DIAMONDROCK HOSPITALITY CO
10-Ks and 10-Qs
|
|
|
|
|
|
|
|
|
|
|
|
|
|
|
|
|
|
|
|
|
|
|
|
|
|
|
|
|
|
|
|
|
|
|
|
|
|
|
|
|
|
|
|
|
|
|
|
|
|
|
|
|
|
|
|
UNITED STATES SECURITIES AND EXCHANGE COMMISSION
Washington, D.C. 20549
_____________________________
FORM 10-K
þ
ANNUAL REPORT PURSUANT TO SECTION 13 OR 15(d) OF THE SECURITIES EXCHANGE ACT OF 1934
For the fiscal year ended
December 31, 2018
OR
o
TRANSITION REPORT PURSUANT TO SECTION 13 OR 15(d) OF THE SECURITIES EXCHANGE ACT OF 1934
Commission file number 001-32514
DIAMONDROCK HOSPITALITY COMPANY
(Exact Name of Registrant as Specified in Its Charter)
|
Maryland
|
|
20-1180098
|
|
(State of Incorporation)
|
|
(I.R.S. Employer Identification No.)
|
|
|
|
|
|
2 Bethesda Metro Center, Suite 1400, Bethesda, Maryland
|
|
20814
|
|
(Address of Principal Executive Offices)
|
|
(Zip Code)
|
(240) 744-1150
(Registrant’s telephone number, including area code)
Securities registered pursuant to Section 12(b) of the Act:
|
Title of Each Class
|
Name of Exchange on Which Registered
|
|
Common Stock, $.01 par value
|
New York Stock Exchange
|
Securities registered pursuant to Section 12(g) of the Act:
None
Indicate by check mark if the registrant is a well-known seasoned issuer, as defined in Rule 405 of the Securities Act.
þ
Yes
o
No
Indicate by check mark if the registrant is not required to file reports pursuant to Section 13 or Section 15(d) of the Act.
o
Yes
þ
No
Indicate by check mark whether the registrant (1) has filed all reports required to be filed by Section 13 or 15(d) of the Securities Exchange Act of 1934 during the preceding 12 months (or for such shorter period that the registrant was required to file such reports), and (2) has been subject to such filing requirements for the past 90 days.
þ
Yes
o
No
Indicate by check mark whether the registrant has submitted electronically every Interactive Data File required to be submitted pursuant to Rule 405 of Regulation S-T (§232.405 of this chapter) during the preceding 12 months (or for such shorter period that the registrant was required to submit such files).
þ
Yes
o
No
Indicate by check mark if disclosure of delinquent filers pursuant to Item 405 of Regulation S-K (§229.405 of this chapter) is not contained herein, and will not be contained, to the best of registrant's knowledge, in definitive proxy or information statements incorporated by reference in Part III of this Form 10-K or any amendment to this Form 10-K.
o
Indicate by check mark whether the registrant is a large accelerated filer, an accelerated filer, a non-accelerated filer, a smaller reporting company or an emerging growth company. See the definitions of “large accelerated filer,” “accelerated filer,” “smaller reporting company,” and "emerging growth company" in Rule 12b-2 of the Exchange Act.
|
Large accelerated filer
þ
|
|
Accelerated filer
o
|
|
Non-accelerated filer
o
|
|
Smaller reporting company
o
|
Emerging growth company
o
|
|
If an emerging growth company, indicate by check mark if the registrant has elected not to use the extended transition period for complying with any new or revised financial accounting standards pursuant to Section 13(a) of the Exchange Act.
o
Indicate by check mark whether the registrant is a shell company (as defined in Rule 12b-2 of the Exchange Act).
o
Yes
þ
No
The aggregate market value of the common equity held by non-affiliates of the Registrant (assuming for these purposes, but without conceding, that all executive officers and Directors are “affiliates” of the Registrant) as of June 29, 2018, the last business day of the Registrant's most recently completed second fiscal quarter, was $2.5 billion (based on the closing sale price of the Registrant's Common Stock on that date as reported on the New York Stock Exchange).
The registrant had
201,392,563
shares of its $0.01 par value common stock outstanding as of February 26, 2019.
Documents Incorporated by Reference
Portions of the registrant's Proxy Statement for its 2019 Annual Meeting of Stockholders, to be filed with the Securities and Exchange Commission not later than 120 days after
December 31, 2018
, are incorporated by reference in Part III herein.
Table of Contents
INDEX
|
|
|
|
|
Page No.
|
|
|
|
-
3
-
SPECIAL NOTE ABOUT FORWARD-LOOKING STATEMENTS
Certain statements in this Annual Report on Form 10-K, other than purely historical information, including estimates, projections, statements relating to our business plans, objectives and expected operating results, and the assumptions upon which those statements are based, are “forward-looking statements” within the meaning of the Private Securities Litigation Reform Act of 1995, Section 27A of the Securities Act of 1933 and Section 21E of the Securities Exchange Act of 1934. These forward-looking statements generally are identified by the words “believes,” “project,” “expects,” “anticipates,” “estimates,” “intends,” “strategy,” “plan,” “may,” “will,” “would,” “will be,” “will continue,” “will likely result,” “strive,” “endeavor,” “mission,” “goal,” and similar expressions. Forward-looking statements are based on current expectations and assumptions that are subject to risks and uncertainties which may cause actual results to differ materially from the forward-looking statements.
Some of the risks and uncertainties that may cause our actual results, performance or achievements to differ materially from those expressed or implied by forward-looking statements include, among others, the following:
|
•
|
negative changes in the economy, including, but not limited to, a reversal of current job growth trends, an increase in unemployment or a decrease in corporate earnings and investment;
|
|
•
|
increased competition in the lodging industry and from alternative lodging channels or third party internet intermediaries in the markets in which we own properties;
|
|
•
|
failure to effectively execute our long-term business strategy and successfully identify and complete acquisitions;
|
|
•
|
risks and uncertainties affecting hotel renovations and management (including, without limitation, construction delays, increased construction costs, disruption in hotel operations and the risks associated with our franchise agreements);
|
|
•
|
risks associated with the availability and terms of financing and the use of debt to fund acquisitions and renovations or refinance existing indebtedness, including the impact of higher interest rates on the cost and/or availability of financing;
|
|
•
|
risks associated with the lodging industry overall, including, without limitation, an increase in alternative lodging channels, decreases in the frequency of business travel and increases in operating costs;
|
|
•
|
risks associated with natural disasters;
|
|
•
|
costs of compliance with government regulations, including, without limitation, the Americans with Disabilities Act;
|
|
•
|
potential liability for uninsured losses and environmental contamination;
|
|
•
|
risks associated with security breaches through cyber-attacks or otherwise, as well as other significant disruptions of our information technologies and systems systems, which support our operations and our hotel managers;
|
|
•
|
risks associated with our potential failure to qualify as a real estate investment trust (“REIT”) under the Internal Revenue Code of 1986, as amended (the “Code”);
|
|
•
|
possible adverse changes in tax and environmental laws; and
|
|
•
|
risks associated with our dependence on key personnel whose continued service is not guaranteed.
|
The risks and uncertainties set forth above are not exhaustive. Other sections of this Annual Report on Form 10-K, including Item 1A “Risk Factors” and Item 7 “Management's Discussion and Analysis of Financial Condition and Results of Operations,” discuss these and other risks and uncertainties that could cause actual results and events to differ materially from such forward-looking statements.
Except as required by law, we undertake no obligation to update or revise publicly any forward-looking statements, whether as a result of new information, future events or otherwise.
References in this Annual Report on Form 10-K to “we,” “our,” “us” and “the Company” refer to DiamondRock Hospitality Company, including as the context requires, DiamondRock Hospitality Limited Partnership, as well as our other direct and indirect subsidiaries.
PART I
Item 1.
Business
Overview
DiamondRock Hospitality Company is a lodging-focused Maryland corporation operating as a REIT for federal income tax purposes. As of
December 31, 2018
, we owned a portfolio of
31
premium hotels and resorts that contain
10,091
guest rooms located in 21 different markets in North America and the U.S. Virgin Islands. Our hotel in the U.S. Virgin Islands, the Frenchman's Reef & Morning Star Beach Resort ("Frenchman's Reef"), is currently closed due to damage incurred by Hurricanes Irma and Maria in September 2017.
-
4
-
As an owner, rather than an operator, of lodging properties, we receive all of the operating profits or losses generated by our hotels after the payment of fees due to hotel managers and hotel brands, which are calculated based on the revenues and profitability of each hotel.
Our goal is to deliver long-term stockholder returns, that exceed those generated by our peers, through a combination of dividends and enduring capital appreciation. Our strategy is to utilize disciplined capital allocation, focus on high quality lodging properties in North American urban and resort markets with superior growth prospects and high barriers-to-entry, aggressively asset manage those hotels, and employ conservative amounts of leverage.
Our primary business is to acquire, own, asset manage and renovate premium hotel properties in the United States. Our portfolio is concentrated in key gateway cities and destination resort locations. Each of our hotels is managed by a third party—either an independent operator or a brand operator, such as Marriott International, Inc. (“Marriott”).
We critically evaluate each of our hotels to ensure that we own a portfolio of hotels that conforms to our vision, supports our mission and corresponds with our strategy. On a regular basis, we analyze our portfolio to identify opportunities to invest capital in certain projects or market non-core assets for sale in order to increase our portfolio quality. We are committed to a conservative capital structure with prudent leverage. We regularly assess the availability and affordability of capital in order to maximize stockholder value and minimize enterprise risk. In addition, we are committed to following sound corporate governance practices and to being open and transparent in our communications with our stockholders.
Our Company
We commenced operations in July 2004 and became a public reporting company in May 2005. Our common stock is traded on the New York Stock Exchange (the “NYSE”) under the symbol “DRH”. We have been successful in acquiring, financing and asset managing our hotels. As of December 31, 2018, we had 31 full-time employees. Since our formation, we have sought to be forthright and transparent in our communications with investors, to actively monitor our corporate overhead and to adopt sound corporate governance practices.
Our Business Strategy
Our business strategy is to utilize disciplined capital allocation, mainly focused on owning high quality lodging properties in North American markets with superior growth prospects and high barriers-to-entry, and aggressively asset manage those hotels and employ conservative amounts of leverage.
We plan to strategically allocate capital in order to create value depending on our cost of capital. If our cost of capital is attractive, we expect to:
|
•
|
pursue strategic acquisitions;
|
|
•
|
consider opportunistically raising equity; and
|
|
•
|
evaluate opportunities to dispose of non-core hotels.
|
If we believe our cost of capital is elevated, we expect to create value over the long term to stockholders by deploying investment capacity into share repurchases.
We prefer a relatively efficient capital structure and have not invested in joint ventures or issued preferred stock. We structure our hotel acquisitions to be straightforward and to fit within our conservative capital structure; however, we will consider a more complex transaction (e.g. the issuance of operating partnership units to limited partners) if we believe that the projected returns to our stockholders will significantly exceed the returns that would otherwise be available.
High-Quality Urban and Destination Resort Hotels
As of
December 31, 2018
, we owned
31
premium hotels and resorts throughout North America and the U.S. Virgin Islands. Our hotels and resorts are primarily categorized as upper upscale as defined by Smith Travel Research and are generally located in high barrier-to-entry markets with multiple demand generators. Our properties are concentrated in key gateway cities and in resort destinations. We consider lodging properties located in gateway cities and resort destinations to be the most capable of generating dynamic cash flow growth and achieving superior long-term capital appreciation.
-
5
-
We have enhanced our hotel portfolio by recycling capital from non-core hotels, located in slower growth markets, to higher quality hotels located primarily in high-growth urban and destination resort markets. We have repositioned our portfolio through the acquisition of urban and resort hotels that align with our strategic goals while disposing of non-core hotels. These acquisitions increased our urban exposure with acquisitions in cities such as San Diego, San Francisco, Boston, Denver, and Washington, D.C. Our resort exposure increased with acquisitions in locations such as Key West and Fort Lauderdale, Florida, Sedona, Arizona, and Sausalito, Huntington Beach and South Lake Tahoe, California. Five of our last six acquisitions have been resort destination hotels. Over 90% of our portfolio EBITDA for the year ended
December 31, 2018
is derived from core urban and resort destination hotels. Our capital recycling program has also achieved several other important strategic portfolio goals that include improving our portfolio’s geographic, operator and brand diversity.
We are highly sensitive to our cost of capital and may pursue acquisitions that create value in the near term. We will continue to evaluate our portfolio for opportunities to continue to upgrade our portfolio by considering strategic acquisitions and opportunistic non-core hotel dispositions.
The primary focus of our acquisitions over the past eight years was on hotels that we believe presented unique value-add opportunities. In addition, we have repositioned certain of our hotels through a change in brand, comprehensive renovation and/or change in third-party hotel manager to a more efficient operator. This focus has helped us achieve the strategic goals of improving our portfolio's brand and management diversity.
We evaluate each hotel in our portfolio to assess the optimal brand and management strategy for the individual hotel and market. We leverage the leading global hotel brands at most of our hotels, which are flagged under a brand owned by Marriott or Hilton Worldwide Holdings, Inc. ("Hilton"). We also maintain a portion of our hotels as independent lifestyle hotels. We believe that premier global hotel brands create significant value as a result of each brand's ability to produce incremental revenue through their strong reservation and rewards systems and sales organizations. We are also interested in owning non-branded hotels located in premier or unique markets where we believe that the returns on such a hotel may be higher than if the hotel were operated under a globally-recognized brand.
Innovative Asset Management
We believe that we can create significant value in our portfolio through innovative asset management strategies such as rebranding, renovating and repositioning our hotels. We regularly evaluate our portfolio to determine if there are opportunities to employ these value-add strategies.
Our asset management team is focused on improving hotel profit margins through revenue management strategies and cost control programs. Our asset management team also focuses on identifying new and potential value creation opportunities across our portfolio, including implementing resort and other fees, creating incremental guest rooms, leasing out restaurants to more profitable third-party operators, converting under-utilized space to revenue-generating meeting space and implementing programs to reduce energy consumption and increase labor efficiency.
Our senior management team has established a broad network of hotel industry contacts and relationships, including relationships with hotel owners, financiers, operators, project managers and contractors and other key industry participants. We use our broad network of hotel industry contacts and relationships to maximize the value of our hotels. We strive to negotiate management agreements that give us the right to exert influence over the management of our properties, annual budgets and all capital expenditures (all, to the extent permitted under the REIT rules), and then to use those rights to continually monitor and improve the performance of our properties. We cooperatively partner with our hotel managers in an attempt to increase operating results and long-term asset values at our hotels. In addition to working directly with the personnel at our hotels, our senior management team also has long-standing professional relationships with our hotel managers' senior executives, and we work directly with these senior executives to improve the performance of our hotels.
Conservative Capital Structure
We believe that a conservative capital structure maximizes investment capacity while reducing enterprise risk. We currently employ a conservative debt profile and straight-forward capital structure with no preferred equity or convertible bonds. We maintain significant balance sheet flexibility with existing corporate cash, no outstanding borrowings under our $300 million senior unsecured credit facility, and with 23 of our
31
hotels unencumbered by mortgage debt as of
December 31, 2018
. We are well positioned for potential credit market volatility and uncertainty in the lodging cycle given that we have no near-term debt maturities and the majority of our debt is financed with long-term, fixed-rate mortgages with a well-laddered maturity schedule. We believe it is prudent to reduce the inherent risk of highly cyclical lodging fundamentals through a low leverage capital structure.
-
6
-
We believe that our strategically designed capital structure is a value creation tool that can be used over the entire lodging cycle. Specifically, we believe that lower leverage benefits us in the following ways:
|
•
|
provides capacity to fund attractive acquisitions;
|
|
•
|
enhances our ability to maintain a sustainable dividend;
|
|
•
|
enables us to opportunistically repurchase shares during periods of stock price dislocation; and
|
|
•
|
provides capacity to fund late-cycle capital needs.
|
As of December 31, 2018, our outstanding debt consists of a combination of property-specific mortgage debt, all of which bears interest at a fixed rate, and unsecured corporate term loans. We prefer that at least half of our portfolio remain unencumbered by debt in order to provide maximum balance sheet flexibility. We expect that our strategy will enable us to maintain a balance sheet with an appropriate amount of debt throughout all phases of the lodging cycle.
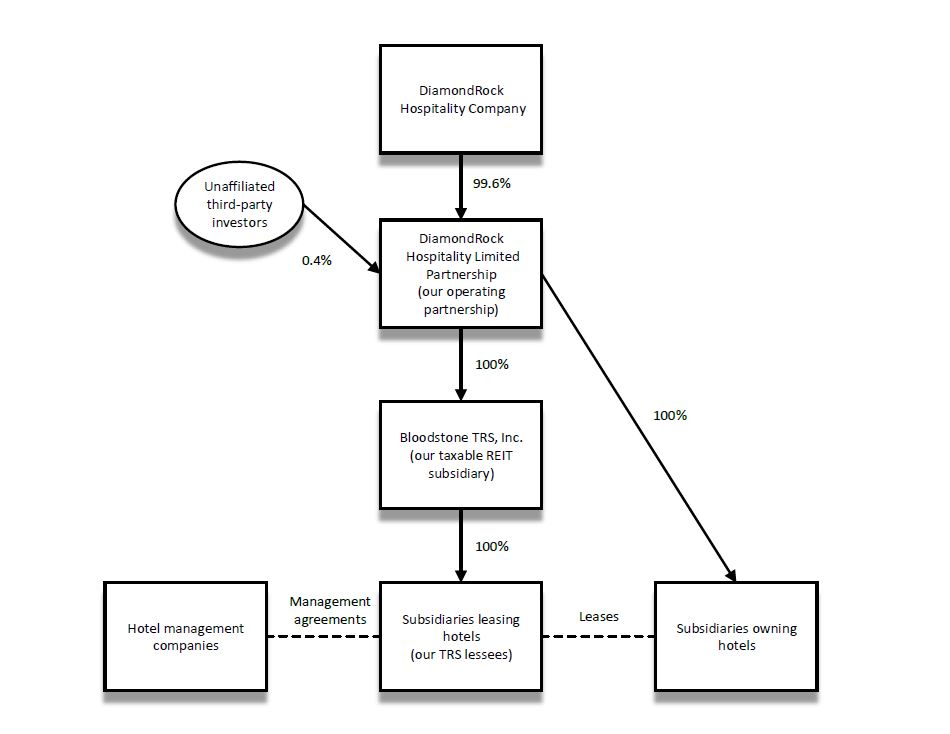
Our Corporate Structure
We conduct our business through a traditional umbrella partnership REIT, or UPREIT, in which our hotels are owned by subsidiaries of our operating partnership, DiamondRock Hospitality Limited Partnership. We are the sole general partner of our operating partnership and own either directly or indirectly 99.6% of the limited partnership units (“OP units”) of our operating partnership. The remaining 0.4% of the OP units are held by third parties. These OP units were issued in connection with our acquisition of Cavallo Point, The Lodge at the Golden Gate (“Cavallo Point”), in December 2018. Each OP unit currently owned by holders other than us is redeemable, at the option of the holder, beginning December 12, 2019, for an amount of cash equal to the market value of one share of the Company's common stock or, at our election, one share of the Company's common stock, in each case subject to adjustment upon the occurrence of stock splits, mergers, consolidations or similar pro-rata share transactions. As of
December 31, 2018
, limited partners held 796,684 OP units. In the future, we may issue additional OP units from time to time in connection with acquiring hotel properties, financing, compensation, or other reasons.
In order for the income from our hotel investments to constitute “rents from real property” for purposes of the gross income tests required for REIT qualification, we must lease each of our hotels to a wholly-owned subsidiary of our taxable REIT subsidiary, or TRS (each, a TRS lessee), or to an unrelated third party. We currently lease all of our domestic hotels to TRS lessees. In turn, our TRS lessees must engage a third-party management company to manage the hotels. However, we may structure our properties that are not subject to U.S. federal income tax differently from the structures that we use for our U.S. properties. For example, Frenchman's Reef is held by a U.S. Virgin Islands corporation, which we have elected to be a TRS.
The following chart shows our corporate structure as of the date of this report:
-
7
-
Competition
The hotel industry is highly competitive and our hotels are subject to competition from other hotels for guests. Competition is based on a number of factors, including convenience of location, reputation, brand affiliation, price, range of services, guest amenities, and quality of customer service. Competition is specific to the individual markets in which our properties are located and will include competition from existing and new hotels operated under brands in the full-service, select-service and extended-stay segments. We believe that properties flagged with a Marriott or Hilton brand will enjoy the competitive advantages associated with their operations under such brand. These global brands' reservation systems and national advertising, marketing and promotional services combined with the strong management expertise they provide enable our properties to perform favorably in terms of both occupancy and room rates relative to other brands and non-branded hotels. The guest loyalty programs operated by these global brands generate repeat guest business that might otherwise go to competing hotels. Increased competition may have a material adverse effect on occupancy, Average Daily Rate (or ADR) and Revenue per Available Room (or RevPAR), or may require us to make capital improvements that we otherwise would not undertake, which may result in decreases in the profitability of our hotels.
In addition to competing with traditional hotels and lodging facilities, we compete with alternative lodging, including third-party providers of short-term rental properties and serviced apartments. We compete based on a number of factors, including room rates, quality of accommodations, service levels, convenience of location, reputation, reservation systems, brand recognition and supply and availability of alternative lodging.
We face competition for the acquisition of hotels from institutional pension funds, private equity funds, REITs, hotel companies and others who are engaged in hotel acquisitions and investments. Some of these competitors have substantially greater financial and operational resources than we have and may have greater knowledge of the markets in which we seek to invest. This competition may reduce the number of suitable investment opportunities offered to us and increase the cost of acquiring our targeted hotel investments.
-
8
-
Seasonality
The periods during which our hotels experience higher revenues vary from property to property, depending principally upon location and the customer base served. Accordingly, we expect some seasonality in our business. Volatility in our financial performance from the seasonality of the lodging industry could adversely affect our financial condition and results of operations.
Regulatory Matters
Environmental Matters
In connection with the ownership of hotels, the Company is subject to various federal, state and local environmental laws and regulations relating to environmental protection. Under these laws, a current or previous owner or operator (including tenants) of real estate may be liable for the costs or removal or remediation of certain hazardous or toxic substances at, on, under or in such property. These laws typically impose liability without regard to fault or whether or not the owner or operator knew of or caused the presence of the contamination, and the liability under these laws may be joint and several. Because these laws also impose liability on the persons who owned the property at the time it became contaminated, it is possible that we could incur cleanup costs or other environmental liabilities even after we sell properties. The presence of contamination, or the failure to properly remediate contamination, on a property may adversely affect the ability of the owner or operator to sell that property or to borrow funds using such property as collateral. Under the environmental laws, courts and government agencies also have the authority to require that a person who sent waste to a waste disposal facility, such as a landfill or incinerator, pay for the cleanup of that facility if it becomes contaminated and threatens human health or the environment.
Our hotels are subject to various federal, state, and local environmental, health and safety laws and regulations that address a wide variety of issues, including, but not limited to, storage tanks, air emissions from emergency generators, storm water and wastewater discharges, asbestos, lead-based paint, mold and mildew and waste management. Some of our hotels routinely handle and use hazardous or regulated substances and wastes as part of their operations, which substances and wastes are subject to regulation (
e.g.
, swimming pool chemicals). Our hotels incur costs to comply with these laws and regulations and could be subject to fines and penalties for non-compliance.
We believe that our hotels are in compliance, in all material respects, with all federal, state and local environmental ordinances and regulations regarding hazardous or toxic substances and other environmental matters, the violation of which could have a material adverse effect on us. We have not received written notice from any governmental authority of any material noncompliance, liability or claim relating to hazardous or toxic substances or other environmental matters in connection with any of our present properties.
Annually, we submit a response to the Global Real Estate Sustainability Benchmarking survey (the “GRESB Report”), which benchmarks the Company's approach and performance on environmental, social and governance indicators against other real estate companies. The GRESB Report is accessible on our website. The information included in, referenced to, or otherwise accessible through the GRESB Report, is not incorporated by reference in, or considered to be a part of, this report or any document unless expressly incorporated by reference therein.
ADA Regulation
Our properties must comply with Title III of the Americans with Disabilities Act of 1990, or ADA, to the extent that such properties are "public accommodations" as defined by the ADA. The ADA may require removal of structural barriers to access by individuals with disabilities in certain public areas of our properties where such removal is readily achievable. We believe that our properties are in substantial compliance with the ADA. However, noncompliance with the ADA could result in payment of civil penalties, damages, and attorneys' fees and costs. The obligation to comply with the ADA is an ongoing one, and we will continue to assess our properties and to make alterations as appropriate in this regard.
Employees
As of
December 31, 2018
, we employed 31 full-time employees. We believe that our relations with our employees are good. None of our employees is a member of any union; however, the employees of our hotel managers at the Lexington Hotel New York, Courtyard Manhattan/Fifth Avenue, Courtyard Manhattan/Midtown East, Hilton Garden Inn/Times Square, Westin Boston Waterfront, and Hilton Boston Downtown are currently represented by labor unions and are subject to collective bargaining agreements.
-
9
-
Insurance
We carry comprehensive liability, fire, extended coverage, earthquake, windstorm, business interruption and rental loss insurance covering all of the properties in our portfolio under a blanket policy. In addition, we carry earthquake and terrorism insurance on our properties in an amount and with deductibles which we believe are commercially reasonable. We do not carry insurance for generally uninsured losses such as loss from riots, war or acts of God. Certain of the properties in our portfolio are located in areas known to be seismically active or subject to hurricanes and we believe that we have appropriate insurance for those risks, although they are subject to higher deductibles than ordinary property insurance.
Most of our hotel management agreements and mortgage agreements require that we obtain and maintain property insurance, business interruption insurance, flood insurance, earthquake insurance (if the hotel is located in an "earthquake prone zone" as determined by the U.S. Geological Survey) and other customary types of insurance related to hotels. We comply with all such requirements. In addition, either we or the hotel manager are responsible for obtaining general liability insurance, workers' compensation and employer's liability insurance.
Available Information
We maintain a website at the following address: www.drhc.com. We make our proxy statements, annual reports on Form 10-K, quarterly reports on Form 10-Q, current reports on Form 8-K and amendments to those reports filed or furnished pursuant to Section 13(a) or 15(d) of the Securities Exchange Act of 1934, as amended (the “Exchange Act”), available on our website free of charge as soon as reasonably practicable after such reports and amendments are electronically filed with, or furnished to, the Securities and Exchange Commission (the “SEC”). Such reports are also available by accessing the EDGAR database on the SEC's website at www.sec.gov.
Our website is also a key source of important information about us. We post to the Investor Relations section of our website important information about our business, our operating results and our financial condition and prospects, including, for example, information about material acquisitions and dispositions, our earnings releases and certain supplemental financial information related or complimentary thereto. The website also has a Corporate Governance page that includes, among other things, copies of our charter, our bylaws, our Code of Business Conduct and Ethics and the charters for each standing committee of our Board of Directors: currently, the Audit Committee, the Compensation Committee and the Nominating and Corporate Governance Committee. We intend to disclose on our website any amendment to, or waiver of, any provisions of our Code of Business Conduct and Ethics that apply to any of our directors, executive officers or senior financial officers that would otherwise be required to be disclosed under the rules of the SEC or the NYSE. Copies of our charter, our bylaws, our Code of Business Conduct and Ethics and our SEC reports are also available in print to stockholders upon request addressed to Investor Relations, DiamondRock Hospitality Company, 2 Bethesda Metro Center, Suite 1400, Bethesda, Maryland 20814 or through the “Information Request” section on the Investor Relations page of our website.
The information included in, referenced to, or otherwise accessible through our website, is not incorporated by reference in, or considered to be a part of, this report or any document unless expressly incorporated by reference therein.
DiamondRock Hospitality Company is traded on the NYSE, under the symbol “DRH”.
Supplemental Material U.S. Federal Income Tax Considerations
This summary is for general information purposes only and is not tax advice. This discussion does not address all aspects of taxation that may be relevant to particular holders of our securities in light of their personal investment or tax circumstances.
The following discussion supplements and updates the disclosures under “Material U.S. Federal Income Tax Considerations” in the prospectus dated August 8, 2018 contained in our Registration Statement on Form S-3 filed with the SEC on August 8, 2018.
Taxation of the Operating Partnership
Previously, our operating partnership was disregarded as an entity separate from us for U.S. federal income tax purposes but since September 1, 2018, our operating partnership has been treated as a partnership for U.S. federal income tax purposes. As a result, the discussion under “
Material U.S. Federal Income Tax Considerations - Taxation of the Operating Partnership
” is revised as follows:
|
•
|
The first, fourth and seventh paragraphs are deleted;
|
-
10
-
|
•
|
The first sentence of the sixth paragraph is revised to state: “We have used and may continue to use our operating partnership to acquire hotels by issuing operating partnership units, in order to permit the sellers of such properties to defer recognition of their tax gain.”; and
|
|
•
|
The following will be inserted under the heading and thus will become the first two paragraphs in the discussion:
|
Before September 1, 2018, our operating partnership was a disregarded entity for U.S. federal income tax purposes because we owned 100% of the interests in it, directly or through other disregarded entities. Since September 1, 2018, our operating partnership has been treated as a partnership for U.S. federal income tax purposes. Generally, a domestic unincorporated entity with two or more partners is treated as a partnership for U.S. federal income tax purposes unless it affirmatively elects to be treated as a corporation. However, certain “publicly traded partnerships” are treated as corporations for U.S. federal income tax purposes. We intend to comply with one or more exceptions from treatment as a corporation under the publicly traded partnership rules. Failure to qualify for such an exception would prevent us from qualifying as a REIT.
When our operating partnership became taxable as a partnership, we generally were treated for U.S. federal income tax purposes as contributing our properties to the operating partnership. As a result, for our properties that were appreciated at such time, we may recognize a smaller share of tax depreciation, and a larger share of tax gain on sale, from such properties after the deemed contribution, as compared to our former percentage interest in the operating partnership.
New TRSs
In September 2018, our indirect subsidiaries, DiamondRock Cayman Islands, Inc., a Cayman Island corporation, and CPFB Holdings, LLC, a Delaware limited liability company, elected to be treated as our TRSs. Generally the provisions under “
Material U.S. Federal Income Tax Considerations
” in the prospectus that discuss TRSs should apply to DiamondRock Cayman Islands, Inc. and CPFB Holdings, LLC, including, but not limited to, the discussion of TRS lessees as CPFB Holdings, LLC has formed such a subsidiary.
Recent IRS Guidance on Recent Tax Legislation
In September 2018, the Internal Revenue Service (the “IRS”) issued guidance clarifying that global intangible low-tax income (“GILTI”) earned by certain foreign subsidiary corporations that is included in a REIT’s taxable income is qualifying REIT income for purposes of the 95% gross income test. As a result, the fourth, fifth and sixth sentences in the second paragraph under “
Material U.S. Federal Income Tax Considerations - Recent Tax Legislation
” in the prospectus are deleted and replaced with the following:
The IRS issued guidance that GILTI constitutes qualifying REIT income for purposes of the 95% gross income test, and thus the inclusion of GILTI earned by DiamondRock Frenchman's Owner, Inc. and DiamondRock Cayman Islands, Inc. in our U.S. taxable income should not influence our ownership structure of these foreign TRSs but no assurances can be given. The inclusion of such GILTI in our U.S. taxable income, however, could increase our dividend distribution requirement, regardless of whether we receive a corresponding distribution of cash from our foreign TRSs.
Recent FATCA Regulations
On December 18, 2018, the IRS promulgated proposed Treasury Regulations under Sections 1471-1474 of the Code (commonly referred to as FATCA), which proposed regulations eliminate FATCA withholding on gross proceeds of a disposition of property that can produce U.S. source interest or dividends and thus implicate certain tax-related disclosures contained in the prospectus. While these proposed Treasury Regulations have not yet been finalized, taxpayers are generally entitled to rely on the proposed Treasury Regulations (subject to certain limited exceptions). As a result, the discussion under “
Material U.S. Federal Income Tax Considerations - FATCA Withholding and Reporting
” in the prospectus is revised as follows:
|
•
|
In the second sentence, the phrase “, and gross proceeds from the sale or other disposition of,” is deleted; and
|
|
•
|
The third and fourth sentences are deleted.
|
Recent Partnership Audit Regulations
-
11
-
On December 21, 2018, the IRS adopted final Treasury Regulations under Sections 6221-6241 of the Code to implement the centralized partnership audit regime, and applicable finalized Treasury Regulations retain the ability of a REIT that is a partner in a partnership to use deficiency dividend procedures with respect to partnership adjustments resulting from a “push-out election.”
Item 1A.
Risk Factors
The following risk factors and other information included in this Annual Report on Form 10-K should be carefully considered. The risks and uncertainties described below are not the only ones that we may face. Additional risks and uncertainties not presently known to us or that we may currently deem immaterial also may impair our business operations. If any of the following risks occur, our business, financial condition, operating results and cash flows could be affected adversely.
Risks Related to Our Business and Operations
Our business model, especially our concentration in premium full-service hotels, can
be highly volatile.
We solely own hotels, a very different asset class from many other REITs. A typical office REIT, for example, has long-term leases with third-party tenants, which provide a relatively stable long-term stream of revenue. Our TRS lessees, on the other hand, do not enter into leases with hotel managers. Instead, the TRS lessee engages the hotel manager pursuant to a management agreement and pays the manager a fee for managing the hotel. The TRS lessee receives all of the operating profit or losses at the hotel. Moreover, virtually all hotel guests stay at the hotel for only a few nights, so the rate and occupancy at each of our hotels changes every day. As a result, our earnings may be highly volatile.
In addition to fluctuations related to our business model, our hotels are, and will continue to be, subject to various long-term operating risks common to the hotel industry, many of which are beyond our control, including:
|
•
|
dependence on business and commercial travelers and tourism, both of which vary with consumer and business confidence in the strength of the economy;
|
|
•
|
decreases in the frequency of business travel that may result from alternatives to in-person meetings;
|
|
•
|
competition from other hotels and alternative lodging channels located in the markets in which we own properties;
|
|
•
|
competition from third-party internet travel intermediaries;
|
|
•
|
an over-supply or over-building of hotels in the markets in which we own properties which could adversely affect occupancy rates, revenues and profits at our hotels;
|
|
•
|
increases in energy and transportation costs and other expenses affecting travel, which may affect travel patterns and reduce the number of business and commercial travelers and tourists;
|
|
•
|
increases in operating costs due to inflation and other factors that may not be offset by increased room rates; and
|
|
•
|
changes in governmental laws and regulations, fiscal policies and zoning ordinances and the related costs of compliance.
|
In addition, our hotels are mostly in the premium full-service segment of the hotel business, which, historically, tends to have the strongest operating results in a growing economy and the weakest results in a contracting or slow growth economy when many travelers might curtail travel or choose lower cost hotels. In periods of weak demand, profitability is negatively affected by the relatively high fixed costs of operating premium full-service hotels as compared to other classes of hotels.
The occurrence of any of the foregoing factors could have a material adverse effect on our business, financial condition, results of operations and our ability to make distributions to our stockholders.
Economic conditions and other factors beyond our control may adversely affect the lodging industry.
Our entire business is related to the lodging industry. The performance of the lodging industry is highly cyclical and has historically been linked to key macroeconomic indicators, such as U.S. gross domestic product, or GDP, growth, employment, personal discretionary spending levels, corporate earnings and investment, foreign exchange rates and travel demand. Given that our hotels are concentrated in key gateway cities and destination resort locations in the United States, our business may be particularly sensitive to changes in foreign exchange rates or a negative international perception of the United States arising from
-
12
-
its political or other positions. A substantial part of our business strategy is based on the belief that the lodging markets in which we own properties will continue to experience improving economic fundamentals in the future but we cannot assure you how long the growth period of the current lodging cycle will last. However, in the event conditions in the industry deteriorate or do not continue to see sustained improvement as we expect, or there is an extended period of economic weakness, our occupancy rates, revenues and profitability could be adversely affected. Furthermore, other macroeconomic factors, such as consumer confidence and conditions which negatively shape public perception of travel, may have a negative effect on the lodging industry and may adversely impact our revenues and profitability.
Our hotels are subject to significant competition.
Currently, the markets where our hotels are located are very competitive. However, a material increase in the supply of new hotel rooms to a market can quickly destabilize that market and existing hotels can experience rapidly decreasing RevPAR and profitability. If such over-building occurs in one or more of our major markets, our business, financial condition, results of operations and our ability to make distributions to our stockholders may be materially adversely affected. For 2019, we currently project a 2.9% increase in supply for the top-25 urban markets. We expect certain markets where we own hotels will exceed this expected average of supply growth.
We own four hotels in New York City, representing 15% of our portfolio measured by number of rooms as of
December 31, 2018
. For 2019, we currently project a 7.5% increase in supply in the New York City market.
We own two hotels located in Boston that represent approximately 12% of our portfolio measured by number of rooms as of
December 31, 2018
. For 2019, we currently project a 4.8% increase in supply in the Boston market.
Our hotels are subject to seasonal volatility, which is expected to contribute to fluctuations in our financial condition and results of operations.
The periods during which our hotels experience higher revenues vary from property to property, depending principally upon location and the customer base served. This seasonality can be expected to cause periodic fluctuations in a hotel’s room revenues, occupancy levels, room rates and operating expenses. We can provide no assurances that our cash flows will be sufficient to offset any shortfalls that occur as a result of these fluctuations. Volatility in our financial performance resulting from the seasonality of our hotels could have a material adverse effect on our business, financial condition, results of operations and our ability to make distributions to our stockholders.
The increase in the use of third-party internet travel intermediaries and the increase in alternative lodging channels, such as Airbnb, could adversely affect our profitability.
Many of our managers and franchisors contract with third-party internet travel intermediaries, including, but not limited to Expedia.com and Priceline.com and their subsidiaries. These internet intermediaries are generally paid commissions and transaction fees by our managers and franchisors for sales of our rooms through such agencies. These intermediaries initially focused on leisure travel, but have grown to focus on corporate travel and group meetings as well. If bookings through these intermediaries increase, these internet intermediaries may be able to negotiate higher commissions, reduced room rates or other contract concessions from us, our managers or our franchisors. In addition, internet intermediaries use extensive marketing, which could result in hotel consumers developing brand loyalties to the offered brands and such internet intermediary instead of our management or franchise brands. Further, internet intermediaries emphasize pricing and quality indicators, such as a star rating system, at the expense of brand identification. In response to these intermediaries, the brand operators and franchisors have launched initiatives to offer discounted rates for booking on their sites, which could put downward pressure on rates and revenue. In addition, an increasing number of companies have entered various aspects of the online travel market. Google, for example, has established a hotel meta-search business (“Hotel Ads”) which is growing rapidly, as well as its “Book on Google” reservation functionality. An increase in hotel reservations made through Google or its competitors, such as Apple, Amazon or Facebook, may reduce the value of our franchise brands, which may negatively affect our average rates and revenues.
In addition to competing with traditional hotels and lodging facilities, we compete with alternative lodging, including third-party providers of short-term rental properties and serviced apartments, such as Airbnb, as well as alternative meeting and event space platforms, such as Convene. We compete based on a number of factors, including room rates, quality of accommodations, service levels, convenience of location, reputation, reservation systems, brand recognition and supply and availability of alternative lodging and event space. Increasing use of these alternative facilities could materially adversely affect the occupancy at our hotels and could put downward pressure on average rates and revenues.
-
13
-
The rise of social media review platforms, including, but not limited to Tripadvisor.com, could impact our occupancy levels and operating results as people might be more inclined to write about dissatisfaction than satisfaction with a hotel stay.
The need for business-related travel, and, therefore, demand for rooms in some of our hotels may be materially and adversely affected by the increased use of business-related technology.
The increased use of teleconferencing and video-conference technology by businesses could result in decreased business travel as companies increase the use of technologies that allow multiple parties from different locations to participate in meetings without traveling to a centralized meeting location, such as our hotels. To the extent that such technologies, or new technologies, play an increased role in day-to-day business interactions and the necessity for business-related travel decreases, demand for hotel rooms may decrease and our hotels could be materially and adversely affected.
Investments in hotels are illiquid and we may not be able to respond in a timely
fashion to adverse changes in the performance of our properties.
Because real estate investments are relatively illiquid, our ability to promptly sell one or more hotel properties or investments in our portfolio in response to changing economic, financial and investment conditions may be limited. Moreover, the Code, imposes restrictions on a REIT’s ability to dispose of properties that are not applicable to other types of real estate companies. In particular, the tax laws applicable to REITs require that we hold our hotels for investment, rather than primarily for sale in the ordinary course of business, which may cause us to forego or defer sales of hotels that would otherwise be in our best interests.
In addition, the real estate market is affected by many factors that are beyond our control, including:
|
•
|
adverse changes in international, national, regional and local economic and market conditions;
|
|
•
|
changes in supply of competitive hotels;
|
|
•
|
changes in interest rates and in the availability, cost and terms of debt financing;
|
|
•
|
changes in tax laws and property taxes, or an increase in the assessed valuation of a property for real estate tax purposes;
|
|
•
|
changes in governmental laws and regulations, fiscal policies and zoning ordinances and the related costs of compliance with laws and regulations, fiscal policies and ordinances;
|
|
•
|
fluctuations in foreign currency exchange rates;
|
|
•
|
the ongoing need for capital improvements, particularly in older structures;
|
|
•
|
changes in operating expenses; and
|
|
•
|
federal government shutdowns, airline strikes, civil unrest, acts of God, including earthquakes, floods, hurricanes and other natural disasters and acts of war or terrorism, including the consequences of terrorist acts such as those that occurred on September 11, 2001, which may result in uninsured losses.
|
It may be in the best interest of our stockholders to sell one or more of our hotels in the future. We cannot predict whether we will be able to sell any hotel property or investment at an acceptable price or otherwise on reasonable terms and conditions. We also cannot predict the length of time that will be necessary to find a willing purchaser and to close the sale of a hotel property or loan.
These facts and any others that would impede our ability to respond to adverse changes in the performance of our hotel properties could have a material adverse effect on our operating results and financial condition, as well as our ability to make distributions to our stockholders.
Due to restrictions in our hotel management agreements, franchise agreements, mortgage agreements and
ground leases, we may not be able to sell our hotels at the highest possible price,
or at all.
Certain of our current hotel management agreements are long-term.
-
14
-
Our current hotel management and franchise agreements contain initial terms generally ranging from five to forty years and certain agreements have renewal periods of five to forty-five years which are exercisable at the option of the property manager. Because some of our hotels would have to be sold subject to the applicable hotel management agreement, the term length of a hotel management agreement may deter some potential purchasers and could adversely impact the price realized from any such sale. To the extent that we receive lower sale proceeds, our business, financial condition, results of operations and our ability to make distributions to stockholders could be materially adversely affected.
Our mortgage agreements contain certain provisions that may limit our ability to sell
our hotels.
In order to assign or transfer our rights and obligations under certain of our mortgage agreements, we generally must obtain the consent of the lender, pay a fee equal to a fixed percentage of the outstanding loan balance, and pay any costs incurred by the lender in connection with any such assignment or transfer. These provisions of our mortgage agreements may limit our ability to sell our hotels which, in turn, could adversely impact the price realized from any such sale. To the extent that we receive lower sale proceeds, our business, financial condition, results of operations and our ability to make distributions to stockholders could be materially adversely affected.
Our ground leases contain certain provisions that may limit our ability to sell our
hotels.
Our ground lease agreements with respect to the Bethesda Marriott Suites, the Salt Lake City Marriott Downtown, the Westin Boston Waterfront Hotel, the Hotel Palomar Phoenix, and Cavallo Point, as well as the ground lease underlying our annex sublease at the Orchards Inn Sedona, require the consent of the lessor for assignment or transfer. These provisions of our ground leases may limit our ability to sell our hotels which, in turn, could adversely impact the price realized from any such sale. In addition, at any given time, investors may be disinterested in buying properties subject to a ground lease, especially ground leases with less than 40 years remaining, such as the Salt Lake City Marriott Downtown, and may pay a lower price for such properties than for a comparable property owned in fee simple or they may not purchase such properties at any price. Accordingly, we may find it difficult to sell a property subject to a ground lease or may receive lower proceeds from any such sale. To the extent that we receive lower sale proceeds or are unable to sell the hotel at an opportune time or at all, our business, financial condition, results of operations and our ability to make distributions to stockholders could be materially adversely affected.
We are subject to risks associated with our ongoing need for renovations and capital
improvements as well as financing for such expenditures.
In order to remain competitive, our hotels have an ongoing need for renovations and other capital improvements, including replacements, from time to time, of furniture, fixtures and equipment. These capital improvements may give rise to the following risks:
•
construction cost overruns and delays;
|
•
|
a possible shortage of available cash to fund capital improvements and the related possibility that financing for these capital improvements may not be available to us on affordable terms;
|
|
•
|
the renovation investment failing to produce the returns on investment that we expect;
|
|
•
|
disruptions in the operations of the hotel as well as in demand for the hotel while capital improvements are underway; and
|
•
disputes with franchisors/hotel managers regarding compliance with relevant franchise/management agreements.
The costs of these capital improvements or profit displacements during the completion of these capital improvements could have a material adverse effect on our business, financial condition, results of operations and our ability to make distributions to our stockholders.
In addition, we may not be able to fund capital improvements or acquisitions solely from cash provided from our operating activities because we generally must distribute at least 90% of our REIT taxable income, determined without regard to the dividends paid deduction and excluding net capital gains, each year to maintain our REIT tax status. As a result, our ability to fund capital expenditures or investments through retained earnings, is very limited. Consequently, we rely upon the availability of debt or equity capital to fund our investments and capital improvements. These sources of funds may not be available on reasonable terms or conditions.
-
15
-
There are significant risks associated with redevelopment of Frenchman’s Reef & Morning Star Beach Resort (“Frenchman’s Reef”).
In September 2017, Frenchman’s Reef closed as a result of significant damage from Hurricane Irma and, to a lesser extent, Hurricane Maria, and it remains closed. The surrounding community also sustained significant damage, and we are not certain to what extent the community will be rebuilt and restored. The damage in the community may lead to a prolonged decline in local tourism, inadequate local infrastructure, an insufficient labor pool to rebuild our hotel, and increases in the cost of both building materials and insurance. The terms of the Frenchman’s Reef management agreement permitted either party to terminate the management agreement in the event that the hotel sustained catastrophic damage, as defined in the management agreement. We terminated the management agreement, effective February 20, 2018.
We are in the process of rebuilding Frenchman’s Reef and expect the hotel to re-open in 2020. However, we have not reached an agreement with the insurance carriers on either the scope or total cost of the redevelopment. We may experience difficulty in reaching agreement with insurers and there is a risk that we do not receive insurance proceeds sufficient to cover the full cost of the redevelopment. As with any capital improvement project we undertake, this renovation is subject to cost overruns and delays, but given the project’s complexity and geographical challenges, we may be more susceptible to these risks. The occurrence of any of these or other effects could have a material adverse effect on our business, financial condition, results of operations and our ability to make distributions to our stockholders.
In the event of natural disasters caused by climate change or otherwise, terrorist attacks, significant military actions,
outbreaks of contagious diseases or other events for which we may not have adequate
insurance, our operations may suffer.
Seven of our hotels (The Lodge at Sonoma, Westin San Diego, Hotel Emblem, Renaissance Charleston Historic District, Shorebreak Hotel, The Landing Resort & Spa, and Cavallo Point) are located in areas that are seismically active. Five of our hotels (Frenchman's Reef, Havana Cabana Key West, Sheraton Suites Key West, Westin Fort Lauderdale Beach Resort, and Renaissance Charleston) are located in areas that have experienced, and will continue to experience, many hurricanes. Eleven of our hotels are located in metropolitan markets that have been, or may in the future be, targets of actual or threatened terrorist attacks, including New York City, Chicago, Boston, San Francisco and Washington, D.C. These hotels are material to our financial results, having constituted 72% of our total revenues in 2018. In addition, to the extent that climate change causes an increase in storm intensity or rising sea levels, our hotels, which are concentrated in coastal areas and other areas that may be impacted by climate change, may be susceptible to an increase in weather-related damage. Additionally, even in the absence of direct physical damage to our hotels, the occurrence of any natural disasters, terrorist attacks, significant military actions, a changing climate in the area of any of our hotels, outbreaks of diseases, such as Zika, Ebola, H1N1 or other similar viruses, or other casualty events, will likely have a material adverse effect on business and commercial travelers and tourists, the economy generally and the hotel and tourism industries in particular. While we cannot predict the impact of the occurrence of any of these events, such impact could result in a material adverse effect on our business, financial condition, results of operations and our ability to make distributions to our stockholders.
We have acquired and intend to maintain comprehensive insurance on each of our hotels, including liability, terrorism, fire and extended coverage, of the type and amount that we believe are customarily obtained for or by hotel owners. We cannot guarantee that such coverage will continue to be available at reasonable rates or with reasonable deductibles. Our Florida and U.S. Virgin Island hotels (Frenchman’s Reef, Westin Fort Lauderdale Beach Resort, Havana Cabana Key West, and Sheraton Suites Key West) each have a deductible of 5% of total insured value for a named storm. In addition, each of our California hotels (Westin San Diego, Hotel Emblem, Shorebreak Hotel, The Lodge at Sonoma, and Cavallo Point) have a deductible of 5% of total insured value for damage due to an earthquake. Due to the damage sustained by Frenchman’s Reef as a result of Hurricanes Irma and Maria in 2017, we submitted a significant insurance claim. While we currently expect that insurance proceeds will be sufficient to cover all or a substantial portion of the remediation and replacement costs and business interruption at Frenchman’s Reef, this claim and the increased incidence of substantial claims due to future natural disasters may adversely impact the availability or pricing of insurance available to us.
Various types of catastrophic losses, like earthquakes, floods, losses from foreign terrorist activities, or losses from domestic terrorist activities may not be insurable or are generally not insured because of economic infeasibility, legal restrictions or the policies of insurers. Future lenders may require such insurance, and our failure to obtain such insurance could constitute a default under loan agreements. Depending on our access to capital, liquidity and the value of the properties securing the affected loan in relation to the balance of the loan, a default could have a material adverse effect on our results of operations and ability to obtain future financing.
In the event of a substantial loss, our insurance coverage may not be sufficient to cover the full current market value or replacement cost of our lost investment. Should an uninsured loss or a loss in excess of insured limits occur, we could lose all or
-
16
-
a portion of the capital we have invested in a hotel, as well as the anticipated future revenue from that particular hotel. In that event, we might nevertheless remain obligated for any mortgage debt or other financial obligations secured by or related to the property. Inflation, changes in building codes and ordinances, environmental considerations and other factors might also prevent us from using insurance proceeds to replace or renovate a hotel after it has been damaged or destroyed. Under those circumstances, the insurance proceeds we receive might be inadequate to restore our economic position with regard to the damaged or destroyed property.
Our results of operations are highly dependent on the management of our hotel
properties by third-party hotel management companies.
In order to qualify as a REIT, we cannot operate our hotel properties or control the daily operations of our hotel properties. Our TRS lessees may not operate these hotel properties and, therefore, they must enter into third-party hotel management agreements with one or more eligible independent contractors. Thus, third-party hotel management companies that enter into management contracts with our TRS lessees control the daily operations of our hotel properties.
Under the terms of the hotel management agreements that we have entered into, or that we will enter into in the future, our ability to participate in operating decisions regarding our hotel properties is limited to certain matters, including approval of the annual operating budget. We currently rely, and will continue to rely, on these hotel management companies to adequately operate our hotel properties under the terms of the hotel management agreements. While we and our TRS lessees closely monitor the performance of our hotel managers, we do not have the authority to require any hotel property to be operated in a particular manner or to govern any particular aspect of its operations (for instance, setting room rates and cost structures). Thus, even if we believe that our hotel properties are being operated inefficiently or in a manner that does not result in satisfactory occupancy rates, ADRs and operating profits, we may not have sufficient rights under our hotel management agreements to enable us to force the hotel management company to change its method of operation. We can only seek redress if a hotel management company violates the terms of the applicable hotel management agreement with the TRS lessee, and then only to the extent of the remedies provided for under the terms of the hotel management agreement. Although several of our management agreements have relatively short terms, most of our current management agreements are non-terminable, subject to certain exceptions for cause or failure to achieve certain performance targets. In the event that we need to replace any of our hotel management companies pursuant to termination for cause or performance, we may experience significant disruptions at the affected properties and the new management companies may not meet our performance expectations, which may have a material adverse effect on our business, financial condition, results of operations and our ability to make distributions to our stockholders.
We may be unable to maintain good relationships with third-party hotel managers and franchisors.
The success of our respective hotel investments and the value of our franchised properties largely depend on our ability to establish and maintain good relationships with the third-party hotel managers and franchisors of our respective hotel management and franchise agreements. If we are unable to maintain good relationships with third-party hotel managers, we may be unable to renew existing management or franchise agreements or expand relationships with them. Additionally, opportunities for developing new relationships with additional third-party hotel managers or franchisors may be adversely affected. This, in turn, could have an adverse effect on our results of operations and our ability to execute our repositioning strategy through a change in brand or change in third-party hotel manager.
A substantial number of our hotels operate under a brand owned by Marriott or Hilton; therefore, we are subject to risks associated with concentrating our portfolio in two brands.
As of
December 31, 2018
, 19 of our
31
hotels operate under brands owned by Marriott and three of our hotels operate under brands owned by Hilton. As a result, our success is dependent in part on the continued success of Marriott and Hilton and their respective brands. Consequently, if market recognition or the positive perception of Marriott or Hilton is reduced or compromised, the goodwill associated with the Marriott- and Hilton-branded hotels in our portfolio may be adversely affected, which may have a material adverse effect on our business, financial condition, results of operations and our ability to make distributions to our stockholders.
Several of our hotels are operated under franchise agreements and we are subject to the risks associated with the franchise brand and the costs associated with maintaining the franchise license.
As of
December 31, 2018
, 13 of our hotels operate under Marriott or Hilton franchise agreements. The maintenance of the franchise licenses for branded hotel properties is subject to the franchisors’ operating standards and other terms and conditions set forth in the applicable franchise agreement. Franchisors periodically inspect hotel properties to ensure that we, our TRS lessees and management companies follow their brand standards.
-
17
-
If we fail to maintain these required standards, then the brand may terminate its agreement with us and assert a claim for damages for any liability we may have caused, which could include liquidated damages. Moreover, from time to time, we may receive notices from franchisors or the hotel brands regarding alleged non-compliance with the franchise agreements or brand standards, and we may disagree with these claims that we are not in compliance. Any disputes arising under these agreements could also lead to a termination of a franchise or management agreement and a payment of liquidated damages. For example, the Company was notified by the franchisor of one of its hotels that as a result of low guest satisfaction scores, the Company was in default under the franchise agreement for that hotel. If the franchisor of that hotel elects to terminate the franchise agreement for that hotel, such termination may result in the franchisor pursuing a claim for liquidated damages. If we were to lose a franchise or hotel brand for a particular hotel, it could harm the operation, financing, or value of that hotel due to the loss of the franchise or hotel brand name, marketing support and centralized reservation system, all or any of which could have a material adverse effect on our business, financial condition, results of operations and our ability to make distributions to stockholders.
Contractual and other disagreements with third-party hotel managers and franchisors could make us liable to them or result in litigation costs or other expenses.
Our management and franchise agreements with third-party hotel managers require us and the applicable third-party hotel manager to comply with operational and performance conditions that are subject to interpretation and could result in disagreements, and we expect this will be true of any management and franchise agreements that we enter into with future third-party hotel managers or franchisors. At any given time, we may be in disputes with one or more third-party hotel managers or franchisors. For example, the Company was notified by the franchisor of one of its hotels that as a result of low guest satisfaction scores, the Company is in default under the franchise agreement for that hotel.
Any such dispute could be very expensive for us, even if the outcome is ultimately in our favor. We cannot predict the outcome of any arbitration or litigation, the effect of any negative judgment against us or the amount of any settlement that we may enter into with any franchisor other third-party hotel manager. In the event we terminate a management or franchise agreement early and the hotel manager or franchisor considers such termination to have been wrongful, they may seek damages. Additionally, we may be required to indemnify our third-party hotel managers and franchisors against disputes with third parties, pursuant to our management and franchise agreements. An adverse result in any of these proceedings could materially and adversely affect our revenues and profitability.
If we were to lose a brand license at one or more of our hotels, the value of the affected hotels could decline significantly and we could incur significant costs to obtain new franchise licenses, which could materially and adversely affect our results of operations and profitability as well as limit or slow our future growth.
If we were to lose a brand license, the underlying value of a particular hotel could decline significantly from the loss of associated name recognition, marketing support, participation in guest loyalty programs and the centralized reservation system provided by the franchisor or brand manager, which could require us to recognize an impairment on the hotel. Furthermore, the loss of a franchise license at a particular hotel could harm our relationship with the franchisor or brand manager, which could impede our ability to operate other hotels under the same brand, limit our ability to obtain new franchise licenses or brand management agreements from the franchisor or brand in the future on favorable terms, or at all, and cause us to incur significant costs to obtain a new franchise license or brand management agreement for the particular hotel. Accordingly, if we lose one or more franchise licenses or brand management agreements, it could materially and adversely affect our results of operations and profitability as well as limit or slow our future growth.
Our business may be adversely affected by consolidation in the lodging industry.
Consolidation among companies in the lodging industry may reduce our bargaining power in negotiating management agreements and franchise agreements due to decreased competition among major brand companies. For instance, in 2016, Marriott acquired Starwood Hotels & Resorts, resulting in the increased portfolio concentration in the Marriott brand family (19 of our
31
hotels). We believe Marriott may use this leverage when negotiating for property improvement plans upon the acquisition of a hotel in cases where the franchisor or hotel brand requires renovations to bring the physical condition of a hotel into compliance with the specifications and standards each franchisor or hotel brand has developed.
Industry consolidation could also result in the lack of differentiation among the brands, which could impact the ability to drive higher rates in those brands. In addition, to the extent that consolidation among hotel brand companies adversely affects the loyalty reward program offered by one or more of our hotels, customer loyalty to those hotels may suffer and demand for guestrooms may decrease. Furthermore, because each hotel brand company relies on its own network of reservation systems, hotel management systems and customer databases, the integration of two or more networks may result in a disruption to
-
18
-
operations of these systems, such as disruptions in processing guest reservations, delayed bookings or sales, or lost guest reservations, which could adversely affect our financial condition and results of operations. Additionally, following the completion of a merger of companies, the costs to integrate the companies may be absorbed by our impacted hotel or hotels and adversely affect our financial condition and results of operations.
Our ownership of properties through ground leases exposes us to the risks that we may
have difficulty financing such properties, be forced to sell such properties for a lower price, are unable to extend the ground leases at maturity
or lose such properties upon breach or termination of the ground leases.
We hold a leasehold or subleasehold interest in all or a portion of the land underlying nine of our hotels (Bethesda Marriott Suites, Courtyard Manhattan/Fifth Avenue, Salt Lake City Marriott Downtown, Westin Boston Waterfront Hotel, Shorebreak Hotel, JW Marriott Denver, Orchards Inn Sedona, Hotel Palomar Phoenix, and Cavallo Point), and the parking lot at another of our hotels (Renaissance Worthington). We may acquire additional hotels in the future subject to ground leases. In the past, from time to time, secured lenders have been unwilling to lend, or otherwise charged higher interest rates, for loans secured by a leasehold mortgage compared to loans secured by a fee simple mortgage. In addition, at any given time, investors may be disinterested in buying properties subject to a ground lease, especially ground leases with less than 40 years remaining, such as the Salt Lake City Marriott Downtown, which has 36 years remaining, and may pay a lower price for such properties than for a comparable property in fee simple, or they may not purchase such properties at any price whatsoever. For these reasons, we may have a difficult time selling a property subject to a ground lease or may receive lower proceeds from a sale. Finally, as the lessee under our ground leases, we are exposed to the possibility of losing the hotel, or a portion of the hotel, upon termination, or an earlier breach by us, of the ground lease, which could result in a material adverse effect on our business, financial condition, results of operations and our ability to make distributions to our stockholders.
Furthermore, unless we purchase a fee interest in the land and improvements subject to our ground leases, we will not have any economic interest in the land or improvements at the expiration of our ground leases and therefore we generally will not share in any increase in value of the land or improvements beyond the term of a ground lease, notwithstanding our capital outlay to purchase our interest in the hotel or fund improvements thereon, and will lose our right to use the hotel.
The failure of tenants to make rent payments under our retail and restaurant leases may adversely affect our results of operation.
On occasion, retail and restaurant tenants at our hotel properties may fail to make rent payments when due. Generally, we hold security deposits in connection with each lease which may be applied in the event that the tenant under the lease fails or is unable to make payments; however, these security deposits do not provide us with sustained cash flow to pay distributions or for other purposes. In the event that a tenant continually fails to make rent payments, the security deposits may be applied in full to the non-payment of rents, but we face the risk of being able to recover only a portion of the rents due to us or being unable to recover any amounts whatsoever. If we evict a tenant, we also face the risk of delay or inability to find a suitable tenant or replacement tenant that suits the needs of our hotel.
We face competition for hotel acquisitions and investments and we may not be successful in
identifying or completing hotel acquisitions and investments that meet our criteria, which may impede
our growth.
One component of our long-term business strategy is expansion through hotel acquisitions and investments. However, we may not be successful in identifying or completing acquisitions or investments that are consistent with our strategy. We compete with institutional pension funds, private equity funds, REITs, hotel companies and others who are engaged in hotel acquisitions and investments. This competition for hotel investments may increase the price we pay for hotels and these competitors may succeed in acquiring those hotels that we seek to purchase. In addition, the number of entities competing for suitable hotels may increase in the future, which would increase demand for these hotels and the prices we must pay to acquire them. If we pay higher prices for hotels, our returns on investment and profitability may be reduced. Also, future acquisitions of hotels, hotel companies or hotel investments may not yield the returns we expect, especially if we cannot obtain financing without paying higher borrowing costs, and may result in stockholder dilution.
Actions by organized labor could have a material adverse effect on our business.
We believe that unions are generally becoming more aggressive about organizing workers at hotels in certain geographic locations. Potential labor activities at these hotels could significantly increase the administrative, labor and legal expenses and
reduce the profits that we receive. If hotels in our portfolio are organized, this could have a material adverse effect on our business, financial condition, results of operation and our ability to make distributions to our stockholders.
-
19
-
We have entered into management agreements with third-party managers to operate our hotels. Our hotel managers are responsible for hiring and maintaining the labor force at each of our hotels. From time to time, strikes, lockouts, public demonstrations or other negative actions and publicity may disrupt hotel operations at any of our hotels, negatively impact our reputation or the reputation of our brands, or harm relationships with the labor forces at our hotels. For example, a strike at the Westin Boston Waterfront negatively impacted our hotel operations in 2018. We also may incur increased legal costs and indirect labor costs as a result of contract disputes or other events. Additionally, hotels where our managers have collective bargaining agreements with employees are more highly affected by labor force activities than others. The resolution of labor disputes or new or re-negotiated labor contracts could lead to increased labor costs, either by increases in wages or benefits or by changes in work rules that raise hotel operating costs. Furthermore, labor agreements may limit the ability of our hotel managers to reduce the size of hotel workforces during an economic downturn because collective bargaining agreements are negotiated between the hotel managers and labor unions. We do not have the ability to control the outcome of these negotiations.
Actions by federal, state or local jurisdictions could have a material adverse effect on our business.
Several local jurisdictions in the United States have enacted, or considered, legislation increasing the minimum wage for workers in the jurisdiction. Some of this legislation applies to hotels only. If a jurisdiction in which the Company owns a hotel adopts such legislation, then the cost to operate the hotel may increase significantly and could have a material adverse effect on our business, financial condition, results of operations and our ability to make distributions to our stockholders.
The Department of Labor has proposed regulations that would have the effect of increasing the number of workers entitled to overtime. If these regulations are implemented, it could have a material adverse effect on our business, financial condition, results of operations and our ability to make distributions to our stockholders.
Our success depends on senior executive officers whose continued service is not
guaranteed, and changes in our senior executive officers may adversely affect the operation of our business.
We depend on the efforts and expertise of our senior executive officers to manage our day-to-day operations and strategic business direction. Finding suitable replacements for senior executive officers could be difficult. The loss of any of their services could have a material adverse effect on our business, financial condition, results of operations and our ability to make distributions to our stockholders.
We and our hotel managers rely on information technology in our operations and any material failures, inadequacies, interruptions, security failures, social engineering attacks or cyber-attacks could harm our business.
We and our hotel managers rely on information technologies and systems, including the Internet, to access, store, transmit, deliver and manage information and processes. Some of these information technologies and systems are provided by third-party vendors. We rely on commercially available systems, software, tools and monitoring to provide security for processing, transmission and storage of certain confidential customer information, such as individually identifiable information, including information relating to financial accounts. Recently, a number of hotels and hotel management companies have been subject to successful cyber-attacks including those seeking guest credit card information. Moreover, cybersecurity incidents and cyber-attacks have been occurring globally at a more frequent and severe level, and will likely continue to increase in frequency in the future.
For these reasons, we and our hotel managers are subject to risks associated with security breaches, whether through cyber-attacks or online fraud schemes, spoofed e-mails and social engineering efforts by hackers aimed at obtaining confidential information. If unauthorized parties gain access to such information or our vendor's technology systems, they may be able to steal, publish, delete or modify private and sensitive information for proprietary or financial gain. Although we and our hotel managers believe that we have taken commercially reasonable steps to protect the security of these systems, there can be no assurance that such security measures will prevent failures, inadequacies or interruptions in system services, or that system security will not be breached through physical or electronic break-ins, computer viruses, social engineering attacks and cyber-attacks. Disruptions in service, system shutdowns and security breaches in either the information technologies and systems of our hotel managers or our own information technologies and systems, including unauthorized disclosure of confidential information, could have a material adverse effect on our business operations and results, our financial and compliance reporting and our reputation.
Many of our hotel managers carry cyber insurance policies to protect and offset a portion of potential costs that may be incurred from a security breach. Additionally, we currently have cyber insurance policies to provide supplemental coverage above the coverage carried by our third-party managers. Despite various precautionary steps to protect our hotels from losses resulting from cyber-attacks, however, any occurrence of a social engineering attack or cyber-attack could still result in losses at our properties, which could affect our results of operations. We are not aware of any cyber incidents that we believe to be material or that could have a material adverse effect on our business, financial condition and results of operations.
-
20
-
From time to time, we may be subject to litigation, which could have a material adverse effect on our financial condition, results of operations, cash flow and trading price of our common stock.
From time to time, we may be subject to litigation. In addition, we generally indemnify third-party hotel managers for legal costs resulting from management of our hotels. Some of these claims may result in defense costs, settlements, fines or judgments against us, some of which are not covered by insurance. The outcome of these legal proceedings cannot be predicted. Payment of any such costs, settlements, fines or judgments that are not insured could have a material adverse impact on our financial position and results of operations. In addition, certain litigation or the resolution of certain litigation may affect the availability or cost of some of our insurance coverage, which could adversely impact our results of operations and cash flows, expose us to increased risks that would be uninsured and/or adversely impact our ability to attract officers and directors.
Risks Related to the Economy and Credit Markets
The lack of availability and terms of financing could adversely impact the amounts,
sources and costs of capital available to us.
The ownership of hotels is very capital intensive. We finance the acquisition of our hotels with a mixture of equity and long-term debt while we traditionally finance renovations and operating needs with cash provided from operations or with borrowings from our corporate credit facility. Our mortgage loans typically have a large balloon payment due at their maturity. Generally, we find it more efficient to place a significant amount of debt on a small number of our hotels while we try to maintain a significant number of our hotels unencumbered.
During periods of economic recession, it could be difficult for us to borrow money. In recent years, a significant percentage of hotel loans were made by lenders who sold such loans to securitized lending vehicles, such as commercial mortgage backed security (CMBS) pools. If the market for new CMBS issuances results in CMBS lenders making fewer loans, there is a risk that the debt capital available to us could be reduced.
An uncertain environment in the lodging industry and the economy generally could result in declines in our average
daily room rates, occupancy and RevPAR, and thereby have a material adverse effect on
our results of operations.
The performance of the lodging industry has traditionally been closely linked with the general economy. A stall in economic growth or an economic recession would have a material adverse effect on our results of operations. If a property’s occupancy or room rates drop to the point where its revenues are less than its operating expenses, then we would be required to spend additional funds in order to cover that property’s operating expenses.
In addition, if the operating results decline at our hotels that are secured by mortgage debt, there may not be sufficient operating profits from the hotel to fund the debt service on the mortgage. In such a case, we may be forced to choose from a number of unfavorable options, including using corporate cash, drawing on our corporate credit facility, selling a hotel on disadvantageous terms, including an unattractive price, or defaulting on the mortgage debt and permitting the lender to foreclose. Any one of these options could have a material adverse effect on our business, results of operations, financial condition and ability to pay distributions to our stockholders.
Risks Related to Our Debt and Financing
Our existing indebtedness contains financial covenants that could limit our
operations and our ability to make distributions to our stockholders.
Our existing property-level debt instruments contain restrictions (including cash management provisions) that may, under circumstances specified in the loan agreements, prohibit our subsidiaries that own our hotels from making distributions or paying dividends, repaying loans to us or other subsidiaries or transferring any of their assets to us or another subsidiary. Failure to meet our financial covenants could result from, among other things, changes in our results of operations, the incurrence of additional debt or changes in general economic conditions. In addition, this could cause one or more of our lenders to accelerate the timing of payments and could have a material adverse effect on our business, financial condition, results of operations and our ability to make distributions to our stockholders. The terms of our debt may restrict our ability to engage in transactions that we believe would otherwise be in the best interests of our stockholders.
Our credit facility and term loans contain financial covenants that may constrain our ability to sell assets and make distributions to our stockholders.
-
21
-
Our corporate credit facility and term loans contain several financial covenants, the most constraining of which limits the amount of debt that we may incur compared to the value of our hotels (our leverage covenant) and the amount of debt service we pay compared to our cash flow (our debt service coverage covenant). If we were to default under either of these covenants, the lenders may require us to repay all amounts then outstanding under our credit facility and term loans and may terminate our credit facility and term loans. These and our other financial covenants constrain us from incurring material amounts of additional debt or from selling properties that generate a material amount of income. In addition, our credit facility requires that we maintain a minimum number of our hotels as unencumbered assets.
Many of our existing mortgage debt agreements contain “cash trap” provisions that
could limit our ability to make distributions to our stockholders.
Certain of our loan agreements contain cash trap provisions that may be triggered if the performance of the affected hotel or hotels declines. If the provisions in one or more of these loan agreements are triggered, substantially all of the cash flow generated by the hotel or hotels affected will be deposited directly into lockbox accounts and then swept into cash management accounts for the benefit of the lenders. Cash will be distributed to us only after certain items are paid, including deposits into leasing and maintenance reserves and the payment of debt service, insurance, taxes, operating expenses, and extraordinary capital expenditures and leasing expenses. This could affect our liquidity and our ability to make distributions to our stockholders.
There is refinancing risk associated with our debt.
Our typical debt contains limited principal amortization; therefore, the vast majority of the principal must be repaid at the maturity of the loan in a so-called “balloon payment.” In the event that we do not have sufficient funds to repay the debt at the maturity of these loans, we will need to refinance this debt. If the credit environment is constrained at the time of our debt maturities, we would have a very difficult time refinancing debt. In addition, we locked in our fixed-rate debt at a point in time when we were able to obtain favorable interest rates, principal amortization and other terms. When we refinance our debt, prevailing interest rates and other factors may result in paying a greater amount of debt service, which will adversely affect our cash flow, and, consequently, our cash available for distribution to our stockholders. If we are unable to refinance our debt on acceptable terms, we may be forced to choose from a number of unfavorable options. These options include agreeing to otherwise unfavorable financing terms on one or more of our unencumbered assets, selling one or more hotels on disadvantageous terms, including unattractive prices or defaulting on the mortgage and permitting the lender to foreclose. Any one of these options could have a material adverse effect on our business, financial condition, results of operations and our ability to make distributions to our stockholders.
If we default on our secured debt in the future, the lenders may foreclose on our
hotels.
All of our indebtedness, except our credit facility and term loan, is secured by single property first mortgages on the applicable property. If we default on any of the secured loans, the lender will be able to foreclose on the property pledged to the relevant lender under that loan. While we have maintained certain of our hotels unencumbered by mortgage debt, we have a relatively high loan-to-value on a number of our hotels which are subject to mortgage loans and, as a result, those mortgaged hotels may be at an increased risk of default and foreclosure. In addition, to the extent that we cannot meet any future debt service obligations, we will risk losing some or all of our hotels that are pledged to secure our obligations to foreclosure. This could affect our ability to make distributions to our stockholders.
In addition to losing the property, a foreclosure may result in recognition of taxable income. Under the Code, a foreclosure of property securing non-recourse debt would be treated as a sale of the property for a purchase price equal to the outstanding balance of the debt secured by the mortgage. If the outstanding balance of the debt secured by the mortgage exceeds our tax basis in the property, we would recognize taxable income on foreclosure even though we did not receive any cash proceeds. As a result, we may be required to identify and utilize other sources of cash for distributions to our stockholders. If this occurs, our financial condition, cash flow and ability to satisfy our other debt obligations or ability to pay distributions may be adversely affected.
Future debt service obligations may adversely affect our operating results, require
us to liquidate our properties, jeopardize our ability to make cash distributions necessary to maintain our tax status as a REIT and limit our
ability to make distributions to our stockholders.
In the future, we and our subsidiaries may incur substantial additional debt, including secured debt. Although borrowing costs have been historically low, they are expected to rise in the near-term and borrowing costs on new and refinanced debt may be more expensive. Our existing debt, and any additional debt borrowed in the future could subject us to many risks, including the risks that:
-
22
-
|
•
|
our cash flow from operations will be insufficient to make required payments of principal and interest or to make cash distributions necessary to maintain our tax status as a REIT;
|
|
•
|
we may be vulnerable to adverse economic and industry conditions;
|
|
•
|
we may be required to dedicate a substantial portion of our cash flow from operations to the repayment of our debt, thereby reducing the cash available for distribution to our stockholders, operations and capital expenditures, future investment opportunities or other purposes;
|
|
•
|
the terms of any refinancing might not be as favorable as the terms of the debt being refinanced; and
|
|
•
|
the use of leverage could adversely affect our stock price and our ability to make distributions to our stockholders.
|
If we violate covenants in our future indebtedness agreements, we could be required to repay all or a portion of our indebtedness before maturity at a time when we might be unable to arrange financing for such repayment on favorable terms, if at all.
Refinanced debt could reduce the amounts available for distribution to our stockholders, as well as reduce funds available for our operations, future investment opportunities or other purposes.
Increases in interest rates may increase our interest expense.
Higher interest rates could increase debt service requirements on any of our floating rate debt, including our unsecured term loans and any outstanding balance on our senior unsecured credit facility, and could reduce the amounts available for distribution to our stockholders, as well as reduce funds available for our operations, future business opportunities or other purposes.
Hedging against interest rate exposure may adversely affect us.
We manage certain exposure to interest rate volatility by using interest rate hedging, such as swap agreements, to “hedge” against the possible negative effects of interest rate fluctuations. We may continue to do so in the future. However, hedging can be expensive, particularly during periods of volatile interest rates, available interest rate hedges may not correspond directly with the interest rate risk for which protection is sought, the duration of the interest rate hedge may not match the duration of the related liability, and we cannot assure you that any hedging will adequately mitigate the adverse effects of interest rate increases or that counterparties under these agreements will honor their obligations. As a result, our hedging transactions could have a material and adverse effect on our results of operations.
Risks Related to Regulation, Taxes and the Environment
Noncompliance with governmental regulations could adversely affect our operating
results.
Environmental matters.
Our hotels are, and the hotels that we acquire in the future will be, subject to various federal, state and local environmental laws. Under these laws, courts and government agencies may have the authority to require us, as owner of a contaminated property, to clean up the property, even if we did not know of or were not responsible for the contamination. These laws also apply to persons who owned a property at the time it became contaminated. In addition to the costs of cleanup, environmental contamination can affect the value of a property and, therefore, an owner’s ability to borrow funds using the property as collateral or to sell the property. Under the environmental laws, courts and government agencies also have the authority to require that a person who sent waste to a waste disposal facility, such as a landfill or an incinerator, pay for the clean-up of that facility if it becomes contaminated and threatens human health or the environment. A person who arranges for the disposal or treatment, or transports for disposal or treatment, a hazardous substance at a property owned by another person may be liable for the costs of removal or remediation of hazardous substances released into the environment at that property.
Furthermore, various court decisions have established that third parties may recover damages for injury caused by property contamination. For instance, a person exposed to asbestos while staying in a hotel may seek to recover damages if he or she suffers injury from the asbestos. Lastly, some of these environmental laws restrict the use of a property or place conditions on various activities. For example, certain laws require a business using chemicals (such as swimming pool chemicals at a hotel) to manage them carefully and to notify local officials that the chemicals are being used.
-
23
-
We could be responsible for the costs associated with a contaminated property. The costs to clean up a contaminated property, to defend against a claim, or to comply with environmental laws could be material and could adversely affect the funds available for distribution to our stockholders. We cannot assure you that future laws or regulations will not impose material environmental liabilities or that the current environmental condition of our hotels will not be affected by the condition of the properties in the vicinity of our hotels (such as the presence of leaking underground storage tanks) or by third parties unrelated to us. We may face liability regardless of our knowledge of the contamination, the timing of the contamination, the cause of the contamination, or the party responsible for the contamination of the property.
Although we have taken and will take commercially reasonable steps to assess the condition of our properties, there may be unknown environmental problems associated with our properties. If environmental contamination exists on our properties, we could become subject to strict, joint and several liability for the contamination by virtue of our ownership interest. In addition, we are obligated to indemnify our lenders for any liability they may incur in connection with a contaminated property.
The presence of hazardous substances or petroleum contamination on a property may adversely affect our ability to sell the property and could cause us to incur substantial remediation costs. The discovery of environmental liabilities attached to our properties could have a material adverse effect on our results of operations and financial condition and our ability to pay dividends to our stockholders.
Numerous treaties, laws and regulations have been enacted to regulate or limit carbon emissions. Changes in the regulations and legislation relating to climate change, and complying with such laws and regulations, may require us to make significant investments in our hotels and could result in increased energy costs at our properties which could have a material adverse effect on our results of operations and our ability to make distributions to our stockholders.
Americans with Disabilities Act and other changes in governmental rules and
regulations.
Under the ADA, all public accommodations must meet various federal non-discrimination requirements related to access and use by individuals with disabilities. Compliance with the ADA’s requirements could require removal of architectural barriers to access and non-compliance could result in the payment of civil penalties, damages, and attorneys' fees and costs. If we are required to make substantial modifications to our hotels, whether to comply with the ADA or other changes in governmental rules and regulations, our financial condition, results of operations and ability to make distributions to our stockholders could be adversely affected.
Our hotel properties may contain or develop harmful mold, which could lead to
liability for adverse health effects and costs of remediating the problem.
When excessive moisture accumulates in buildings or on building materials, mold growth may occur, particularly if the moisture problem remains undiscovered or is not addressed over a period of time. Some molds may produce airborne toxins or irritants. Concern about indoor exposure to mold has been increasing, as exposure to mold may cause a variety of adverse health effects and symptoms, including allergic reactions. As a result, the presence of mold to which our hotel guests or employees could be exposed at any of our properties could require us to undertake a costly remediation program to contain or remove the mold from the affected property, which would reduce our cash available for distribution. In addition, exposure to mold by our guests or employees, management company employees or others could expose us to liability if property damage or adverse health concerns arise.
Risks Related to Our Status as a REIT
We cannot assure you that we will remain qualified as a REIT.
We believe that we are qualified to be taxed as a REIT for federal income tax purposes for our taxable year ended
December 31, 2018
, and we expect to continue to qualify as a REIT for future taxable years, but we cannot assure you that we have qualified, or will remain qualified, as a REIT. The REIT qualification requirements are extremely complex and official interpretations of the federal income tax laws governing qualification as a REIT are limited. Certain aspects of our REIT qualification are beyond our control. Accordingly, we cannot be certain that we will be successful in operating so that we can remain qualified as a REIT. At any time, new laws, interpretations or court decisions may change the federal tax laws or the federal income tax consequences of our qualification as a REIT. Moreover, our charter provides that our board of directors may revoke or otherwise terminate our REIT election, without the approval of our stockholders, if it determines that it is no longer in our best interest to continue to qualify as a REIT.
-
24
-
If we fail to qualify as a REIT and do not qualify for certain statutory relief provisions, or otherwise cease to be a REIT, we will be subject to federal income tax on our taxable income at the corporate rate. We might need to borrow money or sell assets in order to pay any such tax. Also, we would not be allowed a deduction for dividends paid to our stockholders in computing our taxable income and we would no longer be compelled to make distributions under the Code. Unless we were entitled to relief under certain federal income tax laws, we could not re-elect REIT status until the fifth calendar year after the year in which we failed to qualify as a REIT. If we fail to qualify as a REIT but are eligible for certain relief provisions, then we may retain our status as a REIT, but we may be required to pay a penalty tax, which could be substantial.
Maintaining our REIT qualification contains certain restrictions and drawbacks.
Complying with REIT requirements may cause us to forgo otherwise attractive
opportunities.
To remain qualified as a REIT for federal income tax purposes, we must continually satisfy tests concerning, among other things, the sources of our income, the nature and diversification of our assets, the amounts we distribute to our stockholders and the ownership of our stock. In order to meet these tests, we may be required to forgo attractive business or investment opportunities. For example, we may not lease to our TRS any hotel which contains gaming. Thus, compliance with the REIT requirements may hinder our ability to operate solely to maximize profits.
To qualify as a REIT, we must meet annual distribution requirements.
In order to remain qualified as a REIT, we generally are required to distribute at least 90% of our REIT taxable income, determined without regard to the dividends paid deduction and excluding net capital gains, each year to our stockholders. To the extent that we satisfy this distribution requirement, but distribute less than 100% of our taxable income, we will be subject to federal corporate income tax on our undistributed taxable income. In addition, we will be subject to a 4% nondeductible excise tax if the actual amount that we pay out to our stockholders in a calendar year is less than a minimum amount specified under federal tax laws. As a result of differences between cash flow and the accrual of income and expenses for tax purposes, or nondeductible expenditures, for example, our REIT taxable income in any given year could exceed our cash available for distribution. Accordingly, we may be required to borrow money or sell assets to make distributions sufficient to enable us to pay out enough of our taxable income to satisfy the distribution requirement and to avoid federal corporate income tax and the 4% nondeductible excise tax in a particular year.
The formation of our TRSs and TRS lessees increases our overall tax liability.
Overall, no more than 20% of the value of a REIT’s assets may consist of stock or securities of one or more TRSs. Our domestic TRSs are subject to federal and state income tax on their taxable income. The taxable income of our TRS lessees currently consists and generally will continue to consist of revenues from the hotels leased by our TRS lessees plus, in certain cases, key money payments (amounts paid to us by a hotel management company in exchange for the right to manage a hotel we acquire) and yield support payments, net of the operating expenses for such properties and rent payments to us. Such taxes could be substantial. Our non-U.S. TRSs also may be subject to tax in jurisdictions where they operate.
We will be subject to a 100% excise tax to the extent that transactions with our TRSs are not conducted on an arm’s-length basis. For example, to the extent that the rent paid by one of our TRS lessees exceeds an arm’s-length rental amount, such excess is potentially subject to this excise tax. While we believe that we structure all of our leases on an arm’s-length basis, upon an audit, the IRS might disagree with our conclusion.
If the leases of our hotels to our TRS lessees are not respected as true leases for U.S. federal income tax purposes, we will fail to qualify as a REIT.
To qualify as a REIT, we must annually satisfy two gross income tests, under which specified percentages of our gross income must be derived from certain sources, such as “rents from real property.” Rents paid to us by our TRS lessees pursuant to the leases of our hotels will constitute substantially all of our gross income. In order for such rent to qualify as “rents from real property” for purposes of the gross income tests, the leases must be respected as true leases for U.S. federal income tax purposes and not be treated as service contracts, financing arrangements, joint ventures or some other type of arrangement. If our leases are not respected as true leases for U.S. federal income tax purposes, we will fail to qualify as a REIT.
You may be restricted from transferring our common stock.
In order to maintain our REIT qualification, among other requirements, no more than 50% in value of our outstanding stock may be owned, directly or indirectly, by five or fewer individuals (as defined in the federal income tax laws to include certain
-
25
-
entities) during the last half of any taxable year. In addition, the REIT rules generally prohibit a manager of one of our hotels from owning, directly or indirectly, more than 35% of our stock and a person who holds 35% or more of our stock from also holding, directly or indirectly, more than 35% of any such hotel management company. To qualify for and preserve REIT status, our charter contains an aggregate share ownership limit and a common share ownership limit. Generally, any shares of our stock owned by affiliated owners will be added together for purposes of the aggregate share ownership limit, and any shares of common stock owned by affiliated owners will be added together for purposes of the common share ownership limit.
If anyone transfers or owns shares in a way that would violate the aggregate share ownership limit or the common share ownership limit (unless such ownership limits have been waived by our board of directors), or would prevent us from continuing to qualify as a REIT under the federal income tax laws, those shares instead will be transferred to a trust for the benefit of a charitable beneficiary and will be either redeemed by us or sold to a person whose ownership of the shares will not violate the aggregate share ownership limit or the common share ownership limit. If this transfer to a trust would not be effective to prevent a violation of the ownership restrictions in our charter, then the initial intended transfer or ownership will be null and void from the outset. The intended transferee or owner of those shares will be deemed never to have owned the shares. Anyone who acquires or owns shares in violation of the aggregate share ownership limit, the common share ownership limit (unless such ownership limits have been waived by our board of directors) or the other restrictions on transfer or ownership in our charter bears the risk of a financial loss when the shares are redeemed or sold if the market price of our stock falls between the date of purchase and the date of redemption or sale.
Even if we maintain our status as a REIT, in certain circumstances, we may be subject to federal and state income taxes, which would reduce our cash available for distribution to our stockholders.
Even if we qualify and maintain our status as a REIT, we may be subject to federal income taxes or state taxes in various circumstances. For example, net income from a “prohibited transaction” will be subject to a 100% tax. In addition, we may not be able to distribute all of our income in any given year, which would result in corporate level taxes, and we may not make sufficient distributions to avoid excise taxes. We may also decide to retain certain gains from the sale or other disposition of our property and pay income tax directly on such gains. In that event, our stockholders would be required to include such gains in income and would receive a corresponding credit for their share of taxes paid by us. We may also be subject to U.S. state and local and non-U.S. taxes on our income or properties, either directly or at the level of our operating partnership or the other companies through which we indirectly own our assets. In addition, we may be subject to federal, state, local or non-U.S. taxes in other various circumstances. Any federal or state taxes that we pay will reduce our cash available for distribution to our stockholders.
Dividends payable by REITs generally do not qualify for reduced tax rates.
A maximum 20% tax rate applies to “qualified dividend income” payable to individual U.S. stockholders. Dividends payable by REITs, however, are generally not eligible for the reduced rates on qualified dividend income and are taxed at normal ordinary income tax rates (provided that for taxable years beginning after December 31, 2017 and before January 1, 2026, non-corporate taxpayers generally may deduct up to 20% of their ordinary REIT dividends that are not “capital gain dividends” or “qualified dividend income”). However, to the extent that our dividends are attributable to certain dividends that we receive from a TRS, such dividends generally will be eligible for the reduced rates that apply to qualified dividend income (but will be ineligible for the 20% deduction). The more favorable rates applicable to regular corporate dividends could cause investors who are individuals to perceive investments in REITs to be relatively less attractive than investments in the stocks of non-REIT corporations that pay qualified dividend income, which could adversely affect the value of the stock of REITs, including our common stock. In addition, non-REIT corporations may begin to pay dividends or increase dividends as a result of the lower corporate income tax rate that is effective for taxable years beginning after December 31, 2017. As a result, the trading price of our common stock may be negatively impacted.
Failure of our operating partnership to be taxable as a partnership could cause us to fail to qualify as a REIT and we could suffer other adverse tax consequences.
We believe that our operating partnership will continue to be treated for federal income tax purposes as a partnership and not as an association or as a publicly traded partnership taxable as a corporation. If the IRS were successfully to determine that our operating partnership was properly treated as a corporation, our operating partnership would be required to pay U.S. federal income tax at corporate rates on its net income, its partners would be treated as stockholders of our operating partnership and distributions to partners would constitute distributions that would not be deductible in computing the operating partnership’s taxable income. In addition, we could fail to qualify as a REIT, with the resulting consequences described above.
Our UPREIT structure may result in potential conflicts of interest with limited partners in our operating partnership whose interests may not be aligned with those of our stockholders.
-
26
-
Limited partners in our operating partnership have the right to vote on certain amendments to the agreement that governs our operating partnership, as well as on certain other matters. Persons holding such voting rights may exercise them in a manner that conflicts with our stockholders’ interests. As general partner of our operating partnership, we are obligated to act in a manner that is in the best interests of all partners of our operating partnership. Circumstances may arise in the future when the interests of limited partners in our operating partnership may conflict with the interests of our stockholders. These conflicts may be resolved in a manner that some stockholders believe is not in their best interests.
Recent tax legislation or regulatory action could adversely affect us or our investors.
On December 22, 2017, H.R. 1, informally titled the Tax Cuts and Jobs Act (the “TCJA”), was enacted. The TCJA made major changes to the Code, including a number of provisions of the Code that affect the taxation of REITs and their stockholders. The long-term effect of the significant changes made by the TCJA remains uncertain, and additional administrative guidance will be required in order to fully evaluate the effect of many provisions. The effect of any technical corrections with respect to the TCJA could have an adverse effect on us or our stockholders.
Legislative or regulatory action could adversely affect our stockholders.
In recent years, numerous legislative, judicial and administrative changes have been made to the federal income tax laws applicable to investments in REITs and similar entities. Additional changes to applicable tax laws are likely to continue to occur in the future, and we cannot assure our stockholders that any such changes will not adversely affect the taxation of a stockholder. Any such changes could have an adverse effect on an investment in our common stock. All stockholders are urged to consult with their tax advisors with respect to the status of legislative, regulatory or administrative developments and proposals and their potential effect on an investment in our common stock.
Risks Related to Our Organization and Structure
Provisions of our charter may limit the ability of a third party to acquire control
of our company.
Our charter provides that no person may beneficially own more than 9.8% of the aggregate outstanding shares of our common stock or more than 9.8% of the value of the aggregate outstanding shares of our capital stock, except certain “look-through entities,” such as mutual funds, which may beneficially own up to 15% of the aggregate outstanding shares of our common stock or up to 15% of the value of the aggregate outstanding shares of our capital stock. Our board of directors has waived this ownership limitation for certain investors in the past. Our bylaws waive this ownership limitation for certain other classes of investors. These ownership limitations may prevent an acquisition of control of our company by a third party without our board of directors’ approval, even if our stockholders believe the change of control is in their best interests.
Our charter also authorizes our board of directors to issue up to 400,000,000 shares of common stock and up to 10,000,000 shares of preferred stock, to classify or reclassify any unissued shares of common stock or preferred stock and to set the preferences, rights and other terms of the classified or reclassified shares. Furthermore, our board of directors may, without any action by the stockholders, amend our charter from time to time to increase or decrease the aggregate number of shares of stock of any class or series that we have authority to issue. Issuances of additional shares of stock may have the effect of delaying, deferring or preventing a transaction or a change in control of our company that might involve a premium to the market price of our common stock or otherwise be in our stockholders’ best interests.
Certain advance notice provisions of our bylaws may limit the ability of a third
party to acquire control of our company.
Our bylaws provide that (a) with respect to an annual meeting of stockholders, nominations of individuals for election to our board of directors and the proposal of other business to be considered by stockholders may be made only (i) pursuant to our notice of the meeting, (ii) by the board of directors or (iii) by a stockholder who is entitled to vote at the meeting and has complied with the advance notice procedures set forth in the bylaws and (b) with respect to special meetings of stockholders, only the business specified in our notice of meeting may be brought before the meeting of stockholders and nominations of individuals for election to the board of directors may be made only (A) by the board of directors or (B) provided that the board of directors has determined that directors shall be elected at such meeting by a stockholder who is entitled to vote at the meeting and has complied with the advance notice provisions set forth in the bylaws. These advance notice provisions may have the effect of delaying, deferring or preventing a transaction or a change in control of our company that might involve a premium to the market price of our common stock or otherwise be in our stockholders’ best interests.
Provisions of Maryland law may limit the ability of a third party to acquire control
of our company.
-
27
-
The Maryland General Corporation Law, or the MGCL, has certain restrictions on a “business combination” and “control share acquisition” which we have opted out of. If an affirmative majority of votes cast by a majority of stockholders entitled to vote approve it, our board of directors may opt in to such provisions of the MGCL. If we opt in, and the stockholders approve it, these provisions may have the effect of delaying, deferring or preventing a transaction or a change in control of our company that might involve a premium price for holders of our common stock or otherwise be in their best interests.
In addition, provisions of Maryland law permit the board of a corporation with a class of equity securities registered under the Exchange Act and at least three independent directors, without stockholder approval, to implement possible takeover defenses, such as a classified board or a two-thirds vote requirement for removal of a director. These provisions, if implemented, may make it more difficult for a third party to affect a takeover. In February 2014, however, we amended our charter to prohibit us from dividing directors into classes unless such action is first approved by the affirmative vote of a majority of the votes cast on the matter by stockholders entitled to vote generally in the election of directors.
We have entered into an agreement with each of our senior executive officers that
provides each of them benefits in the event that his employment is terminated by us
without cause, by him for good reason or under certain circumstances following a
change of control of our company.
We have entered into an agreement with each of our senior executive officers that provides each of them with severance benefits if his employment is terminated under certain circumstances following a change of control of our company. Certain of these benefits and the related tax indemnity in the case of certain executive officers could prevent or deter a change of control of our company that might involve a premium price for our common stock or otherwise be in the best interests of our stockholders.
You have limited control as a stockholder regarding any changes that we make to our
policies.
Our board of directors determines our major policies, including policies related to our investment objectives, leverage, financing, growth and distributions to our stockholders. Our board of directors may amend or revise these policies without a vote of our stockholders. This means that our stockholders will have limited control over changes in our policies and those changes could adversely affect our business, financial condition, results of operations and our ability to make distributions to our stockholders.
We may be unable to generate sufficient cash flows from our operations to make distributions to our stockholders at expected levels, and we cannot assure you of our ability to make distributions in the future.
We intend to pay quarterly dividends that represents at least 90% of our REIT taxable income. Our ability to make these intended distributions may be adversely affected by the factors, risks and uncertainties described in this Annual Report on Form 10-K and other reports that we file from time to time with the SEC. In addition, our board of directors has the sole discretion to determine the timing, form and amount of any distribution to our stockholders. Our board of directors will make determinations regarding distributions based upon many facts, including our financial performance, our debt service obligations, our debt covenants, our capital expenditure requirements, the requirements for qualification as a REIT and other factors that our board of directors may deem relevant from time to time. As a result, no assurance can be given that we will be able to make distributions to our stockholders at expected levels, or at all, or that distributions will increase or even be maintained over time, any of which could materially and adversely affect the market price of our common stock.
Changes in market conditions could adversely affect the market price of our common
stock.
As with other publicly traded equity securities, the value of our common stock depends on various market conditions that may change from time to time. Among the market conditions that may affect the value of our common stock are the following:
|
•
|
the extent of investor interest in our securities;
|
|
•
|
the general reputation of REITs and the attractiveness of our equity securities in comparison to other equity securities, including securities issued by other real estate-based companies;
|
|
•
|
the underlying asset value of our hotels;
|
|
•
|
investor confidence in the stock and bond markets, generally;
|
|
•
|
national and local economic conditions;
|
-
28
-
|
•
|
changes in tax laws;
|
|
•
|
our financial performance; and
|
|
•
|
general stock and bond market conditions.
|
The market value of our common stock is based primarily upon the market’s perception of our growth potential and our current and potential future earnings and cash distributions. Consequently, our common stock may trade at prices that are greater or less than our net asset value per share of common stock. If our future earnings or cash distributions are less than expected, it is likely that the market price of our common stock will diminish.
In addition, interest rates have been at historically low levels for an extended period of time. The market for common shares of publicly traded REITs may be influenced by the distribution yield on their common shares (i.e., the amount of annual distributions as a percentage of the market price of their common shares) relative to market interest rates. Although current market interest rates remain low compared to historical levels, interest rates have recently risen and some market forecasts predict additional increases in the near term. If market interest rates increase, prospective purchasers of REIT common shares may seek to achieve a higher distribution yield, which we may not be able to, or may choose not to, provide. Thus, higher market interest rates could cause the returns on investment in our common stock to be relatively less attractive to our investors and the market price of our common stock to decline. Additionally, higher market interest rates may adversely impact the market values of our hotels.
The market price of our common stock could be volatile and could decline, resulting
in a substantial or complete loss on our common stockholders’ investment.
The market price of our common stock has been highly volatile in the past, and investors in our common stock may experience a decrease in the value of their shares, including decreases unrelated to our operating performance or prospects. In the past, securities class action litigation has often been instituted against companies following periods of volatility in their stock price. This type of litigation could result in substantial costs and divert our management’s attention and resources.
Future issuances of our common stock or our operating partnership’s common limited partnership units (“OP units”), may depress the market price of our common stock and have a dilutive effect on our existing stockholders.
We cannot predict whether future issuances of our common stock or the availability of shares for resale in the open market may depress the market price of our common stock. Future issuances or sales of a substantial number of shares of our common stock in the public market, or the issuance of our common stock in connection with future property, portfolio or business acquisitions, or the perception that such issuances or sales might occur, may cause the market price of our shares to decline. In addition, future issuances or sales of our common stock may be dilutive to existing stockholders.
Our December 2018 acquisition of Cavallo Point was partially funded by the issuance by our operating partnership of OP units, which will be redeemable by the seller at any time after the one-year anniversary of such issuance for cash or, at our election, on a one-for-one basis for shares of our common stock. Pursuant to the terms of the contribution agreement governing our acquisition of Cavallo Point, if any of the OP units are outstanding seven years after their issuance, we have the option to redeem them for cash or shares of our common stock, at our election. In the future, our operating partnership may issue additional OP units to acquire additional properties or portfolios. Such OP unit issuances would reduce our ownership interest in the operating partnership and may in the future result in dilution of our shareholders’ equity interests.
Future offerings of debt securities or preferred stock, which would be senior to our
common stock upon liquidation and for the purpose of distributions, may cause the
market price of our common stock to decline.
In the future, we may increase our capital resources by making additional offerings of debt or equity securities, which may include senior or subordinated notes, classes of preferred stock and/or common stock. We will be able to issue additional shares of common stock or preferred stock without stockholder approval, unless stockholder approval is required by applicable law or the rules of any stock exchange or automated quotation system on which our securities may be listed or traded. Upon liquidation, holders of our debt securities and shares of preferred stock and lenders with respect to other borrowings will receive a distribution of our available assets prior to the holders of our common stock. Additional equity offerings could significantly dilute the holdings of our existing stockholders or reduce the market price of our common stock, or both. Holders of our common stock are not entitled to preemptive rights or other protections against dilution. Preferred stock and debt, if issued, could have a preference on liquidating distributions or a preference on dividend or interest payments that could limit our ability to make distributions to the holders of our common stock. Because our decision to issue securities in any future offering will depend on market conditions and other
-
29
-
factors beyond our control, we cannot predict or estimate the amount, timing or nature of our future offerings. Thus, our stockholders bear the risk of our future offerings reducing the market price of our common stock and diluting their interest.
Our growth strategy may not achieve the anticipated results.
Our future success will depend on our ability to grow our business, including through capital investments to acquire and renovate full-service hotel properties. Our growth and innovation strategies require significant commitments of management resources and capital investments and may not grow our revenues at the rate we expect or at all. As a result, we may not be able to recover the costs incurred in acquiring or renovating new hotel properties or to realize their intended or projected benefits, which could materially adversely affect our business, financial condition or results of operations.
We cannot guarantee that we will repurchase our common stock pursuant to our share repurchase program or that our share repurchase program will enhance long-term stockholder value. Share repurchases could also increase the volatility of the price of our common stock and could diminish our cash reserves.
The timing and amount of repurchases of shares of our common stock, if any, will depend upon several factors, including market and business conditions, the trading price of our common stock, our cost of capital and the nature of other investment opportunities. Our share repurchase program may be limited, suspended or discontinued at any time without prior notice. In addition, repurchases of our common stock pursuant to our share repurchase program could affect our stock price and increase its volatility. The existence of our share repurchase program could cause our stock price to be higher than it would be in the absence of such a program and could potentially reduce the market liquidity for our stock. Additionally, our share repurchase program could diminish our cash reserves, which may impact our ability to finance future growth and to pursue possible future strategic opportunities and acquisitions. There can be no assurance that any share repurchases will enhance stockholder value because the market price of our common stock may decline below the levels at which we repurchased shares of stock. Although our share repurchase program is intended to enhance long-term stockholder value, there is no assurance that it will do so and short-term stock price fluctuations could reduce the program’s effectiveness. Our share repurchase program may be suspended or terminated at any time without notice.
Tax protection agreements may limit our ability to sell or otherwise dispose of certain properties and may require our operating partnership to maintain certain debt levels that otherwise would not be required to operate our business.
In connection with contributions of properties to our operating partnership, our operating partnership has entered and may in the future enter into tax protection agreements under which it agrees to minimize the tax consequences to the contributing partners resulting from the sale or other disposition of the contributed properties. Tax protection agreements may make it economically prohibitive to sell any properties that are subject to such agreements. In addition, we may be required to maintain a minimum level of indebtedness throughout the term of any tax protection agreement regardless of whether such debt levels are otherwise required to operate our business.
Item 1B.
Unresolved Staff Comments
None.
-
30
-
Item 2.
Properties
The following table sets forth certain information for each of our hotels owned as of
December 31, 2018
.
|
Hotel
|
City
|
State
|
Chain Scale Segment (1)
|
Service Category
|
Rooms
|
Manager
|
|||||||
|
Chicago Marriott
|
Chicago
|
Illinois
|
Upper Upscale
|
Full Service
|
1,200
|
|
Marriott
|
||||||
|
Westin Boston Waterfront Hotel
|
Boston
|
Massachusetts
|
Upper Upscale
|
Full Service
|
793
|
|
Marriott
|
||||||
|
Lexington Hotel New York
|
New York
|
New York
|
Upper Upscale
|
Full Service
|
725
|
|
Highgate Hotels
|
||||||
|
Salt Lake City Marriott Downtown
|
Salt Lake City
|
Utah
|
Upper Upscale
|
Full Service
|
510
|
|
Marriott
|
||||||
|
Renaissance Worthington
|
Fort Worth
|
Texas
|
Upper Upscale
|
Full Service
|
504
|
|
Marriott
|
||||||
|
Frenchman’s Reef & Morning Star Beach Resort
|
St. Thomas
|
U.S. Virgin Islands
|
Upper Upscale
|
Full Service
|
502
|
|
None (2)
|
||||||
|
Westin San Diego
|
San Diego
|
California
|
Upper Upscale
|
Full Service
|
436
|
|
Interstate Hotels & Resorts
|
||||||
|
Westin Fort Lauderdale Beach Resort
|
Fort Lauderdale
|
Florida
|
Upper Upscale
|
Full Service
|
432
|
|
HEI Hotels & Resorts
|
||||||
|
Westin Washington, D.C. City Center
|
Washington
|
District of Columbia
|
Upper Upscale
|
Full Service
|
410
|
|
HEI Hotels & Resorts
|
||||||
|
Hilton Boston Downtown
|
Boston
|
Massachusetts
|
Upper Upscale
|
Full Service
|
403
|
|
Davidson Hotels & Resorts
|
||||||
|
Vail Marriott Mountain Resort & Spa
|
Vail
|
Colorado
|
Upper Upscale
|
Full Service
|
344
|
|
Vail Resorts
|
||||||
|
Marriott Atlanta Alpharetta
|
Atlanta
|
Georgia
|
Upper Upscale
|
Full Service
|
318
|
|
Marriott
|
||||||
|
Courtyard Manhattan/Midtown East
|
New York
|
New York
|
Upscale
|
Select Service
|
321
|
|
HEI Hotels & Resorts
|
||||||
|
The Gwen Chicago
|
Chicago
|
Illinois
|
Luxury
|
Full Service
|
311
|
|
HEI Hotels & Resorts
|
||||||
|
Hilton Garden Inn Times Square Central
|
New York
|
New York
|
Upscale
|
Select Service
|
282
|
|
Highgate Hotels
|
||||||
|
Bethesda Marriott Suites
|
Bethesda
|
Maryland
|
Upper Upscale
|
Full Service
|
272
|
|
Marriott
|
||||||
|
Hilton Burlington
|
Burlington
|
Vermont
|
Upper Upscale
|
Full Service
|
258
|
|
Interstate Hotels & Resorts
|
||||||
|
Hotel Palomar Phoenix
|
Phoenix
|
Arizona
|
Upper Upscale
|
Full Service
|
242
|
|
Kimpton Hotels & Restaurants
|
||||||
|
JW Marriott Denver at Cherry Creek
|
Denver
|
Colorado
|
Luxury
|
Full Service
|
196
|
|
Sage Hospitality
|
||||||
|
Courtyard Manhattan/Fifth Avenue
|
New York
|
New York
|
Upscale
|
Select Service
|
189
|
|
Marriott
|
||||||
|
Sheraton Suites Key West
|
Key West
|
Florida
|
Upper Upscale
|
Full Service
|
184
|
|
Ocean Properties
|
||||||
|
The Lodge at Sonoma, a Renaissance Resort & Spa
|
Sonoma
|
California
|
Upper Upscale
|
Full Service
|
182
|
|
Marriott
|
||||||
|
Courtyard Denver Downtown
|
Denver
|
Colorado
|
Upscale
|
Select Service
|
177
|
|
Sage Hospitality
|
||||||
|
Renaissance Charleston
|
Charleston
|
South Carolina
|
Upper Upscale
|
Full Service
|
166
|
|
Marriott
|
||||||
|
Shorebreak Hotel
|
Huntington Beach
|
California
|
Upper Upscale
|
Full Service
|
157
|
|
Kimpton Hotels & Restaurants
|
||||||
|
Cavallo Point, The Lodge at the Golden Gate
|
Sausalito
|
California
|
Luxury
|
Full Service
|
142
|
|
Ft. Baker Management LLC
|
||||||
|
Havana Cabana Key West (3)
|
Key West
|
Florida
|
Upscale
|
Select Service
|
106
|
|
Ocean Properties
|
||||||
|
Hotel Emblem (4)
|
San Francisco
|
California
|
Upper Upscale
|
Full Service
|
94
|
|
Viceroy Hotels & Resorts
|
||||||
|
L'Auberge de Sedona
|
Sedona
|
Arizona
|
Luxury
|
Full Service
|
88
|
|
Two Roads Hospitality
|
||||||
|
The Landing Resort & Spa
|
South Lake Tahoe
|
California
|
Luxury
|
Full Service
|
77
|
|
Two Roads Hospitality
|
||||||
|
Orchards Inn Sedona
|
Sedona
|
Arizona
|
Upscale
|
Full Service
|
70
|
|
Two Roads Hospitality
|
||||||
|
Total
|
|
10,091
|
|
||||||||||
_____________
-
31
-
|
(1)
|
As defined by Smith Travel Research
|
|
(2)
|
We terminated the management agreement with Marriott, effective February 20, 2018. The hotel is currently closed as a result of the damage incurred by Hurricanes Irma and Maria in September 2017.
|
|
(3)
|
Formerly named the Inn at Key West
|
|
(4)
|
Formerly named Hotel Rex
|
Hotel Management Agreements
We are party to hotel management agreements for each hotel that we own. The following table sets forth the expiration date of the current term, the terms of termination of the manager by the Company, and the number of remaining renewal terms at the manager's option under the respective hotel management agreements for each of our hotels. Generally, the term of the hotel management agreements, if applicable, renew automatically for a negotiated number of consecutive periods upon the expiration of the initial term unless the manager gives notice to us of its election not to renew the hotel management agreement.
|
Property (1)
|
Manager
|
Terminable
|
Expiration Date of Current Term
|
Number of Remaining Renewal Terms at Manager's Exclusive Option (2)
|
||||
|
Atlanta Alpharetta Marriott
|
Marriott
|
No
|
12/2030
|
Two ten-year periods
|
||||
|
Bethesda Marriott Suites
|
Marriott
|
2022 with no fee
|
12/2025
|
Two ten-year periods
|
||||
|
Boston Westin Waterfront
|
Marriott
|
2026 with no fee
|
12/2026
|
None
|
||||
|
Cavallo Point, The Lodge at the Golden Gate
|
Passport Resorts
|
At will with fee
|
6/2023
|
One five-year period
|
||||
|
Chicago Marriott Downtown
|
Marriott
|
No
|
12/2038
|
Two ten-year periods
|
||||
|
Courtyard Denver Downtown
|
Sage Hospitality
|
At will with no fee
|
7/2021
|
None
|
||||
|
Courtyard Manhattan/Fifth Avenue
|
Marriott
|
No
|
12/2035
|
None
|
||||
|
Courtyard Manhattan/Midtown East
|
HEI Hotels & Resorts
|
At will with fee
|
8/2027
|
None
|
||||
|
The Gwen Chicago
|
HEI Hotels & Resorts
|
At will with fee
|
6/2026
|
None
|
||||
|
Hilton Boston Downtown
|
Davidson Hotels & Resorts
|
At will with no fee
|
11/2019
|
None
|
||||
|
Hilton Burlington
|
Interstate Hotels & Resorts
|
At will with no fee
|
N/A
|
Month-to-month
|
||||
|
Hilton Garden Inn New York City/Times Square Central
|
Highgate Hotels
|
2024 with no fee
|
12/2024
|
One five-year period (3)
|
||||
|
Hotel Emblem
|
Viceroy Hotels & Resorts
|
At will with fee
|
12/2027
|
One five-year period
|
||||
|
Hotel Palomar Phoenix
|
Kimpton Hotel & Restaurant Group
|
2020 upon sale with fee;
2023 upon sale with no fee |
12/2027
|
One five-year period (4)
|
||||
|
Havana Cabana Key West
|
Ocean Properties
|
At will with no fee
|
12/2026
|
Two five-year periods
|
||||
|
JW Marriott Denver at Cherry Creek
|
Sage Hospitality
|
At will with no fee
|
5/2021
|
None
|
||||
|
L'Auberge de Sedona
|
Two Roads Hospitality
|
At will with fee
|
12/2022
|
None
|
||||
|
Lexington Hotel New York
|
Highgate Hotels
|
2019 upon sale with fee; 2020 upon sale with no fee
|
5/2021
|
One five-year period (3)
|
||||
|
Orchards Inn Sedona
|
Two Roads Hospitality
|
At will with fee
|
12/2022
|
None
|
||||
|
Renaissance Charleston
|
Marriott
|
Upon sale with fee
|
12/2021
|
Two five-year periods
|
||||
|
Renaissance Worthington
|
Marriott
|
No
|
12/2031
|
Two ten-year periods
|
||||
|
Salt Lake City Marriott Downtown
|
Marriott
|
No
|
12/2026
|
Two fifteen-year periods
|
||||
|
Sheraton Suites Key West
|
Ocean Properties
|
No
|
7/2027
|
None
|
||||
|
Shorebreak Hotel
|
Kimpton Hotel & Restaurant Group
|
At will with fee
|
2/2025
|
None
|
||||
|
The Landing Resort & Spa
|
Two Roads Hospitality
|
At will with fee;
2020 with no fee |
12/2023
|
None
|
||||
|
The Lodge at Sonoma, a Renaissance Resort & Spa
|
Marriott
|
No
|
12/2025
|
One ten-year period
|
||||
|
Vail Marriott Mountain Resort & Spa
|
Vail Resorts
|
Upon sale with fee
|
12/2020
|
None
|
||||
|
Westin Fort Lauderdale Beach Resort
|
HEI Hotels & Resorts
|
At will with fee;
2023 with no fee |
12/2024
|
None
|
||||
|
Westin San Diego
|
Interstate Hotels & Resorts
|
At will with no fee
|
N/A
|
Month-to-month
|
||||
|
Westin Washington D.C. City Center
|
HEI Hotels & Resorts
|
At will with fee;
2023 with no fee |
4/2025
|
None
|
||||
____________________
|
(1)
|
We terminated the management agreement for Frenchman's Reef with Marriott, effective
February 20, 2018
. The hotel is currently closed as a result of the physical damage incurred from Hurricanes Irma and Maria.
|
|
(2)
|
Certain agreements allow for other extension rights that may be only at our option.
|
-
32
-
|
(3)
|
Hotel manager is entitled to one five-year extension option upon achievement of a certain level of net operating income, which is significantly above current net operating income at the hotel.
|
|
(4)
|
Hotel manager is entitled to one five-year extension option if the manager earns an incentive management fee in both 2026 and 2027. The manager did not earn an incentive management fee in 2018.
|
Under our hotel management agreements, the hotel manager receives a base management fee and, if certain financial thresholds are met or exceeded, an incentive management fee. The base management fee is generally payable as a percentage of gross hotel revenues for each fiscal year. The incentive management fee is generally based on hotel operating profits, but the fee only applies to that portion of hotel operating profits above a negotiated return on our invested capital, which we refer to as the owner's priority. We refer to this excess of operating profits over the owner's priority as “available cash flow.”
The following table sets forth the base management fee, incentive management fee and FF&E reserve contribution, generally due and payable each fiscal year, for each of our hotels:
|
Property
|
Base Management Fee(1)
|
|
Incentive Management Fee(2)
|
|
FF&E Reserve Contribution(1)
|
|
||||
|
Atlanta Alpharetta Marriott
|
2
|
%
|
(3)
|
25
|
%
|
|
5
|
%
|
|
|
|
Bethesda Marriott Suites
|
3
|
%
|
|
50
|
%
|
(4)
|
5
|
%
|
(5)
|
|
|
Boston Westin Waterfront
|
2.5
|
%
|
|
20
|
%
|
|
4
|
%
|
|
|
|
Cavallo Point, The Lodge at the Golden Gate
|
|
2.5
|
%
|
|
5
|
%
|
|
4
|
%
|
|
|
Chicago Marriott Downtown
|
2
|
%
|
(6)
|
18
|
%
|
(7)
|
5
|
%
|
|
|
|
Courtyard Denver Downtown
|
1.5
|
%
|
(8)
|
10
|
%
|
|
4
|
%
|
|
|
|
Courtyard Manhattan/Fifth Avenue
|
6
|
%
|
|
25
|
%
|
|
4
|
%
|
|
|
|
Courtyard Manhattan/Midtown East
|
1.75
|
%
|
(9)
|
15
|
%
|
|
4
|
%
|
|
|
|
Frenchman's Reef & Morning Star Beach Resort (10)
|
3
|
%
|
|
15
|
%
|
|
5.5
|
%
|
|
|
|
The Gwen Chicago
|
2
|
%
|
(11)
|
15
|
%
|
4
|
%
|
|||
|
Havana Cabana Key West
|
3
|
%
|
10
|
%
|
|
4
|
%
|
|||
|
Hilton Boston Downtown
|
2
|
%
|
10
|
%
|
|
4
|
%
|
|||
|
Hilton Burlington
|
1.5
|
%
|
(12)
|
10
|
%
|
|
—
|
|
||
|
Hilton Garden Inn New York City/Times Square Central
|
3
|
%
|
|
20
|
%
|
4
|
%
|
|||
|
Hotel Emblem
|
2.75
|
%
|
|
15
|
%
|
|
4
|
%
|
||
|
Hotel Palomar Phoenix
|
3.5
|
%
|
|
20
|
%
|
|
4
|
%
|
||
|
JW Marriott Denver at Cherry Creek
|
2.5
|
%
|
|
10
|
%
|
|
4
|
%
|
|
|
|
The Landing Resort & Spa
|
1.5
|
%
|
15
|
%
|
4
|
%
|
||||
|
Lexington Hotel New York
|
3
|
%
|
|
20
|
%
|
|
5
|
%
|
||
|
Renaissance Charleston
|
3.5
|
%
|
|
20
|
%
|
|
5
|
%
|
|
|
|
Renaissance Worthington
|
3
|
%
|
|
25
|
%
|
|
5
|
%
|
|
|
|
Salt Lake City Marriott Downtown
|
2
|
%
|
(13)
|
20
|
%
|
|
5
|
%
|
|
|
|
L'Auberge de Sedona
|
0.5
|
%
|
(14)
|
10
|
%
|
4
|
%
|
|||
|
Orchards Inn Sedona
|
0.5
|
%
|
(14)
|
10
|
%
|
4
|
%
|
|||
|
Sheraton Suites Key West
|
3
|
%
|
10
|
%
|
4
|
%
|
||||
|
Shorebreak Hotel
|
2.5
|
%
|
15
|
%
|
4
|
%
|
||||
|
The Lodge at Sonoma, a Renaissance Resort & Spa
|
3
|
%
|
|
20
|
%
|
|
5
|
%
|
|
|
|
Vail Marriott Mountain Resort & Spa
|
3
|
%
|
|
20
|
%
|
|
4
|
%
|
|
|
|
Westin Fort Lauderdale Beach Resort
|
2
|
%
|
|
15
|
%
|
|
4
|
%
|
||
|
Westin San Diego
|
1.5
|
%
|
(12)
|
10
|
%
|
|
4
|
%
|
|
|
|
Westin Washington D.C. City Center
|
2
|
%
|
15
|
%
|
|
4
|
%
|
|||
______________
|
(1)
|
As a percentage of gross revenues.
|
|
(2)
|
Based on a percentage of hotel operating profits above a specified return on our invested capital or specified operating profit thresholds.
|
|
(3)
|
The base management fee decreases to
2%
of gross revenues between
February 2018
and
January 2021
.
|
|
(4)
|
The owner's priority expires in
2028
, after which the manager will receive
50%
of the hotel's operating profits.
|
|
(5)
|
The contribution is reduced to
1%
until operating profits exceed an owner's priority of
$4.4 million
.
|
|
(6)
|
The base management fee decreased from
3.0%
to
2.0%
for October 2017 through September 2021 and will then revert back to
3%
for the remainder of the term.
|
-
33
-
|
(7)
|
Calculated as
18%
of net operating income. There is
no
owner's priority; however, the Company's contribution to the hotel's multi-year property renovation is treated as a deduction in calculating net operating income.
|
|
(8)
|
The base management fee is a sum of
1.5%
of gross revenues and
1.5%
of gross operating profit.
|
|
(9)
|
Beginning in
January 2018
, the base management fee increased to
1.75%
of gross revenues through the remainder of the term.
|
|
(10)
|
We terminated the management agreement with Marriott, effective
February 20, 2018
. The hotel is currently closed as a result of the physical damage incurred from Hurricanes Irma and Maria.
|
|
(11)
|
The base management fee increases to
2.25%
for 2018 through the remainder of the term.
|
(12) Total management fees are capped at
2.5%
of gross revenues.
|
(13)
|
The base management fee decreased from
3%
to
1.5%
beginning May 2016 and increased to
2.0%
in May 2018 and will increase to
3.0%
in May 2021 through the remainder of the term.
|
|
(14)
|
Prior to December 2017, the base management fee was
2.45%
of gross revenues under the previous hotel manager. The base management fee increases to
1.0%
for 2019 and
1.5%
for 2020 through the remainder of the term.
|
Additional information regarding fees incurred under hotel management agreements can be found in Note 12 to our accompanying consolidated financial statements.
Franchise Agreements
The following table sets forth the terms of the hotel franchise agreements for our
13
franchised hotels:
|
Expiration Date of Agreement
|
Franchise Fee
|
|||
|
Vail Marriott Mountain Resort & Spa
|
12/2021
|
6% of gross room sales plus 3% of gross food and beverage sales
|
||
|
JW Marriott Denver at Cherry Creek
|
10/2026
|
6% of gross room sales and 3% of gross food and beverage sales
|
||
|
Lexington Hotel New York
|
3/2032
|
5% of gross room sales
|
||
|
Courtyard Denver Downtown
|
10/2027
|
4.5% of gross room sales (1)
|
||
|
Hilton Boston Downtown
|
7/2022
|
5% of gross room sales and 3% of gross food and beverage sales; program fee of 4% of gross room sales
|
||
|
Westin Washington D.C. City Center
|
12/2030
|
7% of gross room sales and 3% of gross food and beverage sales
|
||
|
Westin San Diego
|
12/2030
|
7% of gross room sales and 3% of gross food and beverage sales
|
||
|
Hilton Burlington
|
7/2032
|
4% of gross room sales and 3% of gross food and beverage sales; program fee of 4% of gross room sales (2)
|
||
|
Hilton Garden Inn New York/Times Square Central
|
6/2033
|
5% of gross room sales; program fee of 4.3% of gross room sales
|
||
|
Westin Fort Lauderdale Beach Resort
|
12/2034
|
6% of gross room sales and 2% of gross food and beverage sales
|
||
|
The Gwen Chicago
|
9/2035
|
4.5% of gross room sales
|
||
|
Sheraton Suites Key West
|
2/2026
|
5% of gross room sales
|
||
|
Courtyard Manhattan/Midtown East
|
8/2042
|
6% of gross room sales
|
||
______________
|
(1)
|
Prior to October 2017, the franchise fee was
5.5%
of gross room sales. The franchise fee reverts back to
5.5%
of gross room sales beginning October 2019.
|
|
(2)
|
Prior to August 2018, the franchise fee was 3% of gross room sales. The franchise fee increased to
4%
of gross room sales beginning August 2018 and will increase to
5%
of gross room sales beginning August 2019 through the remainder of the term.
|
Additional information regarding fees incurred under franchise agreements can be found in Note 12 to our accompanying consolidated financial statements.
Mortgage Debt
Eight of our hotels are encumbered by mortgage debt. Additional information regarding such hotels can be found in Note 8 to our accompanying consolidated financial statements.
Ground Leases
Ten of our hotels are subject to ground lease agreements. Additional information regarding our hotels that are subject to ground leases can be found in Note 13 to our accompanying consolidated financial statements.
-
34
-
Item 3.
Legal Proceedings
Litigation
We are subject to various claims, lawsuits and legal proceedings, including routine litigation arising in the ordinary course of business, regarding the operation of our hotels and Company matters. While it is not possible to ascertain the ultimate outcome of such matters, management believes that the aggregate amount of such liabilities, if any, in excess of amounts covered by insurance, will not have a material adverse impact on our financial condition or results of operations. The outcome of claims, lawsuits and legal proceedings brought against the Company, however, is subject to significant uncertainties.
On August 13, 2018, the Company brought suit against certain of its property insurers in St. Thomas, U.S. Virgin Islands, over the amount of the coverage the insurers owe as a result of the damage caused to Frenchman's Reef by Hurricanes Irma and Maria. On September 28, 2018, certain of the Company's property insurers brought a similar suit against the Company in New York seeking a declaration that the insurers do not owe the full amount of the Company's claim. Notwithstanding the litigation, the Company and its insurers continue to engage in discussions and negotiation regarding the Company's claim.
|
Item 4.
|
Mine Safety Disclosures
|
Not applicable.
-
35
-
Part II
Item 5.
Market for Registrant's Common Equity, Related Stockholder Matters and Issuer Purchases of Equity Securities
Market Information
Our common stock trades on the NYSE under the symbol “DRH”. The closing price of our common stock on the NYSE on December 31, 2018 was $9.08 per share.
Stock Performance Graph
The following graph compares the five-year cumulative total stockholder return on our common stock against the cumulative total returns of the Standard & Poor's 500 Index (the “
S&P 500 Total Return
”) and the Dow Jones U.S. Hotels & Lodging REITs Index (the “
Dow Jones U.S. Hotels Total Return
”
). We believe the Dow Jones U.S. Hotels & Lodging REITs Index's total return provides a relevant industry sector comparison to our common stock's total stockholder return given the index is based on REITs that primarily invest in lodging real estate.
The graph assumes an initial investment on December 31, 2013 of $100 in our common stock in each of the indices and also assumes the reinvestment of dividends. The total return values do not include dividends declared, but not paid, during the period.
-
36
-
|
Year Ended December 31,
|
|||||||||||||||||||||||
|
2013
|
2014
|
2015
|
2016
|
2017
|
2018
|
||||||||||||||||||
|
DiamondRock Hospitality Company Total Return
|
|
$100.00
|
|
|
$132.84
|
|
|
$89.92
|
|
|
$113.13
|
|
|
$115.82
|
|
|
$96.24
|
|
|||||
|
S&P 500 Total Return
|
|
$100.00
|
|
|
$113.69
|
|
|
$115.26
|
|
|
$129.05
|
|
|
$157.22
|
|
|
$150.33
|
|
|||||
|
Dow Jones U.S. Hotels Total Return
|
|
$100.00
|
|
|
$129.43
|
|
|
$94.00
|
|
|
$116.80
|
|
|
$124.66
|
|
|
$109.10
|
|
|||||
This performance graph shall not be deemed “filed” for purposes of Section 18 of the Securities Exchange Act of 1934, as amended, or incorporated by reference into any filing by us under the Securities Act of 1933, as amended, except as shall be expressly set forth by specific reference in such filing.
Dividend Information
In order to maintain our qualification as a REIT, we must make distributions to our stockholders each year in an amount equal to at least:
|
•
|
90% of our REIT taxable income, determined without regard to the dividends paid deduction and excluding net capital gains, plus
|
|
•
|
90% of the excess of our net income from foreclosure property over the tax imposed on such income by the Code, minus
|
|
•
|
any excess non-cash income.
|
We generally pay quarterly cash dividends to common stockholders at the discretion of our board of directors.
Stockholder Information
As of February 22, 2019, there were 16 record holders of our common stock and we believe we have more than one thousand beneficial holders. As of February 22, 2019, there were 14 holders of OP units (in addition to the Company).
In order to comply with certain requirements related to our qualification as a REIT, our charter, subject to certain exceptions, limits the number of common shares that may be owned by any single person or affiliated group to 9.8% of the outstanding common shares.
Equity Compensation Plan Information
The following table provides information as of December 31, 2018 regarding shares of common stock that may be issued under the Company’s equity compensation plans.
|
Plan Category
|
Number of Securities to be Issued Upon Exercise of Outstanding Options, Warrants and Rights
|
Weighted-Average Exercise Price of Outstanding Options, Warrants and Rights
|
Number of Securities Remaining Available for Future Issuance Under Equity Compensation Plans (Excluding Securities Reflected in Column (a))
|
|||
|
(a)
|
(b)
|
(c)
|
||||
|
Equity compensation plans approved by security holders
|
1,546,472
(1)
|
—
(2)
|
5,236,147
|
|||
|
Equity compensation plans not approved by security holders
|
—
|
—
|
—
|
|||
|
Total
|
1,546,472
|
—
|
5,236,147
|
|||
__________________________________
|
(1)
|
Includes 764,549 shares of common stock issuable pursuant to our deferred compensation plan and 781,923 shares of common stock issuable upon the achievement of certain performance conditions.
|
|
(2)
|
Performance stock units and deferred stock units do not have any exercise price.
|
-
37
-
Fourth Quarter 2018 Repurchases of Equity Securities
|
Period
|
Total Number of Shares Purchased
|
Average Price Paid per Share
|
Total Number of Shares Purchased as Part of Publicly Announced Plans or Programs
|
Maximum Dollar Amount that May Yet be Purchased Under the Plans or Programs (in thousands)
(1)
|
||||||||
|
October 1 - October 31, 2018
|
65,638 (2)
|
$
|
11.54
|
|
—
|
$
|
150,000
|
|
||||
|
November 1 - November 30, 2018
|
—
|
$
|
—
|
|
—
|
$
|
250,000
|
|
||||
|
December 1 - December 31, 2018
|
3,384,359
|
$
|
9.49
|
|
3,384,359
|
$
|
217,886
|
|
||||
______________________________
|
(1)
|
Represents amounts available under the Company's share repurchase program. To facilitate repurchases, we make purchases pursuant to a trading plan under Rule 10b5-1 of the Exchange Act, which allows us to repurchase shares during periods when we otherwise may be prevented from doing so under insider trading laws or because of self-imposed trading blackout periods. The share repurchase program may be suspended or terminated at any time without prior notice. On November 2, 2018, our board of directors increased the authorization under the share repurchase program from
$150 million
to
$250 million
. Our share repurchase program will be effective until November 6, 2020.
|
|
(2)
|
Reflects shares surrendered to the Company by employees for payment of tax withholding obligations in connection with the issuance of common stock under our deferred compensation plan.
|
-
38
-
Item 6.
Selected Financial Data
The selected historical financial information as of and for the years ended December 31, 2018, 2017, 2016, 2015 and 2014 has been derived from our audited historical financial statements. The selected historical financial data should be read in conjunction with “Management's Discussion and Analysis of Financial Condition and Results of Operations,” the consolidated financial statements as of December 31, 2018 and 2017 and for the years ended December 31, 2018, 2017 and 2016, and the related notes contained elsewhere in this Annual Report on Form 10-K.
|
Year Ended December 31,
|
||||||||||||||||||||
|
2018
|
2017
|
2016
|
2015
|
2014
|
||||||||||||||||
|
(in thousands)
|
||||||||||||||||||||
|
Revenues:
|
||||||||||||||||||||
|
Rooms
|
$
|
631,048
|
|
$
|
635,932
|
|
$
|
650,624
|
|
$
|
673,578
|
|
$
|
628,870
|
|
|||||
|
Food and beverage
|
184,097
|
|
183,049
|
|
194,756
|
|
208,173
|
|
195,077
|
|
||||||||||
|
Other
|
48,559
|
|
51,024
|
|
51,178
|
|
49,239
|
|
48,915
|
|
||||||||||
|
Total revenues
|
863,704
|
|
870,005
|
|
896,558
|
|
930,990
|
|
872,862
|
|
||||||||||
|
Operating expenses:
|
||||||||||||||||||||
|
Rooms
|
158,078
|
|
158,534
|
|
159,151
|
|
163,549
|
|
162,870
|
|
||||||||||
|
Food and beverage
|
118,709
|
|
120,460
|
|
125,916
|
|
137,297
|
|
135,402
|
|
||||||||||
|
Management fees
|
22,159
|
|
21,969
|
|
30,143
|
|
30,633
|
|
30,027
|
|
||||||||||
|
Other hotel expenses
|
322,713
|
|
302,272
|
|
302,805
|
|
317,623
|
|
295,826
|
|
||||||||||
|
Impairment losses
|
—
|
|
3,209
|
|
—
|
|
10,461
|
|
—
|
|
||||||||||
|
Hotel acquisition costs
|
—
|
|
2,028
|
|
—
|
|
949
|
|
2,177
|
|
||||||||||
|
Corporate expenses
(1)
|
28,563
|
|
26,711
|
|
23,629
|
|
24,061
|
|
22,267
|
|
||||||||||
|
Depreciation and amortization
|
104,524
|
|
99,090
|
|
97,444
|
|
101,143
|
|
99,650
|
|
||||||||||
|
Business interruption insurance income
|
(19,379
|
)
|
(4,051
|
)
|
—
|
|
—
|
|
—
|
|
||||||||||
|
Gain on property insurance settlement
|
(1,724
|
)
|
—
|
|
—
|
|
—
|
|
(1,825
|
)
|
||||||||||
|
Gain on litigation settlement, net
|
—
|
|
—
|
|
—
|
|
—
|
|
(10,999
|
)
|
||||||||||
|
Total operating expenses
|
733,643
|
|
730,222
|
|
739,088
|
|
785,716
|
|
735,395
|
|
||||||||||
|
Interest and other income, net
|
(1,806
|
)
|
(1,820
|
)
|
(762
|
)
|
(688
|
)
|
(3,027
|
)
|
||||||||||
|
Interest expense
|
40,970
|
|
38,481
|
|
41,735
|
|
52,684
|
|
58,278
|
|
||||||||||
|
Gain on repayments of notes receivable
|
—
|
|
—
|
|
—
|
|
(3,927
|
)
|
(13,550
|
)
|
||||||||||
|
Loss (gain) on sales of hotel properties, net
|
—
|
|
764
|
|
(10,698
|
)
|
—
|
|
(50,969
|
)
|
||||||||||
|
Gain on hotel property acquisition
|
—
|
|
—
|
|
—
|
|
—
|
|
(23,894
|
)
|
||||||||||
|
Loss on early extinguishment of debt
|
—
|
|
274
|
|
—
|
|
—
|
|
1,616
|
|
||||||||||
|
Income before income taxes
|
90,897
|
|
102,084
|
|
127,195
|
|
97,205
|
|
169,013
|
|
||||||||||
|
Income tax expense
|
(3,101
|
)
|
(10,207
|
)
|
(12,399
|
)
|
(11,575
|
)
|
(5,636
|
)
|
||||||||||
|
Net income
|
87,796
|
|
91,877
|
|
114,796
|
|
85,630
|
|
163,377
|
|
||||||||||
|
Less: Net income attributable to noncontrolling interests
|
(12
|
)
|
—
|
|
—
|
|
—
|
|
—
|
|
||||||||||
|
Net income attributable to common stockholders
|
$
|
87,784
|
|
$
|
91,877
|
|
$
|
114,796
|
|
$
|
85,630
|
|
$
|
163,377
|
|
|||||
_________
|
(1)
|
Corporate expenses for the year ended December 31, 2018 include approximately $0.8 million of costs related to the departure of our former Chief Financial Officer. Corporate expenses for the year ended December 31, 2016 include the reversal of approximately $0.6 million of previously recognized compensation expense resulting from the forfeiture of equity awards related to the resignation of our former Executive Vice President and Chief Operating Officer. Corporate expenses for the year ended December 31, 2014 include reimbursement of $1.8 million of previously incurred legal fees and other costs from the proceeds of a litigation settlement relating to Westin Boston Waterfront.
|
-
39
-
|
Year Ended December 31,
|
||||||||||||||||||||
|
2018
|
2017
|
2016
|
2015
|
2014
|
||||||||||||||||
|
(in thousands, except for per share data)
|
||||||||||||||||||||
|
Earnings per share:
|
||||||||||||||||||||
|
Net income per share attributable to common stockholders, basic
|
$
|
0.43
|
|
$
|
0.46
|
|
$
|
0.57
|
|
$
|
0.43
|
|
$
|
0.83
|
|
|||||
|
Net income per share attributable to common stockholders, diluted
|
$
|
0.43
|
|
$
|
0.46
|
|
$
|
0.57
|
|
$
|
0.43
|
|
$
|
0.83
|
|
|||||
|
Other data:
|
||||||||||||||||||||
|
Dividends declared per common share
|
$
|
0.50
|
|
$
|
0.50
|
|
$
|
0.50
|
|
$
|
0.50
|
|
$
|
0.41
|
|
|||||
|
As of December 31,
|
||||||||||||||||||||
|
2018
|
2017
|
2016
|
2015
|
2014
|
||||||||||||||||
|
(in thousands)
|
||||||||||||||||||||
|
Balance sheet data:
|
||||||||||||||||||||
|
Property and equipment, net
|
$
|
2,944,617
|
|
$
|
2,692,286
|
|
$
|
2,646,676
|
|
$
|
2,882,176
|
|
$
|
2,764,393
|
|
|||||
|
Cash and cash equivalents
|
43,863
|
|
183,569
|
|
243,095
|
|
213,584
|
|
144,365
|
|
||||||||||
|
Total assets
|
3,197,580
|
|
3,100,858
|
|
3,050,908
|
|
3,312,510
|
|
3,151,687
|
|
||||||||||
|
Total debt
|
977,966
|
|
937,792
|
|
920,539
|
|
1,169,749
|
|
1,031,666
|
|
||||||||||
|
Total liabilities
|
1,306,987
|
|
1,267,213
|
|
1,214,121
|
|
1,487,905
|
|
1,322,700
|
|
||||||||||
|
Stockholders' equity
|
1,882,897
|
|
1,833,645
|
|
1,836,787
|
|
1,824,605
|
|
1,828,987
|
|
||||||||||
-
40
-
Item 7. Management’s Discussion and Analysis of Financial Condition and Results of Operations
The following discussion should be read in conjunction with the consolidated financial statements and related notes thereto included elsewhere in this report. This discussion contains forward-looking statements about our business. These statements are based on current expectations and assumptions that are subject to risks and uncertainties. Actual results could differ materially because of factors discussed in "Special Note About Forward-Looking Statements" and "Risk Factors" contained in this Annual Report on Form 10-K and in our other reports that we file from time to time with the SEC.
Overview
DiamondRock Hospitality Company is a lodging-focused real estate company operating as a REIT for federal income tax purposes that owns a portfolio of premium hotels and resorts. As of
December 31, 2018
, we owned a portfolio of
31
premium hotels and resorts that contain
10,091
guest rooms located in 21 different markets in North America and the U.S. Virgin Islands. Our hotel in the U.S. Virgin Islands, Frenchman's Reef, is currently closed due to damage incurred by Hurricanes Irma and Maria in September 2017.
As an owner, rather than an operator, of lodging properties, we receive all of the operating profits or losses generated by our hotels after the payment of fees due to hotel managers, which are calculated based on the revenues and profitability of each hotel.
Key Indicators of Financial Condition and Operating Performance
We use a variety of operating and other information to evaluate the financial condition and operating performance of our business. These key indicators include financial information that is prepared in accordance with U.S. Generally Accepted Accounting Principles (“U.S. GAAP”), as well as other financial information that is not prepared in accordance with U.S. GAAP. In addition, we use other information that may not be financial in nature, including statistical information and comparative data. We use this information to measure the performance of individual hotels, groups of hotels and/or our business as a whole. We periodically compare historical information to our internal budgets as well as industry-wide information. These key indicators include:
|
•
|
Occupancy percentage;
|
|
•
|
Average Daily Rate (or ADR);
|
|
•
|
Revenue per Available Room (or RevPAR);
|
|
•
|
Earnings Before Interest, Income Taxes, Depreciation and Amortization (or EBITDA), EBITDA
re
, and Adjusted EBITDA; and
|
|
•
|
Funds From Operations (or FFO) and Adjusted FFO.
|
Occupancy, ADR and RevPAR are commonly used measures within the hotel industry to evaluate operating performance. RevPAR, which is calculated as the product of ADR and occupancy percentage, is an important statistic for monitoring operating performance at the individual hotel level and across our business as a whole. We evaluate individual hotel RevPAR performance on an absolute basis with comparisons to budget and prior periods, as well as on a company-wide basis. ADR and RevPAR include only room revenue. Room revenue comprised approximately
73%
of our total revenues for the year ended
December 31, 2018
and is dictated by demand, as measured by occupancy percentage, pricing, as measured by ADR, and our available supply of hotel rooms.
Our ADR, occupancy percentage and RevPAR performance may be impacted by macroeconomic factors such as U.S. economic conditions generally, regional and local employment growth, personal income and corporate earnings, office vacancy rates and business relocation decisions, airport and other business and leisure travel, new hotel construction and the pricing strategies of competitors. In addition, our ADR, occupancy percentage and RevPAR performance is dependent on the continued success of our hotels' global brands.
We also use EBITDA, EBITDA
re
, Adjusted EBITDA, FFO and Adjusted FFO as measures of the financial performance of our business. See “Non-GAAP Financial Measures.”
Overview of 2018
-
41
-
Key highlights for 2018 include the following:
Hotel Acquisitions.
In March 2018, we acquired the 77-room Landing Resort & Spa in South Lake Tahoe, California, for a total contractual purchase price of $42 million, and the 242-room Hotel Palomar in Phoenix, Arizona, for a total contractual purchase price of $80 million. In December 2018, we acquired the 142-room Cavallo Point in Sausalito, California, for a total contractual purchase price of $152 million.
Financing Activity.
On October 18, 2018, we entered into a new five-year $50 million unsecured term loan. On December 5, 2018, we drew down the full balance of the term loan in connection with the closing of the Cavallo Point acquisition.
Update on Insurance Claims
As previously disclosed, we have insurance claims resulting from hurricanes that impacted Frenchman's Reef and the Havana Cabana Key West in 2017, as well as from the 2017 wildfires in Northern California that impacted The Lodge at Sonoma. The Company is insured for up to $361 million for each covered event, subject to certain deductibles and other conditions.
Frenchman's Reef.
The hotel was significantly damaged by Hurricanes Irma and Maria in 2017 and is expected to remain closed into 2020. We submitted our insurance claim during the first quarter of 2018 and are continuing to work diligently with our insurance carriers and the U.S. Virgin Islands government to ensure the best outcome for our stockholders. During the year ended December 31, 2018, we recognized $16.1 million of business interruption insurance income under the insurance claim.
Havana Cabana Key West.
We completed a comprehensive renovation and re-positioning of the hotel in connection with the remediation of substantial wind and water-related damage from Hurricane Irma. The hotel reopened as the Havana Cabana Key West in April 2018. In July 2018, we settled our insurance claim for the property damage and business interruption for $8.3 million, net of deductibles. During the year ended December 31, 2018, we recognized $2.1 million of business interruption income and a $1.7 million gain on the property damage insurance settlement.
The Lodge at Sonoma Renaissance Resort & Spa.
In July 2018, we settled our insurance claim for smoke damage and business interruption for $1.3 million, net of deductibles. During the year ended December 31, 2018, we recognized $1.2 million of business interruption income related to The Lodge at Sonoma.
Outlook for 2019
Although economic indicators such as GDP growth, corporate earnings, consumer confidence and employment reflect a stable U.S. economy, we expect RevPAR growth to decelerate in 2019. Furthermore we anticipate the U.S. lodging industry will be challenged by rising labor costs.
Our portfolio is weighted towards top-25 urban markets, which have experienced hotel supply increases in excess of the national average in recent years. However, we expect our resort hotels to continue to outperform the broader U.S. market, with recent repositionings driving value within the portfolio. Following $115 million of hotel renovations and capital improvements in 2018, we expect lower renovation disruption in 2019. Additionally, we continue to work closely with our hotel managers to control operating costs.
Despite anticipated deceleration, we enter 2019 with several favorable factors, including: (1) ownership of a high-quality portfolio concentrated in urban and resort locations; (2) increased internal growth from the continuation of our asset management initiatives; (3) a low leveraged capital structure relative to our peers; and (4) an unrestricted cash balance of $44 million and no outstanding borrowings on our $300 million senior unsecured credit facility as of December 31, 2018.
Results of Operations
The following table sets forth certain operating information for the year ended
December 31, 2018
for each of the hotels we owned during 2018.
-
42
-
|
Property (1)
|
Location
|
Number of
Rooms |
Occupancy (%)
|
ADR($)
|
RevPAR($)
|
% Change
from 2017 RevPAR (2) |
|||||||||||||
|
Chicago Marriott
|
Chicago, Illinois
|
1,200
|
|
73.8
|
%
|
$
|
230.37
|
|
$
|
169.96
|
|
6.4
|
%
|
||||||
|
Westin Boston Waterfront Hotel
|
Boston, Massachusetts
|
793
|
|
74.3
|
%
|
251.58
|
|
186.93
|
|
(4.4
|
)%
|
||||||||
|
Lexington Hotel New York
|
New York, New York
|
725
|
|
90.5
|
%
|
251.84
|
|
227.86
|
|
0.0
|
%
|
||||||||
|
Salt Lake City Marriott Downtown
|
Salt Lake City, Utah
|
510
|
|
70.2
|
%
|
171.74
|
|
120.61
|
|
(5.0
|
)%
|
||||||||
|
Renaissance Worthington
|
Fort Worth, Texas
|
504
|
|
74.9
|
%
|
186.66
|
|
139.78
|
|
3.2
|
%
|
||||||||
|
Westin San Diego
|
San Diego, California
|
436
|
|
81.8
|
%
|
193.56
|
|
158.35
|
|
(2.9
|
)%
|
||||||||
|
Westin Fort Lauderdale Beach Resort
|
Fort Lauderdale, Florida
|
432
|
|
81.3
|
%
|
196.67
|
|
159.99
|
|
(1.4
|
)%
|
||||||||
|
Westin Washington, D.C. City Center
|
Washington, D.C.
|
410
|
|
87.0
|
%
|
206.19
|
|
179.33
|
|
(6.2
|
)%
|
||||||||
|
Hilton Boston Downtown
|
Boston, Massachusetts
|
403
|
|
88.2
|
%
|
296.75
|
|
261.71
|
|
5.5
|
%
|
||||||||
|
Vail Marriott Mountain Resort & Spa
|
Vail, Colorado
|
344
|
|
57.5
|
%
|
293.49
|
|
168.77
|
|
(14.0
|
)%
|
||||||||
|
Marriott Atlanta Alpharetta
|
Atlanta, Georgia
|
318
|
|
69.5
|
%
|
170.35
|
|
118.37
|
|
(6.0
|
)%
|
||||||||
|
Courtyard Manhattan/Midtown East
|
New York, New York
|
321
|
|
94.5
|
%
|
261.95
|
|
247.46
|
|
4.6
|
%
|
||||||||
|
The Gwen Chicago
|
Chicago, Illinois
|
311
|
|
82.6
|
%
|
255.00
|
|
210.53
|
|
23.5
|
%
|
||||||||
|
Hilton Garden Inn New York City/Times Square Central
|
New York, New York
|
282
|
|
98.0
|
%
|
260.20
|
|
254.88
|
|
6.8
|
%
|
||||||||
|
Bethesda Marriott Suites
|
Bethesda, Maryland
|
272
|
|
67.7
|
%
|
177.23
|
|
119.90
|
|
(5.7
|
)%
|
||||||||
|
Hilton Burlington
|
Burlington, Vermont
|
258
|
|
81.4
|
%
|
187.81
|
|
152.89
|
|
6.3
|
%
|
||||||||
|
Hotel Palomar Phoenix (3)
|
Phoenix, Arizona
|
242
|
|
77.8
|
%
|
181.69
|
|
141.30
|
|
2.8
|
%
|
||||||||
|
JW Marriott Denver at Cherry Creek
|
Denver, Colorado
|
196
|
|
81.5
|
%
|
247.17
|
|
201.39
|
|
(4.9
|
)%
|
||||||||
|
Courtyard Manhattan/Fifth Avenue
|
New York, New York
|
189
|
|
91.4
|
%
|
273.47
|
|
249.93
|
|
6.0
|
%
|
||||||||
|
Sheraton Suites Key West
|
Key West, Florida
|
184
|
|
84.9
|
%
|
250.68
|
|
212.87
|
|
(2.8
|
)%
|
||||||||
|
The Lodge at Sonoma, a Renaissance Resort & Spa
|
Sonoma, California
|
182
|
|
71.6
|
%
|
304.70
|
|
218.02
|
|
7.6
|
%
|
||||||||
|
Courtyard Denver Downtown
|
Denver, Colorado
|
177
|
|
82.9
|
%
|
192.38
|
|
159.40
|
|
(3.5
|
)%
|
||||||||
|
Renaissance Charleston
|
Charleston, South Carolina
|
166
|
|
84.1
|
%
|
254.60
|
|
213.99
|
|
7.1
|
%
|
||||||||
|
Shorebreak Hotel
|
Huntington Beach, California
|
157
|
|
76.6
|
%
|
256.29
|
|
196.30
|
|
8.8
|
%
|
||||||||
|
Cavallo Point, The Lodge at the Golden Gate (4)
|
Sausalito, California
|
142
|
|
57.6
|
%
|
450.98
|
|
259.85
|
|
0.3
|
%
|
||||||||
|
Havana Cabana Key West (5)
|
Key West, Florida
|
106
|
|
73.5
|
%
|
185.25
|
|
136.07
|
|
(15.9
|
)%
|
||||||||
|
Hotel Emblem (6)
|
San Francisco, California
|
94
|
|
81.6
|
%
|
204.17
|
|
166.70
|
|
(6.6
|
)%
|
||||||||
|
L'Auberge de Sedona
|
Sedona, Arizona
|
88
|
|
76.0
|
%
|
602.63
|
|
457.86
|
|
10.0
|
%
|
||||||||
|
The Landing Resort & Spa (3)
|
South Lake Tahoe, California
|
77
|
|
61.6
|
%
|
319.11
|
|
196.47
|
|
1.1
|
%
|
||||||||
|
Orchards Inn Sedona
|
Sedona, Arizona
|
70
|
|
75.5
|
%
|
256.70
|
|
193.87
|
|
6.0
|
%
|
||||||||
|
Total/Weighted Average
|
|
9,589
|
|
79.1
|
%
|
$
|
234.04
|
|
$
|
185.13
|
|
0.0
|
%
|
||||||
________________
|
(1)
|
Frenchman's Reef was closed on September 6, 2017 due to Hurricane Irma and remains closed. Accordingly, there is no operating information for the year ended December 31, 2018.
|
|
(2)
|
The percentage change from 2017 RevPAR reflects the comparable period in 2017 to our 2018 ownership period for all hotels.
|
|
(3)
|
The operating statistics reflect our ownership period from March 1, 2018 to December 31, 2018.
|
|
(4)
|
The operating statistics reflect our ownership period from December 10, 2018 to December 31, 2018.
|
|
(5)
|
The hotel closed on September 6, 2017 due to Hurricane Irma and reopened in April 2018. Accordingly, the operating information reported only includes operations beginning in April 2018.
|
|
(6)
|
The hotel closed on September 4, 2018 for a comprehensive renovation. Accordingly, the operating information presented only includes operations through the closure date.
|
Comparison of the Year Ended
December 31, 2018
to the Year Ended
December 31, 2017
Revenue
. Revenue consists primarily of the room, food and beverage and other operating revenues from our hotels, as follows (in millions):
|
Year Ended December 31,
|
||||||||||
|
2018
|
2017
|
% Change
|
||||||||
|
Rooms
|
$
|
631.0
|
|
$
|
635.9
|
|
(0.8
|
)%
|
||
|
Food and beverage
|
184.1
|
|
183.1
|
|
0.5
|
|
||||
|
Other
|
48.6
|
|
51.0
|
|
(4.7
|
)
|
||||
|
Total revenues
|
$
|
863.7
|
|
$
|
870.0
|
|
(0.7
|
)%
|
||
-
43
-
Our total revenues decreased $6.3 million from
$870.0 million
for the year ended
December 31, 2017
to
$863.7 million
for the year ended
December 31, 2018
. The decrease includes amounts that are not comparable year-over-year as follows:
|
•
|
$50.1 million decrease from Frenchman's Reef, which was closed on September 6, 2017 due to Hurricane Irma and remained closed through the end of 2018.
|
|
•
|
$0.6 million decrease from the Havana Cabana Key West, which was closed on September 6, 2017 due to Hurricane Irma and re-opened in April 2018.
|
|
•
|
$2.2 million decrease from Hotel Emblem, which closed beginning September 4, 2018 for renovations.
|
|
•
|
$8.4 million increase from The Landing Resort & Spa, which was acquired on March 1, 2018.
|
|
•
|
$18.4 million increase from the Hotel Palomar Phoenix, which was acquired on March 1, 2018.
|
|
•
|
$2.4 million increase from Cavallo Point, which was acquired on December 12, 2018.
|
|
•
|
$3.2 million increase from the L'Auberge de Sedona, which was acquired on February 28, 2017.
|
|
•
|
$1.0 million increase from the Orchards Inn Sedona, which was acquired on February 28, 2017.
|
Excluding these non-comparable amounts our total revenues increased $13.2 million, or 1.6%.
The following are key hotel operating statistics for the years ended
December 31, 2018
and
2017
. The 2017 amounts reflect the period in 2017 comparable to our ownership period in 2018 for the The Landing Resort & Spa, Hotel Palomar Phoenix, Cavallo Point, L'Auberge de Sedona and Orchards Inn Sedona, and exclude the results from Frenchman's Reef and the Havana Cabana Key West, due to the closure of these hotels for all or a portion of the periods presented, and Hotel Emblem beginning September 4, 2017, due to the renovation closure on September 4, 2018.
|
Year Ended December 31,
|
||||||||||
|
2018
|
2017
|
% Change
|
||||||||
|
Occupancy %
|
79.1
|
%
|
80.1
|
%
|
(1.0) percentage points
|
|
||||
|
ADR
|
$
|
234.40
|
|
$
|
228.71
|
|
2.5
|
%
|
||
|
RevPAR
|
$
|
185.51
|
|
$
|
183.18
|
|
1.3
|
%
|
||
Excluding non-comparable amounts, our rooms revenues increased $8.2 million, or 1.4%.
Food and beverage revenues increased $1.0 million from the year ended
December 31, 2017
, which includes amounts that are not comparable year-over-year as follows:
|
•
|
$14.1 million decrease from Frenchman's Reef, which was closed on September 6, 2017 due to Hurricane Irma and remained closed through the end of 2018.
|
|
•
|
$0.2 million decrease from Hotel Emblem, which closed beginning September 4, 2018 for renovations.
|
|
•
|
$0.2 million increase from the Havana Cabana Key West, which was closed on September 6, 2017 due to Hurricane Irma and re-opened in April 2018.
|
|
•
|
$2.8 million increase from The Landing Resort & Spa, which was acquired on March 1, 2018.
|
|
•
|
$7.2 million increase from the Hotel Palomar Phoenix, which was acquired on March 1, 2018.
|
|
•
|
$0.8 million increase from Cavallo Point, which was acquired on December 12, 2018.
|
|
•
|
$0.8 million increase from the L'Auberge de Sedona, which was acquired on February 28, 2017.
|
|
•
|
$0.5 million increase from the Orchards Inn Sedona, which was acquired on February 28, 2017.
|
Excluding these non-comparable amounts, food and beverage revenues increased $3.0 million, or 1.8%, primarily due to an increase in restaurant and room service revenues.
Excluding non-comparable amounts, other revenues, which primarily represent spa, parking, resort fees and attrition and cancellation fees, increased by $2.0 million, or 4.6%, primarily due to an increase in resort fees, partially offset by a decrease in attrition and cancellation fees.
Hotel operating expenses.
The operating expenses consisted of the following (in millions):
-
44
-
|
Year Ended December 31,
|
||||||||||
|
2018
|
2017
|
% Change
|
||||||||
|
Rooms departmental expenses
|
$
|
158.1
|
|
$
|
158.5
|
|
(0.3
|
)%
|
||
|
Food and beverage departmental expenses
|
118.7
|
|
120.5
|
|
(1.5
|
)
|
||||
|
Other departmental expenses
|
10.4
|
|
11.5
|
|
(9.6
|
)
|
||||
|
General and administrative
|
75.4
|
|
74.7
|
|
0.9
|
|
||||
|
Utilities
|
20.7
|
|
23.4
|
|
(11.5
|
)
|
||||
|
Repairs and maintenance
|
32.4
|
|
34.5
|
|
(6.1
|
)
|
||||
|
Sales and marketing
|
61.1
|
|
59.1
|
|
3.4
|
|
||||
|
Franchise fees
|
26.1
|
|
24.0
|
|
8.8
|
|
||||
|
Base management fees
|
16.4
|
|
15.7
|
|
4.5
|
|
||||
|
Incentive management fees
|
5.8
|
|
6.3
|
|
(7.9
|
)
|
||||
|
Property taxes
|
55.5
|
|
51.9
|
|
6.9
|
|
||||
|
Other fixed charges
|
18.5
|
|
12.9
|
|
43.4
|
|
||||
|
Severance costs
|
10.9
|
|
—
|
|
100.0
|
|
||||
|
Ground rent—Contractual
|
4.7
|
|
4.1
|
|
14.6
|
|
||||
|
Ground rent—Non-cash
|
7.0
|
|
6.1
|
|
14.8
|
|
||||
|
Total hotel operating expenses
|
$
|
621.7
|
|
$
|
603.2
|
|
3.1
|
%
|
||
Our hotel operating expenses increased $18.5 million from
$603.2 million
for the year ended
December 31, 2017
to
$621.7 million
for the year ended
December 31, 2018
. The increase in hotel operating expenses includes amounts that are not comparable year-over-year as follows:
|
•
|
$37.3 million decrease from Frenchman's Reef, which was closed on September 6, 2017 due to Hurricane Irma and remained closed through the end of 2018.
|
|
•
|
$0.7 million decrease from Hotel Emblem, which closed beginning September 4, 2018 for renovations.
|
|
•
|
$1.2 million increase from the Havana Cabana Key West, which was closed on September 6, 2017 due to Hurricane Irma and re-opened in April 2018.
|
|
•
|
$6.9 million increase from The Landing Resort & Spa, which was acquired on March 1, 2018.
|
|
•
|
$13.7 million increase from the Hotel Palomar Phoenix, which was acquired on March 1, 2018.
|
|
•
|
$1.6 million increase from Cavallo Point, which was acquired on December 12, 2018.
|
|
•
|
$2.8 million increase from the L'Auberge de Sedona, which was acquired on February 28, 2017.
|
|
•
|
$0.8 million increase from the Orchards Inn Sedona, which was acquired on February 28, 2017.
|
In connection with the termination of the hotel manager of Frenchman's Reef in February 2018, we recognized $2.2 million of accelerated amortization of key money during the year ended
December 31, 2018
. This amortization reduced base management fees and is included within the non-comparable decrease of hotel operating expenses. For the year ended
December 31, 2017
, we recognized $2.6 million of accelerated amortization of key money in connection with the termination of the hotel manager of Frenchman's Reef from the date of our notice of termination in 2017, which is included within the non-comparable decrease of hotel operating expenses. Additionally, in connection with the change in hotel manager of the Courtyard Manhattan/Midtown East in August 2017, we recognized $1.9 million of accelerated amortization of key money during the year ended
December 31, 2017
. This amortization reduced base management fees during the year ended
December 31, 2017
. In total, this accelerated amortization reduced base management fees by $4.5 million during the year ended
December 31, 2017
.
For the year ended
December 31, 2018
, we incurred $10.9 million of severance costs related to payments made to unionized employees under a voluntary buyout program at the Lexington Hotel New York.
Excluding the severance costs, the accelerated amortization of key money, and the non-comparable amounts detailed above, hotel operating expenses increased $16.7 million, or 2.9%, from the year ended
December 31, 2017
.
Depreciation and amortization.
Our depreciation and amortization expense increased
$5.4 million
from the year ended
December 31, 2017
. The increase is primarily due to depreciation from our 2018 hotel acquisitions and on capital expenditures from our recent hotel renovations.
-
45
-
Impairment losses.
During the year ended
December 31, 2017
, we recorded impairment losses of $3.2 million. The loss is comprised of $1.8 million from the write-off of construction in progress that was determined not to be recoverable, $0.9 million from the write-off of property and equipment disposed at our hotels impacted by the hurricanes during September 2017 that is not expected to be recovered by insurance proceeds, and $0.5 million on a rent receivable asset related to a tenant lease at the Lexington Hotel New York. We did not recognize any impairment losses during the year ended
December 31, 2018
.
Hotel acquisition costs.
All three of our 2018 hotel acquisitions are accounted for as acquisitions of assets. Accordingly, all direct acquisition related costs are capitalized as a component of acquired assets. Refer to Note 2 for additional information on the adoption of ASU No. 2017-01 on January 1, 2018. We incurred $2.0 million of hotel acquisition costs during the year ended
December 31, 2017
, associated with the acquisitions of L'Auberge de Sedona and Orchards Inn Sedona.
Corporate expenses.
Corporate expenses principally consist of employee-related costs, including base payroll, bonus and restricted stock. Corporate expenses also include corporate operating costs, professional fees and directors’ fees. Our corporate expenses increased $1.9 million, from
$26.7 million
for the year ended
December 31, 2017
to
$28.6 million
for the year ended
December 31, 2018
. The increase is primarily due to various drivers, including an increase in professional fees, consulting fees, and employee compensation.
Business interruption insurance income.
In September 2017, Hurricanes Irma and Maria caused significant damage to Frenchman's Reef and the Havana Cabana Key West. In October 2017, The Lodge at Sonoma was impacted by smoke infiltration due to the wildfires. These natural disasters resulted in lost revenue and additional expenses covered under our insurance policy. For the year ended
December 31, 2018
, we recognized
$19.4 million
of business interruption insurance income, which is in addition to $2.9 million of expense reimbursements from insurance recorded within other hotel expenses on our accompanying consolidated statement of operations. For the year ended
December 31, 2017
, we recognized
$4.1 million
of business interruption insurance income, which is in addition to $7.3 million of expense reimbursements from insurance recorded within other hotel expenses on our accompanying consolidated statement of operations.
Gain on property insurance settlement.
In July 2018, we settled our insurance claim for the property damage and business interruption related to the Havana Cabana Key West. Based on the settled insurance claim, we recognized a gain on insurance settlement of
$1.7 million
, which represents proceeds received in excess of the impairment loss for property damage.
Interest expense.
Our interest expense was
$41.0 million
and
$38.5 million
for the years ended
December 31, 2018
and
December 31, 2017
, respectively, and is comprised of the following (in millions):
|
Year Ended December 31,
|
|||||||
|
2018
|
2017
|
||||||
|
Mortgage debt interest
|
$
|
27.1
|
|
$
|
29.3
|
|
|
|
Term loan interest
|
10.6
|
|
6.2
|
|
|||
|
Credit facility interest and unused fees
|
1.2
|
|
1.0
|
|
|||
|
Amortization of deferred financing costs
|
2.1
|
|
2.0
|
|
|||
|
|
$
|
41.0
|
|
$
|
38.5
|
|
|
The increase in interest expense is primarily related to the $200 million unsecured term loan entered into in April 2017, the $50 million unsecured term loan entered into in October 2018, which we drew down in full in December 2018, and higher interest rates on our term loans compared with 2017. This increase is partially offset by a decrease in mortgage debt interest expense, primarily related to the repayment of the mortgage loan secured by the Lexington Hotel New York in April 2017.
Loss on early extinguishment of debt.
We prepaid the $170.4 million mortgage loan previously secured by the Lexington Hotel New York on April 26, 2017 and recognized a loss on early extinguishment of debt of approximately $0.3 million.
Income taxes.
We recorded income tax expense of $
3.1 million
in
2018
and $
10.2 million
in
2017
. The
2018
income tax expense includes $2.6 million of income tax expense incurred on the $7.9 million pre-tax income of our domestic TRSs, foreign income tax expense of less than $0.1 million incurred on the $14.0 million pre-tax income of the TRS that owns Frenchman's Reef, and $0.5 million of corporate state income tax. The 2017 income tax expense includes $8.7 million of income tax expense incurred on the $26.9 million pre-tax income of our domestic TRSs and foreign income tax expense of $1.5 million incurred on the $11.4 million pre-tax income of the TRS that owns Frenchman's Reef. The 2017 income tax provision included a benefit of
$4.2 million
due to a remeasurement of our net deferred tax liabilities as of December 31, 2017 as a result of the TCJA, which
-
46
-
lowered the corporate tax rates from a maximum of 35% to a flat rate of 21% effective for tax years beginning after December 31, 2017.
Comparison of the Year Ended
December 31, 2017
to the Year Ended
December 31, 2016
Revenue
. Revenue consists primarily of the room, food and beverage and other operating revenues from our hotels, as follows (in millions):
|
Year Ended December 31,
|
||||||||||
|
2017
|
2016
|
% Change
|
||||||||
|
Rooms
|
$
|
635.9
|
|
$
|
650.6
|
|
(2.3
|
)%
|
||
|
Food and beverage
|
183.1
|
|
194.8
|
|
(6.0
|
)
|
||||
|
Other
|
51.0
|
|
51.2
|
|
(0.4
|
)
|
||||
|
Total revenues
|
$
|
870.0
|
|
$
|
896.6
|
|
(3.0
|
)%
|
||
Our total revenues decreased $26.6 million from
$896.6 million
for the year ended
December 31, 2016
to
$870.0 million
for the year ended
December 31, 2017
. Our total revenues include amounts that are not comparable year-over-year due to acquisitions and dispositions as follows:
•
$14.1 million decrease from the Orlando Airport Marriott, which was sold on June 8, 2016.
•
$24.8 million decrease from the Minneapolis Hilton, which was sold on June 30, 2016.
•
$6.4 million decrease from the Hilton Garden Inn Chelsea/New York City, which was sold on July 7, 2016.
•
$21.8 million increase from the L'Auberge de Sedona, which was acquired on February 28, 2017.
•
$7.5 million increase from the Orchards Inn Sedona, which was acquired on February 28, 2017.
Additionally, the year-over year change in total revenues includes a decrease of $18.6 million that is not comparable due to the closure of Frenchman's Reef and the Havana Cabana Key West. Both hotels closed on September 6, 2017 due to Hurricane Irma and remain closed through the end of 2017.
Excluding these non-comparable amounts our total revenues increased $8.0 million, or 1.0%.
The following are key hotel operating statistics for the years ended
December 31, 2017
and
2016
. The 2016 amounts reflect the period in 2016 comparable to our ownership period in 2017 for the L'Auberge de Sedona and Orchards Inn Sedona and exclude the hotels sold in 2016. The 2016 amounts also exclude the results from Frenchman's Reef and the Havana Cabana Key West for the period in 2016 comparable to the hotels' closure beginning September 6, 2017 through the end of 2017.
|
Year Ended December 31,
|
||||||||||
|
2017
|
2016
|
% Change
|
||||||||
|
Occupancy %
|
80.6
|
%
|
79.8
|
%
|
0.8 percentage points
|
|
||||
|
ADR
|
$
|
230.61
|
|
$
|
227.46
|
|
1.4
|
%
|
||
|
RevPAR
|
$
|
185.93
|
|
$
|
181.58
|
|
2.4
|
%
|
||
Excluding non-comparable amounts, our rooms revenues increased $10.4 million, or 1.7%.
Food and beverage revenues decreased $11.7 million from the year ended
December 31, 2016
, which includes amounts that are not comparable year-over-year due to acquisitions and dispositions as follows:
•
$4.7 million decrease from the Orlando Airport Marriott, which was sold on June 8, 2016.
•
$9.1 million decrease from the Minneapolis Hilton, which was sold on June 30, 2016.
•
$0.1 million decrease from the Hilton Garden Inn Chelsea/New York City, which was sold on July 7, 2016.
•
$7.0 million increase from the L'Auberge de Sedona, which was acquired on February 28, 2017.
•
$3.3 million increase from the Orchards Inn Sedona, which was acquired on February 28, 2017.
Additionally, the year-over year change in food and beverage revenues includes a decrease of $5.0 million that are not comparable due to the closure of Frenchman's Reef and the Havana Cabana Key West. Both hotels closed on September 6, 2017 due to Hurricane Irma and remained closed through the end of 2017.
-
47
-
Excluding these non-comparable amounts, food and beverage revenues decreased $3.1 million, or 1.8%. The decrease in food and beverage revenues is primarily a result of a decrease in banquets.
Excluding non-comparable amounts, other revenues, which primarily represent spa, parking, resort fees and attrition and cancellation fees, increased by $0.7 million.
Hotel operating expenses.
The operating expenses consisted of the following (in millions):
|
Year Ended December 31,
|
||||||||||
|
2017
|
2016
|
% Change
|
||||||||
|
Rooms departmental expenses
|
$
|
158.5
|
|
$
|
159.2
|
|
(0.4
|
)%
|
||
|
Food and beverage departmental expenses
|
120.5
|
|
125.9
|
|
(4.3
|
)
|
||||
|
Other departmental expenses
|
11.5
|
|
11.4
|
|
0.9
|
|
||||
|
General and administrative
|
74.7
|
|
76.5
|
|
(2.4
|
)
|
||||
|
Utilities
|
23.4
|
|
25.9
|
|
(9.7
|
)
|
||||
|
Repairs and maintenance
|
34.5
|
|
35.6
|
|
(3.1
|
)
|
||||
|
Sales and marketing
|
59.1
|
|
62.0
|
|
(4.7
|
)
|
||||
|
Franchise fees
|
24.0
|
|
21.8
|
|
10.1
|
|
||||
|
Base management fees
|
15.7
|
|
22.3
|
|
(29.6
|
)
|
||||
|
Incentive management fees
|
6.3
|
|
7.8
|
|
(19.2
|
)
|
||||
|
Property taxes
|
51.9
|
|
46.4
|
|
11.9
|
|
||||
|
Other fixed charges
|
12.9
|
|
10.6
|
|
21.7
|
|
||||
|
Ground rent—Contractual
|
4.1
|
|
6.9
|
|
(40.6
|
)
|
||||
|
Ground rent—Non-cash
|
6.1
|
|
5.7
|
|
7.0
|
|
||||
|
Total hotel operating expenses
|
$
|
603.2
|
|
$
|
618.0
|
|
(2.4
|
)%
|
||
Our hotel operating expenses decreased $14.8 million from $618.0 million for the year ended
December 31, 2016
to $603.2 million for the year ended
December 31, 2017
. The decrease in hotel operating expenses includes amounts that are not comparable year-over-year due to acquisitions and dispositions as follows:
•
$9.1 million decrease from the Orlando Airport Marriott, which was sold on June 8, 2016.
•
$19.4 million decrease from the Minneapolis Hilton, which was sold on June 30, 2016.
•
$4.8 million decrease from the Hilton Garden Inn Chelsea/New York City, which was sold on July 7, 2016.
•
$15.8 million increase from the L'Auberge de Sedona, which was acquired on February 28, 2017.
•
$4.9 million increase from the Orchards Inn Sedona, which was acquired on February 28, 2017.
Additionally, the year-over year change in hotel operating expenses include a decrease of $12.0 million of net hotel operating expenses that are not comparable due to the closure of Frenchman's Reef and the Havana Cabana Key West. Both hotels closed on September 6, 2017 due to Hurricane Irma and remained closed through the end of 2017.
Excluding the non-comparable amounts, hotel operating expenses increased $11.1 million, or 2.9%, from the year ended
December 31, 2016
.
In connection with the change in hotel manager of the Courtyard Manhattan/Midtown East, we recognized $1.9 million of accelerated amortization of key money during the year ended
December 31, 2017
. In connection with the termination of the hotel manager of Frenchman's Reef, we accelerated the amortization of key money from the date of our notice of termination in 2017 through the effective termination date of February 20, 2018. We recognized an additional $2.6 million of amortization of key money during the year ended
December 31, 2017
in connection with this acceleration. In total, this accelerated amortization reduced base management fees by $4.5 million during the year ended
December 31, 2017
.
Other fixed charges increased $2.3 million, or 21.7%, from the year ended
December 31, 2016
, primarily due to hurricane-related costs that are not recoverable through insurance.
Depreciation and amortization.
Our depreciation and amortization expense increased
$1.6 million
from the year ended
December 31, 2016
. The increase is primarily due to depreciation from our 2017 hotel acquisitions and on capital expenditures from our recent hotel renovations, partially offset by our 2016 hotel dispositions.
-
48
-
Impairment losses.
During the year ended
December 31, 2017
, we recorded impairment losses of $3.2 million. The loss is comprised of $1.8 million from the write-off of construction in progress that was determined not to be recoverable, $0.9 million from the write-off of property and equipment disposed at our hotels impacted by the hurricanes during September 2017 that is not expected to be recovered by insurance proceeds, and $0.5 million on a rent receivable asset related to a tenant lease at the Lexington Hotel New York. We did not recognize any impairment losses during the year ended
December 31, 2016
.
Hotel acquisition costs.
We recorded
$2.0 million
of hotel acquisition costs during the year ended
December 31, 2017
, which is comprised of $2.2 million of costs incurred from the acquisitions of L'Auberge de Sedona and Orchards Inn Sedona, offset by a refund of $0.2 million of transfer taxes related to the acquisition of the Hotel Emblem. We had no hotel acquisitions during the year ended
December 31, 2016
.
Corporate expenses.
Corporate expenses principally consist of employee-related costs, including base payroll, bonus and restricted stock. Corporate expenses also include corporate operating costs, professional fees and directors’ fees. Our corporate expenses increased $3.1 million, from
$23.6 million
for the year ended
December 31, 2016
to
$26.7 million
for the year ended
December 31, 2017
. The increase is primarily due to higher employee-related costs in 2017 and the reversal of $0.7 million in 2016 of previously recognized compensation expense resulting from the forfeiture of equity awards related to the resignation of our former Executive Vice President and Chief Operating Officer.
Business interruption insurance income.
In September 2017, Hurricanes Irma and Maria caused significant damage to Frenchman's Reef and the Havana Cabana Key West. These natural disasters resulted in lost revenue and additional expenses covered under our insurance policy. For the year ended
December 31, 2017
, we recognized
$4.1 million
of business interruption insurance income, which is in addition to $7.3 million of expense reimbursements from insurance recorded within other hotel expenses on our accompanying consolidated statement of operations.
Interest expense.
Our interest expense was
$38.5 million
and
$41.7 million
for the years ended
December 31, 2017
and
December 31, 2016
, respectively, and is comprised of the following (in millions):
|
Year Ended December 31,
|
|||||||
|
2017
|
2016
|
||||||
|
Mortgage debt interest
|
$
|
29.3
|
|
$
|
36.8
|
|
|
|
Term loan interest
|
6.2
|
|
1.3
|
|
|||
|
Credit facility interest and unused fees
|
1.0
|
|
1.3
|
|
|||
|
Amortization of deferred financing costs
|
2.0
|
|
2.3
|
|
|||
|
|
$
|
38.5
|
|
$
|
41.7
|
|
|
The decrease in mortgage debt interest expense is primarily related to the repayment of the mortgage loans secured by the the Courtyard Manhattan Fifth Avenue and the Lexington Hotel. The decrease is also attributed to the sale of the Hilton Minneapolis on June 30, 2016. The decrease in interest expense is partially offset by the increase in interest expense on our two unsecured term loans, entered into in May 2016 and April 2017.
Loss on early extinguishment of debt.
We prepaid the $170.4 million mortgage loan previously secured by the Lexington Hotel New York on April 26, 2017 and recognized a loss on early extinguishment of debt of approximately $0.3 million.
Income taxes.
We recorded income tax expense of
$10.2 million
in
2017
and
$12.4 million
in
2016
. The
2017
income tax expense includes $8.7 million of income tax expense incurred on the $26.9 million pre-tax income of our domestic TRSs and foreign income tax expense of $1.5 million incurred on the $11.4 million pre-tax income of the TRS that owns Frenchman's Reef. The 2016 income tax expense includes $12.4 million of income tax expense incurred on the $29.4 million pre-tax income of our TRS. There was no foreign income tax expense incurred on the TRS that owns Frenchman's Reef. The 2017 income tax provision included a benefit of $4.2 million due to a remeasurement of our net deferred tax liabilities as of December 31, 2017 as a result of the TCJA, which lowered the corporate tax rates from a maximum of 35% to a flat rate of 21% effective for tax years beginning after December 31, 2017.
Liquidity and Capital Resources
Our short-term liquidity requirements consist primarily of funds necessary to fund distributions to our stockholders to maintain our REIT status as well as to pay for operating expenses and capital expenditures directly associated with our hotels,
-
49
-
funding of share repurchases under our share repurchase program, hotel acquisitions, costs to repair property damaged by natural disasters, and scheduled debt payments of interest and principal. We currently expect that our available cash flows, which are generally provided through net cash from hotel operations, existing cash balances, equity issuances, proceeds from new financings and refinancings of maturing debt, insurance proceeds, proceeds from potential property dispositions, and, if necessary, short-term borrowings under our senior unsecured credit facility, will be sufficient to meet our short-term liquidity requirements.
Some of our mortgage debt agreements contain “cash trap” provisions that are triggered when the hotel’s operating results
fall below a certain debt service coverage ratio. When these provisions are triggered, all of the excess cash flow generated by the hotel is deposited directly into cash management accounts for the benefit of our lenders until a specified debt service coverage ratio is reached and maintained for a certain period of time. Such provisions do not allow the lender the right to accelerate repayment of the underlying debt.
Our long-term liquidity requirements consist primarily of funds necessary to pay for the costs of acquiring additional hotels, renovations, and other capital expenditures that need to be made periodically to our hotels, scheduled debt payments, debt maturities, redemption of OP units and making distributions to our stockholders. We expect to meet our long-term liquidity requirements through various sources of capital, including cash provided by operations, borrowings, issuances of additional equity, including OP units, and/or debt securities and proceeds from property dispositions. Our ability to incur additional debt is dependent upon a number of factors, including the state of the credit markets, our degree of leverage, the value of our unencumbered assets and borrowing restrictions imposed by existing lenders. Our ability to raise capital through the issuance of additional equity and/or debt securities is also dependent on a number of factors including the current state of the capital markets, investor sentiment and intended use of proceeds. We may need to raise additional capital if we identify acquisition opportunities that meet our investment objectives and require liquidity in excess of existing cash balances. Our ability to raise funds through the issuance of equity securities depends on, among other things, general market conditions for hotel companies and REITs and market perceptions about us.
ATM Program
We have equity distribution agreements, dated August 8, 2018, with a number of sales agents (the “Current ATM Program") to issue and sell, from time to time, shares of our common stock, par value $0.01 per share, having an aggregate offering price of up to $200 million (the “ATM Shares”). Sales of the ATM Shares can be made in privately negotiated transactions and/or any other method permitted by law, including sales deemed to be an “at the market” offering, which includes sales made directly on the New York Stock Exchange or sales made to or through a market maker other than on an exchange. We have not sold any shares under the Current ATM Program. Actual future sales of the ATM Shares will depend upon a variety of factors, including but not limited to market conditions, the trading price of the Company's common stock and the Company's capital needs. We have no obligation to sell the ATM Shares under the Current ATM Program.
Prior to the implementation of the Current ATM Program, the Company had a $200 million ATM program (the "Prior ATM Program"), which is no longer active. During the year ended
December 31, 2018
, we sold
7,472,946
shares of common stock at an average price of
$12.56
for net proceeds of
$92.9 million
under the Prior ATM Program.
Our Financing Strategy
Since our formation in 2004, we have been committed to a conservative capital structure with prudent leverage. The majority of our outstanding debt is fixed interest rate mortgage debt. We have a preference to maintain a significant portion of our portfolio as unencumbered assets in order to provide balance sheet flexibility. We expect that our strategy will enable us to maintain a balance sheet with an appropriate amount of debt throughout all phases of the lodging cycle. We believe that it is prudent to reduce the inherent risk of highly cyclical lodging fundamentals through a low leverage capital structure.
We prefer a relatively simple but efficient capital structure. We have not invested in joint ventures and have not issued any preferred stock. We generally structure our hotel acquisitions to be straightforward and to fit within our capital structure; however, we will consider a more complex transaction, such as the issuance of OP units in connection with the acquisition of Cavallo Point, if we believe that the projected returns to our stockholders will significantly exceed the returns that would otherwise be available.
We believe that we maintain a reasonable amount of debt. As of
December 31, 2018
, we had
$978.0 million
of debt outstanding with a weighted average interest rate of
4.01%
and a weighted average maturity date of approximately
5.5
years. We maintain one of the lowest levered balance sheets among our lodging REIT peers. We maintain balance sheet flexibility with limited near-term debt maturities, capacity under our senior unsecured credit facility and 23 of our
31
hotels unencumbered by mortgage debt. We remain committed to our core strategy of prudent leverage.
-
50
-
Information about our financing activities is available in Note 8 to the accompanying consolidated financial statements.
Share Repurchase Program
Our board of directors has approved a share repurchase program authorizing us to repurchase shares of our common stock. On November 2, 2018, our board of directors increased the authorization under the share repurchase program from
$150 million
to
$250 million
. Information about our share repurchase program is found in Note 5 to the accompanying consolidated financial statements.
During the year ended
December 31, 2018
, we repurchased
3,384,359
shares of our common stock at an average price of
$9.49
per share for a total purchase price of
$32.2 million
. Subsequent to
December 31, 2018
, we repurchased
3,143,922
shares of our common stock at an average price of
$9.52
per share for a total purchase price of
$30.0 million
. We retired all repurchased shares on their respective settlement dates. As of
February 26, 2019
, we have
$188.0 million
of authorized capacity remaining under our share repurchase program.
Short-Term Borrowings
Other than borrowings under our senior unsecured credit facility, we do not utilize short-term borrowings to meet liquidity requirements.
Senior Unsecured Credit Facility
We are party to a
$300 million
senior unsecured credit facility expiring in
May 2020
. Information about our senior unsecured credit facility is found in Note 8 to the accompanying consolidated financial statements. As of
December 31, 2018
, we had no outstanding borrowings on our senior unsecured credit facility.
Senior Unsecured Term Loans
We are party to a
$100 million
unsecured term loan expiring in
May 2021
, a
$200 million
unsecured term loan expiring in
April 2022
, and a
$50 million
unsecured term loan expiring in
October 2023
. Information about our senior unsecured term loans is found in Note 8 to the accompanying consolidated financial statements.
Sources and Uses of Cash
Our principal sources of cash are net cash flow from hotel operations, sales of common stock, borrowings under mortgage debt, term loans, our senior unsecured credit facility, proceeds from hotel dispositions, and proceeds from insurance claims. Our principal uses of cash are acquisitions of hotel properties, debt service and maturities, share repurchases, capital expenditures, operating costs, corporate expenses, natural disaster remediation and repair costs and dividends. As of
December 31, 2018
, we had
$43.9 million
of unrestricted corporate cash and
$47.7 million
of restricted cash, and no outstanding borrowings on our senior unsecured credit facility.
Our net cash provided by operations was
$219.3 million
for the year ended
December 31, 2018
. Our cash from operations generally consists of the net cash flow from hotel operations offset by cash paid for corporate expenses and other working capital changes.
Our net cash used in investing activities was
$344.3 million
for the year ended
December 31, 2018
, which consisted of
$259.9 million
paid for the acquisitions of The Landing Resort & Spa, Hotel Palomar Phoenix and Cavallo Point, and capital expenditures at our hotels of
$115.2 million
, offset by
$30.7 million
of proceeds from our property insurance policy related to our hotels impacted by Hurricanes Irma and Maria.
Our net cash used in financing activities was
$7.2 million
for the year ended
December 31, 2018
, which consisted of
$102.7 million
of dividend payments,
$33.1 million
paid to repurchase shares under our share repurchase program and upon the vesting of restricted stock for the payment of tax withholding obligations,
$0.4 million
of financing costs related to our unsecured term loan, and
$13.6 million
of scheduled mortgage debt principal payments, partially offset by
$50.0 million
of proceeds from our new unsecured term loan, and
$92.7 million
in net proceeds from our Prior ATM Program.
We currently anticipate our significant sources of cash for the year ending December 31, 2019 will be the net cash flow from hotel operations, insurance claims, and potential property dispositions. We expect our estimated uses of cash for the year ending
-
51
-
December 31, 2019 will be regularly scheduled debt service payments, capital expenditures, dividends, corporate expenses, potential hotel acquisitions, and share repurchases.
Dividend Policy
We intend to distribute to our stockholders dividends at least equal to our REIT taxable income to avoid paying corporate income tax and excise tax on our earnings (other than the earnings of our TRS, which are all subject to tax at regular corporate rates) and to qualify for the tax benefits afforded to REITs under the Code. In order to qualify as a REIT under the Code, we generally must make distributions to our stockholders each year in an amount equal to at least:
|
•
|
90% of our REIT taxable income determined without regard to the dividends paid deduction and excluding net capital gains, plus
|
|
•
|
90% of the excess of our net income from foreclosure property over the tax imposed on such income by the Code, minus
|
|
•
|
any excess non-cash income.
|
The timing and frequency of distributions will be authorized by our board of directors and declared by us based upon a variety of factors, including our financial performance, restrictions under applicable law and our current and future loan agreements, our debt service requirements, our capital expenditure requirements, the requirements for qualification as a REIT under the Code and other factors that our board of directors may deem relevant from time to time.
The following table sets forth the dividends on our common shares for the years ended
December 31, 2018
and
2017
, and through the date of this report:
|
Payment Date
|
Record Date
|
Dividend
per Share
|
|
|||
|
April 12, 2017
|
March 31, 2017
|
|
$0.125
|
|
||
|
July 12, 2017
|
June 30, 2017
|
|
$0.125
|
|
||
|
October 12, 2017
|
September 29, 2017
|
|
$0.125
|
|
||
|
January 12, 2018
|
December 29, 2017
|
|
$0.125
|
|
||
|
April 12, 2018
|
March 29, 2018
|
|
$0.125
|
|
||
|
July 12, 2018
|
June 29, 2018
|
|
$0.125
|
|
||
|
October 12, 2018
|
September 28, 2018
|
|
$0.125
|
|
||
|
January 14, 2019
|
January 4, 2019
|
|
$0.125
|
|
||
Capital Expenditures
The management and franchise agreements for each of our hotels provide for the establishment of separate property improvement reserves to cover, among other things, the cost of replacing and repairing furniture, fixtures and equipment at our hotels and other routine capital expenditures. Contributions to the property improvement fund are calculated as a percentage of hotel revenues. In addition, we may be required to pay for the cost of certain additional improvements that are not permitted to be funded from the property improvement reserves under the applicable management or franchise agreement. As of
December 31, 2018
, we have set aside $43.1 million for capital projects in property improvement funds, which are included in restricted cash.
We spent approximately
$115.2 million
on capital improvements during the year ended
December 31, 2018
, which included the following significant projects:
|
•
|
Chicago Marriott Downtown:
We substantially completed the hotel's $110 million multi-year renovation, which included the remaining 258 of 1,200 guest rooms and the hotel's 60,000 square feet of meeting space.
|
|
•
|
Havana Cabana Key West:
We completed a comprehensive renovation of the hotel as part of the remediation of the substantial wind and water-related damage caused by Hurricane Irma. The hotel reopened as the Havana Cabana Key West in April 2018.
|
|
•
|
Bethesda Marriott Suites:
We completed a renovation of the guest rooms at the hotel during the first quarter.
|
|
•
|
Westin Boston Waterfront Hotel:
We completed a refresh of the hotel's guest rooms during the first quarter.
|
|
•
|
Vail Marriott Mountain Resort & Spa:
We completed a renovation of the hotel's guest rooms and meeting space during the third quarter.
|
-
52
-
|
•
|
Westin Fort Lauderdale Beach Resort:
We completed a renovation of the hotel's guest rooms in the third quarter.
|
|
•
|
Hotel Emblem:
We substantially completed a comprehensive renovation and re-positioning of the former Hotel Rex as the Hotel Emblem San Francisco, part of Viceroy's Urban Retreats Collection, in the fourth quarter. The hotel closed for approximately four months during renovation and reopened in January 2019.
|
We expect to spend approximately $125 million on capital improvements at our hotels in 2019, which includes carryover from certain projects that commenced in 2018. Significant projects in 2019 include the following:
|
•
|
JW Marriott Denver:
We commenced a renovation of the hotel's guest rooms and meeting space in January 2019 and will renovate the public space later in 2019. The renovation is expected to secure the hotel's position as the top luxury hotel in the high-end Cherry Creek submarket of Denver.
|
|
•
|
Sheraton Suites Key West:
We expect to complete a comprehensive renovation of the hotel, which will include upgrades to the resort’s entrance, lobby, restaurant, outdoor lounge, pool area and guestrooms. In order to minimize disruption, the renovation is expected to occur from August to November, the hotel’s slowest period of the year.
|
|
•
|
The Lodge at Sonoma:
We expect to enhance the cottage rooms and landscaping to better align the hotel with the luxury competition in the market, reposition the restaurant with a new concept from world-renowned chef, Michael Mina, and enhance the spa to a luxury level. We are also evaluating a brand change for the hotel.
|
|
•
|
Vail Marriott:
We expect to complete the second phase of the hotel renovation, which includes the upgrade renovation of the spa and fitness center. The scope of this project is consistent with our multi-phased strategy to renovate the hotel to a luxury standard.
|
|
•
|
Worthington Renaissance:
We expect to renovate the the lobby and reposition the food and beverage outlets during the third quarter of 2019.
|
Contractual Obligations
The following table outlines the timing of payment requirements related to our debt and other commitments of our operating partnership as of
December 31, 2018
.
|
Payments Due by Period
|
||||||||||||||||||||
|
Total
|
Less Than 1 Year
|
1 to 3 Years
|
3 to 5 Years
|
After 5 Years
|
||||||||||||||||
|
(In thousands)
|
||||||||||||||||||||
|
Long-Term Debt Obligations Including Interest (1)
|
$
|
1,166,956
|
|
$
|
55,051
|
|
$
|
255,827
|
|
$
|
454,536
|
|
$
|
401,542
|
|
|||||
|
Operating Lease Obligations - Ground Leases and Office Space
|
663,219
|
|
5,232
|
|
10,998
|
|
10,219
|
|
636,770
|
|
||||||||||
|
Purchase Commitments (2)
|
||||||||||||||||||||
|
Purchase Orders and Letters of Commitment
|
56,078
|
|
56,078
|
|
—
|
|
—
|
|
—
|
|
||||||||||
|
Total
|
$
|
1,886,253
|
|
$
|
116,361
|
|
$
|
266,825
|
|
$
|
464,755
|
|
$
|
1,038,312
|
|
|||||
________________
(1) The interest expense for our variable rate loans is calculated based on the rate as of December 31, 2018.
(2) As of December 31, 2018, purchase orders and letters of commitment totaling approximately $56.1 million had been issued for renovations at our properties. We have committed to these projects and anticipate making similar arrangements in the future with our existing properties or any future properties that we may acquire.
Off-Balance Sheet Arrangements
We have no off-balance sheet arrangements that have or are reasonably likely to have a current or future effect on our financial condition, changes in financial condition, revenues or expenses, results of operations, liquidity, capital expenditures or capital resources that is material to investors.
Non-GAAP Financial Measures
We use the following non-GAAP financial measures that we believe are useful to investors as key measures of our operating performance: EBITDA, EBITDA
re
, Adjusted EBITDA, FFO and Adjusted FFO. These measures should not be considered in isolation or as a substitute for measures of performance in accordance with U.S. GAAP. EBITDA, EBITDA
re
, Adjusted EBITDA, FFO and Adjusted FFO, as calculated by us, may not be comparable to other companies that do not define such terms exactly as the Company.
-
53
-
Use and Limitations of Non-GAAP Financial Measures
Our management and Board of Directors use EBITDA, EBITDA
re
, Adjusted EBITDA, FFO and Adjusted FFO to evaluate the performance of our hotels and to facilitate comparisons between us and other lodging REITs, hotel owners who are not REITs and other capital intensive companies. The use of these non-GAAP financial measures has certain limitations. These non-GAAP financial measures as presented by us, may not be comparable to non-GAAP financial measures as calculated by other real estate companies. These measures do not reflect certain expenses or expenditures that we incurred and will incur, such as depreciation, interest and capital expenditures. We compensate for these limitations by separately considering the impact of these excluded items to the extent they are material to operating decisions or assessments of our operating performance. Our reconciliations to the most comparable U.S. GAAP financial measures, and our consolidated statements of operations and cash flows, include interest expense, capital expenditures, and other excluded items, all of which should be considered when evaluating our performance, as well as the usefulness of our non-GAAP financial measures.
These non-GAAP financial measures are used in addition to and in conjunction with results presented in accordance with U.S. GAAP. They should not be considered as alternatives to operating profit, cash flow from operations, or any other operating performance measure prescribed by U.S. GAAP. These non-GAAP financial measures reflect additional ways of viewing our operations that we believe, when viewed with our U.S. GAAP results and the reconciliations to the corresponding U.S. GAAP financial measures, provide a more complete understanding of factors and trends affecting our business than could be obtained absent this disclosure. We strongly encourage investors to review our financial information in its entirety and not to rely on a single financial measure.
EBITDA, EBITDA
re
and FFO
EBITDA represents net income (calculated in accordance with U.S. GAAP) excluding: (1) interest expense; (2) provision for income taxes, including income taxes applicable to sale of assets; and (3) depreciation and amortization. The Company computes EBITDA
re
in accordance with the National Association of Real Estate Investment Trusts ("Nareit") guidelines, as defined in its September 2017 white paper "Earnings Before Interest, Taxes, Depreciation and Amortization for Real Estate." EBITDA
re
represents net income (calculated in accordance with U.S. GAAP) adjusted for: (1) interest expense; (2) provision for income taxes, including income taxes applicable to sale of assets; (3) depreciation and amortization; (4) gains or losses on the disposition of depreciated property, including gains or losses on change of control; (5) impairment write-downs of depreciated property and of investments in unconsolidated affiliates caused by a decrease in value of depreciated property in the affiliate; and (6) adjustments to reflect the entity's share of EBITDA
re
of unconsolidated affiliates.
We believe EBITDA and EBITDA
re
are useful to an investor in evaluating our operating performance because they help investors evaluate and compare the results of our operations from period to period by removing the impact of our capital structure (primarily interest expense) and our asset base (primarily depreciation and amortization, and in the case of EBITDA
re
, impairment and gains or losses on dispositions of depreciated property) from our operating results. In addition, covenants included in our debt agreements use EBITDA as a measure of financial compliance. We also use EBITDA and EBITDA
re
as measures in determining the value of hotel acquisitions and dispositions.
The Company computes FFO in accordance with standards established by the Nareit, which defines FFO as net income determined in accordance with U.S. GAAP, excluding gains or losses from sales of properties and impairment losses, plus real estate related depreciation and amortization. The Company believes that the presentation of FFO provides useful information to investors regarding its operating performance because it is a measure of the Company's operations without regard to specified non-cash items, such as real estate related depreciation and amortization and gains or losses on the sale of assets. The Company also uses FFO as one measure in assessing its operating results.
Adjustments to EBITDA and FFO
We adjust EBITDA and FFO when evaluating our performance because we believe that the exclusion of certain additional items described below provides useful supplemental information to investors regarding our ongoing operating performance and that the presentation of Adjusted EBITDA and Adjusted FFO, when combined with U.S. GAAP net income, EBITDA and FFO, is beneficial to an investor's complete understanding of our consolidated operating performance. We adjust EBITDA and FFO for the following items:
|
•
|
Non-Cash Ground Rent
: We exclude the non-cash expense incurred from the straight line recognition of rent from our ground lease obligations and the non-cash amortization of our favorable lease assets. We exclude these non-cash items because they do not reflect the actual rent amounts due to the respective lessors in the current period and they are of lesser significance in evaluating our actual performance for that period.
|
-
54
-
|
•
|
Non-Cash Amortization of Favorable and Unfavorable Contracts
: We exclude the non-cash amortization of the favorable and unfavorable contracts recorded in conjunction with certain acquisitions because the non-cash amortization is based on historical cost accounting and is of lesser significance in evaluating our actual performance for that period.
|
|
•
|
Cumulative Effect of a Change in Accounting Principle
: The Financial Accounting Standards Board promulgates new accounting standards that require or permit the consolidated statement of operations to reflect the cumulative effect of a change in accounting principle. We exclude the effect of these adjustments, which include the accounting impact from prior periods, because they do not reflect the Company’s actual underlying performance for the current period.
|
|
•
|
Gains or Losses from Early Extinguishment of Debt
: We exclude the effect of gains or losses recorded on the early extinguishment of debt because these gains or losses result from transaction activity related to the Company’s capital structure that we believe are not indicative of the ongoing operating performance of the Company or our hotels.
|
|
•
|
Hotel Acquisition Costs
: We exclude hotel acquisition costs expensed during the period because we believe these transaction costs are not reflective of the ongoing performance of the Company or our hotels.
|
|
•
|
Severance Costs
: We exclude corporate severance costs, or reversals thereof, incurred with the termination of corporate-level employees and severance costs incurred at our hotels related to lease terminations or structured severance programs because we believe these costs do not reflect the ongoing performance of the Company or our hotels.
|
|
•
|
Hotel Manager Transition Items
: We exclude the transition items associated with a change in hotel manager because we believe these items do not reflect the ongoing performance of the Company or our hotels.
|
|
•
|
Other Items
: From time to time we incur costs or realize gains that we consider outside the ordinary course of business and that we do not believe reflect the ongoing performance of the Company or our hotels. Such items may include, but are not limited to the following: pre-opening costs incurred with newly developed hotels; lease preparation costs incurred to prepare vacant space for marketing; management or franchise contract termination fees; gains or losses from legal settlements; costs incurred related to natural disasters; and gains from insurance proceeds, other than income related to business interruption insurance.
|
In addition, to derive Adjusted FFO we exclude any fair value adjustments to derivative instruments. We exclude these non-cash amounts because they do not reflect the underlying performance of the Company.
The following table is a reconciliation of our U.S. GAAP net income to EBITDA, EBITDA
re
and Adjusted EBITDA (in thousands):
-
55
-
|
Year Ended December 31,
|
||||||||||||
|
2018
|
2017
|
2016
|
||||||||||
|
(in thousands)
|
||||||||||||
|
Net income
|
$
|
87,796
|
|
$
|
91,877
|
|
$
|
114,796
|
|
|||
|
Interest expense
|
40,970
|
|
38,481
|
|
41,735
|
|
||||||
|
Income tax expense
|
3,101
|
|
10,207
|
|
12,399
|
|
||||||
|
Real estate related depreciation and amortization
|
104,524
|
|
99,090
|
|
97,444
|
|
||||||
|
EBITDA
|
236,391
|
|
239,655
|
|
266,374
|
|
||||||
|
Impairment losses
|
—
|
|
3,209
|
|
—
|
|
||||||
|
Loss (gain) on sale of hotel properties (1)
|
—
|
|
764
|
|
(10,698
|
)
|
||||||
|
EBITDA
re
|
236,391
|
|
243,628
|
|
255,676
|
|
||||||
|
Non-cash ground rent
|
7,305
|
|
6,290
|
|
5,671
|
|
||||||
|
Non-cash amortization of favorable and unfavorable contracts, net
|
(1,969
|
)
|
(1,912
|
)
|
(1,912
|
)
|
||||||
|
Hurricane-related costs (2)
|
3,855
|
|
3,280
|
|
—
|
|
||||||
|
Loss on early extinguishment of debt
|
—
|
|
274
|
|
—
|
|
||||||
|
Hotel acquisition costs
|
—
|
|
2,028
|
|
—
|
|
||||||
|
Hotel manager transition and pre-opening items (3)
|
(1,491
|
)
|
(3,637
|
)
|
—
|
|
||||||
|
Severance costs (4)
|
11,691
|
|
—
|
|
(563
|
)
|
||||||
|
Gain on property insurance settlement
|
(1,724
|
)
|
—
|
|
—
|
|
||||||
|
Adjusted EBITDA
|
$
|
254,058
|
|
$
|
249,951
|
|
$
|
258,872
|
|
|||
_______________
|
(1)
|
During the year ended December 31, 2017, we recognized an incremental pre-tax loss of $0.8 million due to a post-closing adjustment for hotel expenses incurred under our ownership period related to 2016 dispositions.
|
|
|
(2)
|
Represents stabilization, cleanup, and other costs (such as hotel labor) incurred at our hotels impacted by Hurricanes Irma or Maria that are not expected to be recovered by insurance.
|
|
|
(3)
|
For the year ended December 31, 2018 consists of (a) manager transition costs of $0.1 million related to the Hotel Emblem, L'Auberge de Sedona and Orchards Inn Sedona and (b) pre-opening costs of $0.6 million related to the reopening of the Havana Cabana Key West and Hotel Emblem, offset by $2.2 million of accelerated amortization of key money in connection with the termination of the Frenchman's Reef management agreement. For the year ended December 31, 2017, includes items related to the hotel manager changes as follows: Courtyard Manhattan Midtown East: (a) employee severance costs of approximately $0.3 million, (b) transition costs of approximately $0.1 million offset by (c) $1.9 million of accelerated amortization of key money received from Marriott; transition costs of approximately $0.4 million related to the Hotel Emblem, L'Auberge de Sedona and Orchards Inn Sedona; offset by $2.6 million of accelerated amortization of key money received from Marriott for Frenchman's Reef.
|
|
|
(4)
|
For the year ended December 31, 2018, consists of (a) $10.9 million related to payments made to unionized employees under a voluntary buyout program at the Lexington Hotel New York, which are classified within other hotel expenses on the consolidated statement of operations, and (b) $0.8 million related to the departure of our former Chief Financial Officer, which is classified within corporate expenses on the consolidated statement of operations. During the year ended December 31, 2016, we reversed $0.6 million of previously recognized compensation expense for forfeited equity awards related to the resignation of our former Executive Vice President and Chief Operating Officer. Amounts recognized in 2016 are classified as corporate expenses on the consolidated statements of operations.
|
|
The following table is a reconciliation of our U.S. GAAP net income to FFO and Adjusted FFO (in thousands):
-
56
-
|
Year Ended December 31,
|
||||||||||||
|
2018
|
2017
|
2016
|
||||||||||
|
(in thousands)
|
||||||||||||
|
Net income
|
$
|
87,796
|
|
$
|
91,877
|
|
$
|
114,796
|
|
|||
|
Real estate related depreciation and amortization
|
104,524
|
|
99,090
|
|
97,444
|
|
||||||
|
Impairment losses
|
—
|
|
3,209
|
|
—
|
|
||||||
|
Loss (gain) on sale of hotel properties, net of income tax (1)
|
—
|
|
458
|
|
(9,118
|
)
|
||||||
|
FFO
|
192,320
|
|
194,634
|
|
203,122
|
|
||||||
|
Non-cash ground rent
|
7,305
|
|
6,290
|
|
5,671
|
|
||||||
|
Non-cash amortization of favorable and unfavorable contracts, net
|
(1,969
|
)
|
(1,912
|
)
|
(1,912
|
)
|
||||||
|
Hurricane-related costs (2)
|
3,855
|
|
3,280
|
|
—
|
|
||||||
|
Loss on early extinguishment of debt
|
—
|
|
274
|
|
—
|
|
||||||
|
Hotel acquisition costs
|
—
|
|
2,028
|
|
—
|
|
||||||
|
Hotel manager transition and pre-opening items (3)
|
(1,491
|
)
|
(3,637
|
)
|
—
|
|
||||||
|
Severance costs (4)
|
11,691
|
|
—
|
|
(563
|
)
|
||||||
|
Gain on property insurance settlement
|
(1,724
|
)
|
—
|
|
—
|
|
||||||
|
Fair value adjustments to debt instruments
|
—
|
|
—
|
|
19
|
|
||||||
|
Adjusted FFO
|
$
|
209,987
|
|
$
|
200,957
|
|
$
|
206,337
|
|
|||
_______________
|
(1)
|
During the year ended December 31, 2017, we recognized an incremental loss, net of tax, of $0.5 million due to a post-closing adjustment for hotel expenses incurred under our ownership period related to 2016 dispositions.
|
|
|
(2)
|
Represents stabilization, cleanup, and other costs (such as hotel labor) incurred at our hotels impacted by Hurricanes Irma or Maria that are not expected to be recovered by insurance.
|
|
|
(3)
|
For the year ended December 31, 2018 consists of (a) manager transition costs of $0.1 million related to the Hotel Emblem, L'Auberge de Sedona and Orchards Inn Sedona and (b) pre-opening costs of $0.6 million related to the reopening of the Havana Cabana Key West and Hotel Emblem, offset by $2.2 million of accelerated amortization of key money in connection with the termination of the Frenchman's Reef management agreement. For the year ended December 31, 2017, includes items related to the hotel manager changes as follows: Courtyard Manhattan Midtown East: (a) employee severance costs of approximately $0.3 million, (b) transition costs of approximately $0.1 million offset by (c) $1.9 million of accelerated amortization of key money received from Marriott; transition costs of approximately $0.4 million related to the Hotel Emblem, L'Auberge de Sedona and Orchards Inn Sedona; offset by $2.6 million of accelerated amortization of key money received from Marriott for Frenchman's Reef.
|
|
|
(4)
|
For the year ended December 31, 2018, consists of (a) $10.9 million related to payments made to unionized employees under a voluntary buyout program at the Lexington Hotel New York, which are classified within other hotel expenses on the consolidated statement of operations, and (b) $0.8 million related to the departure of our former Chief Financial Officer, which is classified within corporate expenses on the consolidated statement of operations. During the year ended December 31, 2016, we reversed $0.6 million of previously recognized compensation expense for forfeited equity awards related to the resignation of our former Executive Vice President and Chief Operating Officer. Amounts recognized in 2016 are classified as corporate expenses on the consolidated statements of operations.
|
|
Critical Accounting Policies
Our consolidated financial statements include the accounts of DiamondRock Hospitality Company and all consolidated subsidiaries. The preparation of financial statements in conformity with U.S. GAAP requires management to make estimates and assumptions that affect the reported amount of assets and liabilities at the date of our financial statements and the reported amounts of revenues and expenses during the reporting period. While we do not believe the reported amounts would be materially different, application of these policies involves the exercise of judgment and the use of assumptions as to future uncertainties and, as a result, actual results could differ materially from these estimates. We evaluate our estimates and judgments, including those related to the impairment of long-lived assets, on an ongoing basis. We base our estimates on experience and on various assumptions that are believed to be reasonable under the circumstances. All of our significant accounting policies are disclosed in the notes to our consolidated financial statements. The following represent certain critical accounting policies that require us to exercise our business judgment or make significant estimates:
Investment in Hotels
. Acquired hotels, land improvements, building and furniture, fixtures and equipment and identifiable intangible assets that are generally accounted for as asset acquisitions are recorded at total cost and allocated based on relative fair value. Direct acquisition-related costs are capitalized as a component of the acquired assets. Additions to property and equipment, including current buildings, improvements, furniture, fixtures and equipment are recorded at cost. Property and equipment are depreciated using the straight-line method over an estimated useful life of 15 to 40 years for buildings and land improvements and one to ten years for furniture and equipment. Identifiable intangible assets are typically related to contracts,
-
57
-
including ground lease agreements and hotel management agreements, which are recorded at fair value. Above-market and below-market contract values are based on the present value of the difference between contractual amounts to be paid pursuant to the contracts acquired and our estimate of the fair market contract rates for corresponding contracts. Contracts acquired that are at market do not have significant value. We enter into a hotel management agreement at the time of acquisition and such agreements are generally based on market terms. Intangible assets are amortized using the straight-line method over the remaining non-cancelable term of the related agreements. In making estimates of fair values for purposes of allocating purchase price, we may utilize a number of sources that may be obtained in connection with the acquisition or financing of a property and other market data. Management also considers information obtained about each property as a result of its pre-acquisition due diligence in estimating the fair value of the tangible and intangible assets acquired.
We review our investments in hotels for impairment whenever events or changes in circumstances indicate that the carrying value of our investments in hotels may not be recoverable. Events or circumstances that may cause us to perform a review include, but are not limited to, adverse changes in the demand for lodging at our properties due to declining national or local economic conditions and/or new hotel construction in markets where our hotels are located. When such conditions exist, management performs an analysis to determine if the estimated undiscounted future cash flows from operations and the proceeds from the ultimate disposition of an investment in a hotel exceed the hotel’s carrying value. If the estimated undiscounted future cash flows are less than the carrying amount of the asset, an adjustment to reduce the carrying value to the estimated fair market value is recorded and an impairment loss is recognized. Fair market value is estimated based on market data, estimated cash flows discounted at an appropriate rate, comparable sales information and other considerations requiring management to use its judgment in determining the assumptions used.
While our hotels have experienced improvement in certain key operating measures as the general economic conditions improve, the operating performance at certain of our hotels has not achieved our expected levels. As part of our overall capital allocation strategy, we assess underperforming hotels for possible disposition, which could result in a reduction in the carrying values of these properties.
Inflation
Operators of hotels, in general, possess the ability to adjust room rates daily to reflect the effects of inflation. However, competitive pressures may limit the ability of our management companies to raise room rates.
Seasonality
The periods during which our hotels experience higher revenues vary from property to property, depending principally upon location and the customer base served. Accordingly, we expect some seasonality in our business. Volatility in our financial performance from the seasonality of the lodging industry could adversely affect our financial condition and results of operations.
New Accounting Pronouncements Not Yet Implemented
See Note 2 to the accompanying consolidated financial statements for additional information relating to recently issued accounting pronouncements.
Item 7A. Quantitative and Qualitative Disclosures about Market Risk
Market risk includes risks that arise from changes in interest rates, foreign currency exchange rates, commodity prices, equity prices and other market changes that affect market sensitive instruments. In pursuing our business strategies, the primary market risk to which we are currently exposed, and to which we expect to be exposed in the future, is interest rate risk. The face amount of our outstanding debt as of
December 31, 2018
was
$983.8 million
of which
$350 million
was variable rate. If market rates of interest on our variable rate debt fluctuate by 100 basis points, interest expense would increase or decrease, depending on rate movement, future earnings and cash flows, by approximately $3.5 million annually.
Item 8.
Financial Statements and Supplementary Data
See Index to the Financial Statements on page F-1.
Item 9.
Changes in and Disagreements with Accountants on Accounting and
Financial Disclosure
None.
-
58
-
Item 9A.
Controls and Procedures
Evaluation of Disclosure Controls and Procedures
The Company’s management has evaluated, under the supervision and with the participation of the Company’s Chief Executive Officer and Chief Financial Officer, the effectiveness of the disclosure controls and procedures (as defined in Rules 13a-15(e) and 15d-15(e) under the Securities Exchange Act of 1934, as amended (the “Exchange Act”)), as required by paragraph (b) of Rules 13a-15 and 15d-15 under the Exchange Act, and has concluded that as of the end of the period covered by this report, the Company’s disclosure controls and procedures were effective to give reasonable assurances that information we disclose in reports filed with the Securities and Exchange Commission (i) is recorded, processed, summarized and reported within the time periods specified in the Securities and Exchange Commission’s rules and forms and (ii) is accumulated and communicated to our management, including our principal executive officer and principal financial officer, as appropriate to allow timely decisions regarding disclosure.
Changes in Internal Control over Financial Reporting
There was no change in the Company’s internal control over financial reporting identified in connection with the evaluation required by paragraph (d) of Rules 13a-15 and 15d-15 under the Exchange Act during the Company’s most recent fiscal quarter that materially affected, or is reasonably likely to materially affect, the Company’s internal control over financial reporting.
Management Report on Internal Control over Financial Reporting
The report of our management regarding internal control over financial reporting is set forth on page F-2 of this Annual Report on Form 10-K under the caption “Management Report on Internal Control over Financial Reporting” and incorporated herein by reference.
Attestation Report of Independent Registered Public Accounting Firm
The report of our independent registered public accounting firm regarding our internal control over financial reporting is set forth on page F-3 of this Annual Report on Form 10-K under the caption “Report of Independent Registered Public Accounting Firm” and incorporated herein by reference.
Item 9B.
Other Information
None.
-
59
-
PART III
The information required by Items 10-14 is incorporated by reference to our proxy statement for the 2019 annual meeting of stockholders (to be filed with the SEC not later than 120 days after the end of the fiscal year covered by this report) (“2019 proxy statement”).
Item 10.
Directors, Executive Officers and Corporate Governance
Information required by this item is incorporated by reference to our 2019 proxy statement.
Item 11.
Executive Compensation
The information required by this item is incorporated by reference to our 2019 proxy statement.
Item 12.
Security Ownership of Certain Beneficial Owners and Management
and Related Stockholder Matters
The information required by this item is incorporated by reference to our 2019 proxy statement. Information regarding our equity plans set forth in Item 5 of this Annual Report on Form 10-K is incorporated by reference into this Item 12.
Item 13.
Certain Relationships and Related Transactions and Director Independence
The information required by this item is incorporated by reference to our 2019 proxy statement.
Item 14.
Principal Accounting Fees and Services
The information required by this item is incorporated by reference to our 2019 proxy statement.
-
60
-
PART IV
Item 15.
Exhibits and Financial Statement Schedules
|
1.
|
Financial Statements
|
Included herein at pages F-1 through F-33.
|
2.
|
Financial Statement Schedules
|
The following financial statement schedule is included herein on pages F-34 and F-35:
Schedule III - Real Estate and Accumulated Depreciation
All other schedules for which provision is made in Regulation S-X are either not required to be included herein under the related instructions or are inapplicable or the related information is included in the footnotes to the applicable financial statement and, therefore, have been omitted.
|
3.
|
Exhibits
|
The following exhibits are included in this Annual Report on Form 10-K for the fiscal year ended
December 31, 2018
(and are numbered in accordance with Item 601 of Regulation S-K):
|
Exhibit Number
|
Description of Exhibit
|
|
|
Articles of Amendment and Restatement of the Articles of Incorporation of DiamondRock Hospitality Company
(incorporated by reference to the Registrant's Registration Statement on Form S-11 filed with the Securities and Exchange Commission on March 1, 2005 (File no. 333-123065))
|
||
|
Amendment to the Articles of Amendment and Restatement of the Articles of Incorporation of DiamondRock Hospitality Company
(incorporated by reference to the Registrant's Current Report on Form 8-K filed with the Securities and Exchange Commission on January 10, 2007)
|
||
|
Amendment to the Articles of Amendment and Restatement of the Articles of Incorporation of DiamondRock Hospitality Company
(incorporated by reference to the Registrant's Current Report on Form 8-K filed with the Securities and Exchange Commission on July 9, 2012)
|
||
|
Articles Supplementary Prohibiting DiamondRock Hospitality Company From Electing to be Subject to Section 3-803 of the Maryland General Corporation Law Absent Stockholder Approval
(incorporated by reference to the Registrant’s Current Report on Form 8-K filed with the Securities and Exchange Commission on February 26, 2014)
|
||
|
Amendment to the Articles of Amendment and Restatement of the Articles of Incorporation of DiamondRock Hospitality Company
(incorporated by reference to the Registrant’s Current Report on Form 8-K filed with the Securities and Exchange Commission on May 5, 2016)
|
||
|
Fourth Amended and Restated Bylaws of DiamondRock Hospitality Company
(incorporated by reference to the Registrant's Current Report on Form 8-K filed with the Securities and Exchange Commission on May 5, 2016)
|
||
|
First Amendment to the Fourth Amended and Restated Bylaws of DiamondRock Hospitality Company
(incorporated by reference to the Registrant’s Quarterly Report on Form 10-Q filed with the Securities and Exchange Commission on November 7, 2017)
|
||
|
Form of Certificate for Common Stock for DiamondRock Hospitality Company
(incorporated by reference to the Registrant's Quarterly Report on Form 10-Q filed with the Securities and Exchange Commission on May 5, 2010)
|
||
|
Amended and Restated Agreement of Limited Partnership of DiamondRock Hospitality Limited Partnership, dated as of August 28, 2018
(incorporated by reference to the Registrant's Current Report on Form 8-K filed with the Securities and Exchange Commission on August 31, 2018)
|
||
|
10.2
*
|
Amended and Restated 2004 Stock Option and Incentive Plan, as amended and restated on April 28, 2010
(incorporated by reference to the Registrant's Quarterly Report on Form 10-Q filed with the Securities and Exchange Commission on May 5, 2010)
|
|
|
10.3
*
|
Amendment to DiamondRock Hospitality Company Amended and Restated 2004 Stock Option and Incentive Plan, approved by the Board of Directors on July 20, 2011
(incorporated by reference to the Registrant’s Quarterly Report on Form 10-Q filed with the Securities and Exchange Commission on October 19, 2011)
|
|
-
61
-
|
10.4
*
|
DiamondRock Hospitality Company Deferred Compensation Plan
(incorporated by reference to the Registrant’s Registration Statement on Form S-8 filed with the Securities and Exchange Commission on August 8, 2014)
|
|
|
10.5
*
|
First Amendment to DiamondRock Hospitality Company Deferred Compensation Plan, approved by the Compensation Committee of the Board of Directors on December 15, 2014
(incorporated by reference to the Registrant's Annual Report on Form 10-K filed with the Securities and Exchange Commission on February 27, 2015)
|
|
|
10.6
*
|
Form of Restricted Stock Award Agreement
(incorporated by reference to the Registrant's Quarterly Report on Form 10-Q filed with the Securities and Exchange Commission on May 5, 2010)
|
|
|
10.7
*
|
Form of Market Stock Unit Agreement
(incorporated by reference to the Registrant's Current Report on Form 8-K filed with the Securities and Exchange Commission on March 9, 2010)
|
|
|
10.8
*
|
Relative TSR Performance Stock Unit Agreement
(incorporated by reference to the Registrant’s Annual Report on Form 10-K filed with the Securities and Exchange Commission on February 25, 2014)
|
|
|
10.9
*
|
Form of Deferred Stock Unit Award Agreement
(incorporated by reference to the Registrant's Quarterly Report on Form 10-Q filed with the Securities and Exchange Commission on May 5, 2010)
|
|
|
10.10
*
|
Form of Director Election Form
(incorporated by reference to the Registrant's Quarterly Report on Form 10-Q filed with the Securities and Exchange Commission on May 5, 2010)
|
|
|
10.11
*
|
Form of Incentive Stock Option Agreement
(incorporated by reference to the Registrant's Registration Statement on Form S-11 filed with the Securities and Exchange Commission (File no. 333-123065))
|
|
|
10.12
*
|
Form of Non-Qualified Stock Option Agreement
(incorporated by reference to the Registrant's Registration Statement on Form S-11 filed with the Securities and Exchange Commission (File no. 333-123065))
|
|
|
Fourth Amended and Restated Credit Agreement, dated as of May 3, 2016, by and among DiamondRock Hospitality Company, DiamondRock Hospitality Limited Partnership, Wells Fargo Bank, National Association, as Administrative Agent, each of Bank of America, N.A. and Citibank, N.A., as Syndication Agent, U.S. Bank National Association, as Documentation Agent, and each of Wells Fargo Securities, LLC, Merrill Lynch, Pierce Fenner and Smith Incorporated and Citigroup Global Markets, as Joint Lead Arrangers and Joint Lead Bookrunners
(incorporated by reference to the Registrant's Current Report on Form 8-K filed with the Securities and Exchange Commission on May 6, 2016)
|
||
|
First Amendment to Fourth Amended and Restated Credit Agreement, dated as of April 26, 2017, by and among DiamondRock Hospitality Company, DiamondRock Hospitality Limited Partnership, Wells Fargo Bank National Association, as Administrative Agent, and the lenders party thereto
(incorporated by reference to the Registrant’s Quarterly Report on Form 10-Q filed with the Securities and Exchange Commission on May 5, 2017)
|
||
|
Term Loan Agreement, dated as of May 3, 2016, by and among DiamondRock Hospitality Company, DiamondRock Hospitality Limited Partnership, KeyBank National Association, as Administrative Agent, each of Keybanc Capital Markets, PNC Capital Markets LLC and Regions Capital Markets as Joint Lead Arrangers, each of PNC Bank, National Association and Regions Bank as Co-Syndication Agents, and the lenders party thereto
(incorporated by reference to the Registrant's Current Report on Form 8-K filed with the Securities and Exchange Commission on May 6, 2016)
|
||
|
First Amendment to Term Loan Agreement, dated as of April 26, 2017, by and among DiamondRock Hospitality Company, DiamondRock Hospitality Limited Partnership, KeyBank National Association, as Administrative Agent, and the lenders party thereto
(incorporated by reference to the Registrant’s Quarterly Report on Form 10-Q filed with the Securities and Exchange Commission on May 5, 2017)
|
||
|
Term Loan Agreement, dated as of April 26, 2017, by and among DiamondRock Hospitality Company, DiamondRock Hospitality Limited Partnership, Regions Bank, as Administrative Agent, each of Regions Capital Markets, KeyBanc Capital Markets, PNC Capital Markets LLC and U.S. Bank National Association as Joint Lead Arrangers, each of KeyBank National Association, PNC Bank, National Association and U.S. Bank National Association, as Co-Syndication Agents, and the lenders party thereto
(incorporated by reference to the Registrant’s Current Report on Form 8-K filed with the Securities and Exchange Commission on May 1, 2017)
|
||
|
10.18
*
|
Form of Severance Agreement (and schedule of material differences thereto)
(incorporated by reference to the Registrant's Quarterly Report on Form 10-Q filed with the Securities and Exchange Commission on April 30, 2012)
|
|
|
10.19
*
|
Form of Stock Appreciation Right
(incorporated by reference to the Registrant's Current Report on Form 8-K filed with the Securities and Exchange Commission on March 6, 2008)
|
|
|
10.20
*
|
Form of Dividend Equivalent Right
(incorporated by reference to the Registrant's Current Report on Form 8-K filed with the Securities and Exchange Commission on March 6, 2008)
|
|
|
10.21
*
|
Form of Amendment No. 1 to Dividend Equivalent Rights Agreement under the DiamondRock Hospitality Company 2004 Stock Option and Incentive Plan
(incorporated by reference to the Registrant's Current Report on Form 8-K filed with the Securities and Exchange Commission on December 30, 2008)
|
|
|
10.22
*
|
Form of Indemnification Agreement
(incorporated by reference to the Registrant's Current Report on Form 8-K filed with the Securities and Exchange Commission on December 16, 2009)
|
|
-
62
-
|
10.23
*
|
Severance Agreement between DiamondRock Hospitality Company and William J. Tennis, dated as of December 16, 2009
(incorporated by reference to the Registrant's Quarterly Report on Form 10-Q filed with the Securities and Exchange Commission on April 30, 2012)
|
|
|
10.24
*
|
Letter Agreement, dated as of December 9, 2009, by and between DiamondRock Hospitality Company and William J. Tennis
(incorporated by reference to the Registrant's Annual Report on Form 10-K filed with the Securities and Exchange Commission on February 26, 2010)
|
|
|
10.25
*
|
Severance Agreement between DiamondRock Hospitality Company and Troy G. Furbay, dated as of April 9, 2014
(incorporated by reference to the Registrant’s Quarterly Report on From 10-Q filed with the Securities and Exchange Commission on May 12, 2014)
|
|
|
10.26
*
|
Letter Agreement between DiamondRock Hospitality Company and Thomas Healy, dated as of December 21, 2016
(incorporated by reference to the Registrant's Current Report on Form 8-K filed with the Securities and Exchange Commission on January 4, 2017)
|
|
|
10.27
*
|
Severance Agreement between DiamondRock Hospitality Company and Thomas Healy, dated as of January 17, 2017
(incorporated by reference to the Registrant’s Quarterly Report on Form 10-Q filed with the Securities and Exchange Commission on May 5, 2017)
|
|
|
10.28
*
|
DiamondRock Hospitality Company 2016 Equity Incentive Plan, effective as of May 3, 2016
(incorporated by reference to Appendix B to the Registrant's Proxy Statement on Schedule 14A filed with the Securities and Exchange Commission on March 24, 2016)
|
|
|
10.29
*
|
First Amendment to the DiamondRock Hospitality Company 2016 Equity Incentive Plan
(incorporated by reference to the Registrant's Current Report on Form 8-K filed with the Securities and Exchange Commission on December 26, 2018)
|
|
|
10.30
*
|
Form of Restricted Stock Award Agreement under the 2016 Equity Incentive Plan
(incorporated by reference to the Registrant’s Quarterly Report on Form 10-Q filed with the Securities and Exchange Commission on August 5, 2016)
|
|
|
10.31
*
|
Form of Performance Stock Unit Agreement under the 2016 Equity Incentive Plan
(incorporated by reference to the Registrant’s Quarterly Report on Form 10-Q filed with the Securities and Exchange Commission on August 5, 2016)
|
|
|
10.32
*
|
Form of Deferred Stock Unit Award Agreement under the 2016 Equity Incentive Plan
(incorporated by reference to the Registrant’s Quarterly Report on Form 10-Q filed with the Securities and Exchange Commission on August 5, 2016)
|
|
|
10.33
*
|
Severance Agreement between DiamondRock Hospitality Company and Jay L. Johnson, dated as of March 19, 2018
(incorporated by reference to the Registrant’s Quarterly Report on Form 10-Q filed with the Securities and Exchange Commission on May 4, 2018)
|
|
|
10.34
*
|
Settlement Agreement between DiamondRock Hospitality Company, Sean Mahoney and RLJ Lodging Trust, dated as of July 16, 2018
(incorporated by reference to the Registrant’s Quarterly Report on Form 10-Q filed with the Securities and Exchange Commission on August 6, 2018)
|
|
|
21.1
†
|
List of DiamondRock Hospitality Company Subsidiaries
|
|
|
23.1
†
|
Consent of KPMG LLP
|
|
|
31.1
†
|
Certification of Chief Executive Officer Required by Rule 13a-14(a) of the Securities Exchange Act of 1934, as amended.
|
|
|
31.2
†
|
Certification of Chief Financial Officer Required by Rule 13a-14(a) of the Securities Exchange Act of 1934, as amended.
|
|
|
32.1
**
|
Certification of Chief Executive Officer and Chief Financial Officer Required by Rule 13a-14(b) of the Securities Exchange Act of 1934, as amended.
|
|
|
Attached as Exhibit 101 to this report are the following materials from DiamondRock Hospitality Company's Annual Report on Form 10-K for the year ended December 31, 2018 formatted in XBRL (eXtensible Business Reporting Language): (i) the Consolidated Balance Sheets, (ii) the Consolidated Statements of Operations, (iii) the Consolidated Statements of Equity, (iv) the Consolidated Statements of Cash Flows, and (v) the related notes to these consolidated financial statements.
|
||
|
* Exhibit is a management contract or compensatory plan or arrangement.
|
||
|
† Filed herewith
|
||
|
** Furnished herewith
|
||
Item 16.
Form 10-K Summary
Not applicable.
-
63
-
SIGNATURES
Pursuant to the requirements of Section 13 or 15(d) of the Securities Exchange Act of 1934, the registrant has duly caused this report to be signed on its behalf by the undersigned, thereunto duly authorized, in the City of Bethesda, State of Maryland, on
February 26, 2019
.
|
DIAMONDROCK HOSPITALITY COMPANY
|
||
|
By:
|
/s/ WILLIAM J. TENNIS
|
|
|
Name:
|
William J. Tennis
|
|
|
Title:
|
Executive Vice President, General Counsel and Corporate Secretary
|
|
Pursuant to the requirements of the Securities Exchange Act of 1934, this report has been signed by the following persons on behalf of the registrant and in the capacities and on the dates indicated.
|
Signature
|
Title
|
Date
|
||
|
/s/ MARK W. BRUGGER
|
Chief Executive Officer and Director
|
February 26, 2019
|
||
|
Mark W. Brugger
|
(Principal Executive Officer)
|
|||
|
/s/ JAY L. JOHNSON
|
Executive Vice President and Chief
|
February 26, 2019
|
||
|
Jay L. Johnson
|
Financial Officer (Principal Financial Officer)
|
|||
|
/s/ BRIONY R. QUINN
|
Senior Vice President and Treasurer
|
February 26, 2019
|
||
|
Briony R. Quinn
|
(Principal Accounting Officer)
|
|||
|
/s/ WILLIAM W. McCARTEN
|
Chairman
|
February 26, 2019
|
||
|
William W. McCarten
|
||||
|
/s/ DANIEL J. ALTOBELLO
|
Director
|
February 26, 2019
|
||
|
Daniel J. Altobello
|
||||
|
/s/ TIMOTHY CHI
|
Director
|
February 26, 2019
|
||
|
Timothy Chi
|
||||
|
/s/ MAUREEN L. McAVEY
|
Director
|
February 26, 2019
|
||
|
Maureen L. McAvey
|
||||
|
/s/ GILBERT T. RAY
|
Director
|
February 26, 2019
|
||
|
Gilbert T. Ray
|
||||
|
/s/ WILLIAM J. SHAW
|
Director
|
February 26, 2019
|
||
|
William J. Shaw
|
||||
|
/s/ BRUCE D. WARDINSKI
|
Director
|
February 26, 2019
|
||
|
Bruce D. Wardinski
|
||||
|
/s/ KATHLEEN WAYTON
|
Director
|
February 26, 2019
|
||
|
Kathleen Wayton
|
||||
-
64
-
Index to Financial Statements
|
|
|
|
|
Page
|
|
Management's Report on Internal Control Over Financial Reporting
|
F-
2
|
|
Reports of Independent Registered Public Accounting Firm
|
F-
3
|
|
Consolidated Balance Sheets as of December 31, 2018 and 2017
|
F-
5
|
|
Consolidated Statements of Operations for the Years Ended December 31, 2018, 2017 and 2016
|
F-
6
|
|
Consolidated Statements of Equity for the Years Ended December 31, 2018, 2017 and 2016
|
F-
7
|
|
Consolidated Statements of Cash Flows for the Years Ended December 31, 2018, 2017 and 2016
|
F-
8
|
|
Notes to Consolidated Financial Statements
|
F-
10
|
|
Schedule III - Real Estate and Accumulated Depreciation as of December 31, 2018
|
F-
34
|
F-
1
Management's Report on Internal Control Over Financial Reporting
Management is responsible for establishing and maintaining adequate internal control over financial reporting for the Company. Internal control over financial reporting refers to the process designed by, or under the supervision of, our Chief Executive Officer and Chief Financial Officer, and effected by our board of directors, management and other personnel, to provide reasonable assurance regarding the reliability of financial reporting and the preparation of financial statements for external purposes in accordance with generally accepted accounting principles, and includes those policies and procedures that:
(1) Pertain to the maintenance of records that in reasonable detail accurately and fairly reflect the transactions and dispositions of the assets of the company;
(2) Provide reasonable assurance that transactions are recorded as necessary to permit preparation of financial statements in accordance with generally accepted accounting principles, and that receipts and expenditures of the company are being made only in accordance with authorizations of management and directors of the company; and
(3) Provide reasonable assurance regarding prevention or timely detection of unauthorized acquisition, use or disposition of the company's assets that could have a material effect on the financial statements.
Internal control over financial reporting cannot provide absolute assurance of achieving financial reporting objectives because of its inherent limitations. Internal control over financial reporting is a process that involves human diligence and compliance and is subject to lapses in judgment and breakdowns resulting from human failures. Internal control over financial reporting also can be circumvented by collusion or improper management override. Because of such limitations, there is a risk that material misstatements may not be prevented or detected on a timely basis by internal control over financial reporting. However, these inherent limitations are known features of the financial reporting process. Therefore, it is possible to design into the process safeguards to reduce, though not eliminate, this risk.
Management has used the framework set forth in the report entitled
Internal
Control - Integrated Framework (2013)
published by the Committee of Sponsoring Organizations of the Treadway Commission to evaluate the effectiveness of the Company's internal control over financial reporting. Management has concluded that the Company's internal control over financial reporting was effective as of December 31, 2018. KPMG LLP, an independent registered public accounting firm, audited the effectiveness of the Company's internal control over financial reporting as of December 31, 2018, as stated in their report, which appears below.
|
/s/ Mark W. Brugger
|
||
|
Chief Executive Officer
|
||
|
(Principal Executive Officer)
|
||
|
/s/ Jay L. Johnson
|
||
|
Executive Vice President and Chief Financial Officer
|
||
|
(Principal Financial Officer)
|
||
|
/s/ Briony R. Quinn
|
||
|
Senior Vice President and Treasurer
|
||
|
(Principal Accounting Officer)
|
||
February 26, 2019
F-
2
Report of Independent Registered Public Accounting Firm
To the Stockholders and Board of Directors
DiamondRock Hospitality Company:
Opinion on Internal Control Over Financial Reporting
We have audited DiamondRock Hospitality Company and subsidiaries' (the Company) internal control over financial reporting as of December 31, 2018, based on criteria established in
Internal Control - Integrated Framework (2013)
issued by the Committee of Sponsoring Organizations of the Treadway Commission. In our opinion, the Company maintained, in all material respects, effective internal control over financial reporting as of December 31, 2018, based on criteria established in
Internal Control - Integrated Framework (2013)
issued by the Committee of Sponsoring Organizations of the Treadway Commission.
We also have audited, in accordance with the standards of the Public Company Accounting Oversight Board (United States) (PCAOB), the consolidated balance sheets of the Company as of December 31, 2018 and 2017, the related consolidated statements of operations, equity, and cash flows for each of the years in the three-year period ended December 31, 2018, the related notes and financial statement schedule III (collectively, the consolidated financial statements), and our report dated
February 26, 2019
expressed an unqualified opinion on those consolidated financial statements.
Basis for Opinion
The Company’s management is responsible for maintaining effective internal control over financial reporting and for its assessment of the effectiveness of internal control over financial reporting, included in the accompanying Management’s Report on Internal Control Over Financial Reporting. Our responsibility is to express an opinion on the Company’s internal control over financial reporting based on our audit. We are a public accounting firm registered with the PCAOB and are required to be independent with respect to the Company in accordance with the U.S. federal securities laws and the applicable rules and regulations of the Securities and Exchange Commission and the PCAOB.
We conducted our audit in accordance with the standards of the PCAOB. Those standards require that we plan and perform the audit to obtain reasonable assurance about whether effective internal control over financial reporting was maintained in all material respects. Our audit of internal control over financial reporting included obtaining an understanding of internal control over financial reporting, assessing the risk that a material weakness exists, and testing and evaluating the design and operating effectiveness of internal control based on the assessed risk. Our audit also included performing such other procedures as we considered necessary in the circumstances. We believe that our audit provides a reasonable basis for our opinion.
Definition and Limitations of Internal Control Over Financial Reporting
A company’s internal control over financial reporting is a process designed to provide reasonable assurance regarding the reliability of financial reporting and the preparation of financial statements for external purposes in accordance with generally accepted accounting principles. A company’s internal control over financial reporting includes those policies and procedures that (1) pertain to the maintenance of records that, in reasonable detail, accurately and fairly reflect the transactions and dispositions of the assets of the company; (2) provide reasonable assurance that transactions are recorded as necessary to permit preparation of financial statements in accordance with generally accepted accounting principles, and that receipts and expenditures of the company are being made only in accordance with authorizations of management and directors of the company; and (3) provide reasonable assurance regarding prevention or timely detection of unauthorized acquisition, use, or disposition of the company’s assets that could have a material effect on the financial statements.
Because of its inherent limitations, internal control over financial reporting may not prevent or detect misstatements. Also, projections of any evaluation of effectiveness to future periods are subject to the risk that controls may become inadequate because of changes in conditions, or that the degree of compliance with the policies or procedures may deteriorate.
/s/ KPMG LLP
McLean, Virginia
February 26, 2019
F-
3
Report of Independent Registered Public Accounting Firm
To the Stockholders and Board of Directors
DiamondRock Hospitality Company:
Opinion on the Consolidated
Financial Statements
We have audited the accompanying consolidated balance sheets of DiamondRock Hospitality Company and subsidiaries (the Company) as of December 31, 2018 and 2017, the related consolidated statements of operations, equity, and cash flows for each of the years in the three‑year period ended December 31, 2018, the related notes, and financial statement schedule III (collectively, the consolidated financial statements). In our opinion, the consolidated financial statements present fairly, in all material respects, the financial position of the Company as of December 31, 2018 and 2017, and the results of its operations and its cash flows for each of the years in the three‑year period ended December 31, 2018, in conformity with U.S. generally accepted accounting principles.
We also have audited, in accordance with the standards of the Public Company Accounting Oversight Board (United States) (PCAOB), the Company’s internal control over financial reporting as of December 31, 2018, based on criteria established in
Internal Control - Integrated Framework (2013)
issued by the Committee of Sponsoring Organizations of the Treadway Commission, and our report dated
February 26, 2019
expressed an unqualified opinion on the effectiveness of the Company’s internal control over financial reporting.
Basis for Opinion
These consolidated financial statements are the responsibility of the Company’s management. Our responsibility is to express an opinion on these consolidated financial statements based on our audits. We are a public accounting firm registered with the PCAOB and are required to be independent with respect to the Company in accordance with the U.S. federal securities laws and the applicable rules and regulations of the Securities and Exchange Commission and the PCAOB.
We conducted our audits in accordance with the standards of the PCAOB. Those standards require that we plan and perform the audit to obtain reasonable assurance about whether the consolidated financial statements are free of material misstatement, whether due to error or fraud. Our audits included performing procedures to assess the risks of material misstatement of the consolidated financial statements, whether due to error or fraud, and performing procedures that respond to those risks. Such procedures included examining, on a test basis, evidence regarding the amounts and disclosures in the consolidated financial statements. Our audits also included evaluating the accounting principles used and significant estimates made by management, as well as evaluating the overall presentation of the consolidated financial statements. We believe that our audits provide a reasonable basis for our opinion.
/s/ KPMG LLP
We have served as the Company’s auditor since 2004.
McLean, Virginia
February 26, 2019
F-
4
DIAMONDROCK HOSPITALITY COMPANY
CONSOLIDATED BALANCE SHEETS
As of
December 31, 2018
and
2017
(in thousands, except share and per share amounts)
|
2018
|
2017
|
||||||
|
ASSETS
|
|
|
|||||
|
Property and equipment, net
|
$
|
2,944,617
|
|
$
|
2,692,286
|
|
|
|
Restricted cash
|
47,735
|
|
40,204
|
|
|||
|
Due from hotel managers
|
86,914
|
|
86,621
|
|
|||
|
Favorable lease assets, net
|
63,945
|
|
26,690
|
|
|||
|
Prepaid and other assets
|
10,506
|
|
71,488
|
|
|||
|
Cash and cash equivalents
|
43,863
|
|
183,569
|
|
|||
|
Total assets
|
$
|
3,197,580
|
|
$
|
3,100,858
|
|
|
|
LIABILITIES AND EQUITY
|
|
|
|||||
|
Liabilities:
|
|
|
|||||
|
Mortgage and other debt, net of unamortized debt issuance costs
|
$
|
629,747
|
|
$
|
639,639
|
|
|
|
Term loans, net of unamortized debt issuance costs
|
348,219
|
|
298,153
|
|
|||
|
Total debt
|
977,966
|
|
937,792
|
|
|||
|
Deferred income related to key money, net
|
11,739
|
|
14,307
|
|
|||
|
Unfavorable contract liabilities, net
|
73,151
|
|
70,734
|
|
|||
|
Deferred ground rent
|
93,719
|
|
86,614
|
|
|||
|
Due to hotel managers
|
72,678
|
|
74,213
|
|
|||
|
Dividends and distributions declared and unpaid
|
26,339
|
|
25,708
|
|
|||
|
Accounts payable and accrued expenses
|
51,395
|
|
57,845
|
|
|||
|
Total liabilities
|
1,306,987
|
|
1,267,213
|
|
|||
|
Equity:
|
|||||||
|
Preferred stock, $0.01 par value; 10,000,000 shares authorized; no shares issued and outstanding
|
—
|
|
—
|
|
|||
|
Common stock, $0.01 par value; 400,000,000 shares authorized; 204,536,485 and 200,306,733 shares issued and outstanding at December 31, 2018 and 2017, respectively
|
2,045
|
|
2,003
|
|
|||
|
Additional paid-in capital
|
2,126,472
|
|
2,061,451
|
|
|||
|
Accumulated deficit
|
(245,620
|
)
|
(229,809
|
)
|
|||
|
Total stockholders' equity
|
1,882,897
|
|
1,833,645
|
|
|||
|
Noncontrolling interests
|
7,696
|
|
—
|
|
|||
|
Total equity
|
1,890,593
|
|
1,833,645
|
|
|||
|
Total liabilities, noncontrolling interests and stockholders’ equity
|
$
|
3,197,580
|
|
$
|
3,100,858
|
|
|
The accompanying notes are an integral part of these consolidated financial statements.
F-
5
DIAMONDROCK HOSPITALITY COMPANY
CONSOLIDATED STATEMENTS OF OPERATIONS
Years Ended
December 31, 2018
,
2017
, and
2016
(in thousands, except share and per share amounts)
|
2018
|
2017
|
2016
|
|||||||||
|
Revenues:
|
|
|
|||||||||
|
Rooms
|
$
|
631,048
|
|
$
|
635,932
|
|
$
|
650,624
|
|
||
|
Food and beverage
|
184,097
|
|
183,049
|
|
194,756
|
|
|||||
|
Other
|
48,559
|
|
51,024
|
|
51,178
|
|
|||||
|
Total revenues
|
863,704
|
|
870,005
|
|
896,558
|
|
|||||
|
Operating Expenses:
|
|
|
|||||||||
|
Rooms
|
158,078
|
|
158,534
|
|
159,151
|
|
|||||
|
Food and beverage
|
118,709
|
|
120,460
|
|
125,916
|
|
|||||
|
Management fees
|
22,159
|
|
21,969
|
|
30,143
|
|
|||||
|
Other hotel expenses
|
322,713
|
|
302,272
|
|
302,805
|
|
|||||
|
Depreciation and amortization
|
104,524
|
|
99,090
|
|
97,444
|
|
|||||
|
Impairment losses
|
—
|
|
3,209
|
|
—
|
|
|||||
|
Hotel acquisition costs
|
—
|
|
2,028
|
|
—
|
|
|||||
|
Corporate expenses
|
28,563
|
|
26,711
|
|
23,629
|
|
|||||
|
Business interruption insurance income
|
(19,379
|
)
|
(4,051
|
)
|
—
|
|
|||||
|
Gain on property insurance settlement
|
(1,724
|
)
|
—
|
|
—
|
|
|||||
|
Total operating expenses, net
|
733,643
|
|
730,222
|
|
739,088
|
|
|||||
|
|
|
|
|
|
|
||||||
|
Interest and other income, net
|
(1,806
|
)
|
(1,820
|
)
|
(762
|
)
|
|||||
|
Interest expense
|
40,970
|
|
38,481
|
|
41,735
|
|
|||||
|
Loss (gain) on sales of hotel properties, net
|
—
|
|
764
|
|
(10,698
|
)
|
|||||
|
Loss on early extinguishment of debt
|
—
|
|
274
|
|
—
|
|
|||||
|
Total other expenses, net
|
39,164
|
|
37,699
|
|
30,275
|
|
|||||
|
Income before income taxes
|
90,897
|
|
102,084
|
|
127,195
|
|
|||||
|
Income tax expense
|
(3,101
|
)
|
(10,207
|
)
|
(12,399
|
)
|
|||||
|
Net income
|
87,796
|
|
91,877
|
|
114,796
|
|
|||||
|
Less: Net income attributable to noncontrolling interests
|
(12
|
)
|
—
|
|
—
|
|
|||||
|
Net income attributable to common stockholders
|
$
|
87,784
|
|
$
|
91,877
|
|
$
|
114,796
|
|
||
|
Earnings per share:
|
|
|
|||||||||
|
Net income per share available to common stockholders—basic
|
$
|
0.43
|
|
$
|
0.46
|
|
$
|
0.57
|
|
||
|
Net income per share available to common stockholders—diluted
|
$
|
0.43
|
|
$
|
0.46
|
|
$
|
0.57
|
|
||
|
Weighted-average number of common shares outstanding:
|
|||||||||||
|
Basic
|
205,462,911
|
|
200,784,450
|
|
201,079,573
|
|
|||||
|
Diluted
|
206,131,150
|
|
201,521,468
|
|
201,676,258
|
|
|||||
The accompanying notes are an integral part of these consolidated financial statements.
F-
6
DIAMONDROCK HOSPITALITY COMPANY
CONSOLIDATED STATEMENTS OF EQUITY
Years Ended
December 31, 2018
,
2017
and
2016
(in thousands, except share and per share amounts)
|
Common Stock
|
||||||||||||||||||||||||||
|
Shares
|
Par Value
|
Additional Paid-In Capital
|
Accumulated Deficit
|
Total Stockholders' Equity
|
Noncontrolling interests
|
Total Equity
|
||||||||||||||||||||
|
Balance at December 31, 2015
|
200,741,777
|
|
$
|
2,007
|
|
$
|
2,056,878
|
|
$
|
(234,280
|
)
|
$
|
1,824,605
|
|
$
|
—
|
|
$
|
1,824,605
|
|
||||||
|
Dividends of $0.50 per common share
|
—
|
|
—
|
|
358
|
|
(101,096
|
)
|
(100,738
|
)
|
—
|
|
(100,738
|
)
|
||||||||||||
|
Issuance and vesting of common stock grants, net
|
187,362
|
|
2
|
|
4,634
|
|
—
|
|
4,636
|
|
—
|
|
4,636
|
|
||||||||||||
|
Share repurchases
|
(728,237
|
)
|
(7
|
)
|
(6,505
|
)
|
—
|
|
(6,512
|
)
|
—
|
|
(6,512
|
)
|
||||||||||||
|
Net income
|
—
|
|
—
|
|
—
|
|
114,796
|
|
114,796
|
|
—
|
|
114,796
|
|
||||||||||||
|
Balance at December 31, 2016
|
200,200,902
|
|
$
|
2,002
|
|
$
|
2,055,365
|
|
$
|
(220,580
|
)
|
$
|
1,836,787
|
|
$
|
—
|
|
$
|
1,836,787
|
|
||||||
|
Dividends of $0.50 per common share
|
—
|
|
—
|
|
424
|
|
(101,106
|
)
|
(100,682
|
)
|
—
|
|
(100,682
|
)
|
||||||||||||
|
Issuance and vesting of common stock grants, net
|
105,831
|
|
1
|
|
5,662
|
|
—
|
|
5,663
|
|
—
|
|
5,663
|
|
||||||||||||
|
Net income
|
—
|
|
—
|
|
—
|
|
91,877
|
|
91,877
|
|
—
|
|
91,877
|
|
||||||||||||
|
Balance at December 31, 2017
|
200,306,733
|
|
$
|
2,003
|
|
$
|
2,061,451
|
|
$
|
(229,809
|
)
|
$
|
1,833,645
|
|
$
|
—
|
|
$
|
1,833,645
|
|
||||||
|
Dividends of $0.50 per common share
|
—
|
|
$
|
—
|
|
465
|
|
(103,705
|
)
|
(103,240
|
)
|
—
|
|
(103,240
|
)
|
|||||||||||
|
Issuance and vesting of common stock grants, net
|
141,165
|
|
1
|
|
4,531
|
|
110
|
|
4,642
|
|
—
|
|
4,642
|
|
||||||||||||
|
Issuance of OP units
|
—
|
|
—
|
|
—
|
|
—
|
|
—
|
|
7,784
|
|
7,784
|
|
||||||||||||
|
Sale of common stock
|
7,472,946
|
|
75
|
|
92,173
|
|
—
|
|
92,248
|
|
—
|
|
92,248
|
|
||||||||||||
|
Distributions to noncontrolling interests
|
—
|
|
—
|
|
—
|
|
—
|
|
—
|
|
(100
|
)
|
(100
|
)
|
||||||||||||
|
Common stock repurchased and retired
|
(3,384,359
|
)
|
(34
|
)
|
(32,148
|
)
|
—
|
|
(32,182
|
)
|
—
|
|
(32,182
|
)
|
||||||||||||
|
Net income
|
—
|
|
—
|
|
—
|
|
87,784
|
|
87,784
|
|
12
|
|
87,796
|
|
||||||||||||
|
Balance at December 31, 2018
|
204,536,485
|
|
$
|
2,045
|
|
$
|
2,126,472
|
|
$
|
(245,620
|
)
|
$
|
1,882,897
|
|
$
|
7,696
|
|
$
|
1,890,593
|
|
||||||
The accompanying notes are an integral part of these consolidated financial statements.
F-
7
DIAMONDROCK HOSPITALITY COMPANY
CONSOLIDATED STATEMENTS OF CASH FLOWS
Years Ended
December 31, 2018
,
2017
and
2016
(in thousands)
|
2018
|
2017
|
2016
|
|||||||||
|
Cash flows from operating activities:
|
|
|
|||||||||
|
Net income
|
$
|
87,796
|
|
$
|
91,877
|
|
$
|
114,796
|
|
||
|
Adjustments to reconcile net income to net cash provided by operating activities:
|
|||||||||||
|
Real estate depreciation
|
104,524
|
|
99,090
|
|
97,444
|
|
|||||
|
Corporate asset depreciation as corporate expenses
|
216
|
|
95
|
|
66
|
|
|||||
|
Loss (gain) on sale of hotel properties, net
|
—
|
|
764
|
|
(10,698
|
)
|
|||||
|
Loss on early extinguishment of debt
|
—
|
|
274
|
|
—
|
|
|||||
|
Non-cash ground rent
|
7,305
|
|
6,290
|
|
5,671
|
|
|||||
|
Non-cash amortization of financing costs and interest rate cap as interest
|
1,862
|
|
1,950
|
|
2,302
|
|
|||||
|
Impairment losses
|
—
|
|
43,993
|
|
—
|
|
|||||
|
Estimated recovery of impairment losses from insurance
|
—
|
|
(40,784
|
)
|
—
|
|
|||||
|
Amortization of favorable and unfavorable contracts, net
|
(1,969
|
)
|
(1,912
|
)
|
(1,912
|
)
|
|||||
|
Amortization of deferred income related to key money
|
(2,568
|
)
|
(5,760
|
)
|
(2,851
|
)
|
|||||
|
Stock-based compensation
|
5,573
|
|
6,201
|
|
5,321
|
|
|||||
|
Deferred income tax expense
|
1,591
|
|
7,702
|
|
10,405
|
|
|||||
|
Changes in assets and liabilities:
|
|||||||||||
|
Prepaid expenses and other assets
|
28,657
|
|
(26,333
|
)
|
17,007
|
|
|||||
|
Due to/from hotel managers
|
(5,686
|
)
|
1,540
|
|
(1,056
|
)
|
|||||
|
Accounts payable and accrued expenses
|
(7,997
|
)
|
17,006
|
|
(20,969
|
)
|
|||||
|
Net cash provided by operating activities
|
219,304
|
|
201,993
|
|
215,526
|
|
|||||
|
Cash flows from investing activities:
|
|
|
|||||||||
|
Hotel capital expenditures
|
(115,171
|
)
|
(97,424
|
)
|
(102,861
|
)
|
|||||
|
Hotel acquisitions
|
(259,883
|
)
|
(93,795
|
)
|
—
|
|
|||||
|
Proceeds from sale of properties, net
|
—
|
|
(764
|
)
|
175,300
|
|
|||||
|
Proceeds from property insurance
|
30,742
|
|
10,042
|
|
—
|
|
|||||
|
Net cash (used in) provided by investing activities
|
(344,312
|
)
|
(181,941
|
)
|
72,439
|
|
|||||
|
Cash flows from financing activities:
|
|
|
|||||||||
|
Scheduled mortgage debt principal payments
|
(13,612
|
)
|
(12,417
|
)
|
(11,198
|
)
|
|||||
|
Repurchase of common stock and other
|
(33,113
|
)
|
(537
|
)
|
(7,197
|
)
|
|||||
|
Proceeds from sale of common stock, net
|
92,679
|
|
—
|
|
—
|
|
|||||
|
Repayments of mortgage debt
|
—
|
|
(170,368
|
)
|
(249,793
|
)
|
|||||
|
Proceeds from senior unsecured term loan
|
50,000
|
|
200,000
|
|
100,000
|
|
|||||
|
Draws on senior unsecured credit facility
|
85,000
|
|
—
|
|
75,000
|
|
|||||
|
Repayments of senior unsecured credit facility
|
(85,000
|
)
|
—
|
|
(75,000
|
)
|
|||||
|
Payment of financing costs
|
(412
|
)
|
(1,579
|
)
|
(2,765
|
)
|
|||||
|
Payment of cash dividends
|
(102,709
|
)
|
(100,542
|
)
|
(100,771
|
)
|
|||||
|
Net cash used in financing activities
|
(7,167
|
)
|
(85,443
|
)
|
(271,724
|
)
|
|||||
|
Net (decrease) increase in cash and cash equivalents, and restricted cash
|
(132,175
|
)
|
(65,391
|
)
|
16,241
|
|
|||||
|
Cash, cash equivalents, and restricted cash beginning of year
|
223,773
|
|
289,164
|
|
272,923
|
|
|||||
|
Cash, cash equivalents, and restricted cash, end of year
|
$
|
91,598
|
|
$
|
223,773
|
|
$
|
289,164
|
|
||
The accompanying notes are an integral part of these consolidated financial statements.
F-
8
DIAMONDROCK HOSPITALITY COMPANY
CONSOLIDATED STATEMENTS OF CASH FLOWS - (CONTINUED)
Years Ended
December 31, 2018
,
2017
and
2016
(in thousands)
|
Supplemental Disclosure of Cash Flow Information:
|
2018
|
2017
|
2016
|
||||||||
|
Cash paid for interest
|
$
|
38,548
|
|
$
|
36,288
|
|
$
|
40,345
|
|
||
|
Cash paid for income taxes
|
$
|
2,208
|
|
$
|
3,251
|
|
$
|
1,973
|
|
||
|
Non-cash Investing and Financing Activities:
|
|||||||||||
|
Unpaid dividends and distributions declared
|
$
|
26,339
|
|
$
|
25,708
|
|
$
|
25,567
|
|
||
|
Buyer assumption of mortgage debt on sale of hotel
|
$
|
—
|
|
$
|
—
|
|
$
|
89,486
|
|
||
|
Issuance of OP units in connection with acquisition of hotel property
|
$
|
7,784
|
|
$
|
—
|
|
$
|
—
|
|
||
The following table provides a reconciliation of cash, cash equivalents, and restricted cash reported within the consolidated balance sheets to the amount shown within the consolidated statements of cash flows:
|
2018
|
2017
|
2016
|
|||||||||
|
Cash and cash equivalents
|
$
|
43,863
|
|
$
|
183,569
|
|
$
|
243,095
|
|
||
|
Restricted cash (1)
|
47,735
|
|
40,204
|
|
46,069
|
|
|||||
|
Total cash, cash equivalents, and restricted cash
|
$
|
91,598
|
|
$
|
223,773
|
|
$
|
289,164
|
|
||
_____________________________
|
(1)
|
Restricted cash primarily consists of reserves for replacement of furniture and fixtures held by our hotel managers and cash held in escrow pursuant to lender requirements.
|
The accompanying notes are an integral part of these consolidated financial statements.
F-
9
DIAMONDROCK HOSPITALITY COMPANY
Notes to the Consolidated Financial Statements
|
1.
|
Organization
|
DiamondRock Hospitality Company (the “Company” or “we”) is a lodging-focused real estate company that owns a portfolio of premium hotels and resorts. Our hotels are concentrated in key gateway cities and in destination resort locations and many of our hotels are operated under a brand owned by one of the leading global lodging brand companies (Marriott International, Inc. (“Marriott”) or Hilton Worldwide (“Hilton”)). We are an owner, as opposed to an operator, of the hotels in our portfolio. As an owner, we receive all of the operating profits or losses generated by our hotels after we pay fees to the hotel managers, which are based on the revenues and profitability of the hotels.
As of
December 31, 2018
, we owned
31
hotels with
10,091
rooms, located in the following markets: Atlanta, Georgia; Boston, Massachusetts (
2
); Burlington, Vermont; Charleston, South Carolina; Chicago, Illinois (
2
); Denver, Colorado (
2
); Fort Lauderdale, Florida; Fort Worth, Texas; Huntington Beach, California; Key West, Florida (
2
); New York, New York (
4
); Phoenix, Arizona; Salt Lake City, Utah; San Diego, California; San Francisco, California (
2
); Sedona, Arizona (
2
); Sonoma, California; South Lake Tahoe, California; Washington D.C. (
2
); St. Thomas, U.S. Virgin Islands; and Vail, Colorado. As of
December 31, 2018
, the Frenchman's Reef & Morning Star Beach Resort ("Frenchman's Reef") is currently closed as a result of damage incurred from Hurricanes Irma and Maria in
September 2017
.
We conduct our business through a traditional umbrella partnership real estate investment trust, or UPREIT, in which our hotel properties are owned by our operating partnership, DiamondRock Hospitality Limited Partnership, or subsidiaries of our operating partnership. The Company is the sole general partner of our operating partnership and owns either directly or indirectly
99.6%
of the limited partnership units ("OP units") of our operating partnership. The remaining
0.4%
of the OP units are held by third parties, otherwise unaffiliated with the Company. See Note 5 for additional disclosures related to OP units.
|
2.
|
Summary of Significant Accounting Policies
|
Basis of Presentation
Our financial statements include all of the accounts of the Company and its subsidiaries in accordance with U.S. GAAP. All intercompany accounts and transactions have been eliminated in consolidation. If the Company determines that it has an interest in a variable interest entity within the meaning of the Financial Accounting Standards Board (“FASB”) Accounting Standards Codification (“ASC”) 810,
Consolidation
, the Company will consolidate the entity when it is determined to be the primary beneficiary of the entity. Our operating partnership meets the criteria of a variable interest entity. The Company is the primary beneficiary and, accordingly, we consolidate our operating partnership. The Company’s sole significant asset is its investment in its operating partnership, and consequently, substantially all of the Company’s assets and liabilities represent those assets and liabilities of its operating partnership. In addition, all of the Company's debt is an obligation of its operating partnership.
Use of Estimates
The preparation of the financial statements in conformity with U.S. GAAP requires management to make estimates and assumptions that affect the reported amounts of assets and liabilities and disclosure of contingent assets and liabilities at the date of the financial statements and the reported amounts of revenues and expenses during the reporting period. Actual results could differ from those estimates.
Risks and Uncertainties
The state of the overall economy can significantly impact hotel operational performance and thus, impact our financial position. Should any of our hotels experience a significant decline in operational performance, it may affect our ability to make distributions to our stockholders and service debt or meet other financial obligations.
Fair Value Measurements
In evaluating fair value, U.S. GAAP outlines a valuation framework and creates a fair value hierarchy that distinguishes between market assumptions based on market data (observable inputs) and a reporting entity’s own assumptions about market data (unobservable inputs). The hierarchy ranks the quality and reliability of inputs used to determine fair value, which are then classified and disclosed in one of the three categories. The three levels are as follows:
F-
10
•
Level 1 - Inputs are quoted prices (unadjusted) in active markets for identical assets or liabilities
•
Level 2 - Inputs include quoted prices in active markets for similar assets and liabilities, quoted prices for identical
or similar assets in markets that are not active and model-derived valuations whose inputs are observable
•
Level 3 - Model-derived valuations with unobservable inputs
Property and Equipment
Following the adoption of FASB Accounting Standards Update (“ASU”) No. 2017-01, investments in hotel properties, including related land, land improvements, building and furniture, fixtures and equipment and identifiable intangible assets are generally accounted for as asset acquisitions, which are recorded at total cost and allocated based on relative fair value. Direct acquisition-related costs are capitalized as a component of the acquired assets. Property and equipment purchased after the hotel acquisition date is recorded at cost. Replacements and improvements are capitalized, while repairs and maintenance are expensed as incurred. Upon the sale or retirement of a fixed asset, the cost and related accumulated depreciation are removed from the Company’s accounts and any resulting gain or loss is included in the statements of operations.
Depreciation is computed using the straight-line method over the estimated useful lives of the assets, generally
5
to
40
years for buildings, land improvements and building improvements and
1
to
10
years for furniture, fixtures and equipment. Leasehold improvements are amortized over the shorter of the lease term or the useful lives of the related assets.
We review our investments in hotel properties for impairment whenever events or changes in circumstances indicate that the carrying value of the hotel properties may not be recoverable. Events or circumstances that may cause a review include, but are not limited to, adverse changes in the demand for lodging at the properties due to declining national or local economic conditions and/or new hotel construction in markets where the hotels are located. When such conditions exist, management performs an analysis to determine if the estimated undiscounted future cash flows from operations and the proceeds from the ultimate disposition of a hotel property and related assets exceed the carrying value. If the estimated undiscounted future cash flows are less than the carrying amount of the asset, an adjustment to reduce the carrying amount to the related hotel property's estimated fair market value is recorded and an impairment loss is recognized.
We classify a hotel as held for sale in the period that we have made the decision to dispose of the hotel, a binding agreement to purchase the property has been signed under which the buyer has committed a significant amount of nonrefundable cash and no significant financing or other contingencies exist which could cause the transaction to not be completed in a timely manner. If these criteria are met, we record an impairment loss if the fair value less costs to sell is lower than the carrying amount of the hotel and related assets and cease recording depreciation expense, and classify the assets and related liabilities as held for sale on the balance sheet.
Cash and Cash Equivalents
We consider all highly liquid investments with an original maturity of three months or less to be cash equivalents.
Revenue Recognition
Revenues from operations of the hotels are recognized when the goods or services are provided. Revenues consist of room sales, food and beverage sales, and other hotel department revenues, such as telephone, parking, gift shop sales and resort fees. Rooms revenue is recognized over the length of stay that the hotel room is occupied by the customer. Food and beverage revenue is recognized at the point in time in which the goods and/or services are rendered to the customer, such as for restaurant dining services or banquet services. Other revenues are recognized at the point in time or over the time period that goods or services are provided to the customer. Certain ancillary services are provided by third parties and we assess whether we are the principal or agent in these arrangements. If we are the agent, revenue is recognized based upon the commission earned from the third party. If we are the principal, we recognize revenue based upon the gross sales price.
Advance deposits are recorded as liabilities when a customer or group of customers provides a deposit for a future stay or banquet event at our hotels. Advance deposits are converted to revenue when the services are provided to the customer or when a customer with a noncancelable reservation fails to arrive for part or all of the reservation. Conversely, advance deposits are generally refundable upon guest cancellation of the related reservation within an established period of time prior to the reservation.
Certain of our hotels have retail spaces, restaurants or other spaces which we lease to third parties. Lease revenue is recognized on a straight-line basis over the life of the lease and included in other operating revenues in our consolidated statements of operations.
F-
11
Income Taxes
We account for income taxes using the asset and liability method. Deferred tax assets and liabilities are recognized for the estimated future tax consequences attributable to the differences between the financial statement carrying amounts of existing assets and liabilities and their respective tax bases. Deferred tax assets and liabilities are measured using enacted tax rates in effect for the year in which those temporary differences are expected to be recovered or settled. The effect on deferred tax assets and liabilities from a change in tax rates is recognized in earnings during the period in which the new rate is enacted. However, deferred tax assets are recognized only to the extent that it is more likely than not that they will be realized based on consideration of all available evidence, including the future reversals of existing taxable temporary differences, future projected taxable income and tax planning strategies. Valuation allowances are provided if, based upon the weight of the available evidence, it is more likely than not that some or all of the deferred tax assets will not be realized.
We have elected to be treated as a REIT under the provisions of the Internal Revenue Code, which requires that we distribute at least 90% of our taxable income annually to our stockholders and comply with certain other requirements. In addition to paying federal and state taxes on any retained income, we may be subject to taxes on “built-in gains” on sales of certain assets. Our taxable REIT subsidiaries will generally be subject to federal, state, local and/or foreign income taxes.
In order for the income from our hotel property investments to constitute “rents from real properties” for purposes of the gross income tests required for REIT qualification, the income we earn cannot be derived from the operation of any of our hotels. Therefore, we lease each of our hotel properties to a wholly owned subsidiary of Bloodstone TRS, Inc., our existing taxable REIT subsidiary, or TRS, except for Frenchman’s Reef, which is owned by a Virgin Islands corporation, which we have elected to be treated as a TRS, and Cavallo Point, The Lodge at the Golden Gate ("Cavallo Point"), which is leased to a wholly owned subsidiary of the Company, which we have elected to be treated as a TRS.
We had
no
accruals for tax uncertainties as of
December 31, 2018
and
2017
.
Intangible Assets and Liabilities
Intangible assets or liabilities are recorded on non-market contracts assumed as part of the acquisition of certain hotels. We review the terms of agreements assumed in conjunction with the purchase of a hotel to determine if the terms are favorable or unfavorable compared to an estimated market agreement at the acquisition date. Favorable contract assets or unfavorable contract liabilities are recorded at the acquisition date and amortized using the straight-line method over the term of the agreement. We do not amortize intangible assets with indefinite useful lives, but we review these assets for impairment annually or at interim periods if events or circumstances indicate that the asset may be impaired.
Earnings Per Share
Basic earnings per share is calculated by dividing net income by the weighted-average number of common shares outstanding during the period. Diluted earnings per share is calculated by dividing net income by the weighted-average number of common shares outstanding during the period plus other potentially dilutive securities such as stock grants or shares issuable in the event of conversion of operating partnership units. No adjustment is made for shares that are anti-dilutive during a period.
Stock-Based Compensation
We account for stock-based employee compensation using the fair value based method of accounting. We record the cost of awards with service or market conditions based on the grant-date fair value of the award. That cost is recognized over the period during which an employee is required to provide service in exchange for the award. No compensation cost is recognized for equity instruments for which employees do not render the requisite service.
Comprehensive Income
We do not have any comprehensive income other than net income. If we have any comprehensive income in future periods, such that a statement of comprehensive income would be necessary, such statement will be reported as one statement with the consolidated statement of operations.
Noncontrolling Interests
F-
12
The noncontrolling interest is the portion of equity in our consolidated operating partnership not attributable, directly or indirectly, to the Company. Such noncontrolling interests are reported on the consolidated balance sheets within equity, separately from the Company’s equity. On the consolidated statements of operations, revenues, expenses and net income or loss from our less-than-wholly-owned operating partnership are reported within the consolidated amounts, including both the amounts attributable to the Company and noncontrolling interests. Income or loss is allocated to noncontrolling interests based on their weighted average ownership percentage for the applicable period. Consolidated statements of equity include beginning balances, activity for the period and ending balances for stockholders’ equity, noncontrolling interests and total equity.
Restricted Cash
Restricted cash primarily consists of reserves for replacement of furniture and fixtures generally held by our hotel managers and cash held in escrow pursuant to lender requirements.
Deferred Financing Costs
Financing costs are recorded at cost as a component of the debt carrying amount and consist of loan fees and other costs incurred in connection with the issuance of debt. Amortization of deferred financing costs is computed using a method that approximates the effective interest method over the remaining life of the debt and is included in interest expense in the accompanying consolidated statements of operations.
Due to/from Hotel Managers
The due from hotel managers consists of hotel level accounts receivable, periodic hotel operating distributions receivable from managers and prepaid and other assets held by the hotel managers on our behalf. The due to hotel managers represents liabilities incurred by the hotel on behalf of us in conjunction with the operation of our hotels which are legal obligations of the Company.
Key Money
Key money received in conjunction with entering into hotel management or franchise agreements or completing specific capital projects is deferred and amortized over the term of the hotel management agreement, the term of the franchise agreement, or other systematic and rational period, if appropriate. Deferred key money is classified as deferred income in the accompanying consolidated balance sheets and amortized as an offset to management fees or franchise fees.
Rental Income and Expense
We record rental income and expense on leases that provide for minimum rental payments that increase in pre-established amounts over the remaining term of the lease on a straight-line basis.
Concentration of Credit Risk
Financial instruments that potentially subject the Company to significant concentrations of credit risk consist principally of our cash and cash equivalents. We maintain cash and cash equivalents with various financial institutions. We perform periodic evaluations of the relative credit standing of these financial institutions and limit the amount of credit exposure with any one institution.
Segment Reporting
Each one of our hotels is an operating segment. We evaluate each of our properties on an individual basis to assess performance, the level of capital expenditures, and acquisition or disposition transactions. Our evaluation of individual properties is not focused on property type (e.g. urban, suburban, or resort), brand, geographic location, or industry classification.
We aggregate our operating segments using the criteria established by U.S. GAAP, including the similarities of our product offering, types of customers and method of providing service. All of our properties react similarly to economic stimulus, such as business investment, changes in Gross Domestic Product, and changes in travel patterns. As such, all our operating segments meet the aggregation criteria, resulting in a single reportable segment represented by our consolidated financial results.
Accounting for Impacts of Natural Disasters
F-
13
Assets destroyed or damaged as a result of natural disasters or other involuntary events are written off or reduced in carrying value to their salvage value. When recovery of all or a portion of the amount of property damage loss or other covered expenses through insurance proceeds is demonstrated to be probable, a receivable is recorded and offsets the loss or expense up to the amount of the total loss or expense. No gain is recorded until all contingencies related to the insurance claim have been resolved. Income resulting from business interruption insurance is not recognized until all contingencies related to the insurance recoveries are resolved.
In
September 2017
, Hurricane Irma caused significant damage to Frenchman's Reef and Havana Cabana Key West. Frenchman's Reef was further impacted by Hurricane Maria. The Company has filed insurance claims for the remediation and repair of property damage and business interruption resulting from the hurricanes, as well as from the
2017
wildfires in Northern California that impacted The Lodge at Sonoma. In
July 2018
, the Company settled the insurance claims for Havana Cabana Key West and The Lodge at Sonoma. The Havana Cabana insurance claim was settled for
$8.3 million
, net of deductibles, and we recorded a gain of approximately
$1.7 million
related to the property damage. The Lodge at Sonoma claim was settled for
$1.3 million
, net of deductibles. The Frenchman’s Reef insurance claim is ongoing and we received
$85.0 million
and
$10.0 million
in insurance proceeds during the years ended
December 31, 2018
and
2017
, respectively.
The following table summarizes the business interruption insurance income by impacted hotel property (in thousands):
|
|
Year Ended December 31,
|
||||||
|
2018
|
2017
|
||||||
|
Frenchman's Reef
|
$
|
16,090
|
|
$
|
3,128
|
|
|
|
Havana Cabana Key West
|
2,137
|
|
923
|
|
|||
|
The Lodge at Sonoma
|
1,152
|
|
—
|
|
|||
|
Total
|
$
|
19,379
|
|
$
|
4,051
|
|
|
For the year ended
December 31, 2018
, we recognized a
$1.7 million
gain related to the settlement of the property damage insurance claim at the Havana Cabana Key West.
Recently Issued Accounting Pronouncements
In January 2017, the FASB issued ASU No. 2017-01,
Business Combinations (Topic 805): Clarifying the Definition of a Business
, which clarifies the definition of a business to assist entities with evaluating whether transactions should be accounted for as acquisitions of assets or business combinations. As a result of the standard, we anticipate that the majority of our hotel acquisitions will be considered asset purchases as opposed to business combinations. However, the determination will be made on a transaction-by-transaction basis and we do not expect the determination to materially change the recognition of the assets and liabilities acquired. This standard will be applied on a prospective basis and, therefore, it does not affect the accounting for any of our previous transactions. This standard is effective for annual periods beginning after December 15, 2017. We adopted ASU No. 2017-01 effective January 1, 2018. This standard does not affect the accounting for any of our transactions prior to January 1, 2018. Refer to Note 10 for more information about our
three
hotel property acquisitions during the year ended
December 31, 2018
, which were all accounted for as asset purchases.
In November 2016, the FASB issued ASU No. 2016-18,
Statement of Cash Flows (Topic 230): Restricted Cash
, which requires that the statement of cash flows explain the change during the period in the total cash, cash equivalents, and amounts generally described as restricted cash or restricted cash equivalents. This standard is effective for annual periods beginning after December 15, 2017. We adopted ASU No. 2016-18 effective January 1, 2018. The adoption of ASU No. 2016-18 changed the presentation of the statement of cash flows for the Company and we utilized a retrospective transition method for each period presented within financial statements for periods subsequent to the date of adoption. Restricted cash reserves are included with cash and cash equivalents on our consolidated statements of cash flows for all periods presented. There was no impact to the consolidated statements of income or the consolidated balance sheets.
In August 2016, the FASB issued ASU No. 2016-15,
Statement of Cash Flows (Topic 230): Classification of Certain Cash Receipts and Cash Payments
, which clarifies and provides specific guidance on eight cash flow classification issues with an objective to reduce the current diversity in practice. This standard is effective for annual periods beginning after December 15, 2017. We adopted ASU No. 2016-15 effective January 1, 2018 and it did not have a material impact on our consolidated financial statements.
In February 2016, the FASB issued ASU No. 2016-02,
Leases (Topic 842)
, which primarily changes the lessee's accounting for operating leases by requiring recognition of lease right-of-use assets and lease liabilities. This standard is effective for annual
F-
14
reporting periods beginning after December 15, 2018. The primary impact of the new standard will be to the treatment of our ground leases, which represent a majority of all of our operating lease payments. We intend to adopt ASU No. 2016-02, along with its related clarifications and amendments, as of the effective date of January 1, 2019. We are finalizing our evaluation of the changes from adopting this standard to our future financial reporting and disclosures, as well as designing and implementing related processes and controls. We also intend to elect all of the new standard’s available transition practical expedients. We expect the standard to result in an increase to both total assets and total liabilities of between
$95 million
and
$125 million
, before adjusting for existing deferred rent and favorable and unfavorable lease intangible amounts included on our balance sheet as of December 31, 2018. Any changes to discount rates, lease terms or other variables may have a significant effect on the calculation of this recorded amount. We do not expect the adoption of the standard to result in a cumulative effect adjustment, or that the adoption of the standard will have a material impact to our results of operations, cash flows, or liquidity.
In May 2014, the FASB issued ASU No. 2014-09,
Revenue from Contracts with Customers (Topic 606)
. The new standard sets forth five prescribed steps to determine the timing and amount of revenue to be recognized to appropriately depict the transfer of promised goods or services to customers in an amount that reflects the consideration to which the entity expects to be entitled in exchange for those goods or services. In August 2015, the FASB issued ASU No. 2015-14,
Revenue from Contracts with Customers (Topic 606): Deferral of the Effective Date
, which deferred the effectiveness of ASU No. 2014-09 to reporting periods beginning after December 15, 2017. We adopted the new standard effective January 1, 2018, under the cumulative effect transition method. No adjustment was recorded to the our opening balance of retained earnings on January 1, 2018, as there was no impact to net income for the Company.
|
3.
|
Property and Equipment
|
Property and equipment as of
December 31, 2018
and
2017
consists of the following (in thousands):
|
2018
|
2017
|
||||||
|
Land
|
$
|
617,695
|
|
$
|
602,879
|
|
|
|
Land improvements
|
7,994
|
|
7,994
|
|
|||
|
Buildings
|
2,682,320
|
|
2,414,216
|
|
|||
|
Furniture, fixtures and equipment
|
491,421
|
|
423,987
|
|
|||
|
Construction in progress
|
38,623
|
|
31,906
|
|
|||
|
|
3,838,053
|
|
3,480,982
|
|
|||
|
Less: accumulated depreciation
|
(893,436
|
)
|
(788,696
|
)
|
|||
|
|
$
|
2,944,617
|
|
$
|
2,692,286
|
|
|
During the year ended
December 31, 2017
, we recognized a
$41.7 million
impairment loss for property damage at Frenchman's Reef, the Havana Cabana Key West, and the Sheraton Suites Key West in connection with Hurricanes Irma and Maria. We recorded a reduction to the impairment loss and a corresponding receivable of
$40.8 million
reflecting the insurance proceeds that were probable of receipt up to the amount of the loss recorded. The receivable for insurance proceeds is included in prepaid and other assets on the accompanying consolidated balance sheets. We evaluate probable recovery by considering various factors, including discussions with our insurance providers, consideration of their financial strength, and review of our insurance provisions and limits. During
2017
, we determined the carrying value of
$1.8 million
of construction in progress was not recoverable and we recorded a corresponding
$1.8 million
charge within impairment losses for the year ended
December 31, 2017
.
As of
December 31, 2018
and
2017
, we had accrued capital expenditures of
$12.4 million
and
$11.7 million
, respectively.
4. Favorable Lease Assets
In connection with the acquisition of certain hotels, we have recognized intangible assets for favorable ground leases and tenant leases. Our favorable lease assets, net of accumulated amortization of
$3.4 million
and
$2.7 million
as of
December 31, 2018
and
2017
, respectively, consist of the following (in thousands):
F-
15
|
2018
|
2017
|
|||||||
|
Cavallo Point Ground Lease
|
$
|
17,908
|
|
$
|
—
|
|
||
|
Hotel Palomar Phoenix Ground Lease
|
19,763
|
|
—
|
|
—
|
|
||
|
Westin Boston Waterfront Hotel Ground Lease
|
17,426
|
|
17,643
|
|
||||
|
Orchards Inn Sedona Annex Sublease
|
8,757
|
|
8,925
|
|
||||
|
Lexington Hotel Tenant Leases
|
91
|
|
122
|
|
||||
|
|
$
|
63,945
|
|
$
|
26,690
|
|
||
Favorable lease assets are recorded at the acquisition date and are generally amortized using the straight-line method over the remaining non-cancelable term of the lease agreement. Amortization expense for the years ended
December 31, 2018
,
2017
, and
2016
, was
$0.7 million
,
$0.4 million
, and
$0.3 million
, respectively. Amortization expense is expected to total
$1.1 million
annually
2019
through
2023
.
In connection with our acquisition of the Orchards Inn Sedona on
February 28, 2017
, we recorded a
$9.1 million
favorable lease asset. In connection with our acquisition of the Hotel Palomar Phoenix on
March 1, 2018
, we recorded a
$20.0 million
favorable lease asset. In connection with our acquisition of Cavallo Point on
December 12, 2018
, we recorded a
$17.9 million
favorable lease asset. We determined the value of these favorable lease assets using a discounted cash flow of the favorable difference between the contractual lease payments and estimated market rents. The market rents were estimated by applying a land capitalization rate to the estimated fee-simple value of the underlying land. The discount rate was estimated using a risk adjusted rate of return.
5. Equity
Common Shares
We are authorized to issue up to
400 million
shares of common stock,
$0.01
par value per share. Each outstanding share of common stock entitles the holder to
one
vote on all matters submitted to a vote of stockholders. Holders of our common stock are entitled to receive dividends out of assets legally available for the payment of dividends when authorized by our board of directors.
We have an “at-the-market” equity offering program (the “Current ATM Program”), pursuant to which we may issue and sell shares of our common stock from time to time, having an aggregate offering price of up to
$200 million
. Prior to the implementation of the Current ATM Program, the Company had a
$200 million
ATM program (the "Prior ATM Program"), which is no longer active. During the year ended
December 31, 2018
, we sold
7,472,946
shares of common stock at an average price of
$12.56
for net proceeds of
$92.9 million
under the Prior ATM Program. The full amount remains available under the Current ATM Program.
Our board of directors has approved a share repurchase program authorizing us to repurchase shares of our common stock. On
November 2, 2018
, our board of directors increased the authorization under the share repurchase program from
$150 million
to
$250 million
of our common stock. Repurchases under this program are made in open market or privately negotiated transactions as permitted by federal securities laws and other legal requirements. This authority may be exercised from time to time and in such amounts as market conditions warrant, and subject to regulatory considerations. The timing, manner, price and actual number of shares repurchased will depend on a variety of factors including stock price, corporate and regulatory requirements, market conditions, and other corporate liquidity requirements and priorities. The share repurchase program may be suspended or terminated at any time without prior notice.
During the year ended
December 31, 2018
, we repurchased
3,384,359
shares of our common stock at an average price of
$9.49
per share for a total purchase price of
$32.2 million
. Subsequent to
December 31, 2018
, we repurchased
3,143,922
shares of our common stock at an average price of
$9.52
per share for a total purchase price of
$30.0 million
. We retired all repurchased shares on their respective settlement dates. As of
February 26, 2019
, we have
$188.0 million
of authorized capacity remaining under our share repurchase program.
Dividends
We have paid the following dividends to holders of our common stock for the years ended
December 31, 2018
and
2017
, and through the date of this report:
F-
16
|
Payment Date
|
Record Date
|
Dividend
per Share
|
||
|
April 12, 2017
|
March 31, 2017
|
$0.125
|
||
|
July 12, 2017
|
June 30, 2017
|
$0.125
|
||
|
October 12, 2017
|
September 29, 2017
|
$0.125
|
||
|
January 12, 2018
|
December 29, 2017
|
$0.125
|
||
|
April 12, 2018
|
March 29, 2018
|
$0.125
|
||
|
July 12, 2018
|
June 29, 2018
|
$0.125
|
||
|
October 12, 2018
|
September 28, 2018
|
$0.125
|
||
|
January 14, 2019
|
January 4, 2019
|
$0.125
|
||
Preferred Shares
We are authorized to issue up to
10 million
shares of preferred stock,
$0.01
par value per share. Our board of directors is required to set for each class or series of preferred stock the terms, preferences, conversion or other rights, voting powers, restrictions, limitations as to dividends or other distributions, qualifications, and terms or conditions of redemption. As of
December 31, 2018
and
2017
, there were
no
shares of preferred stock outstanding.
Operating Partnership Units
In connection with the acquisition of Cavallo Point in
December 2018
, we issued
796,684
OP units to third parties, otherwise unaffiliated with the Company, at
$11.76
per unit. Each OP unit is redeemable at the option of the holder beginning
December 12, 2019
. Holders of OP units have certain redemption rights, which enable them to cause our operating partnership to redeem their units in exchange for cash per unit equal to the market price of our common stock, at the time of redemption, or, at our option, for shares of our common stock on a
one
-for-one basis, subject to adjustment upon the occurrence of stock splits, mergers, consolidations or similar pro-rata share transactions. As of
December 31, 2018
, there were
796,684
operating partnership units held by unaffiliated third parties.
6. Stock Incentive Plans
We are authorized to issue up to
6,082,664
shares of our common stock under our
2016
Equity Incentive Plan (the “
2016
Plan”), of which we have issued or committed to issue
846,517
shares as of
December 31, 2018
. In addition to these shares, additional shares of common stock could be issued in connection with the performance stock unit awards as further described below. The
2016
Plan replaced the
2004
Stock Option and Incentive Plan, as amended (the "
2004
Plan"). We no longer make share grants and issuances under the
2004
Plan, although awards previously made under the
2004
Plan that are outstanding will remain in effect in accordance with the terms of that plan and the applicable award agreements.
Restricted Stock Awards
Restricted stock awards issued to our officers and employees generally vest over a
three
-year period from the date of the grant based on continued employment. We measure compensation expense for the restricted stock awards based upon the fair market value of our common stock at the date of grant. Compensation expense is recognized on a straight-line basis over the vesting period and is included in corporate expenses in the accompanying consolidated statements of operations. A summary of our restricted stock awards from
January 1, 2016
to
December 31, 2018
is as follows:
F-
17
|
Number of
Shares
|
Weighted-
Average Grant
Date Fair
Value
|
|||||
|
Unvested balance at January 1, 2016
|
474,567
|
|
$
|
12.72
|
|
|
|
Granted
|
461,281
|
|
8.94
|
|
||
|
Forfeited
|
(126,610
|
)
|
10.08
|
|
||
|
Vested
|
(241,698
|
)
|
11.83
|
|
||
|
Unvested balance at December 31, 2016
|
567,540
|
|
10.62
|
|
||
|
Granted
|
324,502
|
|
11.19
|
|
||
|
Forfeited
|
(16,669
|
)
|
10.80
|
|
||
|
Vested
|
(244,411
|
)
|
11.29
|
|
||
|
Unvested balance at December 31, 2017
|
630,962
|
|
10.66
|
|
||
|
Granted
|
349,091
|
|
10.19
|
|
||
|
Forfeited
|
(51,061
|
)
|
10.44
|
|
||
|
Vested
|
(287,148
|
)
|
11.02
|
|
||
|
Unvested balance at December 31, 2018
|
641,844
|
|
$
|
10.25
|
|
|
The remaining share awards are expected to vest as follows:
310,117
during
2019
,
215,368
during
2020
, and
116,359
during
2021
. As of
December 31, 2018
, the unrecognized compensation cost related to restricted stock awards was
$4.0 million
and the weighted-average period over which the unrecognized compensation expense will be recorded is approximately
21
months. For the years ended
December 31, 2018
,
2017
, and
2016
, we recorded
$3.1 million
,
$3.1 million
and
$2.8 million
, respectively, of compensation expense related to restricted stock awards.
Performance Stock Units
Performance stock units (“PSUs”) are restricted stock units that vest
three
years from the date of grant. Each executive officer is granted a target number of PSUs (the “PSU Target Award”). For the PSUs issued in 2014 and 2015 and vested in 2017 and 2018, respectively, the actual number of shares of common stock issued to each executive officer was subject to the achievement of certain levels of total stockholder return relative to the total stockholder return of a peer group of publicly-traded lodging REITs over a
three
-year performance period. There is no payout of shares of our common stock if our total stockholder return falls below the
30
th percentile of the total stockholder returns of the peer group. The maximum number of shares of common stock issued to an executive officer is equal to
150%
of the PSU Target Award and is earned if our total stockholder return is equal to or greater than the
75
th percentile of the total stockholder returns of the peer group.
For PSUs issued in 2016 and vesting in 2019, the calculation of total stockholder return relative to the total stockholder return of a peer group over a
three
-year performance period remained in effect for
75%
of the number of PSUs to be earned in the performance period. The remaining
25%
is determined based on achieving improvement in market share for each of our hotels over the
three
-year performance period.
For the PSUs issued in 2017 and 2018 and vesting in 2020 and 2021, respectively, the calculation of total stockholder return relative to the total stockholder return of a peer group over a
three
-year performance period applies to
50%
of the number of PSUs to be earned in the performance period. The remaining
50%
is determined based on achieving improvement in market share for each of our hotels over the
three
-year performance period.
We measure compensation expense for the PSUs based upon the fair market value of the award at the grant date. Compensation expense is recognized on a straight-line basis over the
three
-year performance period and is included in corporate expenses in the accompanying consolidated statements of operations. The grant date fair value of the portion of the PSUs based on our relative total stockholder return is determined using a Monte Carlo simulation performed by a third-party valuation firm. The grant date fair value of the portion of the PSUs based on improvement in market share for each of our hotels is the closing price of our common stock on the grant date. The determination of the grant-date fair values of outstanding awards based on our relative total stockholder return included the following assumptions:
F-
18
|
Award Grant Date
|
Volatility
|
Risk-Free Rate
|
Fair Value at Grant Date
|
|||||||
|
February 26, 2016
|
24.3
|
%
|
0.93
|
%
|
$
|
8.42
|
|
|||
|
February 26, 2017
|
26.7
|
%
|
1.46
|
%
|
$
|
10.89
|
|
|||
|
March 2, 2018
|
26.9
|
%
|
2.40
|
%
|
$
|
9.52
|
|
|||
|
April 2, 2018
|
26.9
|
%
|
2.37
|
%
|
$
|
9.00
|
|
|||
A summary of our PSUs from
January 1, 2016
to
December 31, 2018
is as follows:
|
Number of
Units
|
Weighted-
Average Grant
Date Fair
Value
|
|||||
|
Unvested balance at January 1, 2016
|
676,359
|
|
$
|
11.41
|
|
|
|
Granted
|
310,398
|
|
8.54
|
|
||
|
Additional units from dividends
|
38,324
|
|
9.37
|
|
||
|
Vested (1)
|
(242,096
|
)
|
9.85
|
|
||
|
Forfeited
|
(96,301
|
)
|
10.74
|
|
||
|
Unvested balance at December 31, 2016
|
686,684
|
|
10.65
|
|
||
|
Granted
|
266,009
|
|
11.04
|
|
||
|
Additional units from dividends
|
33,478
|
|
11.17
|
|
||
|
Vested (2)
|
(200,374
|
)
|
12.15
|
|
||
|
Unvested balance at December 31, 2017
|
785,797
|
|
10.42
|
|
||
|
Granted
|
293,111
|
|
9.82
|
|
||
|
Additional units from dividends
|
35,197
|
|
11.24
|
|
||
|
Vested (3)
|
(218,514
|
)
|
11.98
|
|
||
|
Forfeited
|
(113,668
|
)
|
9.86
|
|
||
|
Unvested balance at December 31, 2018
|
781,923
|
|
$
|
11.19
|
|
|
______________________
|
(1)
|
The number of shares of common stock earned for the PSUs vested in
2016
was equal to
89.5%
of the PSU Target Award.
|
|
(2)
|
There was no payout of shares of our common stock for PSUs that vested on February 27, 2017, as our total stockholder return fell below the
30
th percentile of the total stockholder returns of the peer group over the
three
-year performance period.
|
|
(3)
|
The number of shares of common stock earned for the PSUs vested in 2018 was equal to
51.75%
of the PSU Target Award.
|
The remaining unvested target units are expected to vest as follows:
247,949
during
2019
,
231,221
during
2020
and
302,753
during
2021
. As of
December 31, 2018
, the unrecognized compensation cost related to the PSUs was
$3.1 million
and is expected to be recognized on a straight-line basis over a period of
22 months
. For the years ended
December 31, 2018
,
2017
, and
2016
, we recorded approximately
$1.9 million
,
$2.5 million
, and
$2.0 million
, respectively, of compensation expense related to the PSUs.
The compensation expense recorded for the year ended
December 31, 2016
includes the reversal of
$0.4 million
of previously recognized compensation expense resulting from the forfeiture of PSUs by our former Executive Vice President and Chief Operating Officer. The compensation expense for the year ended
December 31, 2018
includes the reversal of
$1.0 million
of previously recognized compensation expense resulting from the forfeiture of PSUs by our former Executive Vice President and Chief Financial Officer.
7. Earnings Per Share
Basic earnings per share is calculated by dividing net income available to common stockholders by the weighted-average number of common shares outstanding. Diluted earnings per share is calculated by dividing net income available to common stockholders by the weighted-average number of common shares outstanding including dilutive securities.
The following is a reconciliation of the calculation of basic and diluted earnings per share (in thousands, except share and per-share data):
F-
19
|
|
Years Ended December 31,
|
||||||||||
|
|
2018
|
2017
|
2016
|
||||||||
|
Numerator:
|
|
|
|||||||||
|
Net income attributable to common stockholders
|
$
|
87,784
|
|
$
|
91,877
|
|
$
|
114,796
|
|
||
|
Denominator:
|
|||||||||||
|
Weighted-average number of common shares outstanding—basic
|
205,462,911
|
|
200,784,450
|
|
201,079,573
|
|
|||||
|
Effect of dilutive securities:
|
|||||||||||
|
Unvested restricted common stock
|
215,655
|
|
188,759
|
|
47,468
|
|
|||||
|
Shares related to unvested PSUs
|
452,584
|
|
548,259
|
|
549,217
|
|
|||||
|
Weighted-average number of common shares outstanding—diluted
|
206,131,150
|
|
201,521,468
|
|
201,676,258
|
|
|||||
|
Earnings per share:
|
|||||||||||
|
Net income per share available to common stockholders—basic
|
$
|
0.43
|
|
$
|
0.46
|
|
$
|
0.57
|
|
||
|
Net income per share available to common stockholders—diluted
|
$
|
0.43
|
|
$
|
0.46
|
|
$
|
0.57
|
|
||
The OP units held by the noncontrolling interest holders have been excluded from the denominator of the diluted earnings per share calculation as there would be no effect on the amounts since the OP units' share of income or loss would also be added or subtracted to derive net income (loss) available to common stockholders.
8. Debt
The following table sets forth information regarding the Company’s debt as of
December 31, 2018
(dollars in thousands):
F-
20
|
Principal Balance
as of December 31,
|
|||||||||||||
|
Loan
|
Interest Rate
|
Maturity Date
|
2018
|
2017
|
|||||||||
|
Salt Lake City Marriott Downtown mortgage loan
|
4.25
|
%
|
November 2020
|
$
|
55,032
|
|
$
|
56,717
|
|
||||
|
Westin Washington D.C. City Center mortgage loan
|
3.99
|
%
|
January 2023
|
62,734
|
|
64,833
|
|
||||||
|
The Lodge at Sonoma, a Renaissance Resort & Spa mortgage loan
|
3.96
|
%
|
April 2023
|
27,633
|
|
28,277
|
|
||||||
|
Westin San Diego mortgage loan
|
3.94
|
%
|
April 2023
|
63,385
|
|
64,859
|
|
||||||
|
Courtyard Manhattan / Midtown East mortgage loan
|
4.40
|
%
|
August 2024
|
82,620
|
|
84,067
|
|
||||||
|
Renaissance Worthington mortgage loan
|
3.66
|
%
|
May 2025
|
82,540
|
|
84,116
|
|
||||||
|
JW Marriott Denver at Cherry Creek mortgage loan
|
4.33
|
%
|
July 2025
|
62,411
|
|
63,519
|
|
||||||
|
Boston Westin mortgage loan
|
4.36
|
%
|
November 2025
|
194,466
|
|
198,046
|
|
||||||
|
New Market Tax Credit loan (1)
|
5.17
|
%
|
December 2020
|
2,943
|
|
—
|
|
||||||
|
Unamortized debt issuance costs
|
(4,017
|
)
|
(4,795
|
)
|
|||||||||
|
Total mortgage and other debt, net of unamortized debt issuance costs
|
629,747
|
|
639,639
|
|
|||||||||
|
Unsecured term loan
|
LIBOR + 1.45% (2)
|
|
May 2021
|
100,000
|
|
100,000
|
|
||||||
|
Unsecured term loan
|
LIBOR + 1.45% (2)
|
|
April 2022
|
200,000
|
|
200,000
|
|
||||||
|
Unsecured term loan
|
LIBOR + 1.45% (3)
|
|
October 2023
|
50,000
|
|
—
|
|
||||||
|
Unamortized debt issuance costs
|
(1,781
|
)
|
(1,847
|
)
|
|||||||||
|
Unsecured term loans, net of unamortized debt issuance costs
|
348,219
|
|
298,153
|
|
|||||||||
|
Senior unsecured credit facility
|
LIBOR + 1.50%
|
|
May 2020 (4)
|
—
|
|
—
|
|
||||||
|
Total debt, net of unamortized debt issuance costs
|
$
|
977,966
|
|
$
|
937,792
|
|
|||||||
|
Weighted-Average Interest Rate
|
4.01%
|
|
|||||||||||
_____________
|
(1)
|
Assumed in connection with the acquisition of the Hotel Palomar Phoenix on
March 1, 2018
.
|
|
(2)
|
The interest rate at
December 31, 2018
was
3.80%
.
|
|
(3)
|
The interest rate at
December 31, 2018
was
3.78%
. We entered into an interest rate swap agreement in
January 2019
to fix LIBOR at
2.41%
through
October 2023
.
|
|
(4)
|
The credit facility may be extended for an additional year upon the payment of applicable fees and the satisfaction of certain customary conditions.
|
The aggregate debt maturities as of
December 31, 2018
are as follows (in thousands):
|
2019
|
14,195
|
|
|
|
2020
|
66,174
|
|
|
|
2021
|
116,461
|
|
|
|
2022
|
214,095
|
|
|
|
2023
|
194,649
|
|
|
|
Thereafter
|
378,190
|
|
|
|
$
|
983,764
|
|
|
Mortgage Debt
F-
21
We have incurred limited recourse, property specific mortgage debt secured by certain of our hotels. In the event of default, the lender may only foreclose on the pledged assets; however, in the event of fraud, misapplication of funds or other customary recourse provisions, the lender may seek payment from us. As of
December 31, 2018
,
eight
of our
31
hotel properties were secured by mortgage debt.
Our mortgage debt contains certain property specific covenants and restrictions, including minimum debt service coverage ratios that trigger “cash trap” provisions as well as restrictions on incurring additional debt without lender consent. As of
December 31, 2018
, we were in compliance with the financial covenants of our mortgage debt.
On
March 1, 2018
, in connection with our acquisition of the Hotel Palomar in Phoenix, Arizona, we assumed a
$2.9 million
loan originated under a qualified New Market Tax Credit program. The loan is interest-only and bears an annual fixed interest rate equal to
5.17%
. The loan matures on
December 6, 2020
.
On
April 26, 2017
, we repaid the mortgage loan secured by the Lexington Hotel New York with proceeds from a new unsecured term loan, which is discussed further below. The mortgage loan had an outstanding balance of
$170.4 million
at repayment.
Senior Unsecured Credit Facility
We are party to a
$300 million
senior unsecured credit facility with a maturity date of
May 2020
. The maturity date of the facility may be extended for an additional year upon the payment of applicable fees and the satisfaction of certain other customary conditions. The facility also includes an accordion feature to expand up to
$600 million
, subject to lender consent. The interest rate on the facility is based upon LIBOR, plus an applicable margin based upon the Company's leverage ratio, as follows:
|
Leverage Ratio
|
Applicable Margin
|
|
|
Less than or equal to 35%
|
1.50%
|
|
|
Greater than 35% but less than or equal to 45%
|
1.65%
|
|
|
Greater than 45% but less than or equal to 50%
|
1.80%
|
|
|
Greater than 50% but less than or equal to 55%
|
2.00%
|
|
|
Greater than 55%
|
2.25%
|
|
In addition to the interest payable on amounts outstanding under the facility, we are required to pay an amount equal to
0.20%
of the unused portion of the facility if the average usage of the facility was greater than
50%
or
0.30%
of the unused portion of the facility if the average usage of the facility was less than or equal to
50%
.
The facility also contains various corporate financial covenants. A summary of the most restrictive covenants is as follows:
|
Actual at
|
|||
|
Covenant
|
December 31,
2018 |
||
|
Maximum leverage ratio (1)
|
60%
|
27.5%
|
|
|
Minimum fixed charge coverage ratio (2)
|
1.50x
|
4.17x
|
|
|
Minimum tangible net worth (3)
|
$1.98 billion
|
$2.72 billion
|
|
|
Secured recourse indebtedness
|
Less than 45% of Total Asset Value
|
18.9%
|
|
_____________________________
|
(1)
|
Leverage ratio is net indebtedness, as defined in the credit agreement, divided by total asset value, defined in the credit agreement as the value of our owned hotels based on hotel net operating income divided by a defined capitalization rate.
|
|
(2)
|
Fixed charge coverage ratio is Adjusted EBITDA, generally defined in the credit agreement as EBITDA less FF&E reserves, for the most recently ending 12 months, to fixed charges, which is defined in the credit agreement as interest expense, all regularly scheduled principal payments and payments on capitalized lease obligations, for the same most recently ending 12-month period.
|
|
(3)
|
Tangible net worth, as defined in the credit agreement, is (i) total gross book value of all assets, exclusive of depreciation and amortization, less intangible assets, total indebtedness, and all other liabilities, plus (ii)
75%
of net proceeds from future equity issuances.
|
F-
22
As of
December 31, 2018
, we had
no
borrowings outstanding under the facility and the Company's leverage ratio was
27.5%
. Accordingly, interest on our borrowings under the facility will be based on LIBOR plus
150 basis points
for the following quarter. We incurred interest and unused credit facility fees on the facility of
$1.2 million
,
$1.0 million
and
$1.3 million
for the years ended
December 31, 2018
,
2017
and
2016
, respectively. Subsequent to
December 31, 2018
, we borrowed
$45 million
under the facility.
Unsecured Term Loans
We are party to a
five
-year
$100 million
unsecured term loan, a
five
-year $
200 million
unsecured term loan, and a new
five
-year
$50 million
unsecured term loan, entered into on
October 18, 2018
. On
December 5, 2018
, in connection with the acquisition closing of Cavallo Point, we drew down the full balance of the new
$50 million
term loan. In
January 2019
, we entered into an interest rate swap agreement to economically hedge variability in LIBOR-indexed interest payments at
2.41%
through
October 2023
for the
$50 million
unsecured term loan.
The financial covenants of the
three
term loans are consistent with the covenants on our senior unsecured credit facility, which are described above. The interest rate on the term loans is based on a pricing grid ranging from
140
to
220
basis points over LIBOR, based on the Company’s leverage ratio, as follows:
|
Applicable Margins
|
||||
|
Leverage Ratio
|
$100 Million and $200 Million
Term Loans
|
$50 Million
Term Loan
|
||
|
Less than or equal to 25%
|
1.45%
|
1.40%
|
||
|
Greater than 25% but less than or equal to 35%
|
1.45%
|
1.45%
|
||
|
Greater than 35% but less than or equal to 45%
|
1.60%
|
1.55%
|
||
|
Greater than 45% but less than or equal to 50%
|
1.75%
|
1.75%
|
||
|
Greater than 50% but less than or equal to 55%
|
1.95%
|
1.95%
|
||
|
Greater than 55%
|
2.20%
|
2.20%
|
||
As of
December 31, 2018
, the Company's leverage ratio was
27.5%
. We incurred interest on the term loans of
$10.6 million
, $
6.2 million
and
$1.3 million
for the years ended
December 31, 2018
,
2017
and
2016
, respectively.
9. Dispositions
On
June 8, 2016
, we sold the
485
-room Orlando Airport Marriott to an unaffiliated third party for a contractual sales price of
$63 million
. We received net proceeds of approximately
$65.8 million
from the transaction, which included credit for the hotel's capital replacement reserve. We recognized a pre-tax gain on sale of the hotel of approximately
$3.7 million
.
On
June 30, 2016
, we sold the
821
-room Hilton Minneapolis to an unaffiliated third party for a contractual sales price of
$140 million
. The buyer assumed the
$89.5 million
mortgage loan secured by the hotel. We received net proceeds of approximately
$54.8 million
from the transaction, which included credit for the hotel's working capital. We recognized a pre-tax gain on sale of the hotel of approximately
$4.9 million
during the year ended December 31, 2016. We recognized an incremental pre-tax loss of
$0.8 million
during the year ended
December 31, 2017
due to a post-closing adjustment for hotel expenses incurred under our ownership period.
On
July 7, 2016
, we sold the
169
-room Hilton Garden Inn Chelsea/New York City to an unaffiliated third party for a contractual sales price of
$65.0 million
. We received net proceeds of approximately
$63.3 million
from the transaction. We recognized a pre-tax gain on sale of the hotel of approximately
$2.0 million
.
We had
no
dispositions during the years ended
December 31, 2017
and
2018
.
Our consolidated statements of operations include the following pre-tax income (loss), inclusive of the gains and losses on sale, from the hotel properties sold during
2016
(in thousands):
F-
23
|
2018
|
2017
|
2016
|
|||||||||
|
Orlando Airport Marriott
|
$
|
—
|
|
$
|
—
|
|
$
|
8,225
|
|
||
|
Hilton Minneapolis
|
—
|
|
(764
|
)
|
4,872
|
|
|||||
|
Hilton Garden Inn Chelsea/New York City
|
—
|
|
—
|
|
3,107
|
|
|||||
|
Total pre-tax (loss) income
|
$
|
—
|
|
$
|
(764
|
)
|
$
|
16,204
|
|
||
10. Acquisitions
2018 Acquisitions (Accounted for as Asset Acquisitions)
On
March 1, 2018
, we acquired the
77
-room Landing Resort & Spa in South Lake Tahoe, California, for a total contractual purchase price of
$42 million
. The acquisition was funded with corporate cash. The acquisition is accounted for as an acquisition of assets; accordingly, direct acquisition costs were capitalized.
On
March 1, 2018
, we acquired the
242
-room Hotel Palomar in Phoenix, Arizona, for a total contractual purchase price of
$80 million
. The acquisition was funded with corporate cash. In connection with the acquisition, we assumed a
$2.9 million
loan under a qualified New Market Tax Credit program. Refer to Note 8 for additional information about the loan. The acquisition is accounted for as an acquisition of assets; accordingly, our direct acquisition costs were capitalized.
We lease the surface and air rights of the hotel property pursuant to a ground lease with the City of Phoenix. We own the building improvements fee simple. The ground lease expires in
2085
, including all extension options. Refer to Note 13 for additional information about this lease. As lessee of government property, we are subject to a Government Property Lease Excise Tax ("GPLET") under Arizona state statute in lieu of ad valorem real estate taxes through the end of the term of the ground lease. We reviewed the terms of the ground lease and GPLET agreement and concluded that the terms of the ground lease are favorable to us compared with a comparable market ground lease. Accordingly, we allocated
$20.0 million
of the total acquisition cost to a favorable ground lease asset that will be amortized over the remaining term of the ground lease, including all extension options.
We assumed an agreement previously made with the lessee of the subsurface parking facility under the hotel, which requires us to pay
50%
of the lessee's lease payments to the landlord—the City of Phoenix. The agreement is coterminous with the underlying subsurface ground lease, which expires in
2085
, including all extension options. We reviewed the terms of the parking agreement and concluded that the terms are unfavorable to us compared with a typical market parking agreement. Accordingly, we allocated
$4.6 million
of the total acquisition cost to an unfavorable agreement liability that will be amortized over the remaining term of the parking agreement, including all extension options.
On
December 12, 2018
, we acquired the
142
-room Cavallo Point for a total contractual purchase price of
$152 million
. The acquisition was funded through a combination of corporate cash, proceeds from the new
$50 million
unsecured term loan and the issuance of OP units. The acquisition is accounted for as an acquisition of assets; accordingly, our direct acquisition costs were capitalized.
Cavallo Point is subject to a long-term ground lease agreement with the United States National Park Service that expires in
2066
. Refer to Note 13 for additional information about this lease. We reviewed the terms of the ground lease and concluded that the terms of the ground lease are favorable to us compared with a comparable market ground lease. Accordingly, we allocated
$17.9 million
of the total acquisition cost to a favorable ground lease asset that will be amortized over the remaining term of the ground lease.
2017 Acquisitions (Accounted for as Business Combinations)
On
February 28, 2017
, we acquired the
88
-room L'Auberge de Sedona and the
70
-room Orchards Inn Sedona, each located in Sedona, Arizona, for a total contractual purchase price of
$97 million
. The acquisition was funded with corporate cash.
We lease the buildings and sublease the underlying land containing
28
of the
70
rooms at the Orchards Inn Sedona, which expires in
2070
, including all extension options. We reviewed the terms of the annex sublease in conjunction with the hotel acquisition accounting and concluded that the terms are favorable to us compared with a comparable market lease. As a result, we recorded a
$9.1 million
favorable lease asset that will be amortized through
2070
.
Acquired properties are included in our results of operations from the date of acquisition. The following pro forma financial information for the years ended
December 31, 2017
, and
2016
, present our results of operations (in thousands, except per share
F-
24
data) as if the hotels acquired in
2017
and accounted for a business combinations were acquired on
January 1, 2016
. The hotels acquired in
2018
are accounted for as asset acquisitions and are not included in the information presented below. The pro forma information is not necessarily indicative of the results that actually would have occurred nor does it indicate future operating results.
|
Year Ended December 31,
|
||||||||
|
2017
|
2016
|
|||||||
|
(unaudited)
|
(unaudited)
|
|||||||
|
Revenues
|
$
|
873,427
|
|
$
|
924,806
|
|
||
|
Net income
|
$
|
91,602
|
|
$
|
118,232
|
|
||
|
Earnings per share:
|
||||||||
|
Net income per share available to common stockholders—basic
|
$
|
0.46
|
|
$
|
0.59
|
|
||
|
Net income per share available to common stockholders—diluted
|
$
|
0.45
|
|
$
|
0.59
|
|
||
For the years ended
December 31, 2018
and
2017
, our consolidated statements of operations includes
$34.7 million
and
$29.3 million
of revenues, respectively, and
$6.9 million
and
$5.9 million
of net income, respectively, related to the operations of the hotels acquired in
2017
under business combination accounting.
The following table summarizes the assets acquired and liabilities assumed in our
2017
and
2018
acquisitions (in thousands):
|
Cavallo Point
|
Landing Resort & Spa
|
Hotel Palomar Phoenix
|
L'Auberge de Sedona
|
Orchards Inn Sedona
|
||||||||||||||||
|
Land
|
$
|
—
|
|
$
|
14,816
|
|
$
|
—
|
|
$
|
39,384
|
|
$
|
9,726
|
|
|||||
|
Building and improvements
|
123,100
|
|
24,351
|
|
59,703
|
|
22,204
|
|
10,180
|
|
||||||||||
|
Furniture, fixtures and equipment
|
10,470
|
|
3,346
|
|
5,207
|
|
4,376
|
|
1,982
|
|
||||||||||
|
Construction in progress
|
1,734
|
|
—
|
|
—
|
|
—
|
|
—
|
|
||||||||||
|
Total fixed assets
|
135,304
|
|
42,513
|
|
64,910
|
|
65,964
|
|
21,888
|
|
||||||||||
|
Favorable lease asset
|
17,907
|
|
—
|
|
20,012
|
|
—
|
|
9,065
|
|
||||||||||
|
Unfavorable lease liability
|
—
|
|
—
|
|
(4,644
|
)
|
—
|
|
—
|
|
||||||||||
|
New Market Tax Credit loan assumption
|
—
|
|
—
|
|
(2,943
|
)
|
—
|
|
—
|
|
||||||||||
|
Other assets and liabilities, net
|
(5,083
|
)
|
(658
|
)
|
497
|
|
(2,710
|
)
|
(412
|
)
|
||||||||||
|
Total
|
$
|
148,128
|
|
$
|
41,855
|
|
$
|
77,832
|
|
$
|
63,254
|
|
$
|
30,541
|
|
|||||
11. Income Taxes
We have elected to be treated as a REIT under the provisions of the Internal Revenue Code, which requires that we distribute at least
90%
of our taxable income annually to our stockholders and comply with certain other requirements. In addition to paying federal and state taxes on any retained income, we may be subject to taxes on “built in gains” on sales of certain assets. Our taxable REIT subsidiaries are subject to federal, state, local and/or foreign income taxes.
Our provision for income taxes consists of the following (in thousands):
F-
25
|
Year Ended December 31,
|
|||||||||||
|
2018
|
2017
|
2016
|
|||||||||
|
Current - Federal
|
$
|
66
|
|
$
|
622
|
|
$
|
—
|
|
||
|
State
|
984
|
|
1,221
|
|
1,297
|
|
|||||
|
Foreign
|
460
|
|
662
|
|
697
|
|
|||||
|
1,510
|
|
2,505
|
|
1,994
|
|
||||||
|
Deferred - Federal
|
1,857
|
|
6,432
|
|
9,779
|
|
|||||
|
State
|
178
|
|
425
|
|
1,324
|
|
|||||
|
Foreign
|
(444
|
)
|
845
|
|
(698
|
)
|
|||||
|
1,591
|
|
7,702
|
|
10,405
|
|
||||||
|
Income tax provision
|
$
|
3,101
|
|
$
|
10,207
|
|
$
|
12,399
|
|
||
A reconciliation of the statutory federal tax provision to our income tax provision is as follows (in thousands):
|
Year Ended December 31,
|
|||||||||||
|
2018
|
2017
|
2016
|
|||||||||
|
Statutory federal tax provision (1)
|
$
|
19,089
|
|
$
|
35,729
|
|
$
|
44,518
|
|
||
|
Tax impact of REIT election
|
(14,439
|
)
|
(22,277
|
)
|
(31,101
|
)
|
|||||
|
State income tax provision, net of federal tax benefit
|
705
|
|
1,652
|
|
1,703
|
|
|||||
|
Foreign income tax benefit
|
(2,927
|
)
|
(430
|
)
|
(3,080
|
)
|
|||||
|
Tax reform impact on U.S. taxes
|
—
|
|
(2,143
|
)
|
—
|
|
|||||
|
Tax reform impact on foreign taxes
|
—
|
|
(2,076
|
)
|
—
|
|
|||||
|
Other
|
673
|
|
(248
|
)
|
359
|
|
|||||
|
Income tax provision
|
$
|
3,101
|
|
$
|
10,207
|
|
$
|
12,399
|
|
||
_____________________________
|
(1)
|
Beginning January 1, 2018, the U.S. federal income tax rate decreased from
35%
to
21%
.
|
On December 22, 2017, the U.S. government enacted comprehensive tax legislation, H.R. 1, originally known as the Tax Cuts and Jobs Act (the "Tax Act"). Among other changes to the U.S. tax code, the Tax Act reduces the U.S. federal corporate income tax rate to 21%, and requires companies to pay a one-time transition tax on certain unrepatriated earnings (where applicable) of foreign subsidiaries with an election option to defer the transition tax over eight years. Accordingly, our federal net deferred tax liabilities as of December 31, 2017 have been remeasured using a U.S. federal income tax rate of 21% that is effective beginning on January 1, 2018, to reflect the effects of the enacted changes in tax rates at the date of enactment based on the applicable enacted tax rate when the temporary differences and carryforwards are expected to reverse. The impact of this remeasurement is a decrease to net deferred tax liabilities and a decrease to the deferred income tax provision in 2017 of approximately
$4.2 million
. Additionally, we elected to defer the transition tax inclusion of approximately
$17.8 million
into REIT taxable income related to the deemed mandatory repatriation of foreign earnings and profits of the Frenchman's Reef & Morning Star Beach Resort (located in the U.S. Virgin Islands) over the eight-year period allowed under the Tax Act. The transition tax increased our 2017 REIT taxable income in 2017 by approximately
$1.5 million
. The remaining deferred transition tax inclusion was included in our 2018 REIT taxable income.
We are required to pay franchise taxes in certain jurisdictions. We recorded approximately
$0.4 million
of franchise taxes during each of the years ended
December 31, 2018
,
2017
and
2016
, which are classified as corporate expenses in the accompanying consolidated statements of operations.
Deferred income taxes are recognized for temporary differences between the financial reporting bases of assets and liabilities and their respective tax bases and for operating loss and tax credit carryforwards based on enacted tax rates expected to be in effect when such amounts are paid. However, deferred tax assets are recognized only to the extent that it is more likely than not that they will be realizable based on consideration of available evidence, including future reversals of existing taxable temporary differences, projected future taxable income and tax planning strategies. Deferred tax assets are included in prepaid and other assets and deferred tax liabilities are included in accounts payable and accrued expenses on the accompanying consolidated balance sheets. The total deferred tax assets and liabilities are as follows (in thousands):
F-
26
|
2018
|
2017
|
||||||
|
Federal
|
|
||||||
|
Net operating loss carryforwards
|
$
|
1,983
|
|
$
|
3,099
|
|
|
|
Deferred income related to key money
|
2,465
|
|
2,549
|
|
|||
|
Alternative minimum tax credit carryforwards
|
103
|
|
169
|
|
|||
|
Other
|
326
|
|
355
|
|
|||
|
Depreciation and amortization
|
(9,188
|
)
|
(8,889
|
)
|
|||
|
Federal - Deferred tax (liabilities) assets, net
|
$
|
(4,311
|
)
|
$
|
(2,717
|
)
|
|
|
|
|
|
|||||
|
State
|
|
||||||
|
Net operating loss carryforwards
|
$
|
2,975
|
|
$
|
3,126
|
|
|
|
Deferred income related to key money
|
780
|
|
801
|
|
|||
|
Alternative minimum tax credit carryforwards
|
80
|
|
81
|
|
|||
|
Other
|
103
|
|
111
|
|
|||
|
Depreciation and amortization
|
(2,906
|
)
|
(2,803
|
)
|
|||
|
Less: Valuation allowance
|
(700
|
)
|
(400
|
)
|
|||
|
State - Deferred tax assets, net
|
$
|
332
|
|
$
|
916
|
|
|
|
|
|
||||||
|
Foreign (USVI)
|
|
||||||
|
Deferred income related to key money
|
$
|
—
|
|
$
|
95
|
|
|
|
Depreciation and amortization
|
(255
|
)
|
(796
|
)
|
|||
|
Other
|
—
|
|
1
|
|
|||
|
Land basis recorded in purchase accounting
|
(2,617
|
)
|
(2,617
|
)
|
|||
|
Foreign - Deferred tax liabilities, net
|
$
|
(2,872
|
)
|
$
|
(3,317
|
)
|
|
As of
December 31, 2018
, we had deferred tax assets of
$5.0 million
consisting of federal and state net operating loss carryforwards. The federal loss carryforwards of
$2.0 million
generally expire in 2029 through 2034 if not utilized by then. We believe that it is more likely than not that the results of future operations will generate sufficient taxable income to realize the deferred tax asset related to federal loss carryforwards prior to their expiration and have determined that no valuation allowance is required. The state loss carryforwards of
$3.0 million
generally expire in 2020 through 2034 if not utilized by then. The Company analyzes state loss carryforwards on a state by state basis and records a valuation allowance when we deem it more likely than not that future results will not generate sufficient taxable income in the respective state to realize the deferred tax asset prior to the expiration of the loss carryforwards. As of
December 31, 2018
, we have a
$0.7 million
valuation allowance on the deferred tax asset related to the Illinois state loss carryforward. The remaining deferred tax assets of
$3.9 million
are expected to be recovered against reversing existing taxable temporary differences.
The Frenchman's Reef & Morning Star Beach Resort is owned by a subsidiary that has elected to be treated as a TRS, and is subject to U.S. Virgin Islands ("USVI") income taxes. We are party to a tax agreement with the USVI that reduces the income tax rate to approximately
7%
. This agreement expires in February 2030.
12. Relationships with Managers and Franchisors
We are party to hotel management agreements for each of our hotels owned. Under our hotel management agreements, the hotel manager receives a base management fee and, if certain financial thresholds are met or exceeded, an incentive management fee. The base management fee is generally payable as a percentage of gross hotel revenues for each fiscal year. The incentive management fee is generally based on hotel operating profits, but the fee only applies to that portion of hotel operating profits above a negotiated return on our invested capital, which we refer to as the owner's priority. We refer to this excess of operating profits over the owner's priority as “available cash flow.”
The following is a summary of management fees for the years ended
December 31, 2018
,
2017
and
2016
(in thousands):
F-
27
|
Year Ended December 31,
|
|||||||||||
|
2018
|
2017
|
2016
|
|||||||||
|
Base management fees
|
$
|
20,467
|
|
$
|
22,265
|
|
$
|
24,480
|
|
||
|
Incentive management fees
|
5,805
|
|
6,259
|
|
7,810
|
|
|||||
|
Amortization of deferred income related to key money
|
(2,398
|
)
|
(4,840
|
)
|
(432
|
)
|
|||||
|
Amortization of unfavorable contract liabilities
|
(1,715
|
)
|
(1,715
|
)
|
(1,715
|
)
|
|||||
|
Total management fees, net
|
$
|
22,159
|
|
$
|
21,969
|
|
$
|
30,143
|
|
||
Nine
of our hotels earned incentive management fees for the year ended
December 31, 2018
.
Ten
of our hotels earned incentive management fees for the year ended
December 31, 2017
.
Nine
of our hotels earned incentive management fees for the year ended
December 31, 2016
.
Performance Termination Provisions
Our management agreements provide us with termination rights upon a manager's failure to meet certain financial performance criteria and manager's decision not to cure the failure by making a cure payment.
Key Money
Our managers and franchisors have contributed to us certain amounts in exchange for the right to manage or franchise hotels we have acquired and in connection with the completion of certain brand enhancing capital projects. We refer to these amounts as “key money.” Key money is classified as deferred income in the accompanying consolidated balance sheets and amortized against management fees or franchise fees on the accompanying consolidated statements of operations. We amortized
$2.6 million
of key money during the year ended
December 31, 2018
,
$5.8 million
during the year ended
December 31, 2017
, and
$2.9 million
during the year ended
December 31, 2016
.
In connection with a change in hotel manager of the Courtyard Manhattan/Midtown East, we recognized
$1.9 million
of accelerated amortization in
2017
of key money provided to us by the previous hotel manager. In connection with the termination of the management agreement for Frenchman's Reef, we accelerated the amortization of key money received from the hotel manager from the date of our notice of termination in
2017
through the effective termination date of
February 20, 2018
. We recognized an additional
$2.6 million
of amortization of key money during the year ended
December 31, 2017
in connection with this acceleration. The remaining
$2.2 million
was amortized during the first quarter of
2018
.
During
2015
, Starwood provided us with
$3.0 million
of key money in connection with our renovation associated with the brand conversion of the hotel formerly known as the Conrad Chicago to The Gwen, a Luxury Collection Hotel. The key money was amortized against franchise fees over the period of the renovation—
January 2016
through
April 2017
.
Franchise Agreements
We have franchise agreements for
13
of our hotels. Pursuant to these franchise agreements, we pay franchise fees based on a percentage of gross room sales, and, under certain agreements, a percentage based on gross food and beverage sales. Further, we pay certain other fees for marketing and reservation services.
The following is a summary of franchise fees for the years ended
December 31, 2018
,
2017
and
2016
(in thousands):
|
Year Ended December 31,
|
|||||||||||
|
2018
|
2017
|
2016
|
|||||||||
|
Franchise fees
|
$
|
26,348
|
|
$
|
24,890
|
|
$
|
24,237
|
|
||
|
Amortization of deferred income related to key money
|
(170
|
)
|
(920
|
)
|
(2,420
|
)
|
|||||
|
Total franchise fees, net
|
$
|
26,178
|
|
$
|
23,970
|
|
$
|
21,817
|
|
||
Total franchise fees are included in other hotel expenses on the accompanying consolidated statements of operations.
13. Commitments and Contingencies
F-
28
Litigation
We are subject to various claims, lawsuits and legal proceedings, including routine litigation arising in the ordinary course of business, regarding the operation of our hotels and Company matters. While it is not possible to ascertain the ultimate outcome of such matters, management believes that the aggregate amount of such liabilities, if any, in excess of amounts covered by insurance will not have a material adverse impact on our financial condition or results of operations. The outcome of claims, lawsuits and legal proceedings brought against the Company, however, is subject to significant uncertainties.
On August 13, 2018, the Company brought suit against certain of its property insurers in St. Thomas, U.S. Virgin Islands, over the amount of the coverage the insurers owe as a result of the damage caused to Frenchman's Reef by Hurricanes Irma and Maria. On September 28, 2018, certain of the Company's property insurers brought a similar suit against the Company in New York seeking a declaration that the insurers do not owe the full amount of the Company's claim. Notwithstanding the litigation, the Company and its insurers continue to engage in discussions and negotiation regarding the Company's claim.
Other Matters
In February 2016, the Company was notified by the franchisor of one of its hotels that as a result of low guest satisfaction scores, the Company was in default under the franchise agreement for that hotel. The Company continues to proactively work with the franchisor and the manager of the hotel and has developed and executed a plan aimed to improve guest satisfaction scores. Though the guest satisfaction scores have improved, the Company remains in default under the franchise agreement. While the franchisor has reserved all of its rights under the franchise agreement, no action to terminate the franchise agreement has been taken by the franchisor and no accrual was recorded as of
December 31, 2018
or
2017
.
If the Company is not successful in resolving the matter, the franchisor may seek to terminate the franchise agreement and assert a claim it is owed a termination fee, including a payment for liquidated damages, which could result in a material adverse effect on the Company's business, financial condition or results of operation.
Restricted Cash
As of
December 31, 2018
and
2017
, we had
$47.7 million
and
$40.2 million
, respectively, of restricted cash, which consists of reserves for replacement of furniture and fixtures generally held by our hotel managers and cash held in escrow pursuant to lender requirements.
Ground Leases
Seven
of our hotels are subject to ground lease agreements that cover all of the land underlying the respective hotel:
|
•
|
The Bethesda Marriott Suites hotel is subject to a ground lease that runs until
2087
. There are
no
renewal options.
|
|
•
|
The Courtyard Manhattan/Fifth Avenue is subject to a ground lease that runs until
2085
, inclusive of
one
49
-year renewal option.
|
|
•
|
The Salt Lake City Marriott Downtown is subject to
two
ground leases: one ground lease covers the land under the hotel and the other ground lease covers the portion of the hotel that extends into the adjacent City Creek Project. We own a
21%
interest in the land under the hotel. The term of the ground lease covering the land under the hotel runs through
2056
, inclusive of renewal options. The term of the ground lease covering the extension into the City Creek Project was amended during
2017
to run coterminously with the term of the ground lease covering the land under the hotel. As such, the term now runs through
2056
, inclusive of renewal options.
|
|
•
|
The Westin Boston Waterfront is subject to a ground lease that runs until
2099
. There are
no
renewal options.
|
|
•
|
The Shorebreak Hotel is subject to a ground lease that runs until
2100
, inclusive of
two
renewal options of
25
years each and
one
24
-year renewal option. We own a
95.5%
undivided interest in the land underlying the hotel and lease the remaining
4.5%
under the ground lease.
|
|
•
|
The Hotel Palomar Phoenix is subject to a ground lease that runs until
2085
, inclusive of
three
renewal options of
five
years each.
|
F-
29
|
•
|
Cavallo Point is subject to a ground lease with the United States National Park Service that runs until
2066
. There are
no
renewal options.
|
A portion of the parking garage relating to the Renaissance Worthington is subject to
three
ground leases that cover, contiguously with each other, approximately one-fourth of the land on which the parking garage is constructed. Each of the ground leases has a term that runs through
July 2067
, inclusive of
three
15
-year renewal options. The remainder of the land on which the parking garage is constructed is owned by us in fee simple.
A portion of the JW Marriott Denver at Cherry Creek is subject to a ground lease that covers approximately
5,500
square feet. The term of the ground lease runs through
December 2030
, inclusive of
two
5
-year renewal options. The lease may be indefinitely extended thereafter in
one
-year increments. The remainder of the land on which the hotel is constructed is owned by us in fee simple.
We lease the buildings and sublease the underlying land containing
28
of the
70
rooms at the Orchards Inn Sedona, which expires in
2070
, including all extension options. The remainder of the land underlying the hotel is owned by us in fee simple.
These ground leases generally require us to make rental payments (including a percentage of gross receipts as percentage rent with respect to the Courtyard Manhattan/Fifth Avenue, Westin Boston Waterfront Hotel, Salt Lake City Marriott Downtown, and Cavallo Point ground leases). Most of our ground leases require us to make payments for all charges, costs, expenses, assessments and liabilities, including real property taxes and utilities. Furthermore, these ground leases generally require us to obtain and maintain insurance covering the subject property.
Ground rent expense was
$11.6 million
,
$10.2 million
and
$12.7 million
for the years ended
December 31, 2018
,
2017
and
2016
, respectively. Cash paid for ground rent was
$4.7 million
,
$4.1 million
and
$7.0 million
for the years ended
December 31, 2018
,
2017
and
2016
, respectively.
The following table reflects the current and future annual rents under our ground leases:
F-
30
|
Property
|
Term (1)
|
Annual Rent
|
||
|
Bethesda Marriott Suites
|
Through 4/2087
|
$781,366 (2)
|
||
|
Courtyard Manhattan/Fifth Avenue (3)
|
10/2007 - 9/2017
|
$906,000
|
||
|
10/2017 - 9/2027
|
$1,132,812
|
|||
|
10/2027 - 9/2037
|
$1,416,015
|
|||
|
10/2037 - 9/2047
|
$1,770,019
|
|||
|
10/2047 - 9/2057
|
$2,212,524
|
|||
|
10/2057 - 9/2067
|
$2,765,655
|
|||
|
10/2067 - 9/2077
|
$3,457,069
|
|||
|
10/2077 - 9/2085
|
$4,321,336
|
|||
|
Salt Lake City Marriott Downtown (Ground lease for hotel) (4)
|
Through 12/2056
|
Greater of $132,000 or 2.6% of annual gross room sales
|
||
|
Salt Lake City Marriott Downtown (Ground lease for extension)
|
1/2013 - 12/2016
|
$11,305
|
||
|
1/2017 - 12/2017
|
$13,000
|
|||
|
1/2018 - 12/2056 (5)
|
$13,500
|
|||
|
Westin Boston Waterfront Hotel (6) (Base rent)
|
1/2016 - 12/2020
|
$750,000
|
||
|
1/2021 - 12/2025
|
$1,000,000
|
|||
|
1/2026 - 12/2030
|
$1,500,000
|
|||
|
1/2031 - 12/2035
|
$1,750,000
|
|||
|
1/2036 - 5/2099
|
No base rent
|
|||
|
Westin Boston Waterfront Hotel (Percentage rent)
|
Through 5/2015
|
0% of annual gross revenue
|
||
|
6/2016 - 5/2026
|
1.0% of annual gross revenue
|
|||
|
6/2026 - 5/2036
|
1.5% of annual gross revenue
|
|||
|
6/2036 - 5/2046
|
2.75% of annual gross revenue
|
|||
|
6/2046 - 5/2056
|
3.0% of annual gross revenue
|
|||
|
6/2056 - 5/2066
|
3.25% of annual gross revenue
|
|||
|
6/2066 - 5/2099
|
3.5% of annual gross revenue
|
|||
|
JW Marriott Denver at Cherry Creek
|
1/2015 - 12/2020
|
$50,000
|
||
|
1/2021 - 12/2025
|
$55,000
|
|||
|
1/2026 - 12/2030 (7)
|
$60,000
|
|||
|
Shorebreak Hotel
|
Through 4/2016
|
$115,542
|
||
|
5/2016 - 4/2021 (8)
|
$126,649
|
|||
|
Orchards Inn Sedona
|
Through 6/2018
|
$117,780
|
||
|
7/2018 - 12/2070
|
$121,078 (9)
|
|||
|
Hotel Palomar Phoenix (Base Rent)
|
Through 3/2020
|
$16,875
|
||
|
4/2020 - 3/2021
|
$33,750
|
|||
|
4/2021 - 3/2085
|
$34,594 (10)
|
|||
|
Hotel Palomar Phoenix (Government Property Lease Excise Tax) (11)
|
1/2022 - 12/2023
|
$390,000
|
||
|
1/2024 - 12/2033
|
$312,000
|
|||
|
1/2034 - 12/2043
|
$234,000
|
|||
|
1/2044 - 12/2053
|
$156,000
|
|||
|
1/2054 - 12/2063
|
$78,000
|
|||
|
1/2064 - 3/2085
|
$—
|
|||
|
Cavallo Point (Base Rent)
|
Through 12/2018
|
$1
|
||
|
1/2019 - 12/2066
|
$67,034 (12)
|
|||
|
Cavallo Point (13) (Percentage Rent)
|
Through 12/2018
|
1.0% of adjusted gross revenue over threshold
|
||
|
1/2019 - 12/2023
|
2.0% of adjusted gross revenue over threshold
|
|||
|
1/2024 - 12/2028
|
3.0% of adjusted gross revenue over threshold
|
|||
|
1/2029 - 12/2033
|
4.0% of adjusted gross revenue over threshold
|
|||
|
1/2034 - 12/2066
|
5.0% of adjusted gross revenue over threshold
|
|||
|
Cavallo Point (14) (Participation Rent)
|
Through 12/2066
|
10.0% of adjusted gross revenue over threshold
|
||
F-
31
|
Property
|
Term (1)
|
Annual Rent
|
||
|
Renaissance Worthington garage ground lease
|
8/2013 - 7/2022
|
$40,400
|
||
|
8/2022 - 7/2037
|
$46,081
|
|||
|
8/2037 - 7/2052
|
$51,763
|
|||
|
8/2052 - 7/2067
|
$57,444
|
|||
__________
|
(1)
|
These terms assume our exercise of all renewal options.
|
|
(2)
|
Represents rent for the year ended December 31, 2018. Rent increases annually by 5.5%.
|
|
(3)
|
The total annual rent includes the fixed rent noted in the table plus a percentage rent equal to 5% of gross receipts for each lease year, but only to the extent that 5% of gross receipts exceeds the minimum fixed rent in such lease year. There was no such percentage rent earned during the year ended December 31, 2018.
|
|
(4)
|
We own a 21% interest in the land underlying the hotel and, as a result, 21% of the annual rent under the ground lease is paid to us by the hotel.
|
|
(5)
|
Rent will increase from the prior year's rent based on a Consumer Price Index calculation on each January 1, beginning January 1, 2019 and through the end of the lease.
|
|
(6)
|
Total annual rent under the ground lease is capped at 2.5% of hotel gross revenues during the initial 30 years of the ground lease.
|
|
(7)
|
Beginning January 2031, we have the right to renew the ground lease in one-year increments at the prior year's annual rent plus 3%.
|
|
(8)
|
Rent will increase on May 1, 2021 and every five years thereafter based on a Consumer Price Index calculation.
|
|
(9)
|
Represents rent from July 2018 through June 2019. On July 1, 2018, rent increased based on a Consumer Price Index calculation, and will continue to do so annually through the end of the lease.
|
|
(10)
|
Represents rent from April 2021 through March 2022. Rent increases annually each April by 2.5%.
|
|
(11)
|
As lessee of government property, the hotel is subject to a Government Property Lease Excise Tax ("GPLET") under Arizona state statute with payments beginning in 2022.
|
|
(12)
|
Base rent increases in January 2019 and resets every five years based on the average of the previous three years of adjusted gross revenues, as defined in the ground lease, multiplied by 75%.
|
|
(13)
|
Percentage rent is applied to annual adjusted gross revenues, as defined in the ground lease, between $30 million and the participation rent threshold. Base rent is deducted from the percentage rent.
|
|
(14)
|
Participation rent is applied to annual adjusted gross revenues, as defined in the ground lease, over $40 million in 2018, $42 million in 2019, and $42 million plus an annual increase based on a Consumer Price Index calculation for 2020 and every year thereafter through the end of the lease term.
|
Future minimum annual rental commitments under all non-cancelable operating leases as of
December 31, 2018
are as follows (in thousands):
|
2019
|
$
|
5,232
|
|
|
2020
|
4,866
|
|
|
|
2021
|
6,132
|
|
|
|
2022
|
5,122
|
|
|
|
2023
|
5,096
|
|
|
|
Thereafter
|
636,770
|
|
|
|
$
|
663,218
|
|
|
14. Fair Value of Financial Instruments
The fair value of certain financial assets and liabilities and other financial instruments as of
December 31, 2018
and
2017
, in thousands, are as follows:
|
December 31, 2018
|
December 31, 2017
|
||||||||||||||
|
Carrying
Amount (1)
|
Fair Value
|
Carrying
Amount (1)
|
Fair Value
|
||||||||||||
|
Debt
|
$
|
977,966
|
|
$
|
960,447
|
|
$
|
937,792
|
|
$
|
942,529
|
|
|||
_______________
|
(1)
|
The carrying amount of debt is net of unamortized debt issuance costs.
|
F-
32
The fair value of our mortgage debt is a Level 2 measurement under the fair value hierarchy (see Note 2). We estimate the fair value of our mortgage debt by discounting the future cash flows of each instrument at estimated market rates. The carrying value of our other financial instruments approximate fair value due to the short-term nature of these financial instruments.
15. Quarterly Operating Results (Unaudited)
|
2018 Quarter Ended
|
||||||||||||||||
|
March 31
|
June 30
|
September 30
|
December 31
|
|||||||||||||
|
(In thousands, except per share data)
|
||||||||||||||||
|
Total revenue
|
$
|
181,530
|
|
$
|
237,949
|
|
$
|
220,818
|
|
$
|
223,407
|
|
||||
|
Total operating expenses
|
168,011
|
|
200,012
|
|
176,589
|
|
189,031
|
|
||||||||
|
Operating income
|
$
|
13,519
|
|
$
|
37,937
|
|
$
|
44,229
|
|
$
|
34,376
|
|
||||
|
Net income
|
$
|
4,338
|
|
$
|
28,009
|
|
$
|
31,443
|
|
$
|
24,006
|
|
||||
|
Net income attributable to common stockholders
|
$
|
4,338
|
|
$
|
28,009
|
|
$
|
31,443
|
|
$
|
23,994
|
|
||||
|
Net income per share available to common stockholders—basic
|
$
|
0.02
|
|
$
|
0.14
|
|
$
|
0.15
|
|
$
|
0.12
|
|
||||
|
Net income per share available to common stockholders—diluted
|
$
|
0.02
|
|
$
|
0.14
|
|
$
|
0.15
|
|
$
|
0.12
|
|
||||
|
2017 Quarter Ended
|
||||||||||||||||
|
March 31
|
June 30
|
September 30
|
December 31
|
|||||||||||||
|
(In thousands, except per share data)
|
||||||||||||||||
|
Total revenue
|
$
|
196,210
|
|
$
|
243,272
|
|
$
|
223,486
|
|
$
|
207,037
|
|
||||
|
Total operating expenses
|
176,914
|
|
192,621
|
|
189,168
|
|
171,519
|
|
||||||||
|
Operating income
|
$
|
19,296
|
|
$
|
50,651
|
|
$
|
34,318
|
|
$
|
35,518
|
|
||||
|
Net income
|
$
|
8,887
|
|
$
|
36,595
|
|
$
|
21,623
|
|
$
|
24,772
|
|
||||
|
Net income attributable to common stockholders
|
$
|
8,887
|
|
$
|
36,595
|
|
$
|
21,623
|
|
$
|
24,772
|
|
||||
|
Net income per share available to common stockholders—basic
|
$
|
0.04
|
|
$
|
0.18
|
|
$
|
0.11
|
|
$
|
0.12
|
|
||||
|
Net income per share available to common stockholders—diluted
|
$
|
0.04
|
|
$
|
0.18
|
|
$
|
0.11
|
|
$
|
0.12
|
|
||||
F-
33
DiamondRock Hospitality Company
Schedule III - Real Estate and Accumulated Depreciation
As of December 31, 2018 (in thousands)
|
Costs
|
||||||||||||||||||||||||||||||||||||||||
|
Initial Cost
|
Capitalized
|
Gross Amount at End of Year
|
||||||||||||||||||||||||||||||||||||||
|
Building and
|
Subsequent to
|
Building and
|
Accumulated
|
Net Book
|
Year of
|
Depreciation
|
||||||||||||||||||||||||||||||||||
|
Description
|
Encumbrances
|
Land
|
Improvements
|
Acquisition
|
Land
|
Improvements
|
Total
|
Depreciation
|
Value
|
Acquisition
|
Life
|
|||||||||||||||||||||||||||||
|
Atlanta Alpharetta Marriott
|
$
|
—
|
|
$
|
3,623
|
|
$
|
33,503
|
|
$
|
2,534
|
|
$
|
3,623
|
|
$
|
36,037
|
|
$
|
39,660
|
|
$
|
(11,696
|
)
|
$
|
27,964
|
|
2005
|
40 Years
|
|||||||||||
|
Bethesda Marriott Suites
|
—
|
|
—
|
|
45,656
|
|
5,345
|
|
—
|
|
51,001
|
|
51,001
|
|
(16,740
|
)
|
34,261
|
|
2004
|
40 Years
|
||||||||||||||||||||
|
Boston Westin Waterfront
|
(194,466
|
)
|
—
|
|
273,696
|
|
26,091
|
|
—
|
|
299,787
|
|
299,787
|
|
(88,210
|
)
|
211,577
|
|
2007
|
40 Years
|
||||||||||||||||||||
|
Cavallo Point
|
—
|
|
—
|
|
123,100
|
|
—
|
|
—
|
|
123,100
|
|
123,100
|
|
(308
|
)
|
122,792
|
|
2018
|
40 Years
|
||||||||||||||||||||
|
Chicago Marriott Downtown
|
—
|
|
36,900
|
|
347,921
|
|
93,281
|
|
36,900
|
|
441,202
|
|
478,102
|
|
(121,187
|
)
|
356,915
|
|
2006
|
40 Years
|
||||||||||||||||||||
|
The Gwen Chicago
|
—
|
|
31,650
|
|
76,961
|
|
22,243
|
|
31,650
|
|
99,204
|
|
130,854
|
|
(25,029
|
)
|
105,825
|
|
2006
|
40 Years
|
||||||||||||||||||||
|
Courtyard Denver
|
—
|
|
9,400
|
|
36,180
|
|
2,978
|
|
9,400
|
|
39,158
|
|
48,558
|
|
(7,003
|
)
|
41,555
|
|
2011
|
40 Years
|
||||||||||||||||||||
|
Courtyard Manhattan/Fifth Avenue
|
—
|
|
—
|
|
34,685
|
|
4,485
|
|
—
|
|
39,170
|
|
39,170
|
|
(13,359
|
)
|
25,811
|
|
2004
|
40 Years
|
||||||||||||||||||||
|
Courtyard Manhattan/Midtown East
|
(82,620
|
)
|
16,500
|
|
54,812
|
|
5,199
|
|
16,500
|
|
60,011
|
|
76,511
|
|
(20,284
|
)
|
56,227
|
|
2004
|
40 Years
|
||||||||||||||||||||
|
Frenchman's Reef & Morning Star Beach Resort
|
—
|
|
17,713
|
|
50,697
|
|
17,949
|
|
17,713
|
|
68,646
|
|
86,359
|
|
(15,230
|
)
|
71,129
|
|
2005
|
40 Years
|
||||||||||||||||||||
|
Havana Cabana Key West
|
—
|
|
32,888
|
|
13,371
|
|
5,513
|
|
32,888
|
|
18,884
|
|
51,772
|
|
(1,491
|
)
|
50,281
|
|
2014
|
40 Years
|
||||||||||||||||||||
|
Hilton Boston Downtown
|
—
|
|
23,262
|
|
128,628
|
|
12,877
|
|
23,262
|
|
141,505
|
|
164,767
|
|
(22,112
|
)
|
142,655
|
|
2012
|
40 Years
|
||||||||||||||||||||
|
Hilton Burlington
|
—
|
|
9,197
|
|
40,644
|
|
2,006
|
|
9,197
|
|
42,650
|
|
51,847
|
|
(6,954
|
)
|
44,893
|
|
2012
|
40 Years
|
||||||||||||||||||||
|
Hilton Garden Inn/New York Times Square Central
|
—
|
|
60,300
|
|
88,896
|
|
472
|
|
60,300
|
|
89,368
|
|
149,668
|
|
(9,702
|
)
|
139,966
|
|
2014
|
40 Years
|
||||||||||||||||||||
|
Hotel Emblem
|
—
|
|
7,856
|
|
21,085
|
|
(36
|
)
|
7,856
|
|
21,049
|
|
28,905
|
|
(3,231
|
)
|
25,674
|
|
2012
|
40 Years
|
||||||||||||||||||||
|
Hotel Palomar Phoenix
|
(2,943
|
)
|
—
|
|
59,703
|
|
(171
|
)
|
—
|
|
59,532
|
|
59,532
|
|
(1,281
|
)
|
58,251
|
|
2018
|
40 Years
|
||||||||||||||||||||
|
JW Marriott Denver
|
(62,411
|
)
|
9,200
|
|
63,183
|
|
1,488
|
|
9,200
|
|
64,671
|
|
73,871
|
|
(12,250
|
)
|
61,621
|
|
2011
|
40 Years
|
||||||||||||||||||||
|
The Landing at Lake Tahoe
|
—
|
|
14,816
|
|
24,351
|
|
(241
|
)
|
14,816
|
|
24,110
|
|
38,926
|
|
(531
|
)
|
38,395
|
|
2018
|
40 Years
|
||||||||||||||||||||
|
L'Auberge de Sedona
|
—
|
|
39,384
|
|
22,204
|
|
293
|
|
39,384
|
|
22,497
|
|
61,881
|
|
(1,592
|
)
|
60,289
|
|
2017
|
40 Years
|
||||||||||||||||||||
|
Lexington Hotel New York
|
—
|
|
92,000
|
|
229,368
|
|
22,796
|
|
92,000
|
|
252,164
|
|
344,164
|
|
(45,686
|
)
|
298,478
|
|
2011
|
40 Years
|
||||||||||||||||||||
|
Orchards Inn Sedona
|
—
|
|
9,726
|
|
10,180
|
|
102
|
|
9,726
|
|
10,282
|
|
20,008
|
|
(511
|
)
|
19,497
|
|
2017
|
40 Years
|
||||||||||||||||||||
|
Renaissance Charleston
|
—
|
|
5,900
|
|
32,511
|
|
5,208
|
|
5,900
|
|
37,719
|
|
43,619
|
|
(7,135
|
)
|
36,484
|
|
2010
|
40 Years
|
||||||||||||||||||||
|
Renaissance Worthington
|
(82,540
|
)
|
15,500
|
|
63,428
|
|
18,037
|
|
15,500
|
|
81,465
|
|
96,965
|
|
(23,086
|
)
|
73,879
|
|
2005
|
40 Years
|
||||||||||||||||||||
|
Salt Lake City Marriott Downtown
|
(55,032
|
)
|
—
|
|
45,815
|
|
5,701
|
|
855
|
|
50,661
|
|
51,516
|
|
(16,944
|
)
|
34,572
|
|
2004
|
40 Years
|
||||||||||||||||||||
|
Sheraton Suites Key West
|
—
|
|
49,592
|
|
42,958
|
|
742
|
|
49,592
|
|
43,700
|
|
93,292
|
|
(3,996
|
)
|
89,296
|
|
2015
|
40 Years
|
||||||||||||||||||||
|
Shorebreak Hotel
|
—
|
|
19,908
|
|
37,525
|
|
3,332
|
|
19,908
|
|
40,857
|
|
60,765
|
|
(3,847
|
)
|
56,918
|
|
2015
|
40 Years
|
||||||||||||||||||||
|
The Lodge at Sonoma, a Renaissance Resort and Spa
|
(27,633
|
)
|
3,951
|
|
22,720
|
|
8,601
|
|
3,951
|
|
31,321
|
|
35,272
|
|
(12,233
|
)
|
23,039
|
|
2004
|
40 Years
|
||||||||||||||||||||
|
Vail Marriott Mountain Resort & Spa
|
—
|
|
5,800
|
|
52,463
|
|
17,335
|
|
5,800
|
|
69,798
|
|
75,598
|
|
(18,695
|
)
|
56,903
|
|
2005
|
40 Years
|
||||||||||||||||||||
|
Westin Fort Lauderdale Beach Resort
|
—
|
|
54,293
|
|
83,227
|
|
8,767
|
|
54,293
|
|
91,994
|
|
146,287
|
|
(8,929
|
)
|
137,358
|
|
2014
|
40 Years
|
||||||||||||||||||||
|
Westin San Diego
|
(63,385
|
)
|
22,902
|
|
95,617
|
|
9,123
|
|
22,902
|
|
104,740
|
|
127,642
|
|
(16,454
|
)
|
111,188
|
|
2012
|
40 Years
|
||||||||||||||||||||
|
Westin Washington, D.C City Center
|
(62,734
|
)
|
24,579
|
|
122,229
|
|
11,802
|
|
24,579
|
|
134,031
|
|
158,610
|
|
(21,162
|
)
|
137,448
|
|
2012
|
40 Years
|
||||||||||||||||||||
|
Total
|
$
|
(633,764
|
)
|
$
|
616,840
|
|
$
|
2,377,317
|
|
$
|
313,852
|
|
$
|
617,695
|
|
$
|
2,690,314
|
|
$
|
3,308,009
|
|
$
|
(556,868
|
)
|
$
|
2,751,141
|
|
|
|
|||||||||||
F-
34
Notes:
A)
The change in total cost of properties for the fiscal years ended
December 31, 2018
,
2017
and
2016
is as follows (in thousands):
|
Balance at December 31, 2015
|
$
|
3,125,051
|
|
|
|
Additions:
|
|
|||
|
Acquisitions
|
—
|
|
||
|
Capital expenditures
|
61,823
|
|
||
|
Deductions:
|
|
|||
|
Dispositions and other
|
(269,240
|
)
|
||
|
Balance at December 31, 2016
|
2,917,634
|
|
||
|
Additions:
|
|
|||
|
Acquisitions
|
81,494
|
|
||
|
Capital expenditures
|
$
|
68,573
|
|
|
|
Deductions:
|
|
|||
|
Dispositions and other
|
(42,612
|
)
|
||
|
Balance at December 31, 2017
|
3,025,089
|
|
||
|
Additions:
|
|
|||
|
Acquisitions
|
221,970
|
|
||
|
Capital expenditures
|
60,950
|
|
||
|
Deductions:
|
|
|||
|
Dispositions and other
|
—
|
|
||
|
Balance at December 31, 2018
|
$
|
3,308,009
|
|
|
B)
The change in accumulated depreciation of real estate assets for the fiscal years ended
December 31, 2018
,
2017
and
2016
is as follows (in thousands):
|
Balance at December 31, 2015
|
$
|
419,309
|
|
|
|
Depreciation and amortization
|
65,490
|
|
||
|
Dispositions and other
|
(42,847
|
)
|
||
|
Balance at December 31, 2016
|
441,952
|
|
||
|
Depreciation and amortization
|
60,023
|
|
||
|
Dispositions and other
|
(9,104
|
)
|
||
|
Balance at December 31, 2017
|
492,871
|
|
||
|
Depreciation and amortization
|
63,997
|
|
||
|
Dispositions and other
|
—
|
|
||
|
Balance at December 31, 2018
|
$
|
556,868
|
|
|
C)
The aggregate cost of properties for Federal income tax purposes (in thousands) is approximately
$3,151,650
as of
December 31, 2018
.
F-
35
TABLE OF CONTENTS
Part IItem 1. BusinessItem 1A. Risk FactorsItem 1B. Unresolved Staff CommentsItem 2. PropertiesItem 3. Legal ProceedingsItem 4. Mine Safety DisclosuresPart IIItem 5. Market For Registrant's Common Equity, Related Stockholder Matters and Issuer Purchases Of Equity SecuritiesItem 6. Selected Financial DataItem 7. Management S Discussion and Analysis Of Financial Condition and Results Of OperationsItem 7A. Quantitative and Qualitative Disclosures About Market RiskItem 8. Financial Statements and Supplementary DataItem 9. Changes in and Disagreements with Accountants on Accounting and Financial DisclosureItem 9A. Controls and ProceduresItem 9B. Other InformationPart IIIItem 10. Directors, Executive Officers and Corporate GovernanceItem 11. Executive CompensationItem 12. Security Ownership Of Certain Beneficial Owners and Management and Related Stockholder MattersItem 13. Certain Relationships and Related Transactions and Director IndependenceItem 14. Principal Accounting Fees and ServicesPart IVItem 15. Exhibits and Financial Statement SchedulesItem 16. Form 10-k Summary