DISTRIBUTION SOLUTIONS GROUP, INC.
10-Ks and 10-Qs
|
|
|
|
|
|
|
|
|
|
|
|
|
|
|
|
|
|
|
|
|
|
|
|
|
|
|
|
|
|
|
|
|
|
|
|
|
|
|
|
|
|
|
|
|
|
|
|
|
|
|
|
|
|
|
|
|
|
|
|
|
|
UNITED STATES SECURITIES AND EXCHANGE COMMISSION
Washington, D.C. 20549
Form 10-K
|
(Mark One)
|
|
|
þ
|
ANNUAL REPORT PURSUANT TO SECTION 13 OR 15(d) OF THE SECURITIES EXCHANGE ACT OF 1934
|
|
For the fiscal year ended December 31, 2012
|
|
|
or
|
|
|
o
|
TRANSITION REPORT PURSUANT TO SECTION 13 OR 15(d) OF THE SECURITIES EXCHANGE ACT OF 1934
|
|
For the transition period from to
|
|
Commission file number: 0-10546
 LAWSON PRODUCTS, INC.
(Exact Name of Registrant as Specified in Charter)
|
Delaware
|
36-2229304
|
|
|
(State or other jurisdiction of
|
(I.R.S. Employer
|
|
|
incorporation or organization)
|
Identification No.)
|
|
8770 W. Bryn Mawr, Chicago, Illinois 60631
(Address of principal executive offices)
Registrant’s telephone number, including area code:
(773) 304-5050
Securities registered pursuant to Section 12(b) of the Act:
|
Title of Each Class
|
Name of Each Exchange on Which Registered
|
|
|
Common Stock, $1.00 par value
|
The NASDAQ Stock Market LLC
(NASDAQ Global Select Market)
|
|
Securities registered pursuant to Section 12(g) of the Act:
None
(Title of class)
Indicate by check mark if the registrant is a well-known seasoned issuer, as defined in Rule 405 of the Securities Act. Yes
o
No
þ
Indicate by check mark if the registrant is not required to file reports pursuant to Section 13 or Section 15(d) of the Exchange Act. Yes
o
No
þ
Indicate by check mark whether the registrant (l) has filed all reports required to be filed by section 13 or 15(d) of the Securities Exchange Act of 1934 during the preceding 12 months (or for such shorter period that the Registrant was required to file such reports), and (2) has been subject to such filing requirements for the past 90 days. Yes
þ
No
o
Indicate by check mark whether the registrant has submitted electronically and posted on its corporate Web site, if any, every Interactive Data File required to be submitted and posted pursuant to Rule 405 of Regulation S-T (§ 232.405 of this chapter) during the preceding 12 months (or for such shorter period that the registrant was required to submit and post such files). Yes
þ
No
o
Indicate by check mark if disclosure of delinquent filers pursuant to Item 405 of Regulation S-K (§ 229.405 of this chapter) is not contained herein, and will not be contained, to the best of registrant’s knowledge, in definitive proxy or information statements incorporated by reference in Part III of this Form 10-K or any amendment to this Form 10-K.
o
Indicate by check mark whether the registrant is a large accelerated filer, an accelerated filer, a non-accelerated filer, or a smaller reporting company. See the definitions of “large accelerated filer,” “accelerated filer” and “smaller reporting company” in Rule 12b-2 of the Exchange Act. (Check one)
|
Large accelerated filer
o
|
Accelerated filer
þ
|
|
Non-accelerated filer
o
(Do not check if a smaller reporting company)
|
Smaller reporting Company
o
|
Indicate by check mark whether the registrant is a shell company (as defined by Rule 12b-2 of the Exchange Act).
Yes
o
No
þ
The aggregate market value of the registrant’s voting stock held by non-affiliates on June 29, 2012 (based upon the per share closing price of $9.25) was
approximately $51,700,000.
As of January 31, 2013, 8,606,456 shares of Common Stock were outstanding.
DOCUMENTS INCORPORATED BY REFERENCE
The following documents are incorporated into this Form 10-K by reference:
Part III incorporates information by reference to the registrant’s definitive proxy statement, to be filed with the Securities and Exchange Commission within 120 days after the close of the fiscal year.
1
TABLE OF CONTENTS
|
Page #
|
||
“Safe Harbor” Statement under the Securities Litigation Reform Act of 1995:
This Annual Report on Form 10-K contains certain forward-looking statements within the meaning of the Private Securities Litigation Reform Act of 1995 that involve risks and uncertainties. The terms “may,” “should,” “could,” “anticipate,” “believe,” “continues,” “estimate,” “expect,” “intend,” “objective,” “plan,” “potential,” “project” and similar expressions are intended to identify forward-looking statements. These statements are not guarantees of future performance and involve risks, uncertainties and assumptions that are difficult to predict. These statements are based on management’s current expectations, intentions or beliefs and are subject to a number of factors, assumptions and uncertainties that could cause actual results to differ materially from those described in the forward-looking statements. Factors that could cause or contribute to such differences or that might otherwise impact the business include the risk factors set forth in Item 1A of this Form 10-K.
The Company undertakes no obligation to update any such factor or to publicly announce the results of any revisions to any forward-looking statements contained herein whether as a result of new information, future events or otherwise.
2
Overview
Lawson Products, Inc. (“Lawson”, the “Company”, “we”, “our”, or “us”) was incorporated in Illinois in 1952, and reincorporated in Delaware in 1982. Lawson is a North American distributor of products and services to the industrial, commercial, institutional, and governmental maintenance, repair and operations (“MRO”) marketplace and also manufactures and distributes production and specialized component parts to the original equipment manufacturers (“OEM”) marketplace.
Industry and Competition
The MRO industrial distribution industry consists of companies that buy and stock products in bulk and supply these products to customers on an as needed basis. The customer benefits from lower costs and convenience of ordering smaller quantities maintained by MRO suppliers. We estimate that total revenue generated by the North American MRO marketplace exceeds $100 billion.
There is a significant amount of fragmentation by geography and product within the industry. We encounter competition from several national distributors and manufacturers and a large number of regional and local distributors. Some competitors have greater financial and personnel resources, handle more extensive lines of merchandise, operate larger facilities and price some merchandise more competitively than we do.
We compete for business by offering a value-added service approach to vendor managed inventory, supplying quality products to our customers and providing deep product knowledge and product application expertise. Our broad geographic sales coverage allows us to serve large multi-location customers. We also utilize a multi-channel approach to service our customers which includes sales representatives, e-commerce, and customer call centers.
Customers
Sales generated by our MRO segment represented over 94% of our net sales for the year ended December 31, 2012. During 2012, we sold products to approximately 75,000 customers and no customer accounted for more than three percent of net sales. In 2012, approximately 90% of our net sales were generated in the United States and approximately 10% from Canada. Our customers operate in a variety of industries including automotive repair, commercial vehicle maintenance, government, manufacturing, food processing, distribution, construction, oil and gas, mining, wholesale, service and others. Although seasonality is not significant in our business, due to fewer selling days during the holiday season, net sales in the fourth quarter are historically slightly lower than the first three quarters of the year.
Our customers include a wide range of purchasers of industrial supply products from small repair shops to large national and governmental accounts. Historically, we have been very effective at selling to and servicing small and medium sized customers that value our service approach.
Operations
Customers place orders primarily through our sales representatives; however, they can also order directly from our website or through our customer service team via fax or phone. We sell products in all 50 states, the District of Columbia, Canada and Puerto Rico, and export products that support U.S. military efforts in Europe. We normally ship to our customers within one to two days of order placement.
Our MRO distribution process normally entails transporting product from our suppliers to a central facility for possible repackaging, labeling or cross-docking. During 2012, we relocated this packaging function from Des Plaines, Illinois to a larger, newly constructed and custom designed packaging and distribution facility in McCook, Illinois (“McCook Facility”). Product is then shipped and stocked in strategically located distribution centers in Georgia, Illinois, Nevada, New Jersey, and Ontario where orders are picked, packed and shipped to our customers. Many factors affect the efficiency of this process including the physical design of the distribution centers, routing logistics, the number of times the product needs to be handled, transportation costs and the flexibility to meet the requirements of our customers.
3
Our engineering department provides technical support for our products and offers on-site problem solutions. They also develop and present product safety and technical training seminars tailored to meet our customers' needs. Material Safety Data Sheets are maintained electronically and are available to our customers 24 hours a day, seven days a week.
Products
Our MRO product offerings are listed on our website and in catalogs that were distributed to our customers in 2012. Our MRO products are manufactured by others, purchased in bulk and repackaged in smaller quantities for sale to our customers.
Sales percentages by broad categories of our MRO product mix in 2012 were as follows:
|
Product Category
|
Percentage
|
|
|
Fastening systems
|
22%
|
|
|
Specialty chemicals
|
16%
|
|
|
Fluid power
|
15%
|
|
|
Cutting tools and abrasives
|
15%
|
|
|
Electrical
|
11%
|
|
|
Aftermarket automotive supplies
|
6%
|
|
|
Welding and metal repair
|
4%
|
|
|
Safety
|
4%
|
|
|
Other
|
7%
|
|
|
100%
|
||
We offer approximately 450,000 different products for sale of which approximately 50,000 products are maintained in inventory. We strive to carry sufficient inventory to ensure product availability and rapid processing of customer orders. Accurate forecasting of customer demand is essential to establish the proper level of inventory for each product. Inventory levels need to be sufficient to meet customer demand while avoiding the costs of stocking excess items.
During 2012, we purchased products from over 1,000 suppliers and no single supplier accounted for more than ten percent of our purchases. However, the loss of one of our core suppliers could affect our operations by hindering our ability to provide full service to our customers.
We actively participate in the design and development of products with our suppliers. Technology has helped us to develop new items that are application specific. We review applications and recommend alternative products that may be beneficial to our customers. Our quality control department tests our product offerings to ensure they meet our specifications. We also conduct failure analysis and recommend solutions to help customers maximize product performance and avoid costly product failures.
Sales Team
Our sales team of approximately 770 individuals is primarily organized into geographical regions. The performance of each region is the responsibility of a Regional Sales Manager. Each region is further divided into geographically defined districts. The performance of each district is the responsibility of a District Sales Manager who reports to the Regional Sales Manager. Our District Sales Managers concentrate their efforts on driving sales within their district and working with our sales team to develop new and existing customers. We also have a team dedicated to acquiring larger national accounts and a team dedicated to serving our governmental accounts. The national accounts are comprised of multi-location customers with a national scope. We have also assigned employees to concentrate solely on new mid-market accounts.
Historically our sales team consisted primarily of independent sales agents. During 2012, we developed the plans to transition our sales team to an employee based model in the U.S. Effective January 1, 2013 all of our U.S. based sales representatives are employees of the Company. Our sales representatives will benefit from being allowed to participate in the benefit programs offered to our employees and we believe our customers will benefit from a more consistent level of service. We
believe we will benefit from the employee sales model with an increase in productivity attained by having greater control over working hours, the frequency of sales calls, the products that are promoted, the prices that are charged and the sales methods that are used.
4
Our sales team receives education in the best uses of our products, enabling them to provide customized solutions to address our customers' needs. The sales team offers our customers technical expertise and on-site problem resolution. This includes on-site visits to help manage customer inventories, introducing cost saving ideas to improve our customers' profitability and regularly analyzing and replenishing inventory to prevent unnecessary purchases and unplanned downtime. The sales team also periodically provides product demonstrations to our customers that are designed to show how our products can improve their productivity. Additionally, we offer customized storage systems and software applications to our customers for improved organization and a more efficient work-flow.
Employees
Our organization supports a culture of continuous improvement, driving results and emphasizes the importance of addressing the needs of our customers. We encourage our employees to be results driven, team oriented, progressive and focused on the future. We require our employees to act with integrity in every aspect of our business.
As of January 1, 2013, following the conversion of our U.S. independent sales agents to Company employees, our workforce included approximately 1,550 employees, comprised of approximately 1,060 in sales and marketing, approximately 380 in operations and distribution and approximately 110 in management and administration. Approximately 8% of our workforce is covered by four collective bargaining agreements. We believe that our relations with our employees and their collective bargaining organizations are good.
Non-Core Businesses
Our non-core operations have provided minimal synergistic value and operated at lower margins than the core MRO business. In 2010, we sold substantially all of the assets of two of our non-core business units, Assembly Component Systems, Inc. and Rutland Tool & Supply Company, Inc. Currently our only non-core operating subsidiary is Automatic Screw Machine Products Company (“ASMP”), which is based in Decatur, Alabama and manufactures and distributes components, fasteners, and fittings for use by OEM customers that are specific to their production needs. ASMP accounted for approximately 6% of our net sales for 2012. We continue to evaluate the strategic options available to us regarding ASMP.
Vision
Our vision is to be our customers' first choice for maintenance, repair and operational solutions that improve their operating performance. We plan to achieve our vision by working closely with our customers to maintain and enhance their operations through products, high in-person services and innovative solutions. Over the past few years we have concentrated on three major initiatives to strengthen our business; (i) replace our legacy information systems with a new comprehensive Enterprise Resource Planning (“ERP”) system, (ii) optimize our distribution network and (iii) transform our sales channels. Over the past year we made significant progress toward these goals.
During 2011, we implemented a new ERP system that was critical to providing the platform that we will use to support a number of our initiatives going forward including the launch of a newly redesigned website, instant access to product pricing and availability, more efficient inventory management, reduced order fulfillment time and improved tools to make critical business decisions.
During 2012 we made great progress in optimizing our network operations. We substantially completed construction of the new leased state-of-the-art McCook Facility. In addition, we completed the sale of four Illinois facilities in anticipation of consolidating their operations in the McCook Facility. By year end, we had successfully transitioned the packaging operations previously performed at our former Des Plaines, Illinois facility and the distribution operations previously conducted at our Vernon Hills, Illinois facility to the McCook Facility. In 2013 we will complete the transition of our Addison, Illinois distribution center to McCook.
Also in 2012, we made significant progress in transforming our sales processes as the vast majority of our U.S. independent sales agents agreed to join the Company as employees. This change will allow us greater control over the management of our sales processes and enable us to conduct more intense sales-product training. We also redesigned our website and officially launched the new website in the first quarter of 2013.
In 2013 we plan to build on our 2012 successes to grow sales, enhance our customers' experience, improve our distribution network operations and improve product management.
5
Sales and Customer Service
In order to continue our goal to provide superior service and value to our customers, in 2013 we will focus on the following initiatives:
Increase our sales force
During the past several years we have made a number of changes in our sales team. We have transitioned from an independent agent model to an employee sales team in the U.S., increased our emphasis on productivity per sales representative and increased our direction and guidance over how our sales representatives interact with our customer base. Due to these changes, we experienced a decline in the number of active sales representatives to approximately 770 at the end of 2012, from 890 and 1,120 at the end of 2011 and 2010, respectively. Although we have realized a significant increase in productivity per sales representative, we have experienced a decline in total sales due to the increase in the number of vacant sales territories. Our focus in 2013 is to increase the size of our sales team with talented, productive and well-trained sales representatives in order to increase the number of sales territories we cover and to increase the penetration of sales in our existing territories.
Fully launch our newly redesigned website
We have redesigned our website so that it will allow for new and existing customers to easily perform product searches, immediately obtain pricing and place direct orders through the internet. The website has been designed to improve cross-selling and up-selling activity, as well as enhance our visibility to customers when our sales team is not on-site with the customer. The new website was formally launched in the first quarter of 2013. In 2013, we will concentrate on increasing customer awareness of the integrated features of the website and the benefits it can bring to the ordering process.
Increase the customer experience through technology
During 2013, we plan to implement a new order entry system that will facilitate the ease with which our sales representatives can access product information and place orders on a real time basis. We also encourage consistent use of hand held devices by our sales representatives to assist them in communicating with customers. We continue to develop on-line tools and dashboards for use by our sales managers to quickly identify potential trends and opportunities in their sales territories.
Distribution Network Operations
The goal of our distribution network initiatives is to improve customer service, increase speed of delivery, lower operating expenses and improve working capital investment. Specifically, we plan to concentrate on the following areas in 2013:
Complete the transition of distribution operations to our McCook Facility
During the first half of 2013 we plan to complete the transition of the operations currently performed at our Addison, Illinois distribution center to our newly opened packaging and distribution center in McCook, Illinois. As the McCook Facility becomes fully operational, we believe we will begin to realize further efficiencies in our supply chain operations. The consolidation of operations in the new distribution facility is intended to enhance customer service through reductions in order delivery times, increase order fulfillment rates and provide a foundation to improve inventory productivity. The facility's close proximity to a major freight hub will provide us more time to process orders and expand our next-day delivery capability.
Historically, we distributed product to our distribution centers using a strategy whereby we would receive product in bulk at our packaging facility and then, due to the limited warehousing space at the packaging center, push the inventory out to the distribution centers. Using this process it was difficult to optimize the amount of product held at each distribution center. The additional warehouse space provided by our McCook Facility will allow us to stock more product in one central location. We will then pull the appropriate quantity of product based on customer demand from the McCook Facility.
Improve service levels
In 2013 we plan to pursue several strategies to improve the efficiency of our product delivery and reduce cycle times. We will continue to concentrate on minimizing backorders and increasing the completeness of customer order fulfillment while
6
also increasing network customer service levels. We plan to accomplish this through critical analysis of our operations using the upgraded technology and logistics capabilities available at the McCook Facility.
Product Management
Pricing
We are continuing to develop and implement a market-based pricing structure that better reflects the value of our products and services to our customers. This market-based approach should promote increasing penetration of our existing customers and attract new accounts at more competitive pricing levels. We are also refining our private label offerings with tiered pricing which allows our sales representatives to select the appropriate tier based on specific customer needs. The combination of private label and national brand products is designed to better position us to meet the needs of a larger, more diverse customer base that we believe provides future growth opportunity.
Sourcing
We continue to review our sourcing process to identify vendor partners to support our supply chain. We are also developing a new standardized supplier negotiation process. This process is expected to maximize our purchasing power with our vendors while at the same time establish minimum performance levels. While we have historically purchased the vast majority of our products from U.S. based vendors, we plan to pursue off-shore partnerships as appropriate.
Available Information
We file or furnish annual reports on Form 10-K, quarterly reports on Form 10-Q, current reports on Form 8-K and file or furnish amendments to those reports pursuant to Section 13(a) or 15(d) of the Exchange Act and Section 16 reports with the Securities and Exchange Commission (“SEC”). The public can obtain copies of these materials by visiting the SEC's Public Reference Room at 100 F Street, NE, Washington DC 20549 or by accessing the SEC's website at http://www.sec.gov. The public may obtain information on the operation of the SEC's Public Reference Room by calling (800) SEC-0330. In addition, as soon as reasonably practicable after such materials are filed with or furnished to the SEC, we make copies available to the public free of charge through our website at
www.lawsonproducts.com.
Information on our website is not incorporated by reference into this report. We also make available, on our website, the charters of the committees of our Board of Directors, our Code of Business Conduct and our Corporate Governance Principles.
7
Executive Officers of the Registrant
The executive officers of Lawson as of January 31, 2013 were as follows.
|
Name
|
Age
|
Year First Elected to Present Office
|
Position
|
|||
|
Michael G. DeCata
|
55
|
2012
|
President and Chief Executive Officer
|
|||
|
Neil E. Jenkins
|
63
|
2004
|
Executive Vice President, Secretary and General Counsel
|
|||
|
Ronald J. Knutson
|
49
|
2012
|
Executive Vice President, Chief Financial Officer
|
|||
|
Robert O. Border
|
49
|
2010
|
Senior Vice President, Chief Information Officer
|
|||
|
Shon R. Libby
|
43
|
2012
|
Senior Vice President, Sales and Marketing
|
|||
|
Shane T. McCarthy
|
44
|
2012
|
Senior Vice President, Operations
|
|||
|
Michael R. Tuvell
|
41
|
2012
|
Senior Vice President, Finance; Treasurer and Controller
|
|||
|
Christian D. Wiltrout
|
39
|
2012
|
Senior Vice President, Supply Chain and Planning
|
|||
Biographical information for the past five years relating to each of our executive officers is set forth below.
Mr. DeCata
was elected President and Chief Executive Officer in September 2012. Mr. DeCata previously served in a consulting capacity for several Private Equity Firms including Hamilton Robinson Capital Partners from 2009 until 2012. Mr. DeCata served as President of The Chefs Warehouse from 2006 until 2009. Prior to 2006, Mr. DeCata held several senior level positions with WW. Grainger, United Rentals and General Electric. Mr. DeCata has served on the Board of Directors of Crescent Electric Supply Company since 2008.
Mr. Jenkins
was elected Executive Vice President, Secretary and General Counsel in 2004.
Mr. Knutson
was elected Executive Vice President, Chief Financial Officer effective July 2012 and joined the Company as Senior Vice President, Chief Financial Officer effective November 2009. Mr. Knutson served as Senior Vice President, Chief Financial Officer of Frozen Food Express Industries, Inc. from January 2009 to November 2009. Mr. Knutson served as Vice President, Finance of Ace Hardware Corporation from 2006 through 2007.
Mr. Border
was elected Senior Vice President, Chief Information Officer in December 2010 and served as Senior Vice President, Information Technology from September 2009 to December 2010. Previously, Mr. Border served as the Managing Director, Information Technology at Midwest Generation, a subsidiary of Edison Mission Energy, from 2004 until 2009.
Mr. Libby
was elected Senior Vice President, Sales and Marketing effective July 2012. Mr. Libby served as Vice President, Strategic Accounts and Segment Sales from December 2008 to July 2012. Previously, Mr. Libby served as Market Vice President Sales for Corporate Express from 2000 to 2008.
Mr. McCarthy
was elected Senior Vice President, Operations in July of 2012 and previously had served as Vice President of Distribution and Logistics from April 2008 to June 2012. Previously Mr. McCarthy served as Vice President of Warehouse Distribution at Cardinal Health from 2006 until 2008.
Mr. Tuvell
was elected Senior Vice President, Finance; Treasurer and Controller in July 2012 and served as Vice President, Finance from March 2008 to June 2012. Previously, Mr. Tuvell served as Associate Vice President, Finance at ARAMARK Corporation from 2006 until 2008.
Mr. Wiltrout
was elected Senior Vice President, Supply Chain and Planning in July 2012 and served as Vice President, Product Management and Marketing from 2008 to 2012. Previously, Mr. Wiltrout served as Vice President, Product Strategy and Services for Hagemeyer North America from 2005 to 2008.
8
In addition to the other information in this Annual Report on Form 10-K for the fiscal year ended December 31, 2012, the following factors should be considered in evaluating Lawson's business. Our operating results depend upon many factors and are subject to various risks and uncertainties. The material risks and uncertainties known to us and described below may negatively affect our business operations or affect our financial results. Additional risks and uncertainties not presently known to us or that we currently deem immaterial may also impair our business operations or affect our financial results.
Our results of operations may be adversely impacted by a downturn in the economy.
Any decline or uncertainty in the strength of the economy may lead to a decrease in customer spending and may cause certain customers to cancel or delay placing orders. Some of our customers may file for bankruptcy protection, preventing us from collecting on accounts receivable and may result in our stocking excess inventory. Contractions in the credit markets may also cause some of our customers to experience difficulties in obtaining financing, leading to lower sales, delays in the collection of receivables and result in an increase in bad debt expense.
Adverse economic conditions could also affect our key suppliers and contractors. This could lead to us incurring additional expenses or result in delays in shipping products to our customers. Economic uncertainty can make it difficult for us to accurately predict future order activity and affect our ability to effectively manage inventory levels and identify risks that may affect our business. Our ability to finance our operations by borrowing through our current credit agreement could also be at risk if the lender is unable to provide funds under the terms of the agreement due to a bankruptcy or a restructuring. There are no assurances that we would be able to establish alternative financing or obtain financing with terms similar to our present credit agreement.
The market price of our common stock may decline.
Our stock price could decrease if our financial performance is inadequate or does not meet investors' expectations, if there is deterioration in the overall market for equities, if large amounts of shares are sold in the market or if investors have concerns that our business, financial condition, results of operations and capital requirements are negatively impacted by an economic downturn.
A significant portion of our inventory may become obsolete.
Our business strategy requires us to carry a significant amount of inventory in order to meet rapid processing of customer orders. If our inventory forecasting and production planning processes result in inventory levels exceeding the levels demanded by customers or should our customers decrease their orders with us, our operating results could be adversely affected due to costs of carrying the inventory and additional inventory write-downs for excess and obsolete inventory.
Work stoppages and other disruptions at transportation centers or shipping ports may adversely affect our ability to obtain inventory and make deliveries to our customers.
Our ability to rapidly process customer orders is an integral component of our overall business strategy. Interruptions at our company operated facilities or disruptions at a major transportation center or shipping port, due to events such as severe weather, labor interruptions, natural disasters, acts of terrorism or other events, could affect both our ability to maintain core products in inventory and deliver products to our customers on a timely basis, which may in turn adversely affect our results of operations. We also face a risk of service disruptions during the transition of our Addison, Illinois operations into the new McCook Facility. In addition, severe weather conditions could adversely affect demand for our products.
Changes in our customers, product mix and pricing strategy could cause our gross margin percentage to decline in the future.
From time to time, we have experienced changes in product mix and inventory costs. When our product mix changes, there can be no assurance that we will be able to maintain our historical gross profit margins. Changes in our customers, product mix, volume of orders or the prices charged could cause our gross profit margin percentage to decline. We expect that our gross margin percentage will be under pressure in the future as we continue to increase the mix of national accounts in our customer base.
9
Increases in energy costs and the cost of raw materials used in our products could impact our cost of goods and distribution and occupancy expenses, which may result in lower operating margins.
Increases in the cost of raw materials used in our products (e.g., steel, brass) and energy costs raise the production costs of our vendors. Those vendors typically look to pass the higher costs along to us through price increases. If we are unable to fully pass these increased prices and costs through to our customers or to modify our activities, the impact would have an adverse effect on our operating profit margins.
Disruptions of our information and communication systems could adversely affect the Company.
We depend on our information and communication systems to process orders, purchase and manage inventory, maintain cost-effective operations, sell and ship products, manage accounts receivable collections and service our customers. Disruptions in the operation of information and communication systems can occur due to a variety of factors including power outages, hardware failure, programming faults and human error. Any disruption in the operation of our information and communication systems whether over a short or an extended period of time or affecting one or multiple distribution centers could have a material adverse effect on our business, financial condition and results of operations.
With the upgrade of our technological infrastructure, we are increasingly dependent on digital technology to process and record financial and operating data and communicate with our employees and business partners. Our technologies, systems, networks, and those of our business partners may become the target of cyber attacks or information security breaches that could result in the unauthorized release, misuse, loss or destruction of proprietary and other information, or other disruption of our business operations. Although to date we have not experienced any losses relating to cyber attacks, there can be no assurance that we will not suffer such losses in the future. As cyber threats continue to evolve, we may be required to expend additional resources to continue to modify or enhance our protective measures or to investigate and fix any information security vulnerabilities.
The inability of management to successfully implement major strategic initiatives, could result in significant disruptions in the Company's operations and increase our costs.
We have committed to developing and executing major strategic initiatives to strengthen our core MRO operations which we believe will significantly enhance our ability to better serve our customers and improve our business. The initiatives are expected to transform our current sales processes and optimize our supply network. In 2013, among other undertakings, we plan to transition our Addison, Illinois operations to the new McCook facility.
These initiatives require additional capital investments and resources and involve significant changes to our current operating processes. Failure to successfully implement these initiatives could result in disruptions in our operations, loss of business and increased costs.
Failure to manage changes within the organization.
Our organization is undergoing significant change including the consolidation of network operations, operating with a U.S. employee based sales model and launching a new redesigned website. These initiatives, and other changes, could impact our business model and affect the culture of our organization to emphasize continuous improvements, be results driven and focused on our end customer. Failure to manage through these changes could adversely affect our financial position and results of operations.
Failure to retain talented employees, managers and executives could negatively impact our operating results.
Our success depends on our ability to attract, develop and retain talented employees, including executives and other key managers. The loss of certain key executives and managers, or the failure to attract and develop talented new executives and managers, could have a material adverse effect on our business.
Failure to retain experienced and productive sales representatives could negatively impact our operating results.
Our MRO sales are primarily driven by sales representatives. Failure to attract and retain a sufficient number of talented, experienced and productive sales representatives could have a material adverse effect on our business, financial condition and results of operations. Our future expenses may be affected by the change in status of our U.S. independent agents to employees in 2013.
10
The Company operates in highly competitive markets.
Our marketplace, although consolidating, still includes large, fragmented industries which are highly competitive. We believe that customers and competitors may continue to consolidate over the next few years, which may make the industry even more competitive. Our competitors include companies with similar or greater market presence, name recognition, and financial, marketing, and other resources and we believe they will continue to challenge the marketplace with their product selection, financial resources, and services.
Failure to adequately fund our operating and working capital needs through cash generated from operations and cash available through our credit facility could negatively impact our ability to invest in the business and maintain our capital structure.
Our business requires investment in working capital and fixed assets. In August 2012 we entered into a new five year $40.0 million credit facility based upon eligible accounts receivable and inventory. At December 31, 2012, we had $16.1 million of borrowings on our revolving line of credit and additional borrowing availability of $18.2 million. Failure to generate sufficient cash flow from operations or to obtain working capital under our credit agreement could cause us to have insufficient funds to operate our business. Adequate funds may not be available when needed or may not be available on terms favorable to us.
Failure to meet the covenant requirements of our credit agreement could lead to higher financing costs, increased restrictions and reduce or eliminate our ability to borrow funds.
Our credit facility contains financial and other restrictive covenants. These covenants could adversely affect us by limiting our financial and operating flexibility as well as our ability to plan for and react to market conditions and to meet our capital needs. Our failure to comply with these covenants could result in events of default which, if not cured or waived, could result in us being required to repay indebtedness before its due date, and we may not have the financial resources or be able to arrange alternative financing to do so.
Changes that affect governmental and other tax-supported entities could negatively impact our sales and earnings.
A portion of our sales are derived from the United States military and other governmental and tax supported entities. These entities are largely dependent upon government budgets and require adherence to certain laws and regulations. A decrease in the levels of defense and other governmental spending or the introduction of more stringent governmental regulations and oversight could lead to reduced sales or an increase in compliance costs which would adversely affect our financial position and results of operations.
Any violation of Federal, state or local environmental protection regulations could lead to significant penalties and fines.
Our product offering includes a wide variety of industrial chemicals and other products which are subject to a multitude of Federal, state and local regulations. These environmental protection laws change frequently and affect the composition, handling, transportation, storage and disposal of the products. Failure to comply with these regulations could lead to severe penalties and fines for each violation.
Our results of operations could be affected by changes in taxation.
Our results of operations could be affected by changes in tax rates, audits by taxing authorities or changes in laws, regulations and their interpretation. Changes in applicable tax laws and regulations could also affect our ability to realize the deferred tax assets on our balance sheet, which could affect our results of operations.
We are currently the subject of an employment tax examination which could result in a negative settlement.
One of our subsidiaries, Drummond American LLC (“Drummond”) is under an employment tax examination for the years 2007 and 2008 of the long-standing treatment of its sales representatives as independent contractors. In January 2012 we received a Notice of Proposed Adjustment in the amount of $9.5 million, including penalties, from the IRS challenging Drummond's position that the sales representatives were independent contractors. Although we intend to vigorously defend our position for the treatment of the sales representatives as independent contractors, we established a liability of $1.2 million as our best estimate of the cost to resolve the matter. An unfavorable outcome of this matter could have a material adverse effect on the Company's business, financial condition and results of operation.
11
None.
In 2012, in conjunction with the construction of a new distribution center in McCook, Illinois and the relocation of our headquarters to Chicago, Illinois, we sold four properties: our former Des Plaines, Illinois headquarters and packaging facility, our Addison, Illinois distribution center; our Vernon Hills, Illinois distribution center; and a Des Plaines, Illinois administrative building. In the last half of 2012, we moved all of the packaging and distribution operations performed from our Des Plaines, Illinois and Vernon Hills, Illinois, facilities to the McCook, Illinois facility. During the first half of 2013 we plan to move all of the distribution operations performed at our Addison, Illinois facility to the McCook facility.
The following owned and leased locations are either currently used in operations or will be used in our operations in 2013:
|
Location
|
Segment
|
Function
|
Square Footage
|
Own/Lease
|
Lease Expiration
|
|||||
|
Locations to be used
|
||||||||||
|
Chicago, Illinois
|
MRO
|
Administration
|
86,300
|
Lease
|
March 2023
|
|||||
|
Fairfield, New Jersey
|
MRO
|
Distribution
|
60,000
|
Own
|
||||||
|
Independence, Ohio
|
MRO
|
Call Center
|
9,761
|
Lease
|
April 2014
|
|||||
|
McCook, Illinois
|
MRO
|
Packaging/Distribution
|
306,805
|
Lease
|
June 2022
|
|||||
|
Mississauga, Ontario Canada
|
MRO
|
Distribution
|
78,000
|
Own
|
||||||
|
Reno, Nevada
|
MRO
|
Distribution
|
244,280
|
Own
|
||||||
|
Suwanee, Georgia
|
MRO
|
Distribution
|
91,235
|
Own
|
||||||
|
Decatur, Alabama
|
OEM
|
Manufacturing
|
65,000
|
Own
|
||||||
|
Locations to be vacated
|
||||||||||
|
Addison, Illinois
|
MRO
|
Distribution
|
85,800
|
Lease
|
May 2013
(1)
|
|||||
|
Vernon Hills, Illinois
|
MRO
|
Distribution
|
107,061
|
Lease
|
May 2013
|
|||||
(1) We may extend the Addison, Illinois lease for a limited amount of time during the transition of operations to the McCook facility.
While we believe that our facilities to be used will be adequate to meet our needs, we will continue to assess the location and operation of our facilities to determine whether they meet the strategic needs of our business.
12
The Company is involved in legal actions that arise in the ordinary course of business. It is the opinion of management that the resolution of any currently pending litigation will not have a material adverse effect on the Company’s financial position or results of operations.
Employment Tax Matter
One of the Company’s subsidiaries, Drummond American LLC (“Drummond”), is under an employment tax examination for the years 2007 and 2008 of the long-standing treatment of its sales representatives as independent contractors. In January 2012 the Company received a Notice of Proposed Adjustment in the amount of
$9.5 million
, including penalties, from the IRS challenging Drummond’s position that the sales representatives were independent contractors. The Company disagreed with the IRS position and filed an administrative appeal with the IRS Appeals Office.
Although the Company intends to vigorously defend its position for the treatment of its sales representatives as independent contractors, the Company established a liability of
$1.2 million
during 2011 as its best estimate of the cost to resolve the matter with the IRS. The Company has maintained this liability throughout 2012. The notice of Proposed Adjustment was determined by applying the full statutory rates and penalties, rather than applying the reduced tax rates provided by section 3509 of the Internal Revenue Code (“IRC”). The Company believes the use of reduced tax rates is mandatory for all IRS worker classification assessments, except when the employer intentionally disregarded its employment tax obligations. Because the Company believes it fully complied with its employment tax obligations, the Company based its estimated liability at the reduced tax rates. The Company applied these reduced tax rates against only one year because any settlement resolution would likely be limited to one year as this is consistent with the IRS’s settlement practices. The Company has assessed its potential exposure of this matter for other subsidiaries and time periods and has concluded that an additional liability is not probable. No adjustment has been proposed by the IRS for any other time periods or subsidiaries of the Company.
The case has been assigned to the Chicago Appeals Office. The Company is unable to establish an estimated time frame in which the case will be resolved through the appeals process. An unfavorable outcome of this matter could have a material adverse effect on the Company's business, financial condition and results of operations.
Not applicable
13
The Company’s Common Stock is traded on the NASDAQ Global Select Market under the symbol of “LAWS.” The following table sets forth the high and low sale prices as reported on the NASDAQ Global Select Market along with cash dividends declared for each outstanding share during the last two years for the periods presented.
|
2012
|
2011
|
||||||||||||||||||||||
|
High
|
Low
|
Cash Dividends Declared per Share
|
High
|
Low
|
Cash Dividends Declared per Share
|
||||||||||||||||||
|
First Quarter
|
$
|
17.92
|
|
$
|
14.39
|
|
$
|
0.12
|
|
$
|
27.21
|
|
$
|
18.61
|
|
$
|
0.12
|
|
|||||
|
Second Quarter
|
15.45
|
|
8.38
|
|
0.12
|
|
25.25
|
|
17.85
|
|
0.12
|
|
|||||||||||
|
Third Quarter
|
10.67
|
|
5.84
|
|
—
|
|
21.27
|
|
13.26
|
|
0.12
|
|
|||||||||||
|
Fourth Quarter
|
10.32
|
|
6.34
|
|
—
|
|
17.79
|
|
13.38
|
|
0.12
|
|
|||||||||||
On January 31, 2013 the closing sales price of our common stock was
$10.98
and the number of stockholders of record was
518
.
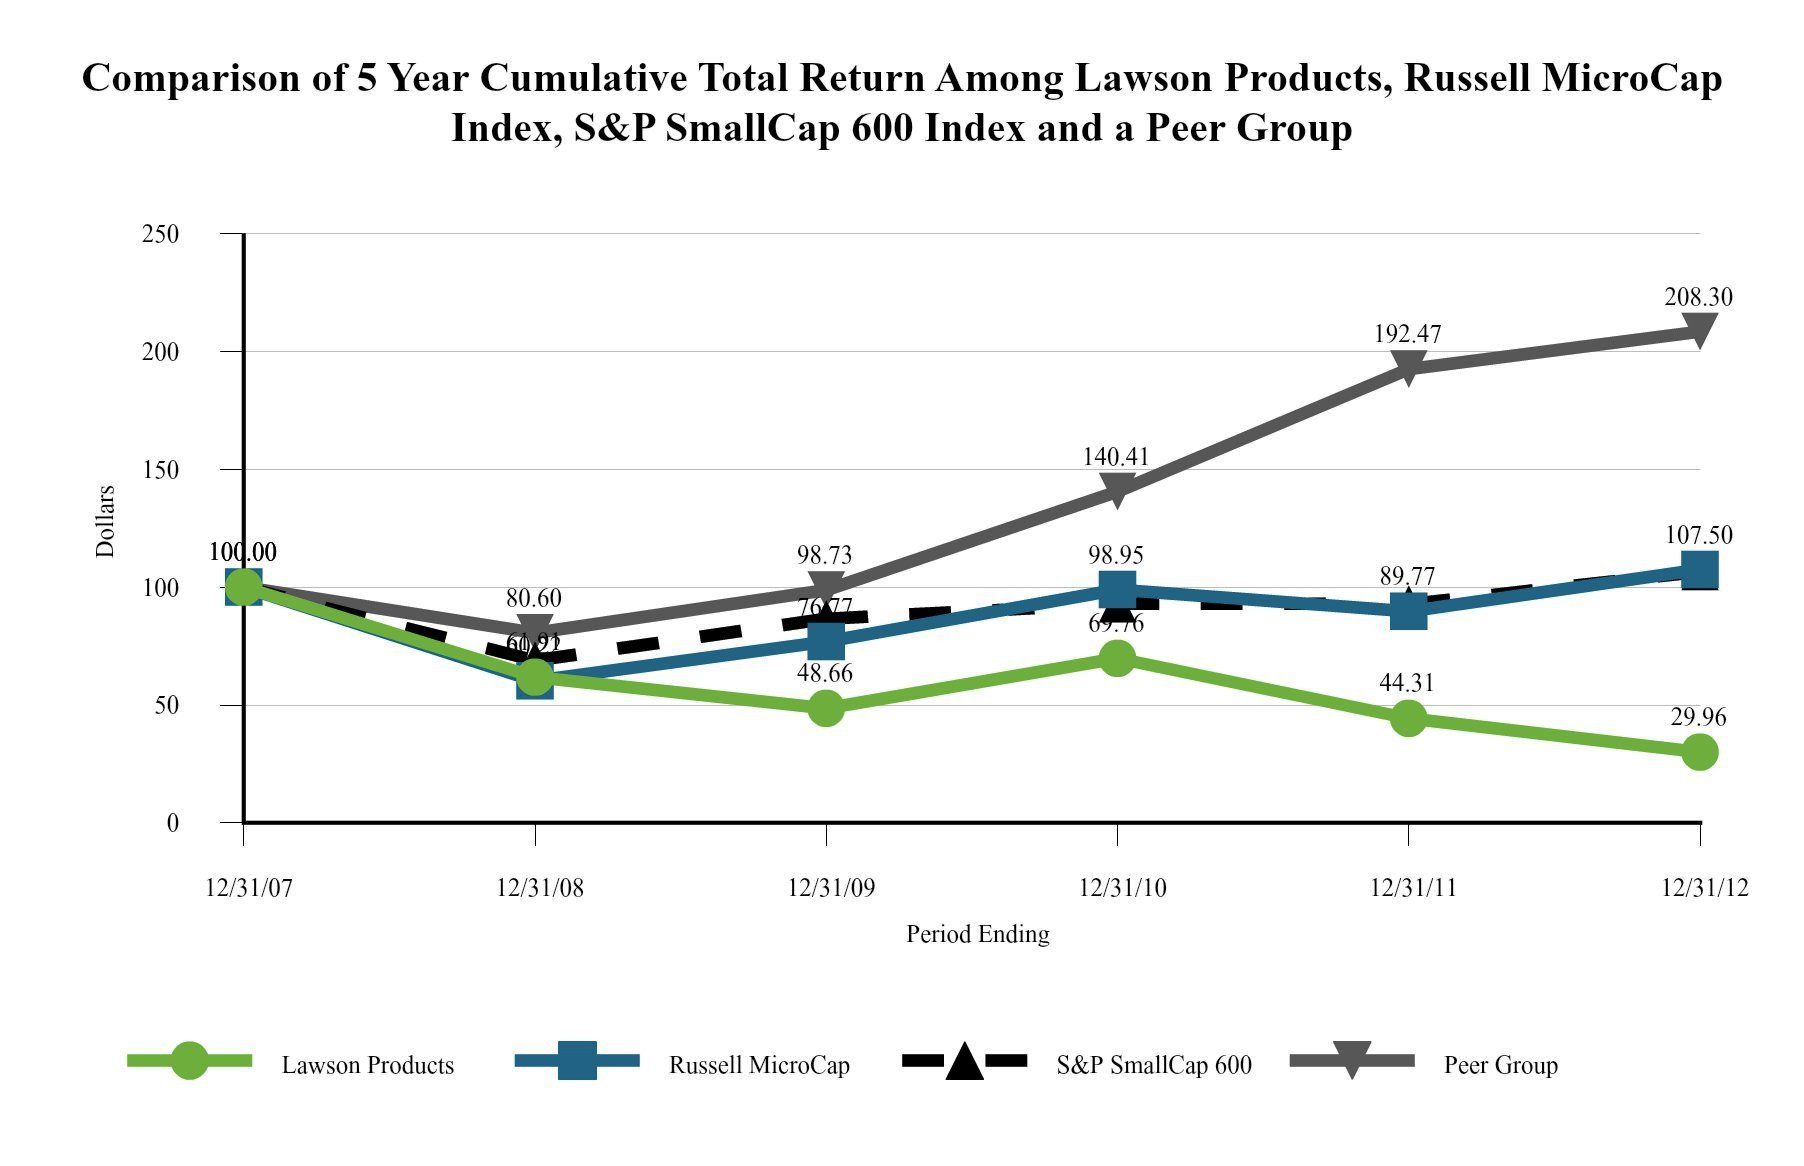
Stock Price Performance Chart
Set forth below is a line graph comparing the yearly change in the cumulative total stockholder return of the Company’s common stock against the cumulative total return of the Russell Microcap Index, S&P SmallCap 600 Index and a peer group (the “Peer Group”) of the Company for the five prior years. The Company has selected the Russell Microcap Index because Lawson is a component of the index and the market capitalization of the other member companies are similar to Lawson’s market capitalization. Previously, the Company had used the S&P SmallCap 600 Index which has been included in the chart for comparison purposes. The Peer Group consists of Barnes Group Inc., Fastenal Company, and MSC Industrial Direct. The Company believes that the Peer Group is representative of the markets it services in terms of product sales and customers. The chart below represents the hypothetical return, including reinvestment of dividends, on $100 if it was invested on December 31, 2007 in the respective stocks or index fund.
14
The following selected financial data should be read in conjunction with the Consolidated Financial Statements of the Company and Notes thereto included elsewhere in this Annual Report. The income statement data and balance sheet data are for, and as of the end of each of, the years in the five-year period ended December 31, 2012, and are derived from the audited Consolidated Financial Statements of the Company. The results of discontinued operations have been reclassified from continuing operations for all periods presented.
|
(Dollars in thousands, except per share data)
|
|||||||||||||||||||
|
2012
(1)
|
2011
(2)
|
2010
(3)
|
2009
|
2008
(4)
|
|||||||||||||||
|
Net sales
|
$
|
290,487
|
|
$
|
314,959
|
|
$
|
316,780
|
|
$
|
301,769
|
|
$
|
376,572
|
|
||||
|
Income (loss) from continuing operations
(5)
|
$
|
(62,717
|
)
|
$
|
(4,389
|
)
|
$
|
9,590
|
|
$
|
1,912
|
|
$
|
(23,679
|
)
|
||||
|
Income (loss) from discontinued operations
|
167
|
|
(235
|
)
|
(2,653
|
)
|
(4,648
|
)
|
(3,952
|
)
|
|||||||||
|
Net income (loss)
|
$
|
(62,550
|
)
|
$
|
(4,624
|
)
|
$
|
6,937
|
|
$
|
(2,736
|
)
|
$
|
(27,631
|
)
|
||||
|
Basic income (loss) per share of common stock:
|
|||||||||||||||||||
|
Continuing operations
|
$
|
(7.30
|
)
|
$
|
(0.51
|
)
|
$
|
1.13
|
|
$
|
0.22
|
|
$
|
(2.78
|
)
|
||||
|
Discontinued operations
|
0.02
|
|
(0.03
|
)
|
(0.32
|
)
|
(0.54
|
)
|
(0.46
|
)
|
|||||||||
|
Net income (loss)
|
$
|
(7.28
|
)
|
$
|
(0.54
|
)
|
$
|
0.81
|
|
$
|
(0.32
|
)
|
$
|
(3.24
|
)
|
||||
|
Diluted income (loss) per share of common stock:
|
|||||||||||||||||||
|
Continuing operations
|
$
|
(7.30
|
)
|
$
|
(0.51
|
)
|
$
|
1.12
|
|
$
|
0.22
|
|
$
|
(2.78
|
)
|
||||
|
Discontinued operations
|
0.02
|
|
(0.03
|
)
|
(0.31
|
)
|
(0.54
|
)
|
(0.46
|
)
|
|||||||||
|
Net income (loss)
|
$
|
(7.28
|
)
|
$
|
(0.54
|
)
|
$
|
0.81
|
|
$
|
(0.32
|
)
|
$
|
(3.24
|
)
|
||||
|
Cash dividends declared per share
|
$
|
0.24
|
|
$
|
0.48
|
|
$
|
0.32
|
|
$
|
0.18
|
|
$
|
0.80
|
|
||||
|
Total assets
|
$
|
172,931
|
|
$
|
222,748
|
|
$
|
236,384
|
|
$
|
241,647
|
|
$
|
271,223
|
|
||||
|
Noncurrent liabilities
|
$
|
42,370
|
|
$
|
36,697
|
|
$
|
37,968
|
|
$
|
41,761
|
|
$
|
64,139
|
|
||||
|
Stockholders’ equity
|
$
|
70,733
|
|
$
|
134,172
|
|
$
|
142,865
|
|
$
|
136,646
|
|
$
|
138,744
|
|
||||
Notes:
|
(1)
|
The 2012 results from continuing operations include a goodwill impairment charge of $28.3 million, an increase in income tax expense of
$33.3 million
due to an increase in the valuation allowance and a $3.7 million gain on the sale of assets.
|
|
(2)
|
The 2011 results from continuing operations include an impairment charge of $1.1 million relating to certain long-lived assets and a $1.2 million provision for the estimated cost of settling an employment tax matter.
|
|
(3)
|
The 2010 results from continuing operations include a $4.1 million benefit from legal settlements and a $1.7 million gain on sale of assets.
|
|
(4)
|
The 2008 results from continuing operations include a $4.0 million charge related to unclaimed property liabilities.
|
|
(5)
|
Settlement and related charges of $0.2 million and $31.7 million related to an investigation and Deferred Prosecution Agreement were recorded in 2009 and 2008, respectively.
|
15
IITEM 7.
MANAGEMENT’S DISCUSSION AND ANALYSIS OF FINANCIAL CONDITION AND RESULTS OF OPERATIONS.
OVERVIEW
Industry
The MRO business is significantly influenced by the overall strength of the manufacturing sector of the U.S. economy. One measure used to determine the strength of the industrial products market is the Purchasing Manufacturers Index ('PMI') published by the Institute for Supply Management. The PMI has declined to an average of 51.7 in 2012 compared to 55.2 in 2011 indicating a slowdown in the growth rate from a year ago. The MRO industry is highly fragmented. We compete for business with several national distributors as well as a large number of regional and local distributors.
2012 Activities
Following are some of the highlights of the Company for the year:
|
•
|
Leadership change
- Michael G. DeCata joined Lawson as president and CEO on October 1, 2012 bringing us significant MRO distribution experience. He previously served as president of Chef's Warehouse and has also held senior positions at United Rentals, WW Grainger and General Electric.
|
|
•
|
Sales Force Transformation
- We developed the plans to transition our U.S. sales team from an independent agent model to an employee based model. Effective January 1, 2013 all of our U.S. based sales representatives became employees of the Company.
|
|
•
|
Distribution Network Consolidation
- We completed the integration of the operations previously conducted at our Des Plaines and Vernon Hills, Illinois facilities into our new state-of-the-art leased facility in McCook, Illinois. During the first half of 2013 we plan to move all of the distribution operations performed at our Addison, Illinois facility to the McCook facility.
|
|
•
|
Website Redesign
- We completed the development and testing of our redesigned website. The new website was formally launched in the first quarter of 2013.
|
|
•
|
Credit facility
- We entered into a new five year $40.0 million credit facility which we intend to use to fund our future operations and business initiatives.
|
|
•
|
ERP Stabilization -
During 2012 we continued to improve and resolve issues we encountered as a result of the implementation of our ERP system in the second half of 2011 that continued to have an affect on our customer service in 2012.
|
|
•
|
Reduced Cost Structure
- We reduced our cost structure by eliminating over 100 corporate and distribution positions. We also introduced other cost-cutting measures such as a rationalization of inventory and reduction of controllable costs such as travel, marketing and net outbound freight expenses.
|
We believe the steps taken in 2012 were necessary to set the Company on a solid course for the future. We will continue to strive to be our customers' first choice for maintenance, repair and operational solutions.
16
SUMMARY OF FINANCIAL PERFORMANCE
|
(Dollars in thousands)
|
||||||||||||||||||||
|
Year Ended December 31,
|
||||||||||||||||||||
|
2012
|
2011
|
2010
|
||||||||||||||||||
|
Amount
|
% of Net Sales
|
Amount
|
% of Net Sales
|
Amount
|
% of Net Sales
|
|||||||||||||||
|
Net sales
|
||||||||||||||||||||
|
MRO
|
$
|
273,562
|
|
94.2
|
%
|
$
|
300,399
|
|
95.4
|
%
|
$
|
303,138
|
|
95.7
|
%
|
|||||
|
OEM
|
16,925
|
|
5.8
|
|
14,560
|
|
4.6
|
|
13,642
|
|
4.3
|
|
||||||||
|
Consolidated total
|
$
|
290,487
|
|
100.0
|
%
|
$
|
314,959
|
|
100.0
|
%
|
$
|
316,780
|
|
100.0
|
%
|
|||||
|
Gross profit
|
||||||||||||||||||||
|
MRO
|
$
|
157,418
|
|
57.5
|
%
|
$
|
176,872
|
|
58.9
|
%
|
$
|
192,544
|
|
63.5
|
%
|
|||||
|
OEM
|
3,764
|
|
22.2
|
|
2,905
|
|
20.0
|
|
2,282
|
|
16.7
|
|
||||||||
|
Consolidated total
|
161,182
|
|
55.5
|
|
179,777
|
|
57.1
|
|
194,826
|
|
61.5
|
|
||||||||
|
Operating expenses (benefits):
|
||||||||||||||||||||
|
Selling, general and administrative expenses
|
171,725
|
|
59.2
|
|
181,291
|
|
57.6
|
|
180,021
|
|
56.8
|
|
||||||||
|
Severance expenses
|
8,021
|
|
2.8
|
|
1,614
|
|
0.5
|
|
3,629
|
|
1.1
|
|
||||||||
|
Loss (gain) on sale of assets
|
(3,721
|
)
|
(1.3
|
)
|
22
|
|
—
|
|
(1,701
|
)
|
(0.5
|
)
|
||||||||
|
Goodwill impairment
|
28,306
|
|
9.7
|
|
—
|
|
—
|
|
—
|
|
—
|
|
||||||||
|
Other operating expenses (benefits)
|
—
|
|
—
|
|
2,346
|
|
0.7
|
|
(4,050
|
)
|
(1.3
|
)
|
||||||||
|
Total operating expenses
|
204,331
|
|
70.4
|
|
185,273
|
|
58.8
|
|
177,899
|
|
56.2
|
|
||||||||
|
Operating income (loss)
|
(43,149
|
)
|
(14.9
|
)
|
(5,496
|
)
|
(1.7
|
)
|
16,927
|
|
5.3
|
|
||||||||
|
Interest expense
|
(775
|
)
|
(0.2
|
)
|
(681
|
)
|
(0.2
|
)
|
(391
|
)
|
(0.1
|
)
|
||||||||
|
Other income (expense), net
|
(56
|
)
|
—
|
|
101
|
|
—
|
|
160
|
|
0.1
|
|
||||||||
|
Income (loss) from continuing operations before income tax expense
|
(43,980
|
)
|
(15.1
|
)
|
(6,076
|
)
|
(1.9
|
)
|
16,696
|
|
5.3
|
|
||||||||
|
Income tax (benefit) expense
|
18,737
|
|
(6.5
|
)
|
(1,687
|
)
|
(0.5
|
)
|
7,106
|
|
2.2
|
|
||||||||
|
Income (loss) from continuing operations
|
$
|
(62,717
|
)
|
(21.6
|
)%
|
$
|
(4,389
|
)
|
(1.4
|
)%
|
$
|
9,590
|
|
3.0
|
%
|
|||||
17
RESULTS OF OPERATIONS FOR 2012 AS COMPARED TO
2011
Net Sales and Gross Profit
Sales and gross profit results for the years ended December 31, 2012 and
2011
were as follows:
|
(Dollars in thousands)
|
|||||||||||
|
Year ended December 31,
|
Change
|
||||||||||
|
2012
|
2011
|
Amount
|
%
|
||||||||
|
Net sales
|
|||||||||||
|
MRO
|
273,562
|
|
300,399
|
|
(26,837
|
)
|
(8.9
|
)%
|
|||
|
OEM
|
16,925
|
|
14,560
|
|
2,365
|
|
16.2
|
|
|||
|
Consolidated
|
290,487
|
|
314,959
|
|
(24,472
|
)
|
(7.8
|
)
|
|||
|
Gross profit
|
|||||||||||
|
MRO
|
157,418
|
|
176,872
|
|
(19,454
|
)
|
(11.0
|
)%
|
|||
|
OEM
|
3,764
|
|
2,905
|
|
859
|
|
29.6
|
|
|||
|
Consolidated
|
161,182
|
|
179,777
|
|
(18,595
|
)
|
(10.3
|
)
|
|||
|
Gross profit margin
|
|||||||||||
|
MRO
|
57.5
|
%
|
58.9
|
%
|
|||||||
|
OEM
|
22.2
|
|
20.0
|
|
|||||||
|
Consolidated
|
55.5
|
|
57.1
|
|
|||||||
Net Sales
Net sales for
2012
decreased
7.8%
to
$290.5 million
from
$315.0 million
in
2011
on one additional selling day in 2012. Excluding the negative Canadian exchange rate impact of $0.4 million, net sales decreased 7.6% for the year.
MRO net sales decreased
8.9%
in
2012
to
$273.6 million
from
$300.4 million
in
2011
. Average MRO daily sales were $1.086 million in
2012
compared to $1.197 million in 2011. The majority of the
$26.8 million
decrease in MRO sales was due to a decrease in territorial sales coverage due to a 14% net decline in sales representatives during the year. The decrease in sales representatives occurred primarily in the first half of 2012 and the size of the sales force stabilized in the second half of the year. Additionally, government sales decreased $10.1 million in
2012
compared to
2011
primarily because we benefited from troop deployments in 2011. We anticipate that growth in the government segment may be limited given our past support to troop deployments which is not expected to increase in the near future.
OEM net sales increased
16.2%
in
2012
to
$16.9 million
from
$14.6 million
in
2011
, driven primarily by stronger demand from existing customers.
Gross Profit
Overall gross profit decreased
10.3%
in 2012 to
$161.2 million
from
$179.8 million
in
2011
. As a percent of sales, gross profit margin decreased to
55.5%
in 2012 compared to
57.1%
in 2011.
MRO gross profit decreased
11.0%
in
2012
to
$157.4 million
from
$176.9 million
in
2011
. As a percent of net sales, MRO gross profit margin decreased to
57.5%
in
2012
from
58.9%
in
2011
. This decrease was principally due to a net increase of $3.3 million of inventory reserves primarily as a result of discontinuing certain products, a decrease of $2.6 million in outbound freight recoveries and a shift toward higher volume national customers with lower margins. These national accounts represented approximately 12.7% of MRO sales in
2012
compared to approximately 11.2% in
2011
. We expect that our gross margin percentage will be under pressure in the future as we continue to increase the mix of national accounts in our customer base as well as continued competitive pressures. During 2013, we do not anticipate that our decision to discontinue certain inventoried products in the second quarter of 2012, will have a material negative impact on our sales or gross margins as the majority of these products will either have suitable substitute items available or be offered on a drop-ship basis with similar pricing to our customers.
18
OEM gross profit increased
$0.9 million
in
2012
to
$3.8 million
from
$2.9 million
in
2011
. Gross profit as a percent of net sales increased to
22.2%
in
2012
from
20.0%
in
2011
, primarily driven by leverage gained from a higher sales volume from existing customers.
Selling, General and Administrative Expenses
SG&A expenses for the years ended December 31, 2012 and
2011
were as follows:
|
(Dollars in thousands)
|
||||||||||||||
|
Year ended December 31,
|
Change
|
|||||||||||||
|
2012
|
2011
|
Amount
|
%
|
|||||||||||
|
Selling expenses
|
$
|
80,389
|
|
$
|
86,520
|
|
$
|
(6,131
|
)
|
(7.1
|
)%
|
|||
|
General and administrative
|
91,336
|
|
94,771
|
|
(3,435
|
)
|
(3.6
|
)
|
||||||
|
Total SG&A
|
$
|
171,725
|
|
$
|
181,291
|
|
$
|
(9,566
|
)
|
(5.3
|
)
|
|||
Total SG&A expenses were
$171.7 million
or
59.2%
of net sales and
$181.3 million
or
57.6%
of net sales in
2012
and
2011
, respectively.
Selling Expenses
Selling expenses consist of commissions paid to our sales representatives and related expenses to support our sales efforts. Selling expenses decreased to
$80.4 million
in
2012
from
$86.5 million
in
2011
due primarily to implementing cost control measures across the organization and lower sales. Selling expenses increased as a percent of sales to
27.7%
in
2012
from
27.5%
in
2011
primarily due to the impact of fixed selling costs on the decreased sales levels.
General and Administrative Expenses
General and administrative expenses consist of expenses to operate our distribution network and overhead expenses to manage the business. General and administrative expenses decreased
$3.4 million
or
3.6%
primarily due to $5.0 million less ERP related expenses in 2012 compared to 2011 and $4.2 million of reduced compensation costs driven primarily by a cost reduction strategy implemented in 2012. The cost reduction strategy included a reduction in our work force of approximately 130 individuals. These savings were partially offset by an increase in depreciation and facility costs of $2.5 million, $2.2 million of consulting fees related to our turnaround strategy, $0.5 million related to the move into our new distribution center and headquarters and $0.8 million related to other expense to support the business.
Severance Expenses
Severance expenses were
$8.0 million
in
2012
compared to
$1.6 million
in
2011
. The severance charge recorded in 2012 consisted primarily of $6.5 million related to the elimination of corporate and distribution positions, primarily as a result of a strategic restructuring plan designed to reduce our cost structure and $1.3 million related to the retirement of our former President and Chief Executive Officer.
Goodwill Impairment
During 2012, we identified indicators of potential goodwill impairment, specifically, the operating losses incurred in our MRO segment and a reduction in our market capitalization below book value. Therefore, we performed an impairment analysis of the goodwill related to our MRO segment. Based on this analysis, we determined that the full amount of the goodwill was impaired and recorded a non-cash charge of
$28.3 million
.
Gain on Sale of Assets
In 2012, in conjunction with the construction of a new distribution center in McCook, Illinois and the relocation of our headquarters to Chicago, Illinois, we sold four properties: our former Des Plaines, Illinois headquarters and packaging facility,
19
our Addison, Illinois distribution center; our Vernon Hills, Illinois distribution center; and a Des Plaines, Illinois administrative building. We received cash proceeds of
$12.3 million
from the sale of the four facilities which resulted in a gain of
$3.7 million
.
Other Operating Expenses
In 2011, the Company recorded a $1.2 million expense for the estimated cost of settling an employment tax matter related to the classification of the sales representatives of one of the Company’s subsidiaries as independent contractors. Also in 2011, we recorded an impairment charge of $1.1 million related to certain long-term assets of our OEM segment. No such charges were incurred in 2012.
Interest Expense
Interest expense increased to
$0.8 million
in
2012
from
$0.7 million
in
2011
. The 2012 expense was primarily due to borrowings on our revolving line of credit while the 2011 interest expense was primarily comprised of interest assessed on unclaimed property settlements.
Income Tax Expense
In
2012
, we recorded income tax expense of
$18.7 million
on a pre-tax loss of
$44.0 million
. Primarily due to the cumulative losses that we recorded over the past several periods, we determined that it was more likely than not that we will not be able to utilize our deferred tax assets to offset future taxable income. Therefore, we increased our deferred tax valuation allowance by
$33.3 million
. Exclusive of the effect of the increase in the tax valuation allowance, the effective income tax rate would have been
33.2%
.
The
2011
, income tax benefit was
$1.7 million
on pre-tax loss of
$6.1 million
, resulting in an effective tax rate of
27.8%
.
Operating Income (Loss)
Operating income (loss) in 2012 was significantly impacted in the second quarter by the charges incurred related to our restructuring. The following represents our quarterly results for 2012:
|
(Dollars in thousands)
|
|||||||||||||||
|
2012 Quarter Ended
|
|||||||||||||||
|
Dec. 31
|
Sep. 30
|
Jun. 30
|
Mar. 31
|
||||||||||||
|
Net sales
|
$
|
68,193
|
|
$
|
71,984
|
|
$
|
74,348
|
|
$
|
75,962
|
|
|||
|
Gross profit (1)
|
39,672
|
|
43,360
|
|
36,816
|
|
41,334
|
|
|||||||
|
Gross profit percentage
|
58.2
|
%
|
60.2
|
%
|
49.5
|
%
|
54.4
|
%
|
|||||||
|
Operating expenses:
|
|||||||||||||||
|
Selling, general & administrative expenses
|
$
|
38,948
|
|
$
|
43,311
|
|
$
|
45,484
|
|
$
|
43,982
|
|
|||
|
Severance expense (benefit)
|
(159
|
)
|
1,410
|
|
6,585
|
|
185
|
|
|||||||
|
Gain on sale of assets
|
(1,588
|
)
|
(11
|
)
|
(2,122
|
)
|
—
|
|
|||||||
|
Goodwill impairment
|
—
|
|
—
|
|
28,306
|
|
—
|
|
|||||||
|
Total operating expenses
|
$
|
37,201
|
|
$
|
44,710
|
|
$
|
78,253
|
|
$
|
44,167
|
|
|||
|
Operating income (loss)
|
$
|
2,471
|
|
$
|
(1,350
|
)
|
$
|
(41,437
|
)
|
$
|
(2,833
|
)
|
|||
|
(
1)
|
Gross profit for the three months ended June 30, 2012 includes a $3.9 million charge for discontinuing certain stocked products.
|
20
RESULTS OF OPERATIONS FOR 2011 AS COMPARED TO 2010
Net Sales and Gross Profit
Sales and gross profit results for the years ended December 31, 2011 and
2010
were as follows:
|
(Dollars in thousands)
|
||||||||||||||
|
Year ended December 31,
|
Change
|
|||||||||||||
|
2011
|
2010
|
Amount
|
%
|
|||||||||||
|
Net sales
|
||||||||||||||
|
MRO
|
$
|
300,399
|
|
$
|
303,138
|
|
$
|
(2,739
|
)
|
(0.9
|
)%
|
|||
|
OEM
|
14,560
|
|
13,642
|
|
918
|
|
6.7
|
%
|
||||||
|
Consolidated
|
$
|
314,959
|
|
$
|
316,780
|
|
$
|
(1,821
|
)
|
(0.6
|
)%
|
|||
|
Gross profit
|
||||||||||||||
|
MRO
|
$
|
176,872
|
|
$
|
192,544
|
|
$
|
(15,672
|
)
|
(8.1
|
)%
|
|||
|
OEM
|
2,905
|
|
2,282
|
|
623
|
|
27.3
|
%
|
||||||
|
Consolidated
|
$
|
179,777
|
|
$
|
194,826
|
|
$
|
(15,049
|
)
|
(7.7
|
)%
|
|||
|
Gross profit margin
|
||||||||||||||
|
MRO
|
58.9
|
%
|
63.5
|
%
|
||||||||||
|
OEM
|
20.0
|
%
|
16.7
|
%
|
||||||||||
|
Consolidated
|
57.1
|
%
|
61.5
|
%
|
||||||||||
Net sales for 2011 decreased
0.6%
to
$315.0 million
from
$316.8 million
in
2010
on one less selling day. Excluding the Canadian exchange rate impact, net sales decreased 1.0% for the year. MRO net sales decreased
$2.7 million
or
0.9%
in 2011 to
$300.4 million
from
$303.1 million
in
2010
. The decrease was largely due to certain challenges we encountered following the launch of our ERP system which caused delays in our supply chain and fulfillment processes leading to a build-up of backorders and lost sales in the second half of the year. For the year, average MRO daily sales were $1.197 million in 2011 compared to $1.203 million in 2010. In the first half of 2011, prior to the ERP launch our average MRO daily sales were $1.259 million, up 7.5% over 2010 levels.
OEM net sales increased $0.9 million or 6.7% in 2011 to $14.6 million from $13.6 million in 2010.
Overall gross profit decreased 7.7% in 2011 to $179.8 million from $194.8 million in 2010. As a percent of sales, gross profit margin decreased to 57.1% in 2011 compared to 61.5% in 2010. MRO gross profit decreased 8.1% in 2011 to $176.9 million from $192.5 million in 2010. As a percent of net sales, MRO gross profit margin decreased to 58.9% in 2011 from 63.5% in 2010. This decline was driven by four main factors: (1) increased vendor costs were not passed along to our customers as we held pricing constant to facilitate our ERP implementation; (2) outbound freight costs increased as we shipped more single line orders to support our customers following the ERP conversion; (3) increased labor costs associated with the packaging of inventory; and (4) a strategic decision to pursue larger customers with lower margins, which is expected to increase retention and allow for dollar margin expansion over time. We also encountered a deterioration of MRO gross margins subsequent to our ERP conversion. MRO gross margins for the first, second, third and fourth quarters of 2011 were 62.2%, 59.1%, 58.4% and 55.3 %, respectively.
OEM gross profit increased $0.6 million in 2011 to $2.9 million from $2.3 million in 2010. Gross profit as a percent of net sales increased to 20.0% in 2011 from 16.7% in 2010, primarily due to a shift in sales toward higher margin customers.
21
Selling, General and Administrative Expenses
SG&A expenses for the years ended December 31, 2011 and 2010 were as follows:
|
(Dollars in thousands)
|
||||||||||||||
|
Year ended December 31,
|
Change
|
|||||||||||||
|
2011
|
2010
|
Amount
|
%
|
|||||||||||
|
Selling expenses
|
86,520
|
|
$
|
88,240
|
|
$
|
(1,720
|
)
|
(1.9
|
)%
|
||||
|
General and administrative
|
94,771
|
|
91,781
|
|
2,990
|
|
3.3
|
|
||||||
|
Total SG&A
|
$
|
181,291
|
|
$
|
180,021
|
|
$
|
1,270
|
|
0.7
|
|
|||
Total SG&A expenses were
$181.3 million
or
57.6%
of net sales and
$180.0 million
or
56.8%
of net sales in
2011
and 2010, respectively.
Selling Expenses
Selling expenses decreased to
$86.5 million
in
2011
from
$88.2 million
in 2010 and decreased as a percent of sales to
27.5%
in 2011 from
27.9%
in 2010, reflecting lower health insurance costs and a shift in our customer mix to larger strategic accounts which tend to result in lower commissions.
General and Administrative Expenses
General and administrative expenses increased
$3.0 million
or
3.3%
. An increase in ERP implementation costs of $3.2 million primarily drove the increase. Additionally, we incurred higher temporary labor, consulting and overtime costs in the second half of the year to address the increase in the number of customer service calls and to reduce backorder levels following the launch of our ERP system. These higher operating costs were partially offset by lower incentive compensation expenses due to our operating performance and decline of our stock price.
Severance Expenses
Severance expenses were
$1.6 million
in
2011
compared to
$3.6 million
in 2010. Severance included the restructuring of some of our managerial responsibilities resulting in the elimination of certain positions within both the sales and corporate teams.
Gain on Sale of Assets
In 2010, we sold our previously discontinued Dallas, Texas distribution center for $2.0 million, resulting in a gain of $1.7 million.
Other Operating Expenses (Income)
In 2011, the Company recorded a $1.2 million expense for the estimated cost of settling an employment tax matter related to the classification of the sales representatives of one of the Company’s subsidiaries as independent contractors. Also in 2011, we recorded an impairment charge of $1.1 million related to certain long-term assets of our OEM segment.
In 2010, we recorded a $4.1 million benefit related to proceeds received from a settlement of litigation.
Interest Expense
Interest expense increased $0.3 million to $0.7 million in 2011 from $0.4 million in 2010, primarily due to interest assessed on unclaimed property settlements in 2011.
Other Income
Other income was relatively unchanged at $0.1 million in 2011 compared to $0.2 million in 2010.
22
Income Tax Expense
The effective tax rates for continuing operations for
2011
and 2010 were 27.8% and 42.6%, respectively. The 2011 tax rate decreased from 2010 primarily due to the effect of permanent tax differences on pre-tax operating loss reported in 2011 compared to pre-tax operating income reported in 2010.
Operating Income (Loss)
Operating income (loss) in 2011 was significantly impacted in the second half of the year by the implementation of our ERP system, reflected in lower sales and lower gross margins and higher operating expenses as a percent of sales. The following represents our quarterly results for 2011:
|
(Dollars in thousands)
|
|||||||||||||||
|
2011 Quarter Ended
|
|||||||||||||||
|
Dec. 31
|
Sep. 30
|
Jun. 30
|
Mar. 31
|
||||||||||||
|
Net sales
|
$
|
72,860
|
|
$
|
75,366
|
|
$
|
84,154
|
|
$
|
82,579
|
|
|||
|
Gross profit
|
38,993
|
|
42,546
|
|
48,299
|
|
49,939
|
|
|||||||
|
Gross profit percentage
|
53.5
|
%
|
56.5
|
%
|
57.4
|
%
|
60.5
|
%
|
|||||||
|
Operating expenses:
|
|||||||||||||||
|
Selling, general & administrative expenses
|
$
|
44,265
|
|
$
|
45,335
|
|
$
|
46,242
|
|
$
|
45,449
|
|
|||
|
Severance expense
|
122
|
|
282
|
|
465
|
|
745
|
|
|||||||
|
Loss on sale of assets
|
22
|
|
—
|
|
—
|
|
—
|
|
|||||||
|
Other operating expenses
|
2,346
|
|
—
|
|
—
|
|
—
|
|
|||||||
|
Total operating expenses
|
$
|
46,755
|
|
$
|
45,617
|
|
$
|
46,707
|
|
$
|
46,194
|
|
|||
|
Operating income (loss)
|
$
|
(7,762
|
)
|
$
|
(3,071
|
)
|
$
|
1,592
|
|
$
|
3,745
|
|
|||
23
LIQUIDITY AND CAPITAL RESOURCES
Cash used in operating activities was
$7.3 million
in
2012
compared to
$22.9 million
in
2011
and cash provided by operations of
$11.3 million
in 2010. In 2012, cash used was primarily due to operating losses incurred in the first half of the year. During 2012 payments of $4.9 million were made for severance and $6.9 million under our security bonus plan for sales representatives which were mostly offset by a
$10.4 million
decrease in accounts receivable. Accounts receivable declined due to lower sales levels and the collection of past due amounts that built up in the second half of 2011.
In 2011, cash was primarily used to support increased levels of accounts receivable and inventory. The increase in inventory was attributable to ERP issues which negatively affected our procurement process and service level to customers. These issues also led to delays in the collection of our receivables. In 2010, cash was primarily generated from operating income.
Capital expenditures were
$18.5 million
in
2012
compared to
$11.1 million
in
2011
and
$10.0 million
in 2010. Capital expenditures in 2012 were primarily for warehouse equipment to support the opening of the new leased McCook, Illinois distribution center, the build out of our new leased headquarters and expenditures related to our website redevelopment. Capital expenditures in 2011 and 2010 included $5.9 million and $6.5 million, respectively, related to the ERP implementation. We received cash proceeds of
$12.3 million
and
$2.0 million
from the sale of properties in 2012 and 2010, respectively. Net proceeds of
$0.9 million
and
$27.3 million
from the sale of non-core businesses in 2010 were realized in 2012 and 2010, respectively.
In 2012, we entered into a new five year $40.0 million asset based credit facility. The terms of the credit facility, including future covenant requirements are more fully detailed in
Note 9 – Revolving Line of Credit
of the Consolidated Financial Statements included in Item 8. In addition to other customary representations, warranties and covenants, we are required to meet minimum quarterly consolidated EBITDA levels as defined in the credit facility. The minimum quarterly EBITDA levels are detailed in the following table:
|
Quarter Ended
|
Minimum EBITDA (as Defined in the Credit Facility)
|
|||
|
December 31, 2012
|
$
|
(1,500,000
|
)
|
|
|
March 31, 2013
|
0
|
|
||
|
June 30, 2013
|
2,000,000
|
|
||
|
September 30, 2013
|
3,500,000
|
|
||
|
December 31, 2013
|
3,000,000
|
|
||
|
March 31, 2014
|
3,500,000
|
|
||
|
June 30, 2014
|
3,500,000
|
|
||
For the quarter ended December 31, 2012, our quarterly EBITDA level, as defined by the agreement, was
$3.4 million
compared to the minimum EBITDA level of
$(1.5) million
required by the agreement. On December 31, 2012, we had borrowings of
$16.1 million
under our credit facility and we had additional borrowing availability of
$11.6 million
.
We paid shareholder dividends of
$3.1 million
in
2012
compared to
$4.1 million
in
2011
and
$2.2 million
in 2010. In the third quarter of 2012, our Board of Directors voted to suspend our quarterly dividend to common stockholders that otherwise would have been paid in the fourth quarter of 2012. Dividends are restricted under the credit facility to amounts not to exceed $1.1 million per quarter subject to a formula based on EBITDA achieved in the previous quarter compared to target amounts specified in the Credit Facility.
We believe cash expected to be provided by operations and the funds available under our Credit Facility are sufficient to fund our operating requirements, strategic initiatives and capital improvements throughout 2013.
24
CONTRACTUAL OBLIGATIONS
Contractual obligations that require cash payment over future periods on December 31, 2012 were as follows:
|
(Dollars in thousands)
|
|||||||||||||||||||
|
Payments due in years ended December 31,
|
|||||||||||||||||||
|
Total
|
2013
|
2014 – 2015
|
2016 - 2017
|
Thereafter
|
|||||||||||||||
|
Operating leases
|
$
|
14,190
|
|
$
|
1,709
|
|
$
|
2,521
|
|
$
|
2,566
|
|
$
|
7,394
|
|
||||
|
Financing lease obligation
|
12,116
|
|
1,047
|
|
2,209
|
|
2,420
|
|
6,440
|
|
|||||||||
|
Capital leases
|
229
|
|
121
|
|
104
|
|
4
|
|
—
|
|
|||||||||
|
Security bonus plan
(1)
|
19,464
|
|
627
|
|
—
|
|
—
|
|
18,837
|
|
|||||||||
|
Deferred compensation
|
10,249
|
|
4,369
|
|
2,035
|
|
804
|
|
3,041
|
|
|||||||||
|
Purchase commitments
|
6,988
|
|
6,988
|
|
—
|
|
—
|
|
—
|
|
|||||||||
|
Severance obligation
|
4,449
|
|
3,499
|
|
950
|
|
—
|
|
—
|
|
|||||||||
|
Total contractual cash obligations
|
$
|
67,685
|
|
$
|
18,360
|
|
$
|
7,819
|
|
$
|
5,794
|
|
$
|
35,712
|
|
||||
|
(1)
|
Payments to participants in our security bonus plan are made on a lump sum basis at time of separation from the Company. Payouts for known separation dates have been included in the scheduled year of payout, while payouts for unknown separation dates are reflected in the thereafter column.
|
OFF-BALANCE SHEET ARRANGEMENTS
We have a lease agreement for our headquarters which expires in March 2023 and includes total future minimum lease payments of $11.4 million. Also, as of December 31, 2012, we had contractual commitments to purchase
$7.0 million
of product from our suppliers and contractors in 2013.
CRITICAL ACCOUNTING POLICIES
We have disclosed our significant accounting policies in Note 2 to the Consolidated Financial Statements. The following provides supplemental information to these accounting policies as well as information on the accounts requiring more significant estimates.
Allowance for Doubtful Accounts
— We evaluate the collectability of accounts receivable based on a combination of factors. In circumstances where we are aware of a specific customer’s inability to meet its financial obligations (e.g., bankruptcy filings, substantial down-grading of credit ratings), a specific reserve for bad debts is recorded against amounts due to reduce the receivable to the amount we believe will be collected. For all other customers, we recognize reserves for bad debts based on our historical experience of bad debt write-offs as a percent of accounts receivable outstanding. If circumstances change (e.g., higher than expected defaults or an unexpected material adverse change in a major customer’s ability to meet its financial obligations), the estimates of the recoverability of amounts due to us could be revised by a material amount. At December 31, 2012, our allowance reserve was 5.1% of our gross accounts receivable outstanding. A hypothetical change of one percent to our reserve allowance as a percent of our gross accounts receivable would have affected our annual doubtful accounts expense by approximately $0.3 million.
Inventory Reserves
—Inventories consist principally of finished goods and are stated at the lower of cost (first-in-first-out method) or market. Most of our products are not exposed to the risk of obsolescence due to technology changes. However, some of our products do have a limited shelf life, and from time to time we add and remove items from our catalogs, brochures or website for marketing and other purposes.
To reduce our inventory to a lower of cost or market value, we record a reserve for slow-moving and obsolete inventory based on historical experience and monitoring current inventory activity. We use estimates to determine the necessity of recording these reserves based on periodic detailed analysis reviews using both qualitative and quantitative factors. As part of this analysis, we consider several factors including the inventories’ length of time on hand, historical sales, product shelf life, product life cycle, product category, and product obsolescence. In general, depending on product category, we reserve inventory with low
25
turnover at higher rates than inventory with high turnover. Our policy is to not re-value inventory to the original cost basis subsequent to establishing a new cost basis.
At December 31, 2012, our inventory reserve was $8.5 million, equal to approximately 14.2% of our total inventory. A hypothetical change of one percent to our reserve allowance as a percent of total inventory would have affected our cost of goods sold by $0.6 million.
Income Taxes
— Deferred tax assets or liabilities reflect temporary differences between amounts of assets and liabilities for financial and tax reporting. Such amounts are adjusted, as appropriate, to reflect changes in enacted tax rates expected to be in effect when the temporary differences reverse. A valuation allowance is established to offset any deferred tax assets if, based upon the available evidence, it is more likely than not (i.e. greater than 50% likely) that some or all of the deferred tax assets will not be realized. The determination of the amount of a valuation allowance to be provided on recorded deferred tax assets involves estimates regarding (1) the timing and amount of the reversal of taxable temporary differences, (2) expected future taxable income, (3) the impact of tax planning strategies and (4) the ability to carry back deferred tax assets to offset prior taxable income. In assessing the need for a valuation allowance, we consider all available positive and negative evidence, including past operating results, projections of future taxable income and the feasibility of ongoing tax planning strategies. The projections of future taxable income include a number of estimates and assumptions regarding our volume, pricing and costs. Additionally, valuation allowances related to deferred tax assets can be impacted by changes to tax laws. Significant judgment is required in determining income tax provisions as well as deferred tax asset and liability balances, including the estimation of valuation allowances and the evaluation of tax positions.
Primarily due to the cumulative losses that we recorded over the past several quarters, we determined that it was more likely than not that we will not be able to utilize our deferred tax assets to offset future taxable income and increased our deferred tax valuation allowance to equal substantially all of our net tax assets. Therefore, substantially all future taxable income will be subject to this tax valuation allowance until the Company can establish that the recoverability of its deferred tax assets is more certain.
Goodwill Impairment
– Impairment of goodwill is evaluated using a three-step process. First, we look at qualitative factors to determine whether events or circumstances exist that would lead us to a determine that it is more likely than not that the fair value of a reporting unit is less than its carrying amount. If events or circumstances do exist that lead us to determine that it is more likely than not that the fair value of a reporting unit is less than its carrying value, then the fair value of the reporting unit is compared with its carrying amount, including goodwill. If the fair value of the reporting unit exceeds its carrying amount, goodwill of the reporting unit is not considered impaired, and thus, the third step of the impairment test is unnecessary. If the carrying amount of the reporting unit exceeds its fair value, the third step of the goodwill impairment test is performed to measure the amount of impairment loss, if any.
In the second quarter of 2012, we identified indicators of impairment related to operating losses and reduced market capitalization and, therefore, performed an interim impairment test of goodwill. We then estimated the fair value of our MRO reporting unit using a discounted cash flow analysis based on our current internal operating forecast to determine the reporting unit’s fair value. After completing the analysis, we concluded that the entire amount of the goodwill was impaired and a non-cash charge of
$28.3 million
was recorded.
26
One of our subsidiaries is located and operates in Canada using the Canadian dollar as its functional currency. Operating results are translated into U.S. dollars when consolidated into our financial statements. Therefore, we are exposed to market risk relating to the change in the value of the Canadian dollar relative to the U.S. dollar. A hypothetical 10% change in the Canadian foreign currency exchange rate would have affected our 2012 net sales by $2.8 million and net assets by $1.2 million.
Certain compensation awards have been granted to our directors, officers and key employees that are payable in cash, based upon the market price of our common stock. These awards are re-measured each reporting period and the effect of the change in the share price is reflected in our operating results. A hypothetical 10% change in the price of our common stock on December 31, 2012 would have affected our 2012 operating results by $0.1 million.
A number of our current and past employees have opted to defer a portion of their earned compensation to be paid at a future date. These individuals have the ability to invest the deferred compensation in one or more portfolios that track the performance of various mutual funds. As of December 31, 2012, the liability, which is based on the performance of these funds, was $10.2 million. Additionally, we have invested funds in life insurance policies on certain executives. The cash surrender value of these policies is invested in investment instruments similar to those supporting the deferred compensation liability. As of December 31, 2012, the cash surrender value of these life insurance policies was $14.9 million. The change in the market value of the funds supporting our deferred compensation plan and the cash surrender value of the life insurance policies is recorded as a component of income and a hypothetical 10% increase or decrease in the investment portfolios of both the cash value of life insurance asset and the deferred compensation liability would be immaterial as the underlying investments are intended to mirror the participants' investment elections.
On December 31, 2012, we had $16.1 million of borrowings outstanding on our revolving line of credit that are exposed to the market risk of fluctuations in the variable interest rate charged which is based on either the Prime rate or the LIBOR rate. A hypothetical 100 basis point change in the underlying interest rate charged on the December 31, 2012 debt balance would have an annual effect on operating results of $0.2 million.
We are exposed to market risk relating to increased commodity and energy costs affecting the production costs of our vendors. These vendors typically look to pass their increased costs along to us and if we are unable to fully pass these costs through to our customers or to modify our activities, the impact would have an adverse effect on our operating profit margins.
27
The following information is presented in this item:
|
|
|
|
|
|
|
|
|
|
|
|
|
|
|
|
|
|
|
|
|
28
Report of Independent Registered Public Accounting Firm
To the Board of Directors and Stockholders
Lawson Products, Inc.
We have audited the accompanying consolidated balance sheets of Lawson Products, Inc. as of December 31, 2012 and 2011, and the related consolidated statements of operations and comprehensive income (loss), changes in stockholders’ equity, and cash flows for each of the three years in the period ended December 31, 2012. Our audits also included the financial statement schedule listed in the Index at Item 15(a). These financial statements and schedule are the responsibility of the Company’s management. Our responsibility is to express an opinion on the financial statements and schedule based on our audits.
We conducted our audits in accordance with the standards of the Public Company Accounting Oversight Board (United States). Those standards require that we plan and perform the audit to obtain reasonable assurance about whether the financial statements are free of material misstatement. An audit includes examining, on a test basis, evidence supporting the amounts and disclosures in the financial statements. An audit also includes assessing the accounting principles used and significant estimates made by management, as well as evaluating the overall financial statement presentation. We believe that our audits provide a reasonable basis for our opinion.
In our opinion, the financial statements referred to above present fairly, in all material respects, the consolidated financial position of Lawson Products, Inc. at December 31, 2012 and 2011, and the consolidated results of its operations and its cash flows for each of the three years in the period ended December 31, 2012, in conformity with U.S. generally accepted accounting principles. Also, in our opinion, the related financial statement schedule, when considered in relation to the basic financial statements taken as a whole, presents fairly in all material respects the information set forth therein.
We also have audited, in accordance with the standards of the Public Company Accounting Oversight Board (United States), Lawson Products, Inc.’s internal control over financial reporting as of December 31, 2012, based on criteria established in Internal Control-Integrated Framework issued by the Committee of Sponsoring Organizations of the Treadway Commission and our report dated
February 25, 2013
, expressed an unqualified opinion thereon.
/s/ Ernst & Young LLP
Chicago, Illinois
February 25, 2013
29
Lawson Products, Inc.
(Dollars in thousands)
|
December 31,
|
|||||||
|
2012
|
2011
|
||||||
|
ASSETS
|
|||||||
|
Current assets:
|
|||||||
|
Cash and cash equivalents
|
$
|
1,640
|
|
$
|
2,116
|
|
|
|
Accounts receivable, less allowance for doubtful accounts of $1,687 and $1,912, respectively
|
31,387
|
|
43,239
|
|
|||
|
Inventories
|
51,484
|
|
55,498
|
|
|||
|
Miscellaneous receivables and prepaid expenses
|
5,451
|
|
7,064
|
|
|||
|
Deferred income taxes
|
17
|
|
5,716
|
|
|||
|
Discontinued operations
|
350
|
|
410
|
|
|||
|
Total current assets
|
90,329
|
|
114,043
|
|
|||
|
Property, plant and equipment, less accumulated depreciation and amortization
|
67,155
|
|
52,702
|
|
|||
|
Cash value of life insurance
|
14,943
|
|
15,490
|
|
|||
|
Deferred income taxes
|
55
|
|
11,864
|
|
|||
|
Goodwill
|
—
|
|
28,148
|
|
|||
|
Other assets
|
449
|
|
501
|
|
|||
|
Total assets
|
$
|
172,931
|
|
$
|
222,748
|
|
|
|
LIABILITIES AND STOCKHOLDERS’ EQUITY
|
|||||||
|
Current liabilities:
|
|||||||
|
Revolving line of credit
|
$
|
16,127
|
|
$
|
—
|
|
|
|
Accounts payable
|
11,833
|
|
22,967
|
|
|||
|
Accrued expenses and other liabilities
|
31,762
|
|
28,231
|
|
|||
|
Discontinued operations
|
106
|
|
681
|
|
|||
|
Total current liabilities
|
59,828
|
|
51,879
|
|
|||
|
Noncurrent liabilities and deferred credits:
|
|||||||
|
Security bonus plan
|
18,837
|
|
23,310
|
|
|||
|
Deferred compensation
|
5,868
|
|
9,279
|
|
|||
|
Financing lease obligation
|
10,786
|
|
3,377
|
|
|||
|
Deferred rent liability
|
4,621
|
|
17
|
|
|||
|
Other
|
2,258
|
|
714
|
|
|||
|
42,370
|
|
36,697
|
|
||||
|
Commitments and contingencies – Note 12
|
|||||||
|
Stockholders’ equity:
|
|||||||
|
Preferred stock, $1 par value:
|
|||||||
|
Authorized - 500,000 shares, Issued and outstanding - None
|
—
|
|
—
|
|
|||
|
Common stock, $1 par value:
|
|||||||
|
Authorized - 35,000,000 shares,
Issued – 8,614,837 and 8,580,753 shares Outstanding – 8,605,901 and 8,574,291 shares |
8,615
|
|
8,581
|
|
|||
|
Capital in excess of par value
|
6,951
|
|
6,210
|
|
|||
|
Retained earnings
|
52,764
|
|
117,371
|
|
|||
|
Treasury stock – 8,936 and 6,462 shares held, respectively
|
(155
|
)
|
(130
|
)
|
|||
|
Accumulated other comprehensive income
|
2,558
|
|
2,140
|
|
|||
|
Total stockholders’ equity
|
70,733
|
|
134,172
|
|
|||
|
Total liabilities and stockholders’ equity
|
$
|
172,931
|
|
$
|
222,748
|
|
|
See notes to Consolidated Financial Statements
30
Lawson Products, Inc.
(Dollars in thousands, except per share data)
|
Year Ended December 31,
|
|||||||||||
|
2012
|
2011
|
2010
|
|||||||||
|
Net sales
|
$
|
290,487
|
|
$
|
314,959
|
|
$
|
316,780
|
|
||
|
Cost of goods sold
|
129,305
|
|
135,182
|
|
121,954
|
|
|||||
|
Gross profit
|
161,182
|
|
179,777
|
|
194,826
|
|
|||||
|
Operating expenses:
|
|||||||||||
|
Selling, general and administrative expenses
|
171,725
|
|
181,291
|
|
180,021
|
|
|||||
|
Severance expenses
|
8,021
|
|
1,614
|
|
3,629
|
|
|||||
|
Loss (gain) on sale of assets
|
(3,721
|
)
|
22
|
|
(1,701
|
)
|
|||||
|
Goodwill impairment
|
28,306
|
|
—
|
|
—
|
|
|||||
|
Other operating expenses (benefits)
|
—
|
|
2,346
|
|
(4,050
|
)
|
|||||
|
Operating expenses
|
204,331
|
|
185,273
|
|
177,899
|
|
|||||
|
Operating income (loss)
|
(43,149
|
)
|
(5,496
|
)
|
16,927
|
|
|||||
|
Interest expense
|
(775
|
)
|
(681
|
)
|
(391
|
)
|
|||||
|
Other income (expense), net
|
(56
|
)
|
101
|
|
160
|
|
|||||
|
Income (loss) from continuing operations before income taxes
|
(43,980
|
)
|
(6,076
|
)
|
16,696
|
|
|||||
|
Income tax expense (benefit)
|
18,737
|
|
(1,687
|
)
|
7,106
|
|
|||||
|
Income (loss) from continuing operations
|
(62,717
|
)
|
(4,389
|
)
|
9,590
|
|
|||||
|
Discontinued operations, net
|
167
|
|
(235
|
)
|
(2,653
|
)
|
|||||
|
Net income (loss)
|
$
|
(62,550
|
)
|
$
|
(4,624
|
)
|
$
|
6,937
|
|
||
|
Basic income (loss) per share of common stock:
|
|||||||||||
|
Continuing operations
|
$
|
(7.30
|
)
|
$
|
(0.51
|
)
|
$
|
1.13
|
|
||
|
Discontinued operations
|
0.02
|
|
(0.03
|
)
|
(0.32
|
)
|
|||||
|
Net Income (loss)
|
$
|
(7.28
|
)
|
$
|
(0.54
|
)
|
$
|
0.81
|
|
||
|
Diluted income (loss) per share of common stock:
|
|||||||||||
|
Continuing operations
|
$
|
(7.30
|
)
|
$
|
(0.51
|
)
|
$
|
1.12
|
|
||
|
Discontinued operations
|
0.02
|
|
(0.03
|
)
|
(0.31
|
)
|
|||||
|
Net Income (loss)
|
$
|
(7.28
|
)
|
$
|
(0.54
|
)
|
$
|
0.81
|
|
||
|
Comprehensive income (loss)
|
|||||||||||
|
Net income (loss)
|
$
|
(62,550
|
)
|
$
|
(4,624
|
)
|
$
|
6,937
|
|
||
|
Other comprehensive loss, net of tax:
|
|||||||||||
|
Adjustment for foreign currency translation
|
418
|
|
(835
|
)
|
1,519
|
|
|||||
|
Comprehensive income (loss)
|
$
|
(62,132
|
)
|
$
|
(5,459
|
)
|
$
|
8,456
|
|
||
See notes to Consolidated Financial Statements
31
Lawson Products, Inc.
Consolidated Statements of Changes in Stockholders’ Equity
(Dollars in thousands)
|
Common
Stock,
$1 par value
|
Capital in Excess of Par Value
|
Retained Earnings
|
Treasury Stock
|
Accumulated Other Comprehensive income (loss)
|
Total stockholders' equity
|
||||||||||||||||||
|
Balance at January 1, 2010
|
$
|
8,522
|
|
$
|
4,780
|
|
$
|
121,888
|
|
$
|
—
|
|
$
|
1,456
|
|
$
|
136,646
|
|
|||||
|
Net income
|
—
|
|
—
|
|
6,937
|
|
—
|
|
—
|
|
6,937
|
|
|||||||||||
|
Adjustment for foreign currency translation
|
—
|
|
—
|
|
—
|
|
—
|
|
1,519
|
|
1,519
|
|
|||||||||||
|
Stock based compensation
|
—
|
|
560
|
|
—
|
|
—
|
|
—
|
|
560
|
|
|||||||||||
|
Shares issued
|
12
|
|
(12
|
)
|
—
|
|
—
|
|
—
|
|
—
|
|
|||||||||||
|
Share repurchase under stock award program
|
—
|
|
—
|
|
—
|
|
(70
|
)
|
—
|
|
(70
|
)
|
|||||||||||
|
Cash dividends declared
|
—
|
|
—
|
|
(2,727
|
)
|
—
|
|
—
|
|
(2,727
|
)
|
|||||||||||
|
Balance at December 31, 2010
|
8,534
|
|
5,328
|
|
126,098
|
|
(70
|
)
|
2,975
|
|
142,865
|
|
|||||||||||
|
Net loss
|
—
|
|
—
|
|
(4,624
|
)
|
—
|
|
—
|
|
(4,624
|
)
|
|||||||||||
|
Adjustment for foreign currency translation
|
—
|
|
—
|
|
—
|
|
—
|
|
(835
|
)
|
(835
|
)
|
|||||||||||
|
Stock based compensation
|
—
|
|
929
|
|
—
|
|
—
|
|
—
|
|
929
|
|
|||||||||||
|
Shares issued
|
47
|
|
(47
|
)
|
—
|
|
—
|
|
—
|
|
—
|
|
|||||||||||
|
Share repurchase under stock award program
|
—
|
|
—
|
|
—
|
|
(60
|
)
|
—
|
|
(60
|
)
|
|||||||||||
|
Cash dividends declared
|
—
|
|
—
|
|
(4,103
|
)
|
—
|
|
—
|
|
(4,103
|
)
|
|||||||||||
|
Balance at December 31, 2011
|
8,581
|
|
6,210
|
|
117,371
|
|
(130
|
)
|
2,140
|
|
134,172
|
|
|||||||||||
|
Net loss
|
—
|
|
—
|
|
(62,550
|
)
|
—
|
|
—
|
|
(62,550
|
)
|
|||||||||||
|
Adjustment for foreign currency translation
|
—
|
|
—
|
|
—
|
|
—
|
|
418
|
|
418
|
|
|||||||||||
|
Stock based compensation
|
—
|
|
775
|
|
—
|
|
—
|
|
—
|
|
775
|
|
|||||||||||
|
Shares issued
|
34
|
|
(34
|
)
|
—
|
|
—
|
|
—
|
|
—
|
|
|||||||||||
|
Share repurchase under stock award program
|
—
|
|
—
|
|
—
|
|
(25
|
)
|
—
|
|
(25
|
)
|
|||||||||||
|
Cash dividends declared
|
—
|
|
—
|
|
(2,057
|
)
|
—
|
|
—
|
|
(2,057
|
)
|
|||||||||||
|
Balance at December 31, 2012
|
$
|
8,615
|
|
$
|
6,951
|
|
$
|
52,764
|
|
$
|
(155
|
)
|
$
|
2,558
|
|
$
|
70,733
|
|
|||||
See notes to Consolidated Financial Statements
32
Lawson Products, Inc.
(Dollars in thousands)
|
Year Ended December 31,
|
|||||||||||
|
2012
|
2011
|
2010
|
|||||||||
|
Operating activities
|
|||||||||||
|
Net income (loss)
|
$
|
(62,550
|
)
|
$
|
(4,624
|
)
|
$
|
6,937
|
|
||
|
Loss (income) from discontinued operations
|
(167
|
)
|
235
|
|
2,653
|
|
|||||
|
Income (loss) from continuing operations
|
(62,717
|
)
|
(4,389
|
)
|
9,590
|
|
|||||
|
Adjustments to reconcile net income (loss) from continuing operations to net cash (used in) provided by operating activities:
|
|||||||||||
|
Depreciation and amortization
|
7,134
|
|
5,704
|
|
6,306
|
|
|||||
|
Deferred income taxes
|
17,444
|
|
(1,837
|
)
|
5,220
|
|
|||||
|
Stock based compensation
|
(306
|
)
|
61
|
|
1,915
|
|
|||||
|
Goodwill impairment
|
28,306
|
|
—
|
|
—
|
|
|||||
|
Loss (gain) on disposal of property and equipment
|
(3,721
|
)
|
22
|
|
(1,701
|
)
|
|||||
|
Settlement payment
|
—
|
|
—
|
|
(10,000
|
)
|
|||||
|
Changes in operating assets and liabilities:
|
|||||||||||
|
Accounts receivable
|
10,426
|
|
(11,422
|
)
|
(4,678
|
)
|
|||||
|
Inventories
|
4,145
|
|
(8,432
|
)
|
(3,539
|
)
|
|||||
|
Prepaid expenses and other assets
|
1,909
|
|
2,035
|
|
2,118
|
|
|||||
|
Accounts payable and other liabilities
|
(11,430
|
)
|
(6,719
|
)
|
5,545
|
|
|||||
|
Other
|
1,555
|
|
2,069
|
|
549
|
|
|||||
|
Net cash (used in) provided by operating activities
|
$
|
(7,255
|
)
|
$
|
(22,908
|
)
|
$
|
11,325
|
|
||
|
Investing activities
|
|||||||||||
|
Purchases of property, plant and equipment
|
$
|
(18,501
|
)
|
$
|
(11,132
|
)
|
$
|
(10,048
|
)
|
||
|
Proceeds related to sale of businesses, net
|
909
|
|
58
|
|
27,264
|
|
|||||
|
Proceeds from sale of property
|
12,278
|
|
—
|
|
2,027
|
|
|||||
|
Net cash (used in) provided by investing activities
|
$
|
(5,314
|
)
|
$
|
(11,074
|
)
|
$
|
19,243
|
|
||
|
Financing activities
|
|||||||||||
|
Net borrowings on revolving line of credit
|
$
|
16,127
|
|
$
|
—
|
|
$
|
—
|
|
||
|
Dividends paid
|
(3,084
|
)
|
(4,098
|
)
|
(2,216
|
)
|
|||||
|
Payment of financing fees
|
(631
|
)
|
—
|
|
(32
|
)
|
|||||
|
Net cash provided by (used in) financing activities
|
$
|
12,412
|
|
$
|
(4,098
|
)
|
$
|
(2,248
|
)
|
||
|
Discontinued operations
|
|||||||||||
|
Operating cash flows
|
$
|
(319
|
)
|
$
|
(370
|
)
|
$
|
3,463
|
|
||
|
Investing cash flows
|
—
|
|
—
|
|
(4
|
)
|
|||||
|
Net cash (used in) provided by discontinued operations
|
$
|
(319
|
)
|
$
|
(370
|
)
|
$
|
3,459
|
|
||
|
Increase (decrease) in cash and cash equivalents
|
(476
|
)
|
(38,450
|
)
|
31,779
|
|
|||||
|
Cash and cash equivalents at beginning of year
|
2,116
|
|
40,566
|
|
8,787
|
|
|||||
|
Cash and cash equivalents at end of year
|
$
|
1,640
|
|
$
|
2,116
|
|
$
|
40,566
|
|
||
See notes to Consolidated Financial Statements
33
Lawson Products, Inc.
Notes to Consolidated Financial Statements
Lawson Products, Inc. (“Lawson” or the “Company”) is a North American distributor of products and services to the industrial, commercial, institutional and governmental maintenance, repair and operations (“MRO”) marketplace. The Company also manufactures and distributes specialized component parts to the original equipment manufacturers (“OEM”) marketplace.
Principles of Consolidation
— The accompanying consolidated financial statements have been prepared in accordance with accounting principles generally accepted in the United States and include the accounts and transactions of the Company and its wholly-owned subsidiaries. All significant intercompany transactions and balances have been eliminated in consolidation. Certain prior period amounts have been reclassified to conform to the current year presentation.
Revenue Recognition
— Net sales includes product sales and billings for freight and handling charges. Sales and associated cost of goods sold are generally recognized when products are shipped and title passes to customers. We accrue for returns based on historical evidence of rates of return.
Shipping and Handling Fees and Costs
— Shipping and handling fees charged to customers totaled
$10.7 million
,
$12.8 million
and
$13.0 million
in 2012, 2011 and 2010, respectively, and are included in the caption Net sales on the Consolidated Statements of Operations and Comprehensive Income (Loss). Costs related to shipping and handling fees of
$13.6 million
,
$13.1 million
and
$11.0 million
in 2012, 2011 and 2010, respectively, are included in Cost of goods sold.
Cash Equivalents
— The Company considers all highly liquid investments with a maturity of three months or less when purchased, such as money market funds, to be cash equivalents.
Allowance for Doubtful Accounts
— The Company evaluates the collectability of accounts receivable based on a combination of factors. In circumstances where the Company is aware of a specific customer’s inability to meet its financial obligations (e.g., bankruptcy filings, substantial down-grading of credit ratings), a specific reserve for bad debts is recorded against amounts due to reduce the receivable to the amount the Company reasonably believes will be collected. For all other customers, the Company recognizes reserves for bad debts based on the Company’s historical experience of bad debt write-offs as a percent of accounts receivable outstanding. If circumstances change (e.g., higher than expected defaults or an unexpected material adverse change in a major customer’s ability to meet its financial obligations), the estimates of the recoverability of amounts due the Company could be revised by a material amount.
Inventories
— Inventories principally consist of finished goods and some raw materials and work in process related to the manufacturing process at Automatic Screw Machine Products Company ("ASMP"). Inventories are stated at the lower of cost (first-in-first-out method) or market. To reduce inventory to a lower of cost or market value, a reserve is recorded for slow-moving and obsolete inventory based on historical experience and monitoring current inventory activity. Estimates are used to determine the necessity of recording these reserves based on periodic detailed analysis using both qualitative and quantitative factors. As part of this analysis, the Company considers several factors including the inventories length of time on hand, historical sales, product shelf life, product life cycle, product classification and product obsolescence. It is the Company’s policy to not re-value inventory to the original cost basis subsequent to establishing a new cost basis.
Inventories that are not considered ready for sale are classified as either raw materials or work in process. All MRO inventory is considered to be in a state ready for sale and classified as finished goods.
Property, Plant and Equipment
— Property, plant and equipment are stated at cost less accumulated depreciation and amortization. Depreciation expense is computed by the straight-line method for buildings and improvements generally using useful lives of
20
to
30
years and using the straight-line and double declining balance methods for machinery and equipment, furniture and fixtures and vehicles using useful lives of
3
to
10
years. Amortization of financing and capital leases is included in depreciation expense. Depreciation expense was
$4.3 million
,
$3.9 million
and
$3.7 million
for 2012, 2011 and 2010, respectively. Capitalized software is amortized over estimated useful lives of
3
to
5
years using the straight-line method. Amortization expense of capitalized software was
$2.7 million
,
$1.7 million
and
$2.6 million
for 2012, 2011 and 2010, respectively.
34
Cash Value of Life Insurance
— The Company has invested funds in life insurance policies on certain current and former executives. The cash surrender value of the policies is invested in various investment instruments and is recorded as an asset on our financial statements. The Company records these funds at contractual value. The change in the cash surrender value of the life insurance policies, which is recorded as a component of Selling, general and administrative expenses, is the change in the policies' contractual values.
Deferred Compensation
— The Company’s Executive Deferral Plan (“Deferral Plan”) allows certain executives to defer payment of a portion of their earned compensation. The deferred compensation is recorded in an Account Balance, which is a bookkeeping entry made by the Company to measure the amount due to the participant. The Account Balance is equal to the participant’s deferred compensation, adjusted for increases and/or decreases in the amount that the participant has designated to one or more bookkeeping portfolios that track the performance of certain mutual funds. Lawson adjusts the deferred compensation liability to equal the contractual value of the participants’ Account Balances. These adjustments are the changes in contractual value of the individual plans and are recorded as a component of Selling, general and administrative expenses.
Stock-Based Compensation
— Compensation based on the share value of the Company’s common stock is valued at its fair value at the grant date and the expense is recognized over the vesting period. Fair value is re-measured each reporting period for liability classified awards that may be redeemable in cash. See
Note 13 - Stock Compensation Plans
.
Goodwill
— Goodwill represents the cost of business acquisitions in excess of the fair value of identifiable net tangible and intangible assets acquired. Goodwill is allocated to the appropriate reporting unit as reviewed by the Company’s chief operating decision maker responsible for reviewing operating performance and allocating resources. Impairment of goodwill is evaluated using a three-step process. First, we look at qualitative factors to determine whether events or circumstances exist that would lead us to a determine that it is more likely than not that the fair value of a reporting unit is less than its carrying amount. If events or circumstances do exist that lead us to determine that it is more likely than not that the fair value of a reporting unit is less than its carrying value, then the fair value of the reporting unit is compared with its carrying amount, including goodwill. If the fair value of the reporting unit exceeds its carrying amount, goodwill of the reporting unit is not considered impaired, and thus, the third step of the impairment test is unnecessary. If the carrying amount of the reporting unit exceeds its fair value, the third step of the goodwill impairment test is performed to measure the amount of impairment loss, if any.
In the second quarter of 2012, we identified indicators of impairment related to operating losses and reduced market capitalization and, therefore, performed an interim impairment test of goodwill. We then estimated the fair value of our MRO reporting unit using a discounted cash flow analysis based on our current internal operating forecast to determine the reporting unit’s fair value. After completing the analysis, we concluded that the entire amount of the goodwill was impaired and a non-cash charge of
$28.3 million
was recorded.
Impairment of Long-Lived Assets
— The Company reviews its long-lived assets, including property, plant and equipment and intangibles, for impairment whenever events or changes in circumstances indicate that the carrying amounts of these assets may not be recoverable. Recoverability is measured by a comparison of the assets' carrying amount to their expected future undiscounted net cash flows. If such assets are considered to be impaired, the impairment to be recognized is measured based on the amount by which the carrying amount of the asset exceeds its fair value.
Income Taxes
— Deferred tax assets or liabilities reflect temporary differences between amounts of assets and liabilities for financial and tax reporting. Such amounts are adjusted, as appropriate, to reflect changes in enacted tax rates expected to be in effect when the temporary differences reverse. A valuation allowance is established to offset any deferred tax assets if, based upon the available evidence, it is more likely than not (i.e. greater than 50% likely) that some or all of the deferred tax assets will not be realized. The determination of the amount of a valuation allowance to be provided on recorded deferred tax assets involves estimates regarding (1) the timing and amount of the reversal of taxable temporary differences, (2) expected future taxable income, (3) the impact of tax planning strategies and (4) the ability to carry back deferred tax assets to offset prior taxable income. In assessing the need for a valuation allowance, we consider all available positive and negative evidence, including past operating results, projections of future taxable income and the feasibility of ongoing tax planning strategies. The projections of future taxable income include a number of estimates and assumptions regarding our volume, pricing and costs. Additionally, valuation allowances related to deferred tax assets can be impacted by changes to tax laws. Significant judgment is required in determining income tax provisions as well as deferred tax asset and liability balances, including the estimation of valuation allowances and the evaluation of tax positions.
Primarily due to the cumulative losses the Company recorded over the past several quarters, Management determined that it was more likely than not that it would not be able to utilize deferred tax assets to offset future taxable income and increased
35
the deferred tax valuation allowance to equal substantially all of the Company's net tax assets. Therefore, substantially all future taxable income will be subject to this tax valuation allowance until the Company can establish that the recoverability of its deferred tax assets is more certain.
Earnings from the Company's foreign subsidiaries are considered to be indefinitely reinvested. A distribution of these non-U.S. earnings in the form of dividends or otherwise would subject the Company to both U.S. Federal and state income taxes, as adjusted for tax credits and foreign withholding taxes.
The Company recognizes the benefit of tax positions when a benefit is more likely than not (i.e., greater than 50% likely) to be sustained on its technical merits. Recognized tax benefits are measured at the largest amount that is more likely than not to be sustained, based on cumulative probability, in final settlement of the position. The Company recognizes interest and penalties related to unrecognized tax benefits as a component of income tax expense.
Leases
— Leases are categorized as either operating or capital leases at inception. Operating lease costs are recognized on a straight-line basis over the term of the lease. An asset and a corresponding liability for the capital lease obligation are established for the cost of capital leases. The capital lease obligation is amortized over the life of the lease. For build-to-suit leases, the Company establishes an asset and liability for the estimated construction costs incurred to the extent that it is involved in the construction of structural improvements or takes construction risk prior to the commencement of the lease. Upon occupancy of facilities under build-to-suit leases, the Company assesses whether these arrangements qualify for sales recognition under the sale-leaseback accounting guidance. If a lease does not meet the criteria to qualify for a sale-leaseback transaction, the established asset and liability remain on the Company's balance sheet. This asset is depreciated over the life of the lease and the liability is reduced by the non-interest portion of the lease payments.
Earnings per Share
— Basic earnings per share is computed by dividing net income by the weighted average number of common shares outstanding during the period. Diluted earnings per share reflect the potential dilution from the exercise or conversion of outstanding stock options and restricted stock awards into common stock.
Foreign Currency
— The accounts of foreign subsidiaries are measured using the local currency as the functional currency. All balance sheet amounts have been translated into U.S. dollars using the exchange rates in effect at the applicable period end. Income statement amounts have been translated using the average exchange rate for the applicable period. The gains and losses resulting from the changes in exchange rates from the translation of subsidiary accounts in local currency to U.S. dollars have been reported as a component of Accumulated other comprehensive income in the Consolidated Balance Sheets. Foreign currency transaction gains and losses result from the effect of exchange rate changes on transactions denominated in currencies other than the functional currency. These gains and losses are included in the Consolidated Statements of Operations and Comprehensive Income (Loss) and were immaterial for all years presented.
Treasury Stock
—The Company repurchased
2,474
,
3,759
and
2,703
shares of its common stock in 2012, 2011 and 2010, respectively, from employees upon the vesting of restricted stock to offset the income taxes owed by those employees. The Company accounts for treasury stock using the cost method and includes treasury stock as a component of stockholders’ equity.
Use of Estimates
— Preparation of financial statements in conformity with accounting principles generally accepted in the United States requires management to make estimates and assumptions that affect the amounts reported in the consolidated financial statements and accompanying notes. Actual results could differ from these estimates.
Recent Accounting Pronouncements
In June 2011, and as amended in December 2011, the FASB issued Accounting Standards Update (“ASU”) No. 2011-05, an amendment to ASC 220, Comprehensive Income. This ASU eliminates the option to present components of other comprehensive income as part of the statement of equity and requires that the total of comprehensive income, the components of net income, and the components of other comprehensive income be presented either in a single continuous statement of comprehensive income or in two separate but consecutive statements. It also requires presentation on the face of the financial statements of reclassification adjustments for items that are reclassified from other comprehensive income to net income in the statements where the components of net income and the components of other comprehensive income are presented. The amendments in this ASU are to be applied retrospectively. This update is effective for fiscal years and interim periods within those years beginning after December 15, 2011.
36
In December 2011, the FASB issued ASU 2011-12, an amendment to certain pending paragraphs from ASU 2011-05. This amendment allowed for companies to defer the effective date of the change in presentation on the face of the financial statements of reclassification adjustments for items that are reclassified from other comprehensive income to net income in the statements where the components of net income and the components of other comprehensive income are presented until the FASB has further deliberated financial statement users need for this information. The effective date for all other amendments put forth in ASU No. 2011-05 are unaffected by this update. This update is effective for fiscal years and interim periods within those years beginning after December 15, 2011.
The Company adopted ASU 2011-05 as amended by ASU 2011-12 beginning on January 1, 2012.
Subsequent Events
— The Company has evaluated events through the issue date of this Form 10-K and has determined that no reportable events have occurred subsequent to the date of these financial statements.
Components of inventories were as follows:
|
(Dollars in thousands)
|
|||||||
|
December 31,
|
|||||||
|
2012
|
2011
|
||||||
|
Finished goods
|
$
|
56,108
|
|
$
|
56,985
|
|
|
|
Work in progress
|
2,292
|
|
1,935
|
|
|||
|
Raw materials
|
1,630
|
|
1,624
|
|
|||
|
Total
|
60,030
|
|
60,544
|
|
|||
|
Reserve for obsolete and excess inventory
|
(8,546
|
)
|
(5,046
|
)
|
|||
|
$
|
51,484
|
|
$
|
55,498
|
|
||
Components of property, plant and equipment were as follows:
|
(Dollars in thousands)
|
|||||||
|
December 31,
|
|||||||
|
2012
|
2011
|
||||||
|
Land
|
$
|
5,952
|
|
$
|
8,750
|
|
|
|
Buildings and improvements
|
31,087
|
|
49,917
|
|
|||
|
Machinery and equipment
|
25,813
|
|
28,767
|
|
|||
|
Capitalized software
|
16,798
|
|
21,422
|
|
|||
|
McCook Facility
|
12,961
|
|
—
|
|
|||
|
Furniture and fixtures
|
6,931
|
|
5,640
|
|
|||
|
Capital leases
|
1,694
|
|
3,501
|
|
|||
|
Vehicles
|
131
|
|
131
|
|
|||
|
Construction in progress
|
7,486
|
|
8,263
|
|
|||
|
108,853
|
|
126,391
|
|
||||
|
Accumulated depreciation and amortization
|
(41,698
|
)
|
(73,689
|
)
|
|||
|
$
|
67,155
|
|
$
|
52,702
|
|
||
Because the Company was directly involved in structural improvements to the McCook, Illinois distribution center ("McCook Facility") and made direct payments of
$1.0 million
for construction costs, under build-to-suit accounting guidance, the Company is required to record the total estimated construction cost of the building as an asset and a corresponding liability for the amount that was paid by the lessor. The asset is being depreciated over the
10
year life of the lease and the liability is being reduced by
37
the non-interest portion of the lease payments. On December 31, 2012, the Company has an asset of
$13.0 million
with corresponding accumulated depreciation of
$0.7 million
. Liabilities related to the McCook facility were
$11.6 million
on December 31, 2012, of which
$0.8 million
is included in accrued expenses and other liabilities and
$10.8 million
is included as a Financing Lease Obligation. The financing lease obligation will be amortized over the 10 year lease term. The non-cash increases in assets and liabilities of
$8.0 million
and
$4.0 million
in 2012 and 2011, respectively, were not reflected in the Consolidated Statements of Cash Flows.
Construction in progress at
December 31, 2012
includes
$6.3 million
related to equipment to support operations of the McCook Facility and
$1.2 million
related to various other business improvement projects. The
December 31, 2011
construction in progress included
$5.6 million
related to the construction of the McCook Facility,
$1.2 million
related to the development of a new website and
$1.4 million
related to various other business improvement projects.
During 2012, the Company sold four properties that were primarily included in the land and buildings and improvements components. See further details in
Note 14 - Sale of Properties
.
As a result of an acquisition in 2001, the Company had goodwill of
$28.3 million
, all of which related to its MRO reporting segment. Goodwill impairment is deemed to exist if the carrying amount of a reporting unit exceeds its estimated fair value and the goodwill impairment charge, if any, is measured as the difference between the carrying amount of the goodwill as compared to its estimated fair value. The Company evaluates goodwill for potential impairment by determining if certain qualitative events have occurred or if circumstances have changed that would more likely than not reduce the fair value of the reporting unit below its carrying value. As a result of this evaluation, the Company identified indicators of impairment during the second quarter of 2012 related to recurring operating losses and reduced market capitalization and, therefore, performed an interim impairment test of goodwill.
The Company estimated the fair value of the MRO reporting unit using a discounted cash flow analysis based on its current operating forecast to determine the reporting unit’s fair value. After completing the analysis, the Company concluded that the entire amount of the goodwill was impaired and a non-cash charge of
$28.3 million
was recorded in the second quarter of 2012.
Goodwill activity in
2012
and
2011
was as follows:
|
(Dollars in thousands)
|
|||||||
|
December 31,
|
|||||||
|
2012
|
2011
|
||||||
|
Beginning balance
|
$
|
28,148
|
|
$
|
28,307
|
|
|
|
Impairment loss
|
(28,306
|
)
|
—
|
|
|||
|
Translation adjustment
|
158
|
|
(159
|
)
|
|||
|
Ending balance
|
$
|
—
|
|
$
|
28,148
|
|
|
In 2011, as a result of the Company's estimate that it was more likely than not that its ASMP operation would be disposed of significantly before the end of the previously estimated useful lives of certain long-lived assets, the Company reviewed those assets for recoverability. In performing the review for recoverability, the Company determined that the future expected undiscounted cash flows of ASMP were less than the carrying amount of the assets, indicating the assets had been impaired at December 31, 2011. The amount of impairment was then measured based on the amount by which the carrying amount of ASMP’s assets exceeded its fair value, which was determined by an independent assessment of the amount the assets would be worth to a willing buyer in an open market. Accordingly, in
2011
, the Company recorded an impairment charge of
$1.1 million
related to property, plant and equipment in the OEM segment.
The Company did not identify any potential indicators of impairment in 2012 related to either its MRO or OEM operating segments.
38
Income (loss) from continuing operations before income taxes consisted of the following:
|
(Dollars in thousands)
|
|||||||||||
|
Year Ended December 31,
|
|||||||||||
|
2012
|
2011
|
2010
|
|||||||||
|
United States
|
$
|
(34,690
|
)
|
$
|
(5,100
|
)
|
$
|
14,269
|
|
||
|
Canada
|
(9,290
|
)
|
(976
|
)
|
2,427
|
|
|||||
|
$
|
(43,980
|
)
|
$
|
(6,076
|
)
|
$
|
16,696
|
|
|||
Provision (benefit) for income taxes from continuing operations for the years ended December 31, consisted of the following:
|
(Dollars in thousands)
|
|||||||||||
|
Year Ended December 31,
|
|||||||||||
|
2012
|
2011
|
2010
|
|||||||||
|
Current income tax expense (benefit):
|
|||||||||||
|
U.S. Federal
|
$
|
62
|
|
$
|
464
|
|
$
|
3,681
|
|
||
|
U.S. state
|
215
|
|
295
|
|
987
|
|
|||||
|
Canada
|
1,016
|
|
(190
|
)
|
366
|
|
|||||
|
Total
|
$
|
1,293
|
|
$
|
569
|
|
$
|
5,034
|
|
||
|
Deferred income tax expense (benefit):
|
|||||||||||
|
U.S. Federal
|
$
|
16,159
|
|
$
|
(2,187
|
)
|
$
|
1,648
|
|
||
|
U.S. state
|
1,160
|
|
(155
|
)
|
217
|
|
|||||
|
Canada
|
125
|
|
86
|
|
207
|
|
|||||
|
Total
|
$
|
17,444
|
|
$
|
(2,256
|
)
|
$
|
2,072
|
|
||
|
Total income tax expense (benefit):
|
|||||||||||
|
U.S. Federal
|
$
|
16,221
|
|
$
|
(1,723
|
)
|
$
|
5,329
|
|
||
|
U.S. state
|
1,375
|
|
140
|
|
1,204
|
|
|||||
|
Canada
|
1,141
|
|
(104
|
)
|
573
|
|
|||||
|
Total
|
$
|
18,737
|
|
$
|
(1,687
|
)
|
$
|
7,106
|
|
||
39
The reconciliation between the effective income tax rate and the statutory federal rate for continuing operations was as follows:
|
Year Ended December 31,
|
||||||||
|
2012
|
2011
|
2010
|
||||||
|
Statutory Federal rate
|
35.0
|
%
|
35.0
|
%
|
35.0
|
%
|
||
|
Increase (decrease) resulting from:
|
||||||||
|
State and local taxes, net
|
2.6
|
|
(1.6
|
)
|
1.2
|
|
||
|
Executive life insurance
|
0.8
|
|
(1.0
|
)
|
(1.8
|
)
|
||
|
Fines and penalties
|
0.1
|
|
0.3
|
|
(0.2
|
)
|
||
|
Meals & entertainment
|
(0.3
|
)
|
(3.0
|
)
|
0.8
|
|
||
|
Capital loss carryforward
|
—
|
|
—
|
|
3.7
|
|
||
|
Deferred tax expense
|
—
|
|
1.0
|
|
1.2
|
|
||
|
Change in valuation allowance
|
(76.0
|
)
|
(1.0
|
)
|
4.1
|
|
||
|
Change in uncertain tax positions
|
(4.6
|
)
|
(1.6
|
)
|
(1.4
|
)
|
||
|
Provision to return differences
|
1.0
|
|
(0.3
|
)
|
1.4
|
|
||
|
Other items, net
|
(1.2
|
)
|
—
|
|
(1.4
|
)
|
||
|
Provision for income taxes
|
(42.6
|
)%
|
27.8
|
%
|
42.6
|
%
|
||
Income taxes paid for the years ended
December 31, 2012
,
2011
, and
2010
amounted to
$0.2 million
,
$2.6 million
and
$5.3 million
, respectively. In
2012
,
2011
and
2010
, the Company received
$3.4 million
,
$3.3 million
and
$5.8 million
, respectively, in income tax refunds primarily related to carryback of net operating losses and recovery of income tax overpayments in prior years.
At
December 31, 2012
, the Company had
$65.6 million
of net operating losses and tax credit carryforwards. The U.S. Federal carryforwards consist of
$31.7 million
of net operating losses which are subject to expiration in
2030
and
$0.5 million
of foreign tax credit carryforwards which are subject to expiration in
2020
. In addition, the Company had
$33.4 million
of state net operating loss carryforwards which expire at varying dates through
2030
.
Primarily due to the cumulative losses that the Company recorded over the past several quarters, the Company determined that it was more likely than not that the Company will not be able to utilize its deferred tax assets to offset future taxable income. Therefore, in
2012
, the Company increased its deferred tax valuation allowance by
$33.3 million
. Substantially all future taxable income will be subject to this tax valuation allowance until the Company can establish that the recoverability of its deferred tax assets is more certain.
40
Deferred income tax assets and liabilities contain the following temporary differences:
|
(Dollars in thousands)
|
|||||||
|
December 31,
|
|||||||
|
2012
|
2011
|
||||||
|
Deferred tax assets:
|
|||||||
|
Compensation and benefits
|
$
|
14,101
|
|
$
|
16,048
|
|
|
|
Net operating loss carryforward
|
12,710
|
|
4,286
|
|
|||
|
Inventory reserve
|
3,654
|
|
2,472
|
|
|||
|
Accounts receivable reserve
|
657
|
|
723
|
|
|||
|
Property, plant and equipment
|
—
|
|
879
|
|
|||
|
Other
|
4,694
|
|
1,147
|
|
|||
|
Total deferred tax assets
|
35,816
|
|
25,555
|
|
|||
|
Deferred tax liabilities:
|
|||||||
|
Property, plant and equipment
|
738
|
|
—
|
|
|||
|
Goodwill
|
—
|
|
6,557
|
|
|||
|
Other
|
728
|
|
480
|
|
|||
|
Total deferred liabilities
|
1,466
|
|
7,037
|
|
|||
|
Net deferred assets before valuation allowance
|
34,350
|
|
18,518
|
|
|||
|
Valuation allowance
|
(34,278
|
)
|
(938
|
)
|
|||
|
Net deferred assets
|
$
|
72
|
|
$
|
17,580
|
|
|
|
Net deferred tax assets:
|
|||||||
|
Net current deferred tax assets
|
$
|
17
|
|
$
|
5,716
|
|
|
|
Net noncurrent deferred tax assets
|
55
|
|
11,864
|
|
|||
|
Net deferred assets
|
$
|
72
|
|
$
|
17,580
|
|
|
A reconciliation of the beginning and ending amount of unrecognized tax benefits is as follows:
|
(Dollars in thousands)
|
|||||||
|
December 31,
|
|||||||
|
2012
|
2011
|
||||||
|
Balance at beginning of year
|
$
|
92
|
|
$
|
—
|
|
|
|
Additions for tax positions of current year
|
1,261
|
|
92
|
|
|||
|
Additions for tax positions of prior years
|
835
|
|
—
|
|
|||
|
Reductions for tax positions of prior years
|
(92
|
)
|
—
|
|
|||
|
Settlements
|
—
|
|
—
|
|
|||
|
Balance at end of year
|
$
|
2,096
|
|
$
|
92
|
|
|
The recognition of the unrecognized tax benefits would have a favorable effect on the effective tax rate. Due to the uncertainty of both timing and resolution of income tax examinations, the Company is unable to determine whether any amounts included in the
December 31, 2012
balance of unrecognized tax benefits represent tax positions that could significantly change during the next twelve months.
The Company and its subsidiaries are subject to U.S. Federal income tax as well as income tax of multiple state and foreign jurisdictions. As of
December 31, 2012
, the Company was subject to income tax examinations in various jurisdictions for the tax years 2006 through 2011. During
2012
, the Company completed U.S. Federal income tax examinations through tax year 2009. The Company is currently under examination by the Canada Revenue Authority for the years 2006 through 2010 and the Company is complying with the information requests and procedural requirements of the examination.
41
Accrued expenses and other liabilities consisted of the following:
|
(Dollars in thousands)
|
|||||||
|
December 31,
|
|||||||
|
2012
|
2011
|
||||||
|
Accrued compensation
|
$
|
12,097
|
|
$
|
9,573
|
|
|
|
Accrued severance
|
3,467
|
|
1,187
|
|
|||
|
Accrued and withheld taxes, other than income taxes
|
1,499
|
|
2,226
|
|
|||
|
Accrued health benefits
|
1,235
|
|
1,234
|
|
|||
|
Employment tax matter
|
1,200
|
|
1,200
|
|
|||
|
Reserve for unrecognized tax benefits
|
916
|
|
102
|
|
|||
|
Financing lease obligation
|
806
|
|
623
|
|
|||
|
Accrued profit sharing
|
539
|
|
2,424
|
|
|||
|
Accrued stock based compensation
|
279
|
|
910
|
|
|||
|
Cash dividends payable
|
—
|
|
1,027
|
|
|||
|
Other
|
9,724
|
|
7,725
|
|
|||
|
$
|
31,762
|
|
$
|
28,231
|
|
||
In August 2012, the Company entered into a
five
-year,
$40.0 million
credit facility (“Credit Facility”). The Credit Facility consists of a
$40.0 million
revolving credit facility which includes a
$10.0 million
sub-facility for letters of credit. Until the later of June 30, 2014 or when the Company achieves certain financial covenants, credit available under the Credit Facility is based upon:
|
a)
|
80%
of the face amount of the Company’s eligible accounts receivables, generally less than
60
days past due, and
|
|
b)
|
50%
of the lower of cost or market value of the Company’s eligible inventory, generally inventory expected to be sold within
18
months or
$20.0 million
, whichever is less.
|
The applicable interest rate margins for borrowings under the Credit Facility are at the Prime rate or the LIBOR rate plus
2.75%
for the first year and LIBOR plus
2.50%
for the second year of the agreement. Following the second year, the interest rate will be based on the Company’s debt to EBITDA ratio and range from LIBOR plus
1.25%
to
1.85%
or Prime minus
1.00%
to
0.40%
.
The Credit Facility is secured by a first priority perfected security interest in substantially all existing assets of the Company. Dividends are restricted under the Credit Facility to amounts not to exceed
$1.1 million
per quarter subject to a formula based on EBITDA achieved in the previous quarter compared to target amounts specified in the Credit Facility.
42
In addition to other customary representations, warranties and covenants, the Credit Facility requires the Company to comply with certain financial covenants. A minimum Consolidated EBITDA level, as defined in the Credit Facility, must be achieved on a quarterly basis as detailed in the following table:
|
Quarter Ended
|
Minimum EBITDA (as Defined in the Credit Facility)
|
|||
|
December 31, 2012
|
$
|
(1,500,000
|
)
|
|
|
March 31, 2013
|
0
|
|
||
|
June 30, 2013
|
2,000,000
|
|
||
|
September 30, 2013
|
3,500,000
|
|
||
|
December 31, 2013
|
3,000,000
|
|
||
|
March 31, 2014
|
3,500,000
|
|
||
|
June 30, 2014
|
3,500,000
|
|
||
Upon meeting certain financial covenants, but not prior to June 30, 2014, the availability under the Credit Facility will be based upon the following covenants with a maximum borrowing level of
$40.0 million
:
|
a)
|
Minimum Debt Service Coverage Ratio of
1.20:1.00
measured quarterly beginning June 30, 2014 and building cumulatively to a rolling
four
quarters.
|
|
b)
|
Minimum Tangible Net Worth of not less than
90%
of the value of shareholders’ equity less intangible assets established as of June 30, 2014, tested quarterly.
|
|
c)
|
Minimum cash, accounts receivable and inventory to debt ratio of
2.0 to 1.0
.
|
For the period ended December 31, 2012, EBITDA, as defined in the Credit Facility, was
$3.4 million
which was in compliance with the minimum EBITDA covenant of
$(1.5) million
for the quarter.
At December 31, 2012, the Company had an outstanding balance of
$16.1 million
under the revolving line of credit of its Credit Facility and additional borrowing availability of
$11.6 million
. The weighted average interest rate was
2.32%
in 2012 and the outstanding balance approximates fair value.
Severance costs are primarily related to management realignment and reorganization in the MRO segment. The table below reflects the activity in the Company’s reserve for severance and related payments.
|
(Dollars in thousands)
|
|||||||||||
|
Year Ended December 31,
|
|||||||||||
|
2012
|
2011
|
2010
|
|||||||||
|
Beginning balance
|
$
|
1,282
|
|
$
|
3,062
|
|
$
|
4,086
|
|
||
|
Charged to earnings current year
|
8,021
|
|
1,614
|
|
3,629
|
|
|||||
|
Cash paid and exchange rate variance
|
(4,886
|
)
|
(3,394
|
)
|
(4,653
|
)
|
|||||
|
Ending balance
|
$
|
4,417
|
|
$
|
1,282
|
|
$
|
3,062
|
|
||
43
Accrued severance charges were included in the line items of the Consolidated Balance Sheets at
December 31, 2012
and
2011
as follows:
|
(Dollars in thousands)
|
|||||||
|
December 31,
|
|||||||
|
2012
|
2011
|
||||||
|
Accrued severance included in:
|
|||||||
|
Accrued expenses and other liabilities
|
$
|
3,467
|
|
$
|
1,187
|
|
|
|
Noncurrent other
|
950
|
|
95
|
|
|||
|
Total accrued severance
|
$
|
4,417
|
|
$
|
1,282
|
|
|
The remaining benefits outstanding as of
December 31, 2012
will be fully paid by the end of 2014.
The Company provides a 401(k) defined contribution plan to allow employees a pre-tax investment vehicle to save for retirement. Beginning January 1, 2012, the Company began contributing matching funds to the 401(k) plan and made contributions of
$1.7 million
for the year ended
December 31, 2012
.
The Company has a retirement plan with a profit sharing feature for certain sales, office and warehouse employees. The amounts of the Company’s annual contributions are determined annually by the Board of Directors. Expenses incurred for the profit sharing plan were
$0.5 million
,
$2.5 million
and
$2.4 million
for the years ended
December 31, 2012
,
2011
and
2010
, respectively.
The Company has a security bonus plan for the benefit of its sales representatives, under the terms of which participants are credited with a percentage of their yearly net commissions. The aggregate amounts credited to participants’ accounts vest
25%
after
five
years and an additional
5%
vests each year thereafter upon qualification for the plan. For financial reporting purposes, amounts are charged to operations over the vesting period. Expenses incurred for the security bonus plan were
$2.1 million
,
$2.1 million
and
$1.9 million
for the years ended
December 31, 2012
,
2011
and
2010
, respectively.
Lease Commitments
Total rental expense for the years ended
December 31, 2012
,
2011
and
2010
amounted to
$2.5 million
,
$0.8 million
and
$1.4 million
, respectively. In March 2012, the Company began leasing its new headquarters. The operating lease for the headquarters expires in March 2023 and at December 31, 2012, includes total future minimum lease payments of
$11.4 million
. In June 2012, the Company began leasing its
10
year build-to-suit lease for the new McCook Facility which expires in June 2022 and includes future minimum lease payments, related to the building, of
$12.1 million
.
44
The Company’s future minimum lease commitments, principally for facilities and equipment, as of
December 31, 2012
, were as follows:
|
Year ended December 31,
|
Operating Leases
|
Financing Lease
(1)
|
Capital
Leases
|
|||||||||
|
2013
|
$
|
1,709
|
|
$
|
1,047
|
|
$
|
121
|
|
|||
|
2014
|
1,292
|
|
1,085
|
|
96
|
|
||||||
|
2015
|
1,229
|
|
1,124
|
|
8
|
|
||||||
|
2016
|
1,261
|
|
1,165
|
|
4
|
|
||||||
|
2017
|
1,305
|
|
1,255
|
|
—
|
|
||||||
|
Thereafter
|
7,394
|
|
6,440
|
|
—
|
|
||||||
|
Total
|
$
|
14,190
|
|
$
|
12,116
|
|
$
|
229
|
|
|||
|
Less: Interest portion
|
(524
|
)
|
(18
|
)
|
||||||||
|
Liability
|
$
|
11,592
|
|
$
|
211
|
|
||||||
(1) Relates to the McCook, Illinois distribution center lease.
The financing lease obligation will be amortized over the
10
year lease term.
At
December 31, 2012
the cost and accumulated depreciation of the asset related to the financing obligation were
$13.0 million
and
$0.7 million
, respectively, and the cost and accumulated amortization of the assets related to capital leases were
$1.7 million
and
$1.5 million
, respectively.
Litigation, regulatory and tax matters
The Company is involved in legal actions that arise in the ordinary course of business. It is the opinion of management that the resolution of any currently pending litigation will not have a material adverse effect on the Company’s financial position or results of operations.
One of the Company’s subsidiaries, Drummond American LLC (“Drummond”), is under an employment tax examination for the years 2007 and 2008 of the long-standing treatment of its sales representatives as independent contractors. In January 2012 the Company received a Notice of Proposed Adjustment in the amount of
$9.5 million
, including penalties, from the IRS challenging Drummond’s position that the sales representatives were independent contractors. The Company disagreed with the IRS position and filed an administrative appeal with the IRS Appeals Office.
Although the Company intends to vigorously defend its position for the treatment of its sales representatives as independent contractors, the Company established a liability of
$1.2 million
during 2011 as its best estimate of the cost to resolve the matter with the IRS. The notice of Proposed Adjustment was determined by applying the full statutory rates and penalties, rather than applying the reduced tax rates provided by section 3509 of the Internal Revenue Code (“IRC”). The Company believes the use of reduced tax rates is mandatory for all IRS worker classification assessments, except when the employer intentionally disregarded its employment tax obligations. Because the Company believes it fully complied with its employment tax obligations, the Company based its estimated loss at the reduced tax rates. The Company applied these reduced tax rates against only one year because any settlement resolution would likely be limited to one year as this is consistent with the IRS’s settlement practices. The Company has assessed its potential exposure for other subsidiaries and time periods and has concluded that an additional liability is not probable. No adjustment has been proposed by the IRS for any other time periods or subsidiaries of the Company.
The case has been assigned to the Chicago Appeals Office. The Company is unable to establish an estimated time frame in which the case will be resolved through the appeals process. An unfavorable outcome of this matter could have a material adverse effect on the Company's business, financial condition and results of operations.
In 2012, the Company identified that a site owned by its Automatic Screw Machine Products (“ASMP”) subsidiary in Alabama contained hazardous substances in the soil and groundwater as a result of historical operations prior to the Company's ownership. The Company has retained an environmental consulting firm to further investigate the contamination including the measurement and monitoring of the site. At this time insufficient data regarding the situation has been collected to reasonably estimate the cost, if any, of remedying this situation. Accordingly, the Company has not established a reserve for any remediation
45
costs.
In 2012, the Company contracted with a third party for the installation of material handling equipment in the Company's new McCook, Illinois distribution center. The third party, in turn, hired subcontractors to complete the project. Certain of the subcontractors have not yet been paid in full which could result in the the subcontractors to file mechanic's liens against the property. While such liens would be the responsibility of the third party, the Company could, under certain circumstances, be required to satisfy any unpaid obligations. The Company has estimated its possible net exposure in the range of
zero
to
$1.0
million. The Company believes an unfavorable outcome related to this situation is not probable, accordingly, no amount has been accrued in the accompanying financial statements.
In 2009, the Company identified certain services and benefits that were not properly reported on information returns with respect to its independent sales representatives. The Company notified the Internal Revenue Service Employment Tax Division and established procedures to improve proper information reporting practices. As of December 31, 2012, the Company believes that this matter has been substantively resolved.
The Company's 2009 Equity Compensation Plan (“Equity Plan”) provides for the grant of nonqualified and incentive stock options, stock awards and stock units to officers and employees of the Company. The Equity Plan also provides for the grant of option rights and restricted stock to non-employee directors. Under the Equity Plan,
500,000
shares of common stock were available to be awarded with no participant being granted more than
40,000
shares of common stock in any calendar year. As of
December 31, 2012
, the Company had approximately
190,000
shares of common stock still available under the Equity Plan. The Equity Plan is administered by the Compensation Committee of the Board of Directors, or its designee, which as administrator of the plan, has the authority to select plan participants, grant awards, and determine the terms and conditions of the awards.
Stock Performance Rights
The Company has a Stock Performance Rights Plan (“SPR Plan”) that provides for the issuance of Stock Performance Rights (“SPRs”) that allow non-employee directors, officers and key employees to receive cash awards, subject to certain restrictions, equal to the appreciation of the Company's common stock. The SPR Plan is administered by the Compensation Committee of the Board of Directors.
SPRs entitle the recipient to receive a cash payment equal to the excess of the market value of the Company's common stock over the SPR exercise price when the SPRs are surrendered. Expense, equal to the fair market value of the SPR at the measurement date, is recorded ratably over the vesting period. Employees and non-employee directors who are retirement eligible, defined as age
65
or older, are permitted to retain their awards after retirement and exercise them during the remaining contractual life. All expense is recognized on the date of grant for SPRs granted to retirement eligible recipients. Compensation expense or benefit is included in Selling, general and administrative expense. A majority of the outstanding SPRs have a
seven
or
ten
year life and vest ratably over
three years
beginning on the first anniversary of the date of the grant. However,
100,000
of the SPRs vest the later of September 24, 2013 or if the market price of the Company's common shares increases to at least
$11.92
per share before September 24, 2022.
On
December 31, 2012
, the SPRs outstanding were re-measured at fair value using the Black-Scholes valuation model for the service only based SPRs and using a binomial lattice method for the SPRs with a market price vesting requirement. These models require the input of subjective assumptions that may have a significant impact on the fair value estimate. The weighted-average estimated value of SPRs outstanding as of
December 31, 2012
was
$4.01
per SPR using the following assumptions:
|
Expected volatility
|
49.4% to 71.1%
|
|
Risk-free rate of return
|
0.1% to 0.9%
|
|
Expected term (in years)
|
0.3 to 5.7
|
|
Expected annual dividend
|
$0
|
The expected volatility was based on the historic volatility of the Company's stock price commensurate with the expected life of the SPR. The risk-free rate of return reflects the interest rate offered for zero coupon treasury bonds over the expected life of the SPR. The expected life represents the period of time that options granted are expected to be outstanding and was
46
calculated using the simplified method allowed by the SEC due to insufficient historical data for the service only based SPRs and was derived based on the binomial lattice model results at the date of grant for the SPRs with a market price vesting requirement. The estimated annual dividend was based on the recent dividend payout trend.
A benefit of
$0.6 million
and
$1.1 million
was recognized for the years ended
December 31, 2012
and
2011
, respectively, as the overall decline in the fair value of the SPRs exceeded the amortization expense related to the unvested SPRs. Compensation expense of
$0.8 million
was recorded for the year ended
December 31, 2010
. No cash has been paid out for SPR exercises during the three year period ended
December 31, 2012
.
Activity related to the Company’s SPRs during the year ended December 31, 2012 was as follows:
|
Weighted
|
||||||
|
Number
|
Average
|
|||||
|
of SPRs
|
Exercise Price
|
|||||
|
Outstanding on December 31, 2011
|
276,200
|
|
$
|
27.58
|
|
|
|
Granted
|
340,000
|
|
7.62
|
|
||
|
Cancelled
|
(99,500
|
)
|
23.28
|
|
||
|
Outstanding on December 31, 2012
|
516,700
|
|
15.28
|
|
||
|
Exercisable on December 31, 2012
|
175,833
|
|
$
|
30.08
|
|
|
The SPRs outstanding had an intrinsic value of
$0.8 million
as of December 31, 2012. Unrecognized compensation cost related to non-vested SPRs was
$1.7 million
at December 31, 2012, which will be recognized over a weighted average period of
3.1
years. During the year ended December 31, 2012,
85,866
SPRs with an immaterial fair value vested. At December 31, 2012, the weighted average remaining contractual term was
6.5
years for all outstanding SPRs and
4.1
years for the all exercisable SPRs.
Restricted Stock Awards
Restricted stock awards ("RSAs") generally vest ratably over a
one
to
three
year period beginning on the first anniversary of the date of the grant. On each vesting date the vested restricted stock awards are exchanged for an equal number of the Company’s common stock. Common stock received by the participant cannot be transferred until either the end of the three year term or employment with the Company is terminated without cause. The participants have no voting or dividend rights with the restricted stock awards or the common shares received through vesting until the final vesting date unless they leave the Company without cause. The restricted stock awards are valued at the closing price of the common stock on the date of grant and the expense is recorded ratably over the vesting period.
Activity related to the Company’s RSAs during the year ended December 31, 2012 was as follows:
|
Restricted Stock
|
|
|
Awards
|
|
|
Outstanding on December 31, 2011
(1)
|
69,171
|
|
Granted
|
70,587
|
|
Exchanged for common shares
|
(34,084)
|
|
Cancelled
|
(31,856)
|
|
Outstanding on December 31, 2012
|
73,818
|
(1) Includes
5,781
RSAs earned under a long-term performance incentive plan.
An expense of
$0.7 million
,
$0.7 million
and
$0.5 million
was recorded in Selling, general and administrative expenses in 2012, 2011 and 2010, respectively. As of December 31, 2012, there was
$0.4 million
of total unrecognized compensation cost related to RSAs that will be recognized over a weighted average period of
0.8
years. The awards granted in 2012 had a weighted average grant date fair value of
$12.73
per share.
47
Stock Awards and Stock Options
In 2012 the Company issued stock awards which entitle the holder to receive shares of the Company’s common stock equal in value to the appreciation in the Company’s common stock from the exercise price of
$10.00
up to the date the holder exercises the award. The
140,000
outstanding stock awards vest on December 31, 2014 and expire on October 2, 2017.
As of December 31, 2012, the Company had
12,198
vested non-qualified stock options outstanding with a weighted average exercise price of
$14.05
and an expiration date of December 31, 2019. Each stock option can be exchanged for one share of the Company’s common stock.
In 2012, in conjunction with the construction of a new distribution center in McCook, Illinois and the relocation of the Company’s headquarters to Chicago, Illinois, the Company sold
four
properties; its Addison, Illinois distribution center, its Vernon Hills, Illinois distribution center, its former Des Plaines, Illinois headquarters and a Des Plaines, Illinois administrative building. The Company received cash proceeds of
$12.3 million
for the sale of the four properties, which were included in the MRO segment, resulting in a gain of
$3.7 million
. Operations currently conducted at the Addison, Illinois, distribution center will be transferred to the new McCook, Illinois facility during the first half of 2013. The Company has entered into arrangements to lease these facilities back from the buyer for transition purposes until the second quarter of 2013.
In addition to these four property sales, the Company allowed the lease of another Des Plaines, Illinois facility to expire during the second quarter of 2012.
In 2010, the Company sold its Dallas, Texas distribution center receiving cash proceeds of
$2.0 million
resulting in a gain of
$1.7 million
.
Other Operating (Income) Expenses consisted of the following:
|
(Dollars in thousands)
|
|||||||||||
|
Year Ended December 31,
|
|||||||||||
|
2012
|
2011
|
2010
|
|||||||||
|
Employment tax matter
|
$
|
—
|
|
$
|
1,200
|
|
$
|
—
|
|
||
|
Impairment of long-lived assets
|
—
|
|
1,146
|
|
—
|
|
|||||
|
Legal settlement
|
—
|
|
—
|
|
(4,050
|
)
|
|||||
|
Ending balance
|
$
|
—
|
|
$
|
2,346
|
|
$
|
(4,050
|
)
|
||
In 2011, the Company recorded a
$1.2 million
expense for the estimated cost of settling an employment tax matter related to the classification of the sales representatives of one of the Company’s subsidiaries. For further details, see
Note 12 – Commitments and Contingencies
.
Also in 2011, an impairment charge of
$1.1 million
was incurred related to certain assets in our OEM segment. For further details, see
Note 6 – Impairment of Long-Lived Assets
.
In 2010, the Company recorded a
$4.1 million
benefit related to proceeds received from a settlement agreement and legal remedies related to the actions of several former sales representatives and the Share Corporation (“Share”) alleging, among other things, breach of contract and interference with customer relationships. In exchange for the proceeds, the Company agreed to settle all related claims with Share and the former sales representatives.
Assembly Component Systems, Inc.
In 2010, the Company sold substantially all of the assets of Assembly Component Systems, Inc. (“ACS”), a wholly owned subsidiary, to Supply Technologies LLC (“Supply Technologies”), a wholly owned company of Park-Ohio Holdings Corp. Under terms of the Asset Purchase Agreement, Supply Technologies purchased substantially all of the assets of ACS for
$19.0 million
48
plus the assumption of certain liabilities. Of the total consideration,
$16.0 million
was paid to Lawson in cash on September 1, 2010. The remaining balance was subject to the terms of a subordinated promissory note between Supply Technologies and Lawson which has been paid in full as of December 31, 2012. A
$3.5 million
pre-tax loss on the sale was recorded in 2010.
Rutland Tool & Supply Company, Inc.
In 2010, the Company sold substantially all of the assets of Rutland Tool & Supply Company, Inc. to Sid Tool Co. Inc., a wholly owned subsidiary of MSC Industrial Direct Co., Inc., for approximately
$11.0 million
in cash plus the assumption of certain liabilities. A
$0.4 million
pre-tax loss on the sale was recorded in 2010.
The computation of basic and diluted earnings (loss) per share consisted of the following:
|
(Dollars in thousands, except per share data)
|
|||||||||||
|
Year Ended December 31,
|
|||||||||||
|
2012
|
2011
|
2010
|
|||||||||
|
Weighted average shares:
|
|||||||||||
|
Basic weighted average shares outstanding
|
8,589
|
|
8,553
|
|
8,522
|
|
|||||
|
Effect of dilutive securities outstanding
|
—
|
|
—
|
|
15
|
|
|||||
|
Diluted weighted average shares outstanding
|
8,589
|
|
8,553
|
|
8,537
|
|
|||||
|
Earnings (loss):
|
|||||||||||
|
Continuing operations
|
$
|
(62,717
|
)
|
$
|
(4,389
|
)
|
$
|
9,590
|
|
||
|
Discontinued operations
|
167
|
|
(235
|
)
|
(2,653
|
)
|
|||||
|
Net income (loss)
|
$
|
(62,550
|
)
|
$
|
(4,624
|
)
|
$
|
6,937
|
|
||
|
Basic earnings (loss) per share of common stock:
|
|||||||||||
|
Continuing operations
|
$
|
(7.30
|
)
|
$
|
(0.51
|
)
|
$
|
1.13
|
|
||
|
Discontinued operations
|
0.02
|
|
(0.03
|
)
|
(0.32
|
)
|
|||||
|
Net income (loss)
|
$
|
(7.28
|
)
|
$
|
(0.54
|
)
|
$
|
0.81
|
|
||
|
Diluted earnings (loss) per share of common stock:
|
|||||||||||
|
Continuing operations
|
$
|
(7.30
|
)
|
$
|
(0.51
|
)
|
$
|
1.12
|
|
||
|
Discontinued operations
|
0.02
|
|
(0.03
|
)
|
(0.31
|
)
|
|||||
|
Net income (loss)
|
$
|
(7.28
|
)
|
$
|
(0.54
|
)
|
$
|
0.81
|
|
||
The effect of
23 thousand
and
55 thousand
restricted share awards outstanding and future stock option exercises for the years ended
December 31, 2012
and
2011
, respectively, would have been anti-dilutive and therefore, were excluded from the computation of diluted earnings per share.
The Company’s Chairman of the Board, Dr. Port, was a partner in
two
partnerships that had an interest in Lawson’s common stock. During 2010, litigation was initiated against Dr. Port, requesting that the partnerships be changed to allow the partners to have more control over their respective shares. The suit named Dr. Port as a defendant based on his role in the partnerships and as a Director of the Company. The Company was not a party to the lawsuit.
In March, 2011 the litigation was settled with assets distributed under the terms of a settlement agreement and all parties agreed to release Dr. Port, individually and as a Director of the Company, from any and all claims related to the litigation. In 2011 and 2010 the Company incurred
$0.1 million
and
$0.7 million
, respectively, for legal services provided to Dr. Port in relation to this litigation.
49
The Company has two operating segments: MRO and OEM. The Company’s MRO segment is a distributor of products and services to the industrial, commercial, institutional, and governmental maintenance repair and operations marketplace. The Company’s OEM segment manufactures, sells and distributes production and specialized component parts to the original equipment marketplace. The Company’s
two
reportable segments are distinguished by the nature of products distributed and sold, types of customers and manner of servicing them. The Company evaluates performance and allocates resources to reportable segments primarily based on operating income. The accounting policies of the segments are the same as those described in
Note 2 – Summary of Significant Accounting Policies
.
Financial information for the Company’s reportable segments from continuing operations consisted of the following:
|
(Dollars in thousands)
|
|||||||||||
|
Year Ended December 31,
|
|||||||||||
|
2012
|
2011
|
2010
|
|||||||||
|
Net sales
|
|||||||||||
|
MRO
|
$
|
273,562
|
|
$
|
300,399
|
|
$
|
303,138
|
|
||
|
OEM
|
16,925
|
|
14,560
|
|
13,642
|
|
|||||
|
Consolidated total
|
$
|
290,487
|
|
$
|
314,959
|
|
$
|
316,780
|
|
||
|
Operating income (loss)
|
|||||||||||
|
MRO
|
$
|
(12,461
|
)
|
$
|
(2,466
|
)
|
$
|
14,522
|
|
||
|
OEM
|
1,918
|
|
952
|
|
283
|
|
|||||
|
Severance expenses
|
(8,021
|
)
|
(1,614
|
)
|
(3,629
|
)
|
|||||
|
Gain (loss) on sale of assets
|
3,721
|
|
(22
|
)
|
1,701
|
|
|||||
|
Goodwill impairment
|
(28,306
|
)
|
—
|
|
—
|
|
|||||
|
Other operating income (expense)
|
—
|
|
(2,346
|
)
|
4,050
|
|
|||||
|
Consolidated total
|
(43,149
|
)
|
(5,496
|
)
|
16,927
|
|
|||||
|
Interest expense
|
(775
|
)
|
(681
|
)
|
(391
|
)
|
|||||
|
Other income (expense), net
|
(56
|
)
|
101
|
|
160
|
|
|||||
|
Income (loss) from continuing operations before income taxes
|
$
|
(43,980
|
)
|
$
|
(6,076
|
)
|
$
|
16,696
|
|
||
|
Capital expenditures
|
|||||||||||
|
MRO
|
$
|
18,127
|
|
$
|
11,066
|
|
$
|
10,038
|
|
||
|
OEM
|
374
|
|
66
|
|
10
|
|
|||||
|
Consolidated total
|
$
|
18,501
|
|
$
|
11,132
|
|
$
|
10,048
|
|
||
|
Depreciation and amortization
|
|||||||||||
|
MRO
|
$
|
7,085
|
|
$
|
5,342
|
|
$
|
5,900
|
|
||
|
OEM
|
49
|
|
362
|
|
406
|
|
|||||
|
Consolidated total
|
$
|
7,134
|
|
$
|
5,704
|
|
$
|
6,306
|
|
||
|
Total assets
|
|||||||||||
|
MRO
|
$
|
162,011
|
|
$
|
194,422
|
|
$
|
210,273
|
|
||
|
OEM
|
10,498
|
|
10,336
|
|
9,749
|
|
|||||
|
Segment total
|
172,509
|
|
204,758
|
|
220,022
|
|
|||||
|
Corporate
|
72
|
|
17,580
|
|
15,743
|
|
|||||
|
Discontinued operations
|
350
|
|
410
|
|
619
|
|
|||||
|
Consolidated total
|
$
|
172,931
|
|
$
|
222,748
|
|
$
|
236,384
|
|
||
50
Financial information related to the Company’s continuing operations by geographic area consisted of the following:
|
(Dollars in thousands)
|
|||||||||||
|
Year Ended December 31,
|
|||||||||||
|
2012
|
2011
|
2010
|
|||||||||
|
Net sales
|
|||||||||||
|
United States
|
$
|
262,121
|
|
$
|
285,071
|
|
$
|
288,054
|
|
||
|
Canada
|
28,366
|
|
29,888
|
|
28,726
|
|
|||||
|
Consolidated total
|
$
|
290,487
|
|
$
|
314,959
|
|
$
|
316,780
|
|
||
|
Long-lived assets
|
|||||||||||
|
United States
|
$
|
63,904
|
|
$
|
49,353
|
|
$
|
41,006
|
|
||
|
Canada
|
3,251
|
|
3,349
|
|
3,436
|
|
|||||
|
Consolidated total
|
$
|
67,155
|
|
$
|
52,702
|
|
$
|
44,442
|
|
||
Net sales are attributed to countries based on the location of customers. Long-lived assets consist of property, plant and equipment.
51
Unaudited quarterly results of operations for the years ended December 31, 2012 and 2011 are summarized as follows:
|
(Dollars in thousands, except per share data)
|
|||||||||||||||
|
2012 Quarter Ended
|
|||||||||||||||
|
Dec. 31
|
Sept. 30
|
June 30
|
Mar. 31
|
||||||||||||
|
Net sales
|
$
|
68,193
|
|
$
|
71,984
|
|
$
|
74,348
|
|
$
|
75,962
|
|
|||
|
Gross profit
|
39,672
|
|
43,360
|
|
36,816
|
|
41,334
|
|
|||||||
|
Income (loss) from continuing operations
(1)
|
$
|
1,524
|
|
$
|
(1,316
|
)
|
$
|
(61,140
|
)
|
$
|
(1,785
|
)
|
|||
|
Income (loss) from discontinued operations
|
199
|
|
(2
|
)
|
(17
|
)
|
(13
|
)
|
|||||||
|
Net income (loss)
|
$
|
1,723
|
|
$
|
(1,318
|
)
|
$
|
(61,157
|
)
|
$
|
(1,798
|
)
|
|||
|
Basic income (loss) per share of common stock:
|
|||||||||||||||
|
Continuing operations
|
$
|
0.18
|
|
$
|
(0.15
|
)
|
$
|
(7.12
|
)
|
$
|
(0.21
|
)
|
|||
|
Discontinued operations
(2)
|
0.02
|
|
—
|
|
—
|
|
—
|
|
|||||||
|
Net income (loss)
(2)
|
$
|
0.20
|
|
$
|
(0.15
|
)
|
$
|
(7.12
|
)
|
$
|
(0.21
|
)
|
|||
|
Diluted income (loss) per share of common stock:
|
|||||||||||||||
|
Continuing operations
|
$
|
0.18
|
|
$
|
(0.15
|
)
|
$
|
(7.12
|
)
|
$
|
(0.21
|
)
|
|||
|
Discontinued operations
(2)
|
0.02
|
|
—
|
|
—
|
|
—
|
|
|||||||
|
Net income (loss)
(2)
|
$
|
0.20
|
|
$
|
(0.15
|
)
|
$
|
(7.12
|
)
|
$
|
(0.21
|
)
|
|||
|
2011 Quarter Ended
|
|||||||||||||||
|
Dec. 31
|
Sept. 30
|
June 30
|
Mar. 31
|
||||||||||||
|
Net sales
|
$
|
72,860
|
|
$
|
75,366
|
|
$
|
84,154
|
|
$
|
82,579
|
|
|||
|
Gross profit
|
38,993
|
|
42,546
|
|
48,299
|
|
49,939
|
|
|||||||
|
Income (loss) from continuing operations
(3)
|
$
|
(5,373
|
)
|
$
|
(2,154
|
)
|
$
|
1,088
|
|
$
|
2,050
|
|
|||
|
Loss from discontinued operations
|
(174
|
)
|
(9
|
)
|
(22
|
)
|
(30
|
)
|
|||||||
|
Net income (loss)
|
$
|
(5,547
|
)
|
$
|
(2,163
|
)
|
$
|
1,066
|
|
$
|
2,020
|
|
|||
|
Basic income (loss) per share of common stock:
|
|||||||||||||||
|
Continuing operations
(2)
|
$
|
(0.63
|
)
|
$
|
(0.25
|
)
|
$
|
0.13
|
|
$
|
0.24
|
|
|||
|
Discontinued operations
(2)
|
(0.02
|
)
|
—
|
|
(0.01
|
)
|
—
|
|
|||||||
|
Net income (loss)
(2)
|
$
|
(0.65
|
)
|
$
|
(0.25
|
)
|
$
|
0.12
|
|
$
|
0.24
|
|
|||
|
Diluted income (loss) per share of common stock:
|
|||||||||||||||
|
Continuing operations
(2)
|
$
|
(0.63
|
)
|
$
|
(0.25
|
)
|
$
|
0.13
|
|
$
|
0.24
|
|
|||
|
Discontinued operations
(2)
|
(0.02
|
)
|
—
|
|
(0.01
|
)
|
(0.01
|
)
|
|||||||
|
Net income (loss)
(2)
|
$
|
(0.65
|
)
|
$
|
(0.25
|
)
|
$
|
0.12
|
|
$
|
0.23
|
|
|||
|
(1)
|
Income from operations for the three month ended December 31, 2012 includes a
$1.6 million
gain from sale of assets. Loss from continuing operations for the three months ended June 30, 2012 includes a
$28.3
million charge for goodwill impairment, a
$2.1
million gain on sale of assets,
$6.8
million of severance expenses and a
$33.5
million increase in deferred tax asset valuation allowance.
|
|
(2)
|
The sum of the quarterly earnings per share amounts may not equal the total annual earnings per share due to rounding and the uneven timing of earnings throughout the year compared to the weighted average shares outstanding.
|
|
(3)
|
Loss from continuing operations for the three months ended December 31, 2011 includes an
$0.8
million net expense for the estimated cost of settling an employment tax matter and a net
$0.8
million asset impairment charge.
|
52
Lawson Products, Inc.
Schedule II -Valuation and Qualifying Accounts
The roll forward of valuation accounts were as follows:
|
(Dollars in thousands)
|
|||||||||||||||
|
Description
|
Balance at Beginning of Period
|
Charged to Costs and Expenses
|
Deductions
|
Balance at End of Period
|
|||||||||||
|
Allowance for doubtful accounts:
|
|||||||||||||||
|
Year ended December 31, 2012
|
$
|
1,912
|
|
$
|
1,556
|
|
$
|
(1,781
|
)
|
(1)
|
$
|
1,687
|
|
||
|
Year ended December 31, 2011
|
1,085
|
|
1,500
|
|
(673)
|
|
(1)
|
1,912
|
|
||||||
|
Year ended December 31, 2010
|
882
|
|
883
|
|
(680)
|
|
(1)
|
1,085
|
|
||||||
|
Allowance for excess and obsolete inventory:
|
|||||||||||||||
|
Year ended December 31, 2012
|
$
|
5,046
|
|
$
|
4,246
|
|
$
|
(746
|
)
|
(2)
|
$
|
8,546
|
|
||
|
Year ended December 31, 2011
|
4,711
|
|
1,103
|
|
(768)
|
|
(2)
|
5,046
|
|
||||||
|
Year ended December 31, 2010
|
4,748
|
|
110
|
|
(147)
|
|
(2)
|
4,711
|
|
||||||
|
Valuation allowance for deferred tax assets:
|
|||||||||||||||
|
Year ended December 31, 2012
|
$
|
938
|
|
$
|
33,340
|
|
$
|
—
|
|
$
|
34,278
|
|
|||
|
Year ended December 31, 2011
|
875
|
|
63
|
|
—
|
|
938
|
|
|||||||
|
Year ended December 31, 2010
|
1,744
|
|
—
|
|
(869)
|
|
(3)
|
875
|
|
||||||
|
(1)
|
Uncollected receivables written off, net of recoveries and translation adjustment.
|
|
(2)
|
Disposal of excess and obsolete inventory and translation adjustment.
|
|
(3)
|
Capital loss carryforward written off.
|
53
None.
Evaluation of Disclosure Controls and Procedures
Under the supervision and with the participation of our senior management, including our Chief Executive Officer and Chief Financial Officer, we conducted an evaluation of the effectiveness of the design and operation of our disclosure controls and procedures, as defined in Rules 13a-15(e) and 15d-15(e) under the Securities Exchange Act of 1934, as amended (the “Exchange Act”), as of the end of the period covered by this annual report (the “Evaluation Date”). Based on this evaluation, our Chief Executive Officer and Chief Financial Officer concluded as of the Evaluation Date that our disclosure controls and procedures were effective such that (i) the information relating to Lawson, including our consolidated subsidiaries, required to be disclosed in our SEC reports is recorded, processed, summarized and reported within the time periods specified in SEC rules and forms, and (ii) include, without limitation, controls and procedures designed to ensure that information required to be disclosed is accumulated and communicated to our management, including our Chief Executive Officer and Chief Financial Officer, as appropriate to allow timely decisions regarding required disclosure.
Management’s Report on Internal Control over Financial Reporting
Management is responsible for establishing and maintaining an adequate system of internal control over financial reporting as defined in Rules 13a-15(f) and 15d-15(f) under the Securities Exchange Act of 1934, as amended, for Lawson Products, Inc. and subsidiaries (the “Company”). This system is designed to provide reasonable assurance regarding the reliability of financial reporting and the preparation of financial statements for external purposes in accordance with U.S. generally accepted accounting principles.
The Company’s internal control over financial reporting includes those policies and procedures that (i) pertain to the maintenance of records that, in reasonable detail, accurately and fairly reflect the transactions and dispositions of the assets of the Company; (ii) provide reasonable assurance that transactions are recorded as necessary to permit preparation of financial statements in accordance with generally accepted accounting principles, and that receipts and expenditures of the Company are being made only in accordance with authorizations of management and directors of the Company; and (iii) provide reasonable assurance regarding prevention or timely detection of unauthorized acquisition, use, or disposition of the Company’s assets that could have a material effect on the financial statements.
Because of its inherent limitations, internal control over financial reporting may not prevent or detect misstatements and even when determined to be effective, can only provide reasonable assurance with respect to financial statement preparation and presentation. Also, projection of any evaluation of the effectiveness of internal control over financial reporting to future periods is subject to the risk that controls may become inadequate because of changes in conditions, or that the degree of compliance with the policies or procedures may deteriorate.
Management, with the participation of the Company’s Chief Executive Officer and Chief Financial Officer, evaluated the effectiveness of the Company’s internal control over financial reporting as of December 31, 2012. In making this evaluation, management used the criteria set forth by the Committee of Sponsoring Organizations of the Treadway Commission (COSO) in
Internal Control — Integrated Framework.
Based on this assessment, management concluded that the Company’s internal control over financial reporting was effective as of December 31, 2012. The Company’s independent registered public accounting firm, Ernst & Young LLP, has audited and issued a report on the Company’s internal controls over financial reporting as set forth in this annual report.
54
Report of Independent Registered Public Accounting Firm
To the Board of Directors and Stockholders of
Lawson Products, Inc.
We have audited Lawson Products, Inc.’s (the “Company”) internal control over financial reporting as of December 31, 2012 based on criteria established in Internal Control — Integrated Framework issued by the Committee of Sponsoring Organizations of the Treadway Commission (the “COSO” criteria). Lawson Products, Inc.’s management is responsible for maintaining effective internal control over financial reporting and for its assessment of the effectiveness of internal control over financial reporting included in the accompanying Management’s Report on Internal Control Over Financial Reporting. Our responsibility is to express an opinion on the effectiveness of the Company’s internal control over financial reporting based on our audit.
We conducted our audit in accordance with the standards of the Public Company Accounting Oversight Board (United States). Those standards require that we plan and perform the audit to obtain reasonable assurance about whether effective internal control over financial reporting was maintained in all material respects. Our audit included obtaining an understanding of internal control over financial reporting, assessing the risk that a material weakness exists, testing and evaluating the design and operating effectiveness of internal control based on the assessed risk, and performing such other procedures as we considered necessary in the circumstances. We believe that our audit provides a reasonable basis for our opinion.
A company’s internal control over financial reporting is a process designed to provide reasonable assurance regarding the reliability of financial reporting and the preparation of financial statements for external purposes in accordance with generally accepted accounting principles. A company’s internal control over financial reporting includes those policies and procedures that (1) pertain to the maintenance of records that, in reasonable detail, accurately and fairly reflect the transactions and dispositions of the assets of the company; (2) provide reasonable assurance that the transactions are recorded as necessary to permit preparation of financial statements in accordance with generally accepted accounting principles, and that receipts and expenditures of the company are being made only in accordance with authorizations of management and directors of the company; and (3) provide reasonable assurance regarding prevention or timely detection of unauthorized acquisition, use, or disposition of the company’s assets that could have a material effect on the financial statements.
Because of its inherent limitations, internal control over financial reporting may not prevent or detect misstatements. Also, projections of any evaluation of effectiveness to future periods are subject to the risk that controls may become inadequate because of changes in conditions, or that the degree of compliance with the policies or procedures may deteriorate.
In our opinion, Lawson Products, Inc. maintained, in all material respects, effective internal control over financial reporting as of December 31, 2012, based on the COSO criteria.
We also have audited, in accordance with the standards of the Public Company Accounting Oversight Board (United States), the consolidated balance sheets of Lawson Products, Inc. as of December 31, 2012 and 2011 and the related consolidated statements of operations and comprehensive income (loss), changes in stockholders’ equity, and cash flows for each of the three years in the period ended December 31, 2012 and our report dated
February 25, 2013
expressed an unqualified opinion thereon.
/s/ Ernst & Young LLP
Chicago, Illinois
February 25, 2013
55
Changes in Internal Controls
There were no changes in our internal control over financial reporting that occurred during the last fiscal quarter that have materially affected, or are reasonably likely to materially affect, our internal control over financial reporting.
None.
a.
Directors
The information required by this Item is set forth in the Company’s Proxy Statement for the Annual Meeting of Stockholders to be held on
May 14, 2013
, under the caption “Election of Directors” and “Section 16(a) Beneficial Ownership Reporting Compliance,” which information is incorporated herein by reference.
b.
Executive Officers
The information required by this Item is set forth under the caption Item 1 —
Business
under “Executive Officers of the Registrant.”
c.
Audit Committee
Information on the Company’s Audit Committee is contained under the caption “Board of Directors Meetings and Committees” in the Company’s Proxy Statement for the Annual Meeting of Stockholders to be held on
May 14, 2013
, which is incorporated herein by reference.
The Board of Directors has determined that Thomas Postek, member of the Audit Committee of the Board of Directors, qualifies as an “audit committee financial expert” as defined in Item 407(d)(5)(ii) of Regulation S-K, and that Mr. Postek is “independent” as the term is defined in the listing standards of the NASDAQ Global Select Market.
d.
Code of Business Conduct
The Company has adopted a Code of Business Conduct applicable to all employees and sales representatives. The Company’s Code of Business Conduct is applicable to senior financial executives including the principal executive officer, principal financial officer and principal accounting officer of the Company. The Company’s Code of Business Conduct is available on the Corporate Governance page in the Investor Relations section of the Company’s website at
www.lawsonproducts.com
. The Company intends to post on its website any amendments to, or waivers from its Code of Business Conduct applicable to senior financial executives. The Company will provide any persons with a copy of its Code of Business Conduct without charge upon written request directed to the Company’s Secretary at the Company’s address.
The information required by this Item is set forth in the Company’s Proxy Statement for the Annual Meeting of Stockholders to be held on
May 14, 2013
, under the caption “Remuneration of Executive Officers,” which information is incorporated herein by reference.
56
The information required by this Item is set forth in the Company’s Proxy Statement for the Annual Meeting of Stockholders to be held on
May 14, 2013
under the caption “Securities Beneficially Owned by Principal Stockholders and Management” which information is incorporated herein by reference.
Equity Compensation Plan Information
The following table provides information as of
December 31, 2012
regarding the number of shares of common stock that were available for issuance under the Company’s equity compensation plans.
|
Plan category
|
Number of securities to be issued upon exercise of outstanding options, warrants and rights
(1)
|
Weighted-average exercise price of outstanding options, warrants and rights
(1) (2)
|
Number of securities remaining available for future issuance under equity compensation plans (excluding securities reflected in the first column)
|
||
|
Equity compensation plans approved by security holders
|
226,016
|
$10.32
|
190,090
|
||
|
Equity compensation plans not approved by security holders
|
—
|
—
|
—
|
||
|
Total
|
226,016
|
$10.32
|
190,090
|
||
|
(1)
|
Includes common stock to cover conversion of 73,818 restricted stock awards, 12,198 stock options and 140,000 stock awards.
|
|
(2)
|
Weighted-average exercise price of 12,198 stock options and 140,000 stock awards.
|
The information required by this Item is set forth in the Company’s Proxy Statement for the Annual Meeting of Stockholders to be held on
May 14, 2013
under the caption “Election of Directors” and “Certain Relationships and Related Transactions” which information is incorporated herein by reference.
The information required under this Item is set forth in the Company’s Proxy Statement for the Annual Meeting of Stockholders to be held on
May 14, 2013
under the caption “Fees Paid to Independent Auditors” which information is incorporated herein by reference.
(a) (1) See Index to Financial Statements in Item 8 on page 28.
(2) See Schedule II in Item 8 on page 53.
(3) See the Exhibit Index immediately following the signature page of this Annual Report on Form 10-K.
57
SIGNATURES
Pursuant to the requirements of Section 13 or 15(d) of the Securities Exchange Act of 1934, the registrant has duly caused this report to be signed on its behalf by the undersigned, thereunto duly authorized.
|
LAWSON PRODUCTS, INC
|
||
|
By:
|
/s/ Michael G. DeCata
|
|
|
Michael G. DeCata
|
||
|
President, Chief Executive Officer
|
||
|
(principal executive officer)
|
||
|
Date:
|
February 25, 2013
|
|
|
By:
|
/s/ Ronald J. Knutson
|
|
|
Ronald J. Knutson
|
||
|
Executive Vice President, Chief Financial Officer
|
||
|
(principal financial and accounting officer)
|
||
|
Date:
|
February 25, 2013
|
|
Pursuant to the requirements of the Securities Exchange Act of 1934, this report has been signed below this 25th day of February, 2013, by the following persons on behalf of the registrant and in the capacities indicated.
|
Signature
|
Title
|
|
|
/s/ Ronald B. Port
|
Chairman of the Board
|
|
|
Ronald B. Port
|
||
|
/s/ Andrew B. Albert
|
Director
|
|
|
Andrew B. Albert
|
||
|
/s/ I. Steven Edelson
|
Director
|
|
|
I. Steven Edelson
|
||
|
/s/ James S. Errant
|
Director
|
|
|
James S. Errant
|
||
|
/s/ Lee S. Hillman
|
Director
|
|
|
Lee S. Hillman
|
||
|
/s/ Thomas S. Postek
|
Director
|
|
|
Thomas S. Postek
|
||
|
/s/ Robert G. Rettig
|
Director
|
|
|
Robert G. Rettig
|
||
|
/s/ Wilma J. Smelcer
|
Director
|
|
|
Wilma J. Smelcer
|
||
58
EXHIBIT INDEX
|
Exhibit
Number
|
Description of Exhibit
|
|
|
3.1
|
Certificate of Incorporation of the Company, as amended, incorporated herein by reference to Exhibit 3(a) to the Company’s Annual Report on Form 10-K for the fiscal year ended December 31, 1988.
|
|
|
3.2
|
Amended and Restated By-laws of the Company, incorporated herein by reference to the Company’s Current Report on Form 8-K dated October 20, 2009.
|
|
|
10.1*
|
Amended and Restated Executive Deferral Plan, incorporated herein by reference from Exhibit 10(c)(7) to the Company’s Annual Report on Form 10-K for the fiscal year ended December 31, 1995.
|
|
|
10.2*
|
Lawson Products, Inc. Stock Performance Plan, incorporated herein by reference from Exhibit 10(c)(8) to the Company’s Annual Report on Form 10-K for the fiscal year ended December 31, 2000.
|
|
|
10.3*
|
Lawson Products, Inc. Long-Term Capital Accumulation Plan, incorporated herein by reference to Exhibit 10(c)(10) to the Company’s Current Report on Form 8-K dated October 21, 2004.
|
|
|
10.4*
|
Form of Shareholder Value Appreciation Rights Award Agreement, incorporated by reference to Exhibit 10(c)(14) to the Company’s Annual Report on Form 10-K for the fiscal year ended December 31, 2004.
|
|
|
10.5*
|
Form Letter regarding Stock Performance Rights, incorporated by reference to Exhibit 10(c)(16) to the Company’s Annual Report on Form 10-K for the fiscal year ended December 31, 2004.
|
|
|
10.6*
|
Executive Employment Agreement dated December 5, 2005 between the Company and Stewart Howley, incorporated herein by reference to Exhibit 10.11 to the Company’s Annual Report on Form 10-K for the fiscal year ended December 31, 2008.
|
|
|
10.7*
|
Employment Agreement dated February 29, 2008 between the Company and Harry Dochelli, incorporated herein by reference to Exhibit 10.12 to the Company’s Annual Report on Form 10-K for the fiscal year ended December 31, 2008.
|
|
|
10.8*
|
Lawson Products, Inc. Long-Term Incentive Plan, incorporated herein by reference to Exhibit 10.1 to the Company’s Current Report on Form 8-K dated May 13, 2008.
|
|
|
10.9*
|
Form of Indemnification Agreement for Directors and Officers incorporated herein by reference to the Company’s Current Report on Form 8-K dated September 15, 2008.
|
|
|
10.10
|
Amendment No. 1 to Lawson Products, Inc. Long-Term Capital Accumulation Plan, incorporated by reference to Exhibit 10.1 to the Company’s Current Report on Form 8-K dated February 12, 2009.
|
|
|
10.11*
|
Form of Amended and Restated Award Agreement, incorporated by reference to Exhibit 10.2 to the Company’s Current Report on Form 8-K dated February 12, 2009.
|
|
|
10.12*
|
Amended and Restated Employment Agreement dated as of February 12, 2009 by and between the Company and Thomas Neri, incorporated by reference to Exhibit 10.3 to the Company’s Current Report on Form 8-K dated February 12, 2009.
|
|
|
10.13*
|
Amended and Restated Employment Agreement dated as of February 12, 2009 by and between the Company and Neil E. Jenkins, incorporated by reference to Exhibit 10.4 to the Company’s Current Report on Form 8-K dated February 12, 2009.
|
|
59
|
10.14
|
Amendment No. 1 to Deferred Prosecution Agreement dated July 31, 2009, incorporated by reference to Exhibit 10.1 to the Company’s Current Report on Form 8-K dated July 31, 2009.
|
|
|
10.15
|
Credit Agreement dated as of August 21, 2009, by and among Lawson Products, Inc. and certain of its subsidiaries and The PrivateBank and Trust Company, incorporated by reference to Exhibit 10.1 to the Company’s Current Report on Form 8-K dated August 21, 2009 and with all exhibits and schedules, incorporated by reference to Exhibit 10.2 to the Company’s Current Report on Form 8-K dated January 29, 2010.
|
|
|
10.16
|
Consent, Waiver and First Amendment to the Credit Agreement dated December 31, 2009 between the Company and The PrivateBank and Trust Company, incorporated herein by reference to Exhibit 10.1 to the Company’s Current Report on Form 8-K dated December 31, 2009.
|
|
|
10.17*
|
Change in Control Agreement dated January 29, 2010 between the Company and Mr. Ronald Knutson, incorporated herein by reference to Exhibit 10.1 to the Company’s Current Report on Form 8-K dated January 29, 2010.
|
|
|
10.18*
|
Second Amendment to the Credit Agreement dated January 29, 2010 between the Company and The PrivateBank and Trust Company, incorporated herein by reference to Exhibit 10.1 to the Company’s Current Report on Form 8-K dated January 29, 2010.
|
|
|
10.19
|
Consent, Waiver and Third Amendment to the Credit Agreement dated September 1, 2010 between the Company and The PrivateBank and Trust Company, incorporated herein by reference to Exhibit 10.1 to the Company’s Current Report on Form 8-K dated August 31, 2010.
|
|
|
10.20
|
Consent, Waiver and Fourth Amendment to the Credit Agreement dated December 10, 2010 between the Company and The PrivateBank and Trust Company, incorporated herein by reference to Exhibit 10.1 to the Company’s Current Report on Form 8-K dated December 10, 2010.
|
|
|
10.21
|
Fifth Amendment to the Credit Agreement dated September 30, 2011 between the Company and The PrivateBank and Trust Company, incorporated herein by reference to Exhibit 10.1 to the Company’s Current Report on Form 8-K dated September 30, 2011.
|
|
|
10.22
|
Sixth Amendment to the Credit Agreement dated December 29, 2011 between the Company and The PrivateBank and Trust Company, incorporated herein by reference to Exhibit 10.1 to the Company’s Current Report on Form 8-K dated December 29, 2011.
|
|
|
10.23
|
Loan and Security Agreement dated August 8, 2012 between the Company and The PrivateBank and Trust Company, incorporated herein by reference to Exhibit 10.1 to the Company’s Current Report on Form 8-K dated August 8, 2012.
|
|
|
10.24*
|
Employment Agreement dated as of August 29, 2012 by and between Lawson Products, Inc., an Illinois corporation, and Thomas Neri, incorporated herein by reference to Exhibit 10.1 to the Company’s Current Report on Form 8-K dated August 29, 2012.
|
|
|
10.25*
|
Employment Agreement dated as of August 29, 2012 by and between Lawson Products, Inc., an Illinois corporation, and Neil E. Jenkins, incorporated herein by reference to Exhibit 10.2 to the Company’s Current Report on Form 8-K dated August 29, 2012.
|
|
|
10.26*
|
Employment Agreement dated as of August 29, 2012 by and between Lawson Products, Inc., an Illinois corporation, and Ron Knutson, incorporated herein by reference to Exhibit 10.3 to the Company’s Current Report on Form 8-K dated August 29, 2012.
|
|
|
10.27*
|
Employment Agreement dated as of October 16, 2012 by and between Lawson Products, Inc., an Illinois corporation, and Michael G. DeCata, incorporated herein by reference to Exhibit 10.1 to the Company’s Current Report on Form 8-K dated October 16, 2012.
|
|
|
21
|
Subsidiaries of the Company.
|
|
60
|
23
|
Consent of Ernst & Young LLP.
|
|
|
31.1
|
Certification of Chief Executive Officer pursuant to 18 U.S.C. Section 1350 as adopted pursuant to Section 302 of the Sarbanes-Oxley Act of 2002.
|
|
|
31.2
|
Certification of Chief Financial Officer pursuant to 18 U.S.C. Section 1350 as adopted pursuant to Section 302 of the Sarbanes-Oxley Act of 2002.
|
|
|
32
|
Certification of Chief Executive Officer and Chief Financial Officer pursuant to 18 U.S.C. Section 1350 as adopted pursuant to Section 906 of the Sarbanes-Oxley Act of 2002.
|
|
|
101.INS **
|
XBRL Instance Document
|
|
|
101.SCH **
|
XBRL Taxonomy Extension Schema Document
|
|
|
101.CAL **
|
XBRL Taxonomy Extension Calculation Linkbase Document
|
|
|
101.LAB **
|
XBRL Taxonomy Extension Label Linkbase Document
|
|
|
101.PRE **
|
XBRL Taxonomy Extension Presentation Linkbase Document
|
|
*
Indicates management employment contracts or compensatory plans or arrangements.
** Furnished but not filed
61
TABLE OF CONTENTS
Part IItem 1. BusinessItem 1A. Risk FactorsItem 1B. Unresolved Staff CommentsItem 2. PropertiesItem 3. Legal ProceedingsItem 4. Mine Safety DisclosuresPart IIItem 5. Market For Registrant S Common Equity, Related Stockholder Matters and Issuer Purchases Of Equity SecuritiesItem 6. Selected Financial DataItem 7A. Quantitative and Qualitative Disclosures About Market RiskItem 8. Financial Statements and Supplementary DataNote 1 - Description Of BusinessNote 2 - Summary Of Significant Accounting PoliciesNote 3 InventoriesNote 4 - Property, Plant and EquipmentNote 5 GoodwillNote 6 Impairment Of Long-lived AssetsNote 7 Income TaxesNote 8 - Accrued Expenses and Other LiabilitiesNote 9 Revolving Line Of CreditNote 10 Reserve For SeveranceNote 11 - Retirement and Security Bonus PlansNote 12 - Commitments and ContingenciesNote 13 Stock Compensation PlansNote 14 Sale Of PropertiesNote 15 - Other Operating Expenses (income)Note 16 Discontinued OperationsNote 17 Earnings (loss) Per ShareNote 18 Related Party TransactionNote 19 Segment ReportingNote 20 - Summary Of Unaudited Quarterly Results Of OperationsItem 9. Changes in and Disagreements with Accountants on Accounting and Financial DisclosureItem 9A. Controls and ProceduresItem 9B. Other InformationPart IIIItem 10. Directors, Executive Officers and Corporate GovernanceItem 11. Executive CompensationItem 12. Security Ownership Of Certain Beneficial Owners and Management and Related Stockholder MattersItem 13. Certain Relationships and Related Transactions, and Director IndependenceItem 14. Principal Accounting Fees and ServicesPart IVItem 15. Exhibits, Financial Statement Schedules