DISTRIBUTION SOLUTIONS GROUP, INC.
10-Ks and 10-Qs
|
|
|
|
|
|
|
|
|
|
|
|
|
|
|
|
|
|
|
|
|
|
|
|
|
|
|
|
|
|
|
|
|
|
|
|
|
|
|
|
|
|
|
|
|
|
|
|
|
|
|
|
|
|
|
|
|
|
|
|
|
|
UNITED STATES SECURITIES AND EXCHANGE COMMISSION
Washington, D.C. 20549
Form 10-K
|
(Mark One)
|
|
|
þ
|
ANNUAL REPORT PURSUANT TO SECTION 13 OR 15(d) OF THE SECURITIES EXCHANGE ACT OF 1934
|
|
For the fiscal year ended December 31, 2013
|
|
|
or
|
|
|
o
|
TRANSITION REPORT PURSUANT TO SECTION 13 OR 15(d) OF THE SECURITIES EXCHANGE ACT OF 1934
|
|
For the transition period from to
|
|
Commission file number: 0-10546
 LAWSON PRODUCTS, INC.
(Exact Name of Registrant as Specified in Charter)
|
Delaware
|
36-2229304
|
|
|
(State or other jurisdiction of
|
(I.R.S. Employer
|
|
|
incorporation or organization)
|
Identification No.)
|
|
8770 W. Bryn Mawr Avenue, Suite 900, Chicago, Illinois 60631
(Address of principal executive offices)
Registrant’s telephone number, including area code:
(773) 304-5050
Securities registered pursuant to Section 12(b) of the Act:
|
Title of Each Class
|
Name of Each Exchange on Which Registered
|
|
|
Common Stock, $1.00 par value
|
The NASDAQ Stock Market LLC
(NASDAQ Global Select Market)
|
|
Securities registered pursuant to Section 12(g) of the Act:
None
(Title of class)
Indicate by check mark if the registrant is a well-known seasoned issuer, as defined in Rule 405 of the Securities Act. Yes
o
No
þ
Indicate by check mark if the registrant is not required to file reports pursuant to Section 13 or Section 15(d) of the Exchange Act. Yes
o
No
þ
Indicate by check mark whether the registrant (l) has filed all reports required to be filed by section 13 or 15(d) of the Securities Exchange Act of 1934 during the preceding 12 months (or for such shorter period that the Registrant was required to file such reports), and (2) has been subject to such filing requirements for the past 90 days. Yes
þ
No
o
Indicate by check mark whether the registrant has submitted electronically and posted on its corporate Web site, if any, every Interactive Data File required to be submitted and posted pursuant to Rule 405 of Regulation S-T (§ 232.405 of this chapter) during the preceding 12 months (or for such shorter period that the registrant was required to submit and post such files). Yes
þ
No
o
Indicate by check mark if disclosure of delinquent filers pursuant to Item 405 of Regulation S-K (§ 229.405 of this chapter) is not contained herein, and will not be contained, to the best of registrant’s knowledge, in definitive proxy or information statements incorporated by reference in Part III of this Form 10-K or any amendment to this Form 10-K.
o
Indicate by check mark whether the registrant is a large accelerated filer, an accelerated filer, a non-accelerated filer, or a smaller reporting company. See the definitions of “large accelerated filer,” “accelerated filer” and “smaller reporting company” in Rule 12b-2 of the Exchange Act. (Check one)
|
Large accelerated filer
o
|
Accelerated filer
þ
|
|
Non-accelerated filer
o
(Do not check if a smaller reporting company)
|
Smaller reporting Company
o
|
Indicate by check mark whether the registrant is a shell company (as defined by Rule 12b-2 of the Exchange Act).
Yes
o
No
þ
The aggregate market value of the registrant’s voting stock held by non-affiliates on June 28, 2013 (based upon the per share closing price of $12.84) was
approximately $73,389,000.
As of January 31, 2014, 8,658,885 shares of Common Stock were outstanding.
DOCUMENTS INCORPORATED BY REFERENCE
The following documents are incorporated into this Form 10-K by reference:
Part III incorporates information by reference to the registrant’s definitive proxy statement, to be filed with the Securities and Exchange Commission within 120 days after the close of the fiscal year.
TABLE OF CONTENTS
|
Page #
|
||
“Safe Harbor” Statement under the Securities Litigation Reform Act of 1995:
This Annual Report on Form 10-K contains certain forward-looking statements within the meaning of the Private Securities Litigation Reform Act of 1995 that involve risks and uncertainties. The terms “may,” “should,” “could,” “anticipate,” “believe,” “continues,” “estimate,” “expect,” “intend,” “objective,” “plan,” “potential,” “project” and similar expressions are intended to identify forward-looking statements. These statements are not guarantees of future performance and involve risks, uncertainties and assumptions that are difficult to predict. These statements are based on management’s current expectations, intentions or beliefs and are subject to a number of factors, assumptions and uncertainties that could cause actual results to differ materially from those described in the forward-looking statements. Factors that could cause or contribute to such differences or that might otherwise impact the business include the risk factors set forth in Item 1A of this Form 10-K.
The Company undertakes no obligation to update any such factor or to publicly announce the results of any revisions to any forward-looking statements contained herein whether as a result of new information, future events or otherwise.
2
Lawson Products, Inc. (“Lawson”, the “Company”, “we”, “our”, or “us”) was incorporated in Illinois in 1952, and reincorporated in Delaware in 1982. Lawson serves the industrial, commercial, institutional and government maintenance, repair and operations ("MRO") market.
Vision
Our vision is to be our customers' first choice for maintenance, repair and operational solutions that improve their operating performance. We plan to achieve our vision by working closely with our customers to maintain and enhance their operations by providing them with quality products, superior service and innovative solutions.
Industry and Competition
The MRO industrial distribution industry is comprised of companies that buy and stock products in bulk and supply these products to customers on an as needed basis. The customer benefits from lower costs and the convenience of ordering smaller quantities maintained by MRO suppliers. We estimate that total annual revenue generated by the North American MRO marketplace exceeds
$130 billion
.
There is a significant amount of fragmentation by geography and product within the industry. We encounter competition from several national distributors and manufacturers and a large number of regional and local distributors. Some competitors have greater financial and personnel resources, handle more extensive lines of merchandise, operate larger facilities and price some merchandise more competitively than we do.
We offer our customers quality products and provide them with deep product knowledge and product application expertise. Our broad geographic sales coverage allows us to serve large multi-location customers. We compete for business primarily by offering a value-added service approach to vendor managed inventory ("VMI") in which our highly trained sales representatives manage the product inventory for our customers. The VMI model makes it less likely that our customers will unintentionally run out of a product while optimizing their inventory levels.
Customers
During
2013
, we sold products to approximately
70,000
customers and no customer accounted for more than
three percent
of net sales. In
2013
, approximately
89%
of our net sales were generated in the United States and approximately
11%
in Canada. Our customers operate in a variety of industries including automotive repair, commercial vehicle maintenance, government, manufacturing, food processing, distribution, construction, oil and gas, mining, wholesale, service and others. Although seasonality is not significant in our business, due to fewer selling days during the holiday season, net sales in the fourth quarter are historically slightly lower than the first three quarters of the year.
Our customers include a wide range of purchasers of industrial supply products from small repair shops to large national and governmental accounts. Historically, we have been very effective selling to and servicing small and medium sized customers that value our service approach.
Operations
Sales orders are primarily generated from the VMI service provided by our sales representatives; however, customers can also order directly from our website or through our customer service team via fax or phone. We ship products to customers in all 50 states, Puerto Rico, Canada, Mexico and the Caribbean. We normally ship to our customers within one day of order placement.
Our MRO distribution process normally entails the purchase of product from suppliers in bulk for delivery to our packaging and distribution facility in McCook, Illinois (“McCook Facility”) for possible repackaging, labeling or cross-docking. Product is then either stocked in the McCook Facility or delivered to one of four additional regionally located distribution centers in Georgia, Nevada, New Jersey, and Ontario. As orders are received, product is picked, packed and delivered to our customers. Many factors affect the efficiency of this process including the physical design of the distribution centers, routing logistics, the number of times the product needs to be handled, transportation costs and the flexibility to meet the requirements of our customers.
3
Products
Our product offerings are listed on our website and in catalogs distributed to our customers. Sales percentages by broad categories of our product mix in
2013
were as follows:
|
Product Category
|
Percentage
|
|
|
Fastening systems
|
21%
|
|
|
Specialty chemicals
|
16%
|
|
|
Fluid power
|
15%
|
|
|
Cutting tools and abrasives
|
15%
|
|
|
Electrical
|
11%
|
|
|
Aftermarket automotive supplies
|
7%
|
|
|
Safety
|
4%
|
|
|
Welding and metal repair
|
3%
|
|
|
Other
|
8%
|
|
|
100%
|
||
We offer approximately
300,000
different core products for sale of which approximately
50,000
products are maintained in inventory. We strive to carry sufficient inventory to ensure product availability and rapid processing of customer orders. Accurate forecasting of customer demand is essential to establish the proper level of inventory for each product. Inventory levels need to be sufficient to meet customer demand while avoiding the costs of stocking excess items.
During
2013
, we purchased products from over
2,000
suppliers and no single supplier accounted for more than
10%
of our purchases. The loss of one of our core suppliers could affect our operations by hindering our ability to provide full service to our customers.
Our quality control department tests our product offerings to ensure they meet our customers' specifications. We recommend solutions to help customers maximize product performance and avoid costly product failures. Our engineering department provides technical support for our products and offers on-site problem solutions. They also develop and present product safety and technical training seminars tailored to meet our customers' needs. Safety Data Sheets are maintained electronically and are available to our customers on our website 24 hours a day, seven days a week.
Sales Team
Our total sales team consists of approximately
1,040
individuals focused on servicing existing customers, identifying new customers, providing customer service support and providing on-site customer service. Of our total sales team, over
800
are sales representatives who are primarily organized into geographical regions. The performance of each region is the responsibility of a Regional Sales Director. Each region is further divided into geographically defined districts. The performance of each district is the responsibility of a District Sales Manager who reports to the Regional Sales Director. Our District Sales Managers work with the sales representatives to generate sales from new and existing customers. We also have a team dedicated to the acquisition of larger national accounts and a team dedicated to serving our governmental accounts. The national accounts are comprised of multi-location customers with a national scope. We have also assigned employees to concentrate solely on new mid-market accounts.
Our sales team receives education in the best uses of our products, enabling them to provide customized solutions to address our customers' needs including technical expertise and on-site problem resolution. This includes on-site visits to help manage customer inventories, introducing cost saving ideas to improve our customers' profitability and regularly analyzing and replenishing inventory to prevent unnecessary purchases and unplanned downtime. The sales team also periodically provides product demonstrations to our customers that are designed to exhibit how our products can improve their productivity. Additionally, we offer customized storage systems and software applications to our customers for improved organization and a more efficient work-flow.
4
Employees
Our organization supports a culture of continuous improvement and emphasizes the importance of addressing the needs of our customers. We encourage our employees to be results driven, team oriented and progressive. We require our employees to act with integrity in every aspect of our business.
As of December 31, 2013, our workforce included approximately
1,540
individuals, comprised of approximately
1,040
in sales and marketing, approximately
390
in operations and distribution and approximately
110
in management and administration. Approximately
10%
of our workforce is covered by three collective bargaining agreements. We believe that our relations with our employees and their collective bargaining organizations are good.
Recent Accomplishments
Over the past few years we have undertaken a number of strategic initiatives that have transformed the foundation of our business including:
•
Transforming our U.S. based sales team from an independent agent model to a company employee based model;
•
Introducing new sales tools including our redesigned website and mobile web applications;
•
Consolidating our distribution network and opening our custom designed, state-of-the-art McCook Facility;
•
Replacing our legacy information systems with a comprehensive enterprise resource planning ("ERP") system; and
•
Focusing our attention exclusively on our MRO operations by disposing of non-core, lower margin businesses.
These investments have fundamentally changed our organization, creating a scalable infrastructure that will allow us to take full advantage of future growth opportunities.
2014 Strategic Focus
In 2014, our focus will be to grow our top line sales while continuing to make further operational improvements to enhance our customers' purchasing experience.
Grow sales
Our sales are directly affected by the size of our sales team and its territorial coverage. In 2013, we began to increase the size of our sales team, adding
49
net new sales representatives, to a total of
806
at December 31, 2013. In 2014, we plan to continue to aggressively expand our sales representative count by approximately 15% to 20% by the end of the year. Our plan to expand our sales force is designed to identify under-served territories that offer the greatest potential growth opportunity, locate and recruit talented sales representatives, provide them with the proper training, and successfully integrate them into our organization.
To acquire the best new sales talent and prepare them for success, we developed an extensive talent acquisition strategy. We are using both internal and external resources to identify and recruit the best available sales talent. We will also be adding additional District Sales Managers and will realign our territorial districts to accommodate the new sale representatives.
Our training programs have been enhanced and expanded to provide the new employees with the tools they need to maximize their sales potential. We have software in place to closely monitor the progress of the new sales representatives and identify and address any potential issues in a timely manner.
As we increase our sales coverage, we anticipate a short-term decrease in average sales per day per sales representative, as new representatives build up customer relationships in their territories. Our 2014 financial results also may be impacted by increased training and other costs related to the sales force expansion. However, we believe that these short-term investments will result in future opportunities as we leverage the impact of top-line growth over our fixed operating costs.
5
Continually improve operations
We will continue to leverage our past investments in the McCook Facility and our ERP system with a concentrated effort on improving our customer order completeness rate, improving our network customer service levels and decreasing our customer backorders. Significant improvement was made in these areas during 2013 to solidify the operating foundation of the Company. That focus will continue throughout 2014.
Additionally, management has committed to a plan to integrate a Lean Six Sigma process of continuous improvement into varying aspects of our business. Lean Six Sigma is a set of tools that allow a project team to analyze and improve selected business processes. The project teams work with the process owner to develop statistical measures to evaluate the effectiveness of the process, document the current components and process flow, examine the root cause and effect of current operations, design and implement new ways to improve performance and then measure the results for effectiveness.
In 2013 we initiated Lean Six Sigma in a select number of processes that offered us the best potential return. In 2014, we plan to expand the scope of our Lean Six Sigma initiative, train additional employees in the methodology and identify additional processes with the highest potential for improvement.
We believe our emphasis on continual improvement will lead to a further reduction in error rates, increased processing speed, reduction in cycle times, standardization of procedures, and elimination of waste so we can become a more efficient and effective organization that provides our customers with the best purchasing experience possible.
Available Information
We file or furnish annual reports on Form 10-K, quarterly reports on Form 10-Q, current reports on Form 8-K and file or furnish amendments to those reports pursuant to Section 13(a) or 15(d) of the Exchange Act and Section 16 reports with the Securities and Exchange Commission (“SEC”). The public can obtain copies of these materials by visiting the SEC's Public Reference Room at 100 F Street, NE, Washington DC 20549 or by accessing the SEC's website at http://www.sec.gov. The public may obtain information on the operation of the SEC's Public Reference Room by calling (800) SEC-0330. In addition, as soon as reasonably practicable after such materials are filed with or furnished to the SEC, we make copies available to the public free of charge through our website at
www.lawsonproducts.com.
Information on our website is not incorporated by reference into this report. We also make available, on our website, the charters of the committees of our Board of Directors, our Code of Business Conduct and our Corporate Governance Principles.
6
Executive Officers of the Registrant
The executive officers of Lawson as of February 10, 2014 were as follows:
|
Name
|
Age
|
Year First Elected to Present Office
|
Position
|
|||
|
Michael G. DeCata
|
56
|
2012
|
President and Chief Executive Officer
|
|||
|
Neil E. Jenkins
|
64
|
2004
|
Executive Vice President, Secretary and General Counsel
|
|||
|
Ronald J. Knutson
|
50
|
2012
|
Executive Vice President, Chief Financial Officer
|
|||
|
Allen D. Jacobson
|
50
|
2014
|
Senior Vice President, Sales
|
|||
|
Shane T. McCarthy
|
45
|
2012
|
Senior Vice President, Operations
|
|||
|
Michael R. Tuvell
|
42
|
2012
|
Senior Vice President, Finance; Treasurer and Controller
|
|||
|
Christian D. Wiltrout
|
40
|
2013
|
Senior Vice President, Marketing, Product Management and Strategic Planning
|
|||
Biographical information for the past five years relating to each of our executive officers is set forth below.
Mr. DeCata
was elected President and Chief Executive Officer in September 2012. Mr. DeCata previously served in a consulting capacity for several private equity firms, including Hamilton Robinson Capital Partners from 2009 until 2012. Mr. DeCata served as President of The Chefs' Warehouse from 2006 until 2009. Prior to 2006, Mr. DeCata held several senior level positions with W.W. Grainger, United Rentals and General Electric. Mr. DeCata previously served on the Board of Directors of Crescent Electric Supply Company from 2008 to 2013.
Mr. Jenkins
was elected Executive Vice President, Secretary and General Counsel in 2004.
Mr. Knutson
was elected Executive Vice President, Chief Financial Officer effective July 2012 and joined the Company as Senior Vice President, Chief Financial Officer effective November 2009. Mr. Knutson served as Senior Vice President, Chief Financial Officer of Frozen Food Express Industries, Inc. from January 2009 to November 2009.
Mr. Jacobson
was elected Senior Vice President, Sales effective February 2014. Mr. Jacobson served as Vice President, Sales from December 2008 to February 2014.
Mr. McCarthy
was elected Senior Vice President, Operations in July of 2012 and previously had served as Vice President of Distribution and Logistics from April 2008 to June 2012.
Mr. Tuvell
was elected Senior Vice President, Finance; Treasurer and Controller in July 2012 and served as Vice President, Finance from March 2008 to June 2012.
Mr. Wiltrout
was elected Senior Vice President, Marketing, Product Management and Strategic Planning in July 2013 and served as Senior Vice President, Supply Chain and Planning from July 2012 to July 2013 and as Vice President, Product Management and Marketing from 2008 to 2012.
7
In addition to the other information in this Annual Report on Form 10-K for the fiscal year ended
December 31, 2013
, the following factors should be considered in evaluating Lawson's business. Our operating results depend upon many factors and are subject to various risks and uncertainties. The material risks and uncertainties known to us and described below may negatively affect our business operations or affect our financial results. Additional risks and uncertainties not presently known to us or that we currently deem immaterial may also impair our business operations or affect our financial results.
Our results of operations may be adversely impacted by a downturn in the economy.
Any decline or uncertainty in the strength of the economy may lead to a decrease in customer spending and may cause certain customers to cancel or delay placing orders. Some of our customers may file for bankruptcy protection, preventing us from collecting on accounts receivable and may result in our stocking excess inventory. Contractions in the credit markets may also cause some of our customers to experience difficulties in obtaining financing, leading to lower sales, delays in the collection of receivables and result in an increase in bad debt expense.
Adverse economic conditions could also affect our key suppliers and contractors. This could lead to us incurring additional expenses or result in delays in shipping products to our customers. Economic uncertainty can make it difficult for us to accurately predict future order activity and affect our ability to effectively manage inventory levels and identify risks that may affect our business. Our ability to finance our operations by borrowing through our current Loan and Security Agreement ("Loan Agreement") could also be at risk if the lender is unable to provide funds under the terms of the agreement due to a bankruptcy or a restructuring. There are no assurances that we would be able to establish alternative financing or obtain financing with terms similar to our present Loan Agreement.
Failure to adequately fund our operating and working capital needs through cash generated from operations and cash available through our Loan Agreement could negatively impact our ability to invest in the business and maintain our capital structure.
Our business requires investment in working capital and fixed assets. We fund these investments from cash generated from operations and funds available from our Loan Agreement. At
December 31, 2013
, we had
$16.1 million
of borrowings on the revolving line of credit and additional borrowing availability of
$17.9 million
. Failure to generate sufficient cash flow from operations or from our Loan Agreement could cause us to have insufficient funds to operate our business. Adequate funds may not be available when needed or may not be available on favorable terms. Net proceeds from the subsequent sale of Automatic Screw Machine Products ("ASMP") in the first quarter of 2014 were used to pay down outstanding borrowings.
Failure to meet the covenant requirements of our Loan Agreement could lead to higher financing costs, increased restrictions and reduce or eliminate our ability to borrow funds.
Our Loan Agreement contains financial and other restrictive covenants. These covenants could adversely affect us by limiting our financial and operating flexibility as well as our ability to plan for and react to market conditions and to meet our capital needs. Failure to meet these covenant requirements could lead to higher financing costs, increased restrictions, or reduce or eliminate our ability to borrow funds. If we require more liquidity than is currently available to us under our Loan Agreement, we may need to raise additional funds through debt or equity offerings which may not be available when needed or may not be available on terms favorable to us. Should funding be insufficient at any time in the future, we may be unable to develop or enhance our products or services, take advantage of business opportunities or respond to competitive pressures, any of which could have a material adverse effect on our business, financial condition and results of operations.
The market price of our common stock may decline.
Our stock price could decrease if our financial performance is inadequate or does not meet investors' expectations, if there is deterioration in the overall market for equities, if large amounts of shares are sold in the market or if investors have concerns that our business, financial condition, results of operations and capital requirements are negatively impacted by an economic downturn.
A significant portion of our inventory may become obsolete.
Our business strategy requires us to carry a significant amount of inventory in order to meet rapid processing of customer orders. If our inventory forecasting and production planning processes result in inventory levels exceeding the levels demanded
8
by customers or should our customers decrease their orders with us, our operating results could be adversely affected due to costs of carrying the inventory and additional inventory write-downs for excess and obsolete inventory.
Work stoppages and other disruptions at transportation centers or shipping ports may adversely affect our ability to obtain inventory and make deliveries to our customers.
Our ability to rapidly process customer orders is an integral component of our overall business strategy. Interruptions at our company operated facilities or disruptions at a major transportation center or shipping port, due to events such as severe weather, labor interruptions, natural disasters, acts of terrorism or other events, could affect our ability to maintain core products in inventory, deliver products to our customers on a timely basis or adversely affect demand for our products, which may in turn adversely affect our results of operations.
Changes in our customers, product mix and pricing strategy could cause our gross margin percentage to decline in the future.
From time to time, we have experienced changes in product mix and inventory costs. When our product mix changes, there can be no assurance that we will be able to maintain our historical gross profit margins. Changes in our customers, product mix, volume of orders or the prices charged could cause our gross profit margin percentage to decline. We expect that our gross margin percentage will be under pressure in the future as we continue to increase the percentage of national accounts in our customer base.
Increases in energy costs and the cost of raw materials used in our products could impact our cost of goods and distribution and occupancy expenses, which may result in lower operating margins.
Increases in the cost of raw materials used in our products (e.g., steel, brass) and increases in energy costs raise the production costs of our vendors. Those vendors typically look to pass the higher costs along to us through price increases. If we are unable to fully pass these increased prices and costs through to our customers or to modify our activities, the impact would have an adverse effect on our operating profit margins.
Disruptions of our information and communication systems could adversely affect the Company.
We depend on our information and communication systems to process orders, purchase and manage inventory, maintain cost-effective operations, sell and ship products, manage accounts receivable collections and service our customers. Disruptions in the operation of information and communication systems can occur due to a variety of factors including power outages, hardware failure, programming faults and human error. Disruptions in the operation of our information and communication systems, whether over a short or an extended period of time or affecting one or multiple distribution centers, could have a material adverse effect on our business, financial condition and results of operations.
Cyber attacks or other information security breaches could have a material adverse effect on our operating results and financial condition, subject us to additional legal costs and damage our reputation in the marketplace.
We are increasingly dependent on digital technology to process and record financial and operating data and communicate with our employees and business partners. During the normal course of business we receive, retain and transmit certain confidential information that our customers provide to us to purchase products or services or otherwise communicate with us.
Our technologies, systems, networks, and those of our business partners may become the target of cyber attacks or information security breaches that could result in the unauthorized release, misuse, loss or destruction of proprietary and other information, or other disruption of our business operations, subject us to additional legal costs and damage our reputation in the marketplace. Although to date we have not experienced any losses relating to cyber attacks, there can be no assurance that we will not suffer such losses in the future. As cyber threats continue to evolve, we may be required to expend additional resources to continue to modify or enhance our protective measures or to investigate and fix any information security vulnerabilities.
The inability to successfully recruit, integrate and retain productive sales representatives could adversely affect our operating results.
We have committed to a plan to aggressively increase the size of our sales force which we believe will lead to increased sales and improve our long-term financial results. A successful expansion in our sales force requires us to identify under served territories that offer the greatest potential growth opportunity, locate and recruit talented sales representatives, provide them with the proper training, and successfully integrate them into our organization. This expansion plan requires significant investment in
9
capital and resources and the failure to identify the optimal sales territories, recruit quality sales representatives and provide them with sufficient support could adversely affect our operating results. Additionally, we anticipate a short-term decrease in average sales per day per sales representative as new representatives build up customer relationships in their territories.
It is also critical to retain the experienced and productive sales representatives that have historically contributed to our success. Failure to retain a sufficient number of talented, experienced and productive sales representatives could adversely affect our operating results.
Failure to retain talented employees, managers and executives could negatively impact our operating results.
Our success depends on our ability to attract, develop and retain talented employees, including executives and other key managers. The loss of certain key executives and managers, or the failure to attract and develop talented employees could have a material adverse effect on our business.
The inability of management to successfully implement changes in operating processes, could lead to disruptions in our operations.
We have initiated a Lean Six Sigma process intended to drive operational efficiencies throughout the organization and to continuously identify and initiate changes intended to improve our internal operations. The implementation of changes to our current operations involve a risk that the changes may not work as intended, may disrupt related processes, may not be properly applied or may not result in accomplishing the intended efficiencies. Failure to successfully manage the implementation of these changes could lead to disruptions in our operations.
The Company operates in highly competitive markets.
Our marketplace, although consolidating, still includes large, fragmented industries which are highly competitive. We believe that customers and competitors may continue to consolidate over the next few years, which may make the industry even more competitive. Our competitors include companies with similar or greater market presence, name recognition, and financial, marketing, and other resources and we believe they will continue to challenge the marketplace with their product selection, financial resources, and services.
Changes that affect governmental and other tax-supported entities could negatively impact our sales and earnings.
A portion of our sales are derived from the United States military and other governmental and tax-supported entities. These entities are largely dependent upon government budgets and require adherence to certain laws and regulations. A decrease in the levels of defense and other governmental spending or the introduction of more stringent governmental regulations and oversight, could lead to reduced sales or an increase in compliance costs which would adversely affect our financial position and results of operations.
Any violation of Federal, state or local environmental protection regulations could lead to significant penalties and fines or other remediation costs.
Our product offering includes a wide variety of industrial chemicals and other products which are subject to a multitude of Federal, state and local regulations. These environmental protection laws change frequently and affect the composition, handling, transportation, storage and disposal of these products. Failure to comply with these regulations could lead to severe penalties and fines for each violation.
Additionally, we have determined that a facility we own in Decatur, Alabama contains hazardous substances in the soil and groundwater as a result of historical operations prior to our ownership. We have retained an environmental consulting firm to further investigate the contamination, including measurement and monitoring of the site. At this time insufficient data regarding the situation has been collected to reasonably estimate the extent of the contamination or the cost, if any, of remedying this situation. Additional procedures may be required to remediate the situation that could negatively impact our operating results.
Our results of operations could be affected by changes in taxation.
Our results of operations could be affected by changes in tax rates, audits by taxing authorities or changes in laws, regulations and their interpretation. Changes in applicable tax laws and regulations could also affect our ability to realize the deferred tax assets on our balance sheet, which could affect our results of operations.
10
None.
At December 31, 2013, we owned or leased the following facilities:
|
Location
|
Function
|
Square Footage
|
Own/Lease
|
Lease Expiration
|
||||
|
Chicago, Illinois
(1)
|
Headquarters
|
86,300
|
Lease
|
March 2023
|
||||
|
McCook, Illinois
|
Packaging/Distribution
|
306,805
|
Lease
|
June 2022
|
||||
|
Fairfield, New Jersey
|
Distribution
|
60,000
|
Own
|
|||||
|
Mississauga, Ontario Canada
|
Distribution
|
78,000
|
Own
|
|||||
|
Reno, Nevada
|
Distribution
|
244,280
|
Own
|
|||||
|
Suwanee, Georgia
|
Distribution
|
91,235
|
Own
|
|||||
|
Independence, Ohio
(2)
|
Call Center
|
9,761
|
Lease
|
April 2014
|
||||
|
Decatur, Alabama
(3)
|
Lease
|
65,000
|
Own
|
|||||
|
(1)
|
In the fourth quarter of 2013, we entered into an agreement to sub-lease approximately 17,100 feet of the Chicago, Illinois headquarters through March 2023.
|
|
(2)
|
We do not intend to renew the lease for the call center located in Independence, Ohio. The majority of the operations previously conducted at this location will be transitioned to our headquarters.
|
|
(3)
|
In connection with the sale of ASMP, we have agreed to lease the Decatur property to the buyer through February, 2019.
|
While we believe that our facilities are adequate to meet our current needs, we will continue to assess the location and operation of our facilities to determine whether they meet the strategic needs of our business.
The Company is involved in legal actions that arise in the ordinary course of business. It is the opinion of management that the resolution of any currently pending litigation will not have a material adverse effect on the Company’s financial position or results of operations.
Employment Tax Matter
One of the Company's subsidiaries, Drummond American LLC (“Drummond”), was under an employment tax examination for the years 2007 and 2008 regarding the long-standing treatment of its sales representatives as independent contractors. In January 2012, the Company received a Notice of Proposed Adjustment in the amount of
$9.5 million
, including penalties, from the IRS challenging Drummond's position that the sales representatives were independent contractors rather than employees. The Company disagreed with the IRS position and filed an administrative appeal with the IRS Appeals Office and established a liability of
$1.2 million
during 2011 as its best estimate of the cost to resolve the matter with the IRS. The tax matter was settled with the IRS in December 2013 for $0.8 million and the Company believes that it has no further liability related to this matter.
Not applicable
11
The Company’s Common Stock is traded on the NASDAQ Global Select Market under the symbol of “LAWS”. The following table sets forth the high and low sale prices as reported on the NASDAQ Global Select Market along with cash dividends declared for each outstanding share during the last two years for the periods presented.
|
2013
|
2012
|
||||||||||||||||||||||
|
High
|
Low
|
Cash Dividends Declared per Share
|
High
|
Low
|
Cash Dividends Declared per Share
|
||||||||||||||||||
|
First Quarter
|
$
|
19.02
|
|
$
|
10.25
|
|
$
|
—
|
|
$
|
17.92
|
|
$
|
14.39
|
|
$
|
0.12
|
|
|||||
|
Second Quarter
|
17.67
|
|
12.15
|
|
—
|
|
15.45
|
|
8.38
|
|
0.12
|
|
|||||||||||
|
Third Quarter
|
14.08
|
|
9.41
|
|
—
|
|
10.67
|
|
5.84
|
|
—
|
|
|||||||||||
|
Fourth Quarter
|
13.46
|
|
10.30
|
|
—
|
|
10.32
|
|
6.34
|
|
—
|
|
|||||||||||
On January 31, 2014, the closing sales price of our common stock was
$14.22
and the number of stockholders of record was
483
.
Stock Price Performance Chart
Set forth below is a line graph comparing the yearly change in the cumulative total stockholder return of the Company’s common stock against the cumulative total return of the Russell Microcap Index and a peer group (the “Peer Group”) of the Company for the five prior years. The Company selected the Russell Microcap Index because Lawson is a component of the index and the market capitalization of the other member companies are similar to Lawson’s market capitalization. The Peer Group consists of W.W. Grainger, Inc., Fastenal Company, and MSC Industrial Direct. The Company believes that the Peer Group is representative of the markets it services in terms of product sales and customers. The chart below represents the hypothetical return, including reinvestment of dividends, on $100 if it was invested on December 31, 2008 in the respective stocks or index fund.
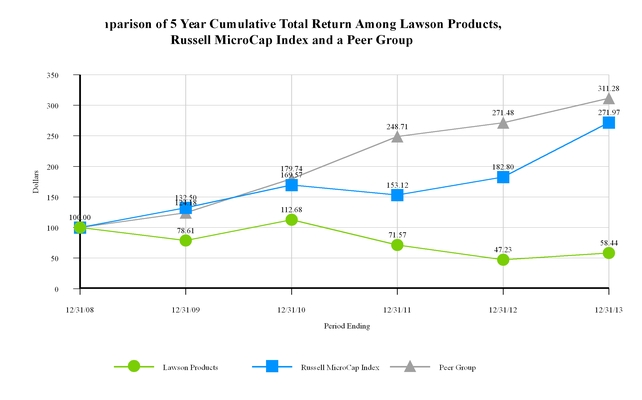
12
Repurchased shares of Common Stock
The following table summarizes the repurchases of the Company's Common Stock for the twelve months ended December 31, 2013. These shares were purchased for the sole purpose of satisfying tax withholding obligations of certain employees upon the vesting of restricted stock awards granted to them by the Company. No shares were repurchased in the open market.
|
Period
|
(a)
Total number of shares (or units) purchased
|
(b)
Average price paid per share (or unit)
|
(c)
Total number of shares (or units) purchased as part of publicly announced plans or programs
|
(d)
Maximum number (or approximate dollar value) of shares that may yet be purchased under the plans or programs
|
|||||||||
|
January 1 to January 31, 2013
|
267
|
|
$
|
9.61
|
|
—
|
|
—
|
|
||||
|
February 1 to February 28, 2013
|
—
|
|
—
|
|
—
|
|
—
|
|
|||||
|
March 1 to March 31, 2013
|
—
|
|
—
|
|
—
|
|
—
|
|
|||||
|
Three months ended March 31, 2013
|
267
|
|
—
|
|
—
|
|
|||||||
|
April 1 to April 30, 2013
|
—
|
|
—
|
|
—
|
|
—
|
|
|||||
|
May 1 to May 31, 2013
|
157
|
|
14.22
|
|
—
|
|
—
|
|
|||||
|
June 1 to June 30, 2013
|
—
|
|
—
|
|
—
|
|
—
|
|
|||||
|
Three months ended June 30, 2013
|
157
|
|
—
|
|
—
|
|
|||||||
|
July 1 to July 31, 2013
|
—
|
|
—
|
|
—
|
|
—
|
|
|||||
|
August 1 to August 31, 2013
|
—
|
|
—
|
|
—
|
|
—
|
|
|||||
|
September 1 to September 30, 2013
|
—
|
|
—
|
|
—
|
|
—
|
|
|||||
|
Three months ended September 30, 2013
|
—
|
|
—
|
|
—
|
|
|||||||
|
October 1 to October 31, 2013
|
—
|
|
—
|
|
—
|
|
—
|
|
|||||
|
November 1 to November 30, 2013
|
—
|
|
—
|
|
—
|
|
—
|
|
|||||
|
December 1 to December 31, 2013
|
2,267
|
|
12.27
|
|
—
|
|
—
|
|
|||||
|
Three months ended December 31, 2013
|
2,267
|
|
—
|
|
—
|
|
|||||||
|
Year ended December 31, 2013
|
2,691
|
|
—
|
|
—
|
|
|||||||
13
The following selected financial data should be read in conjunction with the Consolidated Financial Statements of the Company and Notes thereto included in Item 8 in this Annual Report. The income statement data and balance sheet data are for, and as of the end of each of the years in the five-year period ended
December 31, 2013
and are derived from the audited Consolidated Financial Statements of the Company. The results of discontinued operations have been reclassified from continuing operations for all periods presented.
|
(Dollars in thousands, except per share data)
|
|||||||||||||||||||
|
2013
(1)
|
2012
(2)
|
2011
(3)
|
2010
(4)
|
2009
|
|||||||||||||||
|
Net sales
|
$
|
269,503
|
|
$
|
273,562
|
|
$
|
300,399
|
|
$
|
303,138
|
|
$
|
289,715
|
|
||||
|
Income (loss) from continuing operations
|
$
|
(6,981
|
)
|
$
|
(64,033
|
)
|
$
|
(4,589
|
)
|
$
|
9,250
|
|
$
|
2,001
|
|
||||
|
Income (loss) from discontinued operations
|
1,861
|
|
1,483
|
|
(35
|
)
|
(2,313
|
)
|
(4,737
|
)
|
|||||||||
|
Net income (loss)
|
$
|
(5,120
|
)
|
$
|
(62,550
|
)
|
$
|
(4,624
|
)
|
$
|
6,937
|
|
$
|
(2,736
|
)
|
||||
|
Basic and diluted income (loss) per share of common stock:
|
|||||||||||||||||||
|
Continuing operations
|
$
|
(0.81
|
)
|
$
|
(7.46
|
)
|
$
|
(0.54
|
)
|
$
|
1.09
|
|
$
|
0.23
|
|
||||
|
Discontinued operations
|
0.22
|
|
0.18
|
|
—
|
|
(0.28
|
)
|
(0.55
|
)
|
|||||||||
|
Net income (loss)
|
$
|
(0.59
|
)
|
$
|
(7.28
|
)
|
$
|
(0.54
|
)
|
$
|
0.81
|
|
$
|
(0.32
|
)
|
||||
|
Cash dividends declared per share
|
$
|
—
|
|
$
|
0.24
|
|
$
|
0.48
|
|
$
|
0.32
|
|
$
|
0.18
|
|
||||
|
Total assets
|
$
|
159,945
|
|
$
|
172,931
|
|
$
|
222,748
|
|
$
|
236,384
|
|
$
|
241,647
|
|
||||
|
Noncurrent liabilities
|
$
|
39,083
|
|
$
|
42,370
|
|
$
|
36,697
|
|
$
|
37,968
|
|
$
|
41,761
|
|
||||
|
Stockholders’ equity
|
$
|
65,912
|
|
$
|
70,733
|
|
$
|
134,172
|
|
$
|
142,865
|
|
$
|
136,646
|
|
||||
Notes:
|
(1)
|
The 2013 results from continuing operations include a $2.9 million charge related to the sub-lease of a portion of the leased headquarters and a $0.4 million benefit from the resolution of an employment tax matter.
|
|
(2)
|
The 2012 results from continuing operations include a goodwill impairment charge of $28.3 million, an increase in income tax expense of $33.3 million due to an increase in the deferred tax valuation allowance, a $3.9 million charge related to discontinuing certain products and a $3.7 million gain on the sale of assets.
|
|
(3)
|
The 2011 results from continuing operations include a $1.2 million provision for the estimated cost of settling an employment tax matter.
|
|
(4)
|
The 2010 results from continuing operations include a $4.1 million benefit from legal settlements and a $1.7 million gain on sale of assets.
|
14
IITEM 7.
MANAGEMENT’S DISCUSSION AND ANALYSIS OF FINANCIAL CONDITION AND RESULTS OF OPERATIONS.
Overview
With the discontinuance of our original equipment manufacturer segment, we now operate in one reportable segment: as a distributor of products and services to the industrial, commercial, institutional, and governmental maintenance, repair and operations ("MRO") marketplace. Due to the discontinuance, certain reclassifications have been made to prior period amounts to conform to the current period presentation. Such reclassifications have no effect on net income as previously reported.
The North American MRO industry is highly fragmented. We compete for business with several national distributors as well as a large number of regional and local distributors. The MRO business is significantly influenced by the overall strength of the manufacturing sector of the U.S. economy. One measure used to evaluate the strength of the industrial products market is the Purchasing Managers Index ("PMI") published by the Institute for Supply Management. A measure of that index above 50 generally indicates expansion of the manufacturing sector while a measure below 50 generally represents contraction. The average monthly PMI was
53.9
for the year ended December 31, 2013 compared to
51.7
for the year ended December 31, 2012, indicating an increase in the U.S. manufacturing growth rate from a year ago.
Our sales are also affected by the number of sales representatives and the amount of sales each representative can generate, which we measure as average sales per day per sales representative. In 2013, we focused on increasing the number of sales representatives, adding
49
net new sales representatives, primarily in the second half of the year, to a total of
806
at December 31, 2013. We plan to accelerate our sales force expansion by approximately 15% to 20% in 2014. While we anticipate future sales growth from our expanded sales force, we also anticipate a short-term decrease in average sales per day per sales representative, as new representatives build up customer relationships in their territories.
Average daily sales in the first half of 2013 trailed the first half of 2012 by
3.3%
as we had
71
fewer average sales representatives. However, average daily sales in the second half of 2013 rose above the average daily sales in the second half of 2012 by
0.5%
as the number of average sales representatives exceeded the prior year period by
13
. Due to a continuing focus on controlling costs and improving the efficiency of our operations, our selling, general and administrative expenses continued to decrease as a percentage of sales in 2013, even with the increased cost of a national sales meeting held in 2013 and the additional costs of transitioning our Addison operations to the McCook Facility as we continue to focus on cost controls and leverage gained on fixed costs. Results of operations are examined in detail following a recap of our major activities in 2013.
2013 Activities
Following are some of our 2013 highlights:
|
•
|
Sales Force Transformation
- Effective January 1, 2013 all of our U.S. based sales representatives became employees of the Company, completing the transition from an independent agent model to an employee only U.S. sales team.
|
|
•
|
Increased Sales Team
- We increased the number of net active sales representatives from
757
on January 1, 2013 to
806
on December 31, 2013.
|
|
•
|
Website Redesign
- We completed the launch of our redesigned website in the first quarter of 2013. The website enables new and existing customers to perform product searches, obtain pricing and place orders directly via the internet.
|
|
•
|
National Sales Meeting
- We convened our first national sales meeting in six years in the first quarter. The meeting included training, a supplier trade show and updates on our strategy, and provided our sales representatives an opportunity to network and share best practices.
|
|
•
|
Completed Transition to the McCook Facility
- We completed the transition of distribution operations previously conducted at the Addison, Illinois distribution center to the new state-of-the-art McCook Facility, which we believe will lead to increased operating efficiencies and enhanced customer service as a result of reductions in delivery times and increased fulfillment rates.
|
|
•
|
Signed an Asset Purchase Agreement to Sell Non-Core Business
- We entered into an agreement to sell ASMP, our last non-core business, allowing us to focus our attention exclusively on our higher margin MRO operations. The sale was finalized
|
15
February 14, 2014. The Company anticipates recognizing a pretax gain of approximately $1.6 million, subject to working capital adjustments, in the first quarter of 2014.
|
•
|
IRS Settlement
- We entered into an agreement to settle a prior year employment tax matter with the IRS for $0.4 million less than our original estimate.
|
|
•
|
Lean Six Sigma
- We began to integrate a Lean Six Sigma process of continuous improvement into varying aspects of our business.
|
|
•
|
Improved Operational Performance
- We continued to improve the fundamentals of our business, measured as improved order completeness and line service levels to our customers as well as reduced customer backorders.
|
We believe we have created a scalable infrastructure that will allow us to take full advantage of future growth opportunities. We will continue to strive to be our customers' first choice for maintenance, repair and operational solutions.
RESULTS OF CONTINUING OPERATIONS FOR
2013
AS COMPARED TO
2012
|
Year Ended December 31,
|
Year to Year
|
|||||||||||||||||||
|
2013
|
2012
|
Change
|
||||||||||||||||||
|
(Dollars in thousands)
|
Amount
|
% of Net Sales
|
Amount
|
% of Net Sales
|
Amount
|
%
|
||||||||||||||
|
Net sales
|
$
|
269,503
|
|
100.0
|
%
|
$
|
273,562
|
|
100.0
|
%
|
$
|
(4,059
|
)
|
(1.5
|
)%
|
|||||
|
Cost of goods sold
|
108,208
|
|
40.2
|
|
116,144
|
|
42.5
|
|
(7,936
|
)
|
(6.8
|
)
|
||||||||
|
Gross profit
|
161,295
|
|
59.8
|
|
157,418
|
|
57.5
|
|
3,877
|
|
2.5
|
|
||||||||
|
Operating expenses:
|
||||||||||||||||||||
|
Selling, general and administrative expenses
|
||||||||||||||||||||
|
Selling expenses
|
84,273
|
|
31.3
|
|
80,310
|
|
29.4
|
|
3,963
|
|
4.9
|
|
||||||||
|
General and administrative expenses
|
79,524
|
|
29.5
|
|
89,769
|
|
32.8
|
|
(10,245
|
)
|
(11.4
|
)
|
||||||||
|
Total SG&A
|
163,797
|
|
60.8
|
|
170,079
|
|
62.2
|
|
(6,282
|
)
|
(3.7
|
)
|
||||||||
|
Severance expenses
|
837
|
|
0.3
|
|
8,021
|
|
2.9
|
|
|
|
|
|||||||||
|
Gain on sale of assets
|
(4
|
)
|
—
|
|
(3,721
|
)
|
(1.4
|
)
|
|
|
|
|||||||||
|
Goodwill impairment
|
—
|
|
—
|
|
28,306
|
|
10.3
|
|
|
|
|
|||||||||
|
Other operating expenses, net
|
2,528
|
|
0.9
|
|
—
|
|
—
|
|
|
|
|
|||||||||
|
Total operating expenses
|
167,158
|
|
62.0
|
|
202,685
|
|
74.0
|
|
|
|
|
|
||||||||
|
Operating loss
|
(5,863
|
)
|
(2.2
|
)
|
(45,267
|
)
|
(16.5
|
)
|
|
|
|
|
||||||||
|
Other expenses, net
|
(1,259
|
)
|
(0.4
|
)
|
(831
|
)
|
(0.4
|
)
|
|
|
|
|
||||||||
|
Loss from continuing operations before income tax (benefit) expense
|
(7,122
|
)
|
(2.6
|
)
|
(46,098
|
)
|
(16.9
|
)
|
|
|
|
|
||||||||
|
Income tax (benefit) expense
|
(141
|
)
|
—
|
|
17,935
|
|
6.5
|
|
|
|
|
|
||||||||
|
Loss from continuing operations
|
$
|
(6,981
|
)
|
(2.6
|
)%
|
$
|
(64,033
|
)
|
(23.4
|
)%
|
|
|
|
|
||||||
16
Net Sales
Net sales decreased
1.5%
in
2013
to
$269.5 million
from
$273.6 million
in
2012
. Excluding the negative Canadian exchange rate impact of
$0.8 million
, net sales decreased
1.2%
for the year. The majority of the
$4.1 million
decrease in sales was primarily due to a decrease in sales coverage due to fewer average sales representatives in the first half of 2013 compared to the first half of 2012. Government sales decreased
$5.2 million
from a year ago.
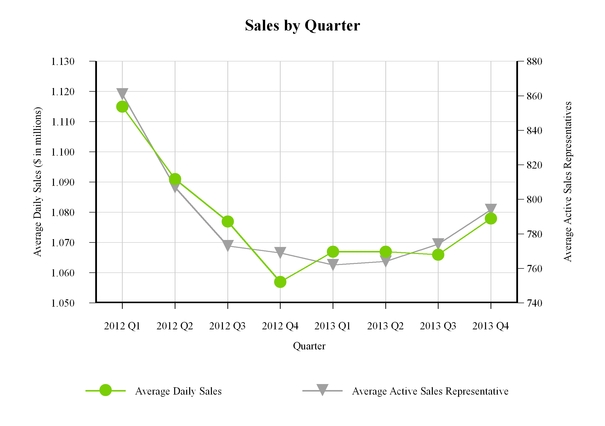
Average daily sales were
$1.069 million
in
2013
compared to
$1.086 million
in
2012
. Although daily sales decreased on a year over year basis, as shown in the following graph, sales during the second half of 2013 improved compared to the second half of 2012 as we increased the average number of active sales representatives. Sales in the fourth quarter of 2013 were
2.0%
higher than the fourth quarter of 2012 as we had an average of
25
more sales representatives in the field than in the fourth quarter of 2012.
Gross Profit
Gross profit increased
2.5%
in 2013 to
$161.3 million
from
$157.4 million
in 2012 and increased as a percent of net sales to
59.8%
from
57.5%
a year ago. The improved gross margin was primarily driven by lower outbound freight costs of
$1.1 million
and lower reserves for excess and obsolete inventory, as 2012 included a non-cash expense of
$3.9 million
related to discontinuing certain products. National accounts represented 14% of total sales in 2013.
Selling Expenses
Selling expenses consist of compensation paid to our sales representatives and related expenses to support our sales efforts. Selling expenses increased
$4.0 million
to
$84.3 million
in 2013 from
$80.3 million
in 2012. The increase was primarily due to
$2.2 million
in increased health insurance costs and
$1.2 million
of expenses related to our 2013 national sales meeting. Selling expenses as a percent of net sales were
31.3%
in 2013 compared to
29.4%
in 2012.
17
General and Administrative Expenses
General and administrative expenses consist of expenses to operate our distribution network and overhead expenses to manage the business. General and administrative expenses decreased
$10.2 million
to
$79.5 million
in 2013 from
$89.8 million
in 2012. The decrease was driven by actions taken in the first half of 2012 to reduce costs, primarily through a reduction in employee headcount and outside services. Employee compensation, excluding stock-based compensation, decreased
$7.3 million
and legal, consulting and other outside service expenses decreased
$7.2 million
in 2013 compared to the prior year. This was partially offset by a
$2.6 million
increase in stock-based compensation and
$1.1 million
increase in temporary labor in 2013.
Severance Expenses
Severance expenses of
$0.8 million
for the year ended December 31, 2013 primarily related to various organizational restructurings. Severance expenses of
$8.0 million
for the year ended December 31, 2012 primarily related to the elimination of corporate and distribution positions as a result of a strategic restructuring plan.
Gain on Sale of Assets
In 2012, in conjunction with the opening of the new McCook Facility and the relocation of our headquarters to Chicago, Illinois, we sold four properties: our former Des Plaines, Illinois headquarters and packaging facility, our Addison, Illinois distribution center; our Vernon Hills, Illinois distribution center; and a Des Plaines, Illinois administrative building. We received cash proceeds of
$12.3 million
from the sale of the four facilities, which resulted in a gain of
$3.7 million
.
Goodwill Impairment
During 2012, we determined that continuing operating losses and the reduction in our market capitalization below book value were indicators of potential goodwill impairment. When we performed an impairment analysis of our goodwill balance we determined that the full amount of the goodwill was impaired and we recorded a non-cash charge of
$28.3 million
.
Other Operating Expenses, Net
In order to improve future cash flows, in the fourth quarter of 2013 we entered into an agreement to sub-lease a portion of our leased headquarters. Under lease accounting rules we recorded a
$2.9 million
charge, primarily representing the net difference between the Company's future scheduled lease payments and the expected proceeds from the sub-lease, as well as related asset write-downs. In 2013, we also recorded a benefit of
$0.4 million
related to the settlement of an employment tax matter with the IRS for
$0.8 million
, as we had originally established a reserve of
$1.2 million
in 2011 as our best estimate of the outcome.
Other Expenses, net
Other expenses, net increased to
$1.3 million
in 2013 from
$0.8 million
in
2012
primarily due to a higher average debt balance which led to an increase in interest expense.
Income Tax (Benefit) Expense
In 2012, we recorded income tax expense of
$17.9 million
on a pre-tax loss of
$46.1 million
, which included a $33.3 million increase in the valuation allowance on our deferred tax assets. The increase in the valuation allowance was primarily due to cumulative losses we had incurred over several reporting periods. We determined that it was more likely than not that we would not be able to utilize our deferred tax assets to offset future taxable income and, therefore, increased our deferred tax valuation allowance. In 2013 we continued to be in a full tax valuation allowance position and the
$0.1 million
of income tax benefit was primarily due to the allocation of income tax between continuing and discontinued operations.
18
RESULTS OF CONTINUING OPERATIONS FOR 2012 AS COMPARED TO 2011
|
Year Ended December 31,
|
Year to Year
|
|||||||||||||||||||
|
2012
|
2011
|
Change
|
||||||||||||||||||
|
(Dollars in thousands)
|
Amount
|
% of Net Sales
|
Amount
|
% of Net Sales
|
Amount
|
%
|
||||||||||||||
|
Net sales
|
$
|
273,562
|
|
100.0
|
%
|
$
|
300,399
|
|
100.0
|
%
|
$
|
(26,837
|
)
|
(8.9
|
)%
|
|||||
|
Cost of goods sold
|
116,144
|
|
42.5
|
|
123,527
|
|
41.1
|
|
(7,383
|
)
|
(6.0
|
)
|
||||||||
|
Gross profit
|
157,418
|
|
57.5
|
|
176,872
|
|
58.9
|
|
(19,454
|
)
|
(11.0
|
)
|
||||||||
|
Operating expenses:
|
||||||||||||||||||||
|
Selling, general and administrative expenses
|
||||||||||||||||||||
|
Selling expenses
|
80,310
|
|
29.4
|
|
86,473
|
|
28.8
|
|
(6,163
|
)
|
(7.1
|
)
|
||||||||
|
General and administrative expenses
|
89,769
|
|
32.8
|
|
93,339
|
|
31.1
|
|
(3,570
|
)
|
(3.8
|
)
|
||||||||
|
Total SG&A
|
170,079
|
|
62.2
|
|
179,812
|
|
59.9
|
|
(9,733
|
)
|
(5.4
|
)
|
||||||||
|
Severance expenses
|
8,021
|
|
2.9
|
|
1,614
|
|
0.5
|
|
||||||||||||
|
Loss (gain) on sale of assets
|
(3,721
|
)
|
(1.4
|
)
|
22
|
|
—
|
|
||||||||||||
|
Goodwill impairment
|
28,306
|
|
10.3
|
|
—
|
|
—
|
|
||||||||||||
|
Other operating expenses, net
|
—
|
|
—
|
|
1,200
|
|
0.4
|
|
||||||||||||
|
Total operating expenses
|
202,685
|
|
74.0
|
|
182,648
|
|
60.8
|
|
||||||||||||
|
Operating loss
|
(45,267
|
)
|
(16.5
|
)
|
(5,776
|
)
|
(1.9
|
)
|
||||||||||||
|
Other expenses, net
|
(831
|
)
|
(0.4
|
)
|
(580
|
)
|
(0.2
|
)
|
||||||||||||
|
Loss from continuing operations before income tax expense (benefit)
|
(46,098
|
)
|
(16.9
|
)
|
(6,356
|
)
|
(2.1
|
)
|
||||||||||||
|
Income tax expense (benefit)
|
17,935
|
|
6.5
|
|
(1,767
|
)
|
(0.6
|
)
|
||||||||||||
|
Loss from continuing operations
|
$
|
(64,033
|
)
|
(23.4
|
)%
|
$
|
(4,589
|
)
|
(1.5
|
)%
|
||||||||||
Net Sales
Net sales decreased
8.9%
in
2012
to
$273.6 million
from
$300.4 million
in
2011
on one additional selling day in 2012. Excluding the negative Canadian exchange rate impact of
$0.4 million
, net sales decreased
8.8%
for the year. The decrease in sales was primarily due to a decrease in sales coverage due to a 14% net decline in sales representatives during the year. However, the sales force began to stabilize in the second half of the year as we ended 2012 with approximately the same number of sales representatives as we had at the end of the second quarter of 2012. Additionally, government sales decreased $10.1 million in 2012 compared to 2011 which benefited from troop deployments. For the year, average daily sales were
$1.086 million
in
2012
compared to
$1.197 million
in
2011
.
Gross Profit
Gross profit decreased
11.0%
in
2012
to
$157.4 million
from
$176.9 million
in
2011
. As a percent of net sales, gross profit margin decreased to
57.5%
in
2012
from
58.9%
in
2011
. This decrease was principally due to a non-cash expense of
$3.9 million
related to discontinuing certain products, a decrease of $2.6 million in outbound freight recoveries and a shift toward higher volume national customers with lower margins. National accounts represented 12.7% of net sales in 2012 compared to 11.2% in 2011.
19
Selling Expenses
Selling expenses decreased
7.1%
to
$80.3 million
in
2012
from
$86.5 million
in
2011
primarily due to implementing cost control measures across the organization and lower sales. Selling expenses increased as a percent of sales to
29.4%
in 2012 from
28.8%
in 2011, primarily due to the impact of fixed selling costs on the decreased sales levels.
General and Administrative Expenses
General and administrative expenses decreased
$3.6 million
, or
3.8%
, primarily due to $5.0 million less ERP related expenses in 2012 compared to 2011 and $4.3 million of reduced compensation costs driven primarily by a cost reduction strategy implemented in 2012 including a reduction in work force. These savings were partially offset by an increase of $2.7 million in depreciation and facility costs, $2.2 million of consulting fees related to our turnaround strategy and $0.5 million related to the move into our new distribution center and headquarters.
Severance Expenses
Severance expenses were
$8.0 million
in
2012
compared to
$1.6 million
in
2011
. The severance charge recorded in 2012 primarily related to the elimination of corporate and distribution positions, as a result of a strategic restructuring plan.
Gain on Sale of Assets
In 2012, in conjunction with the construction of the McCook Facility and the relocation of our headquarters to Chicago, Illinois, we sold four properties: our former Des Plaines, Illinois headquarters and packaging facility, our Addison, Illinois distribution center; our Vernon Hills, Illinois distribution center; and a Des Plaines, Illinois administrative building. We received cash proceeds of
$12.3 million
from the sales of the four facilities which resulted in a gain of
$3.7 million
.
Goodwill Impairment
During 2012, we determined that operating losses and the reduction in our market capitalization below book value were indicators of potential goodwill impairment. When we performed an impairment analysis of our goodwill balance, we determined that the full amount of the goodwill was impaired and we recorded a non-cash charge of
$28.3 million
.
Other Operating Expenses, Net
In 2011, we recorded a
$1.2 million
expense for the estimated cost of settling the employment tax matter related to the classification of the sales representatives of one of our subsidiaries as independent contractors. No such charges were incurred in 2012.
Other Expenses, Net
Other expenses, net increased to
$0.8 million
in 2012 from
$0.6 million
in 2011. The 2012 expense was primarily due to interest on borrowings from our revolving line of credit, while the 2011 expense primarily consisted of interest assessed on unclaimed property settlements.
Income Tax Expense (Benefit)
In 2012, we recorded income tax expense of
$17.9 million
on a pre-tax loss of
$46.1 million
, which included a $33.3 million increase in the valuation allowance on our deferred tax assets. The increase in the valuation allowance was primarily due to cumulative losses we had incurred over several reporting periods. We determined that it was more likely than not that we would not be able to utilize our deferred tax assets to offset future taxable income and, therefore, increased our deferred tax valuation allowance.
The 2011 income tax benefit was
$1.8 million
on a pre-tax loss of
$6.4 million
, resulting in an effective tax rate of
27.8%
.
20
LIQUIDITY AND CAPITAL RESOURCES
Cash provided by operating activities was
$0.6 million
in
2013
compared to cash used in operating activities of
$8.3 million
in
2012
and
$23.1 million
in
2011
. The increase in cash from operations in
2013
primarily resulted from improved operating results. In 2012, cash used in operations was primarily due to operating losses and in 2011, cash was primarily used to support increased levels of accounts receivable and inventory.
Capital expenditures were
$2.9 million
in
2013
compared to
$18.3 million
in
2012
and
$11.1 million
in 2011. Capital expenditures in 2013 were primarily for warehouse equipment to support operations in the McCook Facility, and for improvements to our sales order entry system and our redesigned website. Capital expenditures in 2012 were primarily for warehouse equipment for the opening of the McCook Facility, the build out of the leased headquarters and expenditures related to our website redevelopment. Capital expenditures in 2011 included $5.9 million related to our ERP system. In 2012, we received cash proceeds of
$12.3 million
from the sale of four properties.
We have the ability to borrow funds through an asset-based Loan and Security Agreement ("Loan Agreement") which consists of a $40.0 million revolving credit facility with a $10.0 million sub-facility for letters of credit. In December, 2013, we entered into a Second Amendment to Loan and Security Agreement ("Second Amendment") which revised certain terms of the original Loan Agreement, including, among other items, applicable interest rates, financial covenants and dividend restrictions. The terms of the Loan Agreement as amended are more fully detailed in
Note 8 – Loan Agreement
of the Consolidated Financial Statements included in Item 8 of this Form 10-K. Net proceeds from the subsequent sale of ASMP in the first quarter of 2014 were used to pay down outstanding borrowings.
At
December 31, 2013
, our outstanding revolving line of credit borrowings were
$16.1 million
, similar to 2012, and we had additional borrowing availability of
$17.9 million
.
In addition to other customary representations, warranties and covenants, we are required to meet a minimum trailing twelve month EBITDA to fixed charges ratio and a minimum quarterly tangible net worth level as defined in the Second Amendment. On December 31, 2013, we were in compliance with all financial covenants as detailed below:
|
Quarterly Financial Covenants
|
Requirement
|
Actual
|
||
|
EBITDA to fixed charges ratio
|
1.10 : 1.00
|
2.30 : 1.00
|
||
|
Minimum tangible net worth
|
$45.0 million
|
$57.7 million
|
||
While we met the minimum financial covenant levels for the quarter ended
December 31, 2013
, failure to meet these covenant requirements in future quarters could lead to higher financing costs, increased restrictions, or reduce or eliminate our ability to borrow funds. If we require more liquidity than is currently available to us under our Loan Agreement, we may need to raise additional funds through debt or equity offerings which may not be available when needed or may not be available on terms favorable to us. Should funding be insufficient at any time in the future, we may be unable to develop or enhance our products or services, take advantage of business opportunities or respond to competitive pressures, any of which could have a material adverse effect on our business, financial condition and results of operations.
No cash dividends were paid out in 2013, while
$3.1 million
and
$4.1 million
were paid out to stockholders' in 2012 and 2011, respectively. Dividends are currently restricted under the Loan Agreement to amounts not to exceed $7.0 million annually.
We believe cash expected to be provided by operations and the funds available under our Loan Agreement are sufficient to fund our operating requirements, strategic initiatives and capital improvements throughout
2014
.
21
CONTRACTUAL OBLIGATIONS
Contractual obligations that require cash payment over future periods at December 31, 2013 were as follows:
|
(Dollars in thousands)
|
Payments due in years ended December 31,
|
||||||||||||||||||
|
Total
|
2014
|
2015 – 2016
|
2017 - 2018
|
Thereafter
|
|||||||||||||||
|
Revolving line of credit
(1)
|
$
|
16,078
|
|
$
|
16,078
|
|
(1)
|
$
|
—
|
|
$
|
—
|
|
$
|
—
|
|
|||
|
Operating leases
(2)
|
12,482
|
|
1,293
|
|
2,490
|
|
2,653
|
|
6,046
|
|
|||||||||
|
Financing lease obligation
|
11,069
|
|
1,085
|
|
2,289
|
|
2,603
|
|
5,092
|
|
|||||||||
|
Capital leases
|
108
|
|
96
|
|
12
|
|
—
|
|
—
|
|
|||||||||
|
Security bonus plan
(3)
|
16,742
|
|
599
|
|
—
|
|
—
|
|
16,143
|
|
|||||||||
|
Deferred compensation
|
7,030
|
|
1,163
|
|
1,854
|
|
411
|
|
3,602
|
|
|||||||||
|
Purchase commitments
|
9,887
|
|
9,887
|
|
—
|
|
—
|
|
—
|
|
|||||||||
|
Severance obligation
|
1,769
|
|
1,651
|
|
118
|
|
—
|
|
—
|
|
|||||||||
|
Total contractual cash obligations
|
$
|
75,165
|
|
$
|
31,852
|
|
(1)
|
$
|
6,763
|
|
$
|
5,667
|
|
$
|
30,883
|
|
|||
|
(1)
|
The revolving line of credit with The PrivateBank expires in August 2017. Due to the lock box arrangement and a subjective acceleration clause contained in the borrowing agreement, the revolving line of credit is classified as a current contractual obligation.
|
|
(2)
|
Operating lease obligations are partially offset by future proceeds of $0.8 million from a sub-lease expiring in March 2023.
|
|
(3)
|
Payments to participants in our security bonus plan are made on a lump sum basis at time of separation from the Company. Payouts for known separation dates have been included in the scheduled year of payout, while payouts for unknown separation dates are reflected in the thereafter column.
|
OFF-BALANCE SHEET ARRANGEMENTS
Of the
$12.5 million
operating lease obligation,
$10.5 million
relates to a lease agreement for our headquarters which expires in March 2023. The headquarters lease obligation is partially offset by $0.8 million of total future minimum lease proceeds from a portion of the leased headquarters that has been sub-leased through March of 2023. Also, as of December 31, 2013, we had contractual commitments to purchase
$9.9 million
of product from our suppliers and contractors in 2014.
CRITICAL ACCOUNTING POLICIES
We have disclosed our significant accounting policies in
Note 2
to the consolidated financial statements. The following provides supplemental information to these accounting policies as well as information on the accounts requiring more significant estimates.
Allowance for Doubtful Accounts
— We evaluate the collectability of accounts receivable based on a combination of factors. In circumstances where we are aware of a specific customer’s inability to meet its financial obligations (e.g., bankruptcy filings, substantial down-grading of credit ratings), a specific reserve for bad debts is recorded against amounts due to reduce the receivable to the amount we believe will be collected. For all other customers, we recognize reserves for bad debts based on our historical experience of bad debt write-offs as a percent of accounts receivable outstanding. If circumstances change (e.g., higher than expected defaults or an unexpected material adverse change in a major customer’s ability to meet its financial obligations), the estimates of the recoverability of amounts due to us could be revised by a material amount. At
December 31, 2013
, our reserve was
2.7%
of our gross accounts receivable outstanding. A hypothetical change of one percent to our reserve as a percent of our gross accounts receivable would have affected our annual doubtful accounts expense by approximately
$0.3 million
.
Inventory Reserves
— Inventories consist principally of finished goods and are stated at the lower of cost (determined using the first-in-first-out method) or market. Most of our products are not exposed to the risk of obsolescence due to technology changes. However, some of our products do have a limited shelf life, and from time to time we add and remove items from our catalogs, brochures or website for marketing and other purposes.
22
To reduce our inventory to a lower of cost or market value, we record a reserve for slow-moving and obsolete inventory based on historical experience and monitoring of our current inventory activity. We use estimates to determine the necessity of recording these reserves based on periodic detailed analysis, using both qualitative and quantitative factors. As part of this analysis, we consider several factors including the inventories’ length of time on hand, historical sales, product shelf life, product life cycle, product category, and product obsolescence. In general, depending on the product category, we reserve inventory with low turnover at higher rates than inventory with high turnover. Our policy is to not re-value inventory to the original cost basis subsequent to establishing a new cost basis.
At
December 31, 2013
, our inventory reserve was
$5.3 million
, equal to approximately
10.4%
of our total inventory. A hypothetical change of one percent to our reserve as a percent of total inventory would have affected our cost of goods sold by
$0.5 million
.
Income Taxes
— Deferred tax assets or liabilities reflect temporary differences between amounts of assets and liabilities for financial and tax reporting. Such amounts are adjusted, as appropriate, to reflect changes in enacted tax rates expected to be in effect when the temporary differences reverse. A valuation allowance is established to offset any deferred tax assets if, based upon the available evidence, it is more likely than not (i.e. greater than 50% likely) that some or all of the deferred tax assets will not be realized. The determination of the amount of a valuation allowance to be provided on recorded deferred tax assets involves estimates regarding (1) the timing and amount of the reversal of taxable temporary differences, (2) expected future taxable income, (3) the impact of tax planning strategies and (4) the ability to carry back deferred tax assets to offset prior taxable income. In assessing the need for a valuation allowance, we consider all available positive and negative evidence, including past operating results, projections of future taxable income and the feasibility of ongoing tax planning strategies. The projections of future taxable income include a number of estimates and assumptions regarding our volume, pricing and costs. Additionally, valuation allowances related to deferred tax assets can be impacted by changes to tax laws. Significant judgment is required in determining income tax provisions as well as deferred tax asset and liability balances, including the estimation of valuation allowances and the evaluation of tax positions.
Primarily due to cumulative losses incurred in recent years, management determined that it was more likely than not that we will not be able to utilize our deferred tax assets to offset future taxable income and have established a deferred tax valuation allowance equal to substantially all of our net tax assets. A tax valuation allowance will remain until the Company can establish that the recoverability of its deferred tax assets is more certain.
23
One of our subsidiaries is located and operates in Canada using the Canadian dollar as its functional currency. Operating results are translated into U.S. dollars when consolidated into our financial statements. Therefore, we are exposed to market risk relating to the change in the value of the Canadian dollar relative to the U.S. dollar. A hypothetical 10% change in the Canadian exchange rate would have affected our
2013
net sales by
$2.8 million
and net assets by
$1.1 million
.
Certain compensation awards have been granted to our directors, officers and key employees that are payable in cash based upon the market price of our common stock. These awards are re-measured each reporting period and the effect of the change in the share price is reflected in our operating results. A hypothetical 10% change in the price of our common stock on
December 31, 2013
would have affected our
2013
operating results by
$0.3 million
.
A number of our current and past employees have opted to defer a portion of their earned compensation to be paid at a future date. These individuals have the ability to invest the deferred compensation in one or more portfolios that track the performance of various mutual funds. As of
December 31, 2013
, the liability, which is based on the performance of these funds, was
$7.0 million
. Additionally, we have invested funds in life insurance policies on certain executives. As of
December 31, 2013
, the cash surrender value of these life insurance policies was
$9.2 million
and is invested in financial instruments similar to those supporting the deferred compensation liability. Therefore, any future net increase or decrease in the market value of the deferred compensation liability would be offset by the performance of the portfolio of the cash value of the life insurance asset and the combined gain and loss would have no material effect on our financial results.
On
December 31, 2013
, we had
$16.1 million
of borrowings outstanding on our revolving line of credit that are exposed to the market risk of fluctuations in the variable interest rate based on either the Prime rate or the LIBOR rate. A hypothetical 100 basis point change in the underlying interest rate charged on the
December 31, 2013
debt balance would have an annual effect on operating results of
$0.2 million
.
We are exposed to market risk relating to increased commodity and energy costs affecting the production costs of our vendors. These vendors typically look to pass their increased costs along to us and if we are unable to fully pass these costs through to our customers or to modify our activities, the impact would have an adverse effect on our operating profit margins.
24
The following information is presented in this item:
|
|
|
|
|
|
|
|
|
|
|
|
|
|
|
|
|
|
|
|
|
25
Report of Independent Registered Public Accounting Firm
Board of Directors and Stockholders
Lawson Products, Inc.
Chicago, Illinois
We have audited the accompanying consolidated balance sheet of Lawson Products, Inc. as of December 31, 2013 and the related consolidated statement of operations and comprehensive loss, stockholders’ equity, and cash flows for the year then ended. In connection with our audit of the consolidated financial statements, we have also audited the schedule listed in the accompanying index. These financial statements and schedule are the responsibility of the Company’s management. Our responsibility is to express an opinion on these financial statements and schedule based on our audit.
We conducted our audit in accordance with the standards of the Public Company Accounting Oversight Board (United States). Those standards require that we plan and perform the audit to obtain reasonable assurance about whether the financial statements are free of material misstatement. An audit also includes examining, on a test basis, evidence supporting the amounts and disclosures in the financial statements, assessing the accounting principles used and significant estimates made by management, as well as evaluating the overall financial statement presentation and schedule. We believe that our audit provides a reasonable basis for our opinion.
In our opinion, the consolidated financial statements referred to above present fairly, in all material respects, the financial position of Lawson Products, Inc. at December 31, 2013 and the results of its operations and its cash flows for the period then ended
,
in conformity with accounting principles generally accepted in the United States of America.
Also, in our opinion, the financial statement schedule, when considered in relation to the basic consolidated financial statements taken as a whole, presents fairly, in all material respects, the information set forth therein.
We also have audited, in accordance with the standards of the Public Company Accounting Oversight Board (United States), Lawson Products, Inc.’s internal control over financial reporting as of December 31, 2013, based on criteria established in
Internal Control - Integrated Framework (1992)
issued by the Committee of Sponsoring Organizations of the Treadway Commission (COSO) and our report dated February 20, 2014 expressed an unqualified opinion thereon.
/s/BDO USA, LLP
Chicago, IL
February 20, 2014
26
Report of Independent Registered Public Accounting Firm
We have audited the accompanying consolidated balance sheet of Lawson Products, Inc. as of December 31, 2012 and the related consolidated statements of operations and comprehensive loss, changes in stockholders’ equity, and cash flows for each of the two years in the period ended December 31, 2012. Our audits also included the 2012 and 2011 financial statement schedules listed in the Index at Item 15(a). These financial statements and schedules are the responsibility of the Company’s management. Our responsibility is to express an opinion on the financial statements and schedule based on our audits.
We conducted our audits in accordance with the standards of the Public Company Accounting Oversight Board (United States). Those standards require that we plan and perform the audit to obtain reasonable assurance about whether the financial statements are free of material misstatement. An audit includes examining, on a test basis, evidence supporting the amounts and disclosures in the financial statements. An audit also includes assessing the accounting principles used and significant estimates made by management, as well as evaluating the overall financial statement presentation. We believe that our audits provide a reasonable basis for our opinion.
In our opinion, the financial statements referred to above present fairly, in all material respects, the consolidated financial position of Lawson Products, Inc. at December 31, 2012 and the consolidated results of its operations and its cash flows for each of the two years in the period ended December 31, 2012, in conformity with U.S. generally accepted accounting principles. Also, in our opinion, the related 2012 and 2011 financial statement schedules, when considered in relation to the basic financial statements taken as a whole, presents fairly in all material respects the information set forth therein.
/s/ Ernst & Young LLP
Chicago, Illinois
February 25, 2013, except for Note 13, as to which the date is
February 20, 2014
27
Lawson Products, Inc.
(Dollars in thousands, except share data)
|
December 31,
|
|||||||
|
2013
|
2012
|
||||||
|
ASSETS
|
|||||||
|
Current assets:
|
|||||||
|
Cash and cash equivalents
|
$
|
698
|
|
$
|
1,640
|
|
|
|
Restricted cash
|
800
|
|
—
|
|
|||
|
Accounts receivable, less allowance for doubtful accounts of $828 and $1,637, respectively
|
30,221
|
|
29,451
|
|
|||
|
Inventories
|
45,774
|
|
44,681
|
|
|||
|
Miscellaneous receivables and prepaid expenses
|
4,393
|
|
5,308
|
|
|||
|
Deferred income taxes
|
5
|
|
17
|
|
|||
|
Discontinued operations
|
8,960
|
|
9,232
|
|
|||
|
Total current assets
|
90,851
|
|
90,329
|
|
|||
|
Property, plant and equipment, less accumulated depreciation and amortization
|
58,974
|
|
66,981
|
|
|||
|
Cash value of life insurance
|
9,179
|
|
14,943
|
|
|||
|
Deferred income taxes
|
54
|
|
55
|
|
|||
|
Other assets
|
481
|
|
449
|
|
|||
|
Discontinued operations
|
406
|
|
174
|
|
|||
|
Total assets
|
$
|
159,945
|
|
$
|
172,931
|
|
|
|
LIABILITIES AND STOCKHOLDERS’ EQUITY
|
|||||||
|
Current liabilities:
|
|||||||
|
Revolving line of credit
|
$
|
16,078
|
|
$
|
16,127
|
|
|
|
Accounts payable
|
14,787
|
|
11,421
|
|
|||
|
Accrued expenses and other liabilities
|
23,521
|
|
31,330
|
|
|||
|
Discontinued operations
|
564
|
|
950
|
|
|||
|
Total current liabilities
|
54,950
|
|
59,828
|
|
|||
|
Security bonus plan
|
16,143
|
|
18,837
|
|
|||
|
Financing lease obligation
|
10,223
|
|
10,786
|
|
|||
|
Deferred compensation
|
5,867
|
|
5,741
|
|
|||
|
Deferred rent liability
|
4,961
|
|
4,621
|
|
|||
|
Other liabilities
|
1,889
|
|
2,258
|
|
|||
|
Discontinued operations
|
—
|
|
127
|
|
|||
|
Total liabilities
|
94,033
|
|
102,198
|
|
|||
|
Commitments and contingencies – Note 11
|
|||||||
|
Stockholders’ equity:
|
|||||||
|
Preferred stock, $1 par value:
|
|||||||
|
Authorized - 500,000 shares, issued and outstanding - None
|
—
|
|
—
|
|
|||
|
Common stock, $1 par value:
|
|||||||
|
Authorized - 35,000,000 shares
Issued – 8,670,512 and 8,614,837 shares, respectively Outstanding – 8,658,885 and 8,605,901 shares, respectively |
8,671
|
|
8,615
|
|
|||
|
Capital in excess of par value
|
7,799
|
|
6,951
|
|
|||
|
Retained earnings
|
47,644
|
|
52,764
|
|
|||
|
Treasury stock – 11,627 and 8,936 shares held, respectively
|
(187
|
)
|
(155
|
)
|
|||
|
Accumulated other comprehensive income
|
1,985
|
|
2,558
|
|
|||
|
Total stockholders’ equity
|
65,912
|
|
70,733
|
|
|||
|
Total liabilities and stockholders’ equity
|
$
|
159,945
|
|
$
|
172,931
|
|
|
See notes to Consolidated Financial Statements
28
Lawson Products, Inc.
(Dollars in thousands, except per share data)
|
Year Ended December 31,
|
|||||||||||
|
2013
|
2012
|
2011
|
|||||||||
|
Net sales
|
$
|
269,503
|
|
$
|
273,562
|
|
$
|
300,399
|
|
||
|
Cost of goods sold
|
108,208
|
|
116,144
|
|
123,527
|
|
|||||
|
Gross profit
|
161,295
|
|
157,418
|
|
176,872
|
|
|||||
|
Operating expenses:
|
|||||||||||
|
Selling, general and administrative expenses
|
163,797
|
|
170,079
|
|
179,812
|
|
|||||
|
Severance expenses
|
837
|
|
8,021
|
|
1,614
|
|
|||||
|
Loss (gain) on sale of assets
|
(4
|
)
|
(3,721
|
)
|
22
|
|
|||||
|
Goodwill impairment
|
—
|
|
28,306
|
|
—
|
|
|||||
|
Other operating expenses, net
|
2,528
|
|
—
|
|
1,200
|
|
|||||
|
Operating expenses
|
167,158
|
|
202,685
|
|
182,648
|
|
|||||
|
Operating loss
|
(5,863
|
)
|
(45,267
|
)
|
(5,776
|
)
|
|||||
|
Interest expense
|
(1,097
|
)
|
(775
|
)
|
(681
|
)
|
|||||
|
Other (expenses) income, net
|
(162
|
)
|
(56
|
)
|
101
|
|
|||||
|
Loss from continuing operations before income taxes
|
(7,122
|
)
|
(46,098
|
)
|
(6,356
|
)
|
|||||
|
Income tax (benefit) expense
|
(141
|
)
|
17,935
|
|
(1,767
|
)
|
|||||
|
Loss from continuing operations
|
(6,981
|
)
|
(64,033
|
)
|
(4,589
|
)
|
|||||
|
Income (loss) from discontinued operations
|
1,861
|
|
1,483
|
|
(35
|
)
|
|||||
|
Net loss
|
$
|
(5,120
|
)
|
$
|
(62,550
|
)
|
$
|
(4,624
|
)
|
||
|
Basic and diluted income (loss) per share of common stock:
|
|||||||||||
|
Continuing operations
|
$
|
(0.81
|
)
|
$
|
(7.46
|
)
|
$
|
(0.54
|
)
|
||
|
Discontinued operations
|
0.22
|
|
0.18
|
|
—
|
|
|||||
|
Net loss
|
$
|
(0.59
|
)
|
$
|
(7.28
|
)
|
$
|
(0.54
|
)
|
||
|
Comprehensive loss
|
|||||||||||
|
Net loss
|
$
|
(5,120
|
)
|
$
|
(62,550
|
)
|
$
|
(4,624
|
)
|
||
|
Other comprehensive income (loss), net of tax:
|
|||||||||||
|
Adjustment for foreign currency translation
|
(573
|
)
|
418
|
|
(835
|
)
|
|||||
|
Comprehensive loss
|
$
|
(5,693
|
)
|
$
|
(62,132
|
)
|
$
|
(5,459
|
)
|
||
See notes to Consolidated Financial Statements
29
Lawson Products, Inc.
Consolidated Statements of Changes in Stockholders’ Equity
(Dollars in thousands)
|
Common
Stock,
$1 par value
|
Capital in Excess of Par Value
|
Retained Earnings
|
Treasury Stock
|
Accumulated Other Comprehensive income (loss)
|
Total stockholders' equity
|
||||||||||||||||||
|
Balance at January 1, 2011
|
$
|
8,534
|
|
$
|
5,328
|
|
$
|
126,098
|
|
$
|
(70
|
)
|
$
|
2,975
|
|
$
|
142,865
|
|
|||||
|
Net loss
|
—
|
|
—
|
|
(4,624
|
)
|
—
|
|
—
|
|
(4,624
|
)
|
|||||||||||
|
Adjustment for foreign currency translation
|
—
|
|
—
|
|
—
|
|
—
|
|
(835
|
)
|
(835
|
)
|
|||||||||||
|
Stock-based compensation
|
—
|
|
929
|
|
—
|
|
—
|
|
—
|
|
929
|
|
|||||||||||
|
Shares issued
|
47
|
|
(47
|
)
|
—
|
|
—
|
|
—
|
|
—
|
|
|||||||||||
|
Share repurchase under stock award program
|
—
|
|
—
|
|
—
|
|
(60
|
)
|
—
|
|
(60
|
)
|
|||||||||||
|
Cash dividends declared
|
—
|
|
—
|
|
(4,103
|
)
|
—
|
|
—
|
|
(4,103
|
)
|
|||||||||||
|
Balance at December 31, 2011
|
8,581
|
|
6,210
|
|
117,371
|
|
(130
|
)
|
2,140
|
|
134,172
|
|
|||||||||||
|
Net loss
|
—
|
|
—
|
|
(62,550
|
)
|
—
|
|
—
|
|
(62,550
|
)
|
|||||||||||
|
Adjustment for foreign currency translation
|
—
|
|
—
|
|
—
|
|
—
|
|
418
|
|
418
|
|
|||||||||||
|
Stock-based compensation
|
—
|
|
775
|
|
—
|
|
—
|
|
—
|
|
775
|
|
|||||||||||
|
Shares issued
|
34
|
|
(34
|
)
|
—
|
|
—
|
|
—
|
|
—
|
|
|||||||||||
|
Share repurchase under stock award program
|
—
|
|
—
|
|
—
|
|
(25
|
)
|
—
|
|
(25
|
)
|
|||||||||||
|
Cash dividends declared
|
—
|
|
—
|
|
(2,057
|
)
|
—
|
|
—
|
|
(2,057
|
)
|
|||||||||||
|
Balance at December 31, 2012
|
8,615
|
|
6,951
|
|
52,764
|
|
(155
|
)
|
2,558
|
|
70,733
|
|
|||||||||||
|
Net loss
|
—
|
|
—
|
|
(5,120
|
)
|
—
|
|
—
|
|
(5,120
|
)
|
|||||||||||
|
Adjustment for foreign currency translation
|
—
|
|
—
|
|
—
|
|
—
|
|
(573
|
)
|
(573
|
)
|
|||||||||||
|
Stock-based compensation
|
—
|
|
904
|
|
—
|
|
—
|
|
—
|
|
904
|
|
|||||||||||
|
Shares issued
|
56
|
|
(56
|
)
|
—
|
|
—
|
|
—
|
|
—
|
|
|||||||||||
|
Share repurchase under stock award program
|
—
|
|
—
|
|
—
|
|
(32
|
)
|
—
|
|
(32
|
)
|
|||||||||||
|
Balance at December 31, 2013
|
$
|
8,671
|
|
$
|
7,799
|
|
$
|
47,644
|
|
$
|
(187
|
)
|
$
|
1,985
|
|
$
|
65,912
|
|
|||||
See notes to Consolidated Financial Statements
30
Lawson Products, Inc.
(Dollars in thousands)
|
Year Ended December 31,
|
|||||||||||
|
2013
|
2012
|
2011
|
|||||||||
|
Operating activities
|
|||||||||||
|
Net loss
|
$
|
(5,120
|
)
|
$
|
(62,550
|
)
|
$
|
(4,624
|
)
|
||
|
Loss (income) from discontinued operations
|
(1,861
|
)
|
(1,483
|
)
|
35
|
|
|||||
|
Loss from continuing operations
|
(6,981
|
)
|
(64,033
|
)
|
(4,589
|
)
|
|||||
|
Adjustments to reconcile net loss from continuing operations to net cash provided by (used in) operating activities:
|
|||||||||||
|
Depreciation and amortization
|
9,030
|
|
7,119
|
|
5,410
|
|
|||||
|
Deferred income taxes
|
13
|
|
17,444
|
|
(1,837
|
)
|
|||||
|
Stock-based compensation
|
2,267
|
|
(306
|
)
|
61
|
|
|||||
|
Loss (gain) on disposal of property and equipment
|
(4
|
)
|
(3,721
|
)
|
22
|
|
|||||
|
Increase in restricted cash
|
(800
|
)
|
—
|
|
—
|
|
|||||
|
Loss on sub-lease
|
2,538
|
|
—
|
|
—
|
|
|||||
|
Goodwill impairment
|
—
|
|
28,306
|
|
—
|
|
|||||
|
Changes in operating assets and liabilities:
|
|||||||||||
|
Accounts receivable
|
(941
|
)
|
10,024
|
|
(11,109
|
)
|
|||||
|
Inventories
|
(1,404
|
)
|
4,764
|
|
(7,510
|
)
|
|||||
|
Prepaid expenses and other assets
|
6,391
|
|
2,017
|
|
2,026
|
|
|||||
|
Accounts payable and other liabilities
|
(9,410
|
)
|
(11,537
|
)
|
(6,752
|
)
|
|||||
|
Other
|
(131
|
)
|
1,581
|
|
1,163
|
|
|||||
|
Net cash provided by (used) in operating activities
|
$
|
568
|
|
$
|
(8,342
|
)
|
$
|
(23,115
|
)
|
||
|
Investing activities
|
|||||||||||
|
Purchases of property, plant and equipment
|
$
|
(2,908
|
)
|
$
|
(18,320
|
)
|
$
|
(11,066
|
)
|
||
|
Proceeds from sale of property
|
38
|
|
12,278
|
|
—
|
|
|||||
|
Proceeds related to sale of businesses, net
|
—
|
|
909
|
|
58
|
|
|||||
|
Net cash used in investing activities
|
$
|
(2,870
|
)
|
$
|
(5,133
|
)
|
$
|
(11,008
|
)
|
||
|
Financing activities
|
|||||||||||
|
Net (payments on) proceeds from revolving line of credit
|
$
|
(49
|
)
|
$
|
16,127
|
|
$
|
—
|
|
||
|
Dividends paid
|
—
|
|
(3,084
|
)
|
(4,098
|
)
|
|||||
|
Payment of financing fees
|
—
|
|
(631
|
)
|
—
|
|
|||||
|
Net cash (used in) provided by financing activities
|
$
|
(49
|
)
|
$
|
12,412
|
|
$
|
(4,098
|
)
|
||
|
Discontinued operations
|
|||||||||||
|
Operating cash flows
|
$
|
1,666
|
|
$
|
768
|
|
$
|
(163
|
)
|
||
|
Investing cash flows
|
(257
|
)
|
(181
|
)
|
(66
|
)
|
|||||
|
Net cash provided by (used in) discontinued operations
|
$
|
1,409
|
|
$
|
587
|
|
$
|
(229
|
)
|
||
|
Decrease in cash and cash equivalents
|
(942
|
)
|
(476
|
)
|
(38,450
|
)
|
|||||
|
Cash and cash equivalents at beginning of year
|
1,640
|
|
2,116
|
|
40,566
|
|
|||||
|
Cash and cash equivalents at end of year
|
$
|
698
|
|
$
|
1,640
|
|
$
|
2,116
|
|
||
See notes to Consolidated Financial Statements
31
Lawson Products, Inc.
Notes to Consolidated Financial Statements
Lawson Products, Inc. (“Lawson” or the “Company”) is a North American distributor of products and services to the industrial, commercial, institutional and government maintenance, repair and operations (“MRO”) marketplace.
Principles of Consolidation
— The accompanying consolidated financial statements have been prepared in accordance with accounting principles generally accepted in the United States and include the accounts and transactions of the Company and its wholly-owned subsidiaries. All significant intercompany transactions and balances have been eliminated in consolidation. Prior period amounts reflect the classification of Automatic Screw Machine Products Company, Inc. ("ASMP") as a discontinued operation and conform to the current year presentation.
Revenue Recognition
— Net sales include product sales and billings for freight and handling charges. Sales and associated cost of goods sold are generally recognized when products are shipped and title passes to customers. We accrue for returns based on historical evidence of return rates.
Cash Equivalents
— The Company considers all highly liquid investments with a maturity of three months or less when purchased to be cash equivalents.
Allowance for Doubtful Accounts
— The Company evaluates the collectability of accounts receivable based on a combination of factors. In circumstances where the Company is aware of a specific customer’s inability to meet its financial obligations (e.g., bankruptcy filings, substantial down-grading of credit ratings), a specific reserve for bad debts is recorded against amounts due to reduce the receivable to the amount the Company reasonably believes will be collected. For all other customers, the Company recognizes reserves for bad debts based on the Company’s historical experience of bad debt write-offs as a percent of accounts receivable outstanding. If circumstances change (e.g., higher than expected defaults or an unexpected material adverse change in a major customer’s ability to meet its financial obligations), the estimates of the recoverability of amounts due the Company could be revised by a material amount.
Inventories
— Inventories principally consist of finished goods stated at the lower of cost or market using the first-in-first-out method. To reduce inventory to a lower of cost or market value, a reserve is recorded for slow-moving and obsolete inventory based on historical experience and monitoring of current inventory activity. Estimates are used to determine the necessity of recording these reserves based on periodic detailed analysis using both qualitative and quantitative factors. As part of this analysis, the Company considers several factors including the inventories length of time on hand, historical sales, product shelf life, product life cycle, product classification and product obsolescence. It is the Company’s policy to not re-value inventory to the original cost basis subsequent to establishing a new cost basis.
Property, Plant and Equipment
— Property, plant and equipment are stated at cost less accumulated depreciation and amortization. Depreciation expense is computed by the straight-line method generally using useful lives of
20
to
30
years for buildings and improvements and
3
to
10
years for machinery and equipment, furniture and fixtures and vehicles. Amortization of financing and capital leases is included in depreciation expense. Depreciation expense was
$5.4 million
,
$4.3 million
and
$3.7 million
for
2013
,
2012
and
2011
, respectively. Capitalized software is amortized over estimated useful lives of
3
to
5
years using the straight-line method. Amortization expense of capitalized software was
$3.5 million
,
$2.8 million
and
$1.7 million
for
2013
,
2012
and
2011
, respectively.
Cash Value of Life Insurance
— The Company has invested funds in life insurance policies on certain current and former executives. The cash surrender value of the policies is invested in various investment instruments and is recorded as an asset on our consolidated financial statements. The Company records these funds at contractual value. The change in the cash surrender value of the life insurance policies, which is recorded as a component of Selling, general and administrative expenses, is the change in the policies' contractual values.
Deferred Compensation
— The Company’s Executive Deferral Plan (“Deferral Plan”) allows certain executives to defer payment of a portion of their earned compensation. The deferred compensation is recorded in an Account Balance, which is a bookkeeping entry made by the Company to measure the amount due to the participant. The Account Balance is equal to the participant’s deferred compensation, adjusted for increases and/or decreases in the amount that the participant has designated to one or more bookkeeping portfolios that track the performance of certain mutual funds. Lawson adjusts the deferred compensation
32
liability to equal the contractual value of the participants’ Account Balances. These adjustments are the changes in contractual value of the individual plans and are recorded as a component of Selling, general and administrative expenses.
Stock-Based Compensation
— Compensation based on the share value of the Company’s common stock is valued at its fair value at the grant date and the expense is recognized over the vesting period. Fair value is re-measured each reporting period for liability-classified awards that may be redeemable in cash.
Goodwill
— Goodwill represents the cost of business acquisitions in excess of the fair value of identifiable net tangible and intangible assets acquired. Goodwill is allocated to the appropriate reporting unit as reviewed by the Company’s chief operating decision maker responsible for reviewing operating performance and allocating resources. Impairment of goodwill is evaluated using a three-step process. First, we look at qualitative factors to determine whether events or circumstances exist that would lead us to a determine that it is more likely than not that the fair value of a reporting unit is less than its carrying amount. If events or circumstances do exist that lead us to determine that it is more likely than not that the fair value of a reporting unit is less than its carrying value, then the fair value of the reporting unit is compared with its carrying amount, including goodwill. If the fair value of the reporting unit exceeds its carrying amount, goodwill of the reporting unit is not considered impaired, and thus, the third step of the impairment test is unnecessary. If the carrying amount of the reporting unit exceeds its fair value, the third step of the goodwill impairment test is performed to measure the amount of impairment loss, if any.
In 2012, we identified indicators of impairment related to recurring operating losses and reduced market capitalization and, therefore, performed an interim impairment test of goodwill. We then estimated the fair value of the reporting unit using a discounted cash flow analysis based on our current internal operating forecast to determine the reporting unit’s fair value. After completing the analysis, we concluded that the entire amount of the goodwill was impaired and a non-cash charge of
$28.3 million
was recorded.
Impairment of Long-Lived Assets
— The Company reviews its long-lived assets, including property, plant and equipment and intangibles, for impairment whenever events or changes in circumstances indicate that the carrying amounts of these assets may not be recoverable. Recoverability is measured by a comparison of the assets' carrying amount to their expected future undiscounted net cash flows. If such assets are considered to be impaired, the impairment to be recognized is measured based on the amount by which the carrying amount of the asset exceeds its fair value.
Income Taxes
— Deferred tax assets or liabilities reflect temporary differences between amounts of assets and liabilities for financial and tax reporting. Such amounts are adjusted, as appropriate, to reflect changes in enacted tax rates expected to be in effect when the temporary differences reverse. A valuation allowance is established to offset any deferred tax assets if, based upon the available evidence, it is more likely than not (i.e. greater than 50% likely) that some or all of the deferred tax assets will not be realized. The determination of the amount of a valuation allowance to be provided on recorded deferred tax assets involves estimates regarding (1) the timing and amount of the reversal of taxable temporary differences, (2) expected future taxable income, (3) the impact of tax planning strategies and (4) the ability to carry back deferred tax assets to offset prior taxable income. In assessing the need for a valuation allowance, we consider all available positive and negative evidence, including past operating results, projections of future taxable income and the feasibility of ongoing tax planning strategies. The projections of future taxable income include a number of estimates and assumptions regarding our volume, pricing and costs. Additionally, valuation allowances related to deferred tax assets can be impacted by changes to tax laws. Significant judgment is required in determining income tax provisions as well as deferred tax asset and liability balances, including the estimation of valuation allowances and the evaluation of tax positions.
Primarily due to the cumulative losses incurred in recent years, management determined that it was more likely than not that it would not be able to utilize deferred tax assets to offset future taxable income and increased the deferred tax valuation allowance to equal substantially all of the Company's net tax assets. A tax valuation allowance will remain until the Company can establish that the recoverability of its deferred tax assets is more certain.
Earnings from the Company's foreign subsidiaries are considered to be indefinitely reinvested. A distribution of these non-U.S. earnings in the form of dividends or otherwise would subject the Company to both U.S. Federal and state income taxes, as adjusted for tax credits and foreign withholding taxes.
The Company recognizes the benefit of tax positions when a benefit is more likely than not (i.e., greater than 50% likely) to be sustained on its technical merits. Recognized tax benefits are measured at the largest amount that is more likely than not to be sustained, based on cumulative probability, in final settlement of the position. The Company recognizes interest and penalties related to unrecognized tax benefits as a component of income tax expense.
33
Leases
— Leases are categorized as either operating or capital leases at inception. Operating lease costs are recognized on a straight-line basis over the term of the lease. An asset and a corresponding liability for the capital lease obligation are established for the cost of capital leases. The capital lease obligation is amortized over the life of the lease. For build-to-suit leases, the Company establishes an asset and liability for the estimated construction costs incurred to the extent that it is involved in the construction of structural improvements or takes construction risk prior to the commencement of the lease. Upon occupancy of facilities under build-to-suit leases, the Company assesses whether these arrangements qualify for sales recognition under the sale-leaseback accounting guidance. If a lease does not meet the criteria to qualify for a sale-leaseback transaction, the established asset and liability remain on the Company's consolidated balance sheet. This asset is depreciated over the life of the lease and the liability is reduced by the non-interest portion of the lease payments for costs allocated to the building and on a straight line basis for costs allocated to land.
Sub-leases
— If the Company is relieved of its primary obligation under the original lease then the original lease is considered to be terminated, otherwise if the Company retains primary obligation under the original lease then the Company continues to account for the original lease and also accounts for the new sub-lease as lessor. At the time the sub-lease is executed, the Company records a gain or loss equal to the difference between the total cash payments to be made for gross rent under the original lease agreement over the life of the sub-lease plus executory costs and total gross rent proceeds expected to be received over the life of the sub-lease.
Earnings per Share
— Basic earnings per share is computed by dividing net income by the weighted average number of common shares outstanding during the period. Diluted earnings per share reflect the potential dilution from the exercise or conversion of outstanding stock options and restricted stock awards into common stock.
Foreign Currency
— The accounts of foreign subsidiaries are measured using the local currency as the functional currency. All balance sheet amounts are translated into U.S. dollars using the exchange rates in effect at the applicable period end. Income statement amounts are translated using the average exchange rate for the applicable period. The gains and losses resulting from the changes in exchange rates from the translation of subsidiary accounts in local currency to U.S. dollars have been reported as a component of Accumulated other comprehensive income in the Consolidated Balance Sheets. Foreign currency transaction gains and losses result from the effect of exchange rate changes on transactions denominated in currencies other than the functional currency. These gains and losses are included in the Consolidated Statements of Operations and Comprehensive Loss and were immaterial for all years presented.
Treasury Stock
—The Company repurchased
2,691
,
2,474
and
3,759
shares of its common stock in
2013
,
2012
and
2011
, respectively, from employees upon the vesting of restricted stock to offset the income taxes owed by those employees. The Company accounts for treasury stock using the cost method and includes treasury stock as a component of stockholders’ equity.
Use of Estimates
— Preparation of financial statements in conformity with accounting principles generally accepted in the United States requires management to make estimates and assumptions that affect the amounts reported in the consolidated financial statements and accompanying notes. Actual results could differ from these estimates.
Recent Accounting Pronouncements
In May 2013, the Financial Accounting Standards Board (“FASB”) reissued an exposure draft on lease accounting that would require entities to recognize assets and liabilities arising from lease contracts on the balance sheet. The exposure draft states that lessees and lessors should apply a “right-of-use model” in accounting for all leases. Under the proposed model, lessees would recognize an asset for the right to use the leased asset, and a liability for the obligation to make rental payments over the lease term. The lease expense from real estate based leases would continue to be recorded under a straight line approach, but other leases not related to real estate would be expensed using an effective interest method that would accelerate lease expense. A final standard is currently expected to be issued in 2014 and would be effective no earlier than annual reporting periods beginning on January 1, 2017. The Company is currently assessing the impact that the adoption of the guidance would have on its financial position, results of operations and cash flows.
Subsequent Events
— The Company has evaluated events through the issue date of this Form 10-K and has determined that, except for the completion of the sale of ASMP (see
Note 13 - Discontinued Operations
), no reportable events have occurred subsequent to the date of these consolidated financial statements.
34
The Company has agreed to maintain
$0.8 million
in a money market account as collateral for an outside party that is providing certain commercial card processing services for the Company. The Company is restricted from withdrawing this balance without the prior consent of the outside party during the term of the agreement.
Inventories, consisting primarily of purchased goods which are offered for resale, were as follows:
|
(Dollars in thousands)
|
|||||||
|
December 31,
|
|||||||
|
2013
|
2012
|
||||||
|
Inventories, gross
|
$
|
51,102
|
|
$
|
52,337
|
|
|
|
Reserve for obsolete and excess inventory
|
(5,328
|
)
|
(7,656
|
)
|
|||
|
Inventories, net
|
$
|
45,774
|
|
$
|
44,681
|
|
|
Components of property, plant and equipment were as follows:
|
(Dollars in thousands)
|
|||||||
|
December 31,
|
|||||||
|
2013
|
2012
|
||||||
|
Land
|
$
|
5,864
|
|
$
|
5,952
|
|
|
|
Buildings and improvements
|
30,885
|
|
31,087
|
|
|||
|
Machinery and equipment
|
22,989
|
|
25,632
|
|
|||
|
Capitalized software
|
18,234
|
|
16,798
|
|
|||
|
McCook Facility
|
12,961
|
|
12,961
|
|
|||
|
Furniture and fixtures
|
4,424
|
|
6,931
|
|
|||
|
Capital leases
|
1,007
|
|
1,694
|
|
|||
|
Vehicles
|
164
|
|
131
|
|
|||
|
Construction in progress
|
1,269
|
|
7,486
|
|
|||
|
97,797
|
|
108,672
|
|
||||
|
Accumulated depreciation and amortization
|
(38,823
|
)
|
(41,691
|
)
|
|||
|
$
|
58,974
|
|
$
|
66,981
|
|
||
Loss from continuing operations before income taxes consisted of the following:
|
(Dollars in thousands)
|
|||||||||||
|
Year Ended December 31,
|
|||||||||||
|
2013
|
2012
|
2011
|
|||||||||
|
United States
|
$
|
(6,255
|
)
|
$
|
(36,808
|
)
|
$
|
(5,380
|
)
|
||
|
Canada
|
(867
|
)
|
(9,290
|
)
|
(976
|
)
|
|||||
|
$
|
(7,122
|
)
|
$
|
(46,098
|
)
|
$
|
(6,356
|
)
|
|||
35
Provision (benefit) for income taxes from continuing operations for the years ended December 31, consisted of the following:
|
(Dollars in thousands)
|
|||||||||||
|
Year Ended December 31,
|
|||||||||||
|
2013
|
2012
|
2011
|
|||||||||
|
Current income tax expense (benefit):
|
|||||||||||
|
U.S. Federal
|
$
|
(864
|
)
|
$
|
(740
|
)
|
$
|
384
|
|
||
|
U.S. state
|
84
|
|
215
|
|
295
|
|
|||||
|
Canada
|
639
|
|
1,016
|
|
(190
|
)
|
|||||
|
Total
|
$
|
(141
|
)
|
$
|
491
|
|
$
|
489
|
|
||
|
Deferred income tax expense (benefit):
|
|||||||||||
|
U.S. Federal
|
$
|
—
|
|
$
|
16,159
|
|
$
|
(2,187
|
)
|
||
|
U.S. state
|
—
|
|
1,160
|
|
(155
|
)
|
|||||
|
Canada
|
—
|
|
125
|
|
86
|
|
|||||
|
Total
|
$
|
—
|
|
$
|
17,444
|
|
$
|
(2,256
|
)
|
||
|
Total income tax expense (benefit):
|
|||||||||||
|
U.S. Federal
|
$
|
(864
|
)
|
$
|
15,419
|
|
$
|
(1,803
|
)
|
||
|
U.S. state
|
84
|
|
1,375
|
|
140
|
|
|||||
|
Canada
|
639
|
|
1,141
|
|
(104
|
)
|
|||||
|
Total
|
$
|
(141
|
)
|
$
|
17,935
|
|
$
|
(1,767
|
)
|
||
The reconciliation between the effective income tax rate and the statutory federal rate for continuing operations was as follows:
|
Year Ended December 31,
|
||||||||
|
2013
|
2012
|
2011
|
||||||
|
Statutory Federal rate
|
35.0
|
%
|
35.0
|
%
|
35.0
|
%
|
||
|
Increase (decrease) resulting from:
|
||||||||
|
Change in valuation allowance
|
(30.3
|
)
|
(72.4
|
)
|
(1.5
|
)
|
||
|
Change in uncertain tax positions
|
(9.8
|
)
|
(4.4
|
)
|
(1.6
|
)
|
||
|
Executive life insurance
|
5.1
|
|
0.8
|
|
(0.9
|
)
|
||
|
State and local taxes, net
|
3.2
|
|
2.6
|
|
(1.3
|
)
|
||
|
Meals & entertainment
|
(1.9
|
)
|
(0.3
|
)
|
(2.8
|
)
|
||
|
Provision to return differences
|
1.5
|
|
0.9
|
|
(0.3
|
)
|
||
|
Deferred tax expense
|
—
|
|
—
|
|
1.0
|
|
||
|
Other items, net
|
(0.8
|
)
|
(1.1
|
)
|
0.2
|
|
||
|
Provision for income taxes
|
2.0
|
%
|
(38.9
|
)%
|
27.8
|
%
|
||
Income taxes paid for the years ended
December 31, 2013
,
2012
, and
2011
amounted to
$0.2 million
,
$0.2 million
and
$2.6 million
, respectively. In
2013
,
2012
and
2011
, the Company received
$0.7 million
,
$3.4 million
and
$3.3 million
, respectively, in income tax refunds primarily related to the carryback of net operating losses and recovery of income tax overpayments in prior years.
At
December 31, 2013
, the Company had
$46.5 million
of U.S. Federal net operating loss carryforwards which are subject to expiration beginning in
2030
and
$0.5 million
of foreign tax credit carryforwards which are subject to expiration beginning in
2020
. In addition, the Company had
$44.9 million
of state net operating loss carryforwards which expire at varying dates through
2031
.
Primarily due to the cumulative losses incurred in recent years, management determined that it was more likely than not that the Company will not be able to utilize its deferred tax assets to offset future taxable income. Therefore, in 2013 and 2012
36
the Company increased its deferred tax valuation allowance by
$1.6 million
and
$33.3 million
, respectively. The tax valuation allowance will remain until the Company can establish that the recoverability of its deferred tax assets is more certain.
Deferred income tax assets and liabilities contain the following temporary differences:
|
(Dollars in thousands)
|
|||||||
|
December 31,
|
|||||||
|
2013
|
2012
|
||||||
|
Deferred tax assets:
|
|||||||
|
Compensation and benefits
|
$
|
10,883
|
|
$
|
14,101
|
|
|
|
Net operating loss carryforward
|
18,453
|
|
12,710
|
|
|||
|
Inventory reserve
|
2,734
|
|
3,654
|
|
|||
|
Accounts receivable reserve
|
353
|
|
657
|
|
|||
|
Other
|
4,113
|
|
4,694
|
|
|||
|
Total deferred tax assets
|
36,536
|
|
35,816
|
|
|||
|
Deferred tax liabilities:
|
|||||||
|
Property, plant and equipment
|
53
|
|
738
|
|
|||
|
Other
|
590
|
|
728
|
|
|||
|
Total deferred liabilities
|
643
|
|
1,466
|
|
|||
|
Net deferred tax assets before valuation allowance
|
35,893
|
|
34,350
|
|
|||
|
Valuation allowance
|
(35,834
|
)
|
(34,278
|
)
|
|||
|
Net deferred tax assets
|
$
|
59
|
|
$
|
72
|
|
|
|
Net deferred tax assets:
|
|||||||
|
Net current deferred tax assets
|
$
|
5
|
|
$
|
17
|
|
|
|
Net noncurrent deferred tax assets
|
54
|
|
55
|
|
|||
|
Net deferred tax assets
|
$
|
59
|
|
$
|
72
|
|
|
A reconciliation of the beginning and ending amount of unrecognized tax benefits is as follows:
|
(Dollars in thousands)
|
|||||||
|
December 31,
|
|||||||
|
2013
|
2012
|
||||||
|
Balance at beginning of year
|
$
|
2,096
|
|
$
|
92
|
|
|
|
Additions for tax positions of current year
|
585
|
|
1,261
|
|
|||
|
Additions for tax positions of prior years
|
114
|
|
835
|
|
|||
|
Reductions for tax positions of prior years
|
—
|
|
(92
|
)
|
|||
|
Balance at end of year
|
$
|
2,795
|
|
$
|
2,096
|
|
|
The recognition of the unrecognized tax benefits would have a favorable effect on the effective tax rate. Due to the uncertainty of both timing and resolution of income tax examinations, the Company is unable to determine whether any amounts included in the
December 31, 2013
balance of unrecognized tax benefits represent tax positions that could significantly change during the next twelve months.
The Company and its subsidiaries are subject to U.S. Federal income tax as well as income tax of multiple state and foreign jurisdictions. As of
December 31, 2013
, the Company was subject to income tax examinations in various jurisdictions for the tax years 2006 through 2012. During
2013
, the Company completed U.S. Federal income tax examinations through tax year 2009. The Company is currently under examination by the Canada Revenue Authority ("CRA") for the years 2006 through 2010. The CRA examination was completed during May 2013 and resulted in proposed adjustments which amount to
$1.3 million
of additional tax for the 2008 and 2009 tax years. The Company is not in agreement with these adjustments and filed a request with Competent Authority programs in both the U.S. and Canada in October, 2013. The Competent Authority program assists taxpayers with respect to matters covered in the mutual agreement procedure provisions of tax treaties. Management has not recorded a reserve and is confident that the Company will prevail in this matter. The Company is unable to establish an estimated time frame in which this issue will be resolved through Competent Authority.
37
Accrued expenses and other liabilities consisted of the following:
|
(Dollars in thousands)
|
|||||||
|
December 31,
|
|||||||
|
2013
|
2012
|
||||||
|
Accrued compensation
|
$
|
8,113
|
|
$
|
11,681
|
|
|
|
Accrued severance
|
1,651
|
|
3,467
|
|
|||
|
Accrued stock-based compensation
|
1,642
|
|
279
|
|
|||
|
Accrued and withheld taxes, other than income taxes
|
1,259
|
|
1,484
|
|
|||
|
Reserve for unrecognized tax benefits
|
962
|
|
916
|
|
|||
|
Accrued health benefits
|
933
|
|
1,235
|
|
|||
|
Financing lease obligation
|
745
|
|
806
|
|
|||
|
Accrued profit sharing
|
124
|
|
539
|
|
|||
|
Employment tax matter
|
—
|
|
1,200
|
|
|||
|
Other
|
8,092
|
|
9,723
|
|
|||
|
$
|
23,521
|
|
$
|
31,330
|
|
||
In 2012, the Company entered into a Loan and Security Agreement (“Loan Agreement”) which expires in August 2017. Due to the lock box arrangement and a subjective acceleration clause contained in the borrowing agreement, the revolving line of credit is classified as a current liability. The Loan Agreement consists of a
$40.0 million
revolving line of credit facility, which includes a
$10.0 million
sub-facility for letters of credit. In December 2013, the Company entered into a Second Amendment to Loan and Security Agreement ("Second Amendment") which revised certain terms of the original Loan Agreement.
Credit available under the Loan Agreement is based upon:
|
a)
|
80%
of the face amount of the Company’s eligible accounts receivable, generally less than
60
days past due, and
|
|
b)
|
the lesser of
50%
of the lower of cost or market value of the Company’s eligible inventory, generally inventory expected to be sold within
18
months, or
$20.0 million
.
|
The applicable interest rates for borrowings are at the Prime rate or, if the Company elects, the LIBOR rate plus
1.50%
to
1.85%
based on the Company’s debt to EBITDA ratio. The Loan Agreement is secured by a first priority perfected security interest in substantially all existing assets of the Company. Dividends are restricted so as not to exceed
$7.0 million
annually.
At
December 31, 2013
, the Company had an outstanding balance of
$16.1 million
under its revolving line of credit facility and additional borrowing availability of
$17.9 million
. The Company paid interest of
$1.1 million
,
$0.7 million
and
$0.7 million
in 2013, 2012 and 2011, respectively. The weighted average interest rate was
2.98%
in
2013
and the outstanding balance approximates fair value.
In addition to other customary representations, warranties and covenants, we are required to meet a minimum trailing twelve month EBITDA, as defined in the Loan Agreement, to fixed charges ratio and a minimum quarterly tangible net worth level as defined in the Second Amendment. On December 31, 2013, we were in compliance with all financial covenants as detailed below:
|
Quarterly Financial Covenants
|
Requirement
|
Actual
|
||
|
EBITDA to fixed charges ratio
|
1.10 : 1.00
|
2.30 : 1.00
|
||
|
Minimum tangible net worth
|
$45.0 million
|
$57.7 million
|
||
38
Severance costs are primarily related to management realignment and reorganization. The table below reflects the activity in the Company’s reserve for severance and related payments.
|
(Dollars in thousands)
|
|||||||||||
|
Year Ended December 31,
|
|||||||||||
|
2013
|
2012
|
2011
|
|||||||||
|
Beginning balance
|
$
|
4,417
|
|
$
|
1,282
|
|
$
|
3,062
|
|
||
|
Charged to earnings
|
837
|
|
8,021
|
|
1,614
|
|
|||||
|
Cash paid and exchange rate variance
|
(3,485
|
)
|
(4,886
|
)
|
(3,394
|
)
|
|||||
|
Ending balance
|
$
|
1,769
|
|
$
|
4,417
|
|
$
|
1,282
|
|
||
Accrued severance charges were included in the following line items of the Consolidated Balance Sheets:
|
(Dollars in thousands)
|
|||||||
|
December 31,
|
|||||||
|
2013
|
2012
|
||||||
|
Accrued severance included in:
|
|||||||
|
Accrued expenses and other liabilities
|
$
|
1,651
|
|
$
|
3,467
|
|
|
|
Noncurrent other
|
118
|
|
950
|
|
|||
|
Total accrued severance
|
$
|
1,769
|
|
$
|
4,417
|
|
|
The remaining severance liabilities outstanding as of
December 31, 2013
will be substantially paid by the end of 2014.
The Company provides a 401(k) defined contribution plan to allow employees a pre-tax investment vehicle to save for retirement. Beginning January 1, 2012, the Company began contributing matching funds to the 401(k) plan. In 2013, the amount of contributions increased substantially as the U.S. sales representatives that converted from independent agents to employees on January 1, 2013 became eligible for the plan. The Company made contributions to the 401(k) plan of
$2.7 million
and
$1.7 million
for the years ended
December 31, 2013
and
2012
, respectively.
The Company provides a profit sharing plan for certain sales, office and warehouse employees. The amounts of the Company’s annual contributions are determined annually by the Board of Directors. Expenses incurred for the profit sharing plan were
$0.1 million
,
$0.5 million
and
$2.5 million
for the years ended
December 31, 2013
,
2012
and
2011
, respectively.
The Company has a security bonus plan for the benefit of its independent sales representatives, under the terms of which participants are credited with a percentage of their yearly net commissions. The aggregate amounts credited to participants’ accounts vest
25%
after
five
years and an additional
5%
vests each year thereafter upon qualification for the plan. On January 1, 2013, the Company converted all of its U.S. independent sales representatives to employees. The security bonus for those converted employees continue to vest, but their accounts are no longer credited with a percentage of net commissions. For financial reporting purposes, amounts are charged to operations over the vesting period. Expenses incurred for the security bonus plan were
$0.7 million
,
$2.1 million
and
$2.1 million
for the years ended
December 31, 2013
,
2012
and
2011
, respectively.
Lease Commitments
Total rental expense for the years ended
December 31, 2013
,
2012
and
2011
amounted to
$2.2 million
,
$2.5 million
and
$0.8 million
, respectively. Of the
$12.5 million
future minimum operating lease commitments outstanding at
December 31, 2013
,
$10.5 million
relates to a lease for the Company's headquarters which expires in March 2023. The lease commitment is partially offset by a portion of the headquarters that has been sub-leased through March of 2023 and includes total future minimum lease proceeds of
$0.8 million
. The Company has a financing lease for the McCook Facility which expires in June 2022 and
39
includes future minimum lease payments, related to the building, of
$11.1 million
. Non-cash increases in assets and liabilities of
$8.0 million
and
$4.0 million
in 2012 and 2011, respectively, related to the construction of the McCook Facility were not reflected in the Consolidated Statements of Cash Flows.
The Company’s future minimum lease commitments, principally for facilities and equipment, as of
December 31, 2013
, were as follows:
|
(Dollars in thousands)
|
||||||||||||
|
Year ended December 31,
|
Operating Leases
|
Financing Lease
|
Capital
Leases
|
|||||||||
|
2014
|
$
|
1,293
|
|
$
|
1,085
|
|
$
|
96
|
|
|||
|
2015
|
1,229
|
|
1,124
|
|
8
|
|
||||||
|
2016
|
1,261
|
|
1,165
|
|
4
|
|
||||||
|
2017
|
1,305
|
|
1,255
|
|
—
|
|
||||||
|
2018
|
1,348
|
|
1,348
|
|
—
|
|
||||||
|
Thereafter
|
6,046
|
|
5,092
|
|
—
|
|
||||||
|
Total
|
$
|
12,482
|
|
$
|
11,069
|
|
$
|
108
|
|
|||
At
December 31, 2013
, the cost and accumulated depreciation of the asset related to the financing obligation were
$13.0 million
and
$2.0 million
, respectively, and the cost and accumulated amortization of the assets related to capital leases were
$1.0 million
and
$0.9 million
, respectively.
Litigation, regulatory and tax matters
The Company is involved in legal actions that arise in the ordinary course of business. It is the opinion of management that the resolution of any currently pending litigation will not have a material adverse effect on the Company’s financial position or results of operations.
Employment tax matter
One of the Company's subsidiaries, Drummond American LLC (“Drummond”), was under an employment tax examination for the years 2007 and 2008 regarding the long-standing treatment of its sales representatives as independent contractors. In January 2012, the Company received a Notice of Proposed Adjustment in the amount of
$9.5 million
, including penalties, from the IRS challenging Drummond's position that the sales representatives were independent contractors rather than employees. The Company disagreed with the IRS position and filed an administrative appeal with the IRS Appeals Office and established a liability of
$1.2 million
during 2011 as its best estimate of the cost to resolve the matter with the IRS. The tax matter was settled with the IRS in December, 2013 for
$0.8 million
and the Company believes that it has no further liability related to this matter.
Environmental matter
In 2012, the Company identified that a site it owns in Decatur, Alabama contains hazardous substances in the soil and groundwater as a result of historical operations prior to the Company's ownership. The Company has retained an environmental consulting firm to further investigate the contamination including the measurement and monitoring of the site. On August 13, 2013, the site was enrolled in the state of Alabama's voluntary cleanup program. At this time insufficient data regarding the situation has been collected to reasonably estimate the extent of the contamination or the cost, if any, of remedying this situation. Accordingly, the Company has not established a reserve for any remediation costs.
Plan Administration
The Company's 2009 Equity Compensation Plan (“Equity Plan”) provides for the grant of nonqualified and incentive stock options, stock awards and stock units to officers and employees of the Company. The Equity Plan also provides for the grant of option rights and restricted stock to non-employee directors. Under the Equity Plan,
500,000
shares of common stock were
40
available to be awarded with no participant being granted more than
40,000
shares of common stock in any calendar year. As of
December 31, 2013
, the Company had approximately
77,000
shares of common stock still available under the Equity Plan. The Equity Plan is administered by the Compensation Committee of the Board of Directors, or its designee, which as administrator of the plan, has the authority to select plan participants, grant awards, and determine the terms and conditions of the awards.
The Company also has a Stock Performance Rights Plan (“SPR Plan”) that provides for the issuance of Stock Performance Rights (“SPRs”) that allow non-employee directors, officers and key employees to receive cash awards, subject to certain restrictions, equal to the appreciation of the Company's common stock. The SPR Plan is administered by the Compensation Committee of the Board of Directors.
Stock Performance Rights
SPRs entitle the recipient to receive a cash payment equal to the excess of the market value of the Company's common stock over the SPR exercise price when the SPRs are surrendered. Expense, equal to the fair market value of the SPR at the date of grant and remeasured each reporting period, is recorded ratably over the vesting period. Employees and non-employee directors who are retirement eligible, defined as age
65
or older, are permitted to retain their awards after retirement and exercise them during the remaining contractual life. All expense is recognized on the date of grant for SPRs granted to retirement eligible recipients. Compensation expense or benefit is included in Selling, general and administrative expense. A majority of the outstanding SPRs have a
seven
or
ten
year life and vest over
one
to
three years
beginning on the first anniversary of the date of the grant.
On
December 31, 2013
, the SPRs outstanding were re-measured at fair value using the Black-Scholes valuation model. This model requires the input of subjective assumptions that may have a significant impact on the fair value estimate. The weighted-average estimated value of SPRs outstanding as of
December 31, 2013
was
$4.76
per SPR using the following assumptions:
|
Expected volatility
|
32.2% to 65.3%
|
|
Risk-free rate of return
|
0.1% to 1.9%
|
|
Expected term (in years)
|
0.7 to 5.2
|
|
Expected annual dividend
|
$0
|
The expected volatility was based on the historic volatility of the Company's stock price commensurate with the expected life of the SPR. The risk-free rate of return reflects the interest rate offered for zero coupon treasury bonds over the expected life of the SPR. The expected life represents the period of time that options granted are expected to be outstanding and was calculated using the simplified method allowed by the SEC due to insufficient historical data. The estimated annual dividend was based on the recent dividend payout trend.
Compensation expense of
$1.4 million
was recorded for the year ended December 31, 2013. A benefit of
$0.6 million
and
$1.1 million
was recognized for the years ended December 31, 2012 and 2011, respectively, as the overall decline in the fair value of the SPRs exceeded the amortization expense related to the unvested SPRs. No cash has been paid out for SPR exercises during the three year period ended
December 31, 2013
.
Activity related to the Company’s SPRs during the year ended December 31, 2013 was as follows:
|
Weighted
|
||||||
|
Number
|
Average
|
|||||
|
of SPRs
|
Exercise Price
|
|||||
|
Outstanding on December 31, 2012
|
516,700
|
|
$
|
15.28
|
|
|
|
Granted
|
148,301
|
|
12.20
|
|
||
|
Cancelled
|
(45,732
|
)
|
15.58
|
|
||
|
Outstanding on December 31, 2013
|
619,269
|
|
14.48
|
|
||
|
Exercisable on December 31, 2013
|
258,050
|
|
$
|
21.17
|
|
|
41
The SPRs outstanding had an intrinsic value of
$1.5 million
as of December 31, 2013. Unrecognized compensation cost related to non-vested SPRs was
$1.3 million
at December 31, 2013, which will be recognized over a weighted average period of
2.7
years. During the year ended December 31, 2013,
100,867
SPRs with a fair value of
$0.8 million
vested. At December 31, 2013, the weighted average remaining contractual term was
5.9
years for all outstanding SPRs and
5.4
years for all exercisable SPRs.
Restricted Stock Awards
Restricted stock awards ("RSAs") generally vest over a
one
to
three
year period beginning on the first anniversary of the date of the grant. Upon vesting, the vested restricted stock awards are exchanged for an equal number of the Company’s common stock. The participants have no voting or dividend rights with the restricted stock awards. The restricted stock awards are valued at the closing price of the common stock on the date of grant and the expense is recorded ratably over the vesting period.
Compensation expense of
$0.6 million
,
$0.7 million
and
$0.7 million
related to the RSAs was recorded in Selling, general and administrative expenses for 2013, 2012 and 2011, respectively. Activity related to the Company’s RSAs during the year ended December 31, 2013 was as follows:
|
Restricted Stock
|
||
|
Awards
|
||
|
Outstanding on December 31, 2012
|
73,818
|
|
|
Granted
|
34,288
|
|
|
Exchanged for common shares
|
(56,169
|
)
|
|
Cancelled
|
(4,036
|
)
|
|
Outstanding on December 31, 2013
|
47,901
|
|
As of December 31, 2013, there was
$0.2 million
of total unrecognized compensation cost related to RSAs that will be recognized over a weighted average period of
six months
. The awards granted in 2013 had a weighted average grant date fair value of
$14.00
per share.
Market Stock Units
Market Stock Units ("MSUs") are exchangeable for a certain amount of the Company's common shares at the end of the vesting period based on the trailing thirty-day average closing price of the Company's common stock.
|
Market Stock
|
||
|
Units
|
||
|
Outstanding on December 31, 2012
|
—
|
|
|
Granted
|
64,199
|
|
|
Cancelled
|
(5,200
|
)
|
|
Outstanding on December 31, 2013
|
58,999
|
|
The number of shares of common stock that will be issued upon vesting, range from
zero
shares, if the average closing price of the Company's common stock is
$12.18
or less for the
thirty
trading day period ending December 31, 2015, to
88,503
shares if the average closing price of the stock is
$18.00
or greater over that same time frame. An expense of
$0.2 million
related to MSUs was recorded in the year ended December 31, 2013.
42
Stock Awards and Stock Options
As of December 31, 2013, the Company had
125,000
stock awards outstanding which entitle the holder to receive shares of the Company’s common stock equal in value to the appreciation in the Company’s common stock from the exercise price of
$10.00
up to the date the holder exercises the award. The stock awards vest on December 31, 2014 and expire on October 2, 2017.
As of December 31, 2013, the Company had
12,198
vested non-qualified stock options outstanding with a weighted average exercise price of
$14.05
and an expiration date of December 31, 2019. Each stock option can be exchanged for one share of the Company’s common stock.
In October 2013, the Company entered into an Asset Purchase Agreement to sell substantially all of the assets of ASMP, a wholly owned subsidiary, to Nelson Stud Welding, Inc. (“Buyer”), an indirect subsidiary of Doncasters Group Limited, for a cash purchase price of
$12.5 million
, subject to adjustments based on the closing date net working capital, plus the assumption of certain liabilities. In addition, the Buyer will lease the real property located in Decatur, Alabama currently used by ASMP. The Company has reclassified ASMP's operating results as discontinued operations for all periods presented. The sale of ASMP was finalized on February 14, 2014. The company anticipates recognizing a pretax gain of approximately $1.6 million, subject to working capital adjustments, in the first quarter of 2014.
Other discontinued operations include the 2010 sale of substantially all of the assets of Assembly Component Systems, Inc. and Rutland Tool & Supply Company, Inc. as well as the Company's Mexico operation which was closed in 2007.
The following table details the components of income from discontinued operations:
|
(Dollars in thousands)
|
||||||||||||
|
Year Ended December 31,
|
||||||||||||
|
2013
|
2012
|
2011
|
||||||||||
|
Net sales of ASMP
|
$
|
18,534
|
|
$
|
16,925
|
|
$
|
14,560
|
|
|||
|
Pre-tax operating income (loss) from discontinued operations
|
||||||||||||
|
ASMP
|
$
|
2,801
|
|
$
|
2,118
|
|
$
|
280
|
|
|||
|
Other discontinued operations
|
40
|
|
167
|
|
(337
|
)
|
||||||
|
Total pre-tax income (loss)
|
2,841
|
|
2,285
|
|
(57
|
)
|
||||||
|
Income tax expense (benefit)
|
980
|
|
802
|
|
(22
|
)
|
||||||
|
Net income (loss) from discontinued operations
|
1,861
|
|
1,483
|
|
(35
|
)
|
||||||
|
Basic and diluted income (loss) per share
|
||||||||||||
|
ASMP
|
$
|
0.21
|
|
$
|
0.15
|
|
$
|
—
|
|
|||
|
Other discontinued operations
|
0.01
|
|
0.03
|
|
—
|
|
||||||
|
Total
|
$
|
0.22
|
|
$
|
0.18
|
|
$
|
—
|
|
|||
In 2012, in conjunction with the construction of a new distribution center in McCook, Illinois and the relocation of the Company’s headquarters to Chicago, Illinois, the Company sold
four
properties; its Addison, Illinois distribution center, its Vernon Hills, Illinois distribution center, its former Des Plaines, Illinois headquarters and a Des Plaines, Illinois administrative building. The Company received cash proceeds of
$12.3 million
for the sale of the four properties, resulting in a gain of
$3.7 million
.
43
As a result of a 2001 acquisition, on December 31, 2011, the Company had a goodwill balance of
$28.1 million
. Goodwill impairment is deemed to exist if the carrying amount of a reporting unit exceeds its estimated fair value and the goodwill impairment charge, if any, is measured as the difference between the carrying amount of the goodwill as compared to its estimated fair value. The Company evaluates goodwill for potential impairment by determining if certain qualitative events have occurred or if circumstances have changed that would more likely than not reduce the fair value of the reporting unit below its carrying value. As a result of this evaluation, the Company identified indicators of impairment in 2012 related to recurring operating losses and reduced market capitalization and, therefore, performed an interim impairment test of goodwill.
The Company estimated the fair value of the reporting unit using a discounted cash flow analysis based on its current operating forecast to determine the reporting unit’s fair value. After completing the analysis, the Company concluded that the entire amount of the goodwill, adjusted for the effect of currency translation, was impaired and a non-cash charge of
$28.3 million
was recorded in 2012.
Goodwill activity in
2013
and
2012
was as follows:
|
(Dollars in thousands)
|
|||||||
|
December 31,
|
|||||||
|
2013
|
2012
|
||||||
|
Beginning balance
|
$
|
—
|
|
$
|
28,148
|
|
|
|
Impairment loss
|
—
|
|
(28,306
|
)
|
|||
|
Translation adjustment
|
—
|
|
158
|
|
|||
|
Ending balance
|
$
|
—
|
|
$
|
—
|
|
|
Other operating expenses, net consisted of the following:
|
(Dollars in thousands)
|
|||||||||||
|
Year Ended December 31,
|
|||||||||||
|
2013
|
2012
|
2011
|
|||||||||
|
Loss on sub-lease transaction
|
$
|
2,928
|
|
$
|
—
|
|
$
|
—
|
|
||
|
Employment tax matter
|
(400
|
)
|
—
|
|
1,200
|
|
|||||
|
Total other operating expenses, net
|
$
|
2,528
|
|
$
|
—
|
|
$
|
1,200
|
|
||
In 2013, the Company entered into an agreement to sub-lease a portion of its leased headquarters. Under lease accounting rules the Company recorded a
$2.9 million
charge, primarily representing the net difference between the Company's future scheduled lease payments and the expected proceeds from the sub-lease, as well as related asset write downs.
In 2011, the Company recorded a
$1.2 million
expense as its best estimate of the cost of settling an employment tax matter related to the classification of the sales representatives of one of the Company’s subsidiaries. In 2013, the employment tax matter with the IRS was settled for
$0.8 million
, resulting in a reduction in other operating expenses of
$0.4 million
. For further details, refer to
Note 11 – Commitments and Contingencies.
44
The computation of basic and diluted earnings (loss) per share consisted of the following:
|
(Dollars in thousands, except per share data)
|
|||||||||||
|
Year Ended December 31,
|
|||||||||||
|
2013
|
2012
|
2011
|
|||||||||
|
Basic and diluted weighted average shares outstanding
|
8,634
|
|
8,589
|
|
8,553
|
|
|||||
|
Earnings (loss):
|
|||||||||||
|
Continuing operations
|
$
|
(6,981
|
)
|
$
|
(64,033
|
)
|
$
|
(4,589
|
)
|
||
|
Discontinued operations
|
1,861
|
|
1,483
|
|
(35
|
)
|
|||||
|
Net loss
|
$
|
(5,120
|
)
|
$
|
(62,550
|
)
|
$
|
(4,624
|
)
|
||
|
Basic and diluted earnings (loss) per share of common stock:
|
|||||||||||
|
Continuing operations
|
$
|
(0.81
|
)
|
$
|
(7.46
|
)
|
$
|
(0.54
|
)
|
||
|
Discontinued operations
|
0.22
|
|
0.18
|
|
—
|
|
|||||
|
Net loss
|
$
|
(0.59
|
)
|
$
|
(7.28
|
)
|
$
|
(0.54
|
)
|
||
The effect of approximately
58,000
,
23,000
and
55,000
restricted share awards outstanding and future stock option exercises for the years ended
December 31, 2013
,
2012
and 2011, respectively, would have been anti-dilutive and therefore, were excluded from the computation of diluted earnings per share.
Financial information related to the Company’s continuing operations by geographic area consisted of the following:
|
(Dollars in thousands)
|
|||||||||||
|
Year Ended December 31,
|
|||||||||||
|
2013
|
2012
|
2011
|
|||||||||
|
Net sales
|
|||||||||||
|
United States
|
$
|
241,115
|
|
$
|
245,196
|
|
$
|
270,511
|
|
||
|
Canada
|
28,388
|
|
28,366
|
|
29,888
|
|
|||||
|
Consolidated total
|
$
|
269,503
|
|
$
|
273,562
|
|
$
|
300,399
|
|
||
|
Long-lived assets
|
|||||||||||
|
United States
|
$
|
56,162
|
|
$
|
63,730
|
|
$
|
49,323
|
|
||
|
Canada
|
2,812
|
|
3,251
|
|
3,349
|
|
|||||
|
Consolidated total
|
$
|
58,974
|
|
$
|
66,981
|
|
$
|
52,672
|
|
||
Net sales are attributed to countries based on the location of customers. Long-lived assets consist of property, plant and equipment.
45
Unaudited quarterly results of operations for the years ended December 31, 2013 and 2012 are summarized below:
|
(Dollars in thousands, except per share data)
|
|||||||||||||||
|
2013 Quarter Ended
|
|||||||||||||||
|
Dec. 31
|
Sept. 30
|
June 30
|
Mar. 31
|
||||||||||||
|
Net sales
|
$
|
65,738
|
|
$
|
68,235
|
|
$
|
68,317
|
|
$
|
67,213
|
|
|||
|
Gross profit
|
39,627
|
|
41,220
|
|
40,634
|
|
39,814
|
|
|||||||
|
Income (loss) from continuing operations
(1)
|
$
|
(3,569
|
)
|
$
|
183
|
|
$
|
9
|
|
$
|
(3,604
|
)
|
|||
|
Income from discontinued operations
|
674
|
|
418
|
|
388
|
|
381
|
|
|||||||
|
Net income (loss)
|
$
|
(2,895
|
)
|
$
|
601
|
|
$
|
397
|
|
$
|
(3,223
|
)
|
|||
|
Basic and diluted income (loss) per share of common stock:
|
|||||||||||||||
|
Continuing operations
|
$
|
(0.41
|
)
|
$
|
0.02
|
|
$
|
—
|
|
$
|
(0.42
|
)
|
|||
|
Discontinued operations
(2)
|
0.08
|
|
0.05
|
|
0.05
|
|
0.05
|
|
|||||||
|
Net income (loss)
(2)
|
$
|
(0.33
|
)
|
$
|
0.07
|
|
$
|
0.05
|
|
$
|
(0.37
|
)
|
|||
|
2012 Quarter Ended
|
|||||||||||||||
|
Dec. 31
|
Sept. 30
|
June 30
|
Mar. 31
|
||||||||||||
|
Net sales
|
$
|
64,505
|
|
$
|
67,863
|
|
$
|
69,830
|
|
$
|
71,364
|
|
|||
|
Gross profit
|
38,900
|
|
42,495
|
|
35,726
|
|
40,297
|
|
|||||||
|
Income (loss) from continuing operations
(3)
|
$
|
1,236
|
|
$
|
(1,557
|
)
|
$
|
(61,538
|
)
|
$
|
(2,174
|
)
|
|||
|
Income from discontinued operations
|
487
|
|
239
|
|
381
|
|
376
|
|
|||||||
|
Net income (loss)
|
$
|
1,723
|
|
$
|
(1,318
|
)
|
$
|
(61,157
|
)
|
$
|
(1,798
|
)
|
|||
|
Basic and diluted income (loss) per share of common stock:
|
|||||||||||||||
|
Continuing operations
|
$
|
0.14
|
|
$
|
(0.18
|
)
|
$
|
(7.17
|
)
|
$
|
(0.25
|
)
|
|||
|
Discontinued operations
|
0.06
|
|
0.03
|
|
0.05
|
|
0.04
|
|
|||||||
|
Net income (loss)
|
$
|
0.20
|
|
$
|
(0.15
|
)
|
$
|
(7.12
|
)
|
$
|
(0.21
|
)
|
|||
|
(1)
|
Income from operations for the three months ended December 31, 2013 includes a $2.9 million loss related to a sub-lease.
|
|
(2)
|
The sum of the quarterly earnings per share amounts do not equal the total annual earnings per share due to rounding and the uneven timing of earnings throughout the year compared to the weighted average shares outstanding.
|
|
(3)
|
Income from operations for the three months ended December 31, 2012 includes a
$1.6 million
gain from the sale of assets. Loss from continuing operations for the three months ended June 30, 2012 includes a
$28.3
million charge for goodwill impairment, a
$2.1
million gain on the sale of assets,
$6.8
million of severance expenses and a
$33.5
million increase in the deferred tax assets valuation allowance.
|
46
Lawson Products, Inc.
Schedule II -Valuation and Qualifying Accounts
The roll forward of valuation accounts were as follows:
|
(Dollars in thousands)
|
|||||||||||||||
|
Description
|
Balance at Beginning of Period
|
Charged to Costs and Expenses
|
Deductions
|
Balance at End of Period
|
|||||||||||
|
Allowance for doubtful accounts:
|
|||||||||||||||
|
Year ended December 31, 2013
|
$
|
1,637
|
|
$
|
126
|
|
$
|
(935
|
)
|
(1)
|
$
|
828
|
|
||
|
Year ended December 31, 2012
|
1,865
|
|
1,582
|
|
(1,810
|
)
|
(1)
|
1,637
|
|
||||||
|
Year ended December 31, 2011
|
1,034
|
|
1,500
|
|
(669
|
)
|
(1)
|
1,865
|
|
||||||
|
Allowance for excess and obsolete inventory:
|
|||||||||||||||
|
Year ended December 31, 2013
|
$
|
7,656
|
|
$
|
1,903
|
|
$
|
(4,231
|
)
|
(2)
|
$
|
5,328
|
|
||
|
Year ended December 31, 2012
|
4,390
|
|
3,989
|
|
(723
|
)
|
(2)
|
7,656
|
|
||||||
|
Year ended December 31, 2011
|
4,084
|
|
1,046
|
|
(740
|
)
|
(2)
|
4,390
|
|
||||||
|
Valuation allowance for deferred tax assets:
|
|||||||||||||||
|
Year ended December 31, 2013
|
$
|
34,278
|
|
$
|
1,556
|
|
$
|
—
|
|
$
|
35,834
|
|
|||
|
Year ended December 31, 2012
|
938
|
|
33,340
|
|
—
|
|
34,278
|
|
|||||||
|
Year ended December 31, 2011
|
875
|
|
63
|
|
—
|
|
938
|
|
|||||||
|
(1)
|
Uncollected receivables written off, net of recoveries and translation adjustment.
|
|
(2)
|
Disposal of excess and obsolete inventory and translation adjustment.
|
47
As previously disclosed in a Current Report on Form 8-K dated May 30, 2013, following a competitive selection process, the Company entered into an engagement letter with BDO USA, LLP (“BDO”), approved by the Audit Committee, and engaged BDO as the Company's independent registered public accounting firm to replace Ernst & Young LLP ("E&Y").
E&Y’s reports on the Company’s consolidated financial statements for the years ended December 31, 2012 and 2011 contained no adverse opinion or disclaimer of opinion and were not qualified or modified as to uncertainty, audit scope or accounting principles. During the Company’s fiscal 2012 and fiscal 2011 and the subsequent interim period preceding E&Y’s dismissal, there were:
|
(i)
|
no “disagreements” (within the meaning of Item 304(a) of Regulation S-K) with E&Y on any matter of accounting principles or practices, financial statement disclosure or auditing scope or procedure, which disagreements, if not resolved to the satisfaction of E&Y, would have caused it to make reference to the subject matter of the disagreements in its reports on the consolidated financial statements of the Company; and
|
|
(ii)
|
no “reportable events” (as such term is defined in Item 304(a)(1)(v) of Regulation S-K).
|
Evaluation of Disclosure Controls and Procedures
Under the supervision and with the participation of our senior management, including our Chief Executive Officer and Chief Financial Officer, we conducted an evaluation of the effectiveness of the design and operation of our disclosure controls and procedures, as defined in Rules 13a-15(e) and 15d-15(e) under the Securities Exchange Act of 1934, as amended (the “Exchange Act”), as of the end of the period covered by this annual report (the “Evaluation Date”). Based on this evaluation, our Chief Executive Officer and Chief Financial Officer concluded as of the Evaluation Date that our disclosure controls and procedures were effective such that (i) the information relating to Lawson, including our consolidated subsidiaries, required to be disclosed in our SEC reports is recorded, processed, summarized and reported within the time periods specified in SEC rules and forms, and (ii) include, without limitation, controls and procedures designed to ensure that information required to be disclosed is accumulated and communicated to our management, including our Chief Executive Officer and Chief Financial Officer, as appropriate to allow timely decisions regarding required disclosure.
48
Management’s Report on Internal Control over Financial Reporting
Management is responsible for establishing and maintaining an adequate system of internal control over financial reporting as defined in Rules 13a-15(f) and 15d-15(f) under the Securities Exchange Act of 1934, as amended, for Lawson Products, Inc. and subsidiaries (the “Company”). This system is designed to provide reasonable assurance regarding the reliability of financial reporting and the preparation of financial statements for external purposes in accordance with U.S. generally accepted accounting principles.
The Company’s internal control over financial reporting includes those policies and procedures that (i) pertain to the maintenance of records that, in reasonable detail, accurately and fairly reflect the transactions and dispositions of the assets of the Company; (ii) provide reasonable assurance that transactions are recorded as necessary to permit preparation of financial statements in accordance with generally accepted accounting principles, and that receipts and expenditures of the Company are being made only in accordance with authorizations of management and directors of the Company; and (iii) provide reasonable assurance regarding prevention or timely detection of unauthorized acquisition, use, or disposition of the Company’s assets that could have a material effect on the financial statements.
Because of its inherent limitations, internal control over financial reporting may not prevent or detect misstatements and even when determined to be effective, can only provide reasonable assurance with respect to financial statement preparation and presentation. Also, projection of any evaluation of the effectiveness of internal control over financial reporting to future periods is subject to the risk that controls may become inadequate because of changes in conditions, or that the degree of compliance with the policies or procedures may deteriorate.
Management, with the participation of the Company’s Chief Executive Officer and Chief Financial Officer, evaluated the effectiveness of the Company’s internal control over financial reporting as of
December 31, 2013
. In making this evaluation, management used the criteria set forth by the Committee of Sponsoring Organizations of the Treadway Commission (COSO) in
Internal Control — Integrated Framework (1992).
Based on this assessment, management concluded that the Company’s internal control over financial reporting was effective as of
December 31, 2013
. The Company’s independent registered public accounting firm, BDO USA, LLP, has audited and issued a report on the Company’s internal controls over financial reporting as set forth in this annual report.
49
Report of Independent Registered Public Accounting Firm
Board of Directors and Stockholders
Lawson Products, Inc.
Chicago, Illinois
We have audited Lawson Products, Inc.’s internal control over financial reporting as of December 31, 2013, based on criteria established in
Internal Control - Integrated Framework
(1992)
issued by the Committee of Sponsoring Organizations of the Treadway Commission (the COSO criteria). Lawson Products, Inc.’s management is responsible for maintaining effective internal control over financial reporting and for its assessment of the effectiveness of internal control over financial reporting included in the accompanying Management’s Report on Internal Control Over Financial Reporting. Our responsibility is to express an opinion on the company’s internal control over financial reporting based on our audit.
We conducted our audit in accordance with the standards of the Public Company Accounting Oversight Board (United States). Those standards require that we plan and perform the audit to obtain reasonable assurance about whether effective internal control over financial reporting was maintained in all material respects. Our audit included obtaining an understanding of internal control over financial reporting, assessing the risk that a material weakness exists, and testing and evaluating the design and operating effectiveness of internal control based on the assessed risk. Our audit also included performing such other procedures as we considered necessary in the circumstances. We believe that our audit provides a reasonable basis for our opinion.
A company’s internal control over financial reporting is a process designed to provide reasonable assurance regarding the reliability of financial reporting and the preparation of financial statements for external purposes in accordance with generally accepted accounting principles. A company’s internal control over financial reporting includes those policies and procedures that (1) pertain to the maintenance of records that, in reasonable detail, accurately and fairly reflect the transactions and dispositions of the assets of the company; (2) provide reasonable assurance that transactions are recorded as necessary to permit preparation of financial statements in accordance with generally accepted accounting principles, and that receipts and expenditures of the company are being made only in accordance with authorizations of management and directors of the company; and (3) provide reasonable assurance regarding prevention or timely detection of unauthorized acquisition, use, or disposition of the company’s assets that could have a material effect on the financial statements.
Because of its inherent limitations, internal control over financial reporting may not prevent or detect misstatements. Also, projections of any evaluation of effectiveness to future periods are subject to the risk that controls may become inadequate because of changes in conditions, or that the degree of compliance with the policies or procedures may deteriorate.
In our opinion, Lawson Products, Inc. maintained, in all material respects, effective internal control over financial reporting as of December 31, 2013, based on the COSO criteria
.
We also have audited, in accordance with the standards of the Public Company Accounting Oversight Board (United States), the consolidated balance sheet of Lawson Products, Inc. as of December 31, 2013 and the related consolidated statement of operations and comprehensive loss, stockholders’ equity, and cash flows for the year then ended and our report dated February 20, 2014 expressed an unqualified opinion thereon.
/s/BDO USA, LLP
Chicago, IL
February 20, 2014
50
Changes in Internal Controls
There were no changes in our internal control over financial reporting that occurred during the last fiscal quarter that have materially affected, or are reasonably likely to materially affect, our internal control over financial reporting.
None
a.
Directors
The information required by this Item is set forth in the Company’s Proxy Statement for the Annual Meeting of Stockholders to be held on
May 13, 2014
, under the caption “Election of Directors” and “Section 16(a) Beneficial Ownership Reporting Compliance,” which information is incorporated herein by reference.
b.
Executive Officers
The information required by this Item is set forth under the caption Item 1 —
Business
under “Executive Officers of the Registrant.”
c.
Audit Committee
Information on the Company’s Audit Committee is contained under the caption “Board of Directors Meetings and Committees” in the Company’s Proxy Statement for the Annual Meeting of Stockholders to be held on
May 13, 2014
, which is incorporated herein by reference.
The Board of Directors has determined that Thomas Postek, member of the Audit Committee of the Board of Directors, qualifies as an “audit committee financial expert” as defined in Item 407(d)(5)(ii) of Regulation S-K, and that Mr. Postek is “independent” as the term is defined in the listing standards of the NASDAQ Global Select Market.
d.
Code of Business Conduct
The Company has adopted a Code of Business Conduct applicable to all employees and sales representatives. The Company’s Code of Business Conduct is applicable to senior financial executives including the principal executive officer, principal financial officer and principal accounting officer of the Company. The Company’s Code of Business Conduct is available on the Corporate Governance page in the Investor Relations section of the Company’s website at
www.lawsonproducts.com
. The Company intends to post on its website any amendments to, or waivers from its Code of Business Conduct applicable to senior financial executives. The Company will provide any persons with a copy of its Code of Business Conduct without charge upon written request directed to the Company’s Secretary at the Company’s address.
The information required by this Item is set forth in the Company’s Proxy Statement for the Annual Meeting of Stockholders to be held on
May 13, 2014
, under the caption “Remuneration of Executive Officers,” which information is incorporated herein by reference.
51
The information required by this Item is set forth in the Company’s Proxy Statement for the Annual Meeting of Stockholders to be held on
May 13, 2014
under the caption “Securities Beneficially Owned by Principal Stockholders and Management” which information is incorporated herein by reference.
Equity Compensation Plan Information
The following table provides information as of
December 31, 2013
regarding the number of shares of common stock that were available for issuance under the Company’s equity compensation plans.
|
Plan category
|
Number of securities to be issued upon exercise of outstanding options, warrants and rights
(1)
|
Weighted-average exercise price of outstanding options, warrants and rights
(1) (2)
|
Number of securities remaining available for future issuance under equity compensation plans (excluding securities reflected in the first column)
|
||
|
Equity compensation plans approved by security holders
|
273,602
|
$10.36
|
77,393
|
||
|
Equity compensation plans not approved by security holders
|
—
|
—
|
—
|
||
|
Total
|
273,602
|
$10.36
|
77,393
|
||
|
(1)
|
Includes potential common stock issuance of
47,901
from restricted stock awards,
88,503
from market stock units
12,198
from stock options and
125,000
from stock awards.
|
|
(2)
|
Weighted-average exercise price of
12,198
stock options and
125,000
stock awards.
|
The information required by this Item is set forth in the Company’s Proxy Statement for the Annual Meeting of Stockholders to be held on
May 13, 2014
under the caption “Election of Directors” and “Certain Relationships and Related Transactions” which information is incorporated herein by reference.
The information required under this Item is set forth in the Company’s Proxy Statement for the Annual Meeting of Stockholders to be held on
May 13, 2014
under the caption “Fees Paid to Independent Auditors” which information is incorporated herein by reference.
(a) (1) See Index to Financial Statements in Item 8 on page 25.
(2) See Schedule II in Item 8 on page 47.
(3) See the Exhibit Index immediately following the signature page of this Annual Report on Form 10-K.
52
SIGNATURES
Pursuant to the requirements of Section 13 or 15(d) of the Securities Exchange Act of 1934, the registrant has duly caused this report to be signed on its behalf by the undersigned, thereunto duly authorized.
|
LAWSON PRODUCTS, INC
|
||
|
By:
|
/s/ Michael G. DeCata
|
|
|
Michael G. DeCata
|
||
|
President, Chief Executive Officer
|
||
|
(principal executive officer)
|
||
|
Date:
|
February 20, 2014
|
|
|
By:
|
/s/ Ronald J. Knutson
|
|
|
Ronald J. Knutson
|
||
|
Executive Vice President, Chief Financial Officer
|
||
|
(principal financial and accounting officer)
|
||
|
Date:
|
February 20, 2014
|
|
Pursuant to the requirements of the Securities Exchange Act of 1934, this report has been signed below this 20th day of February, 2014, by the following persons on behalf of the registrant and in the capacities indicated.
|
Signature
|
Title
|
|
|
/s/ Ronald B. Port
|
Chairman of the Board
|
|
|
Ronald B. Port
|
||
|
/s/ Andrew B. Albert
|
Director
|
|
|
Andrew B. Albert
|
||
|
/s/ I. Steven Edelson
|
Director
|
|
|
I. Steven Edelson
|
||
|
/s/ James S. Errant
|
Director
|
|
|
James S. Errant
|
||
|
/s/ Lee S. Hillman
|
Director
|
|
|
Lee S. Hillman
|
||
|
/s/ Thomas S. Postek
|
Director
|
|
|
Thomas S. Postek
|
||
|
/s/ Robert G. Rettig
|
Director
|
|
|
Robert G. Rettig
|
||
|
/s/ Wilma J. Smelcer
|
Director
|
|
|
Wilma J. Smelcer
|
||
53
EXHIBIT INDEX
|
Exhibit
Number
|
Description of Exhibit
|
|
|
3.1
|
Certificate of Incorporation of the Company, as amended, incorporated herein by reference to Exhibit 3(a) to the Company’s Annual Report on Form 10-K for the fiscal year ended December 31, 1988.
|
|
|
3.2
|
Amended and Restated By-laws of the Company, incorporated herein by reference to the Company’s Current Report on Form 8-K dated October 20, 2009.
|
|
|
10.1*
|
Amended and Restated Executive Deferral Plan, incorporated herein by reference from Exhibit 10(c)(7) to the Company’s Annual Report on Form 10-K for the fiscal year ended December 31, 1995.
|
|
|
10.2*
|
Lawson Products, Inc. Stock Performance Plan, incorporated herein by reference from Exhibit 10(c)(8) to the Company’s Annual Report on Form 10-K for the fiscal year ended December 31, 2000.
|
|
|
10.3*
|
Form Letter regarding Stock Performance Rights, incorporated by reference to Exhibit 10(c)(16) to the Company’s Annual Report on Form 10-K for the fiscal year ended December 31, 2004.
|
|
|
10.4*
|
Lawson Products, Inc. Long-Term Incentive Plan, incorporated herein by reference to Exhibit 10.1 to the Company’s Current Report on Form 8-K dated May 13, 2008.
|
|
|
10.5*
|
Form of Indemnification Agreement for Directors and Officers incorporated herein by reference to the Company’s Current Report on Form 8-K dated September 15, 2008.
|
|
|
10.6*
|
Form of Amended and Restated Award Agreement, incorporated by reference to Exhibit 10.2 to the Company’s Current Report on Form 8-K dated February 12, 2009.
|
|
|
10.7
|
Loan and Security Agreement dated August 8, 2012 between the Company and The PrivateBank and Trust Company, incorporated herein by reference to Exhibit 10.1 to the Company’s Current Report on Form 8-K dated August 8, 2012.
|
|
|
10.8*
|
Employment Agreement dated as of August 29, 2012 by and between Lawson Products, Inc., an Illinois corporation, and Neil E. Jenkins, incorporated herein by reference to Exhibit 10.2 to the Company’s Current Report on Form 8-K dated August 29, 2012.
|
|
|
10.9*
|
Employment Agreement dated as of August 29, 2012 by and between Lawson Products, Inc., an Illinois corporation, and Ron Knutson, incorporated herein by reference to Exhibit 10.3 to the Company’s Current Report on Form 8-K dated August 29, 2012.
|
|
|
10.10*
|
Employment Agreement dated as of October 16, 2012 by and between Lawson Products, Inc., an Illinois corporation, and Michael G. DeCata, incorporated herein by reference to Exhibit 10.1 to the Company’s Current Report on Form 8-K dated October 16, 2012.
|
|
|
10.11
|
First Amendment to Loan and Security Agreement dated September 25, 2013 between the Company and The PrivateBank and Trust Company, incorporated herein by reference to Exhibit 10.1 to the Company's Current Report on Form 8-K dated September 25, 2013.
|
|
|
10.12
|
Asset Purchase Agreement, dated as of October 11, 2013, by and among Automatic Screw Machine Products Company, Inc., Baron Divestiture Company, Lawson Products, Inc. and Nelson Stud Welding, Inc., incorporated herein by reference to Exhibit 2.1 to the Company's Current Report on Form 8-K dated October 11, 2013.
|
|
54
|
10.13
|
Second Amendment to Loan and Security Agreement dated December 20, 2013 between the Company and The PrivateBank and Trust Company, incorporated herein by reference to Exhibit 10.1 to the Company's Current Report on Form 8-K dated December 20, 2013.
|
|
|
10.14
|
Third Amendment to Loan and Security Agreement dated February 14, 2013 between the Company and The PrivateBank and Trust Company incorporated herein by reference to Exhibit 10.1 to the Company's Current Report on Form 8-K dated February 14, 2014.
|
|
|
21
|
Subsidiaries of the Company.
|
|
|
23.1
|
Consent of BDO USA, LLP
|
|
|
23.2
|
Consent of Ernst & Young LLP.
|
|
|
31.1
|
Certification of Chief Executive Officer pursuant to 18 U.S.C. Section 1350 as adopted pursuant to Section 302 of the Sarbanes-Oxley Act of 2002.
|
|
|
31.2
|
Certification of Chief Financial Officer pursuant to 18 U.S.C. Section 1350 as adopted pursuant to Section 302 of the Sarbanes-Oxley Act of 2002.
|
|
|
32
|
Certification of Chief Executive Officer and Chief Financial Officer pursuant to 18 U.S.C. Section 1350 as adopted pursuant to Section 906 of the Sarbanes-Oxley Act of 2002.
|
|
|
101.INS
|
XBRL Instance Document
|
|
|
101.SCH
|
XBRL Taxonomy Extension Schema Document
|
|
|
101.CAL
|
XBRL Taxonomy Extension Calculation Linkbase Document
|
|
|
101.DEF
|
XBRL Taxonomy Extension Definition Linkbase Document
|
|
|
101.LAB
|
XBRL Taxonomy Extension Label Linkbase Document
|
|
|
101.PRE
|
XBRL Taxonomy Extension Presentation Linkbase Document
|
|
*
Indicates management employment contracts or compensatory plans or arrangements.
55
TABLE OF CONTENTS
Part IItem 1. BusinessItem 1A. Risk FactorsItem 1B. Unresolved Staff CommentsItem 2. PropertiesItem 3. Legal ProceedingsItem 4. Mine Safety DisclosuresPart IIItem 5. Market For Registrant S Common Equity, Related Stockholder Matters and Issuer Purchases Of Equity SecuritiesItem 6. Selected Financial DataItem 7A. Quantitative and Qualitative Disclosures About Market RiskItem 8. Financial Statements and Supplementary DataNote 1 - Description Of BusinessNote 2 - Summary Of Significant Accounting PoliciesNote 3 Restricted CashNote 4 InventoriesNote 5 - Property, Plant and EquipmentNote 6 Income TaxesNote 7 - Accrued Expenses and Other LiabilitiesNote 8 Loan AgreementNote 9 Reserve For SeveranceNote 10 - Retirement and Security Bonus PlansNote 11 - Commitments and ContingenciesNote 12 Stock-based Compensation PlansNote 13 Discontinued OperationsNote 14 Sale Of PropertiesNote 15 GoodwillNote 16 - Other Operating Expenses, NetNote 17 Earnings (loss) Per ShareNote 18 Geographic InformationNote 19 - Summary Of Unaudited Quarterly Results Of OperationsItem 9. Changes in and Disagreements with Accountants on Accounting and Financial DisclosureItem 9A. Controls and ProceduresItem 9B. Other InformationPart IIIItem 10. Directors, Executive Officers and Corporate GovernanceItem 11. Executive CompensationItem 12. Security Ownership Of Certain Beneficial Owners and Management and Related Stockholder MattersItem 13. Certain Relationships and Related Transactions, and Director IndependenceItem 14. Principal Accounting Fees and ServicesPart IVItem 15. Exhibits, Financial Statement Schedules