DTE ENERGY CO
10-Ks and 10-Qs
|
|
|
|
|
|
|
|
|
|
|
|
|
|
|
|
|
|
|
|
|
|
|
|
|
|
|
|
|
|
|
|
|
|
|
|
|
|
|
|
|
|
|
|
|
|
|
|
|
|
UNITED STATES SECURITIES AND EXCHANGE COMMISSION
Washington, D.C. 20549
_____________________________________________
Form 10-K
|
þ
|
|
ANNUAL REPORT PURSUANT TO SECTION 13 OR 15(d) OF THE SECURITIES EXCHANGE ACT OF 1934
|
|
FOR THE FISCAL YEAR ENDED DECEMBER 31, 2012
|
||
|
¨
|
|
TRANSITION REPORT PURSUANT TO SECTION 13 OR 15(d) OF THE SECURITIES EXCHANGE ACT OF 1934
|
Commission file number 1-11607
DTE ENERGY COMPANY
(Exact name of registrant as specified in its charter)
|
Michigan
|
|
38-3217752
|
|
(State or other jurisdiction of
incorporation or organization)
|
|
(I.R.S. Employer
Identification No.)
|
|
One Energy Plaza, Detroit, Michigan
|
|
48226-1279
|
|
(Address of principal executive offices)
|
|
(Zip Code)
|
313-235-4000
(Registrant’s telephone number, including area code)
Securities registered pursuant to Section 12(b) of the Act:
|
Title of Each Class
|
|
Name of Each Exchange on Which Registered
|
|
Common Stock, without par value
|
|
New York Stock Exchange
|
|
2011 Series I 6.5% Junior Subordinated Debentures due 2061
|
New York Stock Exchange
|
|
|
2012 Series C 5.25% Junior Subordinated Debentures due 2062
|
New York Stock Exchange
|
|
Securities registered pursuant to Section 12(g) of the Act: None
Indicate by check mark if the registrant is a well-known seasoned issuer, as defined in Rule 405 of the Securities Act. Yes
þ
No
o
Indicate by check mark if the registrant is not required to file reports pursuant to Section 13 or Section 15(d) of the Act. Yes
o
No
þ
Indicate by check mark whether the registrant: (1) has filed all reports required to be filed by Section 13 or 15(d) of the Securities Exchange Act of 1934 during the preceding 12 months (or for such shorter period that the registrant was required to file such reports), and (2) has been subject to such filing requirements for the past 90 days. Yes
þ
No
o
Indicate by check mark whether the registrant has submitted electronically and posted on its corporate Web site, if any, every Interactive Data File required to be submitted and posted pursuant to Rule 405 of Regulation S-T (§ 232.405 of this chapter) during the preceding 12 months (or such shorter period that the registrant was required to submit and post such files). Yes
þ
No
o
Indicate by check mark if disclosure of delinquent filers pursuant to Item 405 of Regulation S-K is not contained herein, and will not be contained, to the best of the registrant’s knowledge, in definitive proxy or information statements incorporated by reference in Part III of this Form 10-K or any amendment to this Form 10-K.
þ
Indicate by check mark whether the registrant is a large accelerated filer, an accelerated filer, a non-accelerated filer, or a smaller reporting company. See the definitions of “large accelerated filer,” “accelerated filer” and “smaller reporting company” in Rule 12b-2 of the Exchange Act. (Check one):
|
Large accelerated filer
þ
|
|
Accelerated filer
o
|
|
Non-accelerated filer
o
(Do not check if a smaller reporting company)
|
|
Smaller reporting company
o
|
Indicate by check mark whether the registrant is a shell company (as defined in Rule 12b-2 of the Exchange Act). Yes
o
No
þ
On June 30, 2012, the aggregate market value of the Registrant’s voting and non-voting common equity held by non-affiliates was approximately $10.2 billion (based on the New York Stock Exchange closing price on such date). There were 172,545,941shares of common stock outstanding at January 31, 2013.
Certain information in DTE Energy Company’s definitive Proxy Statement for its 2013 Annual Meeting of Common Shareholders to be held May 2, 2013, which will be filed with the Securities and Exchange Commission pursuant to Regulation 14A, not later than 120 days after the end of the registrant’s fiscal year covered by this report on Form 10-K, is incorporated herein by reference to Part III (Items 10, 11, 12, 13 and 14) of this Form
10-K.
DTE Energy Company
Annual Report on Form 10-K
Year Ended
December 31, 2012
TABLE OF CONTENTS
|
Page
|
||
|
EX-4.279
|
||
|
EX-10.81
|
||
|
EX-12.52
|
||
|
EX-21.8
|
||
|
EX-23.26
|
||
|
EX-31.79
|
||
|
EX-31.80
|
||
|
EX-32.79
|
||
|
EX-32.80
|
||
|
EX-101 INSTANCE DOCUMENT
|
||
|
EX-101 SCHEMA DOCUMENT
|
||
|
EX-101 CALCULATION LINKBASE DOCUMENT
|
||
|
EX-101 LABELS LINKBASE DOCUMENT
|
||
|
EX-101 PRESENTATION LINKBASE DOCUMENT
|
||
|
EX-101 DEFINITION LINKBASE DOCUMENT
|
||
DEFINITIONS
|
ASC
|
Accounting Standards Codification
|
|
|
|
||
|
ASU
|
Accounting Standards Update
|
|
|
|
||
|
CIM
|
A Choice Incentive Mechanism authorized by the MPSC that allows DTE Electric to recover or refund non-fuel revenues lost or gained as a result of fluctuations in electric Customer Choice sales.
|
|
|
|
||
|
Citizens
|
Citizens Fuel Gas Company, which distributes natural gas in Adrian, Michigan
|
|
|
Company
|
DTE Energy Company and any subsidiary companies
|
|
|
Customer Choice
|
Michigan legislation giving customers the option to choose alternative suppliers for electricity and gas.
|
|
|
|
||
|
DTE Electric
|
DTE Electric Company (a direct wholly owned subsidiary of DTE Energy Company) and subsidiary companies. Formerly known as The Detroit Edison Company.
|
|
|
DTE Energy
|
DTE Energy Company, directly or indirectly the parent of DTE Electric, DTE Gas and numerous non-utility subsidiaries
|
|
|
DTE Gas
|
DTE Gas Company (an indirect wholly owned subsidiary of DTE Energy) and subsidiary companies. Formerly known as Michigan Consolidated Gas Company.
|
|
|
|
||
|
EPA
|
United States Environmental Protection Agency
|
|
|
|
||
|
FASB
|
Financial Accounting Standards Board
|
|
|
|
||
|
FERC
|
Federal Energy Regulatory Commission
|
|
|
|
||
|
FTRs
|
Financial transmission rights are financial instruments that entitle the holder to receive payments related to costs incurred for congestion on the transmission grid.
|
|
|
|
||
|
GCR
|
A Gas Cost Recovery mechanism authorized by the MPSC that allows DTE Gas to recover through rates its natural gas costs.
|
|
|
|
||
|
MCIT
|
Michigan Corporate Income Tax
|
|
|
MDEQ
|
Michigan Department of Environmental Quality
|
|
|
|
||
|
MISO
|
Midwest Independent System Operator is an Independent System Operator and the Regional Transmission Organization serving the Midwest United States and Manitoba, Canada.
|
|
|
|
||
|
MPSC
|
Michigan Public Service Commission
|
|
|
|
||
|
Non-utility
|
An entity that is not a public utility. Its conditions of service, prices of goods and services and other operating related matters are not directly regulated by the MPSC.
|
|
|
|
||
|
NRC
|
United States Nuclear Regulatory Commission
|
|
|
|
||
|
Production tax credits
|
Tax credits as authorized under Sections 45K and 45 of the Internal Revenue Code that are designed to stimulate investment in and development of alternate fuel sources. The amount of a production tax credit can vary each year as determined by the Internal Revenue Service.
|
|
1
|
|
||
|
PSCR
|
A Power Supply Cost Recovery mechanism authorized by the MPSC that allows DTE Electric to recover through rates its fuel, fuel-related and purchased power costs.
|
|
|
|
||
|
RDM
|
A Revenue Decoupling Mechanism authorized by the MPSC that is designed to minimize the impact on revenues of changes in average customer usage.
|
|
|
|
||
|
Securitization
|
DTE Electric financed specific stranded costs at lower interest rates through the sale of rate reduction bonds by a wholly-owned special purpose entity, The Detroit Edison Securitization Funding LLC.
|
|
|
|
||
|
Subsidiaries
|
The direct and indirect subsidiaries of DTE Energy Company
|
|
|
|
||
|
VIE
|
Variable Interest Entity
|
|
|
|
||
|
Units of Measurement
|
||
|
|
||
|
Bcf
|
Billion cubic feet of gas
|
|
|
|
||
|
Bcfe
|
Conversion metric using a standard ratio of one barrel of oil and/or natural gas liquids to 6 Mcf of natural gas equivalents.
|
|
|
BTU
|
Heat value (energy content) of fuel
|
|
|
dth/d
|
Decatherms per day
|
|
|
|
||
|
kWh
|
Kilowatthour of electricity
|
|
|
|
||
|
Mcf
|
Thousand cubic feet of gas
|
|
|
|
||
|
MMcf
|
Million cubic feet of gas
|
|
|
|
||
|
MW
|
Megawatt of electricity
|
|
|
|
||
|
MWh
|
Megawatthour of electricity
|
|
2
F
ORWARD
-L
OOKING
S
TATEMENTS
Certain information presented herein includes “forward-looking statements” within the meaning of the Private Securities Litigation Reform Act of 1995 with respect to the financial condition, results of operations and business of DTE Energy. Words such as “anticipate,” “believe,” “expect,” “projected” and “goals” signify forward-looking statements. Forward-looking statements are not guarantees of future results and conditions, but rather are subject to numerous assumptions, risks and uncertainties that may cause actual future results to be materially different from those contemplated, projected, estimated or budgeted. Many factors may impact forward-looking statements including, but not limited to, the following:
|
•
|
impact of regulation by the FERC, MPSC, NRC and other applicable governmental proceedings and regulations, including any associated impact on rate structures;
|
|
•
|
the amount and timing of cost recovery allowed as a result of regulatory proceedings, related appeals or new legislation;
|
|
•
|
impact of electric and gas utility restructuring in Michigan, including legislative amendments and Customer Choice programs;
|
|
•
|
economic conditions and population changes in our geographic area resulting in changes in demand, customer conservation, increased thefts of electricity and gas and high levels of uncollectible accounts receivable;
|
|
•
|
environmental issues, laws, regulations, and the increasing costs of remediation and compliance, including actual and potential new federal and state requirements;
|
|
•
|
health, safety, financial, environmental and regulatory risks associated with ownership and operation of nuclear facilities;
|
|
•
|
changes in the cost and availability of coal and other raw materials, purchased power and natural gas;
|
|
•
|
the potential for losses on investments, including nuclear decommissioning and benefit plan assets and the related increases in future expense and contributions;
|
|
•
|
volatility in the short-term natural gas storage markets impacting third-party storage revenues;
|
|
•
|
access to capital markets and the results of other financing efforts which can be affected by credit agency ratings;
|
|
•
|
instability in capital markets which could impact availability of short and long-term financing;
|
|
•
|
the timing and extent of changes in interest rates;
|
|
•
|
the level of borrowings;
|
|
•
|
the potential for increased costs or delays in completion of significant construction projects;
|
|
•
|
changes in and application of federal, state and local tax laws and their interpretations, including the Internal Revenue Code, regulations, rulings, court proceedings and audits;
|
|
•
|
the effects of weather and other natural phenomena on operations and sales to customers, and purchases from suppliers;
|
|
•
|
unplanned outages;
|
|
•
|
the cost of protecting assets against, or damage due to, terrorism or cyber attacks;
|
|
•
|
employee relations and the impact of collective bargaining agreements;
|
|
•
|
the availability, cost, coverage and terms of insurance and stability of insurance providers;
|
|
•
|
cost reduction efforts and the maximization of plant and distribution system performance;
|
|
•
|
the effects of competition;
|
|
•
|
changes in and application of accounting standards and financial reporting regulations;
|
|
•
|
changes in federal or state laws and their interpretation with respect to regulation, energy policy and other business issues;
|
|
•
|
binding arbitration, litigation and related appeals; and
|
|
•
|
the risks discussed in our public filings with the Securities and Exchange Commission.
|
New factors emerge from time to time. We cannot predict what factors may arise or how such factors may cause our results to differ materially from those contained in any forward-looking statement. Any forward-looking statements speak only as of the date on which such statements are made. We undertake no obligation to update any forward-looking statement to reflect events or circumstances after the date on which such statement is made or to reflect the occurrence of unanticipated events.
3
Items 1. and 2.
Business and Properties
General
In 1995, DTE Energy incorporated in the State of Michigan. Our utility operations consist primarily of DTE Electric and DTE Gas. We also have three other segments that are engaged in a variety of energy-related businesses.
DTE Electric is a Michigan corporation organized in 1903 and is a public utility subject to regulation by the MPSC and the FERC. DTE Electric is engaged in the generation, purchase, distribution and sale of electricity to approximately 2.1 million customers in southeastern Michigan.
DTE Gas is a Michigan corporation organized in 1898 and is a public utility subject to regulation by the MPSC. DTE Gas is engaged in the purchase, storage, transportation, distribution and sale of natural gas to approximately 1.2 million customers throughout Michigan and the sale of storage and transportation capacity.
Our other businesses are involved in 1) natural gas pipelines, gathering and storage; 2) power and industrial projects ; and 3) energy marketing and trading operations.
Our annual reports on Form 10-K, quarterly reports on Form 10-Q, current reports on Form 8-K, proxy statements, and all amendments to such reports are available free of charge through the Investors - Reports and Filings page of our website:
www.dteenergy.com
, as soon as reasonably practicable after they are filed with or furnished to the Securities and Exchange Commission (SEC). Our previously filed reports and statements are also available at the SEC’s website:
www.sec.gov
.
The Company’s Code of Ethics and Standards of Behavior, Board of Directors’ Mission and Guidelines, Board Committee Charters, and Categorical Standards of Director Independence are also posted on its website. The information on the Company’s website is not part of this or any other report that the Company files with, or furnishes to, the SEC.
Additionally, the public may read and copy any materials the Company files with the SEC at the SEC’s Public Reference Room at 100 F Street, NE, Room 1580, Washington, D.C. 20549. The public may obtain information on the operation of the Public Reference Room by calling the SEC at 1-800-SEC-0330. The SEC also maintains an Internet site that contains reports, proxy and information statements, and other information regarding issuers that file electronically with the SEC at
www.sec.gov
.
References in this Report to “we,” “us,” “our,” “Company” or “DTE” are to DTE Energy and its subsidiaries, collectively.
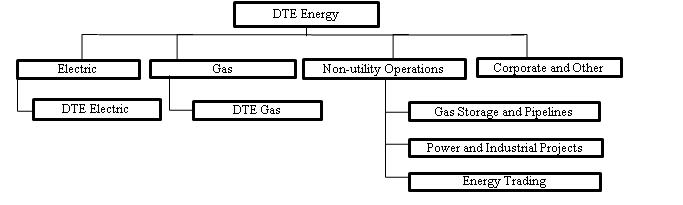
Corporate Structure
Based on the following structure, we set strategic goals, allocate resources, and evaluate performance. See Note 23 of the Notes to Consolidated Financial Statements in Item 8 of this Report for financial information by segment for the last three years.
Electric
|
•
|
The Electric segment consists principally of DTE Electric, which is engaged in the generation, purchase, distribution and sale of electricity to approximately 2.1 million residential, commercial and industrial customers in southeastern Michigan.
|
Gas
|
•
|
The Gas segment consists of DTE Gas and Citizens. DTE Gas is engaged in the purchase, storage, transportation, distribution and sale of natural gas to approximately 1.2 million residential, commercial and industrial customers throughout Michigan and the sale of storage and transportation capacity. Citizens distributes natural gas in Adrian, Michigan to approximately 17,000 customers.
|
4
Non-utility Operations
|
•
|
Gas Storage and Pipelines consists of natural gas pipelines, gathering and storage businesses.
|
|
•
|
Power and Industrial Projects is comprised primarily of projects that deliver energy and utility-type products and services to industrial, commercial and institutional customers; produce reduced emissions fuel and sell electricity from biomass-fired energy projects.
|
|
•
|
Energy Trading consists of energy marketing and trading operations.
|
Corporate and Other
, includes various holding company activities, holds certain non-utility debt and energy-related investments.
Refer to our Management’s Discussion and Analysis in Item 7 of this Report for an in-depth analysis of each segment’s financial results. A description of each business unit follows.
ELECTRIC
Description
Our Electric segment consists principally of DTE Electric, an electric utility engaged in the generation, purchase, distribution and sale of electricity to approximately 2.1 million customers in southeastern Michigan. Our generating plants are regulated by numerous federal and state governmental agencies, including, but not limited to, the MPSC, the FERC, the NRC, the EPA and the MDEQ. Electricity is generated from our fossil-fuel plants, a hydroelectric pumped storage plant, a nuclear plant and our wind and other renewable assets, and is purchased from electricity generators, suppliers and wholesalers. The electricity we produce and purchase is sold to three major classes of customers: residential, commercial and industrial, throughout southeastern Michigan.
Revenue by Service
|
2012
|
2011
|
2010
|
|||||||||
|
|
(In millions)
|
||||||||||
|
Residential
|
$
|
2,354
|
|
$
|
2,182
|
|
$
|
2,052
|
|
||
|
Commercial
|
1,898
|
|
1,704
|
|
1,629
|
|
|||||
|
Industrial
|
784
|
|
692
|
|
688
|
|
|||||
|
Other
|
152
|
|
458
|
|
479
|
|
|||||
|
Subtotal
|
5,188
|
|
5,036
|
|
4,848
|
|
|||||
|
Interconnection sales (a)
|
105
|
|
118
|
|
145
|
|
|||||
|
Total Revenue
|
$
|
5,293
|
|
$
|
5,154
|
|
$
|
4,993
|
|
||
______________________________
|
(a)
|
Represents power that is not distributed by DTE Electric.
|
Weather, economic factors, competition and electricity prices affect sales levels to customers. Our peak load and highest total system sales generally occur during the third quarter of the year, driven by air conditioning and other cooling-related demands. Our operations are not dependent upon a limited number of customers, and the loss of any one or a few customers would not have a material adverse effect on DTE Electric.
5
Fuel Supply and Purchased Power
Our power is generated from a variety of fuels and is supplemented with purchased power. We expect to have an adequate supply of fuel and purchased power to meet our obligation to serve customers. Our generating capability is heavily dependent upon the availability of coal. Coal is purchased from various sources in different geographic areas under agreements that vary in both pricing and terms. We expect to obtain the majority of our coal requirements through long-term contracts, with the balance to be obtained through short-term agreements and spot purchases. We have long-term and short-term contracts for the purchase of approximately 22.1 million tons of low-sulfur western coal to be delivered from 2013 through 2015 and approximately 3.5 million tons of Appalachian coal to be delivered from 2013 through 2014. All of these contracts have pricing schedules. We have approximately 81% of our 2013 expected coal requirements under contract. Given the geographic diversity of supply, we believe we can meet our expected generation requirements. We lease a fleet of rail cars and have our expected western coal rail requirements under contract through 2015. All of our expected eastern coal rail requirements are under contract through 2013. Our expected vessel transportation requirements for delivery of purchased coal to our generating facilities are under contract through 2014.
DTE Electric participates in the energy market through MISO. We offer our generation in the market on a day-ahead and real-time basis and bid for power in the market to serve our load. We are a net purchaser of power that supplements our generation capability to meet customer demand during peak cycles or during major plant outages.
Properties
DTE Electric owns generating plants and facilities that are located in the State of Michigan. Substantially all of our property is subject to the lien of a mortgage.
Generating plants owned and in service as of
December 31, 2012
are as follows:
|
Location by
Michigan
|
Summer Net
Rated
Capability (a)
|
||||||||
|
Plant Name
|
County
|
(MW)
|
(%)
|
Year in Service
|
|||||
|
Fossil-fueled Steam-Electric
|
|
|
|
|
|
||||
|
Belle River (b)
|
St. Clair
|
1,036
|
|
9.8
|
1984 and 1985
|
||||
|
Greenwood
|
St. Clair
|
793
|
|
7.5
|
1979
|
||||
|
Harbor Beach
|
Huron
|
95
|
|
0.9
|
1968
|
||||
|
Monroe (c)
|
Monroe
|
3,047
|
|
28.9
|
1971, 1973 and 1974
|
||||
|
River Rouge
|
Wayne
|
524
|
|
5.0
|
1957 and 1958
|
||||
|
St. Clair
|
St. Clair
|
1,379
|
|
13.0
|
1953, 1954, 1959, 1961 and 1969
|
||||
|
Trenton Channel
|
Wayne
|
675
|
|
6.4
|
1949 and 1968
|
||||
|
|
|
7,549
|
|
71.5
|
|
||||
|
Oil or Gas-fueled Peaking Units
|
Various
|
1,018
|
|
9.6
|
1966-1971, 1981 and 1999
|
||||
|
Nuclear-fueled Steam-Electric Fermi 2 (d)
|
Monroe
|
1,086
|
|
10.3
|
1988
|
||||
|
Hydroelectric Pumped Storage
Ludington (e)
|
Mason
|
917
|
|
8.6
|
1973
|
||||
|
|
|
10,570
|
|
100.0
|
|
||||
_______________________________________
|
(a)
|
Summer net rated capabilities of generating plants in service are based on periodic load tests and are changed depending on operating experience, the physical condition of units, environmental control limitations and customer requirements for steam, which otherwise would be used for electric generation.
|
|
(b)
|
The Belle River capability represents DTE Electric’s entitlement to 81% of the capacity and energy of the plant. See Note 9 of the Notes to the Consolidated Financial Statements in Item 8 of this Report.
|
|
(c)
|
The Monroe generating plant provided 37% of DTE Electric’s total 2012 power generation.
|
|
(d)
|
Fermi 2 has a design electrical rating (net) of 1,150 MW.
|
|
(e)
|
Represents DTE Electric’s 49% interest in Ludington with a total capability of 1,872 MW. See Note 9 of the Notes to the Consolidated Financial Statements in Item 8 of this Report.
|
In 2008, a renewable portfolio standard was established for Michigan electric providers targeting 10% of electricity sold to retail customers from renewable energy by 2015. DTE Electric has approximately 720 MW of owned or contracted renewable energy, principally wind turbines located in Gratiot, Tuscola, Huron and Sanilac counties in Michigan, at December 31, 2012 representing approximately 8% of electricity sold to retail customers. Approximately 510 MW is in commercial operation at December 31, 2012 with an additional 210 MW expected in commercial operation in 2013 or early 2014.
6
DTE Electric owns and operates 671 distribution substations with a capacity of approximately 33,648,000 kilovolt-amperes (kVA) and approximately 430,600 line transformers with a capacity of approximately 22,306,000 kVA.
Circuit miles of electric distribution lines owned and in service as of December 31, 2012:
|
Circuit Miles
|
||||||
|
Operating Voltage-Kilovolts (kV)
|
Overhead
|
Underground
|
||||
|
4.8 kV to 13.2 kV
|
27,856
|
|
14,585
|
|
||
|
24 kV
|
182
|
|
696
|
|
||
|
40 kV
|
2,278
|
|
383
|
|
||
|
120 kV
|
54
|
|
8
|
|
||
|
30,370
|
|
15,672
|
|
|||
There are numerous interconnections that allow the interchange of electricity between DTE Electric and electricity providers external to our service area. These interconnections are generally owned and operated by ITC Transmission, an unrelated company, and connect to neighboring energy companies.
Regulation
DTE Electric's business is subject to the regulatory jurisdiction of various agencies, including, but not limited to, the MPSC, the FERC and the NRC. The MPSC issues orders pertaining to rates, recovery of certain costs, including the costs of generating facilities and regulatory assets, conditions of service, accounting and operating-related matters. DTE Electric's MPSC-approved rates charged to customers have historically been designed to allow for the recovery of costs, plus an authorized rate of return on our investments. The FERC regulates DTE Electric with respect to financing authorization and wholesale electric activities. The NRC has regulatory jurisdiction over all phases of the operation, construction, licensing and decommissioning of DTE Electric's nuclear plant operations. We are subject to the requirements of other regulatory agencies with respect to safety, the environment and health.
See Notes 3, 10, 11 and 19 of the Notes to Consolidated Financial Statements in Item 8 of this Report.
Energy Assistance Programs
Energy assistance programs, funded by the federal government and the State of Michigan, remain critical to DTE Electric’s ability to control its uncollectible accounts receivable and collections expenses. DTE Electric’s uncollectible accounts receivable expense is directly affected by the level of government-funded assistance its qualifying customers receive. We work continuously with the State of Michigan and others to determine whether the share of funding allocated to our customers is representative of the number of low-income individuals in our service territory. We also partner with federal, state and local officials to attempt to increase the share of low-income funding allocated to our customers. Changes in the level of funding provided to our low-income customers will affect the level of uncollectible expense.
Strategy and Competition
We strive to be the preferred supplier of electrical generation in southeast Michigan. We can accomplish this goal by working with our customers, communities and regulatory agencies to be a reliable, low-cost supplier of electricity. To ensure generation and network reliability we continue to make capital investments in our generating plants and distribution system, which will improve plant availability, operating efficiencies and environmental compliance in areas that have a positive impact on reliability with the goal of high customer satisfaction.
Our distribution operations focus on improving reliability, restoration time and the quality of customer service. We seek to lower our operating costs by improving operating efficiencies. Revenues from year to year will vary due to weather conditions, economic factors, regulatory events and other risk factors as discussed in the “Risk Factors” in Item 1A. of this Report.
The electric Customer Choice program in Michigan allows our electric customers to purchase their electricity from alternative electric suppliers of generation services, subject to limits. Customers choosing to purchase power from alternative electric suppliers represented approximately 10% of retail sales in
2012
,
2011
and
2010
. Customers participating in the electric Customer Choice program consist primarily of industrial and commercial customers whose MPSC-authorized full service rates exceed market costs. MPSC rate orders and 2008 energy legislation enacted by the State of Michigan have placed a 10% cap on the total potential Customer Choice related migration, mitigating some of the unfavorable effects of electric Customer
7
Choice on our financial performance and full service customer rates. We expect that in
2013
customers choosing to purchase power from alternative electric suppliers will represent approximately 10% of retail sales.
Competition in the regulated electric distribution business is primarily from the on-site generation of industrial customers and from distributed generation applications by industrial and commercial customers. We do not expect significant competition for distribution to any group of customers in the near term.
GAS
Description
Our Gas segment consists of DTE Gas and Citizens. DTE Gas is a natural gas utility engaged in the purchase, storage, transportation, distribution and sale of natural gas to approximately 1.2 million residential, commercial and industrial customers throughout Michigan and the sale of storage and transportation capacity. Citizens distributes natural gas in Adrian, Michigan to approximately 17,000 customers.
Revenue is generated by providing the following major classes of service: gas sales, end user transportation, intermediate transportation, and gas storage.
Revenue by Service
|
2012
|
2011
|
2010
|
|||||||||
|
|
(In millions)
|
||||||||||
|
Gas sales
|
$
|
957
|
|
$
|
1,150
|
|
$
|
1,281
|
|
||
|
End user transportation
|
198
|
|
194
|
|
185
|
|
|||||
|
Intermediate transportation
|
58
|
|
58
|
|
69
|
|
|||||
|
Storage and other
|
102
|
|
103
|
|
113
|
|
|||||
|
Total Revenue
|
$
|
1,315
|
|
$
|
1,505
|
|
$
|
1,648
|
|
||
|
•
|
Gas sales —
Includes the sale and delivery of natural gas primarily to residential and small-volume commercial and industrial customers.
|
|
•
|
End user transportation —
Gas delivery service provided primarily to large-volume commercial and industrial customers. Additionally, the service is provided to residential customers, and small-volume commercial and industrial customers who have elected to participate in our Customer Choice program. End user transportation customers purchase natural gas directly from marketers, producers or brokers and utilize our pipeline network to transport the gas to their facilities or homes.
|
|
•
|
Intermediate transportation —
Gas delivery service is provided to producers, brokers and other gas companies that own the natural gas, but are not the ultimate consumers. Intermediate transportation customers utilize our gathering and high-pressure transportation system to transport the natural gas to storage fields, processing plants, pipeline interconnections or other locations.
|
|
•
|
Storage and other —
Includes revenues from natural gas storage, appliance maintenance, facility development and other energy-related services.
|
Our gas sales, end user transportation and intermediate transportation volumes, revenues and net income are impacted by weather. Given the seasonal nature of our business, revenues and net income are concentrated in the first and fourth quarters of the calendar year. By the end of the first quarter, the heating season is largely over, and we typically realize substantially reduced revenues and earnings in the second quarter and losses in the third quarter. The impacts of changes in average customer usage are minimized by the RDM. Effective with the self implementation of rates on November 1, 2012, the RDM was terminated. The DTE Gas partial rate case settlement agreement approved by the MPSC in December 2012 creates a new RDM effective November 1, 2013 which decouples weather normalized distribution revenue inside caps. The caps are tied to expected customer conservation attributable to DTE Gas' energy efficiency program. or 1.125% in year one, increasing to 2.25% for the second and future periods.
Our operations are not dependent upon a limited number of customers, and the loss of any one or a few customers would not have a material adverse effect on our Gas segment.
8
Natural Gas Supply
Our gas distribution system has a planned maximum daily send-out capacity of 2.4 Bcf, with approximately 64% of the volume coming from underground storage for 2012. Peak-use requirements are met through utilization of our storage facilities, pipeline transportation capacity, and purchased gas supplies. Because of our geographic diversity of supply and our pipeline transportation and storage capacity, we are able to reliably meet our supply requirements. We believe natural gas supply and pipeline capacity will be sufficiently available to meet market demands in the foreseeable future.
We purchase natural gas supplies in the open market by contracting with producers and marketers, and we maintain a diversified portfolio of natural gas supply contracts. Supplier, producing region, quantity, and available transportation diversify our natural gas supply base. We obtain our natural gas supply from various sources in different geographic areas (Gulf Coast, Mid-Continent, Canada and Michigan) under agreements that vary in both pricing and terms. Gas supply pricing is generally tied to the New York Mercantile Exchange and published price indices to approximate current market prices combined with MPSC approved fixed price supplies with varying terms and volumes through 2015.
We are directly connected to interstate pipelines, providing access to most of the major natural gas supply producing regions in the Gulf Coast, Mid-Continent and Canadian regions. Our primary long-term transportation supply contracts are as follows:
|
Availability
(MMcf/d)
|
Contract
Expiration
|
||
|
Great Lakes Gas Transmission L.P.
|
80
|
2013
|
|
|
Viking Gas Transmission Company
|
51
|
2013
|
|
|
Vector Pipeline L.P.
|
50
|
2015
|
|
|
ANR Pipeline Company
|
195
|
2017
|
|
|
Panhandle Eastern Pipeline Company
|
75
|
2029
|
|
Properties
We own distribution, storage and transportation properties that are located in the State of Michigan. Our distribution system includes approximately 19,000 miles of distribution mains, approximately 1,173,000 service pipelines and approximately 1,309,000 active meters. We own approximately 2,000 miles of transmission pipelines that deliver natural gas to the distribution districts and interconnect our storage fields with the sources of supply and the market areas.
We own storage properties relating to four underground natural gas storage fields with an aggregate working gas storage capacity of approximately 139 Bcf. These facilities are important in providing reliable and cost-effective service to our customers. In addition, we sell storage services to third parties.
Most of our distribution and transportation property is located on property owned by others and used by us through easements, permits or licenses. Substantially all of our property is subject to the lien of a mortgage.
We own 68 miles of transportation and gathering (non-utility) pipelines in the northern lower peninsula of Michigan. We lease a portion of our pipeline system to the Vector Pipeline Partnership (an affiliate) through a capital lease arrangement. See Note 18 of the Notes to Consolidated Financial Statements in Item 8 of the Report.
Regulation
DTE Gas' business is subject to the regulatory jurisdiction of the MPSC, which issues orders pertaining to rates, recovery of certain costs, including the costs of regulatory assets, conditions of service, accounting and operating-related matters. DTE Gas' MPSC-approved rates charged to customers have historically been designed to allow for the recovery of costs, plus an authorized rate of return on our investments. DTE Gas operates natural gas storage and transportation facilities in Michigan as intrastate facilities regulated by the MPSC and provides intrastate storage and transportation services pursuant to an MPSC-approved tariff.
DTE Gas also provides interstate storage and transportation services in accordance with an Operating Statement on file with the FERC. The FERC's jurisdiction is limited and extends to the rates, non-discriminatory requirements, and the terms and conditions applicable to storage and transportation provided by DTE Gas in interstate markets. FERC granted DTE Gas
9
authority to provide storage and related services in interstate commerce at market-based rates. DTE Gas provides transportation services in interstate commerce at cost-based rates approved by the MPSC and filed with the FERC.
We are subject to the requirements of other regulatory agencies with respect to safety, the environment and health.
See Note 11 of the Notes to the Consolidated Financial Statements in Item 8 of this Report.
Energy Assistance Program
Energy assistance programs, funded by the federal government and the State of Michigan, remain critical to DTE Gas’ ability to control its uncollectible accounts receivable and collections expenses. DTE Gas’ uncollectible accounts receivable expense is directly affected by the level of government-funded assistance its qualifying customers receive. We work continuously with the State of Michigan and others to determine whether the share of funding allocated to our customers is representative of the number of low-income individuals in our service territory. We also partner with federal, state and local officials to attempt to increase the share of low-income funding allocated to our customers. Changes in the level of funding provided to our low-income customers will affect the level of uncollectible expense.
Strategy and Competition
Our strategy is to be the preferred provider of natural gas services in Michigan. We expect future sales volumes to decline due to reduced natural gas usage by customers due to more efficient furnaces and appliances, and an increased emphasis on conservation of energy usage. We continue to provide energy-related services that capitalize on our expertise, capabilities and efficient systems. We continue to focus on lowering our operating costs by improving operating efficiencies.
Competition in the gas business primarily involves other natural gas transportation providers, as well as providers of alternative fuels and energy sources. The primary focus of competition for end user transportation is cost and reliability. Some large commercial and industrial customers have the ability to switch to alternative fuel sources such as coal, electricity, oil and steam. If these customers were to choose an alternative fuel source, they would not have a need for our end-user transportation service. In addition, some of these customers could bypass our pipeline system and have their gas delivered directly from an interstate pipeline. We compete against alternative fuel sources by providing competitive pricing and reliable service, supported by our storage capacity.
Our extensive transportation pipeline system has enabled us to market 400 to 500 Bcf annually for intermediate storage and transportation services for Michigan gas producers, marketers, distribution companies and other pipeline companies. We operate in a central geographic location with connections to major Midwestern interstate pipelines that extend throughout the Midwest, eastern United States and eastern Canada.
DTE Gas’ storage capacity is used to store natural gas for delivery to DTE Gas' customers as well as sold to third parties, under a variety of arrangements for periods up to three years. Prices for storage arrangements for shorter periods are generally higher, but more volatile than for longer periods. Prices are influenced primarily by market conditions, weather and natural gas pricing.
GAS STORAGE AND PIPELINES
Description
Gas Storage and Pipelines controls two natural gas storage fields, intrastate lateral and intrastate gathering pipeline systems, and has ownership interests in two interstate pipelines serving the Midwest, Ontario and Northeast markets. The pipeline and storage assets are primarily supported by long-term, fixed-price revenue contracts.
10
Properties
The Gas Storage and Pipelines business holds the following property:
|
Property Classification
|
% Owned
|
Description
|
Location
|
||||
|
Pipelines
|
|||||||
|
Vector Pipeline
|
40
|
%
|
348-mile pipeline with 1,300 MMcf per day capacity
|
IL, IN, MI & Ontario
|
|||
|
Millennium Pipeline
|
26
|
%
|
182-mile pipeline with 525 MMcf per day capacity
|
NY
|
|||
|
Bluestone Lateral
|
100
|
%
|
44-mile pipeline designed to flow over 275 MMcf per day
|
PA & NY
|
|||
|
Susquehanna gathering system
|
100
|
%
|
Gathering system to transport gas to Bluestone Lateral
|
PA
|
|||
|
Michigan gathering systems
|
100
|
%
|
Gathers production gas in northern Michigan
|
MI
|
|||
|
Storage
|
|||||||
|
Washington 10
|
100
|
%
|
75 Bcf of storage capacity
|
MI
|
|||
|
Washington 28
|
50
|
%
|
16 Bcf of storage capacity
|
MI
|
|||
The assets of these businesses are well integrated with other DTE Energy operations. Pursuant to an operating agreement, DTE Gas provides physical operations, maintenance, and technical support for the Washington 10 and 28 storage facilities and for the DTE Gas pipeline.
Regulation
The Gas Storage and Pipelines business operates natural gas storage facilities in Michigan as intrastate facilities regulated by the MPSC and provides intrastate storage and related services pursuant to an MPSC-approved tariff. We also provide interstate services in accordance with an Operating Statement on file with the FERC. Vector and Millennium Pipelines provide interstate transportation services in accordance with their FERC-approved tariffs. Bluestone Lateral is regulated as an intrastate pipeline by applicable agencies in the states of New York and Pennsylvania.
Strategy and Competition
Our Gas Storage and Pipelines business expects to continue its steady growth plan by expanding existing assets and developing new assets that are typically supported with long−term customer commitments. We have competition from other pipelines and storage providers. The Gas Storage and Pipelines business focuses on asset development opportunities in the Midwest−to−Northeast region to supply natural gas to meet growing demand. Much of the growth in demand for natural gas is expected to occur in the Eastern Canada and the Northeast U.S. regions. We believe that the Vector and Millennium Pipelines are well positioned to provide access routes and low−cost expansion options to these markets. In addition, we believe that Millennium Pipeline is well positioned for growth in production from the Marcellus shale, especially with respect to Marcellus production in Northern Pennsylvania and along the southern tier of New York. Gas Storage and Pipelines has executed an agreement with Southwestern Energy Services Company to support its Bluestone Lateral and Susquehanna gathering system. Bluestone Lateral is a 44-mile pipeline in Susquehanna County, Pennsylvania and Broome County, New York with the southern portion of the pipeline placed in service in 2012 and the northern portion scheduled to be in service in the first quarter of 2013. We expect to continue steady growth in the Gas Storage and Pipelines business and are evaluating new pipeline and storage investment opportunities that could include additional Millennium expansions and laterals, Bluestone laterals and gathering expansions and other Marcellus midstream development or partnering opportunities.
POWER AND INDUSTRIAL PROJECTS
Description
Power and Industrial Projects is comprised primarily of projects that deliver energy and utility-type products and services to industrial, commercial and institutional customers; produce reduced emissions fuel and sell electricity from biomass-fired energy projects. This business segment provides services using project assets usually located on or near the customers' premises in the steel, automotive, pulp and paper, airport and other industries as follows:
Steel, Steel Industry Fuel, and Petroleum Coke:
We produce metallurgical coke from two coke batteries with a capacity of 1.4 million tons per year. We have an investment in a third coke battery with a capacity of 1.2 million tons per year. We are investors in entities which sell steel industry fuel at three coke battery sites. Steel industry fuel facilities recycle tar decanter sludge, a byproduct of the coking process. We also provide pulverized coal and petroleum coke to the steel, pulp and paper, and other industries.
11
Onsite Energy:
We provide power generation, steam production, chilled water production, wastewater treatment and compressed air supply to industrial customers. We provide utility-type services using project assets usually located on or near the customers' premises in the automotive, airport, chemical and other industries.
Wholesale Power and Renewables:
We own and operate four biomass-fired electric generating plants with a capacity of 183 MWs. We own a coal-fired power plant currently undergoing conversion to biomass with an expected in-service date in 2013. The electric output is sold under long term power purchase agreements. We also develop landfill gas recovery systems that capture the gas and provide local utilities, industry and consumers with an opportunity to use a competitive, renewable source of energy, in addition to providing environmental benefits by reducing greenhouse gas emissions.
Reduced Emissions Fuel (REF)
: We own and operate nine REF facilities. Our facilities blend a proprietary additive with coal used in coal-fired power plants resulting in reduced emissions of Nitrogen Oxide (NO) and Mercury (Hg). Qualifying facilities are eligible to generate tax credits for ten years upon achieving certain criteria. The value of a tax credit is adjusted annually by an inflation factor published by the Internal Revenue Service. The value of the tax credit is reduced if the reference price of coal exceeds certain thresholds. The economic benefit of the REF facilities is dependent upon the generation of production tax credits. We placed in service five REF facilities in 2009 and an additional four REF facilities in 2011. To optimize income and cash flow from the REF operations, we sold membership interests in 2011 at two of the facilities (treated as sales of tax credits for financial reporting purposes). Although both sales included a modest up-front payment from the tax investor, the bulk of the proceeds will be received, and the income for all of the proceeds will be recognized for financial reporting purposes, as production tax credits are generated. We continue to optimize these facilities by seeking investors for facilities operating at DTE Electric and other utility sites. Additionally, we intend to relocate certain underutilized facilities to alternative coal-fired power plants which may provide increased production and emission reduction opportunities in 2013 and future years.
12
Properties and Other
The following are significant properties operated by the Power and Industrial Projects segment:
|
Facility
|
Location
|
Service Type
|
||
|
Steel, Steel Industry Fuel, and Petroleum Coke
|
||||
|
Pulverized Coal Operations
|
MI & MD
|
Pulverized Coal
|
||
|
Coke Production
|
MI, PA & IN
|
Metallurgical Coke Supply/Steel Industry Fuels
|
||
|
Other Investment in Coke Production and Petroleum Coke
|
IN & MS
|
Metallurgical Coke Supply/Steel Industry Fuels, and Pulverized Petroleum Coke
|
||
|
On-Site Energy
|
||||
|
Automotive
|
Various sites in
|
Electric Distribution, Chilled Water,
|
||
|
MI, IN, OH &
NY
|
Waste Water, Steam, Cooling Tower Water, Reverse Osmosis Water, Compressed Air, Mist and Dust Collectors
|
|||
|
Airports
|
MI & PA
|
Electricity, Hot and Chilled Water
|
||
|
Chemical Manufacturing
|
IL, KY & OH
|
Electricity, Steam, Natural Gas, Compressed Air and Wastewater
|
||
|
Consumer Manufacturing
|
KY & OH
|
Electricity, Steam, Hot and Chilled Water, Sewer, Compressed Air
|
||
|
Business Park
|
FL, NY, OH & PA
|
Electricity, Steam, Hot and Chilled Water, Compressed Air
|
||
|
Hospital
|
CA
|
Electricity, Steam and Chilled Water
|
||
|
Wholesale Power and Renewables
|
||||
|
Pulp and Paper
|
AL
|
Electric Generation and Steam
|
||
|
Renewables
|
CA, MN & WI
|
Electric Generation
|
||
|
Landfill Gas Recovery
|
Various U.S. sites
|
Electric Generation and Landfill Gas
|
||
|
Other Industries
|
||||
|
REF
|
MI, OK, IL
|
REF Supply
|
||
|
2012
|
2011
|
2010
|
|||||||||
|
(In millions)
|
|||||||||||
|
Production Tax Credits Generated (Allocated to DTE Energy)
|
|||||||||||
|
REF
|
$
|
35
|
|
$
|
1
|
|
$
|
1
|
|
||
|
Power Generation
|
7
|
|
4
|
|
2
|
|
|||||
|
Landfill Gas Recovery
|
1
|
|
1
|
|
1
|
|
|||||
|
Steel Industry Fuels (a)
|
—
|
|
—
|
|
29
|
|
|||||
|
$
|
43
|
|
$
|
6
|
|
$
|
33
|
|
|||
______________________________
|
(a)
|
Tax laws enabling the steel industry fuel tax credits expired on December 31, 2010.
|
Regulation
Certain electric generating facilities within Power and Industrial Projects have market-based rate authority from the FERC to sell power. The facilities are subject to FERC reporting requirements and market behavior rules. Certain Power and Industrial projects are also subject to the applicable laws, rules and regulations related to the Commodity Futures Trading Commission, U.S. Department of Homeland Security and Department of Energy.
Strategy and Competition
Power and Industrial Projects will continue leveraging its energy-related operating experience and project management capability to develop and grow our steel; renewable power; on-site energy; landfill gas recovery; and REF businesses. We also will continue to pursue opportunities to provide asset management and operations services to third parties. There are limited competitors for our existing disparate businesses who provide similar products and services.
We anticipate building around our core strengths in the markets where we operate. In determining the markets in which to compete, we examine closely the regulatory and competitive environment, new and pending legislation, the number of
13
competitors and our ability to achieve sustainable margins. We plan to maximize the effectiveness of our related businesses as we expand. As we pursue growth opportunities, our first priority will be to achieve value-added returns.
We intend to focus on the following areas for growth:
|
•
|
Selling membership interests in our REF projects;
|
|
•
|
Relocating our underutilized REF facilities to alternative coal-fired power plants which may provide increased production and emission reduction opportunities in 2013 and future years;
|
|
•
|
Acquiring and developing landfill gas recovery facilities, renewable energy projects, and other energy projects which may qualify for tax credits; and
|
|
•
|
Providing operating services to owners of industrial and power plants.
|
ENERGY TRADING
Description
Energy Trading focuses on physical and financial power, gas and coal marketing and trading, structured transactions, enhancement of returns from DTE Energy’s asset portfolio, and optimization of contracted natural gas pipeline transportation and storage, and generating capacity positions. Energy Trading also provides natural gas, power and related services which may include the management of associated storage and transportation contracts on the customers’ behalf under FERC Asset Management Arrangements, and the supply or purchase of renewable energy credits to various customers. Our customer base is predominantly utilities, local distribution companies, pipelines, producers and generators, and other marketing and trading companies. We enter into derivative financial instruments as part of our marketing and hedging activities. These financial instruments are generally accounted for under the mark-to-market method, which results in the recognition in earnings of unrealized gains and losses from changes in the fair value of the derivatives. We utilize forwards, futures, swaps and option contracts to mitigate risk associated with our marketing and trading activity as well as for proprietary trading within defined risk guidelines. Energy Trading also provides commodity risk management services to the other businesses within DTE Energy.
Significant portions of the Energy Trading portfolio are economically hedged. Most financial instruments and physical power and gas contracts are deemed derivatives; whereas, natural gas inventory, contracts for pipeline transportation, renewable energy credits and certain storage assets are not derivatives. As a result, this segment may experience earnings volatility as derivatives are marked-to-market without revaluing the underlying non-derivative contracts and assets. The segment’s strategy is to economically manage the price risk of these underlying non-derivative contracts and assets with futures, forwards, swaps and options. This results in gains and losses that are recognized in different interim and annual accounting periods.
Regulation
Energy Trading has market-based rate authority from the FERC to sell power and blanket authority from the FERC to sell natural gas at market prices. Energy Trading is subject to FERC reporting requirements and market behavior rules. Energy Trading is also subject to the applicable laws, rules and regulations related to the Commodity Futures Trading Commission, U.S. Department of Homeland Security and Department of Energy.
Strategy and Competition
Our strategy for the Energy Trading business is to deliver value-added services to our customers. We seek to manage this business in a manner consistent with and complementary to the growth of our other business segments. We focus on physical marketing and the optimization of our portfolio of energy assets. We compete with electric, gas and coal marketers, financial institutions, traders, utilities and other energy providers. The Energy Trading business is dependent upon the availability of capital and an investment grade credit rating. The Company believes it has ample available capital capacity to support Energy Trading activities. We monitor our use of capital closely to ensure that our commitments do not exceed capacity. A material credit restriction would negatively impact our financial performance. Competitors with greater access to capital or at a lower cost may have a competitive advantage. We have risk management and credit processes to monitor and mitigate risk.
14
CORPORATE AND OTHER
Description
Corporate and Other includes various holding company activities and holds certain non-utility debt and energy-related investments.
ENVIRONMENTAL MATTERS
We are subject to extensive environmental regulation. We expect to continue recovering environmental costs related to utility operations through rates charged to our customers. The following table summarizes our estimated significant future environmental expenditures based upon current regulations. Actual costs to comply could vary substantially. Additional costs may result as the effects of various substances on the environment are studied and governmental regulations are developed and implemented.
|
Electric
|
Gas
|
Non-utility
|
Total
|
||||||||||||
|
(In millions)
|
|||||||||||||||
|
Air
|
$
|
1,784
|
|
$
|
—
|
|
$
|
—
|
|
$
|
1,784
|
|
|||
|
Water
|
80
|
|
—
|
|
23
|
|
103
|
|
|||||||
|
Contaminated and other sites
|
13
|
|
30
|
|
—
|
|
43
|
|
|||||||
|
Estimated total future expenditures through 2020
|
$
|
1,877
|
|
$
|
30
|
|
$
|
23
|
|
$
|
1,930
|
|
|||
|
Estimated 2013 expenditures
|
$
|
336
|
|
$
|
10
|
|
$
|
21
|
|
$
|
367
|
|
|||
|
Estimated 2014 expenditures
|
$
|
324
|
|
$
|
6
|
|
$
|
2
|
|
$
|
332
|
|
|||
Air -
DTE Electric is subject to the EPA ozone and fine particulate transport and acid rain regulations that limit power plant emissions of sulfur dioxide and nitrogen oxides. Since 2005, the EPA and the State of Michigan have issued additional emission reduction regulations relating to ozone, fine particulate, regional haze, mercury and other air pollution. These rules have led to additional emission controls on fossil-fueled power plants to reduce nitrogen oxide and sulfur dioxide, with further emission controls planned for reductions of mercury and other emissions. Future rulemakings could require additional controls for sulfur dioxide, nitrogen oxides and hazardous air pollutants over the next few years.
Water
- In response to an EPA regulation, DTE Electric is required to examine alternatives for reducing the environmental impacts of the cooling water intake structures at several of its facilities. Based on the results of completed studies and expected future studies, DTE Electric may be required to install technologies to reduce the impacts of the water intakes. However, the types of technologies are unknown at this time. The EPA has also issued an information collection request to begin a review of steam electric effluent guidelines.
Contaminated and Other Sites -
Prior to the construction of major interstate natural gas pipelines, gas for heating and other uses was manufactured locally from processes involving coal, coke or oil. The facilities, which produced gas, have been designated as manufactured gas plant (MGP) sites. Gas segment owns, or previously owned, fifteen such former MGP sites. DTE Electric owns, or previously owned, three former MGP sites. The Company anticipates the cost amortization methodology approved by the MPSC for DTE Gas, which allows DTE Gas to amortize the MGP costs over a ten-year period beginning with the year subsequent to the year the MGP costs were incurred, and the cost deferral and rate recovery mechanism for Citizens Fuel Gas approved by the City of Adrian, will prevent MGP environmental costs from having a material adverse impact on the Company's results of operations.
We are also in the process of cleaning up other sites where contamination is present as a result of historical and ongoing utility operations. These other sites include an engineered ash storage facility, electrical distribution substations, gas pipelines, electric generating power plants, and underground and aboveground storage tank locations. Cleanup activities associated with these sites will be conducted over the next several years. Any significant change in assumptions, such as remediation techniques, nature and extent of contamination and regulatory requirements, could impact the estimate of remedial action costs for these sites and affect the Company's financial position and cash flows and the rates we charge our customers.
The EPA has published proposed rules to regulate coal ash, which may result in a designation as a hazardous waste. The EPA could apply some, or all, of the disposal and reuse standards that have been applied to other existing hazardous wastes. Some of the regulatory actions currently being contemplated could have a significant impact on our operations and financial position and the rates we charge our customers. It is not possible to quantify the impact of those expected rulemakings at this time.
15
See Notes 11 and 19 of the Notes to Consolidated Financial Statements in Item 8 of this Report and Management’s Discussion and Analysis in Item 7 of this Report.
EMPLOYEES
We had approximately 9,900 employees as of
December 31, 2012
, of which approximately 4,900 were represented by unions. There are several bargaining units for the Company’s represented employees. The majority of represented employees are under contracts that expire in June and October 2013.
Item 1A.
Risk Factors
There are various risks associated with the operations of DTE Energy's utility and non-utility businesses. To provide a framework to understand the operating environment of DTE Energy, we are providing a brief explanation of the more significant risks associated with our businesses. Although we have tried to identify and discuss key risk factors, others could emerge in the future. Each of the following risks could affect our performance.
We are subject to rate regulation.
Electric and gas rates for our utilities are set by the MPSC and the FERC and cannot be changed without regulatory authorization. We may be negatively impacted by new regulations or interpretations by the MPSC, the FERC or other regulatory bodies. Our ability to recover costs may be impacted by the time lag between the incurrence of costs and the recovery of the costs in customers' rates. Our regulators also may decide to disallow recovery of certain costs in customers' rates if they determine that those costs do not meet the standards for recovery under our governing laws and regulations. Our utilities typically self-implement base rate changes six months after rate case filings in accordance with Michigan law. However, if the final rates authorized by our regulators in the final rate order are lower than the amounts we collected during the self-implementation period, we must refund the difference with interest. Our regulators may also disagree with our rate calculations under the various tracking and decoupling mechanisms that are intended to mitigate the risk to our utilities of certain aspects of our business. If we cannot agree with our regulators on an appropriate reconciliation of those mechanisms, it may impact our ability to recover certain costs through our customer rates. Our regulators may also decide to eliminate more of these mechanisms in future rate cases, which may make it more difficult for us to recover our costs in the rates we charge customers. We cannot predict what rates an MPSC order will adopt in future rate cases. New legislation, regulations or interpretations could change how our business operates, impact our ability to recover costs through rates or require us to incur additional expenses.
Changes to Michigan's electric Customer Choice program could negatively impact our financial performance.
The electric Customer Choice program, as originally contemplated in Michigan, anticipated an eventual transition to a totally deregulated and competitive environment where customers would be charged market-based rates for their electricity. The State of Michigan currently experiences a hybrid market, where the MPSC continues to regulate electric rates for our customers, while alternative electric suppliers charge market-based rates. In addition, such regulated electric rates for certain groups of our customers exceed the cost of service to those customers. Due to distorted pricing mechanisms during the initial implementation period of electric Customer Choice, many commercial customers chose alternative electric suppliers. MPSC rate orders and 2008 energy legislation enacted by the State of Michigan are phasing out the pricing disparity over five years and have placed a 10 percent cap on the total potential Customer Choice related migration. However, even with the electric Customer Choice-related relief received in prior DTE Electric rate orders and the legislated 10 percent cap on participation in the electric Customer Choice program, there continues to be legislative and financial risk associated with the electric Customer Choice program. Electric Customer Choice migration is sensitive to market price and full service electric price changes.
Environmental laws and liability may be costly.
We are subject to and affected by numerous environmental regulations. These regulations govern air emissions, water quality, wastewater discharge and disposal of solid and hazardous waste. Compliance with these regulations can significantly increase capital spending, operating expenses and plant down times and can negatively affect the affordability of the rates we charge to our customers.
Uncertainty around future environmental regulations creates difficulty planning long-term capital projects in our generation fleet and gas distribution businesses. These laws and regulations require us to seek a variety of environmental licenses, permits, inspections and other regulatory approvals. We could be required to install expensive pollution control measures or limit or cease activities based on these regulations. Additionally, we may become a responsible party for environmental cleanup at sites identified by a regulatory body. We cannot predict with certainty the amount and timing of future expenditures related to environmental matters because of the difficulty of estimating clean up costs. There is also uncertainty in quantifying liabilities under environmental laws that impose joint and several liability on potentially responsible parties.
16
We may also incur liabilities as a result of potential future requirements to address climate change issues. Proposals for voluntary initiatives and mandatory controls are being discussed both in the United States and worldwide to reduce greenhouse gases such as carbon dioxide, a by-product of burning fossil fuels. If increased regulation of greenhouse gas emissions are implemented, the operations of our fossil-fuel generation assets may be significantly impacted. Since there can be no assurances that environmental costs may be recovered through the regulatory process, our financial performance may be negatively impacted as a result of environmental matters.
Future environmental regulation of natural gas extraction techniques including hydraulic fracturing being discussed both at the United States federal level and by some states may affect the profitability of natural gas extraction businesses which could affect demand for and profitability of our gas transportation businesses.
Operation of a nuclear facility subjects us to risk.
Ownership of an operating nuclear generating plant subjects us to significant additional risks. These risks include, among others, plant security, environmental regulation and remediation, changes in federal nuclear regulation and operational factors that can significantly impact the performance and cost of operating a nuclear facility. While we maintain insurance for various nuclear-related risks, there can be no assurances that such insurance will be sufficient to cover our costs in the event of an accident or business interruption at our nuclear generating plant, which may affect our financial performance.
The supply and/or price of energy commodities and/or related services may impact our financial results.
We are dependent on coal for much of our electrical generating capacity. Our access to natural gas supplies is critical to ensure reliability of service for our utility gas customers. Our non-utility businesses, including our energy transportation business, are also dependent upon supplies and prices of energy commodities and services. Price fluctuations, fuel supply disruptions and changes in transportation costs could have a negative impact on the amounts we charge our utility customers for electricity and gas and on the profitability of our non-utility businesses. We have hedging strategies and regulatory recovery mechanisms in place to mitigate some of the negative fluctuations in commodity supply prices in our utility and non-utility businesses, but there can be no assurances that our financial performance will not be negatively impacted by price fluctuations. The price of energy also impacts the market for our non-utility businesses that compete with utilities and alternative electric suppliers or provide energy transportation services.
The supply and/or price of other industrial raw and finished inputs and/or related services may impact our financial results
. We are dependent on supplies of certain commodities, such as copper and limestone, among others, and industrial materials and services in order to maintain day-to-day operations and maintenance of our facilities. Price fluctuations or supply interruptions for these commodities and other items could have a negative impact on the amounts we charge our customers for our utility products and on the profitability of our non-utility businesses.
Adverse changes in our credit ratings may negatively affect us.
Regional and national economic conditions, increased scrutiny of the energy industry and regulatory changes, as well as changes in our economic performance, could result in credit agencies reexamining our credit rating. While credit ratings reflect the opinions of the credit agencies issuing such ratings and may not necessarily reflect actual performance, a downgrade in our credit rating below investment grade could restrict or discontinue our ability to access capital markets and could result in an increase in our borrowing costs, a reduced level of capital expenditures and could impact future earnings and cash flows. In addition, a reduction in our credit rating may require us to post collateral related to various physical or financially settled contracts for the purchase of energy-related commodities, products and services, which could impact our liquidity.
Poor investment performance of pension and other postretirement benefit plan holdings and other factors impacting benefit plan costs could unfavorably impact our liquidity and results of operations.
Our costs of providing non-contributory defined benefit pension plans and other postretirement benefit plans are dependent upon a number of factors, such as the rates of return on plan assets, the level of interest rates used to measure the required minimum funding levels of the plans, future government regulation, and our required or voluntary contributions made to the plans. The performance of the debt and equity markets affects the value of assets that are held in trust to satisfy future obligations under our plans. We have significant benefit obligations and hold significant assets in trust to satisfy these obligations. These assets are subject to market fluctuations and will yield uncertain returns, which may fall below our projected return rates. A decline in the market value of the pension and postretirement benefit plan assets will increase the funding requirements under our pension and postretirement benefit plans if the actual asset returns do not recover these declines in the foreseeable future. Additionally, our pension and postretirement benefit plan liabilities are sensitive to changes in interest rates. As interest rates decrease, the liabilities increase, resulting in increasing benefit expense and funding requirements. Also, if future increases in pension and postretirement benefit costs as a result of reduced plan assets are not recoverable from our utility customers, the results of operations and financial position of our company could be negatively affected. Without sustained growth in the plan investments over time to increase the value of
17
our plan assets, we could be required to fund our plans with significant amounts of cash. Such cash funding obligations could have a material impact on our cash flows, financial position, or results of operations.
Our ability to access capital markets is important.
Our ability to access capital markets is important to operate our businesses. In the past, turmoil in credit markets has constrained, and may again in the future constrain, our ability as well as the ability of our subsidiaries to issue new debt, including commercial paper, and refinance existing debt at reasonable interest rates. In addition, the level of borrowing by other energy companies and the market as a whole could limit our access to capital markets. Our long term revolving credit facilities do not expire until 2016, but we regularly access capital markets to refinance existing debt or fund new projects at our utilities and non-utility businesses, and we cannot predict the pricing or demand for those future transactions.
Construction and capital improvements to our power facilities and distribution systems subject us to ris
k. We are managing ongoing and planning future significant construction and capital improvement projects at multiple power generation and distribution facilities and our gas distribution system. Many factors that could cause delays or increased prices for these complex projects are beyond our control, including the cost of materials and labor, subcontractor performance, timing and issuance of necessary permits, construction disputes and weather conditions. Failure to complete these projects on schedule and on budget for any reason could adversely affect our financial performance and operations at the affected facilities and businesses.
Our non-utility businesses may not perform to our expectations.
We rely on our non-utility operations for an increasing portion of our earnings. If our current and contemplated non-utility investments do not perform at expected levels, we could experience diminished earnings and a corresponding decline in our shareholder value.
Our participation in energy trading markets subjects us to risk.
Events in the energy trading industry have increased the level of scrutiny on the energy trading business and the energy industry as a whole. In certain situations we may be required to post collateral to support trading operations, which could be substantial. If access to liquidity to support trading activities is curtailed, we could experience decreased earnings potential and cash flows. Energy trading activities take place in volatile markets and expose us to risks related to commodity price movements. We routinely have speculative trading positions in the market, within strict policy guidelines we set, resulting from the management of our business portfolio. To the extent speculative trading positions exist, fluctuating commodity prices can improve or diminish our financial results and financial position. We manage our exposure by establishing and enforcing strict risk limits and risk management procedures. During periods of extreme volatility, these risk limits and risk management procedures may not work as planned and cannot eliminate all risks associated with these activities.
Our ability to utilize production tax credits may be limited.
To reduce U.S. dependence on imported oil, the Internal Revenue Code provides production tax credits as an incentive for taxpayers to produce fuels and electricity from alternative sources. We generated production tax credits from coke production, landfill gas recovery, biomass fired electric generation, reduced emission fuel, renewable energy generation, steel industry fuel and gas production operations. All production tax credits taken after 2010 are subject to audit by the Internal Revenue Service (IRS). If our production tax credits were disallowed in whole or in part as a result of an IRS audit, there could be additional tax liabilities owed for previously recognized tax credits that could significantly impact our earnings and cash flows.
Weather significantly affects operations.
Deviations from normal hot and cold weather conditions affect our earnings and cash flow. Mild temperatures can result in decreased utilization of our assets, lowering income and cash flow. Ice storms, tornadoes, or high winds can damage the electric distribution system infrastructure and power generation facilities and require us to perform emergency repairs and incur material unplanned expenses. The expenses of storm restoration efforts may not be fully recoverable through the regulatory process.
Unplanned power plant outages may be costly.
Unforeseen maintenance may be required to safely produce electricity or comply with environmental regulations. As a result of unforeseen maintenance, we may be required to make spot market purchases of electricity that exceed our costs of generation. Our financial performance may be negatively affected if we are unable to recover such increased costs.
We rely on cash flows from subsidiaries.
DTE Energy is a holding company. Cash flows from our utility and non-utility subsidiaries are required to pay interest expenses and dividends on DTE Energy debt and securities. Should a major subsidiary not be able to pay dividends or transfer cash flows to DTE Energy, our ability to pay interest and dividends would be restricted.
Renewable portfolio standards and energy efficiency programs may affect our business.
We are subject to existing Michigan and potential future federal legislation and regulation requiring us to secure sources of renewable energy. Under the
18
current Michigan legislation we will be required in the future to provide a specified percentage of our power from Michigan renewable energy sources. We are implementing a strategy for complying with the existing state legislation, but we do not know what requirements may be added by federal legislation. In addition, there could be additional state requirements increasing the percentage of power required to be provided by renewable energy sources. We are actively engaged in developing renewable energy projects and identifying third party projects in which we can invest. We cannot predict the financial impact or costs associated with these future projects.
We are also required by Michigan legislation to implement energy efficiency measures and provide energy efficiency customer awareness and education programs. These requirements necessitate expenditures and implementation of these programs creates the risk of reducing our revenues as customers decrease their energy usage. We do not know how these programs will impact our business and future operating results.
Regional and national economic conditions can have an unfavorable impact on us.
Our utility and non-utility businesses follow the economic cycles of the customers we serve and credit risk of counterparties we do business with. Should national or regional economic conditions deteriorate, reduced volumes of electricity and gas, and demand for energy services we supply, collections of accounts receivable, reductions in federal and state energy assistance funding, and potentially higher levels of lost gas or stolen gas and electricity could result in decreased earnings and cash flow.
Threats of terrorism or cyber attacks could affect our business.
We may be threatened by problems such as computer viruses or terrorism that may disrupt our operations and could harm our operating results. Our industry requires the continued operation of sophisticated information technology systems and network infrastructure. Despite our implementation of security measures, all of our technology systems are vulnerable to disability or failures due to hacking, viruses, acts of war or terrorism and other causes. If our information technology systems were to fail and we were unable to recover in a timely way, we might be unable to fulfill critical business functions, which could have a material adverse effect on our business, operating results, and financial condition.
In addition, our generation plants, gas pipeline and storage facilities and electrical distribution facilities in particular may be targets of terrorist activities that could disrupt our ability to produce or distribute some portion of our energy products. We have increased security as a result of past events and we may be required by our regulators or by the future terrorist threat environment to make investments in security that we cannot currently predict.
Failure to maintain the security of personally identifiable information could adversely affect us.
In connection with our business we collect and retain personally identifiable information of our customers, shareholders and employees. Our customers, shareholders and employees expect that we will adequately protect their personal information, and the United States regulatory environment surrounding information security and privacy is increasingly demanding. A significant theft, loss or fraudulent use of customer, shareholder, employee or DTE Energy data by cybercrime or otherwise could adversely impact our reputation and could result in significant costs, fines and litigation.
Failure to retain and attract key executive officers and other skilled professional and technical employees could have an adverse effect on our operations.
Our business is dependent on our ability to recruit, retain, and motivate employees. Competition for skilled employees in some areas is high and the inability to retain and attract these employees could adversely affect our business and future operating results.
A work interruption may adversely affect us.
Unions represent approximately 4,900 of our employees. Our contracts with several bargaining units for the majority of our represented employees are due to expire in June and October 2013. We cannot predict the outcome of those negotiations. A union choosing to strike would have an impact on our business. We are unable to predict the effect a work stoppage would have on our costs of operation and financial performance.
If our goodwill becomes impaired, we may be required to record a charge to earnings.
We annually review the carrying value of goodwill associated with acquisitions made by the Company for impairment. Factors that may be considered for purposes of this analysis include any change in circumstances indicating that the carrying value of our goodwill may not be recoverable such as a decline in stock price and market capitalization, future cash flows, and slower growth rates in our industry. We cannot predict the timing, strength or duration of any economic slowdown or subsequent recovery, worldwide or in the economy or markets in which we operate; however, when events or changes in circumstances indicate that the carrying value of these assets may not be recoverable, the Company may take a non-cash impairment charge, which could potentially materially impact our results of operations and financial position.
We may not be fully covered by insurance.
We have a comprehensive insurance program in place to provide coverage for various types of risks, including catastrophic damage as a result of acts of God, terrorism or a combination of other significant
19
unforeseen events that could impact our operations. Economic losses might not be covered in full by insurance or our insurers may be unable to meet contractual obligations
.
20
Item 1B.
Unresolved Staff Comments
None.
Item 3.
Legal Proceedings
We are involved in certain legal, regulatory, administrative and environmental proceedings before various courts, arbitration panels and governmental agencies concerning matters arising in the ordinary course of business. These proceedings include certain contract disputes, environmental reviews and investigations, audits, inquiries from various regulators, and pending judicial matters. We cannot predict the final disposition of such proceedings. We regularly review legal matters and record provisions for claims that are considered probable of loss. The resolution of pending proceedings is not expected to have a material effect on our operations or financial statements in the periods they are resolved.
In July 2009, DTE Energy received a Notice of Violation (NOV)/Finding of Violation (FOV) from the EPA alleging, among other things, that five of DTE Electric's power plants violated New Source Performance standards, Prevention of Significant Deterioration requirements, and operating permit requirements under the Clean Air Act. In June 2010, the EPA issued a NOV/FOV making similar allegations related to a recent project and outage at Unit 2 of the Monroe Power Plant.
In August 2010, the United States Department of Justice, at the request of EPA, brought a civil suit in the U.S. District Court for the Eastern District of Michigan against DTE Energy and DTE Electric, related to the June 2010 NOV/FOV and the outage work performed at Unit 2 of the Monroe Power Plant, but not relating to the July 2009 NOV/FOV. Among other relief, the EPA requested the court to require DTE Electric to install and operate the best available control technology at Unit 2 of the Monroe Power Plant. Further, the EPA requested the court to issue a preliminary injunction to require DTE Electric to (i) begin the process of obtaining the necessary permits for the Monroe Unit 2 modification and (ii) offset the pollution from Monroe Unit 2 through emissions reductions from DTE Electric's fleet of coal-fired power plants until the new control equipment is operating. On August 23, 2011, the U.S. District Court judge granted DTE Energy's motion for summary judgment in the civil case, dismissing the case and entering judgment in favor of DTE Energy and DTE Electric. On October 20, 2011, the EPA caused to be filed a Notice of Appeal to the U.S. Court of Appeals for the Sixth Circuit. Oral arguments at the Court of Appeals were held on November 27, 2012 and a decision is expected in early 2013.
DTE Energy and DTE Electric believe that the plants identified by the EPA, including Unit 2 of the Monroe Power Plant, have complied with all applicable federal environmental regulations. Depending upon the outcome of discussions with the EPA regarding the two NOVs/FOVs, DTE Electric could be required to install additional pollution control equipment at some or all of the power plants in question, implement early retirement of facilities where control equipment is not economical, engage in supplemental environmental programs, and/or pay fines. DTE Energy and DTE Electric cannot predict the financial impact or outcome of these matters, or the timing of its resolution.
In October 2010, the Company received a Notice of Violation from the Michigan Department of Natural Resources (MDNRE) alleging that the Michigan coke battery facility violated the visible emission readings and quench water sampling requirements under applicable National Emissions Standards for Hazardous Air Pollutants regulations. This Notice of Violation resulted from the Company self reporting to the MDNRE and the EPA questionable activities by an employee of a contractor hired by the Company to perform visible emissions readings and quench water sampling. The information provided by the contractor was used by the Company in filing certain reports with the MDNRE and the EPA. The Company has ceased using the contractor for these activities, has retained a new certified contractor to perform the required activities and implemented standard operating procedures designed to prevent a reoccurrence of such a situation. At this time, the Company cannot predict the outcome or financial impact of this issue.
For additional discussion on legal matters, see Notes 11 and 19 of the Notes to Consolidated Financial Statements in Item 8 of this Report.
Item 4.
Mine Safety Disclosures
Not applicable.
21
Item 5.
Market for Registrant’s Common Equity, Related Stockholder Matters and Issuer Purchases of Equity Securities
Our common stock is listed on the New York Stock Exchange, which is the principal market for such stock. The following table indicates the reported high and low sales prices of our common stock on the Composite Tape of the New York Stock Exchange and dividends paid per share for each quarterly period during the past two years:
|
Dividends
Paid per Share
|
||||||||||||||
|
Year
|
Quarter
|
High
|
Low
|
|||||||||||
|
2012
|
|
|
|
|
|
|
|
|||||||
|
|
First
|
$
|
56.52
|
|
$
|
52.46
|
|
$
|
0.5875
|
|
||||
|
|
Second
|
$
|
60.25
|
|
$
|
53.70
|
|
$
|
0.5875
|
|
||||
|
|
Third
|
$
|
62.54
|
|
$
|
58.06
|
|
$
|
0.6200
|
|
||||
|
|
Fourth
|
$
|
62.49
|
|
$
|
58.20
|
|
$
|
0.6200
|
|
||||
|
2011
|
|
|
|
|
|
|
|
|||||||
|
|
First
|
$
|
49.36
|
|
$
|
45.17
|
|
$
|
0.5600
|
|
||||
|
|
Second
|
$
|
52.78
|
|
$
|
48.06
|
|
$
|
0.5875
|
|
||||
|
|
Third
|
$
|
52.00
|
|
$
|
43.22
|
|
$
|
0.5875
|
|
||||
|
|
Fourth
|
$
|
55.28
|
|
$
|
47.03
|
|
$
|
0.5875
|
|
||||
At
December 31, 2012
, there were 172,351,680 shares of our common stock outstanding. These shares were held by a total of 67,753 shareholders of record.
Our Bylaws nullify Chapter 7B of the Michigan Business Corporation Act (Act). This Act regulates shareholder rights when an individual’s stock ownership reaches 20% of a Michigan corporation’s outstanding shares. A shareholder seeking control of the Company cannot require our Board of Directors to call a meeting to vote on issues related to corporate control within 10 days, as stipulated by the Act.
We paid cash dividends on our common stock of $407 million in
2012
, $389 million in
2011
, and $360 million in
2010
. The amount of future dividends will depend on our earnings, cash flows, financial condition and other factors that are periodically reviewed by our Board of Directors. Although there can be no assurances, we anticipate paying dividends for the foreseeable future.
See Note 13 of the Notes to Consolidated Financial Statements in Item 8 of this Report for information on dividend restrictions.
All of our equity compensation plans that provide for the annual awarding of stock-based compensation have been approved by shareholders. See Note 21 of the Notes to Consolidated Financial Statements in Item 8 of this Report for additional detail.
See the following table for information as of
December 31, 2012
.
|
Number of Securities
to be Issued Upon
Exercise of
Outstanding Options
|
Weighted-Average
Exercise Price of
Outstanding Options
|
Number of Securities
Remaining Available for
Future Issuance Under Equity
Compensation Plans
|
|||
|
Plans approved by shareholders
|
1,192,670
|
$41.86
|
3,784,351
|
||
22
UNREGISTERED SALES OF EQUITY SECURITIES AND USE OF PROCEEDS
Purchases of Equity Securities by the Issuer and Affiliated Purchasers
The following table provides information about our purchases of equity securities that are registered by the Company pursuant to Section 12 of the Exchange Act for the year ended
December 31, 2012
:
|
Number of
Shares
Purchased (a)
|
Average
Price
Paid per
Share (a)
|
Number
of Shares
Purchased as
Part of Publicly
Announced
Plans or
Programs
|
Average
Price Paid
per Share
|
Maximum Dollar
Value that May
Yet Be
Purchased Under
the Plans or
Programs
|
|||||||||||
|
01/01/2012 — 01/31/2012
|
6,492
|
|
$
|
53.58
|
|
—
|
|
—
|
|
—
|
|
||||
|
02/01/2012 — 02/28/2012
|
181,394
|
|
53.94
|
|
—
|
|
—
|
|
—
|
|
|||||
|
03/01/2012 — 03/31/2012
|
160,870
|
|
54.93
|
|
—
|
|
—
|
|
—
|
|
|||||
|
04/01/2012 — 04/30/2012
|
101,299
|
|
56.27
|
|
—
|
|
—
|
|
—
|
|
|||||
|
05/01/2012 — 05/31/2012
|
880
|
|
55.74
|
|
—
|
|
—
|
|
—
|
|
|||||
|
06/01/2012 — 06/30/2012
|
25,052
|
|
57.54
|
|
—
|
|
—
|
|
—
|
|
|||||
|
07/01/2012 — 07/31/2012
|
51,873
|
|
60.74
|
|
—
|
|
—
|
|
—
|
|
|||||
|
08/01/2012 — 08/31/2012
|
9,114
|
|
51.70
|
|
—
|
|
—
|
|
—
|
|
|||||
|
09/01/2012 — 09/30/2012
|
1,500
|
|
47.69
|
|
—
|
|
—
|
|
—
|
|
|||||
|
10/01/2012 — 10/31/2012
|
1,278
|
|
59.51
|
|
—
|
|
—
|
|
—
|
|
|||||
|
11/01/2012 — 11/30/2012
|
1,000
|
|
59.23
|
|
—
|
|
—
|
|
—
|
|
|||||
|
12/01/2012 — 12/31/2012
|
27,791
|
|
51.26
|
|
—
|
|
—
|
|
—
|
|
|||||
|
Total
|
568,543
|
|
|
|
—
|
|
|
|
|
|
|||||
_______________________________________
|
(a)
|
Represents shares of common stock purchased on the open market to provide shares to participants under various employee compensation and incentive programs. These purchases were not made pursuant to a publicly announced plan or program. Also includes shares of common stock withheld to satisfy income tax obligations upon the vesting of restricted stock.
|
COMPARISON OF CUMULATIVE FIVE YEAR TOTAL RETURN
Total Return To Shareholders
(Includes reinvestment of dividends)
|
Annual Return Percentage
Year Ended December 31
|
||||||||||||||
|
Company/Index
|
2008
|
2009
|
2010
|
2011
|
2012
|
|||||||||
|
DTE Energy Company
|
(14.37
|
)
|
30.08
|
|
9.06
|
|
25.76
|
|
14.90
|
|
||||
|
S&P 500 Index
|
(37.00
|
)
|
26.46
|
|
15.06
|
|
2.11
|
|
16.00
|
|
||||
|
S&P 500 Multi-Utilities Index
|
(24.34
|
)
|
20.92
|
|
11.08
|
|
18.41
|
|
4.24
|
|
||||
|
Indexed Returns
Year Ended December 31
|
|||||||||||||||||
|
Base
Period
|
|||||||||||||||||
|
Company/Index
|
2007
|
2008
|
2009
|
2010
|
2011
|
2012
|
|||||||||||
|
DTE Energy Company
|
100
|
|
85.63
|
|
111.38
|
|
121.47
|
|
152.76
|
|
175.53
|
|
|||||
|
S&P 500 Index
|
100
|
|
63.00
|
|
79.67
|
|
91.68
|
|
93.61
|
|
108.59
|
|
|||||
|
S&P 500 Multi-Utilities Index
|
100
|
|
75.66
|
|
91.49
|
|
101.63
|
|
120.33
|
|
125.43
|
|
|||||
23

24
Item 6.
Selected Financial Data
The following selected financial data should be read in conjunction with the accompanying Management’s Discussion and Analysis in Item 7 of this Report and Notes to the Consolidated Financial Statements in Item 8 of this Report.
|
2012
|
2011
|
2010
|
2009
|
2008
|
|||||||||||||||
|
(In millions, except per share amounts)
|
|||||||||||||||||||
|
Operating Revenues
|
$
|
8,791
|
|
$
|
8,858
|
|
$
|
8,525
|
|
$
|
7,983
|
|
$
|
9,281
|
|
||||
|
Net Income Attributable to DTE Energy Company
|
|||||||||||||||||||
|
Income from continuing operations (a)
|
$
|
666
|
|
$
|
714
|
|
$
|
638
|
|
$
|
538
|
|
$
|
439
|
|
||||
|
Discontinued operations (b)
|
(56
|
)
|
(3
|
)
|
(8
|
)
|
(6
|
)
|
107
|
|
|||||||||
|
Net Income Attributable to DTE Energy Company
|
$
|
610
|
|
$
|
711
|
|
$
|
630
|
|
$
|
532
|
|
$
|
546
|
|
||||
|
Diluted Earnings Per Common Share
|
|||||||||||||||||||
|
Income from continuing operations
|
$
|
3.88
|
|
$
|
4.20
|
|
$
|
3.78
|
|
$
|
3.27
|
|
$
|
2.69
|
|
||||
|
Discontinued operations
|
(0.33
|
)
|
(0.02
|
)
|
(0.04
|
)
|
(0.03
|
)
|
0.65
|
|
|||||||||
|
Diluted Earnings Per Common Share
|
$
|
3.55
|
|
$
|
4.18
|
|
$
|
3.74
|
|
$
|
3.24
|
|
$
|
3.34
|
|
||||
|
Financial Information
|
|||||||||||||||||||
|
Dividends declared per share of common stock
|
$
|
2.42
|
|
$
|
2.32
|
|
$
|
2.18
|
|
$
|
2.12
|
|
$
|
2.12
|
|
||||
|
Total assets
|
$
|
26,339
|
|
$
|
26,009
|
|
$
|
24,896
|
|
$
|
24,195
|
|
$
|
24,590
|
|
||||
|
Long-term debt, including capital leases
|
$
|
7,014
|
|
$
|
7,187
|
|
$
|
7,089
|
|
$
|
7,370
|
|
$
|
7,741
|
|
||||
|
Shareholders’ equity
|
$
|
7,373
|
|
$
|
7,009
|
|
$
|
6,722
|
|
$
|
6,278
|
|
$
|
5,995
|
|
||||
_______________________________________
|
(a)
|
2011 results include an $87 million income tax benefit related to the enactment of the MCIT.
|
|
(b)
|
Discontinued operations represents the Unconventional Gas Production business that was sold in 2012 resulting in a $55 million after-tax loss on sale. The 2008 results include an $80 million after-tax gain on the sale of a portion of the Unconventional Gas Production properties.
|
Item 7.
Management’s Discussion and Analysis of Financial Condition and Results of Operations
EXECUTIVE OVERVIEW
DTE Energy is a diversified energy company with
2012
operating revenues of approximately $8.8 billion and approximately $26 billion in assets. We are the parent company of DTE Electric and DTE Gas, regulated electric and gas utilities engaged primarily in the business of providing electricity and natural gas sales, distribution and storage services throughout southeastern Michigan. We operate three energy-related non-utility segments with operations throughout the United States.
The following table summarizes our financial results:
|
2012
|
2011
|
2010
|
|||||||||
|
(In millions, except per share amounts)
|
|||||||||||
|
Income from continuing operations
|
$
|
674
|
|
$
|
723
|
|
$
|
647
|
|
||
|
Diluted earnings per common share from continuing operations
|
$
|
3.88
|
|
$
|
4.20
|
|
$
|
3.78
|
|
||
The decrease in 2012 Income from continuing operations is principally driven by an income tax benefit of $87 million in the Corporate and Other segment related to the enactment of the MCIT in the second quarter of 2011 and lower results in the Energy Trading segment, partially offset by improved results in the Electric segment. The increase in 2011 Income from continuing operations is due to the above mentioned income tax benefit and higher earnings in Energy Trading, partially offset by lower earnings in the Electric and Gas segments and in the Power and Industrial Projects segment.
Please see detailed explanations of segment performance in the following Results of Operations section.
DTE Energy's strategy is to achieve long-term earnings growth, maintain a strong balance sheet and continue our attractive dividend yield.
Our utilities' growth will be driven by mandated environmental and renewable investments in addition to base infrastructure investments. We are focused on executing plans to achieve operational excellence and customer satisfaction with a focus on customer affordability. We operate in a constructive regulatory environment and have solid relationships with our regulators.
25
We have significant investments in our non-utility businesses. We employ disciplined investment criteria when assessing meaningful, low-risk growth opportunities that leverage our assets, skills and expertise and provide diversity in earnings and geography. Specifically, we invest in targeted energy markets with attractive competitive dynamics where meaningful scale is in alignment with our risk profile. We expect growth opportunities in the Gas Storage and Pipelines and Power and Industrial Projects segments.
A key priority for DTE Energy is to maintain a strong balance sheet which facilitates access to capital markets and reasonably priced short-term and long-term financing. Near-term growth will be funded through internally generated cash flows, issuance of debt and issuance of equity through our dividend reinvestment plan and pension and other employee benefit plans. We have an enterprise risk management program that, among other things, is designed to monitor and manage our exposure to earnings and cash flow volatility related to commodity price changes, interest rates and counterparty credit risk.
CAPITAL INVESTMENTS
Our utility businesses require significant base capital investments each year in order to maintain and improve the reliability of their asset bases, including power generation plants, distribution systems, storage fields and other facilities and fleets. DTE Electric's capital investments over the 2013-2017 period are estimated at $4.7 billion for base infrastructure, $1.2 billion for mandated environmental compliance requirements and $500 million for renewable energy and energy efficiency expenditures. DTE Gas' capital investments over the 2013-2017 period are estimated at $650 million for base infrastructure and $400 million for gas main renewal, meter move out and pipeline integrity programs. DTE Gas proposed in its rate case filing in April 2012, starting in 2013, a five-year annual incremental Infrastructure Recovery Mechanism (IRM) to recover costs associated with capital investment for the gas main renewal and meter move out programs. The IRM was not part of the rate case settlement approved in December 2012 and is expected to be resolved in 2013. DTE Electric and DTE Gas both plan to seek regulatory approval in general rate case filings to include these capital expenditures within our regulatory rate base consistent with prior general rate case filing treatment. DTE Electric is implementing a 20-year renewable energy plan to address the provisions of Michigan Public Act 295 of 2008, with the goals of delivering cleaner renewable electric generation to its customers, further diversifying DTE Electric's and the State of Michigan's sources of electric supply and addressing the state and national goals of increasing energy independence. DTE Electric routinely files renewable energy plans, requests for approval of renewable contracts and for recovery of renewable capital expenditures with the MPSC as the implementation of the 20-year renewable energy plan progresses.
ENVIRONMENTAL MATTERS
We are subject to extensive environmental regulation. Additional costs may result as the effects of various substances on the environment are studied and governmental regulations are developed and implemented. Actual costs to comply could vary substantially. We expect to continue recovering environmental costs related to utility operations through rates charged to our customers.
DTE Electric is subject to the EPA ozone and fine particulate transport and acid rain regulations that limit power plant emissions of sulfur dioxide and nitrogen oxides. Since 2005, the EPA and the State of Michigan have issued additional emission reduction regulations relating to ozone, fine particulate, regional haze and mercury air pollution. These rules will lead to additional emission controls on fossil-fueled power plants to reduce nitrogen oxide, sulfur dioxide and mercury emissions. To comply with these requirements, DTE Electric has spent approximately $1.9 billion through 2012. It is estimated that DTE Electric will make capital expenditures of approximately $335 million in 2013 and up to approximately $1.6 billion of additional capital expenditures through 2020 based on current regulations.
Climate regulation and/or legislation has been proposed and discussed within the U.S. Congress and the EPA. The EPA is implementing regulatory actions under the Clean Air Act to address emissions of greenhouse gases (GHGs). EPA regulation of GHGs requires the best available control technology (BACT) for new major sources or modifications to existing major sources that cause significant increases in GHG emissions. In June 2012, the EPA proposed new source performance standards for carbon dioxide emissions from new fossil-fueled power plants. These new source performance standards are expected to be finalized in 2013 as well as a proposed performance standard for carbon dioxide emissions from existing plants. Pending or future legislation or other regulatory actions could have a material impact on our operations and financial position and the rates we charge our customers. Impacts include expenditures for environmental equipment beyond what is currently planned, financing costs related to additional capital expenditures, the purchase of emission offsets from market sources and the retirement of facilities where control equipment is not economical. We would seek to recover these incremental costs through increased rates charged to our utility customers. Increased costs for energy produced from traditional sources could also increase the economic viability of energy produced from renewable and/or nuclear sources and energy efficiency initiatives and
26
the development of market-based trading of carbon offsets providing business opportunities for our utility and non-utility segments. It is not possible to quantify these impacts on DTE Energy or its customers at this time.
See Note 19 of the Notes to the Consolidated Financial Statements and Items 1. and 2. Business and Properties for further discussion of Environmental Matters.
OUTLOOK
The next few years will be a period of rapid change for DTE Energy and for the energy industry. Our strong utility base, combined with our integrated non-utility operations, position us well for long-term growth.
Looking forward, we will focus on several areas that we expect will improve future performance:
|
•
|
improving Electric and Gas customer satisfaction;
|
|
•
|
effectively manage rate competitiveness and affordability;
|
|
•
|
continuing to pursue regulatory stability and investment recovery for our utilities;
|
|
•
|
managing the growth of our utility asset base;
|
|
•
|
continuing to improve employee engagement;
|
|
•
|
optimizing our cost structure across all business segments;
|
|
•
|
managing cash, capital and liquidity to maintain or improve our financial strength; and
|
|
•
|
investing in businesses that integrate our assets and leverage our skills and expertise.
|
We will continue to pursue opportunities to grow our businesses in a disciplined manner if we can secure opportunities that meet our strategic, financial and risk criteria.
RESULTS OF OPERATIONS
The following sections provide a detailed discussion of the operating performance and future outlook of our segments.
|
2012
|
2011
|
2010
|
|||||||||
|
(In millions)
|
|||||||||||
|
Net Income Attributable to DTE Energy by Segment:
|
|||||||||||
|
Electric
|
$
|
483
|
|
$
|
434
|
|
$
|
441
|
|
||
|
Gas
|
115
|
|
110
|
|
127
|
|
|||||
|
Gas Storage and Pipelines
|
61
|
|
57
|
|
51
|
|
|||||
|
Power and Industrial Projects
|
42
|
|
38
|
|
85
|
|
|||||
|
Energy Trading
|
12
|
|
52
|
|
6
|
|
|||||
|
Corporate and Other
|
(47
|
)
|
23
|
|
(72
|
)
|
|||||
|
Income From Continuing Operations Attributable to DTE Energy Company
|
666
|
|
714
|
|
638
|
|
|||||
|
Discontinued Operations
|
(56
|
)
|
(3
|
)
|
(8
|
)
|
|||||
|
Net Income Attributable to DTE Energy Company
|
$
|
610
|
|
$
|
711
|
|
$
|
630
|
|
||
27
ELECTRIC
Our Electric segment consists principally of DTE Electric.
Electric results are discussed below:
|
2012
|
2011
|
2010
|
|||||||||
|
(In millions)
|
|||||||||||
|
Operating Revenues
|
$
|
5,293
|
|
$
|
5,154
|
|
$
|
4,993
|
|
||
|
Fuel and Purchased Power
|
1,758
|
|
1,716
|
|
1,580
|
|
|||||
|
Gross Margin
|
3,535
|
|
3,438
|
|
3,413
|
|
|||||
|
Operation and Maintenance
|
1,429
|
|
1,370
|
|
1,305
|
|
|||||
|
Depreciation and Amortization
|
827
|
|
818
|
|
849
|
|
|||||
|
Taxes Other Than Income
|
257
|
|
240
|
|
237
|
|
|||||
|
Asset (Gains) and Losses, Reserves and Impairments, Net
|
(2
|
)
|
13
|
|
(6
|
)
|
|||||
|
Operating Income
|
1,024
|
|
997
|
|
1,028
|
|
|||||
|
Other (Income) and Deductions
|
261
|
|
298
|
|
317
|
|
|||||
|
Income Tax Expense
|
280
|
|
265
|
|
270
|
|
|||||
|
Net Income Attributable to DTE Energy Company
|
$
|
483
|
|
$
|
434
|
|
$
|
441
|
|
||
|
Operating Income as a Percent of Operating Revenues
|
19
|
%
|
19
|
%
|
21
|
%
|
|||||
Gross margin
increased $97 million in
2012
and increased $25 million in
2011
. Revenues associated with certain tracking mechanisms and surcharges are offset by related expenses elsewhere in the Consolidated Statement of Operations.
The following table details changes in various gross margin components relative to the comparable prior period:
|
2012
|
2011
|
||||||
|
(In millions)
|
|||||||
|
2011 rate case increase and weather effect, net of 2011 RDM
|
$
|
79
|
|
$
|
29
|
|
|
|
Restoration tracker, discontinued in October 2011
|
(47
|
)
|
27
|
|
|||
|
Securitization bond and tax surcharge
|
25
|
|
(39
|
)
|
|||
|
Renewable energy program
|
35
|
|
26
|
|
|||
|
Energy optimization performance incentive
|
(7
|
)
|
17
|
|
|||
|
Low Income Energy Efficiency Fund revenue deferral
|
4
|
|
(23
|
)
|
|||
|
Regulatory mechanisms and other
|
8
|
|
(12
|
)
|
|||
|
Increase in gross margin
|
$
|
97
|
|
$
|
25
|
|
|
|
2012
|
2011
|
2010
|
||||||
|
(In thousands of MWh)
|
||||||||
|
Electric Sales
|
||||||||
|
Residential
|
15,666
|
|
15,907
|
|
15,726
|
|
||
|
Commercial
|
16,832
|
|
16,779
|
|
16,570
|
|
||
|
Industrial
|
9,989
|
|
9,739
|
|
10,195
|
|
||
|
Other
|
958
|
|
3,136
|
|
3,210
|
|
||
|
43,445
|
|
45,561
|
|
45,701
|
|
|||
|
Interconnection sales (a)
|
2,125
|
|
3,512
|
|
4,876
|
|
||
|
Total Electric Sales
|
45,570
|
|
49,073
|
|
50,577
|
|
||
|
Electric Deliveries
|
|
|
|
|
|
|
||
|
Retail and Wholesale
|
43,445
|
|
45,561
|
|
45,701
|
|
||
|
Electric Customer Choice, including self generators
|
5,197
|
|
5,445
|
|
5,005
|
|
||
|
Total Electric Sales and Deliveries
|
48,642
|
|
51,006
|
|
50,706
|
|
||
______________________________
|
(a)
|
Represents power that is not distributed by DTE Electric.
|
Operation and maintenance
expense increased $59 million in
2012
and increased $65 million in
2011
. The increase in
2012
is primarily due to higher employee benefit expenses of $53 million, increased energy optimization and renewable energy expenses of $17 million, higher power plant generation expenses of $12 million, increased distribution operations expenses of $4 million and higher expenses for low income energy assistance of $4 million, partially offset by reduced restoration and line clearance expenses of $22 million and reduced uncollectible expenses of $9 million. The increase in 2011 is primarily due to higher restoration and line clearance expenses of $41 million, higher generation maintenance and outage expenses of
28
$25 million, higher energy optimization and renewable energy expenses of $19 million, higher employee benefit expense of $9 million, partially offset by reduced contributions of $23 million to the Low Income Energy Efficiency Fund due to a court order, and reduced uncollectible expenses of $7 million.
Depreciation and amortization
expense increased $9 million in
2012
due primarily to higher amortization of regulatory assets, partially offset by the net effect of lower depreciation rates on a higher depreciable base. Depreciation and amortization expense was $31 million lower in 201l due primarily to reduced amortization of regulatory assets, partially offset by expenses related to a higher depreciable base.
Asset (gains) and losses, reserves and impairments, net
decreased $15 million in 2012 and increased $19 million in 2011 principally attributable to a 2011 accrual of $19 million resulting from management's revisions of the timing and estimate of cash flows for the decommissioning of Fermi 1, partially offset by a 2011 revision of $6 million in the timing and estimate of cash flows for the Fermi 1 asbestos removal obligation and other items. See Note 10 of the Notes to the Consolidated Financial Statements.
Other (income) and deductions
were lower by $37 million in 2012 and $19 million in 2011. The decrease in 2012 was due primarily to the lower contributions to the DTE Foundation of $21 million and lower interest expense of $17 million. The 2011 decrease was due to lower interest expense of $24 million, partially offset by higher contributions to the DTE Foundation of $7 million.
Outlook
—
We continue to move forward in our efforts to achieve operational excellence, sustained strong cash flows and earn our authorized return on equity. We expect that our planned significant environmental and renewable expenditures will result in earnings growth. Looking forward, additional factors may impact earnings such as weather, the outcome of regulatory proceedings, investment returns and changes in discount rate assumptions in benefit plans and health care costs, and uncertainty of legislative or regulatory actions regarding climate change and electric choice. We expect to continue our efforts to improve productivity and decrease our costs while improving customer satisfaction with consideration of customer rate affordability.
On June 25, 2012, our Fermi 2 nuclear power plant was manually shutdown after one of the plant's two non-safety related feed-water pumps failed. Supported by a detailed analysis, DTE Electric decided to operate the plant with one feed-water pump at a reduced power level until the second feed-water pump is returned to service. The plant was restarted on July 30, 2012 which restored production to 68% of full capacity. We expect that a substantial portion of the property damage will be covered by existing insurance coverage, subject to deductibles. We are able to purchase sufficient power from MISO to continue to provide uninterrupted service to our customers. We plan to seek recovery of the related incremental purchased power costs through the PSCR process. The plant is scheduled to be brought down in the first quarter of 2013 to complete the repair.
GAS
Our Gas segment consists of DTE Gas and Citizens.
Gas results are discussed below:
|
2012
|
2011
|
2010
|
|||||||||
|
(In millions)
|
|||||||||||
|
Operating Revenues
|
$
|
1,315
|
|
$
|
1,505
|
|
$
|
1,648
|
|
||
|
Cost of Gas
|
550
|
|
744
|
|
870
|
|
|||||
|
Gross Margin
|
765
|
|
761
|
|
778
|
|
|||||
|
Operation and Maintenance
|
385
|
|
394
|
|
378
|
|
|||||
|
Depreciation and Amortization
|
92
|
|
89
|
|
92
|
|
|||||
|
Taxes Other Than Income
|
54
|
|
54
|
|
55
|
|
|||||
|
Operating Income
|
234
|
|
224
|
|
253
|
|
|||||
|
Other (Income) and Deductions
|
69
|
|
54
|
|
59
|
|
|||||
|
Income Tax Expense
|
50
|
|
60
|
|
67
|
|
|||||
|
Net Income Attributable to DTE Energy Company
|
$
|
115
|
|
$
|
110
|
|
$
|
127
|
|
||
|
Operating Income as a Percent of Operating Revenues
|
18
|
%
|
15
|
%
|
15
|
%
|
|||||
29
Gross margin
increased $4 million in
2012
and decreased $17 million in
2011
. Revenues associated with certain tracking mechanisms and surcharges are offset by related expenses elsewhere in the Consolidated Statement of Operations. The following table details changes in various gross margin components relative to the comparable prior period:
|
2012
|
2011
|
||||||
|
(In millions)
|
|||||||
|
Weather
|
$
|
(41
|
)
|
$
|
25
|
|
|
|
Uncollectible expenses tracking mechanism
|
—
|
|
(27
|
)
|
|||
|
Lost and stolen gas
|
29
|
|
—
|
|
|||
|
Self-implementation and rate orders
|
5
|
|
(4
|
)
|
|||
|
Revenue decoupling mechanism
|
11
|
|
5
|
|
|||
|
Energy optimization performance incentive
|
(2
|
)
|
7
|
|
|||
|
Energy optimization revenue
|
6
|
|
10
|
|
|||
|
Midstream storage and transportation revenues
|
6
|
|
(12
|
)
|
|||
|
Subsidiaries transferred to Gas Storage and Pipelines segment
|
—
|
|
(17
|
)
|
|||
|
Lower average consumption
|
(6
|
)
|
—
|
|
|||
|
Other
|
(4
|
)
|
(4
|
)
|
|||
|
Increase (decrease) in gross margin
|
$
|
4
|
|
$
|
(17
|
)
|
|
|
2012
|
2011
|
2010
|
||||||
|
Gas Markets (in Bcf)
|
||||||||
|
Gas sales
|
104
|
|
123
|
|
118
|
|
||
|
End user transportation
|
157
|
|
141
|
|
140
|
|
||
|
261
|
|
264
|
|
258
|
|
|||
|
Intermediate transportation
|
264
|
|
273
|
|
391
|
|
||
|
525
|
|
537
|
|
649
|
|
|||
Operation and maintenance
expense decreased $9 million in 2012 and increased $16 million in
2011
. The decrease in 2012 is primarily due to reduced uncollectible expenses of $9 million, lower legal liability expenses of $4 million and lower customer service expenses of $3 million, partially offset by increased energy optimization expenses of $6 million and higher employee benefit-related expenses of $3 million. The increase in 2011 is primarily due to the 2010 deferral of $32 million of previously expensed costs to achieve restructuring expenses and increased energy optimization expenses of $10 million, partially offset by reduced uncollectible expenses of $13 million, reduced expenses for subsidiaries transferred to Gas Storage and Pipelines segment of $6 million, lower customer service expenses of $5 million, and lower gas operations expenses of $4 million.
Other (income) and deductions
were higher by $14 million in 2012 and lower by $5 million in 2011. The increase in 2012 was due primarily to higher contributions to the DTE Foundation of $21 million, partially offset by lower interest expenses of $5 million. The decrease in 2011 was due primarily to lower interest expense of $3 million.
Income tax expense
was lower by $10 million in 2012. The decrease is principally due to adjustments to deferred taxes.
Outlook —
We continue to move forward in our efforts to achieve operational excellence, sustained strong cash flows and earn our authorized return on equity. We expect that our planned significant infrastructure capital expenditures will result in earnings growth. Looking forward, additional factors may impact earnings such as weather, the outcome of regulatory proceedings, investment returns and changes in discount rate assumptions in benefit plans and health care costs. We expect to continue our efforts to improve productivity and decrease our costs while improving customer satisfaction with consideration of customer rate affordability.
30
GAS STORAGE AND PIPELINES
Our Gas Storage and Pipelines segment consists of our non-utility gas pipelines and storage businesses.
Gas Storage and Pipelines results are discussed below:
|
2012
|
2011
|
2010
|
|||||||||
|
(In millions)
|
|||||||||||
|
Operating Revenues
|
$
|
96
|
|
$
|
91
|
|
$
|
83
|
|
||
|
Operation and Maintenance
|
19
|
|
16
|
|
14
|
|
|||||
|
Depreciation and Amortization
|
8
|
|
6
|
|
5
|
|
|||||
|
Taxes Other Than Income
|
3
|
|
3
|
|
2
|
|
|||||
|
Asset (Gains) and Losses and Reserves, Net
|
3
|
|
—
|
|
—
|
|
|||||
|
Operating Income
|
63
|
|
66
|
|
62
|
|
|||||
|
Other (Income) and Deductions
|
(40
|
)
|
(28
|
)
|
(25
|
)
|
|||||
|
Income Tax Expense
|
39
|
|
35
|
|
32
|
|
|||||
|
Net Income
|
64
|
|
59
|
|
55
|
|
|||||
|
Noncontrolling interest
|
3
|
|
2
|
|
4
|
|
|||||
|
Net Income Attributable to DTE Energy
|
$
|
61
|
|
$
|
57
|
|
$
|
51
|
|
||
Net income attributable to DTE Energy increased $4 million and $6 million in
2012
and
2011
, respectively. The
2012
increase was primarily driven by higher earnings from our pipeline equity investments. The
2011
increase was primarily driven by earnings from subsidiaries that were transferred from Gas segment, increased earnings from our pipeline equity investments, and a settlement for customer gas treating services performed in prior years.
Outlook —
Our Gas Storage and Pipelines business expects to continue its steady growth plan and is evaluating new pipeline and storage investment opportunities. Millennium Pipeline has secured customers for its Phase 1 & 2 expansions, which are scheduled to be in service in 2013. Millennium's total capacity with the Phase 1 & 2 expansion will increase from 525,000 dth/d to over 800,000 dth/d. In addition, the Company has executed an agreement with Southwestern Energy Services Company to support its Bluestone lateral and Susquehanna gathering system. Bluestone is a 44-mile pipeline in Susquehanna County, Pennsylvania and Broome County, New York designed to initially flow over 275,000 dth/d to both Millennium Pipeline and Tennessee Pipeline. The southern portion of Bluestone was placed in service in the fourth quarter of 2012 and the northern portion is scheduled to be placed in service in the first quarter of 2013. A portion of the Susquehanna gathering system was placed in service in the fourth quarter of 2012 and additional segments will be placed in service periodically over the next few years.
POWER AND INDUSTRIAL PROJECTS
Power and Industrial Projects is comprised primarily of projects that deliver energy and utility-type products and services to industrial, commercial and institutional customers; produce reduced emissions fuel (REF) and sell electricity from biomass-fired energy projects.
Power and Industrial Projects results are discussed below:
31
|
2012
|
2011
|
2010
|
|||||||||
|
(In millions)
|
|||||||||||
|
Operating Revenues
|
$
|
1,823
|
|
$
|
1,129
|
|
$
|
1,144
|
|
||
|
Operation and Maintenance
|
1,788
|
|
1,025
|
|
978
|
|
|||||
|
Depreciation and Amortization
|
65
|
|
60
|
|
60
|
|
|||||
|
Taxes other than Income
|
16
|
|
10
|
|
14
|
|
|||||
|
Asset (Gains) and Losses, Reserves and Impairments, Net
|
(5
|
)
|
(12
|
)
|
(14
|
)
|
|||||
|
Operating Income (Loss)
|
(41
|
)
|
46
|
|
106
|
|
|||||
|
Other (Income) and Deductions
|
(44
|
)
|
(10
|
)
|
13
|
|
|||||
|
Income Taxes
|
|||||||||||
|
Expense
|
—
|
|
17
|
|
36
|
|
|||||
|
Production Tax Credits
|
(44
|
)
|
(6
|
)
|
(33
|
)
|
|||||
|
(44
|
)
|
11
|
|
3
|
|
||||||
|
Net Income
|
47
|
|
45
|
|
90
|
|
|||||
|
Noncontrolling interest
|
5
|
|
7
|
|
5
|
|
|||||
|
Net Income Attributable to DTE Energy Company
|
$
|
42
|
|
$
|
38
|
|
$
|
85
|
|
||
Operating revenues
increased $694 million in 2012 and decreased $15 million in 2011. The 2012 increase is primarily due to a $740 million increase associated with higher volumes from REF projects, of which $554 million represents affiliate transactions, and a $30 million increase due to the newly acquired on-site projects, partially offset by a $44 million decrease primarily due to lower volumes associated with the steel business, and a $28 million decrease in coal transportation and marketing services business. The 2011 decrease is primarily due to $166 million of lower coal transportation and marketing services related to an expired rail transportation contract at significantly below market rates, $21 million of lower volumes associated with the coal blending business and a $20 million decrease from the sale of our rail services business in 2010, partially offset by a $92 million increase related to REF projects, of which $90 million represents affiliate transactions, a $74 million increase in coke demand and pricing, and a $26 million increase in new on-site energy services projects.
Operation and maintenance
expense increased $763 million in 2012 and increased $47 million in 2011. The 2012 increase is primarily due to a $770 million increase associated with higher volumes from REF projects, of which $562 million represents affiliate transactions, a $25 million increase due to the newly acquired on-site projects and a $11 million customer settlement, partially offset by a $20 million decrease primarily due to lower volumes associated with the steel business and a $26 million decrease in coal transportation and marketing services business. The 2011 increase is due primarily to a $103 million increase in coal costs, a $93 million increase related to REF projects, of which $91 million represents affiliate transactions, and a $25 million increase in new on-site energy services projects, partially offset by $127 million lower coal transportation and marketing services related to the expired rail transportation contract, a $19 million decrease from the sale of our rail services business in 2010, $17 million lower volumes primarily associated with the coal blending business and $11 million of lower coke battery operating costs.
Asset (gains) and losses, reserves and impairments, net
decreased by $7 million in 2012 and decreased by $2 million in 2011. The 2012 decrease was due to a $3 million loss on the sale of assets associated with our coal transloading terminal and $3 million of impairments related to non-strategic assets. The 2011 decrease was due to an asset impairment related to our landfill gas recovery business of $11 million, partially offset by installment gains of $9 million from the sale of a coke battery.
Other (income) and deductions
were higher by $34 million in 2012 and higher by $23 million in 2011. The increase in 2012 and 2011 were due primarily to gains recognized in connection with sale of membership interest in REF facilities (treated as sales of tax credits for financial reporting purposes). The increase in 2011 also included $12 million of gains on the extinguishment of debt related to our landfill gas recovery business.
Production tax credits
increased by $38 million in 2012 primarily due to tax credits earned from REF projects. The decrease of $27 million in 2011 was due primarily to the expiration of steel industry fuels credits as of December 31, 2010, partially offset by tax credits earned from REF projects.
Outlook
- The Company has constructed and placed in service nine REF facilities including three facilities located at third party owned coal-fired power plants. The Company has sold membership interests in two of the facilities. We continue to optimize these facilities by seeking tax investors for facilities operating at DTE Electric and other utility sites. Additionally, we intend to relocate three underutilized facilities, located at DTE Electric sites, to alternative coal-fired power plants which may provide increased production and emission reduction opportunities in 2013 and future years. One of the underutilized facilities is currently being relocated to a third party owned coal-fired power plant. The proceeds from executed and planned sales of membership interests in the REF facilities are expected to be received by the Company on an installment basis, and the
32
Company will recognize the related gains (treated as sales of tax credits for financial reporting purposes) as production tax credits are generated by the respective facilities.
We expect reduced production levels of metallurgical coke and pulverized coal supplied to steel industry customers for 2013. Substantially all of the metallurgical coke margin is maintained under long-term contracts. We have four biomass-fired power generation facilities that were in operation in 2012, and we are converting an additional facility to be placed in service in 2013. Our on-site energy services will continue to be delivered in accordance with the terms of long-term contracts. During 2012, we purchased a portfolio of fourteen on-site energy projects, primarily located in the Midwest. We will continue to look for additional investment opportunities and other energy projects at favorable prices.
Power and Industrial Projects will continue to leverage its extensive energy-related operating experience and project management capability to develop additional energy projects to serve energy intensive industrial customers.
33
ENERGY TRADING
Energy Trading focuses on physical and financial power, gas and coal marketing and trading, structured transactions, enhancement of returns from DTE Energy’s asset portfolio, and optimization of contracted natural gas pipeline transportation and storage, and generating capacity positions. Energy Trading also provides natural gas, power and related services, and the supply or purchase of renewable energy credits to various customers which may include the management of associated storage and transportation contracts on the customers’ behalf.
Energy Trading results are discussed below:
|
2012
|
2011
|
2010
|
|||||||||
|
(In millions)
|
|||||||||||
|
Operating Revenues
|
$
|
1,109
|
|
$
|
1,276
|
|
$
|
875
|
|
||
|
Fuel, Purchased Power and Gas
|
1,011
|
|
1,112
|
|
786
|
|
|||||
|
Gross Margin
|
98
|
|
164
|
|
89
|
|
|||||
|
Operation and Maintenance
|
66
|
|
63
|
|
59
|
|
|||||
|
Depreciation and Amortization
|
2
|
|
3
|
|
5
|
|
|||||
|
Taxes Other Than Income
|
3
|
|
3
|
|
2
|
|
|||||
|
Operating Income
|
27
|
|
95
|
|
23
|
|
|||||
|
Other (Income) and Deductions
|
8
|
|
9
|
|
12
|
|
|||||
|
Income Tax Expense
|
7
|
|
34
|
|
5
|
|
|||||
|
Net Income Attributable to DTE Energy Company
|
$
|
12
|
|
$
|
52
|
|
$
|
6
|
|
||
Gross margin
decreased $66 million in 2012 and increased $75 million in 2011. The overall decrease in gross margin in 2012 was the result of decreased economic performance in our power and gas trading and power full requirements services strategies due to fewer market opportunities.
The decrease in 2012 represents a $28 million decrease in realized margins and a $38 million decrease in unrealized margins. The $28 million decrease in realized margins is due to $74 million of unfavorable results, primarily in our power and gas trading and power full requirements services strategies, offset by $46 million of favorable results, primarily in our gas full requirements services, gas structured, and gas transportation strategies. The $38 million decrease in unrealized margins is due to $58 million of unfavorable results, primarily in our power and gas full requirements services, power trading, and gas structured and storage strategies, offset by $20 million of favorable results, primarily in our gas trading strategy.
The increase in 2011 represents a $25 million increase in realized margins and $50 million increase in unrealized margins. The $25 million increase in realized margins is due to $73 million of favorable results, primarily in our power and gas trading and power full requirements services strategies, offset by $48 million of unfavorable results, primarily in our power origination, gas structured and gas full requirements services strategies. The $50 million increase in unrealized margins is due to $63 million of favorable results, primarily in our power full requirements services, gas structured and gas trading strategies, offset by $13 million of unfavorable results, primarily in our power transmission strategy.
Outlook
- In the near term, we expect market conditions to remain challenging and the profitability of this segment may be impacted by the volatility or lack thereof in commodity prices in the markets we participate in and the uncertainty of impacts associated with financial reform, regulatory changes and changes in operating rules of regional transmission organizations.
The Energy Trading portfolio includes financial instruments, physical commodity contracts and gas inventory, as well as contracted natural gas pipeline transportation and storage, and generation capacity positions. Energy Trading also provides natural gas, power and related services, which may include the management of associated storage and transportation contracts on the customers' behalf under FERC Asset Management Arrangements, and the supply or purchase of renewable energy credits to various customers. Significant portions of the Energy Trading portfolio are economically hedged. Most financial instruments and physical power and gas contracts are deemed derivatives, whereas natural gas inventory, pipeline transportation, renewable energy credits, and storage assets are not derivatives. As a result, we will experience earnings volatility as derivatives are marked-to-market without revaluing the underlying non-derivative contracts and assets. Our strategy is to economically manage the price risk of these underlying non-derivative contracts and assets with futures, forwards, swaps and options. This results in gains and losses that are recognized in different interim and annual accounting periods.
See also the “Fair Value” section that follows.
34
CORPORATE AND OTHER
Corporate and Other includes various holding company activities and holds certain non-utility debt and energy-related investments.
The 2012 net loss of $47 million represented a decrease of $70 million from the 2011 net income of $23 million. The decrease resulted primarily from a income tax benefit of $87 million related to the enactment of the MCIT in the second quarter of 2011, partially offset by lower interest costs.
The 2011 net income of $23 million was an improvement of $95 million from the 2010 net loss of $72 million. The improvement resulted primarily from an income tax benefit of $87 million related to the enactment of the MCIT in the second quarter of 2011 and lower interest costs.
See Note 12 of the Notes to Consolidated Financial Statements in Item 8 of this report.
DISCONTINUED OPERATIONS
Unconventional Gas Production
In December 2012, the Company sold its 100% equity interest in its Unconventional Gas Production business which consisted of gas and oil production assets in the western Barnett and Marble Falls shale areas of Texas. The properties in the sale included all of the reserves on approximately 88,000 net acres near Dallas, Texas. The sale resulted in gross proceeds of approximately $255 million, which resulted in a pre-tax loss of approximately $83 million ($55 million after tax).
The activity of the discontinued Unconventional Gas Production business is shown below. The amounts exclude general corporate overhead costs, and the related tax effects, and no portion of corporate interest costs were allocated to discontinued operations.
|
2012
|
2011
|
2010
|
|||||||||
|
(In millions)
|
|||||||||||
|
Operating Revenues
|
$
|
55
|
|
$
|
39
|
|
$
|
32
|
|
||
|
Operation and Maintenance
|
24
|
|
16
|
|
11
|
|
|||||
|
Depreciation, Depletion and Amortization
|
23
|
|
18
|
|
15
|
|
|||||
|
Taxes Other Than Income
|
4
|
|
3
|
|
2
|
|
|||||
|
Asset (Gains) and Losses, Net
|
83
|
|
—
|
|
10
|
|
|||||
|
Operating Income (Loss)
|
(79
|
)
|
2
|
|
(6
|
)
|
|||||
|
Other (Income) and Deductions
|
6
|
|
6
|
|
6
|
|
|||||
|
Income Tax Benefit
|
(29
|
)
|
(1
|
)
|
(4
|
)
|
|||||
|
Net Income (Loss) Attributable to DTE Energy Company
|
$
|
(56
|
)
|
$
|
(3
|
)
|
$
|
(8
|
)
|
||
CAPITAL RESOURCES AND LIQUIDITY
Cash Requirements
We use cash to maintain and expand our electric and gas utilities and to grow our non-utility businesses, retire and pay interest on long-term debt and pay dividends. We believe that we will have sufficient internal and external capital resources to fund anticipated capital and operating requirements. In 2013, we expect that cash from operations will be $1.8 billion due to higher working capital requirements. We anticipate base level utility capital investments, environmental, renewable and energy optimization expenditures and expenditures for non-utility businesses in 2013 of approximately $2.2 billion. We plan to seek regulatory approval to include utility capital expenditures in our regulatory rate base consistent with prior treatment. Capital spending for growth of existing or new non-utility businesses will depend on the existence of opportunities that meet our strict risk-return and value creation criteria.
35
|
2012
|
2011
|
2010
|
|||||||||
|
(In millions)
|
|||||||||||
|
Cash and Cash Equivalents
|
|||||||||||
|
Cash Flow From (Used For)
|
|||||||||||
|
Operating activities:
|
|||||||||||
|
Net income
|
$
|
618
|
|
$
|
720
|
|
$
|
639
|
|
||
|
Depreciation, depletion and amortization
|
1,018
|
|
995
|
|
1,027
|
|
|||||
|
Deferred income taxes
|
47
|
|
220
|
|
457
|
|
|||||
|
Loss on sale of non-utility business
|
83
|
|
—
|
|
—
|
|
|||||
|
Asset (gains) and losses, reserves and impairments, net
|
1
|
|
(21
|
)
|
(5
|
)
|
|||||
|
Working capital and other
|
442
|
|
94
|
|
(293
|
)
|
|||||
|
2,209
|
|
2,008
|
|
1,825
|
|
||||||
|
Investing activities:
|
|||||||||||
|
Plant and equipment expenditures — utility
|
(1,451
|
)
|
(1,382
|
)
|
(1,011
|
)
|
|||||
|
Plant and equipment expenditures — non-utility
|
(369
|
)
|
(102
|
)
|
(88
|
)
|
|||||
|
Proceeds from sale of non-utility business
|
255
|
|
—
|
|
—
|
|
|||||
|
Proceeds from sale of assets
|
38
|
|
18
|
|
56
|
|
|||||
|
Acquisition, net of cash acquired
|
(198
|
)
|
—
|
|
—
|
|
|||||
|
Other
|
(44
|
)
|
(94
|
)
|
(183
|
)
|
|||||
|
(1,769
|
)
|
(1,560
|
)
|
(1,226
|
)
|
||||||
|
Financing activities:
|
|||||||||||
|
Issuance of long-term debt
|
759
|
|
1,179
|
|
614
|
|
|||||
|
Redemption of long-term debt
|
(639
|
)
|
(1,455
|
)
|
(663
|
)
|
|||||
|
Short-term borrowings, net
|
(179
|
)
|
269
|
|
(177
|
)
|
|||||
|
Issuance of common stock
|
39
|
|
—
|
|
36
|
|
|||||
|
Repurchase of common stock
|
—
|
|
(18
|
)
|
—
|
|
|||||
|
Dividends on common stock
|
(407
|
)
|
(389
|
)
|
(360
|
)
|
|||||
|
Other
|
(16
|
)
|
(31
|
)
|
(36
|
)
|
|||||
|
(443
|
)
|
(445
|
)
|
(586
|
)
|
||||||
|
Net Increase (Decrease) in Cash and Cash Equivalents
|
$
|
(3
|
)
|
$
|
3
|
|
$
|
13
|
|
||
Cash from Operating Activities
A majority of our operating cash flow is provided by our electric and gas utilities, which are significantly influenced by factors such as weather, electric Customer Choice, regulatory deferrals, regulatory outcomes, economic conditions and operating costs.
Cash from operations totaling $2.2 billion in 2012 was $201 million higher than the comparable 2011 period. The operating cash flow comparison primarily reflects cash generated from working capital items, partially offset by lower net income after adjusting for non-cash and non-operating items (depreciation, depletion and amortization, deferred income taxes, loss on sale of non-utility business and asset (gains) and losses, reserves and impairments, net).
Cash from operations totaling $2 billion in 2011 was $183 million higher than the comparable 2010 period. The operating cash flow comparison primarily reflects cash generated from working capital items, partially offset by lower net income after adjusting for non-cash and non-operating items (depreciation, depletion and amortization, deferred income taxes and asset (gains) and losses, reserves and impairments, net).
The changes in working capital items in both years primarily relate to pension and postretirement obligations and income tax items.
Cash from Investing Activities
Cash inflows associated with investing activities are primarily generated from the sale of assets, while cash outflows are the result of plant and equipment expenditures. In any given year, we will look to realize cash from under-performing or non-strategic assets or matured fully valued assets.
Capital spending within the utility business is primarily to maintain and improve our electric generation and electric and gas distribution infrastructure and to comply with environmental regulations and renewable energy requirements.
36
Capital spending within our non-utility businesses is primarily for ongoing maintenance and expansion. The balance of non-utility spending is for growth, which we manage very carefully. We look to make investments that meet strict criteria in terms of strategy, management skills, risks and returns. All new investments are analyzed for their rates of return and cash payback on a risk adjusted basis. We have been disciplined in how we deploy capital and will not make investments unless they meet our criteria. For new business lines, we initially invest based on research and analysis. We start with a limited investment, we evaluate results and either expand or exit the business based on those results. In any given year, the amount of growth capital will be determined by the underlying cash flows of the Company with a clear understanding of any potential impact on our credit ratings.
Net cash used for investing activities was higher in both 2012 and 2011 due primarily to increased capital expenditures by our utility and non-utility businesses. The 2012 increase includes higher capital expenditures for the Bluestone Pipeline project and the Power and Industrial Projects acquisition of fourteen on-site energy projects, partially offset by the proceeds from the sale of the Unconventional Gas Production business.
Cash from Financing Activities
We rely on both short-term borrowing and long-term financing as a source of funding for our capital requirements not satisfied by our operations.
Our strategy is to have a targeted debt portfolio blend of fixed and variable interest rates and maturity. We continually evaluate our leverage target, which is currently 50 percent to 52 percent, to ensure it is consistent with our objective to have a strong investment grade debt rating.
Net cash used for financing activities was $443 million in 2012, compared to net cash used for financing activities of approximately $445 million for the same period in 2011. The change was primarily attributable to lower redemptions of long-term debt, offset by a reduction in short-term borrowings.
Net cash used for financing activities was $445 million in 2011, compared to net cash used for financing activities of approximately $586 million for the same period in 2010. The change was primarily attributable to increased short-term borrowings and long-term debt issuances, partially offset by increased long-term debt redemptions.
Outlook
We expect cash flow from operations to increase over the long-term primarily as a result of growth from our utilities and non-utility businesses. We expect growth in our utilities to be driven primarily by capital spending to maintain and improve our electric generation and electric and gas distribution infrastructure and to comply with new and existing state and federal regulations that will result in additional environmental and renewable energy investments which will increase the base from which rates are determined. Our non-utility growth is expected from additional investments primarily in our Gas Storage and Pipelines and Power and Industrial Projects segments.
We may be impacted by the delayed collection of underrecoveries of our various recovery and tracking mechanisms as a result of timing of MPSC orders. Energy prices are likely to be a source of volatility with regard to working capital requirements for the foreseeable future. We are continuing our efforts to identify opportunities to improve cash flow through working capital initiatives and maintaining flexibility in the timing and extent of our long-term capital projects.
We have approximately $800 million in long-term debt maturing in the next twelve months. The repayment of the principal amount of the Securitization debt is funded through a surcharge payable by DTE Electric’s customers. The repayment of the other debt is expected to be paid through internally generated funds or the issuance of long-term debt.
DTE Energy has approximately $1.6 billion of available liquidity at December 31, 2012, consisting of cash and amounts available under unsecured revolving credit agreements.
We expect to issue equity of approximately $300 million in 2013 through our dividend reinvestment plan and pension and other employee benefit plans.
At the discretion of management, and depending upon financial market conditions, we anticipate making up to a $315 million contribution to the pension plans in 2013. In January 2013, the Company contributed $145 million to its postretirement benefit plans. At the discretion of management, the Company may make up to an additional $120 million contribution to its postretirement benefit plans in 2013.
37
Various non-utility subsidiaries of the Company have entered into contracts which contain ratings triggers and are guaranteed by DTE Energy. These contracts contain provisions which allow the counterparties to request that the Company post cash or letters of credit as collateral in the event that DTE Energy’s credit rating is downgraded below investment grade. As of
December 31, 2012
, the value of the transactions for which the Company would have been exposed to collateral requests had DTE Energy’s credit rating been below investment grade on such date was approximately $
326 million
. In circumstances where an entity is downgraded below investment grade and collateral requests are made as a result, the requesting parties often agree to accept less than the full amount of their exposure to the downgraded entity. In addition, the Company maintains adequate credit facilities to meet this obligation should such an occurrence arise.
We believe we have sufficient operating flexibility, cash resources and funding sources to maintain adequate amounts of liquidity and to meet our future operating cash and capital expenditure needs. However, virtually all of our businesses are capital intensive, or require access to capital, and the inability to access adequate capital could adversely impact earnings and cash flows.
See Notes 11, 12, 15, 17, and 20 of the Notes to Consolidated Financial Statements in Item 8 of this Report.
Contractual Obligations
The following table details our contractual obligations for debt redemptions, leases, purchase obligations and other long-term obligations as of December 31, 2012:
|
Total
|
2013
|
2014-2015
|
2016-2017
|
2018
and Beyond
|
|||||||||||||||
|
(In millions)
|
|||||||||||||||||||
|
Long-term debt:
|
|||||||||||||||||||
|
Mortgage bonds, notes and other
|
$
|
6,865
|
|
$
|
634
|
|
$
|
1,066
|
|
$
|
474
|
|
$
|
4,691
|
|
||||
|
Securitization bonds
|
479
|
|
177
|
|
302
|
|
—
|
|
—
|
|
|||||||||
|
Junior subordinated debentures
|
480
|
|
—
|
|
—
|
|
—
|
|
480
|
|
|||||||||
|
Capital lease obligations
|
20
|
|
7
|
|
10
|
|
3
|
|
—
|
|
|||||||||
|
Interest
|
5,890
|
|
415
|
|
688
|
|
577
|
|
4,210
|
|
|||||||||
|
Operating leases
|
233
|
|
38
|
|
56
|
|
41
|
|
98
|
|
|||||||||
|
Electric, gas, fuel, transportation and storage purchase obligations (a)
|
4,229
|
|
1,856
|
|
1,584
|
|
222
|
|
567
|
|
|||||||||
|
Other long-term obligations (b)(c)(d)
|
148
|
|
80
|
|
39
|
|
13
|
|
16
|
|
|||||||||
|
Total obligations
|
$
|
18,344
|
|
$
|
3,207
|
|
$
|
3,745
|
|
$
|
1,330
|
|
$
|
10,062
|
|
||||
_______________________________________
|
(a)
|
Excludes amounts associated with full requirements contracts where no stated minimum purchase volume is required.
|
|
(b)
|
Includes liabilities for unrecognized tax benefits of $11 million.
|
|
(c)
|
Excludes other long-term liabilities of $179 million not directly derived from contracts or other agreements.
|
|
(d)
|
At December 31, 2012, we met the minimum pension funding levels required under the Employee Retirement Income Security Act of 1974 (ERISA) and the Pension Protection Act of 2006 for our defined benefit pension plans. We may contribute more than the minimum funding requirements for our pension plans and may also make contributions to our benefit plans and our postretirement benefit plans; however, these amounts are not included in the table above as such amounts are discretionary. Planned funding levels are disclosed in the Capital Resources and Liquidity and Critical Accounting Estimates sections herein and in Note 20 of the Notes to Consolidated Financial Statements in Item 8 of this Report.
|
Credit Ratings
Credit ratings are intended to provide banks and capital market participants with a framework for comparing the credit quality of securities and are not a recommendation to buy, sell or hold securities. The Company’s credit ratings affect our cost of capital and other terms of financing as well as our ability to access the credit and commercial paper markets. Management believes that our current credit ratings provide sufficient access to the capital markets. However, disruptions in the banking and capital markets not specifically related to us may affect our ability to access these funding sources or cause an increase in the return required by investors.
As part of the normal course of business, DTE Electric, DTE Gas and various non-utility subsidiaries of the Company routinely enter into physical or financially settled contracts for the purchase and sale of electricity, natural gas, coal, capacity, storage and other energy-related products and services. Certain of these contracts contain provisions which allow the counterparties to request that the Company post cash or letters of credit in the event that the senior unsecured debt rating of DTE Energy is downgraded below investment grade. Certain of these contracts for DTE Electric and DTE Gas contain similar provisions in the event that the senior unsecured debt rating of the particular utility is downgraded below investment grade.
38
The amount of such collateral which could be requested fluctuates based upon commodity prices and the provisions and maturities of the underlying transactions and could be substantial. Also, upon a downgrade below investment grade, we could have restricted access to the commercial paper market and if DTE Energy is downgraded below investment grade our non-utility businesses, especially the Energy Trading and Power and Industrial Projects segments, could be required to restrict operations due to a lack of available liquidity. A downgrade below investment grade could potentially increase the borrowing costs of DTE Energy and its subsidiaries and may limit access to the capital markets. The impact of a downgrade will not affect our ability to comply with our existing debt covenants. While we currently do not anticipate such a downgrade, we cannot predict the outcome of current or future credit rating agency reviews.
In January 2012, Fitch Ratings raised DTE Electric's senior secured debt rating from 'A-' to 'A' and raised DTE Gas' senior secured debt rating from 'BBB+' to 'A-'. At the same time, Fitch Ratings revised the outlook for DTE Gas from stable to positive. In January 2013, Fitch raised DTE Gas' senior secured debt rating from 'A-' to 'A' and revised the outlook from positive to stable. In February 2012, Moody's revised the outlook of DTE Energy, DTE Electric and DTE Gas from stable to positive. In February 2013, Moody's raised DTE Energy's senior unsecured debt rating from 'Baa2' to 'Baa1', DTE Electric's senior secured debt rating from 'A2' to 'A1', and DTE Gas' senior secured debt rating from 'A2 to A1'. At the same time, Moody's revised the outlook of DTE Energy, DTE Electric and DTE Gas from positive to stable.
CRITICAL ACCOUNTING ESTIMATES
The preparation of financial statements in conformity with generally accepted accounting principles require that management apply accounting policies and make estimates and assumptions that affect results of operations and the amounts of assets and liabilities reported in the financial statements. Management believes that the areas described below require significant judgment in the application of accounting policy or in making estimates and assumptions in matters that are inherently uncertain and that may change in subsequent periods. Additional discussion of these accounting policies can be found in the Notes to Consolidated Financial Statements in Item 8 of this Report.
Regulation
A significant portion of our business is subject to regulation. This results in differences in the application of generally accepted accounting principles between regulated and non-regulated businesses. DTE Electric and DTE Gas are required to record regulatory assets and liabilities for certain transactions that would have been treated as revenue or expense in non-regulated businesses. Future regulatory changes or changes in the competitive environment could result in the discontinuance of this accounting treatment for regulatory assets and liabilities for some or all of our businesses. Management believes that currently available facts support the continued use of regulatory assets and liabilities and that all regulatory assets and liabilities are recoverable or refundable in the current rate environment.
See Note 11 of the Notes to Consolidated Financial Statements in Item 8 of this Report.
Derivatives and Hedging Activities
Derivatives are generally recorded at fair value and shown as Derivative Assets or Liabilities. Changes in the fair value of the derivative instruments are recognized in earnings in the period of change, unless the derivative meets certain defined conditions and qualifies as an effective hedge. The normal purchases and normal sales exception requires, among other things, physical delivery in quantities expected to be used or sold over a reasonable period in the normal course of business. Contracts that are designated as normal purchases and normal sales are not recorded at fair value. Substantially all of the commodity contracts entered into by DTE Electric and DTE Gas meet the criteria specified for this exception.
Fair value is defined as the price that would be received to sell an asset or paid to transfer a liability in an orderly transaction between market participants at the measurement date in a principal or most advantageous market. Fair value is a market-based measurement that is determined based on inputs, which refer broadly to assumptions that market participants use in pricing assets and liabilities. These inputs can be readily observable, market corroborated or generally unobservable inputs. Management makes certain assumptions it believes that market participants would use in pricing assets and liabilities, including assumptions about risk, and the risks inherent in the inputs to valuation techniques. Credit risk of the Company and our counterparties is incorporated in the valuation of the assets and liabilities through the use of credit reserves, the impact of which was immaterial at
December 31, 2012
and
2011
. Management believes it uses valuation techniques that maximize the use of observable market-based inputs and minimize the use of unobservable inputs.
39
The fair values we calculate for our derivatives may change significantly as inputs and assumptions are updated for new information. Actual cash returns realized on our derivatives may be different from the results we estimate using models. As fair value calculations are estimates based largely on commodity prices, we perform sensitivity analyses on the fair values of our forward contracts. See sensitivity analysis in Item 7A. Quantitative and Qualitative Disclosures About Market Risk. See also the Fair Value section, herein. See Notes 3 and 4 of the Notes to Consolidated Financial Statements in Item 8 of this Report.
Allowance for Doubtful Accounts
We establish an allowance for doubtful accounts based on historical losses and management's assessment of existing economic conditions, customer trends, and other factors. The allowance for doubtful accounts for our two utilities is calculated using the aging approach that utilizes rates developed in reserve studies and applies these factors to past due receivable balances. We believe the allowance for doubtful accounts is based on reasonable estimates.
Asset Impairments
Goodwill
Certain of our reporting units have goodwill or allocated goodwill resulting from purchase business combinations. We perform an impairment test for each of our reporting units with goodwill annually or whenever events or circumstances indicate that the value of goodwill may be impaired.
In September 2011, the FASB issued ASU No. 2011-08,
Intangibles-Goodwill and Other (Topic 350)-Testing Goodwill for Impairment
, which is intended to simplify how entities test for goodwill impairment by permitting an entity the option of performing a qualitative assessment to determine whether further impairment testing is necessary (“step zero”). The standard is effective for annual and interim goodwill impairments tests for fiscal years beginning after December 15, 2011. We did not apply step zero for the 2012 goodwill impairment test and proceeded directly to step one of the test.
In performing Step 1 of the impairment test, we compare the fair value of the reporting unit to its carrying value including goodwill. If the carrying value including goodwill were to exceed the fair value of a reporting unit, Step 2 of the test would be performed. Step 2 of the impairment test requires the carrying value of goodwill to be reduced to its fair value, if lower, as of the test date.
For Step 1 of the test, we estimate the reporting unit's fair value using standard valuation techniques, including techniques which use estimates of projected future results and cash flows to be generated by the reporting unit. Such techniques generally include a terminal value that utilizes an earnings multiple approach, which incorporates the current market values of comparable entities. These cash flow valuations involve a number of estimates that require broad assumptions and significant judgment by management regarding future performance. We also employ market-based valuation techniques to test the reasonableness of the indications of value for the reporting units determined under the cash flow technique.
We performed our annual impairment test as of October 1, 2012 and determined that except for the Unconventional Gas Production reporting unit, the estimated fair value of each reporting unit exceeded its carrying value, and no impairment existed. The $2 million of goodwill attributable to the Unconventional Gas Production reporting unit was written off in the fourth quarter of 2012 in connection with its sale. As part of the annual impairment test, we also compared the aggregate fair value of our reporting units to our overall market capitalization. The implied premium of the aggregate fair value over market capitalization is likely attributable to an acquisition control premium (the price in excess of a stock's market price that investors typically pay to gain control of an entity). The results of the test and key estimates that were incorporated are as follows.
40
As of October 1, 2012 Valuation Date:
|
Reporting Unit
|
Goodwill
|
|
Fair Value Reduction % (a)
|
|
Discount Rate
|
|
Terminal Multiple (b)
|
|
Valuation Methodology (c)
|
|||||||
|
|
(In millions)
|
|
|
|
|
|
|
|
|
|||||||
|
Electric
|
$
|
1,208
|
|
|
31
|
|
%
|
|
7
|
|
%
|
|
9.0x
|
|
DCF, assuming stock sale
|
|
|
Gas
|
745
|
|
21
|
|
%
|
|
7
|
|
%
|
|
10.5x
|
|
DCF, assuming stock sale
|
|||
|
Power and Industrial Projects (d)
|
26
|
|
70
|
|
%
|
|
9
|
|
%
|
|
10.0x
|
|
DCF, assuming asset sale (e)
|
|||
|
Gas Storage and Pipelines
|
22
|
|
82
|
|
%
|
|
8
|
|
%
|
|
11.0x
|
|
DCF, assuming asset sale
|
|||
|
Energy Trading
|
17
|
|
33
|
|
%
|
|
15
|
|
%
|
|
n/a
|
|
DCF, assuming asset sale
|
|||
|
Unconventional Gas Production (f)
|
2
|
|
n/a
|
|
|
n/a
|
|
|
n/a
|
|
Sales Price
|
|||||
|
|
$
|
2,020
|
|
|
|
|
|
|
|
|
|
|||||
_______________________________________
|
(a)
|
Percentage by which the fair value of equity of the reporting unit would need to decline to equal its carrying value, including goodwill.
|
|
(b)
|
Multiple of enterprise value (sum of debt plus equity value) to earnings before interest, taxes, depreciation and amortization (EBITDA).
|
|
(c)
|
Discounted cash flows (DCF) incorporated 2013-2017 projected cash flows plus a calculated terminal value.
|
|
(d)
|
Power and Industrial Projects excludes Biomass and Coal Services reporting units as these units have no allocated goodwill.
|
|
(e)
|
Asset sales were assumed except for Power and Industrial Projects' reduced emissions fuel projects, which assumed stock sales.
|
|
(f)
|
Goodwill attributable to Unconventional Gas Production was written off in the fourth quarter of 2012 in connection with its sale. Refer to Note 7 of the Notes to Consolidated Financial Statements in Item 8 of this Report.
|
We perform an annual impairment test each October. In between annual tests, we monitor our estimates and assumptions regarding estimated future cash flows, including the impact of movements in market indicators in future quarters and will update our impairment analyses if a triggering event occurs. While we believe our assumptions are reasonable, actual results may differ from our projections. To the extent projected results or cash flows are revised downward, the reporting unit may be required to write down all or a portion of its goodwill, which would adversely impact our earnings.
Long-Lived Assets
We evaluate the carrying value of our long-lived assets, excluding goodwill, when circumstances indicate that the carrying value of those assets may not be recoverable. Conditions that could have an adverse impact on the cash flows and fair value of the long-lived assets are deteriorating business climate, condition of the asset, or plans to dispose of the asset before the end of its useful life. The review of long-lived assets for impairment requires significant assumptions about operating strategies and estimates of future cash flows, which require assessments of current and projected market conditions. An impairment evaluation is based on an undiscounted cash flow analysis at the lowest level for which independent cash flows of long-lived assets can be identified from other groups of assets and liabilities. Impairment may occur when the carrying value of the asset exceeds the future undiscounted cash flows. When the undiscounted cash flow analysis indicates a long-lived asset is not recoverable, the amount of the impairment loss is determined by measuring the excess of the long-lived asset over its fair value. An impairment would require us to reduce both the long-lived asset and current period earnings by the amount of the impairment, which would adversely impact our earnings.
Pension and Postretirement Costs
We sponsor defined benefit pension plans and postretirement benefit plans for eligible employees of the Company. The measurement of the plan obligations and cost of providing benefits under these plans involve various factors, including numerous assumptions and accounting elections. When determining the various assumptions that are required, we consider historical information as well as future expectations. The benefit costs are affected by, among other things, the actual rate of return on plan assets, the long-term expected return on plan assets, the discount rate applied to benefit obligations, the incidence of mortality, the expected remaining service period of plan participants, level of compensation and rate of compensation increases, employee age, length of service, the anticipated rate of increase of health care costs and the level of benefits provided to employees and retirees. Pension and postretirement benefit costs attributed to the segments are included with labor costs and ultimately allocated to projects within the segments, some of which are capitalized.
We had pension costs of $220 million in 2012, $172 million in 2011, and $112 million in 2010. Postretirement benefits costs were $151 million in 2012, $122 million in 2011 and $164 million in 2010. Pension and postretirement benefits costs for 2012 are calculated based upon a number of actuarial assumptions, including an expected long-term rate of return on our plan assets of 8.25%. In developing our expected long-term rate of return assumptions, we evaluated asset class risk and return expectations, as well as inflation assumptions. Projected returns are based on broad equity, bond and other markets. Our 2013 expected long-term rate of return on pension plan assets is based on an asset allocation assumption utilizing active investment
41
management of 47% in equity markets, 25% in fixed income markets, and 28% invested in other assets. Because of market volatility, we periodically review our asset allocation and rebalance our portfolio when considered appropriate. Given market conditions, we are maintaining our long-term rate of return assumption for our pension plans and our postretirement health and life plans at 8.25% for 2013. We believe this rate is a reasonable assumption for the long-term rate of return on our plan assets for 2013 given our investment strategy. We will continue to evaluate our actuarial assumptions, including our expected rate of return, at least annually.
We calculate the expected return on pension and other postretirement benefit plan assets by multiplying the expected return on plan assets by the market-related value (MRV) of plan assets at the beginning of the year, taking into consideration anticipated contributions and benefit payments that are to be made during the year. Current accounting rules provide that the MRV of plan assets can be either fair value or a calculated value that recognizes changes in fair value in a systematic and rational manner over not more than five years. For our pension plans, we use a calculated value when determining the MRV of the pension plan assets and recognize changes in fair value over a three-year period. Accordingly, the future value of assets will be impacted as previously deferred gains or losses are recognized. Financial markets in 2012 contributed to our investment performance resulting in unrecognized net gains. As of December 31, 2012, we had $81 million of cumulative losses that remain to be recognized in the calculation of the MRV of pension assets related to investment performance in 2012, 2011 and 2010. For our postretirement benefit plans, we use fair value when determining the MRV of postretirement benefit plan assets, therefore all investment losses and gains have been recognized in the calculation of MRV for these plans.
The discount rate that we utilize for determining future pension and postretirement benefit obligations is based on a yield curve approach and a review of bonds that receive one of the two highest ratings given by a recognized rating agency. The yield curve approach matches projected pension plan and postretirement benefit payment streams with bond portfolios reflecting actual liability duration unique to our plans. The discount rate determined on this basis decreased to 4.15% at December 31, 2012 from 5.0% at December 31, 2011. We estimate that our 2013 total pension costs will approximate $226 million compared to $220 million in 2012 primarily due to a lower discount rate and higher amortization of net actuarial losses, partially offset by 2013 contributions. Our 2013 postretirement benefit costs will approximate $30 million compared to $151 million in 2012 primarily due to plan design changes and favorable retiree medical utilization, partially offset by a lower discount rate, higher amortization of net actuarial losses and updated assumed long-term retiree medical inflation. Our health care trend rate assumes 7.00% for 2013 through 2017, 6.50% in 2018, 6.00% in 2019, 5.50% in 2020 and 5.00% in 2021 and beyond. Future actual pension and postretirement benefit costs will depend on future investment performance, changes in future discount rates and various other factors related to plan design. The MPSC approved the deferral of the non-capitalized portion of DTE Gas' negative pension expense. DTE Gas records a regulatory liability for any negative pension costs, as determined under generally accepted accounting principles.
Lowering the expected long-term rate of return on our plan assets by one percentage point would have increased our 2012 pension costs by approximately $32 million. Lowering the discount rate and the salary increase assumptions by one percentage point would have increased our 2012 pension costs by approximately $14 million. Lowering the expected long-term rate of return on our plan assets by one percentage point would have increased our 2012 postretirement costs by approximately $10 million. Lowering the discount rate assumption by one percentage point would have increased our 2012 postretirement costs by approximately $46 million. Lowering the health care cost trend assumptions by one percentage point would have decreased our postretirement benefit service and interest costs for 2012 by approximately $26 million.
The value of our qualified pension and postretirement benefit plan assets was $4.4 billion at December 31, 2012 and $3.9 billion at December 31, 2011. At December 31, 2012, our qualified pension plans were underfunded by $1.4 billion and our other postretirement benefit plans were underfunded by $1.2 billion. The 2012 and 2011 funding levels were generally similar due to plan sponsor contributions in 2012 and 2011, largely offset by the impact of decreased discount rates.
Pension and postretirement costs and pension cash funding requirements may increase in future years without typical returns in the financial markets. We made contributions to our qualified pension plans of $229 million in 2012 and $200 million in 2011. At the discretion of management, consistent with the Pension Protection Act of 2006, and depending upon financial market conditions, we anticipate making contributions to our qualified pension plans of $315 million in 2013 and up to $1.3 billion over the next five years. We made postretirement benefit plan contributions of $140 million and $111 million in 2012 and 2011, respectively. We are required by orders issued by the MPSC to make postretirement benefit contributions at least equal to the amounts included in our utilities' base rates. As a result, we contributed $145 million to our postretirement plans in January 2013 and expect to make up to an additional $120 million contribution to our postretirement plans in 2013 and, subject to MPSC funding requirements, up to $622 million over the next five years. The planned contributions will be made in cash, DTE Energy common stock or a combination of cash and stock.
See Note 20 of the Notes to Consolidated Financial Statements in Item 8 of this Report.
42
Legal Reserves
We are involved in various legal proceedings, claims and litigation arising in the ordinary course of business. We regularly assess our liabilities and contingencies in connection with asserted or potential matters, and establish reserves when appropriate. Legal reserves are based upon management’s assessment of pending and threatened legal proceedings and claims against us.
Insured and Uninsured Risks
Our comprehensive insurance program provides coverage for various types of risks. Our insurance policies cover risk of loss including property damage, general liability, workers’ compensation, auto liability, and directors’ and officers’ liability. Under our risk management policy, we self-insure portions of certain risks up to specified limits, depending on the type of exposure. The maximum self-insured retention for various risks is as follows: property damage- $10 million, general liability- $7 million, workers’ compensation- $9 million, and auto liability-$7 million. We have an actuarially determined estimate of our incurred but not reported (IBNR) liability prepared annually and we adjust our reserves for self-insured risks as appropriate. As of December 31, 2012, this IBNR liability was approximately $37 million.
Accounting for Tax Obligations
We are required to make judgments regarding the potential tax effects of various financial transactions and results of operations in order to estimate our obligations to taxing authorities. We account for uncertain income tax positions using a benefit recognition model with a two-step approach, a more-likely-than-not recognition criterion and a measurement attribute that measures the position as the largest amount of tax benefit that is greater than 50% likely of being realized upon ultimate settlement. If the benefit does not meet the more likely than not criteria for being sustained on its technical merits, no benefit will be recorded. Uncertain tax positions that relate only to timing of when an item is included on a tax return are considered to have met the recognition threshold. We also have non-income tax obligations related to property, sales and use and employment-related taxes and ongoing appeals related to these tax matters.
Accounting for tax obligations requires judgments, including assessing whether tax benefits are more likely than not to be sustained, and estimating reserves for potential adverse outcomes regarding tax positions that have been taken. We also assess our ability to utilize tax attributes, including those in the form of carry-forwards, for which the benefits have already been reflected in the financial statements. We believe the resulting tax reserve balances as of December 31, 2012 and December 31, 2011 are appropriately accounted. The ultimate outcome of such matters could result in favorable or unfavorable adjustments to our consolidated financial statements and such adjustments could be material.
See Note 12 of the Notes to Consolidated Financial Statements in Item 8 of this Report.
FAIR VALUE
Derivatives are generally recorded at fair value and shown as Derivative Assets or Liabilities. Contracts we typically classify as derivative instruments include power, gas, oil and certain coal forwards, futures, options and swaps, and foreign currency exchange contracts. Items we do not generally account for as derivatives include natural gas inventory, pipeline transportation, renewable energy credits and storage assets. See Notes 3 and 4 of the Notes to Consolidated Financial Statements in Item 8 of this Report.
The tables below do not include the expected earnings impact of non-derivative gas storage, transportation, certain power contracts and renewable energy credits which are subject to accrual accounting. Consequently, gains and losses from these positions may not match with the related physical and financial hedging instruments in some reporting periods, resulting in volatility in DTE Energy’s reported period-by-period earnings; however, the financial impact of the timing differences will reverse at the time of physical delivery and/or settlement.
The Company manages its mark-to-market (MTM) risk on a portfolio basis based upon the delivery period of its contracts and the individual components of the risks within each contract. Accordingly, it records and manages the energy purchase and sale obligations under its contracts in separate components based on the commodity (e.g. electricity or gas), the product (e.g. electricity for delivery during peak or off-peak hours), the delivery location (e.g. by region), the risk profile (e.g. forward or option), and the delivery period (e.g. by month and year).
The Company has established a fair value hierarchy that prioritizes the inputs to valuation techniques used to measure fair value in three broad levels. The fair value hierarchy gives the highest priority to quoted prices (unadjusted) in active
43
markets for identical assets or liabilities (Level 1) and the lowest priority to unobservable inputs (Level 3). For further discussion of the fair value hierarchy. See Note 3 of the Notes to Consolidated Financial Statements in Item 8 of this Report.
The following tables provide details on changes in our MTM net asset (or liability) position during 2012:
|
Total
|
|||
|
(In millions)
|
|||
|
MTM at December 31, 2011
|
$
|
49
|
|
|
Reclassify to realized upon settlement
|
(80
|
)
|
|
|
Changes in fair value recorded to income
|
65
|
|
|
|
Amounts recorded to unrealized income
|
(15
|
)
|
|
|
Changes in fair value recorded in regulatory liabilities
|
15
|
|
|
|
Change in collateral held by (for) others
|
(56
|
)
|
|
|
Option premiums paid and other
|
3
|
|
|
|
MTM at December 31, 2012
|
$
|
(4
|
)
|
The table below shows the maturity of our MTM positions:
|
Source of Fair Value
|
2013
|
2014
|
2015
|
2016
and
Beyond
|
Total Fair Value
|
|||||||||||||||
|
(In millions)
|
||||||||||||||||||||
|
Level 1
|
$
|
26
|
|
$
|
9
|
|
$
|
(6
|
)
|
$
|
—
|
|
$
|
29
|
|
|||||
|
Level 2
|
(19
|
)
|
(1
|
)
|
—
|
|
—
|
|
(20
|
)
|
||||||||||
|
Level 3
|
(24
|
)
|
9
|
|
2
|
|
—
|
|
(13
|
)
|
||||||||||
|
MTM before collateral adjustments
|
$
|
(17
|
)
|
$
|
17
|
|
$
|
(4
|
)
|
$
|
—
|
|
(4
|
)
|
||||||
|
Collateral adjustments
|
—
|
|
||||||||||||||||||
|
MTM at December 31, 2012
|
$
|
(4
|
)
|
|||||||||||||||||
44
Item 7A.
Quantitative and Qualitative Disclosures About Market Risk
Market Price Risk
DTE Energy has commodity price risk in both utility and non-utility businesses arising from market price fluctuations.
The Electric and Gas businesses have risks in conjunction with the anticipated purchases of coal, natural gas, uranium, electricity, and base metals to meet their service obligations. However, the Company does not bear significant exposure to earnings risk as such changes are included in the PSCR and GCR regulatory rate-recovery mechanisms. In addition, changes in the price of natural gas can impact the valuation of lost and stolen gas, storage sales revenue and uncollectible expenses at the Gas segment. Gas segment manages its market price risk related to storage sales revenue primarily through the sale of long-term storage contracts. The Company is exposed to short-term cash flow or liquidity risk as a result of the time differential between actual cash settlements and regulatory rate recovery.
Our Gas Storage and Pipelines business segment has exposure to natural gas price fluctuations which impact the pricing for natural gas storage and transportation. The Company manages its exposure through the use of short, medium and long-term storage and transportation contracts.
Our Power and Industrial Projects business segment is subject to electricity and natural gas product price risk. To the extent that commodity price risk has not been mitigated through the use of long-term contracts, we manage this exposure using forward energy, capacity and futures contracts.
Our Energy Trading business segment has exposure to electricity, natural gas, coal, crude oil, heating oil, and foreign currency exchange price fluctuations. These risks are managed by our energy marketing and trading operations through the use of forward energy, capacity, storage, options and futures contracts, within pre-determined risk parameters.
Credit Risk
Bankruptcies
The Company purchases and sells electricity, gas, coal, coke and other energy products from and to governmental entities and numerous companies operating in the steel, automotive, energy, retail, financial and other industries. Certain of its customers have filed for bankruptcy protection under Chapter 11 of the U.S. Bankruptcy Code. The Company regularly reviews contingent matters relating to these customers and its purchase and sale contracts and records provisions for amounts considered at risk of probable loss. The Company believes its accrued amounts are adequate for probable loss. The final resolution of these matters may have a material effect on the consolidated financial statements.
Other
We engage in business with customers that are non-investment grade. We closely monitor the credit ratings of these customers and, when deemed necessary, we request collateral or guarantees from such customers to secure their obligations.
45
Trading Activities
We are exposed to credit risk through trading activities. Credit risk is the potential loss that may result if our trading counterparties fail to meet their contractual obligations. We utilize both external and internal credit assessments when determining the credit quality of our trading counterparties. The following table displays the credit quality of our trading counterparties as of December 31, 2012:
|
Credit Exposure
Before Cash
Collateral
|
Cash
Collateral
|
Net Credit
Exposure
|
|||||||||
|
(In millions)
|
|||||||||||
|
Investment Grade (a)
|
|||||||||||
|
A− and Greater
|
$
|
88
|
|
$
|
—
|
|
$
|
88
|
|
||
|
BBB+ and BBB
|
259
|
|
—
|
|
259
|
|
|||||
|
BBB−
|
84
|
|
—
|
|
84
|
|
|||||
|
Total Investment Grade
|
431
|
|
—
|
|
431
|
|
|||||
|
Non-investment grade (b)
|
2
|
|
—
|
|
2
|
|
|||||
|
Internally Rated — investment grade (c)
|
147
|
|
(3
|
)
|
144
|
|
|||||
|
Internally Rated — non-investment grade (d)
|
26
|
|
(1
|
)
|
25
|
|
|||||
|
Total
|
$
|
606
|
|
$
|
(4
|
)
|
$
|
602
|
|
||
_______________________________________
|
(a)
|
This category includes counterparties with minimum credit ratings of Baa3 assigned by Moody’s Investors Service (Moody’s) and BBB- assigned by Standard & Poor’s Rating Group (Standard & Poor’s). The five largest counterparty exposures combined for this category represented approximately 39 percent of the total gross credit exposure.
|
|
(b)
|
This category includes counterparties with credit ratings that are below investment grade. The five largest counterparty exposures combined for this category represented less than one percent of the total gross credit exposure.
|
|
(c)
|
This category includes counterparties that have not been rated by Moody’s or Standard & Poor’s, but are considered investment grade based on DTE Energy’s evaluation of the counterparty’s creditworthiness. The five largest counterparty exposures combined for this category represented approximately 16 percent of the total gross credit exposure.
|
|
(d)
|
This category includes counterparties that have not been rated by Moody’s or Standard & Poor’s, and are considered non-investment grade based on DTE Energy’s evaluation of the counterparty’s creditworthiness. The five largest counterparty exposures combined for this category represented approximately three percent of the total gross credit exposure.
|
Interest Rate Risk
We are subject to interest rate risk in connection with the issuance of debt and preferred securities. In order to manage interest costs, we may use treasury locks and interest rate swap agreements. Our exposure to interest rate risk arises primarily from changes in U.S. Treasury rates, commercial paper rates and London Inter-Bank Offered Rates (LIBOR). As of December 31, 2012, we had a floating rate debt-to-total debt ratio of approximately 7 percent (excluding securitized debt).
Foreign Currency Exchange Risk
We have foreign currency exchange risk arising from market price fluctuations associated with fixed priced contracts. These contracts are denominated in Canadian dollars and are primarily for the purchase and sale of gas and power as well as for long-term transportation capacity. To limit our exposure to foreign currency exchange fluctuations, we have entered into a series of foreign currency exchange forward contracts through July 2016.
Summary of Sensitivity Analysis
We performed a sensitivity analysis on the fair values of our commodity contracts, long-term debt obligations and foreign currency exchange forward contracts. The commodity contracts and foreign currency exchange risk listed below principally relate to our energy marketing and trading activities. The sensitivity analysis involved increasing and decreasing forward rates at December 31, 2012 and 2011 by a hypothetical 10% and calculating the resulting change in the fair values.
46
The results of the sensitivity analysis calculations as of December 31, 2012 and 2011:
|
Assuming a
10% Increase in Rates
|
Assuming a
10% Decrease in Rates
|
||||||||||||||||
|
As of December 31,
|
As of December 31,
|
||||||||||||||||
|
Activity
|
2012
|
2011
|
2012
|
2011
|
Change in the Fair Value of
|
||||||||||||
|
(In millions)
|
|||||||||||||||||
|
Coal contracts
|
$
|
2
|
|
$
|
(2
|
)
|
$
|
(1
|
)
|
$
|
2
|
|
Commodity contracts
|
||||
|
Gas contracts
|
$
|
(4
|
)
|
$
|
(9
|
)
|
$
|
3
|
|
$
|
13
|
|
Commodity contracts
|
||||
|
Power contracts
|
$
|
4
|
|
$
|
4
|
|
$
|
(5
|
)
|
$
|
(6
|
)
|
Commodity contracts
|
||||
|
Interest rate risk
|
$
|
(247
|
)
|
$
|
(260
|
)
|
$
|
260
|
|
$
|
276
|
|
Long-term debt
|
||||
|
Foreign currency exchange risk
|
$
|
—
|
|
$
|
—
|
|
$
|
—
|
|
$
|
—
|
|
Forward contracts
|
||||
|
Discount rates
|
$
|
—
|
|
$
|
—
|
|
$
|
—
|
|
$
|
—
|
|
Commodity contracts
|
||||
For further discussion of market risk, see Note 4 of the Notes to Consolidated Financial Statements in Item 8 of this Report.
47
Item 8.
Financial Statements and Supplementary Data
The following consolidated financial statements and financial statement schedule are included herein.
|
Page
|
|
|
Financial Statement Schedule
|
|
48
Controls and Procedures
|
(a)
|
Evaluation of disclosure controls and procedures
|
Management of the Company carried out an evaluation, under the supervision and with the participation of DTE Energy’s Chief Executive Officer (CEO) and Chief Financial Officer (CFO), of the effectiveness of the design and operation of the Company’s disclosure controls and procedures (as defined in Exchange Act Rules 13a-15(e) and 15d-15(e)) as of
December 31, 2012
, which is the end of the period covered by this report. Based on this evaluation, the Company’s CEO and CFO have concluded that such disclosure controls and procedures are effective in providing reasonable assurance that information required to be disclosed by the Company in reports that it files or submits under the Exchange Act (i) is recorded, processed, summarized and reported within the time periods specified in the SEC’s rules and forms and (ii) is accumulated and communicated to the Company’s management, including its CEO and CFO, as appropriate to allow timely decisions regarding required disclosure. Due to the inherent limitations in the effectiveness of any disclosure controls and procedures, management cannot provide absolute assurance that the objectives of its disclosure controls and procedures will be attained.
|
(b)
|
Management’s report on internal control over financial reporting
|
Management of the Company is responsible for establishing and maintaining adequate internal control over financial reporting as such term is defined in Exchange Act Rules 13a-15(f) and 15d-15(f). Internal control over financial reporting is a process designed by, or under the supervision of, our CEO and CFO, to provide reasonable assurance regarding the reliability of financial reporting and the preparation of financial statements for external purposes in accordance with generally accepted accounting principles.
Because of its inherent limitations, internal control over financial reporting may not prevent or detect misstatements. Also, projections of any evaluation of effectiveness to future periods are subject to the risk that controls may become inadequate because of changes in conditions, or that the degree of compliance with the policies or procedures may deteriorate.
Management of the Company has assessed the effectiveness of the Company’s internal control over financial reporting as of
December 31, 2012
. In making this assessment, management used the criteria set forth by the Committee of Sponsoring Organizations of the Treadway Commission (COSO) in
Internal Control — Integrated Framework.
Based on this assessment, management concluded that, as of
December 31, 2012
, the Company’s internal control over financial reporting was effective based on those criteria.
The effectiveness of the Company’s internal control over financial reporting as of
December 31, 2012
has been audited by PricewaterhouseCoopers LLP, an independent registered public accounting firm who also audited the Company’s financial statements, as stated in their report which appears herein.
|
(c)
|
Changes in internal control over financial reporting
|
There have been no changes in the Company’s internal control over financial reporting during the quarter ended
December 31, 2012
that have materially affected, or are reasonably likely to materially affect, the Company’s internal control over financial reporting.
49
REPORT OF INDEPENDENT REGISTERED PUBLIC ACCOUNTING FIRM
To the Board of Directors and Shareholders of
DTE Energy Company
In our opinion, the consolidated financial statements listed in the accompanying index present fairly, in all material respects, the financial position of DTE Energy Company and its subsidiaries at December 31, 2012 and 2011, and the results of their operations and their cash flows for each of the three years in the period ended December 31, 2012 in conformity with accounting principles generally accepted in the United States of America. In addition, in our opinion, the financial statement schedule listed in the accompanying index
presents fairly, in all material respects, the information set forth therein when read in conjunction with the related consolidated financial statements. Also in our opinion, the Company maintained, in all material respects, effective internal control over financial reporting as of December 31, 2012, based on criteria established in
Internal Control - Integrated Framework
issued by the Committee of Sponsoring Organizations of the Treadway Commission (COSO). The Company's management is responsible for these financial statements and financial statement schedule, for maintaining effective internal control over financial reporting and for its assessment of the effectiveness of internal control over financial reporting, included in the accompanying Management's report on internal control over financial reporting. Our responsibility is to express opinions on these financial statements, on the financial statement schedule, and on the Company's internal control over financial reporting based on our integrated audits. We conducted our audits in accordance with the standards of the Public Company Accounting Oversight Board (United States). Those standards require that we plan and perform the audits to obtain reasonable assurance about whether the financial statements are free of material misstatement and whether effective internal control over financial reporting was maintained in all material respects. Our audits of the financial statements included examining, on a test basis, evidence supporting the amounts and disclosures in the financial statements, assessing the accounting principles used and significant estimates made by management, and evaluating the overall financial statement presentation. Our audit of internal control over financial reporting included obtaining an understanding of internal control over financial reporting, assessing the risk that a material weakness exists, and testing and evaluating the design and operating effectiveness of internal control based on the assessed risk. Our audits also included performing such other procedures as we considered necessary in the circumstances. We believe that our audits provide a reasonable basis for our opinions.
A company's internal control over financial reporting is a process designed to provide reasonable assurance regarding the reliability of financial reporting and the preparation of financial statements for external purposes in accordance with generally accepted accounting principles. A company's internal control over financial reporting includes those policies and procedures that (i) pertain to the maintenance of records that, in reasonable detail, accurately and fairly reflect the transactions and dispositions of the assets of the company; (ii) provide reasonable assurance that transactions are recorded as necessary to permit preparation of financial statements in accordance with generally accepted accounting principles, and that receipts and expenditures of the company are being made only in accordance with authorizations of management and directors of the company; and (iii) provide reasonable assurance regarding prevention or timely detection of unauthorized acquisition, use, or disposition of the company's assets that could have a material effect on the financial statements.
Because of its inherent limitations, internal control over financial reporting may not prevent or detect misstatements. Also, projections of any evaluation of effectiveness to future periods are subject to the risk that controls may become inadequate because of changes in conditions, or that the degree of compliance with the policies or procedures may deteriorate.
/s/ PricewaterhouseCoopers LLP
Detroit, Michigan
February 20, 2013
50
DTE Energy Company
|
|
Year Ended December 31
|
||||||||||
|
|
2012
|
2011
|
2010
|
||||||||
|
|
(In millions, except per share amounts)
|
||||||||||
|
Operating Revenues
|
$
|
8,791
|
|
$
|
8,858
|
|
$
|
8,525
|
|
||
|
Operating Expenses
|
|
|
|
|
|
|
|||||
|
Fuel, purchased power and gas
|
3,296
|
|
3,537
|
|
3,190
|
|
|||||
|
Operation and maintenance
|
2,892
|
|
2,612
|
|
2,567
|
|
|||||
|
Depreciation, depletion and amortization
|
995
|
|
977
|
|
1,012
|
|
|||||
|
Taxes other than income
|
332
|
|
310
|
|
306
|
|
|||||
|
Other asset (gains) and losses, reserves and impairments, net
|
(3
|
)
|
1
|
|
(20
|
)
|
|||||
|
|
7,512
|
|
7,437
|
|
7,055
|
|
|||||
|
Operating Income
|
1,279
|
|
1,421
|
|
1,470
|
|
|||||
|
Other (Income) and Deductions
|
|
|
|
|
|
|
|||||
|
Interest expense
|
440
|
|
488
|
|
543
|
|
|||||
|
Interest income
|
(10
|
)
|
(10
|
)
|
(12
|
)
|
|||||
|
Other income
|
(173
|
)
|
(117
|
)
|
(78
|
)
|
|||||
|
Other expenses
|
62
|
|
69
|
|
55
|
|
|||||
|
|
319
|
|
430
|
|
508
|
|
|||||
|
Income Before Income Taxes
|
960
|
|
991
|
|
962
|
|
|||||
|
Income Tax Expense
|
286
|
|
268
|
|
315
|
|
|||||
|
Income from Continuing Operations
|
674
|
|
723
|
|
647
|
|
|||||
|
Loss from Discontinued Operations, net of tax
|
(56
|
)
|
(3
|
)
|
(8
|
)
|
|||||
|
Net Income
|
618
|
|
720
|
|
639
|
|
|||||
|
Less: Net Income Attributable to Noncontrolling Interest
|
8
|
|
9
|
|
9
|
|
|||||
|
Net Income Attributable to DTE Energy Company
|
$
|
610
|
|
$
|
711
|
|
$
|
630
|
|
||
|
Basic Earnings per Common Share
|
|||||||||||
|
Income from continuing operations
|
$
|
3.89
|
|
$
|
4.21
|
|
$
|
3.79
|
|
||
|
Loss from discontinued operations, net of tax
|
(0.33
|
)
|
(0.02
|
)
|
(0.04
|
)
|
|||||
|
Total
|
$
|
3.56
|
|
$
|
4.19
|
|
$
|
3.75
|
|
||
|
Diluted Earnings per Common Share
|
|||||||||||
|
Income from continuing operations
|
$
|
3.88
|
|
$
|
4.20
|
|
$
|
3.78
|
|
||
|
Loss from discontinued operations, net of tax
|
(0.33
|
)
|
(0.02
|
)
|
(0.04
|
)
|
|||||
|
Total
|
$
|
3.55
|
|
$
|
4.18
|
|
$
|
3.74
|
|
||
|
Weighted Average Common Shares Outstanding
|
|
|
|
|
|
|
|||||
|
Basic
|
171
|
|
169
|
|
168
|
|
|||||
|
Diluted
|
172
|
|
170
|
|
169
|
|
|||||
|
Dividends Declared per Common Share
|
$
|
2.42
|
|
$
|
2.32
|
|
$
|
2.18
|
|
||
See Notes to Consolidated Financial Statements
51
DTE Energy Company
Consolidated Statements of Comprehensive Income
|
2012
|
2011
|
2010
|
|||||||||
|
(In millions)
|
|||||||||||
|
Net income
|
$
|
618
|
|
$
|
720
|
|
$
|
639
|
|
||
|
Other comprehensive income (loss), net of tax:
|
|||||||||||
|
Benefit obligations:
|
|||||||||||
|
Benefit obligations, net of taxes of $(1), $(5) and $3
|
(2
|
)
|
(9
|
)
|
5
|
|
|||||
|
Amounts reclassified to benefit obligations related to consolidation of VIEs (Note 1), net of taxes of $—, $— and $5
|
—
|
|
—
|
|
10
|
|
|||||
|
(2
|
)
|
(9
|
)
|
15
|
|
||||||
|
Net unrealized gains on derivatives:
|
|||||||||||
|
Gains during the period, net of taxes of $—, $— and $1
|
—
|
|
—
|
|
1
|
|
|||||
|
Amounts reclassified to income, net of taxes of $—, $— and $1
|
—
|
|
—
|
|
1
|
|
|||||
|
—
|
|
—
|
|
2
|
|
||||||
|
Net unrealized gains (losses) on investments:
|
|||||||||||
|
Gains (losses) during the period, net of taxes of $1, $— and $(6)
|
1
|
|
—
|
|
(10
|
)
|
|||||
|
Amounts reclassified to benefit obligations related to consolidation of VIEs (Note 1), net of taxes of $—, $— and $(5)
|
—
|
|
—
|
|
(10
|
)
|
|||||
|
1
|
|
—
|
|
(20
|
)
|
||||||
|
Foreign currency translation, net of taxes of $—, $— and $—
|
1
|
|
—
|
|
1
|
|
|||||
|
Other comprehensive income
|
—
|
|
(9
|
)
|
(2
|
)
|
|||||
|
Comprehensive income
|
618
|
|
711
|
|
637
|
|
|||||
|
Less comprehensive income attributable to noncontrolling interests
|
8
|
|
9
|
|
9
|
|
|||||
|
Comprehensive income attributable to DTE Energy Company
|
$
|
610
|
|
$
|
702
|
|
$
|
628
|
|
||
See Notes to Consolidated Financial Statements
52
DTE Energy Company
|
December 31
|
|||||||
|
2012
|
2011
|
||||||
|
(In millions)
|
|||||||
|
ASSETS
|
|||||||
|
Current Assets
|
|||||||
|
Cash and cash equivalents
|
$
|
65
|
|
$
|
68
|
|
|
|
Restricted cash, principally Securitization
|
122
|
|
147
|
|
|||
|
Accounts receivable (less allowance for doubtful accounts of $62 and $162, respectively)
|
|||||||
|
Customer
|
1,336
|
|
1,317
|
|
|||
|
Other
|
126
|
|
90
|
|
|||
|
Inventories
|
|||||||
|
Fuel and gas
|
527
|
|
572
|
|
|||
|
Materials and supplies
|
234
|
|
219
|
|
|||
|
Deferred income taxes
|
21
|
|
51
|
|
|||
|
Derivative assets
|
108
|
|
222
|
|
|||
|
Regulatory assets
|
182
|
|
314
|
|
|||
|
Other
|
194
|
|
196
|
|
|||
|
2,915
|
|
3,196
|
|
||||
|
Investments
|
|||||||
|
Nuclear decommissioning trust funds
|
1,037
|
|
937
|
|
|||
|
Other
|
554
|
|
525
|
|
|||
|
1,591
|
|
1,462
|
|
||||
|
Property
|
|||||||
|
Property, plant and equipment
|
23,631
|
|
22,541
|
|
|||
|
Less accumulated depreciation, depletion and amortization
|
(8,947
|
)
|
(8,795
|
)
|
|||
|
14,684
|
|
13,746
|
|
||||
|
Other Assets
|
|||||||
|
Goodwill
|
2,018
|
|
2,020
|
|
|||
|
Regulatory assets
|
4,235
|
|
4,539
|
|
|||
|
Securitized regulatory assets
|
413
|
|
577
|
|
|||
|
Intangible assets
|
135
|
|
73
|
|
|||
|
Notes receivable
|
112
|
|
123
|
|
|||
|
Derivative assets
|
39
|
|
74
|
|
|||
|
Other
|
197
|
|
199
|
|
|||
|
7,149
|
|
7,605
|
|
||||
|
Total Assets
|
$
|
26,339
|
|
$
|
26,009
|
|
|
See Notes to Consolidated Financial Statements
53
DTE Energy Company
Consolidated Statements of Financial Position — (Continued)
|
December 31
|
|||||||
|
2012
|
2011
|
||||||
|
(In millions, except shares)
|
|||||||
|
LIABILITIES AND EQUITY
|
|||||||
|
Current Liabilities
|
|||||||
|
Accounts payable
|
$
|
848
|
|
$
|
782
|
|
|
|
Accrued interest
|
93
|
|
95
|
|
|||
|
Dividends payable
|
107
|
|
99
|
|
|||
|
Short-term borrowings
|
240
|
|
419
|
|
|||
|
Current portion long-term debt, including capital leases
|
817
|
|
526
|
|
|||
|
Derivative liabilities
|
125
|
|
158
|
|
|||
|
Other
|
538
|
|
549
|
|
|||
|
2,768
|
|
2,628
|
|
||||
|
Long-Term Debt (net of current portion)
|
|||||||
|
Mortgage bonds, notes and other
|
6,220
|
|
6,405
|
|
|||
|
Securitization bonds
|
302
|
|
479
|
|
|||
|
Junior subordinated debentures
|
480
|
|
280
|
|
|||
|
Capital lease obligations
|
12
|
|
23
|
|
|||
|
7,014
|
|
7,187
|
|
||||
|
Other Liabilities
|
|
|
|
|
|||
|
Deferred income taxes
|
3,191
|
|
3,116
|
|
|||
|
Regulatory liabilities
|
1,031
|
|
1,019
|
|
|||
|
Asset retirement obligations
|
1,719
|
|
1,591
|
|
|||
|
Unamortized investment tax credit
|
56
|
|
65
|
|
|||
|
Derivative liabilities
|
26
|
|
89
|
|
|||
|
Accrued pension liability
|
1,498
|
|
1,298
|
|
|||
|
Accrued postretirement liability
|
1,160
|
|
1,484
|
|
|||
|
Nuclear decommissioning
|
159
|
|
148
|
|
|||
|
Other
|
306
|
|
331
|
|
|||
|
9,146
|
|
9,141
|
|
||||
|
Commitments and Contingencies (Notes 11 and 19)
|
|||||||
|
Equity
|
|||||||
|
Common stock, without par value, 400,000,000 shares authorized, 172,351,680 and 169,247,282 shares issued and outstanding, respectively
|
3,587
|
|
3,417
|
|
|||
|
Retained earnings
|
3,944
|
|
3,750
|
|
|||
|
Accumulated other comprehensive loss
|
(158
|
)
|
(158
|
)
|
|||
|
Total DTE Energy Company Equity
|
7,373
|
|
7,009
|
|
|||
|
Noncontrolling interests
|
38
|
|
44
|
|
|||
|
Total Equity
|
7,411
|
|
7,053
|
|
|||
|
Total Liabilities and Equity
|
$
|
26,339
|
|
$
|
26,009
|
|
|
See Notes to Consolidated Financial Statements
54
DTE Energy Company
|
Year Ended December 31
|
|||||||||||
|
2012
|
2011
|
2010
|
|||||||||
|
(In millions)
|
|||||||||||
|
Operating Activities
|
|||||||||||
|
Net income
|
$
|
618
|
|
$
|
720
|
|
$
|
639
|
|
||
|
Adjustments to reconcile net income to net cash from operating activities:
|
|||||||||||
|
Depreciation, depletion and amortization
|
1,018
|
|
995
|
|
1,027
|
|
|||||
|
Deferred income taxes
|
47
|
|
220
|
|
457
|
|
|||||
|
Loss on sale of non-utility business
|
83
|
|
—
|
|
—
|
|
|||||
|
Asset (gains) and losses, reserves and impairments, net
|
1
|
|
(21
|
)
|
(5
|
)
|
|||||
|
Changes in assets and liabilities, exclusive of changes shown separately (Note 22)
|
442
|
|
94
|
|
(293
|
)
|
|||||
|
Net cash from operating activities
|
2,209
|
|
2,008
|
|
1,825
|
|
|||||
|
Investing Activities
|
|||||||||||
|
Plant and equipment expenditures — utility
|
(1,451
|
)
|
(1,382
|
)
|
(1,011
|
)
|
|||||
|
Plant and equipment expenditures — non-utility
|
(369
|
)
|
(102
|
)
|
(88
|
)
|
|||||
|
Proceeds from sale of non-utility business
|
255
|
|
—
|
|
—
|
|
|||||
|
Proceeds from sale of assets
|
38
|
|
18
|
|
56
|
|
|||||
|
Restricted cash for debt redemption, principally Securitization
|
2
|
|
(5
|
)
|
(32
|
)
|
|||||
|
Acquisition, net of cash acquired
|
(198
|
)
|
—
|
|
—
|
|
|||||
|
Proceeds from sale of nuclear decommissioning trust fund assets
|
97
|
|
80
|
|
377
|
|
|||||
|
Investment in nuclear decommissioning trust funds
|
(102
|
)
|
(97
|
)
|
(410
|
)
|
|||||
|
Consolidation of VIEs
|
—
|
|
—
|
|
19
|
|
|||||
|
Investment in Millennium Pipeline Project
|
—
|
|
(3
|
)
|
(49
|
)
|
|||||
|
Other
|
(41
|
)
|
(69
|
)
|
(88
|
)
|
|||||
|
Net cash used for investing activities
|
(1,769
|
)
|
(1,560
|
)
|
(1,226
|
)
|
|||||
|
Financing Activities
|
|||||||||||
|
Issuance of long-term debt
|
759
|
|
1,179
|
|
614
|
|
|||||
|
Redemption of long-term debt
|
(639
|
)
|
(1,455
|
)
|
(663
|
)
|
|||||
|
Short-term borrowings, net
|
(179
|
)
|
269
|
|
(177
|
)
|
|||||
|
Issuance of common stock
|
39
|
|
—
|
|
36
|
|
|||||
|
Repurchase of common stock
|
—
|
|
(18
|
)
|
—
|
|
|||||
|
Dividends on common stock
|
(407
|
)
|
(389
|
)
|
(360
|
)
|
|||||
|
Other
|
(16
|
)
|
(31
|
)
|
(36
|
)
|
|||||
|
Net cash used for financing activities
|
(443
|
)
|
(445
|
)
|
(586
|
)
|
|||||
|
Net Increase (Decrease) in Cash and Cash Equivalents
|
(3
|
)
|
3
|
|
13
|
|
|||||
|
Cash and Cash Equivalents at Beginning of Period
|
68
|
|
65
|
|
52
|
|
|||||
|
Cash and Cash Equivalents at End of Period
|
$
|
65
|
|
$
|
68
|
|
$
|
65
|
|
||
See Notes to Consolidated Financial Statements
55
DTE Energy Company
Consolidated Statements of Changes in Equity
|
Accumulated
Other Comprehensive Loss
|
Non-Controlling Interest
|
|||||||||||||||||||||
|
Common Stock
|
Retained Earnings
|
|||||||||||||||||||||
|
Shares
|
Amount
|
Total
|
||||||||||||||||||||
|
(Dollars in millions, shares in thousands)
|
||||||||||||||||||||||
|
Balance, December 31, 2009
|
165,400
|
|
$
|
3,257
|
|
$
|
3,168
|
|
$
|
(147
|
)
|
$
|
38
|
|
$
|
6,316
|
|
|||||
|
Net income
|
—
|
|
—
|
|
630
|
|
—
|
|
9
|
|
639
|
|
||||||||||
|
Dividends declared on common stock
|
—
|
|
—
|
|
(367
|
)
|
—
|
|
—
|
|
(367
|
)
|
||||||||||
|
Issuance of common stock
|
777
|
|
36
|
|
—
|
|
—
|
|
—
|
|
36
|
|
||||||||||
|
Contribution of common stock to pension plan
|
2,224
|
|
100
|
|
100
|
|
||||||||||||||||
|
Benefit obligations, net of tax
|
—
|
|
—
|
|
—
|
|
15
|
|
—
|
|
15
|
|
||||||||||
|
Foreign currency translation, net of tax
|
—
|
|
—
|
|
—
|
|
1
|
|
—
|
|
1
|
|
||||||||||
|
Net change in unrealized losses on derivatives, net of tax
|
—
|
|
—
|
|
—
|
|
2
|
|
—
|
|
2
|
|
||||||||||
|
Net change in unrealized losses on investments, net of tax
|
—
|
|
—
|
|
—
|
|
(20
|
)
|
—
|
|
(20
|
)
|
||||||||||
|
Stock-based compensation, distributions to noncontrolling interests and other
|
1,027
|
|
47
|
|
—
|
|
—
|
|
(2
|
)
|
45
|
|
||||||||||
|
Balance, December 31, 2010
|
169,428
|
|
$
|
3,440
|
|
$
|
3,431
|
|
$
|
(149
|
)
|
$
|
45
|
|
$
|
6,767
|
|
|||||
|
Net Income
|
—
|
|
—
|
|
711
|
|
—
|
|
9
|
|
720
|
|
||||||||||
|
Dividends declared on common stock
|
—
|
|
—
|
|
(392
|
)
|
—
|
|
—
|
|
(392
|
)
|
||||||||||
|
Repurchase of common stock
|
(1,184
|
)
|
(58
|
)
|
—
|
|
—
|
|
—
|
|
(58
|
)
|
||||||||||
|
Benefit obligations, net of tax
|
—
|
|
—
|
|
—
|
|
(9
|
)
|
—
|
|
(9
|
)
|
||||||||||
|
Stock-based compensation, distributions to noncontrolling interests and other
|
1,003
|
|
35
|
|
—
|
|
—
|
|
(10
|
)
|
25
|
|
||||||||||
|
Balance, December 31, 2011
|
169,247
|
|
$
|
3,417
|
|
$
|
3,750
|
|
$
|
(158
|
)
|
$
|
44
|
|
$
|
7,053
|
|
|||||
|
Net Income
|
—
|
|
—
|
|
610
|
|
—
|
|
8
|
|
618
|
|
||||||||||
|
Dividends declared on common stock
|
—
|
|
—
|
|
(414
|
)
|
—
|
|
—
|
|
(414
|
)
|
||||||||||
|
Issuance of common stock
|
684
|
|
39
|
|
—
|
|
—
|
|
—
|
|
39
|
|
||||||||||
|
Contribution of common stock to pension plan
|
1,335
|
|
80
|
|
—
|
|
—
|
|
—
|
|
80
|
|
||||||||||
|
Foreign currency translation, net of tax
|
—
|
|
—
|
|
—
|
|
1
|
|
—
|
|
1
|
|
||||||||||
|
Benefit obligations, net of tax
|
—
|
|
—
|
|
—
|
|
(2
|
)
|
—
|
|
(2
|
)
|
||||||||||
|
Net change in unrealized losses on investments, net of tax
|
—
|
|
—
|
|
—
|
|
1
|
|
—
|
|
1
|
|
||||||||||
|
Stock-based compensation, distributions to noncontrolling interests and other
|
1,086
|
|
51
|
|
(2
|
)
|
—
|
|
(14
|
)
|
35
|
|
||||||||||
|
Balance, December 31, 2012
|
172,352
|
|
$
|
3,587
|
|
$
|
3,944
|
|
$
|
(158
|
)
|
$
|
38
|
|
$
|
7,411
|
|
|||||
See Notes to Consolidated Financial Statements
56
DTE Energy Company
Notes to Consolidated Financial Statements
Corporate Structure
DTE Energy owns the following businesses:
|
•
|
DTE Electric, an electric utility engaged in the generation, purchase, distribution and sale of electricity to approximately
2.1 million
customers in southeastern Michigan;
|
|
•
|
DTE Gas, a natural gas utility engaged in the purchase, storage, transportation, distribution and sale of natural gas to approximately
1.2 million
customers throughout Michigan and the sale of storage and transportation capacity; and
|
|
•
|
Other businesses involved in 1) natural gas pipelines, gathering and storage; 2) power and industrial projects; and 3) energy marketing and trading operations.
|
DTE Electric and DTE Gas are regulated by the MPSC. Certain activities of DTE Electric and DTE Gas, as well as various other aspects of businesses under DTE Energy are regulated by the FERC. In addition, the Company is regulated by other federal and state regulatory agencies including the NRC, the EPA and the MDEQ.
References in this Report to “Company” or “DTE” are to DTE Energy and its subsidiaries, collectively.
Basis of Presentation
The accompanying Consolidated Financial Statements are prepared using accounting principles generally accepted in the United States of America. These accounting principles require management to use estimates and assumptions that impact reported amounts of assets, liabilities, revenues and expenses, and the disclosure of contingent assets and liabilities. Actual results may differ from the Company’s estimates.
Certain prior year balances were reclassified to match the current year’s financial statement presentation.
Principles of Consolidation
The Company consolidates all majority-owned subsidiaries and investments in entities in which it has controlling influence. Non-majority owned investments are accounted for using the equity method when the Company is able to influence the operating policies of the investee. Non-majority owned investments include investments in limited liability companies, partnerships or joint ventures. When the Company does not influence the operating policies of an investee, the cost method is used. These consolidated financial statements also reflect the Company's proportionate interests in certain jointly owned utility plant. The Company eliminates all intercompany balances and transactions.
The Company evaluates whether an entity is a VIE whenever reconsideration events occur. The Company consolidates VIEs for which it is the primary beneficiary. If the Company is not the primary beneficiary and an ownership interest is held, the VIE is accounted for under the equity method of accounting. When assessing the determination of the primary beneficiary, the Company considers all relevant facts and circumstances, including: the power, through voting or similar rights, to direct the activities of the VIE that most significantly impact the VIE's economic performance and the obligation to absorb the expected losses and/or the right to receive the expected returns of the VIE. The Company performs ongoing reassessments of all VIEs to determine if the primary beneficiary status has changed.
Legal entities within the Company's Power and Industrial Projects segment enter into long-term contractual arrangements with customers to supply energy-related products or services, which includes arrangements related to entities acquired in 2012. See Note 6. The entities are generally designed to pass-through the commodity risk associated with these contracts to the customers, with the Company retaining operational and customer default risk. These entities generally are VIEs. In addition, the Company has interests in certain VIEs that we share control of all significant activities for those entities with our partners, and therefore are accounted for under the equity method.
57
The Company has variable interests in VIEs through certain of its long-term purchase contracts. As of December 31, 2012, the carrying amount of assets and liabilities in the Consolidated Statements of Financial Position that relate to its variable interests under long-term purchase contracts are predominately related to working capital accounts and generally represent the amounts owed by the Company for the deliveries associated with the current billing cycle under the contracts. The Company has not provided any form of financial support associated with these long-term contracts. There is
no
significant potential exposure to loss as a result of its variable interests through these long-term purchase contracts.
In 2001, DTE Electric financed a regulatory asset related to Fermi 2 and certain other regulatory assets through the sale of rate reduction bonds by a wholly-owned special purpose entity, Securitization. DTE Electric performs servicing activities including billing and collecting surcharge revenue for Securitization. This entity is a VIE, and is consolidated by the Company.
The maximum risk exposure for consolidated VIEs is reflected on the Company's Consolidated Statements of Financial Position. For non-consolidated VIEs, the maximum risk exposure is generally limited to its investment and amounts which it has guaranteed.
The following table summarizes the major balance sheet items for consolidated VIEs as of December 31, 2012 and December 31, 2011. Amounts at December 31, 2012 and December 31, 2011 for consolidated VIEs that are either (1) assets that can be used only to settle obligations of the VIE or (2) liabilities for which creditors do not have recourse to the general credit of the primary beneficiary are segregated in the restricted amounts column. VIEs, in which the Company holds a majority voting interest and is the primary beneficiary, that meet the definition of a business and whose assets can be used for purposes other than the settlement of the VIE's obligations have been excluded from the table below.
|
December 31, 2012
|
December 31, 2011
|
||||||||||||||||||||||||||||||
|
Securitization
|
Other
|
Total
|
Restricted
Amounts
|
Securitization
|
Other
|
Total
|
Restricted
Amounts
|
||||||||||||||||||||||||
|
(In millions)
|
|||||||||||||||||||||||||||||||
|
ASSETS
|
|||||||||||||||||||||||||||||||
|
Cash and cash equivalents
|
$
|
—
|
|
$
|
10
|
|
$
|
10
|
|
$
|
8
|
|
$
|
—
|
|
$
|
25
|
|
$
|
25
|
|
$
|
—
|
|
|||||||
|
Restricted cash
|
102
|
|
7
|
|
109
|
|
109
|
|
107
|
|
7
|
|
114
|
|
114
|
|
|||||||||||||||
|
Accounts receivable
|
34
|
|
7
|
|
41
|
|
38
|
|
34
|
|
17
|
|
51
|
|
36
|
|
|||||||||||||||
|
Inventories
|
—
|
|
141
|
|
141
|
|
3
|
|
—
|
|
183
|
|
183
|
|
—
|
|
|||||||||||||||
|
Other current assets
|
—
|
|
1
|
|
1
|
|
1
|
|
—
|
|
1
|
|
1
|
|
—
|
|
|||||||||||||||
|
Property, plant and equipment
|
—
|
|
93
|
|
93
|
|
49
|
|
—
|
|
73
|
|
73
|
|
23
|
|
|||||||||||||||
|
Securitized regulatory assets
|
413
|
|
—
|
|
413
|
|
413
|
|
577
|
|
—
|
|
577
|
|
577
|
|
|||||||||||||||
|
Other assets
|
7
|
|
11
|
|
18
|
|
18
|
|
10
|
|
6
|
|
16
|
|
16
|
|
|||||||||||||||
|
$
|
556
|
|
$
|
270
|
|
$
|
826
|
|
$
|
639
|
|
$
|
728
|
|
$
|
312
|
|
$
|
1,040
|
|
$
|
766
|
|
||||||||
|
LIABILITIES
|
|||||||||||||||||||||||||||||||
|
Accounts payable and accrued current liabilities
|
$
|
11
|
|
$
|
14
|
|
$
|
25
|
|
$
|
12
|
|
$
|
14
|
|
$
|
24
|
|
$
|
38
|
|
$
|
14
|
|
|||||||
|
Current portion long-term debt, including capital leases
|
177
|
|
8
|
|
185
|
|
185
|
|
164
|
|
7
|
|
171
|
|
171
|
|
|||||||||||||||
|
Other current liabilities
|
50
|
|
4
|
|
54
|
|
53
|
|
55
|
|
—
|
|
55
|
|
55
|
|
|||||||||||||||
|
Mortgage bonds, notes and other
|
—
|
|
25
|
|
25
|
|
25
|
|
—
|
|
30
|
|
30
|
|
30
|
|
|||||||||||||||
|
Securitization bonds
|
302
|
|
—
|
|
302
|
|
302
|
|
479
|
|
—
|
|
479
|
|
479
|
|
|||||||||||||||
|
Capital lease obligations
|
—
|
|
11
|
|
11
|
|
11
|
|
—
|
|
14
|
|
14
|
|
14
|
|
|||||||||||||||
|
Other long-term liabilities
|
7
|
|
2
|
|
9
|
|
8
|
|
7
|
|
2
|
|
9
|
|
8
|
|
|||||||||||||||
|
$
|
547
|
|
$
|
64
|
|
$
|
611
|
|
$
|
596
|
|
$
|
719
|
|
$
|
77
|
|
$
|
796
|
|
$
|
771
|
|
||||||||
58
Amounts for non-consolidated VIEs as of
December 31, 2012
and
December 31, 2011
are as follows:
|
December 31,
2012
|
December 31,
2011
|
||||||
|
(In millions)
|
|||||||
|
Other investments
|
$
|
130
|
|
$
|
117
|
|
|
|
Notes receivable
|
6
|
|
7
|
|
|||
Revenues
Revenues from the sale and delivery of electricity, and the sale, delivery and storage of natural gas are recognized as services are provided. DTE Electric and DTE Gas record revenues for electricity and gas provided but unbilled at the end of each month. Rates for DTE Electric and DTE Gas include provisions to adjust billings for fluctuations in fuel and purchased power costs, cost of natural gas and certain other costs. Revenues are adjusted for differences between actual costs subject to reconciliation and the amounts billed in current rates. Under or over recovered revenues related to these cost recovery mechanisms are recorded on the Consolidated Statements of Financial Position and are recovered or returned to customers through adjustments to the billing factors.
See Note 11 for further discussion of recovery mechanisms authorized by the MPSC.
Non-utility businesses recognize revenues as services are provided and products are delivered. See Note 4 for discussion of derivative contracts.
Accounting for ISO Transactions
DTE Electric participates in the energy market through MISO. MISO requires that we submit hourly day-ahead, real- time and FTR bids and offers for energy at locations across the MISO region. DTE Electric accounts for MISO transactions on a net hourly basis in each of the day-ahead, real-time and FTR markets and net transactions across all MISO energy market locations. In any single hour DTE Electric records net purchases in Fuel, purchased power and gas and net sales in Operating revenues on the Consolidated Statements of Operations. DTE Electric records net sale billing adjustments when invoices are received.
Energy Trading participates in the energy markets through various independent system operators and regional transmission organizations (ISOs and RTOs). These markets require that we submit hourly day-ahead, real-time bids and offers for energy at locations across each region. We submit bids in the annual and monthly auction revenue rights and FTR auctions to the regional transmission organizations. Energy Trading accounts for these transactions on a net hourly basis for the day-ahead, real-time and FTR markets. These transactions are related to our trading contracts which are presented on a net basis in Operating revenues in the Consolidated Statements of Income.
DTE Electric and Energy Trading record expense accruals for future net purchases adjustments based on historical experience, and reconcile accruals to actual expenses when invoices are received from MISO, the ISOs and RTOs.
Comprehensive Income
Comprehensive income is the change in common shareholders’ equity during a period from transactions and events from non-owner sources, including net income. As shown in the following table, amounts recorded to accumulated other comprehensive loss for the year ended
December 31, 2012
include unrealized gains and losses from derivatives accounted for as cash flow hedges, unrealized gains and losses on available for sale securities, the Company’s interest in comprehensive income of equity investees, changes in benefit obligations, consisting of deferred actuarial losses, prior service costs and transition amounts related to pension and other postretirement benefit plans, and foreign currency translation adjustments.
59
|
Year Ended December 31, 2012
|
|||||||||||||||||||
|
Net
Unrealized
Gain/(Loss)
on Derivatives
|
Net
Unrealized
Gain/(Loss)
on Investments
|
Benefit
Obligations
|
Foreign
Currency
Translation
|
Accumulated
Other
Comprehensive
Loss
|
|||||||||||||||
|
(In millions)
|
|||||||||||||||||||
|
Beginning balances January 1, 2012
|
$
|
(4
|
)
|
$
|
(30
|
)
|
$
|
(125
|
)
|
$
|
1
|
|
$
|
(158
|
)
|
||||
|
Current period change, net of tax
|
—
|
|
1
|
|
(2
|
)
|
1
|
|
—
|
|
|||||||||
|
Ending balances December 31, 2012
|
$
|
(4
|
)
|
$
|
(29
|
)
|
$
|
(127
|
)
|
$
|
2
|
|
$
|
(158
|
)
|
||||
Cash Equivalents and Restricted Cash
Cash and cash equivalents include cash on hand, cash in banks and temporary investments purchased with remaining maturities of
three
months or less. Restricted cash consists of funds held to satisfy requirements of certain debt, primarily Securitization bonds, and partnership operating agreements. Restricted cash designated for interest and principal payments within
one
year is classified as a current asset.
Receivables
Accounts receivable are primarily composed of trade receivables and unbilled revenue. Our accounts receivable are stated at net realizable value.
The allowance for doubtful accounts for DTE Electric and DTE Gas is generally calculated using the aging approach that utilizes rates developed in reserve studies. We establish an allowance for uncollectible accounts based on historical losses and management’s assessment of existing economic conditions, customer trends, and other factors. Customer accounts are generally considered delinquent if the amount billed is not received by the due date, which is typically in
21
days, however, factors such as assistance programs may delay aggressive action. We assess late payment fees on trade receivables based on past-due terms with customers. Customer accounts are written off when collection efforts have been exhausted. The time period for write-off was changed in 2012 from
365
days to
150
days after service has been terminated.
The customer allowance for doubtful accounts for our other businesses is calculated based on specific review of probable future collections based on receivable balances in excess of
30
days.
Unbilled revenues of $
686 million
and $
597 million
are included in customer accounts receivable at
December 31, 2012
and
2011
, respectively.
Notes Receivable
Notes receivable, or financing receivables, are primarily comprised of capital lease receivables and loans and are included in Notes receivable and Other current assets on the Company’s Consolidated Statements of Financial Position.
Notes receivable are typically considered delinquent when payment is not received for periods ranging from
60
to
120
days. The Company ceases accruing interest (nonaccrual status), considers a note receivable impaired, and establishes an allowance for credit loss when it is probable that all principal and interest amounts due will not be collected in accordance with the contractual terms of the note receivable. Cash payments received on nonaccrual status notes receivable, that do not bring the account contractually current, are first applied to contractually owed past due interest, with any remainder applied to principal. Accrual of interest is generally resumed when the note receivable becomes contractually current.
In determining the allowance for credit losses for notes receivable, we consider the historical payment experience and other factors that are expected to have a specific impact on the counterparty’s ability to pay. In addition, the Company monitors the credit ratings of the counterparties from which we have notes receivable.
Inventories
The Company generally values inventory at average cost.
60
Natural gas inventory of $
37 million
and $
52 million
as of
December 31, 2012
and
2011
, respectively, at DTE Gas is determined using the last-in, first-out (LIFO) method. At
December 31, 2012
, the replacement cost of gas remaining in storage exceeded the LIFO cost by $
113 million
. At
December 31, 2011
, the replacement cost of gas remaining in storage exceeded the LIFO cost by $
95 million
.
Property, Retirement and Maintenance, and Depreciation, Depletion and Amortization
Property is stated at cost and includes construction-related labor, materials, overheads and, for utility property, an allowance for funds used during construction (AFUDC). The cost of utility properties retired is charged to accumulated depreciation. Expenditures for maintenance and repairs are charged to expense when incurred, except for Fermi 2.
Utility property at DTE Electric and DTE Gas is depreciated over its estimated useful life using straight-line rates approved by the MPSC.
Non-utility property is depreciated over its estimated useful life using the straight-line and units of production methods.
Depreciation, depletion and amortization expense also includes the amortization of certain regulatory assets.
Approximately $
12 million
and $
23 million
of expenses related to Fermi 2 refueling outages were accrued at
December 31, 2012
and
December 31, 2011
, respectively. Amounts are accrued on a pro-rata basis, generally over an
18
-month period, that coincides with scheduled refueling outages at Fermi 2. This accrual of outage costs matches the regulatory recovery of these costs in rates set by the MPSC. See Note 11.
The cost of nuclear fuel is capitalized. The amortization of nuclear fuel is included within Fuel, purchased power, and gas in the Consolidated Statements of Operations and is recorded using the units-of-production method.
Long-Lived Assets
Long-lived assets are reviewed for impairment whenever events or changes in circumstances indicate the carrying amount of an asset may not be recoverable. If the carrying amount of the asset exceeds the expected discounted future cash flows generated by the asset, an impairment loss is recognized resulting in the asset being written down to its estimated fair value. Assets to be disposed of are reported at the lower of the carrying amount or fair value, less costs to sell.
Intangible Assets
The Company has certain intangible assets relating to emission allowances, renewable energy credits and non-utility contracts. Summary of intangible assets as of December 31, 2012 and 2011:
|
2012
|
2011
|
||||||
|
(In millions)
|
|||||||
|
Emission allowances
|
$
|
6
|
|
$
|
10
|
|
|
|
Renewable energy credits
|
44
|
|
39
|
|
|||
|
Contract intangible assets
|
139
|
|
65
|
|
|||
|
189
|
|
114
|
|
||||
|
Less accumulated amortization
|
34
|
|
28
|
|
|||
|
Intangible assets, net
|
155
|
|
$
|
86
|
|
||
|
Less current intangible assets
|
20
|
|
$
|
13
|
|
||
|
$
|
135
|
|
$
|
73
|
|
||
Emission allowances and renewable energy credits are charged to expense, using average cost, as the allowances and credits are consumed in the operation of the business. The Company amortizes contract intangible assets on a straight-line basis over the expected period of benefit, ranging from
3
to
28
years. Intangible assets amortization expense was $
6 million
in
2012
, $
5 million
in
2011
and $
4 million
in
2010
. Amortization expense of intangible assets is estimated to be $
13 million
annually for 2013 through 2017.
61
Excise and Sales Taxes
The Company records the billing of excise and sales taxes as a receivable with an offsetting payable to the applicable taxing authority, with
no
net impact on the Consolidated Statements of Operations.
Deferred Debt Costs
The costs related to the issuance of long-term debt are deferred and amortized over the life of each debt issue. In accordance with MPSC regulations applicable to the Company’s electric and gas utilities, the unamortized discount, premium and expense related to debt redeemed with a refinancing are amortized over the life of the replacement issue. Discount, premium and expense on early redemptions of debt associated with non-utility operations are charged to earnings.
Investments in Debt and Equity Securities
The Company generally classifies investments in debt and equity securities as either trading or available-for-sale and has recorded such investments at market value with unrealized gains or losses included in earnings or in other comprehensive income or loss, respectively. Changes in the fair value of Fermi 2 nuclear decommissioning investments are recorded as adjustments to regulatory assets or liabilities, due to a recovery mechanism from customers. The Company’s equity investments are reviewed for impairment each reporting period. If the assessment indicates that the impairment is other than temporary, a loss is recognized resulting in the equity investment being written down to its estimated fair value. See Note 3.
Offsetting Amounts Related to Certain Contracts
The Company offsets the fair value of derivative instruments with cash collateral received or paid for those derivative instruments executed with the same counterparty under a master netting agreement, which reduces the Company’s total assets and total liabilities. As of
December 31, 2012
, the total cash collateral received, net of cash collateral posted, was $
20 million
. As of December 31, 2011, the total cash collateral posted, net of cash collateral received, was $
71 million
. There was
no
collateral related to unrealized positions to net against derivative assets and liabilities as of December 31, 2012. At December 31, 2011, derivative assets and derivative liabilities were shown net of collateral of $
19 million
and $
74 million
, respectively. The Company recorded cash collateral paid of $
4 million
and cash collateral received of $
24 million
not related to unrealized derivative positions as of
December 31, 2012
. The Company recorded cash collateral paid of $
16 million
not related to unrealized derivative positions, as of
December 31, 2011
. These amounts are included in accounts receivable and accounts payable and are recorded net by counterparty.
Government Grants
Grants are recognized when there is reasonable assurance that the grant will be received and that any conditions associated with the grant will be met. When grants are received related to Property, Plant and Equipment, the Company reduces the basis of the assets on the Consolidated Statements of Financial Position, resulting in lower depreciation expense over the life of the associated asset. Grants received related to expenses are reflected as a reduction of the associated expense in the period in which the expense is incurred.
DTE Energy Foundation
Charitable contributions to the DTE Energy Foundation were $
21 million
, $
21 million
, and $
14 million
for the years ended December 31, 2012, 2011 and 2010, respectively. The DTE Energy Foundation is a non-consolidated not-for-profit private foundation, the purpose of which is to contribute and assist charitable organizations and does not serve a direct business or political purpose of DTE.
62
Other Accounting Policies
See the following notes for other accounting policies impacting the Company’s consolidated financial statements:
|
Note
|
Title
|
|
|
3
|
Fair Value
|
|
|
4
|
Financial and Other Derivative Instruments
|
|
|
5
|
Goodwill
|
|
|
10
|
Asset Retirement Obligations
|
|
|
11
|
Regulatory Matters
|
|
|
12
|
Income Taxes
|
|
|
20
|
Retirement Benefits and Trusteed Assets
|
|
|
21
|
Stock-based Compensation
|
|
Fair value is defined as the price that would be received to sell an asset or paid to transfer a liability in an orderly transaction between market participants at the measurement date in a principal or most advantageous market. Fair value is a market-based measurement that is determined based on inputs, which refer broadly to assumptions that market participants use in pricing assets or liabilities. These inputs can be readily observable, market corroborated or generally unobservable inputs. The Company makes certain assumptions it believes that market participants would use in pricing assets or liabilities, including assumptions about risk, and the risks inherent in the inputs to valuation techniques. Credit risk of the Company and its counterparties is incorporated in the valuation of assets and liabilities through the use of credit reserves, the impact of which was immaterial at
December 31, 2012
and
December 31, 2011
. The Company believes it uses valuation techniques that maximize the use of observable market-based inputs and minimize the use of unobservable inputs.
A fair value hierarchy has been established, that prioritizes the inputs to valuation techniques used to measure fair value in three broad levels. The fair value hierarchy gives the highest priority to quoted prices (unadjusted) in active markets for identical assets or liabilities (Level 1) and the lowest priority to unobservable inputs (Level 3). In some cases, the inputs used to measure fair value might fall in different levels of the fair value hierarchy. All assets and liabilities are required to be classified in their entirety based on the lowest level of input that is significant to the fair value measurement in its entirety. Assessing the significance of a particular input may require judgment considering factors specific to the asset or liability, and may affect the valuation of the asset or liability and its placement within the fair value hierarchy. The Company classifies fair value balances based on the fair value hierarchy defined as follows:
|
•
|
Level 1
— Consists of unadjusted quoted prices in active markets for identical assets or liabilities that the Company has the ability to access as of the reporting date.
|
|
•
|
Level 2
— Consists of inputs other than quoted prices included within Level 1 that are directly observable for the asset or liability or indirectly observable through corroboration with observable market data.
|
|
•
|
Level 3
— Consists of unobservable inputs for assets or liabilities whose fair value is estimated based on internally developed models or methodologies using inputs that are generally less readily observable and supported by little, if any, market activity at the measurement date. Unobservable inputs are developed based on the best available information and subject to cost-benefit constraints.
|
63
The following table presents assets and liabilities measured and recorded at fair value on a recurring basis as of December 31, 2012 and 2011:
|
December 31, 2012
|
December 31, 2011
|
||||||||||||||||||||||||||||||||||||||
|
Level 1
|
Level 2
|
Level 3
|
Netting (a)
|
Net Balance
|
Level 1
|
Level 2
|
Level 3
|
Netting (a)
|
Net Balance
|
||||||||||||||||||||||||||||||
|
(In millions)
|
|||||||||||||||||||||||||||||||||||||||
|
Assets:
|
|||||||||||||||||||||||||||||||||||||||
|
Cash equivalents (b)
|
$
|
—
|
|
$
|
123
|
|
$
|
—
|
|
$
|
—
|
|
$
|
123
|
|
$
|
—
|
|
$
|
140
|
|
$
|
—
|
|
$
|
—
|
|
$
|
140
|
|
|||||||||
|
Nuclear decommissioning trusts
|
694
|
|
343
|
|
—
|
|
—
|
|
1,037
|
|
577
|
|
360
|
|
—
|
|
—
|
|
937
|
|
|||||||||||||||||||
|
Other investments (c) (d)
|
66
|
|
44
|
|
—
|
|
—
|
|
110
|
|
57
|
|
38
|
|
—
|
|
—
|
|
95
|
|
|||||||||||||||||||
|
Derivative assets:
|
|
|
|
|
|
|
|
|
|
|
|
|
|
|
|
|
|||||||||||||||||||||||
|
Foreign currency exchange contracts
|
—
|
|
—
|
|
—
|
|
—
|
|
—
|
|
—
|
|
3
|
|
—
|
|
(3
|
)
|
—
|
|
|||||||||||||||||||
|
Commodity Contracts:
|
|
|
|
|
|
|
|
|
|
|
|
|
|
|
|
|
|||||||||||||||||||||||
|
Natural Gas
|
555
|
|
66
|
|
24
|
|
(605
|
)
|
40
|
|
1,926
|
|
78
|
|
20
|
|
(1,991
|
)
|
33
|
|
|||||||||||||||||||
|
Electricity
|
—
|
|
226
|
|
134
|
|
(258
|
)
|
102
|
|
—
|
|
523
|
|
224
|
|
(490
|
)
|
257
|
|
|||||||||||||||||||
|
Other
|
6
|
|
3
|
|
2
|
|
(6
|
)
|
5
|
|
23
|
|
2
|
|
6
|
|
(25
|
)
|
6
|
|
|||||||||||||||||||
|
Total derivative assets
|
561
|
|
295
|
|
160
|
|
(869
|
)
|
147
|
|
1,949
|
|
606
|
|
250
|
|
(2,509
|
)
|
296
|
|
|||||||||||||||||||
|
Total
|
$
|
1,321
|
|
$
|
805
|
|
$
|
160
|
|
$
|
(869
|
)
|
$
|
1,417
|
|
$
|
2,583
|
|
$
|
1,144
|
|
$
|
250
|
|
$
|
(2,509
|
)
|
$
|
1,468
|
|
|||||||||
|
Liabilities:
|
|||||||||||||||||||||||||||||||||||||||
|
Derivative liabilities:
|
|||||||||||||||||||||||||||||||||||||||
|
Foreign currency exchange contracts
|
$
|
—
|
|
$
|
—
|
|
$
|
—
|
|
$
|
—
|
|
$
|
—
|
|
$
|
—
|
|
$
|
(5
|
)
|
$
|
—
|
|
$
|
3
|
|
$
|
(2
|
)
|
|||||||||
|
Interest rate contracts
|
—
|
|
(1
|
)
|
—
|
|
—
|
|
(1
|
)
|
—
|
|
(1
|
)
|
—
|
|
—
|
|
(1
|
)
|
|||||||||||||||||||
|
Commodity Contracts:
|
|
|
|
|
|
|
|
|
|
|
|
|
|
|
|
|
|||||||||||||||||||||||
|
Natural Gas
|
(526
|
)
|
(73
|
)
|
(62
|
)
|
605
|
|
(56
|
)
|
(1,940
|
)
|
(126
|
)
|
(14
|
)
|
1,976
|
|
(104
|
)
|
|||||||||||||||||||
|
Electricity
|
—
|
|
(240
|
)
|
(111
|
)
|
258
|
|
(93
|
)
|
—
|
|
(513
|
)
|
(192
|
)
|
565
|
|
(140
|
)
|
|||||||||||||||||||
|
Other
|
(6
|
)
|
(1
|
)
|
—
|
|
6
|
|
(1
|
)
|
(19
|
)
|
(1
|
)
|
—
|
|
20
|
|
—
|
|
|||||||||||||||||||
|
Total derivative liabilities
|
(532
|
)
|
(315
|
)
|
(173
|
)
|
869
|
|
(151
|
)
|
(1,959
|
)
|
(646
|
)
|
(206
|
)
|
2,564
|
|
(247
|
)
|
|||||||||||||||||||
|
Total
|
$
|
(532
|
)
|
$
|
(315
|
)
|
$
|
(173
|
)
|
$
|
869
|
|
$
|
(151
|
)
|
$
|
(1,959
|
)
|
$
|
(646
|
)
|
$
|
(206
|
)
|
$
|
2,564
|
|
$
|
(247
|
)
|
|||||||||
|
Net Assets at the end of the period
|
$
|
789
|
|
$
|
490
|
|
$
|
(13
|
)
|
$
|
—
|
|
$
|
1,266
|
|
$
|
624
|
|
$
|
498
|
|
$
|
44
|
|
$
|
55
|
|
$
|
1,221
|
|
|||||||||
|
Assets:
|
|||||||||||||||||||||||||||||||||||||||
|
Current
|
$
|
493
|
|
$
|
372
|
|
$
|
120
|
|
$
|
(754
|
)
|
$
|
231
|
|
$
|
1,571
|
|
$
|
660
|
|
$
|
181
|
|
$
|
(2,050
|
)
|
$
|
362
|
|
|||||||||
|
Noncurrent (e)
|
828
|
|
433
|
|
40
|
|
(115
|
)
|
1,186
|
|
1,012
|
|
484
|
|
69
|
|
(459
|
)
|
1,106
|
|
|||||||||||||||||||
|
Total Assets
|
$
|
1,321
|
|
$
|
805
|
|
$
|
160
|
|
$
|
(869
|
)
|
$
|
1,417
|
|
$
|
2,583
|
|
$
|
1,144
|
|
$
|
250
|
|
$
|
(2,509
|
)
|
$
|
1,468
|
|
|||||||||
|
Liabilities:
|
|||||||||||||||||||||||||||||||||||||||
|
Current
|
$
|
(466
|
)
|
$
|
(269
|
)
|
$
|
(144
|
)
|
$
|
754
|
|
$
|
(125
|
)
|
$
|
(1,603
|
)
|
$
|
(527
|
)
|
$
|
(152
|
)
|
$
|
2,124
|
|
$
|
(158
|
)
|
|||||||||
|
Noncurrent
|
(66
|
)
|
(46
|
)
|
(29
|
)
|
115
|
|
(26
|
)
|
(356
|
)
|
(119
|
)
|
(54
|
)
|
440
|
|
(89
|
)
|
|||||||||||||||||||
|
Total Liabilities
|
$
|
(532
|
)
|
$
|
(315
|
)
|
$
|
(173
|
)
|
$
|
869
|
|
$
|
(151
|
)
|
$
|
(1,959
|
)
|
$
|
(646
|
)
|
$
|
(206
|
)
|
$
|
2,564
|
|
$
|
(247
|
)
|
|||||||||
|
Net Assets at the end of the period
|
$
|
789
|
|
$
|
490
|
|
$
|
(13
|
)
|
$
|
—
|
|
$
|
1,266
|
|
$
|
624
|
|
$
|
498
|
|
$
|
44
|
|
$
|
55
|
|
$
|
1,221
|
|
|||||||||
_______________________________________
|
(a)
|
Amounts represent the impact of master netting agreements that allow the Company to net gain and loss positions and cash collateral held or placed with the same counterparties.
|
|
(b)
|
At December 31, 2012 available for sale securities of
$123 million
included $
109 million
and $
14 million
of cash equivalents included in Restricted cash and Other investments on the Consolidated Statements of Financial Position, respectively. At December 31, 2011 available for sale securities of
$140 million
, included $
124 million
and $
16 million
of cash equivalents included in Restricted cash and Other investments on the Consolidated Statements of Financial Position, respectively.
|
|
(c)
|
Excludes cash surrender value of life insurance investments.
|
|
(d)
|
Available for sale equity securities of
$5 million
at December 31, 2012 and December 31, 2011 are included in Other investments on the Consolidated Statements of Financial Position, respectively.
|
|
(e)
|
Includes $
110 million
and $
95 million
of Other investments that are included in the Consolidated Statements of Financial Position in Other investments at December 31, 2012 and December 31, 2011, respectively.
|
Cash Equivalents
Cash equivalents include investments with maturities of
three
months or less when purchased. The cash equivalents shown in the fair value table are comprised of short-term investments and money market funds. The fair values of the shares in these investments are based upon observable market prices for similar securities and, therefore, have been categorized as Level 2 in the fair value hierarchy.
64
Nuclear Decommissioning Trusts and Other Investments
The nuclear decommissioning trusts and other investments hold debt and equity securities directly and indirectly through commingled funds and institutional mutual funds. Exchange-traded debt and equity securities held directly are valued using quoted market prices in actively traded markets. The commingled funds and institutional mutual funds which hold exchange-traded equity or debt securities are valued based on the underlying securities, using quoted prices in actively traded markets. Non-exchange-traded fixed income securities are valued based upon quotations available from brokers or pricing services. A primary price source is identified by asset type, class or issue for each security. The trustees monitor prices supplied by pricing services and may use a supplemental price source or change the primary price source of a given security if the trustees determine that another price source is considered to be preferable. DTE Energy has obtained an understanding of how these prices are derived, including the nature and observability of the inputs used in deriving such prices. Additionally, DTE Energy selectively corroborates the fair values of securities by comparison of market-based price sources.
Derivative Assets and Liabilities
Derivative assets and liabilities are comprised of physical and financial derivative contracts, including futures, forwards, options and swaps that are both exchange-traded and over-the-counter traded contracts. Various inputs are used to value derivatives depending on the type of contract and availability of market data. Exchange-traded derivative contracts are valued using quoted prices in active markets. DTE Energy considers the following criteria in determining whether a market is considered active: frequency in which pricing information is updated, variability in pricing between sources or over time and the availability of public information. Other derivative contracts are valued based upon a variety of inputs including commodity market prices, broker quotes, interest rates, credit ratings, default rates, market-based seasonality and basis differential factors. DTE Energy monitors the prices that are supplied by brokers and pricing services and may use a supplemental price source or change the primary price source of an index if prices become unavailable or another price source is determined to be more representative of fair value. DTE Energy has obtained an understanding of how these prices are derived. Additionally, DTE Energy selectively corroborates the fair value of its transactions by comparison of market-based price sources. Mathematical valuation models are used for derivatives for which external market data is not readily observable, such as contracts which extend beyond the actively traded reporting period. The Company has established a Risk Management Committee whose responsibilities include directly or indirectly ensuring all valuation methods are applied in accordance with predefined policies. The development and maintenance of our forward price curves has been assigned to our Risk Management Department, which is separate and distinct from the trading functions within the Company.
The following tables present the fair value reconciliation of Level 3 assets and liabilities measured at fair value on a recurring basis for the years ended
December 31, 2012
and
2011
:
|
Year Ended December 31, 2012
|
Year Ended December 31, 2011
|
||||||||||||||||||||||||||||||
|
Natural Gas
|
Electricity
|
Other
|
Total
|
Natural Gas
|
Electricity
|
Other
|
Total
|
||||||||||||||||||||||||
|
(In millions)
|
|||||||||||||||||||||||||||||||
|
Net Assets as of January 1
|
$
|
6
|
|
$
|
32
|
|
$
|
6
|
|
$
|
44
|
|
$
|
1
|
|
$
|
54
|
|
$
|
4
|
|
$
|
59
|
|
|||||||
|
Transfers into Level 3
|
1
|
|
—
|
|
—
|
|
1
|
|
—
|
|
4
|
|
—
|
|
4
|
|
|||||||||||||||
|
Transfers out of Level 3
|
—
|
|
—
|
|
—
|
|
—
|
|
1
|
|
(25
|
)
|
—
|
|
(24
|
)
|
|||||||||||||||
|
Total gains (losses):
|
|||||||||||||||||||||||||||||||
|
Included in earnings
|
(41
|
)
|
101
|
|
—
|
|
60
|
|
7
|
|
77
|
|
3
|
|
87
|
|
|||||||||||||||
|
Recorded in regulatory assets/liabilities
|
—
|
|
—
|
|
15
|
|
15
|
|
—
|
|
—
|
|
2
|
|
2
|
|
|||||||||||||||
|
Purchases, issuances and settlements:
|
|||||||||||||||||||||||||||||||
|
Purchases
|
—
|
|
2
|
|
—
|
|
2
|
|
—
|
|
3
|
|
—
|
|
3
|
|
|||||||||||||||
|
Settlements
|
(4
|
)
|
(112
|
)
|
(19
|
)
|
(135
|
)
|
(3
|
)
|
(81
|
)
|
(3
|
)
|
(87
|
)
|
|||||||||||||||
|
Net Assets (Liabilities) as of December 31
|
$
|
(38
|
)
|
$
|
23
|
|
$
|
2
|
|
$
|
(13
|
)
|
$
|
6
|
|
$
|
32
|
|
$
|
6
|
|
$
|
44
|
|
|||||||
|
The amount of total gains (losses) included in net income attributed to the change in unrealized gains (losses) related to assets and liabilities held at December 31, 2012 and 2011and reflected in Operating revenues and Fuel, purchased power and gas in the Consolidated Statements of Operations
|
$
|
(33
|
)
|
$
|
91
|
|
$
|
—
|
|
$
|
58
|
|
$
|
8
|
|
$
|
65
|
|
$
|
2
|
|
$
|
75
|
|
|||||||
Derivatives are transferred between levels primarily due to changes in the source data used to construct price curves as a result of changes in market liquidity. Transfers in and transfers out are reflected as if they had occurred at the beginning of the
65
period. The following table shows transfers between the levels of the fair value hierarchy for the years ended December 31, 2012 and 2011:
|
Year Ended December 31, 2012
|
Year Ended December 31, 2011
|
||||||||||||||||||||||
|
Level 1
|
Level 2
|
Level 3
|
Level 1
|
Level 2
|
Level 3
|
||||||||||||||||||
|
(In millions)
|
|||||||||||||||||||||||
|
Transfers into Level 1 from
|
N/A
|
|
$
|
—
|
|
$
|
—
|
|
N/A
|
|
$
|
—
|
|
$
|
—
|
|
|||||||
|
Transfers into Level 2 from
|
$
|
—
|
|
N/A
|
|
—
|
|
$
|
—
|
|
N/A
|
|
24
|
|
|||||||||
|
Transfers into Level 3 from
|
—
|
|
1
|
|
N/A
|
|
—
|
|
4
|
|
N/A
|
|
|||||||||||
The following table presents the unobservable inputs related to Level 3 assets and liabilities as of December 31, 2012:
|
December 31, 2012
|
||||||||||||||||||||||||
|
Commodity Contracts
|
Derivative Assets
|
Derivative Liabilities
|
Valuation Techniques
|
Unobservable Input
|
Range
|
Weighted Average
|
||||||||||||||||||
|
(In millions)
|
||||||||||||||||||||||||
|
Natural Gas
|
$
|
24
|
|
$
|
(62
|
)
|
Discounted Cash Flow
|
Forward basis price (per MMBtu)
|
$
|
(0.63
|
)
|
—
|
$
|
1.95
|
/MMBtu
|
$
|
0.03
|
/MMBtu
|
||||||
|
Electricity
|
134
|
|
(111
|
)
|
Discounted Cash Flow
|
Forward basis price (per MWh)
|
$
|
(2
|
)
|
—
|
$
|
16
|
/MWh
|
$
|
3
|
/MWh
|
||||||||
The unobservable inputs used in the fair value measurement of the electricity and natural gas commodity types consists of inputs that are less observable due in part to lack of available broker quotes, supported by little, if any, market activity at the measurement date or are based on internally developed models. Certain forward market and/or basis prices (i.e., the difference in pricing between
two
locations) that were included in the valuation of natural gas and electricity contracts were deemed unobservable.
The inputs listed above would have a direct impact on the fair values of the above security types if they were adjusted. A significant increase (decrease) in the forward market or basis price would result in a higher (lower) fair value for long positions, with offsetting impacts to short positions.
Fair Value of Financial Instruments
The fair value of financial instruments included in the table below is determined by using quoted market prices when available. When quoted prices are not available, pricing services may be used to determine the fair value with reference to observable interest rate indexes. DTE Energy has obtained an understanding of how the fair values are derived. DTE Energy also selectively corroborates the fair value of its transactions by comparison of market-based price sources. Discounted cash flow analyses based upon estimated current borrowing rates are also used to determine fair value when quoted market prices are not available. The fair values of notes receivable, excluding capital leases, are estimated using discounted cash flow techniques that incorporate market interest rates as well assumptions about the remaining life of the loans and credit risk. Depending on the information available, other valuation techniques may be used that rely on internal assumptions and models. Valuation policies and procedures are determined by DTE Energy's Treasury Department which reports to the Company's Vice President and Treasurer.
The following table presents the carrying amount and fair value of financial instruments as of December 31, 2012 and 2011:
|
December 31, 2012
|
December 31, 2011
|
||||||||||||||||||||||
|
Carrying
|
Fair Value
|
Carrying
|
Fair
|
||||||||||||||||||||
|
Amount
|
Level 1
|
Level 2
|
Level 3
|
Amount
|
Value
|
||||||||||||||||||
|
(In millions)
|
|||||||||||||||||||||||
|
Notes receivable, excluding capital leases
|
$
|
39
|
|
$
|
—
|
|
$
|
—
|
|
$
|
39
|
|
$
|
48
|
|
$
|
48
|
|
|||||
|
Dividends payable
|
107
|
|
107
|
|
—
|
|
—
|
|
99
|
|
99
|
|
|||||||||||
|
Short-term borrowings
|
240
|
|
—
|
|
240
|
|
—
|
|
419
|
|
419
|
|
|||||||||||
|
Long-term debt
|
7,813
|
|
507
|
|
7,453
|
|
933
|
|
7,682
|
|
8,757
|
|
|||||||||||
66
See Note 4 for further fair value information on financial and derivative instruments.
Nuclear Decommissioning Trust Funds
DTE Electric has a legal obligation to decommission its nuclear power plants following the expiration of their operating licenses. This obligation is reflected as an asset retirement obligation on the Consolidated Statements of Financial Position. Rates approved by the MPSC provide for the recovery of decommissioning costs of Fermi 2 and the disposal of low-level radioactive waste. DTE Electric is continuing to fund FERC jurisdictional amounts for decommissioning even though explicit provisions are not included in FERC rates. See Note 10.
The following table summarizes the fair value of the nuclear decommissioning trust fund assets:
|
December 31
2012
|
December 31
2011
|
||||||
|
(In millions)
|
|||||||
|
Fermi 2
|
$
|
1,021
|
|
$
|
915
|
|
|
|
Fermi 1
|
3
|
|
3
|
|
|||
|
Low level radioactive waste
|
13
|
|
19
|
|
|||
|
Total
|
$
|
1,037
|
|
$
|
937
|
|
|
At
December 31, 2012
, investments in the nuclear decommissioning trust funds consisted of approximately
61%
in publicly traded equity securities,
38%
in fixed debt instruments and
1%
in cash equivalents. At
December 31, 2011
, investments in the nuclear decommissioning trust funds consisted of approximately
57%
in publicly traded equity securities,
41%
in fixed debt instruments and
2%
in cash equivalents. The debt securities at both
December 31, 2012
and
December 31, 2011
had an average maturity of approximately
6
and
7
years, respectively.
The costs of securities sold are determined on the basis of specific identification. The following table sets forth the gains and losses and proceeds from the sale of securities by the nuclear decommissioning trust funds:
|
Year Ended December 31
|
|||||||||||
|
2012
|
2011
|
2010
|
|||||||||
|
(In millions)
|
|||||||||||
|
Realized gains
|
$
|
37
|
|
$
|
46
|
|
$
|
192
|
|
||
|
Realized losses
|
$
|
(31
|
)
|
$
|
(38
|
)
|
$
|
(83
|
)
|
||
|
Proceeds from sales of securities
|
$
|
97
|
|
$
|
80
|
|
$
|
377
|
|
||
Realized gains and losses from the sale of securities for the Fermi 2 and the low level radioactive waste funds are recorded to the Regulatory asset and Nuclear decommissioning liability. The following table sets forth the fair value and unrealized gains for the nuclear decommissioning trust funds:
|
December 31, 2012
|
December 31, 2011
|
||||||||||||||
|
Fair
Value
|
Unrealized
Gains
|
Fair
Value
|
Unrealized
Gains
|
||||||||||||
|
(In millions)
|
|||||||||||||||
|
Equity securities
|
$
|
631
|
|
$
|
122
|
|
$
|
533
|
|
$
|
80
|
|
|||
|
Debt securities
|
399
|
|
27
|
|
385
|
|
22
|
|
|||||||
|
Cash and cash equivalents
|
7
|
|
—
|
|
19
|
|
—
|
|
|||||||
|
$
|
1,037
|
|
$
|
149
|
|
$
|
937
|
|
$
|
102
|
|
||||
Securities held in the nuclear decommissioning trust funds are classified as available-for-sale. As DTE Electric does not have the ability to hold impaired investments for a period of time sufficient to allow for the anticipated recovery of market value, all unrealized losses are considered to be other than temporary impairments.
Unrealized losses incurred by the Fermi 2 trust are recognized as a Regulatory asset. DTE Electric recognized $
44 million
and $
67 million
of unrealized losses as Regulatory assets at
December 31, 2012
and
2011
, respectively. Since the decommissioning of Fermi 1 is funded by DTE Electric rather than through a regulatory recovery mechanism, there is
no
corresponding regulatory asset treatment. Therefore, unrealized losses incurred by the Fermi 1 trust are recognized in earnings immediately. There were
no
unrealized losses recognized in
2012
,
2011
and
2010
for Fermi 1.
67
Available-for-sale Securities
At
December 31, 2012
and
2011
, these securities are comprised primarily of money-market and equity securities. During the year ended
December 31, 2012
and
December 31, 2011
no
amounts of unrealized losses on available for sale securities were reclassified out of other comprehensive income into net income for the periods. Gains related to trading securities held at
December 31, 2012
,
2011
, and
2010
were $
9 million
, $
3 million
and $
7 million
, respectively.
The Company recognizes all derivatives at their fair value as Derivative Assets or Liabilities on the Consolidated Statements of Financial Position unless they qualify for certain scope exceptions, including the normal purchases and normal sales exception. Further, derivatives that qualify and are designated for hedge accounting are classified as either hedges of a forecasted transaction or the variability of cash flows to be received or paid related to a recognized asset or liability (cash flow hedge), or as hedges of the fair value of a recognized asset or liability or of an unrecognized firm commitment (fair value hedge). For cash flow hedges, the portion of the derivative gain or loss that is effective in offsetting the change in the value of the underlying exposure is deferred in Accumulated other comprehensive income and later reclassified into earnings when the underlying transaction occurs. For fair value hedges, changes in fair values for the derivative are recognized in earnings each period. Gains and losses from the ineffective portion of any hedge are recognized in earnings immediately. For derivatives that do not qualify or are not designated for hedge accounting, changes in the fair value are recognized in earnings each period.
The Company’s primary market risk exposure is associated with commodity prices, credit, interest rates and foreign currency exchange. The Company has risk management policies to monitor and manage market risks. The Company uses derivative instruments to manage some of the exposure. The Company uses derivative instruments for trading purposes in its Energy Trading segment. Contracts classified as derivative instruments include power, gas, oil and certain coal forwards, futures, options and swaps, and foreign currency exchange contracts. Items not classified as derivatives include natural gas inventory, pipeline transportation contracts, renewable energy credits and storage assets.
Electric
— DTE Electric generates, purchases, distributes and sells electricity. DTE Electric uses forward energy contracts to manage changes in the price of electricity and fuel. Substantially all of these contracts meet the normal purchases and sales exemption and are therefore accounted for under the accrual method. Other derivative contracts are recoverable through the PSCR mechanism when settled. This results in the deferral of unrealized gains and losses as Regulatory assets or liabilities until realized.
Gas
— DTE Gas purchases, stores, transports, distributes and sells natural gas and sells storage and transportation capacity. DTE Gas has fixed-priced contracts for portions of its expected gas supply requirements through 2015. Substantially all of these contracts meet the normal purchases and sales exemption and are therefore accounted for under the accrual method. DTE Gas may also sell forward transportation and storage capacity contracts. Forward transportation and storage contracts are generally not derivatives and are therefore accounted for under the accrual method.
Gas Storage and Pipelines —
This segment is primarily engaged in services related to the transportation and storage of natural gas. Primarily fixed-priced contracts are used in the marketing and management of transportation and storage services. Generally these contracts are not derivatives and are therefore accounted for under the accrual method.
Power and Industrial Projects
— Business units within this segment manage and operate onsite energy and pulverized coal projects, coke batteries, landfill gas recovery and power generation assets. These businesses utilize fixed-priced contracts in the marketing and management of their assets. These contracts are generally not derivatives and are therefore accounted for under the accrual method.
Energy Trading — Commodity Price Risk —
Energy Trading markets and trades electricity, coal, natural gas physical products and energy financial instruments, and provides energy and asset management services utilizing energy commodity derivative instruments. Forwards, futures, options and swap agreements are used to manage exposure to the risk of market price and volume fluctuations in its operations. These derivatives are accounted for by recording changes in fair value to earnings unless hedge accounting criteria are met.
Energy Trading — Foreign Currency Exchange Risk —
Energy Trading has foreign currency exchange forward contracts to economically hedge fixed Canadian dollar commitments existing under natural gas and power purchase and sale contracts and natural gas transportation contracts. The Company enters into these contracts to mitigate price volatility with respect to
68
fluctuations of the Canadian dollar relative to the U.S. dollar. These derivatives are accounted for by recording changes in fair value to earnings unless hedge accounting criteria are met.
Corporate and Other — Interest Rate Risk —
The Company uses interest rate swaps, treasury locks and other derivatives to hedge the risk associated with interest rate market volatility. In 2004 and 2000, the Company entered into a series of interest rate derivatives to limit its sensitivity to market interest rate risk associated with the issuance of long-term debt. Such instruments were designated as cash flow hedges. The Company subsequently issued long-term debt and terminated these hedges at a cost that is included in Other comprehensive loss. Amounts recorded in Other comprehensive loss will be reclassified to interest expense through 2033. In 2013, the Company estimates reclassifying less than $
1 million
of losses to earnings.
Credit Risk —
The utility and non-utility businesses are exposed to credit risk if customers or counterparties do not comply with their contractual obligations. The Company maintains credit policies that significantly minimize overall credit risk. These policies include an evaluation of potential customers’ and counterparties’ financial condition, credit rating, collateral requirements or other credit enhancements such as letters of credit or guarantees. The Company generally uses standardized agreements that allow the netting of positive and negative transactions associated with a single counterparty. The Company maintains a provision for credit losses based on factors surrounding the credit risk of its customers, historical trends, and other information. Based on the Company’s credit policies and its
December 31, 2012
and 2011 provision for credit losses, the Company’s exposure to counterparty nonperformance is not expected to have a material adverse effect on the Company’s financial statements.
Derivative Activities
The Company manages its mark-to-market (MTM) risk on a portfolio basis based upon the delivery period of its contracts and the individual components of the risks within each contract. Accordingly, it records and manages the energy purchase and sale obligations under its contracts in separate components based on the commodity (e.g. electricity or gas), the product (e.g. electricity for delivery during peak or off-peak hours), the delivery location (e.g. by region), the risk profile (e.g. forward or option), and the delivery period (e.g. by month and year). The following describe the
four
categories of activities represented by their operating characteristics and key risks:
|
•
|
Asset Optimization
— Represents derivative activity associated with assets owned and contracted by DTE Energy, including forward gas purchases and sales, gas transportation and storage capacity. Changes in the value of derivatives in this category typically economically offset changes in the value of underlying non-derivative positions, which do not qualify for fair value accounting. The difference in accounting treatment of derivatives in this category and the underlying non-derivative positions can result in significant earnings volatility.
|
|
•
|
Marketing and Origination
— Represents derivative activity transacted by originating substantially hedged positions with wholesale energy marketers, producers, end users, utilities, retail aggregators and alternative energy suppliers.
|
|
•
|
Fundamentals Based Trading
— Represents derivative activity transacted with the intent of taking a view, capturing market price changes, or putting capital at risk. This activity is speculative in nature as opposed to hedging an existing exposure.
|
|
•
|
Other
— Includes derivative activity at DTE Electric related to FTRs. Changes in the value of derivative contracts at DTE Electric are recorded as Derivative Assets or Liabilities, with an offset to Regulatory Assets or Liabilities as the settlement value of these contracts will be included in the PSCR mechanism when realized.
|
69
The following tables present the fair value of derivative instruments as of
December 31, 2012
and 2011:
|
December 31, 2012
|
December 31, 2011
|
||||||||||||||
|
Derivative Assets
|
Derivative Liabilities
|
Derivative Assets
|
Derivative Liabilities
|
||||||||||||
|
(In millions)
|
|||||||||||||||
|
Derivatives designated as hedging instruments:
|
|||||||||||||||
|
Interest rate contracts
|
$
|
—
|
|
$
|
(1
|
)
|
$
|
—
|
|
$
|
(1
|
)
|
|||
|
Derivatives not designated as hedging instruments:
|
|||||||||||||||
|
Foreign currency exchange contracts
|
$
|
—
|
|
$
|
—
|
|
$
|
3
|
|
$
|
(5
|
)
|
|||
|
Commodity Contracts:
|
|
|
|
|
|||||||||||
|
Natural Gas
|
645
|
|
(661
|
)
|
2,024
|
|
(2,080
|
)
|
|||||||
|
Electricity
|
360
|
|
(351
|
)
|
747
|
|
(705
|
)
|
|||||||
|
Other
|
11
|
|
(7
|
)
|
31
|
|
(20
|
)
|
|||||||
|
Total derivatives not designated as hedging instruments:
|
$
|
1,016
|
|
$
|
(1,019
|
)
|
$
|
2,805
|
|
$
|
(2,810
|
)
|
|||
|
Total derivatives:
|
|||||||||||||||
|
Current
|
$
|
862
|
|
$
|
(879
|
)
|
$
|
2,272
|
|
$
|
(2,282
|
)
|
|||
|
Noncurrent
|
154
|
|
(141
|
)
|
533
|
|
(529
|
)
|
|||||||
|
Total derivatives
|
$
|
1,016
|
|
$
|
(1,020
|
)
|
$
|
2,805
|
|
$
|
(2,811
|
)
|
|||
|
December 31, 2012
|
December 31, 2011
|
||||||||||||||||||||||||||||||
|
Derivative Assets
|
Derivative Liabilities
|
Derivative Assets
|
Derivative Liabilities
|
||||||||||||||||||||||||||||
|
Current
|
Noncurrent
|
Current
|
Noncurrent
|
Current
|
Noncurrent
|
Current
|
Noncurrent
|
||||||||||||||||||||||||
|
(In millions)
|
|||||||||||||||||||||||||||||||
|
Reconciliation of derivative instruments to Consolidated Statements of Financial Position:
|
|||||||||||||||||||||||||||||||
|
Total fair value of derivatives
|
$
|
862
|
|
$
|
154
|
|
$
|
(879
|
)
|
$
|
(141
|
)
|
$
|
2,272
|
|
$
|
533
|
|
$
|
(2,282
|
)
|
$
|
(529
|
)
|
|||||||
|
Counterparty netting
|
(754
|
)
|
(115
|
)
|
754
|
|
115
|
|
(2,050
|
)
|
(440
|
)
|
2,050
|
|
440
|
|
|||||||||||||||
|
Collateral adjustment
|
—
|
|
—
|
|
—
|
|
—
|
|
—
|
|
(19
|
)
|
74
|
|
—
|
|
|||||||||||||||
|
Total derivatives as reported
|
$
|
108
|
|
$
|
39
|
|
$
|
(125
|
)
|
$
|
(26
|
)
|
$
|
222
|
|
$
|
74
|
|
$
|
(158
|
)
|
$
|
(89
|
)
|
|||||||
The effect of derivatives not designated as hedging instruments on the Consolidated Statements of Operations for years ended
December 31, 2012
and 2011 is as follows:
|
Location of Gain
(Loss) Recognized
in Income on Derivatives
|
Gain (Loss)
Recognized in
Income on
Derivatives for
Years Ended
December 31
|
|||||||||
|
Derivatives not Designated as Hedging Instruments
|
2012
|
2011
|
||||||||
|
(In millions)
|
||||||||||
|
Foreign currency exchange contracts
|
Operating Revenue
|
$
|
—
|
|
$
|
(2
|
)
|
|||
|
Commodity Contracts:
|
||||||||||
|
Natural Gas
|
Operating Revenue
|
(29
|
)
|
58
|
|
|||||
|
Natural Gas
|
Fuel, purchased power and gas
|
25
|
|
(21
|
)
|
|||||
|
Electricity
|
Operating Revenue
|
64
|
|
115
|
|
|||||
|
Other
|
Operating Revenue
|
5
|
|
9
|
|
|||||
|
Total
|
$
|
65
|
|
$
|
159
|
|
||||
Revenues and energy costs related to trading contracts are presented on a net basis in the Consolidated Statements of Operations. Commodity derivatives used for trading purposes, and financial non-trading commodity derivatives, are accounted for using the mark-to-market method with unrealized and realized gains and losses recorded in Operating revenues. Non-trading physical commodity sale and purchase derivative contracts are generally accounted for using the mark-to-market method with unrealized and realized gains and losses for sales recorded in Operating revenue and purchases recorded in Fuel, purchased power and gas.
70
The effects of derivative instruments recoverable through the PSCR mechanism when realized on the Consolidated Statements of Financial Position were $
15 million
in unrealized gains related to FTRs recognized in Regulatory liabilities for the year ended
December 31, 2012
, and $
3 million
in unrealized gains related to FTRs recognized in Regulatory liabilities, for the year ended
December 31, 2011
.
The following represents the cumulative gross volume of derivative contracts outstanding as of
December 31, 2012
:
|
Commodity
|
Number of Units
|
|
|
Natural Gas (MMBtu)
|
663,194,602
|
|
|
Electricity (MWh)
|
48,524,412
|
|
|
Foreign Currency Exchange ($ CAD)
|
10,838,396
|
|
|
FTR (MWh)
|
11,077,483
|
|
Various non-utility subsidiaries of the Company have entered into contracts which contain ratings triggers and are guaranteed by DTE Energy. These contracts contain provisions which allow the counterparties to request that the Company post cash or letters of credit as collateral in the event that DTE Energy’s credit rating is downgraded below investment grade. Certain of these provisions (known as “hard triggers”) state specific circumstances under which the Company can be asked to post collateral upon the occurrence of a credit downgrade, while other provisions (known as “soft triggers”) are not as specific. For contracts with soft triggers, it is difficult to estimate the amount of collateral which may be requested by counterparties and/or which the Company may ultimately be required to post. The amount of such collateral which could be requested fluctuates based on commodity prices (primarily gas, power and coal) and the provisions and maturities of the underlying transactions. As of
December 31, 2012
, the value of the transactions for which the Company would have been exposed to collateral requests had DTE Energy’s credit rating been below investment grade on such date under both hard trigger and soft trigger provisions was approximately $
326 million
.
The Company has goodwill resulting from purchase business combinations.
The change in the carrying amount of goodwill for the fiscal years ended
December 31, 2012
and 2011 is as follows:
|
2012
|
2011
|
||||||
|
(In millions)
|
|||||||
|
Balance as of January 1
|
$
|
2,020
|
|
$
|
2,020
|
|
|
|
Goodwill attributable to sale of Unconventional Gas Production business
|
(2
|
)
|
—
|
|
|||
|
Balance at December 31
|
$
|
2,018
|
|
$
|
2,020
|
|
|
In July 2012, the Company executed an agreement to purchase a portfolio of
fourteen
on-site energy projects, primarily located in the Midwest, from subsidiaries of Duke Energy Corporation and GDF Suez Energy North America, Inc. This acquisition provides a growth opportunity for the Company's Power and Industrial Projects segment that will leverage its extensive energy-related operating experience and project management capabilities.
Closing for all of the entities occurred in the fourth quarter 2012. The purchase of equity interests range from
46 percent
to
100 percent
of the project companies for a total purchase price of approximately $
294 million
, which consists of $
220 million
paid in cash and assumption of approximately $
74 million
of debt. The debt assumed relates to
two
project companies which have been deemed variable interest entities. DTE, however, is not the primary beneficiary and thus the VIEs' assets and liabilities are not included in the Company's Consolidated Statements of Financial Position. Therefore, the assumed debt is not included in the purchase price allocation table below. There is
no
exposure to loss related to the debt assumed as the customer of the project companies is obligated to pay the loans in the event of default or termination. See Note 1.
The Company has completed its valuation analysis and calculations in sufficient detail necessary to arrive at the fair value of the project company assets acquired and liabilities assumed, along with the related allocation to intangible assets.
The allocation of the total consideration transferred in the acquisition to the assets acquired and liabilities assumed includes adjustments for the fair value of existing contracts and agreements and property, plant and equipment. The fair value of the assets acquired and liabilities assumed have been determined based on the accounting guidance for fair value measurements in
71
accordance with ASC 805, “Business Combinations.” The following is the Company's assignment as of the closing date of the consideration:
|
(In millions)
|
|||
|
Cash
|
$
|
22
|
|
|
Accounts receivable
|
14
|
|
|
|
Other current assets
|
8
|
|
|
|
Property, plant and equipment
|
100
|
|
|
|
Intangible assets
|
75
|
|
|
|
Other noncurrent assets
|
9
|
|
|
|
Current liabilities
|
(7
|
)
|
|
|
Non-controlling interest
|
(1
|
)
|
|
|
Total purchase price
|
$
|
220
|
|
The Company did not record any goodwill due to the acquisition.
The intangible assets recorded as a result of the acquisition pertain to existing contracts and agreements, which were valued at approximately $
75 million
as of the closing date. The fair value of the intangible assets acquired was estimated by applying the income approach. The income approach is based upon discounted projected future cash flows attributable to the existing contracts and agreements. The fair value measurement is based on significant unobservable inputs, including management estimates and assumptions, and thus represents a Level 3 measurement, pursuant to the applicable accounting guidance. Key estimates and inputs include revenue and expense projections and discount rates based on the risks associated with the projects. The intangible assets are amortized on a straight line basis over a weighted-average amortization period of approximately
eight
years.
The Company's 2012 results of operations include revenue of $
30 million
and net income of $
2 million
associated with the acquired project companies for the approximate
three
-month period following the closing date. The pro forma results of operations have not been presented for DTE Energy because the effects of the acquisition were not material to our consolidated results of operations.
Sale of Unconventional Gas Production Business
In December 2012, the Company sold its
100%
equity interest in its Unconventional Gas Production business which consisted of gas and oil production assets in the western Barnett and Marble Falls shale areas of Texas. The properties in the sale included all of the reserves on approximately
88,000
net acres near Dallas, Texas. The sale resulted in gross proceeds of approximately $
255 million
, which resulted in a pre-tax loss of approximately $
83 million
($
55 million
after tax). The sale price is subject to customary purchase price adjustments that will be recognized in the first half of 2013.
The activity of the discontinued Unconventional Gas Production business is shown below. The amounts exclude general corporate overhead costs, and related tax effects, and
no
portion of corporate interest costs were allocated to discontinued operations.
72
|
Year Ended December 31
|
|||||||||||
|
2012
|
2011
|
2010
|
|||||||||
|
(In millions)
|
|||||||||||
|
Operating Revenues
|
$
|
55
|
|
$
|
39
|
|
$
|
32
|
|
||
|
Operation and Maintenance
|
24
|
|
16
|
|
11
|
|
|||||
|
Depreciation, Depletion and Amortization
|
23
|
|
18
|
|
15
|
|
|||||
|
Taxes Other than Income
|
4
|
|
3
|
|
2
|
|
|||||
|
Asset (Gains) and Losses, Net
|
83
|
|
—
|
|
10
|
|
|||||
|
134
|
|
37
|
|
38
|
|
||||||
|
Operating Income
|
(79
|
)
|
2
|
|
(6
|
)
|
|||||
|
Other (Income) and Deductions
|
6
|
|
6
|
|
6
|
|
|||||
|
Loss Before Income Taxes
|
(85
|
)
|
(4
|
)
|
(12
|
)
|
|||||
|
Income Tax Benefit
|
(29
|
)
|
(1
|
)
|
(4
|
)
|
|||||
|
Net Loss
|
$
|
(56
|
)
|
$
|
(3
|
)
|
$
|
(8
|
)
|
||
Summary of property by classification as of December 31:
|
2012
|
2011
|
||||||
|
Property, Plant and Equipment
|
(In millions)
|
||||||
|
Electric
|
|||||||
|
Generation
|
$
|
10,383
|
|
$
|
9,785
|
|
|
|
Distribution
|
7,306
|
|
7,003
|
|
|||
|
Total Electric
|
17,689
|
|
16,788
|
|
|||
|
Gas
|
|||||||
|
Distribution
|
2,735
|
|
2,561
|
|
|||
|
Storage
|
434
|
|
406
|
|
|||
|
Other
|
852
|
|
902
|
|
|||
|
Total Gas
|
4,021
|
|
3,869
|
|
|||
|
Non-utility and other
|
1,921
|
|
1,884
|
|
|||
|
Total
|
23,631
|
|
22,541
|
|
|||
|
Less Accumulated Depreciation, Depletion and Amortization
|
|||||||
|
Electric
|
|||||||
|
Generation
|
(3,880
|
)
|
(3,946
|
)
|
|||
|
Distribution
|
(2,837
|
)
|
(2,580
|
)
|
|||
|
Total Electric
|
(6,717
|
)
|
(6,526
|
)
|
|||
|
Gas
|
|||||||
|
Distribution
|
(1,075
|
)
|
(1,041
|
)
|
|||
|
Storage
|
(133
|
)
|
(127
|
)
|
|||
|
Other
|
(363
|
)
|
(413
|
)
|
|||
|
Total Gas
|
(1,571
|
)
|
(1,581
|
)
|
|||
|
Non-utility and other
|
(659
|
)
|
(688
|
)
|
|||
|
Total
|
(8,947
|
)
|
(8,795
|
)
|
|||
|
Net Property, Plant and Equipment
|
$
|
14,684
|
|
$
|
13,746
|
|
|
The Allowance for Funds used During Construction (AFUDC) capitalized was approximately
$20 million
and $
10 million
during 2012 and 2011, respectively.
The composite depreciation rate for DTE Electric was approximately
3.3%
in 2012, 2011 and 2010. The composite depreciation rate for DTE Gas was
2.4%
in 2012,
2.3%
in
2011
and
2.5%
in
2010
.
73
The average estimated useful life for each major class of utility property, plant and equipment as of
December 31, 2012
follows:
|
Estimated Useful Lives in Years
|
||||||
|
Utility
|
Generation
|
Distribution
|
Storage
|
|||
|
Electric
|
40
|
41
|
N/A
|
|||
|
Gas
|
N/A
|
50
|
53
|
|||
The estimated useful lives for major classes of non-utility assets and facilities ranges from
3
to
55
years.
Capitalized software costs are classified as Property, plant and equipment and the related amortization is included in Accumulated depreciation, depletion and amortization on the Consolidated Statements of Financial Position. The Company capitalizes the costs associated with computer software it develops or obtains for use in its business. The Company amortizes capitalized software costs on a straight-line basis over the expected period of benefit, ranging from
3
to
15
years.
Capitalized software costs amortization expense was $
75 million
in 2012 and $
65 million
in 2011 and
2010
. The gross carrying amount and accumulated amortization of capitalized software costs at
December 31, 2012
were $
561 million
and $
295 million
, respectively. The gross carrying amount and accumulated amortization of capitalized software costs at
December 31, 2011
were $
623 million
and $
300 million
, respectively. Amortization expense of capitalized software costs is estimated to be approximately $
46 million
annually for 2013 through 2017.
Gross property under capital leases was $
32 million
and
$57 million
at
December 31, 2012
and
December 31, 2011
, respectively. Accumulated amortization of property under capital leases was $
3 million
and $
34 million
at
December 31, 2012
and
December 31, 2011
, respectively.
DTE Electric has joint ownership interest in
two
power plants, Belle River and Ludington Hydroelectric Pumped Storage. DTE Electric’s share of direct expenses of the jointly owned plants are included in Fuel, purchased power and gas and Operation and maintenance expenses in the Consolidated Statements of Operations. Ownership information of the
two
utility plants as of
December 31, 2012
was as follows:
|
Belle River
|
Ludington
Hydroelectric
Pumped Storage
|
||||||
|
In-service date
|
1984-1985
|
|
1973
|
|
|||
|
Total plant capacity
|
1,270
|
MW
|
1,872
|
MW
|
|||
|
Ownership interest
|
(a)
|
|
49
|
%
|
|||
|
Investment (in millions)
|
$
|
1,661
|
|
$
|
199
|
|
|
|
Accumulated depreciation (in millions)
|
$
|
953
|
|
$
|
164
|
|
|
_______________________________________
|
(a)
|
DTE Electric's ownership interest is
63%
in Unit No. 1,
81%
of the facilities applicable to Belle River used jointly by the Belle River and St. Clair Power Plants and
75%
in common facilities used at Unit No. 2.
|
Belle River
The Michigan Public Power Agency (MPPA) has an ownership interest in Belle River Unit No. 1 and other related facilities. The MPPA is entitled to
19%
of the total capacity and energy of the plant and is responsible for the same percentage of the plant’s operation, maintenance and capital improvement costs.
Ludington Hydroelectric Pumped Storage
Consumers Energy Company has an ownership interest in the Ludington Hydroelectric Pumped Storage Plant. Consumers Energy is entitled to
51%
of the total capacity and energy of the plant and is responsible for the same percentage of the plant’s operation, maintenance and capital improvement costs.
74
The Company has a legal retirement obligation for the decommissioning costs for its Fermi 1 and Fermi 2 nuclear plants, dismantlement of facilities located on leased property and various other operations. The Company has conditional retirement obligations for gas pipelines, asbestos and PCB removal at certain of its power plants and various distribution equipment. The Company recognizes such obligations as liabilities at fair market value when they are incurred, which generally is at the time the associated assets are placed in service. Fair value is measured using expected future cash outflows discounted at our credit-adjusted risk-free rate. In its regulated operations, the Company recognizes regulatory assets or liabilities for timing differences in expense recognition for legal asset retirement costs that are currently recovered in rates.
If a reasonable estimate of fair value cannot be made in the period in which the retirement obligation is incurred, such as for assets with indeterminate lives, the liability is recognized when a reasonable estimate of fair value can be made. Natural gas storage system assets, substations, manholes and certain other distribution assets have an indeterminate life. Therefore,
no
liability has been recorded for these assets.
A reconciliation of the asset retirement obligations for
2012
follows:
|
(In millions)
|
|||
|
Asset retirement obligations at December 31, 2011
|
$
|
1,593
|
|
|
Accretion
|
100
|
|
|
|
Liabilities incurred
|
27
|
|
|
|
Liabilities settled
|
(11
|
)
|
|
|
Revision in estimated cash flows
|
10
|
|
|
|
Asset retirement obligations at December 31, 2012
|
1,719
|
|
|
In 2001, DTE Electric began the final decommissioning of Fermi 1, with the goal of removing the remaining radioactive material and terminating the Fermi 1 license. In 2011, based on management decisions revising the timing and estimate of cash flows, DTE Electric accrued an additional $
19 million
with respect to the decommissioning of Fermi 1. Management has suspended decommissioning activities and placed the facility in safe storage status. The expense amount has been recorded in Asset (gains) and losses, reserves and impairments, net on the Consolidated Statements of Operations. In addition, in 2011, based on updated studies revising the timing and estimate of cash flows, a reduction of approximately $
20 million
was made to the DTE Electric asset retirement obligation for asbestos removal with approximately $
6 million
of the decrease associated with Fermi 1 recorded in Asset (gains) and losses, reserves and impairments, net on the Consolidated Statements of Operations.
In October 2011, the MPSC approved DTE Electric's request for a reduction to the nuclear decommissioning surcharge under the assumption that it would request an extension of the Fermi 2 license for an additional
20
years beyond the term of the existing license which expires in 2025. DTE Electric expects to request the license extension in 2014. This proposed extension of the license, including the associated impact on spent nuclear fuel, resulted in a revision in estimated cash flows for the Fermi 2 asset retirement obligation of approximately $
22 million
in 2011. It is estimated that the cost of decommissioning Fermi 2 is $
1.5 billion
in 2012 dollars and $
10 billion
in 2045 dollars, using a
6%
inflation rate. Approximately $
1.5 billion
of the asset retirement obligations represent nuclear decommissioning liabilities that are funded through a surcharge to electric customers over the life of the Fermi 2 nuclear plant.
The NRC has jurisdiction over the decommissioning of nuclear power plants and requires minimum decommissioning funding based upon a formula. The MPSC and FERC regulate the recovery of costs of decommissioning nuclear power plants and both require the use of external trust funds to finance the decommissioning of Fermi 2. Rates approved by the MPSC provide for the recovery of decommissioning costs of Fermi 2 and the disposal of low-level radioactive waste. DTE Electric is continuing to fund FERC jurisdictional amounts for decommissioning even though explicit provisions are not included in FERC rates. The Company believes the MPSC and FERC collections will be adequate to fund the estimated cost of decommissioning. The decommissioning assets, anticipated earnings thereon and future revenues from decommissioning collections will be used to decommission Fermi 2. The Company expects the liabilities to be reduced to
zero
at the conclusion of the decommissioning activities. If amounts remain in the trust funds for Fermi 2 following the completion of the decommissioning activities, those amounts will be disbursed based on rulings by the MPSC and FERC.
A portion of the funds recovered through the Fermi 2 decommissioning surcharge and deposited in external trust accounts is designated for the removal of non-radioactive assets and returning the site to greenfield. This removal and greenfielding is not considered a legal liability. Therefore, it is not included in the asset retirement obligation, but is reflected as the nuclear
75
decommissioning liability. The decommissioning of Fermi 1 is funded by DTE Electric. Contributions to the Fermi 1 trust are discretionary. See Note 3 for additional discussion of Nuclear Decommissioning Trust Fund Assets.
Regulation
DTE Electric and DTE Gas are subject to the regulatory jurisdiction of the MPSC, which issues orders pertaining to rates, recovery of certain costs, including the costs of generating facilities and regulatory assets, conditions of service, accounting and operating-related matters. DTE Electric is also regulated by the FERC with respect to financing authorization and wholesale electric activities. Regulation results in differences in the application of generally accepted accounting principles between regulated and non-regulated businesses.
The Company is unable to predict the outcome of the unresolved regulatory matters discussed herein. Resolution of these matters is dependent upon future MPSC orders and appeals, which may materially impact the financial position, results of operations and cash flows of the Company.
Regulatory Assets and Liabilities
DTE Electric and DTE Gas are required to record regulatory assets and liabilities for certain transactions that would have been treated as revenue or expense in non-regulated businesses. Continued applicability of regulatory accounting treatment requires that rates be designed to recover specific costs of providing regulated services and be charged to and collected from customers. Future regulatory changes or changes in the competitive environment could result in the discontinuance of this accounting treatment for regulatory assets and liabilities for some or all of our businesses and may require the write-off of the portion of any regulatory asset or liability that was
no
longer probable of recovery through regulated rates. Management believes that currently available facts support the continued use of regulatory assets and liabilities and that all regulatory assets and liabilities are recoverable or refundable in the current rate environment.
The following are balances and a brief description of the regulatory assets and liabilities at December 31:
|
2012
|
2011
|
||||||
|
(In millions)
|
|||||||
|
Assets
|
|||||||
|
Recoverable pension and postretirement costs:
|
|||||||
|
Pension
|
$
|
2,420
|
|
$
|
2,208
|
|
|
|
Postretirement costs
|
426
|
|
778
|
|
|||
|
Asset retirement obligation
|
424
|
|
420
|
|
|||
|
Recoverable Michigan income taxes
|
304
|
|
324
|
|
|||
|
Recoverable income taxes related to securitized regulatory assets
|
226
|
|
316
|
|
|||
|
Cost to achieve Performance Excellence Process
|
96
|
|
116
|
|
|||
|
Accrued PSCR/GCR revenue
|
87
|
|
147
|
|
|||
|
Other recoverable income taxes
|
76
|
|
81
|
|
|||
|
Choice incentive mechanism
|
66
|
|
166
|
|
|||
|
Unamortized loss on reacquired debt
|
63
|
|
64
|
|
|||
|
Deferred environmental costs
|
58
|
|
49
|
|
|||
|
Recoverable restoration expense
|
49
|
|
58
|
|
|||
|
Recoverable revenue decoupling
|
28
|
|
18
|
|
|||
|
Enterprise Business Systems costs
|
16
|
|
18
|
|
|||
|
Other
|
78
|
|
90
|
|
|||
|
4,417
|
|
4,853
|
|
||||
|
Less amount included in current assets
|
(182
|
)
|
(314
|
)
|
|||
|
$
|
4,235
|
|
$
|
4,539
|
|
||
|
Securitized regulatory assets
|
$
|
413
|
|
$
|
577
|
|
|
76
|
2012
|
2011
|
||||||
|
(In millions)
|
|||||||
|
Liabilities
|
|||||||
|
Asset removal costs
|
$
|
439
|
|
$
|
419
|
|
|
|
Renewable energy
|
230
|
|
192
|
|
|||
|
Refundable revenue decoupling/deferred gain
|
127
|
|
127
|
|
|||
|
Negative pension offset
|
105
|
|
120
|
|
|||
|
Refundable income taxes
|
56
|
|
66
|
|
|||
|
Over recovery of Securitization
|
54
|
|
53
|
|
|||
|
Refundable uncollectible expense
|
37
|
|
31
|
|
|||
|
Energy Optimization
|
34
|
|
34
|
|
|||
|
Accrued PSCR/GCR refund
|
16
|
|
26
|
|
|||
|
Fermi 2 refueling outage
|
12
|
|
23
|
|
|||
|
Low Income Energy Efficiency Fund
|
—
|
|
26
|
|
|||
|
Other
|
10
|
|
9
|
|
|||
|
1,120
|
|
1,126
|
|
||||
|
Less amount included in current liabilities
|
(89
|
)
|
(107
|
)
|
|||
|
$
|
1,031
|
|
$
|
1,019
|
|
||
As noted below, certain regulatory assets for which costs have been incurred have been included (or are expected to be included, for costs incurred subsequent to the most recently approved rate case) in DTE Electric or DTE Gas’s rate base, thereby providing a return on invested costs (except as noted). Certain other regulatory assets are not included in rate base but accrue recoverable carrying charges until surcharges to collect the assets are billed. Certain regulatory assets do not result from cash expenditures and therefore do not represent investments included in rate base or have offsetting liabilities that reduce rate base.
ASSETS
|
•
|
Recoverable pension and postretirement costs
— Accounting rules for pension and other postretirement benefit costs require, among other things, the recognition in other comprehensive income of the actuarial gains or losses and the prior service costs that arise during the period but that are not immediately recognized as components of net periodic benefit costs. DTE Electric and DTE Gas record the impact of actuarial gains or losses and prior services costs as a regulatory asset since the traditional rate setting process allows for the recovery of pension and postretirement costs. The asset will reverse as the deferred items are amortized and recognized as components of net periodic benefit costs.
(a)
|
|
•
|
Asset retirement obligation
— This obligation is primarily for Fermi 2 decommissioning costs. The asset captures the timing differences between expense recognition and current recovery in rates and will reverse over the remaining life of the related plant.
(a)
|
|
•
|
Recoverable Michigan income taxes
—
In July 2007, the Michigan Business Tax (MBT) was enacted by the State of Michigan. State deferred tax liabilities were established for the Company’s utilities, and offsetting regulatory assets were recorded as the impacts of the deferred tax liabilities will be reflected in rates as the related taxable temporary differences reverse and flow through current income tax expense. In May 2011, the MBT was repealed and the Michigan Corporate Income Tax (MCIT) was enacted. The regulatory asset was remeasured to reflect the impact of the MCIT tax rate.
(a)
|
|
•
|
Recoverable income taxes related to securitized regulatory assets
— Receivable for the recovery of income taxes to be paid on the non-bypassable securitization bond surcharge. A non-bypassable securitization tax surcharge recovers the income tax over a
fourteen
-year period ending 2015. (a)
|
|
•
|
Cost to achieve Performance Excellence Process (PEP)
— The MPSC authorized the deferral of costs to implement the PEP. These costs consist of employee severance, project management and consultant support. These costs are amortized over a
ten
-year period beginning with the year subsequent to the year the costs were deferred.
|
77
|
•
|
Accrued PSCR/GCR revenue
— Receivable for the temporary under-recovery of and a return on fuel and purchased power costs incurred by DTE Electric which are recoverable through the PSCR mechanism and temporary under-recovery of and return on gas costs incurred by DTE Gas which are recoverable through the GCR mechanism.
|
|
•
|
Other recoverable income taxes
— Income taxes receivable from DTE Electric’s customers representing the difference in property-related deferred income taxes and amounts previously reflected in DTE Electric’s rates. This asset will reverse over the remaining life of the related plant.
(a)
|
|
•
|
Choice incentive mechanism
(CIM) — DTE Electric receivable for non-fuel revenues lost as a result of fluctuations in electric Customer Choice sales. The CIM was terminated in the October 20, 2011 MPSC order issued to DTE Electric.
|
|
•
|
Unamortized loss on reacquired debt
— The unamortized discount, premium and expense related to debt redeemed with a refinancing are deferred, amortized and recovered over the life of the replacement issue.
|
|
•
|
Deferred environmental costs
— The MPSC approved the deferral of investigation and remediation costs associated with DTE Gas's former MGP sites. Amortization of deferred costs is over a
ten
-year period beginning in the year after costs were incurred, with recovery (net of any insurance proceeds) through base rate filings. (a)
|
|
•
|
Recoverable restoration expense
— Receivable for the MPSC approved restoration expense tracking mechanism that tracks the difference between actual restoration expense and the amount provided for in base rates, recognized pursuant to the MPSC authorization. The restoration expense tracking mechanism was terminated in the October 20, 2011 MPSC order issued to DTE Electric.
|
|
•
|
Recoverable revenue decoupling
— Amounts recoverable from DTE Gas customers for the change in revenue resulting from the difference in weather-adjusted average sales per customer compared to the base level of average sales per customer established by the MPSC. The December 2012 order in DTE Gas' rate case requires the RDM be discontinued effective November 1, 2012. The order provides for a new RDM beginning in November 2013.
|
|
•
|
Enterprise Business Systems (EBS) costs
— The MPSC approved the deferral and amortization over
ten
years beginning in January 2009 of EBS costs that would otherwise be expensed.
|
|
•
|
Securitized regulatory assets
— The net book balance of the Fermi 2 nuclear plant was written off in 1998 and an equivalent regulatory asset was established. In 2001, the Fermi 2 regulatory asset and certain other regulatory assets were securitized pursuant to PA 142 and an MPSC order. A non-bypassable securitization bond surcharge recovers the securitized regulatory asset over a
fourteen
-year period ending in 2015.
|
_________________________________
|
(a)
|
Regulatory assets not earning a return or accruing carrying charges.
|
LIABILITIES
|
•
|
Asset removal costs
— The amount collected from customers for the funding of future asset removal activities.
|
|
•
|
Renewable energy —
Amounts collected in rates in excess of renewable energy expenditures.
|
|
•
|
Refundable revenue decoupling / deferred gain —
At December 31, 2011, amounts were accrued as refundable to DTE Electric customers for the change in revenue resulting from the difference between actual average sales per customer compared to the base level of average sales per customer established by the MPSC. In 2012, the revenue decoupling liability was reversed and a new regulatory liability representing DTE Electric's obligation to refund the resulting gain was accrued. See further discussion below.
|
|
•
|
Negative pension offset —
DTE Gas’ negative pension costs are not included as a reduction to its authorized rates; therefore, the Company is accruing a regulatory liability to eliminate the impact on earnings of the negative pension expense accrued. This regulatory liability will reverse to the extent DTE Gas’ pension expense is positive in future years.
|
|
•
|
Refundable income taxes
— Income taxes refundable to DTE Gas’ customers representing the difference in property-related deferred income taxes payable and amounts recognized pursuant to MPSC authorization.
|
78
|
•
|
Over recovery of Securitization
— Over recovery of securitization bond expenses.
|
|
•
|
Refundable uncollectible expense
(UETM )— DTE Electric and DTE Gas liability for the MPSC approved uncollectible expense tracking mechanism that tracks the difference in the fluctuation in uncollectible accounts and amounts recognized pursuant to the MPSC authorization. The UETM was terminated for DTE Electric in the October 20, 2011 MPSC rate case order and terminated for DTE Gas in the December 20, 2012 MPSC approval of the partial settlement agreement.
|
|
•
|
Energy Optimization (EO)
- Amounts collected in rates in excess of energy optimization expenditures.
|
|
•
|
Accrued PSCR/GCR refund
— Liability for the temporary over-recovery of and a return on power supply costs and transmission costs incurred by DTE Electric which are recoverable through the PSCR mechanism and temporary over-recovery of and a return on gas costs incurred by DTE Gas which are recoverable through the GCR mechanism.
|
|
•
|
Fermi 2 refueling outage
— Accrued liability for refueling outage at Fermi 2 pursuant to MPSC authorization.
|
|
•
|
Low Income Energy Efficiency Fund (LIEEF)
— Escrow of LIEEF funds collected by DTE Electric and DTE Gas as ordered by the MPSC pursuant to July 2011 Michigan Court of Appeals decision.
|
2009 Electric Rate Case Filing
-
Court of Appeals Decision/Refundable Deferred Gain
On April 10, 2012, the Michigan Court of Appeals (COA) issued a decision relating to an appeal of the January 2010 MPSC order in DTE Electric's January 2009 rate case filing.
The COA found that the record of evidence in the 2009 rate case order was insufficient to support the MPSC's authorization to recover costs for the pilot advanced metering infrastructure (AMI) program and remanded this matter to the MPSC. The MPSC had approved $
37 million
of rate base related to the AMI program in the January 2010 order. DTE Electric is currently operating its AMI program pursuant to the MPSC's approval set forth in its October 20, 2011 order, which was not reviewed by or subject to the COA's April 10, 2012 decision. On November 28, 2012, DTE Electric filed the necessary data and evidence to the MPSC supporting the AMI program expenditures. DTE Electric's AMI program expenditures are $
110 million
as of December 31, 2012, net of Department of Energy matching grant funds of $
60 million
.
The COA affirmed the use of a number of tracking mechanisms (restoration, line clearance, uncollectibles expense and choice incentive) and the peak demand computations approved in the January 2010 order. The COA also determined that the MPSC only had statutory authority to implement a Revenue Decoupling Mechanism (RDM) for gas providers, but not for electric providers, thereby reversing the MPSC's decision to authorize an RDM for DTE Electric. DTE Electric had accrued a total of $
127 million
of RDM refund liabilities for the 2010 and 2011 RDM reconciliation periods.
No
party appealed the COA decision regarding the RDM determination.
On August 1, 2012, DTE Electric filed an application for approval of accounting authority to defer for future amortization the gain resulting from the reversal of the Company's $
127 million
regulatory liability associated with the operation of the RDM. On August 14, 2012, the MPSC dismissed DTE Electric's initial pilot RDM reconciliation cases. On September 25, 2012, the MPSC issued an order approving the Company's accounting application. As described in the accounting application, DTE Electric will amortize the new regulatory liability to income, at a monthly rate of approximately $
10.6 million
, beginning January 2014. It is currently anticipated that with this accounting treatment, along with other cost saving measures, DTE Electric will not need to increase base rates until 2015. If DTE Electric's base rates are increased prior to January 1, 2015, the Company will cease amortization and refund to customers the remaining unamortized balance of the new regulatory liability.
Energy Optimization (EO) Plans
The EO plan is designed to help each customer class reduce their electric usage by: 1) building customer awareness of energy efficiency options and 2) offering a diverse set of programs and participation options that result in energy savings for each customer class.
In May 2012, DTE Electric and DTE Gas both filed separate applications for approval of their respective reconciliations
79
of their 2011 EO plan expenses. On October 31, 2012, the MPSC approved DTE Electric's reconciliation and on November 16, 2012, the MPSC approved DTE Gas' reconciliation. The MPSC orders also approved performance incentive surcharges for DTE Electric of $
8.4 million
and for DTE Gas of $
3.4 million
to be applied to customer bills rendered on and after January 1, 2013.
In August 2012, Detroit Edison and MichCon filed amended EO plans with the MPSC. DTE Electric's EO plan application proposed the recovery of EO expenditures for the period 2013-2015 of $
224 million
and DTE Gas' EO plan application proposed the recovery of EO expenditures for the period 2013-2015 of $
66 million
. Both applications requested approval of surcharges to recover these costs.
DTE Electric Restoration Expense Tracker Mechanism (RETM) and Line Clearance Tracker (LCT) Reconciliation
In January 2012, DTE Electric filed an application with the MPSC for approval of the reconciliation of its 2011 RETM and LCT. The Company's 2011 restoration expenses were higher than the amount provided in rates. Accordingly, DTE Electric requested net recovery of approximately $
44 million
. An MPSC order is expected in the first quarter of 2013.
DTE Electric Uncollectible Expense True-Up Mechanism (UETM)
In February 2012, DTE Electric filed an application with the MPSC for approval of its UETM for 2011 requesting authority to refund approximately $
9 million
consisting of costs related to 2011 uncollectible expense. An MPSC order is expected in the first quarter of 2013.
DTE Electric Choice Incentive Mechanism (CIM)
In January 2012, DTE Electric filed an application with the MPSC for approval of its CIM reconciliation for the period from January 1, 2011 through October 28, 2011, the termination date of the CIM pursuant to the October 20, 2011 MPSC rate order. On January 17, 2013, the MPSC approved a settlement agreement authorizing the Company to recover $
63 million
, plus interest, from its customers through a surcharge to be implemented over a
ten
-month period beginning March 2013 through December 2013.
Power Supply Cost Recovery Proceedings
The PSCR process is designed to allow DTE Electric to recover all of its power supply costs if incurred under reasonable and prudent policies and practices. DTE Electric's power supply costs include fuel and related transportation costs, purchased and net interchange power costs, nitrogen oxide and sulfur dioxide emission allowances costs, urea costs, transmission costs and MISO costs. The MPSC reviews these costs, policies and practices for prudence in annual plan and reconciliation filings.
2011 PSCR Year
-
In March 2012, DTE Electric filed the 2011 PSCR reconciliation calculating a net under-recovery of $
148 million
that includes an under-recovery of $
52.6 million
for the 2010 PSCR year. In addition, the 2011 PSCR reconciliation includes an over-refund of $
3.8 million
for the 2011 refund of the self-implementation rate increase related to the 2009 electric rate case filing and a credit of $
10.5 million
related to the expiration of a wholesale power sales contract.
2013 Plan Year
- In September 2012, DTE Electric filed its 2013 PSCR plan case seeking approval of a levelized PSCR factor of
4.74
mills/kWh above the amount included in base rates for all PSCR customers. The filing supports a total power supply expense forecast of $
1.5 billion
. The plan also includes approximately $
81 million
for the recovery of its projected 2012 PSCR under-recovery.
2012 Gas Rate Case Filing
DTE Gas filed a rate case on April 20, 2012 based on a projected test year for the
twelve
-month period ending October 31, 2013. The filing with the MPSC requested an increase in base rates of approximately $
77 million
that is required to recover higher costs associated with increased investments in plant, the impact of sales reductions due to customer losses and continuing conservation, and increasing operating costs, primarily pipeline integrity and leak remediation expenses. On October 24, 2012, DTE Gas filed notification with the MPSC indicating that it intended to self-implement $
27 million
of rate relief beginning in November 2012, suspend the RDM and terminate the monthly credit which was implemented to remove the Vulnerable Household Warmth Fund collections from rates. On December 20, 2012, the MPSC approved a partial settlement agreement and authorized the Company to increase its annual gas revenues by $
19.9 million
for service rendered on and after
80
January 1, 2013. A refund liability of approximately $
1 million
, representing the difference between the final ordered rate relief and the self- implemented revenue, was accrued as of December 31, 2012.
The case also included a proposal for an infrastructure recovery mechanism (IRM) designed to recover DTE Gas' projected costs related to its gas main renewal and meter move out programs. The approved settlement did not resolve the IRM which will continue to be litigated with an order expected by April 2013.
DTE Gas UETM
In March 2012, DTE Gas filed an application with the MPSC for approval of its UETM for 2011 requesting authority to refund approximately $
7 million
,
consisting of a $
19 million
over-recovery related to 2011 uncollectible expense, partially offset by $
12 million
related to the 2010 UETM under-recovery. In September 2012, the MPSC approved a settlement agreement approving the net refund of $
7 million
and the implementation of credits and surcharges over a
twelve
-month period beginning in November 2012. The December 2012 order in DTE Gas' rate case requires the UETM be terminated effective November 1, 2012 and the reconciliation to be filed by March 31, 2013. DTE Gas accrued a refund obligation of approximately $
20 million
for the 2012 over-recovery.
DTE Gas Revenue Decoupling Mechanism (RDM)
In September 2011, DTE Gas filed an application with the MPSC for approval of its RDM reconciliation for the period July 1, 2010 through June 30, 2011. DTE Gas' RDM application proposed the recovery of approximately $
20 million
. On July 13, 2012, the MPSC approved a settlement agreement approving the RDM reconciliation and the implementation of a surcharge over a
twelve
-month period beginning in August 2012. As a result of the provisions of the settlement, during the quarter ended June 30, 2012, DTE Gas recognized an additional $
5 million
of revenue related to the 2010/2011 period and $
3 million
related to the 2011/2012 period.
In October 2012, DTE Gas filed an application with the MPSC for approval of its RDM reconciliation for the period July 1, 2011 through June 30, 2012. The application requests authority to adjust existing retail gas rates so as to collect a net amount of $
8.6 million
, plus interest. An order is expected in the first quarter of 2013.
The December 2012 order in DTE Gas' rate case requires the RDM be discontinued effective November 1, 2012 and a reconciliation be filed by October 31, 2013. DTE Gas recognized approximately $
5 million
for the under-recovery during the July through October 2012 period. The order provides for a new RDM beginning in November 2013 for the period November 1, 2013 through October 31, 2014. The new RDM decouples weather normalized distribution revenue inside caps. The caps are tied to expected conservation targets:
1.125%
in the first reconciliation period and
2.25%
for the second and future periods.
DTE Gas Depreciation Filing
In June 2012, DTE Gas filed a depreciation study, as ordered by the MPSC, indicating an annual depreciation expense increase of $
12.4 million
. Pursuant to the December 2012 order in DTE Gas' rate case, the final approved depreciation rates will be implemented in conjunction with the MPSC's order in DTE Gas' next general rate case. Management cannot predict when DTE Gas will file its next rate case.
Gas Cost Recovery Proceedings
The GCR process is designed to allow DTE Gas to recover all of its gas supply costs if incurred under reasonable and prudent policies and practices. The MPSC reviews these costs, policies and practices for prudence in annual plan and reconciliation filings.
2010-2011 GCR Year
- An MPSC order was issued on August 14, 2012 approving the GCR reconciliation for the
twelve
-month period ended March 31, 2011. The MPSC authorized DTE Gas to include in its 2011-2012 GCR reconciliation beginning balance the net over-recovery of approximately $
6 million
.
2011-2012 GCR Year
- In June 2012, DTE Gas filed its GCR reconciliation for the
twelve
months ending March 31, 2012 calculating a net under-recovery of $
6.4 million
.
Gas Recovery of Costs to Achieve (CTA) Performance Excellence Process
81
DTE Gas incurred CTA restructuring expense during a review of its operations which began in 2005. In September 2006, the MPSC issued an order approving a settlement agreement that allowed DTE Electric and DTE Gas, commencing in 2006, to defer the incremental CTA. Further, the order provided for DTE Electric and DTE Gas to amortize the CTA deferrals over a
ten
-year period beginning with the year subsequent to the year the CTA was deferred. The September 2006 order did not provide a regulatory recovery mechanism for DTE Gas, therefore DTE Gas expensed CTA incurred during the period 2006 through 2008. A June 2010 MPSC order provided for DTE Gas’ recovery of the regulatory unamortized balance of CTA. DTE Gas deferred and recognized in income approximately $
32 million
($
20 million
after-tax) of previously expensed CTA in 2010.
Income Tax Summary
The Company files a consolidated federal income tax return. Total income tax expense varied from the statutory federal income tax rate for the following reasons:
|
2012
|
2011
|
2010
|
|||||||||
|
(In millions)
|
|||||||||||
|
Income before income taxes
|
$
|
960
|
|
$
|
991
|
|
$
|
962
|
|
||
|
Income tax expense at 35% statutory rate
|
$
|
336
|
|
$
|
347
|
|
$
|
337
|
|
||
|
Production tax credits
|
(49
|
)
|
(6
|
)
|
(33
|
)
|
|||||
|
Investment tax credits
|
(6
|
)
|
(6
|
)
|
(6
|
)
|
|||||
|
Depreciation
|
(4
|
)
|
(4
|
)
|
(4
|
)
|
|||||
|
Employee Stock Ownership Plan dividends
|
(4
|
)
|
(4
|
)
|
(5
|
)
|
|||||
|
Domestic production activities deduction
|
(14
|
)
|
(7
|
)
|
(7
|
)
|
|||||
|
Settlement of Federal tax audit
|
—
|
|
—
|
|
(12
|
)
|
|||||
|
State and local income taxes, net of federal benefit
|
37
|
|
37
|
|
44
|
|
|||||
|
Enactment of Michigan Corporate Income Tax, net of federal expense
|
—
|
|
(87
|
)
|
—
|
|
|||||
|
Other, net
|
(10
|
)
|
(2
|
)
|
1
|
|
|||||
|
Income tax expense
|
$
|
286
|
|
$
|
268
|
|
$
|
315
|
|
||
|
Effective income tax rate
|
29.8
|
%
|
27.0
|
%
|
32.7
|
%
|
|||||
Components of income tax expense were as follows:
|
2012
|
2011
|
2010
|
|||||||||
|
Current income tax expense (benefit)
|
(In millions)
|
||||||||||
|
Federal
|
$
|
190
|
|
$
|
27
|
|
$
|
(168
|
)
|
||
|
State and other income tax
|
49
|
|
21
|
|
26
|
|
|||||
|
Total current income taxes
|
239
|
|
48
|
|
(142
|
)
|
|||||
|
Deferred income tax expense (benefit)
|
|||||||||||
|
Federal
|
39
|
|
318
|
|
415
|
|
|||||
|
State and other income tax
|
8
|
|
(98
|
)
|
42
|
|
|||||
|
Total deferred income taxes
|
47
|
|
220
|
|
457
|
|
|||||
|
Total income taxes from continuing operations
|
286
|
|
268
|
|
315
|
|
|||||
|
Discontinued operations
|
(29
|
)
|
(1
|
)
|
(4
|
)
|
|||||
|
Total
|
$
|
257
|
|
$
|
267
|
|
$
|
311
|
|
||
Deferred tax assets and liabilities are recognized for the estimated future tax effect of temporary differences between the tax basis of assets or liabilities and the reported amounts in the financial statements. Deferred tax assets and liabilities are classified as current or noncurrent according to the classification of the related assets or liabilities. Deferred tax assets and liabilities not related to assets or liabilities are classified according to the expected reversal date of the temporary differences. Consistent with rate making treatment, deferred taxes are offset in the table below for temporary differences which have related regulatory assets and liabilities.
Deferred tax assets (liabilities) were comprised of the following at December 31:
82
|
2012
|
2011
|
||||||
|
(In millions)
|
|||||||
|
Property, plant and equipment
|
$
|
(3,389
|
)
|
$
|
(3,131
|
)
|
|
|
Securitized regulatory assets
|
(256
|
)
|
(360
|
)
|
|||
|
Alternative minimum tax credit carry-forwards
|
254
|
|
294
|
|
|||
|
Merger basis differences
|
42
|
|
50
|
|
|||
|
Pension and benefits
|
(33
|
)
|
(39
|
)
|
|||
|
Other comprehensive income
|
101
|
|
99
|
|
|||
|
Derivative assets and liabilities
|
66
|
|
64
|
|
|||
|
State net operating loss and credit carry-forwards
|
37
|
|
30
|
|
|||
|
Other
|
41
|
|
(45
|
)
|
|||
|
(3,137
|
)
|
(3,038
|
)
|
||||
|
Less valuation allowance
|
(33
|
)
|
(27
|
)
|
|||
|
$
|
(3,170
|
)
|
$
|
(3,065
|
)
|
||
|
Current deferred income tax assets
|
$
|
21
|
|
$
|
51
|
|
|
|
Long-term deferred income tax liabilities
|
(3,191
|
)
|
(3,116
|
)
|
|||
|
$
|
(3,170
|
)
|
$
|
(3,065
|
)
|
||
|
Deferred income tax assets
|
$
|
1,038
|
|
$
|
1,048
|
|
|
|
Deferred income tax liabilities
|
(4,208
|
)
|
(4,113
|
)
|
|||
|
$
|
(3,170
|
)
|
$
|
(3,065
|
)
|
||
Production tax credits earned in prior years but not utilized totaled $
254 million
and are carried forward indefinitely as alternative minimum tax credits. The majority of the production tax credits earned, including all of those from our synfuel projects, were generated from projects that had received a private letter ruling (PLR) from the Internal Revenue Service (IRS). These PLRs provide assurance as to the appropriateness of using these credits to offset taxable income, however, these tax credits are subject to IRS audit and adjustment.
The above table excludes deferred tax liabilities associated with unamortized investment tax credits that are shown separately on the Consolidated Statements of Financial Position. Investment tax credits are deferred and amortized to income over the average life of the related property.
The Company has state deferred tax assets related to net operating loss and credit carry-forwards of $
37 million
and $
30 million
at
December 31, 2012
and
2011
, respectively. The state net operating loss and credit carry-forwards expire from 2013 through 2031. The Company has recorded valuation allowances at
December 31, 2012
and
2011
of approximately $
33 million
and $
27 million
, respectively, with respect to these deferred tax assets. In assessing the realizability of deferred tax assets, the Company considers whether it is more likely than not that some portion or all of the deferred tax assets will not be realized. The ultimate realization of deferred tax assets is dependent upon the generation of future taxable income during the periods in which those temporary differences become deductible.
Uncertain Tax Positions
A reconciliation of the beginning and ending amount of unrecognized tax benefits is as follows:
|
2012
|
2011
|
2010
|
|||||||||
|
(In millions)
|
|||||||||||
|
Balance at January 1
|
$
|
48
|
|
$
|
28
|
|
$
|
81
|
|
||
|
Additions for tax positions of prior years
|
—
|
|
27
|
|
4
|
|
|||||
|
Reductions for tax positions of prior years
|
(2
|
)
|
(4
|
)
|
(4
|
)
|
|||||
|
Additions for tax positions of current year
|
1
|
|
1
|
|
—
|
|
|||||
|
Settlements
|
(30
|
)
|
(3
|
)
|
(53
|
)
|
|||||
|
Lapse of statute of limitations
|
(6
|
)
|
(1
|
)
|
—
|
|
|||||
|
Balance at December 31
|
$
|
11
|
|
$
|
48
|
|
$
|
28
|
|
||
The Company had $
3 million
and $
4 million
of unrecognized tax benefits at
December 31, 2012
and at
December 31, 2011
, respectively, that, if recognized, would favorably impact its effective tax rate. During the next
twelve
months, it is reasonably possible that the Company will settle certain federal and state tax examinations and audits. As a result, the
83
Company believes that it is possible that there will be a decrease in unrecognized tax benefits of up to $
1 million
within the next
twelve
months.
The Company recognizes interest and penalties pertaining to income taxes in Interest expense and Other expenses, respectively, on its Consolidated Statements of Operations. Accrued interest pertaining to income taxes totaled $
1 million
and $
2 million
at
December 31, 2012
and
December 31, 2011
, respectively. The Company had
no
accrued penalties pertaining to income taxes. The Company recognized interest expense (income) related to income taxes of $
(1) million
, $
(2) million
and $
1 million
in 2012, 2011 and 2010, respectively.
In 2012, the Company settled a federal tax audit for the 2009 and 2010 tax years, which resulted in the recognition of $
30 million
of unrecognized tax benefits. The Company's federal income tax returns for 2011 and subsequent years remain subject to examination by the IRS. The Company's Michigan Business Tax returns for the year 2008 and subsequent years remain subject to examination by the State of Michigan. The Company also files tax returns in numerous state and local jurisdictions with varying statutes of limitation.
Michigan Corporate Income Tax (MCIT)
On May 25, 2011, the Michigan Business Tax (MBT) was repealed and the MCIT was enacted and became effective January 1, 2012. The MCIT subjects corporations with business activity in Michigan to a
6 percent
tax rate on an apportioned income tax base and eliminates the modified gross receipts tax and nearly all credits available under the MBT. The MCIT also eliminated the future deductions allowed under MBT that enabled companies to establish a
one
-time deferred tax asset upon enactment of the MBT to offset deferred tax liabilities that resulted from enactment of the MBT.
As a result of the enactment of the MCIT, the net state deferred tax liability was remeasured to reflect the impact of the MCIT tax rate on cumulative temporary differences expected to reverse after the effective date. The net impact of this remeasurement was a decrease in deferred income tax liabilities of $
36 million
attributable to our regulated utilities that was offset against the regulatory asset established upon the enactment of the MBT. Due to the elimination of the future tax deductions allowed under the MBT, the
one
-time MBT deferred tax asset that was established upon the enactment of the MBT has been remeasured to
zero
. The net impact of this remeasurement is a reduction of the net deferred tax assets of $
308 million
, with $
395 million
of this decrease in deferred tax assets attributable to our regulated utilities, partially offset by an $
87 million
decrease in deferred tax liabilities attributable to our non-utilities. The $
395 million
decrease in deferred tax assets at our regulated utilities was offset against the regulatory liabilities established upon enactment of the MBT. The $
87 million
is primarily due to a lower apportionment factor from inclusion of non-utility entities in DTE Energy's unitary Michigan tax return and was recognized as a reduction to income tax expense in 2011.
Consistent with the original establishment of these deferred tax liabilities (assets),
no
recognition of these non-cash transactions have been reflected in the Consolidated Statements of Cash Flows.
Common Stock
On June 18, 2012, the Company contributed $
80 million
of DTE Energy common stock to the DTE Energy Company Affiliates Employee Benefit Plans Master Trust. The common stock was valued using the closing market price of DTE Energy common stock on that date in accordance with fair value measurement and accounting requirements.
In March 2010, the Company contributed $
100 million
of DTE Energy common stock to the DTE Energy Company Affiliates Employee Benefit Plans Master Trust. The common stock was contributed over
four
business days from March 26, 2010 through March 31, 2010 and was valued using the closing market prices of DTE Energy common stock on each of those days in accordance with fair value measurement and accounting requirements.
Under the DTE Energy Company Long-Term Incentive Plan, the Company grants non-vested stock awards to key employees, primarily management. As a result of a stock award, a settlement of an award of performance shares, or by exercise of a participant’s stock option, the Company may deliver common stock from the Company’s authorized but unissued common stock and/or from outstanding common stock acquired by or on behalf of the Company in the name of the participant.
Dividends
84
Certain of the Company’s credit facilities contain a provision requiring the Company to maintain a total funded debt to capitalization ratio, as defined in the agreements, of no more than
0.65
to
1
, which has the effect of limiting the amount of dividends the Company can pay in order to maintain compliance with this provision. See Note 17 for a definition of this ratio. The effect of this provision was to restrict the payment of approximately $
239 million
at December 31, 2012 of total retained earnings of approximately $
4 billion
. There are
no
other effective limitations with respect to the Company’s ability to pay dividends.
85
The Company reports both basic and diluted earnings per share. The calculation of diluted earnings per share assumes the issuance of potentially dilutive common shares outstanding during the period from the exercise of stock options. A reconciliation of both calculations is presented in the following table as of December 31:
|
2012
|
2011
|
2010
|
|||||||||
|
(In millions, expect per share amounts)
|
|||||||||||
|
Basic Earnings per Share
|
|||||||||||
|
Net income attributable to DTE Energy Company
|
$
|
610
|
|
$
|
711
|
|
$
|
630
|
|
||
|
Average number of common shares outstanding
|
171
|
|
169
|
|
168
|
|
|||||
|
Weighted average net restricted shares outstanding
|
1
|
|
1
|
|
1
|
|
|||||
|
Dividends declared — common shares
|
$
|
413
|
|
$
|
392
|
|
$
|
365
|
|
||
|
Dividends declared — net restricted shares
|
1
|
|
1
|
|
2
|
|
|||||
|
Total distributed earnings
|
$
|
414
|
|
$
|
393
|
|
$
|
367
|
|
||
|
Net income less distributed earnings
|
$
|
196
|
|
$
|
318
|
|
$
|
263
|
|
||
|
Distributed (dividends per common share)
|
$
|
2.42
|
|
$
|
2.32
|
|
$
|
2.18
|
|
||
|
Undistributed
|
1.14
|
|
1.87
|
|
1.57
|
|
|||||
|
Total Basic Earnings per Common Share
|
$
|
3.56
|
|
$
|
4.19
|
|
$
|
3.75
|
|
||
|
Diluted Earnings per Share
|
|||||||||||
|
Net income attributable to DTE Energy Company
|
$
|
610
|
|
$
|
711
|
|
$
|
630
|
|
||
|
Average number of common shares outstanding
|
171
|
|
169
|
|
168
|
|
|||||
|
Average incremental shares from assumed exercise of options
|
1
|
|
1
|
|
1
|
|
|||||
|
Common shares for dilutive calculation
|
172
|
|
170
|
|
169
|
|
|||||
|
Weighted average net restricted shares outstanding
|
1
|
|
1
|
|
1
|
|
|||||
|
Dividends declared — common shares
|
$
|
413
|
|
$
|
392
|
|
$
|
365
|
|
||
|
Dividends declared — net restricted shares
|
1
|
|
1
|
|
2
|
|
|||||
|
Total distributed earnings
|
$
|
414
|
|
$
|
393
|
|
$
|
367
|
|
||
|
Net income less distributed earnings
|
$
|
196
|
|
$
|
318
|
|
$
|
263
|
|
||
|
Distributed (dividends per common share)
|
$
|
2.42
|
|
$
|
2.32
|
|
$
|
2.18
|
|
||
|
Undistributed
|
1.13
|
|
1.86
|
|
1.56
|
|
|||||
|
Total Diluted Earnings per Common Share
|
$
|
3.55
|
|
$
|
4.18
|
|
$
|
3.74
|
|
||
Options to purchase approximately
5 million
shares of common stock in 2010 were not included in the computation of diluted earnings per share because the options’ exercise price was greater than the average market price of the common shares, thus making these options anti-dilutive.
86
Long-Term Debt
The Company’s long-term debt outstanding and weighted average interest rates (a) of debt outstanding at December 31 were:
|
2012
|
2011
|
||||||
|
(In millions)
|
|||||||
|
Mortgage bonds, notes, and other
|
|||||||
|
DTE Energy Debt, Unsecured
|
|||||||
|
5.4% due 2013 to 2033
|
$
|
1,298
|
|
$
|
1,298
|
|
|
|
DTE Electric Taxable Debt, Principally Secured
|
|||||||
|
5.0% due 2013 to 2042
|
3,777
|
|
3,515
|
|
|||
|
DTE Electric Tax-Exempt Revenue Bonds (b)
|
|||||||
|
5.3% due 2014 to 2038
|
707
|
|
893
|
|
|||
|
DTE Gas Taxable Debt, Principally Secured
|
|||||||
|
5.6% due 2013 to 2042
|
919
|
|
889
|
|
|||
|
Other Long-Term Debt, Including Non-Recourse Debt
|
153
|
|
165
|
|
|||
|
6,854
|
|
6,760
|
|
||||
|
Less amount due within one year
|
(634
|
)
|
(355
|
)
|
|||
|
$
|
6,220
|
|
$
|
6,405
|
|
||
|
Securitization bonds
|
|||||||
|
6.6% due 2013 to 2015
|
$
|
479
|
|
$
|
643
|
|
|
|
Less amount due within one year
|
(177
|
)
|
(164
|
)
|
|||
|
$
|
302
|
|
$
|
479
|
|
||
|
Junior Subordinated Debentures
|
|||||||
|
6.5% due 2061
|
$
|
280
|
|
$
|
280
|
|
|
|
5.25% due 2062
|
200
|
|
—
|
|
|||
|
$
|
480
|
|
$
|
280
|
|
||
_______________________________________
|
(a)
|
Weighted average interest rates as of
December 31, 2012
are shown below the description of each category of debt.
|
|
(b)
|
DTE Electric Tax-Exempt Revenue Bonds are issued by a public body that loans the proceeds to DTE Electric on terms substantially mirroring the Revenue Bonds.
|
Debt Issuances
In 2012, the Company issued the following long-term debt:
|
Company
|
Month Issued
|
Type
|
Interest Rate
|
Maturity
|
Amount
|
||||||||
|
(In millions)
|
|||||||||||||
|
DTE Electric
|
June
|
Mortgage Bonds (a)
|
2.65
|
%
|
2022
|
$
|
250
|
|
|||||
|
DTE Electric
|
June
|
Mortgage Bonds (a)
|
3.95
|
%
|
2042
|
250
|
|
||||||
|
DTE Energy
|
October
|
Junior Subordinated Debentures (b)
|
5.25
|
%
|
2062
|
200
|
|
||||||
|
DTE Gas
|
December
|
Mortgage Bonds (c)
|
3.92
|
%
|
2042
|
70
|
|
||||||
|
$
|
770
|
|
|||||||||||
_______________________________________
|
(a)
|
Proceeds were used for the early redemption of DTE Electric long-term debt; for the repayment of short-term borrowings; and for general corporate purposes.
|
|
(b)
|
Proceeds were used to pay a portion of the purchase price for a portfolio of on-site energy projects; for the repayment of short-term borrowings; and for general corporate purposes.
|
|
(c)
|
Proceeds were used for general corporate purposes.
|
Debt Redemptions
In 2012, the following debt was redeemed:
87
|
Company
|
Month
|
Type
|
Interest Rate
|
Maturity
|
Amount
|
||||||||
|
(In millions)
|
|||||||||||||
|
DTE Electric
|
March/September
|
Securitization Bonds
|
6.42
|
%
|
2012
|
$
|
164
|
|
|||||
|
DTE Electric
|
April
|
Mortgage Bonds
|
7.90
|
%
|
2012
|
10
|
|
||||||
|
DTE Electric
|
April
|
Mortgage Bonds
|
8.36
|
%
|
2012
|
3
|
|
||||||
|
DTE Gas
|
May
|
Secured Medium Term Notes
|
7.06
|
%
|
2012
|
40
|
|
||||||
|
DTE Electric
|
July
|
Senior Notes
|
5.20
|
%
|
2012
|
225
|
|
||||||
|
DTE Electric
|
December
|
Tax Exempt Revenue Bonds (a)
|
3.05
|
%
|
2024
|
65
|
|
||||||
|
DTE Electric
|
December
|
Tax Exempt Revenue Bonds (a)
|
5.45
|
%
|
2032
|
64
|
|
||||||
|
DTE Electric
|
December
|
Tax Exempt Revenue Bonds (a)
|
5.25
|
%
|
2032
|
56
|
|
||||||
|
DTE Energy
|
Various
|
Other Long-Term Debt
|
Various
|
|
2012
|
12
|
|
||||||
|
$
|
639
|
|
|||||||||||
_______________________________________
|
(a)
|
DTE Electric Tax Exempt Revenue Bonds are issued by a public body that loans the proceeds to DTE Electric on terms substantially mirroring the Revenue Bonds.
|
The following table shows the scheduled debt maturities, excluding any unamortized discount or premium on debt:
|
2013
|
2014
|
2015
|
2016
|
2017
|
2018 and
Thereafter
|
Total
|
|||||||||||||||||||||
|
(In millions)
|
|||||||||||||||||||||||||||
|
Amount to mature
|
$
|
811
|
|
$
|
891
|
|
$
|
476
|
|
$
|
465
|
|
$
|
9
|
|
$
|
5,166
|
|
$
|
7,818
|
|
||||||
Junior Subordinated Debentures
At December 31, 2012, the Company had $
280 million
of
6.5%
Junior Subordinated Debentures due 2061 and $
200 million
of
5.25%
Junior Subordinated Debentures due 2062. The Company has the right to defer interest payments on the debt securities. Should the Company exercise this right, it cannot declare or pay dividends on, or redeem, purchase or acquire, any of its capital stock during the deferral period. Any deferred interest payments will bear additional interest at the rate associated with the related debt issue.
Cross Default Provisions
Substantially all of the net utility properties of DTE Electric and DTE Gas are subject to the lien of mortgages. Should DTE Electric or DTE Gas fail to timely pay their indebtedness under these mortgages, such failure may create cross defaults in the indebtedness of DTE Energy.
As of
December 31, 2012
, the amount of authorized and unissued stock is as follows:
|
Company
|
Type of Stock
|
Par Value
|
Shares Authorized
|
||||||
|
DTE Energy
|
Preferred
|
$
|
—
|
|
5,000,000
|
|
|||
|
DTE Electric
|
Preferred
|
$
|
100
|
|
6,747,484
|
|
|||
|
DTE Electric
|
Preference
|
$
|
1
|
|
30,000,000
|
|
|||
|
DTE Gas
|
Preferred
|
$
|
1
|
|
7,000,000
|
|
|||
|
DTE Gas
|
Preference
|
$
|
1
|
|
4,000,000
|
|
|||
DTE Energy and its wholly owned subsidiaries, DTE Electric and DTE Gas, have unsecured revolving credit agreements with a syndicate of
20
banks that may be used for general corporate borrowings, but are intended to provide liquidity support for each of the companies’ commercial paper programs. No
one
bank provides more than
8.5%
of the commitment in any facility. Borrowings under the facilities are available at prevailing short-term interest rates. Additionally, DTE Energy has other facilities to support letter of credit issuance.
88
The agreements require the Company to maintain a total funded debt to capitalization ratio of no more than
0.65
to
1
. In the agreements, “total funded debt” means all indebtedness of the Company and its consolidated subsidiaries, including capital lease obligations, hedge agreements and guarantees of third parties’ debt, but excluding contingent obligations, nonrecourse and junior subordinated debt and certain equity-linked securities and, except for calculations at the end of the second quarter, certain DTE Gas short-term debt. “Capitalization” means the sum of (a) total funded debt plus (b) “consolidated net worth,” which is equal to consolidated total stockholders’ equity of the Company and its consolidated subsidiaries (excluding pension effects under certain FASB statements), as determined in accordance with accounting principles generally accepted in the United States of America. At
December 31, 2012
, the total funded debt to total capitalization ratios for DTE Energy, DTE Electric and DTE Gas are
0.48
to
1
,
0.52
to
1
and
0.46
to
1
, respectively, and are in compliance with this financial covenant. The availability under these combined facilities at
December 31, 2012
is shown in the following table:
|
DTE Energy
|
DTE Electric
|
DTE Gas
|
Total
|
||||||||||||
|
(In millions)
|
|||||||||||||||
|
Unsecured letter of credit facility, expiring in May 2013
|
50
|
|
—
|
|
—
|
|
50
|
|
|||||||
|
Unsecured letter of credit facility, expiring in August 2015
|
125
|
|
—
|
|
—
|
|
125
|
|
|||||||
|
Unsecured revolving credit facility, expiring October 2016
|
1,100
|
|
300
|
|
400
|
|
1,800
|
|
|||||||
|
Total credit facilities at December 31, 2012
|
$
|
1,275
|
|
$
|
300
|
|
$
|
400
|
|
$
|
1,975
|
|
|||
|
Amounts outstanding at December 31, 2012:
|
|||||||||||||||
|
Commercial paper issuances
|
—
|
|
130
|
|
110
|
|
240
|
|
|||||||
|
Letters of credit
|
175
|
|
—
|
|
—
|
|
175
|
|
|||||||
|
175
|
|
130
|
|
110
|
|
415
|
|
||||||||
|
Net availability at December 31, 2012
|
$
|
1,100
|
|
$
|
170
|
|
$
|
290
|
|
$
|
1,560
|
|
|||
The Company has other outstanding letters of credit which are not included in the above described facilities totaling approximately $
73 million
which are used for various corporate purposes.
The weighted average interest rate for short-term borrowings was
0.4%
and
0.5%
at
December 31, 2012
and
2011
, respectively.
In conjunction with maintaining certain exchange traded risk management positions, the Company may be required to post cash collateral with its clearing agent. The Company has a demand financing agreement for up to
$100 million
with its clearing agent. The agreement, as amended, also allows for up to
$50 million
of additional margin financing provided that the Company posts a letter of credit for the incremental amount. At
December 31, 2012
, a
$40 million
letter of credit was in place, raising the capacity under this facility to
$140 million
. The
$40 million
letter of credit is included in the table above. The amount outstanding under this agreement was
$65 million
and
$56 million
at
December 31, 2012
and
December 31, 2011
, respectively.
Lessee
— The Company leases various assets under capital and operating leases, including coal railcars, office buildings, a warehouse, computers, vehicles and other equipment. The Company has also entered into various power purchase agreements which meet the criteria of capital and operating leases. The lease arrangements expire at various dates through 2032. Future minimum lease payments under non-cancelable leases at
December 31, 2012
were:
89
|
Capital
Leases
|
Operating
Leases
|
||||||
|
(In millions)
|
|||||||
|
2013
|
$
|
7
|
|
$
|
38
|
|
|
|
2014
|
5
|
|
31
|
|
|||
|
2015
|
5
|
|
25
|
|
|||
|
2016
|
3
|
|
21
|
|
|||
|
2017
|
—
|
|
20
|
|
|||
|
Thereafter
|
—
|
|
98
|
|
|||
|
Total minimum lease payments
|
$
|
20
|
|
$
|
233
|
|
|
|
Less imputed interest
|
2
|
|
|||||
|
Present value of net minimum lease payments
|
18
|
|
|||||
|
Less current portion
|
6
|
|
|||||
|
Non-current portion
|
$
|
12
|
|
||||
Rental expense for operating leases was $
36 million
in 2012, $
40 million
in 2011, and $
32 million
in 2010. Contingent rental payments of $
27 million
were incurred in 2012 related to power purchase agreements. The contingent payments are based upon delivery of energy and renewable energy credits, which are dependent upon future production.
Lessor
— The Company leases a portion of its pipeline system to the Vector Pipeline through a capital lease contract that expires in 2020, with renewal options extending for
five
years. The Company owns a
40%
interest in the Vector Pipeline. In addition, the Company has an energy services agreement, a portion of which is accounted for as a capital lease. The agreement expires in 2019, with a
three
or
five
year renewal option. The components of the net investment in the capital leases at
December 31, 2012
, were as follows:
|
(In millions)
|
|||
|
2013
|
$
|
12
|
|
|
2014
|
12
|
|
|
|
2015
|
12
|
|
|
|
2016
|
12
|
|
|
|
2017
|
12
|
|
|
|
Thereafter
|
31
|
|
|
|
Total minimum future lease receipts
|
91
|
|
|
|
Residual value of leased pipeline
|
40
|
|
|
|
Less unearned income
|
(48
|
)
|
|
|
Net investment in capital lease
|
83
|
|
|
|
Less current portion
|
(4
|
)
|
|
|
$
|
79
|
|
|
Environmental
Electric
Air -
DTE Electric is subject to the EPA ozone and fine particulate transport and acid rain regulations that limit power plant emissions of sulfur dioxide and nitrogen oxides. Since 2005, the EPA and the State of Michigan have issued additional emission reduction regulations relating to ozone, fine particulate, regional haze, mercury, and other air pollution. These rules have led to additional controls on fossil-fueled power plants to reduce nitrogen oxide, sulfur dioxide, mercury and other emissions. To comply with these requirements, DTE Electric has spent approximately $
1.9 billion
through 2012. The Company estimates DTE Electric will make capital expenditures of approximately $
335 million
in 2013 and up to approximately $
1.6 billion
of additional capital expenditures through 2020 based on current regulations. Further, additional rulemakings are expected over the next few years which could require additional controls for sulfur dioxide, nitrogen oxides and hazardous air pollutants. The Cross State Air Pollution Rule (CSAPR), finalized in July 2011, requires further reductions of sulfur dioxide and nitrogen oxides emissions beginning in 2012. On December 30, 2011, the U. S. Court of Appeals for the District of Columbia Circuit granted the motions to stay the rule, leaving DTE Electric temporarily subject to the previously existing Clean Air Interstate Rule (CAIR). On August 21, 2012, the Court issued its decision, vacating CSAPR and leaving
90
CAIR in place. The EPA's petition seeking a rehearing of the U.S. Court of Appeals' decision regarding the CSAPR was denied on January 24, 2013. The Electric Generating Unit Maximum Achievable Control Technology (EGU MACT) Rule was finalized on December 16, 2011. The EGU MACT requires reductions of mercury and other hazardous air pollutants beginning in 2015. Because these rules were recently finalized and technologies to comply are still being tested, it is not possible to quantify the impact of these rulemakings.
In July 2009, DTE Energy received a Notice of Violation/Finding of Violation (NOV/FOV) from the EPA alleging, among other things, that
five
DTE Electric power plants violated New Source Performance standards, Prevention of Significant Deterioration requirements, and operating permit requirements under the Clean Air Act. An additional NOV/FOV was received in June 2010 related to a recent project and outage at Unit 2 of the Monroe Power Plant.
On August 5, 2010, the U. S. Department of Justice, at the request of the EPA, brought a civil suit in the U.S. District Court for the Eastern District of Michigan against DTE Energy and DTE Electric, related to the June 2010 NOV/FOV and the outage work performed at Unit 2 of the Monroe Power Plant, but not relating to the July 2009 NOV/FOV. Among other relief, the EPA requested the court to require DTE Electric to install and operate the best available control technology at Unit 2 of the Monroe Power Plant. Further, the EPA requested the court to issue a preliminary injunction to require DTE Electric to (i) begin the process of obtaining the necessary permits for the Monroe Unit 2 modification and (ii) offset the pollution from Monroe Unit 2 through emissions reductions from DTE Electric's fleet of coal-fired power plants until the new control equipment is operating.
On August 23, 2011, the U.S. District judge granted DTE Energy's motion for summary judgment in the civil case, dismissing the case and entering judgment in favor of DTE Energy.
On October 20, 2011, the EPA caused to be filed a Notice of Appeal. Oral arguments took place on November 27, 2012 in the appeal of the August 2011 summary judgment before a three-judge panel of the Sixth Circuit Court of Appeals in Cincinnati, Ohio. A decision in this appeal is expected in early 2013. DTE Energy and DTE Electric believe that the plants identified by the EPA, including Unit 2 of the Monroe Power Plant, have complied with all applicable federal environmental regulations. Depending upon the outcome of discussions with the EPA regarding the NOV/FOV and the result of the appeals process, the Company could also be required to install additional pollution control equipment at some or all of the power plants in question, implement early retirement of facilities where control equipment is not economical, engage in supplemental environmental programs, and/or pay fines. The Company cannot predict the financial impact or outcome of this matter, or the timing of its resolution.
On November 9, 2012, the Sierra Club filed a Notice of Intent to Sue DTE Electric for Violations of the Clean Air Act at the St. Clair, Belle River, and Trenton Channel power plants. The notice cites
1,330
total exceedances of the 6-minute opacity standard at
nine
electric generating units over a
five
-year period. The Sierra Club obtained the opacity exceedance data from excess emission reports that are submitted every quarter by DTE Electric to the MDEQ.
No
enforcement actions have been initiated by the MDEQ over this
five
-year period as a result of the reported opacity exceedances. The Company will develop a strategy for responding to the petition from the Sierra Club that is expected in early 2013.
Water
- In response to an EPA regulation, DTE Electric would be required to examine alternatives for reducing the environmental impacts of the cooling water intake structures at several of its facilities. Based on the results of completed studies and expected future studies, DTE Electric may be required to install technologies to reduce the impacts of the water intake structures. The initial rule published in 2004 was subsequently remanded and a proposed rule published in 2011. The proposed rule specified an eight year compliance timeline. In July 2012, the EPA announced that a notice of its final action on the rule will be issued June 2013. The EPA has also issued an information collection request to begin a review of steam electric effluent guidelines. It is not possible at this time to quantify the impacts of these developing requirements.
Contaminated and Other Sites
— Prior to the construction of major interstate natural gas pipelines, gas for heating and other uses was manufactured locally from processes involving coal, coke or oil. The facilities, which produced gas, have been designated as manufactured gas plant (MGP) sites. DTE Electric conducted remedial investigations at contaminated sites, including
three
former MGP sites. The investigations have revealed contamination related to the by-products of gas manufacturing at each site. In addition to the MGP sites, the Company is also in the process of cleaning up other contaminated sites, including the area surrounding an ash landfill, electrical distribution substations, electric generating power plants, and underground and aboveground storage tank locations. The findings of these investigations indicated that the estimated cost to remediate these sites is expected to be incurred over the next several years. At December 31, 2012 and 2011, the Company had $
9 million
and $
8 million
, respectively, accrued for remediation. Any significant change in assumptions, such as remediation techniques, nature and extent of contamination and regulatory requirements, could impact the estimate of remedial action costs for the sites and affect the Company’s financial position and cash flows.
91
DTE Electric owns and operates a permitted engineered ash storage facility at the Monroe Power Plant to dispose of fly ash from the coal fired power plant. The EPA has published proposed rules to regulate coal ash under the authority of the Resources Conservation and Recovery Act (RCRA). The proposed rule published in June 2010 contains
two
primary regulatory options to regulate coal ash residue. The EPA is currently considering either designating coal ash as a “Hazardous Waste” as defined by RCRA or regulating coal ash as non-hazardous waste under RCRA. Agencies and legislatures have urged the EPA to regulate coal ash as a non-hazardous waste. If the EPA designates coal ash as a hazardous waste, the agency could apply some, or all, of the disposal and reuse standards that have been applied to other existing hazardous wastes to disposal and reuse of coal ash. Some of the regulatory actions currently being contemplated could have a significant impact on our operations and financial position and the rates we charge our customers. It is not possible to quantify the impact of those expected rulemakings at this time.
Gas
Contaminated Sites
— Gas segment, owned or previously owned,
15
former MGP sites. Investigations have revealed contamination related to the by-products of gas manufacturing at each site. In addition to the MGP sites, the Company is also in the process of cleaning up other contaminated sites. Cleanup activities associated with these sites will be conducted over the next several years.
The MPSC has established a cost deferral and rate recovery mechanism for investigation and remediation costs incurred at former MGP sites. Accordingly, Gas segment recognizes a liability and corresponding regulatory asset for estimated investigation and remediation costs at former MGP sites. As of December 31, 2012 and 2011, the Company had $
29 million
and $
36 million
, accrued for remediation, respectively.
Any significant change in assumptions, such as remediation techniques, nature and extent of contamination and regulatory requirements, could impact the estimate of remedial action costs for the sites and affect the Company’s financial position and cash flows. The Company anticipates the cost amortization methodology approved by the MPSC for DTE Gas, which allows DTE Gas to amortize the MGP costs over a
ten
-year period beginning with the year subsequent to the year the MGP costs were incurred and the cost deferral and rate recovery mechanism for Citizens Fuel Gas approved by the City of Adrian, will prevent environmental costs from having a material adverse impact on the Company’s results of operations.
Non-utility
The Company’s non-utility affiliates are subject to a number of environmental laws and regulations dealing with the protection of the environment from various pollutants.
The Michigan coke battery facility received and responded to information requests from the EPA that resulted in the issuance of a NOV in June 2007 alleging potential maximum achievable control technologies and new source review violations. The EPA is in the process of reviewing the Company’s position of demonstrated compliance and has not initiated escalated enforcement. At this time, the Company cannot predict the impact of this issue. Furthermore, the Michigan coke battery facility is the subject of an investigation by the MDEQ concerning visible emissions readings that resulted from the Company self reporting to MDEQ questionable activities by an employee of a contractor hired by the Company to perform the visible emissions readings. At this time, the Company cannot predict the impact of this investigation.
In April 2006, the prior owners of the coke battery facility in Pennsylvania that the Company purchased in 2008 received a NOV/FOV from the EPA alleging violations of the lowest achievable emission rate requirements associated with visible emissions from the combustion stack, door leaks and charging activities at the coke battery facility. The EPA and the Pennsylvania Department of Environmental Protection (PADEP) have also alleged certain violations of the Clean Water Act including wastewater discharges and coal pile storm water runoff discussed below. The Company agreed to a Consent Order with the EPA and settled these historic air and water issues by paying a fine of $
1.75 million
.
The Company received two NOVs from the PADEP in 2010 alleging violations of the permit for the Pennsylvania coke battery facility in connection with coal pile storm water runoff. The Company has implemented best management practices to address this issue and is currently seeking a permit from the PADEP to upgrade its wastewater treatment technology to a biological treatment facility. The Company expects to spend less than $
6 million
on the existing waste water treatment system to comply with existing water discharge requirements and to upgrade its coal pile storm water runoff management program.
92
The Company may spend an additional $
17 million
over the next few years to meet future regulatory requirements and gain other operational improvements savings.
The Company believes that its non-utility affiliates are substantially in compliance with all environmental requirements, other than as noted above.
Other
In March 2011, the EPA finalized a new set of regulations regarding the identification of non-hazardous secondary materials that are considered solid waste, industrial boiler and process heater maximum achievable control technologies (IBMACT) for major and area sources, and commercial/industrial solid waste incinerator new source performance standard and emission guidelines (CISWI). The effective dates of the major source IBMACT and CISWI regulations were stayed and
a re-proposal was issued by the EPA in December 2011. The re-proposed rules may impact our existing operations and may require us, in certain instances, to install new air pollution control devices. The re-proposed regulations will provide a minimum period of
three
years for compliance with the applicable standards. Final IBMACT and CISWI were issued by the EPA in December 2012. The Company will assess the financial impact, if any, on current operations for compliance with the applicable new standards.
In 2010, the EPA finalized a new
1
-hour sulfur dioxide ambient air quality standard that requires states to submit plans for non-attainment areas to be in compliance by 2017. Michigan's proposed non-attainment area includes DTE Energy facilities in southwest Detroit and areas of Wayne County. Preliminary modeling runs by the MDEQ suggest that emission reductions may be required by significant sources of sulfur dioxide emissions in these areas, including DTE Electric power plants and our Michigan coke battery. The state implementation plan process is in the preliminary stage and any required emission reductions for DTE Energy sources to meet the standard cannot be estimated currently.
Nuclear Operations
Property Insurance
DTE Electric maintains property insurance policies specifically for the Fermi 2 plant. These policies cover such items as replacement power and property damage. The Nuclear Electric Insurance Limited (NEIL) is the primary supplier of the insurance policies.
DTE Electric maintains a policy for extra expenses, including replacement power costs necessitated by Fermi 2’s unavailability due to an insured event. This policy has a 12-week waiting period and provides an aggregate $
490 million
of coverage over a
3
-year period.
DTE Electric has $
500 million
in primary coverage and $
2.25 billion
of excess coverage for stabilization, decontamination, debris removal, repair and/or replacement of property and decommissioning. The combined coverage limit for total property damage is $
2.75 billion
, subject to a $
1 million
deductible.
In 2007, the Terrorism Risk Insurance Extension Act of 2005 (TRIA) was extended through December 31, 2014. A major change in the extension is the inclusion of “domestic” acts of terrorism in the definition of covered or “certified” acts. For multiple terrorism losses caused by acts of terrorism not covered under the TRIA occurring within
one
year after the first loss from terrorism, the NEIL policies would make available to all insured entities up to $
3.2 billion
, plus any amounts recovered from reinsurance, government indemnity, or other sources to cover losses.
Under the NEIL policies, DTE Electric could be liable for maximum assessments of up to approximately $
31 million
per event if the loss associated with any
one
event at any nuclear plant in the United States should exceed the accumulated funds available to NEIL.
Public Liability Insurance
As of January 1, 2013, as required by federal law, DTE Electric maintains $
375 million
of public liability insurance for a nuclear incident. For liabilities arising from a terrorist act outside the scope of TRIA, the policy is subject to one industry aggregate limit of $
300 million
. Further, under the Price-Anderson Amendments Act of 2005, deferred premium charges up to $
117.5 million
could be levied against each licensed nuclear facility, but not more than $
17.5 million
per year per facility.
93
Thus, deferred premium charges could be levied against all owners of licensed nuclear facilities in the event of a nuclear incident at any of these facilities.
Nuclear Fuel Disposal Costs
In accordance with the Federal Nuclear Waste Policy Act of 1982, DTE Electric has a contract with the U.S. Department of Energy (DOE) for the future storage and disposal of spent nuclear fuel from Fermi 2. DTE Electric is obligated to pay the DOE a fee of
1
mill per kWh of Fermi 2 electricity generated and sold. The fee is a component of nuclear fuel expense. The DOE's Yucca Mountain Nuclear Waste Repository program for the acceptance and disposal of spent nuclear fuel was terminated in 2011. DTE Electric currently employs a spent nuclear fuel storage strategy utilizing a fuel pool. The Company continues to develop its on-site dry cask storage facility and has postponed the initial offload from the spent fuel pool until 2014. The dry cask storage facility is expected to provide sufficient spent fuel storage capability for the life of the plant as defined by the original operating license.
DTE Electric is a party in the litigation against the DOE for both past and future costs associated with the DOE's failure to accept spent nuclear fuel under the timetable set forth in the Federal Nuclear Waste Policy Act of 1982. In July 2012, DTE Electric executed a settlement agreement with the federal government for costs associated with the DOE's delay in acceptance of spent nuclear fuel from Fermi 2 for permanent storage. The settlement provided for a payment of approximately $
48 million
, received in August 2012, for delay-related costs experienced by DTE Electric through 2010, and a claims process for submittal of delay-related costs from 2011 through 2013. The settlement proceeds reduced the cost of the dry cask storage facility assets. The federal government continues to maintain its legal obligation to accept spent nuclear fuel from Fermi 2 for permanent storage. Issues relating to long-term waste disposal policy and to the disposition of funds contributed by DTE Electric ratepayers to the federal waste fund await future governmental action.
Synthetic Fuel Guarantees
The Company discontinued the operations of its synthetic fuel production facilities throughout the United States as of December 31, 2007. The Company provided certain guarantees and indemnities in conjunction with the sales of interests in its synfuel facilities. The guarantees cover potential commercial, environmental, oil price and tax-related obligations and will survive until
90
days after expiration of all applicable statutes of limitations. The Company estimates that its maximum potential liability under these guarantees at December 31, 2012 is approximately $
1.2 billion
. Payment under these guarantees is considered remote.
Reduced Emissions Fuel Guarantees
The Company has provided certain guarantees and indemnities in conjunction with the sales of interests in its reduced emissions fuel facilities. The guarantees cover potential commercial, environmental, and tax-related obligations and will survive until
90
days after expiration of all applicable statutes of limitations. The Company estimates that its maximum potential liability under these guarantees at December 31, 2012 is approximately $
77 million
. Payment under these guarantees is considered remote.
Other Guarantees
In certain limited circumstances, the Company enters into contractual guarantees. The Company may guarantee another entity’s obligation in the event it fails to perform. The Company may provide guarantees in certain indemnification agreements. Finally, the Company may provide indirect guarantees for the indebtedness of others. The Company’s guarantees are not individually material with maximum potential payments totaling $
50 million
at December 31, 2012.
The Company is periodically required to obtain performance surety bonds in support of obligations to various governmental entities and other companies in connection with its operations. As of December 31, 2012, the Company had approximately $
41 million
of performance bonds outstanding. In the event that such bonds are called for nonperformance, the Company would be obligated to reimburse the issuer of the performance bond. The Company is released from the performance bonds as the contractual performance is completed and does not believe that a material amount of any currently outstanding performance bonds will be called.
94
Labor Contracts
There are several bargaining units for the Company’s approximately
4,900
represented employees. The majority of represented employees are under contracts that expire in June and October 2013.
Purchase Commitments
As of December 31, 2012, the Company was party to numerous long-term purchase commitments relating to a variety of goods and services required for the Company’s business. These agreements primarily consist of fuel supply commitments and energy trading contracts. The Company estimates that these commitments will be approximately $
4.4 billion
from 2013 through 2052 as detailed in the following table:
|
(In millions)
|
|||
|
2013
|
$
|
1,937
|
|
|
2014
|
1,199
|
|
|
|
2015
|
424
|
|
|
|
2016
|
147
|
|
|
|
2017
|
88
|
|
|
|
2018 — 2052
|
582
|
|
|
|
$
|
4,377
|
|
|
The Company also estimates that 2013 capital expenditures will be approximately $
2.2 billion
. The Company has made certain commitments in connection with expected capital expenditures.
Bankruptcies
The Company purchases and sells electricity, gas, coal, coke and other energy products from and to governmental entities and numerous companies operating in the steel, automotive, energy, retail, financial and other industries. Certain of its customers have filed for bankruptcy protection under Chapter 11 of the U.S. Bankruptcy Code. The Company regularly reviews contingent matters relating to these customers and its purchase and sale contracts and records provisions for amounts considered at risk of probable loss. The Company believes its accrued amounts are adequate for probable loss. The final resolution of these matters may have a material effect on its consolidated financial statements.
Other Contingencies
The Company is involved in certain other legal, regulatory, administrative and environmental proceedings before various courts, arbitration panels and governmental agencies concerning claims arising in the ordinary course of business. These proceedings include certain contract disputes, additional environmental reviews and investigations, audits, inquiries from various regulators, and pending judicial matters. The Company cannot predict the final disposition of such proceedings. The Company regularly reviews legal matters and records provisions for claims that it can estimate and are considered probable of loss. The resolution of these pending proceedings is not expected to have a material effect on the Company’s operations or financial statements in the periods they are resolved.
See Notes 4 and 11 for a discussion of contingencies related to derivatives and regulatory matters.
Pension Plan Benefits
The Company has qualified defined benefit retirement plans for eligible represented and non-represented employees. The plans are noncontributory and cover substantially all employees. The plans provide traditional retirement benefits based on the employees’ years of benefit service, average final compensation and age at retirement. In addition, certain represented and non-represented employees are covered under cash balance provisions that determine benefits on annual employer contributions and interest credits. The Company also maintains supplemental nonqualified, noncontributory, retirement benefit plans for selected management employees. These plans provide for benefits that supplement those provided by DTE Energy’s other retirement plans.
95
Effective January 1, 2012, the Company discontinued offering future non-represented employees a cash balance retirement plan benefit. In its place, the Company will annually contribute an amount equivalent to
four percent
of an employee's eligible pay to the employee's defined contribution retirement savings plan.
The Company’s policy is to fund pension costs by contributing amounts consistent with the Pension Protection Act of 2006 provisions and additional amounts when it deems appropriate. The Company contributed $
229 million
to its pension plans in 2012. At the discretion of management, and depending upon financial market conditions, we anticipate making up to a $
315 million
contribution to the pension plans in 2013.
Net pension cost includes the following components:
|
2012
|
2011
|
2010
|
|||||||||
|
(In millions)
|
|||||||||||
|
Service cost
|
$
|
82
|
|
$
|
69
|
|
$
|
64
|
|
||
|
Interest cost
|
204
|
|
202
|
|
202
|
|
|||||
|
Expected return on plan assets
|
(244
|
)
|
(246
|
)
|
(258
|
)
|
|||||
|
Amortization of:
|
|||||||||||
|
Net loss
|
176
|
|
142
|
|
100
|
|
|||||
|
Prior service cost
|
—
|
|
3
|
|
4
|
|
|||||
|
Special termination benefits
|
2
|
|
2
|
|
—
|
|
|||||
|
Net pension cost
|
$
|
220
|
|
$
|
172
|
|
$
|
112
|
|
||
|
2012
|
2011
|
||||||
|
(In millions)
|
|||||||
|
Other changes in plan assets and benefit obligations recognized in Regulatory assets and Other comprehensive income
|
|||||||
|
Net actuarial loss
|
$
|
395
|
|
$
|
619
|
|
|
|
Amortization of net actuarial loss
|
(178
|
)
|
(142
|
)
|
|||
|
Amortization of prior service cost
|
—
|
|
(3
|
)
|
|||
|
Total recognized Regulatory assets and Other comprehensive income
|
$
|
217
|
|
$
|
474
|
|
|
|
Total recognized in net periodic pension cost, Regulatory assets and Other comprehensive income
|
$
|
437
|
|
$
|
646
|
|
|
|
Estimated amounts to be amortized from Regulatory assets and Accumulated other comprehensive income into net periodic benefit cost during next fiscal year
|
|||||||
|
Net actuarial loss
|
$
|
202
|
|
$
|
171
|
|
|
The following table reconciles the obligations, assets and funded status of the plans as well as the amounts recognized as prepaid pension cost or pension liability in the Consolidated Statements of Financial Position at December 31:
96
|
2012
|
2011
|
||||||
|
(In millions)
|
|||||||
|
Accumulated benefit obligation, end of year
|
$
|
4,349
|
|
$
|
3,881
|
|
|
|
Change in projected benefit obligation
|
|||||||
|
Projected benefit obligation, beginning of year
|
$
|
4,195
|
|
$
|
3,785
|
|
|
|
Service cost
|
82
|
|
69
|
|
|||
|
Interest cost
|
204
|
|
202
|
|
|||
|
Actuarial loss
|
474
|
|
355
|
|
|||
|
Special termination benefits
|
2
|
|
2
|
|
|||
|
Benefits paid
|
(228
|
)
|
(218
|
)
|
|||
|
Projected benefit obligation, end of year
|
$
|
4,729
|
|
$
|
4,195
|
|
|
|
Change in plan assets
|
|||||||
|
Plan assets at fair value, beginning of year
|
$
|
2,886
|
|
$
|
2,913
|
|
|
|
Actual return on plan assets
|
325
|
|
(18
|
)
|
|||
|
Company contributions
|
240
|
|
209
|
|
|||
|
Benefits paid
|
(228
|
)
|
(218
|
)
|
|||
|
Plan assets at fair value, end of year
|
$
|
3,223
|
|
$
|
2,886
|
|
|
|
Funded status of the plans
|
$
|
(1,506
|
)
|
$
|
(1,309
|
)
|
|
|
Amount recorded as:
|
|||||||
|
Current liabilities
|
$
|
(8
|
)
|
$
|
(11
|
)
|
|
|
Noncurrent liabilities
|
(1,498
|
)
|
(1,298
|
)
|
|||
|
$
|
(1,506
|
)
|
$
|
(1,309
|
)
|
||
|
Amounts recognized in Accumulated other comprehensive loss, pre-tax
|
|||||||
|
Net actuarial loss
|
$
|
205
|
|
$
|
202
|
|
|
|
Prior service (credit)
|
(2
|
)
|
(3
|
)
|
|||
|
$
|
203
|
|
$
|
199
|
|
||
|
Amounts recognized in Regulatory assets (see Note 11)
|
|||||||
|
Net actuarial loss
|
$
|
2,413
|
|
$
|
2,201
|
|
|
|
Prior service cost
|
7
|
|
7
|
|
|||
|
$
|
2,420
|
|
$
|
2,208
|
|
||
At December 31, 2012, the benefits related to the Company’s qualified and nonqualified pension plans expected to be paid in each of the next
five
years and in the aggregate for the
five
fiscal years thereafter are as follows:
|
(In millions)
|
|||
|
2013
|
$
|
236
|
|
|
2014
|
242
|
|
|
|
2015
|
252
|
|
|
|
2016
|
260
|
|
|
|
2017
|
269
|
|
|
|
2018-2022
|
1,485
|
|
|
|
$
|
2,744
|
|
|
Assumptions used in determining the projected benefit obligation and net pension costs are listed below:
|
2012
|
2011
|
2010
|
||||||
|
Projected benefit obligation
|
||||||||
|
Discount rate
|
4.15
|
%
|
5.00
|
%
|
5.50
|
%
|
||
|
Rate of compensation increase
|
4.20
|
%
|
4.20
|
%
|
4.00
|
%
|
||
|
Net pension costs
|
||||||||
|
Discount rate
|
5.00
|
%
|
5.50
|
%
|
5.90
|
%
|
||
|
Rate of compensation increase
|
4.20
|
%
|
4.00
|
%
|
4.00
|
%
|
||
|
Expected long-term rate of return on plan assets
|
8.25
|
%
|
8.50
|
%
|
8.75
|
%
|
||
97
The Company employs a formal process in determining the long-term rate of return for various asset classes. Management reviews historic financial market risks and returns and long-term historic relationships between the asset classes of equities, fixed income and other assets, consistent with the widely accepted capital market principle that asset classes with higher volatility generate a greater return over the long-term. Current market factors such as inflation, interest rates, asset class risks and asset class returns are evaluated and considered before long-term capital market assumptions are determined. The long-term portfolio return is also established employing a consistent formal process, with due consideration of diversification, active investment management and rebalancing. Peer data is reviewed to check for reasonableness.
The Company employs a total return investment approach whereby a mix of equities, fixed income and other investments are used to maximize the long-term return on plan assets consistent with prudent levels of risk, with consideration given to the liquidity needs of the plan. Risk tolerance is established through consideration of future plan cash flows, plan funded status, and corporate financial considerations. The investment portfolio contains a diversified blend of equity, fixed income and other investments. Furthermore, equity investments are diversified across U.S. and non-U.S. stocks, growth and value investment styles, and large and small market capitalizations. Fixed income securities generally include corporate bonds of companies from diversified industries, mortgage-backed securities, and U.S. Treasuries. Other assets such as private equity and hedge funds are used to enhance long-term returns while improving portfolio diversification. Derivatives may be utilized in a risk controlled manner, to potentially increase the portfolio beyond the market value of invested assets and/or reduce portfolio investment risk. Investment risk is measured and monitored on an ongoing basis through annual liability measurements, periodic asset/liability studies, and quarterly investment portfolio reviews.
Target allocations for plan assets as of December 31, 2012 are listed below:
|
U.S. Large Cap Equity Securities
|
22
|
%
|
|
U.S. Small Cap and Mid Cap Equity Securities
|
5
|
|
|
Non U.S. Equity Securities
|
20
|
|
|
Fixed Income Securities
|
25
|
|
|
Hedge Funds and Similar Investments
|
20
|
|
|
Private Equity and Other
|
8
|
|
|
100
|
%
|
|
Fair Value Measurements at December 31, 2012 and 2011
(a):
|
December 31, 2012
|
December 31, 2011
|
||||||||||||||||||||||||||||||
|
Level 1
|
Level 2
|
Level 3
|
Net Balance
|
Level 1
|
Level 2
|
Level 3
|
Net Balance
|
||||||||||||||||||||||||
|
(In millions)
|
|||||||||||||||||||||||||||||||
|
Asset Category:
|
|||||||||||||||||||||||||||||||
|
Short-term investments (b)
|
$
|
—
|
|
$
|
24
|
|
$
|
—
|
|
$
|
24
|
|
$
|
—
|
|
$
|
33
|
|
$
|
—
|
|
$
|
33
|
|
|||||||
|
Equity securities
|
|
|
|
|
|
|
|
|
|
|
|
|
—
|
|
|||||||||||||||||
|
U.S. Large Cap (c)
|
688
|
|
44
|
|
—
|
|
732
|
|
640
|
|
40
|
|
—
|
|
680
|
|
|||||||||||||||
|
U.S. Small/Mid Cap (d)
|
153
|
|
5
|
|
—
|
|
158
|
|
159
|
|
5
|
|
—
|
|
164
|
|
|||||||||||||||
|
Non U.S (e)
|
530
|
|
120
|
|
—
|
|
650
|
|
392
|
|
114
|
|
—
|
|
506
|
|
|||||||||||||||
|
Fixed income securities (f)
|
87
|
|
765
|
|
—
|
|
852
|
|
88
|
|
703
|
|
—
|
|
791
|
|
|||||||||||||||
|
Hedge Funds and Similar Investments (g)
|
209
|
|
80
|
|
339
|
|
628
|
|
190
|
|
58
|
|
296
|
|
544
|
|
|||||||||||||||
|
Private Equity and Other (h)
|
—
|
|
—
|
|
179
|
|
179
|
|
—
|
|
—
|
|
168
|
|
168
|
|
|||||||||||||||
|
Total
|
$
|
1,667
|
|
$
|
1,038
|
|
$
|
518
|
|
$
|
3,223
|
|
$
|
1,469
|
|
$
|
953
|
|
$
|
464
|
|
$
|
2,886
|
|
|||||||
_______________________________________
|
(a)
|
See Note 3 — Fair Value for a description of levels within the fair value hierarchy.
|
|
(b)
|
This category predominantly represents certain short-term fixed income securities and money market investments that are managed in separate accounts or commingled funds. Pricing for investments in this category are obtained from quoted prices in actively traded markets or valuations from brokers or pricing services.
|
|
(c)
|
This category comprises both actively and not actively managed portfolios that track the S&P 500 low cost equity index funds. Investments in this category are exchange-traded securities whereby unadjusted quote prices can be obtained. Exchange-traded securities held in a commingled fund are classified as Level 2 assets.
|
|
(d)
|
This category represents portfolios of small and medium capitalization domestic equities. Investments in this category are exchange-traded securities whereby unadjusted quote prices can be obtained. Exchange-traded securities held in a commingled fund are classified as Level 2 assets.
|
|
(e)
|
This category primarily consists of portfolios of non-U.S. developed and emerging market equities. Investments in this category are exchange-traded securities whereby unadjusted quote prices can be obtained. Exchange-traded securities held in a commingled fund are classified as Level 2 assets.
|
98
|
(f)
|
This category includes corporate bonds from diversified industries, U.S. Treasuries, and mortgage-backed securities. Pricing for investments in this category is obtained from quoted prices in actively traded markets and quotations from broker or pricing services. Non-exchange traded securities and exchange-traded securities held in commingled funds are classified as Level 2 assets.
|
|
(g)
|
This category utilizes a diversified group of strategies that attempt to capture financial market inefficiencies and includes publicly traded debt and equity, publicly traded mutual funds, commingled and limited partnership funds and non-exchange traded securities. Pricing for Level 1 and Level 2 assets in this category is obtained from quoted prices in actively traded markets and quoted prices from broker or pricing services. Non-exchange traded securities held in commingled funds are classified as Level 2 assets. Valuations for some Level 3 assets in this category may be based on limited observable inputs as there may be little, if any, publicly available pricing.
|
|
(h)
|
This category includes a diversified group of funds and strategies that primarily invests in private equity partnerships. This category also includes investments in timber and private mezzanine debt. Pricing for investments in this category is based on limited observable inputs as there is little, if any, publicly available pricing. Valuations for assets in this category may be based on discounted cash flow analyses, relevant publicly-traded comparables and comparable transactions.
|
The pension trust holds debt and equity securities directly and indirectly through commingled funds and institutional mutual funds. Exchange-traded debt and equity securities held directly are valued using quoted market prices in actively traded markets. The commingled funds and institutional mutual funds which hold exchange-traded equity or debt securities are valued based on underlying securities, using quoted prices in actively traded markets. Non-exchange traded fixed income securities are valued by the trustee based upon quotations available from brokers or pricing services. A primary price source is identified by asset type, class or issue for each security. The trustees monitor prices supplied by pricing services and may use a supplemental price source or change the primary price source of a given security if the trustees challenge an assigned price and determine that another price source is considered to be preferable. DTE Energy has obtained an understanding of how these prices are derived, including the nature and observability of the inputs used in deriving such prices. Additionally, DTE Energy selectively corroborates the fair values of securities by comparison of market-based price sources.
Fair Value Measurements Using Significant Unobservable Inputs (Level 3):
|
Year Ended December 31, 2012
|
Year Ended December 31, 2011
|
||||||||||||||||||||||
|
Hedge Funds
and Similar
Investments
|
Private Equity
and Other
|
Total
|
Hedge Funds
and Similar
Investments
|
Private Equity
and Other
|
Total
|
||||||||||||||||||
|
(In millions)
|
|||||||||||||||||||||||
|
Beginning Balance at January 1
|
$
|
296
|
|
$
|
168
|
|
$
|
464
|
|
$
|
304
|
|
$
|
174
|
|
$
|
478
|
|
|||||
|
Total realized/unrealized gains (losses):
|
|||||||||||||||||||||||
|
Realized gains (losses)
|
18
|
|
(6
|
)
|
12
|
|
(4
|
)
|
6
|
|
2
|
|
|||||||||||
|
Unrealized gains (losses)
|
(5
|
)
|
12
|
|
7
|
|
1
|
|
(30
|
)
|
(29
|
)
|
|||||||||||
|
Purchases, sales and settlements:
|
|||||||||||||||||||||||
|
Purchases
|
250
|
|
33
|
|
283
|
|
64
|
|
23
|
|
87
|
|
|||||||||||
|
Sales
|
(220
|
)
|
(28
|
)
|
(248
|
)
|
(69
|
)
|
(5
|
)
|
(74
|
)
|
|||||||||||
|
Ending Balance at December 31
|
$
|
339
|
|
$
|
179
|
|
$
|
518
|
|
$
|
296
|
|
$
|
168
|
|
$
|
464
|
|
|||||
|
The amount of total gains (losses) for the period attributable to the change in unrealized gains or losses related to assets still held at the end of the period
|
$
|
16
|
|
$
|
6
|
|
$
|
22
|
|
$
|
4
|
|
$
|
(28
|
)
|
$
|
(24
|
)
|
|||||
There were
no
transfers between Level 3 and Level 2 and there were
no
significant transfers between Level 2 and Level 1 in the years ended December 31, 2012 and 2011.
The Company also sponsors defined contribution retirement savings plans. Participation in one of these plans is available to substantially all represented and non-represented employees. The Company matches employee contributions up to certain predefined limits based upon eligible compensation, the employee’s contribution rate and, in some cases, years of credited service. The cost of these plans was $
37 million
, $
35 million
, and $
34 million
in each of the years 2012, 2011, and 2010, respectively.
Other Postretirement Benefits
The Company provides certain postretirement health care and life insurance benefits for employees who are eligible for these benefits. The Company’s policy is to fund certain trusts to meet its postretirement benefit obligations. Separate qualified Voluntary Employees Beneficiary Association (VEBA) and 401(h) trusts exist for represented and non-represented employees. The Company contributed $
140 million
to its postretirement medical and life insurance benefit plans during 2012.
99
Effective January 1, 2012, in lieu of offering future non-represented employees post-employment health care and life insurance benefits, the Company will allocate $
4,000
per year to an account in a tax-exempt trust for each employee. The accumulated balance and earnings in an employee's account will vest when the employee has
ten
years of service, regardless of age. These funds will be available to the employee to use for health care expenses after the employee leaves the Company.
Effective January 1, 2013, the Company replaced sponsored retiree medical, prescription drug and dental coverage for current and future Medicare eligible non-represented retirees, spouses, surviving spouses, or same sex domestic partners with a Retiree Health Care Allowance (RHCA) account of $
3,500
or $
3,250
per year depending on their date of hire. Local 17 employees hired after September 24, 2012 will receive a $
4,000
per year allocation to an account in a tax-exempt trust for each employee, in lieu of offering post-employment health care and life insurance benefits. Current Local 17 employees, spouses, surviving spouse, or same sex domestic partners, who retired after November 6, 2012 will receive a RHCA of $
3,250
per year upon becoming eligible for Medicare.
In January 2013, the Company contributed $
145 million
to its other postretirement benefit plans. At the discretion of management, the Company may make up to an additional $
120 million
contribution to its VEBA trusts in 2013.
Net postretirement cost includes the following components:
|
2012
|
2011
|
2010
|
|||||||||
|
(In millions)
|
|||||||||||
|
Service cost
|
$
|
68
|
|
$
|
64
|
|
$
|
61
|
|
||
|
Interest cost
|
120
|
|
121
|
|
125
|
|
|||||
|
Expected return on plan assets
|
(92
|
)
|
(94
|
)
|
(74
|
)
|
|||||
|
Amortization of:
|
|
|
|
|
|
|
|||||
|
Net loss
|
80
|
|
55
|
|
54
|
|
|||||
|
Prior service credit
|
(27
|
)
|
(26
|
)
|
(4
|
)
|
|||||
|
Net transition asset
|
2
|
|
2
|
|
2
|
|
|||||
|
Net postretirement cost
|
$
|
151
|
|
$
|
122
|
|
$
|
164
|
|
||
|
2012
|
2011
|
||||||
|
(In millions)
|
|||||||
|
Other changes in plan assets and APBO recognized in Regulatory assets and Other comprehensive income (in millions)
|
|||||||
|
Net actuarial (gain) loss
|
$
|
(34
|
)
|
$
|
195
|
|
|
|
Amortization of net actuarial loss
|
(80
|
)
|
(55
|
)
|
|||
|
Prior service credit
|
(264
|
)
|
(4
|
)
|
|||
|
Amortization of prior service credit
|
27
|
|
26
|
|
|||
|
Amortization of transition asset
|
(2
|
)
|
(2
|
)
|
|||
|
Total recognized in Regulatory assets and Other comprehensive income
|
$
|
(353
|
)
|
$
|
160
|
|
|
|
Total recognized in net periodic pension cost, Regulatory assets and Other comprehensive income
|
$
|
(202
|
)
|
$
|
282
|
|
|
|
Estimated amounts to be amortized from Regulatory assets and Accumulated other comprehensive income into net periodic benefit cost during next fiscal year (in millions)
|
|||||||
|
Net actuarial loss
|
$
|
69
|
|
$
|
78
|
|
|
|
Prior service credit
|
$
|
(91
|
)
|
$
|
(27
|
)
|
|
|
Net transition obligation
|
$
|
—
|
|
$
|
2
|
|
|
100
The following table reconciles the obligations, assets and funded status of the plans including amounts recorded as accrued postretirement cost in the Consolidated Statements of Financial Position at December 31:
|
2012
|
2011
|
||||||
|
(In millions)
|
|||||||
|
Change in accumulated postretirement benefit obligation
|
|||||||
|
Accumulated postretirement benefit obligation, beginning of year
|
$
|
2,470
|
|
$
|
2,305
|
|
|
|
Service cost
|
68
|
|
64
|
|
|||
|
Interest cost
|
120
|
|
121
|
|
|||
|
Plan amendments
|
(264
|
)
|
(4
|
)
|
|||
|
Actuarial loss
|
5
|
|
80
|
|
|||
|
Medicare Part D subsidy
|
6
|
|
6
|
|
|||
|
Benefits paid
|
(90
|
)
|
(102
|
)
|
|||
|
Accumulated postretirement benefit obligation, end of year
|
$
|
2,315
|
|
$
|
2,470
|
|
|
|
Change in plan assets
|
|||||||
|
Plan assets at fair value, beginning of year
|
$
|
985
|
|
$
|
1,029
|
|
|
|
Actual return on plan assets
|
131
|
|
(22
|
)
|
|||
|
Company contributions
|
140
|
|
111
|
|
|||
|
Benefits paid
|
(103
|
)
|
(133
|
)
|
|||
|
Plan assets at fair value, end of year
|
$
|
1,153
|
|
$
|
985
|
|
|
|
Funded status, end of year
|
$
|
(1,162
|
)
|
$
|
(1,485
|
)
|
|
|
Amount recorded as:
|
|||||||
|
Current liabilities
|
$
|
(2
|
)
|
$
|
(1
|
)
|
|
|
Noncurrent liabilities
|
$
|
(1,160
|
)
|
$
|
(1,484
|
)
|
|
|
$
|
(1,162
|
)
|
$
|
(1,485
|
)
|
||
|
Amounts recognized in Accumulated other comprehensive loss, pre-tax
|
|||||||
|
Net actuarial loss
|
$
|
40
|
|
$
|
47
|
|
|
|
Prior service credit
|
(14
|
)
|
(20
|
)
|
|||
|
Net transition asset
|
(1
|
)
|
(1
|
)
|
|||
|
$
|
25
|
|
$
|
26
|
|
||
|
Amounts recognized in Regulatory assets (See Note 11)
|
|||||||
|
Net actuarial loss
|
$
|
727
|
|
$
|
835
|
|
|
|
Prior service cost
|
(302
|
)
|
(60
|
)
|
|||
|
Net transition obligation
|
1
|
|
3
|
|
|||
|
$
|
426
|
|
$
|
778
|
|
||
At December 31, 2012, the benefits expected to be paid, including prescription drug benefits, in each of the next
five
years and in the aggregate for the
five
fiscal years thereafter are as follows:
|
(In millions)
|
|||
|
2013
|
$
|
103
|
|
|
2014
|
109
|
|
|
|
2015
|
115
|
|
|
|
2016
|
120
|
|
|
|
2017
|
127
|
|
|
|
2018 — 2022
|
726
|
|
|
|
$
|
1,300
|
|
|
101
Assumptions used in determining the projected benefit obligation and net benefit costs are listed below:
|
2012
|
2011
|
2010
|
||||||
|
Projected benefit obligation
|
||||||||
|
Discount rate
|
4.15
|
%
|
5.00
|
%
|
5.50
|
%
|
||
|
Health care trend rate pre- and post- 65
|
7.00
|
%
|
7.00
|
%
|
7.00
|
%
|
||
|
Ultimate health care trend rate
|
5.00
|
%
|
5.00
|
%
|
5.00
|
%
|
||
|
Year in which ultimate reached
|
2019
|
|
2016
|
|
2016
|
|
||
|
Net benefit costs
|
||||||||
|
Discount rate
|
5.00
|
%
|
5.50
|
%
|
5.90
|
%
|
||
|
Expected long-term rate of return on plan assets
|
8.25
|
%
|
8.75
|
%
|
8.75
|
%
|
||
|
Health care trend rate pre- and post- 65
|
7.00
|
%
|
7.00
|
%
|
7.00
|
%
|
||
|
Ultimate health care trend rate
|
5.00
|
%
|
5.00
|
%
|
5.00
|
%
|
||
|
Year in which ultimate reached
|
2020
|
|
2019
|
|
2016
|
|
||
A
one
percentage point increase in health care cost trend rates would have increased the total service cost and interest cost components of benefit costs by $
28 million
and increased the accumulated benefit obligation by $
279 million
at December 31, 2012. A
one
percentage point decrease in the health care cost trend rates would have decreased the total service and interest cost components of benefit costs by $
19 million
and would have decreased the accumulated benefit obligation by $
264 million
at December 31, 2012.
The process used in determining the long-term rate of return for assets and the investment approach for the Company’s other postretirement benefits plans is similar to those previously described for its pension plans.
Target allocations for plan assets as of December 31, 2012 are listed below:
|
U.S. Domestic Equity Securities
|
21
|
%
|
|
Non U.S. Equity Securities
|
20
|
|
|
Fixed Income Securities
|
25
|
|
|
Hedge Funds and Similar Investments
|
20
|
|
|
Private Equity and Other
|
14
|
|
|
100
|
%
|
|
Fair Value Measurements at December 31, 2012 and 2011
(a)
:
|
December 31, 2012
|
December 31, 2011
|
||||||||||||||||||||||||||||||
|
Level 1
|
Level 2
|
Level 3
|
Net Balance
|
Level 1
|
Level 2
|
Level 3
|
Net Balance
|
||||||||||||||||||||||||
|
Asset Category:
|
(In millions)
|
||||||||||||||||||||||||||||||
|
Short-term investments (b)
|
$
|
1
|
|
$
|
2
|
|
$
|
—
|
|
$
|
3
|
|
$
|
—
|
|
$
|
13
|
|
$
|
—
|
|
$
|
13
|
|
|||||||
|
Equity securities:
|
|
|
|
|
|
|
|
|
|
|
|
|
|||||||||||||||||||
|
U.S. Large Cap (c)
|
189
|
|
3
|
|
—
|
|
192
|
|
175
|
|
15
|
|
—
|
|
190
|
|
|||||||||||||||
|
U.S. Small/Mid Cap (d)
|
105
|
|
—
|
|
—
|
|
105
|
|
70
|
|
6
|
|
—
|
|
76
|
|
|||||||||||||||
|
Non U.S (e)
|
230
|
|
7
|
|
—
|
|
237
|
|
176
|
|
14
|
|
—
|
|
190
|
|
|||||||||||||||
|
Fixed income securities (f)
|
38
|
|
247
|
|
—
|
|
285
|
|
24
|
|
236
|
|
—
|
|
260
|
|
|||||||||||||||
|
Hedge Funds and Similar Investments (g)
|
102
|
|
24
|
|
119
|
|
245
|
|
80
|
|
21
|
|
95
|
|
196
|
|
|||||||||||||||
|
Private Equity and Other (h)
|
—
|
|
—
|
|
86
|
|
86
|
|
—
|
|
—
|
|
60
|
|
60
|
|
|||||||||||||||
|
Total
|
$
|
665
|
|
$
|
283
|
|
$
|
205
|
|
$
|
1,153
|
|
$
|
525
|
|
$
|
305
|
|
$
|
155
|
|
$
|
985
|
|
|||||||
_______________________________________
|
(a)
|
See Note 3 — Fair Value for a description of levels within the fair value hierarchy.
|
|
(b)
|
This category predominantly represents certain short-term fixed income securities and money market investments that are managed in separate accounts or commingled funds. Pricing for investments in this category are obtained from quoted prices in actively traded markets or valuations from brokers or pricing services.
|
|
(c)
|
This category comprises both actively and not actively managed portfolios that track the S&P 500 low cost equity index funds. Investments in this category are exchange-traded securities whereby unadjusted quote prices can be obtained. Exchange-traded securities held in a commingled fund are classified as Level 2 assets.
|
|
(d)
|
This category represents portfolios of small and medium capitalization domestic equities. Investments in this category are exchange-traded securities whereby unadjusted quote prices can be obtained. Exchange-traded securities held in a commingled fund are classified as Level 2 assets.
|
|
(e)
|
This category primarily consists of portfolios of non-U.S. developed and emerging market equities. Investments in this category are exchange-traded securities whereby unadjusted quote prices can be obtained. Exchange-traded securities held in a commingled fund are classified as Level 2 assets.
|
102
|
(f)
|
This category includes corporate bonds from diversified industries, U.S. Treasuries, and mortgage backed securities. Pricing for investments in this category is obtained from quoted prices in actively traded markets and quotations from broker or pricing services. Non-exchange traded securities and exchange-traded securities held in commingled funds are classified as Level 2 assets.
|
|
(g)
|
This category utilizes a diversified group of strategies that attempt to capture financial market inefficiencies and includes publicly traded debt and equity, publicly traded mutual funds, commingled and limited partnership funds and non-exchange traded securities. Pricing for Level 1 and Level 2 assets in this category is obtained from quoted prices in actively traded markets and quoted prices from broker or pricing services. Non-exchange traded securities held in commingled funds are classified as Level 2 assets. Valuations for some Level 3 assets in this category may be based on limited observable inputs as there may be little, if any, publicly available pricing.
|
|
(h)
|
This category includes a diversified group of funds and strategies that primarily invests in private equity partnerships. This category also includes investments in timber and private mezzanine debt. Pricing for investments in this category is based on limited observable inputs as there is little, if any, publicly available pricing. Valuations for assets in this category may be based on discounted cash flow analyses, relevant publicly-traded comparables and comparable transactions.
|
The VEBA trusts hold debt and equity securities directly and indirectly through commingled funds and institutional mutual funds. Exchange-traded debt and equity securities held directly are valued using quoted market prices in actively traded markets. The commingled funds and institutional mutual funds which hold exchange-traded equity or debt securities are valued based on underlying securities, using quoted prices in actively traded markets. Non-exchange traded fixed income securities are valued by the trustee based upon quotations available from brokers or pricing services. A primary price source is identified by asset type, class or issue for each security. The trustees monitor prices supplied by pricing services and may use a supplemental price source or change the primary price source of a given security if the trustees challenge an assigned price and determine that another price source is considered to be preferable. DTE Energy has obtained an understanding of how these prices are derived, including the nature and observability of the inputs used in deriving such prices. Additionally, DTE Energy selectively corroborates the fair values of securities by comparison of market-based price sources.
Fair Value Measurements Using Significant Unobservable Inputs (Level 3):
|
Year Ended December 31, 2012
|
Year Ended December 31, 2011
|
||||||||||||||||||||||
|
Hedge Funds
and Similar
Investments
|
Private Equity
and Other
|
Total
|
Hedge Funds
and Similar
Investments
|
Private Equity
and Other
|
Total
|
||||||||||||||||||
|
(In millions)
|
|||||||||||||||||||||||
|
Beginning Balance at January 1
|
$
|
95
|
|
$
|
60
|
|
$
|
155
|
|
$
|
79
|
|
$
|
55
|
|
$
|
134
|
|
|||||
|
Total realized/unrealized gains (losses):
|
|||||||||||||||||||||||
|
Realized gains (losses)
|
6
|
|
(11
|
)
|
(5
|
)
|
(1
|
)
|
2
|
|
1
|
|
|||||||||||
|
Unrealized gains (losses)
|
—
|
|
14
|
|
14
|
|
2
|
|
(22
|
)
|
(20
|
)
|
|||||||||||
|
Purchases, sales and settlements:
|
|||||||||||||||||||||||
|
Purchases
|
86
|
|
36
|
|
122
|
|
68
|
|
48
|
|
116
|
|
|||||||||||
|
Sales
|
(68
|
)
|
(13
|
)
|
(81
|
)
|
(53
|
)
|
(23
|
)
|
(76
|
)
|
|||||||||||
|
Ending Balance at December 31
|
$
|
119
|
|
$
|
86
|
|
$
|
205
|
|
$
|
95
|
|
$
|
60
|
|
$
|
155
|
|
|||||
|
The amount of total gains (losses) for the period attributable to the change in unrealized gains or losses related to assets still held at the end of the period
|
$
|
6
|
|
$
|
2
|
|
$
|
8
|
|
$
|
5
|
|
$
|
(16
|
)
|
$
|
(11
|
)
|
|||||
There were
no
transfers between Level 3 and Level 2 and there were
no
significant transfers between Level 2 and Level 1 in the years ended December 31, 2012 and 2011.
Healthcare Legislation
In December 2003, the Medicare Act was signed into law which provides for a non-taxable federal subsidy to sponsors of retiree health care benefit plans that provide a benefit that is at least “actuarially equivalent” to the benefit established by law. The effects of the subsidy reduced net periodic postretirement benefit costs by $
6 million
in 2012, $
6 million
in 2011 and $
7 million
in 2010.
Grantor Trust
DTE Gas maintains a Grantor Trust to fund other postretirement benefit obligations that invests in life insurance contracts and income securities. Employees and retirees have no right, title or interest in the assets of the Grantor Trust, and DTE Gas can revoke the trust subject to providing the MPSC with prior notification. The Company accounts for its investment at fair value, approximately $
14 million
at December 31, 2012, with unrealized gains and losses recorded to earnings. The Grantor Trust investment is included in Other investments on the Consolidated Statements of Financial Position.
103
104
The Company’s stock incentive program permits the grant of incentive stock options, non-qualifying stock options, stock awards, performance shares and performance units to employees and members of its Board of Directors. Key provisions of the stock incentive program are:
|
•
|
Authorized limit is
11,500,000
shares of common stock;
|
|
•
|
Prohibits the grant of a stock option with an exercise price that is less than the fair market value of the Company’s stock on the date of the grant; and
|
|
•
|
Imposes the following award limits to a single participant in a single calendar year, (1) options for more than
500,000
shares of common stock; (2) stock awards for more than
150,000
shares of common stock; (3) performance share awards for more than
300,000
shares of common stock (based on the maximum payout under the award); or (4) more than
1,000,000
performance units, which have a face amount of $
1.00
each.
|
The Company records compensation expense at fair value over the vesting period for all awards it grants.
Stock-based compensation for the reporting periods is as follows:
|
2012
|
2011
|
2010
|
|||||||||
|
(In millions)
|
|||||||||||
|
Stock-based compensation expense
|
$
|
83
|
|
$
|
66
|
|
$
|
52
|
|
||
|
Tax benefit
|
33
|
|
25
|
|
20
|
|
|||||
|
Stock-based compensation cost capitalized in property, plant and equipment
|
5
|
|
4
|
|
3
|
|
|||||
Options
Options are exercisable according to the terms of the individual stock option award agreements and expire
10
years after the date of the grant. The option exercise price equals the fair value of the stock on the date that the option was granted. Stock options vest ratably over a
3
-year period.
Stock option activity was as follows:
|
Number of
Options
|
Weighted
Average
Exercise Price
|
Aggregate
Intrinsic
Value (In millions)
|
||||||||
|
Options outstanding at January 1, 2012
|
2,764,670
|
|
$
|
41.25
|
|
|||||
|
Granted
|
—
|
|
$
|
—
|
|
|||||
|
Exercised
|
(1,555,227
|
)
|
$
|
40.78
|
|
|||||
|
Forfeited or expired
|
(16,773
|
)
|
$
|
42.02
|
|
|||||
|
Options outstanding at December 31, 2012
|
1,192,670
|
|
$
|
41.86
|
|
$
|
22
|
|
||
|
Options exercisable at December 31, 2012
|
991,826
|
|
$
|
41.44
|
|
$
|
19
|
|
||
As of
December 31, 2012
, the weighted average remaining contractual life for the exercisable shares is
4.30
years. As of
December 31, 2012
,
200,844
options were non-vested. During
2012
,
332,026
options vested.
There were no options granted during 2012 or 2011. The intrinsic value of options exercised for the years ended
December 31, 2012
,
2011
and
2010
was $
25 million
, $
20 million
, and $
9 million
, respectively. Total option expense recognized during
2012
,
2011
and
2010
was $
0.7 million
, $
2 million
and $
4 million
, respectively.
105
The number, weighted average exercise price and weighted average remaining contractual life of options outstanding were as follows:
|
Weighted Average
Exercise Price
|
Weighted Average
Remaining Contractual Life (Years)
|
||||||||||||||
|
Number of Options
|
|||||||||||||||
|
Range of Exercise Prices
|
|||||||||||||||
|
$
|
27.00
|
|
—
|
$
|
38.00
|
|
142,619
|
|
$
|
27.98
|
|
6.15
|
|||
|
$
|
38.01
|
|
—
|
$
|
42.00
|
|
291,982
|
|
$
|
41.14
|
|
3.22
|
|||
|
$
|
42.01
|
|
—
|
$
|
45.00
|
|
605,569
|
|
$
|
44.03
|
|
5.40
|
|||
|
$
|
45.01
|
|
—
|
$
|
50.00
|
|
152,500
|
|
$
|
47.62
|
|
4.03
|
|||
|
1,192,670
|
|
$
|
41.86
|
|
4.78
|
||||||||||
The Company determined the fair value for these options at the date of grant in 2010 using a Black-Scholes based option pricing model and the following assumptions:
|
2010
|
|||
|
Risk-free interest rate
|
2.91
|
%
|
|
|
Dividend yield
|
5.08
|
%
|
|
|
Expected volatility
|
22.96
|
%
|
|
|
Expected life
|
6 years
|
|
|
The Company includes both historical and implied share-price volatility in option volatility. Implied volatility is derived from exchange traded options on DTE Energy common stock. The Company’s expected life estimate is based on historical data.
Stock Awards
Stock awards granted under the plan are restricted for varying periods, generally for three years. Participants have all rights of a shareholder with respect to a stock award, including the right to receive dividends and vote the shares. Prior to vesting in stock awards, the participant: (i) may not sell, transfer, pledge, exchange or otherwise dispose of shares; (ii) shall not retain custody of the share certificates; and (iii) will deliver to the Company a stock power with respect to each stock award upon request.
The stock awards are recorded at cost that approximates fair value on the date of grant. The cost is amortized to compensation expense over the vesting period.
Stock award activity for the periods ended December 31 was:
|
2012
|
2011
|
2010
|
|||||||||
|
Fair value of awards vested (in millions)
|
$
|
9
|
|
$
|
13
|
|
$
|
19
|
|
||
|
Restricted common shares awarded
|
167,320
|
|
381,840
|
|
238,405
|
|
|||||
|
Weighted average market price of shares awarded
|
$
|
53.71
|
|
$
|
47.98
|
|
$
|
44.08
|
|
||
|
Compensation cost charged against income (in millions)
|
$
|
12
|
|
$
|
12
|
|
$
|
12
|
|
||
The following table summarizes the Company’s stock awards activity for the period ended
December 31, 2012
:
|
Restricted
Stock
|
Weighted Average
Grant Date
Fair Value
|
|||||
|
Balance at January 1, 2012
|
726,224
|
|
$
|
42.25
|
|
|
|
Grants
|
167,320
|
|
$
|
53.71
|
|
|
|
Forfeitures
|
(37,767
|
)
|
$
|
48.46
|
|
|
|
Vested and issued
|
(258,129
|
)
|
$
|
34.41
|
|
|
|
Balance at December 31, 2012
|
597,648
|
|
$
|
48.33
|
|
|
106
Performance Share Awards
Performance shares awarded under the plan are for a specified number of shares of common stock that entitle the holder to receive a cash payment, shares of common stock or a combination thereof. The final value of the award is determined by the achievement of certain performance objectives and market conditions. The awards vest at the end of a specified period, usually three years. The Company accounts for performance share awards by accruing compensation expense over the vesting period based on: (i) the number of shares expected to be paid which is based on the probable achievement of performance objectives; and (ii) the closing stock price market value. The settlement of the award is based on the closing price at the settlement date.
The Company recorded compensation expense as follows:
|
2012
|
2011
|
2010
|
|||||||||
|
(In millions)
|
|||||||||||
|
Compensation expense
|
$
|
71
|
|
$
|
53
|
|
$
|
36
|
|
||
|
Cash settlements (a)
|
$
|
4
|
|
$
|
3
|
|
$
|
3
|
|
||
|
Stock settlements (a)
|
$
|
41
|
|
$
|
25
|
|
$
|
23
|
|
||
_______________________________________
|
(a)
|
Sum of cash and stock settlements approximates the intrinsic value of the liability.
|
During the vesting period, the recipient of a performance share award has no shareholder rights. Performance shares granted are entitled to dividend equivalent payments before the performance shares granted are earned and vested. During the period beginning on the date the performance shares are awarded and ending on the certification date of the performance objectives, the number of performance shares awarded will be increased, assuming full dividend reinvestment at the fair market value on the dividend payment date. The cumulative number of performance shares will be adjusted to determine the final payment bases on the performance objectives achieved. Performance share awards are nontransferable and are subject to risk of forfeiture.
The following table summarizes the Company’s performance share activity for the period ended
December 31, 2012
:
|
Performance Shares
|
||
|
Balance at January 1, 2012
|
1,608,733
|
|
|
Grants
|
590,098
|
|
|
Forfeitures
|
(59,712
|
)
|
|
Payouts
|
(504,755
|
)
|
|
Balance at December 31, 2012
|
1,634,364
|
|
Unrecognized Compensation Costs
As of
December 31, 2012
, there was $
58 million
of total unrecognized compensation cost related to non-vested stock incentive plan arrangements. That cost is expected to be recognized over a weighted-average period of
1.37
years.
|
Unrecognized
Compensation
Cost
|
Weighted Average
to be Recognized
|
||||
|
(In millions)
|
(In years)
|
||||
|
Options
|
$
|
—
|
|
0.15
|
|
|
Stock awards
|
11
|
|
1.02
|
||
|
Performance shares
|
47
|
|
1.46
|
||
|
$
|
58
|
|
1.37
|
||
A detailed analysis of the changes in assets and liabilities that are reported in the Consolidated Statements of Cash Flows follows:
107
|
2012
|
2011
|
2010
|
|||||||||
|
(In millions)
|
|||||||||||
|
Changes in Assets and Liabilities, Exclusive of Changes Shown Separately
|
|||||||||||
|
Accounts receivable, net
|
$
|
52
|
|
$
|
71
|
|
$
|
79
|
|
||
|
Inventories
|
35
|
|
(129
|
)
|
(133
|
)
|
|||||
|
Recoverable pension and postretirement costs
|
141
|
|
(620
|
)
|
(32
|
)
|
|||||
|
Accrued/prepaid pensions
|
280
|
|
432
|
|
67
|
|
|||||
|
Accounts payable
|
40
|
|
(23
|
)
|
12
|
|
|||||
|
Income taxes payable/receivable
|
30
|
|
249
|
|
(245
|
)
|
|||||
|
Derivative assets and liabilities
|
53
|
|
(94
|
)
|
(48
|
)
|
|||||
|
Postretirement obligation
|
(323
|
)
|
209
|
|
(24
|
)
|
|||||
|
Regulatory assets
|
122
|
|
38
|
|
(37
|
)
|
|||||
|
Other assets
|
117
|
|
(28
|
)
|
(15
|
)
|
|||||
|
Other liabilities
|
(105
|
)
|
(11
|
)
|
83
|
|
|||||
|
$
|
442
|
|
$
|
94
|
|
$
|
(293
|
)
|
|||
Supplementary cash information for the years ended December 31, were as follows:
|
2012
|
2011
|
2010
|
|||||||||
|
(In millions)
|
|||||||||||
|
Cash paid (received) for:
|
|||||||||||
|
Interest (net of interest capitalized)
|
$
|
438
|
|
$
|
485
|
|
$
|
551
|
|
||
|
Income taxes
|
$
|
173
|
|
$
|
(205
|
)
|
$
|
93
|
|
||
Supplementary non-cash information for the years ended December 31, were as follows:
|
2012
|
2011
|
2010
|
|||||||||
|
(In millions)
|
|||||||||||
|
Common stock issued for employee benefit plans
|
$
|
114
|
|
$
|
1
|
|
$
|
156
|
|
||
|
Change in capital expenditures not paid
|
$
|
23
|
|
$
|
76
|
|
$
|
20
|
|
||
The Company sets strategic goals, allocates resources and evaluates performance based on the following structure:
Electric
segment consists principally of DTE Electric, which is engaged in the generation, purchase, distribution and sale of electricity to approximately
2.1 million
residential, commercial and industrial customers in southeastern Michigan.
Gas
segment consists of DTE Gas and Citizens. DTE Gas is engaged in the purchase, storage, transportation, distribution and sale of natural gas to approximately
1.2 million
residential, commercial and industrial customers throughout Michigan and the sale of storage and transportation capacity. Citizens distributes natural gas in Adrian, Michigan to approximately
17,000
customers.
Gas Storage and Pipelines
consists of natural gas pipeline, gathering and storage businesses.
Power and Industrial Projects
is comprised primarily of projects that deliver energy and utility-type products and services to industrial, commercial and institutional customers; and sell electricity from biomass-fired energy projects.
Energy Trading
consists of energy marketing and trading operations.
Corporate and Other,
includes various holding company activities, holds certain non-utility debt and energy-related investments.
The federal income tax provisions or benefits of DTE Energy’s subsidiaries are determined on an individual company basis and recognize the tax benefit of production tax credits and net operating losses if applicable. The state and local income tax provisions of the utility subsidiaries is determined on an individual company basis and recognizes the tax benefit of various
108
tax credits and net operating losses if applicable. The subsidiaries record federal, state and local income taxes payable to or receivable from DTE Energy based on the federal, state and local tax provisions of each company.
Inter-segment billing for goods and services exchanged between segments is based upon tariffed or market-based prices of the provider and primarily consists of the sale of reduced emissions fuel, power sales, gas sales and coal transportation services in the following segments:
|
2012
|
2011
|
2010
|
|||||||||
|
(In millions)
|
|||||||||||
|
Electric
|
$
|
29
|
|
$
|
33
|
|
$
|
30
|
|
||
|
Gas
|
4
|
|
2
|
|
—
|
|
|||||
|
Gas Storage and Pipelines
|
6
|
|
8
|
|
4
|
|
|||||
|
Power and Industrial Projects
|
801
|
|
238
|
|
161
|
|
|||||
|
Energy Trading
|
43
|
|
70
|
|
89
|
|
|||||
|
Corporate and Other
|
(37
|
)
|
(50
|
)
|
(65
|
)
|
|||||
|
Discontinued Operations
|
2
|
|
—
|
|
—
|
|
|||||
|
$
|
848
|
|
$
|
301
|
|
$
|
219
|
|
|||
Financial data of the business segments follows:
|
Operating
Revenue
|
Depreciation,
Depletion &
Amortization
|
Interest
Income
|
Interest
Expense
|
Income
Taxes
|
Net Income
Attributable
to DTE
Energy
Company
|
Total
Assets
|
Goodwill
|
Capital
Expenditures
|
|||||||||||||||||||||||||||
|
(In millions)
|
|||||||||||||||||||||||||||||||||||
|
2012
|
|||||||||||||||||||||||||||||||||||
|
Electric
|
$
|
5,293
|
|
$
|
827
|
|
$
|
(1
|
)
|
$
|
272
|
|
$
|
280
|
|
$
|
483
|
|
$
|
17,755
|
|
$
|
1,208
|
|
$
|
1,230
|
|
||||||||
|
Gas
|
1,315
|
|
92
|
|
(7
|
)
|
59
|
|
50
|
|
115
|
|
4,059
|
|
745
|
|
220
|
|
|||||||||||||||||
|
Gas Storage and Pipelines
|
96
|
|
8
|
|
(8
|
)
|
8
|
|
39
|
|
61
|
|
668
|
|
22
|
|
233
|
|
|||||||||||||||||
|
Power and Industrial Projects
|
1,823
|
|
65
|
|
(7
|
)
|
37
|
|
(44
|
)
|
42
|
|
991
|
|
26
|
|
83
|
|
|||||||||||||||||
|
Energy Trading
|
1,109
|
|
2
|
|
—
|
|
8
|
|
7
|
|
12
|
|
629
|
|
17
|
|
1
|
|
|||||||||||||||||
|
Corporate and Other
|
3
|
|
1
|
|
(52
|
)
|
121
|
|
(46
|
)
|
(47
|
)
|
3,074
|
|
—
|
|
3
|
|
|||||||||||||||||
|
Reclassifications and Eliminations
|
(848
|
)
|
—
|
|
65
|
|
(65
|
)
|
—
|
|
—
|
|
(837
|
)
|
—
|
|
—
|
|
|||||||||||||||||
|
Total from Continuing Operations
|
$
|
8,791
|
|
$
|
995
|
|
$
|
(10
|
)
|
$
|
440
|
|
$
|
286
|
|
666
|
|
26,339
|
|
2,018
|
|
1,770
|
|
||||||||||||
|
Discontinued Operations (Note 7)
|
(56
|
)
|
—
|
|
—
|
|
49
|
|
|||||||||||||||||||||||||||
|
Total
|
$
|
610
|
|
$
|
26,339
|
|
$
|
2,018
|
|
$
|
1,819
|
|
|||||||||||||||||||||||
|
Operating
Revenue
|
Depreciation,
Depletion &
Amortization
|
Interest
Income
|
Interest
Expense
|
Income
Taxes
|
Net Income
Attributable
to DTE
Energy
Company
|
Total
Assets
|
Goodwill
|
Capital
Expenditures
|
|||||||||||||||||||||||||||
|
(In millions)
|
|||||||||||||||||||||||||||||||||||
|
2011
|
|||||||||||||||||||||||||||||||||||
|
Electric
|
$
|
5,154
|
|
$
|
818
|
|
$
|
(1
|
)
|
$
|
289
|
|
$
|
265
|
|
$
|
434
|
|
$
|
17,567
|
|
$
|
1,208
|
|
$
|
1,203
|
|
||||||||
|
Gas
|
1,505
|
|
89
|
|
(7
|
)
|
64
|
|
60
|
|
110
|
|
4,065
|
|
745
|
|
179
|
|
|||||||||||||||||
|
Gas Storage and Pipelines
|
91
|
|
6
|
|
(5
|
)
|
7
|
|
35
|
|
57
|
|
538
|
|
22
|
|
16
|
|
|||||||||||||||||
|
Power and Industrial Projects
|
1,129
|
|
60
|
|
(8
|
)
|
32
|
|
11
|
|
38
|
|
789
|
|
26
|
|
56
|
|
|||||||||||||||||
|
Energy Trading
|
1,276
|
|
3
|
|
—
|
|
9
|
|
34
|
|
52
|
|
612
|
|
17
|
|
1
|
|
|||||||||||||||||
|
Corporate and Other
|
4
|
|
1
|
|
(47
|
)
|
145
|
|
(136
|
)
|
23
|
|
2,605
|
|
—
|
|
—
|
|
|||||||||||||||||
|
Reclassifications and Eliminations
|
(301
|
)
|
—
|
|
58
|
|
(58
|
)
|
(1
|
)
|
—
|
|
(485
|
)
|
—
|
|
—
|
|
|||||||||||||||||
|
Total from Continuing Operations
|
$
|
8,858
|
|
$
|
977
|
|
$
|
(10
|
)
|
$
|
488
|
|
$
|
268
|
|
$
|
714
|
|
$
|
25,691
|
|
$
|
2,018
|
|
$
|
1,455
|
|
||||||||
|
Discontinued Operations (Note 7)
|
(3
|
)
|
318
|
|
2
|
|
29
|
|
|||||||||||||||||||||||||||
|
Total
|
$
|
711
|
|
$
|
26,009
|
|
$
|
2,020
|
|
$
|
1,484
|
|
|||||||||||||||||||||||
109
|
Operating
Revenue
|
Depreciation,
Depletion &
Amortization
|
Interest
Income
|
Interest
Expense
|
Income
Taxes
|
Net Income
Attributable
to DTE
Energy
Company
|
Total
Assets
|
Goodwill
|
Capital
Expenditures
|
|||||||||||||||||||||||||||
|
(In millions)
|
|||||||||||||||||||||||||||||||||||
|
2010
|
|||||||||||||||||||||||||||||||||||
|
Electric
|
$
|
4,993
|
|
$
|
849
|
|
$
|
(1
|
)
|
$
|
313
|
|
$
|
270
|
|
$
|
441
|
|
$
|
16,611
|
|
$
|
1,206
|
|
$
|
864
|
|
||||||||
|
Gas
|
1,648
|
|
92
|
|
(9
|
)
|
66
|
|
67
|
|
127
|
|
3,925
|
|
759
|
|
147
|
|
|||||||||||||||||
|
Gas Storage and Pipelines
|
83
|
|
5
|
|
(1
|
)
|
6
|
|
32
|
|
51
|
|
446
|
|
9
|
|
5
|
|
|||||||||||||||||
|
Power and Industrial Projects
|
1,144
|
|
60
|
|
(3
|
)
|
33
|
|
3
|
|
85
|
|
872
|
|
27
|
|
53
|
|
|||||||||||||||||
|
Energy Trading
|
875
|
|
5
|
|
—
|
|
13
|
|
5
|
|
6
|
|
513
|
|
17
|
|
1
|
|
|||||||||||||||||
|
Corporate & Other
|
1
|
|
1
|
|
(47
|
)
|
160
|
|
(62
|
)
|
(72
|
)
|
2,616
|
|
—
|
|
—
|
|
|||||||||||||||||
|
Reclassifications and Eliminations
|
(219
|
)
|
—
|
|
49
|
|
(48
|
)
|
—
|
|
—
|
|
(413
|
)
|
—
|
|
—
|
|
|||||||||||||||||
|
Total from Continuing Operations
|
$
|
8,525
|
|
$
|
1,012
|
|
$
|
(12
|
)
|
$
|
543
|
|
$
|
315
|
|
$
|
638
|
|
$
|
24,570
|
|
$
|
2,018
|
|
$
|
1,070
|
|
||||||||
|
Discontinued Operations (Note 7)
|
(8
|
)
|
326
|
|
2
|
|
27
|
|
|||||||||||||||||||||||||||
|
Total
|
$
|
630
|
|
$
|
24,896
|
|
$
|
2,020
|
|
$
|
1,097
|
|
|||||||||||||||||||||||
Quarterly earnings per share may not equal full year totals, since quarterly computations are based on weighted average common shares outstanding during each quarter.
|
First
Quarter
|
Second
Quarter
|
Third
Quarter
|
Fourth
Quarter
|
Year
|
|||||||||||||||
|
|
(In millions, except per share amounts)
|
||||||||||||||||||
|
2012
|
|
|
|
|
|
|
|
|
|
|
|||||||||
|
Operating Revenues
|
$
|
2,239
|
|
$
|
2,013
|
|
$
|
2,190
|
|
$
|
2,349
|
|
$
|
8,791
|
|
||||
|
Operating Income
|
$
|
312
|
|
$
|
294
|
|
$
|
406
|
|
$
|
267
|
|
$
|
1,279
|
|
||||
|
Net Income Attributable to DTE Energy Company
|
|||||||||||||||||||
|
Continuing Operations
|
$
|
156
|
|
$
|
147
|
|
$
|
226
|
|
$
|
137
|
|
$
|
666
|
|
||||
|
Discontinued Operations
|
—
|
|
(1
|
)
|
1
|
|
(56
|
)
|
(56
|
)
|
|||||||||
|
Net Income Attributable to DTE Energy Company
|
$
|
156
|
|
$
|
146
|
|
$
|
227
|
|
$
|
81
|
|
$
|
610
|
|
||||
|
Basic Earnings per Share
|
|||||||||||||||||||
|
Continuing Operations
|
$
|
0.91
|
|
$
|
0.87
|
|
$
|
1.31
|
|
$
|
0.79
|
|
$
|
3.89
|
|
||||
|
Discontinued Operations
|
—
|
|
(0.01
|
)
|
0.01
|
|
(0.32
|
)
|
(0.33
|
)
|
|||||||||
|
Total
|
$
|
0.91
|
|
$
|
0.86
|
|
$
|
1.32
|
|
$
|
0.47
|
|
$
|
3.56
|
|
||||
|
Diluted Earnings per Share
|
|||||||||||||||||||
|
Continuing Operations
|
$
|
0.91
|
|
$
|
0.87
|
|
$
|
1.30
|
|
$
|
0.79
|
|
$
|
3.88
|
|
||||
|
Discontinued Operations
|
—
|
|
(0.01
|
)
|
0.01
|
|
(0.32
|
)
|
(0.33
|
)
|
|||||||||
|
Total
|
$
|
0.91
|
|
$
|
0.86
|
|
$
|
1.31
|
|
$
|
0.47
|
|
$
|
3.55
|
|
||||
|
2011
|
|
|
|
|
|
|
|
|
|
|
|||||||||
|
Operating Revenues
|
$
|
2,423
|
|
$
|
2,018
|
|
$
|
2,254
|
|
$
|
2,163
|
|
$
|
8,858
|
|
||||
|
Operating Income
|
$
|
389
|
|
$
|
288
|
|
$
|
398
|
|
$
|
346
|
|
$
|
1,421
|
|
||||
|
Net Income Attributable to DTE Energy Company
|
|||||||||||||||||||
|
Continuing Operations (a)
|
$
|
177
|
|
$
|
203
|
|
$
|
183
|
|
$
|
151
|
|
$
|
714
|
|
||||
|
Discontinued Operations
|
(1
|
)
|
(1
|
)
|
—
|
|
(1
|
)
|
(3
|
)
|
|||||||||
|
Net Income Attributable to DTE Energy Company
|
$
|
176
|
|
$
|
202
|
|
$
|
183
|
|
$
|
150
|
|
$
|
711
|
|
||||
|
Basic Earnings per Share
|
|||||||||||||||||||
|
Continuing Operations
|
$
|
1.05
|
|
$
|
1.19
|
|
$
|
1.08
|
|
$
|
0.88
|
|
$
|
4.21
|
|
||||
|
Discontinued Operations
|
(0.01
|
)
|
—
|
|
—
|
|
—
|
|
(0.02
|
)
|
|||||||||
|
Total
|
$
|
1.04
|
|
$
|
1.19
|
|
$
|
1.08
|
|
$
|
0.88
|
|
$
|
4.19
|
|
||||
|
Diluted Earnings per Share
|
|||||||||||||||||||
|
Continuing Operations
|
$
|
1.05
|
|
$
|
1.19
|
|
$
|
1.07
|
|
$
|
0.88
|
|
$
|
4.20
|
|
||||
|
Discontinued Operations
|
(0.01
|
)
|
—
|
|
—
|
|
—
|
|
(0.02
|
)
|
|||||||||
|
Total
|
$
|
1.04
|
|
$
|
1.19
|
|
$
|
1.07
|
|
$
|
0.88
|
|
$
|
4.18
|
|
||||
_______________________________________
(a) Includes an income tax benefit of $
87 million
relating to the enactment of the MCIT in the second quarter of 2011.
110
Item 9.
Changes in and Disagreements with Accountants on Accounting and Financial Disclosure
None.
Item 9A.
Controls and Procedures
See Item 8. Financial Statements and Supplementary Data for management’s evaluation of disclosure controls and procedures, its report on internal control over financial reporting, and its conclusion on changes in internal control over financial reporting.
Item 9B.
Other Information
Item 10.
Directors, Executive Officers and Corporate Governance
Item 11.
Executive Compensation
Item 12.
Security Ownership of Certain Beneficial Owners and Management and Related Stockholder Matters
Item 13.
Certain Relationships and Related Transactions, and Director Independence
Item 14.
Principal Accountant Fees and Services
Information required by Part III (Items 10, 11, 12, 13 and 14) of this Form 10-K is incorporated by reference from DTE Energy’s definitive Proxy Statement for its 2013 Annual Meeting of Shareholders to be held May 2, 2013. The Proxy Statement will be filed with the Securities and Exchange Commission, pursuant to Regulation 14A, not later than 120 days after the end of our fiscal year covered by this report on Form 10-K, all of which information is hereby incorporated by reference in, and made part of, this Form 10-K.
Item 15.
Exhibits and Financial Statement Schedules
|
(i) Exhibits filed herewith:
|
||
|
4-279
|
Forty-Third Supplemental Indenture, dated as of December 1, 2012 to Indenture of Mortgage and Deed of Trust dated as of March 1, 1944 between Michigan Consolidated Gas Company and Citibank, N.A., trustee. (2012 Series D Collateral Bonds)
|
|
|
10-81
|
Second Amendment to the DTE Energy Supplemental Savings Plan dated as of November 13, 2012.
|
|
|
12-52
|
|
Computation of Ratio of Earnings to Fixed Charges.
|
|
21-8
|
|
Subsidiaries of the Company.
|
|
23-26
|
|
Consent of PricewaterhouseCoopers LLP.
|
|
31-79
|
|
Chief Executive Officer Section 302 Form 10-K Certification of Periodic Report.
|
|
31-80
|
|
Chief Financial Officer Section 302 Form 10-K Certification of Periodic Report.
|
|
101.INS
|
XBRL Instance Document
|
|
|
101.SCH
|
XBRL Taxonomy Extension Schema
|
|
|
101.CAL
|
XBRL Taxonomy Extension Calculation Linkbase
|
|
|
101.DEF
|
XBRL Taxonomy Extension Definition Database
|
|
|
101.LAB
|
XBRL Taxonomy Extension Label Linkbase
|
|
|
101.PRE
|
XBRL Taxonomy Extension Presentation Linkbase
|
|
111
|
|
|
(ii) Exhibits incorporated herein by reference:
|
|
Certain exhibits listed below refer to "The Detroit Edison Company" and "Michigan Consolidated Gas Company" and were effective prior to the change to DTE Electric Company and DTE Gas Company, respectively, effective January 1, 2013.
|
||
|
3(a)
|
|
Amended and Restated Articles of Incorporation of DTE Energy Company, dated December 13, 1995 and as amended from time to time (Exhibit 3-1 to Form 8-K dated May 6, 2010).
|
|
3(b)
|
|
Amended Bylaws of DTE Energy Company, as amended through May 5, 2011 (Exhibit 3-11 to Form 10-Q for the quarter ended September 30, 2011).
|
|
4(a)
|
|
Amended and Restated Indenture, dated as of April 9, 2001, between DTE Energy Company and The Bank of New York, as trustee (Exhibit 4.1 to Registration Statement on Form S-3 (File No. 333-58834)).
|
|
|
|
|
|
|
|
Supplemental Indenture, dated as of April 1, 2003, between DTE Energy Company and The Bank of New York, as trustee, creating 2003 Series A 6
3
/8% Senior Notes due 2033 (Exhibit 4(o) to Form 10-Q for the quarter ended March 31, 2003). (2003 Series A 6
3
/8% Senior Notes due 2033).
|
|
|
|
|
|
|
|
Supplemental Indenture, dated as of May 15, 2006, between DTE Energy Company and The Bank of New York, as trustee (Exhibit 4-239 to Form 10-Q for the quarter ended June 30, 2006). (2006 Series B 6.35% Senior Notes due 2016).
|
|
Supplemental Indenture, dated as of May 1, 2009, between DTE Energy Company and The Bank of New York Mellon Trust Company, N.A. as successor trustee (Exhibit 4-1 to Form 8-K dated May 13, 2009). (2009 Series A 7.625% Senior Notes due 2014).
|
||
|
Supplemental Indenture dated as of May 15, 2011, between DTE Energy Company and The Bank of New York Mellon Trust Company, N.A., as successor trustee (Exhibit 4-269 to Form 10-Q for the quarter ended June 30, 2011). (2011 Series C Floating Rate Notes due 2013).
|
||
|
|
|
Supplemental Indenture, dated as of December 1, 2011, between DTE Energy Company and The Bank of New York Mellon Trust Company, N.A., as successor trustee (Exhibit 4-274 to Form 8-K dated December 7, 2011). (2011 Series I 6.50% Junior Subordinated Debentures due 2061).
|
|
Supplemental Indenture, dated as of September 1, 2012, to the Amended and Restated Indenture, dated as of April 9, 2001, between DTE Energy Company and The Bank of New York Mellon Trust Company,, N.A., as successor trustee (Exhibit 4-275 to Form 8-K dated October 1, 2012) (2012 Series C 5.25% Junior Subordinated Debentures due 2062).
|
||
|
4(b)
|
|
Mortgage and Deed of Trust, dated as of October 1, 1924, between The Detroit Edison Company and The Bank of New York Mellon Trust Company, N.A., as successor trustee (Exhibit B-1 to Detroit Edison's Registration Statement on Form A-2 (File No. 2-1630)) and indentures supplemental thereto, dated as of dates indicated below, and filed as exhibits to the filings set forth below:
|
|
|
|
|
|
|
|
Supplemental Indenture, dated as of December 1, 1940, to the Mortgage and Deed of Trust, dated as of October 1, 1924, between The Detroit Edison Company and The Bank of New York Mellon Trust Company, N.A., as successor trustee (Exhibit B-14 to Detroit Edison's Registration Statement on Form A-2 (File No. 2-4609)). (amendment)
|
|
|
|
|
|
|
|
Supplemental Indenture, dated as of September 1, 1947, to the Mortgage and Deed of Trust, dated as of October 1, 1924, between The Detroit Edison Company and The Bank of New York Mellon Trust Company, N.A., as successor trustee (Exhibit B-20 to Detroit Edison's Registration Statement on Form S-1 (File No. 2-7136)). (amendment)
|
|
|
|
|
|
|
|
Supplemental Indenture, dated as of March 1, 1950, to the Mortgage and Deed of Trust, dated as of October 1, 1924, between The Detroit Edison Company and The Bank of New York Mellon Trust Company, N.A., as successor trustee (Exhibit B-22 to Detroit Edison's Registration Statement on Form S-1 (File No. 2-8290)). (amendment)
|
|
|
|
|
|
|
|
Supplemental Indenture, dated as of November 15, 1951, to the Mortgage and Deed of Trust, dated as of October 1, 1924, between The Detroit Edison Company and The Bank of New York Mellon Trust Company, N.A., as successor trustee (Exhibit B-23 to Detroit Edison's Registration Statement on Form S-1 (File No. 2-9226)). (amendment)
|
|
|
|
|
|
|
|
Supplemental Indenture, dated as of August 15, 1957, to the Mortgage and Deed of Trust, dated as of October 1, 1924, between The Detroit Edison Company and The Bank of New York Mellon Trust Company, N.A., as successor trustee (Exhibit 3-B-30 to Detroit Edison's Form 8-K dated September 11, 1957). (amendment)
|
112
|
|
|
Supplemental Indenture, dated as of December 1, 1966, to the Mortgage and Deed of Trust, dated as of October 1, 1924, between The Detroit Edison Company and The Bank of New York Mellon Trust Company, N.A., as successor trustee (Exhibit 2-B-32 to Detroit Edison's Registration Statement on Form S-9 (File No. 2-25664)). (amendment)
|
|
|
|
|
|
|
|
Supplemental Indenture, dated as of February 15, 1990, to the Mortgage and Deed of Trust, dated as of October 1, 1924, between The Detroit Edison Company and The Bank of New York Mellon Trust Company, N.A., as successor trustee (Exhibit 4-212 to Detroit Edison's Form 10-K for the year ended December 31, 2000). (1990 Series B and C)
|
|
|
|
|
|
|
|
Supplemental Indenture, dated as of May 1, 1991, to the Mortgage and Deed of Trust, dated as of October 1, 1924, between The Detroit Edison Company and The Bank of New York Mellon Trust Company, N.A., as successor trustee (Exhibit 4-178 to Detroit Edison's Form 10-K for the year ended December 31, 1996). (1991 Series BP and CP)
|
|
|
|
|
|
|
|
Supplemental Indenture, dated as of May 15, 1991, to the Mortgage and Deed of Trust, dated as of October 1, 1924, between The Detroit Edison Company and The Bank of New York Mellon Trust Company, N.A., as successor trustee (Exhibit 4-179 to Detroit Edison's Form 10-K for the year ended December 31, 1996). (1991 Series DP)
|
|
|
|
|
|
|
|
Supplemental Indenture, dated as of February 29, 1992, to the Mortgage and Deed of Trust, dated as of October 1, 1924, between The Detroit Edison Company and The Bank of New York Mellon Trust Company, N.A., as successor trustee (Exhibit 4-187 to Detroit Edison's Form 10-Q for the quarter ended March 31, 1998). (1992 Series AP)
|
|
|
|
|
|
|
|
Supplemental Indenture, dated as of April 26, 1993, to the Mortgage and Deed of Trust, dated as of October 1, 1924, between The Detroit Edison Company and The Bank of New York Mellon Trust Company, N.A., as successor trustee (Exhibit 4-215 to Detroit Edison's Form 10-K for the year ended December 31, 2000). (amendment)
|
|
|
|
|
|
|
|
Supplemental Indenture, dated as of August 1, 2000, to the Mortgage and Deed of Trust, dated as of October 1, 1924, between The Detroit Edison Company and The Bank of New York Mellon Trust Company, N.A., as successor trustee (Exhibit 4-210 to Detroit Edison's Form 10-Q for the quarter ended September 30, 2000). (2000 Series BP)
|
|
|
|
|
|
|
|
Supplemental Indenture, dated as of September 17, 2002, to the Mortgage and Deed of Trust, dated as of October 1, 1924, between The Detroit Edison Company and The Bank of New York Mellon Trust Company, N.A., as successor trustee (Exhibit 4.1 to Detroit Edison's Registration Statement on Form S-3 (File No. 333-100000)). (amendment and successor trustee)
|
|
|
|
|
|
|
|
Supplemental Indenture, dated as of October 15, 2002, to the Mortgage and Deed of Trust, dated as of October 1, 1924, between The Detroit Edison Company and The Bank of New York Mellon Trust Company, N.A., as successor trustee (Exhibit 4-230 to Detroit Edison's Form 10-Q for the quarter ended September 30, 2002). (2002 Series A and B)
|
|
|
|
Supplemental Indenture, dated as of August 1, 2003, to the Mortgage and Deed of Trust, dated as of October 1, 1924, between The Detroit Edison Company and The Bank of New York Mellon Trust Company, N.A., as successor trustee (Exhibit 4-235 to Detroit Edison's Form 10-Q for the quarter ended September 30, 2003). (2003 Series A)
|
|
|
|
|
|
|
|
Supplemental Indenture, dated as of March 15, 2004, to the Mortgage and Deed of Trust, dated as of October 1, 1924, between The Detroit Edison Company and The Bank of New York Mellon Trust Company, N.A., as successor trustee (Exhibit 4-238 to Detroit Edison's Form 10-Q for the quarter ended March 31, 2004). (2004 Series A and B)
|
|
|
|
|
|
|
|
Supplemental Indenture, dated as of July 1, 2004, to the Mortgage and Deed of Trust, dated as of October 1, 1924, between The Detroit Edison Company and The Bank of New York Mellon Trust Company, N.A., as successor trustee (Exhibit 4-240 to Detroit Edison's Form 10-Q for the quarter ended June 30, 2004). (2004 Series D)
|
|
|
|
|
|
|
|
Supplemental Indenture, dated as of April 1, 2005, to the Mortgage and Deed of Trust, dated as of October 1, 1924, between Detroit Edison and The Bank of New York Mellon Trust Company, N.A., as successor trustee (Exhibit 4.3 to Detroit Edison's Registration Statement on Form S-4(File No. 333-123926)). (2005 Series AR and BR)
|
|
|
|
|
|
|
|
Supplemental Indenture, dated as of September 15, 2005, to the Mortgage and Deed of Trust, dated as of October 1, 1924, between The Detroit Edison Company and The Bank of New York Mellon Trust Company, N.A., as successor trustee (Exhibit 4.2 to Detroit Edison's Form 8-K dated September 29, 2005). (2005 Series C)
|
|
|
|
|
113
|
|
|
Supplemental Indenture, dated as of September 30, 2005, to the Mortgage and Deed of Trust, dated as of October 1, 1924, between Detroit Edison and The Bank of New York Mellon Trust Company, N.A., as successor trustee (Exhibit 4-248 to Detroit Edison's Form 10-Q for the quarter ended September 30, 2005). (2005 Series E)
|
|
|
|
|
|
|
|
Supplemental Indenture, dated as of May 15, 2006, to the Mortgage and Deed of Trust, dated as of October 1, 1924, between The Detroit Edison Company and The Bank of New York Mellon Trust Company, N.A., as successor trustee (Exhibit 4-250 to Detroit Edison's Form 10-Q for the quarter ended June 30, 2006). (2006 Series A)
|
|
|
|
|
|
|
|
Supplemental Indenture, dated as of May 1, 2008 to Mortgage and Deed of Trust, dated as of October 1, 1924 between The Detroit Edison Company and The Bank of New York Mellon Trust Company, N.A., as successor trustee (Exhibit 4-253 to Detroit Edison's Form 10-Q for the quarter ended June 30, 2008). (2008 Series ET).
|
|
|
|
|
|
|
|
Supplemental Indenture, dated as of June 1, 2008 to Mortgage and Deed of Trust, dated as of October 1, 1924 between The Detroit Edison Company and The Bank of New York Mellon Trust Company, N.A., as successor trustee (Exhibit 4-255 to Detroit Edison's Form 10-Q for the quarter ended June 30, 2008). (2008 Series G)
|
|
|
|
Supplemental Indenture, dated as of July 1, 2008 to Mortgage and Deed of Trust, dated as of October 1, 1924 between The Detroit Edison Company and The Bank of New York Mellon Trust Company, N.A., as successor trustee (Exhibit 4-257 to Detroit Edison's Form 10-Q for the quarter ended June 30, 2008). (2008 Series KT)
|
|
|
|
|
|
|
|
Supplemental Indenture, dated as of October 1, 2008 to Mortgage and Deed of Trust, dated as of October 1, 1924 between The Detroit Edison Company and The Bank of New York Mellon Trust Company N.A. as successor trustee (Exhibit 4-259 to Detroit Edison's Form 10-Q for the quarter ended September 30, 2008). (2008 Series J)
|
|
|
|
|
|
|
|
Supplemental Indenture, dated as of December 1, 2008 to Mortgage and Deed of Trust, dated as of October 1, 1924 between The Detroit Edison Company and The Bank of New York Mellon Trust Company N.A., as successor trustee (Exhibit 4-261 to Detroit Edison's Form 10-K for the year ended December 31, 2008). (2008 Series LT)
|
|
|
|
|
|
|
|
Supplemental Indenture, dated as of March 15, 2009 to Mortgage and Deed of Trust, dated as of October 1, 1924 between The Detroit Edison Company and The Bank of New York Mellon Trust Company N.A., as successor trustee (Exhibit 4-263 to Detroit Edison's Form 10-Q for the quarter ended March 31, 2009). (2009 Series BT)
|
|
|
|
|
|
|
|
Supplemental Indenture, dated as of August 1, 2010, to the Mortgage and Deed of Trust, dated as of October 1, 1924, between The Detroit Edison Company and The Bank of New York Mellon Trust Company, N.A., as successor trustee (Exhibit 4-269 to Detroit Edison's Form 10-Q for the quarter ended September 30, 2010). (2010 Series B)
|
|
|
|
|
|
|
|
Supplemental Indenture, dated as of September 1, 2010, to the Mortgage and Deed of Trust, dated as of October 1, 1924, between The Detroit Edison Company and The Bank of New York Mellon Trust Company, N.A., as successor trustee (Exhibit 4-271 to Detroit Edison's Form 10-Q for the quarter ended September 30, 2010). (2010 Series A)
|
|
|
|
|
|
|
|
Supplemental Indenture, dated as of December 1, 2010, to the Mortgage and Deed of Trust, dated as of October 1, 1924, between The Detroit Edison Company and The Bank of New York Mellon Trust Company, N.A., as successor trustee (Exhibit 4-273 to Detroit Edison's Form 10-K for the year ended December 31, 2010). (2010 Series CT)
|
|
Supplemental Indenture, dated as of March 1, 2011, to the Mortgage and Deed of Trust, dated as of October 1, 1924, between The Detroit Edison Company and The Bank of New York Mellon Trust Company, N.A. as successor trustee (Exhibit 4-274 to Detroit Edison's Form 10-Q for the quarter ended March 31, 2011). (2011 Series AT)
|
||
|
Supplemental Indenture, dated as of May 15, 2011, to the Mortgage and Deed of Trust, dated as of October 1, 1924, between The Detroit Edison Company and The Bank of New York Mellon Trust Company, N.A. as successor trustee (Exhibit 4-275 to Detroit Edison's Form 10-Q for the quarter ended June 30, 2011). (2011 Series B)
|
||
|
Supplemental Indenture, dated as of August 1, 2011, to the Mortgage and Deed of Trust, dated as of October 1, 1924, between The Detroit Edison Company and The Bank of New York Mellon Trust Company, N.A. as successor trustee (Exhibit 4-276 to Detroit Edison's Form 10-Q for the quarter ended September 30, 2011). (2011 Series GT)
|
||
|
|
|
Supplemental Indenture, dated as of August 15, 2011, to the Mortgage and Deed of Trust, dated as of October 1, 1924, between The Detroit Edison Company and The Bank of New York Mellon Trust Company, N.A. as successor trustee (Exhibit 4-277 to Detroit Edison's Form 10-Q for the quarter ended September 30, 2011). (2011 Series D, 2011 Series E, 2011 Series F)
|
114
|
Supplemental Indenture, dated as of September 1, 2011, to the Mortgage and Deed of Trust, dated as of October 1, 1924, between The Detroit Edison Company and The Bank of New York Mellon Trust Company, N.A. as successor trustee (Exhibit 4-278 to Detroit Edison's Form 10-Q for the quarter ended September 30, 2011). (2011 Series H)
|
||
|
Supplemental Indenture dated as of June 20, 2012, to the Mortgage and Deed of Trust, dated as of October 1, 1924, between The Detroit Edison Company and The Bank of New York Mellon Trust Company, N.A., as successor trustee (Exhibit 4-279 to Detroit Edison's Form 10-Q for the quarter ended June 30, 2012). (2012 Series A and B)
|
||
|
|
Collateral Trust Indenture, dated as of June 30, 1993, between The Detroit Edison Company and The Bank of New York Mellon Trust Company, N.A., as successor trustee (Exhibit 4-152 to Detroit Edison's Registration Statement (File No. 33-50325)) and indentures supplemental thereto, dated as of dates indicated below, and filed as exhibits to the filings set forth below:
|
|
|
Tenth Supplemental Indenture, dated as of October 23, 2002, to the Collateral Trust Indenture, dated as of June 30, 1993, between The Detroit Edison Company and The Bank of New York Mellon Trust Company, N.A., as successor trustee (Exhibit 4-231 to Detroit Edison's Form 10-Q for the quarter ended September 30, 2002). (6.35% Senior Notes due 2032)
|
||
|
|
|
Twelfth Supplemental Indenture, dated as of August 1, 2003, to the Collateral Trust Indenture, dated as of June 30, 1993, between The Detroit Edison Company and The Bank of New York Mellon Trust Company, N.A., as successor trustee (Exhibit 4-236 to Detroit Edison's Form 10-Q for the quarter ended September 30, 2003). (5
1
/
2
% Senior Notes due 2030)
|
|
|
|
|
|
|
|
Thirteenth Supplemental Indenture, dated as of April 1, 2004, to the Collateral Trust Indenture, dated as of June 30, 1993, between The Detroit Edison Company and The Bank of New York Mellon Trust Company, N.A., as successor trustee (Exhibit 4-237 to Detroit Edison's Form 10-Q for the quarter ended March 31, 2004). (4.875% Senior Notes Due 2029 and 4.65% Senior Notes due 2028)
|
|
|
|
|
|
|
|
Fourteenth Supplemental Indenture, dated as of July 15, 2004, to the Collateral Trust Indenture, dated as of June 30, 1993, between The Detroit Edison Company and The Bank of New York Mellon Trust Company, N.A., as successor trustee (Exhibit 4-239 to Detroit Edison's Form 10-Q for the quarter ended June 30, 2004). (2004 Series D 5.40% Senior Notes due 2014)
|
|
|
|
|
|
|
|
Sixteenth Supplemental Indenture, dated as of April 1, 2005, to the Collateral Trust Indenture, dated as of June 30, 1993, between The Detroit Edison Company and The Bank of New York Mellon Trust Company, N.A., as successor trustee (Exhibit 4.1 to Detroit Edison's Registration Statement on Form S-4 (File No. 333-123926)). (2005 Series AR 4.80% Senior Notes due 2015 and 2005 Series BR 5.45% Senior Notes due 2035)
|
|
|
|
|
|
|
|
Eighteenth Supplemental Indenture, dated as of September 15, 2005, to the Collateral Trust Indenture, dated as of June 30, 1993, between The Detroit Edison Company and The Bank of New York Mellon Trust Company, N.A., as successor trustee (Exhibit 4.1 to Detroit Edison's Form 8-K dated September 29, 2005). (2005 Series C 5.19% Senior Notes due October 1, 2023)
|
|
|
|
|
|
|
|
Nineteenth Supplemental Indenture, dated as of September 30, 2005, to the Collateral Trust Indenture, dated as of June 30, 1993, between The Detroit Edison Company and The Bank of New York Mellon Trust Company, N.A., as successor trustee (Exhibit 4-247 to Detroit Edison's Form 10-Q for the quarter ended September 30, 2005). (2005 Series E 5.70% Senior Notes due 2037)
|
|
|
|
|
|
|
|
Twentieth Supplemental Indenture, dated as of May 15, 2006, to the Collateral Trust Indenture dated as of June 30, 1993, between The Detroit Edison Company and The Bank of New York Mellon Trust Company, N.A., as successor trustee (Exhibit 4-249 to Detroit Edison's Form 10-Q for the quarter ended June 30, 2006). (2006 Series A Senior Notes due 2036)
|
|
|
|
|
|
|
|
Twenty-second Supplemental Indenture, dated as of December 1, 2007, to the Collateral Trust Indenture, dated as of June 30, 1993, between The Detroit Edison Company and The Bank of New York Mellon Trust Company, N.A., as successor trustee (Exhibit 4.1 to Detroit Edison's Form 8-K dated December 18, 2007). (2007 Series A Senior Notes due 2038)
|
|
|
|
|
|
|
|
Twenty-fourth Supplemental Indenture, dated as of May 1, 2008 to the Collateral Trust Indenture, dated as of June 30, 1993 between The Detroit Edison Company and The Bank of New York Mellon Trust Company, N.A. as successor trustee (Exhibit 4-254 to Detroit Edison's Form 10-Q for the quarter ended June 30, 2008). (2008 Series ET Variable Rate Senior Notes due 2029)
|
|
|
|
|
|
|
|
Amendment dated June 1, 2009 to the Twenty-fourth Supplemental Indenture, dated as of May 1, 2008 to the Collateral Trust Indenture, dated as of June 30, 1993 between The Detroit Edison Company and The Bank of New York Mellon Trust Company, N.A. as successor trustee (2008 Series ET Variable Rate Senior Notes due 2029) (Exhibit 4-265 to Detroit Edison's Form 10-Q for the quarter ended June 30, 2009)
|
115
|
Twenty-fifth Supplemental Indenture, dated as of June 1, 2008 to the Collateral Trust Indenture, dated as of June 30, 1993 between The Detroit Edison Company and The Bank of New York Mellon Trust Company, N.A., as successor trustee (Exhibit 4-256 to Detroit Edison's Form 10-Q for the quarter ended June 30, 2008). (2008 Series G 5.60% Senior Notes due 2018)
|
||
|
|
|
Twenty-sixth Supplemental Indenture, dated as of July 1, 2008 to the Collateral Trust Indenture, dated as of June 30, 1993 between The Detroit Edison Company and The Bank of New York Mellon Trust Company, N.A., as successor trustee (Exhibit 4-258 to Detroit Edison's Form 10-Q for the quarter ended June 30, 2008). (2008 Series KT Variable Rate Senior Notes due 2020)
|
|
|
|
|
|
|
|
Amendment dated June 1, 2009 to the Twenty-sixth Supplemental Indenture, dated as of July 1, 2008 to the Collateral Trust Indenture, dated as of June 30, 1993 between The Detroit Edison Company and The Bank of New York Mellon Trust Company, N.A., as successor trustee (Exhibit 4-266 to Detroit Edison's Form 10-Q for the quarter ended June 30, 2009) (2008 Series KT Variable Rate Senior Notes due 2020)
|
|
|
|
|
|
|
|
Twenty-seventh Supplemental Indenture, dated as of October 1, 2008 to the Collateral Trust Indenture, dated as of June 30, 1993 between The Detroit Edison Company and The Bank of New York Mellon Trust Company, N.A., as successor trustee (Exhibit 4-260 to Detroit Edison's Form 10-Q for the quarter ended September 30, 2008). (2008 Series J 6.40% Senior Notes due 2013)
|
|
|
|
|
|
|
|
Twenty-eighth Supplemental Indenture, dated as of December 1, 2008 to the Collateral Trust Indenture, dated as of June 30, 1993 between The Detroit Edison Company and The Bank of New York Mellon Trust Company, N.A., as successor trustee (Exhibit 4-262 to Detroit Edison's Form 10-K for the year ended December 31, 2008). (2008 Series LT 6.75% Senior Notes due 2038)
|
|
|
|
|
|
|
|
Twenty-ninth Supplemental Indenture, dated as of March 15, 2009, to the Collateral Trust Indenture, dated as of June 30, 1993 between The Detroit Edison Company and The Bank of New York Mellon Trust Company, N.A., as successor trustee (Exhibit 4-264 to Detroit Edison's Form 10-Q for the quarter ended March 31, 2009). (2009 Series BT 6.00% Senior Notes due 2036)
|
|
|
|
|
|
|
|
Thirty-First Supplemental Indenture, dated as of August 1, 2010 to the Collateral Trust Indenture, dated as of June 1, 1993 between The Detroit Edison Company and The Bank of New York Mellon Trust Company, N.A., as successor trustee (Exhibit 4-270 to Detroit Edison's Form 10-Q for the quarter ended September 30, 2010). (2010 Series B 3.45% Senior Notes due 2020)
|
|
|
|
|
|
|
|
Thirty-Second Supplemental Indenture, dated as of September 1, 2010, between The Detroit Edison Company and The Bank of New York Mellon Trust Company, N.A., as successor trustee (Exhibit 4-272 to Detroit Edison's Form 10-Q for the quarter ended September 30, 2010). (2010 Series A 4.89% Senior Notes due 2020)
|
|
|
|
|
|
4(d)
|
|
Indenture dated as of June 1, 1998 between Michigan Consolidated Gas Company and Citibank, N.A., as trustee, related to Senior Debt Securities (Exhibit 4-1 to Michigan Consolidated Gas Company Registration Statement on Form S-3 (File No. 333-63370)) and indentures supplemental thereto, dated as of dates indicated below, and filed as exhibits to the filings set forth below:
|
|
|
|
|
|
|
|
Fourth Supplemental Indenture dated as of February 15, 2003, to the Indenture dated as of June 1, 1998 between Michigan Consolidated Gas Company and Citibank, N.A., trustee (Exhibit 4-3 to Michigan Consolidated Gas Company Form 10-Q for the quarter ended March 31, 2003). (5.70% Senior Notes, 2003 Series A due 2033)
|
|
|
|
Fifth Supplemental Indenture dated as of October 1, 2004, to the Indenture dated as of June 1, 1998 between Michigan Consolidated Gas Company and Citibank, N.A., trustee (Exhibit 4-6 to Michigan Consolidated Gas Company Form 10-Q for the quarter ended September 31, 2004). (5.00% Senior Notes, 2004 Series E due 2019)
|
|
|
|
|
|
|
|
Sixth Supplemental Indenture dated as of April 1, 2008, to the Indenture dated as of June 1, 1998 between Michigan Consolidated Gas Company and Citibank, N.A., trustee (Exhibit 4-241 to Form 10-Q for the quarter ended March 31, 2008). (5.26% Senior Notes, 2008 Series A due 2013, 6.04% Senior Notes, 2008 Series B due 2018 and 6.44% Senior Notes, 2008 Series C due 2023).
|
|
|
|
|
|
|
|
Seventh Supplemental Indenture, dated as of June 1, 2008 to Indenture dated as of June 1, 1998 between Michigan Consolidated Gas Company and Citibank, N.A., trustee (Exhibit 4-243 to Form 10-Q for the quarter ended June 30, 2008). (6.78% Senior Notes, 2008 Series F due 2028)
|
|
|
|
|
|
|
|
Eighth Supplemental Indenture, dated as of August 1, 2008 to Indenture dated as of June 1, 1998 between Michigan Consolidated Gas Company and Citibank, N.A., trustee (Exhibit 4-251 to Form 10-Q for the quarter ended September 30, 2008). (5.94% Senior Notes, 2008 Series H due 2015 and 6.36% Senior Notes, 2008 Series I due 2020)
|
|
|
|
|
|
4(e)
|
|
Indenture of Mortgage and Deed of Trust dated as of March 1, 1944 (Exhibit 7-D to Michigan Consolidated Gas Company Registration Statement No. 2-5252) and indentures supplemental thereto, dated as of dates indicated below, and filed as exhibits to the filings set forth below:
|
|
|
|
|
116
|
|
|
Thirty-second Supplemental Indenture dated as of January 5, 1993 to Indenture of Mortgage and Deed of Trust dated as of March 1, 1944 between Michigan Consolidated Gas Company and Citibank, N.A., trustee (Exhibit 4-1 to Michigan Consolidated Gas Company Form 10-K for the year ended December 31, 1992). (First Mortgage Bonds Designated Secured Term Notes, Series B)
|
|
|
|
|
|
|
|
Thirty-third Supplemental Indenture dated as of May 1, 1995 to Indenture of Mortgage and Deed of Trust dated as of March 1, 1944 between Michigan Consolidated Gas Company and Citibank, N.A., trustee (Exhibit 4-2 to Michigan Consolidated Gas Company Registration Statement on Form S-3(File No. 33-59093)). (First Mortgage Bonds Designated Secured Medium Term Notes, Series B)
|
|
|
|
|
|
|
|
Thirty-fifth Supplemental Indenture dated as of June 18, 1998 to Indenture of Mortgage and Deed of Trust dated as of March 1, 1944 between Michigan Consolidated Gas Company and Citibank, N.A., trustee, creating an issue of first mortgage bonds designated as collateral bonds (Exhibit 4-2 to Michigan Consolidated Gas Company Form 8-K dated June 18, 1998).
|
|
|
|
|
|
|
|
Thirty-seventh Supplemental Indenture dated as of February 15, 2003 to Indenture of Mortgage and Deed of Trust dated as of March 1, 1944 between Michigan Consolidated Gas Company and Citibank, N.A., trustee (Exhibit 4-4 to Michigan Consolidated Gas Company Form 10-Q for the quarter ended March 31, 2003). (5.70% collateral bonds due 2033)
|
|
|
|
Thirty-eighth Supplemental Indenture dated as of October 1, 2004 to Indenture of Mortgage and Deed of Trust dated as of March 1, 1944 between Michigan Consolidated Gas Company and Citibank, N.A., trustee (Exhibit 4-5 to Michigan Consolidated Gas Company Form 10-Q for the quarter ended September 31, 2004). (2004 Series E collateral bonds)
|
|
|
|
|
|
|
|
Thirty-ninth Supplemental Indenture, dated as of April 1, 2008 to Indenture of Mortgage and Deed of Trust dated as of March 1, 1944 between Michigan Consolidated Gas Company and Citibank, N.A., trustee (Exhibit 4-240 to Form 10-Q for the quarter ended March 31, 2008). (2008 Series A, B and C Collateral Bonds)
|
|
|
|
|
|
|
|
Fortieth Supplemental Indenture, dated as of June 1, 2008 to Indenture of Mortgage and Deed of Trust dated as of March 1, 1944 between Michigan Consolidated Gas Company and Citibank, N.A., trustee (Exhibit 4-242 to Form 10-Q for the quarter ended June 30, 2008). (2008 Series F Collateral Bonds)
|
|
|
|
|
|
|
|
Forty-first Supplemental Indenture, dated as of August 1, 2008 to Indenture of Mortgage and Deed of Trust dated as of March 1, 1944 between Michigan Consolidated Gas Company and Citibank, N.A., trustee (Exhibit 4-250 to Form 10-Q for the quarter ended September 30, 2008). (2008 Series H and I Collateral Bonds)
|
|
|
|
|
|
10(a)
|
|
Form of Indemnification Agreement between DTE Energy Company and each of Gerard M. Anderson., Steven E. Kurmas, David E. Meador, Gerardo Norcia, Bruce D. Peterson, and non-employee Directors (Exhibit 10-1 to Form 8-K dated December 6, 2007).
|
|
|
|
|
|
10(b)
|
|
Certain arrangements pertaining to the employment of Gerard M. Anderson with The Detroit Edison Company, dated October 6, 1993 (Exhibit 10-48 to The Detroit Edison Company's Form 10-K for the year ended December 31, 1993).
|
|
|
|
|
|
10(c)
|
|
Certain arrangements pertaining to the employment of David E. Meador with The Detroit Edison Company, dated January 14, 1997 (Exhibit 10-5 to Form 10-K for the year ended December 31, 1996).
|
|
|
|
|
|
10(d)
|
|
Certain arrangements pertaining to the employment of Bruce D. Peterson, dated May 22, 2002 (Exhibit 10-48 to Form 10-Q for the quarter ended June 30, 2002).
|
|
|
|
|
|
10(e)
|
|
DTE Energy Company Annual Incentive Plan (Exhibit 10-44 to Form 10-Q for the quarter ended March 31, 2001).
|
|
|
|
|
|
10(f)
|
|
Amended and Restated DTE Energy Company 2006 Long-Term Incentive Plan (as Amended and Restated effective as of May 6, 2010 and as Amended May 3, 2012) (Exhibit A to DTE Energy's Definitive Proxy Statement dated March 15, 2012).
|
|
|
|
|
|
10(g)
|
|
DTE Energy Company Retirement Plan for Non-Employee Directors' Fees (as Amended and Restated effective as of December 31, 1998) (Exhibit 10-31 to Form 10-K for the year ended December 31, 1998).
|
|
|
|
|
|
10(h)
|
|
The Detroit Edison Company Supplemental Long-Term Disability Plan, dated January 27, 1997 (Exhibit 10-4 to Form 10-K for the year ended December 31, 1996).
|
|
10(i)
|
|
Description of Executive Life Insurance Plan (Exhibit 10-47 to Form 10-Q for the quarter ended June 30, 2002).
|
|
|
|
|
|
10(j)
|
|
DTE Energy Affiliates Nonqualified Plans Master Trust, effective as of May 1, 2003 (Exhibit 10-49 to Form 10-Q for the quarter ended March 31, 2003).
|
|
|
|
|
|
10(k)
|
|
Form of Director Restricted Stock Agreement (Exhibit 10.1 to Form 8-K dated June 23, 2005).
|
|
|
|
|
117
|
10(l)
|
|
Form of Director Restricted Stock Agreement pursuant to the DTE Energy Company Long-Term Incentive Plan (Exhibit 10.1 to Form 8-K dated June 29, 2006).
|
|
|
|
|
|
10(m)
|
|
DTE Energy Company Executive Supplemental Retirement Plan as Amended and Restated, effective as of January 1, 2005 (Exhibit 10.75 to Form 10-K for the year ended December 31, 2008).
|
|
|
|
First Amendment to the DTE Energy Company Executive Supplemental Retirement Plan (Amended and Restated Effective January 1, 2005) dated as of December 2, 2009 (Exhibit 10.1 to Form 8-K dated December 8, 2009).
|
|
|
|
|
|
Second Amendment to the DTE Energy Company Executive Supplemental Retirement Plan (Amended and Restated Effective January 1, 2005) dated as of May 5, 2011 (Exhibit 10.80 to Form 10-Q for the quarter ended March 31, 2012.
|
||
|
10(n)
|
|
DTE Energy Company Supplemental Retirement Plan as Amended and Restated, effective as of January 1, 2005 (Exhibit 10.76 to Form 10-K for the year ended December 31, 2008).
|
|
|
|
|
|
10(o)
|
|
DTE Energy Company Supplemental Savings Plan as Amended and Restated, effective as of January 1, 2005 (Exhibit 10.77 to Form 10-K for the year ended December 31, 2008).
|
|
|
|
|
|
10(p)
|
|
DTE Energy Company Executive Deferred Compensation Plan as Amended and Restated, effective as of January 1, 2005 (Exhibit 10.78 to Form 10-K for the year ended December 31, 2008).
|
|
|
|
|
|
10(q)
|
|
DTE Energy Company Plan for Deferring the Payment of Directors' Fees as Amended and Restated, effective as of January 1, 2005 (Exhibit 10.79 to Form 10-K for the year ended December 31, 2008).
|
|
|
|
|
|
10(r)
|
|
DTE Energy Company Deferred Stock Compensation Plan for Non-Employee Directors as Amended and Restated, effective January 1, 2005 (Exhibit 10.80 to Form 10-K for the year ended December 31, 2008).
|
|
|
|
|
|
10(s)
|
|
Form of Amended and Restated DTE Energy Five-Year Credit Agreement, dated as of August 20, 2010 and Amended and Restated as of October 21, 2011, by and among DTE Energy Company, the lenders party thereto, Citibank, N.A., as Administrative Agent, and Barclays Capital, The Bank of Nova Scotia and JPMorgan Chase Bank, N.A., as Co-Syndication Agents (Exhibit 10.1 to Form 8-K dated October 21, 2011).
|
|
|
|
|
|
10(t)
|
|
Form of Amended and Restated Michigan Consolidated Gas Company Five-Year Credit Agreement, dated as of August 20, 2010 and Amended and Restated as of October 21, 2011, by and among
MichCon, the lenders party thereto, JPMorgan Chase Bank, N.A., as Administrative Agent, and Barclays Capital, Citibank, N.A. and Bank of America, N.A., as Co-Syndication Agents (Exhibit 10.2 to Form 8-K dated October 21, 2011).
|
|
|
|
|
|
10(u)
|
|
Form of Amended and Restated Detroit Edison Five-Year Credit Agreement, dated as of August 20, 2010 and Amended and Restated as of October 21, 2011, by and among Detroit Edison, the lenders party thereto, Barclays Bank PLC, as Administrative Agent, and Citibank, N.A., JPMorgan Chase Bank, N.A., and The Royal Bank of Scotland plc, as Co-Syndication Agents (Exhibit 10.1 to DTE Energy Company's and Detroit Edison's Form 8-K dated October 21, 2011
).
|
|
|
|
|
|
99(a)
|
|
Amendment and Restatement of Master Trust Agreement for the DTE Energy Company Master Plan Trust between DTE Energy Corporate Services, LLC and DTE Energy Investment Committee and JP Morgan Chase Bank, N.A., dated as of October 15, 2010.
|
|
|
|
(iii) Exhibits furnished herewith:
|
|
32-79
|
|
Chief Executive Officer Section 906 Form 10-K Certification of Periodic Report.
|
|
|
|
|
|
32-80
|
|
Chief Financial Officer Section 906 Form 10-K Certification of Periodic Report.
|
118
DTE Energy Company
Schedule II — Valuation and Qualifying Accounts
|
Year Ending December 31,
|
|||||||||||
|
2012
|
2011
|
2010
|
|||||||||
|
(In millions)
|
|||||||||||
|
Allowance for Doubtful Accounts (shown as deduction from Accounts Receivable in the Consolidated Statements of Financial Position)
|
|||||||||||
|
Balance at Beginning of Period
|
$
|
162
|
|
$
|
196
|
|
$
|
262
|
|
||
|
Additions:
|
|||||||||||
|
Charged to costs and expenses
|
79
|
|
94
|
|
113
|
|
|||||
|
Charged to other accounts (a)
|
16
|
|
18
|
|
20
|
|
|||||
|
Deductions (b)
|
(195
|
)
|
(146
|
)
|
(199
|
)
|
|||||
|
Balance at End of Period
|
$
|
62
|
|
$
|
162
|
|
$
|
196
|
|
||
_______________________________________
|
(a)
|
Collection of accounts previously written off.
|
|
(b)
|
Uncollectible accounts written off.
|
119
Signatures
Pursuant to the requirements of Section 13 or 15(d) of the Securities Exchange Act of 1934, the registrant has duly caused this report to be signed on its behalf by the undersigned, thereunto duly authorized.
|
DTE ENERGY COMPANY
|
||
|
(Registrant)
|
||
|
|
By
|
/s/ GERARD M. ANDERSON
|
|
Gerard M. Anderson
Chairman of the Board, President and Chief Executive Officer |
||
Date: February 20, 2013
Pursuant to the requirements of the Securities Exchange Act of 1934, this report has been signed below by the following persons on behalf of the registrant and in the capacities and on the date indicated.
|
By
|
|
/s/ GERARD M. ANDERSON
|
|
By
|
|
/s/ DAVID E. MEADOR
|
|
|
|
Gerard M. Anderson
Chairman of the Board, President and Chief Executive Officer
and Director
(Principal Executive Officer)
|
|
|
|
David E. Meador
Executive Vice President and Chief Financial Officer
(Principal Financial Officer)
|
|
|
|
|
|
|
|
|
|
By
|
|
/s/ DONNA M. ENGLAND
|
|
By
|
|
/s/ EUGENE A. MILLER
|
|
|
|
Donna M. England
Chief Accounting Officer
(Principal Accounting Officer)
|
|
|
|
Eugene A. Miller, Director
|
|
|
|
|
|
|
|
|
|
By
|
|
/s/ LILLIAN BAUDER
|
|
By
|
|
/s/ MARK A. MURRAY
|
|
|
|
Lillian Bauder, Director
|
|
|
|
Mark A. Murray, Director
|
|
|
|
|
|
|
|
|
|
By
|
|
/s/ DAVID A. BRANDON
|
|
By
|
|
/s/ JAMES B. NICHOLSON
|
|
|
|
David A. Brandon, Director
|
|
|
|
James B. Nicholson, Director
|
|
|
|
|
|
|
|
|
|
By
|
|
/s/ W. FRANK FOUNTAIN, JR.
|
|
By
|
|
/s/ CHARLES W. PRYOR, JR.
|
|
|
|
W. Frank Fountain, Jr., Director
|
|
|
|
Charles W. Pryor, Jr., Director
|
|
|
|
|
|
|
|
|
|
By
|
|
/s/ FRANK M. HENNESSEY
|
|
By
|
|
/s/ JOSUE ROBLES, JR.
|
|
|
|
Frank M. Hennessey, Director
|
|
|
|
Josue Robles, Jr., Director
|
|
|
|
|
|
|
|
|
|
By
|
|
/s/ CHARLES G. MCCLURE JR.
|
|
By
|
|
/s/ RUTH G. SHAW
|
|
|
|
Charles G. McClure Jr., Director
|
|
|
|
Ruth G. Shaw, Director
|
|
|
|
|
|
|||
|
By
|
|
/s/ GAIL J. MCGOVERN
|
|
By
|
/s/ JAMES H. VANDENBERGHE
|
|
|
|
|
Gail J. McGovern, Director
|
|
James H. Vandenberghe, Director
|
||
Date: February 20, 2013
120
TABLE OF CONTENTS
Part IItem 1A. Risk FactorsItem 1B. Unresolved Staff CommentsItem 3. Legal ProceedingsItem 4. Mine Safety DisclosuresPart IIItem 5. Market For Registrant S Common Equity, Related Stockholder Matters and Issuer Purchases Of Equity SecuritiesItem 6. Selected Financial DataItem 7. Management S Discussion and Analysis Of Financial Condition and Results Of OperationsItem 7A. Quantitative and Qualitative Disclosures About Market RiskItem 8. Financial Statements and Supplementary DataNote 1 Organization and Basis Of PresentationNote 2 Significant Accounting PoliciesNote 3 Fair ValueNote 4 Financial and Other Derivative InstrumentsNote 5 GoodwillNote 6 AcquisitionNote 7 Discontinued OperationsNote 8 Property, Plant and EquipmentNote 9 Jointly Owned Utility PlantNote 10 Asset Retirement ObligationsNote 11 Regulatory MattersNote 12 Income TaxesNote 13 Common StockNote 14 Earnings Per ShareNote 15 Long-term DebtNote 16 Preferred and Preference SecuritiesNote 17 Short-term Credit Arrangements and BorrowingsNote 18 Capital and Operating LeasesNote 19 Commitments and ContingenciesNote 20 Retirement Benefits and Trusteed AssetsNote 21 Stock-based CompensationNote 22 Supplemental Cash Flow InformationNote 23 Segment and Related InformationNote 24 Supplementary Quarterly Financial Information (unaudited)Item 9. Changes in and Disagreements with Accountants on Accounting and Financial DisclosureItem 9A. Controls and ProceduresItem 9B. Other InformationPart IIIItem 10. Directors, Executive Officers and Corporate GovernanceItem 11. Executive CompensationItem 12. Security Ownership Of Certain Beneficial Owners and Management and Related Stockholder MattersItem 13. Certain Relationships and Related Transactions, and Director IndependenceItem 14. Principal Accountant Fees and ServicesPart IVItem 15. Exhibits and Financial Statement Schedules