DUKE ENERGY CORP
10-Ks and 10-Qs
|
|
|
|
|
|
|
|
|
|
|
|
|
|
|
|
|
|
|
|
|
|
|
|
|
|
|
|
|
|
|
|
|
|
|
|
|
|
|
|
|
|
|
|
|
|
|
|
|
|
|
|
|
|
|
|
UNITED STATES SECURITIES AND EXCHANGE COMMISSION
WASHINGTON, D.C. 20549
FORM 10-K
(Mark One)
|
ý
|
ANNUAL REPORT PURSUANT TO SECTION 13 OR 15(d) OF THE SECURITIES EXCHANGE ACT OF 1934
|
|
¨
|
TRANSITION REPORT PURSUANT TO SECTION 13 OR 15(d) OF THE SECURITIES EXCHANGE ACT OF 1934
|
For the transition period from________to________
|
Commission
file number
|
Registrant, State of Incorporation or Organization, Address of Principal Executive Offices, and Telephone Number
|
IRS Employer
Identification No.
|
||

|
||||
|
1-32853
|
DUKE ENERGY CORPORATION
(a Delaware corporation)
550 South Tryon Street
Charlotte, NC 28202-1803
704-382-3853
|
20-2777218
|
||
|
Commission file number
|
Registrant, State of Incorporation or Organization, Address of Principal Executive Offices, Telephone Number and IRS Employer Identification Number
|
Commission file number
|
Registrant, State of Incorporation or Organization, Address of Principal Executive Offices, Telephone Number and IRS Employer Identification Number
|
|||
|
1-4928
|
DUKE ENERGY CAROLINAS, LLC
(a North Carolina limited liability company)
526 South Church Street
Charlotte, North Carolina 28202-1803
704-382-3853
56-0205520
|
1-3274
|
DUKE ENERGY FLORIDA, LLC
(formerly DUKE ENERGY FLORIDA, INC.)
(a Florida limited liability company)
299 First Avenue North
St. Petersburg, Florida 33701
704-382-3853
59-0247770
|
|||
|
1-15929
|
PROGRESS ENERGY, INC.
(a North Carolina corporation)
410 South Wilmington Street
Raleigh, North Carolina 27601-1748
704-382-3853
56-2155481
|
1-1232
|
DUKE ENERGY OHIO, INC.
(an Ohio corporation)
139 East Fourth Street
Cincinnati, Ohio 45202
704-382-3853
31-0240030
|
|||
|
1-3382
|
DUKE ENERGY PROGRESS, LLC
(formerly DUKE ENERGY PROGRESS, INC.)
(a North Carolina limited liability company)
410 South Wilmington Street
Raleigh, North Carolina 27601-1748
704-382-3853
56-0165465
|
1-3543
|
DUKE ENERGY INDIANA, LLC
(formerly DUKE ENERGY INDIANA, Inc.)
(an Indiana limited liability company)
1000 East Main Street
Plainfield, Indiana 46168
704-382-3853
35-0594457
|
|||
|
SECURITIES REGISTERED PURSUANT TO SECTION 12(B) OF THE ACT:
|
||||
|
Registrant
|
Title of each class
|
Name of each exchange on
which registered
|
||
|
Duke Energy Corporation (Duke Energy)
|
Common Stock, $0.001 par value
|
New York Stock Exchange, Inc.
|
||
|
Duke Energy
|
5.125% Junior Subordinated Debentures due January 15, 2073
|
New York Stock Exchange, Inc.
|
||
|
Duke Energy Carolinas, LLC (Duke Energy Carolinas)
|
All of the registrant's limited liability company member interests are directly owned by Duke Energy.
|
|||
|
Progress Energy, Inc. (Progress Energy)
|
All of the registrant's common stock is directly owned by Duke Energy.
|
|||
|
Duke Energy Progress, LLC (Duke Energy Progress)
|
All of the registrant's limited liability company member interests are directly owned by Duke Energy.
|
|||
|
Duke Energy Florida, LLC (Duke Energy Florida)
|
All of the registrant's limited liability company member interests are directly owned by Duke Energy.
|
|||
|
Duke Energy Ohio, Inc. (Duke Energy Ohio)
|
All of the registrant's common stock is indirectly owned by Duke Energy.
|
|||
|
Duke Energy Indiana, LLC (Duke Energy Indiana)
|
All of the registrant's limited liability company member interests are directly owned by Duke Energy.
|
|||
SECURITIES REGISTERED PURSUANT TO SECTION 12(G) OF THE ACT: None
Indicate by check mark if the registrant is a well-known seasoned issuer, as defined in Rule 405 of the Securities Act
|
Duke Energy
|
Yes
x
|
No
¨
|
Duke Energy Florida
|
Yes
x
|
No
¨
|
|||
|
Duke Energy Carolinas
|
Yes
x
|
No
¨
|
Duke Energy Ohio
|
Yes
¨
|
No
x
|
|||
|
Progress Energy
|
Yes
¨
|
No
x
|
Duke Energy Indiana
|
Yes
¨
|
No
x
|
|||
|
Duke Energy Progress
|
Yes
x
|
No
¨
|
|
|
|
|||
Indicate by check mark if the registrant is not required to file reports pursuant to Section 13 or Section 15(d) of the Exchange Act.
Yes
¨
No
x
(Response applicable to all registrants.)
Indicate by check mark whether the registrants (1) have filed all reports required to be filed by Section 13 or 15(d) of the Securities Exchange Act of 1934 during the preceding 12 months (or for such shorter period that the registrant was required to file such reports), and (2) has been subject to such filing requirements for the past 90 days. Yes
x
No
¨
Indicate by check mark whether the registrants have submitted electronically and posted on their corporate website, if any, every Interactive Data File required to be submitted and posted pursuant to Rule 405 of Regulation S-T (§232.405 of this chapter) during the preceding 12 months (or for such shorter period that the registrant was required to submit and post such files). Yes
x
No
¨
Indicate by check mark if disclosure of delinquent filers pursuant to Item 405 of Regulation S-K is not contained herein, and will not be contained, to the best of registrant’s knowledge, in definitive proxy or information statements incorporated by reference in Part III of this Form 10-K or any amendment to this Form 10-K.
|
Duke Energy
|
Yes
x
|
No
¨
|
Duke Energy Florida
|
Yes
x
|
No
¨
|
|||||
|
Duke Energy Carolinas
|
Yes
x
|
No
¨
|
Duke Energy Ohio
|
Yes
x
|
No
¨
|
|||||
|
Progress Energy
|
Yes
x
|
No
¨
|
Duke Energy Indiana
|
Yes
x
|
No
¨
|
|||||
|
Duke Energy Progress
|
Yes
x
|
No
¨
|
|
|
|
|||||
Indicate by check mark whether Duke Energy is a large accelerated filer, an accelerated filer, a non-accelerated filer, or a smaller reporting company. See the definitions of “large accelerated filer,” “accelerated filer” and “smaller reporting company” in Rule 12b-2 of the Exchange Act. (Check one): Large accelerated filer
x
Accelerated filer
¨
Non-accelerated filer
¨
Smaller reporting company
¨
Indicate by check mark whether Duke Energy Carolinas, Progress Energy, Duke Energy Progress, Duke Energy Florida, Duke Energy Ohio and Duke Energy Indiana are large accelerated filers, accelerated filers, non-accelerated filers, or smaller reporting companies. See the definitions of “large accelerated filer,” “accelerated filer” and “smaller reporting company” in Rule 12b-2 of the Exchange Act. (Check one): Large accelerated filer
¨
Accelerated filer
¨
Non-accelerated filer
x
Smaller reporting company
¨
Indicate by check mark whether the registrants are a shell company (as defined in Rule 12b-2 of the Exchange Act). Yes
¨
No
x
|
Estimated aggregate market value of the common equity held by nonaffiliates of Duke Energy at June 30, 2015.
|
48,570,203,631
|
|
|
Number of shares of Common Stock, $0.001 par value, outstanding at January 31, 2016.
|
688,377,923
|
|
DOCUMENTS INCORPORATED BY REFERENCE
Portions of the Duke Energy definitive proxy statement for the 2015 Annual Meeting of the Shareholders or an amendment to this Annual Report are incorporated by reference into PART II, Item 5 and PART III, Items 10, 11, 12 and 13 hereof.
This combined Form 10-K is filed separately by seven registrants: Duke Energy, Duke Energy Carolinas, Progress Energy, Duke Energy Progress, Duke Energy Florida, Duke Energy Ohio and Duke Energy Indiana (collectively the Duke Energy Registrants). Information contained herein relating to any individual registrant is filed by such registrant solely on its own behalf. Each registrant makes no representation as to information relating exclusively to the other registrants.
Duke Energy Carolinas, Progress Energy, Duke Energy Progress, Duke Energy Florida, Duke Energy Ohio and Duke Energy Indiana meet the conditions set forth in General Instructions I(1)(a) and (b) of Form 10-K and are, therefore, filing this form with the reduced disclosure format specified in General Instructions I(2) of Form 10-K.
TABLE OF CONTENTS
FORM 10-K FOR THE YEAR ENDED December 31, 2015
|
Item
|
Page
|
|
|
|
|
|
|
CAUTIONARY STATEMENT REGARDING FORWARD-LOOKING INFORMATION
|
|
|
|
|
|
|
|
GLOSSARY OF TERMS
|
|
|
|
|
|
|
|
PART I.
|
|
|
|
1.
|
||
|
|
|
|
|
1A.
|
||
|
|
|
|
|
1B.
|
||
|
|
|
|
|
2.
|
||
|
|
|
|
|
3.
|
||
|
|
|
|
|
4.
|
||
|
|
|
|
|
PART II.
|
|
|
|
5.
|
||
|
|
|
|
|
6.
|
||
|
|
|
|
|
7.
|
||
|
|
|
|
|
7A.
|
||
|
|
|
|
|
8.
|
||
|
|
|
|
|
9.
|
||
|
|
|
|
|
9A.
|
||
|
|
|
|
|
PART III.
|
|
|
|
10.
|
||
|
|
|
|
|
11.
|
||
|
|
|
|
|
12.
|
||
|
|
|
|
|
13.
|
||
|
|
|
|
|
14.
|
||
|
|
|
|
|
PART IV.
|
|
|
|
15.
|
||
|
|
||
|
|
||
CAUTIONARY STATEMENT REGARDING FORWARD-LOOKING INFORMATION
This document includes forward-looking statements within the meaning of Section 27A of the Securities Act of 1933 and Section 21E of the Securities Exchange Act of 1934. Forward-looking statements are based on management’s beliefs and assumptions and can often be identified by terms and phrases that include “anticipate,” “believe,” “intend,” “estimate,” “expect,” “continue,” “should,” “could,” “may,” “plan,” “project,” “predict,” “will,” “potential,” “forecast,” “target,” “guidance,” “outlook” or other similar terminology. Various factors may cause actual results to be materially different than the suggested outcomes within forward-looking statements; accordingly, there is no assurance that such results will be realized. These factors include, but are not limited to:
|
•
|
State, federal and foreign legislative and regulatory initiatives, including costs of compliance with existing and future environmental requirements or climate change, as well as rulings that affect cost and investment recovery or have an impact on rate structures or market prices;
|
|
•
|
The extent and timing of costs and liabilities to comply with federal and state laws, regulations, and legal requirements related to coal ash remediation, including amounts for required closure of certain ash impoundments, are uncertain and difficult to estimate;
|
|
•
|
The ability to recover eligible costs, including amounts associated with coal ash mitigation such as coal ash impoundment retirement obligations and cost related to significant weather events, and earn an adequate return on investment through the regulatory process;
|
|
•
|
The costs of decommissioning Crystal River Unit 3 and other nuclear facilities could prove to be more extensive than amounts estimated and all costs may not be fully recoverable through the regulatory process;
|
|
•
|
Credit ratings of the Duke Energy Registrants may be different from what is expected;
|
|
•
|
Costs and effects of legal and administrative proceedings, settlements, investigations and claims;
|
|
•
|
Industrial, commercial and residential growth or decline in service territories or customer bases resulting from variations in customer usage patterns, including energy efficiency efforts and use of alternative energy sources, including self-generation and distributed generation technologies;
|
|
•
|
Federal and state regulations, laws and other efforts designed to promote and expand the use of energy efficiency measures and distributed generation technologies, such as rooftop solar and battery storage, in Duke Energy service territories could result in customers leaving the electric distribution system, excess generation resources as well as stranded costs;
|
|
•
|
Advancements in technology;
|
|
•
|
Additional competition in electric markets and continued industry consolidation;
|
|
•
|
Political, economic and regulatory uncertainty in Brazil and other countries in which Duke Energy conducts business;
|
|
•
|
The influence of weather and other natural phenomena on operations, including the economic, operational and other effects of severe storms, hurricanes, droughts, earthquakes and tornadoes;
|
|
•
|
The ability to successfully operate electric generating facilities and deliver electricity to customers including direct or indirect effects to the company resulting from an incident that affects the U.S. electric grid or generating resources;
|
|
•
|
The impact on facilities and business from a terrorist attack, cybersecurity threats, data security breaches, and other catastrophic events such as fires, explosions, pandemic health events or other similar occurrences;
|
|
•
|
The inherent risks associated with the operation and potential construction of nuclear facilities, including environmental, health, safety, regulatory and financial risks;
|
|
•
|
The timing and extent of changes in commodity prices, interest rates and foreign currency exchange rates and the ability to recover such costs through the regulatory process, where appropriate, and their impact on liquidity positions and the value of underlying assets;
|
|
•
|
The results of financing efforts, including the ability to obtain financing on favorable terms, which can be affected by various factors, including credit ratings, interest rate fluctuations and general economic conditions;
|
|
•
|
Declines in the market prices of equity and fixed income securities and resultant cash funding requirements for defined benefit pension plans, other post-retirement benefit plans, and nuclear decommissioning trust funds;
|
|
•
|
Construction and development risks associated with the completion of Duke Energy Registrants’ capital investment projects, including risks related to financing, obtaining and complying with terms of permits, meeting construction budgets and schedules, and satisfying operating and environmental performance standards, as well as the ability to recover costs from customers in a timely manner or at all;
|
|
•
|
Changes in rules for regional transmission organizations, including changes in rate designs and new and evolving capacity markets, and risks related to obligations created by the default of other participants;
|
|
•
|
The ability to control operation and maintenance costs;
|
|
•
|
The level of creditworthiness of counterparties to transactions;
|
|
•
|
Employee workforce factors, including the potential inability to attract and retain key personnel;
|
|
•
|
The ability of subsidiaries to pay dividends or distributions to Duke Energy Corporation holding company (the Parent);
|
|
•
|
The performance of projects undertaken by our nonregulated businesses and the success of efforts to invest in and develop new opportunities;
|
|
•
|
The effect of accounting pronouncements issued periodically by accounting standard-setting bodies;
|
|
•
|
The impact of potential goodwill impairments;
|
|
•
|
The ability to reinvest prospective undistributed earnings of foreign subsidiaries or repatriate such earnings on a tax-efficient basis;
|
|
•
|
The expected timing and likelihood of completion of the proposed acquisition of Piedmont Natural Gas Company, Inc. (Piedmont), including the timing, receipt and terms and conditions of any required governmental and regulatory approvals of the proposed acquisition that could reduce anticipated benefits or cause the parties to abandon the acquisition, and under certain specified circumstance pay a termination fee of $250 million, as well as the ability to successfully integrate the businesses and realize anticipated benefits and the risk that the credit ratings of the combined company or its subsidiaries may be different from what the companies expect; and
|
|
•
|
The ability to successfully complete future merger, acquisition or divestiture plans.
|
In light of the various risks, uncertainties and assumptions, the events described in the forward-looking statements might not occur or might occur to a different extent or at a different time than described. Forward-looking statements speak only as of the date they are made; the Duke Energy Registrants expressly disclaim an obligation to publicly update or revise any forward-looking statements, whether as a result of new information, future events or otherwise.
Glossary of Terms
The following terms or acronyms used in this Form 10-K are defined below:
|
Term or Acronym
|
Definition
|
|
|
|
|
the 2010 Plan
|
Duke Energy’s 2010 Long-Term Incentive Plan
|
|
the 2012 Edwardsport settlement
|
Settlement agreement in 2012 among Duke Energy Indiana, the Office of Utility Consumer Counselor, the Duke Energy Indiana Industrial Group and Nucor Steel-Indiana
|
|
|
|
|
the 2012 Settlement
|
Settlement agreement in 2012 among Duke Energy Florida, the OPC and other customer advocates
|
|
|
|
|
the 2013 Settlement
|
Settlement agreement in 2013 among Duke Energy Florida, the OPC and other customer advocates
|
|
|
|
|
ACP
|
Atlantic Coast Pipeline
|
|
AFUDC
|
Allowance for Funds Used During Construction
|
|
|
|
|
AHFS
|
Assets held for sale
|
|
ALJ
|
Administrative Law Judge
|
|
|
|
|
ANEEL
|
Brazilian electricity regulatory agency
|
|
|
|
|
AOCI
|
Accumulated Other Comprehensive Income
|
|
ASRP
|
Accelerated natural gas service line replacement program
|
|
ASU
|
Accounting standard update
|
|
Board of Directors
|
Duke Energy Board of Directors
|
|
Bison
|
Bison Insurance Company Limited
|
|
|
|
|
Brunswick
|
Brunswick Nuclear Plant
|
|
|
|
|
CAA
|
Clean Air Act
|
|
|
|
|
CAIR
|
Clean Air Interstate Rule
|
|
|
|
|
Calpine
|
Calpine Corporation
|
|
Catawba
|
Catawba Nuclear Station
|
|
|
|
|
Catawba Riverkeeper
|
Catawba Riverkeeper Foundation, Inc.
|
|
|
|
|
CC
|
Combined Cycle
|
|
CCR
|
Coal Combustion Residuals
|
|
|
|
|
CCS
|
Carbon Capture and Storage
|
|
|
|
|
CECPCN
|
Certificate of Environmental Compatibility and Public Convenience and Necessity
|
|
CEO
|
Chief Executive Officer
|
|
Cinergy
|
Cinergy Corp. (collectively with its subsidiaries)
|
|
|
|
|
CO
2
|
Carbon Dioxide
|
|
|
|
|
Coal Ash Act
|
North Carolina Coal Ash Management Act of 2014
|
|
Coal Ash Commission
|
Coal Ash Management Commission
|
|
COL
|
Combined Construction and Operating License
|
|
|
|
|
the Company
|
Duke Energy Corporation and its subsidiaries
|
|
Consolidated Complaint
|
Corrected Verified Consolidated Shareholder Derivative Complaint
|
|
CPCN
|
Certificate of Public Convenience and Necessity
|
|
CPP
|
Clean Power Plan
|
|
CRC
|
Cinergy Receivables Company, LLC
|
|
|
|
|
Crescent
|
Crescent Resources LLC
|
|
|
|
|
Crystal River Unit 3
|
Crystal River Unit 3 Nuclear Plant
|
|
|
|
|
CSA
|
Comprehensive Site Assessment
|
|
CSAPR
|
Cross-State Air Pollution Rule
|
|
|
|
|
CT
|
Combustion Turbine
|
|
CWA
|
Clean Water Act
|
|
|
|
|
D.C. Circuit Court
|
U.S. Court of Appeals for the District of Columbia
|
|
|
|
|
DEBS
|
Duke Energy Business Services, LLC
|
|
DECAM
|
Duke Energy Commercial Asset Management, LLC
|
|
|
|
|
DECS
|
Duke Energy Corporate Services
|
|
DEFR
|
Duke Energy Florida Receivables, LLC
|
|
DEGS
|
Duke Energy Generation Services, Inc.
|
|
|
|
|
DEIGP
|
Duke Energy International Geracao Paranapenema S.A.
|
|
|
|
|
Deloitte
|
Deloitte & Touche LLP, and the member firms of Deloitte Touche Tohmatsu and their respective affiliates
|
|
DEPR
|
Duke Energy Progress Receivables, LLC
|
|
|
|
|
DERF
|
Duke Energy Receivables Finance Company, LLC
|
|
|
|
|
Disposal Group
|
Duke Energy Ohio’s nonregulated Midwest generation business and Duke Energy Retail Sales, LLC
|
|
DOE
|
U.S. Department of Energy
|
|
|
|
|
Dominion
|
Dominion Resources
|
|
DSM
|
Demand Side Management
|
|
|
|
|
Duke Energy
|
Duke Energy Corporation (collectively with its subsidiaries)
|
|
|
|
|
Duke Energy Audit Committee
|
Audit Committee of the Board of Directors
|
|
Duke Energy Carolinas
|
Duke Energy Carolinas, LLC
|
|
|
|
|
Duke Energy Defendants
|
Several current and former Duke Energy officers and directors named as defendants in the Consolidated Complaint
|
|
Duke Energy Florida
|
Duke Energy Florida, LLC (formerly Duke Energy Florida, Inc.)
|
|
|
|
|
Duke Energy Indiana
|
Duke Energy Indiana, Inc. (subsequently Duke Energy Indiana, LLC)
|
|
|
|
|
Duke Energy Kentucky
|
Duke Energy Kentucky, Inc.
|
|
|
|
|
Duke Energy Ohio
|
Duke Energy Ohio, Inc.
|
|
|
|
|
Duke Energy Progress
|
Duke Energy Progress, LLC (formerly Duke Energy Progress, Inc.)
|
|
|
|
|
Duke Energy Registrants
|
Duke Energy, Duke Energy Carolinas, Progress Energy, Duke Energy Progress, Duke Energy Florida, Duke Energy Ohio and Duke Energy Indiana
|
|
|
|
|
Duke Energy Retail
|
Duke Energy Retail Sales, LLC
|
|
|
|
|
DukeNet
|
DukeNet Communications Holdings, LLC
|
|
|
|
|
Dynegy
|
Dynegy Inc.
|
|
EE
|
Energy efficiency
|
|
|
|
|
EGU
|
Electric Generating Units
|
|
EIP
|
Progress Energy’s Equity Incentive Plan
|
|
|
|
|
ELG
|
Effluent Limitation Guidelines
|
|
|
|
|
EMC
|
North Carolina Environmental Management Commission
|
|
EPA
|
U.S. Environmental Protection Agency
|
|
|
|
|
EPC
|
Engineering, Procurement and Construction agreement
|
|
|
|
|
EPS
|
Earnings Per Share
|
|
|
|
|
ESP
|
2014 Electric Security Plan
|
|
|
|
|
ETR
|
Effective tax rate
|
|
|
|
|
Exchange Act
|
Exchange Act of 1934
|
|
FASB
|
Financial Accounting Standards Board
|
|
|
|
|
FERC
|
Federal Energy Regulatory Commission
|
|
|
|
|
Fitch
|
Fitch Ratings, Inc.
|
|
FMJO
|
Florida Municipal Joint Owners - city of Ocala, Orlando Utilities Commission, city of Gainesville, city of Leesburg, Kissimmee Utility Authority, Utilities Commission of City of New Smyrna Beach, city of Alachua and city of Bushnell
|
|
Form S-3
|
Registration statement
|
|
FPSC
|
Florida Public Service Commission
|
|
FTC
|
Federal Trade Commission
|
|
|
|
|
FTR
|
Financial transmission rights
|
|
|
|
|
GAAP
|
Generally Accepted Accounting Principles in the United States
|
|
|
|
|
Gas Settlement
|
Settlement agreement in 2013 among Duke Energy Ohio, PUCO Staff and intervening parties
|
|
|
|
|
GHG
|
Greenhouse Gas
|
|
|
|
|
GPC
|
Georgia Power Company
|
|
GWh
|
Gigawatt-hours
|
|
|
|
|
Harris
|
Shearon Harris Nuclear Plant
|
|
|
|
|
HB 998
|
North Carolina House Bill 998, or the North Carolina Tax Simplification and Rate Reduction Act
|
|
Hines
|
Hines Energy Complex
|
|
|
|
|
IAP
|
State Environmental Agency of Parana
|
|
|
|
|
IBAMA
|
Brazil Institute of Environment and Renewable Natural Resources
|
|
|
|
|
IBNR
|
Incurred but not yet reported
|
|
|
|
|
IC
|
Internal combustion
|
|
|
|
|
IGCC
|
Integrated Gasification Combined Cycle
|
|
|
|
|
Interim FERC Mitigation
|
Interim firm power sale agreements mitigation plans related to the Progress Energy merger
|
|
IRP
|
Integrated Resource Plans
|
|
|
|
|
IRS
|
Internal Revenue Service
|
|
ISFSI
|
Independent Spent Fuel Storage Installation
|
|
|
|
|
ISO
|
Independent System Operator
|
|
|
|
|
ITC
|
Investment Tax Credit
|
|
|
|
|
IURC
|
Indiana Utility Regulatory Commission
|
|
|
|
|
Investment Trusts
|
Grantor trusts of Duke Energy Progress, Duke Energy Florida and Duke Energy Indiana
|
|
|
|
|
JDA
|
Joint Dispatch Agreement
|
|
|
|
|
Joint Intervenors
|
Intervenors in matters related to the Edwardsport IGCC Plan, including the Citizens Action Coalition of Indiana, Inc., Sierra Club, Inc., Save the Valley, Inc. and Valley Watch, Inc.
|
|
KPSC
|
Kentucky Public Service Commission
|
|
|
|
|
kV
|
Kilovolt
|
|
|
|
|
kWh
|
Kilowatt-hour
|
|
|
|
|
Lee Nuclear Station
|
William States Lee III Nuclear Station
|
|
Levy
|
Duke Energy Florida’s proposed nuclear plant in Levy County, Florida
|
|
|
|
|
Legacy Duke Energy Directors
|
Members of the pre-merger Duke Energy Board of Directors
|
|
|
|
|
LIBOR
|
London Interbank Offered Rate
|
|
|
|
|
Long-Term FERC Mitigation
|
The revised market power mitigation plan related to the Progress Energy merger
|
|
MATS
|
Mercury and Air Toxics Standards (previously referred to as the Utility MACT Rule)
|
|
|
|
|
Mcf
|
Thousand cubic feet
|
|
|
|
|
McGuire
|
McGuire Nuclear Station
|
|
|
|
|
MGP
|
Manufactured gas plant
|
|
|
|
|
MISO
|
Midcontinent Independent System Operator, Inc.
|
|
|
|
|
MMBtu
|
Million British Thermal Unit
|
|
|
|
|
Moody’s
|
Moody’s Investors Service, Inc.
|
|
|
|
|
MTBE
|
Methyl tertiary butyl ether
|
|
|
|
|
MTEP
|
MISO Transmission Expansion Planning
|
|
|
|
|
MW
|
Megawatt
|
|
|
|
|
MVP
|
Multi Value Projects
|
|
|
|
|
MWh
|
Megawatt-hour
|
|
|
|
|
NASDAQ
|
Nasdaq Composite
|
|
|
|
|
NCDEQ
|
North Carolina Department of Environmental Quality (formerly the North Carolina Department of Environment and Natural Resources)
|
|
NCEMC
|
North Carolina Electric Membership Corporation
|
|
|
|
|
NCEMPA
|
North Carolina Eastern Municipal Power Agency
|
|
NCRC
|
Florida’s Nuclear Cost Recovery Clause
|
|
|
|
|
NCSC
|
North Carolina Supreme Court
|
|
|
|
|
NCUC
|
North Carolina Utilities Commission
|
|
|
|
|
NC WARN
|
N.C. Waste Awareness and Reduction Network
|
|
|
|
|
NDTF
|
Nuclear decommissioning trust funds
|
|
|
|
|
NEIL
|
Nuclear Electric Insurance Limited
|
|
|
|
|
NMC
|
National Methanol Company
|
|
|
|
|
NOL
|
Net operating loss
|
|
|
|
|
NOV
|
Notice of violation
|
|
NO
x
|
Nitrogen oxide
|
|
|
|
|
NPNS
|
Normal purchase/normal sale
|
|
|
|
|
NRC
|
U.S. Nuclear Regulatory Commission
|
|
|
|
|
NSR
|
New Source Review
|
|
|
|
|
NWPA
|
Nuclear Waste Policy Act of 1982
|
|
|
|
|
NYSE
|
New York Stock Exchange
|
|
|
|
|
Oconee
|
Oconee Nuclear Station
|
|
Ohio EPA
|
Ohio Environmental Protection Agency
|
|
|
|
|
OPC
|
Florida Office of Public Counsel
|
|
|
|
|
OPEB
|
Other Post-Retirement Benefit Obligations
|
|
|
|
|
Osprey Plant acquisition
|
Duke Energy Florida's proposed acquisition of Calpine Corporation's 599 MW combined-cycle natural gas plant in Auburndale, Florida
|
|
|
|
|
OUCC
|
Office of Utility Consumer Counselor
|
|
|
|
|
OVEC
|
Ohio Valley Electric Corporation
|
|
|
|
|
the Parent
|
Duke Energy Corporation Holding Company
|
|
|
|
|
PESC
|
Progress Energy Service Company
|
|
PJM
|
PJM Interconnection, LLC
|
|
|
|
|
Plea Agreements
|
Plea Agreements entered into by Duke Energy Carolinas and Duke Energy Progress in connection with a criminal investigation related to the Dan River ash basin release and the management of coal ash basins in North Carolina
|
|
Progress Energy
|
Progress Energy, Inc.
|
|
PSCSC
|
Public Service Commission of South Carolina
|
|
|
|
|
Public Staff
|
North Carolina Utilities Commission Public Staff
|
|
|
|
|
PUCO
|
Public Utilities Commission of Ohio
|
|
|
|
|
PURPA
|
Public Utility Regulatory Act of 1978
|
|
QF
|
Qualifying Facility
|
|
|
|
|
RCA
|
Revolving Credit Agreement
|
|
RCRA
|
Resource Conservation and Recovery Act
|
|
Relative TSR
|
TSR of Duke Energy stock relative to a pre-defined peer group
|
|
|
|
|
the Resolutions
|
Proposed resolutions promulgated by the Brazilian electricity regulatory agency
|
|
Robinson
|
Robinson Nuclear Station
|
|
|
|
|
RTO
|
Regional Transmission Organization
|
|
|
|
|
Sabal Trail
|
Sabal Trail Transmission, LLC
|
|
SAFSTOR
|
A method of decommissioning in which a nuclear facility is placed and maintained in a condition that allows the facility to be safely stored and subsequently decontaminated to levels that permit release for unrestricted use.
|
|
|
|
|
SCDHEC
|
South Carolina Department of Health and Environmental Control
|
|
SEC
|
Securities and Exchange Commission
|
|
|
|
|
SELC
|
Southern Environmental Law Center
|
|
Segment Income
|
Income from continuing operations net of income attributable to noncontrolling interests
|
|
|
|
|
SO
2
|
Sulfur dioxide
|
|
|
|
|
Spectra Energy
|
Spectra Energy Corp.
|
|
|
|
|
Spectra Capital
|
Spectra Energy Capital, LLC (formerly Duke Capital LLC)
|
|
|
|
|
S&P
|
Standard & Poor’s Rating Services
|
|
|
|
|
SSO
|
Standard Service Offer
|
|
|
|
|
State Utility Commissions
|
NCUC, PSCSC, FPSC, PUCO, IURC and KPSC (Collectively)
|
|
Subsidiary Registrants
|
Duke Energy Carolinas, Progress Energy, Duke Energy Progress, Duke Energy Florida, Duke Energy Ohio and Duke Energy Indiana
|
|
|
|
|
Supreme Court
|
U.S. Supreme Court
|
|
|
|
|
Sutton
|
L.V. Sutton combined cycle facility
|
|
Suwannee project
|
Proposed 320 MW combustion turbine plant at Duke Energy Florida's Suwannee generating facility
|
|
|
|
|
TSR
|
Total shareholder return
|
|
|
|
|
U.S.
|
United States
|
|
USDOJ
|
United States Department of Justice Environmental Crimes Section and the United States Attorneys for the Eastern District of North Carolina, the Middle District of North Carolina and the Western District of North Carolina, collectively
|
|
VDEQ
|
Virginia Department of Environmental Quality
|
|
VEBA I
|
Duke Energy Corporation Employee Benefits Trust
|
|
|
|
|
Vermillion
|
Vermillion Generating Station
|
|
|
|
|
VIE
|
Variable Interest Entity
|
|
|
|
|
WACC
|
Weighted Average Cost of Capital
|
|
|
|
|
WVPA
|
Wabash Valley Power Association, Inc.
|
PART I
ITEM 1. BUSINESS
DUKE ENERGY
General
Duke Energy Corporation (collectively with its subsidiaries, Duke Energy) is an energy company headquartered in Charlotte, North Carolina, subject to regulation by the Federal Energy Regulatory Commission (FERC). Duke Energy operates in the United States (U.S.) and Latin America primarily through its direct and indirect subsidiaries. Duke Energy's subsidiaries include its subsidiary registrants (collectively referred to as the Subsidiary Registrants); Duke Energy Carolinas, LLC (Duke Energy Carolinas); Progress Energy, Inc. (Progress Energy); Duke Energy Progress, LLC (formerly Duke Energy Progress, Inc.) (Duke Energy Progress); Duke Energy Florida, LLC (formerly Duke Energy Florida, Inc.) (Duke Energy Florida); Duke Energy Ohio, Inc. (Duke Energy Ohio); and Duke Energy Indiana, LLC (formerly Duke Energy Indiana, Inc.) (Duke Energy Indiana). When discussing Duke Energy’s consolidated financial information, it necessarily includes the results of its Subsidiary Registrants, which along with Duke Energy, are collectively referred to as the Duke Energy Registrants.
Duke Energy has entered into an Agreement and Plan of Merger (Merger Agreement) with Piedmont Natural Gas Company, Inc. (Piedmont), a North Carolina corporation. Piedmont is an energy services company primarily engaged in the distribution of natural gas to residential, commercial, industrial and power generation customers in portions of North Carolina, South Carolina and Tennessee. Under terms of the Merger Agreement, Duke Energy will acquire Piedmont for
$4.9 billion
in cash and Piedmont will become a wholly owned subsidiary of Duke Energy. Piedmont's common stock will be delisted from the New York Stock Exchange (NYSE). Duke Energy and Piedmont target to close the transaction by the end of 2016 subject to meeting various conditions, including receipt of required regulatory approvals. For additional information see Note
2
to the Consolidated Financial Statements, "Acquisitions and Dispositions."
Duke Energy completed the sale of the nonregulated Midwest generation business and Duke Energy Retail Sales, LLC (collectively, the Disposal Group) to Dynegy Inc. (Dynegy) on April 2, 2015, for approximately $2.8 billion in cash. The Disposal Group primarily included Duke Energy Ohio's coal-fired and gas-fired generation assets located in the Midwest region of the United States and dispatched into the PJM wholesale market. The Disposal Group also included a retail sales subsidiary of Duke Energy, that served retail electric and gas customers in Ohio with energy and other energy services at competitive rates. For additional information see Note
2
to the Consolidated Financial Statements, "Acquisitions and Dispositions."
The Duke Energy Registrants electronically file reports with the Securities and Exchange Commission (SEC), including annual reports on Form 10-K, quarterly reports on Form 10-Q, current reports on Form 8-K, proxies and amendments to such reports.
The public may read and copy any materials the Duke Energy Registrants file with the SEC at the SEC’s Public Reference Room at 100 F Street, NE, Washington, DC 20549. The public may obtain information on the operation of the Public Reference Room by calling the SEC at 1-800-SEC-0330. The SEC also maintains an Internet site that contains reports, proxy and information statements, and other information regarding issuers that file electronically with the SEC at http://www.sec.gov. Additionally, information about the Duke Energy Registrants, including reports filed with the SEC, is available through Duke Energy’s website at http://www.duke-energy.com. Such reports are accessible at no charge and are made available as soon as reasonably practicable after such material is filed with or furnished to the SEC.
Business Segments
Duke Energy conducts its operations in three business segments; Regulated Utilities, International Energy and Commercial Portfolio (formerly Commercial Power). The remainder of Duke Energy’s operations are presented as Other. Duke Energy’s chief operating decision maker regularly reviews financial information about each of these business segments in deciding how to allocate resources and evaluate the performance of the business. For additional information on each of these business segments, including financial and geographic information, see Note
3
to the Consolidated Financial Statements, “Business Segments.”
The following sections describe the business and operations of each of Duke Energy’s reportable business segments, as well as Other.
REGULATED UTILITIES
Regulated Utilities conducts operations primarily through Duke Energy Carolinas, Duke Energy Progress, Duke Energy Florida, Duke Energy Indiana, and Duke Energy Ohio. These electric and gas operations are subject to the rules and regulations of the FERC, the North Carolina Utilities Commission (NCUC), the Public Service Commission of South Carolina (PSCSC), the Florida Public Service Commission (FPSC), the Indiana Utility Regulatory Commission (IURC), the Public Utilities Commission of Ohio (PUCO), and the Kentucky Public Service Commission (KPSC).
Regulated Utilities serves 7.4 million retail electric customers in six states in the Southeast and Midwest regions of the U.S. Its service area covers approximately 95,000 square miles with an estimated population of 24 million people. Regulated Utilities serves 525,000 retail natural gas customers in southwestern Ohio and northern Kentucky. Electricity is also sold wholesale to incorporated municipalities, electric cooperative utilities and other load-serving entities.
9
PART I
The following table represents the distribution of billed sales by customer class for the year ended
December 31, 2015
.
|
Duke
|
|
Duke
|
|
Duke
|
|
Duke
|
|
Duke
|
|
||||
|
Energy
|
|
Energy
|
|
Energy
|
|
Energy
|
|
Energy
|
|
||||
|
Carolinas
(a)
|
|
Progress
(a)
|
|
Florida
(b)
|
|
Ohio
(c)
|
|
Indiana
(d)
|
|
||||
|
Residential
|
32
|
%
|
28
|
%
|
50
|
%
|
34
|
%
|
27
|
%
|
|||
|
General service
|
33
|
%
|
24
|
%
|
38
|
%
|
37
|
%
|
25
|
%
|
|||
|
Industrial
|
25
|
%
|
16
|
%
|
8
|
%
|
24
|
%
|
31
|
%
|
|||
|
Total retail sales
|
90
|
%
|
68
|
%
|
96
|
%
|
95
|
%
|
83
|
%
|
|||
|
Wholesale and other sales
|
10
|
%
|
32
|
%
|
4
|
%
|
5
|
%
|
17
|
%
|
|||
|
Total sales
|
100
|
%
|
100
|
%
|
100
|
%
|
100
|
%
|
100
|
%
|
|||
|
(a)
|
Primary general service sectors include health care, education, financial services, information technology and military buildings. Primary industrial sectors include textiles, chemicals, rubber and plastics, paper, food and beverage, and auto manufacturing.
|
|
(b)
|
Primary general service sectors include tourism, health care and government facilities and schools. Primary industrial sectors include phosphate rock mining and processing and citrus and other food processing.
|
|
(c)
|
Primary general service sectors include health care, education, real estate and rental leasing, financial and insurance services, water/wastewater services, and wholesale trade services. Primary industrial sectors include primary metals, chemicals, food and beverage, and transportation.
|
|
(d)
|
Primary general service sectors include retail, financial, health care and education services. Primary industrial sectors include metals, transportation, building materials, food and beverage, and chemicals.
|
The number of residential, general service and industrial customers within the Regulated Utilities service territory is expected to increase over time. However, growth in the near term has been hampered by current economic conditions and continued adoption of energy efficiencies. Average usage per residential customer is expected to remain flat or decline for the foreseeable future. While total industrial and general service sales increased in
2015
when compared to
2014
, the growth rate was modest when compared to historical periods.
Seasonality and the Impact of Weather
Regulated Utilities’ costs and revenues are influenced by seasonal patterns. Peak sales of electricity occur during the summer and winter months, resulting in higher revenue and cash flows in these periods. By contrast, lower sales of electricity occur during the spring and fall, allowing for scheduled plant maintenance. Peak gas sales occur during the winter months. Residential and general service customers are most impacted by weather. Estimated weather impacts are based on actual current period weather compared to normal weather conditions. Normal weather conditions are defined as the long-term average of actual historical weather conditions.
The estimated impact of weather on earnings is based on the temperature variances from a normal condition and customers’ historic usage levels and patterns. The methodology used to estimate the impact of weather does not consider all variables that may impact customer response to weather conditions such as humidity in the summer or wind chill in the winter. The precision of this estimate may also be impacted by applying long-term weather trends to shorter-term periods.
Degree-day data are used to estimate energy required to maintain comfortable indoor temperatures based on each day’s average temperature. Heating-degree days measure the variation in weather based on the extent the average daily temperature falls below a base temperature. Cooling-degree days measure the variation in weather based on the extent the average daily temperature rises above the base temperature. Each degree of temperature below the base temperature counts as one heating-degree day and each degree of temperature above the base temperature counts as one cooling-degree day.
Competition
Retail
Regulated Utilities’ businesses operate as the sole supplier of electricity within their service territories, with the exception of Ohio, which has a competitive electricity supply market for generation service. Regulated Utilities owns and operates facilities necessary to transmit and distribute electricity and, except in Ohio, to generate electricity. Services are priced by state commission approved rates designed to include the costs of providing these services and a reasonable return on invested capital. This regulatory policy is intended to provide safe and reliable electricity at fair prices. Competition in the regulated electric distribution business is primarily from the development and deployment of alternative energy sources including on-site generation from industrial customers and distributed generation, such as rooftop solar, at residential, general service and/or industrial customer sites.
Regulated Utilities is not aware of any proposed legislation in any of its jurisdictions that would give its retail customers the right to choose their electricity provider or otherwise restructure or deregulate the electric industry including broadly subsidizing distributed generation such as rooftop solar.
Although there is no pending legislation at this time, if the retail jurisdictions served by Regulated Utilities become subject to deregulation, the recovery of stranded costs could become a significant consideration. Stranded costs primarily include the generation assets of Regulated Utilities whose value in a competitive marketplace may be less than their current book value, as well as above-market purchased power commitments from qualifying facilities (QFs). The Public Utility Regulatory Policies Act of 1978 (PURPA) established a new class of generating facilities as QFs, typically small power production facilities that generate power within a utility company’s service territory for which the utility companies are legally obligated to purchase the energy at an avoided cost rate. Thus far, all states that have passed restructuring legislation have provided for the opportunity to recover a substantial portion of stranded costs.
10
PART I
Regulated Utilities’ largest stranded cost exposure is primarily related to Duke Energy Florida’s purchased power commitments with QFs, under which it has future minimum expected capacity payments through 2043 of $3.1 billion. Duke Energy Florida was obligated to enter into these contracts under provisions of PURPA. Duke Energy Florida continues to seek ways to address the impact of escalating payments under these contracts. However, the FPSC allows full recovery of the retail portion of the cost of power purchased from QFs. For additional information related to these purchased power commitments, see Note
5
to the Consolidated Financial Statements, “Commitments and Contingencies.”
In Ohio, Regulated Utilities conducts competitive auctions for electricity supply and purchases the gas commodity for natural gas service. The cost of energy purchased through these auctions and the cost of gas purchases are recovered from retail customers. Regulated Utilities earns retail margin in Ohio on the transmission and distribution of electricity and the distribution of gas and not on the cost of the underlying energy.
Wholesale
Regulated Utilities competes with other utilities and merchant generators for bulk power sales, sales to municipalities and cooperatives, and wholesale transactions. The principal factors in competing for these sales are price, availability of capacity and power, and reliability of service. Prices are influenced primarily by market conditions and fuel costs.
Increased competition in the wholesale electric utility industry and the availability of transmission access could affect Regulated Utilities’ load forecasts, plans for power supply and wholesale energy sales and related revenues. Wholesale energy sales will be impacted by the extent to which additional generation is available to sell to the wholesale market and the ability of Regulated Utilities to attract new customers and to retain existing customers.
Energy Capacity and Resources
Regulated Utilities owns approximately 50,000 megawatts (MW) of generation capacity. For additional information on Regulated Utilities’ generation facilities, see Item 2, “Properties.”
Energy and capacity are also supplied through contracts with other generators and purchased on the open market. Factors that could cause Regulated Utilities to purchase power for its customers include generating plant outages, extreme weather conditions, generation reliability, demand growth, and price. Regulated Utilities has interconnections and arrangements with its neighboring utilities to facilitate planning, emergency assistance, sale and purchase of capacity and energy, and reliability of power supply.
Regulated Utilities’ generation portfolio is a balanced mix of energy resources having different operating characteristics and fuel sources designed to provide energy at the lowest possible cost to meet its obligation to serve retail customers. All options, including owned generation resources and purchased power opportunities, are continually evaluated on a real-time basis to select and dispatch the lowest-cost resources available to meet system load requirements.
Potential Plant Retirements
The Subsidiary Registrants periodically file Integrated Resource Plans (IRP) with state regulatory commissions. The IRPs provide a view of forecasted energy needs over a long term (10 to 20 years) and options being considered to meet those needs. Recent IRPs filed by the Subsidiary Registrants included planning assumptions to potentially retire certain coal-fired generating facilities earlier than their current estimated useful lives. These facilities do not have the requisite emission control equipment, primarily to meet United States Environmental Protection Agency (EPA) regulations recently approved or proposed. Duke Energy continues to evaluate the potential need to retire these coal-fired generating facilities earlier than the current estimated useful lives, and plans to seek regulatory recovery for amounts that would not be otherwise recovered when any of these assets are retired. For additional information related to potential plant retirements see Note
4
to the Consolidated Financial Statements, “Regulatory Matters.”
On October 23, 2015, the EPA published in the Federal Register the Clean Power Plan (CPP) rule for regulating carbon dioxide (CO
2
) emissions from existing fossil fuel-fired electric generating units (EGUs). The CPP establishes CO
2
emission rates and mass cap goals that apply to fossil fuel-fired generation. Under the CPP, states are required to develop and submit a final compliance plan, or an initial plan with an extension request, to the EPA by September 2016, or no later than September 2018 with an approved extension. These state plans are subject to EPA approval, with a federal plan applied to states that fail to submit a plan to the EPA or if a state plan is not approved. Legal challenges to the CPP have been filed by stakeholders and motions to stay the requirements of the rule pending the outcome of the litigation have been filed. The U.S. Supreme Court granted a Motion to Stay in February 2016, effectively blocking enforcement of the rule until legal challenges are resolved. Final resolution of these legal challenges could take several years. Compliance with CPP could cause the industry to replace coal generation with natural gas and renewables, especially in states that have significant CO
2
reduction targets under the rule. Costs to operate coal-fired generation plants continue to grow due to increasing environmental compliance requirements, including ash management costs unrelated to CPP, and this may result in the retirement of coal-fired generation plants earlier than the current useful lives. Duke Energy continues to evaluate the need to retire generating facilities and plans to seek regulatory recovery, where appropriate, for amounts that have not been recovered upon asset retirements. However, recovery is subject to future regulatory approval, including the recovery of carrying costs on remaining book values, and therefore cannot be assured.
11
PART I
Sources of Electricity
Regulated Utilities relies principally on coal, natural gas and nuclear fuel for its generation of electricity. The following table lists sources of electricity and fuel costs for the three years ended
December 31, 2015
.
|
Cost of Delivered Fuel per Net
|
|||||||||||||||||
|
Generation by Source
(d)
|
Kilowatt-hour Generated (Cents)
(d)
|
||||||||||||||||
|
2015
|
|
2014
(e)
|
|
2013
(e)
|
|
2015
|
|
2014
|
|
2013
|
|
||||||
|
Coal
(a)
|
29.0
|
%
|
33.5
|
%
|
32.8
|
%
|
3.24
|
|
3.54
|
|
3.67
|
|
|||||
|
Nuclear
(a)
|
27.0
|
%
|
26.1
|
%
|
26.3
|
%
|
0.65
|
|
0.65
|
|
0.66
|
|
|||||
|
Gas and oil
(a)
|
23.1
|
%
|
19.0
|
%
|
19.5
|
%
|
3.74
|
|
4.70
|
|
4.18
|
|
|||||
|
All fuels (cost-based on weighted average)
(a)
|
79.1
|
%
|
78.6
|
%
|
78.6
|
%
|
2.50
|
|
2.86
|
|
2.79
|
|
|||||
|
Hydroelectric and solar
(b)
|
0.8
|
%
|
0.8
|
%
|
1.3
|
%
|
|||||||||||
|
Total generation
|
79.9
|
%
|
79.4
|
%
|
79.9
|
%
|
|||||||||||
|
Purchased power and net interchange
(c)
|
20.1
|
%
|
20.6
|
%
|
20.1
|
%
|
|||||||||||
|
Total sources of energy
|
100.0
|
%
|
100.0
|
%
|
100.0
|
%
|
|||||||||||
|
(a)
|
Statistics related to all fuels reflect Regulated Utilities' ownership interest in jointly owned generation facilities.
|
|
(b)
|
Generating figures are net of output required to replenish pumped storage facilities during off-peak periods.
|
|
(c)
|
Purchased power includes renewable energy purchases.
|
|
(d)
|
Includes the effect of the Joint Dispatch Agreement (JDA).
|
|
(e)
|
Amounts for 2014 and 2013 have been adjusted to reflect the inclusion of Duke Energy Ohio auction purchases from PJM and Purchased power and net interchange.
|
Coal
Regulated Utilities meets its coal demand through a portfolio of long-term purchase contracts and short-term spot market purchase agreements. Large amounts of coal are purchased under long-term contracts with mining operators who mine both underground and at the surface. Regulated Utilities uses spot market purchases to meet coal requirements not met by long-term contracts. Expiration dates for its long-term contracts, which have various price adjustment provisions and market re-openers, range from 2016 to 2017 for Duke Energy Carolinas, 2016 to 2018 for Duke Energy Progress, 2016 to 2017 for Duke Energy Florida, and 2016 to 2025 for Duke Energy Indiana. Regulated Utilities expects to renew these contracts or enter into similar contracts with other suppliers as existing contracts expire, though prices will fluctuate over time as coal markets change. Coal purchased for the Carolinas is primarily produced from mines in Central Appalachia, Northern Appalachia and the Illinois Basin. Coal purchased for Florida is primarily produced from mines in Colorado and the Illinois Basin. Coal purchased for Indiana is primarily produced in Indiana and Illinois. Regulated Utilities has an adequate supply of coal under contract to fuel its projected 2016 operations and a significant portion of supply to fuel its projected 2017 operations. As a result of lower natural gas prices and less coal-fired dispatch within the generation fleet, coal inventories may periodically exceed production requirements and result in higher inventory levels. In these circumstances, Regulated Utilities has worked with suppliers to defer contracted deliveries, renegotiate existing contract volumes or has received regulatory support to adjust generation dispatch to reduce the inventory levels.
The current average sulfur content of coal purchased by Regulated Utilities is between 1.5 percent and 2 percent for Duke Energy Carolinas, between 1.5 percent and 2 percent for Duke Energy Progress, between 1 percent and 2.5 percent for Duke Energy Florida, and between 2 percent and 3 percent for Duke Energy Indiana. Regulated Utilities’ environmental controls, in combination with the use of sulfur dioxide (SO
2
) emission allowances, enable Regulated Utilities to satisfy current SO
2
emission limitations for its existing facilities.
Nuclear
The industrial processes for producing nuclear generating fuel generally involve the mining and milling of uranium ore to produce uranium concentrates, and services to convert, enrich, and fabricate fuel assemblies.
Regulated Utilities has contracted for uranium materials and services to fuel its nuclear reactors. Uranium concentrates, conversion services and enrichment services are primarily met through a diversified portfolio of long-term supply contracts. The contracts are diversified by supplier, country of origin and pricing. Regulated Utilities staggers its contracting so that its portfolio of long-term contracts covers the majority of its fuel requirements in the near term and decreasing portions of its fuel requirements over time thereafter. Near-term requirements not met by long-term supply contracts have been and are expected to be fulfilled with spot market purchases. Due to the technical complexities of changing suppliers of fuel fabrication services, Regulated Utilities generally sources these services to a single domestic supplier on a plant-by-plant basis using multiyear contracts.
Regulated Utilities has entered into fuel contracts that cover 100 percent of its uranium concentrates, conversion services, and enrichment services requirements through at least 2017 and cover fabrication services requirements for these plants through at least 2019. For future requirements not already covered under long-term contracts, Regulated Utilities believes it will be able to renew contracts as they expire, or enter into similar contractual arrangements with other suppliers of nuclear fuel materials and services.
12
PART I
Natural Gas and Oil
Natural gas and oil supply for Regulated Utilities’ generation fleet is purchased under term and spot contracts from various suppliers. Duke Energy Carolinas, Duke Energy Progress, Duke Energy Florida and Duke Energy Indiana use derivative instruments to limit a portion of their exposure to price fluctuations for natural gas. Regulated Utilities has certain dual-fuel generating facilities that can operate with both natural gas and oil. The cost of Regulated Utilities’ natural gas and oil is either at a fixed price or determined by market prices as reported in certain industry publications. Regulated Utilities believes it has access to an adequate supply of gas and oil for the reasonably foreseeable future. Regulated Utilities’ natural gas transportation for its gas generation is purchased under long-term firm transportation contracts with interstate and intrastate pipelines. Regulated Utilities may also purchase additional shorter-term transportation for its load requirements during peak periods. The Regulated Utilities natural gas plants are served by several supply zones and multiple pipelines.
Purchased Power
Regulated Utilities purchases a portion of its capacity and system requirements through purchase obligations, leases and purchase contracts. Regulated Utilities believes it can obtain adequate purchased power capacity to meet future system load needs. However, during periods of high demand, the price and availability of purchased power may be significantly affected.
The following table summarizes purchased power the previous three years:
|
2015
|
|
2014
|
|
2013
|
|
|||
|
Purchase obligations and leases (in millions of megawatt-hours (MWh))
(a)
|
14.9
|
|
14.3
|
|
11.7
|
|
||
|
Purchases capacity under contract (in MW)
(b)
|
4,573
|
|
4,500
|
|
3,800
|
|
||
(a) Represents approximately 5 percent of total system requirements for all years presented.
(b) These agreements include approximately 421 MW of firm capacity under contract by Duke Energy Florida with QFs.
Natural Gas for Retail Distribution
Regulated Utilities is responsible for the purchase and the subsequent delivery of natural gas to retail customers in its Ohio and Kentucky service territories. Regulated Utilities’ natural gas procurement strategy is to buy firm natural gas supplies and firm interstate pipeline transportation capacity during the winter season and during the non-heating season through a combination of firm supply and transportation capacity along with spot supply and interruptible transportation capacity. This strategy allows Regulated Utilities to assure reliable natural gas supply for its non-curtailable customers during peak winter conditions and provides Regulated Utilities the flexibility to reduce its contract commitments if firm customers choose alternate gas. In
2015
, firm supply purchase commitment agreements provided approximately 71 percent of the natural gas supply.
Inventory
Generation of electricity is capital intensive. Regulated Utilities must maintain an adequate stock of fuel and materials and supplies in order to ensure continuous operation of generating facilities and reliable delivery to customers. As of
December 31, 2015
, the inventory balance for Regulated Utilities was $3,702 million. For additional information on inventory see Note
1
to the Consolidated Financial Statements, “Summary of Significant Accounting Policies.”
Ash Basin Management
On September 20, 2014, the North Carolina Coal Ash Management Act of 2014 (Coal Ash Act) became law and was amended on June 24, 2015, by the Mountain Energy Act. The Coal Ash Act established a Coal Ash Management Commission (Coal Ash Commission) to oversee handling of coal ash within the state and requires closure of ash impoundments by no later than December 31, 2029 based on risk rankings, amongst other detailed requirements. The Coal Ash Act leaves the decision on cost recovery determinations related to closure of coal combustion residual (CCR) surface impoundments (ash basins or impoundments) to the normal ratemaking processes before utility regulatory commissions. Duke Energy has and will periodically submit to applicable authorities required site-specific coal ash impoundment remediation or closure plans. These plans and all associated permits must be approved before any work can begin.
On April 17, 2015, the EPA published Resource Conservation and Recovery Act (RCRA) in the Federal Register, establishing rules to regulate the disposal of coal combustion residuals (CCR) from electric utilities as solid waste. The RCRA, and the Coal Ash Act, as amended, finalized the legal framework related to coal ash management practices and ash basin closure.
Duke Energy has advanced the strategy and implementation for the remediation or closure of coal ash basins. In 2015, Duke Energy began activities at certain sites within North Carolina specified as high risk by the Coal Ash Act with coal ash moving off-site for use in structural fill or to lined landfills.
For additional information on the ash basins, see Notes
5
and 9 to the Consolidated Financial Statements, "Commitments and Contingencies" and "Asset Retirement Obligations," respectively.
Nuclear Matters
Regulated Utilities owns, wholly or partially, 11 nuclear reactors located at six stations. Nuclear insurance includes: nuclear liability coverage; property, decontamination and premature decommissioning coverage; and replacement power expense coverage. Joint owners reimburse Regulated Utilities for certain expenses associated with nuclear insurance in accordance with joint owner agreements. The Price-Anderson Act requires plant owners to provide for public nuclear liability claims resulting from nuclear incidents to the maximum total financial protection liability, which currently is
$13.5 billion
. For additional information on nuclear insurance see Note
5
to the Consolidated Financial Statements, “Commitments and Contingencies.”
13
PART I
Regulated Utilities has a significant future financial commitment to dispose of spent nuclear fuel and decommission and decontaminate each plant safely. The NCUC, PSCSC and FPSC require Regulated Utilities to update their cost estimates for decommissioning their nuclear plants every five years.
The following table summarizes the fair value of nuclear decommissioning trust fund (NDTF) balances and cost study results for Duke Energy Carolinas, Duke Energy Progress and Duke Energy Florida.
|
NDTF
(a)
|
|||||||||||||
|
(in millions)
|
December 31, 2015
|
|
December 31, 2014
|
|
Decommissioning Costs
(a)(b)
|
|
Year of Cost Study
|
||||||
|
Duke Energy
|
$
|
5,825
|
|
$
|
5,546
|
|
$
|
8,130
|
|
2013 and 2014
|
|||
|
Duke Energy Carolinas
|
3,050
|
|
3,042
|
|
3,420
|
|
2013
|
||||||
|
Duke Energy Progress
|
2,035
|
|
1,701
|
|
3,550
|
|
2014
|
||||||
|
Duke Energy Florida
(c)
|
740
|
|
803
|
|
1,160
|
|
2013
|
||||||
(a) Amounts for Progress Energy equal the sum of Duke Energy Progress and Duke Energy Florida.
|
(b)
|
Amounts include the Subsidiary Registrants' ownership interest in jointly owned reactors. Other joint owners are responsible for decommissioning costs related to their interest in the reactors.
|
|
(c)
|
Duke Energy Florida received reimbursements from the NDTF for costs related to ongoing decommissioning activity of the Crystal River Unit 3 Nuclear Plant during 2015.
|
The NCUC, PSCSC. FPSC and FERC have allowed Regulated Utilities’ to recover estimated decommissioning costs through retail and wholesale rates over the expected remaining service periods of their nuclear stations. Regulated Utilities believes the decommissioning costs being recovered through rates, when coupled with the existing fund balance and expected fund earnings, will be sufficient to provide for the cost of future decommissioning. For additional information see Note
9
to the Consolidated Financial Statements, “Asset Retirement Obligations.”
The Nuclear Waste Policy Act of 1982 (as amended) (NWPA) provides the framework for development by the federal government of interim storage and permanent disposal facilities for high-level radioactive waste materials. The NWPA promotes increased usage of interim storage of spent nuclear fuel at existing nuclear plants. Regulated Utilities will continue to maximize the use of spent fuel storage capability within its own facilities for as long as feasible.
Under federal law, the U.S. Department of Energy (DOE) is responsible for the selection and construction of a facility for the permanent disposal of spent nuclear fuel and high-level radioactive waste. Delays have occurred in the DOE’s proposed permanent repository to be located at Yucca Mountain, Nevada. At this time, DOE's focus is on developing consolidated storage for commercial spent nuclear fuel at one or more central sites rather than at a permanent repository.
Until the DOE begins to accept the spent nuclear fuel, Duke Energy Carolinas, Duke Energy Progress and Duke Energy Florida will continue to safely manage their spent nuclear fuel. Under current regulatory guidelines, Harris Nuclear Plant has sufficient storage capacity in its spent fuel pools through the expiration of its renewed operating license. Crystal River Unit 3 was retired in 2013, and placed in SAFSTOR prior to final decommissioning. The spent fuel is currently stored in the spent fuel pool and an independent spent fuel storage installation will be installed to accommodate storage of all the spent nuclear fuel until the DOE accepts the spent nuclear fuel. With certain modifications and approvals by the U.S. Nuclear Regulatory Commission (NRC) to expand the on-site dry cask storage facilities, spent nuclear fuel dry storage facilities will be sufficient to provide storage space of spent fuel through the expiration of the operating licenses, including any license renewals, for the Brunswick Nuclear Plant, Catawba Nuclear Station, McGuire Nuclear Station, Oconee Nuclear Station and Robinson Nuclear Plant.
The nuclear power industry faces uncertainties with respect to the cost and long-term availability of disposal sites for spent nuclear fuel and other radioactive waste, compliance with changing regulatory requirements, capital outlays for modifications and new plant construction, the technological and financial aspects of decommissioning plants at the end of their licensed lives, and requirements relating to nuclear insurance.
Regulated Utilities is subject to the jurisdiction of the NRC for the design, construction and operation of its nuclear generating facilities. The following table includes the current year of expiration of nuclear operating licenses for nuclear stations in operation. Nuclear operating licenses are potentially subject to extension.
|
Unit
|
Year of Expiration
|
|
Duke Energy Carolinas
|
|
|
Catawba Unit 1 & 2
|
2043
|
|
McGuire Unit 1
|
2041
|
|
McGuire Unit 2
|
2043
|
|
Oconee Unit 1 & 2
|
2033
|
|
Oconee Unit 3
|
2034
|
|
Duke Energy Progress
|
|
|
Brunswick Unit 1
|
2036
|
|
Brunswick Unit 2
|
2034
|
|
Harris
|
2046
|
|
Robinson
|
2030
|
14
PART I
Duke Energy Florida has requested the NRC to terminate the Crystal River Unit 3 operating license as Crystal River Unit 3 permanently ceased operation in February 2013. For additional information on decommissioning activity and transition to SAFSTOR, see Note
4
"Regulatory Matters."
The NRC issues orders with regard to security at nuclear plants in response to new or emerging threats. The most recent orders include additional restrictions on nuclear plant access, increased security measures at nuclear facilities and closer coordination with intelligence, military, law enforcement and emergency response functions at the federal, state and local levels. As the NRC, other governmental entities and the industry continue to consider security issues, it is possible that more extensive security plans could be required.
Regulation
State
The NCUC, PSCSC, FPSC, PUCO, IURC and KPSC (collectively, the state utility commissions) approve rates for retail electric and gas service within their respective states. The state utility commissions, to varying degrees, have authority over the construction and operation of Regulated Utilities’ generating facilities. Certificates of Public Convenience and Necessity issued by the state utility commissions, as applicable, authorize Regulated Utilities to construct and operate its electric facilities, and to sell electricity to retail and wholesale customers. Prior approval from the relevant state utility commission is required for Regulated Utilities to issue securities. The underlying concept of utility ratemaking is to set rates at a level that allows the utility to collect revenues equal to its cost of providing service plus earn a reasonable rate of return on its invested capital, including equity.
Each of the state utility commissions allow recovery of certain costs through various cost-recovery clauses to the extent the respective commission determines in periodic hearings that such costs, including any past over or under-recovered costs, are prudent. The clauses are in addition to approved base rates.
Fuel, fuel-related costs and certain purchased power costs are eligible for recovery by Regulated Utilities. Regulated Utilities uses coal, hydroelectric, natural gas, oil and nuclear fuel to generate electricity, thereby maintaining a diverse fuel mix that helps mitigate the impact of cost increases in any one fuel. Due to the associated regulatory treatment and the method allowed for recovery, changes in fuel costs from year to year have no material impact on operating results of Regulated Utilities, unless a commission finds a portion of such costs to have been imprudent. However, delays between the expenditure for fuel costs and recovery from customers can adversely impact the timing of cash flows of Regulated Utilities.
The following table summarizes base rate cases approved and effective in the past three years.
|
Annual
|
|
Return
|
|
Equity Component
|
|
||||||||
|
Increase
|
|
on
|
|
of Capital
|
|
||||||||
|
(in millions)
|
|
Equity
|
|
Structure
|
|
Effective Date
|
Other
|
||||||
|
Duke Energy Carolinas 2013 North Carolina Rate Case
(a)
|
$
|
234
|
|
10.2
|
%
|
53
|
%
|
September 2013
|
(b)
|
||||
|
Duke Energy Carolinas 2013 South Carolina Rate Case
(a)
|
118
|
|
10.2
|
%
|
53
|
%
|
September 2013
|
(c)
|
|||||
|
Duke Energy Progress 2012 North Carolina Rate Case
(a)
|
178
|
|
10.2
|
%
|
53
|
%
|
June 2013
|
(d)
|
|||||
|
Duke Energy Ohio 2012 Electric Rate Case
|
49
|
|
9.84
|
%
|
53
|
%
|
May 2013
|
||||||
|
Duke Energy Ohio 2012 Natural Gas Rate Case
|
—
|
|
9.84
|
%
|
53
|
%
|
December 2013
|
(e)
|
|||||
|
Duke Energy Florida 2013 FPSC Settlement
|
—
|
|
10.5
|
%
|
49
|
%
|
October 2013
|
(f)(h)
|
|||||
|
Duke Energy Florida 2012 FPSC Settlement
|
150
|
|
10.5
|
%
|
49
|
%
|
January 2013
|
(g)(h)
|
|||||
|
(a)
|
Rates increase over a two or three year period as approved by the NCUC and PSCSC. Annual increase amounts represent the total increase once effective.
|
|
(b)
|
Terms of this rate case include (i) recognition of nuclear outage expenses over the refueling cycle rather than when the outage occurs, (ii) a $10 million shareholder contribution to agencies providing energy assistance to low-income customers, and (iii) an annual reduction in the regulatory liability for costs of removal of $30 million for each of the first two years.
|
|
(c)
|
Terms of this rate case include (i) recognition of nuclear outage expenses over the refueling cycle rather than when the outage occurs, (ii) an approximate $4 million shareholder contribution to agencies providing energy assistance to low-income customers and for economic development, and (iii) a reduction in the regulatory liability for costs of removal of $45 million for the first year.
|
|
(d)
|
Terms of this rate case include (i) recognition of nuclear outage expenses over the refueling cycle rather than when the outage occurs, (ii) a $20 million shareholder contribution to agencies providing energy assistance to low-income customers, and (iii) a reduction in the regulatory liability for costs of removal of $20 million for the first year.
|
|
(e)
|
Although the PUCO approved no increase in base rates, more than half of the revenue request was approved to be recovered in various riders, including recovery of costs related to former manufactured gas plants (MGP). Recovery of $56 million of MGP costs via a rider was approved in November 2013. The rider became effective in March 2014, was suspended in June 2014 and reinstated in January 2015. For additional information on MGP recovery see Note
4
to the Consolidated Financial Statements, “Regulatory Matters.”
|
|
(f)
|
Terms of this settlement include (i) no additional base rate increases until 2019, (ii) partial recovery of Crystal River Unit 3, which began in 2014, and (iii) full recovery of Crystal River Unit 3, not to exceed $1,466 million, plus the cost to build a dry cask storage facility, beginning no later than 2017. See Note 4, "Regulatory Matters," for information regarding Duke Energy Florida's nuclear asset securitizable balance related to Crystal River Unit 3.
|
|
(g)
|
Terms of this settlement include the removal of Crystal River Unit 3 assets from rate base.
|
|
(h)
|
Capital structure includes deferred income tax, customer deposits and investment tax credits.
|
For more information on rate matters and other regulatory proceedings, see Note
4
to the Consolidated Financial Statements, “Regulatory Matters.”
15
PART I
Federal
The FERC approves Regulated Utilities’ cost-based rates for electric sales to certain wholesale customers, as well as sales of transmission service. Regulations of FERC and the state utility commissions govern access to regulated electric and gas customers and other data by nonregulated entities and services provided between regulated and nonregulated energy affiliates. These regulations affect the activities of nonregulated affiliates with Regulated Utilities.
Regional Transmission Organizations (RTO).
PJM Interconnection, LLC (PJM) and Midcontinent Independent Transmission System Operator, Inc. (MISO) are the Independent System Operators (ISO) and FERC-approved RTOs for the regions in which Duke Energy Ohio and Duke Energy Indiana operate. PJM and MISO operate energy, capacity and other markets, and, through central dispatch, control the day-to-day operations of bulk power systems.
Duke Energy Ohio is a member of PJM and Duke Energy Indiana is a member of MISO. Transmission owners in these RTOs have turned over control of their transmission facilities, and their transmission systems are currently under the dispatch control of the RTOs. Transmission service is provided on a region wide, open-access basis using the transmission facilities of the RTO members at rates based on the costs of transmission service.
Environmental.
Regulated Utilities is subject to the jurisdiction of the EPA and state and local environmental agencies. For a discussion of environmental regulation, see “Environmental Matters” in this section.
See “Other Matters” section of Management’s Discussion and Analysis of Financial Condition and Results of Operations for a discussion about potential Global Climate Change legislation and other EPA regulations under development and the potential impacts such legislation and regulation could have on Duke Energy’s operations.
INTERNATIONAL ENERGY
International Energy principally operates and manages power generation facilities and engages in sales and marketing of electric power, natural gas, and natural gas liquids outside the U.S. Its activities principally target power generation in Latin America. Additionally, International Energy owns a 25 percent interest in National Methanol Company (NMC), a large regional producer of methanol and methyl tertiary butyl ether (MTBE) located in Saudi Arabia. International Energy’s economic ownership interest will decrease to 17.5 percent upon successful startup of NMC's polyacetal production facility, which is expected to occur in January 2017. International Energy will retain 25 percent of the board representation and voting rights of NMC. The investment in NMC is accounted for under the equity method of accounting.
On February 18, 2016, Duke Energy announced it had initiated a process to divest the International Energy business segment, excluding the equity method investment in NMC. The process remains in a preliminary stage and there have been no binding or non-binding offers requested or submitted. Duke Energy can provide no assurance that this process will result in a transaction and there is no specific timeline for execution of a potential transaction.
In December 2014, Duke Energy declared a taxable dividend of historical foreign earnings in the form of notes payable that resulted in the repatriation of approximately $2.7 billion in cash held and expected to be generated by International Energy over a period of up to eight years. For additional information see Note
22
to the Consolidated Financial Statements, “Income Taxes.”
Customers, Competition and Regulation
International Energy’s customers include retail distributors, electric utilities, independent power producers, marketers, and industrial and commercial companies.
International Energy’s sales and marketing of electric power and natural gas competes directly with other generators and marketers serving its market areas. Competitors are country and region-specific, but include government-owned electric generating companies, local distribution companies with self-generation capability and other privately owned electric generating and marketing companies. The principal elements of competition are price and availability, terms of service, flexibility and reliability of service.
A high percentage of International Energy’s portfolio consists of baseload hydroelectric generation facilities, which compete with other forms of electric generation available to International Energy’s customers and end-users, including natural gas and fuel oils. Economic activity, conservation, legislation, governmental regulations, weather, including rainfall, additional generation capacities and other factors affect the supply and demand for electricity in the regions served by International Energy.
International Energy’s operations are subject to both country-specific and international laws and regulations. See “Environmental Matters” in this section.
COMMERCIAL PORTFOLIO
Commercial Portfolio primarily acquires, builds, develops, and operates wind and solar renewable generation and energy transmission projects throughout the continental U.S. The portfolio includes nonregulated renewable energy, electric transmission, natural gas infrastructure and energy storage businesses. The segment was renamed in 2015 as a result of the sale of the nonregulated Midwest generation business, as discussed in Note
2
of the Consolidated Financial Statements, "Acquisitions and Dispositions."
16
PART I
Commercial Portfolio's renewable energy includes utility-scale wind and solar generation assets which total more than 2,400 MW across 11 states from more than 22 wind farms and 38 commercial solar farms. Revenues are primarily generated by selling the power produced from renewable generation through long-term contracts to utilities, electric cooperatives, municipalities, and commercial and industrial customers. In most instances, these customers have obligations under state-mandated renewable energy portfolio standards or similar state or local renewable energy goals. Energy and renewable energy credits generated by wind and solar projects are generally sold at contractual prices. In addition, as wind and solar projects are placed in service, Commercial Portfolio recognizes either investment tax credits (ITC) when the renewable project achieves commercial availability or production tax credits (PTC) as power is generated by the project over 10 years. Renewable ITC are recognized over the useful life of the asset with the benefit of the tax basis adjustment due to the ITC recognized in income in the year of commercial availability.
Duke Energy, through its Commercial Portfolio segment, is a 40 percent equity member of Atlantic Coast Pipeline, LLC, (ACP) that plans to build and own the proposed Atlantic Coast Pipeline (the pipeline), a 564-mile interstate natural gas pipeline. The pipeline is intended to transport diverse gas supplies into southeastern markets. Duke Energy Carolinas and Duke Energy Progress, among others, will be customers of the pipeline. The estimated in-service date of the pipeline is late 2018. For additional information on the ACP equity investment and further details on the proposed pipeline, see Note
4
to the Consolidated Financial Statements, “Regulatory Matters."
Commercial Portfolio also has a 7.5 percent equity ownership interest in the proposed Sabal Trail natural gas pipeline. The Sabal Trail pipeline is planned to begin service in 2017 and traverse Alabama, Georgia and Florida to meet rapidly growing demand for natural gas in those states. For additional information on the Sabal Trail equity investment and further details on the proposed pipeline, see Note
4
to the Consolidated Financial Statements, “Regulatory Matters."
Commercial Portfolio has executed investments to expand and grow the business through the addition of distributed solar projects, energy storage systems and energy management solutions specifically tailored to commercial businesses.
For additional information on Commercial Portfolio’s generation facilities, see Item 2, “Properties.”
Other Matters
Commercial Portfolio is subject to regulation at the federal level, primarily from the FERC. Regulations of the FERC govern access to regulated market information by nonregulated entities, services provided between regulated and nonregulated utilities, pipeline certification.
For more information on rate matters, see Note
4
to the Consolidated Financial Statements, “Regulatory Matters – Rate Related Information.”
Market Environment and Competition
The market price of commodities and services, along with the quality and reliability of services provided, drive competition in the wholesale energy business. Commercial Portfolio’s main competitors include other nonregulated generators and wholesale power providers.
Sources of Electricity
Commercial Portfolio relies on wind and solar resources for its generation of electric energy.
OTHER
The remainder of Duke Energy’s operations is presented as Other. While it is not an operating segment, Other primarily includes unallocated corporate interest expense, certain unallocated corporate costs, Bison Insurance Company Limited (Bison), Duke Energy’s wholly owned, captive insurance subsidiary, contributions to the Duke Energy Foundation, and other minor and immaterial investments in businesses the Company retained from previous divestitures that are no longer part of its current operating segment or is in various stages of exiting or winding down.
Bison’s principal activities as a captive insurance entity include the indemnification of various business risks and losses, such as property, workers’ compensation and general liability of Duke Energy subsidiaries and affiliates.
Regulation
Certain entities within Other are subject to the jurisdiction of state and local agencies.
Geographic Regions
For a discussion of Duke Energy’s foreign operations see “Management’s Discussion and Analysis of Results of Operations” and Note
3
to the Consolidated Financial Statements, “Business Segments.”
Employees
On
December 31, 2015
, Duke Energy had a total of 29,188 employees on its payroll. The total includes 5,371 employees who are represented by labor unions under various collective bargaining agreements that generally cover wages, benefits, working practices, and other terms and conditions of employment.
17
PART I
Executive Officers of the Registrants
The following table sets forth the individuals who currently serve as executive officers. Executive officers serve until their successors are duly elected or appointed.
|
Name
|
Age
(a)
|
Current and Recent Positions Held
|
|||
|
Lynn J. Good
|
56
|
|
Chairman, President and Chief Executive Officer.
Ms. Good was elected as Chairman of the Board, effective January 1, 2016, and assumed her position as President and Chief Executive Officer in July 2013. Prior to that, she served as Executive Vice President and Chief Financial Officer since 2009.
|
||
|
Steven K. Young
|
57
|
|
Executive Vice President and Chief Financial Officer.
Mr. Young assumed his current position in August 2013. Prior to that, he had served as Senior Vice President, Chief Accounting Officer and Controller since April 2006.
|
||
|
Douglas F Esamann
|
58
|
|
Executive Vice President and President, Midwest and Florida Regions.
Mr. Esamann assumed his current position in June 2015. Prior to that he was President, Duke Energy Indiana since November 2010.
|
||
|
Lloyd M. Yates
|
55
|
|
Executive Vice President, Market Solutions and President, Carolinas Region.
Mr. Yates assumed his current position in August 2014. He held the position of Executive Vice President, Regulated Utilities from December 2012 to August 2014, and prior to that, had served as Executive Vice President, Customer Operations since July 2012, upon the merger of Duke Energy and Progress Energy. Prior to the merger, Mr. Yates was President and Chief Executive Officer of Progress Energy Carolinas, Inc., which is now known as Duke Energy Progress, LLC. since July 2007.
|
||
|
Dhiaa M. Jamil
|
59
|
|
Executive Vice President and President, Regulated Generation and Transmission.
Mr. Jamil assumed his current position in June 2015. Prior to that he had served as Executive Vice President and President, Regulated Generation since August 2014. He served as Executive Vice President and President of Duke Energy Nuclear from March 2013 and as Chief Nuclear Officer from February 2008 to August 2014. He also served as Chief Generation Officer for Duke Energy from July 2009 to June 2012.
|
||
|
Julia S. Janson
|
51
|
|
Executive Vice President, Chief Legal Officer and Corporate Secretary.
Ms. Janson assumed her current position in December 2012 and, in February 2016, assumed the interim responsibilities for the External Affairs and Strategic Policy organization. Prior to that, she had held the position of President of Duke Energy Ohio and Duke Energy Kentucky since 2008.
|
||
|
A.R. Mullinax
|
61
|
|
Executive Vice President, Strategic Services.
Mr. Mullinax assumed his current position in August 2014. Prior to that, he had held the position of Chief Information Officer since 2007.
|
||
|
Melissa H. Anderson
|
51
|
|
Senior Vice President and Chief Human Resources Officer.
Ms. Anderson assumed her position in January 2015. Prior to joining Duke Energy, she served as Senior Vice President of Human Resources at Domtar Inc. since 2010.
|
||
|
Brian D. Savoy
|
40
|
|
Senior Vice President, Chief Accounting Officer and Controller.
Mr. Savoy assumed his current position in September 2013. Prior to that, he had held the position of Director, Forecasting and Analysis since 2009.
|
||
(a) The ages of the officers provided are as of December 31, 2015.
There are no family relationships between any of the executive officers, nor any arrangement or understanding between any executive officer and any other person involved in officer selection.
Environmental Matters
The Duke Energy Registrants are subject to federal, state and local laws and regulations with regard to air and water quality, hazardous and solid waste disposal and other environmental matters. Duke Energy is also subject to international laws and regulations with regard to air and water quality, hazardous and solid waste disposal and other environmental matters. Environmental laws and regulations affecting the Duke Energy Registrants include, but are not limited to:
|
•
|
The Clean Air Act (CAA), as well as state laws and regulations impacting air emissions, including State Implementation Plans related to existing and new national ambient air quality standards for ozone and particulate matter. Owners and/or operators of air emission sources are responsible for obtaining permits and for annual compliance and reporting.
|
|
•
|
The Clean Water Act (CWA), which requires permits for facilities that discharge wastewaters into the environment.
|
|
•
|
The Comprehensive Environmental Response, Compensation and Liability Act, which can require any individual or entity that currently owns or in the past may have owned or operated a disposal site, as well as transporters or generators of hazardous substances sent to a disposal site, to share in remediation costs.
|
|
•
|
The Solid Waste Disposal Act, as amended by the RCRA, which requires certain solid wastes, including hazardous wastes, to be managed pursuant to a comprehensive regulatory regime.
|
|
•
|
The National Environmental Policy Act, which requires federal agencies to consider potential environmental impacts in their decisions, including siting approvals.
|
|
•
|
The CPP, which regulates CO
2
emissions from existing fossil fuel-fired electric generating units by requiring states to develop and submit final compliance plans, or initial plans with an extension request, to the EPA by September 6, 2016, or no later than September 6, 2018, with an approved extension. On February 9, 2016, the U.S. Supreme Court granted a stay against the CPP halting enforcement until legal challenges are resolved.
|
18
PART I
|
•
|
Coal Ash Act, as amended, which establishes regulations regarding the use and closure of existing ash basins, the disposal of ash at active coal plants and the handling of surface water impacts from ash basins in North Carolina.
|
|
•
|
CCR, which classifies CCR as nonhazardous waste under RCRA and establishes requirements regarding landfill design and management and monitoring of CCR.
|
See “Other Matters” section of Management’s Discussion and Analysis of Financial Condition and Results of Operations for a discussion about potential Global Climate Change legislation and the potential impacts such legislation could have on the Duke Energy Registrants’ operations. Additionally, other recently passed and potential future environmental laws and regulations could have a significant impact on the Duke Energy Registrants’ results of operations, cash flows or financial position. However, if and when such laws and regulations become effective, the Duke Energy Registrants will seek appropriate regulatory recovery of costs to comply within its regulated operations.
For more information on environmental matters involving the Duke Energy Registrants, including possible liability and capital costs, see Note
5
to the Consolidated Financial Statements, “Commitments and Contingencies – Environmental.” Except to the extent discussed in Note
5
to the Consolidated Financial Statements, “Commitments and Contingencies,” compliance with current international, federal, state and local provisions regulating the discharge of materials into the environment, or otherwise protecting the environment, is incorporated into the routine cost structure of our various business segments and is not expected to have a material adverse effect on the competitive position, consolidated results of operations, cash flows or financial position of the Duke Energy Registrants.
DUKE ENERGY CAROLINAS
Duke Energy Carolinas is a regulated public utility primarily engaged in the generation, transmission, distribution, and sale of electricity in portions of North Carolina and South Carolina. Duke Energy Carolinas’ service area covers approximately 24,000 square miles and supplies electric service to 2.5 million residential, commercial and industrial customers. For information about Duke Energy Carolinas’ generating facilities, see Item 2, “Properties.” Duke Energy Carolinas is subject to the regulatory provisions of the NCUC, PSCSC, NRC and FERC.
Substantially all of Duke Energy Carolinas' operations are regulated and qualify for regulatory accounting. Duke Energy Carolinas operates one reportable business segment, Regulated Utilities. For additional information regarding this business segment, including financial information, see Note
3
to the Consolidated Financial Statements, “Business Segments.”
PROGRESS ENERGY
Progress Energy is a public utility holding company primarily engaged in the regulated electric utility business and is subject to regulation by the FERC. Progress Energy conducts operations through its wholly owned subsidiaries, Duke Energy Progress and Duke Energy Florida. When discussing Progress Energy’s financial information, it necessarily includes the results of Duke Energy Progress and Duke Energy Florida.
Substantially all of Progress Energy’s operations are regulated and qualify for regulatory accounting. Progress Energy operates one reportable business segment, Regulated Utilities. For additional information regarding this business segment, including financial information, see Note
3
to the Consolidated Financial Statements, “Business Segments.”
DUKE ENERGY PROGRESS
Duke Energy Progress is a regulated public utility primarily engaged in the generation, transmission, distribution and sale of electricity in portions of North Carolina and South Carolina. Duke Energy Progress’ service area covers approximately 32,000 square miles, and supplies electric service to approximately 1.5 million residential, commercial and industrial customers. For information about Duke Energy Progress’ generating facilities, see Item 2, “Properties.” Duke Energy Progress is subject to the regulatory provisions of the NCUC, PSCSC, NRC and FERC.
Substantially all of Duke Energy Progress’ operations are regulated and qualify for regulatory accounting. Duke Energy Progress operates one reportable business segment, Regulated Utilities. For additional information regarding this business segment, including financial information, see Note
3
to the Consolidated Financial Statements, “Business Segments.”
DUKE ENERGY FLORIDA
Duke Energy Florida is a regulated public utility primarily engaged in the generation, transmission, distribution, and sale of electricity in portions of Florida. Duke Energy Florida’s service area covers approximately 13,000 square miles and supplies electric service to approximately 1.7 million residential, commercial and industrial customers. For information about Duke Energy Florida’s generating facilities, see Item 2, “Properties.” Duke Energy Florida is subject to the regulatory provisions of the FPSC, NRC and FERC.
Substantially all of Duke Energy Florida’s operations are regulated and qualify for regulatory accounting. Duke Energy Florida operates one reportable business segment, Regulated Utilities. For additional information regarding this business segment, including financial information, see Note
3
to the Consolidated Financial Statements, “Business Segments.”
DUKE ENERGY OHIO
Duke Energy Ohio is a regulated public utility primarily engaged in the transmission and distribution of electricity in portions of Ohio and Kentucky, in the generation and sale of electricity in portions of Kentucky, and the transportation and sale of natural gas in portions of Ohio and Kentucky. Duke Energy Ohio also conducts competitive auctions for retail electricity supply in Ohio whereby recovery of the energy price is from retail customers. Operations in Kentucky are conducted through its wholly owned subsidiary, Duke Energy Kentucky, Inc. (Duke Energy Kentucky). References herein to Duke Energy Ohio include Duke Energy Ohio and its subsidiaries, unless otherwise noted. Duke Energy Ohio is subject to the regulatory provisions of the PUCO, KPSC and FERC.
19
PART I
Duke Energy Ohio’s service area covers approximately 3,000 square miles and supplies electric service to approximately 840,000 residential, commercial and industrial customers and provides transmission and distribution services for natural gas to approximately 525,000 customers. For information about Duke Energy Ohio's generating facilities, see Item 2, “Properties.”
On April 2, 2015, Duke Energy completed the sale of its nonregulated Midwest generation business, which sold power into wholesale energy markets, to a subsidiary of Dynegy. For further information about the sale of the Midwest Generation business, refer to Note
2
to the Consolidated Financial Statements, "Acquisitions and Dispositions."
Substantially all of Duke Energy Ohio's operations that remain after the sale qualify for regulatory accounting.
Business Segments
Duke Energy Ohio had two reportable operating segments, Regulated Utilities and Commercial Portfolio, prior to the sale of the nonregulated Midwest generation business. As a result of the sale Commercial Portfolio no longer qualifies as a Duke Energy Ohio reportable operating segment. Therefore, for periods subsequent to the sale, beginning in the second quarter of 2015, all of the remaining assets and related results of operations previously presented in Commercial Portfolio are presented in Regulated Utilities and Other. For additional information on this business segment, including financial information, see Note
3
to the Consolidated Financial Statements, “Business Segments.”
DUKE ENERGY INDIANA
Duke Energy Indiana is a regulated public utility primarily engaged in the generation, transmission, distribution and sale of electricity in portions of Indiana. Duke Energy Indiana’s service area covers 23,000 square miles and supplies electric service to 810,000 residential, commercial and industrial customers. See Item 2, “Properties” for further discussion of Duke Energy Indiana’s generating facilities, transmission and distribution. Duke Energy Indiana is subject to the regulatory provisions of the IURC and FERC.
Substantially all of Duke Energy Indiana’s operations are regulated and qualify for regulatory accounting. Duke Energy Indiana operates one reportable business segment, Regulated Utilities. For additional information regarding this business segment, including financial information, see Note
3
to the Consolidated Financial Statements, “Business Segments.”
ITEM 1A. RISK FACTORS
In addition to other disclosures within this Form 10-K, including Management’s Discussion and Analysis – Matters Impacting Future Results for each registrant in Item 7, and other documents filed with the SEC from time to time, the following factors should be considered in evaluating Duke Energy and its subsidiaries. Such factors could affect actual results of operations and cause results to differ substantially from those currently expected or sought. Unless otherwise indicated, risk factors discussed below generally relate to risks associated with all of the Duke Energy Registrants. Risks identified at the Subsidiary Registrant level are generally applicable to Duke Energy.
Duke Energy may be unable to obtain the approvals required to complete its acquisition of Piedmont or, in order to do so, the combined company may be required to comply with material restrictions or conditions.
On October 24, 2015, Duke Energy entered into a Merger Agreement with Piedmont. For the acquisition to be completed, various approvals must be obtained from state utility and regulatory authorities. These governmental authorities may impose conditions on the completion, or require changes to the terms, of the transaction, including restrictions or conditions on the business, operations, or financial performance of the combined company following completion of the transaction. These conditions or changes could have the effect of delaying completion of the acquisition or imposing additional costs on or limiting the revenues of the combined company following the transaction, which could have a material adverse effect on the financial position, results of operations or cash flows of the combined company and/or cause either Duke Energy or Piedmont to abandon the transaction.
If completed, Duke Energy’s acquisition of Piedmont may not achieve its intended results.
Duke Energy and Piedmont entered into the merger agreement with the expectation that the transaction would result in various benefits, including, among other things, being accretive to earnings and foundational to establishing a broader gas infrastructure business within Duke Energy. Achieving the anticipated benefits of the transaction is subject to a number of uncertainties, including whether the business of Piedmont is integrated in an efficient and effective manner. Failure to achieve these anticipated benefits could result in increased costs; decreases in the amount of expected revenues generated by the combined company and diversion of management’s time and energy, all of which could have an adverse effect on the combined company’s financial position, results of operations or cash flows.
Failure to complete the transaction with Piedmont could negatively impact Duke Energy’s stock price and Duke Energy’s future business and financial results.
If Duke Energy’s acquisition of Piedmont is not completed, Duke Energy’s ongoing business and financial results may be adversely affected and Duke Energy will be subject to a number of risks, including the following:
|
•
|
Duke Energy may be required, under specified circumstances set forth in the Merger Agreement, to pay Piedmont a termination fee of $250 million;
|
|
•
|
Duke Energy will be required to pay costs relating to the transaction, including legal, accounting, financial advisory, filing and printing costs, whether or not the transaction is completed; and
|
|
•
|
execution of Duke Energy’s acquisition of Piedmont (including integration planning) may require substantial commitments of time and resources by our management, which could otherwise have been devoted to other opportunities that may have been beneficial to Duke Energy.
|
20
PART I
Duke Energy could also be subject to litigation related to any failure to complete the transaction with Piedmont. If the transaction is not completed, these risks may materialize and may adversely affect Duke Energy’s financial position, results of operations or cash flows.
Regulatory, Legislative and Legal Risks
The Duke Energy Registrants’ regulated electric revenues, earnings and results are dependent on state legislation and regulation that affect electric generation, transmission, distribution and related activities, which may limit their ability to recover costs.
The Duke Energy Registrants’ regulated utility businesses are regulated on a cost-of-service/rate-of-return basis subject to statutes and regulatory commission rules and procedures of North Carolina, South Carolina, Florida, Ohio, Indiana and Kentucky. If the Duke Energy Registrants’ regulated utility earnings exceed the returns established by the state utility commissions, retail electric rates may be subject to review and possible reduction by the commissions, which may decrease the Duke Energy Registrants’ future earnings. Additionally, if regulatory bodies do not allow recovery of costs incurred in providing service on a timely basis, the Duke Energy Registrants’ future earnings could be negatively impacted.
If legislative and regulatory structures were to evolve in such a way that the Duke Energy Registrants’ exclusive rights to serve their regulated customers were eroded, their future earnings could be negatively impacted. In addition, federal and state regulations, laws and other efforts designed to promote and expand the use of energy efficiency measures and distributed generation technologies, such as rooftop solar and battery storage, in Duke Energy service territories could result in customers leaving the electric distribution system and an increased customer net energy metering, which allows customers with rooftop solar to receive bill credits for surplus power at the full retail amount. Over time, customer adoption of these technologies and increased energy efficiency could result in excess generation resources as well as stranded costs if the Company is not able to fully recover the costs and investment in generation.
Deregulation or restructuring in the electric industry may result in increased competition and unrecovered costs that could adversely affect the Duke Energy Registrants’ financial position, results of operations or cash flows and their utility businesses.
Increased competition resulting from deregulation or restructuring legislation could have a significant adverse impact on the Duke Energy Registrants’ results of operations, financial position, or cash flows. Retail competition and the unbundling of regulated electric service could have a significant adverse financial impact on the Duke Energy Registrants due to an impairment of assets, a loss of retail customers, lower profit margins or increased costs of capital. The Duke Energy Registrants cannot predict the extent and timing of entry by additional competitors into the electric markets. The Duke Energy Registrants cannot predict if or when they will be subject to changes in legislation or regulation, nor can they predict the impact of these changes on their financial position, results of operations or cash flows.
The Duke Energy Registrants’ businesses are subject to extensive federal regulation that will affect their operations and costs.
The Duke Energy Registrants are subject to regulation by FERC, NRC, EPA and various other federal agencies as well as the North American Electric Reliability Corporation. Regulation affects almost every aspect of the Duke Energy Registrants’ businesses, including, among other things, their ability to: take fundamental business management actions; determine the terms and rates of transmission and distribution services; make acquisitions; issue equity or debt securities; engage in transactions with other subsidiaries and affiliates; and pay dividends upstream to the Duke Energy Registrants. Changes to federal regulations are continuous and ongoing. The Duke Energy Registrants cannot predict the future course of regulatory changes or the ultimate effect those changes will have on their businesses. However, changes in regulation can cause delays in or affect business planning and transactions and can substantially increase the Duke Energy Registrants’ costs.
The Dan River ash basin release could impact the reputation and financial condition of the Duke Energy Registrants.
There is uncertainty regarding the extent and timing of future additional costs and liabilities related to the Dan River ash basin release, including the amount and extent of any pending or future civil penalties and resulting litigation. These uncertainties are likely to continue for an extended period and may further increase costs. Thus, the Dan River ash basin release could have an adverse impact on the reputation of the Duke Energy Registrants and their financial position, results of operations and cash flows.
The Duke Energy Registrants are subject to numerous environmental laws and regulations requiring significant capital expenditures that can increase the cost of operations, and which may impact or limit business plans, or cause exposure to environmental liabilities.
The Duke Energy Registrants are subject to numerous environmental laws and regulations affecting many aspects of their present and future operations, including CCRs, air emissions, water quality, wastewater discharges, solid waste and hazardous waste. These laws and regulations can result in increased capital, operating and other costs. These laws and regulations generally require the Duke Energy Registrants to obtain and comply with a wide variety of environmental licenses, permits, inspections and other approvals. Compliance with environmental laws and regulations can require significant expenditures, including expenditures for cleanup costs and damages arising from contaminated properties. Failure to comply with environmental regulations may result in the imposition of fines, penalties and injunctive measures affecting operating assets. The steps the Duke Energy Registrants could be required to take to ensure their facilities are in compliance could be prohibitively expensive. As a result, the Duke Energy Registrants may be required to shut down or alter the operation of their facilities, which may cause the Duke Energy Registrants to incur losses. Further, the Duke Energy Registrants may not be successful in recovering capital and operating costs incurred to comply with new environmental regulations through existing regulatory rate structures and their contracts with customers. Also, the Duke Energy Registrants may not be able to obtain or maintain from time to time all required environmental regulatory approvals for their operating assets or development projects. Delays in obtaining any required environmental regulatory approvals, failure to obtain and comply with them or changes in environmental laws or regulations to more stringent compliance levels could result in additional costs of operation for existing facilities or development of new facilities being prevented, delayed or subject to additional costs. Although it is not expected that the costs to comply with current environmental regulations will have a material adverse effect on the Duke Energy Registrants’ financial position, results of operations or cash flows due to regulatory cost recovery, the Duke Energy Registrants are at risk that the costs of complying with environmental regulations in the future will have such an effect.
21
PART I
The EPA has recently enacted or proposed new federal regulations governing the management of cooling water intake structures, wastewater and CO
2
emissions. These regulations may require the Duke Energy Registrants to make additional capital expenditures and increase operating and maintenance costs.
Duke Energy’s investments and projects located outside of the U.S. expose it to risks related to the laws, taxes, economic and political conditions, and policies of foreign governments. These risks may delay or reduce Duke Energy’s realization of value from its international projects.
Duke Energy currently owns and may acquire and/or dispose of material energy-related investments and projects outside the U.S. The economic, regulatory, market and political conditions in some of the countries where Duke Energy has interests may impact its ability to obtain financing on suitable terms. Other risks relate to its customers’ ability to honor their obligations with respect to projects and investments, delays in construction, limitations on its ability to enforce legal rights, and interruption of business, as well as risks of war, expropriation, nationalization, renegotiation, trade sanctions or nullification of existing contracts and changes in law, regulations, market rules or tax policy.
Operational Risks
The Duke Energy Registrants’ results of operations may be negatively affected by overall market, economic and other conditions that are beyond their control.
Sustained downturns or sluggishness in the economy generally affect the markets in which the Duke Energy Registrants operate and negatively influence electricity operations. Declines in demand for electricity as a result of economic downturns in the Duke Energy Registrants’ regulated electric service territories will reduce overall sales and lessen cash flows, especially as industrial customers reduce production and, therefore, consumption of electricity. Although the Duke Energy Registrants’ regulated electric business is subject to regulated allowable rates of return and recovery of certain costs, such as fuel, under periodic adjustment clauses, overall declines in electricity sold as a result of economic downturn or recession could reduce revenues and cash flows, thereby diminishing results of operations. Additionally, prolonged economic downturns that negatively impact the Duke Energy Registrants’ results of operations and cash flows could result in future material impairment charges to write-down the carrying value of certain assets, including goodwill, to their respective fair values.
The Duke Energy Registrants also sell electricity into the spot market or other competitive power markets on a contractual basis. With respect to such transactions, the Duke Energy Registrants are not guaranteed any rate of return on their capital investments through mandated rates, and revenues and results of operations are likely to depend, in large part, upon prevailing market prices. These market prices may fluctuate substantially over relatively short periods of time and could reduce the Duke Energy Registrants’ revenues and margins, thereby diminishing results of operations.
Factors that could impact sales volumes, generation of electricity and market prices at which the Duke Energy Registrants are able to sell electricity are as follows:
|
•
|
weather conditions, including abnormally mild winter or summer weather that cause lower energy usage for heating or cooling purposes, respectively, and periods of low rainfall that decrease the ability to operate facilities in an economical manner;
|
|
•
|
supply of and demand for energy commodities;
|
|
•
|
transmission or transportation constraints or inefficiencies that impact nonregulated energy operations;
|
|
•
|
availability of competitively priced alternative energy sources, which are preferred by some customers over electricity produced from coal, nuclear or gas plants, and customer usage of energy efficient equipment that reduces energy demand;
|
|
•
|
natural gas, crude oil and refined products production levels and prices;
|
|
•
|
ability to procure satisfactory levels of inventory, such as coal, gas and uranium; and
|
|
•
|
capacity and transmission service into, or out of, the Duke Energy Registrants’ markets.
|
Natural disasters or operational accidents may adversely affect the Duke Energy Registrants’ operating results.
Natural disasters (such as electromagnetic events or the 2011 earthquake and tsunami in Japan) or other operational accidents within the company or industry (such as the San Bruno, California natural gas transmission pipeline failure) could have direct significant impacts on the Duke Energy Registrants as well as on key contractors and suppliers. Such events could indirectly impact the Duke Energy Registrants through changes to policies, laws and regulations whose compliance costs have a significant impact on the Duke Energy Registrants’ financial position, results of operations and cash flows.
The reputation and financial condition of the Duke Energy Registrants could be negatively impacted due to their obligations to comply with federal and state regulations, laws, and other legal requirements that govern the operations, assessments, storage, closure, remediation, disposal, and monitoring relating to coal combustion residuals (CCR), the high costs and new rate impacts associated with implementing these new CCR-related requirements, and the strategies and methods necessary to implement these requirements in compliance with these legal obligations.
As a result of electricity produced for decades at coal-fired power plants, the Duke Energy Registrants manage large amounts of CCR that are primarily stored in dry storage within landfills or combined with water in other surface impoundments, all in compliance with applicable regulatory requirements. However, the potential exists for another CCR-related incident, such as the one that occurred during the 2014 Dan River Steam Station basin release, that could raise environmental or general public health concerns. Such a CCR-related incident could have a material adverse impact on the reputation and financial condition of the Duke Energy Registrants.
22
PART I
During 2015, EPA regulations were enacted related to the management of CCR from power plants. These regulations classify CCR as nonhazardous waste under the RCRA, and apply to electric generating sites with new and existing landfills, new and existing surface impoundments, structural fills and CCR piles, and establishes requirements regarding landfill design, structural integrity design and assessment criteria for surface impoundments, groundwater monitoring and protection procedures, and other operational and reporting procedures for the disposal and management of CCR. In addition to the federal regulations, CCR landfills and surface impoundments will continue to be independently regulated by existing state laws, regulations, and permits, as well as additional legal requirements that may be imposed in the future. These federal and state laws, regulations, and other legal requirements may require or result in additional expenditures, increased operating and maintenance costs, and/or result in closure of certain power generating facilities, which could affect the financial position, results of operations and cash flows of the Duke Energy Registrants. The Duke Energy Registrants intend to seek full cost recovery for expenditures through the normal ratemaking process with state and federal utility commissions, who permit recovery in rates of necessary and prudently incurred costs associated with the Duke Energy Registrants’ regulated operations, and through other wholesale contracts with terms that contemplate recovery of such costs, although there is no guarantee of full cost recovery. In addition, the timing for recovery of such costs could have a material adverse impact on Duke Energy's cash flows.
The Duke Energy Registrants have recognized significant asset retirement obligations related to these CCR-related requirements. In 2015, closure activities began at the four sites specified as high priority by the North Carolina Coal Ash Management Act (Coal Ash Act) and at the W.S. Lee Steam Station site in South Carolina in connection with other legal requirements. Excavation at these sites involves movement of large amounts of CCR materials to offsite locations for use as structural fill and to offsite or onsite lined landfills. At other sites, preliminary planning and closure methods have been studied and factored into the estimated retirement and management costs. Coal Ash Act requires CCR surface impoundments in North Carolina to be closed, with the closure method based on a risk ranking classification determined by state regulators and the North Carolina Coal Ash Commission. Other than the high priority sites specifically delineated by Coal Ash Act, the North Carolina Department of Environmental Quality (NCDEQ) has issued either preliminary draft risk rankings or has yet to designate specific risk classifications. These proposed risk rankings remain subject to a public comment period, including public meetings, followed by a final risk ranking recommendation by the NCDEQ to the Coal Ash Commission, for the Coal Ash Commission’s final approval. As the closure and CCR management work progresses, final risk ranking classifications of surface impoundments in North Carolina are delineated, and final closure plans are developed and approved at each site, the scope and complexity of work and the amount of CCR material could be greater than estimates and could, therefore, materially increase compliance expenditures and rate impacts.
The Duke Energy Registrants’ financial position, results of operations and cash flows may be negatively affected by a lack of growth or slower growth in the number of customers, or decline in customer demand or number of customers.
Growth in customer accounts and growth of customer usage each directly influence demand for electricity and the need for additional power generation and delivery facilities. Customer growth and customer usage are affected by a number of factors outside the control of the Duke Energy Registrants, such as mandated energy efficiency measures, demand-side management goals, distributed generation resources and economic and demographic conditions, such as population changes, job and income growth, housing starts, new business formation and the overall level of economic activity.
Certain regulatory and legislative bodies have introduced or are considering requirements and/or incentives to reduce energy consumption by certain dates. Additionally, technological advances driven by federal laws mandating new levels of energy efficiency in end-use electric devices or other improvements in or applications of technology could lead to declines in per capita energy consumption.
Advances in distributed generation technologies that produce power, including fuel cells, micro-turbines, wind turbines and solar cells, may reduce the cost of alternative methods of producing power to a level competitive with central power station electric production utilized by the Duke Energy Registrants.
Some or all of these factors, could result in a lack of growth or decline in customer demand for electricity or number of customers, and may cause the failure of the Duke Energy Registrants to fully realize anticipated benefits from significant capital investments and expenditures which could have a material adverse effect on their financial position, results of operations and cash flows.
Furthermore, the Duke Energy Registrants currently have energy efficiency riders in place to recover the cost of energy efficiency programs in North Carolina, South Carolina, Florida, Ohio and Kentucky. Should the Duke Energy Registrants be required to invest in conservation measures that result in reduced sales from effective conservation, regulatory lag in adjusting rates for the impact of these measures could have a negative financial impact.
The Duke Energy Registrants’ operating results may fluctuate on a seasonal and quarterly basis and can be negatively affected by changes in weather conditions and severe weather.
Electric power generation is generally a seasonal business. In most parts of the U.S., and other markets in which Duke Energy operates, demand for power peaks during the warmer summer months, with market prices typically peaking at that time. In other areas, demand for power peaks during the winter. Further, extreme weather conditions such as heat waves or winter storms could cause these seasonal fluctuations to be more pronounced. As a result, in the future, the overall operating results of the Duke Energy Registrants’ businesses may fluctuate substantially on a seasonal and quarterly basis and thus make period-to-period comparison less relevant.
Sustained severe drought conditions could impact generation by hydroelectric plants, as well as fossil and nuclear plant operations, as these facilities use water for cooling purposes and for the operation of environmental compliance equipment. Furthermore, destruction caused by severe weather events, such as hurricanes, tornadoes, severe thunderstorms, snow and ice storms, can result in lost operating revenues due to outages; property damage, including downed transmission and distribution lines; and additional and unexpected expenses to mitigate storm damage. The cost of storm restoration efforts may not be fully recoverable through the regulatory process.
23
PART I
The Duke Energy Registrants’ sales may decrease if they are unable to gain adequate, reliable and affordable access to transmission assets.
The Duke Energy Registrants depend on transmission and distribution facilities owned and operated by utilities and other energy companies to deliver electricity sold to the wholesale market. FERC’s power transmission regulations, as well as those of Duke Energy’s international markets, require wholesale electric transmission services to be offered on an open-access, non-discriminatory basis. If transmission is disrupted, or if transmission capacity is inadequate, the Duke Energy Registrants’ ability to sell and deliver products may be hindered.
The different regional power markets have changing regulatory structures, which could affect growth and performance in these regions. In addition, the ISOs who oversee the transmission systems in regional power markets have imposed in the past, and may impose in the future, price limitations and other mechanisms to address volatility in the power markets. These types of price limitations and other mechanisms may adversely impact the profitability of the Duke Energy Registrants’ wholesale power marketing business.
Fluctuations in commodity prices or availability may adversely affect various aspects of the Duke Energy Registrants’ operations as well as their financial condition, results of operations and cash flows.
The Duke Energy Registrants are exposed to the effects of market fluctuations in the price of natural gas, coal, fuel oil, nuclear fuel, electricity and other energy-related commodities as a result of their ownership of energy-related assets. Fuel costs are recovered primarily through cost-recovery clauses, subject to the approval of state utility commissions.
Additionally, the Duke Energy Registrants are exposed to risk that counterparties will not be able to fulfill their obligations. Disruption in the delivery of fuel, including disruptions as a result of, among other things, transportation delays, weather, labor relations,
force majeure
events, or environmental regulations affecting any of these fuel suppliers, could limit the Duke Energy Registrants to operate their facilities. Should counterparties fail to perform, the Duke Energy Registrants might be forced to replace the underlying commitment at prevailing market prices possibly resulting in losses in addition to the amounts, if any, already paid to the counterparties.
Certain of the Duke Energy Registrants’ hedge agreements may result in the receipt of, or posting of, derivative collateral with counterparties, depending on the daily derivative position. Fluctuations in commodity prices that lead to the return of collateral received and/or the posting of collateral with counterparties negatively impact liquidity. Downgrades in the Duke Energy Registrants’ credit ratings could lead to additional collateral posting requirements. The Duke Energy Registrants continually monitor derivative positions in relation to market price activity.
Potential terrorist activities or military or other actions could adversely affect the Duke Energy Registrants’ businesses.
The continued threat of terrorism and the impact of retaliatory military and other action by the U.S. and its allies may lead to increased political, economic and financial market instability and volatility in prices for natural gas and oil, which may have material adverse effects in ways the Duke Energy Registrants cannot predict at this time. In addition, future acts of terrorism and possible reprisals as a consequence of action by the U.S. and its allies could be directed against companies operating in the U.S. or their international affiliates. Information technology systems, transmission and distribution and generation facilities such as nuclear plants could be potential targets of terrorist activities or harmful activities by individuals or groups. The potential for terrorism has subjected the Duke Energy Registrants’ operations to increased risks and could have a material adverse effect on their businesses. In particular, the Duke Energy Registrants may experience increased capital and operating costs to implement increased security for their information technology systems, transmission and distribution and generation facilities, including nuclear power plants under the NRC’s design basis threat requirements. These increased costs could include additional physical plant security and security personnel or additional capability following a terrorist incident.
Cyberattacks and data security breaches could adversely affect the Duke Energy Registrants' businesses.
Information security risks have generally increased in recent years as a result of the proliferation of new technologies and the increased sophistication and frequency of cyberattacks and data security breaches. The utility industry requires the continued operation of sophisticated information technology systems and network infrastructure, which are part of an interconnected regional grid. Additionally, connectivity to the Internet continues to increase through smart grid and other initiatives. Because of the critical nature of the infrastructure, increased connectivity to the Internet and technology systems’ inherent vulnerability to disability or failures due to hacking, viruses, acts of war or terrorism or other types of data security breaches, the Duke Energy Registrants face a heightened risk of cyberattack. In the event of such an attack, the Duke Energy Registrants could (i) have business operations disrupted, property damaged, customer information stolen and other private information accessed (ii) experience substantial loss of revenues, repair and restoration costs, implementation costs for additional security measures to avert future cyberattacks and other financial loss, and (iii) be subject to increased regulation, litigation and reputational damage.
Failure to attract and retain an appropriately qualified workforce could unfavorably impact the Duke Energy Registrants’ results of operations.
Certain events, such as an aging workforce, mismatch of skill set or complement to future needs, or unavailability of contract resources may lead to operating challenges and increased costs. The challenges include lack of resources, loss of knowledge base and the lengthy time required for skill development. In this case, costs, including costs for contractors to replace employees, productivity costs and safety costs, may rise. Failure to hire and adequately train replacement employees, including the transfer of significant internal historical knowledge and expertise to new employees, or future availability and cost of contract labor may adversely affect the ability to manage and operate the business, especially considering the workforce needs associated with nuclear generation facilities and new skills required to operate a modernized, technology-enabled power grid. If the Duke Energy Registrants are unable to successfully attract and retain an appropriately qualified workforce, their financial position or results of operations could be negatively affected.
24
PART I
Duke Energy’s investments and projects located outside of the U.S. expose it to risks related to fluctuations in currency rates. These risks, and Duke Energy’s activities to mitigate such risks, may adversely affect its cash flows and results of operations.
Duke Energy’s operations and investments outside the U.S. expose it to risks related to fluctuations in currency rates. As each local currency’s value changes relative to the U.S. dollar, the value in U.S. dollars of Duke Energy’s assets and liabilities in such locality and the cash flows generated in such locality, expressed in U.S. dollars, also change. Duke Energy’s primary foreign currency rate exposure is to the Brazilian real.
Duke Energy selectively mitigates some risks associated with foreign currency fluctuations by, among other things, indexing contracts to the U.S. dollar and/or local inflation rates, hedging through debt denominated or issued in the foreign currency and hedging through foreign currency derivatives. These efforts, however, may not be effective and, in some cases, may expose Duke Energy to other risks that could negatively affect its cash flows and results of operations.
The costs of retiring Duke Energy Florida’s Crystal River Unit 3 could prove to be more extensive than is currently identified.
Costs to retire and decommission the plant could exceed estimates and, if not recoverable through the regulatory process, could adversely affect Duke Energy’s, Progress Energy’s and Duke Energy Florida’s financial condition, results of operations and cash flows.
Duke Energy Ohio’s and Duke Energy Indiana’s membership in an RTO presents risks that could have a material adverse effect on their results of operations, financial condition and cash flows.
The rules governing the various regional power markets may change, which could affect Duke Energy Ohio’s and Duke Energy Indiana’s costs and/or revenues. To the degree Duke Energy Ohio and Duke Energy Indiana incur significant additional fees and increased costs to participate in an RTO, their results of operations may be impacted. Duke Energy Ohio and Duke Energy Indiana may be allocated a portion of the cost of transmission facilities built by others due to changes in RTO transmission rate design. Duke Energy Ohio and Duke Energy Indiana may be required to expand their transmission system according to decisions made by an RTO rather than their own internal planning process. While RTO transmission rates were initially designed to be revenue neutral, various proposals and proceedings currently taking place by the FERC may cause transmission rates to change from time to time. In addition, RTOs have been developing rules associated with the allocation and methodology of assigning costs associated with improved transmission reliability, reduced transmission congestion and firm transmission rights that may have a financial impact on Duke Energy Ohio and Duke Energy Indiana.
As members of an RTO, Duke Energy Ohio and Duke Energy Indiana are subject to certain additional risks, including those associated with the allocation among RTO members, of losses caused by unreimbursed defaults of other participants in the RTO markets and those associated with complaint cases filed against an RTO that may seek refunds of revenues previously earned by RTO members.
Nuclear Generation Risks
Duke Energy Carolinas, Duke Energy Progress and Duke Energy Florida may incur substantial costs and liabilities due to their ownership and operation of nuclear generating facilities.
Ownership interest in and operation of nuclear stations by Duke Energy Carolinas, Duke Energy Progress and Duke Energy Florida subject them to various risks. These risks include, among other things: the potential harmful effects on the environment and human health resulting from the operation of nuclear facilities and the storage, handling and disposal of radioactive materials; limitations on the amounts and types of insurance commercially available to cover losses that might arise in connection with nuclear operations; and uncertainties with respect to the technological and financial aspects of decommissioning nuclear plants at the end of their licensed lives.
Ownership and operation of nuclear generation facilities requires compliance with licensing and safety-related requirements imposed by the NRC. In the event of non-compliance, the NRC may increase regulatory oversight, impose fines, and/or shut down a unit, depending upon its assessment of the severity of the situation. Revised security and safety requirements promulgated by the NRC, which could be prompted by, among other things, events within or outside of the control of Duke Energy Carolinas, Duke Energy Progress and Duke Energy Florida, such as a serious nuclear incident at a facility owned by a third party, could necessitate substantial capital and other expenditures, as well as assessments to cover third-party losses. In addition, if a serious nuclear incident were to occur, it could have a material adverse effect on the results of operations and financial condition and reputation of the Duke Energy Registrants.
Liquidity, Capital Requirements and Common Stock Risks
The Duke Energy Registrants rely on access to short-term borrowings and longer-term capital markets to finance their capital requirements and support their liquidity needs. Access to those markets can be adversely affected by a number of conditions, many of which are beyond the Duke Energy Registrants’ control.
The Duke Energy Registrants’ businesses are to a large degree financed through issuances of debt. The maturity and repayment profile of debt used to finance investments often does not correlate to cash flows from their assets. Accordingly, as a source of liquidity for capital requirements not satisfied by the cash flow from their operations and to fund investments originally financed through debt instruments with disparate maturities, the Duke Energy Registrants rely on access to short-term money markets as well as longer-term capital markets. The Subsidiary Registrants also rely on access to short-term intercompany borrowings. If the Duke Energy Registrants are not able to access capital at competitive rates or at all, the ability to finance their operations and implement their strategy and business plan as scheduled could be adversely affected. An inability to access capital may limit the Duke Energy Registrants’ ability to pursue improvements or acquisitions that they may otherwise rely on for future growth.
25
PART I
Market disruptions may increase the cost of borrowing or adversely affect the ability to access one or more financial markets. Such disruptions could include: economic downturns, the bankruptcy of an unrelated energy company, capital market conditions generally, market prices for electricity and gas, actual or threatened terrorist attacks, or the overall health of the energy industry. The availability of credit under Duke Energy’s Master Credit Facility depends upon the ability of the banks providing commitments under the facility to provide funds when their obligations to do so arise. Systematic risk of the banking system and the financial markets could prevent a bank from meeting its obligations under the facility agreement.
Duke Energy maintains a revolving credit facility to provide backup for its commercial paper program and letters of credit to support variable rate demand tax-exempt bonds that may be put to the Duke Energy Registrant issuer at the option of the holder. The facility includes borrowing sublimits for the Duke Energy Registrants, each of whom is a party to the credit facility, and financial covenants that limit the amount of debt that can be outstanding as a percentage of the total capital for the specific entity. Failure to maintain these covenants at a particular entity could preclude Duke Energy from issuing commercial paper or the Duke Energy Registrants from issuing letters of credit or borrowing under the Master Credit Facility.
The Duke Energy Registrants must meet credit quality standards and there is no assurance they will maintain investment grade credit ratings. If the Duke Energy Registrants are unable to maintain investment grade credit ratings, they would be required under credit agreements to provide collateral in the form of letters of credit or cash, which may materially adversely affect their liquidity.
Each of the Duke Energy Registrants’ senior long-term debt issuances is currently rated investment grade by various rating agencies. The Duke Energy Registrants cannot ensure their senior long-term debt will be rated investment grade in the future.
If the rating agencies were to rate the Duke Energy Registrants below investment grade, borrowing costs would increase, perhaps significantly. In addition, the potential pool of investors and funding sources would likely decrease. Further, if the short-term debt rating were to fall, access to the commercial paper market could be significantly limited.
A downgrade below investment grade could also require the posting of additional collateral in the form of letters of credit or cash under various credit, commodity and capacity agreements and trigger termination clauses in some interest rate derivative agreements, which would require cash payments. All of these events would likely reduce the Duke Energy Registrants’ liquidity and profitability and could have a material effect on their financial position, results of operations or cash flows.
Non-compliance with debt covenants or conditions could adversely affect the Duke Energy Registrants’ ability to execute future borrowings.
The Duke Energy Registrants’ debt and credit agreements contain various financial and other covenants. Failure to meet those covenants beyond applicable grace periods could result in accelerated due dates and/or termination of the agreements.
Market performance and other changes may decrease the value of the NDTF investments of Duke Energy Carolinas, Duke Energy Progress and Duke Energy Florida, which then could require significant additional funding.
Ownership and operation of nuclear generation facilities also requires the maintenance of funded trusts that are intended to pay for the decommissioning costs of the respective nuclear power plants. The performance of the capital markets affects the values of the assets held in trust to satisfy these future obligations. Duke Energy Carolinas, Duke Energy Progress and Duke Energy Florida have significant obligations in this area and hold significant assets in these trusts. These assets are subject to market fluctuations and will yield uncertain returns, which may fall below projected rates of return. Although a number of factors impact funding requirements, a decline in the market value of the assets may increase the funding requirements of the obligations for decommissioning nuclear plants. If Duke Energy Carolinas, Duke Energy Progress and Duke Energy Florida are unable to successfully manage their NDTF assets, their financial condition, results of operations and cash flows could be negatively affected.
Poor investment performance of the Duke Energy pension plan holdings and other factors impacting pension plan costs could unfavorably impact the Duke Energy Registrants’ liquidity and results of operations.
The costs of providing non-contributory defined benefit pension plans are dependent upon a number of factors, such as the rates of return on plan assets, discount rates, the level of interest rates used to measure the required minimum funding levels of the plans, future government regulation and required or voluntary contributions made to the plans. The Subsidiary Registrants are allocated their proportionate share of the cost and obligations related to these plans. Without sustained growth in the pension investments over time to increase the value of plan assets and, depending upon the other factors impacting costs as listed above, Duke Energy could be required to fund its plans with significant amounts of cash. Such cash funding obligations, and the Subsidiary Registrants’ proportionate share of such cash funding obligations, could have a material impact on the Duke Energy Registrants’ financial position, results of operations or cash flows.
ITEM 1B. UNRESOLVED STAFF COMMENTS
None.
26
PART I
ITEM 2. PROPERTIES
REGULATED UTILITIES
The following table provides information related to Regulated Utilities' electric generation stations as of
December 31, 2015
. The MW displayed in the table below are based on summer capacity.
|
Total MW
|
|
Owned MW
|
|
Ownership
|
|
||||
|
Facility
|
Plant Type
|
Primary Fuel
|
Location
|
Capacity
|
|
Capacity
|
|
Interest (%)
|
|
|
Duke Energy Carolinas
|
|||||||||
|
Oconee
|
Nuclear
|
Uranium
|
SC
|
2,554
|
|
2,554
|
|
100
|
|
|
McGuire
|
Nuclear
|
Uranium
|
NC
|
2,296
|
|
2,296
|
|
100
|
|
|
Catawba
(a)
|
Nuclear
|
Uranium
|
SC
|
2,290
|
|
441
|
|
19.25
|
|
|
Belews Creek
|
Fossil
|
Coal
|
NC
|
2,220
|
|
2,220
|
|
100
|
|
|
Marshall
|
Fossil
|
Coal
|
NC
|
2,078
|
|
2,078
|
|
100
|
|
|
J.E. Rogers
|
Fossil
|
Coal
|
NC
|
1,396
|
|
1,396
|
|
100
|
|
|
Lincoln Combustion Turbine (CT)
|
Fossil
|
Gas/Oil
|
NC
|
1,267
|
|
1,267
|
|
100
|
|
|
Allen
|
Fossil
|
Coal
|
NC
|
1,127
|
|
1,127
|
|
100
|
|
|
Rockingham CT
|
Fossil
|
Gas/Oil
|
NC
|
825
|
|
825
|
|
100
|
|
|
Buck CC
|
Fossil
|
Gas
|
NC
|
668
|
|
668
|
|
100
|
|
|
Dan River Combined Cycle (CC)
|
Fossil
|
Gas
|
NC
|
638
|
|
638
|
|
100
|
|
|
Mill Creek CT
|
Fossil
|
Gas/Oil
|
SC
|
596
|
|
596
|
|
100
|
|
|
W.S. Lee
|
Fossil
|
Gas
|
SC
|
170
|
|
170
|
|
100
|
|
|
W.S. Lee CT
|
Fossil
|
Gas/Oil
|
SC
|
82
|
|
82
|
|
100
|
|
|
Bad Creek
|
Hydro
|
Water
|
SC
|
1,360
|
|
1,360
|
|
100
|
|
|
Jocassee
|
Hydro
|
Water
|
SC
|
780
|
|
780
|
|
100
|
|
|
Cowans Ford
|
Hydro
|
Water
|
NC
|
325
|
|
325
|
|
100
|
|
|
Keowee
|
Hydro
|
Water
|
SC
|
152
|
|
152
|
|
100
|
|
|
Other small facilities (25 plants)
|
Hydro
|
Water
|
NC/SC
|
666
|
|
666
|
|
100
|
|
|
Distributed generation
|
Renewable
|
Solar
|
NC
|
4
|
|
4
|
|
100
|
|
|
Total Duke Energy Carolinas
|
21,494
|
|
19,645
|
|
|||||
|
Total MW
|
|
Owned MW
|
|
Ownership
|
|
||||
|
Facility
|
Plant Type
|
Primary Fuel
|
Location
|
Capacity
|
|
Capacity
|
|
Interest (%)
|
|
|
Duke Energy Progress
|
|||||||||
|
Brunswick
|
Nuclear
|
Uranium
|
NC
|
1,870
|
|
1,870
|
|
100
|
|
|
Harris
|
Nuclear
|
Uranium
|
NC
|
928
|
|
928
|
|
100
|
|
|
Robinson
|
Nuclear
|
Uranium
|
SC
|
741
|
|
741
|
|
100
|
|
|
Roxboro
|
Fossil
|
Coal
|
NC
|
2,439
|
|
2,439
|
|
100
|
|
|
Smith CC
|
Fossil
|
Gas/Oil
|
NC
|
1,088
|
|
1,088
|
|
100
|
|
|
H.F. Lee CC
|
Fossil
|
Gas/Oil
|
NC
|
910
|
|
910
|
|
100
|
|
|
Wayne County CT
|
Fossil
|
Gas/Oil
|
NC
|
863
|
|
863
|
|
100
|
|
|
Smith CT
|
Fossil
|
Gas/Oil
|
NC
|
780
|
|
780
|
|
100
|
|
|
Darlington CT
|
Fossil
|
Gas/Oil
|
SC
|
735
|
|
735
|
|
100
|
|
|
Mayo
|
Fossil
|
Coal
|
NC
|
727
|
|
727
|
|
100
|
|
|
L.V. Sutton CC
|
Fossil
|
Gas/Oil
|
NC
|
622
|
|
622
|
|
100
|
|
|
Asheville
|
Fossil
|
Coal
|
NC
|
376
|
|
376
|
|
100
|
|
|
Asheville CT
|
Fossil
|
Gas/Oil
|
NC
|
324
|
|
324
|
|
100
|
|
|
Weatherspoon CT
|
Fossil
|
Gas/Oil
|
NC
|
128
|
|
128
|
|
100
|
|
|
L.V. Sutton CT
|
Fossil
|
Gas/Oil
|
NC
|
61
|
|
61
|
|
100
|
|
|
Blewett CT
|
Fossil
|
Oil
|
NC
|
52
|
|
52
|
|
100
|
|
|
Walters
|
Hydro
|
Water
|
NC
|
112
|
|
112
|
|
100
|
|
|
Other small facilities (3 plants)
|
Hydro
|
Water
|
NC
|
115
|
|
115
|
|
100
|
|
|
Distributed generation
|
Renewable
|
Solar
|
NC
|
44
|
|
44
|
|
100
|
|
|
Total Duke Energy Progress
|
12,915
|
|
12,915
|
|
|||||
27
PART I
|
Total MW
|
|
Owned MW
|
|
Ownership
|
|
||||
|
Facility
|
Plant Type
|
Primary Fuel
|
Location
|
Capacity
|
|
Capacity
|
|
Interest (%)
|
|
|
Duke Energy Florida
|
|||||||||
|
Crystal River
|
Fossil
|
Coal
|
FL
|
2,291
|
|
2,291
|
|
100
|
|
|
Hines CC
|
Fossil
|
Gas/Oil
|
FL
|
1,912
|
|
1,912
|
|
100
|
|
|
Bartow CC
|
Fossil
|
Gas/Oil
|
FL
|
1,105
|
|
1,105
|
|
100
|
|
|
Anclote
|
Fossil
|
Gas
|
FL
|
1,041
|
|
1,041
|
|
100
|
|
|
Intercession City CT
(b)
|
Fossil
|
Gas/Oil
|
FL
|
984
|
|
984
|
|
(b)
|
|
|
DeBary CT
|
Fossil
|
Gas/Oil
|
FL
|
637
|
|
637
|
|
100
|
|
|
Tiger Bay CC
|
Fossil
|
Gas/Oil
|
FL
|
205
|
|
205
|
|
100
|
|
|
Bartow CT
|
Fossil
|
Gas/Oil
|
FL
|
175
|
|
175
|
|
100
|
|
|
Bayboro CT
|
Fossil
|
Oil
|
FL
|
174
|
|
174
|
|
100
|
|
|
Suwannee River CT
|
Fossil
|
Gas
|
FL
|
155
|
|
155
|
|
100
|
|
|
Suwannee River
|
Fossil
|
Gas/Oil
|
FL
|
128
|
|
128
|
|
100
|
|
|
Higgins CT
|
Fossil
|
Gas/Oil
|
FL
|
109
|
|
109
|
|
100
|
|
|
Turner CT
|
Fossil
|
Oil
|
FL
|
79
|
|
79
|
|
100
|
|
|
Avon Park CT
|
Fossil
|
Gas/Oil
|
FL
|
48
|
|
48
|
|
100
|
|
|
University of Florida CoGen CT
|
Fossil
|
Gas
|
FL
|
46
|
|
46
|
|
100
|
|
|
Rio Pinar CT
|
Fossil
|
Oil
|
FL
|
12
|
|
12
|
|
100
|
|
|
Total Duke Energy Florida
|
9,101
|
|
9,101
|
|
|||||
|
Total MW
|
|
Owned MW
|
|
Ownership
|
|
||||
|
Facility
|
Plant Type
|
Primary Fuel
|
Location
|
Capacity
|
|
Capacity
|
|
Interest (%)
|
|
|
Duke Energy Ohio
|
|||||||||
|
East Bend
|
Fossil
|
Coal
|
KY
|
600
|
|
600
|
|
100
|
|
|
Woodsdale CT
|
Fossil
|
Gas/Propane
|
OH
|
462
|
|
462
|
|
100
|
|
|
Total Duke Energy Ohio
|
1,062
|
|
1,062
|
|
|||||
|
Total MW
|
|
Owned MW
|
|
Ownership
|
|
||||
|
Facility
|
Plant Type
|
Primary Fuel
|
Location
|
Capacity
|
|
Capacity
|
|
Interest (%)
|
|
|
Duke Energy Indiana
|
|||||||||
|
Gibson
(c)
|
Fossil
|
Coal
|
IN
|
3,132
|
|
2,822
|
|
90.10
|
|
|
Cayuga
(d)
|
Fossil
|
Coal/Oil
|
IN
|
1,005
|
|
1,005
|
|
100
|
|
|
Wabash River
(e)
|
Fossil
|
Coal/Oil
|
IN
|
676
|
|
676
|
|
100
|
|
|
Edwardsport
|
Fossil
|
Coal
|
IN
|
595
|
|
595
|
|
100
|
|
|
Madison CT
|
Fossil
|
Gas
|
OH
|
576
|
|
576
|
|
100
|
|
|
Vermillion CT
(f)
|
Fossil
|
Gas
|
IN
|
568
|
|
355
|
|
62.50
|
|
|
Wheatland CT
|
Fossil
|
Gas
|
IN
|
460
|
|
460
|
|
100
|
|
|
Noblesville CC
|
Fossil
|
Gas/Oil
|
IN
|
285
|
|
285
|
|
100
|
|
|
Gallagher
|
Fossil
|
Coal
|
IN
|
280
|
|
280
|
|
100
|
|
|
Henry County CT
|
Fossil
|
Gas/Oil
|
IN
|
129
|
|
129
|
|
100
|
|
|
Cayuga CT
|
Fossil
|
Gas/Oil
|
IN
|
99
|
|
99
|
|
100
|
|
|
Connersville CT
|
Fossil
|
Oil
|
IN
|
86
|
|
86
|
|
100
|
|
|
Miami Wabash CT
|
Fossil
|
Oil
|
IN
|
80
|
|
80
|
|
100
|
|
|
Markland
|
Hydro
|
Water
|
IN
|
45
|
|
45
|
|
100
|
|
|
Total Duke Energy Indiana
|
8,016
|
|
7,493
|
|
|||||
28
PART I
|
Total MW
|
|
Owned MW
|
|
Ownership
|
||||
|
Facility
|
Plant Type
|
Primary Fuel
|
Location
|
Capacity
|
|
Capacity
|
|
Interest (%)
|
|
Total Regulated Utilities
|
52,588
|
|
50,216
|
|
||||
|
Totals By Plant Type
|
||||||||
|
Nuclear
|
10,679
|
|
8,830
|
|
||||
|
Fossil
|
38,306
|
|
37,783
|
|
||||
|
Hydro
|
3,555
|
|
3,555
|
|
||||
|
Renewable
|
48
|
|
48
|
|
||||
|
Total Regulated Utilities
|
52,588
|
|
50,216
|
|
||||
|
(a)
|
Jointly owned with North Carolina Municipal Power Agency Number 1, North Carolina Electric Membership Corporation and Piedmont Municipal Power Agency.
|
|
(b)
|
Duke Energy Florida owns and operates Intercession City Station Units 1-10 and 12-14. Unit 11 is jointly owned with Georgia Power Company (GPC). GPC has the exclusive right to the output of this unit during the months of June through September. Duke Energy Florida has the exclusive right to the output of this unit for the remainder of the year. Duke Energy Florida has executed an agreement to purchase Georgia Power Company's interest in these facilities.
|
|
(c)
|
Duke Energy Indiana owns and operates Gibson Station Units 1-4 and owns 50.05 percent of, and operates, unit 5. Unit 5 is jointly owned with Wabash Valley Power Association, Inc. and Indiana Municipal Power Agency.
|
(d) Includes Cayuga Internal Combustion (IC).
(e) Includes Wabash River IC.
(f) Jointly owned with Wabash Valley Power Association.
The following table provides information related to Regulated Utilities' electric transmission and distribution properties as of
December 31, 2015
.
|
Duke
|
|
Duke
|
|
Duke
|
|
Duke
|
|
Duke
|
|
Duke
|
|
|
|
Energy
|
|
Energy
|
|
Energy
|
|
Energy
|
|
Energy
|
|
Energy
|
|
|
|
Carolinas
|
|
Progress
|
|
Florida
|
|
Ohio
|
|
Indiana
|
|
Utilities
|
|
|
|
Electric Transmission Lines
|
||||||||||||
|
Miles of 500 to 525 Kilovolt (kV)
|
600
|
|
300
|
|
200
|
|
—
|
|
—
|
|
1,100
|
|
|
Miles of 345 kV
|
—
|
|
—
|
|
—
|
|
1,000
|
|
700
|
|
1,700
|
|
|
Miles of 230 kV
|
2,600
|
|
3,400
|
|
1,700
|
|
—
|
|
700
|
|
8,400
|
|
|
Miles of 100 to 161 kV
|
6,800
|
|
2,600
|
|
1,000
|
|
700
|
|
1,400
|
|
12,500
|
|
|
Miles of 13 to 69 kV
|
3,100
|
|
—
|
|
2,300
|
|
700
|
|
2,500
|
|
8,600
|
|
|
Total conductor miles of electric transmission lines
|
13,100
|
|
6,300
|
|
5,200
|
|
2,400
|
|
5,300
|
|
32,300
|
|
|
Electric Distribution Lines
|
||||||||||||
|
Miles of overhead lines
|
66,600
|
|
44,100
|
|
24,200
|
|
13,800
|
|
22,400
|
|
171,100
|
|
|
Miles of underground line
|
36,500
|
|
23,700
|
|
18,200
|
|
5,800
|
|
8,600
|
|
92,800
|
|
|
Total conductor miles of electric distribution lines
|
103,100
|
|
67,800
|
|
42,400
|
|
19,600
|
|
31,000
|
|
263,900
|
|
|
Number of electric transmission and distribution substations
|
1,500
|
|
500
|
|
500
|
|
300
|
|
500
|
|
3,300
|
|
|
Miles of gas mains
|
—
|
|
—
|
|
—
|
|
7,200
|
|
—
|
|
7,200
|
|
|
Miles of gas service lines
|
—
|
|
—
|
|
—
|
|
5,800
|
|
—
|
|
5,800
|
|
Substantially all of Regulated Utilities' electric plant in service is mortgaged under indentures relating to Duke Energy Carolinas’, Duke Energy Progress', Duke Energy Florida's, Duke Energy Ohio’s and Duke Energy Indiana’s various series of First Mortgage Bonds.
29
PART I
INTERNATIONAL ENERGY
The following table provides additional information related to International Energy’s electric generation stations as of
December 31, 2015
. The MW displayed in the table below are based on summer capacity.
|
Total MW
|
|
Owned MW
|
|
Ownership
|
|
|||
|
Primary Fuel
|
Location
|
Capacity
|
|
Capacity
|
|
Interest (%)
|
|
|
|
DEI Brazil
|
Water
|
Brazil
|
2,274
|
|
2,087
|
|
92
|
|
|
DEI Argentina
|
Water/Gas
|
Argentina
|
576
|
|
523
|
|
91
|
|
|
DEI Peru – Egenor
|
Water
|
Peru
|
352
|
|
352
|
|
100
|
|
|
DEI Peru – Aguaytia
|
Gas
|
Peru
|
192
|
|
192
|
|
100
|
|
|
DEI Chile
|
Water/Diesel
|
Chile
|
362
|
|
362
|
|
100
|
|
|
DEI Guatemala
|
Oil/Diesel/Coal
|
Guatemala
|
361
|
|
361
|
|
100
|
|
|
DEI El Salvador
|
Oil/Diesel
|
El Salvador
|
324
|
|
293
|
|
90
|
|
|
DEI Ecuador
|
Diesel
|
Ecuador
|
192
|
|
163
|
|
85
|
|
|
Total International Energy
|
4,633
|
|
4,333
|
|
||||
International Energy also owns a 25 percent equity interest in NMC. In 2015, NMC produced approximately 890,000 metric tons of methanol and approximately 1.0 million metric tons of MTBE. Approximately 40 percent of methanol is normally used in the MTBE production.
30
PART I
COMMERCIAL PORTFOLIO
The following table provides information related to Commercial Portfolio’s electric generation facilities as of
December 31, 2015
. The MW displayed in the table below are based on summer capacity.
|
Total MW
|
|
Owned MW
|
|
Ownership
|
|
||||
|
Facility
|
Plant Type
|
Primary Fuel
|
Location
|
Capacity
|
|
Capacity
|
|
Interest (%)
|
|
|
Duke Energy Renewables – Wind
|
|||||||||
|
Los Vientos Windpower
|
Renewable
|
Wind
|
TX
|
712
|
|
712
|
|
100
|
|
|
Top of the World
|
Renewable
|
Wind
|
WY
|
200
|
|
200
|
|
100
|
|
|
Notrees
|
Renewable
|
Wind
|
TX
|
153
|
|
153
|
|
100
|
|
|
Campbell Hill
|
Renewable
|
Wind
|
WY
|
99
|
|
99
|
|
100
|
|
|
North Allegheny
|
Renewable
|
Wind
|
PA
|
70
|
|
70
|
|
100
|
|
|
Laurel Hill Wind Energy
|
Renewable
|
Wind
|
PA
|
69
|
|
69
|
|
100
|
|
|
Ocotillo
|
Renewable
|
Wind
|
TX
|
59
|
|
59
|
|
100
|
|
|
Kit Carson
|
Renewable
|
Wind
|
CO
|
51
|
|
51
|
|
100
|
|
|
Silver Sage
|
Renewable
|
Wind
|
WY
|
42
|
|
42
|
|
100
|
|
|
Happy Jack
|
Renewable
|
Wind
|
WY
|
29
|
|
29
|
|
100
|
|
|
Shirley
|
Renewable
|
Wind
|
WI
|
20
|
|
20
|
|
100
|
|
|
Sweetwater I
|
Renewable
|
Wind
|
TX
|
38
|
|
19
|
|
50
|
|
|
Sweetwater II
|
Renewable
|
Wind
|
TX
|
91
|
|
45
|
|
50
|
|
|
Sweetwater III
|
Renewable
|
Wind
|
TX
|
135
|
|
67
|
|
50
|
|
|
Sweetwater IV
|
Renewable
|
Wind
|
TX
|
241
|
|
113
|
|
47
|
|
|
Sweetwater V
|
Renewable
|
Wind
|
TX
|
80
|
|
38
|
|
47
|
|
|
Ironwood
|
Renewable
|
Wind
|
KS
|
168
|
|
84
|
|
50
|
|
|
Cimarron II
|
Renewable
|
Wind
|
KS
|
131
|
|
66
|
|
50
|
|
|
Mesquite Creek
|
Renewable
|
Wind
|
TX
|
211
|
|
106
|
|
50
|
|
|
Total Renewables – Wind
|
2,599
|
|
2,042
|
|
|||||
|
Duke Energy Renewables – Solar
|
|||||||||
|
Conetoe II
|
Renewable
|
Solar
|
NC
|
80
|
|
80
|
|
100
|
|
|
Seville
|
Renewable
|
Solar
|
CA
|
50
|
|
50
|
|
100
|
|
|
Kelford
|
Renewable
|
Solar
|
NC
|
22
|
|
22
|
|
100
|
|
|
Highlander
|
Renewable
|
Solar
|
CA
|
21
|
|
21
|
|
100
|
|
|
Dogwood
|
Renewable
|
Solar
|
NC
|
20
|
|
20
|
|
100
|
|
|
Halifax Airport
|
Renewable
|
Solar
|
NC
|
20
|
|
20
|
|
100
|
|
|
Pasquotank
|
Renewable
|
Solar
|
NC
|
20
|
|
20
|
|
100
|
|
|
Pumpjack
|
Renewable
|
Solar
|
CA
|
20
|
|
20
|
|
100
|
|
|
Wildwood
|
Renewable
|
Solar
|
CA
|
20
|
|
20
|
|
100
|
|
|
Shawboro
|
Renewable
|
Solar
|
NC
|
20
|
|
20
|
|
100
|
|
|
Bagdad
|
Renewable
|
Solar
|
AZ
|
15
|
|
15
|
|
100
|
|
|
TX Solar
|
Renewable
|
Solar
|
TX
|
14
|
|
14
|
|
100
|
|
|
Creswell Alligood
|
Renewable
|
Solar
|
NC
|
14
|
|
14
|
|
100
|
|
|
Washington White Post
|
Renewable
|
Solar
|
NC
|
12
|
|
12
|
|
100
|
|
|
Whitakers
|
Renewable
|
Solar
|
NC
|
12
|
|
12
|
|
100
|
|
|
Other small solar
|
Renewable
|
Solar
|
Various
|
79
|
|
79
|
|
100
|
|
|
Total Renewables – Solar
|
439
|
|
439
|
|
|||||
|
Total Commercial Portfolio
|
3,038
|
|
2,481
|
|
|||||
OTHER
Duke Energy owns approximately 5.2 million square feet and leases 2.9 million square feet of corporate, regional and district office space spread throughout its service territories and in Houston, Texas.
ITEM 3. LEGAL PROCEEDINGS
For information regarding legal proceedings, including regulatory and environmental matters, see Note
4
, “Regulatory Matters,” and Note
5
, “Commitments and Contingencies,” to the Consolidated Financial Statements.
31
Virginia Department of Environmental Quality Civil Enforcement
In June 2015, the Virginia State Water Control Board voted to approve a consent order to resolve the civil enforcement claim of the Virginia Department of Environmental Quality (VDEQ) against Duke Energy Carolinas related to the February 2014 Dan River coal ash release. Pursuant to the terms of the $2.5 million settlement, Duke Energy Carolinas is required to perform $2.25 million of environmental projects that benefit Virginia communities and fund an additional $250,000 for VDEQ to respond to environmental emergencies. Failure to perform sufficient environmental projects will require Duke Energy Carolinas to make a cash payment in the amount of the shortfall.
MTBE Litigation
On June 29, 2007, the New Jersey Department of Environmental Protection (NJDEP) filed suit against, among others, Duke Energy Merchants (DEM), alleging contamination of “waters of the state” by MTBE from leaking gasoline storage tanks. MTBE is a gasoline additive intended to increase the oxygen level in gasoline and make it burn cleaner. The case was moved to federal court and consolidated in an existing multidistrict litigation docket of pending MTBE cases. DEM and NJDEP have reached an agreement in principle to settle the case for a payment by DEM of $1.7 million. On February 19, 2016, the Court approved a Consent Decree executed by the parties which settles the case.
DEM is also a defendant in a similar case filed by the Commonwealth of Pennsylvania on June 19, 2014. That case has also been moved to the consolidated multidistrict proceeding. Discovery in this case continues.
Brazilian Transmission Fee Assessments
On July 16, 2008, Duke Energy International Geracao Paranapanema S.A. (DEIGP) filed a lawsuit in the Brazilian federal court challenging transmission fee assessments imposed under two new resolutions promulgated by the Brazilian electricity regulatory agency (ANEEL) (collectively, the Resolutions). The Resolutions purport to impose additional transmission fees on generation companies located in the State of Sao Paulo for utilization of the electric transmission system. The fees were retroactive to July 1, 2004, and effective through June 30, 2009. DEIGP's original assessment under these Resolutions amounts to approximately $43 million inclusive of interest through December 2015. Pending resolution of this dispute on the merits, DEIGP deposited the disputed portion, approximately $15 million, of the assessment into a court-monitored escrow, and paid the undisputed portion to the distribution companies. In a decision published on October 2, 2013, the trial court affirmed an additional fine imposed by ANEEL in the amount of approximately $7 million for DEIGP’s failure to pay the disputed portion of the assessment. The $7 million was also deposited into a court-monitored escrow. In December 2014, the trial court ruled in favor of DEIGP on the merits of the original assessment. The merits of the original assessment and fine, as well as the contradiction between the trial court's ruling in favor of DEIGP on the original assessment but against DEIGP on its alleged failure to timely pay that assessment are being addressed on appeal.
Brazilian Regulatory Citations
In September 2007, the State Environmental Agency of Parana (IAP) assessed seven fines against DEIGP for failure to comply with reforestation measures allegedly required by state regulations in Brazil. DEIGP has challenged the fines in administrative and judicial proceedings. Two of the seven fines have subsequently been dismissed or otherwise resolved in favor of DEIGP. A third fine was determined legitimate by the trial court, but is under appeal. The remaining fines are pending. The total current amount of the IAP fines is approximately $10 million.
Additionally, DEIGP was assessed three fines by Brazil Institute of Environment and Renewable Natural Resources (IBAMA) for improper maintenance of existing reforested areas. One of these fines was determined legitimate by the trial court and is under appeal. The others are pending. The total current IBAMA assessment is approximately $400,000. DEIGP believes that it has properly maintained all reforested areas and has challenged the IBAMA assessments.
This is not applicable for any of the Duke Energy Registrants.
32
PART II
The common stock of Duke Energy is listed and traded on the NYSE (ticker symbol DUK). As of January 31,
2016
, there were 166,231 Duke Energy common stockholders of record.
There is no market for common stock of the Subsidiary Registrants, all of which is owned by Duke Energy.
Common Stock Data by Quarter
The following chart provides Duke Energy common stock trading prices as reported on the New York Stock Exchange and information on common stock dividends declared. Stock prices represent the intra-day high and low stock price.
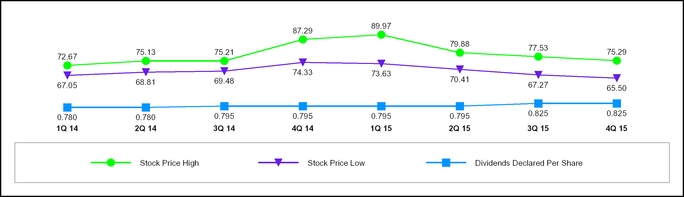
Duke Energy expects to continue its policy of paying regular cash dividends; however, there is no assurance as to the amount of future dividends as they depend on future earnings, capital requirements, and financial condition, and are subject to declaration by the Duke Energy Board of Directors.
Duke Energy’s operating subsidiaries have certain restrictions on their ability to transfer funds in the form of dividends or loans to Duke Energy. See Note
4
to the Consolidated Financial Statements, “Regulatory Matters” for further information regarding these restrictions.
Securities Authorized for Issuance Under Equity Compensation Plans
Duke Energy will provide information that is responsive to this Item 5 in its definitive proxy statement or in an amendment to this annual report not later than 120 days after the end of the fiscal year covered by this annual report, in either case under the caption “Security Ownership of Certain Beneficial Owners and Management and Related Stockholder Matters,” and possibly elsewhere therein. That information is incorporated in this Item 5 by reference.
Issuer Purchases of Equity Securities for Fourth Quarter 2015
There were no repurchases of equity securities during the fourth quarter of 2015.
33
PART II
Stock Performance Graph
The following performance graph compares the cumulative total shareholder return from Duke Energy Corporation common stock, as compared with the Standard & Poor's 500 Stock Index (S&P 500) and the Philadelphia Utility Sector Index (Philadelphia Utility Index) for the past five years. The graph assumes an initial investment of $100 on December 31, 2010, in Duke Energy common stock, in the S&P 500 and in the Philadelphia Utility Index and that all dividends were reinvested. The stockholder return shown below for the five-year historical period may not be indicative of future performance.

NYSE CEO Certification
Duke Energy has filed the certification of its Chief Executive Officer and Chief Financial Officer pursuant to Section 302 of the Sarbanes-Oxley Act of 2002 as exhibits to this Annual Report on Form 10-K for the year ended
December 31, 2015
.
34
PART II
The following table provides selected financial data for the years of 2011 through 2015.
|
(in millions, except per share amounts)
|
2015
|
|
2014
|
|
2013
|
|
2012
|
|
2011
|
|
|||||||||
|
|
|||||||||||||||||||
|
Total operating revenues
|
$
|
23,459
|
|
$
|
23,925
|
|
$
|
22,756
|
|
$
|
17,912
|
|
$
|
12,412
|
|
||||
|
Operating income
|
5,367
|
|
5,258
|
|
4,854
|
|
2,911
|
|
2,475
|
|
|||||||||
|
Income from continuing operations
|
2,811
|
|
2,465
|
|
2,590
|
|
1,611
|
|
1,508
|
|
|||||||||
|
Income (loss) from discontinued operations, net of tax
|
20
|
|
(576
|
)
|
86
|
|
171
|
|
206
|
|
|||||||||
|
Net income
|
2,831
|
|
1,889
|
|
2,676
|
|
1,782
|
|
1,714
|
|
|||||||||
|
Net income attributable to Duke Energy Corporation
|
2,816
|
|
1,883
|
|
2,665
|
|
1,768
|
|
1,706
|
|
|||||||||
|
Common Stock Data
|
|||||||||||||||||||
|
Income from continuing operations attributable to Duke Energy Corporation common stockholders
(b)
|
|||||||||||||||||||
|
Basic
|
$
|
4.02
|
|
$
|
3.46
|
|
$
|
3.64
|
|
$
|
2.77
|
|
$
|
3.34
|
|
||||
|
Diluted
|
4.02
|
|
3.46
|
|
3.63
|
|
2.77
|
|
3.34
|
|
|||||||||
|
Income (loss) from discontinued operations attributable to Duke Energy Corporation common stockholders
(b)
|
|||||||||||||||||||
|
Basic
|
$
|
0.03
|
|
$
|
(0.80
|
)
|
$
|
0.13
|
|
$
|
0.30
|
|
$
|
0.49
|
|
||||
|
Diluted
|
0.03
|
|
(0.80
|
)
|
0.13
|
|
0.30
|
|
0.49
|
|
|||||||||
|
Net income attributable to Duke Energy Corporation common stockholders
(b)
|
|||||||||||||||||||
|
Basic
|
$
|
4.05
|
|
$
|
2.66
|
|
$
|
3.77
|
|
$
|
3.07
|
|
$
|
3.83
|
|
||||
|
Diluted
|
4.05
|
|
2.66
|
|
3.76
|
|
3.07
|
|
3.83
|
|
|||||||||
|
Dividends declared per share of common stock
(b)
|
3.24
|
|
3.15
|
|
3.09
|
|
3.03
|
|
2.97
|
|
|||||||||
|
|
|||||||||||||||||||
|
Total assets
(c)
|
$
|
120,976
|
|
$
|
120,557
|
|
$
|
114,779
|
|
$
|
113,856
|
|
$
|
62,526
|
|
||||
|
Long-term debt including capital leases and redeemable preferred stock of subsidiaries, less current maturities
(c)
|
37,495
|
|
37,061
|
|
38,152
|
|
36,444
|
|
18,679
|
|
|||||||||
|
(a)
|
Significant transactions reflected in the results above include: (i) 2014 impairment of the Disposal Group (see Note
2
to the Consolidated Financial Statements, "Acquisitions and Dispositions"); (ii) 2014 incremental tax expense resulting from the decision to repatriate all cumulative historical undistributed foreign earnings (see Note
22
to the Consolidated Financial Statements, "Income Taxes"); (iii) 2014 increase in the litigation reserve related to the criminal investigation of the Dan River coal ash release (see Note
5
to the Consolidated Financial Statements, “Commitments and Contingencies”); (iv) 2013 charges related to Crystal River Unit 3 and nuclear development costs (see Note
4
to the Consolidated Financial Statements, "Regulatory Matters"); (v) the 2012 merger with Progress Energy; (vi) costs to achieve mergers in 2015, 2014, 2013, 2012 and 2011; and (vii) 2012 and 2011 pretax impairment and other charges related to the Edwardsport Integrated Gasification Combined Cycle (IGCC) project of $628 million and $222 million, respectively.
|
|
(b)
|
On July 2, 2012, immediately prior to the merger with Progress Energy, Duke Energy executed a one-for-three reverse stock split. All share and earnings per share amounts are presented as if the one-for-three reverse stock split had been effective at the beginning of the earliest period presented.
|
|
(c)
|
During 2015, Duke Energy adopted new accounting guidance related to the presentation of debt issuance costs on the balance sheet. As a result of the adoption, Total Assets and Long-term debt including capital leases and redeemable preferred stock of subsidiaries, less current maturities were recasted to conform to the new presentation. The impact to 2013, 2012 and 2011 was not material. See Note 1 to the Consolidated Financial Statements, "Summary of Significant Accounting Policies," for additional information related the new accounting standard.
|
35
PART II
Management’s Discussion and Analysis includes financial information prepared in accordance with generally accepted accounting principles (GAAP) in the United States (U.S.), as well as certain non-GAAP financial measures such as adjusted earnings, adjusted earnings per share and adjusted segment income, discussed below. Generally, a non-GAAP financial measure is a numerical measure of financial performance, financial position or cash flows that excludes (or includes) amounts that are included in (or excluded from) the most directly comparable measure calculated and presented in accordance with GAAP. The non-GAAP financial measures should be viewed as a supplement to, and not a substitute for, financial measures presented in accordance with GAAP. Non-GAAP measures as presented herein may not be comparable to similarly titled measures used by other companies.
The following combined Management’s Discussion and Analysis of Financial Condition and Results of Operations is separately filed by Duke Energy Corporation (collectively with its subsidiaries, Duke Energy) and its subsidiaries Duke Energy Carolinas, LLC (Duke Energy Carolinas), Progress Energy, Inc. (Progress Energy), Duke Energy Progress, LLC (formerly Duke Energy Progress, Inc.) (Duke Energy Progress), Duke Energy Florida, LLC (formerly Duke Energy Florida, Inc.) (Duke Energy Florida), Duke Energy Ohio, Inc. (Duke Energy Ohio) and Duke Energy Indiana, LLC (formerly Duke Energy Indiana, Inc.) (Duke Energy Indiana) (collectively referred to as the Subsidiary Registrants). However, none of the registrants makes any representation as to information related solely to Duke Energy or the Subsidiary Registrants of Duke Energy other than itself.
DUKE ENERGY
Duke Energy is an energy company headquartered in Charlotte, North Carolina. Duke Energy operates in the U.S. primarily through its wholly owned subsidiaries, Duke Energy Carolinas, Duke Energy Progress, Duke Energy Florida, Duke Energy Ohio, and Duke Energy Indiana, as well as in Latin America.
When discussing Duke Energy’s consolidated financial information, it necessarily includes the results of the Subsidiary Registrants, which, along with Duke Energy, are collectively referred to as the Duke Energy Registrants.
Management’s Discussion and Analysis should be read in conjunction with the Consolidated Financial Statements and Notes for the years ended December 31,
2015
,
2014
and
2013
.
Executive Overview
Acquisition of Piedmont Natural Gas
On October 24, 2015, Duke Energy entered into an Agreement and Plan of Merger (Merger Agreement) with Piedmont Natural Gas Company, Inc., (Piedmont) a North Carolina corporation. Under the terms of the Merger Agreement, Duke Energy will acquire Piedmont for approximately $4.9 billion in cash. Upon closing, Piedmont will become a wholly owned subsidiary of Duke Energy.
Pursuant to the Merger Agreement, upon the closing of the merger, each share of Piedmont common stock issued and outstanding immediately prior to the closing will be converted automatically into the right to receive $60 in cash per share. In addition, Duke Energy will assume Piedmont's existing debt, which was approximately $1.9 billion at October 31, 2015, the end of Piedmont's most recent fiscal year. Duke Energy expects to finance the transaction with a combination of debt, between $500 million and $750 million of newly issued equity and other cash sources.
In connection with the Merger Agreement with Piedmont, Duke Energy entered into a $4.9 billion senior unsecured bridge financing facility (Bridge Facility) with Barclays Capital, Inc. (Barclays). The Bridge Facility, if drawn upon, may be used to (i) fund the cash consideration for the transaction and (ii) pay certain fees and expenses in connection with the transaction. In November 2015, Barclays syndicated its commitment under the Bridge Facility to a broader group of lenders. Duke Energy intends to finance the transaction with proceeds raised through the issuance of debt, equity and other sources as noted above and, therefore, does not expect to draw upon the Bridge Facility.
The Federal Trade Commission (FTC) has granted early termination of the 30-day waiting period under the federal Hart-Scott-Rodino Antitrust Improvements Act of 1976. On January 22, 2016, shareholders of Piedmont Natural Gas approved the company's acquisition by Duke Energy. On January 15, 2016, Duke Energy filed for approval of the transaction and associated financing requests with the NCUC. On January 29, 2016, the NCUC approved the financing requests. On January 15, 2016, Duke Energy and Piedmont filed a joint request with the Tennessee Regulatory Authority for approval of a change in control of Piedmont that will result from Duke Energy's acquisition of Piedmont. In that request, Duke Energy and Piedmont requested that the Authority approve the change in control on or before April 30, 2016. Subject to receipt of required regulatory approvals and meeting closing conditions, Duke Energy and Piedmont target a closing by the end of 2016.
On December 11, 2015, Duke Energy Kentucky filed a declaratory request with the KPSC seeking a finding that the transaction does not constitute a change in control of Duke Energy Kentucky requiring KPSC approval. Duke Energy also presented the transaction for information before the PSCSC on January 13, 2016.
The Merger Agreement contains certain termination rights for both Duke Energy and Piedmont, and provides that, upon termination of the Merger Agreement under specified circumstances, Duke Energy would be required to pay a termination fee of $250 million to Piedmont and Piedmont would be required to pay Duke Energy a termination fee of $125 million.
See Note 4 to the Consolidated Financial Statements, Regulatory Matters," for additional information regarding Duke Energy and Piedmont's joint investment in Atlantic Coast Pipeline, LLC.
36
PART II
Midwest Generation Exit
Duke Energy, through indirect subsidiaries, completed the sale of the nonregulated Midwest generation business and Duke Energy Retail Sales LLC (collectively, the Disposal Group) to a subsidiary of Dynegy on April 2, 2015, for approximately $2.8 billion in cash. Refer to Note 2 to the Consolidated Financial Statements, “Acquisitions and Dispositions,” for additional information on this transaction.
Accelerated Stock Repurchase Program
On April 6, 2015, Duke Energy entered into agreements with each of Goldman, Sachs & Co. and JPMorgan Chase Bank, National Association (the Dealers) to repurchase a total of $1.5 billion of Duke Energy common stock under an accelerated stock repurchase program (the ASR). Duke Energy made payments of $750 million to each of the Dealers and was delivered 16.6 million shares, with a total fair value of $1.275 billion, which represented approximately 85 percent of the total number of shares of Duke Energy common stock expected to be repurchased under the ASR. The $225 million unsettled portion met the criteria to be accounted for as a forward contract indexed to Duke Energy's stock and qualified as an equity instrument. The company recorded the $1.5 billion payment as a reduction to common stock as of April 6, 2015. In June 2015, the Dealers delivered 3.2 million additional shares to Duke Energy to complete the ASR. Approximately 19.8 million shares, in total, were delivered to Duke Energy and retired under the ASR at an average price of $75.75 per share. The final number of shares repurchased was based upon the average of the daily volume weighted average stock prices of Duke Energy’s common stock during the term of the program, less a discount.
For additional information on the details of this transaction, see Note
18
to the Consolidated Financial Statements, “Common Stock.”
Financial Results


|
(a)
|
See Results of Operations below for Duke Energy’s definition of adjusted earnings and adjusted diluted earnings per share as well as a reconciliation of this non-GAAP financial measure to net income attributable to Duke Energy and net income attributable to Duke Energy per diluted share.
|
Adjusted earnings decreased from 2014 to 2015 primarily due to lower earnings at International Energy as a result of unfavorable hydrology and changes in foreign currency exchange rates, partially offset by improved earnings at Regulated Utilities from improved retail pricing and wholesale margins net of higher operations and maintenance expense.
Adjusted earnings increased from 2013 to 2014 primarily due to the impact of revised rates and favorable weather, partially offset by higher depreciation and amortization expense.
See “Results of Operations” below for a detailed discussion of the consolidated results of operations, as well as a detailed discussion of financial results for each of Duke Energy’s reportable business segments, as well as Other.
2015
Areas of Focus and Accomplishments
In 2015, Duke Energy advanced a number of important strategic initiatives to transform the energy future with a focus on customers, employees, operations and growth. Duke Energy announced the acquisition of Piedmont, completed the purchase of North Carolina Eastern Municipal Power Agency's (NCEMPA) generation assets, completed the sale of the nonregulated Midwest Generation business and executed on the coal ash strategy to continue moving towards ash basin closures. Duke Energy also accomplished industry-leading safety and environmental performance and increased the growth rate of the dividend, a significant component of the investor value proposition.
Acquisition of Piedmont Natural Gas.
In 2015, Duke Energy entered into a Merger Agreement with Piedmont, under which Duke Energy will acquire Piedmont for $4.9 billion in cash. This acquisition reflects the growing importance of natural gas to the future of the energy infrastructure within the company's service territory, and throughout the U.S., and establishes a platform for future growth in natural gas infrastructure.
37
PART II
Purchase of NCEMPA's Generation.
In 2015, Duke Energy completed the acquisition of NCEMPA's ownership interest in some of Duke Energy Progress’s existing nuclear and coal generation for a total amount of approximately $1.25 billion. Duke Energy and NCEMPA signed a long-term wholesale contract to provide power to NCEMPA's customers previously served by the generation assets purchased by Duke Energy.
Sale of the Midwest Generation Business.
In 2015, Duke Energy completed the sale of the Disposal Group to Dynegy for approximately $2.8 billion. This decision supports Duke Energy’s strategy to focus investments on businesses with more predictable and less volatile earnings. The proceeds from the sale were used, in part, to recapitalize Duke Energy through a stock repurchase program and deferrals of the issuance of long-term debt.
Operational Excellence of the Nuclear Fleet.
Duke Energy’s nuclear fleet set a company record for total electricity production and demonstrated a combined capacity factor at approximately 94 percent, the 17th consecutive year above 90 percent on this plant reliability measure.
Coal Ash Management.
On April 17, 2015, the EPA published the RCRA in the Federal Register, establishing rules to regulate the disposal of CCR from electric utilities as solid waste. The RCRA, and the Coal Ash Act, as amended, finalized the legal framework related to coal ash management practices and ash basin closure. With final rules in place, Duke Energy has made significant progress toward closure of coal ash basins and has recommended excavation of 24 basins in the Carolinas. In addition, Duke Energy has performed comprehensive groundwater studies at each North Carolina basin and provided that information to the North Carolina Department of Environmental Quality (NCDEQ), which was used by NCDEQ to risk-rank each North Carolina basin. These draft risk rankings provide additional direction for the closure of each basin.
Also in 2015, Duke Energy began closure activities on the four sites specified as high risk by the Coal Ash Act and at the W.S. Lee site in South Carolina. At each site, excavation has commenced, with coal ash moving off-site for use in structural fill or to lined landfills.
Deliver Merger Benefits.
Duke Energy continues to focus on realizing benefits of the merger with Progress Energy. Duke Energy is on track to achieve the $687 million of guaranteed savings for customers in the Carolinas over five years. After three and a half years, Duke Energy Carolinas and Duke Energy Progress have generated approximately 90 percent of the guaranteed fuel and joint dispatch savings.
Grow the Dividend.
In 2015, Duke Energy increased the growth rate of the dividend to an annual rate of approximately 4 percent.
Duke Energy Objectives – 2016 and Beyond
Duke Energy will continue to deliver exceptional value to our customers, be an integral part of the communities in which we do business, and provide attractive returns to our investors. Duke Energy is committed to lead the way to cleaner, smarter energy solutions that customers value through a strategy focused on:
|
•
|
Transformation of the customer experience to meet the changing customer expectations through enhanced convenience, control and choice in energy supply and usage.
|
|
•
|
Modernization of the power grid to improve reliability and flexibility in support of increased distributed energy sources.
|
|
•
|
Generation of cleaner energy through an increased amount of natural gas, renewables generation and the continued safe and reliable operation of nuclear plants.
|
|
•
|
Operational excellence through engagement with employees and being one of the best safety performers in the industry.
|
|
•
|
Stakeholder engagement to ensure the regulatory rules in the states in which we operate benefit all customers.
|
Primary objectives toward the implementation of this strategy include:
Complete the Acquisition of Piedmont.
As discussed above, Duke Energy will continue to pursue the remaining required regulatory approvals to achieve completion of the Piedmont acquisition in 2016. This acquisition will establish a broader gas infrastructure platform within Duke Energy.
Duke Energy expects to finance the acquisition through a combination of debt, newly issued equity and other cash sources.
Potential Sale of the Latin American Generation Business.
On February 18, 2016, Duke Energy announced it had initiated a process to divest the International Energy business segment, excluding the equity investment in NMC. The process remains in a preliminary stage and there have been no binding or non-binding offers requested or submitted. There is no specific timeline for execution of a potential transaction. The sale is expected to be dilutive to Duke Energy but would improve Duke Energy's risk profile and enhance its ability to generate more consistent earnings and cash flows over time. Proceeds from a successful sale would be used to fund the operations and growth of its domestic business.
Growth Initiatives.
Duke Energy will continue to pursue regulatory, state and federal approval of the growth projects announced in 2015 and in earlier periods. These projects will support long-term adjusted earnings growth and support Duke Energy’s ability to continue providing its customers affordable, reliable energy from an increasingly diverse generation portfolio.
Growth in the Regulated Utilities business is expected to be supported by retail and wholesale load growth and significant investments. Duke Energy expects to invest between $4 billion and $5 billion annually in the Regulated Utilities business growth projects. Many of these projects will be recovered through riders such as transmission and distribution expenditures in Indiana and Ohio, as well as energy efficiency riders in the Carolinas.
The Commercial Portfolio renewables business is a significant component of the Duke Energy growth strategy. Renewable projects enable Duke Energy to respond to customer interest in clean energy resources while increasing diversity in the generation portfolio. The portfolio of wind and solar is expected to continue growing as between $1 billion and $2 billion of capital is expected to be deployed over the next three years. Additionally, investments in the Atlantic Coast Pipeline add approximately $1 billion of capital spending through 2017.
38
PART II
Duke Energy announced new growth initiatives in 2015, which include:
|
•
|
Duke Energy Progress proposed an approximate $1 billion investment in the Western Carolinas Modernization Project. The project will retire and replace the existing coal units with two natural gas combined cycle 280 MW fired generation projects, a utility scale solar power plant and aggressive energy efficiency and demand-side management adoption in the region.
|
|
•
|
Commercial Portfolio acquired a 7.5 percent ownership interest in Sabal Trail Transmission, LLC pipeline for a total estimated investment of approximately $225 million upon completion of the project.
|
Cost Management.
Duke Energy has a demonstrated track record of driving efficiencies and productivity into the business. Duke Energy committed to efficiencies following the merger with Progress Energy and is on track to meet those commitments. Additionally, there is potential for more productivity and efficiency gains leading to a target of 2016 operations and maintenance costs at or below 2015 levels.
Continue the Coal Ash Management Strategy
. Duke Energy will continue the company's compliance strategy with the Coal Ash Act and RCRA. Duke Energy will update ash management plans to comply with the appropriate regulations and expand excavation and other compliance work at additional sites once plans and permits are approved.
Results of Operations
In this section, Duke Energy provides analysis and discussion of earnings and factors affecting earnings on both a GAAP and non-GAAP basis.
Management evaluates financial performance in part based on the non-GAAP financial measures, adjusted earnings and adjusted diluted EPS. These items are measured as income from continuing operations net of income (loss) attributable to noncontrolling interests, adjusted for the dollar and per-share impact of mark-to-market impacts of economic hedges in the Commercial Portfolio segment and special items including the operating results of the Disposal Group classified as discontinued operations for GAAP purposes. Special items represent certain charges and credits, which management believes will not be recurring on a regular basis, although it is reasonably possible such charges and credits could recur. Operating results of the Disposal Group sold to Dynegy are reported as discontinued operations, including a portion of the mark-to-market adjustments associated with derivative contracts. Management believes that including the operating results of the Disposal Group reported as discontinued operations better reflects its financial performance and therefore has included these results in adjusted earnings and adjusted diluted EPS prior to the sale of the Disposal Group. Additionally, as a result of completing the sale of the Disposal Group during the second quarter of 2015, state income tax expense increased as state income tax apportionments changed. The additional tax expense was recognized in Continuing Operations on a GAAP basis. This impact to state income taxes has been excluded from the Commercial Portfolio segment for adjusted diluted EPS purposes as management believes these impacts are incidental to the sale of the Disposal Group. Derivative contracts are used in Duke Energy’s hedging of a portion of the economic value of its generation assets in the Commercial Portfolio segment. The mark-to-market impact of derivative contracts is recognized in GAAP earnings immediately and, if associated with the Disposal Group, classified as discontinued operations, as such derivative contracts do not qualify for hedge accounting or regulatory treatment. The economic value of generation assets is subject to fluctuations in fair value due to market price volatility of input and output commodities (e.g., coal, electricity, natural gas). Economic hedging involves both purchases and sales of those input and output commodities related to generation assets. Operations of the generation assets are accounted for under the accrual method. Management believes excluding impacts of mark-to-market changes of the derivative contracts from adjusted earnings until settlement better matches the financial impacts of the derivative contract with the portion of economic value of the underlying hedged asset. Management believes the presentation of adjusted earnings and adjusted diluted EPS provides useful information to investors, as it provides them an additional relevant comparison of Duke Energy’s performance across periods. Management uses these non-GAAP financial measures for planning and forecasting and for reporting results to the Duke Energy Board of Directors (Board of Directors), employees, shareholders, analysts and investors concerning Duke Energy’s financial performance. Adjusted diluted EPS is also used as a basis for employee incentive bonuses. The most directly comparable GAAP measures for adjusted earnings and adjusted diluted EPS are Net Income Attributable to Duke Energy Corporation and Diluted EPS Attributable to Duke Energy Corporation common shareholders, which include the dollar and per-share impact of special items, mark-to-market impacts of economic hedges in the Commercial Portfolio segment and discontinued operations.
Management evaluates segment performance based on segment income. Segment income is defined as income from continuing operations net of income attributable to noncontrolling interests. Segment income, as discussed below, includes intercompany revenues and expenses that are eliminated in the Consolidated Financial Statements. Management also uses adjusted segment income as a measure of historical and anticipated future segment performance. Adjusted segment income is a non-GAAP financial measure, as it is based upon segment income adjusted for the mark-to-market impacts of economic hedges in the Commercial Portfolio segment and special items, including the operating results of the Disposal Group classified as discontinued operations for GAAP purposes. Management believes the presentation of adjusted segment income as presented provides useful information to investors, as it provides them with an additional relevant comparison of a segment’s performance across periods. The most directly comparable GAAP measure for adjusted segment income is segment income, which represents segment income from continuing operations, including any special items and the mark-to-market impacts of economic hedges in the Commercial Portfolio segment.
Duke Energy’s adjusted earnings, adjusted diluted EPS, and adjusted segment income may not be comparable to similarly titled measures of another company because other entities may not calculate the measures in the same manner.
See Note
3
to the Consolidated Financial Statements, “Business Segments,” for a discussion of Duke Energy’s segment structure.
39
PART II
Overview


 The following table reconciles non-GAAP measures to the most directly comparable GAAP measure.
|
|
Year Ended December 31, 2015
|
||||||||||||||||||||||||||||||
|
Total
|
|
Eliminations/
|
|
Per
|
|
||||||||||||||||||||||||||
|
Regulated
|
|
International
|
|
Commercial
|
|
Reportable
|
|
Discontinued
|
|
Duke
|
|
Diluted
|
|
||||||||||||||||||
|
(in millions, except per share amounts)
|
Utilities
|
|
Energy
|
|
Portfolio
|
|
Segments
|
|
Other
|
|
Operations
|
|
Energy
|
|
Share
|
|
|||||||||||||||
|
Adjusted segment income/Adjusted earnings
|
$
|
2,972
|
|
$
|
225
|
|
$
|
140
|
|
$
|
3,337
|
|
$
|
(185
|
)
|
$
|
—
|
|
$
|
3,152
|
|
$
|
4.54
|
|
|||||||
|
Midwest generation operations
|
—
|
|
—
|
|
(94
|
)
|
$
|
(94
|
)
|
—
|
|
94
|
|
—
|
|
—
|
|
||||||||||||||
|
Cost savings initiatives
|
(10
|
)
|
—
|
|
(1
|
)
|
(11
|
)
|
(77
|
)
|
—
|
|
(88
|
)
|
(0.13
|
)
|
|||||||||||||||
|
Costs to achieve mergers
|
—
|
|
—
|
|
—
|
|
—
|
|
(60
|
)
|
—
|
|
(60
|
)
|
(0.09
|
)
|
|||||||||||||||
|
Edwardsport settlement
|
(58
|
)
|
—
|
|
—
|
|
(58
|
)
|
—
|
|
—
|
|
(58
|
)
|
(0.08
|
)
|
|||||||||||||||
|
Ash basin settlement penalties
|
(11
|
)
|
—
|
|
—
|
|
(11
|
)
|
—
|
|
—
|
|
(11
|
)
|
(0.02
|
)
|
|||||||||||||||
|
Discontinued operations
|
—
|
|
—
|
|
(41
|
)
|
(41
|
)
|
—
|
|
(78
|
)
|
(119
|
)
|
(0.17
|
)
|
|||||||||||||||
|
Segment income (loss)/Net income attributable to Duke Energy Corporation
|
$
|
2,893
|
|
$
|
225
|
|
$
|
4
|
|
$
|
3,122
|
|
$
|
(322
|
)
|
$
|
16
|
|
$
|
2,816
|
|
$
|
4.05
|
|
|||||||
|
|
Year Ended December 31, 2014
|
||||||||||||||||||||||||||||||
|
Total
|
|
Eliminations/
|
|
Per
|
|
||||||||||||||||||||||||||
|
Regulated
|
|
International
|
|
Commercial
|
|
Reportable
|
|
Discontinued
|
|
Duke
|
|
Diluted
|
|
||||||||||||||||||
|
(in millions, except per share amounts)
|
Utilities
|
|
Energy
|
|
Portfolio
|
|
Segments
|
|
Other
|
|
Operations
|
|
Energy
|
|
Share
|
|
|||||||||||||||
|
Adjusted segment income/Adjusted earnings
|
$
|
2,897
|
|
$
|
428
|
|
$
|
109
|
|
$
|
3,434
|
|
$
|
(216
|
)
|
$
|
—
|
|
$
|
3,218
|
|
$
|
4.55
|
|
|||||||
|
International tax adjustment
|
—
|
|
(373
|
)
|
—
|
|
(373
|
)
|
—
|
|
—
|
|
(373
|
)
|
(0.53
|
)
|
|||||||||||||||
|
Costs to achieve mergers
|
—
|
|
—
|
|
—
|
|
—
|
|
(127
|
)
|
—
|
|
(127
|
)
|
(0.18
|
)
|
|||||||||||||||
|
Midwest generation operations
|
—
|
|
—
|
|
(114
|
)
|
(114
|
)
|
—
|
|
114
|
|
—
|
|
—
|
|
|||||||||||||||
|
Coal ash Plea Agreements reserve
|
(102
|
)
|
—
|
|
—
|
|
(102
|
)
|
—
|
|
—
|
|
(102
|
)
|
(0.14
|
)
|
|||||||||||||||
|
Asset impairment
|
—
|
|
—
|
|
(59
|
)
|
(59
|
)
|
—
|
|
—
|
|
(59
|
)
|
(0.08
|
)
|
|||||||||||||||
|
Asset sales
|
—
|
|
—
|
|
—
|
|
—
|
|
9
|
|
—
|
|
9
|
|
0.01
|
|
|||||||||||||||
|
Economic hedges (mark-to-market)
|
—
|
|
—
|
|
(6
|
)
|
(6
|
)
|
—
|
|
—
|
|
(6
|
)
|
(0.01
|
)
|
|||||||||||||||
|
Discontinued operations
|
—
|
|
—
|
|
15
|
|
15
|
|
—
|
|
(692
|
)
|
(677
|
)
|
(0.96
|
)
|
|||||||||||||||
|
Segment income (loss)/Net income attributable to Duke Energy Corporation
|
$
|
2,795
|
|
$
|
55
|
|
$
|
(55
|
)
|
$
|
2,795
|
|
$
|
(334
|
)
|
$
|
(578
|
)
|
$
|
1,883
|
|
|
$
|
2.66
|
|
||||||
40
PART II
|
|
Year Ended December 31, 2013
|
||||||||||||||||||||||||||||||
|
Total
|
|
Eliminations/
|
|
Per
|
|
||||||||||||||||||||||||||
|
Regulated
|
|
International
|
|
Commercial
|
|
Reportable
|
|
Discontinued
|
|
Duke
|
|
Diluted
|
|
||||||||||||||||||
|
(in millions, except per share amounts)
|
Utilities
|
|
Energy
|
|
Portfolio
|
|
Segments
|
|
Other
|
|
Operations
|
|
Energy
|
|
Share
|
|
|||||||||||||||
|
Adjusted segment income/Adjusted earnings
|
$
|
2,776
|
|
$
|
408
|
|
$
|
15
|
|
$
|
3,199
|
|
$
|
(119
|
)
|
$
|
—
|
|
$
|
3,080
|
|
$
|
4.36
|
|
|||||||
|
Crystal River Unit 3 charges
|
(215
|
)
|
—
|
|
—
|
|
(215
|
)
|
—
|
|
—
|
|
(215
|
)
|
(0.31
|
)
|
|||||||||||||||
|
Costs to achieve mergers
|
—
|
|
—
|
|
—
|
|
—
|
|
(184
|
)
|
—
|
|
(184
|
)
|
(0.26
|
)
|
|||||||||||||||
|
Midwest generation operations
|
—
|
|
—
|
|
(88
|
)
|
(88
|
)
|
14
|
|
74
|
|
—
|
|
—
|
|
|||||||||||||||
|
Nuclear development charges
|
(57
|
)
|
—
|
|
—
|
|
(57
|
)
|
—
|
|
—
|
|
(57
|
)
|
(0.08
|
)
|
|||||||||||||||
|
Litigation reserve
|
—
|
|
—
|
|
—
|
|
—
|
|
(14
|
)
|
—
|
|
(14
|
)
|
(0.02
|
)
|
|||||||||||||||
|
Asset sales
|
—
|
|
—
|
|
(15
|
)
|
(15
|
)
|
65
|
|
—
|
|
50
|
|
0.07
|
|
|||||||||||||||
|
Discontinued operations
|
—
|
|
—
|
|
—
|
|
—
|
|
—
|
|
5
|
|
5
|
|
—
|
|
|||||||||||||||
|
Segment income (loss)/Net income attributable to Duke Energy Corporation
|
$
|
2,504
|
|
$
|
408
|
|
$
|
(88
|
)
|
$
|
2,824
|
|
$
|
(238
|
)
|
$
|
79
|
|
$
|
2,665
|
|
|
$
|
3.76
|
|
||||||
The variance in adjusted earnings for the year ended
December 31, 2015
, compared to
2014
, was primarily due to:
|
•
|
Lower results in Latin America primarily due to lower demand, unfavorable hydrology in Brazil, changes in foreign currency exchange rates, a prior-year tax benefit related to the reorganization of Chilean operations, and lower dispatch in Central America due to increased competition;
|
|
•
|
Higher operations and maintenance expense primarily due to the prior-year benefit associated with the adoption of nuclear outage levelization, amounts related to additional ownership interest in assets acquired from NCEMPA, and higher planned fossil generation outage costs, partially offset by lower storm restoration costs;
|
|
•
|
Higher depreciation and amortization expense primarily due to higher depreciable base; and
|
|
•
|
Lower equity in earnings of unconsolidated affiliates due to lower margins at NMC, largely driven by lower MTBE prices, partially offset by lower butane costs.
|
Partially offset by:
|
•
|
Increased retail pricing primarily due to rate riders in most jurisdictions, including increased revenues related to energy efficiency programs, equity returns related to additional ownership interest in assets acquired from NCEMPA, and higher base rates;
|
|
•
|
Increased wholesale net margins largely due to increases in contracted amounts and prices and a new wholesale contract with NCEMPA;
|
|
•
|
Retail sales growth of 0.6 percent;
|
|
•
|
Higher results at the nonregulated Midwest generation business prior to its sale on April 2, 2015, due to higher PJM Interconnection LLC (PJM) capacity revenues and increased generation margins; and
|
|
•
|
Reduction in shares outstanding due to the Duke Energy stock repurchase (only impacts per diluted share amounts in the tables above).
|
The variance in adjusted earnings for the year ended
December 31, 2014
, compared to
2013
, was primarily due to:
|
•
|
Increased retail pricing and riders primarily resulting from the implementation of revised rates in most jurisdictions;
|
|
•
|
Favorable weather in 2014 compared to 2013;
|
|
•
|
Higher PJM capacity revenues for the nonregulated Midwest generation business due to higher prices; and
|
|
•
|
Higher results of the renewables business due to higher production from the wind and solar portfolios, lower costs and additional renewables investments.
|
Partially offset by:
|
•
|
Higher depreciation and amortization expense primarily due to higher depreciable asset base and lower reductions to cost of removal reserves;
|
|
•
|
Higher operations and maintenance expense due to higher storm costs, the timing of fossil plant outages and the impact of nuclear outage cost levelization;
|
|
•
|
Lower post in-service debt returns due to projects added to customer rates; and
|
|
•
|
Higher property and other non-income taxes.
|
41
PART II
Segment Results
The remaining information presented in this discussion of results of operations is on a GAAP basis.
Regulated Utilities
|
|
Years Ended December 31,
|
||||||||||||||||||
|
Variance
|
|
Variance
|
|
||||||||||||||||
|
2015 vs.
|
|
2014 vs.
|
|
||||||||||||||||
|
(in millions)
|
2015
|
|
2014
|
|
2014
|
|
2013
|
|
2013
|
|
|||||||||
|
Operating Revenues
|
$
|
22,062
|
|
$
|
22,271
|
|
$
|
(209
|
)
|
$
|
20,910
|
|
$
|
1,361
|
|
||||
|
Operating Expenses
|
16,698
|
|
17,026
|
|
(328
|
)
|
16,126
|
|
900
|
|
|||||||||
|
Gains on Sales of Other Assets and Other, net
|
11
|
|
4
|
|
7
|
|
7
|
|
(3
|
)
|
|||||||||
|
Operating Income
|
5,375
|
|
5,249
|
|
126
|
|
4,791
|
|
458
|
|
|||||||||
|
Other Income and Expense, net
|
262
|
|
267
|
|
(5
|
)
|
221
|
|
46
|
|
|||||||||
|
Interest Expense
|
1,097
|
|
1,093
|
|
4
|
|
986
|
|
107
|
|
|||||||||
|
Income Before Income Taxes
|
4,540
|
|
4,423
|
|
117
|
|
4,026
|
|
397
|
|
|||||||||
|
Income Tax Expense
|
1,647
|
|
1,628
|
|
19
|
|
1,522
|
|
106
|
|
|||||||||
|
Segment Income
|
$
|
2,893
|
|
$
|
2,795
|
|
$
|
98
|
|
$
|
2,504
|
|
$
|
291
|
|
||||
|
Duke Energy Carolinas Gigawatt-Hours (GWh) sales
|
87,375
|
|
87,645
|
|
(270
|
)
|
85,790
|
|
1,855
|
|
|||||||||
|
Duke Energy Progress GWh sales
|
64,881
|
|
62,871
|
|
2,010
|
|
60,204
|
|
2,667
|
|
|||||||||
|
Duke Energy Florida GWh sales
|
40,053
|
|
38,703
|
|
1,350
|
|
37,974
|
|
729
|
|
|||||||||
|
Duke Energy Ohio GWh sales
|
25,439
|
|
24,735
|
|
704
|
|
24,557
|
|
178
|
|
|||||||||
|
Duke Energy Indiana GWh sales
|
33,518
|
|
33,433
|
|
85
|
|
33,715
|
|
(282
|
)
|
|||||||||
|
Total Regulated Utilities GWh sales
|
251,266
|
|
247,387
|
|
3,879
|
|
242,240
|
|
5,147
|
|
|||||||||
|
Net proportional MW capacity in operation
|
50,170
|
|
49,600
|
|
570
|
|
49,607
|
|
(7
|
)
|
|||||||||
Year Ended December 31, 2015 as Compared to 2014
Regulated Utilities’ results increased due to an increase in wholesale power margins, growth in retail sales, and increased retail pricing primarily due to rate riders in most jurisdictions, including increased revenues related to energy efficiency programs, and higher base rates primarily due to phasing of 2013 rate cases. These drivers were partially offset by impairment expense associated with the 2015 Edwardsport IGCC settlement, higher operations and maintenance expenses, and increased depreciation and amortization expense. The following is a detailed discussion of the variance drivers by line item.
Operating Revenues.
The variance was driven primarily by:
|
•
|
a $339 million decrease in fuel revenues driven primarily by overall lower fuel rates for electric retail customers. Fuel revenues represent sales to retail and wholesale customers; and
|
|
•
|
a $131 million decrease in revenues to recover gross receipts taxes due to the North Carolina Tax Simplification and Rate Reduction Act, which terminated the collection of the North Carolina gross receipts tax effective July 1, 2014.
|
Partially offset by:
|
•
|
a $175 million increase in wholesale power revenues, primarily due to additional volumes and capacity charges for customers served under long-term contracts, including the NCEMPA wholesale contract that became effective August 1, 2015; and
|
|
•
|
a $79 million increase from retail sales growth (net of fuel revenue) reflecting increased demand.
|
Operating Expenses.
The variance was driven primarily by:
|
•
|
a $422 million decrease in fuel expense (including purchased power and natural gas purchases for resale) primarily due to (i) lower natural gas and coal prices, (ii) lower volumes of coal and oil used in electric generation and (iii) lower gas prices and volumes to full-service retail gas customers, partially offset by (iv) higher volumes of natural gas used in electric generation; and
|
|
•
|
a $116 million decrease in property and other taxes primarily due to the termination of the collection of the North Carolina gross receipts tax as mentioned above, and the partial reversal of a sales tax reserve recorded in 2014 at Duke Energy Indiana, partially offset by higher property taxes across multiple jurisdictions and a favorable 2014 Ohio gas excise tax settlement that did not recur in 2015.
|
Partially offset by:
|
•
|
an $88 million impairment charge related to the 2015 Edwardsport IGCC settlement. See Note 4 to the Consolidated Financial Statements, “Regulatory Matters,” for additional information;
|
42
PART II
|
•
|
a $56 million increase in operations and maintenance expense primarily due to planned nuclear spending and the prior-year benefit of the adoption of nuclear outage levelization, higher costs for customer programs and distribution projects, and higher maintenance costs at fossil generation stations primarily due to increased ownership interest in assets acquired from NCEMPA, partially offset by a 2014 litigation reserve related to the investigation of the Dan River coal ash spill (see Note 5 to the Consolidated Financial Statements, “Commitments and Contingencies,” for additional information), and lower storm restoration costs; and
|
|
•
|
a $55 million increase in depreciation and amortization expense primarily due to increased plant in service.
|
Income Tax Expense.
The variance was primarily due to an increase in the pretax income. The effective tax rates for the years ended December 31, 2015 and 2014 were 36.3 percent and 36.8 percent, respectively.
Year Ended December 31, 2014 as Compared to 2013
Regulated Utilities’ results were positively impacted by higher retail pricing and rate riders, favorable weather, an increase in wholesale power margins, retail sales growth, and 2013 impairments and other charges. These impacts were partially offset by higher depreciation and amortization expense, higher operation and maintenance costs, higher interest expense, and higher income tax expense. The following is a detailed discussion of the variance drivers by line item.
Operating Revenues.
The variance was driven primarily by:
|
•
|
a $614 million increase in fuel revenues driven primarily by increased demand from electric retail customers resulting from favorable weather conditions, and higher fuel rates for electric retail customers for all jurisdictions, except North Carolina. Fuel revenues represent sales to retail and wholesale customers;
|
|
•
|
a $556 million net increase in retail pricing primarily due to retail rate changes and updated rate riders;
|
|
•
|
a $216 million increase in electric sales (net of fuel revenue) to retail customers due to more favorable weather conditions across the service territory. Compared to normal, weather was favorable in the Carolinas and Florida service territories, while weather in the Midwest was essentially normal;
|
|
•
|
a $63 million increase in wholesale power revenues, net of sharing, primarily due to additional volumes and capacity charges for customers served under long-term contracts; and
|
|
•
|
a $21 million increase from retail sales growth (net of fuel revenue) reflecting increased demand.
|
Partially offset by:
|
•
|
a $139 million
decrease in gross receipts tax revenue due to the NC Tax Simplification and Rate Reduction Act which terminated the collection of the North Carolina gross receipts tax effective July 1, 2014.
|
Operating Expenses.
The variance was driven primarily by:
|
•
|
a $611 million increase in fuel expense (including purchased power and natural gas purchases for resale) primarily related to (i) higher volumes of coal, and oil
used in electric generation due primarily to increased generation resulting from favorable weather conditions, (ii) higher natural gas
prices, and (iii) the application of the Nuclear Electric Insurance Limited (NEIL) settlement proceeds in 2013 for Duke Energy Florida;
|
|
•
|
a $436 million increase in depreciation and amortization expense primarily due to increases in depreciation as a result of additional plant in service and amortization of regulatory assets, and higher 2013 reductions to cost of removal reserves in accordance with regulatory orders; and
|
|
•
|
a $292 million increase in operating and maintenance expense primarily due to a litigation reserve related to the criminal investigation of the Dan River coal ash spill (see Note
5
to the Consolidated Financial Statements, “Commitments and Contingencies,” for additional information), higher storm costs, repairs and remediation expenses associated with the Dan River coal ash discharge and other ash basin related assessment costs, and higher nuclear costs, including nuclear outage levelization costs, and higher environmental and operational costs that are recoverable in rates; partially offset by a 2013 Crystal River Unit 3 related settlement matter, decreased benefits costs
and 2013 donations for low-income customers and job training in accordance with 2013 NCUC and PSCSC rate case orders.
|
Partially offset by:
|
•
|
a $346 million decrease due to the 2013 impairment and other charges primarily related to Crystal River Unit 3 and the proposed Levy Nuclear Station (Levy). See Note
4
to the Consolidated Financial Statements, “Regulatory Matters,” for additional information;
|
|
•
|
a $42 million decrease in property and other taxes primarily due to the termination of the collection of the North Carolina gross receipts tax as mentioned above; partially offset by a sales tax reserve as a result of an Indiana sales tax audit, and higher property taxes; and
|
|
•
|
a $22 million decrease due to the 2013 impairment resulting from the decision to suspend the application for two proposed nuclear units at Shearon Harris Nuclear Plant (Harris).
|
Other Income and Expenses, net.
The variance
is primarily due to recognition of post in-service equity returns for projects that had been completed prior to being reflected in customer rates, partially offset by lower Allowance for Funds Used During Construction (AFUDC) equity, primarily due to placing the Sutton Plant into service in late 2013.
43
PART II
Interest Expense.
The variance
was primarily due to no longer recording post in-service debt returns on projects reflected in customer rates
and a reduction in debt return on the Crystal River Unit 3 regulatory asset recovered through fuel revenues.
Income Tax Expense.
The variance was primarily due to higher pretax income, partially offset by a lower effective tax rate of 36.8 percent compared to 37.8 percent, respectively, for the years ended December 31, 2014 and 2013. The decrease in effective tax rate is primarily due to favorable audit settlements, a higher manufacturing deduction due to prior year limitations based on taxable income, and changes in income apportionment for state income tax, partially offset by the non-deductible litigation reserve related to the criminal investigation of the Dan River coal ash spill.
Matters Impacting Future Regulated Utilities Results
Duke Energy is a party to multiple lawsuits and could be subject to fines and other penalties related to the Dan River coal ash release and operations at other North Carolina facilities with ash basins. The outcome of these lawsuits and potential fines and penalties could have an adverse impact on Regulated Utilities’ financial position, results of operations and cash flows. See Note
5
to the Consolidated Financial Statements, “Commitments and Contingencies,” for additional information.
An order from regulatory authorities disallowing recovery of costs related to closure of ash impoundments could have an adverse impact on Regulated Utilities' financial position, results of operations and cash flows. See Notes 4 and 9 to the Consolidated Financial Statements, “Regulatory Matters” and "Asset Retirement Obligations," respectively, for additional information.
In 2013, a Federal Energy Regulatory Commission (FERC) Administrative Law Judge (ALJ) issued an initial decision that Duke Energy is responsible for costs associated with Multi Value Projects (MVP), a type of Transmission Expansion Planning (MTEP) cost, approved by MISO prior to the date of Duke Energy’s withdrawal. On October 29, 2015, the FERC issued an order reversing the ALJ's decision. FERC ruled that Duke Energy has no liability for MVP costs after its withdrawal from MISO. On November 30, 2015, MISO filed with the FERC a request for rehearing. MISO may appeal the FERC's decision if its request for rehearing is denied. If Duke Energy is deemed responsible for these costs, and if the regulatory commissions disallow recovery of these costs, there would be an adverse impact to Regulated Utilities' financial position, results of operations and cash flows. See Note
4
to the Consolidated Financial Statements, “Regulatory Matters,” for additional information.
The FPSC approved an agreement on all securitization-related issues and issued a final financing order to securitize the Crystal River Unit 3 Regulatory asset with low-cost securities. Securitization will replace base rate recovery and result in a lower rate impact to customers. Securitization of the costs of the retired Crystal River Unit 3 Nuclear Plant would result in an initial acceleration of cash, followed by a reduction to Regulated Utilities’ future results of operations and ongoing cash flows as it would no longer earn an equity return on these costs. Under a previous settlement agreement with the FPSC, the allowed return on equity for Crystal River Unit 3 is limited to 70 percent of the approved return on equity, which is currently 10.5 percent. Regulated Utilities expects to issue the securitization bonds in the first half of 2016.
In September 2015, Duke Energy Indiana entered into a settlement agreement with multiple parties that will resolve all disputes, claims and issues from the IURC proceedings regarding the Edwardsport IGCC generating facility. In January 2016, additional parties joined a revised settlement. Pursuant to the terms of the agreement, Regulated Utilities recognized an impairment and related charges of $93 million. Additionally, the agreement stipulates the recovery of the remaining regulatory asset over an eight-year period and confirms the conclusion that the in-service date for accounting and ratemaking purposes will remain June 7, 2013. The settlement agreement will also impose a cost cap for recoverable operations and maintenance retail costs of $73 million in 2016 and $77 million in 2017 as well as a cost cap for ongoing capital expenditures through 2017. As part of the settlement, Duke Energy Indiana committed to cease burning coal at Gallagher Station Units 2 and 4 by the end of 2022. The settlement is subject to IURC approval and if approved would resolve and close a number of outstanding issues pending before the IURC related to post commercial operating performance and recovery of ongoing operating and capital costs at Edwardsport. If the settlement is not approved, outstanding issues before the IURC related to Edwardsport would resume, the ultimate resolution of which could have an adverse impact on Regulated Utilities' financial position, results of operations and cash flows. In addition, the inability to manage operating and capital costs under caps imposed under the settlement could have an adverse impact on Regulated Utilities' financial position, results of operations and cash flows. See Note
4
to the Consolidated Financial Statements, “Regulatory Matters,” for additional information.
On October 23, 2015, the EPA published in the Federal Register the CPP rule for regulating CO
2
emissions from existing fossil fuel-fired EGUs. The CPP establishes CO
2
emission rates and mass cap goals that apply to fossil fuel-fired generation. Under the CPP, states are required to develop and submit a final compliance plan, or an initial plan with an extension request, to the EPA by September 6, 2016, or no later than September 6, 2018, with an approved extension. These state plans are subject to EPA approval, with a federal plan applied to states that fail to submit a plan to the EPA or if a state plan is not approved. Legal challenges to the CPP have been filed by stakeholders and motions to stay the requirements of the rule pending the outcome of the litigation have been filed. The U.S. Supreme Court granted a Motion to Stay in February 2016, effectively blocking enforcement of the rule until legal challenges are resolved. Final resolution of these legal challenges could take several years. Compliance with CPP could cause the industry to replace coal generation with natural gas and renewables, especially in states that have significant CO
2
reduction targets under the rule. Costs to operate coal-fired generation plants continue to grow due to increasing environmental compliance requirements, including ash management costs unrelated to CPP, and this may result in the retirement of coal-fired generation plants earlier than the current useful lives. Regulated Utilities continues to evaluate the need to retire generating facilities and plans to seek regulatory recovery, where appropriate, for amounts that have not been recovered upon asset retirements. However, recovery is subject to future regulatory approval, including the recovery of carrying costs on remaining book values, and therefore cannot be assured. In addition, Regulated Utilities could incur increased fuel, purchased power, operation and maintenance, and other costs for replacement generation as a result of this rule. Regulated Utilities cannot predict the outcome of these matters.
44
PART II
International Energy
|
|
Years Ended December 31,
|
|||||||||||||||||||
|
Variance
|
|
Variance
|
|
|||||||||||||||||
|
2015 vs.
|
|
2014 vs.
|
|
|||||||||||||||||
|
(in millions)
|
2015
|
|
2014
|
|
2014
|
|
2013
|
|
2013
|
|
||||||||||
|
Operating Revenues
|
$
|
1,088
|
|
$
|
1,417
|
|
$
|
(329
|
)
|
$
|
1,546
|
|
$
|
(129
|
)
|
|||||
|
Operating Expenses
|
805
|
|
1,007
|
|
(202
|
)
|
1,000
|
|
7
|
|
||||||||||
|
Gains on Sales of Other Assets and Other, net
|
6
|
|
6
|
|
—
|
|
3
|
|
3
|
|
||||||||||
|
Operating Income
|
289
|
|
416
|
|
(127
|
)
|
549
|
|
(133
|
)
|
||||||||||
|
Other Income and Expense, net
|
101
|
|
190
|
|
(89
|
)
|
125
|
|
65
|
|
||||||||||
|
Interest Expense
|
85
|
|
93
|
|
(8
|
)
|
86
|
|
7
|
|
||||||||||
|
Income Before Income Taxes
|
305
|
|
513
|
|
(208
|
)
|
588
|
|
(75
|
)
|
||||||||||
|
Income Tax Expense
|
74
|
|
449
|
|
(375
|
)
|
166
|
|
283
|
|
||||||||||
|
Less: Income Attributable to Noncontrolling Interests
|
6
|
|
9
|
|
(3
|
)
|
14
|
|
(5
|
)
|
||||||||||
|
Segment Income
|
$
|
225
|
|
$
|
55
|
|
$
|
170
|
|
$
|
408
|
|
$
|
(353
|
)
|
|||||
|
Sales, GWh
|
19,211
|
|
18,629
|
|
582
|
|
20,306
|
|
(1,677
|
)
|
||||||||||
|
Net proportional MW capacity in operation
|
4,333
|
|
4,340
|
|
(7
|
)
|
4,600
|
|
(260
|
)
|
||||||||||
Year Ended December 31, 2015 as Compared to 2014
International Energy’s results were impacted by the absence of prior-year taxes on repatriated foreign earnings, partially offset by lower results in Brazil due to lower demand, unfavorable hydrological conditions and changes in foreign currency exchange rates, the absence of a prior year merger step-up tax benefit in Chile and lower earnings from NMC and Central America. The following is a detailed discussion of the variance drivers by line item.
Operating Revenues
.
The variance was driven primarily by:
|
•
|
a $177 million decrease in Brazil due to exchange rates, lower average spot prices and volumes, partially offset by higher average contract prices;
|
|
•
|
a $122 million decrease in Central America due to lower average prices and volumes as a result of increased competition and unplanned outages; and
|
|
•
|
a $27 million decrease in Peru due to lower average hydrocarbon prices and unfavorable exchanges rates, partially offset by higher energy sales volumes.
|
Operating Expenses
.
The variance was driven primarily by:
|
•
|
a $105 million decrease in Brazil due to exchange rates and lower purchased power costs, partially offset by higher variable costs;
|
|
•
|
an $88 million decrease in Central America due to lower fuel costs; and
|
|
•
|
a $31 million decrease in Peru due to lower hydrocarbon royalties, purchased power costs and fuel consumption and change in exchange rates.
|
Partially offset by:
|
•
|
a $25 million increase in Ecuador due to an asset impairment loss, higher fuel consumption, and provision for asset retirement obligation.
|
Other Income and Expenses, net
.
The variance is primarily due to lower interest income in Brazil and lower equity earnings in NMC, as a result of lower average MTBE and methanol prices, and lower MTBE sales volumes, partially offset by lower butane costs.
Income Tax Expense.
The variance was primarily due to approximately $373 million of incremental tax expense in 2014 resulting from the decision to repatriate all cumulative historical undistributed foreign earnings. The effective tax rates for the years ended December 31, 2015 and 2014 were 24.3 percent and 87.3 percent, respectively. The decrease in the effective tax rate was primarily due to the tax expense associated with the repatriation decision, partially offset by the favorable adjustment related to the merger of two Chilean subsidiaries recorded in 2014
.
Year Ended December 31, 2014 as Compared to 2013
International Energy’s results were negatively impacted by higher tax expense resulting from the decision to repatriate historical undistributed foreign earnings, unfavorable hydrology and exchange rates in Brazil and an unplanned outage in Chile, partially offset by higher equity earnings in NMC and a 2013 net currency remeasurement loss in Latin America. The following is a detailed discussion of the variance drivers by line item.
45
PART II
Operating Revenues.
The variance was driven primarily by:
|
•
|
a $44 million decrease in Peru as a result of lower sales volumes and exchange rates;
|
|
•
|
a $35 million decrease in Brazil due to exchange rates and lower sales volumes partially offset by higher average prices;
|
|
•
|
a $27 million decrease in Chile as a result of lower sales volumes due to an unplanned outage, and lower average prices; and
|
|
•
|
a $25 million decrease in Argentina due to exchange rates and lower average prices.
|
Operating Expenses.
The variance was driven primarily by:
|
•
|
a $75 million increase in Brazil due to higher purchased power as a result of unfavorable hydrology, partially offset by exchange rates.
|
Partially offset by:
|
•
|
a $38 million decrease in Peru as a result of lower purchased power, transmission, and royalty costs; and
|
|
•
|
a $26 million decrease in Argentina due to exchange rates and lower purchased power and fuel consumption.
|
Other Income and Expenses, net
.
The variance is primarily due to a 2013 net currency remeasurement loss in Latin America, higher interest income in Brazil, and higher equity earnings in NMC as a result of increased MTBE and methanol sales volumes, partially offset by lower average prices and higher butane costs.
Income Tax Expense.
The variance was primarily due to approximately $373 million of incremental tax expense in 2014 resulting from the decision to repatriate all cumulative historical undistributed foreign earnings. The effective tax rates for the years ended December 31, 2014 and 2013 were 87.3 percent and 28.3 percent, respectively. The increase in the effective tax rate was also primarily due to the tax expense associated with the repatriation decision.
Matters Impacting Future International Energy Results
International Energy's operations include conventional hydroelectric power generation facilities located in Brazil where water reservoirs are at abnormally low levels due to a lack of rainfall. Weather and economic conditions within Brazil have resulted in higher energy prices, a reduction in electricity demand and unfavorable impacts to the exchange rate of Brazil's currency. These weather and economic conditions have also resulted in lawsuits brought to the Brazilian courts by certain hydroelectric generators to limit the financial exposure to the generators. International Energy's earnings and future cash flows could continue to be adversely impacted by a further sustained period of low reservoir levels, a further decline of economic conditions within Brazil, or from the outcome of legal matters in the Brazilian courts.
International Energy's equity earnings from NMC reflect sales of methanol and MTBE, which generate margins that are directionally correlated with crude oil prices and the recent decline in crude oil prices have reduced the equity earnings realized from NMC. Continued weakness in the market price of Brent crude oil and related commodities will likely result in a further decline in equity earnings from NMC.
On February 18, 2016, Duke Energy announced it had initiated a process to divest the International Energy business segment, excluding the equity method investment in NMC. Duke Energy is in the preliminary stage and no binding or non-binding offers have been requested or submitted. Duke Energy can provide no assurance that this process will result in a transaction and there is no specific timeline for execution of a potential transaction. If the potential of a sale were to progress, it could result in classification of International Energy as assets held for sale and as a discontinued operation. As of December 31, 2015, the International Energy segment had a carrying value of approximately $2.7 billion, adjusted to include the cumulative foreign currency translation losses currently classified as accumulated other comprehensive income.
46
PART II
Commercial Portfolio
|
|
Years Ended December 31,
|
||||||||||||||||||
|
Variance
|
|
Variance
|
|
||||||||||||||||
|
2015 vs.
|
|
2014 vs.
|
|
||||||||||||||||
|
(in millions)
|
2015
|
|
2014
|
|
2014
|
|
2013
|
|
2013
|
|
|||||||||
|
Operating Revenues
|
$
|
301
|
|
$
|
255
|
|
$
|
46
|
|
$
|
260
|
|
$
|
(5
|
)
|
||||
|
Operating Expenses
|
353
|
|
441
|
|
(88
|
)
|
425
|
|
16
|
|
|||||||||
|
Gains (Losses) on Sales of Other Assets and Other, net
|
1
|
|
—
|
|
1
|
|
(23
|
)
|
23
|
|
|||||||||
|
Operating Loss
|
(51
|
)
|
(186
|
)
|
135
|
|
(188
|
)
|
2
|
|
|||||||||
|
Other Income and Expense, net
|
6
|
|
18
|
|
(12
|
)
|
13
|
|
5
|
|
|||||||||
|
Interest Expense
|
44
|
|
58
|
|
(14
|
)
|
61
|
|
(3
|
)
|
|||||||||
|
Loss Before Income Taxes
|
(89
|
)
|
(226
|
)
|
137
|
|
(236
|
)
|
10
|
|
|||||||||
|
Income Tax Benefit
|
(92
|
)
|
(171
|
)
|
79
|
|
(148
|
)
|
(23
|
)
|
|||||||||
|
Less: Loss Attributable to Noncontrolling Interests
|
(1
|
)
|
—
|
|
(1
|
)
|
—
|
|
—
|
|
|||||||||
|
Segment Income (Loss)
|
$
|
4
|
|
$
|
(55
|
)
|
$
|
59
|
|
$
|
(88
|
)
|
$
|
33
|
|
||||
|
Coal-fired plant production, GWh
|
—
|
|
867
|
|
(867
|
)
|
1,644
|
|
(777
|
)
|
|||||||||
|
Renewable plant production, GWh
|
5,577
|
|
5,462
|
|
115
|
|
5,111
|
|
351
|
|
|||||||||
|
Total Commercial Portfolio production, GWh
|
5,577
|
|
6,329
|
|
(752
|
)
|
6,755
|
|
(426
|
)
|
|||||||||
|
Net proportional MW capacity in operation
|
1,943
|
|
1,370
|
|
573
|
|
2,031
|
|
(661
|
)
|
|||||||||
Year Ended December 31, 2015 as Compared to 2014
Commercial Portfolio’s results were positively impacted by the 2014 impairment recorded for an intangible asset and new solar generation, partially offset by unfavorable wind patterns. The following is a detailed discussion of the variance drivers by line item.
Operating Revenues.
The variance was driven primarily by:
|
•
|
a $41 million increase in electric revenues due to the acquisition of REC Solar; and
|
|
•
|
a $15 million increase in electric revenues from new solar generation placed in service.
|
Partially offset by:
|
•
|
an $18 million decrease in electric revenues due to lower wind production.
|
Operating Expenses.
The variance was driven primarily by the $94 million pretax impairment related to Ohio Valley Electric Corporation (OVEC) in 2014.
Other Income and Expense, net.
The variance was primarily due to lower equity earnings in the renewables portfolio due to lower wind production.
Interest Expense.
The variance was driven primarily by capitalized interest from increased spending on wind and solar projects.
Income Tax Benefit.
The variance is primarily due to a decrease in pretax losses and changes in state deferred taxes. The effective tax rates for the years ended December 31, 2015 and 2014 were 103.4 percent and 75.5 percent, respectively. The increase in the effective tax rate is primarily due to the impact of the production tax credits for the renewables portfolio, partially offset by changes to state apportionment factors on deferred taxes due to the Disposal Group sale
.
Year Ended December 31, 2014 as Compared to 2013
Commercial Portfolio’s results were impacted by higher production tax credits generation, higher production and lower operating costs by the renewables business and a prior-year loss recognized on certain renewables projects, partially offset by an impairment recorded for an intangible asset. The following is a detailed discussion of the variance drivers by line item.
Operating Revenues.
The variance was driven primarily by:
|
•
|
an $8 million decrease in electric revenues for the Beckjord station, which is not included in the Disposal Group, driven from lower production as units have been retired;
|
|
•
|
a $7 million decrease in net mark-to-market revenues on non-qualifying power hedge contracts.
|
Partially offset by:
|
•
|
a $16 million increase in electric revenues from higher production in the renewables portfolio.
|
47
PART II
Operating Expenses.
The variance was driven primarily by:
|
•
|
a $94 million increase driven by an impairment related to OVEC. The impairment reduced the carrying amount of OVEC to zero.
|
Partially offset by:
|
•
|
an $18 million decrease in depreciation driven by discontinued amortization of an intangible asset that was impaired and written off in 2014 and extensions on the projected useful lives of assets in the renewable portfolio;
|
|
•
|
a $17 million decrease in fuel expense for the Beckjord station driven by lower cost of coal from decreased production as units have been retired;
|
|
•
|
a $16 million decrease related to a 2013 legal settlement reserve related to previously disposed businesses;
|
|
•
|
a $10 million decrease in general and administrative costs;
|
|
•
|
a $9 million decrease in operations and maintenance expense for the renewables portfolio driven primarily by development cost reductions; and
|
|
•
|
a $6 million decrease in property tax expense driven by cost reductions in the renewables portfolio resulting from a property tax abatement that went into effect in the current year.
|
Losses on Sales of Other Assets and Other, net.
The variance is attributable to a loss recognized on the sale of certain renewable development projects in 2013.
Other Income and Expense.
The variance was primarily due to a net gain recognized for the sale of certain renewable development assets and increased equity earnings from higher production in the renewable wind portfolio.
Income Tax Benefit.
The variance was primarily due to changes in state deferred taxes and higher production tax credits in 2014 for the Renewables portfolio. The effective tax rates for the years ended December 31, 2014 and 2013 were 75.5 percent and 62.8 percent, respectively.
Other
|
|
Years Ended December 31,
|
||||||||||||||||||
|
Variance
|
|
Variance
|
|
||||||||||||||||
|
2015 vs.
|
|
2014 vs.
|
|
||||||||||||||||
|
(in millions)
|
2015
|
|
2014
|
|
2014
|
|
2013
|
|
2013
|
|
|||||||||
|
Operating Revenues
|
$
|
123
|
|
$
|
105
|
|
$
|
18
|
|
$
|
175
|
|
$
|
(70
|
)
|
||||
|
Operating Expenses
|
382
|
|
322
|
|
60
|
|
457
|
|
(135
|
)
|
|||||||||
|
Gains (Losses) on Sales of Other Assets and Other, net
|
17
|
|
6
|
|
11
|
|
(3
|
)
|
9
|
|
|||||||||
|
Operating Loss
|
(242
|
)
|
(211
|
)
|
(31
|
)
|
(285
|
)
|
74
|
|
|||||||||
|
Other Income and Expense, net
|
20
|
|
45
|
|
(25
|
)
|
131
|
|
(86
|
)
|
|||||||||
|
Interest Expense
|
393
|
|
400
|
|
(7
|
)
|
416
|
|
(16
|
)
|
|||||||||
|
Loss Before Income Taxes
|
(615
|
)
|
(566
|
)
|
(49
|
)
|
(570
|
)
|
4
|
|
|||||||||
|
Income Tax Benefit
|
(303
|
)
|
(237
|
)
|
(66
|
)
|
(335
|
)
|
98
|
|
|||||||||
|
Less: Income attributable to Noncontrolling Interests
|
10
|
|
5
|
|
5
|
|
3
|
|
2
|
|
|||||||||
|
Net Expense
|
$
|
(322
|
)
|
$
|
(334
|
)
|
$
|
12
|
|
$
|
(238
|
)
|
$
|
(96
|
)
|
||||
Year Ended December 31, 2015 as Compared to 2014
Other’s results were impacted by lower Progress Energy merger costs, an increase in income tax benefit, severance accruals, and higher North Carolina franchise taxes. The following is a detailed discussion of the variance drivers by line item.
Operating Revenues
. The increase was primarily due to revenues from OVEC, which was shifted from the Commercial Portfolio segment to Other subsequent to the sale of the Disposal Group (see Note 3 to the Consolidated Financial Statements, "Business Segments.")
Operating Expenses.
The increase was primarily due to severance accruals, higher charges in the current year due to the shift of the residual Midwest Generation business from the Commercial Portfolio segment to Other in 2015 (see Note 3 to the Consolidated Financial Statements, "Business Segments,") and higher North Carolina franchise taxes, partially offset by lower charges related to the Progress Energy merger and higher prior-year captive insurance loss experience.
Gains on Sales of Other Assets and Other, net.
The variance was primarily due to the gain on sale of telecommunication leases.
Other Income and Expenses, net.
The variance was primarily due to lower returns on investments that support benefit obligations, a gain on an investment sale in the prior year and lower investment income at Bison Insurance Company Limited, partially offset by interest income from the resolution of an income tax matter.
48
PART II
Income Tax Benefit.
The variance was primarily due to an increase in pretax losses and higher effective tax rate. The effective tax rates for the years ended December 31, 2015 and 2014 were 49.3 percent and 41.9 percent, respectively.
Year Ended December 31, 2014 as Compared to 2013
Other’s results were negatively impacted by a decrease in income tax benefit. The following is a detailed discussion of the variance drivers by line item.
Operating Revenues.
The decrease was primarily due to mark-to-market activity of mitigation sales related to the Progress Energy merger.
Operating Expenses.
The decrease was primarily due to lower charges related to the Progress Energy merger and prior year Crescent Resources LLC (Crescent) litigation reserve, partially offset by unfavorable loss experience at Bison.
Other Income and Expenses.
The decrease was primarily due to a gain on the sale of Duke Energy’s 50 percent ownership in DukeNet Communications Holdings, LLC (DukeNet) in 2013, partially offset by a current year investment sale gain and higher investment income at Bison.
Interest Expense.
The variance was due primarily to lower interest on long-term debt resulting from debt maturities and new debt issued at lower rates.
Income Tax Benefit.
The variance was primarily due to a state tax benefit recognized in 2013. The effective tax rates for the years ended December 31, 2014 and 2013 were 41.9 percent and 58.6 percent, respectively.
Matters Impacting Future Other Results
Duke Energy Ohio’s retired Beckjord generating station (Beckjord), previously an asset of Commercial Portfolio, became an asset of Other after the sale of the Disposal Group. Beckjord, a nonregulated facility retired during 2014, is not subject to the recently enacted EPA rule related to the disposal of CCR from electric utilities. However, if costs are incurred as a result of environmental regulations or to mitigate risk associated with on-site storage of coal ash, the costs could have an adverse impact on Other's financial position, results of operations and cash flows.
INCOME (LOSS) FROM DISCONTINUED OPERATIONS, NET OF TAX
Year Ended December 31, 2015 as Compared to 2014
The variance was primarily driven by the 2014 impairment and unrealized mark-to-market losses on economic hedges, and favorable operating results in 2015, partially offset by a litigation reserve recorded in 2015, as discussed in Note
5
, "Commitments and Contingencies," to the Consolidated Financial Statements. Operating results in 2015 were favorable primarily due to higher PJM capacity revenues related to higher average cleared capacity auction pricing, increased generation margins and lower depreciation expense. Included in the variance is the impact of ceasing depreciation on the assets of the Disposal Group beginning in the second quarter of 2014. The foregone depreciation for the years ended December 31, 2015, and December 31, 2014, was approximately $40 million and $117 million, respectively.
Year Ended December 31, 2014 as Compared to 2013
The variance was primarily due to the 2014 $929 million pretax write-down of the carrying amount of the assets to the estimated fair value of the Disposal Group, based on the transaction price included in the purchase sale agreement (PSA), less estimated costs to sell and a $134 million pretax mark-to-market loss on economic hedges for the Disposal Group.
DUKE ENERGY CAROLINAS
Introduction
Management’s Discussion and Analysis should be read in conjunction with the accompanying Consolidated Financial Statements and Notes for the years ended December 31,
2015
,
2014
and
2013
.
Basis of Presentation
The results of operations and variance discussion for Duke Energy Carolinas is presented in a reduced disclosure format in accordance with General Instruction (I)(2)(a) of Form 10-K.
Results of Operations
|
|
Years Ended December 31,
|
||||||||||
|
(in millions)
|
2015
|
|
2014
|
|
Variance
|
|
|||||
|
Operating Revenues
|
$
|
7,229
|
|
$
|
7,351
|
|
$
|
(122
|
)
|
||
|
Operating Expenses
|
5,268
|
|
5,456
|
|
(188
|
)
|
|||||
|
Losses on Sales of Other Assets and Other, net
|
(1
|
)
|
—
|
|
(1
|
)
|
|||||
|
Operating Income
|
1,960
|
|
1,895
|
|
65
|
|
|||||
|
Other Income and Expense, net
|
160
|
|
172
|
|
(12
|
)
|
|||||
|
Interest Expense
|
412
|
|
407
|
|
5
|
|
|||||
|
Income Before Income Taxes
|
1,708
|
|
1,660
|
|
48
|
|
|||||
|
Income Tax Expense
|
627
|
|
588
|
|
39
|
|
|||||
|
Net Income
|
$
|
1,081
|
|
$
|
1,072
|
|
$
|
9
|
|
||
49
PART II
The following table shows the percent changes in GWh sales and average number of customers for Duke Energy Carolinas. The below percentages for retail customer classes represent billed sales only. Total sales includes billed and unbilled retail sales, and wholesale sales to incorporated municipalities and to public and private utilities and power marketers. Amounts are not weather normalized.
|
(Decrease) increase over prior year
|
2015
|
2014
|
|||
|
Residential sales
|
(0.2
|
)%
|
4.0
|
%
|
|
|
General service sales
|
1.0
|
%
|
2.4
|
%
|
|
|
Industrial sales
|
2.6
|
%
|
2.4
|
%
|
|
|
Wholesale power sales
|
1.5
|
%
|
5.7
|
%
|
|
|
Joint dispatch sales
|
(44.8
|
)%
|
(25.7
|
)%
|
|
|
Total sales
|
(0.3
|
)%
|
2.2
|
%
|
|
|
Average number of customers
|
1.3
|
%
|
1.0
|
%
|
|
Year Ended December 31, 2015 as Compared to 2014
Operating Revenues.
The variance was driven primarily by:
|
•
|
a $219 million decrease in fuel revenues driven primarily by lower natural gas and coal prices, as well as change in fuel mix, partially offset by an increase in demand from customers. Fuel revenues represent sales to retail and wholesale customers; and
|
|
•
|
a $78 million decrease in revenues to recover gross receipts taxes due to the North Carolina Tax Simplification and Rate Reduction Act, which terminated the collection of North Carolina gross receipts tax effective July 1, 2014.
|
Partially offset by:
|
•
|
a $78 million increase in retail pricing and rate riders, which primarily reflects increased revenues related to energy efficiency programs and the second year base rate step-up from the 2013 South Carolina rate case;
|
|
•
|
a $51 million increase from retail sales growth; and
|
|
•
|
a $40 million increase in wholesale power revenues, net of sharing, primarily due to additional volumes for customers served under long-term contracts.
|
Operating Expenses.
The variance was driven primarily by:
|
•
|
a $252 million decrease in fuel expense (including purchased power) primarily related to lower natural gas and coal prices, as well as change in fuel mix; and
|
|
•
|
a $47 million decrease in property and other tax expenses primarily due to the termination of the collection of the North Carolina gross receipts tax as mentioned above, partially offset by higher property tax expense.
|
Partially offset by:
|
•
|
a $71 million increase in operations and maintenance expenses primarily due to higher expenses at generating plants, including the prior-year benefit of the adoption of nuclear outage levelization, severance expenses related to cost saving initiatives, higher energy efficiency program costs and higher distribution maintenance expenses, partially offset by a 2014 litigation reserve related to the criminal investigation of the Dan River coal ash spill, lower costs associated with the Progress Energy merger, and repairs and remediation expenses associated with the Dan River coal ash discharge in 2014; and
|
|
•
|
a $42 million increase in depreciation and amortization expense primarily due to higher depreciation as a result of additional plant in service, partially offset by lower nuclear decommissioning costs and lower amortization of certain regulatory assets.
|
Other Income and Expenses, net
. The variance was primarily due to a decrease in recognition of post in-service equity returns for projects that had been completed prior to being reflected in customer rates.
Income Tax Expense.
The variance is primarily due to an increase in the effective tax rate and higher pretax income. The effective tax rates for the years ended December 31, 2015 and 2014 were 36.7 percent and 35.4 percent, respectively. The increase in the effective tax rate is primarily due to favorable audit settlements and changes in apportionment related to state income tax recorded in 2014, and a lower tax benefit related to the manufacturing deduction in 2015 as compared to 2014, partially offset by the non-deductible litigation reserve related to the criminal investigation of the Dan River coal ash spill recorded in 2014.
Matters Impacting Future Results
Duke Energy Carolinas is a party to multiple lawsuits and subject to fines and other penalties related to the Dan River coal ash release and operations at other North Carolina facilities with ash basins. The outcome of these lawsuits, fines and penalties could have an adverse impact on Duke Energy Carolinas’ financial position, results of operations and cash flows. See Note 5 to the Consolidated Financial Statements, “Commitments and Contingencies,” for additional information.
An order from regulatory authorities disallowing recovery of costs related to closure of ash impoundments could have an adverse impact on Duke Energy Carolinas' financial position, results of operations and cash flows. See Notes 4 and 9 to the Consolidated Financial Statements, “Regulatory Matters” and "Asset Retirement Obligations," respectively, for additional information.
50
PART II
On October 23, 2015, the EPA published in the Federal Register the CPP rule for regulating CO
2
emissions from existing fossil fuel-fired EGUs. The CPP establishes CO
2
emission rates and mass cap goals that apply to fossil fuel-fired generation. Under the CPP, states are required to develop and submit a final compliance plan, or an initial plan with an extension request, to the EPA by September 6, 2016, or no later than September 6, 2018, with an approved extension. These state plans are subject to EPA approval, with a federal plan applied to states that fail to submit a plan to the EPA or if a state plan is not approved. Legal challenges to the CPP have been filed by stakeholders and motions to stay the requirements of the rule pending the outcome of the litigation have been filed. The U.S. Supreme Court granted a Motion to Stay in February 2016, effectively blocking enforcement of the rule until legal challenges are resolved. Final resolution of these legal challenges could take several years. Compliance with CPP could cause the industry to replace coal generation with natural gas and renewables, especially in states that have significant CO
2
reduction targets under the rule. Costs to operate coal-fired generation plants continue to grow due to increasing environmental compliance requirements, including ash management costs unrelated to CPP, and this may result in the retirement of coal-fired generation plants earlier than the current useful lives. Duke Energy Carolinas continues to evaluate the need to retire generating facilities and plans to seek regulatory recovery, where appropriate, for amounts that have not been recovered upon asset retirements. However, recovery is subject to future regulatory approval, including the recovery of carrying costs on remaining book values, and therefore cannot be assured. In addition, Duke Energy Carolinas could incur increased fuel, purchased power, operation and maintenance, and other costs for replacement generation as a result of this rule. Duke Energy Carolinas cannot predict the outcome of these matters.
PROGRESS ENERGY
Introduction
Management’s Discussion and Analysis should be read in conjunction with the accompanying Consolidated Financial Statements and Notes for the years ended December 31,
2015
,
2014
and
2013
.
Basis of Presentation
The results of operations and variance discussion for Progress Energy is presented in a reduced disclosure format in accordance with General Instruction (I)(2)(a) of Form 10-K.
Results of Operations
|
|
Years Ended December 31,
|
||||||||||
|
(in millions)
|
2015
|
|
2014
|
|
Variance
|
|
|||||
|
Operating Revenues
|
$
|
10,277
|
|
$
|
10,166
|
|
$
|
111
|
|
||
|
Operating Expenses
|
8,142
|
|
8,159
|
|
(17
|
)
|
|||||
|
Gains on Sales of Other Assets and Other, net
|
25
|
|
11
|
|
14
|
|
|||||
|
Operating Income
|
2,160
|
|
2,018
|
|
142
|
|
|||||
|
Other Income and Expense, net
|
97
|
|
77
|
|
20
|
|
|||||
|
Interest Expense
|
670
|
|
675
|
|
(5
|
)
|
|||||
|
Income Before Income Taxes
|
1,587
|
|
1,420
|
|
167
|
|
|||||
|
Income Tax Expense
|
522
|
|
540
|
|
(18
|
)
|
|||||
|
Income from Continuing Operations
|
1,065
|
|
880
|
|
185
|
|
|||||
|
Loss from Discontinued Operations, net of tax
|
(3
|
)
|
(6
|
)
|
3
|
|
|||||
|
Net Income
|
1,062
|
|
874
|
|
188
|
|
|||||
|
Less: Net Income Attributable to Noncontrolling Interests
|
11
|
|
5
|
|
6
|
|
|||||
|
Net Income Attributable to Parent
|
$
|
1,051
|
|
$
|
869
|
|
$
|
182
|
|
||
Year Ended December 31, 2015 as Compared to 2014
Operating Revenues.
The variance was driven primarily by:
|
•
|
a $118 million increase in wholesale power revenues primarily due to a new NCEMPA contract effective August 1, 2015, coupled with increased overall demand rates and higher peak demand at Duke Energy Progress; and
|
|
•
|
an $82 million increase in fuel revenues driven primarily by increased demand at Duke Energy Progress and Duke Energy Florida. Fuel revenues represent sales to retail and wholesale customers.
|
Partially offset by:
|
•
|
a $113 decrease in rider revenues primarily due to a decrease in the nuclear cost recovery clause as a result of suspending Levy recovery, a decrease in energy conservation cost recovery clause and environmental cost recovery clause revenues due to lower recovery rates at Duke Energy Florida, partially offset by higher retail pricing and rate riders at Duke Energy Progress, which primarily reflect increased revenues related to the energy efficiency programs and the second year base rate step-up from the 2013 North Carolina retail rate case.
|
Operating Expenses.
The variance was driven primarily by:
|
•
|
a $29 million increase in fuel used in electric generation and purchased power primarily due to recovery of prior year under-collections of fuel and increased purchased power, partially offset by lower fuel prices at Duke Energy Florida; and
|
51
PART II
|
•
|
a $28 million increase in impairment charges primarily driven by a 2014 reversal of a prior-year impairment at Duke Energy Progress and current year impairments at Duke Energy Florida.
|
Partially offset by:
|
•
|
a $37 million decrease in operations and maintenance expenses. For Duke Energy Progress, this was primarily due to a 2014 litigation reserve related to the criminal investigation of the management of North Carolina coal ash basins, lower storm restoration costs and a favorable pension expense adjustment recorded in 2015, partially offset by higher nuclear refueling outage expenses, including the prior-year benefit of the adoption of nuclear outage levelization, due to three refueling outages in 2015 compared to one outage during the same period in 2014, higher nuclear costs related to additional ownership interest in assets acquired from NCEMPA, and severance expenses related to cost savings initiatives. For Duke Energy Florida, this was primarily due to a decrease in expenses related to costs that were recoverable through the energy conservation cost recovery clause and environmental cost recovery clause; a decrease in employee and executive benefits; partially offset by an increase in expenses related to various information technology projects;
|
|
•
|
a $25 million decrease in property and other taxes primarily due to the North Carolina Tax Simplification and Rate Reduction Act, which terminated the collection of North Carolina gross receipts tax effective July 1, 2014, at Duke Energy Progress, partially offset by higher property tax rates and higher revenue related taxes at Duke Energy Florida; and
|
|
•
|
a $12 million decrease in depreciation and amortization expenses primarily due to reductions in amounts recovered through the nuclear cost recovery clause and the environmental cost recovery clauses at Duke Energy Florida, partially offset by higher depreciation related to additional plant in service at Duke Energy Progress.
|
Gains on Sales of Other Assets and Other, net.
The variance was primarily due to the gain on sale of telecommunication leases.
Other Income and Expenses, net.
The variance is due to higher AFUDC equity, primarily due to nuclear plant expenditures at Duke Energy Progress.
Income Tax Expense.
The variance was primarily due to a lower effective tax rate. The effective tax rates for the years ended December 31, 2015 and 2014 were 32.9 percent and 38.0 percent, respectively. The decrease in the effective tax rate was primarily due to the non-deductible litigation reserve related to the criminal investigation of the management of the coal ash basins in 2014, an increase in AFUDC equity in 2015, state tax benefits from corporate restructuring in 2015, and the release of tax reserves in 2015 due to expired statutes.
Matters Impacting Future Results
Progress Energy is a party to multiple lawsuits and subject to fines and other penalties related to operations at certain North Carolina facilities with ash basins. The outcome of these lawsuits, fines and penalties could have an adverse impact on Progress Energy’s financial position, results of operations and cash flows. See Note 5 to the Consolidated Financial Statements, “Commitments and Contingencies,” for additional information.
An order from regulatory authorities disallowing recovery of costs related to closure of ash impoundments could have an adverse impact on Progress Energy’s financial position, results of operations and cash flows. See Notes 4 and 9 to the Consolidated Financial Statements, “Regulatory Matters” and "Asset Retirement Obligations," respectively, for additional information.
The FPSC approved an agreement on all securitization-related issues and issued a final financing order to securitize the Crystal River Unit 3 Regulatory asset with low-cost securities. Securitization will replace base rate recovery and result in a lower rate impact to customers. Securitization of the costs of the retired Crystal River Unit 3 Nuclear Plant would result in an initial acceleration of cash, followed by a reduction to Progress Energy's future results of operations and ongoing cash flows as it would no longer earn an equity return on these costs. Under a previous settlement agreement with the FPSC, the allowed return on equity for Crystal River Unit 3 is limited to 70 percent of the approved return on equity, which is currently 10.5 percent. Progress Energy expects the securitization bonds to be issued in the first half of 2016.
On October 23, 2015, the EPA published in the Federal Register the CPP rule for regulating CO
2
emissions from existing fossil fuel-fired EGUs. The CPP establishes CO
2
emission rates and mass cap goals that apply to fossil fuel-fired generation. Under the CPP, states are required to develop and submit a final compliance plan, or an initial plan with an extension request, to the EPA by September 6, 2016, or no later than September 6, 2018, with an approved extension. These state plans are subject to EPA approval, with a federal plan applied to states that fail to submit a plan to the EPA or if a state plan is not approved. Legal challenges to the CPP have been filed by stakeholders and motions to stay the requirements of the rule pending the outcome of the litigation have been filed. The U.S. Supreme Court granted a Motion to Stay in February 2016, effectively blocking enforcement of the rule until legal challenges are resolved. Final resolution of these legal challenges could take several years. Compliance with CPP could cause the industry to replace coal generation with natural gas and renewables, especially in states that have significant CO
2
reduction targets under the rule. Costs to operate coal-fired generation plants continue to grow due to increasing environmental compliance requirements, including ash management costs unrelated to CPP, and this may result in the retirement of coal-fired generation plants earlier than the current useful lives. Progress Energy continues to evaluate the need to retire generating facilities and plans to seek regulatory recovery, where appropriate, for amounts that have not been recovered upon asset retirements. However, recovery is subject to future regulatory approval, including the recovery of carrying costs on remaining book values, and therefore cannot be assured. In addition, Progress Energy could incur increased fuel, purchased power, operation and maintenance, and other costs for replacement generation as a result of this rule. Progress Energy cannot predict the outcome of these matters.
DUKE ENERGY PROGRESS
Introduction
Management’s Discussion and Analysis should be read in conjunction with the accompanying Consolidated Financial Statements and Notes for the years ended December 31,
2015
,
2014
and
2013
.
52
PART II
Basis of Presentation
The results of operations and variance discussion for Duke Energy Progress is presented in a reduced disclosure format in accordance with General Instruction (I)(2)(a) of Form 10-K.
Results of Operations
|
|
Years Ended December 31,
|
||||||||||
|
(in millions)
|
2015
|
|
2014
|
|
Variance
|
|
|||||
|
Operating Revenues
|
$
|
5,290
|
|
$
|
5,176
|
|
$
|
114
|
|
||
|
Operating Expenses
|
4,269
|
|
4,244
|
|
25
|
|
|||||
|
Gains on Sales of Other Asset and Other, net
|
3
|
|
3
|
|
—
|
|
|||||
|
Operating Income
|
1,024
|
|
935
|
|
89
|
|
|||||
|
Other Income and Expense, net
|
71
|
|
51
|
|
20
|
|
|||||
|
Interest Expense
|
235
|
|
234
|
|
1
|
|
|||||
|
Income Before Income Taxes
|
860
|
|
752
|
|
108
|
|
|||||
|
Income Tax Expense
|
294
|
|
285
|
|
9
|
|
|||||
|
Net Income
|
$
|
566
|
|
$
|
467
|
|
$
|
99
|
|
||
The following table shows the percent changes in GWh sales and average number of customers for Duke Energy Progress. The below percentages for retail customer classes represent billed sales only. Total sales includes billed and unbilled retail sales, and wholesale sales to incorporated municipalities and to public and private utilities and power marketers. Amounts are not weather normalized.
|
(Decrease) increase over prior year
|
2015
|
|
2014
|
|
|
|
Residential sales
|
(1.4
|
)%
|
5.1
|
%
|
|
|
General service sales
|
0.9
|
%
|
2.1
|
%
|
|
|
Industrial sales
|
(0.3
|
)%
|
(2.9
|
)%
|
|
|
Wholesale power sales
|
13.0
|
%
|
(2.3
|
)%
|
|
|
Joint dispatch sales
|
14.1
|
%
|
75.3
|
%
|
|
|
Total sales
|
3.2
|
%
|
4.4
|
%
|
|
|
Average number of customers
|
1.4
|
%
|
1.1
|
%
|
|
Year Ended December 31, 2015 as Compared to 2014
Operating Revenues.
The variance was driven primarily by:
|
•
|
a $100 million increase in wholesale power revenues primarily due to a new NCEMPA contract effective August 1, 2015, and increased demand rates charged along with higher peak demand;
|
|
•
|
a $34 million increase in retail pricing and rate riders, which primarily reflect increased revenues related to the energy efficiency programs and the second year base rate step-up from the 2013 North Carolina retail rate case; and
|
|
•
|
a $26 million increase in fuel revenues driven primarily by increased demand from wholesale and retail customers.
|
Partially offset by:
|
•
|
a $44 million decrease in revenues to recover gross receipts taxes due to the North Carolina Tax Simplification and Rate Reduction Act, which terminated the collection of North Carolina gross receipts tax effective July 1, 2014.
|
Operating Expenses.
The variance was driven primarily by:
|
•
|
a $61 million increase in depreciation and amortization expenses primarily due to higher depreciation related to additional plant in service; and
|
|
•
|
an $18 million reversal in 2014 of a prior-year impairment. These charges related to planned transmission projects for which recovery is not expected, and certain cost associated with mitigation sales pursuant to merger settlement agreements with the FERC.
|
Partially offset by:
|
•
|
a $34 million decrease in property and other taxes primarily due to the termination of the collection of the North Carolina gross receipts tax as mentioned above; and
|
|
•
|
an $18 million decrease in operations and maintenance expenses, primarily due to a 2014 litigation reserve related to the criminal investigation of the management of North Carolina coal ash basins, lower storm restoration costs and a favorable pension expense adjustment recorded in 2015, partially offset by higher nuclear refueling outage expenses, including the prior-year benefit of the adoption of nuclear outage levelization, due to three refueling outages in 2015 compared to one outage during the same period in 2014, higher nuclear costs related to additional ownership interest in assets acquired from NCEMPA, and severance expenses in 2015 related to cost savings initiatives.
|
53
PART II
Other Income and Expenses, net.
The variance is due to higher AFUDC equity, primarily due to nuclear plant expenditures.
Income Tax Expense.
The effective tax rates for the years ended December 31, 2015 and 2014 were 34.2 percent and 37.9 percent, respectively. The decrease in the effective tax rate was primarily due to the non-deductible litigation reserve related to the criminal investigation of the management of the coal ash basins in 2014, an increase in AFUDC equity, and the reduction of the North Carolina statutory corporate state income tax rate.
Matters Impacting Future Results
Duke Energy Progress is a party to multiple lawsuits and subject to fines and other penalties related to operations at certain North Carolina facilities with ash basins. The outcome of these lawsuits, fines and penalties could have an adverse impact on Duke Energy Progress’ financial position, results of operations and cash flows. See Note 5 to the Consolidated Financial Statements, “Commitments and Contingencies,” for additional information.
An order from regulatory authorities disallowing recovery of costs related to closure of ash impoundments could have an adverse impact on Duke Energy Progress’ financial position, results of operations and cash flows. See Notes 4 and 9 to the Consolidated Financial Statements, “Regulatory Matters” and "Asset Retirement Obligations," respectively, for additional information.
On October 23, 2015, the EPA published in the Federal Register the CPP rule for regulating CO
2
emissions from existing fossil fuel-fired EGUs. The CPP establishes CO
2
emission rates and mass cap goals that apply to fossil fuel-fired generation. Under the CPP, states are required to develop and submit a final compliance plan, or an initial plan with an extension request, to the EPA by September 6, 2016, or no later than September 6, 2018, with an approved extension. These state plans are subject to EPA approval, with a federal plan applied to states that fail to submit a plan to the EPA or if a state plan is not approved. Legal challenges to the CPP have been filed by stakeholders and motions to stay the requirements of the rule pending the outcome of the litigation have been filed. The U.S. Supreme Court granted a Motion to Stay in February 2016, effectively blocking enforcement of the rule until legal challenges are resolved. Final resolution of these legal challenges could take several years. Compliance with CPP could cause the industry to replace coal generation with natural gas and renewables, especially in states that have significant CO
2
reduction targets under the rule. Costs to operate coal-fired generation plants continue to grow due to increasing environmental compliance requirements, including ash management costs unrelated to CPP, and this may result in the retirement of coal-fired generation plants earlier than the current useful lives. Duke Energy Progress continues to evaluate the need to retire generating facilities and plans to seek regulatory recovery, where appropriate, for amounts that have not been recovered upon asset retirements. However, recovery is subject to future regulatory approval, including the recovery of carrying costs on remaining book values, and therefore cannot be assured. In addition, Duke Energy Progress could incur increased fuel, purchased power, operation and maintenance, and other costs for replacement generation as a result of this rule. Duke Energy Progress cannot predict the outcome of these matters.
DUKE ENERGY FLORIDA
Introduction
Management’s Discussion and Analysis should be read in conjunction with the accompanying Consolidated Financial Statements and Notes for the years ended December 31,
2015
,
2014
and
2013
.
Basis of Presentation
The results of operations and variance discussion for Duke Energy Florida is presented in a reduced disclosure format in accordance with General Instruction (I)(2)(a) of Form 10-K.
Results of Operations
|
|
Years Ended December 31,
|
||||||||||
|
(in millions)
|
2015
|
|
2014
|
|
Variance
|
|
|||||
|
Operating Revenues
|
$
|
4,977
|
|
$
|
4,975
|
|
$
|
2
|
|
||
|
Operating Expenses
|
3,862
|
|
3,898
|
|
(36
|
)
|
|||||
|
Gains on Sales of Other Asset and Other, net
|
—
|
|
1
|
|
(1
|
)
|
|||||
|
Operating Income
|
1,115
|
|
1,078
|
|
37
|
|
|||||
|
Other Income and Expense, net
|
24
|
|
20
|
|
4
|
|
|||||
|
Interest Expense
|
198
|
|
201
|
|
(3
|
)
|
|||||
|
Income Before Income Taxes
|
941
|
|
897
|
|
44
|
|
|||||
|
Income Tax Expense
|
342
|
|
349
|
|
(7
|
)
|
|||||
|
Net Income
|
$
|
599
|
|
$
|
548
|
|
$
|
51
|
|
||
54
PART II
The following table shows the percent changes in GWh sales and average number of customers for Duke Energy Florida. The below percentages for retail customer classes represent billed sales only. Wholesale power sales include both billed and unbilled sales. Total sales includes billed and unbilled retail sales, and wholesale sales to incorporated municipalities and to public and private utilities and power marketers. Amounts are not weather normalized.
|
Increase (decrease) over prior year
|
2015
|
|
2014
|
|
|
|
Residential sales
|
4.9
|
%
|
2.7
|
%
|
|
|
General service sales
|
2.4
|
%
|
0.5
|
%
|
|
|
Industrial sales
|
0.8
|
%
|
1.9
|
%
|
|
|
Wholesale and other
|
(2.3
|
)%
|
(5.9
|
)%
|
|
|
Total sales
|
3.5
|
%
|
1.9
|
%
|
|
|
Average number of customers
|
1.5
|
%
|
1.5
|
%
|
|
Year Ended December 31, 2015 as Compared to 2014
Operating Revenues.
The variance was driven primarily by:
|
•
|
a $56 million increase in fuel and capacity revenues driven by increased usage. Fuel revenues represent sales to retail and wholesale customers;
|
|
•
|
a $37 million increase due to retail sales growth;
|
|
•
|
a $34 million increase driven by favorable weather conditions. Weather was also favorable to normal in 2015; and
|
|
•
|
an $18 million increase in wholesale power revenues primarily driven by increased capacity rates on contracts.
|
Partially offset by:
|
•
|
a $147 million decrease in rider revenues primarily due to a decrease in the nuclear cost recovery clause as a result of suspending Levy recovery, a decrease in energy conservation cost recovery clause and environmental cost recovery clause revenues due to lower recovery rates.
|
Operating Expenses.
The variance was driven primarily by:
|
•
|
a $72 million decrease in depreciation and amortization expense due to reductions in amounts recovered through the nuclear cost recovery clause and the environmental cost recovery clause; and
|
|
•
|
a $15 million decrease in operations and maintenance expense primarily due to a decrease in expenses related to costs that were recoverable through the energy conservation cost recovery clause and environmental cost recovery clause; and a decrease in employee and executive benefits; partially offset by an increase in expenses related to various information technology projects.
|
Partially offset by:
|
•
|
a $37 million increase in fuel used in electric generation and purchase power related to recovery of prior year under-collections of fuel expense and increased purchased power, partially offset by lower fuel prices; and
|
|
•
|
a $9 million increase in property and other taxes due to higher property tax rates and higher revenue related taxes.
|
Income Tax Expense.
The effective tax rates for the years ended December 31, 2015 and 2014 were 36.3 percent and 38.9 percent, respectively. The decrease in the effective tax rate was primarily due to a release of tax reserves due to expired statutes.
Matters Impacting Future Results
The FPSC approved an agreement on all securitization-related issues and issued a final financing order to securitize the Crystal River Unit 3 Regulatory asset with low-cost securities. Securitization will replace base rate recovery and result in a lower rate impact to customers. Securitization of the costs of the retired Crystal River Unit 3 Nuclear Plant would result in an initial acceleration of cash, followed by a reduction to Duke Energy Florida's future results of operations and ongoing cash flows as it would no longer earn an equity return on these costs. Under a previous settlement agreement with the FPSC, the allowed return on equity for Crystal River Unit 3 is limited to 70 percent of the approved return on equity, which is currently 10.5 percent. Duke Energy Florida expects to issue the securitization bonds in the first half of 2016.
55
PART II
On October 23, 2015, the EPA published in the Federal Register the CPP rule for regulating CO
2
emissions from existing fossil fuel-fired EGUs. The CPP establishes CO
2
emission rates and mass cap goals that apply to fossil fuel-fired generation. Under the CPP, states are required to develop and submit a final compliance plan, or an initial plan with an extension request, to the EPA by September 6, 2016, or no later than September 6, 2018, with an approved extension. These state plans are subject to EPA approval, with a federal plan applied to states that fail to submit a plan to the EPA or if a state plan is not approved. Legal challenges to the CPP have been filed by stakeholders and motions to stay the requirements of the rule pending the outcome of the litigation have been filed. The U.S. Supreme Court granted a Motion to Stay in February 2016, effectively blocking enforcement of the rule until legal challenges are resolved. Final resolution of these legal challenges could take several years. Compliance with CPP could cause the industry to replace coal generation with natural gas and renewables, especially in states that have significant CO
2
reduction targets under the rule. Costs to operate coal-fired generation plants continue to grow due to increasing environmental compliance requirements, including ash management costs unrelated to CPP, and this may result in the retirement of coal-fired generation plants earlier than the current useful lives. Duke Energy Florida continues to evaluate the need to retire generating facilities and plans to seek regulatory recovery, where appropriate, for amounts that have not been recovered upon asset retirements. However, recovery is subject to future regulatory approval, including the recovery of carrying costs on remaining book values, and therefore cannot be assured. In addition, Duke Energy Florida could incur increased fuel, purchased power, operation and maintenance, and other costs for replacement generation as a result of this rule. Duke Energy Florida cannot predict the outcome of these matters.
DUKE ENERGY OHIO
Introduction
Management’s Discussion and Analysis should be read in conjunction with the accompanying Consolidated Financial Statements and Notes for the years ended December 31,
2015
,
2014
and
2013
.
Basis of Presentation
The results of operations and variance discussion for Duke Energy Ohio is presented in a reduced disclosure format in accordance with General Instruction (I)(2)(a) of Form 10-K.
Results of Operations
|
|
Years Ended December 31,
|
||||||||
|
(in millions)
|
2015
|
|
2014
|
|
Variance
|
|
|||
|
Operating Revenues
|
$
|
1,905
|
|
$
|
1,913
|
|
$
|
(8
|
)
|
|
Operating Expenses
|
1,610
|
|
1,727
|
|
(117
|
)
|
|||
|
Gains on Sales of Other Assets and Other, net
|
8
|
|
1
|
|
7
|
|
|||
|
Operating Income
|
303
|
|
187
|
|
116
|
|
|||
|
Other Income and Expense, net
|
6
|
|
10
|
|
(4
|
)
|
|||
|
Interest Expense
|
79
|
|
86
|
|
(7
|
)
|
|||
|
Income from Continuing Operations Before Income Taxes
|
230
|
|
111
|
|
119
|
|
|||
|
Income Tax Expense from Continuing Operations
|
81
|
|
43
|
|
38
|
|
|||
|
Income from Continuing Operations
|
149
|
|
68
|
|
81
|
|
|||
|
Income (Loss) from Discontinued Operations, net of tax
|
23
|
|
(563
|
)
|
586
|
|
|||
|
Net Income (Loss)
|
$
|
172
|
|
$
|
(495
|
)
|
$
|
667
|
|
The following table shows the percent changes in Regulated Utilities' GWh sales and average number of customers for Duke Energy Ohio. The below percentages for retail customer classes represent billed sales only. Total sales includes billed and unbilled retail sales, and wholesale sales to incorporated municipalities and to public and private utilities and power marketers. Amounts are not weather normalized.
|
(Decrease) increase over prior year
|
2015
|
|
2014
|
|
|
|
Residential sales
|
(2.2
|
)%
|
1.3
|
%
|
|
|
General service sales
|
(0.1
|
)%
|
0.8
|
%
|
|
|
Industrial sales
|
0.4
|
%
|
3.3
|
%
|
|
|
Wholesale power sales
|
222.3
|
%
|
(24.9
|
)%
|
|
|
Total sales
|
2.8
|
%
|
0.7
|
%
|
|
|
Average number of customers
|
0.7
|
%
|
0.6
|
%
|
|
Year Ended December 31, 2015 as Compared to 2014
Operating Revenues
.
The variance was driven primarily by:
|
•
|
a $66 million decrease in fuel revenues primarily driven by lower electric fuel and natural gas costs and decreased sales volume;
|
|
•
|
an $11 million decrease in electric and natural gas sales to retail customers due to unfavorable weather conditions compared to both the prior year and to normal weather; and
|
|
•
|
a $10 million decrease due to an Ohio regulatory order that reduced certain energy efficiency rider revenues (see Note 4 to the Consolidated Financial Statements, "Regulatory Matters.").
|
56
PART II
Partially offset by:
|
•
|
a $29 million increase in Kentucky wholesale revenues primarily due to the purchase of the additional capacity in the East Bend Station in December 2014, the profits from which are shared with Duke Energy Kentucky retail customers;
|
|
•
|
a $19 million increase in regulated natural gas rate riders primarily due to rate increases;
|
|
•
|
a $19 million increase in Ohio other revenues related to OVEC; and
|
|
•
|
a $16 million increase in electric rate riders, excluding Ohio energy efficiency, due to rate increases and 2014 true-ups.
|
Operating Expenses
. The variance was driven primarily by the $94 million pretax impairment related to OVEC in 2014.
Income Tax Expense.
The variance was primarily due to an increase in pretax income, partially offset by a decrease in the effective tax rate. The effective tax rates for the years ended December 31, 2015 and 2014 were 35.2 percent and 38.9 percent, respectively. The decrease in the effective tax rate was primarily due to a favorable adjustment in 2015.
Discontinued Operations, Net of Tax.
The variance was primarily driven by the 2014 impairment and unrealized mark-to-market losses on economic hedges for the Disposal Group and favorable operating results in 2015, partially offset by a litigation reserve recorded in 2015, as discussed in Note 5, "Commitments and Contingencies," to the Consolidated Financial Statements. Operating results in 2015 were favorable primarily due to higher PJM capacity revenues related to higher average cleared capacity auction pricing, increased generation margins and lower depreciation expense. Included in the variance is the impact of ceasing depreciation on the assets of the Disposal Group beginning in the second quarter of 2014. The foregone depreciation for the year ended December 31, 2015, and December 31, 2014, was approximately $40 million and $121 million, respectively.
Matters Impacting Future Results
In 2013, a FERC ALJ issued an initial decision that Duke Energy Ohio is responsible for costs associated with certain MVP costs, a type of MTEP cost, approved by MISO prior to the date of Duke Energy Ohio’s withdrawal. On October 29, 2015, the FERC issued an order reversing the ALJ's decision. FERC ruled that Duke Energy Ohio has no liability for MVP costs after its withdrawal from MISO. On November 30, 2015, MISO filed with the FERC a request for rehearing. If Duke Energy Ohio is deemed responsible for these costs upon appeal, and if the regulatory commissions disallow recovery of these costs, there would be an adverse impact to Duke Energy Ohio's financial position, results of operations and cash flows. See Note 4 to the Consolidated Financial Statements, “Regulatory Matters,” for additional information.
An order from regulatory authorities disallowing recovery of costs related to closure of ash basins could have an adverse impact on Duke Energy Ohio's financial position, results of operations and cash flows. See Notes 4 and 9 to the Consolidated Financial Statements, “Regulatory Matters” and "Asset Retirement Obligations," respectively, for additional information.
Duke Energy Ohio’s nonregulated Beckjord station, a facility retired during 2014, is not subject to the recently enacted EPA rule related to the disposal of CCR from electric utilities. However, if costs are incurred as a result of environmental regulations or to mitigate risk associated with on-site storage of coal ash at the facility, the costs could have an adverse impact on Duke Energy Ohio's financial position, results of operations and cash flows.
On October 23, 2015, the EPA published in the Federal Register the CPP rule for regulating CO
2
emissions from existing fossil fuel-fired EGUs. The CPP establishes CO
2
emission rates and mass cap goals that apply to fossil fuel-fired generation. Under the CPP, states are required to develop and submit a final compliance plan, or an initial plan with an extension request, to the EPA by September 6, 2016, or no later than September 6, 2018, with an approved extension. These state plans are subject to EPA approval, with a federal plan applied to states that fail to submit a plan to the EPA or if a state plan is not approved. Legal challenges to the CPP have been filed by stakeholders and motions to stay the requirements of the rule pending the outcome of the litigation have been filed. The U.S. Supreme Court granted a Motion to Stay in February 2016, effectively blocking enforcement of the rule until legal challenges are resolved. Final resolution of these legal challenges could take several years. Compliance with CPP could cause the industry to replace coal generation with natural gas and renewables, especially in states that have significant CO
2
reduction targets under the rule. Costs to operate coal-fired generation plants continue to grow due to increasing environmental compliance requirements, including ash management costs unrelated to CPP, and this may result in the retirement of coal-fired generation plants earlier than the current useful lives. Duke Energy Ohio continues to evaluate the need to retire generating facilities and plans to seek regulatory recovery, where appropriate, for amounts that have not been recovered upon asset retirements. However, recovery is subject to future regulatory approval, including the recovery of carrying costs on remaining book values, and therefore cannot be assured. In addition, Duke Energy Ohio could incur increased fuel, purchased power, operation and maintenance, and other costs for replacement generation as a result of this rule. Duke Energy Ohio cannot predict the outcome of these matters.
DUKE ENERGY INDIANA
Introduction
Management’s Discussion and Analysis should be read in conjunction with the accompanying Consolidated Financial Statements and Notes for the years ended December 31,
2015
,
2014
and
2013
.
Basis of Presentation
The results of operations and variance discussion for Duke Energy Indiana is presented in a reduced disclosure format in accordance with General Instruction (I)(2)(a) of Form 10-K.
57
PART II
Results of Operations
|
|
Years Ended December 31,
|
||||||||
|
(in millions)
|
2015
|
|
2014
|
|
Variance
|
|
|||
|
Operating Revenues
|
$
|
2,890
|
|
$
|
3,175
|
|
$
|
(285
|
)
|
|
Operating Expenses
|
2,247
|
|
2,470
|
|
(223
|
)
|
|||
|
Gains on Sales of Other Assets and Other, net
|
1
|
|
—
|
|
1
|
|
|||
|
Operating Income
|
644
|
|
705
|
|
(61
|
)
|
|||
|
Other Income and Expense, net
|
11
|
|
22
|
|
(11
|
)
|
|||
|
Interest Expense
|
176
|
|
171
|
|
5
|
|
|||
|
Income Before Income Taxes
|
479
|
|
556
|
|
(77
|
)
|
|||
|
Income Tax Expense
|
163
|
|
197
|
|
(34
|
)
|
|||
|
Net Income
|
$
|
316
|
|
$
|
359
|
|
$
|
(43
|
)
|
The following table shows the percent changes in GWh sales and average number of customers for Duke Energy Indiana. The below percentages for retail customer classes represent billed sales only. Total sales includes billed and unbilled retail sales, and wholesale sales to incorporated municipalities and to public and private utilities and power marketers. Amounts are not weather normalized.
|
(Decrease) increase over prior year
|
2015
|
|
2014
|
|
|
|
Residential sales
|
(4.1
|
)%
|
2.1
|
%
|
|
|
General service sales
|
(0.5
|
)%
|
—
|
%
|
|
|
Industrial sales
|
(1.4
|
)%
|
2.5
|
%
|
|
|
Wholesale power sales
|
9.4
|
%
|
(8.8
|
)%
|
|
|
Total sales
|
0.3
|
%
|
(0.8
|
)%
|
|
|
Average number of customers
|
0.8
|
%
|
0.6
|
%
|
|
Year Ended December 31, 2015 as Compared to 2014
Operating Revenues.
The variance was driven primarily by:
|
•
|
a $265 million decrease in fuel revenues primarily due to a decrease in fuel rates as a result of lower fuel and purchased power costs.
|
Operating Expenses.
The variance was driven primarily by:
|
•
|
a $277 million decrease in fuel used in electric generation and purchased power primarily due to lower fuel prices; and
|
|
•
|
a $67 million decrease in property and other taxes, primarily as a result of lower sales and use tax. In 2014, an approximate $40 million other tax reserve was recorded, a portion of which was reversed in 2015 upon settlement of the matter.
|
Partially offset by:
|
•
|
an $88 million impairment charge related to the 2015 Edwardsport IGCC settlements. See Note 4 to the Consolidated Financial Statements, “Regulatory Matters,” for additional information.
|
Other Income and Expense, net.
The variance was primarily due to lower AFUDC equity due to Cayuga scrubbers placed into service in July 2015 and a lower rate compared to the prior year, partially offset by favorable interest income.
Income Tax Expense.
The variance was primarily due to a decrease in pretax income and in the effective tax rate. The effective tax rates for the years ended December 31, 2015 and 2014 were 34.0 percent and 35.5 percent, respectively. The decrease in the effective tax rate was primarily due to a favorable adjustment in 2015.
Matters Impacting Future Results
Duke Energy Indiana is evaluating converting Wabash River Unit 6 to a natural gas-fired unit or retiring the unit earlier than its current estimated useful life. If Duke Energy Indiana elects early retirement of the unit, recovery of remaining book values and associated carrying costs totaling approximately $40 million could be subject to future regulatory approvals and therefore cannot be assured.
On April 17, 2015, the EPA published in the Federal Register a rule to regulate the disposal of CCR from electric utilities as solid waste. Duke Energy Indiana has interpreted the rule to identify the coal ash basin sites impacted and has assessed the amounts of coal ash subject to the rule and a method of compliance. Duke Energy Indiana's interpretation of the requirements of the CCR rule is subject to potential legal challenges and further regulatory approvals, which could result in additional ash basin closure requirements, higher costs of compliance and greater asset retirement obligations. An order from regulatory authorities disallowing recovery of costs related to closure of ash basins could have an adverse impact on Duke Energy Indiana's financial position, results of operations and cash flows.
58
PART II
In September 2015, Duke Energy Indiana entered into a settlement agreement with multiple parties that will resolve all disputes, claims and issues from the IURC proceedings regarding the Edwardsport IGCC generating facility. In January 2016, additional parties joined a revised settlement. Pursuant to the terms of the agreement, Duke Energy Indiana recognized an impairment and related charges of $93 million. Additionally, the settlement agreement stipulates the recovery of the remaining regulatory asset over an eight-year period and confirms the conclusion that the in-service date for accounting and ratemaking purposes will remain June 7, 2013. The settlement agreement will also impose a cost cap for recoverable operations and maintenance retail costs of $73 million in 2016 and $77 million in 2017 as well as a cost cap for ongoing capital expenditures through 2017. As part of the settlement, Duke Energy Indiana committed to cease burning coal at Gallagher Station Unit 2 and 4 by the end of 2022. The settlement is subject to IURC approval and, if approved, would resolve and close a number of outstanding issues pending before the IURC related to post commercial operating performance and recovery of ongoing operating and capital costs at Edwardsport. If the settlement is not approved, outstanding issues before the IURC related to Edwardsport would resume, the ultimate resolution of which could have an adverse impact on Duke Energy Indiana's financial position, results of operations and cash flows. In addition, the inability to manage operating and capital costs under caps imposed under the settlement could have an adverse impact on Duke Energy Indiana's financial position, results of operations and cash flows. See Note 4 to the Consolidated Financial Statements, “Regulatory Matters,” for additional information.
On October 23, 2015, the EPA published in the Federal Register the CPP rule for regulating CO
2
emissions from existing fossil fuel-fired EGUs. The CPP establishes CO
2
emission rates and mass cap goals that apply to fossil fuel-fired generation. Under the CPP, states are required to develop and submit a final compliance plan, or an initial plan with an extension request, to the EPA by September 6, 2016, or no later than September 6, 2018, with an approved extension. These state plans are subject to EPA approval, with a federal plan applied to states that fail to submit a plan to the EPA or if a state plan is not approved. Legal challenges to the CPP have been filed by stakeholders and motions to stay the requirements of the rule pending the outcome of the litigation have been filed. The U.S. Supreme Court granted a Motion to Stay in February 2016, effectively blocking enforcement of the rule until legal challenges are resolved. Final resolution of these legal challenges could take several years. Compliance with CPP could cause the industry to replace coal generation with natural gas and renewables, especially in states that have significant CO
2
reduction targets under the rule. Costs to operate coal-fired generation plants continue to grow due to increasing environmental compliance requirements, including ash management costs unrelated to CPP, and this may result in the retirement of coal-fired generation plants earlier than the current useful lives. Duke Energy Indiana continues to evaluate the need to retire generating facilities and plans to seek regulatory recovery, where appropriate, for amounts that have not been recovered upon asset retirements. However, recovery is subject to future regulatory approval, including the recovery of carrying costs on remaining book values, and therefore cannot be assured. In addition, Duke Energy Indiana could incur increased fuel, purchased power, operation and maintenance, and other costs for replacement generation as a result of this rule. Duke Energy Indiana cannot predict the outcome of these matters.
CRITICAL ACCOUNTING POLICIES AND ESTIMATES
Preparation of financial statements requires the application of accounting policies, judgments, assumptions and estimates that can significantly affect the reported results of operations and the amounts of assets and liabilities reported in the financial statements. Judgments made include the likelihood of success of particular projects, possible legal and regulatory challenges, earnings assumptions on pension and other benefit fund investments and anticipated recovery of costs, especially through regulated operations.
Management discusses these policies, estimates and assumptions with senior members of management on a regular basis and provides periodic updates on management decisions to the Audit Committee of the Board of Directors. Management believes the areas described below require significant judgment in the application of accounting policy or in making estimates and assumptions that are inherently uncertain and that may change in subsequent periods.
For further information, see Note 1 to the Consolidated Financial Statements, "Summary of Significant Accounting Policies."
Regulatory Accounting
Regulated Utilities, Duke Energy’s regulated operations, meets the criteria for application of regulatory accounting treatment for substantially all of its operations. As a result, Duke Energy records assets and liabilities that would not be recorded for nonregulated entities. Regulatory assets generally represent incurred costs that have been deferred because such costs are probable of future recovery in customer rates. Regulatory liabilities generally represent obligations to make refunds or reduce rates to customers for previous collections or for costs that have yet to be incurred.
Management continually assesses whether recorded regulatory assets are probable of future recovery by considering factors such as applicable regulatory environment changes, historical regulatory treatment for similar costs in Duke Energy’s jurisdictions, litigation of rate orders, recent rate orders to other regulated entities, levels of actual return on equity compared to approved rates of return on equity, and the status of any pending or potential deregulation legislation. If future recovery of costs ceases to be probable, asset write-offs would be recognized in operating income. Additionally, regulatory agencies can provide flexibility in the manner and timing of the depreciation of property, plant and equipment, recognition of asset retirement costs, and amortization of regulatory assets, or may disallow recovery of all or a portion of certain assets. For further information on regulatory assets and liabilities, see Note
4
to the Consolidated Financial Statements, “Regulatory Matters.”
As required by regulated operations accounting rules, significant judgment can be required to determine if an otherwise recognizable incurred cost, such as closure costs for ash impoundments, qualifies to be deferred for future recovery as a regulatory asset. Significant judgment can also be required to determine if revenues previously recognized are for entity specific costs that are no longer expected to be incurred and are therefore a regulatory liability. See Note 4 to the Consolidated Financial Statements, "Regulatory Matters," for a more in-depth discussion of Regulatory Assets and Liabilities.
59
PART II
Regulatory accounting rules also require recognition of a disallowance (also called "impairment") loss if it becomes probable that part of the cost of a plant under construction (or a recently completed plant or an abandoned plant) will be disallowed for ratemaking purposes and a reasonable estimate of the amount of the disallowance can be made. For example, if a cost cap is set for a plant still under construction, the amount of the disallowance is a result of a judgment as to the ultimate cost of the plant. Other disallowances can require judgments on allowed future rate recovery. See Note
4
to the Consolidated Financial Statements, “Regulatory Matters,” for a discussion of disallowances recorded related to the Edwardsport IGCC Plant and the retired Crystal River Unit 3 Nuclear Plant.
When it becomes probable that regulated generation, transmission or distribution assets will be abandoned, the cost of the asset is removed from plant in service. The value that may be retained as a regulatory asset on the balance sheet for the abandoned property is dependent upon amounts that may be recovered through regulated rates, including any return. As such, an impairment charge, if any, could be offset by the establishment of a regulatory asset if rate recovery is probable. The impairment for a disallowance of costs for regulated plants under construction, recently completed or abandoned is based on discounted cash flows.
For further information, see Note 4 to the Consolidated Financial Statements, "Regulatory Matters."
Goodwill Impairment Assessments
Duke Energy allocates goodwill to reporting units, which are either the Business Segments listed in Note 3 or one level below based on how the Business Segment is managed. Duke Energy is required to test goodwill for impairment at least annually and more frequently if it is more likely than not that the fair value is less than the carrying value. Duke Energy performs its annual impairment test as of August 31.
Application of the goodwill impairment test requires management judgment, including determining the fair value of the reporting unit, which management estimates using a weighted combination of the income approach, which estimates fair value based on discounted cash flows, and the market approach, which estimates fair value based on market comparables within the utility and energy industries. Significant assumptions used in these fair value analyses include discount and growth rates, future rates of return expected to result from ongoing rate regulation, utility sector market performance and transactions, projected operating and capital cash flows for Duke Energy’s business and the fair value of debt.
Estimated future cash flows under the income approach are based to a large extent on Duke Energy’s internal business plan, and adjusted as appropriate for Duke Energy’s views of market participant assumptions. Duke Energy’s internal business plan reflects management’s assumptions related to customer usage and attrition based on internal data and economic data obtained from third-party sources, projected commodity pricing data and potential changes in environmental regulations. The business plan assumes the occurrence of certain events in the future, such as the outcome of future rate filings, future approved rates of returns on equity, anticipated earnings/returns related to significant future capital investments, continued recovery of cost of service, the renewal of certain contracts and the future of renewable tax credits. Management also makes assumptions regarding operation, maintenance and general and administrative costs based on the expected outcome of the aforementioned events. In estimating cash flows, Duke Energy incorporates expected growth rates, regulatory and economic stability, the ability to renew contracts and other factors, into its revenue and expense forecasts.
One of the most significant assumptions that Duke Energy utilizes in determining the fair value of its reporting units under the income approach is the discount rate applied to the estimated future cash flows. Management determines the appropriate discount rate for each of its reporting units based on the weighted average cost of capital (WACC) for each individual reporting unit. The WACC takes into account both the after-tax cost of debt and cost of equity. A major component of the cost of equity is the current risk-free rate on 20-year U.S. Treasury bonds. In the
2015
impairment tests, Duke Energy considered implied WACCs for certain peer companies in determining the appropriate WACC rates to use in its analysis. As each reporting unit has a different risk profile based on the nature of its operations, including factors such as regulation, the WACC for each reporting unit may differ. Accordingly, the WACCs were adjusted, as appropriate, to account for company specific risk premiums. The discount rates used for calculating the fair values as of August 31,
2015
, for each of Duke Energy’s domestic reporting units ranged from 5.9 percent to 7.1 percent.
For Duke Energy’s international operations, a country-specific risk adder based on the average risk premium for each separate country in which International Energy operates was added to the base discount rate to reflect the differing risk profiles. This resulted in a discount rate for the August 31,
2015
, goodwill impairment test for the international operations of 10.5 percent.
The underlying assumptions and estimates are made as of a point in time. Subsequent changes, particularly changes in the discount rates, authorized regulated rates of return or growth rates inherent in management’s estimates of future cash flows, could result in future impairment charges.
The majority of Duke Energy’s business is in environments that are either fully or partially rate-regulated. In such environments, revenue requirements are adjusted periodically by regulators based on factors including levels of costs, sales volumes and costs of capital. Accordingly, Duke Energy’s regulated utilities operate to some degree with a buffer from the direct effects, positive or negative, of significant swings in market or economic conditions. However, significant changes in discount rates over a prolonged period may have a material impact on the fair value of equity.
As of August 31,
2015
, all of the reporting units’ estimated fair value of equity substantially exceeded the carrying value of equity.
For further information, see Note 11 to the Consolidated Financial Statements, "Goodwill and Intangible Assets."
Long-Lived Asset Impairment Assessments, Excluding Regulated Operations
Property, plant and equipment, excluding plant held for sale, is stated at the lower of carrying value (historical cost less accumulated depreciation and previously recorded impairments) or fair value, if impaired. Duke Energy evaluates property, plant and equipment for impairment when events or changes in circumstances (such as a significant change in cash flow projections, the determination that it is more likely than not an asset or asset group will be sold) indicate the carrying value of such assets may not be recoverable. The determination of whether an impairment has occurred is based on an estimate of undiscounted future cash flows attributable to the assets, as compared with their carrying value.
60
PART II
Performing an impairment evaluation involves a significant degree of estimation and judgment in areas such as identifying circumstances that indicate an impairment may exist, identifying and grouping affected assets, and developing the undiscounted future cash flows. If an impairment has occurred, the amount of the impairment recognized is determined by estimating the fair value and recording a loss if the carrying value is greater than the fair value. Additionally, determining fair value requires probability weighting future cash flows to reflect expectations about possible variations in their amounts or timing and the selection of an appropriate discount rate. Although cash flow estimates are based on relevant information available at the time the estimates are made, estimates of future cash flows are, by nature, highly uncertain and may vary significantly from actual results. For assets identified as held for sale, the carrying value is compared to the estimated fair value less cost to sell to determine if an impairment loss is required. Until the assets are disposed of, their estimated fair value is re-evaluated when circumstances or events change.
When determining whether an asset or asset group has been impaired, management groups assets at the lowest level that has discrete cash flows.
For further information, see Note 2 to the Consolidated Financial Statements, "Acquisition and Dispositions."
Accounting for Loss Contingencies
Preparation of financial statements and related disclosures require judgments regarding the future outcome of contingent events. Duke Energy is involved in certain legal and environmental matters arising in the normal course of business. Estimating probable losses requires analysis of multiple forecasts and scenarios that often depend on judgments about potential actions by third parties, such as federal, state and local courts and regulators. Contingent liabilities are often resolved over long periods of time. Amounts recorded in the consolidated financial statements may differ from the actual outcome once the contingency is resolved, which could have a material impact on future results of operations, financial position and cash flows of Duke Energy.
For further information, see Notes 4 and
5
to the Consolidated Financial Statements, "Regulatory Matters" and “Commitments and Contingencies.”
Revenue Recognition
Revenues on sales of electricity and gas are recognized when either the service is provided or the product is delivered. Operating revenues include unbilled electric and gas revenues earned when service has been delivered but not billed by the end of the accounting period. Unbilled retail revenues are estimated by applying an average revenue per kilowatt-hour (kWh) or per thousand cubic feet (Mcf) for all customer classes to the number of estimated kWh or Mcf delivered but not billed. Unbilled wholesale energy revenues are calculated by applying the contractual rate per MWh to the number of estimated MWh delivered but not yet billed. Unbilled wholesale demand revenues are calculated by applying the contractual rate per MW to the MW volume delivered but not yet billed. The amount of unbilled revenues can vary significantly from period to period as a result of numerous factors, including seasonality, weather, customer usage patterns, customer mix, timing of rendering customer bills, and the average price in effect for customer classes.
Pension and Other Post-Retirement Benefits
The calculation of pension expense, other post-retirement benefit expense and net pension and other post-retirement assets or liabilities require the use of assumptions and election of permissible accounting alternatives. Changes in assumptions can result in different expense and reported asset or liability amounts, and future actual experience can differ from the assumptions. Duke Energy believes the most critical assumptions for pension and other post-retirement benefits are the expected long-term rate of return on plan assets and the assumed discount rate applied to future benefit payments. Additionally, the health care cost trend rate assumption is critical to Duke Energy’s estimate of other post-retirement benefits.
Duke Energy elects to amortize net actuarial gains or losses in excess of the corridor of 10 percent of the greater of the market-related value of plan assets or plan projected benefit obligation, into net pension or other post-retirement benefit expense over the average remaining service period of active covered employees. Prior service cost or credit, which represents the effect on plan liabilities due to plan amendments, is amortized over the average remaining service period of active covered employees.
Duke Energy maintains non-contributory defined benefit retirement plans. The plans cover most U.S. employees using a cash balance formula. Under a cash balance formula, a plan participant accumulates a retirement benefit consisting of pay credits based upon a percentage of current eligible earnings based on age and years of service and current interest credits. Certain employees are covered under plans that use a final average earnings formula. As of January 1, 2014, the qualified and non-qualified non-contributory defined benefit plans are closed to new and rehired non-union, and certain unionized employees.
Duke Energy provides some health care and life insurance benefits for retired employees on a contributory and non-contributory basis. Certain employees are eligible for these benefits if they have met age and service requirements at retirement, as defined in the plans.
As of
December 31, 2015
, Duke Energy assumes pension and other post-retirement plan assets will generate a long-term rate of return of 6.50 percent. The expected long-term rate of return was developed using a weighted average calculation of expected returns based primarily on future expected returns across asset classes considering the use of active asset managers, where applicable. Equity securities are held for their higher expected returns. Debt securities are primarily held to hedge the pension liability. Hedge funds, real estate and other global securities are held for diversification. Investments within asset classes are diversified to achieve broad market participation and reduce the impact of individual managers on investments. In 2013, Duke Energy adopted a de-risking investment strategy for its pension assets. As the funded status of the plans increase, over time the targeted allocation to return seeking assets will be reduced and the targeted allocation to fixed-income assets will be increased to better manage Duke Energy's pension liability and reduced funded status volatility. Effective January 1, 2016, based on the current funded status of the plans, the asset allocation for the Duke Energy pension plans has been adjusted to 63 percent fixed-income assets and 37 percent return-seeking assets. Duke Energy regularly reviews its actual asset allocation and periodically rebalances its investments to the targeted allocations when considered appropriate.
61
PART II
The assets for Duke Energy’s pension and other post-retirement plans are maintained in a master trust. Duke Energy also invests other post-retirement assets in the Duke Energy Corporation Employee Benefits Trust (VEBA I). The investment objective of VEBA I is to achieve sufficient returns, subject to a prudent level of portfolio risk, for the purpose of promoting the security of plan benefits for participants. VEBA I is passively managed.
Duke Energy discounted its future U.S. pension and other post-retirement obligations using a rate of 4.4 percent as of
December 31, 2015
. Discount rates used to measure benefit plan obligations for financial reporting purposes reflect rates at which pension benefits could be effectively settled. As of
December 31, 2015
, Duke Energy determined its discount rate for U.S. pension and other post-retirement obligations using a bond selection-settlement portfolio approach. This approach develops a discount rate by selecting a portfolio of high quality corporate bonds that generate sufficient cash flow to match the timing of projected benefit payments. The selected bond portfolio is derived from a universe of non-callable corporate bonds rated Aa quality or higher. After the bond portfolio is selected, a single interest rate is determined that equates the present value of the plan’s projected benefit payments discounted at this rate with the market value of the bonds selected.
Future changes in plan asset returns, assumed discount rates and various other factors related to the participants in Duke Energy’s pension and post-retirement plans will impact future pension expense and liabilities. Duke Energy cannot predict with certainty what these factors will be in the future. The following table presents the approximate effect on Duke Energy’s
2015
pretax pension expense, pretax other post-retirement expense, pension obligation and other post-retirement benefit obligation if a 0.25 percent change in rates were to occur.
|
Qualified and Non-
|
Other Post-Retirement
|
||||||||||||||
|
|
Qualified Pension Plans
|
Plans
|
|||||||||||||
|
(in millions)
|
0.25
|
%
|
(0.25
|
)%
|
0.25
|
%
|
(0.25
|
)%
|
|||||||
|
Effect on 2015 pretax pension and other post-retirement expense
|
|
|
|
|
|||||||||||
|
Expected long-term rate of return
|
$
|
(20
|
)
|
$
|
20
|
|
$
|
(1
|
)
|
$
|
1
|
|
|||
|
Discount rate
|
(14
|
)
|
13
|
|
(1
|
)
|
1
|
|
|||||||
|
Effect on pension and other post-retirement benefit obligation at December 31, 2015
|
|
|
|
|
|
|
|
|
|||||||
|
Discount rate
|
(200
|
)
|
206
|
|
(17
|
)
|
17
|
|
|||||||
Duke Energy’s U.S. other post-retirement plan uses a health care trend rate covering both pre- and post-age 65 retired plan participants, which is comprised of a medical care trend rate, which reflects the near- and long-term expectation of increases in medical costs, and a prescription drug trend rate, which reflects the near and long-term expectation of increases in prescription drug costs. As of
December 31, 2015
, the health care trend rate was 7.5 percent, trending down to 4.75 percent by 2023. The following table presents the approximate effect on Duke Energy’s
2015
pretax other post-retirement expense and other post-retirement benefit obligation if a 1 percentage point change in the health care trend rate were to occur.
|
Other Post-Retirement
|
|||||||
|
|
Plans
|
||||||
|
(in millions)
|
1
|
%
|
(1
|
)%
|
|||
|
Effect on 2015 other post-retirement expense
|
$
|
7
|
|
$
|
(6
|
)
|
|
|
Effect on other post-retirement benefit obligation at December 31, 2015
|
29
|
|
(26
|
)
|
|||
For further information, see Note
21
to the Consolidated Financial Statements, “
Employee Benefit Plans
.”
LIQUIDITY AND CAPITAL RESOURCES
Sources and Uses of Cash
Duke Energy relies primarily upon cash flows from operations, debt issuances and its existing cash and cash equivalents to fund its domestic liquidity and capital requirements. Duke Energy’s capital requirements arise primarily from capital and investment expenditures, repaying long-term debt and paying dividends to shareholders. Duke Energy’s projected primary sources and uses for the next three fiscal years are included in the table below.
|
(in millions)
|
2016
|
|
2017
|
|
2018
|
|
|||||
|
Uses
(a)
:
|
|
|
|
|
|
|
|||||
|
Capital expenditures
|
$8,600-$8,775
|
|
$7,300-$8,500
|
|
$6,775-$7,800
|
|
|||||
|
Debt maturities and reduction in short-term debt
(b)
|
3,885
|
|
2,250
|
|
2,750
|
|
|||||
|
Dividend payments
|
2,300
|
|
2,400
|
|
2,500
|
|
|||||
|
Sources
(a)
:
|
|
|
|||||||||
|
Cash flows from operations
(c)
|
$
|
7,200
|
|
$
|
7,500
|
|
$
|
7,900
|
|
||
|
Debt issuances
|
7,050
|
|
5,200
|
|
4,150
|
|
|||||
|
Equity issuances
|
—
|
|
—
|
|
350
|
|
|||||
|
(a)
|
Uses and Sources exclude amounts related to payments for or proceeds from the planned acquisition of Piedmont and possible sale of the International Energy segment.
|
|
(b)
|
Excludes capital leases and securitized receivables maturities in 2016 and 2017 expected to be renewed. Amounts represent Duke Energy's financing plan, which accelerates certain contractual maturities.
|
62
PART II
|
(c)
|
Includes expenditures related to ash basin closures.
|
On October 24, 2015, Duke Energy entered into an Agreement and Plan of Merger (Merger Agreement) with Piedmont Natural Gas Company, Inc., (Piedmont) a North Carolina corporation. Under the terms of the Merger Agreement, Duke Energy will acquire Piedmont for $4.9 billion in cash and will assume Piedmont's existing debt, which was approximately $1.9 billion at October 31, 2015, the end of Piedmont's most recent fiscal year. Duke Energy expects to finance the transaction with a combination of debt, between $500 million and $750 million of newly issued equity and other cash sources. Duke Energy has a fully underwritten bridge facility to support funding of the merger. For further information on the Piedmont acquisition, refer to Note 2 to the Consolidated Financial Statements, “Acquisitions and Dispositions."
During 2014, Duke Energy declared a taxable dividend of foreign earnings in the form of notes payable that was intended to result in the repatriation of approximately $2.7 billion of cash held and expected to be generated by International Energy over a period of up to eight years. In 2015, approximately $1.5 billion was remitted. Approximately $300 million is expected to be remitted in 2016, with the remaining amount remitted by 2022. Duke Energy announced on February 18, 2016, it had initiated a process to divest the International Energy business segment, excluding the equity method investment in NMC. Duke Energy is in the preliminary stage and no binding or non-binding offers have been requested or submitted. Duke Energy can provide no assurance that this process will result in a transaction. Additional proceeds from the notes payable or from a successful sale of International Energy will principally be used to fund the operations and growth of its domestic businesses.
The Subsidiary Registrants generally maintain minimal cash balances and use short-term borrowings to meet their working capital needs and other cash requirements. The Subsidiary Registrants, excluding Progress Energy, support their short-term borrowing needs through participation with Duke Energy and certain of its other subsidiaries in a money pool arrangement. The companies with short-term funds may provide short-term loans to affiliates participating under this arrangement. See Note
6
to the Consolidated Financial Statements, “Debt and Credit Facilities,” for additional discussion of the money pool arrangement.
Duke Energy and the Subsidiary Registrants, excluding Progress Energy, may also use short-term debt, including commercial paper and the money pool, as a bridge to long-term debt financings. The levels of borrowing may vary significantly over the course of the year due to the timing of long-term debt financings and the impact of fluctuations in cash flows from operations. From time to time, Duke Energy’s current liabilities exceed current assets resulting from the use of short-term debt as a funding source to meet scheduled maturities of long-term debt, as well as cash needs, which can fluctuate due to the seasonality of its business.
Credit Facilities and Registration Statements
Master Credit Facility Summary
Duke Energy has a Master Credit Facility with a capacity of $7.5 billion through January 2020. The Duke Energy Registrants, excluding Progress Energy (Parent), have borrowing capacity under the Master Credit Facility up to specified sublimits for each borrower. Duke Energy has the unilateral ability at any time to increase or decrease the borrowing sublimits of each borrower, subject to a maximum sublimit for each borrower. The amount available under the Master Credit Facility has been reduced to backstop the issuances of commercial paper, certain letters of credit and variable-rate demand tax-exempt bonds that may be put to the Duke Energy Registrants at the option of the holder and as security to meet obligations under the Plea Agreements. The table below includes the current borrowing sublimits and available capacity under the Master Credit Facility.
|
|
December 31, 2015
|
||||||||||||||||||||||||||
|
Duke
|
|
Duke
|
|
Duke
|
|
Duke
|
|
Duke
|
|
Duke
|
|
||||||||||||||||
|
Duke
|
|
Energy
|
|
Energy
|
|
Energy
|
|
Energy
|
|
Energy
|
|
Energy
|
|
||||||||||||||
|
(in millions)
|
Energy
|
|
(Parent)
|
|
Carolinas
|
|
Progress
|
|
Florida
|
|
Ohio
|
|
Indiana
|
|
|||||||||||||
|
Facility size
(a)
|
$
|
7,500
|
|
$
|
3,475
|
|
$
|
800
|
|
$
|
1,000
|
|
$
|
1,200
|
|
$
|
425
|
|
$
|
600
|
|
||||||
|
Reduction to backstop issuances
|
|
||||||||||||||||||||||||||
|
Commercial paper
(b)
|
(3,138
|
)
|
(1,531
|
)
|
(300
|
)
|
(333
|
)
|
(709
|
)
|
(115
|
)
|
(150
|
)
|
|||||||||||||
|
Outstanding letters of credit
|
(72
|
)
|
(65
|
)
|
(4
|
)
|
(2
|
)
|
(1
|
)
|
—
|
|
—
|
|
|||||||||||||
|
Tax-exempt bonds
|
(116
|
)
|
—
|
|
(35
|
)
|
—
|
|
—
|
|
—
|
|
(81
|
)
|
|||||||||||||
|
Coal ash set-aside
(c)
|
(500
|
)
|
—
|
|
(250
|
)
|
(250
|
)
|
—
|
|
—
|
|
—
|
|
|||||||||||||
|
Available capacity
|
$
|
3,674
|
|
|
$
|
1,879
|
|
|
$
|
211
|
|
|
$
|
415
|
|
|
$
|
490
|
|
|
$
|
310
|
|
|
$
|
369
|
|
|
(a)
|
Represents the sublimit of each borrower at December 31, 2015. The Duke Energy Ohio sublimit includes $125 million for Duke Energy Kentucky.
|
|
(b)
|
Duke Energy issued $625 million of commercial paper and loaned the proceeds through the money pool to Duke Energy Carolinas, Duke Energy Progress, Duke Energy Ohio and Duke Energy Indiana. The balances are included within Long-Term Debt Payable to Affiliated Companies in the Consolidated Balance Sheets.
|
|
(c)
|
On May 14, 2015, the United States District Court for the Eastern District of North Carolina approved the separate Plea Agreements entered into by Duke Energy Carolinas, Duke Energy Progress and Duke Energy Business Services, LLC (DEBS), a wholly owned subsidiary of Duke Energy, in connection with the investigation initiated by the USDOJ. Duke Energy Carolinas and Duke Energy Progress are required to each maintain
$250 million
of available capacity under the Master Credit Facility as security to meet their obligations under the Plea Agreements, in addition to certain other conditions. See Note
5
to the Consolidated Financial Statements, “Commitments and Contingencies,” for additional information.
|
63
PART II
Piedmont Bridge Facility
In connection with the Merger Agreement with Piedmont, Duke Energy entered into a $4.9 billion Bridge Facility with Barclays. The Bridge Facility, if drawn upon, may be used to (i) fund the cash consideration for the transaction and (ii) pay certain fees and expenses in connection with the transaction. In November 2015, Barclays syndicated its commitment under the Bridge Facility to a broader group of lenders. Duke Energy intends to finance the transaction with proceeds raised through the issuance of debt, equity and other sources as noted above and, therefore, does not expect to draw upon the Bridge Facility.
Short-Term Loan Facility
On February 22, 2016, Duke Energy entered into a six-month term loan facility (Term Loan) with commitments totaling $1 billion to provide additional flexibility in managing short-term liquidity. The Term Loan can be drawn upon in a single borrowing of up to $1 billion, which must occur no later than 45 calendar days following February 22, 2016. As of February 24, 2016, no amounts have been drawn under the Term Loan. Amounts drawn under this facility, if any, will be due on August 19, 2016. The terms and conditions of this Term Loan are generally consistent with those governing the Master Credit Facility discussed above.
Shelf Registration
In September 2013, Duke Energy filed a registration statement (Form S-3) with the SEC. Under this Form S-3, which is uncapped, the Duke Energy Registrants, excluding Progress Energy may issue debt and other securities in the future at amounts, prices and with terms to be determined at the time of future offerings. The registration statement also allows for the issuance of common stock by Duke Energy.
CAPITAL EXPENDITURES
Duke Energy continues to focus on reducing risk and positioning its business for future success and will invest principally in its strongest business sectors. Based on this goal, the majority of Duke Energy’s total projected capital expenditures are allocated to the Regulated Utilities segment. Duke Energy’s projected capital and investment expenditures for the next three fiscal years are included in the table below.
|
(in millions)
|
2016
|
|
2017
|
|
2018
|
|
|||
|
New generation
|
$
|
1,275
|
|
$
|
925
|
|
$
|
825
|
|
|
Environmental
|
350
|
|
425
|
|
200
|
|
|||
|
Nuclear fuel
|
525
|
|
425
|
|
425
|
|
|||
|
Major nuclear
|
175
|
|
200
|
|
75
|
|
|||
|
Customer additions
|
500
|
|
575
|
|
575
|
|
|||
|
Grid modernization and other transmission and distribution projects
|
1,300
|
|
1,475
|
|
1,575
|
|
|||
|
Maintenance
|
2,700
|
|
2,325
|
|
2,200
|
|
|||
|
Total Regulated Utilities
|
6,825
|
|
6,350
|
|
5,875
|
|
|||
|
Commercial Portfolio, International Energy and Other
|
1,775
|
|
950
|
|
900
|
|
|||
|
Total committed expenditures
|
8,600
|
|
7,300
|
|
6,775
|
|
|||
|
Discretionary expenditures
|
175
|
|
1,200
|
|
1,025
|
|
|||
|
Total projected capital and investment expenditures
|
$
|
8,775
|
|
$
|
8,500
|
|
$
|
7,800
|
|
DEBT MATURITIES
The following table shows the significant components of Current maturities of Long-Term Debt on the Consolidated Balance Sheets. The Duke Energy Registrants currently anticipate satisfying these obligations with cash on hand and proceeds from additional borrowings.
|
(in millions)
|
Maturity Date
|
Interest Rate
|
|
December 31, 2015
|
|
|||
|
Unsecured Debt
|
||||||||
|
Progress Energy (Parent)
|
January 2016
|
5.625
|
%
|
$
|
300
|
|
||
|
Duke Energy Indiana
|
June 2016
|
6.05
|
%
|
325
|
|
|||
|
Duke Energy (Parent)
|
November 2016
|
2.150
|
%
|
500
|
|
|||
|
First Mortgage Bonds
|
||||||||
|
Duke Energy Indiana
|
July 2016
|
0.670
|
%
|
150
|
|
|||
|
Duke Energy Carolinas
|
December 2016
|
1.750
|
%
|
350
|
|
|||
|
Other
|
449
|
|
||||||
|
Current maturities of long-term debt
|
$
|
2,074
|
|
|||||
DIVIDEND PAYMENTS
In
2015
, Duke Energy paid quarterly cash dividends for the 90th consecutive year and expects to continue its policy of paying regular cash dividends in the future. There is no assurance as to the amount of future dividends because they depend on future earnings, capital requirements, financial condition and are subject to the discretion of the Board of Directors.
64
PART II
Through 2020, the dividend payout ratio is expected to be between 70 and 75 percent, based upon adjusted diluted EPS. Over the past several years, Duke Energy’s dividend has grown at approximately 2 percent annually, slower than overall adjusted earnings growth. In 2015, Duke Energy increased the dividend payout to grow the dividend at approximately 4 percent annually, better matching expected future earnings growth.
Dividend and Other Funding Restrictions of Duke Energy Subsidiaries
As discussed in Note
4
to the Consolidated Financial Statements, “Regulatory Matters,” Duke Energy’s wholly owned public utility operating companies have restrictions on the amount of funds that can be transferred to Duke Energy through dividends, advances or loans as a result of conditions imposed by various regulators in conjunction with merger transactions. Duke Energy Progress and Duke Energy Florida also have restrictions imposed by their first mortgage bond indentures and Articles of Incorporation which in certain circumstances limit their ability to make cash dividends or distributions on common stock. Additionally, certain other Duke Energy subsidiaries have other restrictions, such as minimum working capital and tangible net worth requirements pursuant to debt and other agreements that limit the amount of funds that can be transferred to Duke Energy. At
December 31, 2015
, the amount of restricted net assets of wholly owned subsidiaries of Duke Energy that may not be distributed to Duke Energy in the form of a loan or dividend is less than 25 percent of Duke Energy’s net assets. Duke Energy does not have any legal or other restrictions on paying common stock dividends to shareholders out of its consolidated equity accounts. Although these restrictions cap the amount of funding the various operating subsidiaries can provide to Duke Energy, management does not believe these restrictions will have a significant impact on Duke Energy’s ability to access cash to meet its payment of dividends on common stock and other future funding obligations.
CASH FLOWS FROM OPERATING ACTIVITIES
The relatively stable operating cash flows of Regulated Utilities compose a substantial portion of Duke Energy’s cash flows from operations. Regulated Utilities’ cash flows from operations are primarily driven by sales of electricity and natural gas and costs of operations. Weather conditions, working capital and commodity price fluctuations, and unanticipated expenses including unplanned plant outages, storms, and legal costs and related settlements can affect the timing and level of cash flows from operations.
Duke Energy believes it has sufficient liquidity resources through the commercial paper markets, and ultimately, the Master Credit Facility, to support these operations. Cash flows from operations are subject to a number of other factors, including, but not limited to, regulatory constraints, economic trends and market volatility (see Item 1A, “Risk Factors,” for additional information).
At
December 31, 2015
, Duke Energy had cash and cash equivalents and short-term investments of $857 million, of which approximately $534 million is held by entities domiciled in foreign jurisdictions. In December 2014, Duke Energy declared a taxable dividend of historical foreign earnings in the form of notes payable that was expected to result in the repatriation of approximately $2.7 billion of cash held and expected to be generated by International Energy over a period of up to eight years. In 2015, approximately $1.5 billion was remitted.
As of December 31, 2015, Duke Energy’s intention was to indefinitely reinvest undistributed earnings generated by Duke Energy's foreign subsidiaries. As a result, no U.S. tax is recorded on such earnings of approximately $250 million. The amount of unrecognized deferred tax liability related to undistributed earnings was approximately $12 million. On February 18, 2016, Duke Energy announced it had initiated a process to divest the International Energy business segment, excluding the investment in NMC. See Note 2 for further information. Accordingly, Duke Energy no longer intends to indefinitely reinvest the undistributed foreign earnings of International Energy and will therefore record U.S. taxes related to International Energy's undistributed foreign earnings during the first quarter of 2016.
Proceeds from the notes payable or from a successful sale of International Energy will principally be used to fund the operations and growth of its domestic businesses.
DEBT ISSUANCES
Depending on availability based on the issuing entity, the credit rating of the issuing entity, and market conditions, the Subsidiary Registrants prefer to issue first mortgage bonds and secured debt, followed by unsecured debt. This preference is the result of generally higher credit ratings for first mortgage bonds and secured debt, which typically result in lower interest costs. Duke Energy Corporation primarily issues unsecured debt.
Duke Energy’s capitalization is balanced between debt and equity as shown in the table below.
|
|
Projected 2016
|
|
Actual 2015
|
|
Actual 2014
|
|
||
|
Equity
|
47
|
%
|
48
|
%
|
49
|
%
|
||
|
Debt
|
53
|
%
|
52
|
%
|
51
|
%
|
||
Duke Energy’s fixed charges coverage ratio, calculated using SEC guidelines, was 3.2 times for
2015
, 3.2 times for
2014
, and 3.0 times for
2013
.
Restrictive Debt Covenants
Duke Energy’s debt and credit agreements contain various financial and other covenants. The Master Credit Facility contains a covenant requiring the debt-to-total capitalization ratio to not exceed 65 percent for each borrower. Failure to meet those covenants beyond applicable grace periods could result in accelerated due dates and/or termination of the agreements or sublimits thereto. As of
December 31, 2015
, Duke Energy was in compliance with all covenants related to its debt agreements. In addition, some credit agreements may allow for acceleration of payments or termination of the agreements due to nonpayment, or to the acceleration of other significant indebtedness of the borrower or some of its subsidiaries. None of the debt or credit agreements contain material adverse change clauses.
65
PART II
Credit Ratings
The Duke Energy Registrants each hold credit ratings by Fitch Ratings, Inc. (Fitch), Moody’s Investors Service, Inc. (Moody’s) and Standard & Poor’s Rating Services (S&P). The following table includes Duke Energy and certain subsidiaries’ credit ratings and ratings outlook as of February 2016.
|
|
Fitch
|
Moody's
|
|
S&P
|
|
|
Duke Energy Corporation
|
Watch-N
|
Negative
|
|
Negative
|
|
|
Issuer Credit Rating
|
BBB+
|
Baa1
|
|
A-
|
|
|
Senior Unsecured Debt
|
BBB+
|
Baa1
|
|
BBB+
|
|
|
Commercial Paper
|
F-2
|
P-2
|
A-2
|
||
|
Duke Energy Carolinas
|
Stable
|
Stable
|
|
Negative
|
|
|
Senior Secured Debt
|
AA-
|
Aa2
|
|
A
|
|
|
Senior Unsecured Debt
|
A+
|
A1
|
|
A-
|
|
|
Progress Energy
|
Stable
|
Stable
|
|
Negative
|
|
|
Senior Unsecured Debt
|
BBB
|
Baa2
|
|
BBB+
|
|
|
Duke Energy Progress
|
Stable
|
Stable
|
|
Negative
|
|
|
Issuer Credit Rating
|
A-
|
A2
|
A-
|
||
|
Senior Secured Debt
|
A+
|
Aa3
|
|
A
|
|
|
Duke Energy Florida
|
Stable
|
Stable
|
|
Negative
|
|
|
Senior Secured Debt
|
A
|
A1
|
|
A
|
|
|
Senior Unsecured Debt
|
A-
|
A3
|
|
A-
|
|
|
Duke Energy Ohio
|
Stable
|
Stable
|
|
Negative
|
|
|
Senior Secured Debt
|
A
|
A2
|
|
A
|
|
|
Senior Unsecured Debt
|
A-
|
Baa1
|
|
A-
|
|
|
Duke Energy Indiana
|
Positive
|
Stable
|
|
Negative
|
|
|
Senior Secured Debt
|
A
|
Aa3
|
|
A
|
|
|
Senior Unsecured Debt
|
A-
|
A2
|
|
A-
|
|
Credit ratings are intended to provide credit lenders a framework for comparing the credit quality of securities and are not a recommendation to buy, sell or hold. The Duke Energy Registrants’ credit ratings are dependent on the rating agencies’ assessments of their ability to meet their debt principal and interest obligations when they come due. If, as a result of market conditions or other factors, the Duke Energy Registrants are unable to maintain current balance sheet strength, or if earnings and cash flow outlook materially deteriorates, credit ratings could be negatively impacted.
Cash Flow Information
The following table summarizes Duke Energy’s cash flows for the three most recently completed fiscal years.
|
|
Years Ended December 31,
|
||||||||||
|
(in millions)
|
2015
|
|
|
2014
|
|
|
2013
|
|
|||
|
Cash flows provided by (used in):
|
|||||||||||
|
Operating activities
|
$
|
6,676
|
|
$
|
6,586
|
|
$
|
6,382
|
|
||
|
Investing activities
|
(5,277
|
)
|
(5,373
|
)
|
(4,978
|
)
|
|||||
|
Financing activities
|
(2,578
|
)
|
(678
|
)
|
(1,327
|
)
|
|||||
|
Net (decrease) increase in cash and cash equivalents
|
(1,179
|
)
|
|
535
|
|
|
77
|
|
|||
|
Cash and cash equivalents at beginning of period
|
2,036
|
|
1,501
|
|
1,424
|
|
|||||
|
Cash and cash equivalents at end of period
|
$
|
857
|
|
|
$
|
2,036
|
|
|
$
|
1,501
|
|
66
PART II
OPERATING CASH FLOWS
The following table summarizes key components of Duke Energy’s operating cash flows for the three most recently completed fiscal year.
|
|
Years Ended December 31,
|
||||||||||
|
(in millions)
|
2015
|
|
|
2014
|
|
|
2013
|
|
|||
|
Net income
|
$
|
2,831
|
|
$
|
1,889
|
|
$
|
2,676
|
|
||
|
Non-cash adjustments to net income
|
4,800
|
|
5,366
|
|
4,876
|
|
|||||
|
Contributions to qualified pension plans
|
(302
|
)
|
—
|
|
(250
|
)
|
|||||
|
Payments for asset retirement obligations
|
(346
|
)
|
(68
|
)
|
(12
|
)
|
|||||
|
Working capital
|
(307
|
)
|
(601
|
)
|
(908
|
)
|
|||||
|
Net cash provided by operating activities
|
$
|
6,676
|
|
|
$
|
6,586
|
|
|
$
|
6,382
|
|
For the year ended
December 31, 2015
compared to
2014
, the variance was driven primarily by:
|
•
|
a $376 million increase in net income after non-cash adjustments resulting from increased retail pricing due to rate riders and higher base rates, increased wholesale net margins due to higher contracted amounts and prices, a new wholesale contract with NCEMPA, retail sales growth and
|
|
•
|
a $294 million increase in cash flows from a working capital decrease primarily due to lower current year receivables resulting from unseasonably warmer weather in December 2015 and prior year under collection of fuel and purchased power due to increased consumption.
|
Partially offset by:
|
•
|
a $302 million increase in contributions to qualified pension plans and
|
|
•
|
a $278 million increase in payments for asset retirement obligations.
|
For the year ended
December 31, 2014
compared to
2013
, the variance was driven primarily by:
|
•
|
a $204 million increase due to prior year contributions to qualified pension plans, favorable retail pricing and rate riders and favorable weather, partially offset by current year under collection of fuel and purchased power costs and timing of cash payments for operations and maintenance expenses.
|
INVESTING CASH FLOWS
The following table summarizes key components of Duke Energy’s investing cash flows for the three most recently completed fiscal years.
|
|
Years Ended December 31,
|
||||||||||
|
(in millions)
|
2015
|
|
|
2014
|
|
|
2013
|
|
|||
|
Capital, investment and acquisition expenditures
|
$
|
(8,363
|
)
|
$
|
(5,528
|
)
|
$
|
(5,607
|
)
|
||
|
Available for sale securities, net
|
3
|
|
23
|
|
173
|
|
|||||
|
Net proceeds from the sale of Midwest generation business and sales of equity investments and other assets
|
2,968
|
|
179
|
|
277
|
|
|||||
|
Other investing items
|
115
|
|
(47
|
)
|
179
|
|
|||||
|
Net cash used in investing activities
|
$
|
(5,277
|
)
|
|
$
|
(5,373
|
)
|
|
$
|
(4,978
|
)
|
The primary use of cash related to investing activities is capital, investment and acquisition expenditures, detailed by reportable business segment in the following table.
|
|
Years Ended December 31,
|
||||||||||
|
(in millions)
|
2015
|
|
|
2014
|
|
|
2013
|
|
|||
|
Regulated Utilities
|
$
|
6,974
|
|
$
|
4,744
|
|
$
|
5,049
|
|
||
|
Commercial Portfolio
|
1,131
|
|
555
|
|
268
|
|
|||||
|
International Energy
|
45
|
|
67
|
|
67
|
|
|||||
|
Other
|
213
|
|
162
|
|
223
|
|
|||||
|
Total capital, investment and acquisition expenditures
|
$
|
8,363
|
|
|
$
|
5,528
|
|
|
$
|
5,607
|
|
For the year ended
December 31, 2015
compared to
2014
, the variance was driven primarily by:
|
•
|
a $2,789 million increase in proceeds mainly due to sale of the nonregulated Midwest generation business to Dynegy and
|
|
•
|
a $202 million return of collateral related to the Chilean acquisition in 2013. The collateral was used to repay a secured loan.
|
67
PART II
Partially offset by:
|
•
|
a $2,835 million increase in capital, investment and acquisition expenditures mainly due to the acquisition of NCEMPA ownership interests in certain generating assets, fuel and spare parts inventory jointly owned with and operated by Duke Energy Progress and growth initiatives in electric and natural gas infrastructure, solar projects and natural-gas fired generation.
|
For the year ended
December 31, 2014
compared to
2013
, the variance was driven primarily by:
|
•
|
a $192 million return of collateral related to the Chilean hydro acquisition in 2013 and
|
|
•
|
a $150 million decrease in net proceeds from sales and maturities of available for sale securities, net of purchases.
|
FINANCING CASH FLOWS
The following table summarizes key components of Duke Energy’s financing cash flows for the three most recently completed fiscal years.
|
|
Years Ended December 31,
|
||||||||||
|
(in millions)
|
2015
|
|
2014
|
|
2013
|
|
|||||
|
Issuance of common stock related to employee benefit plans
|
$
|
17
|
|
$
|
25
|
|
$
|
9
|
|
||
|
(Repayments) Issuances of long-term debt, net
|
(74
|
)
|
(123
|
)
|
840
|
|
|||||
|
Notes payable and commercial paper
|
1,245
|
|
1,688
|
|
93
|
|
|||||
|
Dividends paid
|
(2,254
|
)
|
(2,234
|
)
|
(2,188
|
)
|
|||||
|
Repurchase of common shares
|
(1,500
|
)
|
—
|
|
—
|
|
|||||
|
Other financing items
|
(12
|
)
|
(34
|
)
|
(81
|
)
|
|||||
|
Net cash used in financing activities
|
$
|
(2,578
|
)
|
|
$
|
(678
|
)
|
|
$
|
(1,327
|
)
|
For the year ended
December 31, 2015
compared to
2014
, the variance was driven primarily by:
|
•
|
a $1,500 million increase in cash outflows due to the repurchase of 19.8 million common shares under the ASR and
|
|
•
|
a $443 million decrease in proceeds from net issuances of notes payable and commercial paper, primarily due to prior year financing with short-term debt in advance of the 2015 receipt of proceeds from the sale of the nonregulated Midwest generation business to Dynegy, net of current year financing with short-term debt used to repay long-term debt maturities at Duke Energy Florida in advance of the 2016 proceeds from the proposed issuance of securitization bonds related to Crystal River Unit 3.
|
For the year ended
December 31, 2014
compared to
2013
, the variance was driven primarily by:
|
•
|
a $1,595 million increase in proceeds from net issuances of notes payable and commercial paper, primarily due to funding a larger proportion of total financing needs with short-term debt in advance of the receipt in 2015 of proceeds from the sale of the Midwest Generation business.
|
Partially offset by:
|
•
|
a $963 million decrease in net issuances of long-term debt, primarily due to funding a larger proportion of total financing needs with short-term debt in 2014 than in 2013.
|
Summary of Significant Debt Issuances
|
Year Ended December 31, 2015
|
||||||||||||||||||||
|
Duke
|
|
Duke
|
|
Duke
|
|
|||||||||||||||
|
Maturity
|
Interest
|
|
Duke
|
|
Energy
|
|
Energy
|
|
Energy
|
|
||||||||||
|
Issuance Date
|
Date
|
Rate
|
|
Energy
|
|
(Parent)
|
|
Carolinas
|
|
Progress
|
|
|||||||||
|
Unsecured Debt
|
||||||||||||||||||||
|
November 2015
(a)(b)
|
April 2024
|
3.750
|
%
|
$
|
400
|
|
$
|
400
|
|
$
|
—
|
|
$
|
—
|
|
|||||
|
November 2015
(a)(b)
|
December 2045
|
4.800
|
%
|
600
|
|
600
|
|
—
|
|
—
|
|
|||||||||
|
First Mortgage Bonds
|
||||||||||||||||||||
|
March 2015
(c)
|
June 2045
|
3.750
|
%
|
500
|
|
—
|
|
500
|
|
—
|
|
|||||||||
|
August 2015
(a)(d)
|
August 2025
|
3.250
|
%
|
500
|
|
—
|
|
—
|
|
500
|
|
|||||||||
|
August 2015
(a)(d)
|
August 2045
|
4.200
|
%
|
700
|
|
—
|
|
—
|
|
700
|
|
|||||||||
|
Total issuances
|
$
|
2,700
|
|
$
|
1,000
|
|
$
|
500
|
|
$
|
1,200
|
|
||||||||
68
PART II
|
(a)
|
Proceeds were used to repay short-term money pool and commercial paper borrowing issued to fund a portion of the NCEMPA acquisition, see Note
2
to the Consolidated Financial Statements, "
Acquisitions, Dispositions and Sales of Other Assets
", for further information.
|
|
(b)
|
Proceeds were used to refinance at maturity $300 million of unsecured notes at Progress Energy due January 2016.
|
|
(c)
|
Proceeds were used to redeem at maturity $500 million of first mortgage bonds due October 2015.
|
|
(d)
|
Proceeds were used to refinance at maturity $400 million of first mortgage bonds due December 2015.
|
|
Year Ended December 31, 2014
|
||||||||||||||||||||
|
Duke
|
|
Duke
|
|
Duke
|
|
|||||||||||||||
|
Maturity
|
Interest
|
|
Duke
|
|
Energy
|
|
Energy
|
|
Energy
|
|
||||||||||
|
Issuance Date
|
Date
|
Rate
|
|
Energy
|
|
(Parent)
|
|
Progress
|
|
Florida
|
|
|||||||||
|
Unsecured Debt
|
||||||||||||||||||||
|
April 2014
(a)
|
April 2024
|
3.750
|
%
|
600
|
|
600
|
|
—
|
|
—
|
|
|||||||||
|
April 2014
(a)(b)
|
April 2017
|
0.613
|
%
|
400
|
|
400
|
|
—
|
|
—
|
|
|||||||||
|
June 2014
(c)
|
May 2019
|
11.970
|
%
|
108
|
|
—
|
|
—
|
|
—
|
|
|||||||||
|
June 2014
(c)
|
May 2021
|
13.680
|
%
|
110
|
|
—
|
|
—
|
|
—
|
|
|||||||||
|
Secured Debt
|
||||||||||||||||||||
|
March 2014
(d)
|
March 2017
|
0.863
|
%
|
225
|
|
—
|
|
—
|
|
225
|
|
|||||||||
|
July 2014
(e)
|
July 2036
|
5.340
|
%
|
129
|
|
—
|
|
—
|
|
—
|
|
|||||||||
|
First Mortgage Bonds
|
||||||||||||||||||||
|
March 2014
(f)
|
March 2044
|
4.375
|
%
|
400
|
|
—
|
|
400
|
|
—
|
|
|||||||||
|
March 2014
(f)(g)
|
March 2017
|
0.435
|
%
|
250
|
|
—
|
|
250
|
|
—
|
|
|||||||||
|
November 2014
(h)
|
December 2044
|
4.150
|
%
|
500
|
|
—
|
|
500
|
|
—
|
|
|||||||||
|
November 2014
(g)(h)
|
November 2017
|
0.432
|
%
|
200
|
|
—
|
|
200
|
|
—
|
|
|||||||||
|
Total issuances
|
$
|
2,922
|
|
$
|
1,000
|
|
$
|
1,350
|
|
$
|
225
|
|
||||||||
|
(a)
|
Proceeds were used to redeem $402 million of tax-exempt bonds at Duke Energy Ohio, the repayment of outstanding commercial paper and for general corporate purposes. See Note
13
to the Consolidated Financial Statements, "
Related Party Transactions
" for additional information related to the redemption of Duke Energy Ohio's tax-exempt bonds.
|
|
(b)
|
The debt is floating rate based on three-month London Interbank Offered Rate (LIBOR) plus a fixed credit spread of 38 basis points.
|
|
(c)
|
Proceeds were used to repay $196 million of debt for International Energy and for general corporate purposes. The interest rates include country specific risk premiums.
|
|
(d)
|
Relates to the securitization of accounts receivable at a subsidiary of Duke Energy Florida. Proceeds were used to repay short-term borrowings under the intercompany money pool borrowing arrangement and for general corporate purposes. See Note
17
to the Consolidated Financial Statements, "
Variable Interest Entities
" for further details.
|
|
(e)
|
Proceeds were used to fund a portion of Duke Energy's prior investment in the existing Wind Star renewables portfolio.
|
|
(f)
|
Proceeds were used to repay short-term borrowings under the intercompany money pool borrowing arrangement and for general corporate purposes.
|
|
(g)
|
The debt is floating rate based on three-month LIBOR plus a fixed credit spread of 20 basis points.
|
|
(h)
|
Proceeds were used to repay to redeem $450 million of tax-exempt bonds, repay short-term borrowings under the intercompany money pool borrowing arrangement and for general corporate purposes.
|
Off-Balance Sheet Arrangements
Duke Energy and certain of its subsidiaries enter into guarantee arrangements in the normal course of business to facilitate commercial transactions with third parties. These arrangements include performance guarantees, stand-by letters of credit, debt guarantees, surety bonds and indemnifications.
Most of the guarantee arrangements entered into by Duke Energy enhance the credit standing of certain subsidiaries, non-consolidated entities or less than wholly owned entities, enabling them to conduct business. As such, these guarantee arrangements involve elements of performance and credit risk, which are not always included on the Consolidated Balance Sheets. The possibility of Duke Energy, either on its own or on behalf of Spectra Energy Capital, LLC (Spectra Capital) through indemnification agreements entered into as part of the January 2, 2007, spin-off of Spectra Energy Corp (Spectra Energy), having to honor its contingencies is largely dependent upon the future operations of the subsidiaries, investees and other third parties, or the occurrence of certain future events.
Duke Energy performs ongoing assessments of their respective guarantee obligations to determine whether any liabilities have been incurred as a result of potential increased non-performance risk by third parties for which Duke Energy has issued guarantees.
See Note
7
to the Consolidated Financial Statements, “Guarantees and Indemnifications,” for further details of the guarantee arrangements.
Issuance of these guarantee arrangements is not required for the majority of Duke Energy’s operations. Thus, if Duke Energy discontinued issuing these guarantees, there would not be a material impact to the consolidated results of operations, cash flows or financial position.
69
PART II
Other than the guarantee arrangements discussed above, normal operating lease arrangements and off-balance sheet debt related to non-consolidated VIEs, Duke Energy does not have any material off-balance sheet financing entities or structures. For additional information, see Note
5
and Note
17
to the Consolidated Financial Statements, “Commitments and Contingencies” and "
Variable Interest Entities
," respectively.
Contractual Obligations
Duke Energy enters into contracts that require payment of cash at certain specified periods, based on certain specified minimum quantities and prices. The following table summarizes Duke Energy’s contractual cash obligations as of
December 31, 2015
.
|
|
Payments Due By Period
|
||||||||||||||||||
|
More than
|
|
||||||||||||||||||
|
Less than
|
|
2-3 years
|
|
4-5 years
|
|
5 years
|
|
||||||||||||
|
1 year
|
|
(2017 &
|
|
(2019 &
|
|
(2021 &
|
|
||||||||||||
|
(in millions)
|
Total
|
|
(2016)
|
|
2018)
|
|
2020)
|
|
beyond)
|
|
|||||||||
|
Long-Term debt
(a)
|
$
|
36,376
|
|
$
|
1,970
|
|
$
|
5,687
|
|
$
|
4,858
|
|
$
|
23,861
|
|
||||
|
Interest payments on long-term debt
(b)
|
24,846
|
|
1,619
|
|
3,041
|
|
2,557
|
|
17,629
|
|
|||||||||
|
Capital leases
(c)
|
2,060
|
|
173
|
|
351
|
|
360
|
|
1,176
|
|
|||||||||
|
Operating leases
(c)
|
1,699
|
|
219
|
|
343
|
|
273
|
|
864
|
|
|||||||||
|
Purchase obligations:
(d)
|
|
|
|
|
|
|
|
|
|
|
|||||||||
|
Fuel and purchased power
(e)(f)
|
19,852
|
|
4,457
|
|
5,731
|
|
2,860
|
|
6,804
|
|
|||||||||
|
Other purchase obligations
(g)
|
10,737
|
|
8,467
|
|
1,564
|
|
258
|
|
448
|
|
|||||||||
|
Nuclear decommissioning trust annual funding
(h)
|
270
|
|
42
|
|
29
|
|
26
|
|
173
|
|
|||||||||
|
Total contractual cash obligations
(i)(j)
|
$
|
95,840
|
|
$
|
16,947
|
|
$
|
16,746
|
|
$
|
11,192
|
|
$
|
50,955
|
|
||||
|
(a)
|
See Note
6
to the Consolidated Financial Statements, “Debt and Credit Facilities.”
|
|
(b)
|
Interest payments on variable rate debt instruments were calculated using
December 31, 2015
, interest rates and holding them constant for the life of the instruments.
|
|
(c)
|
See Note
5
to the Consolidated Financial Statements, “Commitments and Contingencies.” Amounts in the table above include the interest component of capital leases based on the interest rates stated in the lease agreements and exclude certain related executory costs.
|
|
(d)
|
Current liabilities, except for current maturities of long-term debt, and purchase obligations reflected on the Consolidated Balance Sheets have been excluded from the above table.
|
|
(e)
|
Includes firm capacity payments that provide Duke Energy with uninterrupted firm access to electricity transmission capacity and natural gas transportation contracts, as well as undesignated contracts and contracts that qualify as normal purchase/normal sale (NPNS). For contracts where the price paid is based on an index, the amount is based on market prices at
December 31, 2015
, or the best projections of the index. For certain of these amounts, Duke Energy may settle on a net cash basis since Duke Energy has entered into payment netting arrangements with counterparties that permit Duke Energy to offset receivables and payables with such counterparties.
|
|
(f)
|
Amounts exclude obligations under the OVEC purchase power agreement. See Note 17 to the Consolidated Financial Statements for additional information.
|
|
(g)
|
Includes contracts for software, telephone, data and consulting or advisory services. Amount also includes contractual obligations for engineering, procurement and construction costs for new generation plants and nuclear plant refurbishments, environmental projects on fossil facilities, maintenance and day to day contract work at certain wind and solar facilities and commitments to buy wind and combustion turbines. Amount excludes certain open purchase orders for services that are provided on demand, for which the timing of the purchase cannot be determined.
|
|
(h)
|
Related to future annual funding obligations to NDTF through nuclear power stations' re-licensing dates. Amounts through 2017 include North Carolina jurisdictional amounts that Duke Energy Progress retained internally and is transitioning to its external decommissioning funds per a 2008 NCUC order. The transition of the original $131 million must be complete by December 31, 2017, and at least 10 percent must be transitioned each year. See Note
9
to the Consolidated Financial Statements, "Asset Retirement Obligations."
|
|
(i)
|
Unrecognized tax benefits of
$88 million
are not reflected in this table as Duke Energy cannot predict when open income tax years will close with completed examinations. See Note
22
to the Consolidated Financial Statements, "Income Taxes."
|
|
(j)
|
The table above excludes reserves for litigation, environmental remediation, asbestos-related injuries and damages claims and self-insurance claims (see Note
5
to the Consolidated Financial Statements, “Commitments and Contingencies”) because Duke Energy is uncertain as to the timing and amount of cash payments that will be required. Additionally, the table above excludes annual insurance premiums that are necessary to operate the business, including nuclear insurance (see Note
5
to the Consolidated Financial Statements, “Commitments and Contingencies”), funding of pension and other post-retirement benefit plans (see Note
21
to the Consolidated Financial Statements, "Employee Benefit Plans"), asset retirement obligations, including ash management expenditures (see Note
9
to the Consolidated Financial Statements, "Asset Retirement Obligations") and regulatory liabilities (see Note
4
to the Consolidated Financial Statements, “Regulatory Matters”) because the amount and timing of the cash payments are uncertain. Also excluded are Deferred Income Taxes and Investment Tax Credits recorded on the Consolidated Balance Sheets since cash payments for income taxes are determined based primarily on taxable income for each discrete fiscal year.
|
70
PART II
QUANTITATIVE AND QUALITATIVE DISCLOSURES ABOUT MARKET RISK
Risk Management Policies
Duke Energy is exposed to market risks associated with commodity prices, interest rates, equity prices and foreign currency exchange rates. Duke Energy has established comprehensive risk management policies to monitor and manage these market risks. Duke Energy’s Chief Executive Officer and Chief Financial Officer are responsible for the overall approval of market risk management policies and the delegation of approval and authorization levels. The Finance and Risk Management Committee of the Board of Directors receives periodic updates from the Chief Risk Officer and other members of management on market risk positions, corporate exposures, and overall risk management activities. The Chief Risk Officer is responsible for the overall governance of managing commodity price risk, including monitoring exposure limits.
The following disclosures about market risk contain forward-looking statements that involve estimates, projections, goals, forecasts, assumptions, risks and uncertainties that could cause actual results or outcomes to differ materially from those expressed in the forward-looking statements. Please review Item 1A, “Risk Factors,” and “Cautionary Statement Regarding Forward-Looking Information” for a discussion of the factors that may impact any such forward-looking statements made herein.
Commodity Price Risk
Duke Energy is exposed to the impact of market fluctuations in the prices of electricity, coal, natural gas and other energy-related products marketed and purchased as a result of its ownership of energy related assets. Duke Energy’s exposure to these fluctuations is limited by the cost-based regulation of its operations in its Regulated Utilities segment as these operations are typically allowed to recover substantially all of these costs through various cost-recovery clauses, including fuel clauses. While there may be a delay in timing between when these costs are incurred and when they are recovered through rates, changes from year to year generally do not have a material impact on operating results of these regulated operations.
Price risk represents the potential risk of loss from adverse changes in the market price of electricity or other energy commodities. Duke Energy’s exposure to commodity price risk is influenced by a number of factors, including contract size, length, market liquidity, location and unique or specific contract terms. Duke Energy employs established policies and procedures to manage risks associated with these market fluctuations, which may include using various commodity derivatives, such as swaps, futures, forwards and options. For additional information, see Note
14
to the Consolidated Financial Statements, “Derivatives and Hedging.”
The inputs and methodologies used to determine the fair value of contracts are validated by an internal group separate from Duke Energy’s deal origination function. While Duke Energy uses common industry practices to develop its valuation techniques, changes in its pricing methodologies or the underlying assumptions could result in significantly different fair values and income recognition.
Hedging Strategies
Duke Energy closely monitors risks associated with commodity price changes on its future operations and, where appropriate, uses various commodity instruments such as electricity, coal and natural gas forward contracts to mitigate the effect of such fluctuations on operations. Duke Energy’s primary use of energy commodity derivatives is to hedge the generation portfolio against exposure to the prices of power and fuel.
The majority of instruments used to manage Duke Energy’s commodity price exposure are either not designated as hedges or do not qualify for hedge accounting. These instruments are referred to as undesignated contracts. Mark-to-market changes for undesignated contracts entered into by regulated businesses are reflected as regulatory assets or liabilities on the Consolidated Balance Sheets. Undesignated contracts entered into by unregulated businesses are marked-to-market each period, with changes in the fair value of the derivative instruments reflected in earnings.
Duke Energy may also enter into other contracts that qualify for the normal purchase/normal sale (NPNS) exception. When a contract meets the criteria to qualify as an NPNS, Duke Energy applies such exception. Income recognition and realization related to NPNS contracts generally coincide with the physical delivery of the commodity. For contracts qualifying for the NPNS exception, no recognition of the contract’s fair value in the Consolidated Financial Statements is required until settlement of the contract as long as the transaction remains probable of occurring.
Generation Portfolio Risks
Duke Energy is primarily exposed to market price fluctuations of wholesale power, natural gas, and coal prices in the Regulated Utilities segment. The Duke Energy Registrants optimize the value of their generation portfolios, which include generation assets, fuel, and emission allowances. Modeled forecasts of future generation output and fuel requirements are based on forward power and fuel markets. The component pieces of the portfolio are bought and sold based on models and forecasts of generation in order to manage the economic value of the portfolio in accordance with the strategies of the business units.
For the Regulated Utilities segment, the generation portfolio not utilized to serve retail operations or committed load is subject to commodity price fluctuations. However, the impact on the Consolidated Statements of Operations is partially offset by mechanisms in these regulated jurisdictions that result in the sharing of net profits from these activities with retail customers.
International Energy generally hedges their expected generation using long-term bilateral power sales contracts when favorable market conditions exist and are subject to wholesale commodity price risks for electricity not sold under such contracts. International Energy dispatches electricity not sold under long-term bilateral contracts into unregulated markets and receives wholesale energy margins and capacity revenues from national system operators.
71
PART II
Interest Rate Risk
Duke Energy is exposed to risk resulting from changes in interest rates as a result of its issuance of variable and fixed-rate debt and commercial paper. Duke Energy manages interest rate exposure by limiting variable-rate exposures to a percentage of total debt and by monitoring the effects of market changes in interest rates. Duke Energy also enters into financial derivative instruments, which may include instruments such as, but not limited to, interest rate swaps, swaptions and U.S. Treasury lock agreements to manage and mitigate interest rate risk exposure. See Notes
1
,
6
,
14
, and
16
to the Consolidated Financial Statements, “Summary of Significant Accounting Policies,” “Debt and Credit Facilities,” “Derivatives and Hedging,” and “Fair Value Measurements.”
At
December 31, 2015
, Duke Energy had
$727 million
notional amount of floating-to-fixed swaps outstanding,
$500 million
notional amount of fixed-to-floating swaps outstanding and
$1,300 million
forward-starting swaps outstanding. In the first quarter of 2016, Duke Energy entered into an additional
$500 million
notional amount of forward-starting swaps. Duke Energy had
$7.9 billion
of unhedged long- and short-term floating interest rate exposure at
December 31, 2015
. The impact of a 100 basis point change in interest rates on pretax income is approximately
$79 million
at
December 31, 2015
. This amount was estimated by considering the impact of the hypothetical interest rates on variable-rate securities outstanding, adjusted for interest rate hedges as of
December 31, 2015
.
See Notes 2 and 14, "Acquisitions and Dispositions" and Derivatives and Hedging," respectively, to the Consolidated Financial Statements for additional information about the forward-starting interest rate swaps related to the Piedmont acquisition.
Credit Risk
Credit risk represents the loss that the Duke Energy Registrants would incur if a counterparty fails to perform under its contractual obligations. Where exposed to credit risk, the Duke Energy Registrants analyze the counterparty's financial condition prior to entering into an agreement and monitor exposure on an on-going basis. The Duke Energy Registrants establish credit limits where appropriate in the context of contractual arrangements and monitor such limits.
To reduce credit exposure, the Duke Energy Registrants seek to include netting provisions with counterparties which permit the offset of receivables and payables with such counterparties. The Duke Energy Registrants also frequently use master agreements with credit support annexes to further mitigate certain credit exposures. The master agreements provide for a counterparty to post cash or letters of credit to the exposed party for exposure in excess of an established threshold. The threshold amount represents a negotiated unsecured credit limit for each party to the agreement, determined in accordance with the Duke Energy Registrants’ internal corporate credit practices and standards. Collateral agreements generally also provide that the inability to post collateral is sufficient cause to terminate contracts and liquidate all positions.
The Duke Energy Registrants also obtain cash or letters of credit from certain counterparties to provide credit support outside of collateral agreements, where appropriate, based on a financial analysis of the counterparty and the regulatory or contractual terms and conditions applicable to each transaction. See Note
14
to the Consolidated Financial Statements, “Derivatives and Hedging,” for additional information regarding credit risk related to derivative instruments.
The Duke Energy Registrants’ principal counterparties for its electric and gas businesses are regional transmission organizations, distribution companies, municipalities, electric cooperatives and utilities located throughout the U.S. and Latin America. The Duke Energy Registrants have concentrations of receivables from such entities throughout these regions. These concentrations of receivables may affect the Duke Energy Registrants’ overall credit risk in that risk factors can negatively impact the credit quality of the entire sector.
The Duke Energy Registrants are also subject to credit risk from transactions with their suppliers that involve pre-payments in conjunction with outsourcing arrangements, major construction projects and certain commodity purchases. The Duke Energy Registrants’ credit exposure to such suppliers may take the form of increased costs or project delays in the event of non-performance. The Duke Energy Registrants' frequently require guarantees or letters of credit from suppliers to mitigate this credit risk.
Credit risk associated with the Duke Energy Registrants’ service to residential, commercial and industrial customers is generally limited to outstanding accounts receivable. The Duke Energy Registrants mitigate this credit risk by requiring customers to provide a cash deposit, letter of credit or surety bond until a satisfactory payment history is established, subject to the rules and regulations in effect in each retail jurisdiction, at which time the deposit is typically refunded. Charge-offs for retail customers have historically been insignificant to the operations of the Duke Energy Registrants and are typically recovered through retail rates. Management continually monitors customer charge-offs and payment patterns to ensure the adequacy of bad debt reserves. Duke Energy Ohio and Duke Energy Indiana sell certain of their accounts receivable and related collections through Cinergy Receivables Company, LLC (CRC), a Duke Energy consolidated variable interest entity. Losses on collection are first absorbed by the equity of CRC and next by the subordinated retained interests held by Duke Energy Ohio, Duke Energy Kentucky and Duke Energy Indiana. See Note
17
to the Consolidated Financial Statements, “Variable Interest Entities.”
Duke Energy Carolinas has third-party insurance to cover certain losses related to asbestos-related injuries and damages above an aggregate self-insured retention. Duke Energy Carolinas’ cumulative payments began to exceed the self-insurance retention in 2008. Future payments up to the policy limit will be reimbursed by the third-party insurance carrier. The insurance policy limit for potential future insurance recoveries indemnification and medical cost claim payments is
$847 million
in excess of the self-insured retention. Receivables for insurance recoveries were
$599 million
and
$616 million
at
December 31, 2015
and
2014
, respectively. These amounts are classified in Other within Investments and Other Assets and Receivables on the Consolidated Balance Sheets. Duke Energy Carolinas is not aware of any uncertainties regarding the legal sufficiency of insurance claims. Duke Energy Carolinas believes the insurance recovery asset is probable of recovery as the insurance carrier continues to have a strong financial strength rating.
The Duke Energy Registrants also have credit risk exposure through issuance of performance guarantees, letters of credit and surety bonds on behalf of less than wholly owned entities and third parties. Where the Duke Energy Registrants have issued these guarantees, it is possible that they could be required to perform under these guarantee obligations in the event the obligor under the guarantee fails to perform. Where the Duke Energy Registrants have issued guarantees related to assets or operations that have been disposed of via sale, they attempt to secure indemnification from the buyer against all future performance obligations under the guarantees. See Note
7
to the Consolidated Financial Statements, “Guarantees and Indemnifications,” for further information on guarantees issued by the Duke Energy Registrants.
72
PART II
Based on the Duke Energy Registrants’ policies for managing credit risk, their exposures and their credit and other reserves, the Duke Energy Registrants do not currently anticipate a materially adverse effect on their consolidated financial position or results of operations as a result of non-performance by any counterparty.
Marketable Securities Price Risk
As described further in Note
15
to the Consolidated Financial Statements, “Investments in Debt and Equity Securities,” Duke Energy invests in debt and equity securities as part of various investment portfolios to fund certain obligations. The vast majority of investments in equity securities are within the NDTF and assets of the various pension and other post-retirement benefit plans.
Pension Plan Assets
Duke Energy maintains investments to facilitate funding the costs of providing non-contributory defined benefit retirement and other post-retirement benefit plans. These investments are exposed to price fluctuations in equity markets and changes in interest rates. The equity securities held in these pension plans are diversified to achieve broad market participation and reduce the impact of any single investment, sector or geographic region. Duke Energy has established asset allocation targets for its pension plan holdings, which take into consideration the investment objectives and the risk profile with respect to the trust in which the assets are held.
A significant decline in the value of plan asset holdings could require Duke Energy to increase funding of its pension plans in future periods, which could adversely affect cash flows in those periods. Additionally, a decline in the fair value of plan assets, absent additional cash contributions to the plan, could increase the amount of pension cost required to be recorded in future periods, which could adversely affect Duke Energy’s results of operations in those periods.
Nuclear Decommissioning Trust Funds
As required by the NRC, NCUC, PSCSC and FPSC, subsidiaries of Duke Energy maintain trust funds to fund the costs of nuclear decommissioning. As of
December 31, 2015
, these funds were invested primarily in domestic and international equity securities, debt securities, cash and cash equivalents and short-term investments. Per the NRC, Internal Revenue Code, NCUC, PSCSC and FPSC requirements, these funds may be used only for activities related to nuclear decommissioning. These investments are exposed to price fluctuations in equity markets and changes in interest rates. Duke Energy actively monitors its portfolios by benchmarking the performance of its investments against certain indices and by maintaining, and periodically reviewing, target allocation percentages for various asset classes. Accounting for nuclear decommissioning recognizes that costs are recovered through retail and wholesale rates; therefore, fluctuations in equity prices do not materially affect the Consolidated Statements of Operations as changes in the fair value of these investments are primarily deferred as regulatory assets or regulatory liabilities pursuant to Orders by the NCUC, PSCSC and FPSC. Earnings or losses of the fund will ultimately impact the amount of costs recovered through retail and wholesale rates. See Note
9
to the Consolidated Financial Statements, “Asset Retirement Obligations” for additional information regarding nuclear decommissioning costs. See Note
15
to the Consolidated Financial Statements, “Investments in Debt and Equity Securities” for additional information regarding NDTF assets.
Foreign Currency Risk
Duke Energy is exposed to foreign currency risk from investments in international businesses owned and operated in countries outside the U.S. and from certain commodity-related transactions within domestic operations that are denominated in foreign currencies. To mitigate risks associated with foreign currency fluctuations, contracts may be denominated in or indexed to the U.S. dollar and/or local inflation rates, or investments may be naturally hedged through debt denominated or issued in the foreign currency. Duke Energy may also use foreign currency derivatives, where possible, to manage its risk related to foreign currency fluctuations. To monitor its currency exchange rate risks, Duke Energy uses sensitivity analysis, which measures the impact of devaluation of the foreign currencies to which it has exposure.
Duke Energy’s primary foreign currency rate exposure is to the Brazilian real. The table below summarizes the potential effect of foreign currency devaluations on Duke Energy’s Consolidated Statement of Operations and Consolidated Balance Sheets, based on a sensitivity analysis performed as of
December 31, 2015
and
December 31, 2014
.
Summary of Sensitivity Analysis for Foreign Currency Risks
|
Assuming 10 percent devaluation
|
|||||||
|
in the currency exchange rates in
|
|||||||
|
|
all exposure currencies
|
||||||
|
|
As of December 31,
|
||||||
|
(in millions)
|
2015
|
|
2014
|
|
|||
|
Income Statement impact
(a)
|
$
|
(17
|
)
|
$
|
(20
|
)
|
|
|
Balance Sheet impact
(b)
|
(74
|
)
|
(98
|
)
|
|||
(a) Amounts represent the potential annual net pretax loss on the translation of local currency earnings to the U.S. dollar in
2015
and
2014
, respectively.
|
(b)
|
Amounts represent the potential impact to the currency translation through Accumulated Other Comprehensive Income (AOCI) on the Consolidated Balance Sheets.
|
73
PART II
OTHER MATTERS
Ratios of Earnings to Fixed Charges
The Duke Energy Registrants’ ratios of earnings to fixed charges, as calculated using SEC guidelines, are included in the table below.
|
Years Ended December 31,
|
||||||||
|
2015
|
|
2014
|
|
2013
|
|
|||
|
Duke Energy
|
3.2
|
|
3.2
|
|
3.0
|
|
||
|
Duke Energy Carolinas
|
4.7
|
|
4.6
|
|
4.4
|
|
||
|
Progress Energy
|
2.9
|
|
2.7
|
|
2.2
|
|
||
|
Duke Energy Progress
|
3.7
|
|
3.5
|
|
3.7
|
|
||
|
Duke Energy Florida
|
4.3
|
|
4.1
|
|
2.9
|
|
||
|
Duke Energy Ohio
|
3.6
|
|
2.1
|
|
2.2
|
|
||
|
Duke Energy Indiana
|
3.6
|
|
4.1
|
|
4.1
|
|
||
Environmental Regulations
Duke Energy is subject to international, federal, state and local regulations regarding air and water quality, hazardous and solid waste disposal and other environmental matters. The Subsidiary Registrants are subject to federal, state and local regulations regarding air and water quality, hazardous and solid waste disposal and other environmental matters. These regulations can be changed from time to time and result in new obligations of the Duke Energy Registrants.
The following sections outline various proposed and recently enacted regulations that may impact the Duke Energy Registrants. Refer to Note
4
to the Consolidated Financial Statements, "Regulatory Matters," for further information regarding potential plant retirements and regulatory filings related to the Duke Energy Registrants.
Coal Combustion Residuals
On April 17, 2015, the EPA published in the Federal Register a rule to regulate the disposal of CCR from electric utilities as solid waste. The federal regulation, which became effective in October 2015, classifies CCR as nonhazardous waste under Subtitle D of the Resource Conservation and Recovery Act and allows for beneficial use of CCR with some restrictions. The regulation applies to all new and existing landfills, new and existing surface impoundments receiving CCR and existing surface impoundments that are no longer receiving CCR but contain liquid located at stations currently generating electricity (regardless of fuel source). The rule establishes requirements regarding landfill design, structural integrity design and assessment criteria for surface impoundments, groundwater monitoring and protection procedures and other operational and reporting procedures to ensure the safe disposal and management of CCR. In addition to the requirements of the federal CCR regulation, CCR landfills and surface impoundments will continue to be independently regulated by most states. Duke Energy Carolinas, Progress Energy, Duke Energy Progress, Duke Energy Ohio and Duke Energy Indiana recorded asset retirement obligation amounts during 2015. Cost recovery for future expenditures will be pursued through the normal ratemaking process with federal and state utility commissions and via wholesale contracts, which permit recovery of necessary and prudently incurred costs associated with Duke Energy’s regulated operations. For more information, see Note
9
to the Consolidated Financial Statements, "Asset Retirement Obligations."
Duke Energy Ohio's nonregulated Beckjord station, a facility retired during 2014, is not subject to the recently enacted EPA rule related to the disposal of CCR from electric utilities. However, if costs are incurred as a result of environmental regulations or to mitigate risk associated with on-site storage of coal ash at the facility, the costs could have an adverse impact on Duke Energy Ohio's financial position, results of operations and cash flows. Costs incurred by OVEC related to environmental regulations could also have an adverse impact on Duke Energy Ohio's financial position, results of operations and cash flows.
North Carolina Coal Ash Management Act of 2014
On September 20, 2014, the Coal Ash Act became law and was amended on June 24, 2015, by the North Carolina Mountain Energy Act. The Coal Ash Act, as amended, established regulations regarding the use and closure of existing ash impoundments, the disposal of ash at active coal plants and the handling of surface and groundwater impacts from ash basins in North Carolina. The Coal Ash Act, as amended, deemed eight ash impoundments at four facilities to be high priority and requires closure no later than August 1, 2019, with a potential extension for closure of the Asheville impoundment until 2022. The Coal Ash Act requires state regulators to provide risk ranking classifications for the remaining 25 ash impoundments at 10 North Carolina facilities. The method and timing of closure of these ash impoundments will be determined by the specific risk classifications, with closure no later than December 31, 2029.
Other than the high priority sites specifically delineated by the Coal Ash Act, the NCDEQ has issued either preliminary draft risk rankings or has yet to designate specific risk classifications. These risk rankings were generally determined based on three primary criteria: structural integrity of impoundments and impact to both surface and groundwaters. NCDEQ categorized 12 basins at four sites as intermediate risk and four basins at three plants as low risk. NCDEQ also categorized nine basins at six plants as "low-to-intermediate" risk, thereby not assigning a proposed risk ranking at this time. The risk rankings of these sites will be based upon receipt of additional data primarily related to groundwater quality and the completion of specific modifications and repairs to the impoundments. NCDEQ is expected to finalize its risk classifications after a public comment process. Final proposed classifications are subject to Coal Ash Commission adjustments and approval but may become law if the Commission fails to act within 60 days of receiving the final proposed classifications. Estimated asset retirement obligations have been recognized based on the assigned risk categories or, if not assigned, based on a probability weighting of potential closure methods. Actual closure costs incurred could be materially different from current estimates that form the basis of the recorded asset retirement obligations. For further information on asset retirement obligations, refer to Note 9 to the Consolidated Financial Statements, “Asset Retirement Obligations.”
74
PART II
Mercury and Air Toxics Standards
The final Mercury and Air Toxics Standards (MATS) rule was issued on February 16, 2012. The rule establishes emission limits for hazardous air pollutants from new and existing coal-fired and oil-fired steam electric generating units. The rule required sources to comply with emission limits by April 16, 2015. Under the Clean Air Act (CAA), permitting authorities have the discretion to grant up to a one-year compliance extension, on a case-by-case basis, to sources that are unable to complete the installation of emission controls before the compliance deadline. The Duke Energy Registrants have requested and received compliance extensions for a number of plants. The rule requirements currently apply where a compliance extension was not received. Strategies to achieve compliance include installation of new air emission control equipment, development of monitoring processes, fuel switching and acceleration of retirement for some coal-fired electric-generation units. For additional information, refer to Note 4 of the Consolidated Financial Statements, “Regulatory Matters,” regarding potential plant retirements.
In April 2014, several petitions for review of the final rule were denied by the U.S. Court of Appeals for the District of Columbia (D.C. Circuit Court). On November 25, 2014, the Supreme Court granted a petition for review based on the issue of whether the EPA unreasonably refused to consider costs in determining whether it is appropriate and necessary to regulate hazardous air pollutants from coal-fired and oil-fired steam electric generating units. In June 2015, the Supreme Court reversed the D.C. Circuit Court's decision and remanded the case to the D.C. Circuit Court for further proceedings, finding that the EPA erred in refusing to consider costs when deciding whether it was appropriate and necessary to regulate emissions of hazardous air pollutants from steam electric generating units. In December 2015, the D.C. Circuit Court granted the EPA's request to keep the rule in effect while the agency completes the rulemaking in response to the Supreme Court's ruling. On December 1, 2015 the EPA proposed a supplemental finding to address the cost issue raised by the Supreme Court in its June 2015 ruling. If finalized as proposed, the finding would result in no changes to the current MATS regulatory requirements. The EPA has committed to complete its rulemaking by April 2016. The Duke Energy Registrants cannot predict the results of these proceedings.
Clean Water Act 316(b)
The EPA published the final 316(b) cooling water intake structure rule on August 15, 2014, with an effective date of October 14, 2014. The rule applies to 26 of the electric generating facilities the Duke Energy Registrants own and operate. The rule allows for several options to demonstrate compliance and provides flexibility to the state environmental permitting agencies to make determinations on controls, if any, that will be required for cooling water intake structures. Any required intake structure modifications and/or retrofits are expected to be installed in the 2019 to 2022 time frame. Petitions challenging the rule have been filed by several groups. It is unknown at this time when the courts will rule on the petitions.
Steam Electric Effluent Limitations Guidelines
On January 4, 2016, the final Steam Electric Effluent Limitations Guidelines (ELG) rule became effective. The rule establishes new requirements for wastewater streams associated with steam electric power generation and includes more stringent controls for any new coal plants that may be built in the future. Affected facilities must comply between 2018 and 2023, depending on timing of new Clean Water Act permits. Most, if not all, of the steam electric generating facilities the Duke Energy Registrants own are likely affected sources. The Duke Energy Registrants are well positioned to meet the requirements of the rule due to current efforts to convert to dry ash handling. Petitions challenging the rule have been filed by several groups. It is unknown at this time when the courts will rule on the petitions.
Estimated Cost and Impacts of Rulemakings
Duke Energy will incur capital expenditures to comply with the environmental regulations and rules discussed above. The following five-year table provides estimated costs, excluding AFUDC, of new control equipment that may need to be installed on existing power plants primarily to comply with the Coal Ash Act requirements for conversion to dry disposal of bottom ash and fly ash, MATS, Clean Water Act 316(b) and ELGs, through December 31, 2020. The table excludes ash basin closure costs recorded as Asset retirement obligations on the Consolidated Balance Sheets. For more information related to asset retirement obligations, see Note 9 to the Consolidated Financial Statements.
|
(in millions)
|
Five-Year Estimated Costs
|
|
||||
|
Duke Energy
|
$
|
1,350
|
|
|||
|
Duke Energy Carolinas
|
625
|
|
||||
|
Progress Energy
|
350
|
|
||||
|
Duke Energy Progress
|
300
|
|
||||
|
Duke Energy Florida
|
50
|
|
||||
|
Duke Energy Ohio
|
100
|
|
||||
|
Duke Energy Indiana
|
275
|
|
||||
The Duke Energy Registrants also expect to incur increased fuel, purchased power, operation and maintenance and other expenses, in addition to costs for replacement generation for potential coal-fired power plant retirements, as a result of these regulations. Actual compliance costs incurred may be materially different from these estimates due to reasons such as the timing and requirements of EPA regulations and the resolution of legal challenges to the rules. The Duke Energy Registrants intend to seek rate recovery of necessary and prudently incurred costs associated with regulated operations to comply with these regulations.
Cross-State Air Pollution Rule
On August 8, 2011, the final Cross-State Air Pollution Rule (CSAPR) was published in the Federal Register. The CSAPR established state-level annual sulfur dioxide (SO
2
) budgets and annual and seasonal nitrogen oxide (NO
x
) budgets that were to take effect on January 1, 2012.
75
PART II
On August 21, 2012, the D.C. Circuit Court vacated the CSAPR. The court also directed the EPA to continue administering the Clean Air Interstate Rule (CAIR), which required additional reductions in SO
2
and NO
X
emissions beginning in 2015. On April 29, 2014, the U.S. Supreme Court (Supreme Court) reversed the D.C. Circuit Court’s decision, finding that with CSAPR the EPA reasonably interpreted the good neighbor provision of the CAA. The case was remanded to the D.C. Circuit Court for further proceedings consistent with the Supreme Court’s opinion. On October 23, 2014, the D.C. Circuit Court lifted the CSAPR stay, which allowed Phase 1 of the rule to take effect on January 1, 2015, terminating the CAIR. Where the CSAPR requirements are constraining, actions to meet the requirements could include purchasing emission allowances, power purchases, curtailing generation and utilizing low sulfur fuel. The CSAPR will not result in Duke Energy Registrants adding new emission controls.
Additional legal challenges to the CSAPR filed in 2012, not addressed by the D.C. Circuit Court decision to vacate the CSAPR, are still ongoing. Oral arguments were held February 25, 2015. On July 28, 2015, the court issued decisions finding certain Phase 1 and 2 emissions budgets invalid, which impact South Carolina, North Carolina and Florida. The court remanded the CSAPR to the EPA for reconsideration of the budgets in question. On December 3, 2015 the EPA proposed a rule to lower the current CSAPR Phase 2 state ozone season NO
X
emission budgets for 23 Eastern states, including North Carolina, Ohio, Kentucky and Indiana. The EPA also proposed to eliminate the CSAPR Phase 2 ozone season state NO
X
budgets for Florida and South Carolina. The EPA proposed that these changes to state budgets take effect on May 1, 2017. The Duke Energy Registrants cannot predict the outcome of these proceedings.
Carbon Pollution Standards for New, Modified and Reconstructed Power Plants
On October 23, 2015, the EPA published a final rule in the Federal Register establishing carbon dioxide (CO
2
) emissions limits for new, modified and reconstructed power plants. The requirements for new plants do not apply to any facility that Duke Energy currently has in operation, but would apply to any plants that will be constructed going forward. The EPA set an emissions standard for coal units of 1,400 lbs. of CO
2
per gross MWh. While this limit is higher than the EPA's proposed standard of 1,100 lbs. per MWh, it would still require the application of partial carbon capture and storage (CCS) technology for a coal unit to be able to meet the limit. Utility-scale CCS is not currently a demonstrated and commercially available technology for coal-fired electric generating units, and therefore the final standard effectively bars the development of new coal-fired generation. The final standard of 1,000 lbs. of CO
2
per gross MWh for new natural gas combined-cycle units is the same as the proposed limit. The Duke Energy Registrants do not expect the impacts of the final standards will be material to Duke Energy's financial position, results of operations or cash flows.
Clean Power Plan
On October 23, 2015, the EPA published in the Federal Register the CPP rule that regulates CO
2
emissions from existing fossil fuel-fired EGUs. The CPP establishes CO
2
emission rates and mass cap goals that apply to fossil fuel-fired generation. Under the CPP, states are required to develop and submit a final compliance plan, or an initial plan with an extension request, to the EPA by September 6, 2016. States that receive an extension must submit a final completed plan to the EPA by September 6, 2018. The EPA intends to review and approve or disapprove state plans within 12 months of receipt. The CPP does not directly impose regulatory requirements on the Duke Energy Registrants. State implementation plans will include the regulatory requirements that will apply to the Duke Energy Registrants. The EPA also published a proposed federal plan for public comment. A federal plan would be applied to states that fail to submit a plan to EPA or where a state plan is not approved by the EPA. Comments on the proposed federal plan were due by January 21, 2016.
Legal challenges to the final CPP have been filed by stakeholders. On January 21, 2016 the U.S. Court of Appeals for the District of Columbia denied motions from petitioners to stay the Clean Power Plan pending court review. The court did grant petitioner requests for expedited briefing in the case. Oral arguments are scheduled in June 2016. The court ordered that final briefs in the case be filed by April 22, 2016. On February 9, 2016, the U.S. Supreme Court granted a stay in the matter, halting enforcement until legal challenges are resolved.
Compliance with CPP could cause the industry to replace coal generation with natural gas and renewables. Costs to operate coal-fired generation plants continue to grow due to increasing environmental compliance requirements, including ash management costs unrelated to CPP, which may result in the retirement of coal-fired generation plants earlier than the current useful lives. The Duke Energy Registrants are studying the CPP rule and are working with states to identify the best approach for developing state plans that will establish the regulatory requirements applicable to the Duke Energy Registrants. The Duke Energy Registrants could incur increased fuel, purchased power, operation and maintenance and other costs for replacement generation as a result of this rule. Due to the uncertainties related to the implementation of the CPP, the Duke Energy Registrants cannot predict the outcome of these matters.
Global Climate Change
The Duke Energy Registrants’ greenhouse gas (GHG) emissions consist primarily of CO
2
with most coming from their fleet of coal-fired power plants in the U.S. In 2015, the Duke Energy Registrants’ power plants in the U.S. emitted approximately 108 million tons of CO
2
. Duke Energy’s international operations emitted approximately 2 million tons of CO
2
in 2015. The Duke Energy Registrants’ future CO
2
emissions will be influenced by variables including new regulations, economic conditions that affect electricity demand and the Duke Energy Registrants’ decisions regarding generation technologies deployed to meet customer electricity needs.
The Duke Energy Registrants have taken actions that has resulted in reduced CO
2
emissions over time. Between 2005 and 2015, the Duke Energy Registrants have collectively lowered the CO
2
emissions from their electricity generation in the U.S. by more than 25 percent. These actions will lower the exposure to any future mandatory CO
2
emission reduction requirements or carbon tax, whether as a result of federal legislation or the final CPP regulation. Under any future scenario involving mandatory CO
2
limitations, the Duke Energy Registrants would plan to seek recovery of their compliance costs through appropriate regulatory mechanisms.
76
PART II
The Duke Energy Registrants recognize certain groups associate severe weather events with climate change, and forecast the possibility these weather events could have a material impact on future results of operations should they occur more frequently and with greater severity. However, the uncertain nature of potential changes of extreme weather events (such as increased frequency, duration and severity), the long period of time over which any potential changes might take place and the inability to predict these with any degree of accuracy, make estimating any potential future financial risk to the Duke Energy Registrants’ operations impossible. Currently, the Duke Energy Registrants plan and prepare for potential extreme weather events, such as ice storms, tornadoes, hurricanes, severe thunderstorms, high winds and droughts.
The Duke Energy Registrants routinely take steps to reduce the potential impact of severe weather events on their electric distribution systems. The Duke Energy Registrants’ electric generating facilities are designed to withstand extreme weather events without significant damage. The Duke Energy Registrants maintain an inventory of coal and oil on-site to mitigate the effects of any potential short-term disruption in fuel supply so they can continue to provide customers with an uninterrupted supply of electricity. The Subsidiary Registrants have programs in place to effectively manage the impact of future droughts on U.S. operations.
Nuclear Matters
Following the events at the Fukushima Daiichi nuclear power station in Japan, Duke Energy conducted thorough inspections at each of its seven nuclear sites during 2011. The initial inspections did not identify any significant vulnerabilities; however, Duke Energy is reviewing designs to evaluate safety margins to external events. Emergency-response capabilities, written procedures and engineering specifications were reviewed to verify each site’s ability to respond in the unlikely event of a beyond design-basis event. Duke Energy is working within the nuclear industry to improve safety standards and margin using the three layers of safety approach used in the U.S.: protection, mitigation and emergency response. Emergency equipment has been added or is in the process of being added at each station to perform key safety functions in the event that backup power sources are lost and are not expected to be restored within a specified period of time. These improvements are in addition to the numerous layers of safety measures and systems previously in place.
In March 2011, the NRC formed a task force to conduct a comprehensive review of processes and regulations to determine whether the agency should make additional improvements to the nuclear regulatory system. On July 13, 2011, the task force proposed a set of improvements designed to ensure protection, enhance accident mitigation, strengthen emergency preparedness and improve efficiency of NRC programs. The recommendations were further prioritized into three tiers based on the safety enhancement level. On March 12, 2012, the NRC issued three regulatory orders requiring safety enhancements related to mitigation strategies to respond to extreme natural events resulting in the loss of power at a plant, ensuring reliable hardened containment vents and enhancing spent fuel pool instrumentation.
On August 30, 2012, the NRC issued implementation guidance to enable power plants to achieve compliance with the orders issued in March 2012. Plants were required to submit implementation plans to the NRC by February 28, 2013, and complete implementation of the safety enhancements within two refueling outages or by December 31, 2016, whichever comes first. Each plant is also required to reassess their seismic and flooding hazards using present-day methods and information, conduct inspections to ensure protection against hazards in the current design basis and re-evaluate emergency communications systems and staffing levels.
Duke Energy is committed to compliance with all safety enhancements ordered by the NRC in connection with the March 12, 2012, regulatory orders noted above, the cost of which could be material. Until such time as the NRC-mandated reassessment of flooding and seismic hazards is complete, the exact scope and cost of compliance modifications to Duke Energy’s sites will not be known. With the NRC’s continuing review of the remaining recommendations, Duke Energy cannot predict to what extent the NRC will impose additional licensing and safety-related requirements or the costs of complying with such requirements. Upon receipt of additional guidance from the NRC and a collaborative industry review, Duke Energy will be able to determine an implementation plan and associated costs. See Item 1A, “Risk Factors,” for further discussion of applicable risk factors.
New Accounting Standards
See Note
1
to the Consolidated Financial Statements, “Summary of Significant Accounting Policies,” for a discussion of the impact of new accounting standards.
See “Management’s Discussion and Analysis of Results of Operations and Financial Condition – Quantitative and Qualitative Disclosures About Market Risk.”
77
PART II
|
Duke Energy Corporation (Duke Energy)
|
|
|
Report of Independent Registered Public Accounting Firm
|
|
|
Consolidated Statements of Operations
|
|
|
Consolidated Statements of Comprehensive Income
|
|
|
Consolidated Balance Sheets
|
|
|
Consolidated Statements of Cash Flows
|
|
|
Consolidated Statements of Changes in Equity
|
|
|
|
|
|
Duke Energy Carolinas, LLC (Duke Energy Carolinas)
|
|
|
Report of Independent Registered Public Accounting Firm
|
|
|
Consolidated Statements of Operations and Comprehensive Income
|
|
|
Consolidated Balance Sheets
|
|
|
Consolidated Statements of Cash Flows
|
|
|
Consolidated Statements of Changes in Member’s Equity
|
|
|
|
|
|
Progress Energy, Inc. (Progress Energy)
|
|
|
Report of Independent Registered Public Accounting Firm
|
|
|
Consolidated Statements of Operations and Comprehensive Income
|
|
|
Consolidated Balance Sheets
|
|
|
Consolidated Statements of Cash Flows
|
|
|
Consolidated Statements of Changes in Common Stockholder’s Equity
|
|
|
|
|
|
Duke Energy Progress, LLC (formerly Duke Energy Progress, Inc.) (Duke Energy Progress)
|
|
|
Report of Independent Registered Public Accounting Firm
|
|
|
Consolidated Statements of Operations and Comprehensive Income
|
|
|
Consolidated Balance Sheets
|
|
|
Consolidated Statements of Cash Flows
|
|
|
Consolidated Statements of Changes in Member's/Common Stockholder’s Equity
|
|
|
|
|
|
Duke Energy Florida, LLC (formerly Duke Energy Florida, Inc.) (Duke Energy Florida)
|
|
|
Report of Independent Registered Public Accounting Firm
|
|
|
Consolidated Statements of Operations and Comprehensive Income
|
|
|
Consolidated Balance Sheets
|
|
|
Consolidated Statements of Cash Flows
|
|
|
Consolidated Statements of Changes in Member's/Common Stockholder’s Equity
|
|
|
|
|
|
Duke Energy Ohio, Inc. (Duke Energy Ohio)
|
|
|
Report of Independent Registered Public Accounting Firm
|
|
|
Consolidated Statements of Operations and Comprehensive Income
|
|
|
Consolidated Balance Sheets
|
|
|
Consolidated Statements of Cash Flows
|
|
|
Consolidated Statements of Changes in Common Stockholder’s Equity
|
|
|
|
|
|
Duke Energy Indiana, Inc. (subsequently Duke Energy Indiana, LLC) (Duke Energy Indiana)
|
|
|
Report of Independent Registered Public Accounting Firm
|
|
|
Consolidated Statements of Operations and Comprehensive Income
|
|
|
Consolidated Balance Sheets
|
|
|
Consolidated Statements of Cash Flows
|
|
|
Consolidated Statements of Changes in Common Stockholder’s Equity
|
|
|
|
|
78
PART II
|
Combined Notes to Consolidated Financial Statements
|
|
|
Note 1 – Summary of Significant Accounting Policies
|
|
|
Note 2 – Acquisitions, Dispositions and Sales of Other Assets
|
|
|
Note 3 – Business Segments
|
|
|
Note 4 – Regulatory Matters
|
|
|
Note 5 – Commitments and Contingencies
|
|
|
Note 6 – Debt and Credit Facilities
|
|
|
Note 7 – Guarantees and Indemnifications
|
|
|
Note 8 – Joint Ownership of Generating and Transmission Facilities
|
|
|
Note 9 – Asset Retirement Obligations
|
|
|
Note 10 – Property, Plant and Equipment
|
|
|
Note 11 – Goodwill and Intangible Assets
|
|
|
Note 12 – Investments in Unconsolidated Affiliates
|
|
|
Note 13 – Related Party Transactions
|
|
|
Note 14 – Derivatives and Hedging
|
|
|
Note 15 – Investments in Debt and Equity Securities
|
|
|
Note 16 – Fair Value Measurements
|
|
|
Note 17 – Variable Interest Entities
|
|
|
Note 18 – Common Stock
|
|
|
Note 19 – Severance
|
|
|
Note 20 – Stock-Based Compensation
|
|
|
Note 21 – Employee Benefit Plans
|
|
|
Note 22 – Income Taxes
|
|
|
Note 23 – Other Income and Expenses, Net
|
|
|
Note 24 – Subsequent Events
|
|
|
Note 25 – Quarterly Financial Data (Unaudited)
|
|
79
PART II
REPORT OF INDEPENDENT REGISTERED PUBLIC ACCOUNTING FIRM
To the Board of Directors and Stockholders of
Duke Energy Corporation
Charlotte, North Carolina
We have audited the accompanying consolidated balance sheets of Duke Energy Corporation and subsidiaries (the "Company") as of December 31, 2015 and 2014, and the related consolidated statements of operations, comprehensive income, changes in equity, and cash flows for each of the three years in the period ended December 31, 2015. We also have audited the Company's internal control over financial reporting as of December 31, 2015, based on criteria established in Internal Control - Integrated Framework (2013) issued by the Committee of Sponsoring Organizations of the Treadway Commission. The Company's management is responsible for these financial statements, for maintaining effective internal control over financial reporting, and for its assessment of the effectiveness of internal control over financial reporting, included in the accompanying Management’s Annual Report On Internal Control Over Financial Reporting. Our responsibility is to express an opinion on these financial statements and an opinion on the Company's internal control over financial reporting based on our audits.
We conducted our audits in accordance with the standards of the Public Company Accounting Oversight Board (United States). Those standards require that we plan and perform the audit to obtain reasonable assurance about whether the financial statements are free of material misstatement and whether effective internal control over financial reporting was maintained in all material respects. Our audits of the financial statements included examining, on a test basis, evidence supporting the amounts and disclosures in the financial statements, assessing the accounting principles used and significant estimates made by management, and evaluating the overall financial statement presentation. Our audit of internal control over financial reporting included obtaining an understanding of internal control over financial reporting, assessing the risk that a material weakness exists, and testing and evaluating the design and operating effectiveness of internal control based on the assessed risk. Our audits also included performing such other procedures as we considered necessary in the circumstances. We believe that our audits provide a reasonable basis for our opinions.
A company's internal control over financial reporting is a process designed by, or under the supervision of, the company's principal executive and principal financial officers, or persons performing similar functions, and effected by the company's board of directors, management, and other personnel to provide reasonable assurance regarding the reliability of financial reporting and the preparation of financial statements for external purposes in accordance with generally accepted accounting principles. A company's internal control over financial reporting includes those policies and procedures that (1) pertain to the maintenance of records that, in reasonable detail, accurately and fairly reflect the transactions and dispositions of the assets of the company; (2) provide reasonable assurance that transactions are recorded as necessary to permit preparation of financial statements in accordance with generally accepted accounting principles, and that receipts and expenditures of the company are being made only in accordance with authorizations of management and directors of the company; and (3) provide reasonable assurance regarding prevention or timely detection of unauthorized acquisition, use, or disposition of the company's assets that could have a material effect on the financial statements.
Because of the inherent limitations of internal control over financial reporting, including the possibility of collusion or improper management override of controls, material misstatements due to error or fraud may not be prevented or detected on a timely basis. Also, projections of any evaluation of the effectiveness of the internal control over financial reporting to future periods are subject to the risk that the controls may become inadequate because of changes in conditions, or that the degree of compliance with the policies or procedures may deteriorate.
In our opinion, the consolidated financial statements referred to above present fairly, in all material respects, the financial position of Duke Energy Corporation and subsidiaries as of December 31, 2015 and 2014, and the results of their operations and their cash flows for each of the three years in the period ended December 31, 2015, in conformity with accounting principles generally accepted in the United States of America. Also, in our opinion, the Company maintained, in all material respects, effective internal control over financial reporting as of December 31, 2015, based on the criteria established in Internal Control - Integrated Framework (2013) issued by the Committee of Sponsoring Organizations of the Treadway Commission.
As discussed in Note 22 to the consolidated financial statements, Duke Energy Corporation and subsidiaries adopted ASU 2015-17, Income Taxes (Topic 740); Balance Sheet Classification of Deferred Taxes effective December 31, 2015 on a prospective basis.
/s/ Deloitte & Touche LLP
Charlotte, North Carolina
February 25, 2016
80
PART II
DUKE ENERGY CORPORATION
CONSOLIDATED STATEMENTS OF OPERATIONS
|
|
Years Ended December 31,
|
||||||||||
|
(in millions, except per share amounts)
|
2015
|
|
2014
|
|
2013
|
|
|||||
|
Operating Revenues
|
|
|
|
||||||||
|
Regulated electric
|
$
|
21,379
|
|
$
|
21,550
|
|
$
|
20,329
|
|
||
|
Nonregulated electric and other
|
1,544
|
|
1,802
|
|
1,916
|
|
|||||
|
Regulated natural gas
|
536
|
|
573
|
|
511
|
|
|||||
|
Total operating revenues
|
23,459
|
|
23,925
|
|
22,756
|
|
|||||
|
Operating Expenses
|
|
|
|
||||||||
|
Fuel used in electric generation and purchased power – regulated
|
7,308
|
|
7,686
|
|
7,108
|
|
|||||
|
Fuel used in electric generation and purchased power – nonregulated
|
354
|
|
533
|
|
540
|
|
|||||
|
Cost of natural gas
|
195
|
|
248
|
|
224
|
|
|||||
|
Operation, maintenance and other
|
5,871
|
|
5,856
|
|
5,673
|
|
|||||
|
Depreciation and amortization
|
3,144
|
|
3,066
|
|
2,668
|
|
|||||
|
Property and other taxes
|
1,135
|
|
1,213
|
|
1,274
|
|
|||||
|
Impairment charges
|
120
|
|
81
|
|
399
|
|
|||||
|
Total operating expenses
|
18,127
|
|
18,683
|
|
17,886
|
|
|||||
|
Gains (Losses) on Sales of Other Assets and Other, net
|
35
|
|
16
|
|
(16
|
)
|
|||||
|
Operating Income
|
5,367
|
|
5,258
|
|
4,854
|
|
|||||
|
Other Income and Expenses
|
|
|
|
||||||||
|
Equity in earnings of unconsolidated affiliates
|
69
|
|
130
|
|
122
|
|
|||||
|
Gains on sales of unconsolidated affiliates
|
7
|
|
17
|
|
100
|
|
|||||
|
Other income and expenses, net
|
307
|
|
351
|
|
262
|
|
|||||
|
Total other income and expenses
|
383
|
|
498
|
|
484
|
|
|||||
|
Interest Expense
|
1,613
|
|
1,622
|
|
1,543
|
|
|||||
|
Income From Continuing Operations Before Income Taxes
|
4,137
|
|
4,134
|
|
3,795
|
|
|||||
|
Income Tax Expense From Continuing Operations
|
1,326
|
|
1,669
|
|
1,205
|
|
|||||
|
Income From Continuing Operations
|
2,811
|
|
2,465
|
|
2,590
|
|
|||||
|
Income (Loss) From Discontinued Operations, net of tax
|
20
|
|
(576
|
)
|
86
|
|
|||||
|
Net Income
|
2,831
|
|
1,889
|
|
2,676
|
|
|||||
|
Less: Net Income Attributable to Noncontrolling Interests
|
15
|
|
6
|
|
11
|
|
|||||
|
Net Income Attributable to Duke Energy Corporation
|
$
|
2,816
|
|
$
|
1,883
|
|
$
|
2,665
|
|
||
|
Earnings Per Share
–
Basic and Diluted
|
|
|
|
||||||||
|
Income from continuing operations attributable to Duke Energy Corporation common stockholders
|
|
|
|
||||||||
|
Basic
|
$
|
4.02
|
|
$
|
3.46
|
|
$
|
3.64
|
|
||
|
Diluted
|
$
|
4.02
|
|
$
|
3.46
|
|
$
|
3.63
|
|
||
|
Income (Loss) from discontinued operations attributable to Duke Energy Corporation common stockholders
|
|
|
|
||||||||
|
Basic
|
$
|
0.03
|
|
$
|
(0.80
|
)
|
$
|
0.13
|
|
||
|
Diluted
|
$
|
0.03
|
|
$
|
(0.80
|
)
|
$
|
0.13
|
|
||
|
Net Income attributable to Duke Energy Corporation common stockholders
|
|
|
|
||||||||
|
Basic
|
$
|
4.05
|
|
$
|
2.66
|
|
$
|
3.77
|
|
||
|
Diluted
|
$
|
4.05
|
|
$
|
2.66
|
|
$
|
3.76
|
|
||
|
Weighted average shares outstanding
|
|
|
|
||||||||
|
Basic
|
694
|
|
707
|
|
706
|
|
|||||
|
Diluted
|
694
|
|
707
|
|
706
|
|
|||||
See Notes to Consolidated Financial Statements
81
PART II
DUKE ENERGY CORPORATION
CONSOLIDATED STATEMENTS OF COMPREHENSIVE INCOME
|
|
Years Ended December 31,
|
||||||||||
|
(in millions)
|
2015
|
|
2014
|
|
2013
|
|
|||||
|
Net Income
|
$
|
2,831
|
|
$
|
1,889
|
|
$
|
2,676
|
|
||
|
Other Comprehensive Loss, net of tax
|
|||||||||||
|
Foreign currency translation adjustments
|
(264
|
)
|
(124
|
)
|
(197
|
)
|
|||||
|
Pension and OPEB adjustments
(a)
|
(13
|
)
|
4
|
|
38
|
|
|||||
|
Net unrealized (losses) gains on cash flow hedges
(b)
|
—
|
|
(26
|
)
|
59
|
|
|||||
|
Reclassification into earnings from cash flow hedges
|
9
|
|
7
|
|
1
|
|
|||||
|
Unrealized (losses) gains on available-for-sale securities
|
(6
|
)
|
3
|
|
(4
|
)
|
|||||
|
Reclassification into earnings from available-for-sale securities
|
—
|
|
—
|
|
4
|
|
|||||
|
Other Comprehensive Loss, net of tax
|
(274
|
)
|
(136
|
)
|
(99
|
)
|
|||||
|
Comprehensive Income
|
2,557
|
|
1,753
|
|
2,577
|
|
|||||
|
Less: Comprehensive Income Attributable to Noncontrolling Interests
|
4
|
|
14
|
|
5
|
|
|||||
|
Comprehensive Income Attributable to Duke Energy Corporation
|
$
|
2,553
|
|
$
|
1,739
|
|
$
|
2,572
|
|
||
|
(a)
|
Net of insignificant tax expense in 2015, 2014 and $17 million tax expense in 2013. See Note
21
for additional information.
|
|
(b)
|
Net of insignificant tax expense in 2015, $13 million tax benefit in 2014 and $20 million tax expense in 2013.
|
See Notes to Consolidated Financial Statements
82
PART II
DUKE ENERGY CORPORATION
CONSOLIDATED BALANCE SHEETS
|
|
December 31,
|
||||||
|
(in millions)
|
2015
|
|
2014
|
|
|||
|
ASSETS
|
|
|
|||||
|
Current Assets
|
|
|
|||||
|
Cash and cash equivalents
|
$
|
857
|
|
$
|
2,036
|
|
|
|
Receivables (net of allowance for doubtful accounts of $18 at December 31, 2015 and $17 at December 31, 2014)
|
703
|
|
791
|
|
|||
|
Restricted receivables of variable interest entities (net of allowance for doubtful accounts of $53 at December 31, 2015 and $51 at December 31, 2014)
|
1,748
|
|
1,973
|
|
|||
|
Inventory
|
3,810
|
|
|
3,459
|
|
||
|
Assets held for sale
|
—
|
|
364
|
|
|||
|
Regulatory assets
|
877
|
|
1,115
|
|
|||
|
Other
|
327
|
|
1,837
|
|
|||
|
Total current assets
|
8,322
|
|
11,575
|
|
|||
|
Investments and Other Assets
|
|
|
|||||
|
Investments in equity method unconsolidated affiliates
|
499
|
|
358
|
|
|||
|
Nuclear decommissioning trust funds
|
5,825
|
|
5,546
|
|
|||
|
Goodwill
|
16,343
|
|
16,321
|
|
|||
|
Assets held for sale
|
—
|
|
2,642
|
|
|||
|
Other
|
3,042
|
|
3,008
|
|
|||
|
Total investments and other assets
|
25,709
|
|
27,875
|
|
|||
|
Property, Plant and Equipment
|
|
|
|||||
|
Cost
|
112,826
|
|
104,861
|
|
|||
|
Accumulated depreciation and amortization
|
(37,665
|
)
|
(34,824
|
)
|
|||
|
Generation facilities to be retired, net
|
548
|
|
9
|
|
|||
|
Net property, plant and equipment
|
75,709
|
|
70,046
|
|
|||
|
Regulatory Assets and Deferred Debits
|
|
|
|||||
|
Regulatory assets
|
11,373
|
|
11,042
|
|
|||
|
Other
|
43
|
|
19
|
|
|||
|
Total regulatory assets and deferred debits
|
11,416
|
|
11,061
|
|
|||
|
Total Assets
|
$
|
121,156
|
|
$
|
120,557
|
|
|
|
LIABILITIES AND EQUITY
|
|
|
|||||
|
Current Liabilities
|
|
|
|||||
|
Accounts payable
|
$
|
2,400
|
|
$
|
2,271
|
|
|
|
Notes payable and commercial paper
|
3,633
|
|
2,514
|
|
|||
|
Taxes accrued
|
348
|
|
569
|
|
|||
|
Interest accrued
|
430
|
|
418
|
|
|||
|
Current maturities of long-term debt
|
2,074
|
|
2,807
|
|
|||
|
Liabilities associated with assets held for sale
|
—
|
|
262
|
|
|||
|
Regulatory liabilities
|
400
|
|
204
|
|
|||
|
Other
|
2,115
|
|
2,188
|
|
|||
|
Total current liabilities
|
11,400
|
|
11,233
|
|
|||
|
Long-Term Debt
|
37,495
|
|
37,061
|
|
|||
|
Deferred Credits and Other Liabilities
|
|
|
|||||
|
Deferred income taxes
|
12,705
|
|
13,423
|
|
|||
|
Investment tax credits
|
472
|
|
427
|
|
|||
|
Accrued pension and other post-retirement benefit costs
|
1,088
|
|
1,145
|
|
|||
|
Liabilities associated with assets held for sale
|
—
|
|
35
|
|
|||
|
Asset retirement obligations
|
10,264
|
|
8,466
|
|
|||
|
Regulatory liabilities
|
6,255
|
|
6,193
|
|
|||
|
Other
|
1,706
|
|
1,675
|
|
|||
|
Total deferred credits and other liabilities
|
32,490
|
|
31,364
|
|
|||
|
Commitments and Contingencies
|
|
|
|
|
|||
|
Equity
|
|
|
|||||
|
Common stock, $0.001 par value, 2 billion shares authorized; 688 million and 707 million shares outstanding at December 31, 2015 and 2014, respectively
|
1
|
|
1
|
|
|||
|
Additional paid-in capital
|
37,968
|
|
39,405
|
|
|||
|
Retained earnings
|
2,564
|
|
2,012
|
|
|||
|
Accumulated other comprehensive loss
|
(806
|
)
|
(543
|
)
|
|||
|
Total Duke Energy Corporation stockholders' equity
|
39,727
|
|
40,875
|
|
|||
|
Noncontrolling interests
|
44
|
|
24
|
|
|||
|
Total equity
|
39,771
|
|
40,899
|
|
|||
|
Total Liabilities and Equity
|
$
|
121,156
|
|
$
|
120,557
|
|
|
See Notes to Consolidated Financial Statements
83
PART II
DUKE ENERGY CORPORATION
|
|
Years Ended December 31,
|
||||||||||
|
(in millions)
|
2015
|
|
2014
|
|
2013
|
|
|||||
|
CASH FLOWS FROM OPERATING ACTIVITIES
|
|
|
|
||||||||
|
Net income
|
$
|
2,831
|
|
$
|
1,889
|
|
$
|
2,676
|
|
||
|
Adjustments to reconcile net income to net cash provided by operating activities:
|
|||||||||||
|
Depreciation, amortization and accretion (including amortization of nuclear fuel)
|
3,613
|
|
3,507
|
|
3,229
|
|
|||||
|
Equity component of AFUDC
|
(164
|
)
|
(135
|
)
|
(157
|
)
|
|||||
|
FERC mitigation costs
|
—
|
|
(15
|
)
|
—
|
|
|||||
|
Community support and charitable contributions expense
|
—
|
|
—
|
|
34
|
|
|||||
|
Gains on sales of other assets
|
(48
|
)
|
(33
|
)
|
(79
|
)
|
|||||
|
Impairment charges
|
153
|
|
915
|
|
400
|
|
|||||
|
Deferred income taxes
|
1,244
|
|
1,149
|
|
1,264
|
|
|||||
|
Equity in earnings of unconsolidated affiliates
|
(69
|
)
|
(130
|
)
|
(122
|
)
|
|||||
|
Accrued pension and other post-retirement benefit costs
|
71
|
|
108
|
|
307
|
|
|||||
|
Contributions to qualified pension plans
|
(302
|
)
|
—
|
|
(250
|
)
|
|||||
|
Payments for asset retirement obligations
|
(346
|
)
|
(68
|
)
|
(12
|
)
|
|||||
|
(Increase) decrease in
|
|||||||||||
|
Net realized and unrealized mark-to-market and hedging transactions
|
(29
|
)
|
44
|
|
1
|
|
|||||
|
Receivables
|
359
|
|
58
|
|
(281
|
)
|
|||||
|
Inventory
|
(237
|
)
|
(269
|
)
|
(31
|
)
|
|||||
|
Other current assets
|
(65
|
)
|
(414
|
)
|
(35
|
)
|
|||||
|
Increase (decrease) in
|
|||||||||||
|
Accounts payable
|
(6
|
)
|
(30
|
)
|
73
|
|
|||||
|
Taxes accrued
|
(38
|
)
|
(14
|
)
|
77
|
|
|||||
|
Other current liabilities
|
168
|
|
(201
|
)
|
24
|
|
|||||
|
Other assets
|
(216
|
)
|
16
|
|
(384
|
)
|
|||||
|
Other liabilities
|
(243
|
)
|
209
|
|
(352
|
)
|
|||||
|
Net cash provided by operating activities
|
6,676
|
|
|
6,586
|
|
|
6,382
|
|
|||
|
CASH FLOWS FROM INVESTING ACTIVITIES
|
|||||||||||
|
Capital expenditures
|
(6,766
|
)
|
(5,384
|
)
|
(5,526
|
)
|
|||||
|
Investment expenditures
|
(263
|
)
|
(90
|
)
|
(81
|
)
|
|||||
|
Acquisitions, net of cash acquired
|
(1,334
|
)
|
(54
|
)
|
—
|
|
|||||
|
Purchases of available-for-sale securities
|
(4,037
|
)
|
(4,110
|
)
|
(6,142
|
)
|
|||||
|
Proceeds from sales and maturities of available-for-sale securities
|
4,040
|
|
4,133
|
|
6,315
|
|
|||||
|
Net proceeds from the sale of Midwest generation business and sales of equity investments and other assets
|
2,968
|
|
179
|
|
277
|
|
|||||
|
Change in restricted cash
|
191
|
|
9
|
|
167
|
|
|||||
|
Other
|
(76
|
)
|
(56
|
)
|
12
|
|
|||||
|
Net cash used in investing activities
|
(5,277
|
)
|
|
(5,373
|
)
|
|
(4,978
|
)
|
|||
|
CASH FLOWS FROM FINANCING ACTIVITIES
|
|||||||||||
|
Proceeds from the:
|
|||||||||||
|
Issuance of long-term debt
|
2,955
|
|
2,914
|
|
3,601
|
|
|||||
|
Issuance of common stock related to employee benefit plans
|
17
|
|
25
|
|
9
|
|
|||||
|
Payments for the:
|
|||||||||||
|
Redemption of long-term debt
|
(3,029
|
)
|
(3,037
|
)
|
(2,761
|
)
|
|||||
|
Redemption of preferred stock of a subsidiary
|
—
|
|
—
|
|
(96
|
)
|
|||||
|
Proceeds from the issuance of short-term debt with original maturities greater than 90 days
|
379
|
|
1,066
|
|
—
|
|
|||||
|
Payments for the redemption of short-term debt with original maturities greater than 90 days
|
(931
|
)
|
(564
|
)
|
—
|
|
|||||
|
Notes payable and commercial paper
|
1,797
|
|
1,186
|
|
93
|
|
|||||
|
Distributions to noncontrolling interests
|
(9
|
)
|
(65
|
)
|
(15
|
)
|
|||||
|
Contributions from noncontrolling interests
|
—
|
|
—
|
|
9
|
|
|||||
|
Dividends paid
|
(2,254
|
)
|
(2,234
|
)
|
(2,188
|
)
|
|||||
|
Repurchase of common shares
|
(1,500
|
)
|
—
|
|
—
|
|
|||||
|
Other
|
(3
|
)
|
31
|
|
21
|
|
|||||
|
Net cash used in financing activities
|
(2,578
|
)
|
|
(678
|
)
|
|
(1,327
|
)
|
|||
|
Net (decrease) increase in cash and cash equivalents
|
(1,179
|
)
|
|
535
|
|
|
77
|
|
|||
|
Cash and cash equivalents at beginning of period
|
2,036
|
|
1,501
|
|
1,424
|
|
|||||
|
Cash and cash equivalents at end of period
|
$
|
857
|
|
|
$
|
2,036
|
|
|
$
|
1,501
|
|
|
Supplemental Disclosures:
|
|
|
|
||||||||
|
Cash paid for interest, net of amount capitalized
|
$
|
1,607
|
|
$
|
1,659
|
|
$
|
1,665
|
|
||
|
Cash paid for (received from) income taxes
|
170
|
|
158
|
|
(202
|
)
|
|||||
|
Significant non-cash transactions:
|
|||||||||||
|
Accrued capital expenditures
|
771
|
|
664
|
|
594
|
|
|||||
See Notes to Consolidated Financial Statements
84
PART II
DUKE ENERGY CORPORATION
CONSOLIDATED STATEMENTS OF CHANGES IN EQUITY
|
|
|
|
|
|
|
|
|
Duke Energy Corporation Stockholders'
Accumulated Other Comprehensive Loss
|
|
|
|
|
|
|||||||||||||||||||||||||||||
|
Net Unrealized
|
|
Total
|
|
|||||||||||||||||||||||||||||||||||||||
|
Foreign
|
|
Net
|
|
Gains (Losses)
|
|
Duke Energy
|
|
|||||||||||||||||||||||||||||||||||
|
Common
|
|
Additional
|
|
Currency
|
|
Losses on
|
|
on Available-
|
|
Pension and
|
|
Corporation
|
|
|||||||||||||||||||||||||||||
|
Stock
|
|
Common
|
|
Paid-in
|
|
Retained
|
|
Translation
|
|
Cash Flow
|
|
for-Sale-
|
|
OPEB
|
|
Stockholders'
|
|
Noncontrolling
|
|
Total
|
|
|||||||||||||||||||||
|
(in millions)
|
Shares
|
|
Stock
|
|
Capital
|
|
Earnings
|
|
Adjustments
|
|
Hedges
|
|
Securities
|
|
Adjustments
|
|
Equity
|
|
Interests
|
|
Equity
|
|
||||||||||||||||||||
|
Balance at December 31, 2012
|
704
|
|
$
|
1
|
|
$
|
39,279
|
|
$
|
1,889
|
|
$
|
(116
|
)
|
$
|
(100
|
)
|
$
|
—
|
|
$
|
(90
|
)
|
$
|
40,863
|
|
$
|
78
|
|
$
|
40,941
|
|
||||||||||
|
Net income
|
—
|
|
—
|
|
—
|
|
2,665
|
|
—
|
|
—
|
|
—
|
|
—
|
|
2,665
|
|
11
|
|
2,676
|
|
||||||||||||||||||||
|
Other comprehensive (loss) income
|
—
|
|
—
|
|
—
|
|
—
|
|
(191
|
)
|
60
|
|
—
|
|
38
|
|
(93
|
)
|
(6
|
)
|
(99
|
)
|
||||||||||||||||||||
|
Common stock issuances, including dividend
reinvestment and employee benefits
|
2
|
|
—
|
|
86
|
|
—
|
|
—
|
|
—
|
|
—
|
|
—
|
|
86
|
|
—
|
|
86
|
|
||||||||||||||||||||
|
Common stock dividends
|
—
|
|
—
|
|
—
|
|
(2,188
|
)
|
—
|
|
—
|
|
—
|
|
—
|
|
(2,188
|
)
|
—
|
|
(2,188
|
)
|
||||||||||||||||||||
|
Premium on the redemption of preferred stock of subsidiaries
|
—
|
|
—
|
|
—
|
|
(3
|
)
|
—
|
|
—
|
|
—
|
|
—
|
|
(3
|
)
|
—
|
|
(3
|
)
|
||||||||||||||||||||
|
Contribution from noncontrolling interest
|
—
|
|
—
|
|
—
|
|
—
|
|
—
|
|
—
|
|
—
|
|
—
|
|
—
|
|
9
|
|
9
|
|
||||||||||||||||||||
|
Changes in noncontrolling interest in
subsidiaries
(a)
|
—
|
|
—
|
|
—
|
|
—
|
|
—
|
|
—
|
|
—
|
|
—
|
|
—
|
|
(14
|
)
|
(14
|
)
|
||||||||||||||||||||
|
Balance at December 31, 2013
|
706
|
|
|
$
|
1
|
|
|
$
|
39,365
|
|
|
$
|
2,363
|
|
|
$
|
(307
|
)
|
|
$
|
(40
|
)
|
|
$
|
—
|
|
|
$
|
(52
|
)
|
|
$
|
41,330
|
|
|
$
|
78
|
|
|
$
|
41,408
|
|
|
Net income
|
—
|
|
—
|
|
—
|
|
1,883
|
|
—
|
|
—
|
|
—
|
|
—
|
|
1,883
|
|
6
|
|
1,889
|
|
||||||||||||||||||||
|
Other comprehensive (loss) income
|
—
|
|
—
|
|
—
|
|
—
|
|
(132
|
)
|
(19
|
)
|
3
|
|
4
|
|
(144
|
)
|
8
|
|
(136
|
)
|
||||||||||||||||||||
|
Common stock issuances, including dividend
reinvestment and employee benefits
|
1
|
|
—
|
|
40
|
|
—
|
|
—
|
|
—
|
|
—
|
|
—
|
|
40
|
|
—
|
|
40
|
|
||||||||||||||||||||
|
Common stock dividends
|
—
|
|
—
|
|
—
|
|
(2,234
|
)
|
—
|
|
—
|
|
—
|
|
—
|
|
(2,234
|
)
|
—
|
|
(2,234
|
)
|
||||||||||||||||||||
|
Changes in noncontrolling interest in subsidiaries
(a)
|
—
|
|
—
|
|
—
|
|
—
|
|
—
|
|
—
|
|
—
|
|
—
|
|
—
|
|
(65
|
)
|
(65
|
)
|
||||||||||||||||||||
|
Other
|
—
|
|
—
|
|
—
|
|
—
|
|
—
|
|
—
|
|
—
|
|
—
|
|
—
|
|
(3
|
)
|
(3
|
)
|
||||||||||||||||||||
|
Balance at December 31, 2014
|
707
|
|
|
$
|
1
|
|
|
$
|
39,405
|
|
|
$
|
2,012
|
|
|
$
|
(439
|
)
|
|
$
|
(59
|
)
|
|
$
|
3
|
|
|
$
|
(48
|
)
|
|
$
|
40,875
|
|
|
$
|
24
|
|
|
$
|
40,899
|
|
|
Net income
|
—
|
|
—
|
|
—
|
|
2,816
|
|
—
|
|
—
|
|
—
|
|
—
|
|
2,816
|
|
15
|
|
2,831
|
|
||||||||||||||||||||
|
Other comprehensive (loss) income
|
—
|
|
—
|
|
—
|
|
—
|
|
(253
|
)
|
9
|
|
(6
|
)
|
(13
|
)
|
(263
|
)
|
(11
|
)
|
(274
|
)
|
||||||||||||||||||||
|
Common stock issuances, including dividend
reinvestment and employee benefits
|
1
|
|
—
|
|
63
|
|
—
|
|
—
|
|
—
|
|
—
|
|
—
|
|
63
|
|
—
|
|
63
|
|
||||||||||||||||||||
|
Stock repurchase
|
(20
|
)
|
(1,500
|
)
|
—
|
|
—
|
|
—
|
|
—
|
|
—
|
|
(1,500
|
)
|
—
|
|
(1,500
|
)
|
||||||||||||||||||||||
|
Common stock dividends
|
—
|
|
—
|
|
—
|
|
(2,254
|
)
|
—
|
|
—
|
|
—
|
|
—
|
|
(2,254
|
)
|
—
|
|
(2,254
|
)
|
||||||||||||||||||||
|
Distributions to noncontrolling interests in subsidiaries
|
—
|
|
—
|
|
—
|
|
—
|
|
—
|
|
—
|
|
—
|
|
—
|
|
—
|
|
(9
|
)
|
(9
|
)
|
||||||||||||||||||||
|
Other
(b)
|
—
|
|
—
|
|
—
|
|
(10
|
)
|
—
|
|
—
|
|
—
|
|
—
|
|
(10
|
)
|
25
|
|
15
|
|
||||||||||||||||||||
|
Balance at December 31, 2015
|
688
|
|
$
|
1
|
|
$
|
37,968
|
|
$
|
2,564
|
|
$
|
(692
|
)
|
$
|
(50
|
)
|
$
|
(3
|
)
|
$
|
(61
|
)
|
$
|
39,727
|
|
$
|
44
|
|
$
|
39,771
|
|
||||||||||
|
(a)
|
This decrease primarily relates to cash distributions to noncontrolling interests.
|
|
(b)
|
The $25 million change in Noncontrolling Interests is primarily related to the acquisitions of a majority interest in a provider of energy management systems and services for commercial customers and a solar company.
|
See Notes to Consolidated Financial Statements
85
PART II
REPORT OF INDEPENDENT REGISTERED PUBLIC ACCOUNTING FIRM
To the Board of Directors of
Duke Energy Carolinas, LLC
Charlotte, North Carolina
We have audited the accompanying consolidated balance sheets of Duke Energy Carolinas, LLC and subsidiaries (the "Company") as of December 31, 2015 and 2014, and the related consolidated statements of operations and comprehensive income, changes in equity, and cash flows for each of the three years in the period ended December 31, 2015. These financial statements are the responsibility of the Company's management. Our responsibility is to express an opinion on these financial statements based on our audits.
We conducted our audits in accordance with the standards of the Public Company Accounting Oversight Board (United States). Those standards require that we plan and perform the audit to obtain reasonable assurance about whether the financial statements are free of material misstatement. The Company is not required to have, nor were we engaged to perform, an audit of its internal control over financial reporting. Our audits included consideration of internal control over financial reporting as a basis for designing audit procedures that are appropriate in the circumstances, but not for the purpose of expressing an opinion on the effectiveness of the Company's internal control over financial reporting. Accordingly, we express no such opinion. An audit also includes examining, on a test basis, evidence supporting the amounts and disclosures in the financial statements, assessing the accounting principles used and significant estimates made by management, as well as evaluating the overall financial statement presentation. We believe that our audits provide a reasonable basis for our opinion.
In our opinion, the consolidated financial statements referred to above present fairly, in all material respects, the financial position of Duke Energy Carolinas, LLC and subsidiaries at December 31, 2015 and 2014, and the results of their operations and their cash flows for each of the three years in the period ended December 31, 2015, in conformity with accounting principles generally accepted in the United States of America.
As discussed in Note 22 to the consolidated financial statements, Duke Energy Carolinas, LLC and subsidiaries adopted ASU 2015-17, Income Taxes (Topic 740); Balance Sheet Classification of Deferred Taxes effective December 31, 2015 on a prospective basis.
/s/ Deloitte & Touche LLP
Charlotte, North Carolina
February 25, 2016
86
PART II
DUKE ENERGY CAROLINAS, LLC
CONSOLIDATED STATEMENTS OF OPERATIONS AND COMPREHENSIVE INCOME
|
|
Years Ended December 31,
|
||||||||||
|
(in millions)
|
2015
|
|
2014
|
|
2013
|
|
|||||
|
Operating Revenues
|
$
|
7,229
|
|
$
|
7,351
|
|
$
|
6,954
|
|
||
|
Operating Expenses
|
|
|
|
||||||||
|
Fuel used in electric generation and purchased power
|
1,881
|
|
2,133
|
|
1,982
|
|
|||||
|
Operation, maintenance and other
|
2,066
|
|
1,995
|
|
1,868
|
|
|||||
|
Depreciation and amortization
|
1,051
|
|
1,009
|
|
921
|
|
|||||
|
Property and other taxes
|
269
|
|
316
|
|
374
|
|
|||||
|
Impairment charges
|
1
|
|
3
|
|
—
|
|
|||||
|
Total operating expenses
|
5,268
|
|
5,456
|
|
5,145
|
|
|||||
|
Losses on Sales of Other Assets and Other, net
|
(1
|
)
|
—
|
|
—
|
|
|||||
|
Operating Income
|
1,960
|
|
1,895
|
|
1,809
|
|
|||||
|
Other Income and Expenses, net
|
160
|
|
172
|
|
120
|
|
|||||
|
Interest Expense
|
412
|
|
407
|
|
359
|
|
|||||
|
Income Before Income Taxes
|
1,708
|
|
1,660
|
|
1,570
|
|
|||||
|
Income Tax Expense
|
627
|
|
588
|
|
594
|
|
|||||
|
Net Income
|
$
|
1,081
|
|
$
|
1,072
|
|
$
|
976
|
|
||
|
Other Comprehensive Income, net of tax
|
|
|
|
||||||||
|
Reclassification into earnings from cash flow hedges
|
1
|
|
2
|
|
1
|
|
|||||
|
Unrealized gain on available-for-sale securities
|
1
|
|
—
|
|
—
|
|
|||||
|
Other Comprehensive Income, net of tax
|
2
|
|
2
|
|
1
|
|
|||||
|
Comprehensive Income
|
$
|
1,083
|
|
$
|
1,074
|
|
$
|
977
|
|
||
See Notes to Consolidated Financial Statements
87
PART II
DUKE ENERGY CAROLINAS, LLC
CONSOLIDATED BALANCE SHEETS
|
|
December 31,
|
|||||||
|
(in millions)
|
2015
|
|
2014
|
|
||||
|
ASSETS
|
|
|
||||||
|
Current Assets
|
|
|
||||||
|
Cash and cash equivalents
|
$
|
13
|
|
$
|
13
|
|
||
|
Receivables (net of allowance for doubtful accounts of $3 at December 31, 2015 and December 31, 2014)
|
142
|
|
129
|
|
||||
|
Restricted receivables of variable interest entities (net of allowance for doubtful accounts
of $7 at December 31, 2015 and $6 at December 31, 2014)
|
596
|
|
647
|
|
||||
|
Receivables from affiliated companies
|
107
|
|
75
|
|
||||
|
Notes receivable from affiliated companies
|
163
|
|
150
|
|
||||
|
Inventory
|
1,276
|
|
|
1,124
|
|
|||
|
Regulatory assets
|
305
|
|
399
|
|
||||
|
Other
|
128
|
|
77
|
|
||||
|
Total current assets
|
2,730
|
|
2,614
|
|
||||
|
Investments and Other Assets
|
|
|
||||||
|
Nuclear decommissioning trust funds
|
3,050
|
|
3,042
|
|
||||
|
Other
|
999
|
|
959
|
|
||||
|
Total investments and other assets
|
4,049
|
|
4,001
|
|
||||
|
Property, Plant and Equipment
|
|
|
||||||
|
Cost
|
39,398
|
|
37,372
|
|
||||
|
Accumulated depreciation and amortization
|
(13,521
|
)
|
(12,700
|
)
|
||||
|
Net property, plant and equipment
|
25,877
|
|
24,672
|
|
||||
|
Regulatory Assets and Deferred Debits
|
|
|
||||||
|
Regulatory assets
|
2,766
|
|
2,465
|
|
||||
|
Other
|
4
|
|
4
|
|
||||
|
Total regulatory assets and deferred debits
|
2,770
|
|
2,469
|
|
||||
|
Total Assets
|
$
|
35,426
|
|
$
|
33,756
|
|
||
|
LIABILITIES AND EQUITY
|
|
|
||||||
|
Current Liabilities
|
|
|
||||||
|
Accounts payable
|
$
|
753
|
|
$
|
709
|
|
||
|
Accounts payable to affiliated companies
|
229
|
|
154
|
|
||||
|
Taxes accrued
|
25
|
|
146
|
|
||||
|
Interest accrued
|
95
|
|
95
|
|
||||
|
Current maturities of long-term debt
|
356
|
|
507
|
|
||||
|
Regulatory liabilities
|
39
|
|
34
|
|
||||
|
Other
|
519
|
|
434
|
|
||||
|
Total current liabilities
|
2,016
|
|
2,079
|
|
||||
|
Long-Term Debt
|
7,711
|
|
7,546
|
|
||||
|
Long-Term Debt Payable to Affiliated Companies
|
300
|
|
300
|
|
||||
|
Deferred Credits and Other Liabilities
|
|
|
||||||
|
Deferred income taxes
|
6,146
|
|
5,812
|
|
||||
|
Investment tax credits
|
199
|
|
204
|
|
||||
|
Accrued pension and other post-retirement benefit costs
|
107
|
|
111
|
|
||||
|
Asset retirement obligations
|
3,918
|
|
3,428
|
|
||||
|
Regulatory liabilities
|
2,802
|
|
2,710
|
|
||||
|
Other
|
621
|
|
642
|
|
||||
|
Total deferred credits and other liabilities
|
13,793
|
|
12,907
|
|
||||
|
Commitments and Contingencies
|
|
|
||||||
|
Equity
|
|
|
||||||
|
Member's Equity
|
11,617
|
|
10,937
|
|
||||
|
Accumulated other comprehensive loss
|
(11
|
)
|
(13
|
)
|
||||
|
Total equity
|
11,606
|
|
10,924
|
|
||||
|
Total Liabilities and Equity
|
$
|
35,426
|
|
$
|
33,756
|
|
||
See Notes to Consolidated Financial Statements
88
PART II
DUKE ENERGY CAROLINAS, LLC
CONSOLIDATED STATEMENTS OF CASH FLOWS
|
|
Years Ended December 31,
|
||||||||||
|
(in millions)
|
2015
|
|
2014
|
|
2013
|
|
|||||
|
CASH FLOWS FROM OPERATING ACTIVITIES
|
|
|
|
||||||||
|
Net income
|
$
|
1,081
|
|
$
|
1,072
|
|
$
|
976
|
|
||
|
Adjustments to reconcile net income to net cash provided by operating activities:
|
|
|
|
||||||||
|
Depreciation and amortization (including amortization of nuclear fuel)
|
1,361
|
|
1,273
|
|
1,167
|
|
|||||
|
Equity component of AFUDC
|
(96
|
)
|
(91
|
)
|
(91
|
)
|
|||||
|
FERC mitigation costs
|
—
|
|
3
|
|
14
|
|
|||||
|
Losses on sales of other assets and other, net
|
1
|
|
—
|
|
—
|
|
|||||
|
Impairment charges
|
1
|
|
—
|
|
—
|
|
|||||
|
Deferred income taxes
|
397
|
|
376
|
|
534
|
|
|||||
|
Accrued pension and other post-retirement benefit costs
|
15
|
|
22
|
|
38
|
|
|||||
|
Contributions to qualified pension plans
|
(91
|
)
|
—
|
|
—
|
|
|||||
|
Payments for asset retirement obligations
|
(167
|
)
|
—
|
|
—
|
|
|||||
|
(Increase) decrease in
|
|
|
|
||||||||
|
Net realized and unrealized mark-to-market and hedging transactions
|
—
|
|
—
|
|
(9
|
)
|
|||||
|
Receivables
|
42
|
|
48
|
|
(12
|
)
|
|||||
|
Receivables from affiliated companies
|
(32
|
)
|
—
|
|
(72
|
)
|
|||||
|
Inventory
|
(157
|
)
|
(60
|
)
|
(9
|
)
|
|||||
|
Other current assets
|
(51
|
)
|
(236
|
)
|
(1
|
)
|
|||||
|
Increase (decrease) in
|
|
|
|
||||||||
|
Accounts payable
|
(4
|
)
|
10
|
|
58
|
|
|||||
|
Accounts payable to affiliated companies
|
75
|
|
(7
|
)
|
33
|
|
|||||
|
Taxes accrued
|
(128
|
)
|
(15
|
)
|
4
|
|
|||||
|
Other current liabilities
|
127
|
|
(10
|
)
|
(40
|
)
|
|||||
|
Other assets
|
76
|
|
17
|
|
(102
|
)
|
|||||
|
Other liabilities
|
(77
|
)
|
(22
|
)
|
(77
|
)
|
|||||
|
Net cash provided by operating activities
|
2,373
|
|
2,380
|
|
2,411
|
|
|||||
|
CASH FLOWS FROM INVESTING ACTIVITIES
|
|
|
|
||||||||
|
Capital expenditures
|
(1,933
|
)
|
(1,879
|
)
|
(1,695
|
)
|
|||||
|
Purchases of available-for-sale securities
|
(2,555
|
)
|
(2,064
|
)
|
(2,405
|
)
|
|||||
|
Proceeds from sales and maturities of available-for-sale securities
|
2,555
|
|
2,044
|
|
2,363
|
|
|||||
|
Notes receivable from affiliated companies
|
(13
|
)
|
72
|
|
160
|
|
|||||
|
Other
|
(35
|
)
|
(18
|
)
|
(24
|
)
|
|||||
|
Net cash used in investing activities
|
(1,981
|
)
|
(1,845
|
)
|
(1,601
|
)
|
|||||
|
CASH FLOWS FROM FINANCING ACTIVITIES
|
|
|
|
||||||||
|
Proceeds from the issuance of long-term debt
|
516
|
|
—
|
|
100
|
|
|||||
|
Payments for the redemption of long-term debt
|
(506
|
)
|
(45
|
)
|
(405
|
)
|
|||||
|
Distributions to parent
|
(401
|
)
|
(500
|
)
|
(499
|
)
|
|||||
|
Other
|
(1
|
)
|
—
|
|
(2
|
)
|
|||||
|
Net cash used in financing activities
|
(392
|
)
|
(545
|
)
|
(806
|
)
|
|||||
|
Net (decrease) increase in cash and cash equivalents
|
—
|
|
(10
|
)
|
4
|
|
|||||
|
Cash and cash equivalents at beginning of period
|
13
|
|
23
|
|
19
|
|
|||||
|
Cash and cash equivalents at end of period
|
$
|
13
|
|
$
|
13
|
|
$
|
23
|
|
||
|
Supplemental Disclosures:
|
|
|
|
||||||||
|
Cash paid for interest, net of amount capitalized
|
$
|
389
|
|
$
|
388
|
|
$
|
336
|
|
||
|
Cash paid for (received from) income taxes
|
342
|
|
305
|
|
(7
|
)
|
|||||
|
Significant non-cash transactions:
|
|
|
|
||||||||
|
Accrued capital expenditures
|
239
|
|
194
|
|
199
|
|
|||||
See Notes to Consolidated Financial Statements
89
PART II
DUKE ENERGY CAROLINAS, LLC
CONSOLIDATED STATEMENTS OF CHANGES IN EQUITY
|
Accumulated Other
|
|||||||||||||||
|
|
|
Comprehensive Loss
|
|
||||||||||||
|
Net Losses
|
|
Net Losses
|
|
||||||||||||
|
on Cash
|
|
Available-
|
|
||||||||||||
|
Member's
|
|
Flow
|
|
for-Sale
|
|
Total
|
|
||||||||
|
(in millions)
|
Equity
|
|
Hedges
|
|
Securities
|
|
Equity
|
|
|||||||
|
Balance at December 31, 2012
|
$
|
9,888
|
|
$
|
(15
|
)
|
$
|
(1
|
)
|
$
|
9,872
|
|
|||
|
Net income
|
976
|
|
—
|
|
—
|
|
976
|
|
|||||||
|
Other comprehensive income
|
|
1
|
|
—
|
|
1
|
|
||||||||
|
Distributions to parent
|
(499
|
)
|
—
|
|
—
|
|
(499
|
)
|
|||||||
|
Balance at December 31, 2013
|
$
|
10,365
|
|
$
|
(14
|
)
|
$
|
(1
|
)
|
$
|
10,350
|
|
|||
|
Net income
|
1,072
|
|
—
|
|
—
|
|
1,072
|
|
|||||||
|
Other comprehensive income
|
|
2
|
|
—
|
|
2
|
|
||||||||
|
Distributions to parent
|
(500
|
)
|
—
|
|
—
|
|
(500
|
)
|
|||||||
|
Balance at December 31, 2014
|
$
|
10,937
|
|
$
|
(12
|
)
|
$
|
(1
|
)
|
$
|
10,924
|
|
|||
|
Net income
|
1,081
|
|
—
|
|
—
|
|
1,081
|
|
|||||||
|
Other comprehensive income
|
|
1
|
|
1
|
|
2
|
|
||||||||
|
Distributions to parent
|
(401
|
)
|
—
|
|
—
|
|
(401
|
)
|
|||||||
|
Balance at December 31, 2015
|
$
|
11,617
|
|
$
|
(11
|
)
|
$
|
—
|
|
$
|
11,606
|
|
|||
See Notes to Consolidated Financial Statements
90
PART II
REPORT OF INDEPENDENT REGISTERED PUBLIC ACCOUNTING FIRM
To the Board of Directors of
Progress Energy, Inc.
Charlotte, North Carolina
We have audited the accompanying consolidated balance sheets of Progress Energy, Inc. and subsidiaries (the "Company") as of December 31, 2015 and 2014, and the related consolidated statements of operations and comprehensive income, changes in equity, and cash flows for each of the three years in the period ended December 31, 2015. These financial statements are the responsibility of the Company's management. Our responsibility is to express an opinion on these financial statements based on our audits.
We conducted our audits in accordance with the standards of the Public Company Accounting Oversight Board (United States). Those standards require that we plan and perform the audit to obtain reasonable assurance about whether the financial statements are free of material misstatement. The Company is not required to have, nor were we engaged to perform, an audit of its internal control over financial reporting. Our audits included consideration of internal control over financial reporting as a basis for designing audit procedures that are appropriate in the circumstances, but not for the purpose of expressing an opinion on the effectiveness of the Company's internal control over financial reporting. Accordingly, we express no such opinion. An audit also includes examining, on a test basis, evidence supporting the amounts and disclosures in the financial statements, assessing the accounting principles used and significant estimates made by management, as well as evaluating the overall financial statement presentation. We believe that our audits provide a reasonable basis for our opinion.
In our opinion, the consolidated financial statements referred to above present fairly, in all material respects, the financial position of Progress Energy, Inc. and subsidiaries at December 31, 2015 and 2014, and the results of their operations and their cash flows for each of the three years in the period ended December 31, 2015, in conformity with accounting principles generally accepted in the United States of America.
As discussed in Note 22 to the consolidated financial statements, Progress Energy Inc. and subsidiaries adopted ASU 2015-17, Income Taxes (Topic 740); Balance Sheet Classification of Deferred Taxes effective December 31, 2015 on a prospective basis.
/s/ Deloitte & Touche LLP
Charlotte, North Carolina
February 25, 2016
91
PART II
PROGRESS ENERGY, INC.
CONSOLIDATED STATEMENTS OF OPERATIONS AND COMPREHENSIVE INCOME
|
|
Years Ended December 31,
|
||||||||||
|
(in millions)
|
2015
|
|
2014
|
|
2013
|
|
|||||
|
Operating Revenues
|
$
|
10,277
|
|
$
|
10,166
|
|
$
|
9,533
|
|
||
|
Operating Expenses
|
|
|
|
||||||||
|
Fuel used in electric generation and purchased power
|
4,224
|
|
4,195
|
|
3,851
|
|
|||||
|
Operation, maintenance and other
|
2,298
|
|
2,335
|
|
2,247
|
|
|||||
|
Depreciation and amortization
|
1,116
|
|
1,128
|
|
883
|
|
|||||
|
Property and other taxes
|
492
|
|
517
|
|
557
|
|
|||||
|
Impairment charges
|
12
|
|
(16
|
)
|
380
|
|
|||||
|
Total operating expenses
|
8,142
|
|
|
8,159
|
|
|
7,918
|
|
|||
|
Gains on Sales of Other Assets and Other, net
|
25
|
|
11
|
|
3
|
|
|||||
|
Operating Income
|
2,160
|
|
|
2,018
|
|
|
1,618
|
|
|||
|
Other Income and Expenses, net
|
97
|
|
77
|
|
94
|
|
|||||
|
Interest Expense
|
670
|
|
675
|
|
680
|
|
|||||
|
Income From Continuing Operations Before Income Taxes
|
1,587
|
|
|
1,420
|
|
|
1,032
|
|
|||
|
Income Tax Expense From Continuing Operations
|
522
|
|
540
|
|
373
|
|
|||||
|
Income From Continuing Operations
|
1,065
|
|
|
880
|
|
|
659
|
|
|||
|
(Loss) Income From Discontinued Operations, net of tax
|
(3
|
)
|
(6
|
)
|
16
|
|
|||||
|
Net Income
|
1,062
|
|
|
874
|
|
|
675
|
|
|||
|
Less: Net Income Attributable to Noncontrolling Interests
|
11
|
|
5
|
|
3
|
|
|||||
|
Net Income Attributable to Parent
|
$
|
1,051
|
|
|
$
|
869
|
|
|
$
|
672
|
|
|
Net Income
|
$
|
1,062
|
|
|
$
|
874
|
|
|
$
|
675
|
|
|
Other Comprehensive (Loss) Income, net of tax
|
|
|
|
||||||||
|
Pension and OPEB adjustments
|
(10
|
)
|
9
|
|
9
|
|
|||||
|
Reclassification into earnings from cash flow hedges
|
4
|
|
8
|
|
(1
|
)
|
|||||
|
Unrealized (losses) gains on investments in available-for-sale securities
|
(1
|
)
|
1
|
|
—
|
|
|||||
|
Other Comprehensive (Loss) Income, net of tax
|
(7
|
)
|
|
18
|
|
|
8
|
|
|||
|
Comprehensive Income
|
1,055
|
|
|
892
|
|
|
683
|
|
|||
|
Less: Comprehensive Income Attributable to Noncontrolling Interests
|
11
|
|
5
|
|
3
|
|
|||||
|
Comprehensive Income Attributable to Parent
|
$
|
1,044
|
|
|
$
|
887
|
|
|
$
|
680
|
|
See Notes to Consolidated Financial Statements
92
PART II
PROGRESS ENERGY, INC.
CONSOLIDATED BALANCE SHEETS
|
|
December 31,
|
||||||
|
(in millions)
|
2015
|
|
2014
|
|
|||
|
ASSETS
|
|
|
|||||
|
Current Assets
|
|
|
|||||
|
Cash and cash equivalents
|
$
|
44
|
|
$
|
42
|
|
|
|
Receivables (net of allowance for doubtful accounts of $6 at December 31, 2015 and $8 at December 31, 2014)
|
151
|
|
129
|
|
|||
|
Restricted receivables of variable interest entities (net of allowance for doubtful accounts of $8 at December 31, 2015 and 2014)
|
658
|
|
741
|
|
|||
|
Receivables from affiliated companies
|
375
|
|
59
|
|
|||
|
Notes receivable from affiliated companies
|
—
|
|
220
|
|
|||
|
Inventory
|
1,751
|
|
|
1,590
|
|
||
|
Regulatory assets
|
362
|
|
491
|
|
|||
|
Other
|
156
|
|
1,285
|
|
|||
|
Total current assets
|
3,497
|
|
4,557
|
|
|||
|
Investments and Other Assets
|
|
|
|||||
|
Nuclear decommissioning trust funds
|
2,775
|
|
2,503
|
|
|||
|
Goodwill
|
3,655
|
|
3,655
|
|
|||
|
Other
|
834
|
|
670
|
|
|||
|
Total investments and other assets
|
7,264
|
|
6,828
|
|
|||
|
Property, Plant and Equipment
|
|
|
|||||
|
Cost
|
42,666
|
|
38,650
|
|
|||
|
Accumulated depreciation and amortization
|
(14,867
|
)
|
(13,506
|
)
|
|||
|
Generation facilities to be retired, net
|
548
|
|
—
|
|
|||
|
Net property, plant and equipment
|
28,347
|
|
25,144
|
|
|||
|
Regulatory Assets and Deferred Debits
|
|
|
|||||
|
Regulatory assets
|
5,435
|
|
5,408
|
|
|||
|
Other
|
5
|
|
5
|
|
|||
|
Total regulatory assets and deferred debits
|
5,440
|
|
5,413
|
|
|||
|
Total Assets
|
$
|
44,548
|
|
$
|
41,942
|
|
|
|
LIABILITIES AND EQUITY
|
|
|
|||||
|
Current Liabilities
|
|
|
|||||
|
Accounts payable
|
$
|
722
|
|
$
|
847
|
|
|
|
Accounts payable to affiliated companies
|
311
|
|
203
|
|
|||
|
Notes payable to affiliated companies
|
1,308
|
|
835
|
|
|||
|
Taxes accrued
|
53
|
|
114
|
|
|||
|
Interest accrued
|
195
|
|
184
|
|
|||
|
Current maturities of long-term debt
|
315
|
|
1,507
|
|
|||
|
Regulatory liabilities
|
286
|
|
106
|
|
|||
|
Other
|
891
|
|
1,021
|
|
|||
|
Total current liabilities
|
4,081
|
|
4,817
|
|
|||
|
Long-Term Debt
|
13,999
|
|
13,161
|
|
|||
|
Long-Term Debt Payable to Affiliated Companies
|
150
|
|
—
|
|
|||
|
Deferred Credits and Other Liabilities
|
|
|
|||||
|
Deferred income taxes
|
4,790
|
|
4,759
|
|
|||
|
Accrued pension and other post-retirement benefit costs
|
536
|
|
533
|
|
|||
|
Asset retirement obligations
|
5,369
|
|
4,711
|
|
|||
|
Regulatory liabilities
|
2,387
|
|
2,379
|
|
|||
|
Other
|
383
|
|
406
|
|
|||
|
Total deferred credits and other liabilities
|
13,465
|
|
12,788
|
|
|||
|
Commitments and Contingencies
|
|
|
|||||
|
Equity
|
|
|
|||||
|
Common stock, $0.01 par value, 100 shares authorized and outstanding at December 31, 2015 and 2014
|
—
|
|
—
|
|
|||
|
Additional paid-in capital
|
8,092
|
|
7,467
|
|
|||
|
Retained earnings
|
4,831
|
|
3,782
|
|
|||
|
Accumulated other comprehensive loss
|
(48
|
)
|
(41
|
)
|
|||
|
Total Progress Energy, Inc. stockholders' equity
|
12,875
|
|
11,208
|
|
|||
|
Noncontrolling interests
|
(22
|
)
|
(32
|
)
|
|||
|
Total equity
|
12,853
|
|
11,176
|
|
|||
|
Total Liabilities and Equity
|
$
|
44,548
|
|
|
$
|
41,942
|
|
See Notes to Consolidated Financial Statements
93
PART II
PROGRESS ENERGY, INC.
CONSOLIDATED STATEMENTS OF CASH FLOWS
|
|
Years Ended December 31,
|
||||||||||
|
(in millions)
|
2015
|
|
2014
|
|
2013
|
|
|||||
|
CASH FLOWS FROM OPERATING ACTIVITIES
|
|
|
|
||||||||
|
Net income
|
$
|
1,062
|
|
$
|
874
|
|
$
|
675
|
|
||
|
Adjustments to reconcile net income to net cash provided by operating activities:
|
|
|
|
||||||||
|
Depreciation, amortization and accretion (including amortization of nuclear fuel)
|
1,312
|
|
1,313
|
|
1,041
|
|
|||||
|
Equity component of AFUDC
|
(54
|
)
|
(26
|
)
|
(50
|
)
|
|||||
|
FERC mitigation costs
|
—
|
|
(18
|
)
|
—
|
|
|||||
|
Community support and charitable contributions expense
|
—
|
|
—
|
|
20
|
|
|||||
|
(Gains) losses on sales of other assets
|
(31
|
)
|
(6
|
)
|
2
|
|
|||||
|
Impairment charges
|
12
|
|
2
|
|
380
|
|
|||||
|
Deferred income taxes
|
714
|
|
1,014
|
|
616
|
|
|||||
|
Accrued pension and other post-retirement benefit costs
|
(5
|
)
|
27
|
|
172
|
|
|||||
|
Contributions to qualified pension plans
|
(83
|
)
|
—
|
|
(250
|
)
|
|||||
|
Payments for asset retirement obligations
|
(156
|
)
|
(68
|
)
|
(12
|
)
|
|||||
|
(Increase) decrease in
|
|
|
|
||||||||
|
Net realized and unrealized mark-to-market and hedging transactions
|
(6
|
)
|
12
|
|
55
|
|
|||||
|
Receivables
|
105
|
|
(31
|
)
|
(148
|
)
|
|||||
|
Receivables from affiliated companies
|
(316
|
)
|
(56
|
)
|
11
|
|
|||||
|
Inventory
|
(67
|
)
|
(101
|
)
|
17
|
|
|||||
|
Other current assets
|
553
|
|
(934
|
)
|
(156
|
)
|
|||||
|
Increase (decrease) in
|
|
|
|
||||||||
|
Accounts payable
|
(193
|
)
|
6
|
|
(81
|
)
|
|||||
|
Accounts payable to affiliated companies
|
108
|
|
80
|
|
93
|
|
|||||
|
Taxes accrued
|
(63
|
)
|
(20
|
)
|
22
|
|
|||||
|
Other current liabilities
|
136
|
|
(144
|
)
|
61
|
|
|||||
|
Other assets
|
(167
|
)
|
(14
|
)
|
(243
|
)
|
|||||
|
Other liabilities
|
(112
|
)
|
56
|
|
(103
|
)
|
|||||
|
Net cash provided by operating activities
|
2,749
|
|
|
1,966
|
|
|
2,122
|
|
|||
|
CASH FLOWS FROM INVESTING ACTIVITIES
|
|
|
|
||||||||
|
Capital expenditures
|
(2,698
|
)
|
(1,940
|
)
|
(2,490
|
)
|
|||||
|
Asset acquisition
|
(1,249
|
)
|
—
|
|
—
|
|
|||||
|
Purchases of available-for-sale securities
|
(1,174
|
)
|
(1,689
|
)
|
(2,558
|
)
|
|||||
|
Proceeds from sales and maturities of available-for-sale securities
|
1,211
|
|
1,652
|
|
2,513
|
|
|||||
|
Proceeds from the sale of nuclear fuel
|
102
|
|
—
|
|
—
|
|
|||||
|
Notes receivable from affiliated companies
|
220
|
|
(145
|
)
|
(75
|
)
|
|||||
|
Other
|
(34
|
)
|
(44
|
)
|
13
|
|
|||||
|
Net cash used in investing activities
|
(3,622
|
)
|
(2,166
|
)
|
(2,597
|
)
|
|||||
|
CASH FLOWS FROM FINANCING ACTIVITIES
|
|
|
|
||||||||
|
Proceeds from the issuance of long-term debt
|
1,186
|
|
1,572
|
|
845
|
|
|||||
|
Payments for the:
|
|
|
|
||||||||
|
Redemption of long-term debt
|
(1,553
|
)
|
(931
|
)
|
(1,196
|
)
|
|||||
|
Redemption of preferred stock of subsidiaries
|
—
|
|
—
|
|
(96
|
)
|
|||||
|
Notes payable to affiliated companies
|
623
|
|
(378
|
)
|
758
|
|
|||||
|
Distributions to noncontrolling interests
|
(4
|
)
|
(37
|
)
|
(3
|
)
|
|||||
|
Capital contribution from parent
|
625
|
|
—
|
|
—
|
|
|||||
|
Other
|
(2
|
)
|
(42
|
)
|
(6
|
)
|
|||||
|
Net cash provided by financing activities
|
875
|
|
|
184
|
|
|
302
|
|
|||
|
Net increase (decrease) in cash and cash equivalents
|
2
|
|
|
(16
|
)
|
|
(173
|
)
|
|||
|
Cash and Cash Equivalents at Beginning of Period
|
42
|
|
58
|
|
231
|
|
|||||
|
Cash and Cash Equivalents at End of Period
|
44
|
|
42
|
|
58
|
|
|||||
|
Supplemental Disclosures:
|
|
|
|
||||||||
|
Cash paid for interest, net of amount capitalized
|
$
|
649
|
|
$
|
664
|
|
$
|
678
|
|
||
|
Cash (received from) paid for income taxes
|
(426
|
)
|
141
|
|
(167
|
)
|
|||||
|
Significant non-cash transactions:
|
|
|
|
||||||||
|
Accrued capital expenditures
|
329
|
|
294
|
|
255
|
|
|||||
See Notes to Consolidated Financial Statements
94
PART II
PROGRESS ENERGY, INC.
CONSOLIDATED STATEMENTS OF CHANGES IN EQUITY
|
|
|
|
|
|
|
|
Accumulated Other Comprehensive Loss
|
|
|
|
|
|
|
||||||||||||||||||||||
|
Net
|
|
Net Unrealized
|
|
Total Progress
|
|
||||||||||||||||||||||||||||||
|
Additional
|
|
Losses on
|
|
Gains on
|
|
Pension and
|
|
Energy, Inc.
|
|
||||||||||||||||||||||||||
|
Common
|
|
Paid-in
|
|
Retained
|
|
Cash Flow
|
|
Available-for-
|
|
OPEB
|
|
Stockholders'
|
|
Noncontrolling
|
|
Total
|
|
||||||||||||||||||
|
(in millions)
|
Stock
|
|
Capital
|
|
Earnings
|
|
Hedges
|
|
Sale Securities
|
|
Adjustments
|
|
Equity
|
|
Interests
|
|
Equity
|
|
|||||||||||||||||
|
Balance at December 31, 2012
|
$
|
—
|
|
$
|
7,465
|
|
$
|
2,783
|
|
$
|
(42
|
)
|
$
|
—
|
|
$
|
(25
|
)
|
$
|
10,181
|
|
$
|
4
|
|
$
|
10,185
|
|
||||||||
|
Net income
|
—
|
|
—
|
|
672
|
|
—
|
|
—
|
|
—
|
|
672
|
|
3
|
|
675
|
|
|||||||||||||||||
|
Other comprehensive (loss) income
|
—
|
|
—
|
|
—
|
|
(1
|
)
|
—
|
|
9
|
|
8
|
|
—
|
|
8
|
|
|||||||||||||||||
|
Premium on the redemption of preferred stock of subsidiaries
|
—
|
|
—
|
|
(3
|
)
|
—
|
|
—
|
|
—
|
|
(3
|
)
|
—
|
|
(3
|
)
|
|||||||||||||||||
|
Distributions to noncontrolling interests
|
—
|
|
—
|
|
—
|
|
—
|
|
—
|
|
—
|
|
—
|
|
(3
|
)
|
(3
|
)
|
|||||||||||||||||
|
Other
|
—
|
|
2
|
|
—
|
|
—
|
|
—
|
|
—
|
|
2
|
|
—
|
|
2
|
|
|||||||||||||||||
|
Balance at December 31, 2013
|
$
|
—
|
|
|
$
|
7,467
|
|
|
$
|
3,452
|
|
|
$
|
(43
|
)
|
|
$
|
—
|
|
|
$
|
(16
|
)
|
|
$
|
10,860
|
|
|
$
|
4
|
|
|
$
|
10,864
|
|
|
Net income
|
—
|
|
—
|
|
869
|
|
—
|
|
—
|
|
—
|
|
869
|
|
5
|
|
874
|
|
|||||||||||||||||
|
Other comprehensive income
|
—
|
|
—
|
|
—
|
|
8
|
|
1
|
|
9
|
|
18
|
|
—
|
|
18
|
|
|||||||||||||||||
|
Distributions to noncontrolling interests
|
—
|
|
—
|
|
—
|
|
—
|
|
—
|
|
—
|
|
—
|
|
(37
|
)
|
(37
|
)
|
|||||||||||||||||
|
Transfer of service company net assets to Duke Energy
|
—
|
|
—
|
|
(539
|
)
|
—
|
|
—
|
|
—
|
|
(539
|
)
|
—
|
|
(539
|
)
|
|||||||||||||||||
|
Other
|
—
|
|
—
|
|
—
|
|
—
|
|
—
|
|
—
|
|
—
|
|
(4
|
)
|
(4
|
)
|
|||||||||||||||||
|
Balance at December 31, 2014
|
$
|
—
|
|
|
$
|
7,467
|
|
|
$
|
3,782
|
|
|
$
|
(35
|
)
|
|
$
|
1
|
|
|
$
|
(7
|
)
|
|
$
|
11,208
|
|
|
$
|
(32
|
)
|
|
$
|
11,176
|
|
|
Net income
|
—
|
|
—
|
|
1,051
|
|
—
|
|
—
|
|
—
|
|
1,051
|
|
11
|
|
1,062
|
|
|||||||||||||||||
|
Other comprehensive income (loss)
|
—
|
|
—
|
|
—
|
|
4
|
|
(1
|
)
|
(10
|
)
|
(7
|
)
|
—
|
|
(7
|
)
|
|||||||||||||||||
|
Distributions to noncontrolling interests
|
—
|
|
—
|
|
—
|
|
—
|
|
—
|
|
—
|
|
—
|
|
(4
|
)
|
(4
|
)
|
|||||||||||||||||
|
Capital contribution from parent
|
—
|
|
625
|
|
—
|
|
—
|
|
—
|
|
—
|
|
625
|
|
—
|
|
625
|
|
|||||||||||||||||
|
Other
|
—
|
|
—
|
|
(2
|
)
|
—
|
|
—
|
|
—
|
|
(2
|
)
|
3
|
|
1
|
|
|||||||||||||||||
|
Balance at December 31, 2015
|
$
|
—
|
|
|
$
|
8,092
|
|
|
$
|
4,831
|
|
|
$
|
(31
|
)
|
|
$
|
—
|
|
|
$
|
(17
|
)
|
|
$
|
12,875
|
|
|
$
|
(22
|
)
|
|
$
|
12,853
|
|
See Notes to Consolidated Financial Statements
95
PART II
REPORT OF INDEPENDENT REGISTERED PUBLIC ACCOUNTING FIRM
To the Board of Directors of
Duke Energy Progress, LLC
Charlotte, North Carolina
We have audited the accompanying consolidated balance sheets of Duke Energy Progress, LLC and subsidiaries (the "Company") (formerly Duke Energy Progress, Inc. and subsidiaries) as of December 31, 2015 and 2014, and the related consolidated statements of operations and comprehensive income, changes in equity, and cash flows for each of the three years in the period ended December 31, 2015. These financial statements are the responsibility of the Company's management. Our responsibility is to express an opinion on these financial statements based on our audits.
We conducted our audits in accordance with the standards of the Public Company Accounting Oversight Board (United States). Those standards require that we plan and perform the audit to obtain reasonable assurance about whether the financial statements are free of material misstatement. The Company is not required to have, nor were we engaged to perform, an audit of its internal control over financial reporting. Our audits included consideration of internal control over financial reporting as a basis for designing audit procedures that are appropriate in the circumstances, but not for the purpose of expressing an opinion on the effectiveness of the Company's internal control over financial reporting. Accordingly, we express no such opinion. An audit also includes examining, on a test basis, evidence supporting the amounts and disclosures in the financial statements, assessing the accounting principles used and significant estimates made by management, as well as evaluating the overall financial statement presentation. We believe that our audits provide a reasonable basis for our opinion.
In our opinion, the consolidated financial statements referred to above present fairly, in all material respects, the financial position of Duke Energy Progress, LLC and subsidiaries (formerly Duke Energy Progress, Inc.) at December 31, 2015 and 2014, and the results of their operations and their cash flows for each of the three years in the period ended December 31, 2015, in conformity with accounting principles generally accepted in the United States of America.
As discussed in Note 22 to the consolidated financial statements, Duke Energy Progress, LLC and subsidiaries adopted ASU 2015-17, Income Taxes (Topic 740); Balance Sheet Classification of Deferred Taxes effective December 31, 2015 on a prospective basis.
/s/ Deloitte & Touche LLP
Charlotte, North Carolina
February 25, 2016
96
PART II
DUKE ENERGY PROGRESS, LLC (formerly DUKE ENERGY PROGRESS, INC.)
CONSOLIDATED STATEMENTS OF OPERATIONS AND COMPREHENSIVE INCOME
|
|
Years Ended December 31,
|
||||||||||
|
(in millions)
|
2015
|
|
2014
|
|
2013
|
|
|||||
|
Operating Revenues
|
$
|
5,290
|
|
$
|
5,176
|
|
$
|
4,992
|
|
||
|
Operating Expenses
|
|
|
|
||||||||
|
Fuel used in electric generation and purchased power
|
2,029
|
|
2,036
|
|
1,925
|
|
|||||
|
Operation, maintenance and other
|
1,452
|
|
1,470
|
|
1,357
|
|
|||||
|
Depreciation and amortization
|
643
|
|
582
|
|
534
|
|
|||||
|
Property and other taxes
|
140
|
|
174
|
|
223
|
|
|||||
|
Impairment charges
|
5
|
|
(18
|
)
|
22
|
|
|||||
|
Total operating expenses
|
4,269
|
|
4,244
|
|
4,061
|
|
|||||
|
Gains on Sales of Other Assets and Other, net
|
3
|
|
3
|
|
1
|
|
|||||
|
Operating Income
|
1,024
|
|
935
|
|
932
|
|
|||||
|
Other Income and Expenses, net
|
71
|
|
51
|
|
57
|
|
|||||
|
Interest Expense
|
235
|
|
234
|
|
201
|
|
|||||
|
Income Before Income Taxes
|
860
|
|
752
|
|
788
|
|
|||||
|
Income Tax Expense
|
294
|
|
285
|
|
288
|
|
|||||
|
Net Income and Comprehensive Income
|
$
|
566
|
|
$
|
467
|
|
$
|
500
|
|
||
See Notes to Consolidated Financial Statements
97
PART II
DUKE ENERGY PROGRESS, LLC (formerly DUKE ENERGY PROGRESS, INC.)
CONSOLIDATED BALANCE SHEETS
|
|
December 31,
|
||||||
|
(in millions)
|
2015
|
|
2014
|
|
|||
|
ASSETS
|
|
|
|||||
|
Current Assets
|
|
|
|||||
|
Cash and cash equivalents
|
$
|
15
|
|
$
|
9
|
|
|
|
Receivables (net of allowance for doubtful accounts of $4 at December 31, 2015 and $7 at December 31, 2014)
|
87
|
|
43
|
|
|||
|
Restricted receivables of variable interest entities (net of allowance for doubtful accounts of $5 at December 31, 2015 and December 31, 2014)
|
349
|
|
436
|
|
|||
|
Receivables from affiliated companies
|
16
|
|
10
|
|
|||
|
Notes receivable from affiliated companies
|
—
|
|
237
|
|
|||
|
Inventory
|
1,088
|
|
|
966
|
|
||
|
Regulatory assets
|
264
|
|
287
|
|
|||
|
Other
|
121
|
|
384
|
|
|||
|
Total current assets
|
1,940
|
|
2,372
|
|
|||
|
Investments and Other Assets
|
|
|
|||||
|
Nuclear decommissioning trust funds
|
2,035
|
|
1,701
|
|
|||
|
Other
|
486
|
|
412
|
|
|||
|
Total investments and other assets
|
2,521
|
|
2,113
|
|
|||
|
Property, Plant and Equipment
|
|
|
|||||
|
Cost
|
27,313
|
|
24,207
|
|
|||
|
Accumulated depreciation and amortization
|
(10,141
|
)
|
(9,021
|
)
|
|||
|
Generation facilities to be retired, net
|
548
|
|
—
|
|
|||
|
Net property, plant and equipment
|
17,720
|
|
15,186
|
|
|||
|
Regulatory Assets and Deferred Debits
|
|
|
|||||
|
Regulatory assets
|
2,710
|
|
2,675
|
|
|||
|
Other
|
3
|
|
3
|
|
|||
|
Total regulatory assets and deferred debits
|
2,713
|
|
2,678
|
|
|||
|
Total Assets
|
$
|
24,894
|
|
$
|
22,349
|
|
|
|
LIABILITIES AND EQUITY
|
|
|
|||||
|
Current Liabilities
|
|
|
|||||
|
Accounts payable
|
$
|
399
|
|
$
|
481
|
|
|
|
Accounts payable to affiliated companies
|
190
|
|
120
|
|
|||
|
Notes payable to affiliated companies
|
209
|
|
—
|
|
|||
|
Taxes accrued
|
15
|
|
47
|
|
|||
|
Interest accrued
|
96
|
|
81
|
|
|||
|
Current maturities of long-term debt
|
2
|
|
945
|
|
|||
|
Regulatory liabilities
|
85
|
|
71
|
|
|||
|
Other
|
412
|
|
409
|
|
|||
|
Total current liabilities
|
1,408
|
|
2,154
|
|
|||
|
Long-Term Debt
|
6,366
|
|
5,225
|
|
|||
|
Long-Term Debt Payable to Affiliated Companies
|
150
|
|
—
|
|
|||
|
Deferred Credits and Other Liabilities
|
|
|
|||||
|
Deferred income taxes
|
3,027
|
|
2,908
|
|
|||
|
Investment tax credits
|
132
|
|
79
|
|
|||
|
Accrued pension and other post-retirement benefit costs
|
262
|
|
290
|
|
|||
|
Asset retirement obligations
|
4,567
|
|
3,905
|
|
|||
|
Regulatory liabilities
|
1,878
|
|
1,832
|
|
|||
|
Other
|
45
|
|
89
|
|
|||
|
Total deferred credits and other liabilities
|
9,911
|
|
9,103
|
|
|||
|
Commitments and Contingencies
|
|||||||
|
Equity
|
|
|
|||||
|
Member's Equity
|
7,059
|
|
—
|
|
|||
|
Common stock, no par; 200 million shares authorized; 160 million shares outstanding at December 31, 2014
|
—
|
|
2,159
|
|
|||
|
Retained earnings
|
—
|
|
3,708
|
|
|||
|
Total equity
|
7,059
|
|
5,867
|
|
|||
|
Total Liabilities and Equity
|
$
|
24,894
|
|
$
|
22,349
|
|
|
See Notes to Consolidated Financial Statements
98
PART II
DUKE ENERGY PROGRESS, LLC (formerly DUKE ENERGY PROGRESS, INC.)
CONSOLIDATED STATEMENTS OF CASH FLOWS
|
|
Years Ended December 31,
|
||||||||||
|
(in millions)
|
2015
|
2014
|
2013
|
||||||||
|
CASH FLOWS FROM OPERATING ACTIVITIES
|
|
|
|
||||||||
|
Net income
|
566
|
|
467
|
|
500
|
|
|||||
|
Adjustments to reconcile net income to net cash provided by operating activities:
|
|
|
|
||||||||
|
Depreciation, amortization and accretion (including amortization of nuclear fuel)
|
821
|
|
761
|
|
685
|
|
|||||
|
Equity component of AFUDC
|
(47
|
)
|
(25
|
)
|
(42
|
)
|
|||||
|
FERC mitigation costs
|
—
|
|
(18
|
)
|
—
|
|
|||||
|
Community support and charitable contributions expense
|
—
|
|
—
|
|
20
|
|
|||||
|
Gains on sales of other assets and other, net
|
(7
|
)
|
(3
|
)
|
(1
|
)
|
|||||
|
Impairment charges
|
5
|
|
—
|
|
22
|
|
|||||
|
Deferred income taxes
|
354
|
|
455
|
|
368
|
|
|||||
|
Accrued pension and other post-retirement benefit costs
|
(14
|
)
|
(7
|
)
|
72
|
|
|||||
|
Contributions to qualified pension plans
|
(42
|
)
|
—
|
|
(63
|
)
|
|||||
|
Payments for asset retirement obligations
|
(109
|
)
|
—
|
|
—
|
|
|||||
|
(Increase) decrease in
|
|
|
|
||||||||
|
Net realized and unrealized mark-to-market and hedging transactions
|
(3
|
)
|
13
|
|
(9
|
)
|
|||||
|
Receivables
|
43
|
|
78
|
|
(88
|
)
|
|||||
|
Receivables from affiliated companies
|
(6
|
)
|
(8
|
)
|
3
|
|
|||||
|
Inventory
|
(50
|
)
|
(65
|
)
|
(26
|
)
|
|||||
|
Other current assets
|
185
|
|
(416
|
)
|
(39
|
)
|
|||||
|
Increase (decrease) in
|
|
|
|
||||||||
|
Accounts payable
|
(65
|
)
|
27
|
|
(18
|
)
|
|||||
|
Accounts payable to affiliated companies
|
70
|
|
17
|
|
27
|
|
|||||
|
Taxes accrued
|
(34
|
)
|
10
|
|
15
|
|
|||||
|
Other current liabilities
|
76
|
|
(68
|
)
|
(86
|
)
|
|||||
|
Other assets
|
(83
|
)
|
48
|
|
(74
|
)
|
|||||
|
Other liabilities
|
(66
|
)
|
(21
|
)
|
(78
|
)
|
|||||
|
Net cash provided by operating activities
|
1,594
|
|
1,245
|
|
1,188
|
|
|||||
|
CASH FLOWS FROM INVESTING ACTIVITIES
|
|
|
|
||||||||
|
Capital expenditures
|
(1,669
|
)
|
(1,241
|
)
|
(1,567
|
)
|
|||||
|
Asset acquisition
|
(1,249
|
)
|
—
|
|
—
|
|
|||||
|
Purchases of available-for-sale securities
|
(727
|
)
|
(499
|
)
|
(901
|
)
|
|||||
|
Proceeds from sales and maturities of available-for-sale securities
|
672
|
|
458
|
|
856
|
|
|||||
|
Notes receivable from affiliated companies
|
237
|
|
(237
|
)
|
—
|
|
|||||
|
Other
|
(30
|
)
|
(12
|
)
|
4
|
|
|||||
|
Net cash used in investing activities
|
(2,766
|
)
|
(1,531
|
)
|
(1,608
|
)
|
|||||
|
CASH FLOWS FROM FINANCING ACTIVITIES
|
|
|
|
||||||||
|
Proceeds from the issuance of long-term debt
|
1,186
|
|
1,347
|
|
845
|
|
|||||
|
Payments for the:
|
|
|
|
||||||||
|
Redemption of long-term debt
|
(991
|
)
|
(379
|
)
|
(451
|
)
|
|||||
|
Redemption of preferred stock
|
—
|
|
—
|
|
(62
|
)
|
|||||
|
Notes payable to affiliated companies
|
359
|
|
(462
|
)
|
98
|
|
|||||
|
Capital contribution from parent
|
626
|
|
—
|
|
—
|
|
|||||
|
Dividends to parent
|
—
|
|
(225
|
)
|
—
|
|
|||||
|
Other
|
(2
|
)
|
(7
|
)
|
(7
|
)
|
|||||
|
Net cash provided by financing activities
|
1,178
|
|
274
|
|
423
|
|
|||||
|
Net increase (decrease) in cash and cash equivalents
|
6
|
|
(12
|
)
|
3
|
|
|||||
|
Cash and Cash Equivalents at Beginning of Period
|
9
|
|
21
|
|
18
|
|
|||||
|
Cash and Cash Equivalents at End of Period
|
$
|
15
|
|
$
|
9
|
|
$
|
21
|
|
||
|
Supplemental Disclosures:
|
|
|
|
||||||||
|
Cash paid for interest, net of amount capitalized
|
$
|
218
|
|
$
|
220
|
|
$
|
217
|
|
||
|
Cash (received from) paid for income taxes
|
(197
|
)
|
81
|
|
(94
|
)
|
|||||
|
Significant non-cash transactions:
|
|
|
|
||||||||
|
Accrued capital expenditures
|
143
|
|
194
|
|
166
|
|
|||||
See Notes to Consolidated Financial Statements
99
PART II
DUKE ENERGY PROGRESS, LLC (formerly DUKE ENERGY PROGRESS, INC.)
CONSOLIDATED STATEMENTS OF CHANGES IN EQUITY
|
|
Common
|
|
Retained
|
|
Member's
|
|
Total
|
|
|||||||
|
(in millions)
|
Stock
|
|
Earnings
|
|
Equity
|
|
Equity
|
|
|||||||
|
Balance at December 31, 2012
|
$
|
2,159
|
|
$
|
2,968
|
|
$
|
—
|
|
$
|
5,127
|
|
|||
|
Net income
|
—
|
|
500
|
|
—
|
|
500
|
|
|||||||
|
Premium on the redemption of preferred stock
|
—
|
|
(2
|
)
|
—
|
|
(2
|
)
|
|||||||
|
Balance at December 31, 2013
|
$
|
2,159
|
|
$
|
3,466
|
|
$
|
—
|
|
$
|
5,625
|
|
|||
|
Net income
|
—
|
|
467
|
|
—
|
|
467
|
|
|||||||
|
Dividends to parent
|
—
|
|
(225
|
)
|
—
|
|
(225
|
)
|
|||||||
|
Balance at December 31, 2014
|
$
|
2,159
|
|
$
|
3,708
|
|
$
|
—
|
|
$
|
5,867
|
|
|||
|
Net income
|
—
|
|
355
|
|
211
|
|
566
|
|
|||||||
|
Transfer to Member's Equity
|
(2,159
|
)
|
(4,063
|
)
|
6,222
|
|
—
|
|
|||||||
|
Capital contribution from parent
|
—
|
|
—
|
|
626
|
|
626
|
|
|||||||
|
Balance at December 31, 2015
|
$
|
—
|
|
$
|
—
|
|
|
$
|
7,059
|
|
$
|
7,059
|
|
||
See Notes to Consolidated Financial Statements
100
PART II
REPORT OF INDEPENDENT REGISTERED PUBLIC ACCOUNTING FIRM
To the Board of Directors of
Duke Energy Florida, LLC
Charlotte, North Carolina
We have audited the accompanying consolidated balance sheets of Duke Energy Florida, LLC and subsidiaries (the "Company") (formerly Duke Energy Florida, Inc. and subsidiaries) as of December 31, 2015 and 2014, and the related consolidated statements of operations and comprehensive income, changes in equity, and cash flows for each of the three years in the period ended December 31, 2015. These financial statements are the responsibility of the Company's management. Our responsibility is to express an opinion on these financial statements based on our audits.
We conducted our audits in accordance with the standards of the Public Company Accounting Oversight Board (United States). Those standards require that we plan and perform the audit to obtain reasonable assurance about whether the financial statements are free of material misstatement. The Company is not required to have, nor were we engaged to perform, an audit of its internal control over financial reporting. Our audits included consideration of internal control over financial reporting as a basis for designing audit procedures that are appropriate in the circumstances, but not for the purpose of expressing an opinion on the effectiveness of the Company's internal control over financial reporting. Accordingly, we express no such opinion. An audit also includes examining, on a test basis, evidence supporting the amounts and disclosures in the financial statements, assessing the accounting principles used and significant estimates made by management, as well as evaluating the overall financial statement presentation. We believe that our audits provide a reasonable basis for our opinion.
In our opinion, the consolidated financial statements referred to above present fairly, in all material respects, the financial position of Duke Energy Florida, LLC and subsidiaries (formerly Duke Energy Florida, Inc.) at December 31, 2015 and 2014, and the results of their operations and their cash flows for each of the three years in the period ended December 31, 2015, in conformity with accounting principles generally accepted in the United States of America.
As discussed in Note 22 to the consolidated financial statements, Duke Energy Florida, LLC and subsidiaries adopted ASU 2015-17, Income Taxes (Topic 740); Balance Sheet Classification of Deferred Taxes effective December 31, 2015 on a prospective basis.
/s/ Deloitte & Touche LLP
Charlotte, North Carolina
February 25, 2016
101
PART II
DUKE ENERGY FLORIDA, LLC (formerly DUKE ENERGY FLORIDA, INC.)
CONSOLIDATED STATEMENTS OF OPERATIONS AND COMPREHENSIVE INCOME
|
|
Years Ended December 31,
|
||||||||||
|
(in millions)
|
2015
|
|
2014
|
|
2013
|
|
|||||
|
Operating Revenues
|
$
|
4,977
|
|
$
|
4,975
|
|
$
|
4,527
|
|
||
|
Operating Expenses
|
|
|
|
||||||||
|
Fuel used in electric generation and purchased power
|
2,195
|
|
2,158
|
|
1,927
|
|
|||||
|
Operation, maintenance and other
|
835
|
|
850
|
|
898
|
|
|||||
|
Depreciation and amortization
|
473
|
|
545
|
|
330
|
|
|||||
|
Property and other taxes
|
352
|
|
343
|
|
327
|
|
|||||
|
Impairment charges
|
7
|
|
2
|
|
358
|
|
|||||
|
Total operating expenses
|
3,862
|
|
3,898
|
|
3,840
|
|
|||||
|
Gains on Sales of Other Assets and Other, net
|
—
|
|
1
|
|
1
|
|
|||||
|
Operating Income
|
1,115
|
|
1,078
|
|
688
|
|
|||||
|
Other Income and Expenses, net
|
24
|
|
20
|
|
30
|
|
|||||
|
Interest Expense
|
198
|
|
201
|
|
180
|
|
|||||
|
Income Before Income Taxes
|
941
|
|
897
|
|
538
|
|
|||||
|
Income Tax Expense
|
342
|
|
349
|
|
213
|
|
|||||
|
Net Income
|
$
|
599
|
|
$
|
548
|
|
$
|
325
|
|
||
|
Other Comprehensive Income (Loss), net of tax
|
|
|
|
||||||||
|
Net unrealized loss on cash flow hedges
|
—
|
|
—
|
|
(1
|
)
|
|||||
|
Reclassification into earnings from cash flow hedges
|
—
|
|
1
|
|
—
|
|
|||||
|
Other Comprehensive Income (Loss), net of tax
|
—
|
|
1
|
|
(1
|
)
|
|||||
|
Comprehensive Income
|
$
|
599
|
|
$
|
549
|
|
$
|
324
|
|
||
See Notes to Consolidated Financial Statements
102
PART II
DUKE ENERGY FLORIDA, LLC (formerly DUKE ENERGY FLORIDA, INC.)
CONSOLIDATED BALANCE SHEETS
|
|
December 31,
|
||||||
|
(in millions)
|
2015
|
|
2014
|
|
|||
|
ASSETS
|
|
|
|||||
|
Current Assets
|
|
|
|||||
|
Cash and cash equivalents
|
$
|
8
|
|
$
|
8
|
|
|
|
Receivables (net of allowance for doubtful accounts of $2 at December 31, 2015 and 2014)
|
60
|
|
84
|
|
|||
|
Restricted receivables of variable interest entities (net of allowance for doubtful accounts of $3 at December 31, 2015 and 2014)
|
308
|
|
305
|
|
|||
|
Receivables from affiliated companies
|
84
|
|
40
|
|
|||
|
Inventory
|
663
|
|
|
623
|
|
||
|
Regulatory assets
|
98
|
|
203
|
|
|||
|
Other
|
21
|
|
521
|
|
|||
|
Total current assets
|
1,242
|
|
1,784
|
|
|||
|
Investments and Other Assets
|
|
|
|||||
|
Nuclear decommissioning trust funds
|
740
|
|
803
|
|
|||
|
Other
|
292
|
|
204
|
|
|||
|
Total investments and other assets
|
1,032
|
|
1,007
|
|
|||
|
Property, Plant and Equipment
|
|
|
|||||
|
Cost
|
15,343
|
|
14,433
|
|
|||
|
Accumulated depreciation and amortization
|
(4,720
|
)
|
(4,478
|
)
|
|||
|
Net property, plant and equipment
|
10,623
|
|
9,955
|
|
|||
|
Regulatory Assets and Deferred Debits
|
|
|
|||||
|
Regulatory assets
|
2,725
|
|
2,733
|
|
|||
|
Other
|
2
|
|
2
|
|
|||
|
Total regulatory assets and deferred debits
|
2,727
|
|
2,735
|
|
|||
|
Total Assets
|
$
|
15,624
|
|
$
|
15,481
|
|
|
|
LIABILITIES AND EQUITY
|
|
|
|||||
|
Current Liabilities
|
|
|
|||||
|
Accounts payable
|
$
|
322
|
|
$
|
365
|
|
|
|
Accounts payable to affiliated companies
|
116
|
|
70
|
|
|||
|
Notes payable to affiliated companies
|
813
|
|
84
|
|
|||
|
Taxes accrued
|
132
|
|
65
|
|
|||
|
Interest accrued
|
43
|
|
47
|
|
|||
|
Current maturities of long-term debt
|
13
|
|
562
|
|
|||
|
Regulatory liabilities
|
200
|
|
35
|
|
|||
|
Other
|
452
|
|
586
|
|
|||
|
Total current liabilities
|
2,091
|
|
1,814
|
|
|||
|
Long-Term Debt
|
4,253
|
|
4,261
|
|
|||
|
Deferred Credits and Other Liabilities
|
|
|
|||||
|
Deferred income taxes
|
2,460
|
|
2,452
|
|
|||
|
Accrued pension and other post-retirement benefit costs
|
242
|
|
221
|
|
|||
|
Asset retirement obligations
|
802
|
|
806
|
|
|||
|
Regulatory liabilities
|
509
|
|
547
|
|
|||
|
Other
|
146
|
|
158
|
|
|||
|
Total deferred credits and other liabilities
|
4,159
|
|
4,184
|
|
|||
|
Commitments and Contingencies
|
|
|
|||||
|
Equity
|
|
|
|||||
|
Member's equity
|
5,121
|
|
—
|
|
|||
|
Common Stock, no par; 60 million shares authorized; 100 shares outstanding at December 31, 2014
|
—
|
|
1,762
|
|
|||
|
Retained earnings
|
—
|
|
3,460
|
|
|||
|
Total equity
|
5,121
|
|
5,222
|
|
|||
|
Total Liabilities and Equity
|
$
|
15,624
|
|
$
|
15,481
|
|
|
See Notes to Consolidated Financial Statements
103
PART II
DUKE ENERGY FLORIDA, LLC (formerly DUKE ENERGY FLORIDA, INC.)
CONSOLIDATED STATEMENTS OF CASH FLOWS
|
|
Years Ended December 31,
|
||||||||||
|
(in millions)
|
2015
|
|
2014
|
|
2013
|
|
|||||
|
CASH FLOWS FROM OPERATING ACTIVITIES
|
|
|
|
||||||||
|
Net income
|
$
|
599
|
|
$
|
548
|
|
$
|
325
|
|
||
|
Adjustments to reconcile net income to net cash provided by operating activities:
|
|
|
|
||||||||
|
Depreciation, amortization and accretion
|
480
|
|
550
|
|
335
|
|
|||||
|
Equity component of AFUDC
|
(7
|
)
|
—
|
|
(8
|
)
|
|||||
|
Gains on sales of other assets and other, net
|
—
|
|
(1
|
)
|
(1
|
)
|
|||||
|
Impairment charges
|
7
|
|
2
|
|
358
|
|
|||||
|
Deferred income taxes
|
348
|
|
400
|
|
368
|
|
|||||
|
Accrued pension and other post-retirement benefit costs
|
5
|
|
29
|
|
79
|
|
|||||
|
Contributions to qualified pension plans
|
(40
|
)
|
—
|
|
(133
|
)
|
|||||
|
Payments for asset retirement obligations
|
(47
|
)
|
(68
|
)
|
(12
|
)
|
|||||
|
(Increase) decrease in
|
|
|
|
||||||||
|
Net realized and unrealized mark-to-market and hedging transactions
|
(3
|
)
|
(9
|
)
|
55
|
|
|||||
|
Receivables
|
61
|
|
(33
|
)
|
(44
|
)
|
|||||
|
Receivables from affiliated companies
|
(44
|
)
|
(37
|
)
|
17
|
|
|||||
|
Inventory
|
(17
|
)
|
(36
|
)
|
42
|
|
|||||
|
Other current assets
|
116
|
|
(269
|
)
|
(109
|
)
|
|||||
|
Increase (decrease) in
|
|
|
|
||||||||
|
Accounts payable
|
(127
|
)
|
18
|
|
(22
|
)
|
|||||
|
Accounts payable to affiliated companies
|
46
|
|
32
|
|
(6
|
)
|
|||||
|
Taxes accrued
|
67
|
|
(31
|
)
|
18
|
|
|||||
|
Other current liabilities
|
57
|
|
(80
|
)
|
159
|
|
|||||
|
Other assets
|
(84
|
)
|
(59
|
)
|
(154
|
)
|
|||||
|
Other liabilities
|
(44
|
)
|
10
|
|
(62
|
)
|
|||||
|
Net cash provided by operating activities
|
1,373
|
|
966
|
|
1,205
|
|
|||||
|
CASH FLOWS FROM INVESTING ACTIVITIES
|
|
|
|
||||||||
|
Capital expenditures
|
(1,029
|
)
|
(699
|
)
|
(915
|
)
|
|||||
|
Purchases of available-for-sale securities
|
(447
|
)
|
(1,189
|
)
|
(1,656
|
)
|
|||||
|
Proceeds from sales and maturities of available-for-sale securities
|
538
|
|
1,195
|
|
1,658
|
|
|||||
|
Proceeds from the sale of nuclear fuel
|
102
|
|
—
|
|
—
|
|
|||||
|
Notes receivable from affiliated companies
|
—
|
|
—
|
|
207
|
|
|||||
|
Other
|
(3
|
)
|
(31
|
)
|
—
|
|
|||||
|
Net cash used in investing activities
|
(839
|
)
|
(724
|
)
|
(706
|
)
|
|||||
|
CASH FLOWS FROM FINANCING ACTIVITIES
|
|
|
|
||||||||
|
Proceeds from the issuance of long-term debt
|
—
|
|
225
|
|
—
|
|
|||||
|
Payments for the:
|
|
|
|
||||||||
|
Redemption of long-term debt
|
(562
|
)
|
(252
|
)
|
(435
|
)
|
|||||
|
Redemption of preferred stock
|
—
|
|
—
|
|
(34
|
)
|
|||||
|
Notes payable to affiliated companies
|
729
|
|
(97
|
)
|
181
|
|
|||||
|
Dividends to parent
|
(350
|
)
|
(124
|
)
|
(325
|
)
|
|||||
|
Distribution to parent
|
(350
|
)
|
—
|
|
—
|
|
|||||
|
Other
|
(1
|
)
|
(2
|
)
|
(1
|
)
|
|||||
|
Net cash used in financing activities
|
(534
|
)
|
(250
|
)
|
(614
|
)
|
|||||
|
Net decrease in cash and cash equivalents
|
—
|
|
(8
|
)
|
(115
|
)
|
|||||
|
Cash and Cash Equivalents at Beginning of Period
|
8
|
|
16
|
|
131
|
|
|||||
|
Cash and Cash Equivalents at End of Period
|
$
|
8
|
|
$
|
8
|
|
$
|
16
|
|
||
|
Supplemental Disclosures:
|
|
|
|
||||||||
|
Cash paid for interest, net of amount capitalized
|
$
|
205
|
|
$
|
203
|
|
$
|
201
|
|
||
|
Cash (received from) paid for income taxes
|
(229
|
)
|
59
|
|
(84
|
)
|
|||||
|
Significant non-cash transactions:
|
|
|
|
||||||||
|
Accrued capital expenditures
|
186
|
|
100
|
|
88
|
|
|||||
See Notes to Consolidated Financial Statements
104
PART II
DUKE ENERGY FLORIDA, LLC (formerly DUKE ENERGY FLORIDA, INC.)
CONSOLIDATED STATEMENTS OF CHANGES IN EQUITY
|
Accumulated
|
|
||||||||||||||||||
|
Other
|
|
||||||||||||||||||
|
Comprehensive
|
|
||||||||||||||||||
|
Loss
|
|
||||||||||||||||||
|
Net Losses
|
|
||||||||||||||||||
|
|
Common
|
|
Retained
|
|
Member's
|
|
on Cash Flow
|
|
Total
|
|
|||||||||
|
(in millions)
|
Stock
|
|
Earnings
|
|
Equity
|
|
Hedges
|
|
Equity
|
|
|||||||||
|
Balance at December 31, 2012
|
$
|
1,762
|
|
$
|
3,037
|
|
$
|
—
|
|
$
|
—
|
|
$
|
4,799
|
|
||||
|
Net income
|
—
|
|
325
|
|
—
|
|
—
|
|
325
|
|
|||||||||
|
Other comprehensive loss
|
—
|
|
—
|
|
—
|
|
(1
|
)
|
(1
|
)
|
|||||||||
|
Dividend to parent
|
—
|
|
(325
|
)
|
—
|
|
—
|
|
(325
|
)
|
|||||||||
|
Premium on the redemption of preferred stock
|
—
|
|
(1
|
)
|
—
|
|
—
|
|
(1
|
)
|
|||||||||
|
Balance at December 31, 2013
|
$
|
1,762
|
|
$
|
3,036
|
|
$
|
—
|
|
$
|
(1
|
)
|
$
|
4,797
|
|
||||
|
Net income
|
—
|
|
548
|
|
—
|
|
548
|
|
|||||||||||
|
Other comprehensive income
|
—
|
|
—
|
|
1
|
|
1
|
|
|||||||||||
|
Dividend to parent
|
—
|
|
(124
|
)
|
—
|
|
(124
|
)
|
|||||||||||
|
Balance at December 31, 2014
|
$
|
1,762
|
|
$
|
3,460
|
|
$
|
—
|
|
$
|
—
|
|
$
|
5,222
|
|
||||
|
Net income
|
—
|
|
351
|
|
248
|
|
—
|
|
599
|
|
|||||||||
|
Dividends to parent
|
—
|
|
(350
|
)
|
—
|
|
—
|
|
(350
|
)
|
|||||||||
|
Distribution to parent
|
—
|
|
—
|
|
(350
|
)
|
—
|
|
(350
|
)
|
|||||||||
|
Transfer to Member's Equity
|
(1,762
|
)
|
(3,461
|
)
|
5,223
|
|
—
|
|
—
|
|
|||||||||
|
Balance at December 31, 2015
|
$
|
—
|
|
$
|
—
|
|
$
|
5,121
|
|
$
|
—
|
|
$
|
5,121
|
|
||||
See Notes to Consolidated Financial Statements
105
PART II
REPORT OF INDEPENDENT REGISTERED PUBLIC ACCOUNTING FIRM
To the Board of Directors of
Duke Energy Ohio, Inc.
Charlotte, North Carolina
We have audited the accompanying consolidated balance sheets of Duke Energy Ohio, Inc. and subsidiaries (the "Company") as of December 31, 2015 and 2014, and the related consolidated statements of operations and comprehensive income, changes in equity, and cash flows for each of the three years in the period ended December 31, 2015. These financial statements are the responsibility of the Company's management. Our responsibility is to express an opinion on these financial statements based on our audits.
We conducted our audits in accordance with the standards of the Public Company Accounting Oversight Board (United States). Those standards require that we plan and perform the audit to obtain reasonable assurance about whether the financial statements are free of material misstatement. The Company is not required to have, nor were we engaged to perform, an audit of its internal control over financial reporting. Our audits included consideration of internal control over financial reporting as a basis for designing audit procedures that are appropriate in the circumstances, but not for the purpose of expressing an opinion on the effectiveness of the Company's internal control over financial reporting.
Accordingly, we express no such opinion. An audit also includes examining, on a test basis, evidence supporting the amounts and disclosures in the financial statements, assessing the accounting principles used and significant estimates made by management, as well as evaluating the overall financial statement presentation. We believe that our audits provide a reasonable basis for our opinion.
In our opinion, the consolidated financial statements referred to above present fairly, in all material respects, the financial position of Duke Energy Ohio, Inc. and subsidiaries at December 31, 2015 and 2014, and the results of their operations and their cash flows for each of the three years in the period ended December 31, 2015, in conformity with accounting principles generally accepted in the United States of America.
As discussed in Note 22 to the consolidated financial statements, Duke Energy Ohio, Inc. and subsidiaries adopted ASU 2015-17, Income Taxes (Topic 740); Balance Sheet Classification of Deferred Taxes effective December 31, 2015 on a prospective basis.
/s/ Deloitte & Touche LLP
Charlotte, North Carolina
February 25, 2016
106
PART II
DUKE ENERGY OHIO, INC.
CONSOLIDATED STATEMENTS OF OPERATIONS AND COMPREHENSIVE INCOME
|
|
Years Ended December 31,
|
||||||||||
|
(in millions)
|
2015
|
|
2014
|
|
2013
|
|
|||||
|
Operating Revenues
|
|
|
|
||||||||
|
Regulated electric
|
$
|
1,331
|
|
$
|
1,316
|
|
$
|
1,258
|
|
||
|
Nonregulated electric and other
|
33
|
|
19
|
|
34
|
|
|||||
|
Regulated natural gas
|
541
|
|
578
|
|
513
|
|
|||||
|
Total operating revenues
|
1,905
|
|
1,913
|
|
1,805
|
|
|||||
|
Operating Expenses
|
|
|
|
||||||||
|
Fuel used in electric generation and purchased power – regulated
|
446
|
|
459
|
|
428
|
|
|||||
|
Fuel used in electric generation and purchased power – nonregulated
|
47
|
|
25
|
|
41
|
|
|||||
|
Cost of natural gas
|
141
|
|
185
|
|
152
|
|
|||||
|
Operation, maintenance and other
|
495
|
|
516
|
|
546
|
|
|||||
|
Depreciation and amortization
|
227
|
|
214
|
|
213
|
|
|||||
|
Property and other taxes
|
254
|
|
234
|
|
242
|
|
|||||
|
Impairment charges
|
—
|
|
94
|
|
5
|
|
|||||
|
Total operating expenses
|
1,610
|
|
1,727
|
|
1,627
|
|
|||||
|
Gains on Sales of Other Assets and Other, net
|
8
|
|
1
|
|
4
|
|
|||||
|
Operating Income
|
303
|
|
187
|
|
182
|
|
|||||
|
Other Income and Expenses, net
|
6
|
|
10
|
|
2
|
|
|||||
|
Interest Expense
|
79
|
|
86
|
|
74
|
|
|||||
|
Income From Continuing Operations Before Income Taxes
|
230
|
|
111
|
|
110
|
|
|||||
|
Income Tax Expense From Continuing Operations
|
81
|
|
43
|
|
43
|
|
|||||
|
Income From Continuing Operations
|
149
|
|
68
|
|
67
|
|
|||||
|
Income (Loss) From Discontinued Operations, net of tax
|
23
|
|
(563
|
)
|
35
|
|
|||||
|
Net Income (Loss)
|
$
|
172
|
|
$
|
(495
|
)
|
$
|
102
|
|
||
|
Other Comprehensive Income, net of tax
|
|||||||||||
|
Pension and OPEB adjustments
|
—
|
|
—
|
|
1
|
|
|||||
|
Comprehensive Income (Loss)
|
$
|
172
|
|
$
|
(495
|
)
|
$
|
103
|
|
||
See Notes to Consolidated Financial Statements
107
PART II
DUKE ENERGY OHIO, INC.
CONSOLIDATED BALANCE SHEETS
|
|
December 31,
|
||||||
|
(in millions)
|
2015
|
|
2014
|
|
|||
|
ASSETS
|
|
|
|||||
|
Current Assets
|
|
|
|||||
|
Cash and cash equivalents
|
$
|
14
|
|
$
|
20
|
|
|
|
Receivables (net of allowance for doubtful accounts of $2 at December 31, 2015 and December 31, 2014)
|
66
|
|
93
|
|
|||
|
Receivables from affiliated companies
|
84
|
|
107
|
|
|||
|
Notes receivable from affiliated companies
|
—
|
|
145
|
|
|||
|
Inventory
|
105
|
|
|
97
|
|
||
|
Assets held for sale
|
—
|
|
316
|
|
|||
|
Regulatory assets
|
36
|
|
49
|
|
|||
|
Other
|
110
|
|
167
|
|
|||
|
Total current assets
|
415
|
|
994
|
|
|||
|
Investments and Other Assets
|
|
|
|||||
|
Goodwill
|
920
|
|
920
|
|
|||
|
Assets held for sale
|
—
|
|
2,605
|
|
|||
|
Other
|
20
|
|
23
|
|
|||
|
Total investments and other assets
|
940
|
|
3,548
|
|
|||
|
Property, Plant and Equipment
|
|
|
|||||
|
Cost
|
7,750
|
|
7,141
|
|
|||
|
Accumulated depreciation and amortization
|
(2,507
|
)
|
(2,213
|
)
|
|||
|
Generation facilities to be retired, net
|
—
|
|
9
|
|
|||
|
Net property, plant and equipment
|
5,243
|
|
4,937
|
|
|||
|
Regulatory Assets and Deferred Debits
|
|
|
|||||
|
Regulatory assets
|
497
|
|
512
|
|
|||
|
Other
|
2
|
|
2
|
|
|||
|
Total regulatory assets and deferred debits
|
499
|
|
514
|
|
|||
|
Total Assets
|
$
|
7,097
|
|
$
|
9,993
|
|
|
|
LIABILITIES AND EQUITY
|
|
|
|||||
|
Current Liabilities
|
|
|
|||||
|
Accounts payable
|
$
|
207
|
|
$
|
209
|
|
|
|
Accounts payable to affiliated companies
|
53
|
|
74
|
|
|||
|
Notes payable to affiliated companies
|
103
|
|
491
|
|
|||
|
Taxes accrued
|
171
|
|
163
|
|
|||
|
Interest accrued
|
18
|
|
19
|
|
|||
|
Current maturities of long-term debt
|
106
|
|
157
|
|
|||
|
Liabilities associated with assets held for sale
|
—
|
|
246
|
|
|||
|
Regulatory liabilities
|
12
|
|
10
|
|
|||
|
Other
|
153
|
|
66
|
|
|||
|
Total current liabilities
|
823
|
|
1,435
|
|
|||
|
Long-Term Debt
|
1,467
|
|
1,578
|
|
|||
|
Long-Term Debt Payable to Affiliated Companies
|
25
|
|
25
|
|
|||
|
Deferred Credits and Other Liabilities
|
|
|
|||||
|
Deferred income taxes
|
1,407
|
|
1,765
|
|
|||
|
Accrued pension and other post-retirement benefit costs
|
56
|
|
48
|
|
|||
|
Liabilities associated with assets held for sale
|
—
|
|
34
|
|
|||
|
Asset retirement obligations
|
125
|
|
27
|
|
|||
|
Regulatory liabilities
|
245
|
|
241
|
|
|||
|
Other
|
165
|
|
166
|
|
|||
|
Total deferred credits and other liabilities
|
1,998
|
|
2,281
|
|
|||
|
Commitments and Contingencies
|
|||||||
|
Equity
|
|
|
|||||
|
Common stock, $8.50 par value, 120,000,000 shares authorized; 89,663,086 shares outstanding at December 31, 2015 and 2014
|
762
|
|
762
|
|
|||
|
Additional paid-in capital
|
2,720
|
|
4,782
|
|
|||
|
Accumulated deficit
|
(698
|
)
|
(870
|
)
|
|||
|
Total equity
|
2,784
|
|
4,674
|
|
|||
|
Total Liabilities and Equity
|
$
|
7,097
|
|
$
|
9,993
|
|
|
See Notes to Consolidated Financial Statements
108
PART II
DUKE ENERGY OHIO, INC.
CONSOLIDATED STATEMENTS OF CASH FLOWS
|
|
Years Ended December 31,
|
||||||||||
|
(in millions)
|
2015
|
|
2014
|
|
2013
|
|
|||||
|
CASH FLOWS FROM OPERATING ACTIVITIES
|
|
|
|
||||||||
|
Net income (loss)
|
$
|
172
|
|
$
|
(495
|
)
|
$
|
102
|
|
||
|
Adjustments to reconcile net income (loss) to net cash provided by operating activities:
|
|
|
|
||||||||
|
Depreciation, amortization and accretion
|
230
|
|
258
|
|
357
|
|
|||||
|
Equity component of AFUDC
|
(3
|
)
|
(4
|
)
|
(1
|
)
|
|||||
|
Gains on sales of other assets and other, net
|
(8
|
)
|
(1
|
)
|
(5
|
)
|
|||||
|
Impairment charges
|
40
|
|
941
|
|
5
|
|
|||||
|
Deferred income taxes
|
206
|
|
(219
|
)
|
98
|
|
|||||
|
Accrued pension and other post-retirement benefit costs
|
9
|
|
8
|
|
17
|
|
|||||
|
Contributions to qualified pension plans
|
(8
|
)
|
—
|
|
—
|
|
|||||
|
Payments for asset retirement obligations
|
(4
|
)
|
—
|
|
—
|
|
|||||
|
(Increase) decrease in
|
|
|
|
||||||||
|
Net realized and unrealized mark-to-market and hedging transactions
|
(10
|
)
|
27
|
|
17
|
|
|||||
|
Receivables
|
23
|
|
(56
|
)
|
(15
|
)
|
|||||
|
Receivables from affiliated companies
|
23
|
|
14
|
|
(39
|
)
|
|||||
|
Inventory
|
—
|
|
8
|
|
(3
|
)
|
|||||
|
Other current assets
|
—
|
|
(5
|
)
|
(1
|
)
|
|||||
|
Increase (decrease) in
|
|
|
|
||||||||
|
Accounts payable
|
(1
|
)
|
27
|
|
13
|
|
|||||
|
Accounts payable to affiliated companies
|
(21
|
)
|
(3
|
)
|
15
|
|
|||||
|
Taxes accrued
|
(21
|
)
|
(9
|
)
|
1
|
|
|||||
|
Other current liabilities
|
88
|
|
27
|
|
14
|
|
|||||
|
Other assets
|
25
|
|
(4
|
)
|
(6
|
)
|
|||||
|
Other liabilities
|
(73
|
)
|
(33
|
)
|
(73
|
)
|
|||||
|
Net cash provided by operating activities
|
667
|
|
481
|
|
496
|
|
|||||
|
CASH FLOWS FROM INVESTING ACTIVITIES
|
|
|
|
||||||||
|
Capital expenditures
|
(399
|
)
|
(322
|
)
|
(434
|
)
|
|||||
|
Net proceeds from the sales of other assets
|
—
|
|
—
|
|
11
|
|
|||||
|
Notes receivable from affiliated companies
|
145
|
|
(88
|
)
|
(56
|
)
|
|||||
|
Other
|
(15
|
)
|
(12
|
)
|
1
|
|
|||||
|
Net cash used in investing activities
|
(269
|
)
|
(422
|
)
|
(478
|
)
|
|||||
|
CASH FLOWS FROM FINANCING ACTIVITIES
|
|
|
|
||||||||
|
Proceeds from the issuance of long-term debt
|
—
|
|
—
|
|
450
|
|
|||||
|
Payments for the redemption of long-term debt
|
(157
|
)
|
(449
|
)
|
(258
|
)
|
|||||
|
Notes payable to affiliated companies
|
(95
|
)
|
473
|
|
(202
|
)
|
|||||
|
Dividends to parent
|
(150
|
)
|
(100
|
)
|
—
|
|
|||||
|
Other
|
(2
|
)
|
1
|
|
(3
|
)
|
|||||
|
Net cash used in financing activities
|
(404
|
)
|
(75
|
)
|
(13
|
)
|
|||||
|
Net (decrease) increase in cash and cash equivalents
|
(6
|
)
|
(16
|
)
|
5
|
|
|||||
|
Cash and cash equivalents at beginning of period
|
20
|
|
36
|
|
31
|
|
|||||
|
Cash and cash equivalents at end of period
|
14
|
|
20
|
|
36
|
|
|||||
|
Supplemental Disclosures:
|
|
|
|
||||||||
|
Cash paid for interest, net of amount capitalized
|
$
|
76
|
|
$
|
76
|
|
$
|
71
|
|
||
|
Cash paid for (received from) income taxes
|
410
|
|
(5
|
)
|
9
|
|
|||||
|
Significant non-cash transactions:
|
|
|
|
||||||||
|
Accrued capital expenditures
|
20
|
|
24
|
|
27
|
|
|||||
|
Distribution of membership interest of Duke Energy SAM, LLC to parent
|
1,912
|
|
—
|
|
—
|
|
|||||
See Notes to Consolidated Financial Statements
109
PART II
DUKE ENERGY OHIO, INC.
CONSOLIDATED STATEMENTS OF CHANGES IN EQUITY
|
Accumulated
|
|
||||||||||||||||||
|
Other
|
|
||||||||||||||||||
|
Comprehensive
|
|
||||||||||||||||||
|
|
|
|
|
Loss
|
|
|
|||||||||||||
|
Additional
|
|
Pension and
|
|
||||||||||||||||
|
Common
|
|
Paid-in
|
|
Accumulated
|
|
OPEB Related
|
|
Total
|
|
||||||||||
|
(in millions)
|
Stock
|
|
Capital
|
|
Deficit
|
|
Adjustments
|
|
Equity
|
|
|||||||||
|
Balance at December 31, 2012
|
$
|
762
|
|
$
|
4,882
|
|
$
|
(477
|
)
|
$
|
(1
|
)
|
$
|
5,166
|
|
||||
|
Net income
|
—
|
|
—
|
|
102
|
|
—
|
|
102
|
|
|||||||||
|
Other comprehensive income
|
—
|
|
—
|
|
—
|
|
1
|
|
1
|
|
|||||||||
|
Balance at December 31, 2013
|
$
|
762
|
|
$
|
4,882
|
|
$
|
(375
|
)
|
$
|
—
|
|
$
|
5,269
|
|
||||
|
Net loss
|
—
|
|
—
|
|
(495
|
)
|
—
|
|
(495
|
)
|
|||||||||
|
Dividends to parent
|
—
|
|
(100
|
)
|
—
|
|
—
|
|
(100
|
)
|
|||||||||
|
Balance at December 31, 2014
|
$
|
762
|
|
$
|
4,782
|
|
$
|
(870
|
)
|
$
|
—
|
|
$
|
4,674
|
|
||||
|
Net income
|
—
|
|
—
|
|
172
|
|
—
|
|
172
|
|
|||||||||
|
Dividends to parent
|
—
|
|
(150
|
)
|
—
|
|
—
|
|
(150
|
)
|
|||||||||
|
Distribution of membership interest of Duke Energy SAM, LLC to parent
|
—
|
|
(1,912
|
)
|
—
|
|
—
|
|
(1,912
|
)
|
|||||||||
|
Balance at December 31, 2015
|
$
|
762
|
|
$
|
2,720
|
|
$
|
(698
|
)
|
—
|
|
$
|
2,784
|
|
|||||
See Notes to Consolidated Financial Statements
110
PART II
REPORT OF INDEPENDENT REGISTERED PUBLIC ACCOUNTING FIRM
To the Board of Directors of
Duke Energy Indiana, LLC
Charlotte, North Carolina
We have audited the accompanying consolidated balance sheets of Duke Energy Indiana, Inc. and subsidiary (the "Company") (subsequently Duke Energy Indiana, LLC and subsidiary effective as of January 1, 2016) as of December 31, 2015 and 2014, and the related consolidated statements of operations and comprehensive income, changes in equity, and cash flows for each of the three years in the period ended December 31, 2015. These financial statements are the responsibility of the Company's management. Our responsibility is to express an opinion on these financial statements based on our audits.
We conducted our audits in accordance with the standards of the Public Company Accounting Oversight Board (United States). Those standards require that we plan and perform the audit to obtain reasonable assurance about whether the financial statements are free of material misstatement. The Company is not required to have, nor were we engaged to perform, an audit of its internal control over financial reporting. Our audits included consideration of internal control over financial reporting as a basis for designing audit procedures that are appropriate in the circumstances, but not for the purpose of expressing an opinion on the effectiveness of the Company's internal control over financial reporting. Accordingly, we express no such opinion. An audit also includes examining, on a test basis, evidence supporting the amounts and disclosures in the financial statements, assessing the accounting principles used and significant estimates made by management, as well as evaluating the overall financial statement presentation. We believe that our audits provide a reasonable basis for our opinion.
In our opinion, the consolidated financial statements referred to above present fairly, in all material respects, the financial position of Duke Energy Indiana, Inc. and subsidiary at December 31, 2015 and 2014, and the results of their operations and their cash flows for each of the three years in the period ended December 31, 2015, in conformity with accounting principles generally accepted in the United States of America.
As discussed in Note 22 to the consolidated financial statements, Duke Energy Indiana, Inc. and subsidiary adopted ASU 2015-17, Income Taxes (Topic 740); Balance Sheet Classification of Deferred Taxes effective December 31, 2015 on a prospective basis.
/s/ Deloitte & Touche LLP
Charlotte, North Carolina
February 25, 2016
111
PART II
DUKE ENERGY INDIANA, INC. (subsequently DUKE ENERGY INDIANA, LLC)
CONSOLIDATED STATEMENTS OF OPERATIONS AND COMPREHENSIVE INCOME
|
|
Years Ended December 31,
|
||||||||||
|
(in millions)
|
2015
|
|
2014
|
|
2013
|
|
|||||
|
Operating Revenues
|
$
|
2,890
|
|
$
|
3,175
|
|
$
|
2,926
|
|
||
|
Operating Expenses
|
|
|
|
||||||||
|
Fuel used in electric generation and purchased power
|
982
|
|
1,259
|
|
1,131
|
|
|||||
|
Operation, maintenance and other
|
682
|
|
670
|
|
649
|
|
|||||
|
Depreciation and amortization
|
434
|
|
413
|
|
342
|
|
|||||
|
Property and other taxes
|
61
|
|
128
|
|
71
|
|
|||||
|
Impairment charges
|
88
|
|
—
|
|
—
|
|
|||||
|
Total operating expenses
|
2,247
|
|
2,470
|
|
2,193
|
|
|||||
|
Gains on Sales of Other Assets and Other, net
|
1
|
|
—
|
|
—
|
|
|||||
|
Operating Income
|
644
|
|
705
|
|
733
|
|
|||||
|
Other Income and Expenses, net
|
11
|
|
22
|
|
18
|
|
|||||
|
Interest Expense
|
176
|
|
171
|
|
170
|
|
|||||
|
Income Before Income Taxes
|
479
|
|
|
556
|
|
|
581
|
|
|||
|
Income Tax Expense
|
163
|
|
197
|
|
223
|
|
|||||
|
Net Income
|
$
|
316
|
|
|
$
|
359
|
|
|
$
|
358
|
|
|
Other Comprehensive Loss, net of tax
|
|
|
|
||||||||
|
Reclassification into earnings from cash flow hedges
|
(2
|
)
|
—
|
|
(2
|
)
|
|||||
|
Comprehensive Income
|
$
|
314
|
|
|
$
|
359
|
|
|
$
|
356
|
|
See Notes to Consolidated Financial Statements
112
PART II
DUKE ENERGY INDIANA, INC. (subsequently DUKE ENERGY INDIANA, LLC)
CONSOLIDATED BALANCE SHEETS
|
|
December 31,
|
||||||
|
(in millions)
|
2015
|
|
2014
|
|
|||
|
ASSETS
|
|
|
|||||
|
Current Assets
|
|
|
|||||
|
Cash and cash equivalents
|
$
|
9
|
|
$
|
6
|
|
|
|
Receivables (net of allowance for doubtful accounts of $1 at December 31, 2015 and December 31, 2014)
|
96
|
|
87
|
|
|||
|
Receivables from affiliated companies
|
71
|
|
115
|
|
|||
|
Notes receivable from affiliated companies
|
83
|
|
—
|
|
|||
|
Inventory
|
570
|
|
|
537
|
|
||
|
Regulatory assets
|
102
|
|
93
|
|
|||
|
Other
|
15
|
|
326
|
|
|||
|
Total current assets
|
946
|
|
1,164
|
|
|||
|
Investments and Other Assets
|
212
|
|
251
|
|
|||
|
Property, Plant and Equipment
|
|
|
|||||
|
Cost
|
14,007
|
|
13,034
|
|
|||
|
Accumulated depreciation and amortization
|
(4,484
|
)
|
(4,219
|
)
|
|||
|
Net property, plant and equipment
|
9,523
|
|
8,815
|
|
|||
|
Regulatory Assets and Deferred Debits
|
|
|
|||||
|
Regulatory assets
|
716
|
|
685
|
|
|||
|
Other
|
2
|
|
2
|
|
|||
|
Total regulatory assets and deferred debits
|
718
|
|
687
|
|
|||
|
Total Assets
|
$
|
11,399
|
|
$
|
10,917
|
|
|
|
LIABILITIES AND EQUITY
|
|
|
|||||
|
Current Liabilities
|
|
|
|||||
|
Accounts payable
|
$
|
189
|
|
$
|
179
|
|
|
|
Accounts payable to affiliated companies
|
83
|
|
58
|
|
|||
|
Notes payable to affiliated companies
|
—
|
|
71
|
|
|||
|
Taxes accrued
|
89
|
|
54
|
|
|||
|
Interest accrued
|
56
|
|
56
|
|
|||
|
Current maturities of long-term debt
|
547
|
|
5
|
|
|||
|
Regulatory liabilities
|
62
|
|
54
|
|
|||
|
Other
|
97
|
|
98
|
|
|||
|
Total current liabilities
|
1,123
|
|
575
|
|
|||
|
Long-Term Debt
|
3,071
|
|
3,614
|
|
|||
|
Long-Term Debt Payable to Affiliated Companies
|
150
|
|
150
|
|
|||
|
Deferred Credits and Other Liabilities
|
|
|
|||||
|
Deferred income taxes
|
1,657
|
|
1,591
|
|
|||
|
Investment tax credits
|
138
|
|
139
|
|
|||
|
Accrued pension and other post-retirement benefit costs
|
80
|
|
82
|
|
|||
|
Asset retirement obligations
|
525
|
|
32
|
|
|||
|
Regulatory liabilities
|
754
|
|
796
|
|
|||
|
Other
|
65
|
|
90
|
|
|||
|
Total deferred credits and other liabilities
|
3,219
|
|
2,730
|
|
|||
|
Commitments and Contingencies
|
|
|
|||||
|
Equity
|
|
|
|||||
|
Common Stock, no par; $0.01 stated value, 60,000,000 shares authorized; 53,913,701 shares outstanding at December 31, 2015 and December 31, 2014
|
1
|
|
1
|
|
|||
|
Additional paid-in capital
|
1,384
|
|
1,384
|
|
|||
|
Retained earnings
|
2,450
|
|
2,460
|
|
|||
|
Accumulated other comprehensive income
|
1
|
|
3
|
|
|||
|
Total equity
|
3,836
|
|
3,848
|
|
|||
|
Total Liabilities and Equity
|
$
|
11,399
|
|
$
|
10,917
|
|
|
See Notes to Consolidated Financial Statements
113
PART II
DUKE ENERGY INDIANA, INC. (subsequently DUKE ENERGY INDIANA, LLC)
CONSOLIDATED STATEMENTS OF CASH FLOWS
|
Years Ended December 31,
|
|||||||||||
|
(in millions)
|
2015
|
|
2014
|
|
2013
|
|
|||||
|
CASH FLOWS FROM OPERATING ACTIVITIES
|
|
|
|
||||||||
|
Net income
|
$
|
316
|
|
$
|
359
|
|
$
|
358
|
|
||
|
Adjustments to reconcile net income to net cash provided by operating activities:
|
|
|
|
||||||||
|
Depreciation and amortization
|
439
|
|
416
|
|
346
|
|
|||||
|
Equity component of AFUDC
|
(11
|
)
|
(14
|
)
|
(15
|
)
|
|||||
|
Gains on sales of other assets and other, net
|
(1
|
)
|
—
|
|
—
|
|
|||||
|
Impairment charges
|
88
|
|
—
|
|
—
|
|
|||||
|
Deferred income taxes
|
262
|
|
308
|
|
304
|
|
|||||
|
Accrued pension and other post-retirement benefit costs
|
13
|
|
16
|
|
25
|
|
|||||
|
Contributions to qualified pension plans
|
(19
|
)
|
—
|
|
—
|
|
|||||
|
Payments for asset retirement obligations
|
(19
|
)
|
—
|
|
—
|
|
|||||
|
(Increase) decrease in
|
|
|
|
||||||||
|
Net realized and unrealized mark-to-market and hedging transactions
|
—
|
|
—
|
|
(30
|
)
|
|||||
|
Receivables
|
(7
|
)
|
(35
|
)
|
3
|
|
|||||
|
Receivables from affiliated companies
|
44
|
|
36
|
|
(47
|
)
|
|||||
|
Inventory
|
(21
|
)
|
(103
|
)
|
(53
|
)
|
|||||
|
Other current assets
|
90
|
|
(8
|
)
|
(40
|
)
|
|||||
|
Increase (decrease) in
|
|
|
|
||||||||
|
Accounts payable
|
33
|
|
(41
|
)
|
32
|
|
|||||
|
Accounts payable to affiliated companies
|
25
|
|
2
|
|
(4
|
)
|
|||||
|
Taxes accrued
|
35
|
|
(32
|
)
|
(30
|
)
|
|||||
|
Other current liabilities
|
26
|
|
5
|
|
(5
|
)
|
|||||
|
Other assets
|
(82
|
)
|
(21
|
)
|
(16
|
)
|
|||||
|
Other liabilities
|
(35
|
)
|
17
|
|
(84
|
)
|
|||||
|
Net cash provided by operating activities
|
1,176
|
|
905
|
|
744
|
|
|||||
|
CASH FLOWS FROM INVESTING ACTIVITIES
|
|
|
|
||||||||
|
Capital expenditures
|
(690
|
)
|
(625
|
)
|
(545
|
)
|
|||||
|
Purchases of available-for-sale securities
|
(9
|
)
|
(20
|
)
|
(11
|
)
|
|||||
|
Proceeds from sales and maturities of available-for-sale securities
|
11
|
|
16
|
|
7
|
|
|||||
|
Proceeds from the sales of other assets
|
17
|
|
—
|
|
—
|
|
|||||
|
Notes receivable from affiliated companies
|
(83
|
)
|
96
|
|
(96
|
)
|
|||||
|
Other
|
(17
|
)
|
4
|
|
(3
|
)
|
|||||
|
Net cash used in investing activities
|
(771
|
)
|
(529
|
)
|
(648
|
)
|
|||||
|
CASH FLOWS FROM FINANCING ACTIVITIES
|
|
|
|
||||||||
|
Proceeds from the issuance of long-term debt
|
—
|
|
—
|
|
498
|
|
|||||
|
Payments for the redemption of long-term debt
|
(5
|
)
|
(5
|
)
|
(405
|
)
|
|||||
|
Notes payable to affiliated companies
|
(71
|
)
|
71
|
|
(81
|
)
|
|||||
|
Dividends to parent
|
(326
|
)
|
(450
|
)
|
(125
|
)
|
|||||
|
Other
|
—
|
|
(1
|
)
|
(4
|
)
|
|||||
|
Net cash used in financing activities
|
(402
|
)
|
(385
|
)
|
(117
|
)
|
|||||
|
Net increase (decrease) in cash and cash equivalents
|
3
|
|
(9
|
)
|
(21
|
)
|
|||||
|
Cash and cash equivalents at beginning of period
|
6
|
|
15
|
|
36
|
|
|||||
|
Cash and cash equivalents at end of period
|
$
|
9
|
|
$
|
6
|
|
$
|
15
|
|
||
|
Supplemental Disclosures:
|
|
|
|
||||||||
|
Cash paid for interest, net of amount capitalized
|
$
|
175
|
|
$
|
169
|
|
$
|
194
|
|
||
|
Cash (received from) paid for income taxes
|
(253
|
)
|
(61
|
)
|
46
|
|
|||||
|
Significant non-cash transactions:
|
|||||||||||
|
Accrued capital expenditures
|
64
|
|
87
|
|
73
|
|
|||||
See Notes to Consolidated Financial Statements
114
PART II
DUKE ENERGY INDIANA, INC. (subsequently DUKE ENERGY INDIANA, LLC)
CONSOLIDATED STATEMENTS OF CHANGES IN EQUITY
|
|
|
|
|
Accumulated Other
|
|
|
|||||||||||||
|
Comprehensive
|
|
||||||||||||||||||
|
Income
|
|
||||||||||||||||||
|
Additional
|
|
Net Gains
|
|
||||||||||||||||
|
Common
|
|
Paid-in
|
|
Retained
|
|
on Cash
|
|
Total
|
|
||||||||||
|
(in millions)
|
Stock
|
|
Capital
|
|
Earnings
|
|
Flow Hedges
|
|
Equity
|
|
|||||||||
|
Balance at December 31, 2012
|
$
|
1
|
|
$
|
1,384
|
|
$
|
2,318
|
|
$
|
5
|
|
$
|
3,708
|
|
||||
|
Net income
|
—
|
|
—
|
|
358
|
|
—
|
|
358
|
|
|||||||||
|
Other comprehensive loss
|
—
|
|
—
|
|
—
|
|
(2
|
)
|
(2
|
)
|
|||||||||
|
Dividend to parent
|
—
|
|
—
|
|
(125
|
)
|
—
|
|
(125
|
)
|
|||||||||
|
Balance at December 31, 2013
|
$
|
1
|
|
|
$
|
1,384
|
|
|
$
|
2,551
|
|
|
$
|
3
|
|
|
$
|
3,939
|
|
|
Net income
|
—
|
|
—
|
|
359
|
|
—
|
|
359
|
|
|||||||||
|
Dividend to parent
|
—
|
|
—
|
|
(450
|
)
|
—
|
|
(450
|
)
|
|||||||||
|
Balance at December 31, 2014
|
$
|
1
|
|
|
$
|
1,384
|
|
|
$
|
2,460
|
|
|
$
|
3
|
|
|
$
|
3,848
|
|
|
Net income
|
—
|
|
—
|
|
316
|
|
—
|
|
316
|
|
|||||||||
|
Other comprehensive loss
|
—
|
|
—
|
|
—
|
|
(2
|
)
|
(2
|
)
|
|||||||||
|
Dividends to parent
|
—
|
|
—
|
|
(326
|
)
|
—
|
|
(326
|
)
|
|||||||||
|
Balance at December 31, 2015
|
$
|
1
|
|
|
$
|
1,384
|
|
|
$
|
2,450
|
|
|
$
|
1
|
|
|
$
|
3,836
|
|
See Notes to Consolidated Financial Statements
115
PART II
DUKE ENERGY CORPORATION – DUKE ENERGY CAROLINAS, LLC – PROGRESS ENERGY, INC. –
DUKE ENERGY PROGRESS, INC. – DUKE ENERGY FLORIDA, INC. – DUKE ENERGY OHIO, INC. – DUKE ENERGY INDIANA, INC.
Combined Notes To Consolidated Financial Statements
For the Years Ended December 31, 2015, 2014 and 2013
Index to Combined Notes To Consolidated Financial Statements
The notes to the consolidated financial statements are a combined presentation. The following list indicates the registrants to which the notes apply. Tables within the notes may not sum across due to Progress Energy's consolidation of Duke Energy Progress, Duke Energy Florida and other subsidiaries that are not registrants as the Duke Energy amounts include balances from subsidiaries that are not registrants.
|
|
Applicable Notes
|
||||||||||||||||||||||||
|
Registrant
|
1
|
2
|
3
|
4
|
5
|
6
|
7
|
8
|
9
|
10
|
11
|
12
|
13
|
14
|
15
|
16
|
17
|
18
|
19
|
20
|
21
|
22
|
23
|
24
|
25
|
|
Duke Energy Corporation
|
•
|
•
|
•
|
•
|
•
|
•
|
•
|
•
|
•
|
•
|
•
|
•
|
|
•
|
•
|
•
|
•
|
•
|
•
|
•
|
•
|
•
|
•
|
•
|
•
|
|
Duke Energy Carolinas, LLC
|
•
|
•
|
•
|
•
|
•
|
|
•
|
•
|
•
|
•
|
|
•
|
•
|
•
|
•
|
•
|
|
•
|
•
|
•
|
•
|
•
|
•
|
•
|
|
|
Progress Energy, Inc.
|
•
|
•
|
•
|
•
|
•
|
•
|
•
|
•
|
•
|
•
|
•
|
|
•
|
•
|
•
|
•
|
•
|
|
•
|
•
|
•
|
•
|
•
|
•
|
•
|
|
Duke Energy Progress, LLC
|
•
|
•
|
•
|
•
|
•
|
•
|
|
•
|
•
|
•
|
•
|
|
•
|
•
|
•
|
•
|
•
|
|
•
|
•
|
•
|
•
|
•
|
•
|
•
|
|
Duke Energy Florida, LLC
|
•
|
•
|
•
|
•
|
•
|
•
|
•
|
•
|
•
|
•
|
|
•
|
•
|
•
|
•
|
•
|
|
•
|
•
|
•
|
•
|
•
|
•
|
•
|
|
|
Duke Energy Ohio, Inc.
|
•
|
•
|
•
|
•
|
•
|
•
|
|
•
|
•
|
•
|
•
|
|
•
|
•
|
|
•
|
•
|
|
•
|
•
|
•
|
•
|
•
|
•
|
•
|
|
Duke Energy Indiana, Inc.
|
•
|
•
|
•
|
•
|
•
|
|
•
|
•
|
•
|
•
|
|
•
|
•
|
•
|
•
|
•
|
|
•
|
•
|
•
|
•
|
•
|
•
|
•
|
|
1. SUMMARY OF SIGNIFICANT ACCOUNTING POLICIES
Nature of Operations and Basis of Consolidation
Duke Energy Corporation (collectively with its subsidiaries, Duke Energy) is an energy company headquartered in Charlotte, North Carolina, subject to regulation by the Federal Energy Regulatory Commission (FERC). Duke Energy operates in the United States (U.S.) and Latin America primarily through its direct and indirect subsidiaries. Duke Energy’s subsidiaries include its subsidiary registrants, Duke Energy Carolinas, LLC (Duke Energy Carolinas); Progress Energy, Inc. (Progress Energy); Duke Energy Progress, LLC (formerly Duke Energy Progress, Inc.) (Duke Energy Progress); Duke Energy Florida, LLC (formerly Duke Energy Florida, Inc.) (Duke Energy Florida); Duke Energy Ohio, Inc. (Duke Energy Ohio) and Duke Energy Indiana, Inc. (subsequently Duke Energy Indiana, LLC) (Duke Energy Indiana). When discussing Duke Energy’s consolidated financial information, it necessarily includes the results of its six separate subsidiary registrants (collectively referred to as the Subsidiary Registrants), which, along with Duke Energy, are collectively referred to as the Duke Energy Registrants (Duke Energy Registrants).
The information in these combined notes relate to each of the Duke Energy Registrants as noted in the Index to the Combined Notes to Consolidated Financial Statements. However, none of the registrants makes any representations as to information related solely to Duke Energy or the subsidiaries of Duke Energy other than itself.
These Consolidated Financial Statements include, after eliminating intercompany transactions and balances, the accounts of the Duke Energy Registrants and subsidiaries where the respective Duke Energy Registrants have control. These Consolidated Financial Statements also reflect the Duke Energy Registrants’ proportionate share of certain jointly owned generation and transmission facilities.
Duke Energy Carolinas is a regulated public utility primarily engaged in the generation, transmission, distribution and sale of electricity in portions of North Carolina and South Carolina. Duke Energy Carolinas is subject to the regulatory provisions of the North Carolina Utilities Commission (NCUC), Public Service Commission of South Carolina (PSCSC), U.S. Nuclear Regulatory Commission (NRC) and FERC. Substantially all of Duke Energy Carolinas’ operations qualify for regulatory accounting.
Progress Energy is a public utility holding company headquartered in Raleigh, North Carolina, subject to regulation by the FERC. Progress Energy conducts operations through its wholly owned subsidiaries, Duke Energy Progress and Duke Energy Florida. Substantially all of Progress Energy’s operations qualify for regulatory accounting.
Duke Energy Progress is a regulated public utility primarily engaged in the generation, transmission, distribution and sale of electricity in portions of North Carolina and South Carolina. Duke Energy Progress is subject to the regulatory provisions of the NCUC, PSCSC, NRC and FERC. Substantially all of Duke Energy Progress’ operations qualify for regulatory accounting. On August 1, 2015, Duke Energy Progress, a North Carolina corporation, converted into a North Carolina limited liability company.
Duke Energy Florida is a regulated public utility primarily engaged in the generation, transmission, distribution and sale of electricity in portions of Florida. Duke Energy Florida is subject to the regulatory provisions of the Florida Public Service Commission (FPSC), NRC and FERC. Substantially all of Duke Energy Florida’s operations qualify for regulatory accounting. On August 1, 2015, Duke Energy Florida, a Florida corporation, converted into a Florida limited liability company.
Duke Energy Ohio is a regulated public utility primarily engaged in the transmission and distribution of electricity in portions of Ohio and Kentucky, the generation and sale of electricity in portions of Kentucky and the transportation and sale of natural gas in portions of Ohio and Kentucky. Duke Energy Ohio also conducts competitive auctions for retail electricity supply in Ohio whereby recovery of the energy price is from retail customers and recorded in Operating Revenues on the Consolidated Statements of Operations and Comprehensive Income. Operations in Kentucky are conducted through its wholly owned subsidiary, Duke Energy Kentucky, Inc. (Duke Energy Kentucky). References herein to Duke Energy Ohio include Duke Energy Ohio and its subsidiaries, unless otherwise noted. Duke Energy Ohio is subject to the regulatory provisions of the Public Utilities Commission of Ohio (PUCO), Kentucky Public Service Commission (KPSC) and FERC. On April 2, 2015, Duke Energy completed the sale of its nonregulated Midwest generation business, which sold power into wholesale energy markets, to a subsidiary of Dynegy Inc. (Dynegy). For further information about the sale of the Midwest Generation business, refer to Note
2
"Acquisitions and Dispositions." Substantially all of Duke Energy Ohio's operations that remain after the sale qualify for regulatory accounting.
116
PART II
DUKE ENERGY CORPORATION - DUKE ENERGY CAROLINAS, LLC - PROGRESS ENERGY, INC. –
DUKE ENERGY PROGRESS, LLC – DUKE ENERGY FLORIDA, LLC - DUKE ENERGY OHIO, INC. - DUKE ENERGY INDIANA, INC.
Combined Notes To Consolidated Financial Statements – (Continued)
Duke Energy Indiana is a regulated public utility primarily engaged in the generation, transmission, distribution and sale of electricity in portions of Indiana. Duke Energy Indiana is subject to the regulatory provisions of the Indiana Utility Regulatory Commission (IURC) and FERC. Substantially all of Duke Energy Indiana’s operations qualify for regulatory accounting.
On January 1, 2016, Duke Energy Indiana, an Indiana corporation, converted into an Indiana limited liability company.
Certain prior year amounts have been reclassified to conform to the current year presentation.
Other Current Assets and Liabilities
The following table provides detail of amounts included in Other within Current Assets or Current Liabilities on the Consolidated Balance Sheets.
|
December 31,
|
|||||||||
|
(in millions)
|
Location
|
2015
|
|
2014
|
|
||||
|
Duke Energy
|
|||||||||
|
Accrued compensation
|
Current Liabilities
|
$
|
621
|
|
$
|
638
|
|
||
|
Duke Energy Carolinas
|
|||||||||
|
Accrued compensation
|
Current Liabilities
|
$
|
213
|
|
$
|
216
|
|
||
|
Collateral liabilities
|
Current Liabilities
|
141
|
|
128
|
|
||||
|
Progress Energy
|
|
|
|
|
|
||||
|
Income taxes receivable
|
Current Assets
|
$
|
129
|
|
$
|
718
|
|
||
|
Customer deposits
|
Current Liabilities
|
373
|
|
360
|
|
||||
|
Derivative liabilities
|
Current Liabilities
|
201
|
|
271
|
|
||||
|
Duke Energy Progress
|
|
|
|
|
|
||||
|
Income taxes receivable
|
Current Assets
|
$
|
111
|
|
$
|
272
|
|
||
|
Customer deposits
|
Current Liabilities
|
141
|
|
135
|
|
||||
|
Accrued compensation
|
Current Liabilities
|
108
|
|
116
|
|
||||
|
Derivative liabilities
|
Current Liabilities
|
76
|
|
108
|
|
||||
|
Duke Energy Florida
|
|
|
|
|
|
||||
|
Income taxes receivable
|
Current Assets
|
$
|
—
|
|
$
|
177
|
|
||
|
Customer deposits
|
Current Liabilities
|
232
|
|
225
|
|
||||
|
Derivative liabilities
|
Current Liabilities
|
125
|
|
163
|
|
||||
|
Duke Energy Ohio
|
|
|
|
|
|
||||
|
Income taxes receivable
|
Current Assets
|
$
|
59
|
|
$
|
40
|
|
||
|
Other receivable
|
Current Assets
|
33
|
|
39
|
|
||||
|
Accrued litigation reserve
|
Current Liabilities
|
80
|
|
—
|
|
||||
|
Collateral Liabilities
|
Current Liabilities
|
48
|
|
$
|
42
|
|
|||
|
Duke Energy Indiana
|
|
|
|
||||||
|
Income taxes receivable
|
Current Assets
|
$
|
—
|
|
$
|
98
|
|
||
|
Collateral liabilities
|
Current Liabilities
|
44
|
|
43
|
|
||||
The current portion of deferred tax assets is included within Other in Current Assets at December 31, 2014. Due to the adoption of new accounting guidance issued by the Financial Accounting Standards Board (FASB) related to the balance sheet classification of deferred taxes, all deferred tax assets and liabilities are classified as noncurrent at December 31, 2015. See Note
22
for information related to the presentation of deferred tax assets and liabilities on the Consolidated Balance Sheets.
Discontinued Operations
The results of operations of the nonregulated Midwest generation business have been classified as Discontinued Operations on the Consolidated Statements of Operations. Duke Energy has elected to present cash flows of discontinued operations combined with cash flows of continuing operations. Unless otherwise noted, the notes to these consolidated financial statements exclude amounts related to discontinued operations for all periods presented, assets held for sale and liabilities associated with assets held for sale as of December 31, 2014. See Note
2
for additional information.
For the year ended December 31, 2015, Duke Energy's Income from Discontinued Operations, net of tax was primarily related to results of operations of the nonregulated Midwest generation business and Duke Energy Retail Sales, LLC (collectively, the Disposal Group) prior to its sale on April 2, 2015, partially offset by a charge for a litigation reserve related to the Disposal Group. For the year ended December 31, 2014, Duke Energy’s Loss from Discontinued Operations, net of tax was primarily related to a write-down of the carrying amount of the assets to the estimated fair value of the Disposal Group, based on the transaction price included in the purchase sale agreement, and the operations of the Disposal Group. For the years ended December 31, 2013, Duke Energy’s Income From Discontinued Operations, net of tax was primarily related to the operations of the Disposal Group. See Note
2
for additional information.
117
PART II
DUKE ENERGY CORPORATION - DUKE ENERGY CAROLINAS, LLC - PROGRESS ENERGY, INC. –
DUKE ENERGY PROGRESS, LLC – DUKE ENERGY FLORIDA, LLC - DUKE ENERGY OHIO, INC. - DUKE ENERGY INDIANA, INC.
Combined Notes To Consolidated Financial Statements – (Continued)
For the years ended
December 31, 2015
, 2014 and 2013, Progress Energy’s (Loss) Income From Discontinued Operations, net of tax was primarily due to tax impacts related to prior sales of diversified businesses.
Amounts Attributable to Controlling Interests
For the year ended December 31, 2015, the amount of Income from Discontinued Operations, net of tax presented on the Consolidated Statements of Operations is fully attributable to controlling interests.
During 2014, Duke Energy and Progress Energy's amount of Income (Loss) from Discontinued Operations, net of tax presented on the Consolidated Statements of Operations includes amounts attributable to noncontrolling interest. The following table presents Net Income Attributable to Duke Energy Corporation for continuing operations and discontinued operations for the years ended December 31, 2014 and 2013.
|
Years ended December 31,
|
|||||||||||||
|
2014
|
2013
|
||||||||||||
|
Duke
|
|
Progress
|
|
Duke
|
|
Progress
|
|
||||||
|
(in millions)
|
Energy
|
|
Energy
|
|
Energy
|
|
Energy
|
|
|||||
|
Income from Continuing Operations
|
$
|
2,465
|
|
$
|
880
|
|
2,590
|
|
659
|
|
|||
|
Income from Continuing Operations Attributable to Noncontrolling Interests
|
14
|
|
5
|
|
|
16
|
|
3
|
|
||||
|
Income from Continuing Operations Attributable to Duke Energy Corporation
|
$
|
2,451
|
|
$
|
875
|
|
|
$
|
2,574
|
|
$
|
656
|
|
|
(Loss) Income From Discontinued Operations, net of tax
|
$
|
(576
|
)
|
$
|
(6
|
)
|
86
|
|
16
|
|
|||
|
Loss from Discontinued Operations Attributable to Noncontrolling Interests, net of tax
|
(8
|
)
|
—
|
|
(5
|
)
|
—
|
|
|||||
|
(Loss) Income From Discontinued Operations Attributable to Duke Energy Corporation, net of tax
|
$
|
(568
|
)
|
$
|
(6
|
)
|
|
$
|
91
|
|
$
|
16
|
|
|
Net Income
|
$
|
1,889
|
|
$
|
874
|
|
|
$
|
2,676
|
|
$
|
675
|
|
|
Net Income Attributable to Noncontrolling Interests
|
6
|
|
5
|
|
11
|
|
3
|
|
|||||
|
Net Income Attributable to Duke Energy Corporation
|
$
|
1,883
|
|
$
|
869
|
|
|
$
|
2,665
|
|
$
|
672
|
|
Significant Accounting Policies
Use of Estimates
In preparing financial statements that conform to generally accepted accounting principles (GAAP) in the U.S., the Duke Energy Registrants must make estimates and assumptions that affect the reported amounts of assets and liabilities, the reported amounts of revenues and expenses and the disclosure of contingent assets and liabilities at the date of the financial statements. Actual results could differ from those estimates.
Regulatory Accounting
The majority of the Duke Energy Registrants’ operations are subject to price regulation for the sale of electricity and gas by state utility commissions or FERC. When prices are set on the basis of specific costs of the regulated operations and an effective franchise is in place such that sufficient gas or electric services can be sold to recover those costs, the Duke Energy Registrants apply regulatory accounting. Regulatory accounting changes the timing of the recognition of costs or revenues relative to a company that does not apply regulatory accounting. As a result, Regulatory assets and Regulatory liabilities are recognized on the Consolidated Balance Sheets. Regulatory assets and liabilities are amortized consistent with the treatment of the related cost in the ratemaking process. See Note
4
for further information.
Regulatory accounting rules also require recognition of a disallowance (also called "impairment") loss if it becomes probable that part of the cost of a plant under construction (or a recently completed plant or an abandoned plant) will be disallowed for ratemaking purposes and a reasonable estimate of the amount of the disallowance can be made. Other disallowances can require judgments on allowed future rate recovery.
When it becomes probable that regulated generation, transmission or distribution assets will be abandoned, the cost of the asset is removed from plant in service. The value that may be retained as a regulatory asset on the balance sheet for the abandoned property is dependent upon amounts that may be recovered through regulated rates, including any return. As such, an impairment charge could be offset by the establishment of a regulatory asset if rate recovery is probable. The impairment for a disallowance of costs for regulated plants under construction, recently completed or abandoned is based on discounted cash flows.
Regulated Fuel Costs and Purchased Power
The Duke Energy Registrants utilize cost-tracking mechanisms, commonly referred to as fuel adjustment clauses. These clauses allow for the recovery of fuel and fuel-related costs and portions of purchased power costs through surcharges on customer rates. The difference between the costs incurred and the surcharge revenues is recorded either as an adjustment to Operating Revenues – Regulated electric or Operating Expenses – Fuel used in electric generation on the Consolidated Statements of Operations with an off-setting impact on regulatory assets or liabilities.
118
PART II
DUKE ENERGY CORPORATION - DUKE ENERGY CAROLINAS, LLC - PROGRESS ENERGY, INC. –
DUKE ENERGY PROGRESS, LLC – DUKE ENERGY FLORIDA, LLC - DUKE ENERGY OHIO, INC. - DUKE ENERGY INDIANA, INC.
Combined Notes To Consolidated Financial Statements – (Continued)
Cash and Cash Equivalents
All highly liquid investments with maturities of three months or less at the date of acquisition are considered cash equivalents. At
December 31, 2015
,
$534 million
of Duke Energy’s total cash and cash equivalents is held by entities domiciled in foreign jurisdictions. During the fourth quarter of 2014, Duke Energy declared a taxable dividend of historical foreign earnings in the form of notes payable that will result in the repatriation of approximately
$2.7 billion
in cash held and expected to be generated by International Energy over a period of up to
eight years
. Approximately
$1.5
billion was remitted in 2015. See Note
22
to the Consolidated Financial Statements, “Income Taxes,” for additional information.
Restricted Cash
The Duke Energy Registrants have restricted cash related primarily to collateral assets, escrow deposits and variable interest entities (VIEs). Restricted cash balances are reflected in Other within Current Assets and in Other within Investments and Other Assets on the Consolidated Balance Sheets. At
December 31, 2015
and
2014
, Duke Energy had restricted cash totaling
$108 million
and
$298 million
, respectively.
Inventory
Inventory is used for operations and is recorded primarily using the average cost method. Inventory related to regulated operations is valued at historical cost. Inventory related to nonregulated operations is valued at the lower of cost or market. Materials and supplies are recorded as inventory when purchased and subsequently charged to expense or capitalized to property, plant and equipment when installed. Reserves are established for excess and obsolete inventory. Inventory reserves were not material at December 31, 2015 and 2014. The components of inventory are presented in the tables below.
|
|
December 31, 2015
|
||||||||||||||||||||||||||
|
Duke
|
|
Duke
|
|
Duke
|
|
Duke
|
|
Duke
|
|
||||||||||||||||||
|
Duke
|
|
Energy
|
|
Progress
|
|
Energy
|
|
Energy
|
|
Energy
|
|
Energy
|
|
||||||||||||||
|
(in millions)
|
Energy
|
|
Carolinas
|
|
Energy
|
|
Progress
|
|
Florida
|
|
Ohio
|
|
Indiana
|
|
|||||||||||||
|
Materials and supplies
|
$
|
2,389
|
|
$
|
785
|
|
$
|
1,133
|
|
$
|
776
|
|
$
|
357
|
|
$
|
81
|
|
$
|
301
|
|
||||||
|
Coal held for electric generation
|
1,114
|
|
451
|
|
370
|
|
192
|
|
178
|
|
16
|
|
267
|
|
|||||||||||||
|
Oil, gas and other fuel held for electric generation
|
307
|
|
40
|
|
248
|
|
120
|
|
128
|
|
8
|
|
2
|
|
|||||||||||||
|
Total inventory
|
$
|
3,810
|
|
$
|
1,276
|
|
$
|
1,751
|
|
$
|
1,088
|
|
$
|
663
|
|
$
|
105
|
|
$
|
570
|
|
||||||
|
|
December 31, 2014
|
||||||||||||||||||||||||||
|
Duke
|
|
Duke
|
|
Duke
|
|
Duke
|
|
Duke
|
|
||||||||||||||||||
|
Duke
|
|
Energy
|
|
Progress
|
|
Energy
|
|
Energy
|
|
Energy
|
|
Energy
|
|
||||||||||||||
|
(in millions)
|
Energy
|
|
Carolinas
|
|
Energy
|
|
Progress
|
|
Florida
|
|
Ohio
|
|
Indiana
|
|
|||||||||||||
|
Materials and supplies
|
$
|
2,102
|
|
$
|
719
|
|
$
|
981
|
|
$
|
676
|
|
$
|
305
|
|
$
|
67
|
|
$
|
258
|
|
||||||
|
Coal held for electric generation
|
997
|
|
362
|
|
329
|
|
150
|
|
178
|
|
21
|
|
275
|
|
|||||||||||||
|
Oil, gas and other fuel held for electric generation
|
360
|
|
43
|
|
280
|
|
140
|
|
140
|
|
9
|
|
4
|
|
|||||||||||||
|
Total inventory
|
$
|
3,459
|
|
$
|
1,124
|
|
$
|
1,590
|
|
$
|
966
|
|
$
|
623
|
|
$
|
97
|
|
$
|
537
|
|
||||||
Investments in Debt and Equity Securities
The Duke Energy Registrants classify investments into two categories – trading and available-for-sale. Both categories are recorded at fair value on the Consolidated Balance Sheets. Realized and unrealized gains and losses on trading securities are included in earnings. For certain investments of regulated operations such as the Nuclear Decommissioning Trust Fund (NDTF), realized and unrealized gains and losses (including any other-than-temporary impairments) on available-for-sale securities are recorded as a regulatory asset or liability. Otherwise, unrealized gains and losses are included in Accumulated Other Comprehensive Income (AOCI), unless other-than-temporarily impaired. Other-than-temporary impairments for equity securities and the credit loss portion of debt securities of nonregulated operations are included in earnings. Investments in debt and equity securities are classified as either current or noncurrent based on management’s intent and ability to sell these securities, taking into consideration current market liquidity. See Note
15
for further information.
Goodwill and Intangible Assets
Goodwill
Duke Energy, Progress Energy and Duke Energy Ohio perform annual goodwill impairment tests as of August 31 each year at the reporting unit level, which is determined to be an operating segment or one level below. Duke Energy, Progress Energy and Duke Energy Ohio update these tests between annual tests if events or circumstances occur that would more likely than not reduce the fair value of a reporting unit below its carrying value.
119
PART II
DUKE ENERGY CORPORATION - DUKE ENERGY CAROLINAS, LLC - PROGRESS ENERGY, INC. –
DUKE ENERGY PROGRESS, LLC – DUKE ENERGY FLORIDA, LLC - DUKE ENERGY OHIO, INC. - DUKE ENERGY INDIANA, INC.
Combined Notes To Consolidated Financial Statements – (Continued)
Intangible Assets
Intangible assets are included in Other in Investments and Other Assets on the Consolidated Balance Sheets. Generally, intangible assets are amortized using an amortization method that reflects the pattern in which the economic benefits of the intangible asset are consumed, or on a straight-line basis if that pattern is not readily determinable. Amortization of intangibles is reflected in Depreciation and amortization on the Consolidated Statements of Operations. Intangible assets are subject to impairment testing and if impaired, the carrying value is accordingly reduced.
Emission allowances permit the holder of the allowance to emit certain gaseous byproducts of fossil fuel combustion, including sulfur dioxide (SO
2
) and nitrogen oxide (NO
X
). Allowances are issued by the U.S. Environmental Protection Agency (EPA) at zero cost and may also be bought and sold via third-party transactions. Allowances allocated to or acquired by the Duke Energy Registrants are held primarily for consumption. Carrying amounts for emission allowances are based on the cost to acquire the allowances or, in the case of a business combination, on the fair value assigned in the allocation of the purchase price of the acquired business. Emission allowances are expensed to Fuel used in electric generation and purchased power – regulated on the Consolidated Statements of Operations.
Renewable energy certificates are used to measure compliance with renewable energy standards and are held primarily for consumption. See Note
11
for further information.
Long-Lived Asset Impairments
The Duke Energy Registrants evaluate long-lived assets, excluding goodwill, for impairment when circumstances indicate the carrying value of those assets may not be recoverable. An impairment exists when a long-lived asset’s carrying value exceeds the estimated undiscounted cash flows expected to result from the use and eventual disposition of the asset. The estimated cash flows may be based on alternative expected outcomes that are probability weighted. If the carrying value of the long-lived asset is not recoverable based on these estimated future undiscounted cash flows, the carrying value of the asset is written-down to its then-current estimated fair value and an impairment charge is recognized.
The Duke Energy Registrants assess fair value of long-lived assets using various methods, including recent comparable third-party sales, internally developed discounted cash flow analysis and analysis from outside advisers. Significant changes in commodity prices, the condition of an asset or management’s interest in selling the asset are generally viewed as triggering events to reassess cash flows.
Property, Plant and Equipment
Property, plant and equipment are stated at the lower of depreciated historical cost net of any disallowances or fair value, if impaired. The Duke Energy Registrants capitalize all construction-related direct labor and material costs, as well as indirect construction costs such as general engineering, taxes and financing costs. See “Allowance for Funds Used During Construction (AFUDC) and Interest Capitalized” for information on capitalized financing costs. Costs of renewals and betterments that extend the useful life of property, plant and equipment are also capitalized. The cost of repairs, replacements and major maintenance projects, which do not extend the useful life or increase the expected output of the asset, are expensed as incurred. Depreciation is generally computed over the estimated useful life of the asset using the composite straight-line method. Depreciation studies are conducted periodically to update composite rates and are approved by state utility commissions and/or the FERC when required. The composite weighted average depreciation rates, excluding nuclear fuel, are included in the table that follows.
|
|
Years Ended December 31,
|
|||||||
|
|
2015
|
|
2014
|
|
2013
|
|
||
|
Duke Energy
|
2.9
|
%
|
2.8
|
%
|
2.8
|
%
|
||
|
Duke Energy Carolinas
|
2.8
|
%
|
2.7
|
%
|
2.8
|
%
|
||
|
Progress Energy
|
2.6
|
%
|
2.5
|
%
|
2.5
|
%
|
||
|
Duke Energy Progress
|
2.6
|
%
|
2.5
|
%
|
2.5
|
%
|
||
|
Duke Energy Florida
|
2.7
|
%
|
2.7
|
%
|
2.4
|
%
|
||
|
Duke Energy Ohio
|
2.7
|
%
|
2.3
|
%
|
3.3
|
%
|
||
|
Duke Energy Indiana
|
3.0
|
%
|
3.0
|
%
|
2.8
|
%
|
||
In general, when the Duke Energy Registrants retire regulated property, plant and equipment, original cost plus the cost of retirement, less salvage value, is charged to accumulated depreciation. However, when it becomes probable a regulated asset will be retired substantially in advance of its original expected useful life or is abandoned, the cost of the asset and the corresponding accumulated depreciation is recognized as a separate asset. If the asset is still in operation, the net amount is classified as Generation facilities to be retired, net on the Consolidated Balance Sheets. If the asset is no longer operating, the net amount is classified in Regulatory Assets on the Consolidated Balance Sheets. The carrying value of the asset is based on historical cost if the Duke Energy Registrants are allowed to recover the remaining net book value and a return equal to at least the incremental borrowing rate. If not, an impairment is recognized to the extent the net book value of the asset exceeds the present value of future revenues discounted at the incremental borrowing rate.
When the Duke Energy Registrants sell entire regulated operating units, or retire or sell nonregulated properties, the original cost and accumulated depreciation and amortization balances are removed from Property, Plant and Equipment on the Consolidated Balance Sheets. Any gain or loss is recorded in earnings, unless otherwise required by the applicable regulatory body.
See Note
10
for further information.
120
PART II
DUKE ENERGY CORPORATION - DUKE ENERGY CAROLINAS, LLC - PROGRESS ENERGY, INC. –
DUKE ENERGY PROGRESS, LLC – DUKE ENERGY FLORIDA, LLC - DUKE ENERGY OHIO, INC. - DUKE ENERGY INDIANA, INC.
Combined Notes To Consolidated Financial Statements – (Continued)
Nuclear Fuel
Nuclear fuel is classified as Property, Plant and Equipment on the Consolidated Balance Sheets, except for Duke Energy Florida. Refer to Note 4, “Regulatory Matters,” for additional information on Crystal River Unit 3 investments, including nuclear fuel.
Nuclear fuel in the front-end fuel processing phase is considered work in progress and not amortized until placed in service. Amortization of nuclear fuel is included within Fuel used in electric generation and purchased power – regulated in the Consolidated Statements of Operations. Amortization is recorded using the units-of-production method.
Allowance for Funds Used During Construction and Interest Capitalized
For regulated operations, the debt and equity costs of financing the construction of property, plant and equipment are reflected as AFUDC and capitalized as a component of the cost of property, plant and equipment. AFUDC equity is reported on the Consolidated Statements of Operations as non-cash income in Other income and expenses, net. AFUDC debt is reported as a non-cash offset to Interest Expense. After construction is completed, the Duke Energy Registrants are permitted to recover these costs through their inclusion in rate base and the corresponding subsequent depreciation or amortization of those regulated assets.
AFUDC equity, a permanent difference for income taxes, reduces the effective tax rate when capitalized and increases the effective tax rate when depreciated or amortized. See Note
22
for additional information.
For nonregulated operations, interest is capitalized during the construction phase with an offsetting non-cash credit to Interest Expense on the Consolidated Statements of Operations.
Asset Retirement Obligations
Asset retirement obligations are recognized for legal obligations associated with the retirement of property, plant and equipment. Substantially all asset retirement obligations are related to regulated operations. When recording an asset retirement obligation, the present value of the projected liability is recognized in the period in which it is incurred, if a reasonable estimate of fair value can be made. The liability is accreted over time. For operating plants, the present value of the liability is added to the cost of the associated asset and depreciated over the remaining life of the asset. For retired plants, the present value of the liability is recorded as a regulatory asset.
The present value of the initial obligation and subsequent updates are based on discounted cash flows, which include estimates regarding timing of future cash flows, selection of discount rates and cost escalation rates, among other factors. These estimates are subject to change. Depreciation expense is adjusted prospectively for any changes to the carrying amount of the associated asset. The Duke Energy Registrants receive amounts to fund the cost of the asset retirement obligation for regulated operations through a combination of regulated revenues and earnings on the NDTF. As a result, amounts recovered in regulated revenues, earnings on the NDTF, accretion expense and depreciation of the associated asset are all deferred as a regulatory asset or liability.
Obligations for nuclear decommissioning are based on-site-specific cost studies. Duke Energy Carolinas and Duke Energy Progress assume prompt dismantlement of the nuclear facilities after operations are ceased. Duke Energy Florida assumes Crystal River Unit 3 will be placed into a safe storage configuration until eventual dismantlement is completed by 2074. Duke Energy Carolinas, Duke Energy Progress and Duke Energy Florida also assume that spent fuel will be stored on-site until such time that it can be transferred to a U.S. Department of Energy (DOE) facility.
Obligations for closure of ash basins are based upon discounted cash flows of estimated costs for site specific plans, if known, or probability weightings of the potential closure methods if the closure plans are under development and multiple closure options are being considered and evaluated on a site-by-site basis. See Note
9
for additional information.
Revenue Recognition and Unbilled Revenue
Revenues on sales of electricity and gas are recognized when service is provided or the product is delivered. Unbilled revenues are recognized by applying customer billing rates to the estimated volumes of energy delivered but not yet billed. Unbilled revenues can vary significantly from period to period as a result of seasonality, weather, customer usage patterns, customer mix, average price in effect for customer classes, timing of rendering customer bills and meter reading schedules.
Unbilled revenues are included within Receivables and Restricted receivables of variable interest entities on the Consolidated Balance Sheets as shown in the following table. This table excludes amounts included in assets held for sale (AHFS) at December 31, 2014.
|
|
December 31,
|
||||||
|
(in millions)
|
2015
|
|
2014
|
|
|||
|
Duke Energy
|
$
|
748
|
|
$
|
827
|
|
|
|
Duke Energy Carolinas
|
283
|
|
295
|
|
|||
|
Progress Energy
|
172
|
|
217
|
|
|||
|
Duke Energy Progress
|
102
|
|
135
|
|
|||
|
Duke Energy Florida
|
70
|
|
82
|
|
|||
|
Duke Energy Ohio
|
3
|
|
—
|
|
|||
|
Duke Energy Indiana
|
31
|
|
27
|
|
|||
121
PART II
DUKE ENERGY CORPORATION - DUKE ENERGY CAROLINAS, LLC - PROGRESS ENERGY, INC. –
DUKE ENERGY PROGRESS, LLC – DUKE ENERGY FLORIDA, LLC - DUKE ENERGY OHIO, INC. - DUKE ENERGY INDIANA, INC.
Combined Notes To Consolidated Financial Statements – (Continued)
Additionally, Duke Energy Ohio and Duke Energy Indiana sell, on a revolving basis, nearly all of their retail accounts receivable, including receivables for unbilled revenues, to an affiliate, Cinergy Receivables Company, LLC (CRC) and account for the transfers of receivables as sales. Accordingly, the receivables sold are not reflected on the Consolidated Balance Sheets of Duke Energy Ohio and Duke Energy Indiana. See Note
17
for further information. These receivables for unbilled revenues are shown in the table below.
|
|
December 31,
|
||||||
|
(in millions)
|
2015
|
|
2014
|
|
|||
|
Duke Energy Ohio
|
$
|
71
|
|
$
|
79
|
|
|
|
Duke Energy Indiana
|
97
|
|
112
|
|
|||
Allowance for Doubtful Accounts
Allowances for doubtful accounts are presented in the following table.
|
|
December 31,
|
||||||||
|
(in millions)
|
2015
|
|
2014
|
|
2013
|
|
|||
|
Allowance for Doubtful Accounts
|
|
|
|
||||||
|
Duke Energy
|
$
|
18
|
|
17
|
|
30
|
|
||
|
Duke Energy Carolinas
|
3
|
|
3
|
|
3
|
|
|||
|
Progress Energy
|
6
|
|
8
|
|
14
|
|
|||
|
Duke Energy Progress
|
4
|
|
7
|
|
10
|
|
|||
|
Duke Energy Florida
|
2
|
|
2
|
|
4
|
|
|||
|
Duke Energy Ohio
|
2
|
|
2
|
|
2
|
|
|||
|
Duke Energy Indiana
|
1
|
|
1
|
|
1
|
|
|||
|
Allowance for Doubtful Accounts
–
VIEs
|
|
|
|
||||||
|
Duke Energy
|
$
|
53
|
|
51
|
|
43
|
|
||
|
Duke Energy Carolinas
|
7
|
|
6
|
|
6
|
|
|||
|
Progress Energy
|
8
|
|
8
|
|
—
|
|
|||
|
Duke Energy Progress
|
5
|
|
5
|
|
—
|
|
|||
|
Duke Energy Florida
|
3
|
|
3
|
|
—
|
|
|||
Derivatives and Hedging
Derivative and non-derivative instruments may be used in connection with commodity price, interest rate and foreign currency risk management activities, including swaps, futures, forwards and options. All derivative instruments, except those that qualify for the normal purchase/normal sale (NPNS) exception, are recorded on the Consolidated Balance Sheets at fair value. Qualifying derivative instruments may be designated as either cash flow hedges or fair value hedges. Other derivative instruments (undesignated contracts) either have not been designated or do not qualify as hedges. The effective portion of the change in the fair value of cash flow hedges is recorded in AOCI. The effective portion of the change in the fair value of a fair value hedge is offset in net income by changes in the hedged item. For activity subject to regulatory accounting, gains and losses on derivative contracts are reflected as regulatory assets or liabilities and not as other comprehensive income or current period income. As a result, changes in fair value of these derivatives have no immediate earnings impact.
Formal documentation, including transaction type and risk management strategy, is maintained for all contracts accounted for as a hedge. At inception and at least every three months thereafter, the hedge contract is assessed to see if it is highly effective in offsetting changes in cash flows or fair values of hedged items.
See Note
14
for further information.
Captive Insurance Reserves
Duke Energy has captive insurance subsidiaries that provide coverage, on an indemnity basis, to the Subsidiary Registrants as well as certain third parties, on a limited basis, for various business risks and losses, such as property, workers’ compensation and general liability. Liabilities include provisions for estimated losses incurred but not yet reported (IBNR), as well as estimated provisions for known claims. IBNR reserve estimates are primarily based upon historical loss experience, industry data and other actuarial assumptions. Reserve estimates are adjusted in future periods as actual losses differ from experience.
Duke Energy, through its captive insurance entities, also has reinsurance coverage with third parties for certain losses above a per occurrence and/or aggregate retention. Receivables for reinsurance coverage are recognized when realization is deemed probable.
Unamortized Debt Premium, Discount and Expense
Premiums, discounts and expenses incurred with the issuance of outstanding long-term debt are amortized over the term of the debt issue. Call premiums and unamortized expenses associated with refinancing higher-cost debt obligations in the regulated operations are amortized. Amortization expense is recorded as Interest Expense in the Consolidated Statements of Operations and is reflected as Depreciation, amortization and accretion within Net cash provided by operating activities on the Consolidated Statements of Cash Flows.
122
PART II
DUKE ENERGY CORPORATION - DUKE ENERGY CAROLINAS, LLC - PROGRESS ENERGY, INC. –
DUKE ENERGY PROGRESS, LLC – DUKE ENERGY FLORIDA, LLC - DUKE ENERGY OHIO, INC. - DUKE ENERGY INDIANA, INC.
Combined Notes To Consolidated Financial Statements – (Continued)
During 2015, Duke Energy retrospectively adopted revised accounting guidance related to the presentation of debt issuance costs. Unamortized debt issuance cost are presented as a reduction of the debt amount and included in Long-Term Debt on the Consolidated Balance Sheets presented. See discussion of New Accounting Standards below for further information.
Loss Contingencies and Environmental Liabilities
Contingent losses are recorded when it is probable a loss has occurred and can be reasonably estimated. When a range of the probable loss exists and no amount within the range is a better estimate than any other amount, the minimum amount in the range is recorded. Unless otherwise required by GAAP, legal fees are expensed as incurred.
Environmental liabilities are recorded on an undiscounted basis when environmental remediation or other liabilities become probable and can be reasonably estimated. Environmental expenditures related to past operations that do not generate current or future revenues are expensed. Environmental expenditures related to operations that generate current or future revenues are expensed or capitalized, as appropriate. Certain environmental expenditures receive regulatory accounting treatment and are recorded as regulatory assets.
See Notes
4
and
5
for further information.
Pension and Other Post-Retirement Benefit Plans
Duke Energy maintains qualified, non-qualified and other post-retirement benefit plans. Eligible employees of the Subsidiary Registrants participate in the respective qualified, non-qualified and other post-retirement benefit plans and the Subsidiary Registrants are allocated their proportionate share of benefit costs. See Note
21
for further information, including significant accounting policies associated with these plans.
Severance and Special Termination Benefits
Duke Energy has a severance plan under which, in general, the longer a terminated employee worked prior to termination the greater the amount of severance benefits. A liability for involuntary severance is recorded once an involuntary severance plan is committed to by management if involuntary severances are probable and can be reasonably estimated. For involuntary severance benefits incremental to its ongoing severance plan benefits, the fair value of the obligation is expensed at the communication date if there are no future service requirements, or over the required future service period. From time to time, Duke Energy offers special termination benefits under voluntary severance programs. Special termination benefits are recorded immediately upon employee acceptance absent a significant retention period. Otherwise, the cost is recorded over the remaining service period. Employee acceptance of voluntary severance benefits is determined by management based on the facts and circumstances of the benefits being offered. See Note
19
for further information.
Guarantees
Liabilities are recognized at the time of issuance or material modification of a guarantee for the estimated fair value of the obligation it assumes. Fair value is estimated using a probability-weighted approach. The obligation is reduced over the term of the guarantee or related contract in a systematic and rational method as risk is reduced. Any additional contingent loss for guarantee contracts subsequent to the initial recognition of a liability is accounted for and recognized at the time a loss is probable and can be reasonably estimated. See Note
7
for further information.
Stock-Based Compensation
Stock-based compensation represents costs related to stock-based awards granted to employees and Duke Energy Board of Directors (Board of Directors) members. Duke Energy recognizes stock-based compensation based upon the estimated fair value of awards, net of estimated forfeitures at the date of issuance. The recognition period for these costs begins at either the applicable service inception date or grant date and continues throughout the requisite service period, or, for certain share-based awards, until the employee becomes retirement eligible, if earlier. Compensation cost is recognized as expense or capitalized as a component of property, plant and equipment. See Note
20
for further information.
Income Taxes
Duke Energy and its subsidiaries file a consolidated federal income tax return and other state and foreign jurisdictional returns. The Subsidiary Registrants entered into a tax-sharing agreement with Duke Energy. Income taxes recorded represent amounts the Subsidiary Registrants would incur as separate C-Corporations. Deferred income taxes have been provided for temporary differences between GAAP and tax bases of assets and liabilities because the differences create taxable or tax-deductible amounts for future periods. Deferred taxes are not provided on translation gains and losses when earnings of a foreign operation are expected to be indefinitely reinvested. Investment tax credits (ITC) associated with regulated operations are deferred and amortized as a reduction of income tax expense over the estimated useful lives of the related properties.
Positions taken or expected to be taken on tax returns, including the decision to exclude certain income or transactions from a return, are recognized in the financial statements when it is more likely than not the tax position can be sustained based solely on the technical merits of the position. The largest amount of tax benefit that is greater than 50 percent likely of being effectively settled is recorded. Management considers a tax position effectively settled when: (i) the taxing authority has completed its examination procedures, including all appeals and administrative reviews; (ii) the Duke Energy Registrants do not intend to appeal or litigate the tax position included in the completed examination; and (iii) it is remote the taxing authority would examine or re-examine the tax position. The amount of a tax return position that is not recognized in the financial statements is disclosed as an unrecognized tax benefit. If these unrecognized tax benefits are later recognized, then there will be a decrease in income taxes payable, an income tax refund or a reclassification between deferred and current taxes payable. If the portion of tax benefits that has been recognized changes and those tax benefits are subsequently unrecognized, then the previously recognized tax benefits may impact the financial statements through increasing income taxes payable, reducing income tax refunds receivable or changing deferred taxes. Changes in assumptions on tax benefits may also impact interest expense or interest income and may result in the recognition of tax penalties.
123
PART II
DUKE ENERGY CORPORATION - DUKE ENERGY CAROLINAS, LLC - PROGRESS ENERGY, INC. –
DUKE ENERGY PROGRESS, LLC – DUKE ENERGY FLORIDA, LLC - DUKE ENERGY OHIO, INC. - DUKE ENERGY INDIANA, INC.
Combined Notes To Consolidated Financial Statements – (Continued)
Tax-related interest and penalties are recorded in Interest Expense and Other Income and Expenses, net, in the Consolidated Statements of Operations.
See Note
22
for further information.
Accounting for Renewable Energy Tax Credits and Cash Grants
When Duke Energy receives ITC or cash grants on wind or solar facilities, it reduces the basis of the property recorded on the Consolidated Balance Sheets by the amount of the ITC or cash grant and, therefore, the ITC or grant benefit is recognized through reduced depreciation expense. Additionally, certain tax credits and government grants result in an initial tax depreciable base in excess of the book carrying value by an amount equal to one half of the ITC or government grant. Deferred tax benefits are recorded as a reduction to income tax expense in the period that the basis difference is created.
Excise Taxes
Certain excise taxes levied by state or local governments are required to be paid even if not collected from the customer. These taxes are recognized on a gross basis. Otherwise, the taxes are accounted for net. Excise taxes accounted for on a gross basis as both operating revenues and property and other taxes in the Consolidated Statements of Operations were as follows.
|
|
Years Ended December 31,
|
||||||||||
|
(in millions)
|
2015
|
|
2014
|
|
2013
|
|
|||||
|
Duke Energy
|
$
|
396
|
|
$
|
498
|
|
$
|
602
|
|
||
|
Duke Energy Carolinas
|
31
|
|
94
|
|
164
|
|
|||||
|
Progress Energy
|
229
|
|
263
|
|
304
|
|
|||||
|
Duke Energy Progress
|
16
|
|
56
|
|
115
|
|
|||||
|
Duke Energy Florida
|
213
|
|
207
|
|
189
|
|
|||||
|
Duke Energy Ohio
|
102
|
|
103
|
|
105
|
|
|||||
|
Duke Energy Indiana
|
34
|
|
38
|
|
29
|
|
|||||
On July 23, 2013, North Carolina House Bill 998 (HB 998 or the North Carolina Tax Simplification and Rate Reduction Act) was signed into law. HB 998 repealed the utility franchise tax effective July 1, 2014. The utility franchise tax was
3.22 percent
gross receipts tax on sales of electricity. The result of this change in law is an annual reduction in excise taxes of approximately
$160 million
for Duke Energy Carolinas and approximately
$110 million
for Duke Energy Progress. HB 998 also increases sales tax on electricity from
3 percent
to
7 percent
effective July 1, 2014. HB 998 requires the NCUC to adjust retail electric rates for the elimination of the utility franchise tax, changes due to the increase in sales tax on electricity, and the resulting change in liability of utility companies under the general franchise tax.
Foreign Currency Translation
The local currencies of most of Duke Energy’s foreign operations have been determined to be their functional currencies. However, certain foreign operations’ functional currency has been determined to be the U.S. dollar, based on an assessment of the economic circumstances of the foreign operation
.
Assets and liabilities of foreign operations whose functional currency is not the U.S. dollar are translated into U.S. dollars at the exchange rates in effect at period end. Translation adjustments resulting from changes in exchange rates are included in AOCI. Revenue and expense accounts are translated at average exchange rates during the year. Remeasurement gains and losses arising from balances and transactions denominated in currencies other than the local currency are included in the results of operations when they occur.
Dividend Restrictions and Unappropriated Retained Earnings
Duke Energy does not have any legal, regulatory or other restrictions on paying common stock dividends to shareholders. However, as further described in Note
4
, due to conditions established by regulators in conjunction with merger transaction approvals, Duke Energy Carolinas, Duke Energy Progress, Duke Energy Ohio and Duke Energy Indiana have restrictions on paying dividends or otherwise advancing funds to Duke Energy. At
December 31, 2015
and
2014
, an insignificant amount of Duke Energy’s consolidated Retained earnings balance represents undistributed earnings of equity method investments.
New Accounting Standards
The new accounting standards that were adopted for
2015
,
2014
and
2013
had no material impact on the presentation or results of operations, cash flows or financial position of the Duke Energy Registrants. The following accounting standards were adopted by the Duke Energy Registrants during 2015.
Reporting Discontinued Operations.
In April 2014, the Financial Accounting Standards Board (FASB) issued revised accounting guidance for reporting discontinued operations. A discontinued operation would be either (i) a component of an entity or a group of components of an entity that represents a separate major line of business or major geographical area of operations that either has been disposed of or is part of a single coordinated plan to be classified as held for sale or (ii) a business that, upon acquisition, meets the criteria to be classified as held for sale.
For Duke Energy, the revised accounting guidance is effective on a prospective basis for qualified disposals of components or classifications as held for sale that occurred after January 1, 2015. Under the standard, the guidance is not effective for a component classified as held for sale before the effective date even if the disposal occurs after the effective date of the guidance. Duke Energy has not reported any discontinued operations under the revised accounting guidance.
124
PART II
DUKE ENERGY CORPORATION - DUKE ENERGY CAROLINAS, LLC - PROGRESS ENERGY, INC. –
DUKE ENERGY PROGRESS, LLC – DUKE ENERGY FLORIDA, LLC - DUKE ENERGY OHIO, INC. - DUKE ENERGY INDIANA, INC.
Combined Notes To Consolidated Financial Statements – (Continued)
Balance Sheet Classification of Deferred Taxes.
In November 2015, the FASB issued revised accounting guidance for the Balance Sheet classification of deferred taxes. The core principle of this revised accounting guidance is that all deferred tax assets and liabilities should be classified as noncurrent. For Duke Energy, this revised accounting guidance was adopted prospectively for December 31, 2015. The Balance Sheet as of December 31, 2014, does not reflect this reclassification of current deferred tax assets and liabilities. See Note
22
for further information on the impact from adoption of this accounting standard.
Balance Sheet Presentation of Debt Issuance Costs.
In April and August 2015, the FASB issued revised accounting guidance for the presentation of debt issuance costs. The core principle of this revised accounting guidance is that debt issuance costs are not assets, but adjustments to the carrying cost of debt. For Duke Energy, this revised accounting guidance was adopted retrospectively to December 31, 2014.
The implementation of this accounting standard resulted in a reduction of Other within Regulatory Assets and Deferred Debits and in Long-Term Debt of
$170
million and
$152
million on the Consolidated Balance Sheets as of December 31, 2015 and 2014, respectively.
Fair Value Disclosures for Certain Investments.
In May 2015, the FASB issued revised accounting guidance for investments in certain entities that use net asset value per share (or its equivalent) as a ‘practical expedient’ to determine fair value. The core principle of this revised accounting guidance is that the valuation of investments using the ‘practical expedient’ should not be categorized within the fair value hierarchy (i.e., as Level 1, 2 or 3). The ‘practical expedient’ applies to investments in investment companies for which there is not a readily determinable fair value (market quote) or the investment is not in a mutual fund with a publicly available net asset value. For Duke Energy, this revised accounting guidance was adopted retrospectively. The implementation of this guidance is reflected in Note
16
: Fair Value Measurements and Note
21
: Employee Benefit Plans.
The following new accounting standards have been issued, but have not yet been adopted by the Duke Energy Registrants, as of
December 31, 2015
.
Revenue from Contracts with Customers
. In May 2014, the FASB issued revised accounting guidance for revenue recognition from contracts with customers. The core principle of this guidance is that an entity should recognize revenue to depict the transfer of promised goods or services to customers in an amount that reflects the consideration to which the entity expects to be entitled in exchange for those goods or services. The amendments in this update also require disclosure of sufficient information to allow users to understand the nature, amount, timing and uncertainty of revenue and cash flows arising from contracts with customers.
For the Duke Energy Registrants, this guidance is effective for interim and annual periods beginning January 1, 2018, although it can be early adopted for annual periods beginning as early as January 1, 2017. The guidance can be applied retroactively to all prior reporting periods presented or retrospectively with a cumulative effect as of the initial date of application. Duke Energy is currently evaluating the requirements. The ultimate impact of the new standard has not yet been determined.
Financial Instruments Classification and Measurement.
In January 2016, the FASB issued revised accounting guidance for the classification and measurement of financial instruments. Changes in the fair value of all equity securities will be required to be recorded in net income. Current GAAP allows some changes in fair value for available-for-sale equity securities to be recorded in AOCI. Additional disclosures will be required to present separately the financial assets and financial liabilities by measurement category and form of financial asset. An entity's equity investments that are accounted for under the equity method of accounting are not included within the scope of the new guidance.
For Duke Energy, the revised accounting guidance is effective for interim and annual periods beginning January 1, 2018 by recording a cumulative effect to the balance sheet as of January 1, 2018. This guidance is expected to have minimal impact on Duke Energy’s Statement of Comprehensive Income as changes in the fair value of most of Duke Energy's available-for-sale equity securities are deferred as regulatory assets or liabilities.
2. ACQUISITIONS AND DISPOSITIONS
ACQUISITIONS
The Duke Energy Registrants consolidate assets and liabilities from acquisitions as of the purchase date, and include earnings from acquisitions in consolidated earnings after the purchase date.
Acquisition of Piedmont Natural Gas
On October 24, 2015, Duke Energy entered into an Agreement and Plan of Merger (Merger Agreement) with Piedmont Natural Gas Company, Inc. (Piedmont), a North Carolina corporation. Under the terms of the Merger Agreement, Duke Energy will acquire Piedmont for
$4.9 billion
in cash. Upon closing, Piedmont will become a wholly owned subsidiary of Duke Energy.
Pursuant to the Merger Agreement, upon the closing of the merger, each share of Piedmont common stock issued and outstanding immediately prior to the closing will be converted automatically into the right to receive
$60
in cash per share. In addition, Duke Energy will assume Piedmont's existing debt, which was approximately
$1.9 billion
at October 31, 2015, the end of Piedmont's most recent fiscal year. Duke Energy expects to finance the transaction with a combination of debt, equity issuances and other cash sources. As of December 31, 2015, Duke Energy entered into
$900 million
of forward starting interest rate swaps to lock in components of interest rates for the expected financing. The change in the fair value of the swaps from inception to December 31, 2015, was not material. For additional information on the forward-starting swaps, see Note 14.
In connection with the Merger Agreement with Piedmont, Duke Energy entered into a
$4.9 billion
senior unsecured bridge financing facility (Bridge Facility) with Barclays Capital, Inc. (Barclays). The Bridge Facility, if drawn upon, may be used to (i) fund the cash consideration for the transaction and (ii) pay certain fees and expenses in connection with the transaction. In November 2015, Barclays syndicated its commitment under the Bridge Facility to a broader group of lenders. Duke Energy does not expect to draw upon the Bridge Facility.
125
PART II
DUKE ENERGY CORPORATION - DUKE ENERGY CAROLINAS, LLC - PROGRESS ENERGY, INC. –
DUKE ENERGY PROGRESS, LLC – DUKE ENERGY FLORIDA, LLC - DUKE ENERGY OHIO, INC. - DUKE ENERGY INDIANA, INC.
Combined Notes To Consolidated Financial Statements – (Continued)
The Federal Trade Commission (FTC) has granted early termination of the 30-day waiting period under the federal Hart-Scott-Rodino Antitrust Improvements Act of 1976. On January 22, 2016, shareholders of Piedmont Natural Gas approved the company's acquisition by Duke Energy. On January 15, 2016, Duke Energy filed for approval of the transaction and associated financing requests with the NCUC. On January 29, 2016, the NCUC approved the financing requests. On January 15, 2016, Duke Energy and Piedmont filed a joint request with the Tennessee Regulatory Authority for approval of a change in control of Piedmont that will result from Duke Energy's acquisition of Piedmont. In that request, Duke Energy and Piedmont requested that the Authority approve the change in control on or before April 30, 2016. Subject to receipt of required regulatory approvals and meeting closing conditions, Duke Energy and Piedmont target a closing by the end of 2016.
On December 11, 2015, Duke Energy Kentucky filed a declaratory request with the KPSC seeking a finding that the transaction does not constitute a change in control of Duke Energy Kentucky requiring KPSC approval. Duke Energy also presented the transaction for information before the PSCSC on January 13, 2016.
The Merger Agreement contains certain termination rights for both Duke Energy and Piedmont, and provides that, upon termination of the Merger Agreement under specified circumstances, Duke Energy would be required to pay a termination fee of
$250 million
to Piedmont and Piedmont would be required to pay Duke Energy a termination fee of
$125 million
.
See Note 4 for additional information regarding Duke Energy and Piedmont's joint investment in Atlantic Coast Pipeline, LLC (ACP).
Purchase of NCEMPA's Generation
On July 31, 2015, Duke Energy Progress completed the purchase of North Carolina Eastern Municipal Power Agency’s (NCEMPA) ownership interests in certain generating assets, fuel and spare parts inventory jointly owned with and operated by Duke Energy Progress for approximately
$1.25 billion
. This purchase was accounted for as an asset acquisition. The purchase resulted in the acquisition of a total of approximately 700 megawatts (MW) of generating capacity at Brunswick Nuclear Plant, Shearon Harris Nuclear Plant, Mayo Steam Plant and Roxboro Steam Plant. In connection with this transaction, Duke Energy Progress and NCEMPA entered into a 30-year wholesale power agreement, whereby Duke Energy Progress will sell power to NCEMPA to continue to meet the needs of NCEMPA customers.
The purchase price exceeds the historical carrying value of the acquired assets by
$350 million
, which was recognized as an acquisition adjustment, recorded in property, plant and equipment. Duke Energy Progress received FERC approval for inclusion of the acquisition adjustment in wholesale power formula rates on December 9, 2014. On July 8, 2015, the NCUC adopted a new rule that enables a rider mechanism for recovery of the costs to acquire, operate and maintain interests in the assets purchased as allocated to Duke Energy Progress' North Carolina retail operations, including the acquisition adjustment. Pursuant to the NCUC's approval, Duke Energy Progress implemented a rider to recover costs associated with the NCEMPA asset acquisition effective December 1, 2015. Duke Energy Progress also received an order from the PSCSC to defer the recovery of the South Carolina retail allocated costs of the asset purchased until the Company's next general rate case.
Assets Acquired
The ownership interests in generating assets acquired are subject to rate-setting authority of the FERC, NCUC and PSCSC and accordingly, the assets are recorded at historical cost. The assets acquired are presented in the following table.
|
(in millions)
|
||||
|
Inventory
|
$
|
56
|
|
|
|
Net property, plant and equipment
|
845
|
|
||
|
Total assets
|
901
|
|
||
|
Acquisition adjustment, recorded within property, plant and equipment
|
350
|
|
||
|
Total purchase price
|
$
|
1,251
|
|
|
In connection with the acquisition, Duke Energy Progress acquired NCEMPA's nuclear decommissioning trust fund assets of
$287 million
and assumed asset retirement obligations of
$204 million
associated with NCEMPA's interest in the generation assets. The nuclear decommissioning trust fund and the asset retirement obligation are subject to regulatory accounting treatment.
DISPOSITIONS
Potential Sale of International Energy
On February 18, 2016, Duke Energy announced it had initiated a process to divest the International Energy business segment, excluding the equity method investment in National Methanol Company (NMC). Duke Energy is in the preliminary stage and there have been no binding or non-binding offers requested or submitted. Duke Energy can provide no assurance that this process will result in a transaction and there is no specific timeline for execution of a potential transaction. Proceeds from a successful exit would be used by Duke Energy to fund the operations and growth of domestic businesses. If the potential of a sale were to progress, it could result in classification of International Energy as assets held for sale and as a discontinued operation. As of December 31, 2015, the International Energy segment had a carrying value of approximately
$2.7 billion
, adjusted to include the cumulative foreign currency translation losses currently classified as accumulated other comprehensive income.
Midwest Generation Exit
Duke Energy, through indirect subsidiaries, completed the sale of the nonregulated Midwest generation business and Duke Energy Retail Sales (collectively, the Disposal Group) to a subsidiary of Dynegy on April 2, 2015, for approximately
$2.8 billion
in cash. On April 1, 2015, prior to the sale, Duke Energy Ohio distributed its indirect ownership interest in the nonregulated Midwest generation business to a subsidiary of Duke Energy Corporation.
126
PART II
DUKE ENERGY CORPORATION - DUKE ENERGY CAROLINAS, LLC - PROGRESS ENERGY, INC. –
DUKE ENERGY PROGRESS, LLC – DUKE ENERGY FLORIDA, LLC - DUKE ENERGY OHIO, INC. - DUKE ENERGY INDIANA, INC.
Combined Notes To Consolidated Financial Statements – (Continued)
The assets and liabilities of the Disposal Group prior to the sale were included in the Commercial Portfolio (formerly Commercial Power) segment and classified as held for sale in Duke Energy's and Duke Energy Ohio's Consolidated Balance Sheet at December 31, 2014. The following table presents information at the time of the sale related to the Duke Energy Ohio generation plants included in the Disposal Group.
|
Total MW
|
|
Owned MW
|
|
Ownership
|
|
|||||||||
|
Facility
|
Plant Type
|
Primary Fuel
|
Location
|
Capacity
(d)
|
|
Capacity
(d)
|
|
Interest
|
|
|||||
|
Stuart
(a)(c)
|
Fossil Steam
|
Coal
|
OH
|
2,308
|
|
900
|
|
39
|
%
|
|||||
|
Zimmer
(a)
|
Fossil Steam
|
Coal
|
OH
|
1,300
|
|
605
|
|
46.5
|
%
|
|||||
|
Hanging Rock
|
Combined Cycle
|
Gas
|
OH
|
1,226
|
|
1,226
|
|
100
|
%
|
|||||
|
Miami Fort (Units 7 and 8)
(b)
|
Fossil Steam
|
Coal
|
OH
|
1,020
|
|
652
|
|
64
|
%
|
|||||
|
Conesville
(a)(c)
|
Fossil Steam
|
Coal
|
OH
|
780
|
|
312
|
|
40
|
%
|
|||||
|
Washington
|
Combined Cycle
|
Gas
|
OH
|
617
|
|
617
|
|
100
|
%
|
|||||
|
Fayette
|
Combined Cycle
|
Gas
|
PA
|
614
|
|
614
|
|
100
|
%
|
|||||
|
Killen
(b)(c)
|
Fossil Steam
|
Coal
|
OH
|
600
|
|
198
|
|
33
|
%
|
|||||
|
Lee
|
Combustion Turbine
|
Gas
|
IL
|
568
|
|
568
|
|
100
|
%
|
|||||
|
Dick's Creek
|
Combustion Turbine
|
Gas
|
OH
|
136
|
|
136
|
|
100
|
%
|
|||||
|
Miami Fort
|
Combustion Turbine
|
Oil
|
OH
|
56
|
|
56
|
|
100
|
%
|
|||||
|
Total Midwest Generation
|
9,225
|
|
5,884
|
|
||||||||||
|
(a)
|
Jointly owned with American Electric Power Generation Resources and The Dayton Power and Light Company.
|
|
(b)
|
Jointly owned with The Dayton Power and Light Company.
|
|
(c)
|
Not operated by Duke Energy Ohio.
|
|
(d)
|
Total MW capacity is based on summer capacity.
|
The Disposal Group also included a retail sales business owned by Duke Energy. In the second quarter of 2014, Duke Energy Ohio removed Ohio Valley Electric Corporation's (OVEC) purchase power agreement from the Disposal Group as it no longer intended to sell it with the Disposal Group.
The results of operations of the Disposal Group prior to the date of sale are classified as discontinued operations in the accompanying Consolidated Statements of Operations and Comprehensive Income. Certain immaterial costs that were eliminated as a result of the sale remained in continuing operations. The following table presents the results of discontinued operations.
Duke Energy
|
Years Ended December 31,
|
|||||||||||
|
(in millions)
|
2015
|
|
|
2014
|
|
|
2013
|
|
|||
|
Operating Revenues
|
$
|
543
|
|
$
|
1,748
|
|
$
|
1,885
|
|
||
|
Loss on disposition
(a)
|
(45
|
)
|
(929
|
)
|
—
|
|
|||||
|
Income (loss) before income taxes
(b)
|
$
|
59
|
|
$
|
(818
|
)
|
$
|
141
|
|
||
|
Income tax expense (benefit)
|
26
|
|
(294
|
)
|
56
|
|
|||||
|
Income (loss) from discontinued operations of the Disposal Group
|
33
|
|
(524
|
)
|
85
|
|
|||||
|
Other, net of tax
(c)
|
(13
|
)
|
(52
|
)
|
1
|
|
|||||
|
Income (Loss) From Discontinued Operations, net of tax
|
$
|
20
|
|
$
|
(576
|
)
|
$
|
86
|
|
||
|
(a)
|
The Loss on disposition includes impairments recorded to adjust the carrying amount of the assets to the estimated fair value of the business, based on the selling price to Dynegy less cost to sell.
|
|
(b)
|
The Income (loss) before income taxes includes the pretax impact of an
$81 million
charge for the settlement agreement reached in a lawsuit related to the Disposal Group for the year ended December 31, 2015. Refer to Note 5 for further information related to the lawsuit.
|
|
(c)
|
Relates to discontinued operations of businesses not related to the Disposal Group. Amounts include indemnifications provided for certain legal, tax and environmental matters, and foreign currency translation adjustments.
|
127
PART II
DUKE ENERGY CORPORATION - DUKE ENERGY CAROLINAS, LLC - PROGRESS ENERGY, INC. –
DUKE ENERGY PROGRESS, LLC – DUKE ENERGY FLORIDA, LLC - DUKE ENERGY OHIO, INC. - DUKE ENERGY INDIANA, INC.
Combined Notes To Consolidated Financial Statements – (Continued)
Duke Energy Ohio
|
Years Ended December 31,
|
|||||||||||
|
(in millions)
|
2015
|
|
2014
|
|
2013
|
|
|||||
|
Operating Revenues
|
$
|
412
|
|
$
|
1,299
|
|
$
|
1,503
|
|
||
|
Loss on disposition
(a)
|
(52
|
)
|
(959
|
)
|
—
|
|
|||||
|
Income (loss) before income taxes
(b)
|
$
|
44
|
|
$
|
(863
|
)
|
$
|
67
|
|
||
|
Income tax expense (benefit)
|
21
|
|
(300
|
)
|
32
|
|
|||||
|
Income (Loss) From Discontinued Operations, net of tax
|
$
|
23
|
|
$
|
(563
|
)
|
$
|
35
|
|
||
|
(a)
|
The Loss on disposition includes impairments recorded to adjust the carrying amount of the assets to the estimated fair value of the business, based on the selling price to Dynegy less cost to sell.
|
|
(b)
|
The Income (loss) before income taxes includes the pretax impact of an
$81 million
charge for the settlement agreement reached in a lawsuit related to the Disposal Group for the year ended December 31, 2015, respectively. Refer to Note 5 for further information related to the lawsuit.
|
Commercial Portfolio has a revolving credit agreement (RCA) which was used to support the operations of the nonregulated Midwest generation business. Interest expense associated with the RCA was allocated to discontinued operations. No other interest expense related to corporate level debt was allocated to discontinued operations.
Duke Energy Ohio had a power purchase agreement with the Disposal Group for a portion of its standard service offer (SSO) supply requirement. The agreement and the SSO expired in May 2015. Duke Energy received reimbursement for transition services provided to Dynegy through December 2015. The continuing cash flows were not considered direct cash flows or material. Duke Energy or Duke Energy Ohio did not significantly influence the operations of the Disposal Group during the transition service period.
See Notes 4 and 5 for a discussion of contingencies related to the Disposal Group that are retained by Duke Energy Ohio subsequent to the sale.
3. BUSINESS SEGMENTS
Duke Energy evaluates segment performance based on segment income. Segment income is defined as income from continuing operations net of income attributable to noncontrolling interests. Segment income, as discussed below, includes intercompany revenues and expenses that are eliminated in the Consolidated Financial Statements. Certain governance costs are allocated to each segment. In addition, direct interest expense and income taxes are included in segment income.
Operating segments are determined based on information used by the chief operating decision maker in deciding how to allocate resources and evaluate the performance.
Products and services are sold between affiliate companies and reportable segments of Duke Energy at cost. Segment assets as presented in the tables that follow exclude all intercompany assets.
Duke Energy
Duke Energy has the following reportable operating segments: Regulated Utilities, International Energy and Commercial Portfolio.
Regulated Utilities conducts electric and natural gas operations that are substantially all regulated and, accordingly, qualify for regulatory accounting treatment. These operations are primarily conducted through the Subsidiary Registrants and are subject to the rules and regulations of the FERC, NRC, NCUC, PSCSC, FPSC, PUCO, IURC and KPSC.
International Energy principally operates and manages power generation facilities and engages in sales and marketing of electric power, natural gas and natural gas liquids outside the U.S. Its activities principally target power generation in Latin America. Additionally, International Energy owns a
25 percent
interest in NMC, a large regional producer of methyl tertiary butyl ether (MTBE) located in Saudi Arabia. The investment in NMC is accounted for under the equity method of accounting. On February 4, 2016, Duke Energy announced it had initiated a process to divest its International Energy business segment, excluding the investment in NMC. See Note 2 for further information.
Commercial Portfolio builds, develops and operates wind and solar renewable generation and energy transmission projects throughout the U.S. The segment was renamed as a result of the sale of the Disposal Group, as discussed in Note 2. For periods subsequent to the sale, beginning in the second quarter of 2015, certain immaterial results of operations and related assets previously presented in the Commercial Portfolio segment are presented in Regulated Utilities and Other.
128
PART II
DUKE ENERGY CORPORATION - DUKE ENERGY CAROLINAS, LLC - PROGRESS ENERGY, INC. –
DUKE ENERGY PROGRESS, LLC – DUKE ENERGY FLORIDA, LLC - DUKE ENERGY OHIO, INC. - DUKE ENERGY INDIANA, INC.
Combined Notes To Consolidated Financial Statements – (Continued)
The remainder of Duke Energy’s operations is presented as Other, which is primarily comprised of unallocated corporate interest expense, unallocated corporate costs, contributions to the Duke Energy Foundation and the operations of Duke Energy’s wholly owned captive insurance subsidiary, Bison Insurance Company Limited (Bison).On December 31, 2013, Duke Energy sold its interest in DukeNet Communications Holdings, LLC (DukeNet) to Time Warner Cable, Inc.
|
Year Ended December 31, 2015
|
|||||||||||||||||||||||||||
|
Total
|
|
||||||||||||||||||||||||||
|
Regulated
|
|
International
|
|
Commercial
|
|
Reportable
|
|
||||||||||||||||||||
|
(in millions)
|
Utilities
|
|
Energy
|
|
Portfolio
|
|
Segments
|
|
Other
|
|
Eliminations
|
|
Total
|
|
|||||||||||||
|
Unaffiliated Revenues
|
$
|
22,024
|
|
$
|
1,088
|
|
$
|
301
|
|
$
|
23,413
|
|
$
|
46
|
|
$
|
—
|
|
$
|
23,459
|
|
||||||
|
Intersegment Revenues
|
38
|
|
—
|
|
—
|
|
38
|
|
77
|
|
(115
|
)
|
—
|
|
|||||||||||||
|
Total Revenues
|
$
|
22,062
|
|
$
|
1,088
|
|
$
|
301
|
|
$
|
23,451
|
|
$
|
123
|
|
$
|
(115
|
)
|
$
|
23,459
|
|
||||||
|
Interest Expense
|
$
|
1,097
|
|
$
|
85
|
|
$
|
44
|
|
$
|
1,226
|
|
$
|
393
|
|
$
|
(6
|
)
|
$
|
1,613
|
|
||||||
|
Depreciation and amortization
|
2,814
|
|
92
|
|
104
|
|
3,010
|
|
134
|
|
—
|
|
3,144
|
|
|||||||||||||
|
Equity in earnings of unconsolidated affiliates
|
(4
|
)
|
74
|
|
(3
|
)
|
67
|
|
2
|
|
—
|
|
69
|
|
|||||||||||||
|
Income tax expense (benefit)
|
1,647
|
|
74
|
|
(92
|
)
|
1,629
|
|
(303
|
)
|
—
|
|
1,326
|
|
|||||||||||||
|
Segment income (loss)
(a)(b)(c)(d)
|
2,893
|
|
225
|
|
4
|
|
3,122
|
|
(322
|
)
|
(4
|
)
|
2,796
|
|
|||||||||||||
|
Add back noncontrolling interest component
|
|
|
|
|
|
|
|
|
|
|
|
|
15
|
|
|||||||||||||
|
Income from discontinued operations, net of tax
(e)
|
|
|
|
|
|
|
|
|
|
|
|
|
20
|
|
|||||||||||||
|
Net income
|
|
|
|
|
|
|
|
|
|
|
|
|
$
|
2,831
|
|
||||||||||||
|
Capital investments expenditures and acquisitions
|
$
|
6,974
|
|
$
|
45
|
|
$
|
1,131
|
|
$
|
8,150
|
|
$
|
213
|
|
$
|
—
|
|
$
|
8,363
|
|
||||||
|
Segment Assets
|
111,562
|
|
3,271
|
|
4,010
|
|
118,843
|
|
2,125
|
|
188
|
|
121,156
|
|
|||||||||||||
|
(a)
|
Regulated Utilities includes an after-tax charge of
$58 million
related to the Edwardsport settlement. Refer to Note
4
for further information.
|
|
(b)
|
Commercial Portfolio includes state tax expense of
$41 million
, resulting from changes to state apportionment factors due to the sale of the Disposal Group, that does not qualify for discontinued operations. Refer to Note
2
for further information related to the sale.
|
(c) Other includes
$60 million
of after-tax costs to achieve mergers.
|
(d)
|
Other includes an after-tax charge of
$77 million
related to cost savings initiatives. Refer to Note 19 for further information related to the cost savings initiatives.
|
|
(e)
|
Includes after-tax impact of
$53 million
for the settlement agreement reached in a lawsuit related to the Disposal Group. Refer to Note
5
for further information related to the lawsuit.
|
129
PART II
DUKE ENERGY CORPORATION - DUKE ENERGY CAROLINAS, LLC - PROGRESS ENERGY, INC. –
DUKE ENERGY PROGRESS, LLC – DUKE ENERGY FLORIDA, LLC - DUKE ENERGY OHIO, INC. - DUKE ENERGY INDIANA, INC.
Combined Notes To Consolidated Financial Statements – (Continued)
|
Year Ended December 31, 2014
|
|||||||||||||||||||||||||||
|
Total
|
|
||||||||||||||||||||||||||
|
Regulated
|
|
International
|
|
Commercial
|
|
Reportable
|
|
||||||||||||||||||||
|
(in millions)
|
Utilities
|
|
Energy
|
|
Portfolio
|
|
Segments
|
|
Other
|
|
Eliminations
|
|
Total
|
|
|||||||||||||
|
Unaffiliated Revenues
|
$
|
22,228
|
|
$
|
1,417
|
|
$
|
255
|
|
$
|
23,900
|
|
$
|
25
|
|
$
|
—
|
|
$
|
23,925
|
|
||||||
|
Intersegment Revenues
|
43
|
|
—
|
|
—
|
|
43
|
|
80
|
|
(123
|
)
|
—
|
|
|||||||||||||
|
Total Revenues
|
$
|
22,271
|
|
$
|
1,417
|
|
$
|
255
|
|
$
|
23,943
|
|
$
|
105
|
|
$
|
(123
|
)
|
$
|
23,925
|
|
||||||
|
Interest Expense
|
$
|
1,093
|
|
$
|
93
|
|
$
|
58
|
|
$
|
1,244
|
|
$
|
400
|
|
$
|
(22
|
)
|
$
|
1,622
|
|
||||||
|
Depreciation and amortization
|
2,759
|
|
97
|
|
92
|
|
2,948
|
|
118
|
|
—
|
|
3,066
|
|
|||||||||||||
|
Equity in earnings of unconsolidated affiliates
|
(3
|
)
|
120
|
|
10
|
|
127
|
|
3
|
|
—
|
|
130
|
|
|||||||||||||
|
Income tax expense (benefit)
(a)
|
1,628
|
|
449
|
|
(171
|
)
|
1,906
|
|
(237
|
)
|
—
|
|
1,669
|
|
|||||||||||||
|
Segment income (loss)
(b)(c)(d)
|
2,795
|
|
55
|
|
(55
|
)
|
2,795
|
|
(334
|
)
|
(10
|
)
|
2,451
|
|
|||||||||||||
|
Add back noncontrolling interest component
|
|
|
|
|
|
|
|
|
|
|
|
|
14
|
|
|||||||||||||
|
Loss from discontinued operations, net of tax
|
|
|
|
|
|
|
|
|
|
|
|
|
(576
|
)
|
|||||||||||||
|
Net income
|
|
|
|
|
|
|
|
|
|
|
|
|
$
|
1,889
|
|
||||||||||||
|
Capital investments expenditures and acquisitions
|
$
|
4,744
|
|
$
|
67
|
|
$
|
555
|
|
$
|
5,366
|
|
$
|
162
|
|
$
|
—
|
|
$
|
5,528
|
|
||||||
|
Segment Assets
|
106,574
|
|
5,093
|
|
6,278
|
|
117,945
|
|
2,423
|
|
189
|
|
120,557
|
|
|||||||||||||
|
(a)
|
International Energy includes a tax adjustment of
$373 million
related to deferred tax impact resulting from the decision to repatriate all cumulative historical undistributed foreign earnings. See Note
22
for additional information.
|
|
(b)
|
Commercial Portfolio recorded a
$94 million
pretax impairment charge related to OVEC.
|
|
(c)
|
Other includes costs to achieve mergers.
|
|
(d)
|
Regulated Utilities includes an increase in the litigation reserve related to the criminal investigation of the Dan River coal ash spill. See Note 5 for additional information.
|
|
Year Ended December 31, 2013
|
|||||||||||||||||||||||||||
|
Total
|
|
||||||||||||||||||||||||||
|
Regulated
|
|
International
|
|
Commercial
|
|
Reportable
|
|
||||||||||||||||||||
|
(in millions)
|
Utilities
|
|
Energy
|
|
Portfolio
|
|
Segments
|
|
Other
|
|
Eliminations
|
|
Total
|
|
|||||||||||||
|
Unaffiliated Revenues
(a)(b)(c)
|
$
|
20,871
|
|
$
|
1,546
|
|
$
|
254
|
|
$
|
22,671
|
|
$
|
85
|
|
$
|
—
|
|
$
|
22,756
|
|
||||||
|
Intersegment Revenues
|
39
|
|
—
|
|
6
|
|
45
|
|
90
|
|
(135
|
)
|
—
|
|
|||||||||||||
|
Total Revenues
|
$
|
20,910
|
|
$
|
1,546
|
|
$
|
260
|
|
$
|
22,716
|
|
$
|
175
|
|
$
|
(135
|
)
|
$
|
22,756
|
|
||||||
|
Interest Expense
|
$
|
986
|
|
$
|
86
|
|
$
|
61
|
|
$
|
1,133
|
|
$
|
416
|
|
$
|
(6
|
)
|
$
|
1,543
|
|
||||||
|
Depreciation and amortization
|
2,323
|
|
100
|
|
110
|
|
2,533
|
|
135
|
|
—
|
|
2,668
|
|
|||||||||||||
|
Equity in earnings of unconsolidated affiliates
|
(1
|
)
|
110
|
|
7
|
|
116
|
|
6
|
|
—
|
|
122
|
|
|||||||||||||
|
Income tax expense (benefit)
|
1,522
|
|
166
|
|
(148
|
)
|
1,540
|
|
(335
|
)
|
—
|
|
1,205
|
|
|||||||||||||
|
Segment income (loss)
(a)(b)(c)(d)(e)(f)(g)
|
2,504
|
|
408
|
|
(88
|
)
|
2,824
|
|
(238
|
)
|
(12
|
)
|
2,574
|
|
|||||||||||||
|
Add back noncontrolling interest component
|
|
|
|
|
|
|
|
|
|
|
|
|
16
|
|
|||||||||||||
|
Income from discontinued operations, net of tax
|
|
|
|
|
|
|
|
|
|
|
|
|
86
|
|
|||||||||||||
|
Net income
|
|
|
|
|
|
|
|
|
|
|
|
|
$
|
2,676
|
|
||||||||||||
|
Capital investments expenditures and acquisitions
|
$
|
5,049
|
|
$
|
67
|
|
$
|
268
|
|
$
|
5,384
|
|
$
|
223
|
|
$
|
—
|
|
$
|
5,607
|
|
||||||
|
Segment Assets
|
99,884
|
|
|
4,998
|
|
6,955
|
|
111,837
|
|
2,754
|
|
188
|
|
114,779
|
|
||||||||||||
|
(a)
|
In May 2013, the PUCO approved a Duke Energy Ohio settlement agreement that provides for a net annual increase in electric distribution revenues beginning in May 2013. This rate increase impacts Regulated Utilities.
|
|
(b)
|
In June 2013, NCUC approved a Duke Energy Progress settlement agreement that included an increase in rates in the first year beginning in June 2013. This rate increase impacts Regulated Utilities.
|
|
(c)
|
In September 2013, Duke Energy Carolinas implemented revised customer rates approved by the NCUC and the PSCSC. These rate increases impact Regulated Utilities.
|
130
PART II
DUKE ENERGY CORPORATION - DUKE ENERGY CAROLINAS, LLC - PROGRESS ENERGY, INC. –
DUKE ENERGY PROGRESS, LLC – DUKE ENERGY FLORIDA, LLC - DUKE ENERGY OHIO, INC. - DUKE ENERGY INDIANA, INC.
Combined Notes To Consolidated Financial Statements – (Continued)
|
(d)
|
Regulated Utilities recorded an impairment charge related to Duke Energy Florida's Crystal River Unit 3. See Note
4
for additional information.
|
|
(e)
|
Regulated Utilities recorded an impairment charge related to the letter Duke Energy Progress filed with the NRC requesting the NRC to suspend its review activities associated with the combined construction and operating license (COL) at the Harris site. Regulated Utilities also recorded an impairment charge related to the write-off of the wholesale portion of the Levy investments at Duke Energy Florida in accordance with the 2013 Settlement. See Note
4
for additional information.
|
|
(f)
|
Other includes costs to achieve mergers.
|
|
(g)
|
Other includes gain from the sale of Duke Energy's ownership interest in DukeNet. See Note
12
for additional information on the sale of DukeNet.
|
Geographical Information
|
(in millions)
|
U.S.
|
|
Latin America
(a)
|
|
Consolidated
|
|
|||||
|
2015
|
|
|
|
||||||||
|
Consolidated revenues
|
$
|
22,371
|
|
$
|
1,088
|
|
$
|
23,459
|
|
||
|
Consolidated long-lived assets
|
87,552
|
|
2,012
|
|
89,564
|
|
|||||
|
2014
|
|
|
|
||||||||
|
Consolidated revenues
|
$
|
22,508
|
|
$
|
1,417
|
|
$
|
23,925
|
|
||
|
Consolidated long-lived assets
|
80,709
|
|
2,458
|
|
83,167
|
|
|||||
|
2013
|
|
|
|
||||||||
|
Consolidated revenues
|
$
|
21,211
|
|
$
|
1,545
|
|
$
|
22,756
|
|
||
|
Consolidated long-lived assets
|
78,581
|
|
2,781
|
|
81,362
|
|
|||||
|
(a)
|
Change in amounts of long-lived assets in Latin America includes foreign currency translation adjustments on property, plant and equipment and other long-lived asset balances.
|
Products and Services
The following table summarizes revenues of the reportable segments by type.
|
Retail
|
|
Wholesale
|
|
Retail
|
|
Wholesale
|
|
Total
|
|
||||||||||||||
|
(in millions)
|
Electric
|
|
Electric
|
|
Natural Gas
|
|
Natural Gas
|
|
Other
|
|
Revenues
|
|
|||||||||||
|
2015
|
|
||||||||||||||||||||||
|
Regulated Utilities
|
$
|
18,695
|
|
$
|
2,014
|
|
$
|
546
|
|
$
|
—
|
|
$
|
807
|
|
$
|
22,062
|
|
|||||
|
International Energy
|
—
|
|
1,025
|
|
—
|
|
63
|
|
—
|
|
1,088
|
|
|||||||||||
|
Commercial Portfolio
|
—
|
|
260
|
|
—
|
|
—
|
|
41
|
|
301
|
|
|||||||||||
|
Total Reportable Segments
|
$
|
18,695
|
|
$
|
3,299
|
|
$
|
546
|
|
|
$
|
63
|
|
$
|
848
|
|
$
|
23,451
|
|
||||
|
2014
|
|
||||||||||||||||||||||
|
Regulated Utilities
|
$
|
19,007
|
|
$
|
1,879
|
|
$
|
571
|
|
$
|
—
|
|
$
|
814
|
|
$
|
22,271
|
|
|||||
|
International Energy
|
—
|
|
1,326
|
|
—
|
|
91
|
|
—
|
|
1,417
|
|
|||||||||||
|
Commercial Portfolio
|
—
|
|
255
|
|
—
|
|
—
|
|
—
|
|
255
|
|
|||||||||||
|
Total Reportable Segments
|
$
|
19,007
|
|
$
|
3,460
|
|
$
|
571
|
|
|
$
|
91
|
|
$
|
814
|
|
$
|
23,943
|
|
||||
|
2013
|
|
||||||||||||||||||||||
|
Regulated Utilities
|
$
|
17,837
|
|
$
|
1,720
|
|
$
|
506
|
|
$
|
—
|
|
$
|
847
|
|
$
|
20,910
|
|
|||||
|
International Energy
|
—
|
|
1,447
|
|
—
|
|
99
|
|
—
|
|
1,546
|
|
|||||||||||
|
Commercial Portfolio
|
—
|
|
260
|
|
—
|
|
—
|
|
—
|
|
260
|
|
|||||||||||
|
Total Reportable Segments
|
$
|
17,837
|
|
$
|
3,427
|
|
$
|
506
|
|
|
$
|
99
|
|
|
$
|
847
|
|
$
|
22,716
|
|
|||
Duke Energy Ohio
Duke Energy Ohio had two reportable operating segments, Regulated Utilities and Commercial Portfolio, prior to the sale of the nonregulated Midwest generation business. As a result of the sale discussed in Note 2, Commercial Portfolio no longer qualifies as a Duke Energy Ohio reportable operating segment. Therefore, for periods subsequent to the sale, beginning in the second quarter of 2015, all of the remaining assets and related results of operations previously presented in Commercial Portfolio are presented in Regulated Utilities and Other.
Regulated Utilities transmits and distributes electricity in portions of Ohio and generates, distributes and sells electricity in portions of Kentucky. Regulated Utilities also transports and sells natural gas in portions of Ohio and northern Kentucky. It conducts operations primarily through Duke Energy Ohio and its wholly owned subsidiary, Duke Energy Kentucky.
131
PART II
DUKE ENERGY CORPORATION - DUKE ENERGY CAROLINAS, LLC - PROGRESS ENERGY, INC. –
DUKE ENERGY PROGRESS, LLC – DUKE ENERGY FLORIDA, LLC - DUKE ENERGY OHIO, INC. - DUKE ENERGY INDIANA, INC.
Combined Notes To Consolidated Financial Statements – (Continued)
Other is primarily comprised of governance costs allocated by its parent, Duke Energy, and revenues and expenses related to Duke Energy Ohio's contractual arrangement to buy power from OVEC's power plants. For additional information on related party transactions refer to Note 9. See Note
13
for additional information. All of Duke Energy Ohio’s revenues are generated domestically and its long-lived assets are all in the U.S.
|
|
Year Ended December 31, 2015
|
||||||||||||||||||||||
|
Total
|
|
||||||||||||||||||||||
|
Regulated
|
|
Commercial
|
|
Reportable
|
|
||||||||||||||||||
|
(in millions)
|
Utilities
|
|
Portfolio
|
|
Segments
|
|
Other
|
|
Eliminations
|
|
Total
|
|
|||||||||||
|
Unaffiliated revenues
|
$
|
1,872
|
|
$
|
14
|
|
$
|
1,886
|
|
$
|
19
|
|
$
|
—
|
|
$
|
1,905
|
|
|||||
|
Intersegment revenues
|
1
|
|
—
|
|
1
|
|
—
|
|
(1
|
)
|
—
|
|
|||||||||||
|
Total revenues
|
$
|
1,873
|
|
$
|
14
|
|
$
|
1,887
|
|
$
|
19
|
|
$
|
(1
|
)
|
$
|
1,905
|
|
|||||
|
Interest expense
|
$
|
78
|
|
$
|
—
|
|
$
|
78
|
|
$
|
1
|
|
$
|
—
|
|
$
|
79
|
|
|||||
|
Depreciation and amortization
|
226
|
|
—
|
|
226
|
|
1
|
|
—
|
|
227
|
|
|||||||||||
|
Income tax expense (benefit)
|
105
|
|
(5
|
)
|
100
|
|
(19
|
)
|
—
|
|
81
|
|
|||||||||||
|
Segment income (loss)
|
191
|
|
(8
|
)
|
183
|
|
(33
|
)
|
(1
|
)
|
149
|
|
|||||||||||
|
Income from discontinued operations, net of tax
|
23
|
|
|||||||||||||||||||||
|
Net income
|
|
|
|
|
|
|
|
|
$
|
172
|
|
||||||||||||
|
Capital expenditures
|
$
|
399
|
|
$
|
—
|
|
$
|
399
|
|
$
|
—
|
|
$
|
—
|
|
$
|
399
|
|
|||||
|
Segment assets
|
7,050
|
|
—
|
|
7,050
|
|
55
|
|
(8
|
)
|
7,097
|
|
|||||||||||
|
Year Ended December 31, 2014
|
|||||||||||||||||||||||
|
Total
|
|
||||||||||||||||||||||
|
Regulated
|
|
Commercial
|
|
Reportable
|
|
||||||||||||||||||
|
(in millions)
|
Utilities
|
|
Portfolio
|
|
Segments
|
|
Other
|
|
Eliminations
|
|
Total
|
|
|||||||||||
|
Unaffiliated revenues
|
$
|
1,894
|
|
$
|
19
|
|
$
|
1,913
|
|
$
|
—
|
|
$
|
—
|
|
$
|
1,913
|
|
|||||
|
Intersegment revenues
|
1
|
|
—
|
|
1
|
|
—
|
|
(1
|
)
|
—
|
|
|||||||||||
|
Total revenues
|
$
|
1,895
|
|
$
|
19
|
|
$
|
1,914
|
|
$
|
—
|
|
$
|
(1
|
)
|
$
|
1,913
|
|
|||||
|
Interest expense
|
$
|
81
|
|
$
|
5
|
|
$
|
86
|
|
$
|
—
|
|
$
|
—
|
|
$
|
86
|
|
|||||
|
Depreciation and amortization
|
211
|
|
2
|
|
213
|
|
1
|
|
—
|
|
214
|
|
|||||||||||
|
Income tax expense (benefit)
|
117
|
|
(67
|
)
|
50
|
|
(7
|
)
|
—
|
|
43
|
|
|||||||||||
|
Segment income (loss)
(a)
|
202
|
|
(121
|
)
|
81
|
|
(13
|
)
|
—
|
|
68
|
|
|||||||||||
|
Income from discontinued operations, net of tax
|
(563
|
)
|
|||||||||||||||||||||
|
Net loss
|
|
|
|
|
|
|
|
|
$
|
(495
|
)
|
||||||||||||
|
Capital expenditures
|
$
|
300
|
|
$
|
22
|
|
$
|
322
|
|
$
|
—
|
|
$
|
—
|
|
$
|
322
|
|
|||||
|
Segment assets
|
6,902
|
|
3,187
|
|
10,089
|
|
134
|
|
(230
|
)
|
9,993
|
|
|||||||||||
|
(a)
|
Commercial Portfolio recorded a
$94 million
pretax impairment charge related to OVEC.
|
|
Year Ended December 31, 2013
|
|||||||||||||||||||||||
|
Total
|
|
||||||||||||||||||||||
|
Regulated
|
|
Commercial
|
|
Reportable
|
|
||||||||||||||||||
|
(in millions)
|
Utilities
|
|
Portfolio
|
|
Segments
|
|
Other
|
|
Eliminations
|
|
Total
|
|
|||||||||||
|
Total revenues
|
$
|
1,765
|
|
$
|
40
|
|
$
|
1,805
|
|
$
|
—
|
|
$
|
—
|
|
$
|
1,805
|
|
|||||
|
Interest expense
|
$
|
74
|
|
$
|
—
|
|
$
|
74
|
|
$
|
—
|
|
$
|
—
|
|
$
|
74
|
|
|||||
|
Depreciation and amortization
|
200
|
|
13
|
|
213
|
|
—
|
|
—
|
|
213
|
|
|||||||||||
|
Income tax expense (benefit)
|
91
|
|
(36
|
)
|
55
|
|
(12
|
)
|
—
|
|
43
|
|
|||||||||||
|
Segment income (loss)
|
151
|
|
(65
|
)
|
86
|
|
(19
|
)
|
—
|
|
67
|
|
|||||||||||
|
Income from discontinued operations, net of tax
|
35
|
|
|||||||||||||||||||||
|
Net income
|
|
|
|
|
|
|
|
|
$
|
102
|
|
||||||||||||
|
Capital expenditures
|
$
|
375
|
|
$
|
58
|
|
$
|
433
|
|
$
|
—
|
|
$
|
—
|
|
$
|
433
|
|
|||||
|
Segment assets
|
6,649
|
|
4,170
|
|
10,819
|
|
99
|
|
(155
|
)
|
10,763
|
|
|||||||||||
132
PART II
DUKE ENERGY CORPORATION - DUKE ENERGY CAROLINAS, LLC - PROGRESS ENERGY, INC. –
DUKE ENERGY PROGRESS, LLC – DUKE ENERGY FLORIDA, LLC - DUKE ENERGY OHIO, INC. - DUKE ENERGY INDIANA, INC.
Combined Notes To Consolidated Financial Statements – (Continued)
DUKE ENERGY CAROLINAS, PROGRESS ENERGY, DUKE ENERGY PROGRESS, DUKE ENERGY FLORIDA AND DUKE ENERGY INDIANA
The remaining Subsidiary Registrants each have
one
reportable operating segment, Regulated Utilities, which generates, transmits, distributes and sells electricity. The remainder of each company’s operations is classified as Other. While not considered a reportable segment for any of these companies, Other consists of certain unallocated corporate costs. Other for Progress Energy also includes interest expense on corporate debt instruments of
$240 million
,
$241 million
and
$300 million
for the years ended
December 31, 2015
,
2014
and
2013
. The following table summarizes the net loss for Other for each of these entities.
|
|
Years Ended December 31,
|
||||||||||
|
(in millions)
|
2015
|
|
2014
|
|
2013
|
|
|||||
|
Duke Energy Carolinas
|
$
|
(95
|
)
|
$
|
(79
|
)
|
$
|
(97
|
)
|
||
|
Progress Energy
|
(159
|
)
|
(190
|
)
|
(241
|
)
|
|||||
|
Duke Energy Progress
|
(32
|
)
|
(31
|
)
|
(46
|
)
|
|||||
|
Duke Energy Florida
|
(16
|
)
|
(19
|
)
|
(24
|
)
|
|||||
|
Duke Energy Indiana
|
(10
|
)
|
(11
|
)
|
(16
|
)
|
|||||
Duke Energy Progress earned approximately
10 percent
of its consolidated operating revenues from North Carolina Electric Membership Corporation (NCEMC) in 2015. These revenues relate to wholesale contracts and transmission revenues. The assets Duke Energy Carolinas, Progress Energy, Duke Energy Progress, Duke Energy Florida and Duke Energy Indiana are substantially all included within the Regulated Utilities segment at
December 31, 2015
,
2014
and
2013
.3
4. REGULATORY MATTERS
Regulatory Assets and Liabilities
The Duke Energy Registrants record regulatory assets and liabilities that result from the ratemaking process. See Note
1
for further information.
133
PART II
DUKE ENERGY CORPORATION - DUKE ENERGY CAROLINAS, LLC - PROGRESS ENERGY, INC. –
DUKE ENERGY PROGRESS, LLC – DUKE ENERGY FLORIDA, LLC - DUKE ENERGY OHIO, INC. - DUKE ENERGY INDIANA, INC.
Combined Notes To Consolidated Financial Statements – (Continued)
The following tables present the regulatory assets and liabilities recorded on the Consolidated Balance Sheets.
|
December 31, 2015
|
|||||||||||||||||||||||||||
|
Duke
|
|
Duke
|
|
Duke
|
|
Duke
|
|
Duke
|
|
||||||||||||||||||
|
Duke
|
|
Energy
|
|
Progress
|
|
Energy
|
|
Energy
|
|
Energy
|
|
Energy
|
|
||||||||||||||
|
(in millions)
|
Energy
|
|
Carolinas
|
|
Energy
|
|
Progress
|
|
Florida
|
|
Ohio
|
|
Indiana
|
|
|||||||||||||
|
Regulatory Assets
|
|||||||||||||||||||||||||||
|
Asset retirement obligations – coal ash
|
$
|
2,555
|
|
$
|
1,120
|
|
$
|
1,394
|
|
$
|
1,386
|
|
$
|
8
|
|
$
|
4
|
|
$
|
37
|
|
||||||
|
Asset retirement obligations – nuclear and other
|
838
|
|
104
|
|
487
|
|
195
|
|
292
|
|
—
|
|
—
|
|
|||||||||||||
|
Accrued pension and OPEB
|
2,151
|
|
479
|
|
807
|
|
366
|
|
441
|
|
139
|
|
220
|
|
|||||||||||||
|
Retired generation facilities
|
509
|
|
49
|
|
409
|
|
179
|
|
230
|
|
—
|
|
51
|
|
|||||||||||||
|
Debt fair value adjustment
|
1,191
|
|
—
|
|
—
|
|
—
|
|
—
|
|
—
|
|
—
|
|
|||||||||||||
|
Net regulatory asset related to income taxes
|
1,075
|
|
564
|
|
318
|
|
106
|
|
212
|
|
55
|
|
120
|
|
|||||||||||||
|
Nuclear asset securitizable balance, net
|
1,237
|
|
—
|
|
1,237
|
|
—
|
|
1,237
|
|
—
|
|
—
|
|
|||||||||||||
|
Hedge costs and other deferrals
|
571
|
|
127
|
|
410
|
|
171
|
|
239
|
|
7
|
|
27
|
|
|||||||||||||
|
Demand side management (DSM)/Energy efficiency (EE)
|
340
|
|
80
|
|
250
|
|
237
|
|
13
|
|
10
|
|
—
|
|
|||||||||||||
|
Grid Modernization
|
68
|
|
—
|
|
—
|
|
—
|
|
—
|
|
68
|
|
—
|
|
|||||||||||||
|
Vacation accrual
|
192
|
|
79
|
|
38
|
|
38
|
|
—
|
|
5
|
|
10
|
|
|||||||||||||
|
Deferred fuel and purchased power
|
151
|
|
21
|
|
129
|
|
93
|
|
36
|
|
1
|
|
—
|
|
|||||||||||||
|
Nuclear deferral
|
245
|
|
107
|
|
138
|
|
62
|
|
76
|
|
—
|
|
—
|
|
|||||||||||||
|
Post-in-service carrying costs and deferred operating expenses
|
383
|
|
97
|
|
38
|
|
38
|
|
—
|
|
21
|
|
227
|
|
|||||||||||||
|
Gasification services agreement buyout
|
32
|
|
—
|
|
—
|
|
—
|
|
—
|
|
—
|
|
32
|
|
|||||||||||||
|
Transmission expansion obligation
|
72
|
|
—
|
|
—
|
|
—
|
|
—
|
|
72
|
|
—
|
|
|||||||||||||
|
Manufactured gas plant (MGP)
|
104
|
|
—
|
|
—
|
|
—
|
|
—
|
|
104
|
|
—
|
|
|||||||||||||
|
NCEMPA deferrals
|
21
|
|
—
|
|
21
|
|
21
|
|
—
|
|
—
|
|
—
|
|
|||||||||||||
|
East Bend deferrals
|
16
|
|
—
|
|
—
|
|
—
|
|
—
|
|
16
|
|
—
|
|
|||||||||||||
|
Other
|
499
|
|
244
|
|
121
|
|
82
|
|
39
|
|
31
|
|
94
|
|
|||||||||||||
|
Total regulatory assets
|
12,250
|
|
3,071
|
|
5,797
|
|
2,974
|
|
2,823
|
|
533
|
|
818
|
|
|||||||||||||
|
Less: current portion
|
877
|
|
305
|
|
362
|
|
264
|
|
98
|
|
36
|
|
102
|
|
|||||||||||||
|
Total noncurrent regulatory assets
|
$
|
11,373
|
|
$
|
2,766
|
|
$
|
5,435
|
|
$
|
2,710
|
|
$
|
2,725
|
|
$
|
497
|
|
$
|
716
|
|
||||||
|
December 31, 2015
|
|||||||||||||||||||||||||||
|
Duke
|
|
Duke
|
|
Duke
|
|
Duke
|
|
Duke
|
|
||||||||||||||||||
|
Duke
|
|
Energy
|
|
Progress
|
|
Energy
|
|
Energy
|
|
Energy
|
|
Energy
|
|
||||||||||||||
|
(in millions)
|
Energy
|
|
Carolinas
|
|
Energy
|
|
Progress
|
|
Florida
|
|
Ohio
|
|
Indiana
|
|
|||||||||||||
|
Regulatory Liabilities
|
|
|
|
|
|
|
|
||||||||||||||||||||
|
Costs of removal
|
$
|
5,329
|
|
$
|
2,413
|
|
$
|
2,078
|
|
$
|
1,725
|
|
$
|
353
|
|
$
|
222
|
|
$
|
616
|
|
||||||
|
Amounts to be refunded to customers
|
71
|
|
—
|
|
—
|
|
—
|
|
—
|
|
—
|
|
71
|
|
|||||||||||||
|
Storm reserve
|
150
|
|
24
|
|
125
|
|
—
|
|
125
|
|
1
|
|
—
|
|
|||||||||||||
|
Accrued pension and OPEB
|
288
|
|
68
|
|
51
|
|
25
|
|
26
|
|
21
|
|
83
|
|
|||||||||||||
|
Deferred fuel and purchased power
|
311
|
|
55
|
|
255
|
|
58
|
|
197
|
|
1
|
|
—
|
|
|||||||||||||
|
Other
|
506
|
|
281
|
|
164
|
|
155
|
|
8
|
|
12
|
|
46
|
|
|||||||||||||
|
Total regulatory liabilities
|
6,655
|
|
2,841
|
|
2,673
|
|
1,963
|
|
709
|
|
257
|
|
816
|
|
|||||||||||||
|
Less: current portion
|
400
|
|
39
|
|
286
|
|
85
|
|
200
|
|
12
|
|
62
|
|
|||||||||||||
|
Total noncurrent regulatory liabilities
|
$
|
6,255
|
|
$
|
2,802
|
|
$
|
2,387
|
|
$
|
1,878
|
|
$
|
509
|
|
$
|
245
|
|
$
|
754
|
|
||||||
134
PART II
DUKE ENERGY CORPORATION - DUKE ENERGY CAROLINAS, LLC - PROGRESS ENERGY, INC. –
DUKE ENERGY PROGRESS, LLC – DUKE ENERGY FLORIDA, LLC - DUKE ENERGY OHIO, INC. - DUKE ENERGY INDIANA, INC.
Combined Notes To Consolidated Financial Statements – (Continued)
|
|
December 31, 2014
|
||||||||||||||||||||||||||
|
Duke
|
|
Duke
|
|
Duke
|
|
Duke
|
|
Duke
|
|
||||||||||||||||||
|
Duke
|
|
Energy
|
|
Progress
|
|
Energy
|
|
Energy
|
|
Energy
|
|
Energy
|
|
||||||||||||||
|
(in millions)
|
Energy
|
|
Carolinas
|
|
Energy
|
|
Progress
|
|
Florida
|
|
Ohio
|
|
Indiana
|
|
|||||||||||||
|
Regulatory Assets
|
|
|
|
|
|
|
|
||||||||||||||||||||
|
Asset retirement obligations – coal ash
|
$
|
1,992
|
|
$
|
840
|
|
$
|
1,152
|
|
$
|
1,152
|
|
$
|
—
|
|
$
|
—
|
|
$
|
—
|
|
||||||
|
Asset retirement obligations – nuclear and other
|
1,025
|
|
67
|
|
730
|
|
432
|
|
298
|
|
—
|
|
—
|
|
|||||||||||||
|
Accrued pension and OPEB
|
2,015
|
|
412
|
|
812
|
|
354
|
|
458
|
|
132
|
|
217
|
|
|||||||||||||
|
Retired generation facilities
|
1,659
|
|
58
|
|
1,545
|
|
152
|
|
1,393
|
|
—
|
|
56
|
|
|||||||||||||
|
Debt fair value adjustment
|
1,305
|
|
—
|
|
—
|
|
—
|
|
—
|
|
—
|
|
—
|
|
|||||||||||||
|
Net regulatory asset related to income taxes
|
1,144
|
|
614
|
|
354
|
|
141
|
|
213
|
|
64
|
|
111
|
|
|||||||||||||
|
Hedge costs and other deferrals
|
628
|
|
103
|
|
490
|
|
217
|
|
273
|
|
7
|
|
28
|
|
|||||||||||||
|
DSM/EE
|
330
|
|
106
|
|
203
|
|
193
|
|
10
|
|
21
|
|
—
|
|
|||||||||||||
|
Grid Modernization
|
76
|
|
—
|
|
—
|
|
—
|
|
—
|
|
76
|
|
—
|
|
|||||||||||||
|
Vacation accrual
|
213
|
|
86
|
|
46
|
|
46
|
|
—
|
|
6
|
|
12
|
|
|||||||||||||
|
Deferred fuel and purchased power
|
246
|
|
50
|
|
182
|
|
138
|
|
44
|
|
9
|
|
5
|
|
|||||||||||||
|
Nuclear deferral
|
296
|
|
141
|
|
155
|
|
43
|
|
112
|
|
—
|
|
—
|
|
|||||||||||||
|
Post-in-service carrying costs and deferred operating expenses
|
494
|
|
124
|
|
121
|
|
28
|
|
93
|
|
21
|
|
228
|
|
|||||||||||||
|
Gasification services agreement buyout
|
55
|
|
—
|
|
—
|
|
—
|
|
—
|
|
—
|
|
55
|
|
|||||||||||||
|
Transmission expansion obligation
|
70
|
|
—
|
|
—
|
|
—
|
|
—
|
|
74
|
|
—
|
|
|||||||||||||
|
MGP
|
115
|
|
—
|
|
—
|
|
—
|
|
—
|
|
115
|
|
—
|
|
|||||||||||||
|
Other
|
494
|
|
263
|
|
109
|
|
66
|
|
42
|
|
36
|
|
66
|
|
|||||||||||||
|
Total regulatory assets
|
12,157
|
|
2,864
|
|
5,899
|
|
2,962
|
|
2,936
|
|
561
|
|
778
|
|
|||||||||||||
|
Less: current portion
|
1,115
|
|
399
|
|
491
|
|
287
|
|
203
|
|
49
|
|
93
|
|
|||||||||||||
|
Total noncurrent regulatory assets
|
$
|
11,042
|
|
$
|
2,465
|
|
$
|
5,408
|
|
$
|
2,675
|
|
$
|
2,733
|
|
$
|
512
|
|
$
|
685
|
|
||||||
|
|
December 31, 2014
|
||||||||||||||||||||||||||
|
Duke
|
|
Duke
|
|
Duke
|
|
Duke
|
|
Duke
|
|
||||||||||||||||||
|
Duke
|
|
Energy
|
|
Progress
|
|
Energy
|
|
Energy
|
|
Energy
|
|
Energy
|
|
||||||||||||||
|
(in millions)
|
Energy
|
|
Carolinas
|
|
Energy
|
|
Progress
|
|
Florida
|
|
Ohio
|
|
Indiana
|
|
|||||||||||||
|
Regulatory Liabilities
|
|
|
|
|
|
|
|
||||||||||||||||||||
|
Costs of removal
|
$
|
5,221
|
|
$
|
2,420
|
|
$
|
1,975
|
|
$
|
1,692
|
|
$
|
283
|
|
$
|
222
|
|
$
|
613
|
|
||||||
|
Amounts to be refunded to customers
|
166
|
|
—
|
|
70
|
|
—
|
|
70
|
|
—
|
|
96
|
|
|||||||||||||
|
Storm reserve
|
150
|
|
25
|
|
125
|
|
—
|
|
125
|
|
—
|
|
—
|
|
|||||||||||||
|
Accrued pension and OPEB
|
379
|
|
76
|
|
121
|
|
61
|
|
60
|
|
19
|
|
91
|
|
|||||||||||||
|
Deferred fuel and purchased power
|
37
|
|
6
|
|
23
|
|
23
|
|
—
|
|
—
|
|
8
|
|
|||||||||||||
|
Other
|
444
|
|
217
|
|
171
|
|
127
|
|
44
|
|
10
|
|
42
|
|
|||||||||||||
|
Total regulatory liabilities
|
6,397
|
|
2,744
|
|
2,485
|
|
1,903
|
|
582
|
|
251
|
|
850
|
|
|||||||||||||
|
Less: current portion
|
204
|
|
34
|
|
106
|
|
71
|
|
35
|
|
10
|
|
54
|
|
|||||||||||||
|
Total noncurrent regulatory liabilities
|
$
|
6,193
|
|
$
|
2,710
|
|
$
|
2,379
|
|
$
|
1,832
|
|
$
|
547
|
|
$
|
241
|
|
$
|
796
|
|
||||||
Descriptions of regulatory assets and liabilities, summarized in the tables above, as well as their recovery and amortization periods follow. Items are excluded from rate base unless otherwise noted.
Asset retirement obligations
–
coal ash.
Represents regulatory assets including deferred depreciation and accretion related to the legal obligation to close ash basins. The costs are deferred until recovery treatment has been determined. The recovery period for these costs has yet to be established. Duke Energy Carolinas, Duke Energy Progress and Duke Energy Ohio earn a debt return on their expenditures. See Notes
1
and
9
for additional information.
Asset retirement obligations
–
nuclear and other.
Represents regulatory assets, including deferred depreciation and accretion, related to legal obligations associated with the future retirement of property, plant and equipment, excluding amounts related to coal ash. The Asset retirement obligations relate primarily to decommissioning nuclear power facilities. The amounts also include certain deferred gains on NDTF investments. The recovery period for costs related to nuclear facilities runs through the decommissioning period of each nuclear unit, the latest of which is currently estimated to be 2086. See Notes
1
and
9
for additional information.
135
PART II
DUKE ENERGY CORPORATION - DUKE ENERGY CAROLINAS, LLC - PROGRESS ENERGY, INC. –
DUKE ENERGY PROGRESS, LLC – DUKE ENERGY FLORIDA, LLC - DUKE ENERGY OHIO, INC. - DUKE ENERGY INDIANA, INC.
Combined Notes To Consolidated Financial Statements – (Continued)
Accrued pension and OPEB.
Accrued pension and OPEB represent regulatory assets and liabilities related to each of the Duke Energy Registrants’ respective shares of unrecognized actuarial gains and losses and unrecognized prior service cost and credit attributable to Duke Energy’s pension plans and OPEB plans. The regulatory asset or liability is amortized with the recognition of actuarial gains and losses and prior service cost and credit to net periodic benefit costs for pension and OPEB plans. See Note
21
for additional detail.
Retired generation facilities.
Duke Energy Florida earns a full return on a portion of the regulatory asset related to the retired nuclear plant currently recovered in the nuclear cost recovery clause (NCRC), with the remaining portion earning a reduced return. Duke Energy Carolinas earns a return on the outstanding retail balance with recovery periods ranging from
five
to
10 years
. Duke Energy Progress earns a return on the outstanding balance with recovery over a period of
10 years
for retail purposes and over the longer of
10 years
or the previously estimated planned retirement date for wholesale purposes. Duke Energy Indiana earns a return on the outstanding balances and the costs are included in rate base.
Debt fair value adjustment.
Purchase accounting adjustment recorded to state the carrying value of Progress Energy at fair value in connection with the 2012 merger. Amount is amortized over the life of the related debt.
Net regulatory asset related to income taxes.
Regulatory assets principally associated with the depreciation and recovery of AFUDC equity. Amounts have no impact on rate base as regulatory assets are offset by deferred tax liabilities. The recovery period is over the life of the associated assets. Amounts for Duke Energy, Duke Energy Carolinas, Progress Energy and Duke Energy Progress include regulatory liabilities related to the change in the North Carolina corporate tax rate discussed in Note 22.
Nuclear asset securitizable balance, net.
Represents the balance associated with Crystal River Unit 3 retirement approved for recovery by the FPSC on September 15, 2015, and the deferred operating expenses expected to be securitized in 2016 upon issuance of the associated bonds. The regulatory asset balance is net of the AFUDC equity portion of the
$1.283 billion
amount approved by the FPSC. The regulatory asset balance approved for recovery by the FPSC will earn a reduced return until the expected bond issuance, after which it will earn a return in rates to recover the interest costs of the associated debt. Once bonds are issued, the balance will be recovered over approximately
20 years
. This regulatory asset is not included in rate base.
Hedge costs and other deferrals.
Amounts relate to unrealized gains and losses on derivatives recorded as a regulatory asset or liability, respectively, until the contracts are settled. The recovery period varies for these costs and currently extends to 2048.
DSM/EE.
The recovery period varies for these costs, with some currently unknown. Duke Energy Carolinas, Duke Energy Progress and Duke Energy Florida are required to pay interest on the outstanding liability balance. Duke Energy Carolinas, Duke Energy Progress and Duke Energy Florida collect a return on DSM/EE investments.
Grid Modernization.
Represents deferred depreciation and operating expenses as well as carrying costs on the portion of capital expenditures placed in service but not yet reflected in retail rates as plant in service. Recovery period is generally one year for depreciation and operating expenses. Recovery for post-in-service carrying costs is over the life of the assets. Duke Energy Ohio is earning a return on these costs.
Vacation accrual.
Generally recovered within one year.
Deferred fuel and purchased power.
Represents certain energy related costs that are recoverable or refundable as approved by the applicable regulatory body. Duke Energy Florida amount includes capacity costs. Duke Energy Florida earns a return on the retail portion of under-recovered costs. Duke Energy Ohio earns a return on under-recovered costs. Duke Energy Florida and Duke Energy Ohio pay interest on over-recovered costs. Duke Energy Carolinas and Duke Energy Progress amounts include certain purchased power costs in both North Carolina and South Carolina and costs of distributed energy resource programs in South Carolina. Duke Energy Carolinas and Duke Energy Progress pay interest on over-recovered costs in North Carolina. Recovery period is generally over one year. Duke Energy Indiana recovery period is quarterly.
Nuclear deferral.
Includes (i) amounts related to levelizing nuclear plant outage costs at Duke Energy Carolinas in North Carolina and South Carolina, and Duke Energy Progress in North Carolina, which allows for the recognition of nuclear outage expenses over the refueling cycle rather than when the outage occurs, resulting in the deferral of operations and maintenance costs associated with refueling and (ii) certain deferred preconstruction and carrying costs at Duke Energy Florida as approved by the FPSC primarily associated with Levy, with a final true-up to be filed by May 2017.
Post-in-service carrying costs and deferred operating expenses.
Represents deferred depreciation and operating expenses as well as carrying costs on the portion of capital expenditures placed in service but not yet reflected in retail rates as plant in service. Duke Energy Carolinas, Duke Energy Progress, Duke Energy Ohio and Duke Energy Indiana earn a return on the outstanding balance. Duke Energy Florida earns a return at a reduced rate. For Duke Energy Ohio and Duke Energy Indiana, some amounts are included in rate base. Recovery is over various lives, and the latest recovery period is 2082.
Gasification services agreement buyout.
The IURC authorized Duke Energy Indiana to recover costs incurred to buyout a gasification services agreement, including carrying costs through 2018.
Transmission expansion obligation.
Represents transmission expansion obligations related to Duke Energy Ohio’s withdrawal from Midcontinent Independent System Operator, Inc. (MISO).
MGP.
Represents remediation costs for former MGP sites. In November 2013, the PUCO approved recovery of costs incurred through 2019. Duke Energy Ohio does not earn a return on these costs.
NCEMPA deferrals.
Represents retail allocated cost deferrals and returns associated with the additional ownership interest in assets acquired from NCEMPA discussed in Note 2. The North Carolina retail allocated costs are generally being recovered, over a period of time between three years and the remaining life of the assets purchased, through a rider that became effective on December 1, 2015. The South Carolina retail allocated costs are being deferred until Duke Energy Progress' next general rate case, earning a return pursuant to an order received from the PSCSC.
136
PART II
DUKE ENERGY CORPORATION - DUKE ENERGY CAROLINAS, LLC - PROGRESS ENERGY, INC. –
DUKE ENERGY PROGRESS, LLC – DUKE ENERGY FLORIDA, LLC - DUKE ENERGY OHIO, INC. - DUKE ENERGY INDIANA, INC.
Combined Notes To Consolidated Financial Statements – (Continued)
East Bend deferrals.
Represents both deferred operating expenses and deferred depreciation as well as carrying costs on the portion of East Bend that was acquired from Dayton Power and Light and that had been previously operated as a jointly owned facility. Recovery will not commence until the settlement of the next rate case in Kentucky. Duke Energy Ohio is earning a return on these deferred costs.
Costs of removal.
Represents funds received from customers to cover the future removal of property, plant and equipment from retired or abandoned sites as property is retired. Also includes certain deferred gains on NDTF investments.
Amounts to be refunded to customers.
Represents required rate reductions to retail customers by the applicable regulatory body. The period of refund for Duke Energy Indiana is through 2017.
Storm reserve.
Duke Energy Carolinas and Duke Energy Florida are allowed to petition the PSCSC and FPSC, respectively, to seek recovery of named storms. Funds are used to offset future incurred costs.
Restrictions on the Ability of Certain Subsidiaries to Make Dividends, Advances and Loans to Duke Energy
As a condition to the approval of merger transactions, the NCUC, PSCSC, PUCO, KPSC and IURC imposed conditions on the ability of Duke Energy Carolinas, Duke Energy Progress, Duke Energy Ohio, Duke Energy Kentucky and Duke Energy Indiana to transfer funds to Duke Energy through loans or advances, as well as restricted amounts available to pay dividends to Duke Energy. Certain subsidiaries may transfer funds to Duke Energy Corporation Holding Company (the parent) by obtaining approval of the respective state regulatory commissions. These conditions imposed restrictions on the ability of the public utility subsidiaries to pay cash dividends as discussed below.
Duke Energy Progress and Duke Energy Florida also have restrictions imposed by their first mortgage bond indentures and Articles of Incorporation which, in certain circumstances, limit their ability to make cash dividends or distributions on common stock. Amounts restricted as a result of these provisions were not material at
December 31, 2015
.
Additionally, certain other subsidiaries of Duke Energy have restrictions on their ability to dividend, loan or advance funds to Duke Energy due to specific legal or regulatory restrictions, including, but not limited to, minimum working capital and tangible net worth requirements.
Duke Energy Carolinas
Duke Energy Carolinas must limit cumulative distributions subsequent to mergers to (i) the amount of retained earnings on the day prior to the closing of the mergers, plus (ii) any future earnings recorded.
Duke Energy Progress
Duke Energy Progress must limit cumulative distributions subsequent to the merger between Duke Energy and Progress Energy to (i) the amount of retained earnings on the day prior to the closing of the merger, plus (ii) any future earnings recorded.
Duke Energy Ohio
Duke Energy Ohio will not declare and pay dividends out of capital or unearned surplus without the prior authorization of the PUCO. Duke Energy Ohio received FERC and PUCO approval to pay dividends from its equity accounts that are reflective of the amount that it would have in its retained earnings account had push-down accounting for the Cinergy Corp. (Cinergy) merger not been applied to Duke Energy Ohio’s balance sheet. The conditions include a commitment from Duke Energy Ohio that equity, adjusted to remove the impacts of push-down accounting, will not fall below
30 percent
of total capital.
Duke Energy Kentucky is required to pay dividends solely out of retained earnings and to maintain a minimum of
35 percent
equity in its capital structure.
Duke Energy Indiana
Duke Energy Indiana must limit cumulative distributions subsequent to the merger between Duke Energy and Cinergy to (i) the amount of retained earnings on the day prior to the closing of the merger, plus (ii) any future earnings recorded. In addition, Duke Energy Indiana will not declare and pay dividends out of capital or unearned surplus without prior authorization of the IURC.
The restrictions discussed above were less than
25 percent
of Duke Energy's net assets at
December 31, 2015
.
Rate Related Information
The NCUC, PSCSC, FPSC, IURC, PUCO and KPSC approve rates for retail electric and natural gas services within their states. The FERC approves rates for electric sales to wholesale customers served under cost-based rates (excluding Ohio and Indiana), as well as sales of transmission service.
Duke Energy Carolinas
FERC Transmission Return on Equity Complaint
On January 7, 2016, a customer group filed a complaint with the FERC that the rate of return on equity of
10.2 percent
in Duke Energy Carolinas' transmission formula rates is excessive and should be reduced to no higher than
8.49 percent
, effective upon the complaint date. The customer group requests consolidation with a similar complaint filed against Duke Energy Progress on the same day. Duke Energy Carolinas cannot predict the outcome of this matter.
137
PART II
DUKE ENERGY CORPORATION - DUKE ENERGY CAROLINAS, LLC - PROGRESS ENERGY, INC. –
DUKE ENERGY PROGRESS, LLC – DUKE ENERGY FLORIDA, LLC - DUKE ENERGY OHIO, INC. - DUKE ENERGY INDIANA, INC.
Combined Notes To Consolidated Financial Statements – (Continued)
William States Lee Combined Cycle Facility
On April 9, 2014, the PSCSC granted Duke Energy Carolinas and NCEMC a Certificate of Environmental Compatibility and Public Convenience and Necessity (CECPCN) for the construction and operation of a 750 MW combined-cycle natural gas-fired generating plant at Duke Energy Carolinas' existing William States Lee Generating Station in Anderson, South Carolina. Duke Energy Carolinas began construction in July 2015 and estimates a cost to build of
$600 million
for its share of the facility, including AFUDC. The project is expected to be commercially available in late 2017. NCEMC will own approximately
13 percent
of the project. On July 3, 2014, the South Carolina Coastal Conservation League and Southern Alliance for Clean Energy jointly filed a Notice of Appeal with the Court of Appeals of South Carolina seeking the court's review of the PSCSC's decision, claiming the PSCSC did not properly consider a request related to a proposed solar facility prior to granting approval of the CECPCN. The Court of Appeals affirmed the PSCSC's decision on February 10, 2016. On February 23, 2016, the South Carolina Coastal Conservation League and Southern Alliance for Clean Energy filed a petition for rehearing with the Court of Appeals.
William States Lee III Nuclear Station
In December 2007, Duke Energy Carolinas applied to the NRC for a COL for two Westinghouse AP1000 (advanced passive) reactors for the proposed William States Lee III Nuclear Station (Lee Nuclear Station) at a site in Cherokee County, South Carolina. Submitting the COL application did not commit Duke Energy Carolinas to build nuclear units. Through several separate orders, the NCUC and PSCSC concurred with the prudency of Duke Energy Carolinas incurring certain project development and pre-construction costs, although recovery of costs is not guaranteed. Duke Energy Carolinas has incurred approximately
$471 million
, including AFUDC through
December 31, 2015
. This amount is included in
Net property, plant and equipment
on Duke Energy Carolinas’ Consolidated Balance Sheets.
Design changes have been identified in the Westinghouse AP1000 certified design that must be addressed before NRC can complete its review of the Lee Nuclear Station COL application. These design changes set the schedule for completion of the NRC COL application review and issuance of the Lee COL. Receipt of the Lee Nuclear Station COL is currently expected by late 2016.
Duke Energy Progress
FERC Transmission Return on Equity Complaint
On January 7, 2016, a customer group filed a complaint with the FERC that the rate of return on equity of
10.8 percent
in Duke Energy Progress' transmission formula rates is excessive and should be reduced to no higher than
8.49 percent
, effective upon the complaint date. The customer group requests consolidation with a similar complaint filed against Duke Energy Carolinas on the same day. Duke Energy Progress cannot predict the outcome of this matter.
Sutton Black Start Combustion Turbine CPCN
On April 15, 2015, Duke Energy Progress filed a Certificate of Public Convenience and Necessity (CPCN) application with the NCUC for approval to construct an 84 MW black start combustion turbine (CT) project at the existing Sutton Plant (Sutton Black Start CT Project). The Sutton Black Start CT Project would replace three existing CTs with total capacity of 61 MW with two new 42 MW CT units with black start and fast start capability. In addition to peaking system capacity, the Sutton Black Start CT Project will provide regional black start capability and tertiary backup power services for the Brunswick Nuclear Plant. In June 2015, the Public Staff of the NCUC recommended the NCUC approve Duke Energy Progress' application. On August 3, 2015, the NCUC issued an order granting the application and requiring annual construction and cost progress reports. The new units are expected to be commercially available in the summer of 2017.
Western Carolinas Modernization Plan
In May 2015, Duke Energy Progress announced a
$1.1 billion
plan to modernize the Western Carolinas energy system. The plan included retirement of the Asheville coal-fired plant, building a 650 MW combined-cycle natural gas power plant, installing solar generation at the site, building new transmission lines, a new substation and upgrades to area substations. On June 24, 2015, the North Carolina governor signed into law the North Carolina Mountain Energy Act of 2015 (Mountain Energy Act) which provides for an expedited CPCN process for the proposed Asheville combined-cycle project and extends certain North Carolina Coal Ash Management Act of 2014 (Coal Ash Act) deadlines for the coal ash basin at the Asheville Plant site.
On November 4, 2015, in response to community feedback, Duke Energy Progress announced a revised plan. The revised plan replaces the planned 650 MW plant with two 280 MW combined-cycle natural gas plants having dual fuel capability, with the option to build a third natural gas simple cycle unit in 2023 based upon the outcome of initiatives to reduce the region's power demand. The revised plan includes upgrades to existing transmission lines and substations, but eliminates the need for a new transmission line and a new substation associated with the project in South Carolina. The revised plan has the same overall project cost as the original plan, and the plans to install solar generation remain unchanged. Duke Energy Progress has also proposed to add a pilot battery storage project. These investments will be made within the next seven years. Duke Energy Progress is also working with the local natural gas distribution company to upgrade an existing natural gas pipeline to serve the natural gas plant. The plan requires various approvals including regulatory approvals in North Carolina. Duke Energy Progress filed for a CPCN with the NCUC for the new gas units on January 15, 2016. At the NCUC's staff conference on February 22, 2016, the Public Staff recommended approval of the CPCN for the two combined cycle natural gas plants and recommended that the NCUC not issue a CPCN for the simple cycle unit at this time. The NCUC also heard arguments from intervenors and Duke Energy Progress. Pursuant to the Mountain Energy Act, the NCUC's deadline to issue a decision on the CPCN is February 29, 2016.
The carrying value of the
376
MW Asheville coal-fired plant, including associated ash basin closure costs, of
$548 million
is included in Generation facilities to be retired, net on Duke Energy Progress' Consolidated Balance Sheet as of
December 31, 2015
.
138
PART II
DUKE ENERGY CORPORATION - DUKE ENERGY CAROLINAS, LLC - PROGRESS ENERGY, INC. –
DUKE ENERGY PROGRESS, LLC – DUKE ENERGY FLORIDA, LLC - DUKE ENERGY OHIO, INC. - DUKE ENERGY INDIANA, INC.
Combined Notes To Consolidated Financial Statements – (Continued)
Shearon Harris Nuclear Plant Expansion
In 2006, Duke Energy Progress selected a site at Harris to evaluate for possible future nuclear expansion. On February 19, 2008, Duke Energy Progress filed its COL application with the NRC for two Westinghouse AP1000 reactors at Harris, which the NRC docketed for review. On May 2, 2013, Duke Energy Progress filed a letter with the NRC requesting the NRC to suspend its review activities associated with the COL at the Harris site. As a result of the decision to suspend the COL applications, during the second quarter of 2013, Duke Energy Progress recorded a pretax impairment charge of
$22 million
which represented costs associated with the COL, which were not probable of recovery. The NCUC and PSCSC have approved deferral for
$48 million
of retail costs recorded in Regulatory assets on Duke Energy Progress’ Consolidated Balance Sheets.
Duke Energy Florida
FERC Transmission Return on Equity Complaint
Seminole Electric Cooperative, Inc. and Florida Municipal Power Agency filed multiple complaints with the FERC alleging Duke Energy Florida's current rate of return on equity in transmission formula rates of
10.8 percent
is unjust and unreasonable. The latest complaint, filed on August 12, 2014, claims the rate of return on equity should be reduced to
8.69 percent
. The FERC consolidated all complaints for the purposes of settlement, hearing and decision. On July 21, 2015, the parties filed with the FERC for approval of a settlement agreement under which (i) Duke Energy Florida will pay a total of
$14.1 million
as refunds for all periods through December 31, 2014, (ii) the rate of return on equity will be
10 percent
effective January 1, 2015, and (iii) none of the parties will seek a change in the rate of return on equity prior to January 1, 2018. On November 19, 2015, the FERC approved the settlement agreement resolving all complaints. Duke Energy Florida paid
$14.1 million
in refunds during December 2015.
Citrus County Combined Cycle Facility
On October 2, 2014, the FPSC granted Duke Energy Florida a Determination of Need for the construction of a 1,640 MW combined-cycle natural gas plant in Citrus County, Florida. On May 5, 2015, the Florida Department of Environmental Protection approved Duke Energy Florida's Site Certification Application. The facility is expected to be commercially available in 2018 at an estimated cost of
$1.5 billion
, including AFUDC. The project has received all required permits and approvals and construction began in October 2015.
Purchase of Osprey Energy Center
In December 2014, Duke Energy Florida and Osprey Energy Center, LLC, a wholly owned subsidiary of Calpine Corporation (Calpine), entered into an Asset Purchase and Sale Agreement for the purchase of a 599 MW combined-cycle natural gas plant in Auburndale, Florida (Osprey Plant acquisition) for approximately
$166 million
. On January 30, 2015, Duke Energy Florida petitioned the FPSC requesting a determination that the Osprey Plant acquisition or, alternatively, the construction of a 320 MW combustion turbine at its existing Suwannee generating facility (Suwannee project) with an estimated cost of
$197 million
, is the most cost-effective generation alternative to meet Duke Energy Florida's remaining generation need prior to 2018. On July 21, 2015, the FPSC approved the Osprey Plant acquisition as the most cost-effective alternative and issued an order of approval on July 31, 2015. On July 24, 2015, the FERC issued an order approving the Osprey Plant acquisition. Closing of the acquisition is contingent upon the expiration of the Hart-Scott-Rodino waiting period and is expected to occur by the first quarter of 2017, upon the expiration of an existing Power Purchase Agreement between Calpine and Duke Energy Florida.
FPSC Settlement Agreements
On February 22, 2012, the FPSC approved a settlement agreement (the 2012 Settlement) among Duke Energy Florida, the Florida Office of Public Counsel (OPC) and other customer advocates. The 2012 Settlement was to continue through the last billing cycle of December 2016. On October 17, 2013, the FPSC approved a settlement agreement (the 2013 Settlement) between Duke Energy Florida, OPC, and other customer advocates. The 2013 Settlement replaces and supplants the 2012 Settlement and substantially resolves issues related to (i) Crystal River Unit 3, (ii) Levy, (iii) Crystal River 1 and 2 coal units, and (iv) future generation needs in Florida. Refer to the remaining sections below for further discussion of these settlement agreements.
Crystal River Unit 3
On February 5, 2013, Duke Energy Florida announced the retirement of Crystal River Unit 3. On February 20, 2013, Duke Energy Florida filed with the NRC a certification of permanent cessation of power operations and permanent removal of fuel from the reactor vessel. In December 2013, and March 2014, Duke Energy Florida filed an updated site-specific decommissioning plan with the NRC and FPSC, respectively. The plan, which was approved by the FPSC in November 2014, included a decommissioning cost estimate of
$1,180 million
, including amounts applicable to joint owners at that time, under the SAFSTOR option. Duke Energy Florida’s decommissioning study assumes Crystal River Unit 3 will be in SAFSTOR configuration, requiring limited staffing to monitor plant conditions, until the eventual dismantling and decontamination activities to be completed by 2074. This decommissioning approach is currently utilized at a number of retired domestic nuclear power plants and is one of three accepted approaches to decommissioning approved by the NRC.
Pursuant to the 2013 Settlement, Duke Energy Florida reclassified all Crystal River Unit 3 investments, including property, plant and equipment, nuclear fuel, inventory, and other assets, to regulatory assets. Portions of the nuclear fuel balances that are under contract for sale were subsequently moved to Other within Current Assets and Other within Investments and Other Assets on the Consolidated Balance Sheets. Duke Energy Florida agreed to forgo recovery of
$295 million
of regulatory assets and an impairment charge was recorded in the second quarter of 2013 for this matter. Duke Energy Florida also accelerated cash recovery of approximately
$47 million
, net of tax, of the Crystal River Unit 3 regulatory asset from retail customers during 2014 and 2015, through its fuel clause.
139
PART II
DUKE ENERGY CORPORATION - DUKE ENERGY CAROLINAS, LLC - PROGRESS ENERGY, INC. –
DUKE ENERGY PROGRESS, LLC – DUKE ENERGY FLORIDA, LLC - DUKE ENERGY OHIO, INC. - DUKE ENERGY INDIANA, INC.
Combined Notes To Consolidated Financial Statements – (Continued)
On May 22, 2015, Duke Energy Florida petitioned the FPSC for approval to include in base rates the revenue requirement for the projected
$1.298 billion
Crystal River Unit 3 regulatory asset as authorized by the 2013 Revised and Restated Stipulation and Settlement Agreement (2013 Agreement). On September 15, 2015, the FPSC approved Duke Energy Florida's motion for approval of a settlement agreement with intervenors to reduce the value of the projected Crystal River Unit 3 regulatory asset to be recovered to
$1.283 billion
as of December 31, 2015. An impairment charge of
$15 million
was recognized in the third quarter of 2015 to adjust the regulatory asset balance.
In June 2015, the governor of Florida signed legislation to allow utilities to securitize certain retired nuclear generation assets, with approval of the FPSC. On November 19, 2015, the FPSC issued a financing order approving Duke Energy Florida’s request to securitize its unrecovered regulatory asset related to Crystal River Unit 3 through a debt issuance at a wholly owned special purpose entity. Securitization would replace the base rate recovery methodology authorized by the 2013 Agreement and result in a lower rate impact to customers with an approximately 20 year recovery period. On February 9, 2016, Duke Energy Florida filed a registration statement for the proposed initial public offering of the bonds. Use of the registration statement for purposes of the offering is subject to review and declaration of its effectiveness by the SEC. Duke Energy Florida expects to issue securitization bonds in the first half of 2016.
In December 2014, the FPSC approved Duke Energy Florida's decision to construct an independent spent fuel storage installation (ISFSI) and approved Duke Energy Florida's request to defer amortization of the ISFSI pending resolution of its litigation against the federal government as a result of the Department of Energy's breach of its obligation to accept spent nuclear fuel. The return rate will be based on the currently approved AFUDC rate with a return on equity of
7.35 percent
, or 70 percent of the currently approved
10.5 percent
. The return rate is subject to change if the return on equity changes in the future. Through December 31, 2015 Duke Energy Florida has deferred approximately
$60 million
for recovery associated with building the ISFSI.
The regulatory asset associated with the original Crystal River Unit 3 power uprate project will continue to be recovered through the NCRC over an estimated seven-year period that began in 2013 with a remaining uncollected balance at December 31, 2015 of
$169 million
.
Customer Rate Matters
Pursuant to the 2013 Settlement, Duke Energy Florida will maintain base rates at the current level through the last billing period of 2018, subject to the return on equity range of
9.5 percent
to
11.5 percent
, with exceptions for base rate increases for the recovery of the Crystal River Unit 3 regulatory asset beginning no later than 2017, unless the regulatory asset is securitized as discussed above, and base rate increases for new generation through 2018, per the provisions of the 2013 Settlement. Duke Energy Florida is not required to file a depreciation study, fossil dismantlement study or nuclear decommissioning study until the earlier of the next rate case filing or March 31, 2019. The 2012 Settlement also provided for a
$150 million
increase in base revenue effective with the first billing cycle of January 2013. If Duke Energy Florida’s retail base rate earnings fall below the return on equity range, as reported on a FPSC-adjusted or pro forma basis on a monthly earnings surveillance report, it may petition the FPSC to amend its base rates during the term of the 2013 Settlement.
Duke Energy Florida agreed to refund
$388 million
to retail customers through its fuel clause, as required by the 2012 Settlement. At December 31, 2015,
$70 million
remains to be refunded and is included in Regulatory liabilities within Current Liabilities on the Consolidated Balance Sheets.
Levy Nuclear Project
On July 28, 2008, Duke Energy Florida applied to the NRC for a COL for two Westinghouse AP1000 reactors at Levy. In 2008, the FPSC granted Duke Energy Florida’s petition for an affirmative Determination of Need and related orders requesting cost recovery under Florida’s nuclear cost-recovery rule, together with the associated facilities, including transmission lines and substation facilities. Design changes have been identified in the Westinghouse AP1000 certified design that must be addressed before the NRC can complete its review of the Levy COL application. These design changes set the schedule for completion of the NRC COL application review and issuance of the Levy COL. Based on the current review schedule
,
the Levy COL is currently expected by late 2016.
On January 28, 2014, Duke Energy Florida terminated the Levy engineering, procurement and construction agreement (EPC). Duke Energy Florida may be required to pay for work performed under the EPC and to bring existing work to an orderly conclusion, including but not limited to costs to demobilize and cancel certain equipment and material orders placed. Duke Energy Florida recorded an exit obligation of
$25 million
in first quarter 2014 for the termination of the EPC. This liability was recorded within Other in Deferred Credits and Other Liabilities with an offset primarily to Regulatory assets on the Consolidated Balance Sheets. Duke Energy Florida is allowed to recover reasonable and prudent EPC cancellation costs from its retail customers.
The 2012 Settlement provided that Duke Energy Florida include the allocated wholesale cost of Levy as a retail regulatory asset and include this asset as a component of rate base and amortization expense for regulatory reporting. In accordance with the 2013 Settlement, Duke Energy Florida ceased amortization of the wholesale allocation of Levy investments against retail rates. In the second quarter of 2013, Duke Energy Florida recorded a pretax charge of
$65 million
to write off the wholesale portion of Levy investments. This amount is included in Impairment charges on Duke Energy Florida's Statements of Operations and Comprehensive Income.
On October 27, 2014, the FPSC approved Duke Energy Florida rates for 2015 for Levy as filed and consistent with those established in the 2013 Revised and Restated Settlement Agreement. Recovery of the remaining retail portion of the project costs may occur over five years from 2013 through 2017. Duke Energy Florida has an ongoing responsibility to demonstrate prudency related to the wind down of the Levy investment and the potential for salvage of Levy assets. As of
December 31, 2015
, Duke Energy Florida has a net uncollected investment in Levy of approximately
$183 million
, including AFUDC. Of this amount,
$105 million
related to land and the COL is included in Net, property, plant and equipment and will be recovered through base rates and
$78 million
is included in Regulatory assets within Regulatory Assets and Deferred Debits on the Consolidated Balance Sheets and will be recovered through the NCRC.
140
PART II
DUKE ENERGY CORPORATION - DUKE ENERGY CAROLINAS, LLC - PROGRESS ENERGY, INC. –
DUKE ENERGY PROGRESS, LLC – DUKE ENERGY FLORIDA, LLC - DUKE ENERGY OHIO, INC. - DUKE ENERGY INDIANA, INC.
Combined Notes To Consolidated Financial Statements – (Continued)
On April 16, 2015, the FPSC approved Duke Energy Florida’s petition to cease collection of the Levy Nuclear Project fixed charge beginning with the first billing cycle in May 2015. On August 18, 2015, the FPSC approved leaving the Levy Nuclear Project portion of the Nuclear Cost Recovery Clause charge at
zero dollars
for 2016 and 2017, consistent with the 2013 Settlement. Duke Energy Florida will submit by May 2017 a true-up of Levy Nuclear Project costs or credits to be recovered no earlier than January 2018. To the extent costs become known after May 2017, Duke Energy Florida will petition for recovery at that time.
Crystal River 1 and 2 Coal Units
Duke Energy Florida has evaluated Crystal River 1 and 2 coal units for retirement in order to comply with certain environmental regulations. Based on this evaluation, those units will likely be retired by 2018. Once those units are retired Duke Energy Florida will continue recovery of existing annual depreciation expense through the end of 2020. Beginning in 2021, Duke Energy Florida will be allowed to recover any remaining net book value of the assets from retail customers through the Capacity Cost Recovery Clause. In April 2014, the FPSC approved Duke Energy Florida's petition to allow for the recovery of prudently incurred costs to comply with the Mercury and Air Toxics Standard through the Environmental Cost Recovery Clause.
Cost of Removal Reserve
The 2012 Settlement and the 2013 Settlement provide Duke Energy Florida the discretion to reduce cost of removal amortization expense for a certain portion of the cost of removal reserve until the earlier of its applicable cost of removal reserve reaches zero or the expiration of the 2013 Settlement. Duke Energy Florida could not reduce amortization expense if the reduction would cause it to exceed the appropriate high point of the return on equity range. Duke Energy Florida recognized a reduction in amortization expense of
$114 million
for the year ended December 31, 2013. Duke Energy Florida had no cost of removal reserves eligible for amortization to income remaining after December 31, 2013.
Duke Energy Ohio
Accelerated Natural Gas Service Line Replacement Rider
On January 20, 2015, Duke Energy Ohio filed an application for approval of an accelerated natural gas service line replacement program (ASRP). The ASRP is modeled after the accelerated main replacement program (AMRP), which concluded on December 31, 2015. Under the ASRP, Duke Energy Ohio proposes to replace certain natural gas service lines on an accelerated basis. The program is proposed to last 10 years. Through the ASRP, Duke Energy Ohio also proposes to complete preliminary survey and investigation work related to natural gas service lines that are customer-owned and for which it does not have valid records and, further, to relocate interior natural gas meters to suitable exterior locations where such relocation can be accomplished. Duke Energy Ohio projects total capital and operations and maintenance expenditures under the ASRP to approximate
$320 million
. The filing also seeks approval of Rider ASRP, the rider through which expenditures would be recovered. Similar to the Rider AMRP methodology, Duke Energy Ohio proposes to update Rider ASRP on an annual basis. Duke Energy Ohio’s application is pending before the PUCO and it is uncertain when an order will be issued.
Intervenors oppose the ASRP, primarily because they believe the program is neither required nor necessary under federal pipeline regulation. The hearing concluded on November 19, 2015 and initial and reply briefs were filed, with briefing complete on December 23, 2015.
Duke Energy Ohio cannot predict the outcome of this matter.
Energy Efficiency Cost Recovery
On March 28, 2014, Duke Energy Ohio filed an application for recovery of program costs, lost distribution revenue and performance incentives related to its energy efficiency and peak demand reduction programs. These programs are undertaken to comply with environmental mandates set forth in Ohio law. After a comment period, the PUCO approved Duke Energy Ohio’s application, but found that Duke Energy Ohio was not permitted to use banked energy savings from previous years in order to calculate the amount of allowed incentive. This conclusion represented a change to the cost recovery mechanism that had been agreed to by intervenors and approved by the PUCO in previous cases. As a result of the PUCO’s decision, Duke Energy Ohio reversed
$23 million
in revenues deemed to be refundable for the period between January 2013 and April 2015 in second quarter 2015. The PUCO granted Duke Energy Ohio's application for rehearing on July 8, 2015. Substantive ruling on the application for rehearing is pending. The PUCO granted all applications for rehearing for future consideration. On January 6, 2016, Duke Energy Ohio and PUCO Staff entered into a stipulation, pending PUCO approval, resolving the issues related to, among other things, performance incentives and the PUCO Staff audit of 2013 costs. Based on this stipulation, in December 2015, Duke Energy Ohio re-established approximately
$20 million
of the revenues that had been reversed in the second quarter. A hearing on the stipulation is scheduled for March 10, 2016. Duke Energy Ohio cannot predict the outcome of this matter.
East Bend Station
On December 30, 2014, Duke Energy Ohio acquired The Dayton Power and Light Company's (DP&L)
31 percent
interest in the jointly owned East Bend Station for approximately
$12.4 million
. The purchase price, in accordance with FERC guidelines, was reflected with the net purchase amount as an increase to property, plant and equipment as of December 31, 2014 and with the DP&L's historical original cost as an increase to property, plant and equipment and accumulated depreciation as of December 31, 2015. On August 20, 2015, the KPSC approved Duke Energy Kentucky's application to use the purchase price as the value of the newly acquired interest in the East Bend Station for depreciation purposes and ratemaking.
141
PART II
DUKE ENERGY CORPORATION - DUKE ENERGY CAROLINAS, LLC - PROGRESS ENERGY, INC. –
DUKE ENERGY PROGRESS, LLC – DUKE ENERGY FLORIDA, LLC - DUKE ENERGY OHIO, INC. - DUKE ENERGY INDIANA, INC.
Combined Notes To Consolidated Financial Statements – (Continued)
2014 Electric Security Plan (ESP)
In April 2015, the PUCO modified and approved Duke Energy Ohio's proposed ESP, with a three-year term and an effective date of June 1, 2015. The PUCO approved a competitive procurement process for SSO load, a distribution capital investment rider and a tracking mechanism for incremental distribution expenses caused by major storms. The PUCO order also approved a placeholder tariff for a price stabilization rider, but denied Duke Energy Ohio's specific request to include Duke Energy Ohio's entitlement to generation from OVEC in the rider at this time; however, the order allows Duke Energy Ohio to submit additional information to request recovery in the future. On May 4, 2015, Duke Energy Ohio filed an application for rehearing requesting the PUCO to modify or amend certain aspects of the order. On May 28, 2015, the PUCO granted all applications for rehearing filed in the case for future consideration. Duke Energy Ohio cannot predict the outcome of the appeals in this matter.
During May and November 2015, Duke Energy Ohio completed two competitive bidding processes with results approved by the PUCO to procure a portion of the supply for its SSO load for the term of the ESP.
2012 Natural Gas Rate Case
On November 13, 2013, the PUCO issued an order approving a settlement among Duke Energy Ohio, the PUCO Staff and intervening parties (the Gas Settlement). The Gas Settlement provided for (i) no increase in base rates for natural gas distribution service and (ii) a return on equity of
9.84 percent
. The Gas Settlement provided for a subsequent hearing on Duke Energy Ohio’s request for rider recovery of environmental remediation costs associated with its former MGP sites. The PUCO authorized Duke Energy Ohio to recover
$56 million
excluding carrying costs, of environmental remediation costs. The MGP rider became effective in April 2014 for a five-year period. On March 31, 2014, Duke Energy Ohio filed an application with the PUCO to adjust the MGP rider for investigation and remediation costs incurred in 2013.
Certain consumer groups appealed the PUCO’s decision authorizing the MGP rider to the Ohio Supreme Court and asked the court to stay implementation of the PUCO’s order and collections under the MGP rider pending their appeal. The Ohio Supreme Court granted the motion to stay and subsequently required the posting of a bond to effectuate the stay. When the bond was not posted, the PUCO approved Duke Energy Ohio’s request, in January 2015, to reinstate collections under the MGP rider and Duke Energy Ohio resumed billings. Amounts collected prior to the suspension of the rider were immaterial. On March 31, 2015, Duke Energy Ohio filed an application to adjust the MGP rider to recover remediation costs incurred in 2014. Duke Energy Ohio cannot predict the outcome of the appeal of this matter.
Regional Transmission Organization (RTO) Realignment
Duke Energy Ohio, including Duke Energy Kentucky, transferred control of its transmission assets from MISO to PJM Interconnection, LLC (PJM), effective December 31, 2011.
On December 22, 2010, the KPSC approved Duke Energy Kentucky’s request to effect the RTO realignment, subject to a commitment not to seek double recovery in a future rate case of the transmission expansion fees that may be charged by MISO and PJM in the same period or overlapping periods.
On May 25, 2011, the PUCO approved a settlement between Duke Energy Ohio, Ohio Energy Group, the Office of Ohio Consumers’ Counsel and the PUCO Staff related to Duke Energy Ohio’s recovery of certain costs of the RTO realignment via a non-bypassable rider. Duke Energy Ohio is allowed to recover all MISO Transmission Expansion Planning (MTEP) costs, including but not limited to Multi Value Project (MVP) costs, directly or indirectly charged to Ohio customers. Duke Energy Ohio also agreed to vigorously defend against any charges for MVP projects from MISO.
Upon its exit from MISO on December 31, 2011, Duke Energy Ohio recorded a liability for its exit obligation and share of MTEP costs, excluding MVP. This liability was recorded within Other in Current liabilities and Other in Deferred credits and other liabilities on Duke Energy Ohio’s Consolidated Balance Sheets.
The following table provides a reconciliation of the beginning and ending balance of Duke Energy Ohio’s recorded obligations related to its withdrawal from MISO. As of
December 31, 2015
,
$72 million
is recorded as a Regulatory asset on Duke Energy Ohio's Consolidated Balance Sheets.
|
Provisions/
|
|
Cash
|
|
||||||||||||
|
(in millions)
|
December 31, 2014
|
|
Adjustments
|
|
Reductions
|
|
December 31, 2015
|
|
|||||||
|
Duke Energy Ohio
|
$
|
94
|
|
$
|
3
|
|
$
|
(5
|
)
|
$
|
92
|
|
|||
MVP.
MISO approved
17
MVP proposals prior to Duke Energy Ohio’s exit from MISO on December 31, 2011. Construction of these projects is expected to continue through 2020. Costs of these projects, including operating and maintenance costs, property and income taxes, depreciation and an allowed return, are allocated and billed to MISO transmission owners.
On December 29, 2011, MISO filed a tariff with the FERC providing for the allocation of MVP costs to a withdrawing owner based on monthly energy usage. The FERC set for hearing (i) whether MISO’s proposed cost allocation methodology to transmission owners who withdrew from MISO prior to January 1, 2012 is consistent with the tariff at the time of their withdrawal from MISO and, (ii) if not, what the amount of and methodology for calculating any MVP cost responsibility should be. In 2012, MISO estimated Duke Energy Ohio’s MVP obligation over the period from 2012 to 2071 at
$2.7 billion
, on an undiscounted basis. On July 16, 2013, a FERC Administrative Law Judge (ALJ) issued an initial decision. Under this initial decision, Duke Energy Ohio would be liable for MVP costs. Duke Energy Ohio filed exceptions to the initial decision, requesting FERC to overturn the ALJ’s decision.
On October 29, 2015, the FERC issued an order reversing the ALJ's decision. The FERC ruled the cost allocation methodology is not consistent with the MISO tariff and that Duke Energy Ohio has no liability for MVP costs after its withdrawal from MISO. On November 30, 2015, MISO filed with the FERC a request for rehearing. Duke Energy Ohio cannot predict the outcome of this matter.
142
PART II
DUKE ENERGY CORPORATION - DUKE ENERGY CAROLINAS, LLC - PROGRESS ENERGY, INC. –
DUKE ENERGY PROGRESS, LLC – DUKE ENERGY FLORIDA, LLC - DUKE ENERGY OHIO, INC. - DUKE ENERGY INDIANA, INC.
Combined Notes To Consolidated Financial Statements – (Continued)
FERC Transmission Return on Equity and MTEP Cost Settlement
On October 14, 2011, Duke Energy Ohio and Duke Energy Kentucky submitted with the FERC proposed modifications to the PJM Interconnection Open Access Transmission Tariff pertaining to recovery of the transmission revenue requirement as PJM transmission owners. The filing was made in connection with Duke Energy Ohio's and Duke Energy Kentucky's move from MISO to PJM effective December 31, 2011. On April 24, 2012, the FERC issued an order accepting the proposed filing effective January 1, 2012, except that the order denied a request to recover certain costs associated with the move from MISO to PJM without prejudice to the right to submit another filing seeking such recovery and including certain additional evidence, and set the rate of return on equity of
12.38 percent
for settlement and hearing. On April 16, 2015, the FERC approved a settlement agreement between Duke Energy Ohio, Duke Energy Kentucky and six PJM transmission customers with load in the Duke Energy Ohio and Duke Energy Kentucky zone. The principal terms of the settlement agreement are that, effective upon the date of FERC approval, (i) the return on equity for wholesale transmission service is reduced to
11.38 percent
, (ii) the settling parties agreed not to seek a change in the return on equity that would be effective prior to June 1, 2017, and (iii) Duke Energy Ohio and Duke Energy Kentucky will recover
30 percent
of the wholesale portion of costs arising from their obligation to pay any portion of the costs of projects included in any MTEP that was approved prior to the date of Duke Energy Ohio's and Duke Energy Kentucky's integration into PJM.
Duke Energy Indiana
Edwardsport Integrated Gasification Combined Cycle (IGCC) Plant
On November 20, 2007, the IURC granted Duke Energy Indiana a CPCN for the construction of the Edwardsport IGCC Plant. The Citizens Action Coalition of Indiana, Inc., Sierra Club, Inc., Save the Valley, Inc., and Valley Watch, Inc. (collectively, the Joint Intervenors) were intervenors in several matters related to the Edwardsport IGCC Plant. The Edwardsport IGCC Plant was placed in commercial operation in June 2013. Costs for the Edwardsport IGCC Plant are recovered from retail electric customers via a tracking mechanism, the IGCC rider.
The ninth semi-annual IGCC rider order was appealed by the Joint Intervenors. On September 8, 2014, the Indiana Court of Appeals remanded the IURC order in the ninth IGCC rider proceeding back to the IURC for further findings. On February 25, 2015, the IURC issued a new order upholding its prior decision and provided additional detailed findings. Joint Intervenors appealed this remand order to the Indiana Court of Appeals. On September 23, 2015, the Indiana Court of Appeals affirmed the IURC remand decision on one of the key financial issues. The Indiana Court of Appeals found that there was sufficient evidence for the IURC to find that the three-month delay in construction for this time period was not unreasonable and therefore the costs of such delay should be borne by Duke Energy Indiana customers. The Indiana Court of Appeals found that the IURC did not support its findings regarding the ratemaking impact of the tax in-service declaration and reversed and remanded this issue back to the IURC, with direction to hold further proceedings and issue additional findings on the issue. On December 10, 2015, the Indiana Court of Appeals denied a request for rehearing by Joint Intervenors, and the decision was not further appealed. The proceeding will be remanded to the IURC for further proceedings and additional findings on the tax in-service issue.
The 10th semi-annual IGCC rider order was also appealed by the Joint Intervenors. On August 21, 2014, the Indiana Court of Appeals affirmed the IURC order in the 10th IGCC rider proceeding and on October 29, 2014, denied the Joint Intervenors' request for rehearing. The Joint Intervenors requested the Indiana Supreme Court to review the decision, which was denied on April 23, 2015, concluding the appeal.
Duke Energy Indiana has filed the 14th and 15th semi-annual IGCC rider proceedings. The 11th through 15th semi-annual IGCC riders and a subdocket to Duke Energy Indiana's fuel adjustment clause are currently in various stages of approval by the IURC in the filing process. Issues in these filings include the determination whether the IGCC plant was properly declared in service for ratemaking purposes in June 2013 and a review of the operational performance of the plant. On September 17, 2015, Duke Energy Indiana, the Office of Utility Consumer Counselor, the Industrial Group and Nucor Steel Indiana reached a settlement agreement to resolve these pending issues. On January 15, 2016, The Citizens Action Coalition of Indiana, Inc., Sierra Club, Save the Valley and Valley Watch joined the settlement. The proposed settlement will result in customers not being billed for previously incurred operating costs of
$87.5 million
and for additional Duke Energy Indiana payments and commitments of
$5.5 million
for attorneys’ fees and amounts to fund consumer programs. Attorneys’ fees and expenses for the new settling parties will be addressed in a separate proceeding. Duke Energy Indiana recorded
$87.5 million
within Impairment charges and
$5.5 million
within Other Income and Expenses, net in the Consolidated Statements of Operations and Comprehensive Income for the twelve months ended
December 31, 2015
. Duke Energy Indiana also recorded an
$80.3 million
reduction of Regulatory assets within Regulatory Assets and Deferred Debits, an additional
$7.2 million
of Other within Deferred Credits and Other Liabilities and
$5.5 million
of Accounts payable within Current Liabilities on the Consolidated Balance Sheets at
December 31, 2015
. Additionally, under the proposed settlement, the operating and maintenance expenses and ongoing maintenance capital at the plant are subject to certain caps during the years of 2016 and 2017. The revised settlement includes a commitment to either retire or stop burning coal by December 31, 2022 at the Gallagher Station. Pursuant to the settlement, the in-service date used for accounting and ratemaking will remain as June 2013. Remaining deferred costs will be recovered over
eight years
and not earn a carrying cost. The settlement is subject to IURC approval which is expected in the first half of 2016. As of
December 31, 2015
, deferred costs related to the project are approximately
$128 million
. Future IGCC riders will be filed annually, rather than every six months, with the next filing scheduled for first quarter 2017.
Duke Energy Indiana cannot predict the outcome of the settlement of these matters or future IGCC rider proceedings.
FERC Transmission Return on Equity Complaint
Customer groups have filed with the FERC complaints against MISO and its transmission-owning members, including Duke Energy Indiana, alleging, among other things, that the current base rate of return on equity earned by MISO transmission owners of
12.38 percent
is unjust and unreasonable. The latest complaint, filed on February 12, 2015, claims the base rate of return on equity should be reduced to
8.67 percent
and requests a consolidation of complaints. The motion to consolidate complaints was denied. On January 5, 2015, the FERC issued an order accepting the MISO transmission owners
0.50 percent
adder to the base rate of return on equity based on participation in an RTO subject to it being applied to a return on equity that is shown to be just and reasonable in the pending return on equity complaint. A hearing in the base return on equity proceeding was held in August 2015. On December 22, 2015, the presiding FERC ALJ issued an Initial Decision in which he set the base rate of return on equity at
10.32 percent
. The Initial Decision will be reviewed by the FERC. Duke Energy Indiana currently believes these matters will have an immaterial impact on its results of operations, cash flows and financial position.
143
PART II
DUKE ENERGY CORPORATION - DUKE ENERGY CAROLINAS, LLC - PROGRESS ENERGY, INC. –
DUKE ENERGY PROGRESS, LLC – DUKE ENERGY FLORIDA, LLC - DUKE ENERGY OHIO, INC. - DUKE ENERGY INDIANA, INC.
Combined Notes To Consolidated Financial Statements – (Continued)
Grid Infrastructure Improvement Plan
On August 29, 2014, pursuant to a new statute, Duke Energy Indiana filed a seven-year grid infrastructure improvement plan with the IURC with an estimated cost of
$1.9 billion
, focusing on the reliability, integrity and modernization of the transmission and distribution system. In May 2015, the IURC denied the original proposal due to an insufficient level of detailed projects and cost estimates in the plan. On December 7, 2015, Duke Energy Indiana filed a revised infrastructure improvement plan with an estimated cost of
$1.8 billion
in response to guidance from IURC orders and the Indiana Court of Appeals decisions related to this new statute. The revised plan uses a combination of advanced technology and infrastructure upgrades to improve service to customers and provide them with better information about their energy use. The plan is subject to approval of the IURC, with an order expected in July 2016. Duke Energy Indiana cannot predict the outcome of this matter.
Other Regulatory Matters
Atlantic Coast Pipeline
On September 2, 2014, Duke Energy, Dominion Resources (Dominion), Piedmont and AGL Resources announced the formation of a company, ACP, to build and own the proposed Atlantic Coast Pipeline (the pipeline), a 564-mile interstate natural gas pipeline. The pipeline is designed to meet the needs identified in requests for proposals by Duke Energy Carolinas, Duke Energy Progress and Piedmont. Dominion will build and operate the pipeline and has a
45 percent
ownership percentage in ACP. Duke Energy has a
40 percent
ownership interest in ACP through its Commercial Portfolio segment. Piedmont owns
10 percent
and the remaining share is owned by AGL Resources. Duke Energy Carolinas and Duke Energy Progress, among others, will be customers of the pipeline. Purchases will be made under several 20-year supply contracts, subject to state regulatory approval. In October 2014, the NCUC and PSCSC approved the Duke Energy Carolinas and Duke Energy Progress requests to enter into certain affiliate agreements, pay compensation to ACP and to grant a waiver of certain Code of Conduct provisions relating to contractual and jurisdictional matters. On September 18, 2015, ACP filed an application with the FERC requesting a CPCN authorizing ACP to construct the pipeline. ACP requested approval of the application by July 1, 2016, to enable construction to begin by September 2016, with an in-service date of on or before November 1, 2018. ACP is working with various agencies to develop the final pipeline route. ACP also requested approval of an open access tariff and the precedent agreements it entered into with future pipeline customers, including Duke Energy Carolinas and Duke Energy Progress.
On October 24, 2015, Duke Energy entered into a Merger Agreement with Piedmont. The ACP partnership agreement includes provisions to allow Dominion an option to purchase additional ownership interest in ACP to maintain a leading ownership percentage. Any change in ownership interests is not expected to be material to Duke Energy. Refer to Note 2 for further information related to Duke Energy's proposed acquisition of Piedmont.
Sabal Trail Transmission, LLC (Sabal Trail) Pipeline
On May 4, 2015, Duke Energy acquired a
7.5 percent
ownership interest from Spectra Energy in the proposed 500-mile Sabal Trail natural gas pipeline. Spectra Energy will continue to own
59.5 percent
of the Sabal Trail pipeline and NextEra Energy will own the remaining
33 percent
. The Sabal Trail pipeline will traverse Alabama, Georgia and Florida to meet rapidly growing demand for natural gas in those states. The primary customers of the Sabal Trail pipeline, Duke Energy Florida and Florida Power & Light Company, have each contracted to buy pipeline capacity for 25-year initial terms. On February 3, 2016, the FERC issued an order granting the request for a CPCN to construct and operate the pipeline. The Sabal Trail pipeline requires additional regulatory approvals and is scheduled to begin service in 2017.
NC WARN FERC Complaint
On December 16, 2014, North Carolina Waste Awareness and Reduction Network (NC WARN) filed a complaint with the FERC against Duke Energy Carolinas and Duke Energy Progress that alleged (i) Duke Energy Carolinas and Duke Energy Progress manipulated the electricity market by constructing costly and unneeded generation facilities leading to unjust and unreasonable rates; (ii) Duke Energy Carolinas and Duke Energy Progress failed to comply with Order 1000 by not effectively connecting their transmission systems with neighboring utilities which also have excess capacity; (iii) the plans of Duke Energy Carolinas and Duke Energy Progress for unrealistic future growth lead to unnecessary and expensive generating plants; (iv) the FERC should investigate the practices of Duke Energy Carolinas and Duke Energy Progress and the potential benefits of having them enter into a regional transmission organization; and (v) the FERC should force Duke Energy Carolinas and Duke Energy Progress to purchase power from other utilities rather than construct wasteful and redundant power plants. NC WARN also filed a copy of the complaint with the PSCSC on January 6, 2015. In April 2015, the FERC and the PSCSC issued separate orders dismissing the NC WARN petition. On May 14, 2015, NC WARN filed with FERC a motion for reconsideration which the FERC denied on November 19, 2015. This matter is now closed.
Progress Energy Merger FERC Mitigation
In June 2012, the FERC approved the merger with Progress Energy, including Duke Energy and Progress Energy’s revised market power mitigation plan, the Joint Dispatch Agreement (JDA) and the joint Open Access Transmission Tariff. Several intervenors filed requests for rehearing challenging various aspects of the FERC approval. On October 29, 2014, FERC denied all of the requests for rehearing.
The revised market power mitigation plan provided for the acceleration of one transmission project and the completion of seven other transmission projects (Long-Term FERC Mitigation) and interim firm power sale agreements during the completion of the transmission projects (Interim FERC Mitigation). The Long-Term FERC Mitigation was expected to increase power imported into the Duke Energy Carolinas and Duke Energy Progress service areas and enhance competitive power supply options in the service areas. All of these projects were completed in or before 2014. On May 30, 2014, the Independent Monitor filed with FERC a final report stating that the Long-Term FERC Mitigation is complete. Therefore, Duke Energy Carolinas' and Duke Energy Progress' obligations associated with the Interim FERC Mitigation have terminated. In the second quarter of 2014, Duke Energy Progress recorded an $18 million partial reversal of an impairment recorded in the third quarter of 2012. This reversal adjusts the initial disallowance from the Long-Term FERC mitigation and reflects updated information on the construction costs and in-service dates of the transmission projects.
144
PART II
DUKE ENERGY CORPORATION - DUKE ENERGY CAROLINAS, LLC - PROGRESS ENERGY, INC. –
DUKE ENERGY PROGRESS, LLC – DUKE ENERGY FLORIDA, LLC - DUKE ENERGY OHIO, INC. - DUKE ENERGY INDIANA, INC.
Combined Notes To Consolidated Financial Statements – (Continued)
Following the closing of the merger, outside counsel reviewed Duke Energy’s mitigation plan and discovered a technical error in the calculations. On December 6, 2013, Duke Energy submitted a filing to the FERC disclosing the error and arguing that no additional mitigation is necessary. The city of New Bern filed a protest and requested that FERC order additional mitigation. On October 29, 2014, FERC ordered that the amount of the stub mitigation be increased from 25 MW to 129 MW. The stub mitigation is Duke Energy’s commitment to set aside for third parties a certain quantity of firm transmission capacity from Duke Energy Carolinas to Duke Energy Progress during summer off-peak hours. FERC also ordered that Duke Energy operate certain phase shifters to create additional import capability and that such operation be monitored by an independent monitor. Duke Energy does not expect the costs to comply with this order to be material. FERC also referred Duke Energy’s failure to expressly designate the phase shifter reactivation as a mitigation project in Duke Energy’s original mitigation plan filing in March 2012 to the FERC Office of Enforcement for further inquiry. Duke Energy cannot predict the outcome of this additional inquiry.
Potential Coal Plant Retirements
The Subsidiary Registrants periodically file Integrated Resource Plans (IRP) with their state regulatory commissions. The IRPs provide a view of forecasted energy needs over a long term (10 to 20 years), and options being considered to meet those needs. Recent IRPs filed by the Subsidiary Registrants included planning assumptions to potentially retire certain coal-fired generating facilities in Florida and Indiana earlier than their current estimated useful lives. These facilities do not have the requisite emission control equipment, primarily to meet EPA regulations recently approved or proposed.
The table below contains the net carrying value of generating facilities planned for retirement or included in recent IRPs as evaluated for potential retirement due to a lack of requisite environmental control equipment. Dollar amounts in the table below are included in Net property, plant and equipment on the Consolidated Balance Sheets.
|
|
December 31, 2015
|
||||||||||
|
Duke
|
|
Duke
|
|
||||||||
|
Duke
|
|
Energy
|
|
Energy
|
|
||||||
|
|
Energy
|
|
Florida
(b)
|
|
Indiana
(c)
|
|
|||||
|
Capacity (in MW)
|
1,821
|
|
873
|
|
948
|
|
|||||
|
Remaining net book value (in millions)
(a)
|
$
|
352
|
|
$
|
131
|
|
$
|
221
|
|
||
|
(a)
|
Remaining net book value amounts presented exclude any capitalized asset retirement costs related to closure of ash basins.
|
|
(b)
|
Includes Crystal River Units 1 and 2. Progress Energy amounts are equal to Duke Energy Florida amounts.
|
|
(c)
|
Includes Wabash River Units 2 through 6 and Gallagher Units 2 and 4. Wabash River Unit 6 is being evaluated for potential conversion to natural gas. Duke Energy Indiana committed to retire or convert the Wabash River Units 2 through 6 by June 2018 in conjunction with a settlement agreement associated with the Edwardsport air permit. Duke Energy Indiana committed to either retire or stop burning coal at Gallagher Units 2 and 4 by December 31, 2022, as part of the proposed settlement of Edwardsport IGCC matters.
|
On October 23, 2015, the EPA published in the Federal Register the Clean Power Plan (CPP) rule for regulating carbon dioxide (CO
2
) emissions from existing fossil fuel-fired electric generating units (EGUs). The CPP establishes CO
2
emission rates and mass cap goals that apply to fossil fuel-fired generation. Under the CPP, states are required to develop and submit a final compliance plan, or an initial plan with an extension request, to the EPA by September 6, 2016, or no later than September 6, 2018, with an approved extension. These state plans are subject to EPA approval, with a federal plan applied to states that fail to submit a plan to the EPA or if a state plan is not approved. Legal challenges to the CPP have been filed by stakeholders and motions to stay the requirements of the rule pending the outcome of the litigation were granted by the U.S. Supreme Court in February 2016. Final resolution of these legal challenges could take several years. Compliance with CPP could cause the industry to replace coal generation with natural gas and renewables, especially in states that have significant CO
2
reduction targets under the rule. Costs to operate coal-fired generation plants continue to grow due to increasing environmental compliance requirements, including ash management costs unrelated to CPP, and this may result in the retirement of coal-fired generation plants earlier than the current useful lives. Duke Energy continues to evaluate the need to retire generating facilities and plans to seek regulatory recovery, where appropriate, for amounts that have not been recovered upon asset retirements. However, recovery is subject to future regulatory approval, including the recovery of carrying costs on remaining book values, and therefore cannot be assured.
Refer to the "Western Carolinas Modernization Plan" discussion above for details of Duke Energy Progress' planned retirements.
5. COMMITMENTS AND CONTINGENCIES
General Insurance
The Duke Energy Registrants have insurance and reinsurance coverage either directly or through indemnification from Duke Energy’s captive insurance company, Bison, and its affiliates, consistent with companies engaged in similar commercial operations with similar type properties. The Duke Energy Registrants’ coverage includes (i) commercial general liability coverage for liabilities arising to third parties for bodily injury and property damage; (ii) workers’ compensation; (iii) automobile liability coverage; and (iv) property coverage for all real and personal property damage. Real and personal property damage coverage excludes electric transmission and distribution lines, but includes damages arising from boiler and machinery breakdowns, earthquakes, flood damage and extra expense, but not outage or replacement power coverage. All coverage is subject to certain deductibles or retentions, sublimits, exclusions, terms and conditions common for companies with similar types of operations.
The Duke Energy Registrants self-insure their electric transmission and distribution lines against loss due to storm damage and other natural disasters. As discussed further in Note
4
, Duke Energy Florida maintains a storm damage reserve and has a regulatory mechanism to recover the cost of named storms on an expedited basis.
The cost of the Duke Energy Registrants’ coverage can fluctuate year to year reflecting claims history and conditions of the insurance and reinsurance markets.
145
PART II
DUKE ENERGY CORPORATION - DUKE ENERGY CAROLINAS, LLC - PROGRESS ENERGY, INC. –
DUKE ENERGY PROGRESS, LLC – DUKE ENERGY FLORIDA, LLC - DUKE ENERGY OHIO, INC. - DUKE ENERGY INDIANA, INC.
Combined Notes To Consolidated Financial Statements – (Continued)
In the event of a loss, terms and amounts of insurance and reinsurance available might not be adequate to cover claims and other expenses incurred. Uninsured losses and other expenses, to the extent not recovered by other sources, could have a material effect on the Duke Energy Registrants’ results of operations, cash flows or financial position. Each company is responsible to the extent losses may be excluded or exceed limits of the coverage available.
Nuclear Insurance
Duke Energy Carolinas owns and operates the McGuire Nuclear Station (McGuire) and the Oconee Nuclear Station (Oconee) and operates and has a partial ownership interest in the Catawba Nuclear Station (Catawba). McGuire and Catawba each have two reactors. Oconee has three reactors. The other joint owners of Catawba reimburse Duke Energy Carolinas for certain expenses associated with nuclear insurance per the Catawba joint owner agreements.
Duke Energy Progress owns and operates the Robinson Nuclear Plant (Robinson), Brunswick and Harris. Robinson and Harris each have one reactor. Brunswick has two reactors.
Duke Energy Florida manages and has a partial ownership interest in Crystal River Unit 3, which has been retired. The other joint owner of Crystal River Unit 3 reimburses Duke Energy Florida for certain expenses associated with nuclear insurance per the Crystal River Unit 3 joint owner agreement.
In the event of a loss, terms and amounts of insurance available might not be adequate to cover property damage and other expenses incurred. Uninsured losses and other expenses, to the extent not recovered by other sources, could have a material effect on Duke Energy Carolinas’, Duke Energy Progress’ and Duke Energy Florida’s results of operations, cash flows or financial position. Each company is responsible to the extent losses may be excluded or exceed limits of the coverage available.
Nuclear Liability Coverage
The Price-Anderson Act requires owners of nuclear reactors to provide for public nuclear liability protection per nuclear incident up to a maximum total financial protection liability. The maximum total financial protection liability, which is currently
$13.5 billion
, is subject to change every five years for inflation and for the number of licensed reactors. Total nuclear liability coverage consists of a combination of private primary nuclear liability insurance coverage and a mandatory industry risk-sharing program to provide for excess nuclear liability coverage above the maximum reasonably available private primary coverage. The United States Congress could impose revenue-raising measures on the nuclear industry to pay claims.
Primary Liability Insurance
Duke Energy Carolinas, Duke Energy Progress and Duke Energy Florida have purchased the maximum reasonably available private primary nuclear liability insurance as required by law, which currently is
$375 million
per station.
Excess Liability Program
This program provides
$13.1 billion
of coverage per incident through the Price-Anderson Act’s mandatory industrywide excess secondary financial protection program of risk pooling. This amount is the product of potential cumulative retrospective premium assessments of
$127 million
times the current
103
licensed commercial nuclear reactors in the U.S. Under this program, licensees could be assessed retrospective premiums to compensate for public nuclear liability damages in the event of a nuclear incident at any licensed facility in the U.S. Retrospective premiums may be assessed at a rate not to exceed
$19 million
per year per licensed reactor for each incident. The assessment may be subject to state premium taxes.
Nuclear Property and Accidental Outage Coverage
Duke Energy Carolinas, Duke Energy Progress and Duke Energy Florida are members of Nuclear Electric Insurance Limited (NEIL), an industry mutual insurance company, which provides "all risk" property damage, decontamination, and premature decommissioning insurance for each station for losses resulting from damage to its nuclear plants, either due to accidents or acts of terrorism. Additionally, NEIL provides some replacement power cost insurance for each station for losses in the event of a major accidental outage at an insured nuclear station. NEIL requires its members to maintain an investment grade credit rating or to ensure collectability of their annual retrospective premium obligation by providing a financial guarantee, letter of credit, deposit premium or other means of assurance. The companies are required each year to report to the NRC the current levels and sources of insurance that demonstrate it possesses sufficient financial resources to stabilize and decontaminate its reactors and reactor station sites in the event of an accident.
Pursuant to regulations of the NRC, each company’s property damage insurance policies provide that all proceeds from such insurance be applied, first, to place the plant in a safe and stable condition after a qualifying accident, and second, to decontaminate the plant before any proceeds can be used for decommissioning, plant repair or restoration.
Losses resulting from acts of terrorism are covered as common occurrences, such that if terrorist acts occur against one or more commercial nuclear power plants insured by NEIL within a 12-month period, they would be treated as one event and the owners of the plants where the act occurred would share one full limit of liability. The full limit of liability is currently
$3.2 billion
. NEIL sublimits the total aggregate for all of their policies for non-nuclear terrorist events to approximately
$1.83 billion
.
146
PART II
DUKE ENERGY CORPORATION - DUKE ENERGY CAROLINAS, LLC - PROGRESS ENERGY, INC. –
DUKE ENERGY PROGRESS, LLC – DUKE ENERGY FLORIDA, LLC - DUKE ENERGY OHIO, INC. - DUKE ENERGY INDIANA, INC.
Combined Notes To Consolidated Financial Statements – (Continued)
Each nuclear facility has accident property damage, decontamination and premature decommissioning liability insurance from NEIL with limits of
$1.5 billion
, except for Crystal River Unit 3. Crystal River Unit 3’s limit is
$1 billion
and is on an actual cash value basis. NEIL coverage for Crystal River Unit 3 does not include property damage to or resulting from the containment structure although the coverage does apply to decontamination and debris removal, if required following an accident, to ensure public health and safety or if property damage results from a terrorism event. All nuclear facilities except for Catawba and Crystal River Unit 3 also share an additional
$1.25 billion
nuclear accident insurance limit above their dedicated underlying limit. This shared additional excess limit is not subject to reinstatement in the event of a loss. Catawba has a dedicated
$1.25 billion
of additional nuclear accident insurance limit above its dedicated underlying limit. Catawba and Oconee also have an additional
$750 million
of non-nuclear accident property damage limit. All coverages are subject to sublimits and significant deductibles.
NEIL’s Accidental Outage policy provides some replacement power cost insurance for losses in the event of a major accident property damage outage of a nuclear unit. Coverage is provided on a weekly limit basis after a significant waiting period deductible and at
100 percent
of the available weekly limits for 52 weeks and
80 percent
of the available weekly limits for the next 110 weeks. Coverage is provided until these available weekly periods are met where the accidental outage policy limit will not exceed
$490 million
for McGuire, Catawba, Oconee, Brunswick, and Harris and
$457 million
for Robinson. NEIL sublimits the accidental outage recovery to the first 104 weeks of coverage not to exceed
$328 million
from non-nuclear accidental property damage. Coverage amounts decrease in the event more than one unit at a station is out of service due to a common accident. All coverages are subject to sublimits and significant deductibles.
Potential Retroactive Premium Assessments
In the event of NEIL losses, NEIL’s board of directors may assess member companies retroactive premiums of amounts up to
10
times their annual premiums for up to
six years
after a loss. NEIL has never exercised this assessment. The maximum aggregate annual retrospective premium obligations for Duke Energy Carolinas, Duke Energy Progress and Duke Energy Florida are
$159 million
,
$108 million
and
$7 million
, respectively. The maximum assessment amounts include
100 percent
of Duke Energy Carolinas’ and Duke Energy Florida’s potential obligations to NEIL for their share of jointly owned reactors.
ENVIRONMENTAL
Duke Energy is subject to international, federal, state and local regulations regarding air and water quality, hazardous and solid waste disposal and other environmental matters. The Subsidiary Registrants are subject to federal, state and local regulations regarding air and water quality, hazardous and solid waste disposal and other environmental matters. These regulations can be changed from time to time, imposing new obligations on the Duke Energy Registrants.
The following environmental matters impact all of the Duke Energy Registrants.
Remediation Activities
In addition to the Asset Retirement Obligations discussed in Note 9, the Duke Energy Registrants are responsible for environmental remediation at various sites. These include certain properties that are part of ongoing operations and sites formerly owned or used by Duke Energy entities. These sites are in various stages of investigation, remediation and monitoring. Managed in conjunction with relevant federal, state and local agencies, remediation activities vary based upon site conditions and location, remediation requirements, complexity and sharing of responsibility. If remediation activities involve joint and several liability provisions, strict liability, or cost recovery or contribution actions, the Duke Energy Registrants could potentially be held responsible for environmental impacts caused by other potentially responsible parties, and may also benefit from insurance policies or contractual indemnities that cover some or all cleanup costs. Liabilities are recorded when losses become probable and are reasonably estimable. The total costs that may be incurred cannot be estimated because the extent of environmental impact, allocation among potentially responsible parties, remediation alternatives and/or regulatory decisions have not yet been determined. Additional costs associated with remediation activities are likely to be incurred in the future and could be significant. Costs are typically expensed as Operation, maintenance and other in the Consolidated Statements of Operations unless regulatory recovery of the costs is deemed probable.
The following tables contain information regarding reserves for probable and estimable costs related to the various environmental sites. These reserves are recorded in Other within Deferred Credits and Other Liabilities on the Consolidated Balance Sheets.
|
Duke
|
|
Duke
|
|
Duke
|
|
Duke
|
|
Duke
|
|
||||||||||||||||||
|
Duke
|
|
Energy
|
|
Progress
|
|
Energy
|
|
Energy
|
|
Energy
|
|
Energy
|
|
||||||||||||||
|
(in millions)
|
Energy
|
|
Carolinas
|
|
Energy
|
|
Progress
|
|
Florida
|
|
Ohio
|
|
Indiana
|
|
|||||||||||||
|
Balance at December 31, 2012
|
$
|
75
|
|
$
|
12
|
|
$
|
33
|
|
$
|
14
|
|
$
|
19
|
|
$
|
15
|
|
$
|
8
|
|
||||||
|
Provisions/adjustments
|
26
|
|
—
|
|
4
|
|
(1
|
)
|
5
|
|
20
|
|
1
|
|
|||||||||||||
|
Cash reductions
|
(22
|
)
|
(1
|
)
|
(10
|
)
|
(5
|
)
|
(5
|
)
|
(8
|
)
|
(2
|
)
|
|||||||||||||
|
Balance at December 31, 2013
|
79
|
|
11
|
|
27
|
|
8
|
|
19
|
|
27
|
|
7
|
|
|||||||||||||
|
Provisions/adjustments
|
32
|
|
(1
|
)
|
1
|
|
4
|
|
(3
|
)
|
28
|
|
4
|
|
|||||||||||||
|
Cash reductions
|
(14
|
)
|
—
|
|
(11
|
)
|
(7
|
)
|
(4
|
)
|
(1
|
)
|
(1
|
)
|
|||||||||||||
|
Balance at December 31, 2014
|
97
|
|
10
|
|
17
|
|
5
|
|
12
|
|
54
|
|
10
|
|
|||||||||||||
|
Provisions/adjustments
|
9
|
|
1
|
|
4
|
|
—
|
|
4
|
|
1
|
|
5
|
|
|||||||||||||
|
Cash reductions
|
(9
|
)
|
(1
|
)
|
(4
|
)
|
(2
|
)
|
(2
|
)
|
(1
|
)
|
(3
|
)
|
|||||||||||||
|
Balance at December 31, 2015
|
$
|
97
|
|
$
|
10
|
|
$
|
17
|
|
$
|
3
|
|
$
|
14
|
|
$
|
54
|
|
$
|
12
|
|
||||||
147
PART II
DUKE ENERGY CORPORATION - DUKE ENERGY CAROLINAS, LLC - PROGRESS ENERGY, INC. –
DUKE ENERGY PROGRESS, LLC – DUKE ENERGY FLORIDA, LLC - DUKE ENERGY OHIO, INC. - DUKE ENERGY INDIANA, INC.
Combined Notes To Consolidated Financial Statements – (Continued)
Additional losses in excess of recorded reserves that could be incurred for the stages of investigation, remediation and monitoring for environmental sites that have been evaluated at this time are not material except as presented in the table below.
|
(in millions)
|
|||
|
Duke Energy
|
$
|
74
|
|
|
Duke Energy Carolinas
|
22
|
|
|
|
Duke Energy Ohio
|
42
|
|
|
|
Duke Energy Indiana
|
7
|
|
|
North Carolina and South Carolina Ash Basins
On February 2, 2014, a break in a stormwater pipe beneath an ash basin at Duke Energy Carolinas’ retired Dan River Steam Station caused a release of ash basin water and ash into the Dan River. On February 8, 2014, a permanent plug was installed in the stormwater pipe, stopping the release of materials into the river. Duke Energy Carolinas estimates
30,000
to
39,000
tons of ash and
24 million
to
27 million
gallons of basin water were released into the river. In July 2014, Duke Energy completed remediation work identified by the EPA and continues to cooperate with the EPA's civil enforcement process. During 2014, Duke Energy Carolinas incurred repairs and remediation expenses related to the release of approximately
$24 million
. No additional expenses were recorded in 2015. Duke Energy Carolinas will not seek recovery of these costs from customers. Other costs related to the Dan River release, including pending or future state or federal civil enforcement proceedings, future regulatory directives, natural resources damages, additional pending litigation, future claims or litigation and long-term environmental impact costs, cannot be reasonably estimated at this time.
North Carolina Department of Environmental Quality (NCDEQ), formerly the North Carolina Department of Environment and Natural Resources, has historically assessed Duke Energy Carolinas and Duke Energy Progress with Notice of Violations (NOV) for violations that were most often resolved through satisfactory corrective actions and minor, if any, fines or penalties. Subsequent to the Dan River matter discussed above, Duke Energy Carolina and Duke Energy Progress have been served with a higher level of NOVs, including for violations at L.V. Sutton Plant and Dan River Steam Station. In August 2014, NCDEQ issued an NOV for alleged groundwater violations at Duke Energy Progress' L.V. Sutton Plant. On March 10, 2015, NCDEQ issued a civil penalty of approximately
$25 million
to Duke Energy Progress for environmental damages related to groundwater contamination at the L.V. Sutton Plant. See "Litigation" section below for information related to the resolution of this civil penalty. On February 8, 2016, NCDEQ assessed a penalty of approximately
$6.8 million
, including enforcement costs, against Duke Energy Carolinas related to storm-water pipes and associated discharges at the Dan River Steam Station. Duke Energy Carolinas recorded a charge to Operation, maintenance and other on the Consolidated Statements of Operations and Comprehensive Income in December 2015. Duke Energy Carolinas is reviewing the NCDEQ action to determine next steps and cannot predict the outcome of this matter. These fines and penalties are unprecedented and were not consistent with historic enforcement practices of NCDEQ. Based on historic practices the expected liability of any existing notice of violations would not be material. Duke Energy Carolinas and Duke Energy Progress cannot predict whether the NCDEQ will assess future penalties related to existing NOVs and if such penalties would be material.
See the "Litigation" section below for additional information on litigation, investigations and enforcement actions related to ash basins, including the Memorandum of Plea Agreement (Plea Agreements) in connection to the North Carolina Ash Basin Grand Jury Investigation and NCDEQ matters.
Litigation
Duke Energy
Ash Basin Shareholder Derivative Litigation
Five shareholder derivative lawsuits were filed in Delaware Chancery Court relating to the release at Dan River and to the management of Duke Energy’s ash basins. On October 31, 2014, the five lawsuits were consolidated in a single proceeding titled "In Re Duke Energy Corporation Coal Ash Derivative Litigation." On December 2, 2014, plaintiffs filed a Corrected Verified Consolidated Shareholder Derivative Complaint (Consolidated Complaint). The Consolidated Complaint names as defendants several current and former Duke Energy officers and directors (collectively, the “Duke Energy Defendants”). Duke Energy is named as a nominal defendant.
The Consolidated Complaint alleges the Duke Energy Defendants breached their fiduciary duties by failing to adequately oversee Duke Energy’s ash basins and that these breaches of fiduciary duty may have contributed to the incident at Dan River and continued thereafter. The lawsuit also asserts claims against the Duke Energy Defendants for corporate waste (relating to the money Duke Energy has spent and will spend as a result of the fines, penalties and coal ash removal) and unjust enrichment (relating to the compensation and director remuneration that was received despite these alleged breaches of fiduciary duty). The lawsuit seeks both injunctive relief against Duke Energy and restitution from the Duke Energy Defendants. On January 21, 2015, the Duke Energy Defendants filed a Motion to Stay and an alternative Motion to Dismiss. On August 31, 2015, the court issued an order staying the case through November 15, 2015. A ruling on defendants' motion to further extend the stay remains pending.
148
PART II
DUKE ENERGY CORPORATION - DUKE ENERGY CAROLINAS, LLC - PROGRESS ENERGY, INC. –
DUKE ENERGY PROGRESS, LLC – DUKE ENERGY FLORIDA, LLC - DUKE ENERGY OHIO, INC. - DUKE ENERGY INDIANA, INC.
Combined Notes To Consolidated Financial Statements – (Continued)
On March 5, 2015, shareholder Judy Mesirov filed a shareholder derivative complaint (Mesirov Complaint) in North Carolina state court. The lawsuit, styled
Mesirov v. Good
, is similar to the consolidated derivative action pending in Delaware Chancery Court and was filed against the same current directors and former directors and officers as the Delaware litigation. Duke Energy Corporation, Duke Energy Progress and Duke Energy Carolinas are named as nominal defendants. The Mesirov Complaint alleges that the Duke Energy Board of Directors was aware of Clean Water Act (CWA) compliance issues and failures to maintain structures in ash basins, but that the Board of Directors did not require Duke Energy Carolinas and Duke Energy Progress to take action to remedy deficiencies. The Mesirov Complaint further alleges that the Board of Directors sanctioned activities to avoid compliance with the law by allowing improper influence of NCDEQ to minimize regulation and by opposing previously anticipated citizen suit litigation. The Mesirov Complaint seeks corporate governance reforms and damages relating to costs associated with the Dan River release, remediation of ash basins that are out of compliance with the CWA and defending and payment of fines, penalties and settlements relating to criminal and civil investigations and lawsuits. On December 7, 2015, the Duke Energy Defendants filed a Motion to Stay the proceedings. A hearing was held on February 17, 2016, and a ruling on this motion is pending.
In addition to the above derivative complaints, in 2014, Duke Energy also received two shareholder litigation demand letters. The letters allege that the members of the Board of Directors and certain officers breached their fiduciary duties by allowing the company to illegally dispose of and store coal ash pollutants. One of the letters also alleges a breach of fiduciary duty in the decision-making relating to the leadership changes following the close of the Progress Energy merger in July 2012.
By letter dated September 4, 2015, attorneys for the shareholders were informed that, on the recommendation of the Demand Review Committee formed to consider such matters, the Board of Directors concluded not to pursue potential claims against individuals. One of the shareholders, Mitchell Pinsly, sent a formal demand for records and Duke Energy is responding to this request.
On October 30, 2015, shareholder Saul Bresalier filed a shareholder derivative complaint in the U. S. District Court for the District of Delaware. The lawsuit alleges that several current and former Duke Energy officers and directors (Bresalier Defendants) breached their fiduciary duties in connection with coal ash environmental issues, the post-merger change in Chief Executive Officer and oversight of political contributions. Duke Energy is named as a nominal defendant. The Bresalier Complaint contends that the Demand Review Committee failed to appropriately consider the shareholder’s earlier demand for litigation and improperly decided not to pursue claims against the Bresalier Defendants. The Bresalier Defendants filed a Motion to Dismiss the Bresalier litigation on January 15, 2016.
It is not possible to predict whether Duke Energy will incur any liability or to estimate the damages, if any, it might incur in connection with these matters.
Progress Energy Merger Shareholder Litigation
Duke Energy, the 11 members of the Board of Directors who were also members of the pre-merger Board of Directors (Legacy Duke Energy Directors) and certain Duke Energy officers are defendants in a purported securities class action lawsuit
(Nieman v. Duke Energy Corporation, et al)
. This lawsuit consolidates three lawsuits originally filed in July 2012 and is pending in the United States District Court for the Western District of North Carolina. The plaintiffs allege federal Securities Act of 1933 and Securities Exchange Act of 1934 (Exchange Act) claims based on allegations of materially false and misleading representations and omissions in the Registration Statement filed on July 7, 2011, and purportedly incorporated into other documents, all in connection with the post-merger change in Chief Executive Officer (CEO).
On August 15, 2014, the parties reached an agreement in principle to settle the litigation. On March 10, 2015, the parties filed a Stipulation of Settlement and a Motion for Preliminary Approval of the Settlement. The court issued an order for preliminary approval of the settlement on March 25, 2015. Under the terms of the agreement, Duke Energy agreed to pay
$146 million
to settle the claim. On April 22, 2015, Duke Energy made a payment of
$25 million
into the settlement escrow account. The remainder of
$121 million
was paid by insurers into the settlement escrow account. Notice has been sent to members of the class and a final approval hearing was held on August 12, 2015. The final order approving the settlement was issued on November 2, 2015, thus closing the matter.
On May 31, 2013, the Delaware Chancery Court consolidated four shareholder derivative lawsuits filed in 2012. The Court also appointed a lead plaintiff and counsel for plaintiffs and designated the case as
In Re Duke Energy Corporation Derivative Litigation
. The lawsuit names as defendants the Legacy Duke Energy Directors. Duke Energy is named as a nominal defendant. The case alleges claims for breach of fiduciary duties of loyalty and care in connection with the post-merger change in CEO. On December 10, 2015, the Duke Energy defendants filed a Motion to Dismiss the litigation.
Two shareholder Derivative Complaints, filed in 2012 in federal district court in Delaware, were consolidated as
Tansey v. Rogers, et al.
The case alleges claims for breach of fiduciary duty and waste of corporate assets, as well as claims under Section 14(a) and 20(a) of the Exchange Act. Duke Energy is named as a nominal defendant. On December 21, 2015, Plaintiff filed a Consolidated Amended Complaint asserting the same claims contained in the original complaints. Duke Energy filed a Motion to Dismiss on February 19, 2016.
It is not possible to predict whether Duke Energy will incur any liability or to estimate the damages, if any, it might incur in connection with the remaining litigation.
Price Reporting Cases
Duke Energy Trading and Marketing, LLC (DETM), a non-operating Duke Energy affiliate, is a defendant, along with numerous other energy companies, in four class-action lawsuits and a fifth single-plaintiff lawsuit pending in a consolidated federal court proceeding in Nevada. Each of these lawsuits contains similar claims that defendants allegedly manipulated natural gas markets by various means, including providing false information to natural gas trade publications and entering into unlawful arrangements and agreements in violation of the antitrust laws of the respective states. Plaintiffs seek damages in unspecified amounts.
149
PART II
DUKE ENERGY CORPORATION - DUKE ENERGY CAROLINAS, LLC - PROGRESS ENERGY, INC. –
DUKE ENERGY PROGRESS, LLC – DUKE ENERGY FLORIDA, LLC - DUKE ENERGY OHIO, INC. - DUKE ENERGY INDIANA, INC.
Combined Notes To Consolidated Financial Statements – (Continued)
On July 18, 2011, the judge granted a defendant’s motion for summary judgment in two of five cases. The U.S. Court of Appeals for the Ninth Circuit subsequently reversed the lower court’s decision. On April 21, 2015, the Supreme Court affirmed the U.S. Court of Appeals decision. The case has been reassigned to the same consolidated federal court proceeding in Nevada for further proceedings. In February 2016, DETM reached agreements in principle to settle all of the pending lawsuits. The class-action settlements will be subject to court approval, which is pending. The settlement amount is not material to Duke Energy.
Brazil Expansion Lawsuit
On August 9, 2011, the State of São Paulo sued Duke Energy International Geracao Paranapenema S.A. (DEIGP) in Brazilian state court. The lawsuit claims DEIGP is under a continuing obligation to expand installed generation capacity in the State of São Paulo by
15 percent
pursuant to a stock purchase agreement under which DEIGP purchased generation assets from the state. On August 10, 2011, a judge granted an ex parte injunction ordering DEIGP to present a detailed expansion plan in satisfaction of the
15 percent
obligation. DEIGP has previously taken a position that the expansion obligation is no longer viable given changes that have occurred in the electric energy sector since privatization. DEIGP submitted its proposed expansion plan on November 11, 2011, but reserved objections regarding enforceability. In January 2013, DEIGP filed appeals in the federal courts, which are still pending, regarding various procedural issues. A decision on the merits in the first instance court is also pending. It is not possible to predict whether Duke Energy will incur any liability or to estimate the damages, if any, it might incur in connection with this matter.
Brazil Generation
Record drought conditions in Brazil continue to impact Duke Energy International, Geracao Paranapanema S.A. (DEIGP). A number of electric generators have filed lawsuits seeking relief in the Brazilian courts to mitigate hydrological exposure and diminishing dispatch levels. Some courts have granted injunction orders to limit the financial exposure of certain generators. The implication of these orders is that other electricity market participants not covered by the injunctions may be required to compensate for the financial impact of the liability limitations. The Independent Power Producer Association (APINE) filed one such lawsuit on behalf of DEIGP and other hydroelectric generators against the Brazilian electric regulatory agency. On July 2, 2015, an injunction was granted in favor of APINE limiting the financial exposure of DEIGP and the other plaintiff generators, until the merits of the lawsuit are determined. The APINE decision is subject to appeal and the outcome of these lawsuits is uncertain. It is not possible to predict the impact to Duke Energy from the outcome of these matters.
Duke Energy Carolinas and Duke Energy Progress
NCDEQ Notice of Violation (NOV)
In August 2014, NCDEQ issued an NOV for alleged groundwater violations at Duke Energy Progress' L.V. Sutton Plant. On March 10, 2015, NCDEQ issued a civil penalty of approximately
$25 million
to Duke Energy Progress for environmental damages related to the groundwater contamination at the L.V. Sutton Plant. On April 9, 2015, Duke Energy Progress filed a Petition for Contested Case hearing in the Office of Administrative Hearings. In February 2015, NCDEQ issued an NOV for alleged groundwater violations at Duke Energy Progress' Asheville Plant. Duke Energy Progress responded to NCDEQ regarding this NOV.
On September 29, 2015, Duke Energy Progress and Duke Energy Carolinas entered into a settlement agreement with NCDEQ resolving all former, current and future groundwater penalties at all Duke Energy Carolinas and Duke Energy Progress coal facilities in North Carolina. Under the agreement, Duke Energy Progress paid approximately
$6 million
and Duke Energy Carolinas paid approximately
$1 million
. In addition to these payments, Duke Energy Progress and Duke Energy Carolinas will accelerate remediation actions at the Sutton, Asheville, Belews Creek and H.F. Lee plants. The court entered a consent order resolving the contested case relating to the Sutton Plant and NCDEQ rescinded the NOVs relating to alleged groundwater violations at both the Sutton and Asheville plants.
On October 13, 2015, the Southern Environmental Law Center (SELC), representing multiple conservation groups, filed a lawsuit in North Carolina Superior Court seeking judicial review of the order approving the settlement agreement with NCDEQ. The conservation groups contend that the Administrative Law Judge exceeded his statutory authority in approving a settlement that provided for past, present, and future resolution of groundwater issues at facilities which were not at issue in the penalty appeal. On December 18, 2015, Duke Energy Carolinas and Duke Energy Progress filed a Motion to Dismiss the complaint. At a hearing held on February 12, 2016, Duke Energy Carolinas and Duke Energy Progress stated that a proposed revised order would be submitted to the Administrative Law Judge to address the court's and SELC's concerns. It is not possible to predict the outcome of this matter.
NCDEQ State Enforcement Actions
In the first quarter of 2013, SELC sent notices of intent to sue Duke Energy Carolinas and Duke Energy Progress related to alleged groundwater violations and CWA violations from coal ash basins at two of their coal-fired power plants in North Carolina. NCDEQ filed enforcement actions against Duke Energy Carolinas and Duke Energy Progress alleging violations of water discharge permits and North Carolina groundwater standards. The cases have been consolidated and are being heard before a single judge.
On August 16, 2013, NCDEQ filed an enforcement action against Duke Energy Carolinas and Duke Energy Progress related to their remaining plants in North Carolina, alleging violations of the CWA and violations of the North Carolina groundwater standards. Both of these cases have been assigned to the judge handling the enforcement actions discussed above. SELC, on behalf of several environmental groups, has been permitted to intervene in these cases.
On July 10, 2015, Duke Energy Carolinas and Duke Energy Progress filed Motions for Partial Summary Judgment in the case on the basis that there is no longer either a genuine controversy or disputed material facts about the relief for seven of the 14 North Carolina plants with coal ash basins. On September 14, 2015, the court granted the Motions for Partial Summary Judgment pending court approval of the terms through an order. In November 2015, NCDEQ submitted a proposed order. On November 23, 2015, Duke Energy Carolinas, Duke Energy Progress and SELC filed separate objections to portions of the NCDEQ filing. The parties are drafting a consolidated order to comply with the ruling made by the judge at a hearing held on February 12, 2016.
150
PART II
DUKE ENERGY CORPORATION - DUKE ENERGY CAROLINAS, LLC - PROGRESS ENERGY, INC. –
DUKE ENERGY PROGRESS, LLC – DUKE ENERGY FLORIDA, LLC - DUKE ENERGY OHIO, INC. - DUKE ENERGY INDIANA, INC.
Combined Notes To Consolidated Financial Statements – (Continued)
It is not possible to predict any liability or estimate any damages Duke Energy Carolinas or Duke Energy Progress might incur in connection with these matters.
North Carolina Declaratory Judgment Action
On October 10, 2012, the SELC, on behalf of the same environmental groups that are involved in the state enforcement actions discussed above, filed a petition with the North Carolina Environmental Management Commission (EMC) asking for a declaratory ruling seeking to clarify the application of the state’s groundwater protection rules to coal ash basins. The petition sought to change the interpretation of regulations that permitted NCDEQ to assess the extent, cause and significance of any groundwater contamination before ordering action to eliminate the source of contamination, among other issues. Duke Energy Carolinas and Duke Energy Progress were both permitted to intervene in the matter. On December 3, 2012, the EMC affirmed this interpretation of the regulations.
On March 6, 2014, a North Carolina Superior Court judge overturned the ruling of the EMC holding that in the case of groundwater contamination, NCDEQ was required to issue an order to immediately eliminate the source of the contamination before an assessment of the nature, significance and extent of the contamination or the continuing damage to the groundwater was conducted. Duke Energy Carolinas, Duke Energy Progress and the EMC appealed the ruling in April 2014. On May 16, 2014, the North Carolina Court of Appeals denied a petition to stay the case during the appeal. On October 10, 2014, the parties were notified the case has been transferred to the North Carolina Supreme Court (NCSC). Oral argument was held on March 16, 2015. On June 11, 2015, the NCSC issued its opinion in favor of Duke Energy Carolinas, Duke Energy Progress and the EMC and remanded the matter to the state court judge with instructions to dismiss the case. This matter is now closed.
Federal Citizens Suits
There are currently five cases filed in various North Carolina federal courts related to the Riverbend, Sutton, Cape Fear, H.F. Lee and Buck plants.
On June 11, 2013, Catawba Riverkeeper Foundation, Inc. (Catawba Riverkeeper) filed a separate action in the United States Court for the Western District of North Carolina. The lawsuit contends the state enforcement action discussed above does not adequately address issues raised in Catawba Riverkeeper’s notice of intent to sue relating to the Riverbend Steam Station. On April 11, 2014, the Court denied Catawba Riverkeeper’s objections to the Magistrate Judge’s recommendation that plaintiff’s case be dismissed as well as Duke Energy Carolinas’ motion to dismiss. On August 13, 2015, the court issued an order suspending all proceedings until further order from the court.
On September 12, 2013, Cape Fear River Watch, Inc., Sierra Club and Waterkeeper Alliance filed a citizen suit in the Federal District Court for the Eastern District of North Carolina. The lawsuit alleges unpermitted discharges to surface water and groundwater violations at the Sutton Plant. On June 9, 2014, the court granted Duke Energy Progress' request to dismiss the groundwater claims but rejected its request to dismiss the surface water claims. In response to a motion filed by the SELC, on August 1, 2014, the court modified the original June 9
order to dismiss only the plaintiff's federal law claim based on hydrologic connections at Sutton Lake. The claims related to the alleged state court violations of the permits are back in the case. On August 26, 2015, the court suspended the proceedings until further order from the court.
On September 3, 2014, three citizen suits were filed by various environmental groups: (i) a citizen suit in the United States Court for the Middle District of North Carolina alleging unpermitted discharges to surface water and groundwater violations at the Cape Fear Plant; (ii) in the United States Court for the Eastern District of North Carolina alleging unpermitted discharges to surface water and groundwater violations at the H.F. Lee Plant; and (iii) in the United States Court for the Middle District of North Carolina alleging unpermitted discharges to surface water and groundwater violations at the Buck Steam Station. Motions to Stay or Dismiss the proceedings were filed in each of the three cases. The proceedings related to Cape Fear and H.F. Lee have been stayed. On October 20, 2015, the court issued an order denying the motions in the Buck proceedings. Duke Energy Carolinas' motion seeking appellate review of the District Court's decision was denied on January 29, 2016.
It is not possible to predict whether Duke Energy Carolinas or Duke Energy Progress will incur any liability or to estimate the damages, if any, they might incur in connection with these matters.
North Carolina Ash Basin Grand Jury Investigation
As a result of the Dan River ash basin water release discussed above, NCDEQ issued a Notice of Violation and Recommendation of Assessment of Civil Penalties with respect to this matter on February 28, 2014, which the company responded to on March 13, 2014. Duke Energy and certain Duke Energy employees received subpoenas issued by the United States Attorney for the Eastern District of North Carolina in connection with a criminal investigation related to all
14
of the North Carolina facilities with ash basins and the nature of Duke Energy's contacts with NCDEQ with respect to those facilities. This was a multidistrict investigation that also involves state law enforcement authorities.
On February 20, 2015, Duke Energy Carolinas, Duke Energy Progress and Duke Energy Business Services LLC (DEBS), a wholly owned subsidiary of Duke Energy, each entered into Plea Agreements in connection with the investigation initiated by the United States Department of Justice Environmental Crimes Section and the United States Attorneys for the Eastern District of North Carolina, the Middle District of North Carolina and the Western District of North Carolina (collectively, USDOJ). On May 14, 2015, the United States District Court for the Eastern District of North Carolina approved the Plea Agreements.
151
PART II
DUKE ENERGY CORPORATION - DUKE ENERGY CAROLINAS, LLC - PROGRESS ENERGY, INC. –
DUKE ENERGY PROGRESS, LLC – DUKE ENERGY FLORIDA, LLC - DUKE ENERGY OHIO, INC. - DUKE ENERGY INDIANA, INC.
Combined Notes To Consolidated Financial Statements – (Continued)
Under the Plea Agreements, DEBS and Duke Energy Progress pleaded guilty to four misdemeanor CWA violations related to violations at Duke Energy Progress’ H.F. Lee Steam Electric Plant, Cape Fear Steam Electric Plant and Asheville Steam Electric Generating Plant. Duke Energy Carolinas and DEBS pleaded guilty to five misdemeanor CWA violations related to violations at Duke Energy Carolinas’ Dan River Steam Station and Riverbend Steam Station. DEBS, Duke Energy Carolinas and Duke Energy Progress also agreed (i) to a five-year probation period, (ii) to pay a total of approximately
$68 million
in fines and restitution and
$34 million
for community service and mitigation (the Payments), (iii) to fund and establish environmental compliance plans subject to the oversight of a court-appointed monitor in addition to certain other conditions set out in the Plea Agreements. Duke Energy Carolinas and Duke Energy Progress also agree to each maintain
$250 million
under their Master Credit Facility as security to meet their obligations under the Plea Agreements. Payments under the Plea Agreements will be borne by shareholders and are not tax deductible. Duke Energy Corporation has agreed to issue a guarantee of all payments and performance due from DEBS, Duke Energy Carolinas and Duke Energy Progress, including but not limited to payments for fines, restitution, community service, mitigation and the funding of, and obligations under, the environmental compliance plans. As a result of the Plea Agreements, Duke Energy Carolinas and Duke Energy Progress recognized charges of
$72 million
and
$30 million
, respectively, in Operation, maintenance and other on the Consolidated Statements of Operations and Comprehensive Income during 2014. Payment of the amounts relating to fines and restitution were made between May and July 2015. The Plea Agreements do not cover pending civil claims related to the Dan River coal ash release and operations at other North Carolina coal plants.
On May 14, 2015, Duke Energy reached an Interim Administrative Agreement with the U.S. Environmental Protection Agency Office of Suspension and Debarment that avoids debarment of DEBS, Duke Energy Carolinas or Duke Energy Progress with respect to all active generating facilities. The Interim Administrative Agreement imposes a number of requirements relating to environmental and ethical compliance, subject to the oversight of an independent monitor.
Potential Groundwater Contamination Claims
Beginning in May 2015, a number of residents living in the vicinity of the North Carolina facilities with ash basins received letters from NCDEQ advising them not to drink water from the private wells on their land tested by NCDEQ as the samples were found to have certain substances at levels higher than the criteria set by the North Carolina Department of Health and Human Services (DHHS). The criteria, in some cases, are considerably more stringent than federal drinking water standards established to protect human health and welfare. The Coal Ash Act requires additional groundwater monitoring and assessments for each of the 14 coal-fired plants in North Carolina, including sampling of private water supply wells. The data gathered through these Comprehensive Site Assessments (CSAs) will be used by NCDEQ to determine whether the water quality of these private water supply wells has been adversely impacted by the ash basins. Duke Energy has submitted CSAs documenting the results of extensive groundwater monitoring around coal ash basins at all 14 of the plants with coal ash basins. Generally, the data gathered through the installation of new monitoring wells and soil and water samples across the state have been consistent with historical data provided to state regulators over many years. The DHHS and NCDEQ sent follow-up letters on October 15, 2015, to residents near coal ash basins who have had their wells tested, stating that private well samplings at a considerable distance from coal ash impoundments, as well as some municipal water supplies, contain similar levels of vanadium and hexavalent chromium which leads investigators to believe these constituents are naturally occurring. It is not possible to estimate the maximum exposure of loss, if any, that may occur in connection with claims which might be made by these residents.
Duke Energy Carolinas
New Source Review
In 1999-2000, the U.S. Department of Justice (DOJ) on behalf of the EPA filed a number of complaints and notices of violation against multiple utilities, including Duke Energy Carolinas, for alleged violations of the New Source Review (NSR) provisions of the Clean Air Act (CAA). The government alleges the utilities violated the CAA when undertaking certain maintenance and repair projects at certain coal plants without (i) obtaining NSR permits and (ii) installing the best available emission controls for sulfur dioxide, nitrogen oxide and particulate matter. The complaints sought the installation of pollution control technology on generating units that allegedly violated the CAA, and unspecified civil penalties in amounts of up to
$37,500
per day for each violation.
In 2000, the government sued Duke Energy Carolinas in the U.S. District Court in Greensboro, North Carolina, claiming NSR violations for
29
projects performed at
25
of Duke Energy Carolinas’ coal-fired units. Duke Energy Carolinas asserted there were no CAA violations because the applicable regulations do not require NSR permitting in cases where the projects undertaken are routine or otherwise do not result in an increase in emissions. In 2011, the parties filed a stipulation agreeing to dismiss with prejudice all but
13
claims at
13
generating units,
11
of which have since been retired. On October 20, 2015, the Court approved and entered a consent decree to resolve this matter. Under the consent decree, Duke Energy Carolinas will retire by the end of 2024, the remaining units at the Allen plant that are part of the litigation as well as a third unit that is not part of the litigation. Prior to closure, Duke Energy Carolinas will comply with new, lower emissions limits at the Allen units named in the litigation. Additionally, Duke Energy Carolinas will spend approximately
$4 million
on environmental projects and donations and pay a civil penalty of
$975 thousand
. This matter is now closed.
Asbestos-related Injuries and Damages Claims
Duke Energy Carolinas has experienced numerous claims for indemnification and medical cost reimbursement related to asbestos exposure. These claims relate to damages for bodily injuries alleged to have arisen from exposure to or use of asbestos in connection with construction and maintenance activities conducted on its electric generation plants prior to 1985. As of
December 31, 2015
, there were
156
asserted claims for non-malignant cases with the cumulative relief sought of up to
$37 million
, and
70
asserted claims for malignant cases with the cumulative relief sought of up to
$11 million
. Based on Duke Energy Carolinas’ experience, it is expected that the ultimate resolution of most of these claims likely will be less than the amount claimed.
152
PART II
DUKE ENERGY CORPORATION - DUKE ENERGY CAROLINAS, LLC - PROGRESS ENERGY, INC. –
DUKE ENERGY PROGRESS, LLC – DUKE ENERGY FLORIDA, LLC - DUKE ENERGY OHIO, INC. - DUKE ENERGY INDIANA, INC.
Combined Notes To Consolidated Financial Statements – (Continued)
Duke Energy Carolinas has recognized asbestos-related reserves of
$536 million
and
$575 million
at
December 31, 2015
and
2014
, respectively. These reserves are classified in Other within Deferred Credits and Other Liabilities and Other within Current Liabilities on the Consolidated Balance Sheets. These reserves are based upon the minimum amount of the range of loss for current and future asbestos claims through 2033, are recorded on an undiscounted basis and incorporate anticipated inflation. In light of the uncertainties inherent in a longer-term forecast, management does not believe they can reasonably estimate the indemnity and medical costs that might be incurred after 2033 related to such potential claims. It is possible Duke Energy Carolinas may incur asbestos liabilities in excess of the recorded reserves.
Duke Energy Carolinas has third-party insurance to cover certain losses related to asbestos-related injuries and damages above an aggregate self-insured retention. Duke Energy Carolinas’ cumulative payments began to exceed the self-insurance retention in 2008. Future payments up to the policy limit will be reimbursed by the third-party insurance carrier. The insurance policy limit for potential future insurance recoveries indemnification and medical cost claim payments is
$847 million
in excess of the self-insured retention. Receivables for insurance recoveries were
$599 million
and
$616 million
at
December 31, 2015
and
2014
, respectively. These amounts are classified in Other within Investments and Other Assets and Receivables on the Consolidated Balance Sheets. Duke Energy Carolinas is not aware of any uncertainties regarding the legal sufficiency of insurance claims. Duke Energy Carolinas believes the insurance recovery asset is probable of recovery as the insurance carrier continues to have a strong financial strength rating.
Duke Energy Progress and Duke Energy Florida
Spent Nuclear Fuel Matters
On December 12, 2011, Duke Energy Progress and Duke Energy Florida sued the United States in the U.S. Court of Federal Claims. The lawsuit claimed the Department of Energy breached a contract in failing to accept spent nuclear fuel under the Nuclear Waste Policy Act of 1982 and asserted damages for the cost of on-site storage. Duke Energy Progress and Duke Energy Florida asserted damages for the period January 1, 2006 through December 31, 2010. Claims for all periods prior to 2006 have been resolved. On March 24, 2014, the U.S. Court of Federal Claims issued a judgment in favor of Duke Energy Progress and Duke Energy Florida on this matter, awarding amounts of
$83 million
and
$21 million
, respectively. The majority of the awards were recorded as a reduction to capital costs associated with construction of on-site storage facilities. Duke Energy Progress and Duke Energy Florida received payment of the award in September 2014. On October 16, 2014, Duke Energy Progress and Duke Energy Florida filed a new action for costs incurred from 2011 through 2013 of
$48 million
and
$25 million
, respectively.
Duke Energy Florida
Class Action Lawsuit
On February 22, 2016, Newton, et al v. Duke Energy Florida, LLC and Florida Power & Light Company, was filed in the U.S. District Court for the Southern District of Florida on behalf of a putative class of Duke Energy Florida and Florida Power & Light Company’s customers in Florida. Plaintiffs allege that Florida’s Nuclear Cost Recovery Statutes are unconstitutional and are pre-empted by federal law. Duke Energy Florida has not yet been served with the lawsuit.
Westinghouse Contract Litigation
On March 28, 2014, Duke Energy Florida filed a lawsuit against Westinghouse in the U.S. District Court for the Western District of North Carolina. The lawsuit seeks recovery of
$54 million
in milestone payments in excess of work performed under the terminated EPC for Levy as well as a determination by the court of the amounts due to Westinghouse as a result of the termination of the EPC. Duke Energy Florida recognized an exit obligation as a result of the termination of the EPC contract.
On March 31, 2014, Westinghouse filed a lawsuit against Duke Energy Florida in U.S. District Court for the Western District of Pennsylvania. The Pennsylvania lawsuit alleged damages under the EPC in excess of
$510 million
for engineering and design work, costs to end supplier contracts and an alleged termination fee.
On June 9, 2014, the judge in the North Carolina case ruled that the litigation will proceed in the Western District of North Carolina. In November 2014, Westinghouse filed a Motion for Partial Judgment on the pleadings, which was denied on March 30, 2015. The case is to be ready for trial on September 19, 2016. It is not possible to predict the outcome of the litigation, whether Duke Energy Florida will ultimately have any liability for terminating the EPC contract or to estimate the damages, if any, it might incur in connection with these matters. Ultimate resolution of these matters could have a material effect on the results of operations, financial position or cash flows of Duke Energy Florida. However, appropriate regulatory recovery will be pursued for the retail portion of any costs incurred in connection with such resolution.
Duke Energy Ohio
Antitrust Lawsuit
In January 2008, four plaintiffs, including individual, industrial and nonprofit customers, filed a lawsuit against Duke Energy Ohio in federal court in the Southern District of Ohio. Plaintiffs alleged Duke Energy Ohio conspired to provide inequitable and unfair price advantages for certain large business consumers by entering into nonpublic option agreements in exchange for their withdrawal of challenges to Duke Energy Ohio’s Rate Stabilization Plan implemented in early 2005. In March 2014, a federal judge certified this matter as a class action. Plaintiffs allege claims for antitrust violations under the federal Robinson Patman Act as well as fraud and conspiracy allegations under the federal Racketeer Influenced and Corrupt Organizations statute and the Ohio Corrupt Practices Act.
On October 21, 2015, the parties received preliminary court approval for a settlement agreement. A litigation settlement reserve was recorded for the full amount of
$81 million
and classified in Other within Current Liabilities on Duke Energy Ohio's Consolidated Balance Sheets as of
December 31, 2015
. Duke Energy Ohio recognized the full amount in (Loss) Income From Discontinued Operations, net of tax in the Consolidated Statements of Operations and Comprehensive Income for the twelve months ended December 31, 2015. A hearing to consider objections to the settlement is scheduled for April 2016.
153
PART II
DUKE ENERGY CORPORATION - DUKE ENERGY CAROLINAS, LLC - PROGRESS ENERGY, INC. –
DUKE ENERGY PROGRESS, LLC – DUKE ENERGY FLORIDA, LLC - DUKE ENERGY OHIO, INC. - DUKE ENERGY INDIANA, INC.
Combined Notes To Consolidated Financial Statements – (Continued)
See Note
2
for further discussion on the Midwest Generation Exit.
W.C. Beckjord Fuel Release
On August 18, 2014, approximately
9,000
gallons of fuel oil were inadvertently discharged into the Ohio River during a fuel oil transfer at the W.C. Beckjord generating station. The Ohio Environmental Protection Agency (Ohio EPA) issued a Notice of Violation related to the discharge. Duke Energy Ohio is cooperating with the Ohio EPA, the EPA and the U.S. Attorney for the Southern District of Ohio. No Notice of Violation has been issued by the EPA and no penalty has been assessed. Total repair and remediation costs related to the release were not material. Other costs related to the release, including state or federal civil or criminal enforcement proceedings, cannot be reasonably estimated at this time.
Duke Energy Indiana
Edwardsport IGCC
On December 11, 2012, Duke Energy Indiana filed an arbitration action against General Electric Company and Bechtel Corporation in connection with their work at the Edwardsport IGCC facility. Duke Energy Indiana sought damages equaling some or all of the additional costs incurred in the construction of the project not recovered at the IURC. The arbitration hearing concluded in December 2014. On May 6, 2015, the arbitration panel issued its final decision unanimously dismissing all of Duke Energy Indiana’s claims. This ruling resolves all outstanding issues in the arbitration.
Other Litigation and Legal Proceedings
The Duke Energy Registrants are involved in other legal, tax and regulatory proceedings arising in the ordinary course of business, some of which involve significant amounts. The Duke Energy Registrants believe the final disposition of these proceedings will not have a material effect on their results of operations, cash flows or financial position.
The table below presents recorded reserves based on management’s best estimate of probable loss for legal matters, excluding asbestos-related reserves and the exit obligation discussed above related to the termination of an EPC contract. Reserves are classified on the Consolidated Balance Sheets in Other within Deferred Credits and Other Liabilities and Accounts payable and Other within Current Liabilities. The reasonably possible range of loss in excess of recorded reserves is not material, other than as described above.
|
|
December 31,
|
||||||
|
(in millions)
|
2015
|
|
2014
|
|
|||
|
Reserves for Legal Matters
|
|
|
|||||
|
Duke Energy
|
$
|
166
|
|
$
|
323
|
|
|
|
Duke Energy Carolinas
|
11
|
|
72
|
|
|||
|
Progress Energy
|
54
|
|
93
|
|
|||
|
Duke Energy Progress
|
6
|
|
37
|
|
|||
|
Duke Energy Florida
|
31
|
|
36
|
|
|||
|
Duke Energy Ohio
|
80
|
|
—
|
|
|||
OTHER COMMITMENTS AND CONTINGENCIES
General
As part of their normal business, the Duke Energy Registrants are party to various financial guarantees, performance guarantees and other contractual commitments to extend guarantees of credit and other assistance to various subsidiaries, investees and other third parties. These guarantees involve elements of performance and credit risk, which are not fully recognized on the Consolidated Balance Sheets and have unlimited maximum potential payments. However, the Duke Energy Registrants do not believe these guarantees will have a material effect on their results of operations, cash flows or financial position.
Purchase Obligations
Purchased Power
Duke Energy Progress and Duke Energy Florida have ongoing purchased power contracts, including renewable energy contracts, with other utilities, wholesale marketers, co-generators, and qualified facilities. These purchased power contracts generally provide for capacity and energy payments. In addition, Duke Energy Progress and Duke Energy Florida have various contracts to secure transmission rights.
The following table presents executory purchased power contracts with terms exceeding one year, excluding contracts classified as leases.
|
|
|
Minimum Purchase Amount at December 31, 2015
|
|||||||||||||||||||||||||||
|
Contract
|
|||||||||||||||||||||||||||||
|
(in millions)
|
Expiration
|
2016
|
|
2017
|
|
2018
|
|
2019
|
|
2020
|
|
Thereafter
|
|
Total
|
|
||||||||||||||
|
Duke Energy Progress
(a)
|
2019-2031
|
$
|
54
|
|
$
|
60
|
|
$
|
61
|
|
$
|
62
|
|
$
|
49
|
|
$
|
363
|
|
$
|
649
|
|
|||||||
|
Duke Energy Florida
(b)
|
2021-2043
|
305
|
|
345
|
|
360
|
|
377
|
|
394
|
|
1,591
|
|
3,372
|
|
||||||||||||||
|
Duke Energy Ohio
(c)(d)
|
2017-2018
|
236
|
|
195
|
|
59
|
|
—
|
|
—
|
|
—
|
|
490
|
|
||||||||||||||
154
PART II
DUKE ENERGY CORPORATION - DUKE ENERGY CAROLINAS, LLC - PROGRESS ENERGY, INC. –
DUKE ENERGY PROGRESS, LLC – DUKE ENERGY FLORIDA, LLC - DUKE ENERGY OHIO, INC. - DUKE ENERGY INDIANA, INC.
Combined Notes To Consolidated Financial Statements – (Continued)
(a) Contracts represent between
15 percent
and
100 percent
of net plant output.
(b) Contracts represent between
80 percent
and
100 percent
of net plant output.
(c) Contracts represent between
1 percent
and
11 percent
of net plant output.
(d) Excludes purchase power agreement with OVEC. See Note 17 for additional information.
Operating and Capital Lease Commitments
The Duke Energy Registrants lease office buildings, railcars, vehicles, computer equipment and other property and equipment with various terms and expiration dates. Additionally, Duke Energy Progress has a capital lease related to firm gas pipeline transportation capacity. Duke Energy Progress and Duke Energy Florida have entered into certain purchased power agreements, which are classified as leases. Consolidated capitalized lease obligations are classified as Long-Term Debt or Other within Current Liabilities on the Consolidated Balance Sheets. Amortization of assets recorded under capital leases is included in Depreciation and amortization and Fuel used in electric generation – regulated on the Consolidated Statements of Operations.
The following table presents rental expense for operating leases. These amounts are included in Operation, maintenance and other on the Consolidated Statements of Operations.
|
|
Years Ended December 31,
|
||||||||||
|
(in millions)
|
2015
|
|
2014
|
|
2013
|
|
|||||
|
Duke Energy
|
$
|
318
|
|
$
|
355
|
|
$
|
321
|
|
||
|
Duke Energy Carolinas
|
41
|
|
41
|
|
39
|
|
|||||
|
Progress Energy
|
230
|
|
257
|
|
225
|
|
|||||
|
Duke Energy Progress
|
149
|
|
161
|
|
153
|
|
|||||
|
Duke Energy Florida
|
81
|
|
96
|
|
72
|
|
|||||
|
Duke Energy Ohio
|
13
|
|
17
|
|
14
|
|
|||||
|
Duke Energy Indiana
|
20
|
|
21
|
|
22
|
|
|||||
The following table presents future minimum lease payments under operating leases, which at inception had a non-cancelable term of more than one year.
|
|
December 31, 2015
|
||||||||||||||||||||||||||
|
Duke
|
|
Duke
|
|
Duke
|
|
Duke
|
|
Duke
|
|
||||||||||||||||||
|
Duke
|
|
Energy
|
|
Progress
|
|
Energy
|
|
Energy
|
|
Energy
|
|
Energy
|
|
||||||||||||||
|
(in millions)
|
Energy
|
|
Carolinas
|
|
Energy
|
|
Progress
|
|
Florida
|
|
Ohio
|
|
Indiana
|
|
|||||||||||||
|
2016
|
$
|
219
|
|
$
|
41
|
|
$
|
132
|
|
$
|
66
|
|
$
|
66
|
|
$
|
13
|
|
$
|
20
|
|
||||||
|
2017
|
182
|
|
33
|
|
111
|
|
63
|
|
48
|
|
9
|
|
15
|
|
|||||||||||||
|
2018
|
161
|
|
24
|
|
108
|
|
61
|
|
47
|
|
6
|
|
12
|
|
|||||||||||||
|
2019
|
146
|
|
21
|
|
102
|
|
56
|
|
46
|
|
4
|
|
8
|
|
|||||||||||||
|
2020
|
127
|
|
16
|
|
93
|
|
48
|
|
45
|
|
3
|
|
5
|
|
|||||||||||||
|
Thereafter
|
864
|
|
51
|
|
622
|
|
365
|
|
257
|
|
5
|
|
8
|
|
|||||||||||||
|
Total
|
$
|
1,699
|
|
$
|
186
|
|
$
|
1,168
|
|
$
|
659
|
|
$
|
509
|
|
$
|
40
|
|
$
|
68
|
|
||||||
The following table presents future minimum lease payments under capital leases.
|
|
December 31, 2015
|
||||||||||||||||||||||||||
|
Duke
|
|
Duke
|
|
Duke
|
|
Duke
|
|
Duke
|
|
||||||||||||||||||
|
Duke
|
|
Energy
|
|
Progress
|
|
Energy
|
|
Energy
|
|
Energy
|
|
Energy
|
|
||||||||||||||
|
(in millions)
|
Energy
|
|
Carolinas
|
|
Energy
|
|
Progress
|
|
Florida
|
|
Ohio
|
|
Indiana
|
|
|||||||||||||
|
2016
|
$
|
173
|
|
$
|
6
|
|
$
|
46
|
|
$
|
20
|
|
$
|
26
|
|
$
|
7
|
|
$
|
3
|
|
||||||
|
2017
|
171
|
|
6
|
|
46
|
|
21
|
|
25
|
|
1
|
|
1
|
|
|||||||||||||
|
2018
|
180
|
|
6
|
|
46
|
|
21
|
|
25
|
|
5
|
|
2
|
|
|||||||||||||
|
2019
|
178
|
|
6
|
|
45
|
|
22
|
|
25
|
|
1
|
|
1
|
|
|||||||||||||
|
2020
|
182
|
|
5
|
|
46
|
|
21
|
|
25
|
|
—
|
|
1
|
|
|||||||||||||
|
Thereafter
|
1,176
|
|
30
|
|
367
|
|
272
|
|
95
|
|
1
|
|
43
|
|
|||||||||||||
|
Minimum annual payments
|
2,060
|
|
59
|
|
596
|
|
377
|
|
221
|
|
15
|
|
51
|
|
|||||||||||||
|
Less: amount representing interest
|
(724
|
)
|
(35
|
)
|
(295
|
)
|
(230
|
)
|
(65
|
)
|
(2
|
)
|
(38
|
)
|
|||||||||||||
|
Total
|
$
|
1,336
|
|
$
|
24
|
|
$
|
301
|
|
$
|
147
|
|
$
|
156
|
|
$
|
13
|
|
$
|
13
|
|
||||||
155
PART II
DUKE ENERGY CORPORATION - DUKE ENERGY CAROLINAS, LLC - PROGRESS ENERGY, INC. –
DUKE ENERGY PROGRESS, LLC – DUKE ENERGY FLORIDA, LLC - DUKE ENERGY OHIO, INC. - DUKE ENERGY INDIANA, INC.
Combined Notes To Consolidated Financial Statements – (Continued)
6. DEBT AND CREDIT FACILITIES
The following tables summarize outstanding debt.
|
|
December 31, 2015
|
|||||||||||||||||||||||
|
Weighted
|
|
|||||||||||||||||||||||
|
Average
|
|
Duke
|
|
Duke
|
|
Duke
|
|
Duke
|
|
Duke
|
|
|||||||||||||
|
Interest
|
|
Duke
|
|
Energy
|
|
Progress
|
|
Energy
|
|
Energy
|
|
Energy
|
|
Energy
|
|
|||||||||
|
(in millions)
|
Rate
|
|
Energy
|
|
Carolinas
|
|
Energy
|
|
Progress
|
|
Florida
|
|
Ohio
|
|
Indiana
|
|
||||||||
|
Unsecured debt, maturing 2016 - 2073
|
4.99
|
%
|
$
|
13,392
|
|
$
|
1,152
|
|
$
|
3,850
|
|
$
|
—
|
|
$
|
150
|
|
$
|
765
|
|
$
|
740
|
|
|
|
Secured debt, maturing 2016 - 2037
|
2.57
|
%
|
2,635
|
|
425
|
|
479
|
|
254
|
|
225
|
|
—
|
|
—
|
|
||||||||
|
First mortgage bonds, maturing 2016 - 2045
(a)
|
4.74
|
%
|
18,980
|
|
6,161
|
|
9,750
|
|
5,975
|
|
3,775
|
|
750
|
|
2,319
|
|
||||||||
|
Capital leases, maturing 2016 - 2051
(b)
|
5.38
|
%
|
1,336
|
|
24
|
|
300
|
|
144
|
|
156
|
|
13
|
|
14
|
|
||||||||
|
Tax-exempt bonds, maturing 2017 - 2041
(c)
|
2.59
|
%
|
1,053
|
|
355
|
|
48
|
|
48
|
|
—
|
|
77
|
|
572
|
|
||||||||
|
Notes payable and commercial paper
(d)
|
0.88
|
%
|
4,258
|
|
—
|
|
—
|
|
—
|
|
—
|
|
—
|
|
—
|
|
||||||||
|
Money pool/intercompany borrowings
|
|
—
|
|
300
|
|
1,458
|
|
359
|
|
813
|
|
128
|
|
150
|
|
|||||||||
|
Fair value hedge carrying value adjustment
|
|
6
|
|
6
|
|
—
|
|
—
|
|
—
|
|
—
|
|
—
|
|
|||||||||
|
Unamortized debt discount and premium, net
(e)
|
|
1,712
|
|
(17
|
)
|
(28
|
)
|
(16
|
)
|
(8
|
)
|
(28
|
)
|
(8
|
)
|
|||||||||
|
Unamortized debt issuance costs
(f)
|
(170
|
)
|
(39
|
)
|
(85
|
)
|
(37
|
)
|
(32
|
)
|
(4
|
)
|
(19
|
)
|
||||||||||
|
Total debt
|
4.25
|
%
|
$
|
43,202
|
|
$
|
8,367
|
|
$
|
15,772
|
|
$
|
6,727
|
|
$
|
5,079
|
|
$
|
1,701
|
|
$
|
3,768
|
|
|
|
Short-term notes payable and commercial paper
|
|
(3,633
|
)
|
—
|
|
—
|
|
—
|
|
—
|
|
—
|
|
—
|
|
|||||||||
|
Short-term money pool/intercompany borrowings
|
—
|
|
—
|
|
(1,308
|
)
|
(209
|
)
|
(813
|
)
|
(103
|
)
|
—
|
|
||||||||||
|
Current maturities of long-term debt
(g)
|
|
(2,074
|
)
|
(356
|
)
|
(315
|
)
|
(2
|
)
|
(13
|
)
|
(106
|
)
|
(547
|
)
|
|||||||||
|
Total long-term debt
(g)
|
|
$
|
37,495
|
|
$
|
8,011
|
|
$
|
14,149
|
|
$
|
6,516
|
|
$
|
4,253
|
|
$
|
1,492
|
|
$
|
3,221
|
|
||
|
(a)
|
Substantially all electric utility property is mortgaged under mortgage bond indentures.
|
|
(b)
|
Duke Energy includes
$114 million
and
$731 million
of capital lease purchase accounting adjustments related to Duke Energy Progress and Duke Energy Florida, respectively, related to power purchase agreements that are not accounted for as capital leases in their respective financial statements because of grandfathering provisions in GAAP.
|
|
(c)
|
Substantially all tax-exempt bonds are secured by first mortgage bonds or letters of credit.
|
|
(d)
|
Includes
$625 million
that was classified as Long-Term Debt on the Consolidated Balance Sheets due to the existence of long-term credit facilities that back-stop these commercial paper balances, along with Duke Energy’s ability and intent to refinance these balances on a long-term basis. The weighted average days to maturity for commercial paper was 15 days.
|
|
(e)
|
Duke Energy includes
$1,798 million
in purchase accounting adjustments related to the merger with Progress Energy.
|
|
(f)
|
Duke Energy includes
$59 million
in purchase accounting adjustments primarily related to the merger with Progress Energy.
|
|
(g)
|
Refer to Note 17 for additional information on amounts from consolidated VIEs.
|
156
PART II
DUKE ENERGY CORPORATION - DUKE ENERGY CAROLINAS, LLC - PROGRESS ENERGY, INC. –
DUKE ENERGY PROGRESS, LLC – DUKE ENERGY FLORIDA, LLC - DUKE ENERGY OHIO, INC. - DUKE ENERGY INDIANA, INC.
Combined Notes To Consolidated Financial Statements – (Continued)
|
|
December 31, 2014
|
|||||||||||||||||||||||
|
Weighted
|
|
|||||||||||||||||||||||
|
Average
|
|
Duke
|
|
Duke
|
|
Duke
|
|
Duke
|
|
Duke
|
|
|||||||||||||
|
Interest
|
|
Duke
|
|
Energy
|
|
Progress
|
|
Energy
|
|
Energy
|
|
Energy
|
|
Energy
|
|
|||||||||
|
(in millions)
|
Rate
|
|
Energy
|
|
Carolinas
|
|
Energy
|
|
Progress
|
|
Florida
|
|
Ohio
|
|
Indiana
|
|
||||||||
|
Unsecured debt, maturing 2015 - 2073
|
4.92
|
%
|
$
|
12,937
|
|
$
|
1,155
|
|
$
|
3,850
|
|
$
|
—
|
|
$
|
150
|
|
$
|
773
|
|
$
|
742
|
|
|
|
Secured debt, maturing 2016 - 2037
|
2.50
|
%
|
2,806
|
|
400
|
|
525
|
|
300
|
|
225
|
|
—
|
|
—
|
|
||||||||
|
First mortgage bonds, maturing 2015 - 2044
(a)
|
4.76
|
%
|
19,180
|
|
6,161
|
|
9,800
|
|
5,475
|
|
4,325
|
|
900
|
|
2,319
|
|
||||||||
|
Capital leases, maturing 2015 - 2051
(b)
|
5.30
|
%
|
1,428
|
|
27
|
|
314
|
|
146
|
|
168
|
|
20
|
|
16
|
|
||||||||
|
Tax-exempt bonds, maturing 2015 - 2041
(c)
|
2.13
|
%
|
1,296
|
|
355
|
|
291
|
|
291
|
|
—
|
|
77
|
|
573
|
|
||||||||
|
Notes payable and commercial paper
(d)
|
0.70
|
%
|
2,989
|
|
—
|
|
—
|
|
—
|
|
—
|
|
—
|
|
—
|
|
||||||||
|
Money pool/intercompany borrowings
|
|
—
|
|
300
|
|
835
|
|
—
|
|
84
|
|
516
|
|
221
|
|
|||||||||
|
Fair value hedge carrying value adjustment
|
|
8
|
|
8
|
|
—
|
|
—
|
|
—
|
|
—
|
|
—
|
|
|||||||||
|
Unamortized debt discount and premium, net
(e)
|
|
1,890
|
|
(15
|
)
|
(26
|
)
|
(11
|
)
|
(8
|
)
|
(29
|
)
|
(9
|
)
|
|||||||||
|
Unamortized debt issuance costs
|
(152
|
)
|
(38
|
)
|
(86
|
)
|
(31
|
)
|
(37
|
)
|
(6
|
)
|
(22
|
)
|
||||||||||
|
Total debt
|
4.29
|
%
|
$
|
42,382
|
|
$
|
8,353
|
|
$
|
15,503
|
|
$
|
6,170
|
|
$
|
4,907
|
|
$
|
2,251
|
|
$
|
3,840
|
|
|
|
Short-term notes payable and commercial paper
|
|
(2,514
|
)
|
—
|
|
—
|
|
—
|
|
—
|
|
—
|
|
—
|
|
|||||||||
|
Short-term money pool/intercompany borrowings
|
—
|
|
—
|
|
(835
|
)
|
—
|
|
(84
|
)
|
(491
|
)
|
(71
|
)
|
||||||||||
|
Current maturities of long-term debt
(f)
|
|
(2,807
|
)
|
(507
|
)
|
(1,507
|
)
|
(945
|
)
|
(562
|
)
|
(157
|
)
|
(5
|
)
|
|||||||||
|
Total long-term debt
(f)
|
|
$
|
37,061
|
|
$
|
7,846
|
|
$
|
13,161
|
|
$
|
5,225
|
|
$
|
4,261
|
|
$
|
1,603
|
|
$
|
3,764
|
|
||
|
(a)
|
Substantially all electric utility property is mortgaged under mortgage bond indentures.
|
|
(b)
|
Duke Energy includes
$129 million
and
$787 million
of capital lease purchase accounting adjustments related to Duke Energy Progress and Duke Energy Florida, respectively, related to power purchase agreements that are not accounted for as capital leases in their respective financial statements because of grandfathering provisions in GAAP.
|
|
(c)
|
Substantially all tax-exempt bonds are secured by first mortgage bonds or letters of credit.
|
|
(d)
|
Includes
$475 million
that was classified as Long-Term Debt on the Consolidated Balance Sheets due to the existence of long-term credit facilities that back-stop these commercial paper balances, along with Duke Energy’s ability and intent to refinance these balances on a long-term basis. The weighted average days to maturity for commercial paper was 27 days.
|
|
(e)
|
Duke Energy includes
$1,975 million
in purchase accounting adjustments related to the merger with Progress Energy.
|
|
(f)
|
Refer to Note 17 for additional information on amounts from consolidated VIEs.
|
Current Maturities of Long-Term Debt
The following table shows the significant components of Current maturities of long-term debt on the Consolidated Balance Sheets. The Duke Energy Registrants currently anticipate satisfying these obligations with cash on hand and proceeds from additional borrowings.
|
(in millions)
|
Maturity Date
|
Interest Rate
|
|
December 31, 2015
|
|
|||
|
Unsecured Debt
|
||||||||
|
Progress Energy (Parent)
|
January 2016
|
5.625
|
%
|
$
|
300
|
|
||
|
Duke Energy Indiana
|
June 2016
|
6.05
|
%
|
325
|
|
|||
|
Duke Energy (Parent)
|
November 2016
|
2.150
|
%
|
500
|
|
|||
|
First Mortgage Bonds
|
||||||||
|
Duke Energy Indiana
|
July 2016
|
0.670
|
%
|
150
|
|
|||
|
Duke Energy Carolinas
|
December 2016
|
1.750
|
%
|
350
|
|
|||
|
Other
|
449
|
|
||||||
|
Current maturities of long-term debt
|
$
|
2,074
|
|
|||||
157
PART II
DUKE ENERGY CORPORATION - DUKE ENERGY CAROLINAS, LLC - PROGRESS ENERGY, INC. –
DUKE ENERGY PROGRESS, LLC – DUKE ENERGY FLORIDA, LLC - DUKE ENERGY OHIO, INC. - DUKE ENERGY INDIANA, INC.
Combined Notes To Consolidated Financial Statements – (Continued)
Maturities and Call Options
The following table shows the annual maturities of long-term debt for the next five years and thereafter. Amounts presented exclude short-term notes payable and commercial paper and money pool borrowings for the Subsidiary Registrants.
|
|
December 31, 2015
|
||||||||||||||||||||||||||
|
Duke
|
|
Duke
|
|
Duke
|
|
Duke
|
|
Duke
|
|
||||||||||||||||||
|
Duke
|
|
Energy
|
|
Progress
|
|
Energy
|
|
Energy
|
|
Energy
|
|
Energy
|
|
||||||||||||||
|
(in millions)
|
Energy
(a)
|
|
Carolinas
|
|
Energy
|
|
Progress
|
|
Florida
|
|
Ohio
|
|
Indiana
|
|
|||||||||||||
|
2016
|
$
|
2,074
|
|
$
|
356
|
|
$
|
315
|
|
$
|
2
|
|
$
|
13
|
|
$
|
106
|
|
$
|
547
|
|
||||||
|
2017
|
2,468
|
|
115
|
|
923
|
|
446
|
|
482
|
|
1
|
|
2
|
|
|||||||||||||
|
2018
|
3,441
|
|
1,629
|
|
510
|
|
—
|
|
512
|
|
5
|
|
3
|
|
|||||||||||||
|
2019
|
3,022
|
|
5
|
|
1,667
|
|
855
|
|
14
|
|
552
|
|
63
|
|
|||||||||||||
|
2020
|
2,091
|
|
755
|
|
415
|
|
152
|
|
265
|
|
25
|
|
653
|
|
|||||||||||||
|
Thereafter
|
24,616
|
|
5,507
|
|
10,634
|
|
5,063
|
|
2,980
|
|
909
|
|
2,500
|
|
|||||||||||||
|
Total long-term debt, including current maturities
|
$
|
37,712
|
|
|
$
|
8,367
|
|
|
$
|
14,464
|
|
|
$
|
6,518
|
|
|
$
|
4,266
|
|
|
$
|
1,598
|
|
|
$
|
3,768
|
|
|
(a)
|
Excludes
$1,857 million
in purchase accounting adjustments related to the merger with Progress Energy.
|
The Duke Energy Registrants have the ability under certain debt facilities to call and repay the obligation prior to its scheduled maturity. Therefore, the actual timing of future cash repayments could be materially different than as presented above.
Short-Term Obligations Classified as Long-Term Debt
Tax-exempt bonds that may be put to the Duke Energy Registrants at the option of the holder and certain commercial paper issuances and money pool borrowings are classified as Long-Term Debt on the Consolidated Balance Sheets. These tax-exempt bonds, commercial paper issuances and money pool borrowings, which are short-term obligations by nature, are classified as long term due to Duke Energy’s intent and ability to utilize such borrowings as long-term financing. As Duke Energy’s Master Credit Facility and other bilateral letter of credit agreements have non-cancelable terms in excess of one year as of the balance sheet date, Duke Energy has the ability to refinance these short-term obligations on a long-term basis. The following tables show short-term obligations classified as long-term debt.
|
|
December 31, 2015
|
||||||||||||||||||
|
Duke
|
|
Duke
|
|
Duke
|
|
Duke
|
|
||||||||||||
|
Duke
|
|
Energy
|
|
Energy
|
|
Energy
|
|
Energy
|
|
||||||||||
|
(in millions)
|
Energy
|
|
Carolinas
|
|
Progress
|
|
Ohio
|
|
Indiana
|
|
|||||||||
|
Tax-exempt bonds
|
$
|
347
|
|
$
|
35
|
|
$
|
—
|
|
$
|
27
|
|
$
|
285
|
|
||||
|
Commercial paper
(a)
|
625
|
|
300
|
|
150
|
|
25
|
|
150
|
|
|||||||||
|
Total
|
$
|
972
|
|
|
$
|
335
|
|
$
|
150
|
|
|
$
|
52
|
|
|
$
|
435
|
|
|
|
|
December 31, 2014
|
||||||||||||||
|
Duke
|
|
Duke
|
|
Duke
|
|
||||||||||
|
Duke
|
|
Energy
|
|
Energy
|
|
Energy
|
|
||||||||
|
(in millions)
|
Energy
|
|
Carolinas
|
|
Ohio
|
|
Indiana
|
|
|||||||
|
Tax-exempt bonds
|
$
|
347
|
|
$
|
35
|
|
$
|
27
|
|
$
|
285
|
|
|||
|
Commercial paper
|
475
|
|
300
|
|
25
|
|
150
|
|
|||||||
|
Secured debt
(b)
|
200
|
|
—
|
|
—
|
|
—
|
|
|||||||
|
Total
|
$
|
1,022
|
|
|
$
|
335
|
|
|
$
|
52
|
|
|
$
|
435
|
|
|
(a)
|
Progress Energy amounts are equal to Duke Energy Progress amounts.
|
|
(b)
|
In December 2015, Duke Energy used cash held by the lender to repay debt. Instrument had a term of less than one year with the right to extend the maturity date for additional one-year periods with a final maturity date no later than December 2026.
|
Summary of Significant Debt Issuances
In January 2016, Duke Energy Kentucky issued
$95 million
of unsecured debentures, of which
$45 million
carry a fixed interest rate of
3.42 percent
and mature January 15, 2026 and
$50 million
carry a fixed interest rate of
4.45 percent
and mature January 15, 2046. Proceeds will primarily be used to refinance existing debt, including money pool borrowings, capital expenditures and for general corporate purposes.
158
PART II
DUKE ENERGY CORPORATION - DUKE ENERGY CAROLINAS, LLC - PROGRESS ENERGY, INC. –
DUKE ENERGY PROGRESS, LLC – DUKE ENERGY FLORIDA, LLC - DUKE ENERGY OHIO, INC. - DUKE ENERGY INDIANA, INC.
Combined Notes To Consolidated Financial Statements – (Continued)
The following tables summarize significant debt issuances (in millions).
|
Year Ended December 31, 2015
|
||||||||||||||||||||
|
Duke
|
|
Duke
|
|
Duke
|
|
|||||||||||||||
|
Maturity
|
Interest
|
|
Duke
|
|
Energy
|
|
Energy
|
|
Energy
|
|
||||||||||
|
Issuance Date
|
Date
|
Rate
|
|
Energy
|
|
(Parent)
|
|
Carolinas
|
|
Progress
|
|
|||||||||
|
Unsecured Debt
|
||||||||||||||||||||
|
November 2015
(a)(b)
|
April 2024
|
3.750
|
%
|
$
|
400
|
|
$
|
400
|
|
$
|
—
|
|
$
|
—
|
|
|||||
|
November 2015
(a)(b)
|
December 2045
|
4.800
|
%
|
600
|
|
600
|
|
—
|
|
—
|
|
|||||||||
|
First Mortgage Bonds
|
|
|
||||||||||||||||||
|
March 2015
(c)
|
June 2045
|
3.750
|
%
|
500
|
|
—
|
|
500
|
|
—
|
|
|||||||||
|
August 2015
(a)(d)
|
August 2025
|
3.250
|
%
|
500
|
|
—
|
|
—
|
|
500
|
|
|||||||||
|
August 2015
(a)(d)
|
August 2045
|
4.200
|
%
|
700
|
|
—
|
|
—
|
|
700
|
|
|||||||||
|
Total issuances
|
$
|
2,700
|
|
$
|
1,000
|
|
|
$
|
500
|
|
$
|
1,200
|
|
|||||||
|
(a)
|
Proceeds were used to repay short-term money pool and commercial paper borrowing issued to fund a portion of the NCEMPA acquisition, see Note 2 for further information.
|
|
(b)
|
Proceeds were used to refinance at maturity
$300 million
of unsecured notes at Progress Energy due January 2016.
|
|
(c)
|
Proceeds were used to redeem at maturity
$500 million
of first mortgage bonds due October 2015.
|
|
(d)
|
Proceeds were used to refinance at maturity
$400 million
of first mortgage bonds due December 2015.
|
|
Year Ended December 31, 2014
|
||||||||||||||||||||
|
Duke
|
|
Duke
|
|
Duke
|
|
|||||||||||||||
|
Maturity
|
Interest
|
|
Duke
|
|
Energy
|
|
Energy
|
|
Energy
|
|
||||||||||
|
Issuance Date
|
Date
|
Rate
|
|
Energy
|
|
(Parent)
|
|
Progress
|
|
Florida
|
|
|||||||||
|
Unsecured Debt
|
||||||||||||||||||||
|
April 2014
(a)
|
April 2024
|
3.750
|
%
|
$
|
600
|
|
$
|
600
|
|
$
|
—
|
|
$
|
—
|
|
|||||
|
April 2014
(a)(b)
|
April 2017
|
0.613
|
%
|
400
|
|
400
|
|
—
|
|
—
|
|
|||||||||
|
June 2014
(c)
|
May 2019
|
11.970
|
%
|
108
|
|
—
|
|
—
|
|
—
|
|
|||||||||
|
June 2014
(c)
|
May 2021
|
13.680
|
%
|
110
|
|
—
|
|
—
|
|
—
|
|
|||||||||
|
Secured Debt
|
||||||||||||||||||||
|
March 2014
(d)
|
March 2017
|
0.863
|
%
|
225
|
|
—
|
|
—
|
|
225
|
|
|||||||||
|
July 2014
(e)
|
July 2036
|
5.340
|
%
|
129
|
|
—
|
|
—
|
|
—
|
|
|||||||||
|
First Mortgage Bonds
|
||||||||||||||||||||
|
March 2014
(f)
|
March 2044
|
4.375
|
%
|
400
|
|
—
|
|
400
|
|
—
|
|
|||||||||
|
March 2014
(f)(g)
|
March 2017
|
0.435
|
%
|
250
|
|
—
|
|
250
|
|
—
|
|
|||||||||
|
November 2014
(h)
|
December 2044
|
4.150
|
%
|
500
|
|
—
|
|
500
|
|
—
|
|
|||||||||
|
November 2014
(g)(h)
|
November 2017
|
0.432
|
%
|
200
|
|
—
|
|
200
|
|
—
|
|
|||||||||
|
Total issuances
|
$
|
2,922
|
|
$
|
1,000
|
|
|
$
|
1,350
|
|
|
$
|
225
|
|
||||||
|
(a)
|
Proceeds were used to redeem
$402 million
of tax-exempt bonds at Duke Energy Ohio, the repayment of outstanding commercial paper and for general corporate purposes. See Note
13
for additional information related to the redemption of Duke Energy Ohio's tax-exempt bonds.
|
|
(b)
|
The debt is floating rate based on three-month London Interbank Offered Rate (LIBOR) plus a fixed credit spread of 38 basis points.
|
|
(c)
|
Proceeds were used to repay
$196 million
of debt for International Energy and for general corporate purposes. The interest rates include country specific risk premiums.
|
|
(d)
|
Relates to the securitization of accounts receivable at a subsidiary of Duke Energy Florida. Proceeds were used to repay short-term borrowings under the intercompany money pool borrowing arrangement and for general corporate purposes. See Note
17
for further details.
|
|
(e)
|
Proceeds were used to fund a portion of Duke Energy's prior investment in the existing Wind Star renewables portfolio.
|
|
(f)
|
Proceeds were used to repay short-term borrowings under the intercompany money pool borrowing arrangement and for general corporate purposes.
|
|
(g)
|
The debt is floating rate based on three-month LIBOR plus a fixed credit spread of 20 basis points.
|
|
(h)
|
Proceeds were used to redeem
$450 million
of tax-exempt bonds, repay short-term borrowings under the intercompany money pool borrowing arrangement and for general corporate purposes.
|
159
PART II
DUKE ENERGY CORPORATION - DUKE ENERGY CAROLINAS, LLC - PROGRESS ENERGY, INC. –
DUKE ENERGY PROGRESS, LLC – DUKE ENERGY FLORIDA, LLC - DUKE ENERGY OHIO, INC. - DUKE ENERGY INDIANA, INC.
Combined Notes To Consolidated Financial Statements – (Continued)
Available Credit Facilities
Duke Energy has a Master Credit Facility with a capacity of
$7.5 billion
through January 2020. The Duke Energy Registrants, excluding Progress Energy (Parent), have borrowing capacity under the Master Credit Facility up to specified sublimits for each borrower. Duke Energy has the unilateral ability at any time to increase or decrease the borrowing sublimits of each borrower, subject to a maximum sublimit for each borrower. The amount available under the Master Credit Facility has been reduced to backstop the issuances of commercial paper, certain letters of credit and variable-rate demand tax-exempt bonds that may be put to the Duke Energy Registrants at the option of the holder and as security to meet obligations under the Plea Agreements. The table below includes the current borrowing sublimits and available capacity under the Master Credit Facility.
|
|
December 31, 2015
|
||||||||||||||||||||||||||
|
Duke
|
|
Duke
|
|
Duke
|
|
Duke
|
|
Duke
|
|
Duke
|
|
||||||||||||||||
|
Duke
|
|
Energy
|
|
Energy
|
|
Energy
|
|
Energy
|
|
Energy
|
|
Energy
|
|
||||||||||||||
|
(in millions)
|
Energy
|
|
(Parent)
|
|
Carolinas
|
|
Progress
|
|
Florida
|
|
Ohio
|
|
Indiana
|
|
|||||||||||||
|
Facility size
(a)
|
$
|
7,500
|
|
$
|
3,475
|
|
$
|
800
|
|
$
|
1,000
|
|
$
|
1,200
|
|
$
|
425
|
|
$
|
600
|
|
||||||
|
Reduction to backstop issuances
|
|
||||||||||||||||||||||||||
|
Commercial paper
(b)
|
(3,138
|
)
|
(1,531
|
)
|
(300
|
)
|
(333
|
)
|
(709
|
)
|
(115
|
)
|
(150
|
)
|
|||||||||||||
|
Outstanding letters of credit
|
(72
|
)
|
(65
|
)
|
(4
|
)
|
(2
|
)
|
(1
|
)
|
—
|
|
—
|
|
|||||||||||||
|
Tax-exempt bonds
|
(116
|
)
|
—
|
|
(35
|
)
|
—
|
|
—
|
|
—
|
|
(81
|
)
|
|||||||||||||
|
Coal ash set-aside
(c)
|
(500
|
)
|
—
|
|
(250
|
)
|
(250
|
)
|
—
|
|
—
|
|
—
|
|
|||||||||||||
|
Available capacity
|
$
|
3,674
|
|
|
$
|
1,879
|
|
|
$
|
211
|
|
|
$
|
415
|
|
|
$
|
490
|
|
|
$
|
310
|
|
|
$
|
369
|
|
|
(a)
|
Represents the sublimit of each borrower.
|
|
(b)
|
Duke Energy issued
$625 million
of commercial paper and loaned the proceeds through the money pool to Duke Energy Carolinas, Duke Energy Progress, Duke Energy Ohio and Duke Energy Indiana. The balances are classified as Long-Term Debt Payable to Affiliated Companies in the Consolidated Balance Sheets.
|
|
(c)
|
On May 14, 2015, the United States District Court for the Eastern District of North Carolina approved the separate Plea Agreements entered into by Duke Energy Carolinas, Duke Energy Progress and DEBS, a wholly owned subsidiary of Duke Energy, in connection with the investigation initiated by the USDOJ. Duke Energy Carolinas and Duke Energy Progress are required to each maintain
$250 million
of available capacity under the Master Credit Facility as security to meet their obligations under the Plea Agreements, in addition to certain other conditions. See Note
5
for further details.
|
In connection with the Merger Agreement with Piedmont, Duke Energy entered into a
$4.9 billion
senior unsecured bridge financing facility (Bridge Facility) with Barclays Capital, Inc. (Barclays). The Bridge Facility, if drawn upon, may be used (i) to fund the cash consideration for the transaction and (ii) to pay certain fees and expenses in connection with the transaction. In November 2015, Barclays syndicated its commitment under the Bridge Facility to a broader group of lenders. Duke Energy intends to finance the transaction with proceeds raised through the issuance of debt, equity, and other sources and, therefore, does not expect to draw upon the Bridge Facility. See Note
2
for further details.
On February 22, 2016, Duke Energy entered into a
six months
term loan facility (Term Loan) with commitments totaling
$1 billion
to provide additional flexibility in managing short-term liquidity. The Term Loan can be drawn upon in a single borrowing of up to
$1 billion
, which must occur no later than
45
calendar days following February 22, 2016. As of February 24, 2016,
no
amounts have been drawn under the Term Loan. Amounts drawn under this facility, if any, will be due on August 19, 2016. The terms and conditions of this Term Loan are generally consistent with those governing the Master Credit Facility discussed above.
Other Debt Matters
Duke Energy Florida expects to issue
$1.3 billion
of securitization bonds related to Crystal River Unit 3 in the first half of 2016. See Note
4
for additional details.
In September 2013, Duke Energy filed a registration statement (Form S-3) with the Securities and Exchange Commission (SEC). Under this Form S-3, which is uncapped, the Duke Energy Registrants, excluding Progress Energy, may issue debt and other securities in the future at amounts, prices and with terms to be determined at the time of future offerings. The registration statement also allows for the issuance of common stock by Duke Energy.
Duke Energy has an effective Form S-3 with the SEC to sell up to
$3 billion
of variable denomination floating-rate demand notes, called PremierNotes. The Form S-3 states that no more than
$1.5 billion
of the notes will be outstanding at any particular time. The notes are offered on a continuous basis and bear interest at a floating rate per annum determined by the Duke Energy PremierNotes Committee, or its designee, on a weekly basis. The interest rate payable on notes held by an investor may vary based on the principal amount of the investment. The notes have no stated maturity date, are non-transferable and may be redeemed in whole or in part by Duke Energy or at the investor’s option at any time. The balance as of
December 31, 2015
and
2014
was
$1,121 million
and
$968 million
, respectively. The notes are short-term debt obligations of Duke Energy and are reflected as Notes payable and commercial paper on Duke Energy’s Consolidated Balance Sheets.
At
December 31, 2015
and
2014
,
$767 million
of debt issued by Duke Energy Carolinas was guaranteed by Duke Energy.
160
PART II
DUKE ENERGY CORPORATION - DUKE ENERGY CAROLINAS, LLC - PROGRESS ENERGY, INC. –
DUKE ENERGY PROGRESS, LLC – DUKE ENERGY FLORIDA, LLC - DUKE ENERGY OHIO, INC. - DUKE ENERGY INDIANA, INC.
Combined Notes To Consolidated Financial Statements – (Continued)
Money Pool
The Subsidiary Registrants, excluding Progress Energy, receive support for their short-term borrowing needs through participation with Duke Energy and certain of its subsidiaries in a money pool arrangement. Under this arrangement, those companies with short-term funds may provide short-term loans to affiliates participating in this arrangement. The money pool is structured such that the Subsidiary Registrants, excluding Progress Energy, separately manage their cash needs and working capital requirements. Accordingly, there is no net settlement of receivables and payables between money pool participants. Duke Energy (Parent), may loan funds to its participating subsidiaries, but may not borrow funds through the money pool. Accordingly, as the money pool activity is between Duke Energy and its wholly owned subsidiaries, all money pool balances are eliminated within Duke Energy’s Consolidated Balance Sheets.
Money pool receivable balances are reflected within Notes receivable from affiliated companies on the Subsidiary Registrants’ Consolidated Balance Sheets. Money pool payable balances are reflected within either Notes payable to affiliated companies or Long-Term Debt Payable to Affiliated Companies on the Subsidiary Registrants’ Consolidated Balance Sheets.
Restrictive Debt Covenants
The Duke Energy Registrants’ debt and credit agreements contain various financial and other covenants. The Master Credit Facility contains a covenant requiring the debt-to-total capitalization ratio not exceed
65 percent
for each borrower. Failure to meet those covenants beyond applicable grace periods could result in accelerated due dates and/or termination of the agreements. As of
December 31, 2015
, each of the Duke Energy Registrants were in compliance with all covenants related to their debt agreements. In addition, some credit agreements may allow for acceleration of payments or termination of the agreements due to nonpayment, or acceleration of other significant indebtedness of the borrower or some of its subsidiaries. None of the debt or credit agreements contain material adverse change clauses.
Other Loans
As of December 31, 2015 and 2014, Duke Energy had loans outstanding of
$629 million
, including
$41 million
at Duke Energy Progress and
$603 million
, including
$44 million
at Duke Energy Progress, respectively, against the cash surrender value of life insurance policies it owns on the lives of its executives. The amounts outstanding were carried as a reduction of the related cash surrender value that is included in Other within Investments and Other Assets on the Consolidated Balance Sheets.
7. GUARANTEES AND INDEMNIFICATIONS
Duke Energy and Progress Energy have various financial and performance guarantees and indemnifications, which are issued in the normal course of business. As discussed below, these contracts include performance guarantees, stand-by letters of credit, debt guarantees, surety bonds and indemnifications. Duke Energy and Progress Energy enter into these arrangements to facilitate commercial transactions with third parties by enhancing the value of the transaction to the third party. At
December 31, 2015
, Duke Energy and Progress Energy do not believe conditions are likely for significant performance under these guarantees. To the extent liabilities are incurred as a result of the activities covered by the guarantees, such liabilities are included on the accompanying Consolidated Balance Sheets.
On January 2, 2007, Duke Energy completed the spin-off of its natural gas businesses to shareholders. Guarantees issued by Duke Energy or its affiliates, or assigned to Duke Energy prior to the spin-off, remained with Duke Energy subsequent to the spin-off. Guarantees issued by Spectra Energy Capital, LLC, formerly known as Duke Capital LLC, (Spectra Capital) or its affiliates prior to the spin-off remained with Spectra Capital subsequent to the spin-off, except for guarantees that were later assigned to Duke Energy. Duke Energy has indemnified Spectra Capital against any losses incurred under certain of the guarantee obligations that remain with Spectra Capital. At
December 31, 2015
, the maximum potential amount of future payments associated with these guarantees was
$205 million
, the majority of which expires by 2028.
Duke Energy has issued performance guarantees to customers and other third parties that guarantee the payment and performance of other parties, including certain non-wholly owned entities, as well as guarantees of debt of certain non-consolidated entities and less than wholly owned consolidated entities. If such entities were to default on payments or performance, Duke Energy would be required under the guarantees to make payments on the obligations of the less than wholly owned entity. The maximum potential amount of future payments required under these guarantees as of
December 31, 2015
, was
$253 million
. Of this amount,
$15 million
relates to guarantees issued on behalf of less than wholly owned consolidated entities, with the remainder related to guarantees issued on behalf of third parties and unconsolidated affiliates of Duke Energy. Of the guarantees noted above,
$112 million
of the guarantees expire between 2016 and 2033, with the remaining performance guarantees having no contractual expiration.
Duke Energy has guaranteed certain issuers of surety bonds, obligating itself to make payment upon the failure of a wholly owned and former non-wholly owned entity to honor its obligations to a third party. Under these arrangements, Duke Energy has payment obligations that are triggered by a draw by the third party or customer due to the failure of the wholly owned or former non-wholly owned entity to perform according to the terms of its underlying contract. At
December 31, 2015
, Duke Energy had guaranteed
$47 million
of outstanding surety bonds, most of which have no set expiration.
Duke Energy uses bank-issued stand-by letters of credit to secure the performance of wholly owned and non-wholly owned entities to a third party or customer. Under these arrangements, Duke Energy has payment obligations to the issuing bank which are triggered by a draw by the third party or customer due to the failure of the wholly owned or non-wholly owned entity to perform according to the terms of its underlying contract. At
December 31, 2015
, Duke Energy had issued a total of
$427 million
in letters of credit, which expire between 2016 and 2020. The unused amount under these letters of credit was
$58 million
.
Duke Energy and Progress Energy have issued indemnifications for certain asset performance, legal, tax and environmental matters to third parties, including indemnifications made in connection with sales of businesses. At
December 31, 2015
, the estimated maximum exposure for these indemnifications was
$97 million
, the majority of which expires in 2017. Of this amount,
$7 million
has no contractual expiration. For certain matters for which Progress Energy receives timely notice, indemnity obligations may extend beyond the notice period. Certain indemnifications related to discontinued operations have no limitations as to time or maximum potential future payments.
161
PART II
DUKE ENERGY CORPORATION - DUKE ENERGY CAROLINAS, LLC - PROGRESS ENERGY, INC. –
DUKE ENERGY PROGRESS, LLC – DUKE ENERGY FLORIDA, LLC - DUKE ENERGY OHIO, INC. - DUKE ENERGY INDIANA, INC.
Combined Notes To Consolidated Financial Statements – (Continued)
The following table includes the liabilities recognized for the guarantees discussed above. These amounts are primarily recorded in Other within Deferred Credits and other Liabilities on the Consolidated Balance Sheets. As current estimates change, additional losses related to guarantees and indemnifications to third parties, which could be material, may be recorded by the Duke Energy Registrants in the future.
|
|
December 31,
|
||||||
|
|
2015
|
2014
|
|||||
|
Duke Energy
|
$
|
21
|
|
$
|
28
|
|
|
|
Progress Energy
|
7
|
|
13
|
|
|||
|
Duke Energy Florida
|
7
|
|
7
|
|
|||
8. JOINT OWNERSHIP OF GENERATING AND TRANSMISSION FACILITIES
The Duke Energy Registrants maintain ownership interests in certain jointly owned generating and transmission facilities. The Duke Energy Registrants are entitled to a share of the generating capacity and output of each unit equal to their respective ownership interests, except as otherwise noted below. The Duke Energy Registrants pay their ownership share of additional construction costs, fuel inventory purchases and operating expenses, except in certain instances where agreements have been executed to limit certain joint owners’ maximum exposure to the additional costs. The Duke Energy Registrants share of revenues and operating costs of the jointly owned facilities is included within the corresponding line in the Consolidated Statements of Operations. Each participant in the jointly owned facilities must provide its own financing, except in certain instances where agreements have been executed to limit certain joint owners’ maximum exposure to the additional costs.
The following table presents the Duke Energy Registrants' interest of jointly owned plant or facilities and amounts included on the Consolidated Balance Sheets. All facilities are operated by the Duke Energy Registrants and are included in the Regulated Utilities segment unless otherwise noted.
|
|
December 31, 2015
|
|||||||||||||
|
Construction
|
|
|||||||||||||
|
Ownership
|
|
Property, Plant
|
|
Accumulated
|
|
Work in
|
|
|||||||
|
Interest
|
|
and Equipment
|
|
Depreciation
|
|
Progress
|
|
|||||||
|
Duke Energy Carolinas
|
|
|
|
|
|
|||||||||
|
Catawba Nuclear Station (units 1 and 2)
(a)
|
19.25
|
%
|
$
|
926
|
|
$
|
567
|
|
$
|
9
|
|
|||
|
Duke Energy Florida
|
|
|
|
|
|
|
||||||||
|
Intercession City Plant (unit 11)
|
(b)
|
|
24
|
|
15
|
|
—
|
|
||||||
|
Duke Energy Ohio
|
|
|
|
|
|
|
||||||||
|
Transmission facilities
(c)
|
Various
|
|
85
|
|
50
|
|
1
|
|
||||||
|
Duke Energy Indiana
|
|
|
|
|
|
|
|
|
||||||
|
Gibson Station (unit 5)
(d)
|
50.05
|
%
|
329
|
|
151
|
|
5
|
|
||||||
|
Vermillion
(e)
|
62.5
|
%
|
153
|
|
108
|
|
—
|
|
||||||
|
Transmission and local facilities
(d)
|
Various
|
|
4,094
|
|
1,688
|
|
—
|
|
||||||
|
International Energy
|
|
|
|
|
|
|
|
|
||||||
|
Brazil – Canoas I and II
(f)
|
47.2
|
%
|
160
|
|
57
|
|
—
|
|
||||||
|
(a)
|
Jointly owned with North Carolina Municipal Power Agency Number One, NCEMC and Piedmont Municipal Power Agency.
|
|
(b)
|
Jointly owned with Georgia Power Company (GPC). GPC has exclusive rights to the output of the unit during the months of June through September and pays all fuel and water costs during this period. Duke Energy Florida pays all fuel and water costs during the remaining months. Other costs are allocated
66.67 percent
to Duke Energy Florida and the remainder to GPC.
|
|
(c)
|
Jointly owned with America Electric Power Generation Resources and The Dayton Power and Light Company.
|
|
(d)
|
Jointly owned with Wabash Valley Power Association, Inc. (WVPA) and Indiana Municipal Power Agency.
|
|
(e)
|
Jointly owned with WVPA.
|
|
(f)
|
Jointly owned with Companhia Brasileira de Aluminio and included in the International segment.
|
On July 31, 2015, Duke Energy Progress completed the purchase of NCEMPA's ownership interests in jointly owned facilities. See Note 2 for additional information.
Duke Energy Florida owns
98.3 percent
interest in the retired Crystal River Unit 3 nuclear plant and is in the process of obtaining the remaining
1.7 percent
interest from Seminole Electric Cooperative. On October 30, 2015, Duke Energy Florida completed the purchase of
6.52 percent
ownership interest in Crystal River Unit 3 from the Florida Municipal Joint Owners (FMJO) and settled other disputes for
$55 million
. All costs associated with Crystal River Unit 3 are included within Regulatory assets on the Consolidated Balance Sheets of Duke Energy, Progress Energy and Duke Energy Florida. See Note 4 for additional information.
162
PART II
DUKE ENERGY CORPORATION - DUKE ENERGY CAROLINAS, LLC - PROGRESS ENERGY, INC. –
DUKE ENERGY PROGRESS, LLC – DUKE ENERGY FLORIDA, LLC - DUKE ENERGY OHIO, INC. - DUKE ENERGY INDIANA, INC.
Combined Notes To Consolidated Financial Statements – (Continued)
9. ASSET RETIREMENT OBLIGATIONS
Duke Energy records an asset retirement obligation (ARO) when it has a legal obligation to incur retirement costs associated with the retirement of a long-lived asset and the obligation can be reasonably estimated. Certain assets of the Duke Energy Registrants’ have an indeterminate life, such as transmission and distribution facilities, and thus the fair value of the retirement obligation is not reasonably estimable. A liability for these asset retirement obligations will be recorded when a fair value is determinable.
The Duke Energy Registrants’ regulated operations accrue costs of removal for property that does not have an associated legal retirement obligation based on regulatory orders from state commissions. These costs of removal are recorded as a regulatory liability in accordance with regulatory accounting treatment. The Duke Energy Registrants do not accrue the estimated cost of removal for any nonregulated assets. See Note
4
for the estimated cost of removal for assets without an associated legal retirement obligation, which are included in Regulatory liabilities on the Consolidated Balance Sheets.
The following table presents the AROs recorded on the Consolidated Balance Sheets.
|
December 31, 2015
|
|||||||||||||||||||||||||||
|
Duke
|
|
Duke
|
|
Duke
|
|
Duke
|
|
Duke
|
|
||||||||||||||||||
|
Duke
|
|
Energy
|
|
Progress
|
|
Energy
|
|
Energy
|
|
Energy
|
|
Energy
|
|
||||||||||||||
|
(in millions)
|
Energy
|
|
Carolinas
|
|
Energy
|
|
Progress
|
|
Florida
|
|
Ohio
|
|
Indiana
|
|
|||||||||||||
|
Decommissioning of Nuclear Power Facilities
|
$
|
5,072
|
|
$
|
1,730
|
|
$
|
3,093
|
|
$
|
2,349
|
|
$
|
744
|
|
$
|
—
|
|
$
|
—
|
|
||||||
|
Closure of Ash Impoundments
|
4,958
|
|
2,161
|
|
2,196
|
|
2,188
|
|
7
|
|
94
|
|
507
|
|
|||||||||||||
|
Other
(a)
|
234
|
|
27
|
|
80
|
|
30
|
|
51
|
|
31
|
|
18
|
|
|||||||||||||
|
Total Asset retirement obligation
|
$
|
10,264
|
|
$
|
3,918
|
|
$
|
5,369
|
|
$
|
4,567
|
|
$
|
802
|
|
$
|
125
|
|
$
|
525
|
|
||||||
|
(a)
|
Includes obligations related to asbestos removal and the closure of certain landfills at fossil generation facilities. Duke Energy Ohio also includes AROs related to the retirement of natural gas mains. Duke Energy also includes AROs related to the removal of renewable energy generation assets.
|
North Carolina and South Carolina Ash Impoundments
On September 20, 2014, the Coal Ash Act became law and was amended on June 24, 2015, by the Mountain Energy Act. The Coal Ash Act, as amended, (i) establishes a Coal Ash Management Commission (Coal Ash Commission) to oversee handling of coal ash within the state; (ii) prohibits construction of new and expansion of existing ash impoundments and use of existing impoundments at retired facilities; (iii) requires closure of ash impoundments at Duke Energy Progress' Asheville and Sutton plants and Duke Energy Carolinas' Riverbend and Dan River stations no later than August 1, 2019 (the Mountain Energy Act provides for the potential extension of closure of the Asheville impoundment until 2022); (iv) requires dry disposal of fly ash at active plants, excluding the Asheville Plant, not retired by December 31, 2018; (v) requires dry disposal of bottom ash at active plants, excluding the Asheville Plant, by December 31, 2019, or retirement of active plants; (vi) requires all remaining ash impoundments in North Carolina to be categorized as high-risk, intermediate-risk or low-risk no later than December 31, 2015, by the NCDEQ with the method of closure and timing to be based upon the assigned risk, with closure no later than December 31, 2029; (vii) establishes requirements to deal with groundwater and surface water impacts from impoundments; and (viii) increases the level of regulation for structural fills utilizing coal ash.
In January 2016, NCDEQ published its draft risk classifications. These risk rankings were generally determined based on three primary criteria: structural integrity of the impoundments and impact to both surface and groundwaters. NCDEQ categorized 12 basins at four sites as intermediate risk and four basins at three plants as low risk. NCDEQ also categorized nine basins at six plants as “low-to-intermediate” risk, thereby not assigning a proposed risk ranking at this time. The risk rankings of these sites will be based upon receipt of additional data primarily related to groundwater quality and the completion of specific modifications and repairs to the impoundments. NCDEQ is expected to finalize its risk classifications as part of a public comment process. Duke Energy cannot predict the final classification.
The Coal Ash Act includes a variance procedure for compliance deadlines and modification of requirements regarding structural fills and compliance boundaries. Provisions of the Coal Ash Act prohibit cost recovery in customer rates for unlawful discharge of ash impoundment waters occurring after January 1, 2014. The Coal Ash Act leaves the decision on cost recovery determinations related to closure of ash impoundments to the normal ratemaking processes before utility regulatory commissions. Duke Energy has and will periodically submit to NCDEQ site-specific coal ash impoundment closure plans or excavation plans in advance of closure. These plans and all associated permits must be approved by NCDEQ before any excavation or closure work can begin.
In September 2014, Duke Energy Carolinas executed a consent agreement with the South Carolina Department of Health and Environmental Control (SCDHEC) requiring the excavation of an inactive ash basin and ash fill area at the W.S. Lee Steam Station. As part of this agreement, in December 2014, Duke Energy Carolinas filed an ash removal plan and schedule with SCDHEC. In April 2015, the federal Coal Combustion Residuals (CCR) rules were published and Duke Energy Carolinas subsequently executed an agreement with the conservation groups Upstate Forever and Save Our Saluda that requires Duke Energy Carolinas to remediate all active and inactive ash storage areas at the W.S. Lee Steam Station. Coal-fired generation at W.S. Lee ceased in 2014 and unit 3 was converted to natural gas in March 2015. In July 2015, Duke Energy Progress executed a consent agreement with the SCDHEC requiring the excavation of an inactive ash fill area at the Robinson Plant within eight years. Coal ash impoundments at the Robinson Plant and W.S. Lee Station sites are required to be closed pursuant to the recently issued CCR rule and the provisions of these consent agreements are consistent with the federal CCR closure requirements.
163
PART II
DUKE ENERGY CORPORATION - DUKE ENERGY CAROLINAS, LLC - PROGRESS ENERGY, INC. –
DUKE ENERGY PROGRESS, LLC – DUKE ENERGY FLORIDA, LLC - DUKE ENERGY OHIO, INC. - DUKE ENERGY INDIANA, INC.
Combined Notes To Consolidated Financial Statements – (Continued)
Coal Combustion Residuals
On April 17, 2015, the EPA published in the Federal Register a rule to regulate the disposal of CCR from electric utilities as solid waste. The federal regulation, which became effective in October 2015, classifies CCR as nonhazardous waste under Subtitle D of the Resource Conservation and Recovery Act and allows for beneficial use of CCR with some restrictions. The regulation applies to all new and existing landfills, new and existing surface impoundments receiving CCR and existing surface impoundments that are no longer receiving CCR but contain liquid located at stations currently generating electricity (regardless of fuel source). The rule establishes requirements regarding landfill design, structural integrity design and assessment criteria for surface impoundments, groundwater monitoring and protection procedures and other operational and reporting procedures to ensure the safe disposal and management of CCR. In addition to the requirements of the federal CCR regulation, CCR landfills and surface impoundments will continue to be independently regulated by most states. As a result of the EPA rule, Duke Energy Carolinas, Progress Energy, Duke Energy Progress, Duke Energy Ohio and Duke Energy Indiana recorded additional asset retirement obligation amounts during 2015.
Coal Ash Liability
The ARO amount recorded on the Consolidated Balance Sheets is based upon estimated closure costs for impacted ash impoundments. The amount recorded represents the discounted cash flows for estimated closure costs based upon either specific closure plans or the probability weightings of the potential closure methods as evaluated on a site-by-site basis. Actual costs to be incurred will be dependent upon factors that vary from site to site. The most significant factors are the method and time frame of closure at the individual sites. Closure methods considered include removing the water from the basins, consolidating material as necessary, and capping the ash with a synthetic barrier, excavating and relocating the ash to a lined structural fill or lined landfill, or recycling the ash for concrete or some other beneficial use. The ultimate method and timetable for closure will be in compliance with standards set by federal and state regulations. The ARO amount will be adjusted as additional information is gained through the closure process, including acceptance and approval of compliance approaches which may change management assumptions, and may result in a material change to the balance.
Asset retirement costs associated with the asset retirement obligations for operating plants and retired plants are included in Net property, plant and equipment, and Regulatory assets, respectively, on the Consolidated Balance Sheets. See Note 4 for additional information on Regulatory assets related to AROs.
Cost recovery for future expenditures will be pursued through the normal ratemaking process with federal and state utility commissions, which permit recovery of necessary and prudently incurred costs associated with Duke Energy’s regulated operations.
Nuclear Decommissioning Liability
Asset retirement obligations related to nuclear decommissioning are based on site-specific cost studies. The NCUC, PSCSC, and FPSC require updated cost estimates for decommissioning nuclear plants every five years.
The following table summarizes information about the most recent site-specific nuclear decommissioning cost studies. Decommissioning costs in the table below are presented in dollars of the year of the cost study and include costs to decommission plant components not subject to radioactive contamination.
|
Annual Funding
|
|
Decommissioning
|
|
||||||
|
(in millions)
|
Requirement
(a)
|
|
Costs
(a)(b)
|
|
Year of Cost Study
|
||||
|
Duke Energy
|
$
|
14
|
|
$
|
8,130
|
|
2013 and 2014
|
||
|
Duke Energy Carolinas
|
—
|
|
3,420
|
|
2013
|
||||
|
Duke Energy Progress
|
14
|
|
3,550
|
|
2014
|
||||
|
Duke Energy Florida
|
—
|
|
1,160
|
|
2013
|
||||
|
(a)
|
Amounts for Progress Energy equal the sum of Duke Energy Progress and Duke Energy Florida.
|
|
(b)
|
Amounts include the Subsidiary Registrant's ownership interest in jointly owned reactors. Other joint owners are responsible for decommissioning costs related to their interest in the reactors.
|
Duke Energy Progress’ site-specific nuclear decommissioning cost studies were filed with the NCUC and PSCSC in 2015. New funding studies were completed and filed with the NCUC and PSCSC in 2015 as well. Accordingly, in January 2016 Duke Energy Progress received approval from the PSCSC to reduce the annual funding requirement. The NCUC will decide on the appropriate funding level in 2016. Duke Energy Progress will complete and file new funding studies with the FERC in 2016.
Nuclear Decommissioning Trust Funds (NDTF)
Duke Energy Carolinas, Duke Energy Progress and Duke Energy Florida each maintain Nuclear Decommissioning Trust Funds (NDTF) that are intended to pay for the decommissioning costs of the respective nuclear power plants. The NDTF investments are managed and invested in accordance with applicable requirements of various regulatory bodies including the NRC, FERC, NCUC, PSCSC, FPSC and the Internal Revenue Service. Use of the NTDF investments is restricted to nuclear decommissioning activities including license termination, spent fuel and site restoration. The license termination and spent fuel obligations relate to contaminated decommissioning and are recorded as ARO’s. The site restoration obligation relates to non-contaminated decommissioning and is recorded to cost of removal within Regulatory liabilities on the Consolidated Balance Sheets.
164
PART II
DUKE ENERGY CORPORATION - DUKE ENERGY CAROLINAS, LLC - PROGRESS ENERGY, INC. –
DUKE ENERGY PROGRESS, LLC – DUKE ENERGY FLORIDA, LLC - DUKE ENERGY OHIO, INC. - DUKE ENERGY INDIANA, INC.
Combined Notes To Consolidated Financial Statements – (Continued)
The following table presents the fair value of NDTF assets legally restricted for purposes of settling asset retirement obligations associated with nuclear decommissioning.
|
December 31,
|
|||||||
|
(in millions)
|
2015
|
2014
|
|||||
|
Duke Energy
|
$
|
4,670
|
|
$
|
5,182
|
|
|
|
Duke Energy Carolinas
|
2,686
|
|
2,678
|
|
|||
|
Duke Energy Progress
(a)
|
1,984
|
|
1,701
|
|
|||
|
Duke Energy Florida
(a)(b)
|
—
|
|
803
|
|
|||
(a) Amounts for Progress Energy equal the sum of Duke Energy Progress and Duke Energy Florida.
|
(b)
|
Duke Energy Florida is actively decommissioning Crystal River Unit 3 and was granted an exemption from the NRC which allows for unrestricted use of the NDTF. Therefore, the entire balance of Duke Energy Florida’s NDTF may be applied towards license termination, spent fuel and site restoration costs incurred to decommission Crystal River Unit 3.
|
Nuclear Operating Licenses
Operating licenses for nuclear units are potentially subject to extension. The following table includes the current expiration of nuclear operating licenses. Duke Energy Florida has requested the NRC terminate the operating license for Crystal River Unit 3 as it permanently ceased operation in February 2013. Refer to Note
4
for further information on decommissioning activity and transition to SAFSTOR.
|
Unit
|
Year of Expiration
|
|
Duke Energy Carolinas
|
|
|
Catawba Units 1 and 2
|
2043
|
|
McGuire Unit 1
|
2041
|
|
McGuire Unit 2
|
2043
|
|
Oconee Units 1 and 2
|
2033
|
|
Oconee Unit 3
|
2034
|
|
Duke Energy Progress
|
|
|
Brunswick Unit 1
|
2036
|
|
Brunswick Unit 2
|
2034
|
|
Harris
|
2046
|
|
Robinson
|
2030
|
165
PART II
DUKE ENERGY CORPORATION - DUKE ENERGY CAROLINAS, LLC - PROGRESS ENERGY, INC. –
DUKE ENERGY PROGRESS, LLC – DUKE ENERGY FLORIDA, LLC - DUKE ENERGY OHIO, INC. - DUKE ENERGY INDIANA, INC.
Combined Notes To Consolidated Financial Statements – (Continued)
ARO Liability Rollforward
The following table presents changes in the liability associated with AROs.
|
Duke
|
|
Duke
|
|
Duke
|
|
Duke
|
|
Duke
|
|
||||||||||||||||||
|
Duke
|
|
Energy
|
|
Progress
|
|
Energy
|
|
Energy
|
|
Energy
|
|
Energy
|
|
||||||||||||||
|
(in millions)
|
Energy
|
|
Carolinas
|
|
Energy
|
|
Progress
|
|
Florida
|
|
Ohio
|
|
Indiana
|
|
|||||||||||||
|
Balance at December 31, 2013
|
4,958
|
|
1,594
|
|
2,570
|
|
1,737
|
|
833
|
|
28
|
|
30
|
|
|||||||||||||
|
Acquisitions
|
4
|
|
—
|
|
—
|
|
—
|
|
—
|
|
—
|
|
—
|
|
|||||||||||||
|
Accretion expense
(a)
|
246
|
|
113
|
|
135
|
|
97
|
|
38
|
|
2
|
|
2
|
|
|||||||||||||
|
Liabilities settled
(b)
|
(68
|
)
|
—
|
|
(68
|
)
|
—
|
|
(68
|
)
|
—
|
|
—
|
|
|||||||||||||
|
Liabilities incurred in the current year
(c)
|
3,500
|
|
1,717
|
|
1,783
|
|
1,783
|
|
—
|
|
—
|
|
—
|
|
|||||||||||||
|
Revisions in estimates of cash flows
(d)
|
(174
|
)
|
4
|
|
291
|
|
288
|
|
3
|
|
(3
|
)
|
—
|
|
|||||||||||||
|
Balance at December 31, 2014
|
8,466
|
|
3,428
|
|
4,711
|
|
3,905
|
|
806
|
|
27
|
|
32
|
|
|||||||||||||
|
Acquisitions
(e)
|
226
|
|
—
|
|
226
|
|
204
|
|
23
|
|
—
|
|
—
|
|
|||||||||||||
|
Accretion expense
(a)
|
384
|
|
165
|
|
203
|
|
169
|
|
34
|
|
4
|
|
15
|
|
|||||||||||||
|
Liabilities settled
(b)
|
(422
|
)
|
(200
|
)
|
(195
|
)
|
(125
|
)
|
(70
|
)
|
(4
|
)
|
(23
|
)
|
|||||||||||||
|
Liabilities incurred in the current year
(c)
|
1,016
|
|
178
|
|
282
|
|
282
|
|
—
|
|
116
|
|
418
|
|
|||||||||||||
|
Revisions in estimates of cash flows
(f)
|
594
|
|
347
|
|
142
|
|
132
|
|
9
|
|
(18
|
)
|
83
|
|
|||||||||||||
|
Balance at December 31, 2015
|
$
|
10,264
|
|
|
$
|
3,918
|
|
|
$
|
5,369
|
|
|
$
|
4,567
|
|
|
$
|
802
|
|
|
$
|
125
|
|
|
$
|
525
|
|
|
(a)
|
Substantially all accretion expense for the years ended December 31, 2015 and 2014 relates to Duke Energy’s regulated electric operations and has been deferred in accordance with regulatory accounting treatment.
|
|
(b)
|
For 2014, amounts relate to nuclear decommissioning of Crystal River Unit 3. For 2015, amounts primarily relate to ash impoundment closures and nuclear decommissioning of Crystal River Unit 3.
|
|
(c)
|
For 2014, amounts primarily relate to AROs recorded as a result of the Coal Ash Act and an agreement with the SCDHEC related to the W.S. Lee Steam Station. For 2015, amounts primarily relate to AROs recorded as a result of the EPA's rule for disposal of CCR.
|
|
(d)
|
Amounts for Progress Energy and Duke Energy Progress primarily relate to Duke Energy Progress' site-specific nuclear decommissioning cost studies. The Duke Energy amount also includes the impact of Duke Energy Progress' site-specific nuclear decommissioning cost studies on purchase accounting amounts.
|
|
(e)
|
Duke Energy Progress amount relates to the NCEMPA acquisition. See footnote
2
for additional information.
|
|
(f)
|
Primarily relates to the closure of ash impoundments.
|
166
PART II
DUKE ENERGY CORPORATION - DUKE ENERGY CAROLINAS, LLC - PROGRESS ENERGY, INC. –
DUKE ENERGY PROGRESS, LLC – DUKE ENERGY FLORIDA, LLC - DUKE ENERGY OHIO, INC. - DUKE ENERGY INDIANA, INC.
Combined Notes To Consolidated Financial Statements – (Continued)
10. PROPERTY, PLANT AND EQUIPMENT
The following tables summarize the property, plant and equipment for Duke Energy and its subsidiary registrants.
|
December 31, 2015
|
|||||||||||||||||||||||||||||
|
Estimated
|
|||||||||||||||||||||||||||||
|
Useful
|
Duke
|
|
Duke
|
|
Duke
|
|
Duke
|
|
Duke
|
|
|||||||||||||||||||
|
Life
|
Duke
|
|
Energy
|
|
Progress
|
|
Energy
|
|
Energy
|
|
Energy
|
|
Energy
|
|
|||||||||||||||
|
(in millions)
|
(Years)
|
Energy
|
|
Carolinas
|
|
Energy
|
|
Progress
|
|
Florida
|
|
Ohio
|
|
Indiana
|
|
||||||||||||||
|
Land
|
$
|
1,466
|
|
$
|
407
|
|
$
|
719
|
|
$
|
392
|
|
$
|
327
|
|
$
|
118
|
|
$
|
108
|
|
||||||||
|
Plant – Regulated
|
|
|
|
|
|
|
|
|
|
|
|
|
|
|
|||||||||||||||
|
Electric generation, distribution and transmission
|
8 - 100
|
87,593
|
|
33,623
|
|
36,422
|
|
22,888
|
|
13,534
|
|
4,429
|
|
13,118
|
|
||||||||||||||
|
Natural gas transmission and distribution
|
12 - 67
|
2,322
|
|
—
|
|
—
|
|
—
|
|
—
|
|
2,322
|
|
—
|
|
||||||||||||||
|
Other buildings and improvements
|
15 - 100
|
1,480
|
|
477
|
|
621
|
|
294
|
|
322
|
|
204
|
|
179
|
|
||||||||||||||
|
Plant – Nonregulated
|
|
|
|
|
|
|
|
|
|
|
|
|
|
|
|
||||||||||||||
|
Electric generation, distribution and transmission
|
1 - 30
|
3,348
|
|
—
|
|
—
|
|
—
|
|
—
|
|
—
|
|
—
|
|
||||||||||||||
|
Other buildings and improvements
|
5 - 50
|
2,363
|
|
—
|
|
—
|
|
—
|
|
—
|
|
—
|
|
—
|
|
||||||||||||||
|
Nuclear fuel
|
|
3,194
|
|
1,827
|
|
1,367
|
|
1,367
|
|
—
|
|
—
|
|
—
|
|
||||||||||||||
|
Equipment
|
3 - 38
|
1,791
|
|
368
|
|
530
|
|
398
|
|
132
|
|
344
|
|
173
|
|
||||||||||||||
|
Construction in process
|
|
4,525
|
|
1,860
|
|
1,827
|
|
1,118
|
|
709
|
|
180
|
|
214
|
|
||||||||||||||
|
Other
|
2 - 60
|
4,744
|
|
836
|
|
1,180
|
|
856
|
|
319
|
|
153
|
|
215
|
|
||||||||||||||
|
Total property, plant and equipment
(a)(d)
|
112,826
|
|
39,398
|
|
42,666
|
|
27,313
|
|
15,343
|
|
7,750
|
|
14,007
|
|
|||||||||||||||
|
Total accumulated depreciation – regulated
(b)(c)(d)
|
(35,367
|
)
|
(13,521
|
)
|
(14,867
|
)
|
(10,141
|
)
|
(4,720
|
)
|
(2,507
|
)
|
(4,484
|
)
|
|||||||||||||||
|
Total accumulated depreciation – nonregulated
(c)(d)
|
(2,298
|
)
|
—
|
|
—
|
|
—
|
|
—
|
|
—
|
|
—
|
|
|||||||||||||||
|
Generation facilities to be retired, net
|
548
|
|
—
|
|
548
|
|
548
|
|
—
|
|
—
|
|
—
|
|
|||||||||||||||
|
Total net property, plant and equipment
|
$
|
75,709
|
|
|
$
|
25,877
|
|
|
$
|
28,347
|
|
|
$
|
17,720
|
|
|
$
|
10,623
|
|
|
$
|
5,243
|
|
$
|
9,523
|
|
|||
|
(a)
|
Includes capitalized leases of
$1,470 million
,
$40 million
,
$302 million
,
$144 million
,
$158 million
,
$96 million
, and
$39 million
at Duke Energy, Duke Energy Carolinas, Progress Energy, Duke Energy Progress, Duke Energy Florida, Duke Energy Ohio, and Duke Energy Indiana, respectively, primarily within Plant - Regulated. The Progress Energy, Duke Energy Progress and Duke Energy Florida amounts are net of
$85 million
,
$7 million
and
$78 million
, respectively, of accumulated amortization of capitalized leases.
|
|
(b)
|
Includes
$1,621 million
,
$976 million
,
$645 million
and
$645 million
of accumulated amortization of nuclear fuel at Duke Energy, Duke Energy Carolinas, Progress Energy and Duke Energy Progress, respectively.
|
|
(c)
|
Includes accumulated amortization of capitalized leases of
$58 million
,
$11 million
,
$27 million
and
$7 million
at Duke Energy, Duke Energy Carolinas, Duke Energy Ohio and Duke Energy Indiana, respectively.
|
|
(d)
|
Includes gross property, plant and equipment cost of consolidated VIEs of
$2,033 million
and accumulated depreciation of consolidated VIEs of
$327 million
at Duke Energy.
|
167
PART II
DUKE ENERGY CORPORATION - DUKE ENERGY CAROLINAS, LLC - PROGRESS ENERGY, INC. –
DUKE ENERGY PROGRESS, LLC – DUKE ENERGY FLORIDA, LLC - DUKE ENERGY OHIO, INC. - DUKE ENERGY INDIANA, INC.
Combined Notes To Consolidated Financial Statements – (Continued)
|
December 31, 2014
|
|||||||||||||||||||||||||||||
|
Estimated
|
|||||||||||||||||||||||||||||
|
Useful
|
Duke
|
|
Duke
|
|
Duke
|
|
Duke
|
|
Duke
|
|
|||||||||||||||||||
|
Life
|
Duke
|
|
Energy
|
|
Progress
|
|
Energy
|
|
Energy
|
|
Energy
|
|
Energy
|
|
|||||||||||||||
|
(in millions)
|
(Years)
|
Energy
|
|
Carolinas
|
|
Energy
|
|
Progress
|
|
Florida
|
|
Ohio
|
|
Indiana
|
|
||||||||||||||
|
Land
|
$
|
1,459
|
|
$
|
403
|
|
$
|
704
|
|
$
|
380
|
|
$
|
324
|
|
$
|
114
|
|
$
|
108
|
|
||||||||
|
Plant – Regulated
|
|
|
|
|
|
|
|
|
|
|
|
|
|
|
|||||||||||||||
|
Electric generation, distribution and transmission
|
2 - 138
|
82,206
|
|
31,751
|
|
33,672
|
|
20,616
|
|
13,056
|
|
3,956
|
|
11,911
|
|
||||||||||||||
|
Natural gas transmission and distribution
|
12 - 67
|
2,230
|
|
—
|
|
—
|
|
—
|
|
—
|
|
2,230
|
|
—
|
|
||||||||||||||
|
Other buildings and improvements
|
9 - 100
|
1,445
|
|
465
|
|
607
|
|
286
|
|
318
|
|
200
|
|
173
|
|
||||||||||||||
|
Plant – Nonregulated
|
|
|
|
|
|
|
|
|
|
|
|
|
|
|
|
||||||||||||||
|
Electric generation, distribution and transmission
|
1- 30
|
2,380
|
|
—
|
|
—
|
|
—
|
|
—
|
|
—
|
|
—
|
|
||||||||||||||
|
Other buildings and improvements
|
5 - 50
|
2,498
|
|
—
|
|
—
|
|
—
|
|
—
|
|
—
|
|
—
|
|
||||||||||||||
|
Nuclear fuel
|
|
2,865
|
|
1,676
|
|
1,190
|
|
1,190
|
|
—
|
|
—
|
|
—
|
|
||||||||||||||
|
Equipment
|
3 - 34
|
1,762
|
|
341
|
|
506
|
|
388
|
|
118
|
|
330
|
|
166
|
|
||||||||||||||
|
Construction in process
|
|
4,519
|
|
2,081
|
|
1,215
|
|
908
|
|
307
|
|
97
|
|
481
|
|
||||||||||||||
|
Other
|
5 - 80
|
3,497
|
|
655
|
|
756
|
|
439
|
|
310
|
|
214
|
|
195
|
|
||||||||||||||
|
Total property, plant and equipment
(a)(d)
|
104,861
|
|
37,372
|
|
38,650
|
|
24,207
|
|
14,433
|
|
7,141
|
|
13,034
|
|
|||||||||||||||
|
Total accumulated depreciation – regulated
(b)(c)(d)
|
(32,628
|
)
|
(12,700
|
)
|
(13,506
|
)
|
(9,021
|
)
|
(4,478
|
)
|
(2,213
|
)
|
(4,219
|
)
|
|||||||||||||||
|
Total accumulated depreciation – nonregulated
(c)(d)
|
(2,196
|
)
|
—
|
|
—
|
|
—
|
|
—
|
|
—
|
|
—
|
|
|||||||||||||||
|
Generation facilities to be retired, net
|
9
|
|
—
|
|
—
|
|
—
|
|
—
|
|
9
|
|
—
|
|
|||||||||||||||
|
Total net property, plant and equipment
|
$
|
70,046
|
|
$
|
24,672
|
|
$
|
25,144
|
|
$
|
15,186
|
|
$
|
9,955
|
|
$
|
4,937
|
|
$
|
8,815
|
|
||||||||
|
(a)
|
Includes capitalized leases of
$1,548 million
,
$40 million
,
$315 million
,
$146 million
,
$169 million
,
$98 million
, and
$30 million
at Duke Energy, Duke Energy Carolinas, Progress Energy, Duke Energy Progress, Duke Energy Florida, Duke Energy Ohio, and Duke Energy Indiana, respectively, primarily in regulated plant. The Progress Energy, Duke Energy Progress and Duke Energy Florida amounts are net of
$72 million
,
$5 million
and
$67 million
, respectively, of accumulated amortization of capitalized leases.
|
|
(b)
|
Includes
$1,408 million
,
$847 million
,
$561 million
and
$561 million
of accumulated amortization of nuclear fuel at Duke Energy, Duke Energy Carolinas, Progress Energy and Duke Energy Progress, respectively.
|
|
(c)
|
Includes accumulated amortization of capitalized leases of
$52 million
,
$8 million
,
$25 million
and
$6 million
at Duke Energy, Duke Energy Carolinas, Duke Energy Ohio and Duke Energy Indiana, respectively.
|
|
(d)
|
Includes gross property, plant and equipment cost of consolidated VIEs of
$1,873 million
and accumulated depreciation of consolidated VIEs of
$257 million
at Duke Energy.
|
The following table presents capitalized interest, which includes the debt component of AFUDC.
|
Years Ended December 31,
|
|||||||||||
|
(in millions)
|
2015
|
|
2014
|
|
2013
|
|
|||||
|
Duke Energy
|
$
|
98
|
|
$
|
75
|
|
$
|
89
|
|
||
|
Duke Energy Carolinas
|
38
|
|
38
|
|
41
|
|
|||||
|
Progress Energy
|
24
|
|
11
|
|
19
|
|
|||||
|
Duke Energy Progress
|
20
|
|
10
|
|
16
|
|
|||||
|
Duke Energy Florida
|
4
|
|
1
|
|
3
|
|
|||||
|
Duke Energy Ohio
|
10
|
|
10
|
|
11
|
|
|||||
|
Duke Energy Indiana
|
6
|
|
6
|
|
9
|
|
|||||
168
PART II
DUKE ENERGY CORPORATION - DUKE ENERGY CAROLINAS, LLC - PROGRESS ENERGY, INC. –
DUKE ENERGY PROGRESS, LLC – DUKE ENERGY FLORIDA, LLC - DUKE ENERGY OHIO, INC. - DUKE ENERGY INDIANA, INC.
Combined Notes To Consolidated Financial Statements – (Continued)
Operating Leases
Duke Energy's Commercial Portfolio segment operates various renewable energy projects and sells the generated output to utilities, electric cooperatives, municipalities, and commercial and industrial customers through long-term contracts. In certain situations, these long-term contracts and the associated renewable energy projects qualify as operating leases. Rental income from these leases is accounted for as Operating Revenues in the Consolidated Statements of Operations. There are no minimum lease payments as all payments are contingent based on actual electricity generated by the renewable energy projects. Contingent lease payments were
$172 million
,
$164 million
and
$154 million
for the years ended December 31, 2015, 2014 and 2013. As of December 31, 2015, renewable energy projects owned by Duke Energy and accounted for as operating leases had a cost basis of
$2,455 million
and accumulated depreciation of
$258 million
. These assets are principally classified as nonregulated electric generation and transmission assets.
11. GOODWILL AND INTANGIBLE ASSETS
Goodwill
The following table presents goodwill by reportable operating segment for Duke Energy.
Duke Energy
|
Regulated
|
|
International
|
|
Commercial
|
|
||||||||||
|
(in millions)
|
Utilities
|
|
Energy
|
|
Portfolio
|
|
Total
|
|
|||||||
|
Goodwill at December 31, 2014
(a)
|
$
|
15,950
|
|
$
|
307
|
|
$
|
64
|
|
$
|
16,321
|
|
|||
|
Foreign exchange and other changes
|
—
|
|
(36
|
)
|
—
|
|
(36
|
)
|
|||||||
|
Acquisitions
|
—
|
|
—
|
|
58
|
|
58
|
|
|||||||
|
Goodwill at December 31, 2015
|
$
|
15,950
|
|
$
|
271
|
|
$
|
122
|
|
$
|
16,343
|
|
|||
|
(a)
|
Excludes fully impaired Goodwill related to the nonregulated Midwest Generation business which was sold in the second quarter of 2015. See Note
2
for further information related to the sale.
|
Duke Energy Ohio
Duke Energy Ohio's Goodwill balance of
$920 million
is included in the Regulated Utilities operating segment and presented net of accumulated impairment charges of
$216 million
on the Consolidated Balance Sheets at December 31, 2015 and 2014.
Progress Energy
Progress Energy's Goodwill is included in the Regulated Utilities operating segment and there are no accumulated impairment charges.
Impairment Testing
Duke Energy, Duke Energy Ohio and Progress Energy perform annual goodwill impairment tests each year as of August 31. Duke Energy, Duke Energy Ohio and Progress Energy update their test between annual tests if events or circumstances occur that would more likely than not reduce the fair value of a reporting unit below its carrying value. As the fair value of Duke Energy, Duke Energy Ohio and Progress Energy’s reporting units exceeded their respective carrying values at the date of the annual impairment analysis, no impairment charges were recorded in
2015
.
169
PART II
DUKE ENERGY CORPORATION - DUKE ENERGY CAROLINAS, LLC - PROGRESS ENERGY, INC. –
DUKE ENERGY PROGRESS, LLC – DUKE ENERGY FLORIDA, LLC - DUKE ENERGY OHIO, INC. - DUKE ENERGY INDIANA, INC.
Combined Notes To Consolidated Financial Statements – (Continued)
Intangible Assets
The following tables show the carrying amount and accumulated amortization of intangible assets within Other on the Consolidated Balance Sheets of the Duke Energy Registrants at
December 31, 2015
and
2014
.
|
|
December 31, 2015
|
||||||||||||||||||||||||||
|
Duke
|
|
Duke
|
|
Duke
|
|
Duke
|
|
Duke
|
|
||||||||||||||||||
|
Duke
|
|
Energy
|
|
Progress
|
|
Energy
|
|
Energy
|
|
Energy
|
|
Energy
|
|
||||||||||||||
|
(in millions)
|
Energy
|
|
Carolinas
|
|
Energy
|
|
Progress
|
|
Florida
|
|
Ohio
|
|
Indiana
|
|
|||||||||||||
|
Emission allowances
|
$
|
20
|
|
$
|
1
|
|
$
|
6
|
|
$
|
2
|
|
$
|
4
|
|
$
|
—
|
|
$
|
14
|
|
||||||
|
Renewable energy certificates
|
116
|
|
30
|
|
80
|
|
80
|
|
—
|
|
5
|
|
—
|
|
|||||||||||||
|
Gas, coal and power contracts
|
24
|
|
—
|
|
—
|
|
—
|
|
—
|
|
—
|
|
24
|
|
|||||||||||||
|
Wind development rights
|
115
|
|
—
|
|
—
|
|
—
|
|
—
|
|
—
|
|
—
|
|
|||||||||||||
|
Other
|
68
|
|
—
|
|
—
|
|
—
|
|
—
|
|
—
|
|
—
|
|
|||||||||||||
|
Total gross carrying amounts
|
343
|
|
31
|
|
86
|
|
82
|
|
4
|
|
5
|
|
38
|
|
|||||||||||||
|
Accumulated amortization – gas, coal and power contracts
|
(16
|
)
|
—
|
|
—
|
|
—
|
|
—
|
|
—
|
|
(16
|
)
|
|||||||||||||
|
Accumulated amortization – wind development rights
|
(18
|
)
|
—
|
|
—
|
|
—
|
|
—
|
|
—
|
|
—
|
|
|||||||||||||
|
Accumulated amortization – other
|
(24
|
)
|
—
|
|
—
|
|
—
|
|
—
|
|
—
|
|
—
|
|
|||||||||||||
|
Total accumulated amortization
|
(58
|
)
|
—
|
|
—
|
|
—
|
|
—
|
|
—
|
|
(16
|
)
|
|||||||||||||
|
Total intangible assets, net
|
$
|
285
|
|
|
$
|
31
|
|
|
$
|
86
|
|
|
$
|
82
|
|
|
$
|
4
|
|
|
$
|
5
|
|
|
$
|
22
|
|
|
|
December 31, 2014
|
||||||||||||||||||||||||||
|
Duke
|
|
Duke
|
|
Duke
|
|
Duke
|
|
Duke
|
|
||||||||||||||||||
|
Duke
|
|
Energy
|
|
Progress
|
|
Energy
|
|
Energy
|
|
Energy
|
|
Energy
|
|
||||||||||||||
|
(in millions)
|
Energy
|
|
Carolinas
|
|
Energy
|
|
Progress
|
|
Florida
|
|
Ohio
|
|
Indiana
|
|
|||||||||||||
|
Emission allowances
|
$
|
23
|
|
$
|
1
|
|
$
|
7
|
|
$
|
3
|
|
$
|
4
|
|
$
|
—
|
|
$
|
16
|
|
||||||
|
Renewable energy certificates
|
97
|
|
25
|
|
69
|
|
69
|
|
—
|
|
3
|
|
—
|
|
|||||||||||||
|
Gas, coal and power contracts
|
24
|
|
—
|
|
—
|
|
—
|
|
—
|
|
—
|
|
24
|
|
|||||||||||||
|
Wind development rights
|
97
|
|
—
|
|
—
|
|
—
|
|
—
|
|
—
|
|
—
|
|
|||||||||||||
|
Other
|
76
|
|
—
|
|
—
|
|
—
|
|
—
|
|
—
|
|
—
|
|
|||||||||||||
|
Total gross carrying amounts
|
317
|
|
26
|
|
76
|
|
72
|
|
4
|
|
3
|
|
40
|
|
|||||||||||||
|
Accumulated amortization – gas, coal and power contracts
|
(15
|
)
|
—
|
|
—
|
|
—
|
|
—
|
|
—
|
|
(15
|
)
|
|||||||||||||
|
Accumulated amortization – wind development rights
|
(14
|
)
|
—
|
|
—
|
|
—
|
|
—
|
|
—
|
|
—
|
|
|||||||||||||
|
Accumulated amortization – other
|
(25
|
)
|
—
|
|
—
|
|
—
|
|
—
|
|
—
|
|
—
|
|
|||||||||||||
|
Total accumulated amortization
|
(54
|
)
|
—
|
|
—
|
|
—
|
|
—
|
|
—
|
|
(15
|
)
|
|||||||||||||
|
Total intangible assets, net
|
$
|
263
|
|
|
$
|
26
|
|
|
$
|
76
|
|
|
$
|
72
|
|
|
$
|
4
|
|
|
$
|
3
|
|
|
$
|
25
|
|
Amortization Expense
The following table presents amortization expense for gas, coal and power contracts, wind development rights and other intangible assets.
|
|
December 31,
|
||||||||||
|
(in millions)
|
2015
|
|
2014
|
|
2013
|
|
|||||
|
Duke Energy
|
$
|
4
|
|
$
|
6
|
|
$
|
13
|
|
||
|
Duke Energy Ohio
|
—
|
|
2
|
|
8
|
|
|||||
|
Duke Energy Indiana
|
1
|
|
1
|
|
1
|
|
|||||
170
PART II
DUKE ENERGY CORPORATION - DUKE ENERGY CAROLINAS, LLC - PROGRESS ENERGY, INC. –
DUKE ENERGY PROGRESS, LLC – DUKE ENERGY FLORIDA, LLC - DUKE ENERGY OHIO, INC. - DUKE ENERGY INDIANA, INC.
Combined Notes To Consolidated Financial Statements – (Continued)
The table below shows the expected amortization expense for the next five years for intangible assets as of
December 31, 2015
. The expected amortization expense includes estimates of emission allowances consumption and estimates of consumption of commodities such as gas and coal under existing contracts, as well as estimated amortization related to the wind development projects. The amortization amounts discussed below are estimates and actual amounts may differ from these estimates due to such factors as changes in consumption patterns, sales or impairments of emission allowances or other intangible assets, delays in the in-service dates of wind assets, additional intangible acquisitions and other events.
|
(in millions)
|
2016
|
|
2017
|
|
2018
|
|
2019
|
|
2020
|
|
|||||||||
|
Duke Energy
|
$
|
8
|
|
$
|
8
|
|
$
|
8
|
|
$
|
7
|
|
$
|
7
|
|
||||
|
Duke Energy Indiana
|
2
|
|
2
|
|
2
|
|
2
|
|
2
|
|
|||||||||
12. INVESTMENTS IN UNCONSOLIDATED AFFILIATES
EQUITY METHOD INVESTMENTS
Investments in domestic and international affiliates that are not controlled by Duke Energy, but over which it has significant influence, are accounted for using the equity method. As of
December 31, 2015
, the carrying amount of investments in affiliates with carrying amounts greater than zero exceeded the underlying investment by
$60 million
. These differences are attributable to intangibles associated with underlying contracts which are reflected in the investments balance and the equity in earnings reported in the table below.
The following table presents Duke Energy’s investments in unconsolidated affiliates accounted for under the equity method, as well as the respective equity in earnings, by segment.
|
|
Years Ended December 31,
|
||||||||||||||||||
|
|
2015
|
2014
|
2013
|
||||||||||||||||
|
Equity in
|
|
Equity in
|
|
Equity in
|
|
||||||||||||||
|
(in millions)
|
Investments
|
|
earnings
|
|
Investments
|
|
earnings
|
|
earnings
|
|
|||||||||
|
Regulated Utilities
|
$
|
2
|
|
$
|
(4
|
)
|
$
|
3
|
|
$
|
(3
|
)
|
$
|
(1
|
)
|
||||
|
International Energy
|
39
|
|
74
|
|
69
|
|
120
|
|
110
|
|
|||||||||
|
Commercial Portfolio
|
433
|
|
(3
|
)
|
258
|
|
10
|
|
7
|
|
|||||||||
|
Other
|
25
|
|
2
|
|
28
|
|
3
|
|
6
|
|
|||||||||
|
Total
|
$
|
499
|
|
$
|
69
|
|
$
|
358
|
|
$
|
130
|
|
$
|
122
|
|
||||
During the years ended
December 31, 2015
,
2014
and
2013
, Duke Energy received distributions from equity investments of
$104 million
,
$154 million
and
$144 million
, respectively, which are included in Other assets within Cash Flows from Operating Activities on the Consolidated Statements of Cash Flows.
Significant investments in affiliates accounted for under the equity method are discussed below.
International Energy
Duke Energy owns a
25 percent
indirect interest in NMC, which owns and operates a methanol and MTBE business in Jubail, Saudi Arabia. International Energy’s economic ownership interest will decrease to
17.5 percent
upon successful startup of NMC's polyacetal production facility, which is expected to occur in January 2017.
Commercial Portfolio
Investments accounted for under the equity method primarily consist of Duke Energy’s approximate
50 percent
ownership interest in the five Catamount Sweetwater, LLC wind farm projects (Phase I-V), and DS Cornerstone, LLC. All of these entities own wind power projects in the United States. Duke Energy also owns a
50 percent
interest in Duke American Transmission Co., LLC, which builds, owns and operates electric transmission facilities in North America. Duke Energy also owns a
40 percent
and
7.5 percent
interest in Atlantic Coast Pipeline, LLC and Sabal Trail Transmission, LLC, respectively, which will build and own natural gas pipelines.
Other
On December 31, 2013, Duke Energy completed the sale of its
50 percent
ownership interest in DukeNet, which owned and operated telecommunications businesses, to Time Warner Cable, Inc. After retiring existing DukeNet debt and payment of transaction expenses, Duke Energy received
$215 million
in cash proceeds and recorded a
$105 million
pretax gain in the fourth quarter of 2013.
171
PART II
DUKE ENERGY CORPORATION - DUKE ENERGY CAROLINAS, LLC - PROGRESS ENERGY, INC. –
DUKE ENERGY PROGRESS, LLC – DUKE ENERGY FLORIDA, LLC - DUKE ENERGY OHIO, INC. - DUKE ENERGY INDIANA, INC.
Combined Notes To Consolidated Financial Statements – (Continued)
13. RELATED PARTY TRANSACTIONS
The Subsidiary Registrants engage in related party transactions in accordance with the applicable state and federal commission regulations. Refer to the Consolidated Balance Sheets of the Subsidiary Registrants for balances due to or due from related parties. Material amounts related to transactions with related parties included in the Consolidated Statements of Operations and Comprehensive Income are presented in the following table.
|
|
Years Ended December 31,
|
||||||||||
|
(in millions)
|
2015
|
|
2014
|
|
2013
|
|
|||||
|
Duke Energy Carolinas
|
|
|
|
||||||||
|
Corporate governance and shared service expenses
(a)
|
$
|
914
|
|
$
|
851
|
|
$
|
927
|
|
||
|
Indemnification coverages
(b)
|
24
|
|
21
|
|
22
|
|
|||||
|
JDA revenue
(c)
|
51
|
|
133
|
|
121
|
|
|||||
|
JDA expense
(c)
|
183
|
|
198
|
|
116
|
|
|||||
|
Progress Energy
|
|
|
|
||||||||
|
Corporate governance and shared services provided by Duke Energy
(a)
|
$
|
712
|
|
$
|
732
|
|
$
|
290
|
|
||
|
Corporate governance and shared services provided to Duke Energy
(d)
|
—
|
|
—
|
|
96
|
|
|||||
|
Indemnification coverages
(b)
|
38
|
|
33
|
|
34
|
|
|||||
|
JDA revenue
(c)
|
183
|
|
198
|
|
116
|
|
|||||
|
JDA expense
(c)
|
51
|
|
133
|
|
121
|
|
|||||
|
Duke Energy Progress
|
|
|
|
||||||||
|
Corporate governance and shared service expenses
(a)
|
$
|
403
|
|
$
|
386
|
|
$
|
266
|
|
||
|
Indemnification coverages
(b)
|
16
|
|
17
|
|
20
|
|
|||||
|
JDA revenue
(c)
|
183
|
|
198
|
|
116
|
|
|||||
|
JDA expense
(c)
|
51
|
|
133
|
|
121
|
|
|||||
|
Duke Energy Florida
|
|
|
|
||||||||
|
Corporate governance and shared service expenses
(a)
|
$
|
309
|
|
$
|
346
|
|
$
|
182
|
|
||
|
Indemnification coverages
(b)
|
22
|
|
16
|
|
14
|
|
|||||
|
Duke Energy Ohio
|
|
|
|
||||||||
|
Corporate governance and shared service expenses
(a)
|
$
|
342
|
|
$
|
316
|
|
$
|
347
|
|
||
|
Indemnification coverages
(b)
|
6
|
|
13
|
|
15
|
|
|||||
|
Duke Energy Indiana
|
|
|
|
||||||||
|
Corporate governance and shared service expenses
(a)
|
$
|
349
|
|
$
|
384
|
|
$
|
422
|
|
||
|
Indemnification coverages
(b)
|
9
|
|
11
|
|
14
|
|
|||||
|
(a)
|
The Subsidiary Registrants are charged their proportionate share of corporate governance and other shared services costs, primarily related to human resources, employee benefits, legal and accounting fees, as well as other third-party costs. These amounts are recorded in Operation, maintenance and other on the Consolidated Statements of Operations and Comprehensive Income.
|
|
(b)
|
The Subsidiary Registrants incur expenses related to certain indemnification coverages through Bison, Duke Energy’s wholly owned captive insurance subsidiary. These expenses are recorded in Operation, maintenance and other on the Consolidated Statements of Operations and Comprehensive Income.
|
|
(c)
|
Duke Energy Carolinas and Duke Energy Progress participate in a JDA which allows the collective dispatch of power plants between the service territories to reduce customer rates. Revenues from the sale of power under the JDA are recorded in Operating Revenues on the Consolidated Statements of Operations and Comprehensive Income. Expenses from the purchase of power under the JDA are recorded in Fuel used in electric generation and purchased power on the Consolidated Statements of Operations and Comprehensive Income.
|
|
(d)
|
In 2013, Progress Energy Service Company (PESC), a consolidated subsidiary of Progress Energy, charged a proportionate share of corporate governance and other costs to consolidated affiliates of Duke Energy. Corporate governance and other shared costs were primarily related to human resources, employee benefits, legal and accounting fees, as well as other third-party costs. These charges were recorded as an offset to Operation, maintenance and other in the Consolidated Statements of Operations and Comprehensive Income. Effective January 1, 2014, PESC was contributed to Duke Energy Corporate Services (DECS), a consolidated subsidiary of Duke Energy, and these costs were no longer charged out of Progress Energy. Progress Energy recorded a non-cash after-tax equity transfer related to the contribution of PESC to DECS in its Consolidated Statements of Changes in Common Stockholder's Equity.
|
In addition to the amounts presented above, the Subsidiary Registrants record the impact on net income of other affiliate transactions, including rental of office space, participation in a money pool arrangement, other operational transactions and their proportionate share of certain charged expenses. See Note
6
for more information regarding money pool. The net impact of these transactions was not material for the years ended
December 31, 2015
,
2014
and
2013
for the Subsidiary Registrants.
172
PART II
DUKE ENERGY CORPORATION - DUKE ENERGY CAROLINAS, LLC - PROGRESS ENERGY, INC. –
DUKE ENERGY PROGRESS, LLC – DUKE ENERGY FLORIDA, LLC - DUKE ENERGY OHIO, INC. - DUKE ENERGY INDIANA, INC.
Combined Notes To Consolidated Financial Statements – (Continued)
As discussed in Note
17
, certain trade receivables have been sold by Duke Energy Ohio and Duke Energy Indiana to CRC, an affiliate formed by a subsidiary of Duke Energy. The proceeds obtained from the sales of receivables are largely cash but do include a subordinated note from CRC for a portion of the purchase price.
Duke Energy Ohio's nonregulated indirect subsidiary, Duke Energy Commercial Asset Management (DECAM), owned generating plants included in the Disposal Group sold to Dynegy on April 2, 2015. On April 1, 2015, Duke Energy Ohio distributed its indirect ownership interest in DECAM to a Duke Energy subsidiary and non-cash settled DECAM's intercompany loan payable of
$294 million
. The intercompany loan payable recorded in Notes payable to affiliated companies on Duke Energy Ohio’s Consolidated Balance Sheets was
$459 million
as of December 31, 2014.
Refer to Note
2
for further information on the sale of the Disposal Group.
Intercompany Income Taxes
Duke Energy and its subsidiaries file a consolidated federal income tax return and other state and jurisdictional returns. The Subsidiary Registrants have a tax sharing agreement with Duke Energy for the allocation of consolidated tax liabilities and benefits. Income taxes recorded represent amounts the Subsidiary Registrants would incur as separate C-Corporations. The following table includes the balance of intercompany income tax receivables for the subsidiary registrants.
|
Duke
|
|
Duke
|
|
Duke
|
|
Duke
|
|
Duke
|
|
|||||||||
|
Energy
|
|
Progress
|
|
Energy
|
|
Energy
|
|
Energy
|
|
Energy
|
|
|||||||
|
(in millions)
|
Carolinas
|
|
Energy
|
|
Progress
|
|
Florida
|
|
Ohio
|
|
Indiana
|
|
||||||
|
December 31, 2015
|
||||||||||||||||||
|
Intercompany income tax receivable
|
$
|
122
|
|
$
|
120
|
|
$
|
104
|
|
$
|
—
|
|
$
|
54
|
|
$
|
—
|
|
|
Intercompany income tax payable
|
—
|
|
—
|
|
—
|
|
96
|
|
—
|
|
47
|
|
||||||
|
December 31, 2014
|
||||||||||||||||||
|
Intercompany income tax receivable
|
$
|
43
|
|
$
|
713
|
|
$
|
267
|
|
$
|
174
|
|
$
|
39
|
|
$
|
95
|
|
14. DERIVATIVES AND HEDGING
The Duke Energy Registrants use commodity and interest rate contracts to manage commodity price risk and interest rate risk. The primary use of commodity derivatives is to hedge the generation portfolio against changes in the prices of electricity and natural gas. Interest rate swaps are used to manage interest rate risk associated with borrowings.
All derivative instruments not identified as normal purchase/normal sale (NPNS) are recorded at fair value as assets or liabilities on the Consolidated Balance Sheets. Cash collateral related to derivative instruments executed under master netting arrangements is offset against the collateralized derivatives on the Consolidated Balance Sheets. The cash impacts of settled derivatives are recorded as operating activities on the Consolidated Statements of Cash Flows.
INTEREST RATE RISK
The Duke Energy Registrants are exposed to changes in interest rates as a result of their issuance or anticipated issuance of variable-rate and fixed-rate debt and commercial paper. Interest rate risk is managed by limiting variable-rate exposures to a percentage of total debt and by monitoring changes in interest rates. To manage risk associated with changes in interest rates, the Duke Energy Registrants may enter into interest rate swaps, U.S. Treasury lock agreements and other financial contracts. In anticipation of certain fixed-rate debt issuances, a series of forward-starting interest rate swaps may be executed to lock in components of current market interest rates. These instruments are later terminated prior to or upon the issuance of the corresponding debt.
Cash Flow Hedges
For a derivative designated as hedging the exposure to variable cash flows of a future transaction, referred to as a cash flow hedge, the effective portion of the derivative's gain or loss is initially reported as a component of other comprehensive income and subsequently reclassified into earnings once the future transaction effects earnings. Amounts for interest rate contracts are reclassified to earnings as interest expense over the term of the related debt. Gains and losses reclassified out of AOCI for the years ended
December 31, 2015
and
2014
were not material. Duke Energy's interest rate derivatives designated as hedges include interest rate swaps used to hedge existing debt within the International Energy and Renewables' businesses.
Undesignated Contracts
Undesignated contracts include contracts not designated as a hedge because they are accounted for under regulatory accounting and contracts that do not qualify for hedge accounting.
Duke Energy’s interest rate swaps for its Regulated Utilities operations employ regulatory accounting. With regulatory accounting, the mark-to-market gains or losses on the swaps are deferred as regulatory liabilities or regulatory assets, respectively. Regulatory assets and liabilities are amortized consistent with the treatment of the related costs in the ratemaking process. The accrual of interest on the swaps is recorded as Interest Expense.
173
PART II
DUKE ENERGY CORPORATION - DUKE ENERGY CAROLINAS, LLC - PROGRESS ENERGY, INC. –
DUKE ENERGY PROGRESS, LLC – DUKE ENERGY FLORIDA, LLC - DUKE ENERGY OHIO, INC. - DUKE ENERGY INDIANA, INC.
Combined Notes To Consolidated Financial Statements – (Continued)
Interest rate contracts issued in 2015 that use regulatory accounting include
$400 million
notional amount of forward-starting interest rate swaps issued in October 2015 at Duke Energy Carolinas to hedge debt anticipated to be issued in 2018. In January 2015, Duke Energy Progress executed fixed-to-floating rate swaps that also use regulatory accounting. The swaps were issued to economically convert
$250 million
of fixed-rate first mortgage bonds due September 15, 2021, to floating-rate with an initial rate of approximately
1.75 percent
.
As of December 31, 2015, Duke Energy entered into
$900 million
of forward-starting interest rate swaps to lock in components of interest rates for the expected financing of the Piedmont acquisition. In January 2016, Duke Energy entered into an additional
$500 million
notional amount. The swaps do not qualify for hedge accounting and are marked-to-market, with any gains or losses included in earnings. The impact on net income was not material in 2015. The swaps will be terminated in conjunction with the acquisition financing. See note 2 for additional information related to the Piedmont acquisition.
The following table shows notional amounts for derivatives related to interest rate risk.
|
December 31, 2015
|
December 31, 2014
|
||||||||||||||||||||||||||||||||||||||
|
Duke
|
|
Duke
|
|
Duke
|
|
Duke
|
|
Duke
|
|
Duke
|
|
||||||||||||||||||||||||||||
|
Duke
|
|
Energy
|
|
Progress
|
|
Energy
|
|
Energy
|
|
Energy
|
|
Duke
|
|
Progress
|
|
Energy
|
|
Energy
|
|
||||||||||||||||||||
|
(in millions)
|
Energy
|
|
Carolinas
|
|
Energy
|
|
Progress
|
|
Florida
|
|
Ohio
|
|
Energy
|
|
Energy
|
|
Florida
|
|
Ohio
|
|
|||||||||||||||||||
|
Cash flow hedges
(a)
|
$
|
700
|
|
$
|
—
|
|
$
|
—
|
|
$
|
—
|
|
$
|
—
|
|
$
|
—
|
|
$
|
750
|
|
$
|
—
|
|
$
|
—
|
|
$
|
—
|
|
|||||||||
|
Undesignated contracts
|
1,827
|
|
400
|
|
500
|
|
250
|
|
250
|
|
27
|
|
277
|
|
250
|
|
250
|
|
27
|
|
|||||||||||||||||||
|
Total notional amount
|
$
|
2,527
|
|
$
|
400
|
|
$
|
500
|
|
$
|
250
|
|
$
|
250
|
|
$
|
27
|
|
$
|
1,027
|
|
$
|
250
|
|
$
|
250
|
|
$
|
27
|
|
|||||||||
|
(a)
|
Duke Energy includes amounts related to consolidated Variable Interest Entities (VIEs) of
$497 million
and
$541 million
at
December 31, 2015
and
2014
, respectively.
|
COMMODITY PRICE RISK
The Duke Energy Registrants are exposed to the impact of changes in the prices of electricity, coal and natural gas. Exposure to commodity price risk is influenced by a number of factors including the term of contracts, the liquidity of markets and delivery locations.
Regulated public utilities may have cost-based rate regulations and various other cost recovery mechanisms that result in a limited exposure to market volatility of commodity fuel prices. Financial derivative contracts, where approved by the respective state regulatory commissions, can be used to manage the risk of price volatility. At December 31, 2015 all of Duke Energy's open commodity derivative instruments were undesignated because they are accounted for under regulatory accounting. Mark-to-market gains or losses on contracts that use regulatory accounting are deferred as regulatory liabilities or regulatory assets, respectively. Undesignated contracts expire as late as
2048
.
The Subsidiary Registrants utilize cost-tracking mechanisms, commonly referred to as fuel adjustment clauses. These clauses allow for the recovery of fuel and fuel-related costs, including settlements of undesignated derivatives for fuel commodities, and portions of purchased power costs through surcharges on customer rates. The difference between the costs incurred and the surcharge revenues is recorded as an adjustment to Fuel used in electric generation and purchased power – regulated or as Operating Revenues: Regulated electric on the Consolidated Statements of Operations with an offsetting impact on regulatory assets or liabilities. Therefore, due to the regulatory accounting followed by the Subsidiary Registrants for undesignated derivatives, realized and unrealized gains and losses on undesignated commodity derivatives do not have an immediate impact on reported net income.
Mark-to-market gains and losses related to the nonregulated Midwest generation business were recorded in discontinued operations and open positions at April 2, 2014, were included in the sale of the Disposal Group. Refer to Note 2 for further information on the sale of the Disposal Group. Gains and losses on undesignated derivative contracts for nonregulated continuing operations are not material.
Volumes
The tables below show information relating to volumes of outstanding commodity derivatives. Amounts disclosed represent the absolute value of notional volumes of commodity contracts excluding NPNS. The Duke Energy Registrants have netted contractual amounts where offsetting purchase and sale contracts exist with identical delivery locations and times of delivery. Where all commodity positions are perfectly offset, no quantities are shown.
|
December 31, 2015
|
||||||||||||||||||||
|
Duke
|
|
Duke
|
|
Duke
|
|
Duke
|
|
Duke
|
|
|||||||||||
|
Duke
|
|
Energy
|
|
Progress
|
|
Energy
|
|
Energy
|
|
Energy
|
|
Energy
|
|
|||||||
|
Energy
|
|
Carolinas
|
|
Energy
|
|
Progress
|
|
Florida
|
|
Ohio
|
|
Indiana
|
|
|||||||
|
Electricity (gigawatt-hours)
|
70
|
|
—
|
|
—
|
|
—
|
|
—
|
|
34
|
|
36
|
|
||||||
|
Natural gas (millions of decatherms)
|
398
|
|
66
|
|
332
|
|
117
|
|
215
|
|
—
|
|
—
|
|
||||||
|
December 31, 2014
|
||||||||||||||||||||
|
Duke
|
|
Duke
|
|
Duke
|
|
Duke
|
|
Duke
|
|
|||||||||||
|
Duke
|
|
Energy
|
|
Progress
|
|
Energy
|
|
Energy
|
|
Energy
|
|
Energy
|
|
|||||||
|
Energy
|
|
Carolinas
|
|
Energy
|
|
Progress
|
|
Florida
|
|
Ohio
|
|
Indiana
|
|
|||||||
|
Electricity (gigawatt-hours)
(a)(b)
|
25,370
|
|
—
|
|
—
|
|
—
|
|
—
|
|
19,141
|
|
—
|
|
||||||
|
Natural gas (millions of decatherms)
(a)
|
676
|
|
35
|
|
328
|
|
116
|
|
212
|
|
313
|
|
—
|
|
||||||
174
PART II
DUKE ENERGY CORPORATION - DUKE ENERGY CAROLINAS, LLC - PROGRESS ENERGY, INC. –
DUKE ENERGY PROGRESS, LLC – DUKE ENERGY FLORIDA, LLC - DUKE ENERGY OHIO, INC. - DUKE ENERGY INDIANA, INC.
Combined Notes To Consolidated Financial Statements – (Continued)
|
(a)
|
Duke Energy Ohio includes amounts related to the Disposal Group. Refer to Note 2 for further information on the sale.
|
|
(b)
|
Amounts at Duke Energy Ohio include intercompany positions that eliminate at Duke Energy.
|
LOCATION AND FAIR VALUE OF DERIVATIVE ASSETS AND LIABILITIES RECOGNIZED IN THE CONSOLIDATED BALANCE SHEETS
The following tables show the fair value and balance sheet location of derivative instruments. Although derivatives subject to master netting arrangements are netted on the Consolidated Balance Sheets, the fair values presented below are shown gross and cash collateral on the derivatives has not been netted against the fair values shown.
|
Derivative Assets
|
December 31, 2015
|
|||||||||||||||||||||||||||
|
Duke
|
|
Duke
|
|
Duke
|
|
Duke
|
|
Duke
|
|
|||||||||||||||||||
|
Duke
|
|
Energy
|
|
Progress
|
|
Energy
|
|
Energy
|
|
Energy
|
|
Energy
|
|
|||||||||||||||
|
(in millions)
|
Energy
|
|
Carolinas
|
|
Energy
|
|
Progress
|
|
Florida
|
|
Ohio
|
|
Indiana
|
|
||||||||||||||
|
Commodity Contracts
|
||||||||||||||||||||||||||||
|
Not Designated as Hedging Instruments
|
||||||||||||||||||||||||||||
|
Current
|
12
|
|
—
|
|
1
|
|
—
|
|
1
|
|
3
|
|
7
|
|
||||||||||||||
|
Noncurrent
|
4
|
|
—
|
|
4
|
|
—
|
|
4
|
|
—
|
|
—
|
|
||||||||||||||
|
Total Derivative Assets – Commodity Contracts
|
$
|
16
|
|
$
|
—
|
|
$
|
5
|
|
$
|
—
|
|
$
|
5
|
|
$
|
3
|
|
$
|
7
|
|
|||||||
|
Interest Rate Contracts
|
||||||||||||||||||||||||||||
|
Designated as Hedging Instruments
|
||||||||||||||||||||||||||||
|
Noncurrent
|
$
|
4
|
|
$
|
—
|
|
$
|
—
|
|
$
|
—
|
|
$
|
—
|
|
$
|
—
|
|
$
|
—
|
|
|||||||
|
Not Designated as Hedging Instruments
|
||||||||||||||||||||||||||||
|
Current
|
6
|
|
—
|
|
6
|
|
2
|
|
2
|
|
—
|
|
—
|
|
||||||||||||||
|
Total Derivative Assets – Interest Rate Contracts
|
$
|
10
|
|
|
$
|
—
|
|
|
$
|
6
|
|
|
$
|
2
|
|
|
$
|
2
|
|
|
$
|
—
|
|
|
$
|
—
|
|
|
|
Total Derivative Assets
|
$
|
26
|
|
$
|
—
|
|
$
|
11
|
|
$
|
2
|
|
$
|
7
|
|
$
|
3
|
|
$
|
7
|
|
|||||||
|
Derivative Liabilities
|
December 31, 2015
|
|||||||||||||||||||||||||||
|
Duke
|
|
Duke
|
|
Duke
|
|
Duke
|
|
Duke
|
|
|||||||||||||||||||
|
Duke
|
|
Energy
|
|
Progress
|
|
Energy
|
|
Energy
|
|
Energy
|
|
Energy
|
|
|||||||||||||||
|
(in millions)
|
Energy
|
|
Carolinas
|
|
Energy
|
|
Progress
|
|
Florida
|
|
Ohio
|
|
Indiana
|
|
||||||||||||||
|
Commodity Contracts
|
||||||||||||||||||||||||||||
|
Not Designated as Hedging Instruments
|
||||||||||||||||||||||||||||
|
Current
|
$
|
256
|
|
$
|
32
|
|
$
|
222
|
|
$
|
77
|
|
$
|
145
|
|
$
|
—
|
|
$
|
—
|
|
|||||||
|
Noncurrent
|
100
|
|
8
|
|
92
|
|
16
|
|
71
|
|
—
|
|
—
|
|
||||||||||||||
|
Total Derivative Liabilities – Commodity Contracts
|
$
|
356
|
|
$
|
40
|
|
$
|
314
|
|
$
|
93
|
|
$
|
216
|
|
$
|
—
|
|
$
|
—
|
|
|||||||
|
Interest Rate Contracts
|
||||||||||||||||||||||||||||
|
Designated as Hedging Instruments
|
||||||||||||||||||||||||||||
|
Current
|
$
|
11
|
|
$
|
—
|
|
$
|
—
|
|
$
|
—
|
|
$
|
—
|
|
$
|
—
|
|
$
|
—
|
|
|||||||
|
Noncurrent
|
33
|
|
—
|
|
—
|
|
—
|
|
—
|
|
—
|
|
—
|
|
||||||||||||||
|
Not Designated as Hedging Instruments
|
||||||||||||||||||||||||||||
|
Current
|
4
|
|
—
|
|
3
|
|
—
|
|
—
|
|
1
|
|
—
|
|
||||||||||||||
|
Noncurrent
|
15
|
|
5
|
|
5
|
|
5
|
|
—
|
|
6
|
|
—
|
|
||||||||||||||
|
Total Derivative Liabilities – Interest Rate Contracts
|
$
|
63
|
|
$
|
5
|
|
$
|
8
|
|
$
|
5
|
|
$
|
—
|
|
$
|
7
|
|
$
|
—
|
|
|||||||
|
Total Derivative Liabilities
|
$
|
419
|
|
$
|
45
|
|
$
|
322
|
|
$
|
98
|
|
$
|
216
|
|
$
|
7
|
|
$
|
—
|
|
|||||||
175
PART II
DUKE ENERGY CORPORATION - DUKE ENERGY CAROLINAS, LLC - PROGRESS ENERGY, INC. –
DUKE ENERGY PROGRESS, LLC – DUKE ENERGY FLORIDA, LLC - DUKE ENERGY OHIO, INC. - DUKE ENERGY INDIANA, INC.
Combined Notes To Consolidated Financial Statements – (Continued)
|
Derivative Assets
|
December 31, 2014
|
|||||||||||||||||||||||||||
|
Duke
|
|
Duke
|
|
Duke
|
|
Duke
|
|
Duke
|
|
|||||||||||||||||||
|
Duke
|
|
Energy
|
|
Progress
|
|
Energy
|
|
Energy
|
|
Energy
|
|
Energy
|
|
|||||||||||||||
|
(in millions)
|
Energy
|
|
Carolinas
|
|
Energy
|
|
Progress
|
|
Florida
|
|
Ohio
|
|
Indiana
|
|
||||||||||||||
|
Commodity Contracts
|
||||||||||||||||||||||||||||
|
Not Designated as Hedging Instruments
|
||||||||||||||||||||||||||||
|
Current Assets: Other
|
$
|
18
|
|
$
|
—
|
|
$
|
—
|
|
$
|
—
|
|
$
|
—
|
|
$
|
1
|
|
$
|
14
|
|
|||||||
|
Current Assets: Assets held for sale
|
15
|
|
—
|
|
—
|
|
—
|
|
—
|
|
28
|
|
—
|
|
||||||||||||||
|
Investments and Other Assets: Other
|
3
|
|
—
|
|
—
|
|
—
|
|
—
|
|
—
|
|
—
|
|
||||||||||||||
|
Investments and Other Assets: Assets held for sale
|
15
|
|
—
|
|
—
|
|
—
|
|
—
|
|
26
|
|
—
|
|
||||||||||||||
|
Current Liabilities: Other
|
1
|
|
—
|
|
—
|
|
—
|
|
—
|
|
—
|
|
—
|
|
||||||||||||||
|
Current Liabilities: Assets held for sale
|
174
|
|
—
|
|
—
|
|
—
|
|
—
|
|
175
|
|
—
|
|
||||||||||||||
|
Deferred Credits and Other Liabilities: Other
|
2
|
|
—
|
|
—
|
|
—
|
|
—
|
|
—
|
|
—
|
|
||||||||||||||
|
Deferred Credits and Other Liabilities: Assets held for sale
|
111
|
|
—
|
|
—
|
|
—
|
|
—
|
|
111
|
|
—
|
|
||||||||||||||
|
Total Derivative Assets – Commodity Contracts
|
$
|
339
|
|
|
$
|
—
|
|
$
|
—
|
|
$
|
—
|
|
$
|
—
|
|
$
|
341
|
|
$
|
14
|
|
||||||
|
Interest Rate Contracts
|
||||||||||||||||||||||||||||
|
Designated as Hedging Instruments
|
||||||||||||||||||||||||||||
|
Investments and Other Assets: Other
|
10
|
|
—
|
|
—
|
|
—
|
|
—
|
|
—
|
|
—
|
|
||||||||||||||
|
Not Designated as Hedging Instruments
|
||||||||||||||||||||||||||||
|
Current Assets: Other
|
2
|
|
—
|
|
2
|
|
—
|
|
2
|
|
—
|
|
—
|
|
||||||||||||||
|
Total Derivative Assets – Interest Rate Contracts
|
$
|
12
|
|
$
|
—
|
|
$
|
2
|
|
$
|
—
|
|
$
|
2
|
|
$
|
—
|
|
$
|
—
|
|
|||||||
|
Total Derivative Assets
|
$
|
351
|
|
$
|
—
|
|
$
|
2
|
|
$
|
—
|
|
$
|
2
|
|
$
|
341
|
|
$
|
14
|
|
|||||||
|
Derivative Liabilities
|
December 31, 2014
|
|||||||||||||||||||||||||||
|
Duke
|
|
Duke
|
|
Duke
|
|
Duke
|
|
Duke
|
|
|||||||||||||||||||
|
Duke
|
|
Energy
|
|
Progress
|
|
Energy
|
|
Energy
|
|
Energy
|
|
Energy
|
|
|||||||||||||||
|
(in millions)
|
Energy
|
|
Carolinas
|
|
Energy
|
|
Progress
|
|
Florida
|
|
Ohio
|
|
Indiana
|
|
||||||||||||||
|
Commodity Contracts
|
||||||||||||||||||||||||||||
|
Designated as Hedging Instruments
|
||||||||||||||||||||||||||||
|
Current Liabilities: Other
|
$
|
—
|
|
$
|
—
|
|
$
|
1
|
|
$
|
1
|
|
$
|
—
|
|
$
|
—
|
|
$
|
—
|
|
|||||||
|
Not Designated as Hedging Instruments
|
||||||||||||||||||||||||||||
|
Current Assets: Assets held for sale
|
—
|
|
—
|
|
—
|
|
—
|
|
—
|
|
4
|
|
—
|
|
||||||||||||||
|
Investments and Other Assets: Assets held for sale
|
—
|
|
—
|
|
—
|
|
—
|
|
—
|
|
4
|
|
—
|
|
||||||||||||||
|
Current Liabilities: Other
|
307
|
|
14
|
|
288
|
|
108
|
|
180
|
|
—
|
|
—
|
|
||||||||||||||
|
Current Liabilities: Assets held for sale
|
253
|
|
—
|
|
—
|
|
—
|
|
—
|
|
252
|
|
—
|
|
||||||||||||||
|
Deferred Credits and Other Liabilities: Other
|
91
|
|
5
|
|
80
|
|
23
|
|
57
|
|
—
|
|
—
|
|
||||||||||||||
|
Deferred Credits and Other Liabilities: Assets held for sale
|
208
|
|
—
|
|
—
|
|
—
|
|
—
|
|
207
|
|
—
|
|
||||||||||||||
|
Total Derivative Liabilities – Commodity Contracts
|
$
|
859
|
|
$
|
19
|
|
$
|
369
|
|
$
|
132
|
|
$
|
237
|
|
$
|
467
|
|
$
|
—
|
|
|||||||
|
Interest Rate Contracts
|
||||||||||||||||||||||||||||
|
Designated as Hedging Instruments
|
||||||||||||||||||||||||||||
|
Current Liabilities: Other
|
$
|
13
|
|
$
|
—
|
|
$
|
—
|
|
$
|
—
|
|
$
|
—
|
|
$
|
—
|
|
$
|
—
|
|
|||||||
|
Deferred Credits and Other Liabilities: Other
|
29
|
|
—
|
|
—
|
|
—
|
|
—
|
|
—
|
|
—
|
|
||||||||||||||
|
Not Designated as Hedging Instruments
|
||||||||||||||||||||||||||||
|
Current Liabilities: Other
|
1
|
|
—
|
|
—
|
|
—
|
|
—
|
|
1
|
|
—
|
|
||||||||||||||
|
Deferred Credits and Other Liabilities: Other
|
7
|
|
—
|
|
2
|
|
—
|
|
2
|
|
5
|
|
—
|
|
||||||||||||||
|
Total Derivative Liabilities – Interest Rate Contracts
|
$
|
50
|
|
$
|
—
|
|
$
|
2
|
|
$
|
—
|
|
$
|
2
|
|
$
|
6
|
|
$
|
—
|
|
|||||||
|
Total Derivative Liabilities
|
$
|
909
|
|
$
|
19
|
|
$
|
371
|
|
$
|
132
|
|
$
|
239
|
|
$
|
473
|
|
$
|
—
|
|
|||||||
176
PART II
DUKE ENERGY CORPORATION - DUKE ENERGY CAROLINAS, LLC - PROGRESS ENERGY, INC. –
DUKE ENERGY PROGRESS, LLC – DUKE ENERGY FLORIDA, LLC - DUKE ENERGY OHIO, INC. - DUKE ENERGY INDIANA, INC.
Combined Notes To Consolidated Financial Statements – (Continued)
OFFSETTING ASSETS AND LIABILITIES
The following tables present the line items on the Consolidated Balance Sheets where derivatives are reported. Substantially all of Duke Energy's outstanding derivative contracts are subject to enforceable master netting arrangements. The Gross amounts offset in the tables below show the effect of these netting arrangements on financial position, and include collateral posted to offset the net position. The amounts shown are calculated by counterparty. Accounts receivable or accounts payable may also be available to offset exposures in the event of bankruptcy. These amounts are not included in the tables below.
|
Derivative Assets
|
December 31, 2015
|
|||||||||||||||||||||||||||
|
Duke
|
|
Duke
|
|
Duke
|
|
Duke
|
|
Duke
|
|
|||||||||||||||||||
|
Duke
|
|
Energy
|
|
Progress
|
|
Energy
|
|
Energy
|
|
Energy
|
|
Energy
|
|
|||||||||||||||
|
(in millions)
|
Energy
|
|
Carolinas
|
|
Energy
|
|
Progress
|
|
Florida
|
|
Ohio
|
|
Indiana
|
|
||||||||||||||
|
Current
|
||||||||||||||||||||||||||||
|
Gross amounts recognized
|
$
|
18
|
|
$
|
—
|
|
$
|
7
|
|
$
|
2
|
|
$
|
3
|
|
$
|
3
|
|
$
|
7
|
|
|||||||
|
Gross amounts offset
|
(3
|
)
|
—
|
|
(2
|
)
|
—
|
|
(2
|
)
|
—
|
|
—
|
|
||||||||||||||
|
Net amounts presented in Current Assets: Other
|
$
|
15
|
|
|
$
|
—
|
|
|
$
|
5
|
|
|
$
|
2
|
|
|
$
|
1
|
|
|
$
|
3
|
|
|
$
|
7
|
|
|
|
Noncurrent
|
||||||||||||||||||||||||||||
|
Gross amounts recognized
|
$
|
8
|
|
$
|
—
|
|
$
|
4
|
|
$
|
—
|
|
$
|
4
|
|
$
|
—
|
|
$
|
—
|
|
|||||||
|
Gross amounts offset
|
(4
|
)
|
—
|
|
(4
|
)
|
—
|
|
(4
|
)
|
—
|
|
—
|
|
||||||||||||||
|
Net amounts presented in Investments and Other Assets: Other
|
$
|
4
|
|
$
|
—
|
|
$
|
—
|
|
$
|
—
|
|
$
|
—
|
|
$
|
—
|
|
$
|
—
|
|
|||||||
|
Derivative Liabilities
|
December 31, 2015
|
|||||||||||||||||||||||||||
|
Duke
|
|
Duke
|
|
Duke
|
|
Duke
|
|
Duke
|
|
|||||||||||||||||||
|
Duke
|
|
Energy
|
|
Progress
|
|
Energy
|
|
Energy
|
|
Energy
|
|
Energy
|
|
|||||||||||||||
|
(in millions)
|
Energy
|
|
Carolinas
|
|
Energy
|
|
Progress
|
|
Florida
|
|
Ohio
|
|
Indiana
|
|
||||||||||||||
|
Current
|
||||||||||||||||||||||||||||
|
Gross amounts recognized
|
$
|
271
|
|
$
|
32
|
|
$
|
225
|
|
$
|
77
|
|
$
|
145
|
|
$
|
1
|
|
$
|
—
|
|
|||||||
|
Gross amounts offset
|
(22
|
)
|
—
|
|
(21
|
)
|
(1
|
)
|
(20
|
)
|
—
|
|
—
|
|
||||||||||||||
|
Net amounts presented in Current Liabilities: Other
|
$
|
249
|
|
$
|
32
|
|
$
|
204
|
|
$
|
76
|
|
$
|
125
|
|
$
|
1
|
|
$
|
—
|
|
|||||||
|
Noncurrent
|
||||||||||||||||||||||||||||
|
Gross amounts recognized
|
$
|
148
|
|
$
|
13
|
|
$
|
97
|
|
$
|
21
|
|
$
|
71
|
|
$
|
6
|
|
$
|
—
|
|
|||||||
|
Gross amounts offset
|
(16
|
)
|
—
|
|
(15
|
)
|
—
|
|
(15
|
)
|
—
|
|
—
|
|
||||||||||||||
|
Net amounts presented in Deferred Credits and Other Liabilities: Other
|
$
|
132
|
|
$
|
13
|
|
$
|
82
|
|
$
|
21
|
|
$
|
56
|
|
$
|
6
|
|
$
|
—
|
|
|||||||
177
PART II
DUKE ENERGY CORPORATION - DUKE ENERGY CAROLINAS, LLC - PROGRESS ENERGY, INC. –
DUKE ENERGY PROGRESS, LLC – DUKE ENERGY FLORIDA, LLC - DUKE ENERGY OHIO, INC. - DUKE ENERGY INDIANA, INC.
Combined Notes To Consolidated Financial Statements – (Continued)
|
Derivative Assets
|
December 31, 2014
|
|||||||||||||||||||||||||||
|
Duke
|
|
Duke
|
|
Duke
|
|
Duke
|
|
Duke
|
|
|||||||||||||||||||
|
Duke
|
|
Energy
|
|
Progress
|
|
Energy
|
|
Energy
|
|
Energy
|
|
Energy
|
|
|||||||||||||||
|
(in millions)
|
Energy
|
|
Carolinas
|
|
Energy
|
|
Progress
|
|
Florida
|
|
Ohio
|
|
Indiana
|
|
||||||||||||||
|
Current
(a)
|
||||||||||||||||||||||||||||
|
Gross amounts recognized
|
$
|
210
|
|
$
|
—
|
|
$
|
2
|
|
$
|
—
|
|
$
|
2
|
|
$
|
204
|
|
$
|
14
|
|
|||||||
|
Gross amounts offset
|
(153
|
)
|
—
|
|
(2
|
)
|
—
|
|
(2
|
)
|
(179
|
)
|
—
|
|
||||||||||||||
|
Net amounts subject to master netting
|
57
|
|
—
|
|
—
|
|
—
|
|
—
|
|
25
|
|
14
|
|
||||||||||||||
|
Amounts not subject to master netting
|
—
|
|
—
|
|
—
|
|
—
|
|
—
|
|
—
|
|
—
|
|
||||||||||||||
|
Net amounts recognized on the Condensed Consolidated Balance Sheet
|
$
|
57
|
|
$
|
—
|
|
$
|
—
|
|
$
|
—
|
|
$
|
—
|
|
$
|
25
|
|
$
|
14
|
|
|||||||
|
Noncurrent
(b)
|
||||||||||||||||||||||||||||
|
Gross amounts recognized
|
$
|
136
|
|
$
|
—
|
|
$
|
—
|
|
$
|
—
|
|
$
|
—
|
|
$
|
137
|
|
$
|
—
|
|
|||||||
|
Gross amounts offset
|
(88
|
)
|
—
|
|
—
|
|
—
|
|
—
|
|
(114
|
)
|
—
|
|
||||||||||||||
|
Net amounts subject to master netting
|
48
|
|
—
|
|
—
|
|
—
|
|
—
|
|
23
|
|
—
|
|
||||||||||||||
|
Amounts not subject to master netting
|
5
|
|
—
|
|
—
|
|
—
|
|
—
|
|
—
|
|
—
|
|
||||||||||||||
|
Net amounts recognized on the Condensed Consolidated Balance Sheet
|
$
|
53
|
|
$
|
—
|
|
$
|
—
|
|
$
|
—
|
|
$
|
—
|
|
$
|
23
|
|
$
|
—
|
|
|||||||
|
(a)
|
Amounts for Duke Energy Registrants, except Duke Energy and Duke Energy Ohio, are included in Other within Current Assets on the Condensed Consolidated Balance Sheets. Amounts for Duke Energy and Duke Energy Ohio are included in Other and Assets held for sale within Current Assets on the Condensed Consolidated Balance Sheets.
|
|
(b)
|
Amounts for Duke Energy Registrants, except Duke Energy and Duke Energy Ohio, are included in Other within Investments and Other Assets on the Condensed Consolidated Balance Sheets. Amounts for Duke Energy and Duke Energy Ohio are included in Other and Assets held for sale within Investments and Other Assets on the Condensed Consolidated Balance Sheets.
|
|
Derivative Liabilities
|
December 31, 2014
|
|||||||||||||||||||||||||||
|
Duke
|
|
Duke
|
|
Duke
|
|
Duke
|
|
Duke
|
|
|||||||||||||||||||
|
Duke
|
|
Energy
|
|
Progress
|
|
Energy
|
|
Energy
|
|
Energy
|
|
Energy
|
|
|||||||||||||||
|
(in millions)
|
Energy
|
|
Carolinas
|
|
Energy
|
|
Progress
|
|
Florida
|
|
Ohio
|
|
Indiana
|
|
||||||||||||||
|
Current
(c)
|
||||||||||||||||||||||||||||
|
Gross amounts recognized
|
$
|
573
|
|
$
|
14
|
|
$
|
289
|
|
$
|
109
|
|
$
|
180
|
|
$
|
257
|
|
$
|
—
|
|
|||||||
|
Gross amounts offset
|
(213
|
)
|
—
|
|
(17
|
)
|
—
|
|
(17
|
)
|
(222
|
)
|
—
|
|
||||||||||||||
|
Net amounts subject to master netting
|
360
|
|
14
|
|
272
|
|
109
|
|
163
|
|
35
|
|
—
|
|
||||||||||||||
|
Amounts not subject to master netting
|
1
|
|
—
|
|
—
|
|
—
|
|
—
|
|
—
|
|
—
|
|
||||||||||||||
|
Net amounts recognized on the Condensed Consolidated Balance Sheet
|
$
|
361
|
|
$
|
14
|
|
$
|
272
|
|
$
|
109
|
|
$
|
163
|
|
$
|
35
|
|
$
|
—
|
|
|||||||
|
Noncurrent
(d)
|
||||||||||||||||||||||||||||
|
Gross amounts recognized
|
$
|
319
|
|
$
|
5
|
|
$
|
82
|
|
$
|
23
|
|
$
|
59
|
|
$
|
216
|
|
$
|
—
|
|
|||||||
|
Gross amounts offset
|
(173
|
)
|
—
|
|
(8
|
)
|
—
|
|
(8
|
)
|
(193
|
)
|
—
|
|
||||||||||||||
|
Net amounts subject to master netting
|
146
|
|
5
|
|
74
|
|
23
|
|
51
|
|
23
|
|
—
|
|
||||||||||||||
|
Amounts not subject to master netting
|
16
|
|
—
|
|
—
|
|
—
|
|
—
|
|
—
|
|
—
|
|
||||||||||||||
|
Net amounts recognized on the Condensed Consolidated Balance Sheet
|
$
|
162
|
|
$
|
5
|
|
$
|
74
|
|
$
|
23
|
|
$
|
51
|
|
$
|
23
|
|
$
|
—
|
|
|||||||
|
(c)
|
Amounts for Duke Energy Registrants, except Duke Energy and Duke Energy Ohio, are included in Other within Current Liabilities on the Condensed Consolidated Balance Sheets. Amounts for Duke Energy and Duke Energy Ohio are included in Other and Liabilities associated with assets held for sale within Current Liabilities on the Condensed Consolidated Balance Sheets.
|
|
(d)
|
Amounts for Duke Energy Registrants, except Duke Energy and Duke Energy Ohio, are included in Other within Deferred Credits and Other Liabilities on the Condensed Consolidated Balance Sheets. Amounts for Duke Energy and Duke Energy Ohio are included in Other and Liabilities associated with assets held for sale within Deferred Credits and Other Liabilities on the Condensed Consolidated Balance Sheets.
|
178
PART II
DUKE ENERGY CORPORATION - DUKE ENERGY CAROLINAS, LLC - PROGRESS ENERGY, INC. –
DUKE ENERGY PROGRESS, LLC – DUKE ENERGY FLORIDA, LLC - DUKE ENERGY OHIO, INC. - DUKE ENERGY INDIANA, INC.
Combined Notes To Consolidated Financial Statements – (Continued)
OBJECTIVE CREDIT CONTINGENT FEATURES
Certain derivative contracts contain objective credit contingent features. These features include the requirement to post cash collateral or letters of credit if specific events occur, such as a credit rating downgrade below investment grade. The following tables show information with respect to derivative contracts that are in a net liability position and contain objective credit-risk-related payment provisions. Amounts for Duke Energy Indiana were not material.
|
December 31, 2015
|
|||||||||||||||||||||||
|
Duke
|
|
Duke
|
|
Duke
|
|
Duke
|
|
||||||||||||||||
|
Duke
|
|
Energy
|
|
Progress
|
|
Energy
|
|
Energy
|
|
Energy
|
|
||||||||||||
|
(in millions)
|
Energy
|
|
Carolinas
|
|
Energy
|
|
Progress
|
|
Florida
|
|
Ohio
|
|
|||||||||||
|
Aggregate fair value of derivatives in a net liability position
|
$
|
334
|
|
$
|
45
|
|
$
|
290
|
|
$
|
93
|
|
$
|
194
|
|
$
|
—
|
|
|||||
|
Fair value of collateral already posted
|
30
|
|
—
|
|
30
|
|
—
|
|
30
|
|
—
|
|
|||||||||||
|
Additional cash collateral or letters of credit in the event credit-risk-related contingent features were triggered
|
304
|
|
45
|
|
260
|
|
93
|
|
164
|
|
—
|
|
|||||||||||
|
December 31, 2014
|
|||||||||||||||||||||||
|
Duke
|
|
Duke
|
|
Duke
|
|
Duke
|
|
||||||||||||||||
|
Duke
|
|
Energy
|
|
Progress
|
|
Energy
|
|
Energy
|
|
Energy
|
|
||||||||||||
|
(in millions)
|
Energy
|
|
Carolinas
|
|
Energy
|
|
Progress
|
|
Florida
|
|
Ohio
(a)
|
|
|||||||||||
|
Aggregate fair value of derivatives in a net liability position
|
$
|
845
|
|
$
|
19
|
|
$
|
370
|
|
$
|
131
|
|
$
|
239
|
|
$
|
456
|
|
|||||
|
Fair value of collateral already posted
|
209
|
|
—
|
|
23
|
|
—
|
|
23
|
|
186
|
|
|||||||||||
|
Additional cash collateral or letters of credit in the event credit-risk-related contingent features were triggered
|
407
|
|
19
|
|
347
|
|
131
|
|
216
|
|
41
|
|
|||||||||||
(a) Duke Energy Ohio includes amounts related to the Disposal Group for the year ended December 31, 2014.
The Duke Energy Registrants have elected to offset cash collateral and fair values of derivatives. For amounts to be netted, the derivative must be executed with the same counterparty under the same master netting arrangement. Amounts disclosed below represent the receivables related to the right to reclaim cash collateral under master netting arrangements.
|
December 31, 2015
|
December 31, 2014
|
||||||
|
(in millions)
|
Receivables
|
Receivables
|
|||||
|
Duke Energy
|
|||||||
|
Amounts offset against net derivative positions
|
$
|
30
|
|
$
|
145
|
|
|
|
Amounts not offset against net derivative positions
|
—
|
|
64
|
|
|||
|
Progress Energy
|
|||||||
|
Amounts offset against net derivative positions
|
30
|
|
23
|
|
|||
|
Duke Energy Florida
|
|||||||
|
Amounts offset against net derivative positions
|
30
|
|
23
|
|
|||
|
Duke Energy Ohio
|
|||||||
|
Amounts offset against net derivative positions
|
—
|
|
122
|
|
|||
|
Amounts not offset against net derivative positions
|
—
|
|
64
|
|
|||
15. INVESTMENTS IN DEBT AND EQUITY SECURITIES
AVAILABLE-FOR-SALE SECURITIES
The Duke Energy Registrants classify their investments in debt and equity securities as available-for-sale.
Duke Energy’s available-for-sale securities are primarily comprised of investments held in (i) the NDTF at Duke Energy Carolinas, Duke Energy Progress and Duke Energy Florida, (ii) grantor trusts at Duke Energy Progress, Duke Energy Florida and Duke Energy Indiana related to OPEB plans, (iii) Duke Energy’s captive insurance investment portfolio, and (iv) Duke Energy’s foreign operations investment portfolio.
Duke Energy classifies all other investments in debt and equity securities as long-term, unless otherwise noted.
179
PART II
DUKE ENERGY CORPORATION - DUKE ENERGY CAROLINAS, LLC - PROGRESS ENERGY, INC. –
DUKE ENERGY PROGRESS, LLC – DUKE ENERGY FLORIDA, LLC - DUKE ENERGY OHIO, INC. - DUKE ENERGY INDIANA, INC.
Combined Notes To Consolidated Financial Statements – (Continued)
Investment Trusts
The investments within the NDTF investments and the Duke Energy Progress, Duke Energy Florida and Duke Energy Indiana grantor trusts (Investment Trusts) are managed by independent investment managers with discretion to buy, sell, and invest pursuant to the objectives set forth by the trust agreements. The Duke Energy Registrants have limited oversight of the day-to-day management of these investments. As a result, the ability to hold investments in unrealized loss positions is outside the control of the Duke Energy Registrants. Accordingly, all unrealized losses associated with debt and equity securities within the Investment Trusts are considered other-than-temporary impairments and are recognized immediately.
Investments within the Investment Trusts generally qualify for regulatory accounting, and accordingly realized and unrealized gains and losses are deferred as a regulatory asset or liability. Certain investments held in Duke Energy Florida's NDTF were acquired in a settlement with FMJO and do not qualify for regulatory accounting. Unrealized gains and losses on these assets are included in other comprehensive income until realized, unless it is determined the carrying value of an investment is other-than-temporarily impaired, and realized gains and losses are included within Other income and expense, net on the Consolidated Statements of Operations. The value of these assets have not materially changed since the assets were acquired from FMJO. As a result, there is no material impact on earnings of the Duke Energy Registrants.
Other Available-for-Sale Securities
Unrealized gains and losses on all other available-for-sale securities are included in other comprehensive income until realized, unless it is determined the carrying value of an investment is other-than-temporarily impaired. If an other-than-temporary impairment exists, the unrealized loss is included in earnings based on the criteria discussed below.
The Duke Energy Registrants analyze all investment holdings each reporting period to determine whether a decline in fair value should be considered other-than-temporary. Criteria used to evaluate whether an impairment associated with equity securities is other-than-temporary includes, but is not limited to, (i) the length of time over which the market value has been lower than the cost basis of the investment, (ii) the percentage decline compared to the cost of the investment, and (iii) management’s intent and ability to retain its investment for a period of time sufficient to allow for any anticipated recovery in market value. If a decline in fair value is determined to be other-than-temporary, the investment is written down to its fair value through a charge to earnings.
If the entity does not have an intent to sell a debt security and it is not more likely than not management will be required to sell the debt security before the recovery of its cost basis, the impairment write-down to fair value would be recorded as a component of other comprehensive income, except for when it is determined a credit loss exists. In determining whether a credit loss exists, management considers, among other things, (i) the length of time and the extent to which the fair value has been less than the amortized cost basis, (ii) changes in the financial condition of the issuer of the security, or in the case of an asset backed security, the financial condition of the underlying loan obligors, (iii) consideration of underlying collateral and guarantees of amounts by government entities, (iv) ability of the issuer of the security to make scheduled interest or principal payments, and (v) any changes to the rating of the security by rating agencies. If a credit loss exists, the amount of impairment write-down to fair value is split between credit loss and other factors. The amount related to credit loss is recognized in earnings. The amount related to other factors is recognized in other comprehensive income. There were no credit losses as of
December 31, 2015
and
2014
.
180
PART II
DUKE ENERGY CORPORATION - DUKE ENERGY CAROLINAS, LLC - PROGRESS ENERGY, INC. –
DUKE ENERGY PROGRESS, LLC – DUKE ENERGY FLORIDA, LLC - DUKE ENERGY OHIO, INC. - DUKE ENERGY INDIANA, INC.
Combined Notes To Consolidated Financial Statements – (Continued)
DUKE ENERGY
The following table presents the estimated fair value of investments in available-for-sale securities.
|
December 31, 2015
|
December 31, 2014
|
||||||||||||||||||||||
|
Gross
|
|
Gross
|
|
Gross
|
|
Gross
|
|
||||||||||||||||
|
Unrealized
|
|
Unrealized
|
|
Unrealized
|
|
Unrealized
|
|
||||||||||||||||
|
Holding
|
|
Holding
|
|
Estimated
|
|
Holding
|
|
Holding
|
|
Estimated
|
|
||||||||||||
|
(in millions)
|
Gains
|
|
Losses
(b)
|
|
Fair Value
|
|
Gains
|
|
Losses
(b)
|
|
Fair Value
|
|
|||||||||||
|
NDTF
|
|
|
|
|
|
|
|
||||||||||||||||
|
Cash and cash equivalents
|
$
|
—
|
|
$
|
—
|
|
$
|
179
|
|
$
|
—
|
|
$
|
—
|
|
$
|
136
|
|
|||||
|
Equity securities
|
1,823
|
|
58
|
|
3,590
|
|
1,926
|
|
29
|
|
3,650
|
|
|||||||||||
|
Corporate debt securities
|
7
|
|
8
|
|
432
|
|
14
|
|
2
|
|
454
|
|
|||||||||||
|
Municipal bonds
|
5
|
|
1
|
|
185
|
|
5
|
|
—
|
|
184
|
|
|||||||||||
|
U.S. government bonds
|
11
|
|
5
|
|
1,254
|
|
19
|
|
2
|
|
978
|
|
|||||||||||
|
Other debt securities
|
—
|
|
4
|
|
177
|
|
1
|
|
2
|
|
147
|
|
|||||||||||
|
Total NDTF
(c)
|
$
|
1,846
|
|
$
|
76
|
|
$
|
5,817
|
|
$
|
1,965
|
|
$
|
35
|
|
$
|
5,549
|
|
|||||
|
Other Investments
|
|
|
|
|
|
|
|
|
|
|
|
|
|||||||||||
|
Cash and cash equivalents
|
$
|
—
|
|
$
|
—
|
|
$
|
29
|
|
$
|
—
|
|
$
|
—
|
|
$
|
15
|
|
|||||
|
Equity securities
|
32
|
|
1
|
|
95
|
|
34
|
|
—
|
|
96
|
|
|||||||||||
|
Corporate debt securities
|
1
|
|
3
|
|
92
|
|
1
|
|
1
|
|
58
|
|
|||||||||||
|
Municipal bonds
|
3
|
|
1
|
|
74
|
|
3
|
|
1
|
|
76
|
|
|||||||||||
|
U.S. government bonds
|
—
|
|
—
|
|
45
|
|
—
|
|
—
|
|
27
|
|
|||||||||||
|
Other debt securities
|
—
|
|
2
|
|
62
|
|
1
|
|
1
|
|
80
|
|
|||||||||||
|
Total Other Investments
(a)
|
$
|
36
|
|
$
|
7
|
|
$
|
397
|
|
$
|
39
|
|
$
|
3
|
|
$
|
352
|
|
|||||
|
Total Investments
|
$
|
1,882
|
|
$
|
83
|
|
$
|
6,214
|
|
$
|
2,004
|
|
$
|
38
|
|
$
|
5,901
|
|
|||||
(a) These amounts are recorded in Other within Investments and Other Assets on the Consolidated Balance Sheets.
|
(b)
|
Substantially all these amounts are considered other-than-temporary impairments on investments within Investment Trusts that have been recognized immediately as a regulatory asset.
|
|
(c)
|
The increase in estimated fair value of the NDTF as of
December 31, 2015
, is primarily due to NDTF assets acquired with the purchase of NCEMPA's ownership interest in certain generating assets and the NDTF assets acquired in a settlement with FMJO. This is partially offset due to reimbursements from the NDTF for Duke Energy Florida's costs related to ongoing decommissioning activity of the Crystal River Unit 3 Nuclear Plant. Refer to Note
2
for further information.
|
The table below summarizes the maturity date for debt securities.
|
(in millions)
|
December 31, 2015
|
|
|
Due in one year or less
|
120
|
|
|
Due after one through five years
|
775
|
|
|
Due after five through 10 years
|
598
|
|
|
Due after 10 years
|
828
|
|
|
Total
|
2,321
|
|
Realized gains and losses, which were determined on a specific identification basis, from sales of available-for-sale securities were as follows.
|
Years Ended December 31,
|
|||||||||||
|
(in millions)
|
2015
|
|
2014
|
|
2013
|
|
|||||
|
Realized gains
|
$
|
193
|
|
$
|
271
|
|
$
|
209
|
|
||
|
Realized losses
|
98
|
|
105
|
|
65
|
|
|||||
181
PART II
DUKE ENERGY CORPORATION - DUKE ENERGY CAROLINAS, LLC - PROGRESS ENERGY, INC. –
DUKE ENERGY PROGRESS, LLC – DUKE ENERGY FLORIDA, LLC - DUKE ENERGY OHIO, INC. - DUKE ENERGY INDIANA, INC.
Combined Notes To Consolidated Financial Statements – (Continued)
DUKE ENERGY CAROLINAS
The following table presents the estimated fair value of investments in available-for-sale securities.
|
|
December 31, 2015
|
|
December 31, 2014
|
||||||||||||||||||||
|
Gross
|
|
Gross
|
|
Gross
|
|
Gross
|
|
||||||||||||||||
|
Unrealized
|
|
Unrealized
|
|
Unrealized
|
|
Unrealized
|
|
||||||||||||||||
|
Holding
|
|
Holding
|
|
Estimated
|
|
Holding
|
|
Holding
|
|
Estimated
|
|
||||||||||||
|
(in millions)
|
Gains
|
|
Losses
(b)
|
|
Fair Value
|
|
Gains
|
|
Losses
(b)
|
|
Fair Value
|
|
|||||||||||
|
NDTF
|
|
|
|
|
|
|
|
||||||||||||||||
|
Cash and cash equivalents
|
$
|
—
|
|
$
|
—
|
|
$
|
34
|
|
$
|
—
|
|
$
|
—
|
|
$
|
51
|
|
|||||
|
Equity securities
|
1,021
|
|
27
|
|
2,094
|
|
1,102
|
|
17
|
|
2,162
|
|
|||||||||||
|
Corporate debt securities
|
3
|
|
5
|
|
292
|
|
8
|
|
2
|
|
316
|
|
|||||||||||
|
Municipal bonds
|
1
|
|
—
|
|
33
|
|
1
|
|
—
|
|
62
|
|
|||||||||||
|
U.S. government bonds
|
3
|
|
3
|
|
438
|
|
7
|
|
1
|
|
308
|
|
|||||||||||
|
Other debt securities
|
—
|
|
4
|
|
147
|
|
1
|
|
2
|
|
133
|
|
|||||||||||
|
Total NDTF
|
$
|
1,028
|
|
$
|
39
|
|
$
|
3,038
|
|
$
|
1,119
|
|
$
|
22
|
|
$
|
3,032
|
|
|||||
|
Other Investments
|
|
|
|
|
|
|
|
|
|
|
|
|
|||||||||||
|
Other debt securities
|
$
|
—
|
|
$
|
1
|
|
$
|
3
|
|
$
|
—
|
|
$
|
1
|
|
$
|
3
|
|
|||||
|
Total Other Investments
(a)
|
$
|
—
|
|
$
|
1
|
|
$
|
3
|
|
$
|
—
|
|
$
|
1
|
|
$
|
3
|
|
|||||
|
Total Investments
|
$
|
1,028
|
|
$
|
40
|
|
$
|
3,041
|
|
$
|
1,119
|
|
$
|
23
|
|
$
|
3,035
|
|
|||||
(a) These amounts are recorded in Other within Investments and Other Assets on the Consolidated Balance Sheets.
|
(b)
|
Substantially all these amounts represent other-than-temporary impairments on investments within Investment Trusts that have been recognized immediately as a regulatory asset.
|
The table below summarizes the maturity date for debt securities.
|
(in millions)
|
December 31, 2015
|
|
|
|
Due in one year or less
|
$
|
13
|
|
|
Due after one through five years
|
187
|
|
|
|
Due after five through 10 years
|
275
|
|
|
|
Due after 10 years
|
438
|
|
|
|
Total
|
$
|
913
|
|
Realized gains and losses, which were determined on a specific identification basis, from sales of available-for-sale securities were as follows.
|
Years Ended December 31,
|
|||||||||||
|
(in millions)
|
2015
|
|
2014
|
|
2013
|
|
|||||
|
Realized gains
|
$
|
158
|
|
$
|
109
|
|
$
|
115
|
|
||
|
Realized losses
|
83
|
|
93
|
|
12
|
|
|||||
182
PART II
DUKE ENERGY CORPORATION - DUKE ENERGY CAROLINAS, LLC - PROGRESS ENERGY, INC. –
DUKE ENERGY PROGRESS, LLC – DUKE ENERGY FLORIDA, LLC - DUKE ENERGY OHIO, INC. - DUKE ENERGY INDIANA, INC.
Combined Notes To Consolidated Financial Statements – (Continued)
PROGRESS ENERGY
The following table presents the estimated fair value of investments in available-for-sale securities.
|
December 31, 2015
|
December 31, 2014
|
||||||||||||||||||||||
|
Gross
|
|
Gross
|
|
Gross
|
|
Gross
|
|
||||||||||||||||
|
Unrealized
|
|
Unrealized
|
|
Unrealized
|
|
Unrealized
|
|
||||||||||||||||
|
Holding
|
|
Holding
|
|
Estimated
|
|
Holding
|
|
Holding
|
|
Estimated
|
|
||||||||||||
|
(in millions)
|
Gains
|
|
Losses
(b)
|
|
Fair Value
|
|
Gains
|
|
Losses
(b)
|
|
Fair Value
|
|
|||||||||||
|
NDTF
|
|
|
|
|
|
|
|||||||||||||||||
|
Cash and cash equivalents
|
$
|
—
|
|
$
|
—
|
|
$
|
145
|
|
$
|
—
|
|
$
|
—
|
|
$
|
85
|
|
|||||
|
Equity securities
|
802
|
|
31
|
|
1,496
|
|
824
|
|
12
|
|
1,488
|
|
|||||||||||
|
Corporate debt securities
|
4
|
|
3
|
|
140
|
|
6
|
|
—
|
|
138
|
|
|||||||||||
|
Municipal bonds
|
4
|
|
1
|
|
152
|
|
4
|
|
—
|
|
122
|
|
|||||||||||
|
U.S. government bonds
|
8
|
|
2
|
|
816
|
|
12
|
|
1
|
|
670
|
|
|||||||||||
|
Other debt securities
|
—
|
|
—
|
|
30
|
|
—
|
|
—
|
|
14
|
|
|||||||||||
|
Total NDTF
(c)
|
$
|
818
|
|
$
|
37
|
|
$
|
2,779
|
|
$
|
846
|
|
$
|
13
|
|
$
|
2,517
|
|
|||||
|
Other Investments
|
|
|
|
|
|
|
|
|
|
|
|
|
|||||||||||
|
Cash and cash equivalents
|
$
|
—
|
|
$
|
—
|
|
$
|
18
|
|
$
|
—
|
|
$
|
—
|
|
$
|
15
|
|
|||||
|
Municipal bonds
|
3
|
|
—
|
|
45
|
|
3
|
|
—
|
|
43
|
|
|||||||||||
|
Total Other Investments
(a)
|
$
|
3
|
|
$
|
—
|
|
$
|
63
|
|
$
|
3
|
|
$
|
—
|
|
$
|
58
|
|
|||||
|
Total Investments
|
$
|
821
|
|
$
|
37
|
|
$
|
2,842
|
|
$
|
849
|
|
$
|
13
|
|
$
|
2,575
|
|
|||||
(a) These amounts are recorded in Other within Investments and Other Assets on the Consolidated Balance Sheets.
|
(b)
|
Substantially all these amounts are considered other-than-temporary impairments on investments within Investment Trusts that have been recognized immediately as a regulatory asset.
|
|
(c)
|
The increase in estimated fair value of the NDTF as of
December 31, 2015
, is primarily due to NDTF assets acquired with the purchase of NCEMPA's ownership interest in certain generating assets and the NDTF assets acquired in a settlement with FMJO. This is partially offset due to reimbursements from the NDTF for Duke Energy Florida's costs related to ongoing decommissioning activity of the Crystal River Unit 3 Nuclear Plant. Refer to Note
2
for further information.
|
The table below summarizes the maturity date for debt securities.
|
(in millions)
|
December 31, 2015
|
|
|
|
Due in one year or less
|
$
|
94
|
|
|
Due after one through five years
|
496
|
|
|
|
Due after five through 10 years
|
254
|
|
|
|
Due after 10 years
|
339
|
|
|
|
Total
|
$
|
1,183
|
|
Realized gains and losses, which were determined on a specific identification basis, from sales of available-for-sale securities were as follows.
|
|
Years Ended December 31,
|
||||||||||
|
(in millions)
|
2015
|
|
2014
|
|
2013
|
|
|||||
|
Realized gains
|
$
|
33
|
|
$
|
157
|
|
$
|
90
|
|
||
|
Realized losses
|
13
|
|
11
|
|
46
|
|
|||||
183
PART II
DUKE ENERGY CORPORATION - DUKE ENERGY CAROLINAS, LLC - PROGRESS ENERGY, INC. –
DUKE ENERGY PROGRESS, LLC – DUKE ENERGY FLORIDA, LLC - DUKE ENERGY OHIO, INC. - DUKE ENERGY INDIANA, INC.
Combined Notes To Consolidated Financial Statements – (Continued)
DUKE ENERGY PROGRESS
The following table presents the estimated fair value of investments in available-for-sale securities.
|
|
December 31, 2015
|
December 31, 2014
|
|||||||||||||||||||||
|
Gross
|
|
Gross
|
|
Gross
|
|
Gross
|
|
||||||||||||||||
|
Unrealized
|
|
Unrealized
|
|
Unrealized
|
|
Unrealized
|
|
||||||||||||||||
|
Holding
|
|
Holding
|
|
Estimated
|
|
Holding
|
|
Holding
|
|
Estimated
|
|
||||||||||||
|
(in millions)
|
Gains
|
|
Losses
(b)
|
|
Fair Value
|
|
Gains
|
|
Losses
(b)
|
|
Fair Value
|
|
|||||||||||
|
NDTF
|
|
|
|
|
|
|
|||||||||||||||||
|
Cash and cash equivalents
|
$
|
—
|
|
$
|
—
|
|
$
|
110
|
|
$
|
—
|
|
$
|
—
|
|
$
|
50
|
|
|||||
|
Equity securities
|
596
|
|
25
|
|
1,178
|
|
612
|
|
10
|
|
1,171
|
|
|||||||||||
|
Corporate debt securities
|
3
|
|
2
|
|
96
|
|
5
|
|
—
|
|
97
|
|
|||||||||||
|
Municipal bonds
|
4
|
|
1
|
|
150
|
|
4
|
|
—
|
|
120
|
|
|||||||||||
|
U.S. government bonds
|
6
|
|
2
|
|
486
|
|
9
|
|
1
|
|
265
|
|
|||||||||||
|
Other debt securities
|
—
|
|
—
|
|
18
|
|
—
|
|
—
|
|
8
|
|
|||||||||||
|
Total NDTF
(c)
|
$
|
609
|
|
$
|
30
|
|
$
|
2,038
|
|
$
|
630
|
|
$
|
11
|
|
$
|
1,711
|
|
|||||
|
Other Investments
|
|
|
|
|
|
|
|
|
|
|
|
|
|||||||||||
|
Cash and cash equivalents
|
$
|
—
|
|
$
|
—
|
|
$
|
1
|
|
$
|
—
|
|
$
|
—
|
|
$
|
—
|
|
|||||
|
Total Other Investments
(a)
|
$
|
—
|
|
$
|
—
|
|
$
|
1
|
|
$
|
—
|
|
$
|
—
|
|
$
|
—
|
|
|||||
|
Total Investments
|
$
|
609
|
|
$
|
30
|
|
$
|
2,039
|
|
$
|
630
|
|
$
|
11
|
|
$
|
1,711
|
|
|||||
(a) These amounts are recorded in Other with Investments and Other Assets on the Consolidated Balance Sheets.
|
(b)
|
Substantially all these amounts represent other-than-temporary impairments on investments within Investment Trusts that have been recognized immediately as a regulatory asset.
|
|
(c)
|
As of
December 31, 2015
, the estimated fair value of the NDTF includes NDTF assets acquired with the purchase of NCEMPA's ownership interest in certain generating assets. Refer to Note
2
for further information.
|
The table below summarizes the maturity date for debt securities.
|
(in millions)
|
December 31, 2015
|
|
|
|
Due in one year or less
|
$
|
15
|
|
|
Due after one through five years
|
285
|
|
|
|
Due after five through 10 years
|
206
|
|
|
|
Due after 10 years
|
244
|
|
|
|
Total
|
$
|
750
|
|
Realized gains and losses, which were determined on a specific identification basis, from sales of available-for-sale securities were as follows.
|
|
Years Ended December 31,
|
||||||||||
|
(in millions)
|
2015
|
|
2014
|
|
2013
|
|
|||||
|
Realized gains
|
$
|
26
|
|
$
|
19
|
|
$
|
58
|
|
||
|
Realized losses
|
11
|
|
5
|
|
26
|
|
|||||
184
PART II
DUKE ENERGY CORPORATION - DUKE ENERGY CAROLINAS, LLC - PROGRESS ENERGY, INC. –
DUKE ENERGY PROGRESS, LLC – DUKE ENERGY FLORIDA, LLC - DUKE ENERGY OHIO, INC. - DUKE ENERGY INDIANA, INC.
Combined Notes To Consolidated Financial Statements – (Continued)
DUKE ENERGY FLORIDA
The following table presents the estimated fair value of investments in available-for-sale securities.
|
|
December 31, 2015
|
December 31, 2014
|
|||||||||||||||||||||
|
Gross
|
|
Gross
|
|
Gross
|
|
Gross
|
|
||||||||||||||||
|
Unrealized
|
|
Unrealized
|
|
Unrealized
|
|
Unrealized
|
|
||||||||||||||||
|
Holding
|
|
Holding
|
|
Estimated
|
|
Holding
|
|
Holding
|
|
Estimated
|
|
||||||||||||
|
(in millions)
|
Gains
|
|
Losses
(b)
|
|
Fair Value
|
|
Gains
|
|
Losses
(b)
|
|
Fair Value
|
|
|||||||||||
|
NDTF
|
|
|
|
|
|
|
|||||||||||||||||
|
Cash and cash equivalents
|
$
|
—
|
|
$
|
—
|
|
$
|
35
|
|
$
|
—
|
|
$
|
—
|
|
$
|
35
|
|
|||||
|
Equity securities
|
206
|
|
6
|
|
318
|
|
212
|
|
2
|
|
317
|
|
|||||||||||
|
Corporate debt securities
|
1
|
|
1
|
|
44
|
|
1
|
|
—
|
|
41
|
|
|||||||||||
|
Municipal bonds
|
—
|
|
—
|
|
2
|
|
—
|
|
—
|
|
2
|
|
|||||||||||
|
U.S. government bonds
|
2
|
|
—
|
|
330
|
|
3
|
|
—
|
|
405
|
|
|||||||||||
|
Other debt securities
|
—
|
|
—
|
|
12
|
|
—
|
|
—
|
|
6
|
|
|||||||||||
|
Total NDTF
(c)
|
$
|
209
|
|
$
|
7
|
|
$
|
741
|
|
$
|
216
|
|
$
|
2
|
|
$
|
806
|
|
|||||
|
Other Investments
|
|
|
|
|
|
|
|
|
|
|
|
|
|||||||||||
|
Cash and cash equivalents
|
$
|
—
|
|
$
|
—
|
|
$
|
6
|
|
$
|
—
|
|
$
|
—
|
|
$
|
1
|
|
|||||
|
Municipal bonds
|
3
|
|
—
|
|
45
|
|
3
|
|
—
|
|
43
|
|
|||||||||||
|
Total Other Investments
(a)
|
$
|
3
|
|
$
|
—
|
|
$
|
51
|
|
$
|
3
|
|
$
|
—
|
|
$
|
44
|
|
|||||
|
Total Investments
|
$
|
212
|
|
$
|
7
|
|
$
|
792
|
|
$
|
219
|
|
$
|
2
|
|
$
|
850
|
|
|||||
(a) These amounts are recorded in Other with Investments and Other Assets on the Consolidated Balance Sheets.
|
(b)
|
Substantially all these amounts represent other-than-temporary impairments on investments within Investment Trusts that have been recognized immediately as a regulatory asset.
|
|
(c)
|
The decrease in estimated fair value of the NDTF as of
December 31, 2015
, is primarily due to reimbursements from the NDTF for costs related to ongoing decommissioning activity of the Crystal River Unit 3 Nuclear Plant, partially offset by the NDTF asset acquired in a settlement with FMJO. Refer to Note
2
for further information.
|
The table below summarizes the maturity date for debt securities.
|
(in millions)
|
December 31, 2015
|
|
|
|
Due in one year or less
|
$
|
79
|
|
|
Due after one through five years
|
211
|
|
|
|
Due after five through 10 years
|
48
|
|
|
|
Due after 10 years
|
95
|
|
|
|
Total
|
$
|
433
|
|
Realized gains and losses, which were determined on a specific identification basis, from sales of available-for-sale securities were as follows.
|
Years Ended December 31,
|
|||||||||||
|
(in millions)
|
2015
|
|
2014
|
|
2013
|
|
|||||
|
Realized gains
|
$
|
7
|
|
$
|
138
|
|
$
|
32
|
|
||
|
Realized losses
|
2
|
|
5
|
|
20
|
|
|||||
185
PART II
DUKE ENERGY CORPORATION - DUKE ENERGY CAROLINAS, LLC - PROGRESS ENERGY, INC. –
DUKE ENERGY PROGRESS, LLC – DUKE ENERGY FLORIDA, LLC - DUKE ENERGY OHIO, INC. - DUKE ENERGY INDIANA, INC.
Combined Notes To Consolidated Financial Statements – (Continued)
DUKE ENERGY INDIANA
The following table presents the estimated fair value of investments in available-for-sale securities.
|
|
December 31, 2015
|
December 31, 2014
|
|||||||||||||||||||||
|
Gross
|
|
Gross
|
|
Gross
|
|
Gross
|
|
||||||||||||||||
|
Unrealized
|
|
Unrealized
|
|
Unrealized
|
|
Unrealized
|
|
||||||||||||||||
|
Holding
|
|
Holding
|
|
Estimated
|
|
Holding
|
|
Holding
|
|
Estimated
|
|
||||||||||||
|
(in millions)
|
Gains
|
|
Losses
(b)
|
|
Fair Value
|
|
Gains
|
|
Losses
(b)
|
|
Fair Value
|
|
|||||||||||
|
Other Investments
|
|
|
|
|
|
|
|||||||||||||||||
|
Cash and cash equivalents
|
$
|
—
|
|
$
|
—
|
|
$
|
2
|
|
$
|
—
|
|
$
|
—
|
|
$
|
—
|
|
|||||
|
Equity securities
|
27
|
|
—
|
|
71
|
|
28
|
|
—
|
|
71
|
|
|||||||||||
|
Corporate debt securities
|
—
|
|
—
|
|
2
|
|
—
|
|
—
|
|
—
|
|
|||||||||||
|
Municipal bonds
|
—
|
|
1
|
|
26
|
|
—
|
|
1
|
|
30
|
|
|||||||||||
|
Total Other Investments
(a)
|
$
|
27
|
|
$
|
1
|
|
$
|
101
|
|
$
|
28
|
|
$
|
1
|
|
$
|
101
|
|
|||||
|
Total Investments
|
$
|
27
|
|
$
|
1
|
|
$
|
101
|
|
$
|
28
|
|
$
|
1
|
|
$
|
101
|
|
|||||
(a) These amounts are recorded in Other within Investments and Other Assets on the Consolidated Balance Sheets.
|
(b)
|
Substantially all these amounts represent other-than-temporary impairments on investments within Investment Trusts that have been recognized immediately as a regulatory asset.
|
The table below summarizes the maturity date for debt securities.
|
(in millions)
|
December 31, 2015
|
|
|
|
Due in one year or less
|
$
|
2
|
|
|
Due after one through five years
|
14
|
|
|
|
Due after five through 10 years
|
9
|
|
|
|
Due after 10 years
|
3
|
|
|
|
Total
|
$
|
28
|
|
Realized gains and losses, which were determined on a specific identification basis, from sales of available-for-sale securities were insignificant for the years ended
December 31, 2015
,
2014
and
2013
.
16. FAIR VALUE MEASUREMENTS
Fair value is the exchange price to sell an asset or transfer a liability in an orderly transaction between market participants at the measurement date. The fair value definition focuses on an exit price versus the acquisition cost. Fair value measurements use market data or assumptions market participants would use in pricing the asset or liability, including assumptions about risk and the risks inherent in the inputs to the valuation technique. These inputs may be readily observable, corroborated by market data, or generally unobservable. Valuation techniques maximize the use of observable inputs and minimize use of unobservable inputs. A midmarket pricing convention (the midpoint price between bid and ask prices) is permitted for use as a practical expedient.
Fair value measurements are classified in three levels based on the fair value hierarchy:
Level 1
– Unadjusted quoted prices in active markets for identical assets or liabilities that the reporting entity can access at the measurement date. An active market is one in which transactions for an asset or liability occur with sufficient frequency and volume to provide ongoing pricing information.
Level 2
– A fair value measurement utilizing inputs other than quoted prices included in Level 1 that are observable, either directly or indirectly, for an asset or liability. Inputs include (i) quoted prices for similar assets or liabilities in active markets, (ii) quoted prices for identical or similar assets or liabilities in markets that are not active, (iii) and inputs other than quoted market prices that are observable for the asset or liability, such as interest rate curves and yield curves observable at commonly quoted intervals, volatilities and credit spreads. A Level 2 measurement cannot have more than an insignificant portion of its valuation based on unobservable inputs. Instruments in this category include non-exchange-traded derivatives, such as over-the-counter forwards, swaps and options; certain marketable debt securities; and financial instruments traded in less than active markets.
Level 3
– Any fair value measurement which includes unobservable inputs for more than an insignificant portion of the valuation. These inputs may be used with internally developed methodologies that result in management’s best estimate of fair value. Level 3 measurements may include longer-term instruments that extend into periods in which observable inputs are not available.
Not Categorized
– As discussed in Note 1, certain investments are not categorized within the Fair Value hierarchy. These investments are measured based on the fair value of the underlying investments but may not be readily redeemable at that fair value.
Fair value accounting guidance permits entities to elect to measure certain financial instruments that are not required to be accounted for at fair value, such as equity method investments or the company’s own debt, at fair value. The Duke Energy Registrants have not elected to record any of these items at fair value.
186
PART II
DUKE ENERGY CORPORATION - DUKE ENERGY CAROLINAS, LLC - PROGRESS ENERGY, INC. –
DUKE ENERGY PROGRESS, LLC – DUKE ENERGY FLORIDA, LLC - DUKE ENERGY OHIO, INC. - DUKE ENERGY INDIANA, INC.
Combined Notes To Consolidated Financial Statements – (Continued)
Transfers between levels represent assets or liabilities that were previously (i) categorized at a higher level for which the inputs to the estimate became less observable or (ii) classified at a lower level for which the inputs became more observable during the period. The Duke Energy Registrant’s policy is to recognize transfers between levels of the fair value hierarchy at the end of the period. There were no transfers between Levels 1 and 2 during the years ended
December 31, 2015
,
2014
and
2013
. Transfers out of Level 3 during the year ended December 31, 2014, were the result of forward commodity prices becoming observable due to the passage of time.
Valuation methods of the primary fair value measurements disclosed below are as follows.
Investments in equity securities
The majority of investments in equity securities are valued using Level 1 measurements. Investments in equity securities are typically valued at the closing price in the principal active market as of the last business day of the quarter. Principal active markets for equity prices include published exchanges such as NASDAQ and New York Stock Exchange (NYSE). Foreign equity prices are translated from their trading currency using the currency exchange rate in effect at the close of the principal active market. There was no after-hours market activity that was required to be reflected in the reported fair value measurements.
Investments in debt securities
Most investments in debt securities are valued using Level 2 measurements because the valuations use interest rate curves and credit spreads applied to the terms of the debt instrument (maturity and coupon interest rate) and consider the counterparty credit rating. If the market for a particular fixed income security is relatively inactive or illiquid, the measurement is Level 3.
Commodity derivatives
Commodity derivatives with clearinghouses are classified as Level 1. Other commodity derivatives are primarily valued using internally developed discounted cash flow models which incorporate forward price, adjustments for liquidity (bid-ask spread) and credit or non-performance risk (after reflecting credit enhancements such as collateral), and are discounted to present value. Pricing inputs are derived from published exchange transaction prices and other observable data sources. In the absence of an active market, the last available price may be used. If forward price curves are not observable for the full term of the contract and the unobservable period had more than an insignificant impact on the valuation, the commodity derivative is classified as Level 3. In isolation, increases (decreases) in natural gas forward prices result in favorable (unfavorable) fair value adjustments for gas purchase contracts; and increases (decreases) in electricity forward prices result in unfavorable (favorable) fair value adjustments for electricity sales contracts. Duke Energy regularly evaluates and validates pricing inputs used to estimate the fair value of gas commodity contracts by a market participant price verification procedure. This procedure provides a comparison of internal forward commodity curves to market participant generated curves.
Interest rate derivatives
Most over-the-counter interest rate contract derivatives are valued using financial models which utilize observable inputs for similar instruments and are classified as Level 2. Inputs include forward interest rate curves, notional amounts, interest rates and credit quality of the counterparties.
Goodwill and Long-Lived Assets and Assets Held for Sale
See Note
11
for a discussion of the valuation of goodwill and long-lived assets. See Note
2
related to the assets and related liabilities of the Disposal Group classified as held for sale, and the purchase of NCEMPA's ownership interests in certain generating assets.
DUKE ENERGY
The following tables provide recorded balances for assets and liabilities measured at fair value on a recurring basis on the Consolidated Balance Sheets. Derivative amounts in the table below exclude cash collateral which is disclosed in Note
14
. See Note
15
for additional information related to investments by major security type.
|
|
December 31, 2015
|
||||||||||||||
|
(in millions)
|
Total Fair Value
|
|
Level 1
|
|
Level 2
|
|
Level 3
|
|
Not categorized
|
|
|||||
|
Nuclear decommissioning trust fund equity securities
|
$
|
3,590
|
|
$
|
3,418
|
|
$
|
—
|
|
$
|
—
|
|
$
|
172
|
|
|
Nuclear decommissioning trust fund debt securities
|
2,227
|
|
672
|
|
1,555
|
|
—
|
|
|||||||
|
Other available-for-sale equity securities
|
95
|
|
95
|
|
—
|
|
—
|
|
—
|
|
|||||
|
Other available-for-sale debt securities
|
302
|
|
75
|
|
222
|
|
5
|
|
|||||||
|
Derivative assets
|
26
|
|
—
|
|
16
|
|
10
|
|
|||||||
|
Total assets
|
6,240
|
|
4,260
|
|
1,793
|
|
15
|
|
172
|
|
|||||
|
Derivative liabilities
|
(419
|
)
|
—
|
|
(419
|
)
|
—
|
|
|||||||
|
Net assets
|
$
|
5,821
|
|
$
|
4,260
|
|
$
|
1,374
|
|
$
|
15
|
|
$
|
172
|
|
187
PART II
DUKE ENERGY CORPORATION - DUKE ENERGY CAROLINAS, LLC - PROGRESS ENERGY, INC. –
DUKE ENERGY PROGRESS, LLC – DUKE ENERGY FLORIDA, LLC - DUKE ENERGY OHIO, INC. - DUKE ENERGY INDIANA, INC.
Combined Notes To Consolidated Financial Statements – (Continued)
|
|
December 31, 2014
|
||||||||||||||
|
(in millions)
|
Total Fair Value
|
|
Level 1
|
|
Level 2
|
|
Level 3
|
|
Not categorized
|
|
|||||
|
Nuclear decommissioning trust fund equity securities
|
$
|
3,650
|
|
$
|
3,493
|
|
$
|
6
|
|
$
|
—
|
|
$
|
151
|
|
|
Nuclear decommissioning trust fund debt securities
|
1,899
|
|
648
|
|
1,251
|
|
—
|
|
|||||||
|
Other trading and available-for-sale equity securities
|
96
|
|
96
|
|
—
|
|
—
|
|
—
|
|
|||||
|
Other trading and available-for-sale debt securities
|
263
|
|
41
|
|
217
|
|
5
|
|
|||||||
|
Derivative assets
|
110
|
|
49
|
|
24
|
|
37
|
|
|||||||
|
Total assets
|
6,018
|
|
4,327
|
|
1,498
|
|
42
|
|
151
|
|
|||||
|
Derivative liabilities
|
(668
|
)
|
(162
|
)
|
(468
|
)
|
(38
|
)
|
|||||||
|
Net assets
|
$
|
5,350
|
|
$
|
4,165
|
|
$
|
1,030
|
|
$
|
4
|
|
$
|
151
|
|
The following tables provide reconciliations of beginning and ending balances of assets and liabilities measured at fair value using Level 3 measurements. Amounts included in earnings for derivatives are primarily included in Operating Revenues.
|
|
December 31, 2015
|
||||||||||
|
Derivatives
|
|
||||||||||
|
(in millions)
|
Investments
|
|
(net)
|
|
Total
|
|
|||||
|
Balance at beginning of period
|
$
|
5
|
|
$
|
(1
|
)
|
$
|
4
|
|
||
|
Total pretax realized or unrealized gains (losses) included in earnings
|
—
|
|
21
|
|
21
|
|
|||||
|
Purchases, sales, issuances and settlements:
|
|
|
|||||||||
|
Purchases
|
—
|
|
24
|
|
24
|
|
|||||
|
Sales
|
—
|
|
(1
|
)
|
(1
|
)
|
|||||
|
Settlements
|
—
|
|
(37
|
)
|
(37
|
)
|
|||||
|
Total gains included on the Consolidated Balance Sheet as regulatory assets or liabilities
|
—
|
|
4
|
|
4
|
|
|||||
|
Balance at end of period
|
$
|
5
|
|
|
$
|
10
|
|
$
|
15
|
|
|
|
|
December 31, 2014
|
||||||||||
|
Derivatives
|
|
||||||||||
|
(in millions)
|
Investments
|
|
(net)
|
|
Total
|
|
|||||
|
Balance at beginning of period
|
$
|
20
|
|
$
|
13
|
|
$
|
33
|
|
||
|
Total pretax realized or unrealized gains (losses) included in earnings
|
—
|
|
(7
|
)
|
(7
|
)
|
|||||
|
Purchases, sales, issuances and settlements:
|
|
|
|||||||||
|
Purchases
|
—
|
|
50
|
|
50
|
|
|||||
|
Sales
|
(15
|
)
|
—
|
|
(15
|
)
|
|||||
|
Settlements
|
—
|
|
(54
|
)
|
(54
|
)
|
|||||
|
Net transfers In (Out) of Level 3 due to observability of inputs
|
—
|
|
6
|
|
6
|
|
|||||
|
Total losses included on the Consolidated Balance Sheet as regulatory assets or liabilities
|
—
|
|
(9
|
)
|
(9
|
)
|
|||||
|
Balance at end of period
|
$
|
5
|
|
$
|
(1
|
)
|
$
|
4
|
|
||
|
Pretax amounts included in the Consolidated Statements of Comprehensive Income related to Level 3 measurements outstanding
|
$
|
—
|
|
$
|
(14
|
)
|
$
|
(14
|
)
|
||
DUKE ENERGY CAROLINAS
The following tables provide recorded balances for assets and liabilities measured at fair value on a recurring basis on the Consolidated Balance Sheets. Derivative amounts in the table below exclude cash collateral, which is disclosed in Note
14
. See Note
15
for additional information related to investments by major security type.
|
|
December 31, 2015
|
||||||||||||||
|
(in millions)
|
Total Fair Value
|
|
Level 1
|
|
Level 2
|
|
Level 3
|
|
Not categorized
|
|
|||||
|
Nuclear decommissioning trust fund equity securities
|
$
|
2,094
|
|
$
|
1,922
|
|
$
|
—
|
|
$
|
—
|
|
$
|
172
|
|
|
Nuclear decommissioning trust fund debt securities
|
944
|
|
246
|
|
698
|
|
—
|
|
|||||||
|
Other available-for-sale debt securities
|
3
|
|
—
|
|
—
|
|
3
|
|
|||||||
|
Total assets
|
3,041
|
|
2,168
|
|
698
|
|
3
|
|
172
|
|
|||||
|
Derivative liabilities
|
(45
|
)
|
—
|
|
(45
|
)
|
—
|
|
|||||||
|
Net assets
|
$
|
2,996
|
|
$
|
2,168
|
|
$
|
653
|
|
$
|
3
|
|
$
|
172
|
|
188
PART II
DUKE ENERGY CORPORATION - DUKE ENERGY CAROLINAS, LLC - PROGRESS ENERGY, INC. –
DUKE ENERGY PROGRESS, LLC – DUKE ENERGY FLORIDA, LLC - DUKE ENERGY OHIO, INC. - DUKE ENERGY INDIANA, INC.
Combined Notes To Consolidated Financial Statements – (Continued)
|
|
December 31, 2014
|
||||||||||||||
|
(in millions)
|
Total Fair Value
|
|
Level 1
|
|
Level 2
|
|
Level 3
|
|
Not categorized
|
|
|||||
|
Nuclear decommissioning trust fund equity securities
|
$
|
2,162
|
|
$
|
2,005
|
|
$
|
6
|
|
$
|
—
|
|
$
|
151
|
|
|
Nuclear decommissioning trust fund debt securities
|
870
|
|
138
|
|
732
|
|
—
|
|
|||||||
|
Other trading and available-for-sale debt securities
|
3
|
|
—
|
|
—
|
|
3
|
|
|||||||
|
Total assets
|
3,035
|
|
2,143
|
|
738
|
|
3
|
|
151
|
|
|||||
|
Derivative liabilities
|
(19
|
)
|
—
|
|
(19
|
)
|
—
|
|
|||||||
|
Net assets
|
$
|
3,016
|
|
$
|
2,143
|
|
$
|
719
|
|
$
|
3
|
|
$
|
151
|
|
The following tables provide a reconciliation of beginning and ending balances of assets and liabilities measured at fair value using Level 3 measurements. There was no change to the Level 3 balance during the year ended December 31, 2015.
|
|
|
|
December 31, 2014
|
||||||||||
|
Derivatives
|
|
||||||||||
|
(in millions)
|
Investments
|
|
(net)
|
|
Total
|
|
|||||
|
Balance at beginning of period
|
$
|
3
|
|
$
|
(2
|
)
|
$
|
1
|
|
||
|
Settlements
|
—
|
|
2
|
|
2
|
|
|||||
|
Balance at end of period
|
$
|
3
|
|
$
|
—
|
|
$
|
3
|
|
||
PROGRESS ENERGY
The following tables provide recorded balances for assets and liabilities measured at fair value on a recurring basis on the Consolidated Balance Sheets. Derivative amounts in the table below exclude cash collateral, which is disclosed in Note
14
. See Note
15
for additional information related to investments by major security type.
|
|
December 31, 2015
|
|||||||||||
|
(in millions)
|
Total Fair Value
|
|
Level 1
|
|
Level 2
|
|
Level 3
|
|
||||
|
Nuclear decommissioning trust fund equity securities
|
$
|
1,496
|
|
$
|
1,496
|
|
$
|
—
|
|
$
|
—
|
|
|
Nuclear decommissioning trust fund debt securities
|
1,283
|
|
426
|
|
857
|
|
—
|
|
||||
|
Other available-for-sale debt securities
|
63
|
|
18
|
|
45
|
|
—
|
|
||||
|
Derivative assets
|
11
|
|
—
|
|
11
|
|
—
|
|
||||
|
Total assets
|
2,853
|
|
1,940
|
|
913
|
|
—
|
|
||||
|
Derivative liabilities
|
(322
|
)
|
—
|
|
(322
|
)
|
—
|
|
||||
|
Net assets
|
$
|
2,531
|
|
$
|
1,940
|
|
$
|
591
|
|
$
|
—
|
|
|
|
December 31, 2014
|
|||||||||||
|
(in millions)
|
Total Fair Value
|
|
Level 1
|
|
Level 2
|
|
Level 3
|
|
||||
|
Nuclear decommissioning trust fund equity securities
|
$
|
1,488
|
|
$
|
1,488
|
|
$
|
—
|
|
$
|
—
|
|
|
Nuclear decommissioning trust fund debt securities
|
1,029
|
|
510
|
|
519
|
|
—
|
|
||||
|
Other trading and available-for-sale debt securities
|
58
|
|
15
|
|
43
|
|
—
|
|
||||
|
Derivative assets
|
4
|
|
—
|
|
4
|
|
—
|
|
||||
|
Total assets
|
2,579
|
|
2,013
|
|
566
|
|
—
|
|
||||
|
Derivative liabilities
|
(373
|
)
|
—
|
|
(373
|
)
|
—
|
|
||||
|
Net assets
|
$
|
2,206
|
|
$
|
2,013
|
|
$
|
193
|
|
$
|
—
|
|
189
PART II
DUKE ENERGY CORPORATION - DUKE ENERGY CAROLINAS, LLC - PROGRESS ENERGY, INC. –
DUKE ENERGY PROGRESS, LLC – DUKE ENERGY FLORIDA, LLC - DUKE ENERGY OHIO, INC. - DUKE ENERGY INDIANA, INC.
Combined Notes To Consolidated Financial Statements – (Continued)
DUKE ENERGY PROGRESS
The following tables provide recorded balances for assets and liabilities measured at fair value on a recurring basis on the Consolidated Balance Sheets. Derivative amounts in the table below exclude cash collateral which is disclosed in Note
14
. See Note
15
for additional information related to investments by major security type.
|
|
December 31, 2015
|
|||||||||||
|
(in millions)
|
Total Fair Value
|
|
Level 1
|
|
Level 2
|
|
Level 3
|
|
||||
|
Nuclear decommissioning trust fund equity securities
|
$
|
1,178
|
|
$
|
1,178
|
|
$
|
—
|
|
$
|
—
|
|
|
Nuclear decommissioning trust fund debt securities and other
|
860
|
|
141
|
|
719
|
|
—
|
|
||||
|
Other available-for-sale debt securities and other
|
1
|
|
1
|
|
—
|
|
—
|
|
||||
|
Derivative assets
|
2
|
|
—
|
|
2
|
|
—
|
|
||||
|
Total assets
|
2,041
|
|
1,320
|
|
721
|
|
—
|
|
||||
|
Derivative liabilities
|
(98
|
)
|
—
|
|
(98
|
)
|
—
|
|
||||
|
Net assets
|
$
|
1,943
|
|
$
|
1,320
|
|
$
|
623
|
|
$
|
—
|
|
|
|
December 31, 2014
|
|||||||||||
|
(in millions)
|
Total Fair Value
|
|
Level 1
|
|
Level 2
|
|
Level 3
|
|
||||
|
Nuclear decommissioning trust fund equity securities
|
$
|
1,171
|
|
$
|
1,171
|
|
$
|
—
|
|
$
|
—
|
|
|
Nuclear decommissioning trust fund debt securities and other
|
540
|
|
151
|
|
389
|
|
—
|
|
||||
|
Total assets
|
1,711
|
|
1,322
|
|
389
|
|
—
|
|
||||
|
Derivative liabilities
|
(132
|
)
|
—
|
|
(132
|
)
|
—
|
|
||||
|
Net assets
|
$
|
1,579
|
|
$
|
1,322
|
|
$
|
257
|
|
$
|
—
|
|
DUKE ENERGY FLORIDA
The following tables provide recorded balances for assets and liabilities measured at fair value on a recurring basis on the Consolidated Balance Sheets. Derivative amounts in the table below exclude cash collateral which is disclosed in Note
14
. See Note
15
for additional information related to investments by major security type.
|
|
December 31, 2015
|
|||||||||||
|
(in millions)
|
Total Fair Value
|
|
Level 1
|
|
Level 2
|
|
Level 3
|
|
||||
|
Nuclear decommissioning trust fund equity securities
|
$
|
318
|
|
$
|
318
|
|
$
|
—
|
|
$
|
—
|
|
|
Nuclear decommissioning trust fund debt securities and other
|
423
|
|
285
|
|
138
|
|
—
|
|
||||
|
Other available-for-sale debt securities and other
|
51
|
|
6
|
|
45
|
|
—
|
|
||||
|
Derivative assets
|
7
|
|
—
|
|
7
|
|
—
|
|
||||
|
Total assets
|
799
|
|
609
|
|
190
|
|
—
|
|
||||
|
Derivative liabilities
|
(216
|
)
|
—
|
|
(216
|
)
|
—
|
|
||||
|
Net assets (liabilities)
|
$
|
583
|
|
$
|
609
|
|
$
|
(26
|
)
|
$
|
—
|
|
|
|
December 31, 2014
|
|||||||||||
|
(in millions)
|
Total Fair Value
|
|
Level 1
|
|
Level 2
|
|
Level 3
|
|
||||
|
Nuclear decommissioning trust fund equity securities
|
$
|
317
|
|
$
|
317
|
|
$
|
—
|
|
$
|
—
|
|
|
Nuclear decommissioning trust fund debt securities and other
|
489
|
|
359
|
|
130
|
|
—
|
|
||||
|
Other trading and available-for-sale debt securities and other
|
44
|
|
—
|
|
44
|
|
—
|
|
||||
|
Derivative assets
|
4
|
|
—
|
|
4
|
|
—
|
|
||||
|
Total assets
|
854
|
|
676
|
|
178
|
|
—
|
|
||||
|
Derivative liabilities
|
(241
|
)
|
—
|
|
(241
|
)
|
—
|
|
||||
|
Net assets (liabilities)
|
$
|
613
|
|
$
|
676
|
|
$
|
(63
|
)
|
$
|
—
|
|
190
PART II
DUKE ENERGY CORPORATION - DUKE ENERGY CAROLINAS, LLC - PROGRESS ENERGY, INC. –
DUKE ENERGY PROGRESS, LLC – DUKE ENERGY FLORIDA, LLC - DUKE ENERGY OHIO, INC. - DUKE ENERGY INDIANA, INC.
Combined Notes To Consolidated Financial Statements – (Continued)
DUKE ENERGY OHIO
The following tables provide recorded balances for assets and liabilities measured at fair value on a recurring basis on the Consolidated Balance Sheets. Derivative amounts in the table below exclude cash collateral, which are disclosed in Note
14
.
|
|
December 31, 2015
|
||||||||||||||
|
(in millions)
|
Total Fair Value
|
|
Level 1
|
|
Level 2
|
|
Level 3
|
|
|||||||
|
Derivative assets
|
$
|
3
|
|
$
|
—
|
|
$
|
—
|
|
$
|
3
|
|
|||
|
Derivative liabilities
|
(7
|
)
|
—
|
|
(7
|
)
|
—
|
|
|||||||
|
Net assets (liabilities)
|
$
|
(4
|
)
|
|
$
|
—
|
|
$
|
(7
|
)
|
$
|
3
|
|
||
|
|
December 31, 2014
|
||||||||||||||
|
(in millions)
|
Total Fair Value
|
|
Level 1
|
|
Level 2
|
|
Level 3
|
|
|||||||
|
Derivative assets
|
$
|
49
|
|
$
|
20
|
|
$
|
9
|
|
$
|
20
|
|
|||
|
Derivative liabilities
|
(181
|
)
|
(117
|
)
|
(26
|
)
|
(38
|
)
|
|||||||
|
Net assets (liabilities)
|
$
|
(132
|
)
|
|
$
|
(97
|
)
|
|
$
|
(17
|
)
|
|
$
|
(18
|
)
|
The following table provides a reconciliation of beginning and ending balances of assets and liabilities measured at fair value using Level 3 measurements.
|
|
Derivatives (net)
|
||||||
|
|
Years Ended December 31,
|
||||||
|
(in millions)
|
2015
|
|
2014
|
|
|||
|
Balance at beginning of period
|
$
|
(18
|
)
|
$
|
(4
|
)
|
|
|
Total pretax realized or unrealized gains (losses) included in earnings
|
21
|
|
(9
|
)
|
|||
|
Purchases, sales, issuances and settlements:
|
|||||||
|
Purchases
|
5
|
|
1
|
|
|||
|
Settlements
|
(5
|
)
|
(13
|
)
|
|||
|
Net transfers In (Out) of Level 3 due to observability of inputs
|
—
|
|
6
|
|
|||
|
Total gains included on the Consolidated Balance Sheet as regulatory assets or liabilities
|
—
|
|
1
|
|
|||
|
Balance at end of period
|
$
|
3
|
|
$
|
(18
|
)
|
|
DUKE ENERGY INDIANA
The following tables provide recorded balances for assets and liabilities measured at fair value on a recurring basis on the Consolidated Balance Sheets. Derivative amounts in the table below exclude cash collateral, which is disclosed in Note
14
. See Note
15
for additional information related to investments by major security type.
|
|
December 31, 2015
|
|||||||||||
|
(in millions)
|
Total Fair Value
|
|
Level 1
|
|
Level 2
|
|
Level 3
|
|
||||
|
Other available-for-sale equity securities
|
$
|
71
|
|
$
|
71
|
|
$
|
—
|
|
$
|
—
|
|
|
Other available-for-sale debt securities and other
|
30
|
|
2
|
|
28
|
|
—
|
|
||||
|
Derivative assets
|
7
|
|
—
|
|
—
|
|
7
|
|
||||
|
Net assets (liabilities)
|
$
|
108
|
|
$
|
73
|
|
$
|
28
|
|
$
|
7
|
|
|
|
December 31, 2014
|
|||||||||||
|
(in millions)
|
Total Fair Value
|
|
Level 1
|
|
Level 2
|
|
Level 3
|
|
||||
|
Other trading and available-for-sale equity securities
|
$
|
71
|
|
$
|
71
|
|
$
|
—
|
|
$
|
—
|
|
|
Other trading and available-for-sale debt securities and other
|
30
|
|
—
|
|
30
|
|
—
|
|
||||
|
Derivative assets
|
14
|
|
—
|
|
—
|
|
14
|
|
||||
|
Net assets (liabilities)
|
$
|
115
|
|
$
|
71
|
|
$
|
30
|
|
$
|
14
|
|
191
PART II
DUKE ENERGY CORPORATION - DUKE ENERGY CAROLINAS, LLC - PROGRESS ENERGY, INC. –
DUKE ENERGY PROGRESS, LLC – DUKE ENERGY FLORIDA, LLC - DUKE ENERGY OHIO, INC. - DUKE ENERGY INDIANA, INC.
Combined Notes To Consolidated Financial Statements – (Continued)
The following table provides a reconciliation of beginning and ending balances of assets and liabilities measured at fair value using Level 3 measurements.
|
|
Derivatives (net)
|
||||||
|
|
Years Ended December 31,
|
||||||
|
(in millions)
|
2015
|
|
2014
|
|
|||
|
Balance at beginning of period
|
$
|
14
|
|
$
|
12
|
|
|
|
Total pretax realized or unrealized gains included in earnings
|
—
|
|
3
|
|
|||
|
Purchases, sales, issuances and settlements:
|
|||||||
|
Purchases
|
19
|
|
49
|
|
|||
|
Settlements
|
(30
|
)
|
(41
|
)
|
|||
|
Total gains (losses) included on the Consolidated Balance Sheet as regulatory assets or liabilities
|
4
|
|
(9
|
)
|
|||
|
Balance at end of period
|
$
|
7
|
|
$
|
14
|
|
|
QUANTITATIVE INFORMATION ABOUT UNOBSERVABLE INPUTS
The following table includes quantitative information about the Duke Energy Registrants' derivatives classified as Level 3.
|
December 31, 2015
|
|||||||||||
|
Fair Value
|
|||||||||||
|
Investment Type
|
(in millions)
|
Valuation Technique
|
Unobservable Input
|
Range
|
|||||||
|
Duke Energy
|
|
|
|
|
|
|
|||||
|
Financial transmission rights (FTRs)
|
$
|
10
|
|
RTO auction pricing
|
FTR price – per Megawatt-Hour (MWh)
|
$
|
(0.74
|
)
|
-
|
7.29
|
|
|
Duke Energy Ohio
|
|
|
|||||||||
|
FTRs
|
$
|
3
|
|
RTO auction pricing
|
FTR price – per MWh
|
$
|
0.67
|
|
-
|
2.53
|
|
|
Duke Energy Indiana
|
|
|
|||||||||
|
FTRs
|
$
|
7
|
|
RTO auction pricing
|
FTR price – per MWh
|
$
|
(0.74
|
)
|
-
|
7.29
|
|
|
|
December 31, 2014
|
|||||||||
|
Fair Value
|
||||||||||
|
Investment Type
|
(in millions)
|
Valuation Technique
|
Unobservable Input
|
Range
|
||||||
|
Duke Energy
|
|
|
|
|
|
|
||||
|
Natural gas contracts
|
$
|
(5
|
)
|
Discounted cash flow
|
Forward natural gas curves – price per Million British Thermal Unit (MMBtu)
|
$
|
2.12
|
|
-
|
4.35
|
|
FTRs
|
14
|
|
RTO auction pricing
|
FTR price – per MWh
|
(1.92
|
)
|
-
|
9.86
|
||
|
Electricity contracts
|
(1
|
)
|
Discounted cash flow
|
Forward electricity curves – price per MWh
|
25.16
|
|
-
|
51.75
|
||
|
Commodity capacity option contracts
|
2
|
|
Discounted cash flow
|
Forward capacity option curves – price per MW day
|
21.00
|
|
-
|
109.00
|
||
|
Reserves
|
(11
|
)
|
|
Bid-ask spreads, implied volatility, probability of default
|
|
|
|
|
||
|
Total Level 3 derivatives
|
$
|
(1
|
)
|
|
|
|
|
|
|
|
|
Duke Energy Ohio
|
|
|
|
|
|
|||||
|
Electricity contracts
|
$
|
(6
|
)
|
Discounted cash flow
|
Forward electricity curves – price per MWh
|
$
|
25.25
|
|
-
|
51.75
|
|
Natural gas contracts
|
(5
|
)
|
Discounted cash flow
|
Forward natural gas curves – price per MMBtu
|
2.12
|
|
-
|
4.35
|
||
|
Reserves
|
(7
|
)
|
|
Bid-ask spreads, implied volatility, probability of default
|
|
|||||
|
Total Level 3 derivatives
|
$
|
(18
|
)
|
|
|
|
||||
|
Duke Energy Indiana
|
|
|
|
|
|
|||||
|
FTRs
|
$
|
14
|
|
RTO auction pricing
|
FTR price – per MWh
|
$
|
(1.92
|
)
|
-
|
9.86
|
192
PART II
DUKE ENERGY CORPORATION - DUKE ENERGY CAROLINAS, LLC - PROGRESS ENERGY, INC. –
DUKE ENERGY PROGRESS, LLC – DUKE ENERGY FLORIDA, LLC - DUKE ENERGY OHIO, INC. - DUKE ENERGY INDIANA, INC.
Combined Notes To Consolidated Financial Statements – (Continued)
OTHER FAIR VALUE DISCLOSURES
The fair value and book value of long-term debt, including current maturities, is summarized in the following table. Estimates determined are not necessarily indicative of amounts that could have been settled in current markets. Fair value of long-term debt uses Level 2 measurements.
|
|
December 31, 2015
|
December 31, 2014
|
|||||||||||||
|
(in millions)
|
Book Value
|
|
Fair Value
|
|
Book Value
|
|
Fair Value
|
|
|||||||
|
Duke Energy
|
$
|
39,569
|
|
$
|
42,537
|
|
$
|
39,868
|
|
$
|
44,566
|
|
|||
|
Duke Energy Carolinas
|
8,367
|
|
9,156
|
|
8,353
|
|
9,626
|
|
|||||||
|
Progress Energy
|
14,464
|
|
15,856
|
|
14,668
|
|
16,951
|
|
|||||||
|
Duke Energy Progress
|
6,518
|
|
6,757
|
|
6,170
|
|
6,696
|
|
|||||||
|
Duke Energy Florida
|
4,266
|
|
4,908
|
|
4,823
|
|
5,767
|
|
|||||||
|
Duke Energy Ohio
|
1,598
|
|
1,724
|
|
1,760
|
|
1,970
|
|
|||||||
|
Duke Energy Indiana
|
3,768
|
|
4,219
|
|
3,769
|
|
4,456
|
|
|||||||
At both
December 31, 2015
and
December 31, 2014
, fair value of cash and cash equivalents, accounts and notes receivable, accounts payable, notes payable and commercial paper, and non-recourse notes payable of variable interest entities are not materially different from their carrying amounts because of the short-term nature of these instruments and/or because the stated rates approximate market rates.
17. VARIABLE INTEREST ENTITIES
A VIE is an entity that is evaluated for consolidation using more than a simple analysis of voting control. The analysis to determine whether an entity is a VIE considers contracts with an entity, credit support for an entity, the adequacy of the equity investment of an entity and the relationship of voting power to the amount of equity invested in an entity. This analysis is performed either upon the creation of a legal entity or upon the occurrence of an event requiring reevaluation, such as a significant change in an entity’s assets or activities. A qualitative analysis of control determines the party that consolidates a VIE. This assessment is based on (i) what party has the power to direct the most significant activities of the VIE that impact its economic performance and (ii) what party has rights to receive benefits or is obligated to absorb losses that are significant to the VIE. The analysis of the party that consolidates a VIE is a continual reassessment.
No financial support was provided to any of the consolidated VIEs during the years ended
December 31, 2015
,
2014
and 2013, or is expected to be provided in the future, that was not previously contractually required.
193
PART II
DUKE ENERGY CORPORATION - DUKE ENERGY CAROLINAS, LLC - PROGRESS ENERGY, INC. –
DUKE ENERGY PROGRESS, LLC – DUKE ENERGY FLORIDA, LLC - DUKE ENERGY OHIO, INC. - DUKE ENERGY INDIANA, INC.
Combined Notes To Consolidated Financial Statements – (Continued)
CONSOLIDATED VIEs
The following tables summarize the impact of VIEs consolidated by Duke Energy and the Subsidiary Registrants on the Consolidated Balance Sheets.
|
|
December 31, 2015
|
||||||||||||||||||||
|
Duke Energy
|
|||||||||||||||||||||
|
Duke
|
|
Duke
|
|
Duke
|
|
||||||||||||||||
|
Energy
|
|
Energy
|
|
Energy
|
|
||||||||||||||||
|
Carolinas
|
|
Progress
|
|
Florida
|
|
||||||||||||||||
|
(in millions)
|
DERF
|
|
DEPR
(c)
|
|
DEFR
(c)
|
|
CRC
|
Renewables
|
Other
|
Total
|
|||||||||||
|
ASSETS
|
|
|
|
|
|
|
|
|
|
|
|
|
|
|
|||||||
|
Current Assets
|
|
|
|
|
|
|
|
|
|
|
|
|
|
|
|||||||
|
Cash and Cash Equivalents
|
$
|
—
|
|
$
|
—
|
|
$
|
—
|
|
$
|
—
|
|
$
|
—
|
|
$
|
2
|
|
$
|
2
|
|
|
Restricted receivables of variable interest entities (net of allowance for doubtful accounts)
|
596
|
|
349
|
|
309
|
|
454
|
|
19
|
|
21
|
|
1,748
|
|
|||||||
|
Other
|
—
|
|
—
|
|
—
|
|
—
|
|
138
|
|
4
|
|
142
|
|
|||||||
|
Investments and Other Assets
|
|
|
|
|
|
|
|
|
|
|
|
|
|
|
|||||||
|
Other
|
—
|
|
—
|
|
—
|
|
—
|
|
70
|
|
—
|
|
70
|
|
|||||||
|
Property, Plant and Equipment
|
|
|
|
|
|
|
|
|
|
|
|
|
|
|
|||||||
|
Property, plant and equipment, cost
(a)
|
—
|
|
—
|
|
—
|
|
—
|
|
2,015
|
|
20
|
|
2,035
|
|
|||||||
|
Accumulated depreciation and amortization
|
—
|
|
—
|
|
—
|
|
—
|
|
(321
|
)
|
(6
|
)
|
(327
|
)
|
|||||||
|
Total assets
|
$
|
596
|
|
$
|
349
|
|
$
|
309
|
|
$
|
454
|
|
$
|
1,921
|
|
$
|
41
|
|
$
|
3,670
|
|
|
LIABILITIES AND EQUITY
|
|
|
|
|
|
|
|
|
|
|
|
|
|
|
|||||||
|
Current Liabilities
|
|
|
|
|
|
|
|
|
|
|
|
|
|
|
|||||||
|
Accounts payable
|
—
|
|
—
|
|
—
|
|
—
|
|
35
|
|
—
|
|
35
|
|
|||||||
|
Taxes accrued
|
5
|
|
3
|
|
—
|
|
—
|
|
5
|
|
1
|
|
14
|
|
|||||||
|
Current maturities of long-term debt
|
—
|
|
—
|
|
—
|
|
—
|
|
108
|
|
17
|
|
125
|
|
|||||||
|
Other
|
—
|
|
—
|
|
—
|
|
—
|
|
15
|
|
2
|
|
17
|
|
|||||||
|
Long-Term Debt
(b)
|
425
|
|
254
|
|
225
|
|
325
|
|
968
|
|
—
|
|
2,197
|
|
|||||||
|
Deferred Credits and Other Liabilities
|
|
|
|
|
|
|
|
|
|
|
|
|
|||||||||
|
Deferred income taxes
|
—
|
|
—
|
|
—
|
|
—
|
|
289
|
|
—
|
|
289
|
|
|||||||
|
Asset retirement obligations
|
—
|
|
—
|
|
—
|
|
—
|
|
35
|
|
—
|
|
35
|
|
|||||||
|
Other
|
—
|
|
—
|
|
—
|
|
—
|
|
33
|
|
—
|
|
33
|
|
|||||||
|
Total liabilities
|
$
|
430
|
|
$
|
257
|
|
$
|
225
|
|
$
|
325
|
|
$
|
1,488
|
|
$
|
20
|
|
$
|
2,745
|
|
|
Net assets of consolidated variable interest entities
|
$
|
166
|
|
$
|
92
|
|
$
|
84
|
|
$
|
129
|
|
$
|
433
|
|
$
|
21
|
|
$
|
925
|
|
194
PART II
DUKE ENERGY CORPORATION - DUKE ENERGY CAROLINAS, LLC - PROGRESS ENERGY, INC. –
DUKE ENERGY PROGRESS, LLC – DUKE ENERGY FLORIDA, LLC - DUKE ENERGY OHIO, INC. - DUKE ENERGY INDIANA, INC.
Combined Notes To Consolidated Financial Statements – (Continued)
|
|
December 31, 2014
|
||||||||||||||||||||
|
Duke Energy
|
|||||||||||||||||||||
|
Duke
|
|
Duke
|
|
Duke
|
|
||||||||||||||||
|
Energy
|
|
Energy
|
|
Energy
|
|
||||||||||||||||
|
Carolinas
|
|
Progress
|
|
Florida
|
|
||||||||||||||||
|
(in millions)
|
DERF
|
|
DEPR
(c)
|
|
DEFR
(c)
|
|
CRC
|
Renewables
|
Other
|
Total
|
|||||||||||
|
ASSETS
|
|
|
|
|
|
|
|
|
|
|
|
|
|||||||||
|
Current Assets
|
|
|
|
|
|
|
|
|
|
|
|
|
|||||||||
|
Restricted receivables of variable interest entities (net of allowance for doubtful accounts)
|
$
|
647
|
|
$
|
436
|
|
$
|
305
|
|
$
|
547
|
|
$
|
20
|
|
$
|
18
|
|
$
|
1,973
|
|
|
Other
|
—
|
|
—
|
|
—
|
|
—
|
|
68
|
|
6
|
|
74
|
|
|||||||
|
Investments and Other Assets
|
|
|
|
|
|
|
|
|
|
|
|
|
|||||||||
|
Other
|
—
|
|
—
|
|
—
|
|
—
|
|
25
|
|
25
|
|
50
|
|
|||||||
|
Property, Plant and Equipment
|
|
|
|
|
|
|
|
|
|
|
|
|
|||||||||
|
Property, plant and equipment, cost
(a)
|
—
|
|
—
|
|
—
|
|
—
|
|
1,855
|
|
18
|
|
1,873
|
|
|||||||
|
Accumulated depreciation and amortization
|
—
|
|
—
|
|
—
|
|
—
|
|
(250
|
)
|
(5
|
)
|
(255
|
)
|
|||||||
|
Regulatory Assets and Deferred Debits
|
|
|
|
|
|
|
|
|
|
|
|
|
|||||||||
|
Other
|
—
|
|
—
|
|
—
|
|
—
|
|
34
|
|
2
|
|
36
|
|
|||||||
|
Total assets
|
$
|
647
|
|
$
|
436
|
|
$
|
305
|
|
$
|
547
|
|
$
|
1,752
|
|
$
|
64
|
|
$
|
3,751
|
|
|
LIABILITIES AND EQUITY
|
|
|
|
|
|
|
|
|
|
|
|
|
|||||||||
|
Current Liabilities
|
|
|
|
|
|
|
|
|
|
|
|
|
|||||||||
|
Accounts payable
|
—
|
|
—
|
|
|
|
—
|
|
3
|
|
—
|
|
3
|
|
|||||||
|
Taxes accrued
|
—
|
|
—
|
|
|
|
—
|
|
6
|
|
—
|
|
6
|
|
|||||||
|
Current maturities of long-term debt
|
—
|
|
—
|
|
|
|
—
|
|
68
|
|
16
|
|
84
|
|
|||||||
|
Other
|
—
|
|
—
|
|
|
|
—
|
|
16
|
|
5
|
|
21
|
|
|||||||
|
Long-Term Debt
(b)
|
400
|
|
300
|
|
225
|
|
325
|
|
967
|
|
17
|
|
2,234
|
|
|||||||
|
Deferred Credits and Other Liabilities
|
|
|
|
|
|
|
|
|
|
|
|
|
|||||||||
|
Deferred income taxes
|
—
|
|
—
|
|
|
|
—
|
|
283
|
|
—
|
|
283
|
|
|||||||
|
Asset retirement obligations
|
—
|
|
—
|
|
|
|
—
|
|
29
|
|
—
|
|
29
|
|
|||||||
|
Other
|
—
|
|
—
|
|
|
|
—
|
|
34
|
|
4
|
|
38
|
|
|||||||
|
Total liabilities
|
$
|
400
|
|
$
|
300
|
|
$
|
225
|
|
$
|
325
|
|
$
|
1,406
|
|
$
|
42
|
|
$
|
2,698
|
|
|
Net assets of consolidated variable interest entities
|
$
|
247
|
|
$
|
136
|
|
$
|
80
|
|
$
|
222
|
|
$
|
346
|
|
$
|
22
|
|
$
|
1,053
|
|
|
(a)
|
Restricted as collateral for non-recourse debt of VIEs.
|
|
(b)
|
Non-recourse to the general assets of the applicable registrant.
|
|
(c)
|
The amount for Progress Energy is equal to the total amount for Duke Energy Progress and Duke Energy Florida.
|
The obligations of these VIEs are non-recourse to Duke Energy, Duke Energy Carolinas, Duke Energy Progress and Duke Energy Florida. These entities have no requirement to provide liquidity to, purchase assets of or guarantee performance of these VIEs unless noted in the following paragraphs.
DERF/DEPR/DEFR
Duke Energy Receivables Finance Company, LLC (DERF), Duke Energy Progress Receivables, LLC (DEPR) and Duke Energy Florida Receivables, LLC (DEFR) are bankruptcy remote, special purpose subsidiaries of Duke Energy Carolinas, Duke Energy Progress and Duke Energy Florida, respectively. On a daily basis, DERF, DEPR and DEFR buy certain accounts receivable arising from the sale of electricity and/or related services from their parent companies. DERF, DEPR and DEFR are wholly owned limited liability companies with separate legal existence from their parents and their assets are not generally available to creditors of their parent companies. DERF, DEPR and DEFR borrow amounts under credit facilities to buy the receivables. Borrowing availability is limited to the amount of qualified receivables sold, which is generally expected to be in excess of the credit facilities. The credit facilities are reflected on the Consolidated Balance Sheets as Long-Term Debt. The secured credit facilities were not structured to meet the criteria for sale accounting treatment under the accounting guidance for transfers and servicing of financial assets.
The most significant activity that impacts the economic performance of DERF, DEPR and DEFR are the decisions made to manage delinquent receivables. Duke Energy Carolinas, Duke Energy Progress and Duke Energy Florida consolidate DERF, DEPR and DEFR, respectively, as they make those decisions.
195
PART II
DUKE ENERGY CORPORATION - DUKE ENERGY CAROLINAS, LLC - PROGRESS ENERGY, INC. –
DUKE ENERGY PROGRESS, LLC – DUKE ENERGY FLORIDA, LLC - DUKE ENERGY OHIO, INC. - DUKE ENERGY INDIANA, INC.
Combined Notes To Consolidated Financial Statements – (Continued)
The following table outlines amounts and expiration dates of the credit facilities.
|
DERF
|
|
DEPR
|
|
DEFR
|
|
||||
|
Credit facility amount (in millions)
|
$
|
425
|
|
$
|
300
|
|
$
|
225
|
|
|
Expiration date
|
December 2018
|
|
February 2019
|
|
March 2017
|
|
|||
CRC
On a revolving basis, Duke Energy Ohio and Duke Energy Indiana sell to CRC certain accounts receivable arising from the sale of electricity and related services. The receivables sold are securitized by CRC through a
$325 million
credit facility managed by two unrelated third parties. Borrowing availability from the credit facility is limited to the amount of qualified receivables sold to CRC. The sole source of funds to satisfy the related debt obligation is cash collections from the receivables. The credit facility expires in
December 2018
and is reflected on Duke Energy's Consolidated Balance Sheets as Long-Term Debt.
The proceeds Duke Energy Ohio and Duke Energy Indiana receive from the sale of receivables to CRC are typically
75 percent
cash and
25 percent
in the form of a subordinated note from CRC. The subordinated note is a retained interest in the receivables sold. Depending on collection experience, additional equity infusions to CRC may be required by Duke Energy to maintain a minimum equity balance of
$3 million
. There were no infusions to CRC during the years ended
December 31, 2015
and
2014
.
CRC is considered a VIE because (i) equity capitalization is insufficient to support its operations, (ii) power to direct the most significant activities that impact economic performance of the entity are not performed by the equity holder, Cinergy, and (iii) deficiencies in net worth of CRC are not funded by Cinergy, but by Duke Energy. The most significant activity of CRC relates to the decisions made with respect to the management of delinquent receivables. Duke Energy consolidates CRC as it makes these decisions. Neither Duke Energy Ohio nor Duke Energy Indiana consolidate CRC.
Renewables
Certain of Duke Energy’s renewable energy facilities are VIEs due to long-term fixed price power purchase agreements. These fixed price agreements effectively transfer commodity price risk to the buyer of the power. Certain other of Duke Energy’s renewable energy facilities are VIEs due to Duke Energy issuing guarantees for debt service and operations and maintenance reserves in support of debt financings. For certain VIEs, assets are restricted and cannot be pledged as collateral or sold to third parties without prior approval of debt holders. The most significant activities that impact the economic performance of these renewable energy facilities were decisions associated with siting, negotiating purchase power agreements, engineering, procurement and construction and decisions associated with ongoing operations and maintenance-related activities. Duke Energy consolidates the entities as it makes all of these decisions.
NON-CONSOLIDATED VIEs
The tables below show VIEs not consolidated and how these entities impact the Consolidated Balance Sheets.
|
|
December 31, 2015
|
||||||||||||||||||
|
|
Duke Energy
|
|
|
||||||||||||||||
|
Duke
|
|
Duke
|
|
||||||||||||||||
|
Energy
|
|
Energy
|
|
||||||||||||||||
|
(in millions)
|
Renewables
|
|
Other
|
|
Total
|
|
Ohio
|
|
Indiana
|
|
|||||||||
|
Receivables
|
$
|
—
|
|
$
|
—
|
|
$
|
—
|
|
$
|
47
|
|
$
|
60
|
|
||||
|
Investments in equity method unconsolidated affiliates
|
235
|
|
152
|
|
387
|
|
—
|
|
—
|
|
|||||||||
|
Total assets
|
$
|
235
|
|
$
|
152
|
|
$
|
387
|
|
$
|
47
|
|
$
|
60
|
|
||||
|
Other current liabilities
|
—
|
|
3
|
|
3
|
|
—
|
|
—
|
|
|||||||||
|
Deferred credits and other liabilities
|
—
|
|
14
|
|
14
|
|
—
|
|
—
|
|
|||||||||
|
Total liabilities
|
$
|
—
|
|
$
|
17
|
|
$
|
17
|
|
$
|
—
|
|
$
|
—
|
|
||||
|
Net assets (liabilities)
|
$
|
235
|
|
$
|
135
|
|
$
|
370
|
|
$
|
47
|
|
$
|
60
|
|
||||
196
PART II
DUKE ENERGY CORPORATION - DUKE ENERGY CAROLINAS, LLC - PROGRESS ENERGY, INC. –
DUKE ENERGY PROGRESS, LLC – DUKE ENERGY FLORIDA, LLC - DUKE ENERGY OHIO, INC. - DUKE ENERGY INDIANA, INC.
Combined Notes To Consolidated Financial Statements – (Continued)
|
|
December 31, 2014
|
||||||||||||||||||
|
|
Duke Energy
|
|
|
||||||||||||||||
|
Duke
|
|
Duke
|
|
||||||||||||||||
|
Energy
|
|
Energy
|
|
||||||||||||||||
|
(in millions)
|
Renewables
|
|
Other
|
|
Total
|
|
Ohio
|
|
Indiana
|
|
|||||||||
|
Receivables
|
$
|
—
|
|
$
|
—
|
|
$
|
—
|
|
$
|
91
|
|
$
|
113
|
|
||||
|
Investments in equity method unconsolidated affiliates
|
150
|
|
38
|
|
188
|
|
—
|
|
—
|
|
|||||||||
|
Intangibles
|
—
|
|
—
|
|
—
|
|
—
|
|
—
|
|
|||||||||
|
Investments and other assets
|
—
|
|
4
|
|
4
|
|
—
|
|
—
|
|
|||||||||
|
Total assets
|
$
|
150
|
|
$
|
42
|
|
$
|
192
|
|
$
|
91
|
|
$
|
113
|
|
||||
|
Other current liabilities
|
—
|
|
3
|
|
3
|
|
—
|
|
—
|
|
|||||||||
|
Deferred credits and other liabilities
|
—
|
|
14
|
|
14
|
|
—
|
|
—
|
|
|||||||||
|
Total liabilities
|
$
|
—
|
|
$
|
17
|
|
$
|
17
|
|
$
|
—
|
|
$
|
—
|
|
||||
|
Net assets
|
$
|
150
|
|
$
|
25
|
|
$
|
175
|
|
$
|
91
|
|
$
|
113
|
|
||||
The Duke Energy Registrants are not aware of any situations where the maximum exposure to loss significantly exceeds the carrying values shown above except for the power purchase agreement with OVEC, which is discussed below, and various guarantees, some of which are reflected in the table above as Deferred credits and other liabilities. For more information on various guarantees, refer to Note
7
, "Guarantees and Indemnifications."
Renewables
Duke Energy has investments in various renewable energy project entities. Some of these entities are VIEs due to long-term fixed price power purchase agreements. These fixed price agreements effectively transfer commodity price risk to the buyer of the power. Duke Energy does not consolidate these VIEs because power to direct and control key activities is shared jointly by Duke Energy and other owners.
Other
Duke Energy holds a
50 percent
equity interest in Duke-American Transmission Company, LLC (DATC). DATC is considered a VIE due to insufficient equity at risk to permit DATC to finance its own activities without additional subordinated financial support. The activities that most significantly impact DATC’s economic performance are the decisions related to investing in existing and development of new transmission facilities. The power to direct these activities is jointly and equally shared by Duke Energy and the other joint venture partner and, therefore, Duke Energy does not consolidate.
Duke Energy has a
40 percent
equity interest and a
7.5 percent
equity interest in ACP and Sabal Trail, respectively. These entities are considered VIEs as their equity is not sufficient to permit the entities to finance their activities without additional subordinated financial support. The activity that most significantly impacts the economic performance of both ACP and Sabal Trail is construction. Duke Energy does not control these activities and therefore does not consolidate ACP or Sabal Trail.
OVEC
Duke Energy Ohio’s
9 percent
ownership interest in OVEC is considered a non-consolidated VIE. Through its ownership interest in OVEC, Duke Energy Ohio has a contractual arrangement to buy power from OVEC’s power plants through June 2040. Proceeds from the sale of power by OVEC to its power purchase agreement counterparties are designed to be sufficient to meet its operating expenses, fixed costs, debt amortization and interest expense, as well as earn a return on equity. Accordingly, the value of this contract is subject to variability due to fluctuations in power prices and changes in OVEC’s costs of business, including costs associated with its 2,256 MW of coal-fired generation capacity. Proposed environmental rulemaking could increase the costs of OVEC, which would be passed through to Duke Energy Ohio. In 2014, Duke Energy Ohio recorded a
$94 million
impairment related to OVEC.
CRC
See discussion under Consolidated VIEs for additional information related to CRC.
Amounts included in Receivables in the above table for Duke Energy Ohio and Duke Energy Indiana reflect their retained interest in receivables sold to CRC. These subordinated notes held by Duke Energy Ohio and Duke Energy Indiana are stated at fair value. Carrying values of retained interests are determined by allocating carrying value of the receivables between assets sold and interests retained based on relative fair value. The allocated bases of the subordinated notes are not materially different than their face value because (i) the receivables generally turnover in less than two months, (ii) credit losses are reasonably predictable due to the broad customer base and lack of significant concentration and (iii) the equity in CRC is subordinate to all retained interests and thus would absorb losses first. The hypothetical effect on fair value of the retained interests assuming both a
10 percent
and a
20 percent
unfavorable variation in credit losses or discount rates is not material due to the short turnover of receivables and historically low credit loss history. Interest accrues to Duke Energy Ohio and Duke Energy Indiana on the retained interests using the acceptable yield method. This method generally approximates the stated rate on the notes since the allocated basis and the face value are nearly equivalent. An impairment charge is recorded against the carrying value of both retained interests and purchased beneficial interest whenever it is determined that an other-than-temporary impairment has occurred.
197
PART II
DUKE ENERGY CORPORATION - DUKE ENERGY CAROLINAS, LLC - PROGRESS ENERGY, INC. –
DUKE ENERGY PROGRESS, LLC – DUKE ENERGY FLORIDA, LLC - DUKE ENERGY OHIO, INC. - DUKE ENERGY INDIANA, INC.
Combined Notes To Consolidated Financial Statements – (Continued)
Key assumptions used in estimating fair value are detailed in the following table.
|
|
Duke Energy Ohio
|
Duke Energy Indiana
|
|||||||||
|
|
2015
|
|
2014
|
|
2015
|
|
2014
|
|
|||
|
Anticipated credit loss ratio
|
0.6
|
%
|
0.6
|
%
|
0.3
|
%
|
0.3
|
%
|
|||
|
Discount rate
|
1.2
|
%
|
1.2
|
%
|
1.2
|
%
|
1.2
|
%
|
|||
|
Receivable turnover rate
|
12.9
|
%
|
12.8
|
%
|
10.6
|
%
|
10.5
|
%
|
|||
The following table shows the gross and net receivables sold.
|
|
Duke Energy Ohio
|
Duke Energy Indiana
|
|||||||||||||
|
(in millions)
|
2015
|
|
2014
|
|
2015
|
|
2014
|
|
|||||||
|
Receivables sold
|
$
|
233
|
|
$
|
273
|
|
$
|
260
|
|
$
|
310
|
|
|||
|
Less: Retained interests
|
47
|
|
91
|
|
60
|
|
113
|
|
|||||||
|
Net receivables sold
|
$
|
186
|
|
$
|
182
|
|
$
|
200
|
|
$
|
197
|
|
|||
The following table shows sales and cash flows related to receivables sold.
|
|
Duke Energy Ohio
|
Duke Energy Indiana
|
|||||||||||||||||||||
|
|
Years Ended December 31,
|
Years Ended December 31,
|
|||||||||||||||||||||
|
(in millions)
|
2015
|
|
2014
|
|
2013
|
|
2015
|
|
2014
|
|
2013
|
|
|||||||||||
|
Sales
|
|
|
|
|
|
|
|||||||||||||||||
|
Receivables sold
|
$
|
1,963
|
|
$
|
2,246
|
|
$
|
2,251
|
|
$
|
2,627
|
|
$
|
2,913
|
|
$
|
2,985
|
|
|||||
|
Loss recognized on sale
|
9
|
|
11
|
|
12
|
|
11
|
|
11
|
|
11
|
|
|||||||||||
|
Cash Flows
|
|
|
|
|
|
|
|||||||||||||||||
|
Cash proceeds from receivables sold
|
1,995
|
|
2,261
|
|
2,220
|
|
2,670
|
|
2,932
|
|
2,944
|
|
|||||||||||
|
Collection fees received
|
1
|
|
1
|
|
1
|
|
1
|
|
1
|
|
1
|
|
|||||||||||
|
Return received on retained interests
|
3
|
|
4
|
|
5
|
|
5
|
|
6
|
|
6
|
|
|||||||||||
Cash flows from the sales of receivables are reflected within Cash Flows From Operating Activities on Duke Energy Ohio’s and Duke Energy Indiana’s Consolidated Statements of Cash Flows.
Collection fees received in connection with servicing transferred accounts receivable are included in Operation, maintenance and other on Duke Energy Ohio’s and Duke Energy Indiana’s Consolidated Statements of Operations and Comprehensive Income. The loss recognized on sales of receivables is calculated monthly by multiplying receivables sold during the month by the required discount. The required discount is derived monthly utilizing a three-year weighted average formula that considers charge-off history, late charge history and turnover history on the sold receivables, as well as a component for the time value of money. The discount rate, or component for the time value of money, is the prior month-end LIBOR plus a fixed rate of
1.00 percent
.
18. COMMON STOCK
Basic Earnings Per Share (EPS) is computed by dividing net income attributable to Duke Energy common stockholders, adjusted for distributed and undistributed earnings allocated to participating securities, by the weighted average number of common stock outstanding during the period. Diluted EPS is computed by dividing net income attributable to Duke Energy common stockholders, as adjusted for distributed and undistributed earnings allocated to participating securities, by the diluted weighted average number of common stock outstanding during the period. Diluted EPS reflects the potential dilution that could occur if securities or other agreements to issue common stock, such as stock options, were exercised or settled. Duke Energy’s participating securities are restricted stock units that are entitled to dividends declared on Duke Energy common shares during the restricted stock unit’s vesting periods.
198
PART II
DUKE ENERGY CORPORATION - DUKE ENERGY CAROLINAS, LLC - PROGRESS ENERGY, INC. –
DUKE ENERGY PROGRESS, LLC – DUKE ENERGY FLORIDA, LLC - DUKE ENERGY OHIO, INC. - DUKE ENERGY INDIANA, INC.
Combined Notes To Consolidated Financial Statements – (Continued)
The following table presents Duke Energy’s basic and diluted EPS calculations and reconciles the weighted average number of common stock outstanding to the diluted weighted average number of common stock outstanding.
|
Years Ended December 31,
|
|||||||||||
|
(in millions, except per share amounts)
|
2015
|
|
2014
|
|
2013
|
|
|||||
|
Income from continuing operations attributable to Duke Energy common stockholders excluding impact of participating securities
|
$
|
2,791
|
|
$
|
2,446
|
|
$
|
2,565
|
|
||
|
Weighted average shares outstanding – basic
|
694
|
|
707
|
|
706
|
|
|||||
|
Weighted average shares outstanding – diluted
|
694
|
|
707
|
|
706
|
|
|||||
|
Earnings per share from continuing operations attributable to Duke Energy common stockholders
|
|||||||||||
|
Basic
|
$
|
4.02
|
|
3.46
|
|
3.64
|
|
||||
|
Diluted
|
$
|
4.02
|
|
3.46
|
|
3.63
|
|
||||
|
Potentially dilutive items excluded from the calculation
(a)
|
2
|
|
2
|
|
2
|
|
|||||
|
Dividends declared per common share
|
$
|
3.24
|
|
3.15
|
|
3.09
|
|
||||
|
(a)
|
Performance stock awards and certain stock options were not included in the dilutive securities calculation because either the performance measures related to the awards had not been met or the option exercise prices were greater than the average market price of the common shares during the presented periods.
|
On April 6, 2015, Duke Energy entered into agreements with each of Goldman, Sachs & Co. and JPMorgan Chase Bank, National Association (the Dealers) to repurchase a total of
$1.5 billion
of Duke Energy common stock under an accelerated stock repurchase program (the ASR). Duke Energy made payments of
$750 million
to each of the Dealers and was delivered
16.6 million
shares, with a total fair value of
$1.275 billion
, which represented approximately
85 percent
of the total number of shares of Duke Energy common stock expected to be repurchased under the ASR. The
$225 million
unsettled portion met the criteria to be accounted for as a forward contract indexed to Duke Energy's stock and qualified as an equity instrument. The company recorded the
$1.5 billion
payment as a reduction to common stock as of April 6, 2015. In June 2015, the Dealers delivered
3.2 million
additional shares to Duke Energy to complete the ASR. Approximately
19.8 million
shares, in total, were delivered to Duke Energy and retired under the ASR at an average price of
$75.75
per share. The final number of shares repurchased was based upon the average of the daily volume weighted average stock prices of Duke Energy’s common stock during the term of the program, less a discount.
19. SEVERANCE
During 2015, Duke Energy developed targeted cost-savings initiatives aimed at reducing operating and maintenance expense. The initiatives include efforts to reduce costs through standardization of processes and systems, leveraging technology and workforce optimization throughout the company in order to achieve sustainable cost reductions. In conjunction with these initiatives, voluntary and involuntary severance benefits were extended to a total of approximately
900
employees. The following table presents the direct and allocated severance and related expenses recorded by the Duke Energy Registrants associated with these initiatives. Amounts are included within Operation, maintenance and other on the Consolidated Statements of Operations.
|
Duke
|
|
Duke
|
|
Duke
|
|
Duke
|
|
Duke
|
|
||||||||||||
|
Duke
|
|
Energy
|
|
Progress
|
|
Energy
|
|
Energy
|
|
Energy
|
|
Energy
|
|
||||||||
|
(in millions)
|
Energy
|
|
Carolinas
|
|
Energy
|
|
Progress
|
|
Florida
|
|
Ohio
|
|
Indiana
|
|
|||||||
|
Year Ended December 31, 2015
|
$
|
142
|
|
$
|
93
|
|
$
|
36
|
|
$
|
28
|
|
$
|
8
|
|
$
|
2
|
|
$
|
6
|
|
In conjunction with the 2012 merger with Progress Energy, Duke Energy and Progress Energy offered a voluntary severance plan to certain eligible employees. As of December 31, 2015, all plan participants have separated from the company. The following table presents direct and allocated severance and related expenses recorded by the Duke Energy Registrants associated with this plan. Amounts are included within Operation, maintenance and other on the Consolidated Statements of Operations. Amounts for 2014 and 2015 were not material.
|
Duke
|
|
Duke
|
|
Duke
|
|
Duke
|
|
Duke
|
|
||||||||||||
|
Duke
|
|
Energy
|
|
Progress
|
|
Energy
|
|
Energy
|
|
Energy
|
|
Energy
|
|
||||||||
|
(in millions)
|
Energy
(a)
|
|
Carolinas
|
|
Energy
|
|
Progress
|
|
Florida
|
|
Ohio
|
|
Indiana
|
|
|||||||
|
Year Ended December 31, 2013
|
$
|
34
|
|
$
|
8
|
|
$
|
19
|
|
$
|
14
|
|
$
|
5
|
|
$
|
2
|
|
$
|
2
|
|
|
(a)
|
Includes
$5 million
of accelerated stock award expense and
$2 million
of COBRA and health care reimbursement expense.
|
During 2013, in conjunction with the retirement of Crystal River Unit 3, severance benefits were made available to certain impacted unionized and non-unionized employees, to the extent that those employees did not find job opportunities at other locations. For the year ended December 31, 2013, Duke Energy Florida deferred
$26 million
of severance costs as a regulatory asset. Severance costs accrued in 2014 and 2015 related to this plan were not material. As of December 31, 2015, all plan participants have separated from the company. Refer to Note
4
for further discussion regarding Crystal River Unit 3.
199
PART II
DUKE ENERGY CORPORATION - DUKE ENERGY CAROLINAS, LLC - PROGRESS ENERGY, INC. –
DUKE ENERGY PROGRESS, LLC – DUKE ENERGY FLORIDA, LLC - DUKE ENERGY OHIO, INC. - DUKE ENERGY INDIANA, INC.
Combined Notes To Consolidated Financial Statements – (Continued)
The table below presents the severance liability for past and ongoing severance plans including the plans described above. Amounts for Duke Energy Indiana and Duke Energy Ohio are not material.
|
Duke
|
|
Duke
|
|
Duke
|
|
||||||||||
|
Duke
|
|
Energy
|
|
Progress
|
|
Energy
|
|
Energy
|
|
||||||
|
(in millions)
|
Energy
|
|
Carolinas
|
|
Energy
|
|
Progress
|
|
Florida
|
|
|||||
|
Balance at December 31, 2014
|
$
|
28
|
|
$
|
2
|
|
$
|
18
|
|
$
|
1
|
|
$
|
17
|
|
|
Provision/Adjustments
|
144
|
|
80
|
|
20
|
|
20
|
|
—
|
|
|||||
|
Cash Reductions
|
(36
|
)
|
(4
|
)
|
(15
|
)
|
(2
|
)
|
(13
|
)
|
|||||
|
Balance at December 31, 2015
|
$
|
136
|
|
$
|
78
|
|
$
|
23
|
|
$
|
19
|
|
$
|
4
|
|
20. STOCK-BASED COMPENSATION
The Duke Energy Corporation 2015 Long-Term Incentive Plan (the 2015 Plan) provides for the grant of stock-based compensation awards to employees and outside directors. The 2015 Plan reserves
10 million
shares of common stock for issuance. Duke Energy has historically issued new shares upon exercising or vesting of share-based awards. However, Duke Energy may use a combination of new share issuances and open market repurchases for share-based awards that are exercised or vest in the future. Duke Energy has not determined with certainty the amount of such new share issuances or open market repurchases.
The 2015 Plan supersedes the 2010 Long-Term Incentive Plan, as amended (the 2010 Plan), and the Progress Energy, Inc. 2007 Equity Incentive Plan (the Progress Plan). No additional grants will be made from the 2010 Plan and Progress Plan.
The following table summarizes the total expense recognized by the Duke Energy Registrants, net of tax, for stock-based compensation.
|
|
Years Ended December 31,
|
||||||||||
|
(in millions)
|
2015
|
|
2014
|
|
2013
|
|
|||||
|
Duke Energy
|
$
|
38
|
|
$
|
38
|
|
$
|
52
|
|
||
|
Duke Energy Carolinas
|
14
|
|
12
|
|
13
|
|
|||||
|
Progress Energy
|
14
|
|
14
|
|
23
|
|
|||||
|
Duke Energy Progress
|
9
|
|
9
|
|
14
|
|
|||||
|
Duke Energy Florida
|
5
|
|
5
|
|
9
|
|
|||||
|
Duke Energy Ohio
|
2
|
|
5
|
|
4
|
|
|||||
|
Duke Energy Indiana
|
4
|
|
3
|
|
4
|
|
|||||
Duke Energy's pretax stock-based compensation costs, the tax benefit associated with stock-based compensation expense, and stock-based compensation costs capitalized are included in the following table.
|
|
Years Ended December 31,
|
||||||||||
|
(in millions)
|
2015
|
|
2014
|
|
2013
|
|
|||||
|
Restricted stock unit awards
|
$
|
38
|
|
$
|
39
|
|
$
|
49
|
|
||
|
Performance awards
|
23
|
|
22
|
|
34
|
|
|||||
|
Stock options
|
—
|
|
—
|
|
2
|
|
|||||
|
Pretax stock-based compensation cost
|
$
|
61
|
|
$
|
61
|
|
$
|
85
|
|
||
|
Tax benefit associated with stock-based compensation expense
|
$
|
23
|
|
$
|
23
|
|
$
|
33
|
|
||
|
Stock-based compensation costs capitalized
|
3
|
|
4
|
|
3
|
|
|||||
STOCK OPTIONS
Stock options are granted with a maximum option term of
10 years
and with an exercise price not less than the market price of Duke Energy's common stock on the grant date. Stock options outstanding at December 31, 2015, were not exercisable and the aggregate intrinsic value was not material. The following table summarizes information about stock options outstanding.
|
Weighted Average
|
|
|||||||
|
Stock Options
|
|
Exercise Price
|
|
Weighted Average
|
||||
|
|
(in thousands)
|
|
(per share)
|
|
Remaining Life
|
|||
|
Outstanding at December 31, 2014
|
373
|
|
$
|
64
|
|
|
||
|
Exercised
|
(270
|
)
|
62
|
|
|
|||
|
Outstanding at December 31, 2015
(a)
|
103
|
|
69
|
|
7 years, 2 months
|
|||
(a) Outstanding stock options all vested on January 1, 2016.
200
PART II
DUKE ENERGY CORPORATION - DUKE ENERGY CAROLINAS, LLC - PROGRESS ENERGY, INC. –
DUKE ENERGY PROGRESS, LLC – DUKE ENERGY FLORIDA, LLC - DUKE ENERGY OHIO, INC. - DUKE ENERGY INDIANA, INC.
Combined Notes To Consolidated Financial Statements – (Continued)
The following table summarizes additional information related to stock options exercised and granted.
|
|
Years Ended December 31,
|
||||||||||
|
2015
|
|
2014
|
|
2013
|
|
||||||
|
Intrinsic value of options exercised (in millions)
|
$
|
5
|
|
$
|
6
|
|
$
|
26
|
|
||
|
Tax benefit related to options exercised (in millions)
|
2
|
|
2
|
|
10
|
|
|||||
|
Cash received from options exercised (in millions)
|
17
|
|
25
|
|
9
|
|
|||||
|
Stock options granted (in thousands)
(a)
|
—
|
|
—
|
|
310
|
|
|||||
(a) Stock options granted in 2013 were expensed immediately.
RESTRICTED STOCK UNIT AWARDS
Restricted stock unit awards generally vest over periods from immediate to
three years
. Fair value amounts are based on the market price of Duke Energy's common stock on the grant date. The following table includes information related to restricted stock unit awards.
|
|
Years Ended December 31,
|
||||||||||
|
|
2015
|
|
2014
|
|
2013
|
|
|||||
|
Shares awarded (in thousands)
|
524
|
|
557
|
|
612
|
|
|||||
|
Fair value (in millions)
|
$
|
41
|
|
$
|
40
|
|
$
|
42
|
|
||
The following table summarizes information about restricted stock unit awards outstanding.
|
Weighted Average
|
|
|||||
|
Shares
|
|
Grant Date Fair Value
|
|
|||
|
|
(in thousands)
|
|
(per share)
|
|
||
|
Outstanding at December 31, 2014
|
1,080
|
|
$
|
69
|
|
|
|
Granted
|
524
|
|
79
|
|
||
|
Vested
|
(602
|
)
|
68
|
|
||
|
Forfeited
|
(49
|
)
|
73
|
|
||
|
Outstanding at December 31, 2015
|
953
|
|
75
|
|
||
|
Restricted stock unit awards expected to vest
|
924
|
|
75
|
|
||
The total grant date fair value of shares vested during the years ended
December 31, 2015
,
2014
and
2013
was
$41 million
,
$52 million
and
$50 million
, respectively. At
December 31, 2015
, Duke Energy had
$19 million
of unrecognized compensation cost, which is expected to be recognized over a weighted average period of
one year, eleven months
.
PERFORMANCE AWARDS
Stock-based performance awards generally vest over three years if performance targets are met.
Performance awards granted in 2015, 2014 and 2013 contain market conditions based on the total shareholder return (TSR) of Duke Energy stock relative to a predefined peer group (relative TSR). These awards are valued using a path-dependent model that incorporates expected relative TSR into the fair value determination of Duke Energy’s performance-based share awards. The model uses three-year historical volatilities and correlations for all companies in the predefined peer group, including Duke Energy, to simulate Duke Energy’s relative TSR as of the end of the performance period. For each simulation, Duke Energy’s relative TSR associated with the simulated stock price at the end of the performance period plus expected dividends within the period results in a value per share for the award portfolio. The average of these simulations is the expected portfolio value per share. Actual life to date results of Duke Energy’s relative TSR for each grant are incorporated within the model.
For performance awards granted in 2015, the model used a risk-fee interest rate of
1.0 percent
, which reflects the yield on three-year Treasury bonds as of the grant date, and an expected volatility of
13.6 percent
based on Duke Energy's historical volatility over three years using daily stock prices.
The following table includes information related to stock-based performance awards.
|
|
Years Ended December 31,
|
||||||||||
|
|
2015
|
|
2014
|
|
2013
|
|
|||||
|
Shares awarded (in thousands)
|
642
|
|
542
|
|
633
|
|
|||||
|
Fair value (in millions)
|
$
|
26
|
|
$
|
19
|
|
$
|
28
|
|
||
201
PART II
DUKE ENERGY CORPORATION - DUKE ENERGY CAROLINAS, LLC - PROGRESS ENERGY, INC. –
DUKE ENERGY PROGRESS, LLC – DUKE ENERGY FLORIDA, LLC - DUKE ENERGY OHIO, INC. - DUKE ENERGY INDIANA, INC.
Combined Notes To Consolidated Financial Statements – (Continued)
The following table summarizes information about stock-based performance awards outstanding and assumes payout at the maximum level.
|
Weighted Average
|
|
|||||
|
Shares
|
|
Grant Date Fair Value
|
|
|||
|
|
(in thousands)
|
|
(per share)
|
|
||
|
Outstanding at December 31, 2014
|
1,627
|
|
$
|
42
|
|
|
|
Granted
|
642
|
|
41
|
|
||
|
Vested
|
(271
|
)
|
51
|
|
||
|
Forfeited
|
(301
|
)
|
38
|
|
||
|
Outstanding at December 31, 2015
|
1,697
|
|
40
|
|
||
|
Stock-based performance awards expected to vest
|
1,301
|
|
40
|
|
||
The total grant date fair value of shares vested during the years ended
December 31, 2015
,
2014
and
2013
was
$26 million
,
$27 million
and
$42 million
, respectively. At
December 31, 2015
, Duke Energy had
$22 million
of unrecognized compensation cost, which is expected to be recognized over a weighted average period of
one year, two months
.
21. EMPLOYEE BENEFIT PLANS
DEFINED BENEFIT RETIREMENT PLANS
Duke Energy maintains, and the Subsidiary Registrants participate in, qualified, non-contributory defined benefit retirement plans. The plans cover most U.S. employees using a cash balance formula. Under a cash balance formula, a plan participant accumulates a retirement benefit consisting of pay credits based upon a percentage of current eligible earnings based on age, or age and years of service, and interest credits. Certain employees are covered under plans that use a final average earnings formula. Under these average earnings formulas, a plan participant accumulates a retirement benefit equal to the sum of percentages of their (i) highest three-year or four-year average earnings, (ii) highest three-year or four-year average earnings in excess of covered compensation per year of participation (maximum of
35 years
), and/or (iii) highest three-year average earnings times years of participation in excess of
35 years
. Duke Energy also maintains, and the Subsidiary Registrants participate in, non-qualified, non-contributory defined benefit retirement plans which cover certain executives. As of January 1, 2014, the qualified and non-qualified non-contributory defined benefit plans are closed to new and rehired non-union and certain unionized employees.
Duke Energy uses a December 31 measurement date for its defined benefit retirement plan assets and obligations.
Net periodic benefit costs disclosed in the tables below represent the cost of the respective benefit plan for the periods presented. However, portions of the net periodic benefit costs disclosed in the tables below have been capitalized as a component of property, plant and equipment. Amounts presented in the tables below for the Subsidiary Registrants represent the amounts of pension and other post-retirement benefit cost allocated by Duke Energy for employees of the Subsidiary Registrants. Additionally, the Subsidiary Registrants are allocated their proportionate share of pension and post-retirement benefit cost for employees of Duke Energy’s shared services affiliate that provide support to the Subsidiary Registrants. These allocated amounts are included in the governance and shared service costs discussed in Note
13
.
Duke Energy’s policy is to fund amounts on an actuarial basis to provide assets sufficient to meet benefit payments to be paid to plan participants. The following table includes information related to the Duke Energy Registrants’ contributions to its U.S. qualified defined benefit pension plans.
|
Duke
|
|
Duke
|
|
Duke
|
|
Duke
|
|
Duke
|
|
||||||||||||||||||
|
Duke
|
|
Energy
|
|
Progress
|
|
Energy
|
|
Energy
|
|
Energy
|
|
Energy
|
|
||||||||||||||
|
(in millions)
|
Energy
|
|
Carolinas
|
|
Energy
|
|
Progress
|
|
Florida
|
|
Ohio
|
|
Indiana
|
|
|||||||||||||
|
Anticipated Contributions:
|
|
|
|
|
|
|
|
|
|
|
|
|
|
|
|||||||||||||
|
2016
|
$
|
145
|
|
$
|
43
|
|
$
|
43
|
|
$
|
24
|
|
$
|
20
|
|
$
|
4
|
|
$
|
9
|
|
||||||
|
Contributions Made:
|
|
|
|
|
|
|
|
|
|
|
|
|
|
|
|||||||||||||
|
2015
|
$
|
302
|
|
$
|
91
|
|
$
|
83
|
|
$
|
42
|
|
$
|
40
|
|
$
|
8
|
|
$
|
19
|
|
||||||
|
2014
|
—
|
|
—
|
|
—
|
|
—
|
|
—
|
|
—
|
|
—
|
|
|||||||||||||
|
2013
|
250
|
|
—
|
|
250
|
|
63
|
|
133
|
|
—
|
|
—
|
|
|||||||||||||
202
PART II
DUKE ENERGY CORPORATION - DUKE ENERGY CAROLINAS, LLC - PROGRESS ENERGY, INC. –
DUKE ENERGY PROGRESS, LLC – DUKE ENERGY FLORIDA, LLC - DUKE ENERGY OHIO, INC. - DUKE ENERGY INDIANA, INC.
Combined Notes To Consolidated Financial Statements – (Continued)
QUALIFIED PENSION PLANS
Components of Net Periodic Pension Costs
|
|
Year Ended December 31, 2015
|
||||||||||||||||||||||||||
|
Duke
|
|
Duke
|
|
Duke
|
|
Duke
|
|
Duke
|
|
||||||||||||||||||
|
Duke
|
|
Energy
|
|
Progress
|
|
Energy
|
|
Energy
|
|
Energy
|
|
Energy
|
|
||||||||||||||
|
(in millions)
|
Energy
|
|
Carolinas
|
|
Energy
|
|
Progress
|
|
Florida
|
|
Ohio
|
|
Indiana
|
|
|||||||||||||
|
Service cost
|
$
|
159
|
|
$
|
50
|
|
$
|
44
|
|
$
|
23
|
|
$
|
20
|
|
$
|
4
|
|
$
|
10
|
|
||||||
|
Interest cost on projected benefit obligation
|
324
|
|
83
|
|
104
|
|
48
|
|
54
|
|
18
|
|
27
|
|
|||||||||||||
|
Expected return on plan assets
|
(516
|
)
|
(139
|
)
|
(171
|
)
|
(79
|
)
|
(87
|
)
|
(26
|
)
|
(42
|
)
|
|||||||||||||
|
Amortization of actuarial loss
|
166
|
|
39
|
|
65
|
|
33
|
|
31
|
|
7
|
|
13
|
|
|||||||||||||
|
Amortization of prior service (credit) cost
|
(15
|
)
|
(7
|
)
|
(3
|
)
|
(2
|
)
|
(1
|
)
|
—
|
|
1
|
|
|||||||||||||
|
Other
|
8
|
|
2
|
|
3
|
|
1
|
|
1
|
|
—
|
|
1
|
|
|||||||||||||
|
Net periodic pension costs
(a)(b)
|
$
|
126
|
|
$
|
28
|
|
$
|
42
|
|
$
|
24
|
|
$
|
18
|
|
$
|
3
|
|
$
|
10
|
|
||||||
|
|
Year Ended December 31, 2014
|
||||||||||||||||||||||||||
|
Duke
|
|
Duke
|
|
Duke
|
|
Duke
|
|
Duke
|
|
||||||||||||||||||
|
Duke
|
|
Energy
|
|
Progress
|
|
Energy
|
|
Energy
|
|
Energy
|
|
Energy
|
|
||||||||||||||
|
(in millions)
|
Energy
|
|
Carolinas
|
|
Energy
|
|
Progress
|
|
Florida
|
|
Ohio
|
|
Indiana
|
|
|||||||||||||
|
Service cost
|
$
|
135
|
|
$
|
41
|
|
$
|
40
|
|
$
|
21
|
|
$
|
20
|
|
$
|
4
|
|
$
|
9
|
|
||||||
|
Interest cost on projected benefit obligation
|
344
|
|
85
|
|
112
|
|
54
|
|
57
|
|
20
|
|
29
|
|
|||||||||||||
|
Expected return on plan assets
|
(511
|
)
|
(132
|
)
|
(173
|
)
|
(85
|
)
|
(85
|
)
|
(27
|
)
|
(41
|
)
|
|||||||||||||
|
Amortization of actuarial loss
|
150
|
|
36
|
|
68
|
|
32
|
|
32
|
|
4
|
|
13
|
|
|||||||||||||
|
Amortization of prior service credit
|
(15
|
)
|
(8
|
)
|
(3
|
)
|
(2
|
)
|
(1
|
)
|
—
|
|
—
|
|
|||||||||||||
|
Other
|
8
|
|
2
|
|
3
|
|
1
|
|
1
|
|
—
|
|
1
|
|
|||||||||||||
|
Net periodic pension costs
(a)(b)
|
$
|
111
|
|
$
|
24
|
|
$
|
47
|
|
$
|
21
|
|
$
|
24
|
|
$
|
1
|
|
$
|
11
|
|
||||||
|
|
Year Ended December 31, 2013
|
||||||||||||||||||||||||||
|
Duke
|
|
Duke
|
|
Duke
|
|
Duke
|
|
Duke
|
|
||||||||||||||||||
|
Duke
|
|
Energy
|
|
Progress
|
|
Energy
|
|
Energy
|
|
Energy
|
|
Energy
|
|
||||||||||||||
|
(in millions)
|
Energy
|
|
Carolinas
|
|
Energy
|
|
Progress
|
|
Florida
|
|
Ohio
|
|
Indiana
|
|
|||||||||||||
|
Service cost
|
$
|
167
|
|
$
|
49
|
|
$
|
60
|
|
$
|
22
|
|
$
|
30
|
|
$
|
6
|
|
$
|
11
|
|
||||||
|
Interest cost on projected benefit obligation
|
320
|
|
80
|
|
116
|
|
50
|
|
53
|
|
21
|
|
28
|
|
|||||||||||||
|
Expected return on plan assets
|
(549
|
)
|
(148
|
)
|
(199
|
)
|
(94
|
)
|
(87
|
)
|
(31
|
)
|
(46
|
)
|
|||||||||||||
|
Amortization of actuarial loss
|
244
|
|
60
|
|
101
|
|
46
|
|
49
|
|
13
|
|
24
|
|
|||||||||||||
|
Amortization of prior service (credit) cost
|
(11
|
)
|
(6
|
)
|
(4
|
)
|
(1
|
)
|
(2
|
)
|
—
|
|
1
|
|
|||||||||||||
|
Other
|
7
|
|
2
|
|
2
|
|
1
|
|
1
|
|
—
|
|
1
|
|
|||||||||||||
|
Net periodic pension costs
(a)(b)
|
$
|
178
|
|
$
|
37
|
|
$
|
76
|
|
$
|
24
|
|
$
|
44
|
|
$
|
9
|
|
$
|
19
|
|
||||||
|
(a)
|
Duke Energy amounts exclude
$9 million
,
$10 million
, and
$12 million
for the years ended December 2015, 2014, and 2013, respectively, of regulatory asset amortization resulting from purchase accounting adjustments associated with Duke Energy's merger with Cinergy in April 2006.
|
|
(b)
|
Duke Energy Ohio amounts exclude
$4 million
,
$5 million
, and
$6 million
for the years ended December 2015, 2014, and 2013, respectively, of regulatory asset amortization resulting from purchase accounting adjustments associated with Duke Energy's merger with Cinergy in April 2006.
|
203
PART II
DUKE ENERGY CORPORATION - DUKE ENERGY CAROLINAS, LLC - PROGRESS ENERGY, INC. –
DUKE ENERGY PROGRESS, LLC – DUKE ENERGY FLORIDA, LLC - DUKE ENERGY OHIO, INC. - DUKE ENERGY INDIANA, INC.
Combined Notes To Consolidated Financial Statements – (Continued)
Amounts Recognized in Accumulated Other Comprehensive Income and Regulatory Assets
|
|
Year Ended December 31, 2015
|
||||||||||||||||||||||||||
|
Duke
|
|
Duke
|
|
Duke
|
|
Duke
|
|
Duke
|
|
||||||||||||||||||
|
Duke
|
|
Energy
|
|
Progress
|
|
Energy
|
|
Energy
|
|
Energy
|
|
Energy
|
|
||||||||||||||
|
(in millions)
|
Energy
|
|
Carolinas
|
|
Energy
|
|
Progress
|
|
Florida
|
|
Ohio
|
|
Indiana
|
|
|||||||||||||
|
Regulatory assets, net increase
|
$
|
173
|
|
$
|
65
|
|
$
|
18
|
|
$
|
14
|
|
$
|
4
|
|
$
|
14
|
|
$
|
11
|
|
||||||
|
Accumulated other comprehensive loss (income)
|
|||||||||||||||||||||||||||
|
Deferred income tax expense
|
$
|
6
|
|
—
|
|
5
|
|
—
|
|
—
|
|
—
|
|
—
|
|
||||||||||||
|
Actuarial losses arising during the year
|
4
|
|
—
|
|
—
|
|
—
|
|
—
|
|
—
|
|
—
|
|
|||||||||||||
|
Amortization of prior year service credit
|
1
|
|
—
|
|
—
|
|
—
|
|
—
|
|
—
|
|
—
|
|
|||||||||||||
|
Amortization of prior year actuarial losses
|
(11
|
)
|
—
|
|
(4
|
)
|
—
|
|
—
|
|
—
|
|
—
|
|
|||||||||||||
|
Transfer with the disposal group
|
3
|
|
|||||||||||||||||||||||||
|
Reclassification of actuarial losses to regulatory assets
|
(6
|
)
|
—
|
|
—
|
|
—
|
|
—
|
|
—
|
|
—
|
|
|||||||||||||
|
Net amount recognized in accumulated other comprehensive income
|
$
|
(3
|
)
|
$
|
—
|
|
$
|
1
|
|
$
|
—
|
|
$
|
—
|
|
$
|
—
|
|
$
|
—
|
|
||||||
|
|
Year Ended December 31, 2014
|
||||||||||||||||||||||||||
|
Duke
|
|
Duke
|
|
Duke
|
|
Duke
|
|
Duke
|
|
||||||||||||||||||
|
Duke
|
|
Energy
|
|
Progress
|
|
Energy
|
|
Energy
|
|
Energy
|
|
Energy
|
|
||||||||||||||
|
(in millions)
|
Energy
|
|
Carolinas
|
|
Energy
|
|
Progress
|
|
Florida
|
|
Ohio
|
|
Indiana
|
|
|||||||||||||
|
Regulatory assets, net increase (decrease)
|
$
|
112
|
|
$
|
30
|
|
$
|
(73
|
)
|
$
|
(17
|
)
|
$
|
11
|
|
$
|
17
|
|
$
|
4
|
|
||||||
|
Accumulated other comprehensive (income) loss
|
|
|
|
|
|
|
|
|
|
|
|
|
|
|
|||||||||||||
|
Deferred income tax expense
|
$
|
(10
|
)
|
$
|
—
|
|
$
|
(2
|
)
|
$
|
—
|
|
$
|
—
|
|
$
|
—
|
|
$
|
—
|
|
||||||
|
Actuarial losses arising during the year
|
29
|
|
—
|
|
—
|
|
—
|
|
—
|
|
—
|
|
—
|
|
|||||||||||||
|
Prior year service credit arising during the year
|
—
|
|
—
|
|
—
|
|
—
|
|
—
|
|
—
|
|
—
|
|
|||||||||||||
|
Amortization of prior year actuarial losses
|
(9
|
)
|
—
|
|
—
|
|
—
|
|
—
|
|
—
|
|
—
|
|
|||||||||||||
|
Reclassification of actuarial losses to regulatory assets
|
(1
|
)
|
—
|
|
—
|
|
—
|
|
—
|
|
—
|
|
—
|
|
|||||||||||||
|
Net amount recognized in accumulated other comprehensive income
|
$
|
9
|
|
$
|
—
|
|
$
|
(2
|
)
|
$
|
—
|
|
$
|
—
|
|
$
|
—
|
|
$
|
—
|
|
||||||
204
PART II
DUKE ENERGY CORPORATION - DUKE ENERGY CAROLINAS, LLC - PROGRESS ENERGY, INC. –
DUKE ENERGY PROGRESS, LLC – DUKE ENERGY FLORIDA, LLC - DUKE ENERGY OHIO, INC. - DUKE ENERGY INDIANA, INC.
Combined Notes To Consolidated Financial Statements – (Continued)
Reconciliation of Funded Status to Net Amount Recognized
|
|
Year Ended December 31, 2015
|
||||||||||||||||||||||||||
|
Duke
|
|
Duke
|
|
Duke
|
|
Duke
|
|
Duke
|
|
||||||||||||||||||
|
Duke
|
|
Energy
|
|
Progress
|
|
Energy
|
|
Energy
|
|
Energy
|
|
Energy
|
|
||||||||||||||
|
(in millions)
|
Energy
|
|
Carolinas
|
|
Energy
|
|
Progress
|
|
Florida
|
|
Ohio
|
|
Indiana
|
|
|||||||||||||
|
Change in Projected Benefit Obligation
|
|
|
|
|
|
|
|
|
|||||||||||||||||||
|
Obligation at prior measurement date
|
$
|
8,107
|
|
$
|
2,053
|
|
$
|
2,557
|
|
$
|
1,187
|
|
$
|
1,335
|
|
$
|
469
|
|
$
|
673
|
|
||||||
|
Obligation transferred with the Disposal Group
|
(83
|
)
|
—
|
|
—
|
|
—
|
|
—
|
|
—
|
|
—
|
|
|||||||||||||
|
Service cost
|
159
|
|
50
|
|
44
|
|
23
|
|
20
|
|
4
|
|
10
|
|
|||||||||||||
|
Interest cost
|
324
|
|
83
|
|
104
|
|
48
|
|
54
|
|
18
|
|
27
|
|
|||||||||||||
|
Actuarial gain
|
(241
|
)
|
(53
|
)
|
(111
|
)
|
(46
|
)
|
(62
|
)
|
(9
|
)
|
(15
|
)
|
|||||||||||||
|
Transfers
|
—
|
|
8
|
|
4
|
|
7
|
|
(3
|
)
|
8
|
|
—
|
|
|||||||||||||
|
Plan amendments
|
(6
|
)
|
—
|
|
—
|
|
—
|
|
—
|
|
—
|
|
(4
|
)
|
|||||||||||||
|
Benefits paid
|
(533
|
)
|
(146
|
)
|
(147
|
)
|
(76
|
)
|
(68
|
)
|
(37
|
)
|
(42
|
)
|
|||||||||||||
|
Obligation at measurement date
|
$
|
7,727
|
|
$
|
1,995
|
|
$
|
2,451
|
|
$
|
1,143
|
|
$
|
1,276
|
|
$
|
453
|
|
$
|
649
|
|
||||||
|
Accumulated Benefit Obligation at measurement date
|
$
|
7,606
|
|
$
|
1,993
|
|
$
|
2,414
|
|
$
|
1,143
|
|
$
|
1,240
|
|
$
|
442
|
|
$
|
628
|
|
||||||
|
Change in Fair Value of Plan Assets
|
|
|
|
|
|
|
|
|
|
|
|
|
|
|
|||||||||||||
|
Plan assets at prior measurement date
|
$
|
8,498
|
|
$
|
2,300
|
|
$
|
2,722
|
|
$
|
1,321
|
|
$
|
1,363
|
|
$
|
456
|
|
$
|
681
|
|
||||||
|
Plan assets transferred with the Disposal Group
|
(81
|
)
|
—
|
|
—
|
|
—
|
|
—
|
|
—
|
|
—
|
|
|||||||||||||
|
Employer contributions
|
302
|
|
91
|
|
83
|
|
42
|
|
40
|
|
8
|
|
19
|
|
|||||||||||||
|
Actual return on plan assets
|
(50
|
)
|
(10
|
)
|
(22
|
)
|
(10
|
)
|
(11
|
)
|
(2
|
)
|
(3
|
)
|
|||||||||||||
|
Benefits paid
|
(533
|
)
|
(146
|
)
|
(147
|
)
|
(76
|
)
|
(68
|
)
|
(37
|
)
|
(42
|
)
|
|||||||||||||
|
Transfers
|
—
|
|
8
|
|
4
|
|
7
|
|
(3
|
)
|
8
|
|
—
|
|
|||||||||||||
|
Plan assets at measurement date
|
$
|
8,136
|
|
$
|
2,243
|
|
$
|
2,640
|
|
$
|
1,284
|
|
$
|
1,321
|
|
$
|
433
|
|
$
|
655
|
|
||||||
|
Funded status of plan
|
$
|
409
|
|
$
|
248
|
|
$
|
189
|
|
$
|
141
|
|
$
|
45
|
|
$
|
(20
|
)
|
$
|
6
|
|
||||||
|
|
Year Ended December 31, 2014
|
||||||||||||||||||||||||||
|
Duke
|
|
Duke
|
|
Duke
|
|
Duke
|
|
Duke
|
|
||||||||||||||||||
|
Duke
|
|
Energy
|
|
Progress
|
|
Energy
|
|
Energy
|
|
Energy
|
|
Energy
|
|
||||||||||||||
|
(in millions)
|
Energy
|
|
Carolinas
|
|
Energy
|
|
Progress
|
|
Florida
|
|
Ohio
|
|
Indiana
|
|
|||||||||||||
|
Change in Projected Benefit Obligation
|
|
|
|
|
|
|
|
||||||||||||||||||||
|
Obligation at prior measurement date
|
$
|
7,510
|
|
$
|
1,875
|
|
$
|
2,739
|
|
$
|
1,172
|
|
$
|
1,233
|
|
$
|
442
|
|
$
|
632
|
|
||||||
|
Service cost
|
135
|
|
41
|
|
40
|
|
21
|
|
20
|
|
4
|
|
9
|
|
|||||||||||||
|
Interest cost
|
344
|
|
85
|
|
112
|
|
54
|
|
57
|
|
20
|
|
29
|
|
|||||||||||||
|
Actuarial loss
(a)
|
618
|
|
132
|
|
211
|
|
98
|
|
105
|
|
41
|
|
41
|
|
|||||||||||||
|
Transfers
|
—
|
|
37
|
|
(375
|
)
|
(61
|
)
|
(9
|
)
|
(6
|
)
|
—
|
|
|||||||||||||
|
Plan amendments
|
(4
|
)
|
(1
|
)
|
—
|
|
—
|
|
—
|
|
(1
|
)
|
—
|
|
|||||||||||||
|
Benefits paid
|
(496
|
)
|
(116
|
)
|
(170
|
)
|
(97
|
)
|
(71
|
)
|
(31
|
)
|
(38
|
)
|
|||||||||||||
|
Obligation at measurement date
|
$
|
8,107
|
|
$
|
2,053
|
|
$
|
2,557
|
|
$
|
1,187
|
|
$
|
1,335
|
|
$
|
469
|
|
$
|
673
|
|
||||||
|
Accumulated Benefit Obligation at measurement date
|
$
|
7,966
|
|
$
|
2,052
|
|
$
|
2,519
|
|
$
|
1,187
|
|
$
|
1,297
|
|
$
|
459
|
|
$
|
645
|
|
||||||
|
Change in Fair Value of Plan Assets
|
|
|
|
|
|
|
|
|
|
|
|
|
|
|
|||||||||||||
|
Plan assets at prior measurement date
|
$
|
8,142
|
|
$
|
2,162
|
|
$
|
2,944
|
|
$
|
1,330
|
|
$
|
1,299
|
|
$
|
448
|
|
$
|
654
|
|
||||||
|
Actual return on plan assets
|
852
|
|
217
|
|
300
|
|
149
|
|
144
|
|
45
|
|
65
|
|
|||||||||||||
|
Benefits paid
|
(496
|
)
|
(116
|
)
|
(170
|
)
|
(97
|
)
|
(71
|
)
|
(31
|
)
|
(38
|
)
|
|||||||||||||
|
Transfers
|
—
|
|
37
|
|
(352
|
)
|
(61
|
)
|
(9
|
)
|
(6
|
)
|
—
|
|
|||||||||||||
|
Plan assets at measurement date
|
$
|
8,498
|
|
$
|
2,300
|
|
$
|
2,722
|
|
$
|
1,321
|
|
$
|
1,363
|
|
$
|
456
|
|
$
|
681
|
|
||||||
|
Funded status of plan
|
$
|
391
|
|
$
|
247
|
|
$
|
165
|
|
$
|
134
|
|
$
|
28
|
|
$
|
(13
|
)
|
$
|
8
|
|
||||||
|
(a)
|
Includes an increase in benefit obligation of
$180 million
as a result of changes in Duke Energy's mortality assumptions.
|
205
PART II
DUKE ENERGY CORPORATION - DUKE ENERGY CAROLINAS, LLC - PROGRESS ENERGY, INC. –
DUKE ENERGY PROGRESS, LLC – DUKE ENERGY FLORIDA, LLC - DUKE ENERGY OHIO, INC. - DUKE ENERGY INDIANA, INC.
Combined Notes To Consolidated Financial Statements – (Continued)
Amounts Recognized in the Consolidated Balance Sheets
|
|
December 31, 2015
|
||||||||||||||||||||||||||
|
Duke
|
|
Duke
|
|
Duke
|
|
Duke
|
|
Duke
|
|
||||||||||||||||||
|
Duke
|
|
Energy
|
|
Progress
|
|
Energy
|
|
Energy
|
|
Energy
|
|
Energy
|
|
||||||||||||||
|
(in millions)
|
Energy
|
|
Carolinas
|
|
Energy
|
|
Progress
|
|
Florida
|
|
Ohio
|
|
Indiana
|
|
|||||||||||||
|
Prefunded pension
(a)
|
$
|
474
|
|
$
|
252
|
|
$
|
232
|
|
$
|
145
|
|
$
|
84
|
|
$
|
1
|
|
$
|
6
|
|
||||||
|
Noncurrent pension liability
(b)
|
$
|
65
|
|
$
|
4
|
|
$
|
43
|
|
$
|
4
|
|
$
|
39
|
|
$
|
21
|
|
$
|
—
|
|
||||||
|
Net asset recognized
|
$
|
409
|
|
$
|
248
|
|
$
|
189
|
|
$
|
141
|
|
$
|
45
|
|
$
|
(20
|
)
|
$
|
6
|
|
||||||
|
Regulatory assets
|
$
|
1,884
|
|
$
|
472
|
|
$
|
771
|
|
$
|
360
|
|
$
|
410
|
|
$
|
79
|
|
$
|
162
|
|
||||||
|
Accumulated other comprehensive (income) loss
|
|
|
|
|
|
|
|
|
|
|
|
|
|
|
|||||||||||||
|
Deferred income tax asset
|
$
|
(45
|
)
|
$
|
—
|
|
$
|
(6
|
)
|
$
|
—
|
|
$
|
—
|
|
$
|
—
|
|
$
|
—
|
|
||||||
|
Prior service credit
|
(4
|
)
|
—
|
|
—
|
|
—
|
|
—
|
|
—
|
|
—
|
|
|||||||||||||
|
Net actuarial loss
|
130
|
|
—
|
|
17
|
|
—
|
|
—
|
|
—
|
|
—
|
|
|||||||||||||
|
Net amounts recognized in accumulated other comprehensive loss
(c)
|
$
|
81
|
|
$
|
—
|
|
$
|
11
|
|
$
|
—
|
|
$
|
—
|
|
$
|
—
|
|
$
|
—
|
|
||||||
|
Amounts to be recognized in net periodic pension costs in the next year
|
|
|
|
|
|
|
|
|
|
|
|
|
|
|
|||||||||||||
|
Unrecognized net actuarial loss
|
$
|
132
|
|
$
|
31
|
|
$
|
59
|
|
$
|
25
|
|
$
|
31
|
|
$
|
4
|
|
$
|
11
|
|
||||||
|
Unrecognized prior service credit
|
(16
|
)
|
(8
|
)
|
(3
|
)
|
(2
|
)
|
(1
|
)
|
—
|
|
—
|
|
|||||||||||||
|
|
December 31, 2014
|
||||||||||||||||||||||||||
|
Duke
|
|
Duke
|
|
Duke
|
|
Duke
|
|
Duke
|
|
||||||||||||||||||
|
Duke
|
|
Energy
|
|
Progress
|
|
Energy
|
|
Energy
|
|
Energy
|
|
Energy
|
|
||||||||||||||
|
(in millions)
|
Energy
|
|
Carolinas
|
|
Energy
|
|
Progress
|
|
Florida
|
|
Ohio
|
|
Indiana
|
|
|||||||||||||
|
Prefunded pension
(a)
|
$
|
441
|
|
$
|
247
|
|
$
|
165
|
|
$
|
134
|
|
$
|
28
|
|
$
|
—
|
|
$
|
8
|
|
||||||
|
Noncurrent pension liability
(b)
|
$
|
50
|
|
$
|
—
|
|
$
|
—
|
|
$
|
—
|
|
$
|
—
|
|
$
|
13
|
|
$
|
—
|
|
||||||
|
Net asset recognized
|
$
|
391
|
|
$
|
247
|
|
$
|
165
|
|
$
|
134
|
|
$
|
28
|
|
$
|
(13
|
)
|
$
|
8
|
|
||||||
|
Regulatory assets
|
$
|
1,711
|
|
$
|
407
|
|
$
|
753
|
|
$
|
346
|
|
$
|
406
|
|
$
|
65
|
|
$
|
151
|
|
||||||
|
Accumulated other comprehensive (income) loss
|
|
|
|
|
|
|
|
|
|
|
|
|
|
|
|||||||||||||
|
Deferred income tax asset
|
$
|
(51
|
)
|
$
|
—
|
|
$
|
(11
|
)
|
$
|
—
|
|
$
|
—
|
|
$
|
—
|
|
$
|
—
|
|
||||||
|
Prior service credit
|
(5
|
)
|
—
|
|
—
|
|
—
|
|
—
|
|
—
|
|
—
|
|
|||||||||||||
|
Net actuarial loss
|
140
|
|
—
|
|
21
|
|
—
|
|
—
|
|
—
|
|
—
|
|
|||||||||||||
|
Net amounts recognized in accumulated other comprehensive loss
(c)
|
$
|
84
|
|
$
|
—
|
|
$
|
10
|
|
$
|
—
|
|
$
|
—
|
|
$
|
—
|
|
$
|
—
|
|
||||||
|
(a)
|
Included in Other within Investments and Other Assets on the Consolidated Balance Sheets.
|
|
(b)
|
Included in Accrued pension and other post-retirement benefit costs on the Consolidated Balance Sheets.
|
|
(c)
|
Excludes accumulated other comprehensive income of
$13 million
and
$22 million
as of December 31,
2015
and
2014
, respectively, net of tax, associated with a Brazilian retirement plan.
|
Information for Plans with Accumulated Benefit Obligation in Excess of Plan Assets
|
|
December 31, 2015
|
||||||||||||||
|
Duke
|
|
Duke
|
|
||||||||||||
|
Duke
|
|
Progress
|
|
Energy
|
|
Energy
|
|
||||||||
|
(in millions)
|
Energy
|
|
Energy
|
|
Florida
|
|
Ohio
|
|
|||||||
|
Projected benefit obligation
|
$
|
1,216
|
|
$
|
611
|
|
$
|
611
|
|
$
|
307
|
|
|||
|
Accumulated benefit obligation
|
1,158
|
|
575
|
|
575
|
|
298
|
|
|||||||
|
Fair value of plan assets
|
1,151
|
|
574
|
|
574
|
|
289
|
|
|||||||
206
PART II
DUKE ENERGY CORPORATION - DUKE ENERGY CAROLINAS, LLC - PROGRESS ENERGY, INC. –
DUKE ENERGY PROGRESS, LLC – DUKE ENERGY FLORIDA, LLC - DUKE ENERGY OHIO, INC. - DUKE ENERGY INDIANA, INC.
Combined Notes To Consolidated Financial Statements – (Continued)
|
|
December 31, 2014
|
||||||
|
Duke
|
|
||||||
|
Duke
|
|
Energy
|
|
||||
|
(in millions)
|
Energy
|
|
Ohio
|
|
|||
|
Projected benefit obligation
|
$
|
702
|
|
$
|
315
|
|
|
|
Accumulated benefit obligation
|
672
|
|
306
|
|
|||
|
Fair value of plan assets
|
652
|
|
302
|
|
|||
Assumptions Used for Pension Benefits Accounting
The discount rate used to determine the current year pension obligation and following year’s pension expense is based on a bond selection-settlement portfolio approach. This approach develops a discount rate by selecting a portfolio of high quality corporate bonds that generate sufficient cash flow to provide for projected benefit payments of the plan. The selected bond portfolio is derived from a universe of non-callable corporate bonds rated Aa quality or higher. After the bond portfolio is selected, a single interest rate is determined that equates the present value of the plan’s projected benefit payments discounted at this rate with the market value of the bonds selected.
The average remaining service period of active covered employees is
seven years
for Duke Energy, Duke Energy Carolinas, Progress Energy, Duke Energy Progress, Duke Energy Florida, Duke Energy Ohio and Duke Energy Indiana.
The following tables present the assumptions or range of assumptions used for pension benefit accounting.
|
|
December 31,
|
||||||||||||||
|
|
2015
|
2014
|
2013
|
||||||||||||
|
Benefit Obligations
|
|
|
|
||||||||||||
|
Discount rate
|
4.40%
|
4.10%
|
4.70%
|
||||||||||||
|
Salary increase
|
4.00
|
%
|
-
|
4.40%
|
4.00
|
%
|
-
|
4.40%
|
4.00
|
%
|
-
|
4.40%
|
|||
|
Net Periodic Benefit Cost
|
|
|
|
||||||||||||
|
Discount rate
|
4.10%
|
4.70%
|
|
|
4.10%
|
||||||||||
|
Salary increase
|
4.00
|
%
|
-
|
4.40%
|
4.00
|
%
|
-
|
4.40%
|
4.00
|
%
|
-
|
4.30%
|
|||
|
Expected long-term rate of return on plan assets
|
6.50%
|
6.75%
|
|
|
7.75%
|
||||||||||
Expected Benefit Payments
|
Duke
|
|
Duke
|
|
Duke
|
|
Duke
|
|
Duke
|
|
||||||||||||
|
Duke
|
|
Energy
|
|
Progress
|
|
Energy
|
|
Energy
|
|
Energy
|
|
Energy
|
|
||||||||
|
(in millions)
|
Energy
|
|
Carolinas
|
|
Energy
|
|
Progress
|
|
Florida
|
|
Ohio
|
|
Indiana
|
|
|||||||
|
Years ending December 31,
|
|
|
|
|
|
|
|
||||||||||||||
|
2016
|
$
|
628
|
|
$
|
189
|
|
$
|
164
|
|
$
|
91
|
|
$
|
71
|
|
$
|
35
|
|
$
|
48
|
|
|
2017
|
639
|
|
199
|
|
167
|
|
92
|
|
73
|
|
35
|
|
47
|
|
|||||||
|
2018
|
640
|
|
203
|
|
169
|
|
92
|
|
75
|
|
34
|
|
47
|
|
|||||||
|
2019
|
643
|
|
202
|
|
171
|
|
91
|
|
77
|
|
34
|
|
47
|
|
|||||||
|
2020
|
641
|
|
201
|
|
174
|
|
92
|
|
80
|
|
35
|
|
47
|
|
|||||||
|
2021 – 2025
|
3,053
|
|
906
|
|
869
|
|
438
|
|
420
|
|
171
|
|
230
|
|
|||||||
207
PART II
DUKE ENERGY CORPORATION - DUKE ENERGY CAROLINAS, LLC - PROGRESS ENERGY, INC. –
DUKE ENERGY PROGRESS, LLC – DUKE ENERGY FLORIDA, LLC - DUKE ENERGY OHIO, INC. - DUKE ENERGY INDIANA, INC.
Combined Notes To Consolidated Financial Statements – (Continued)
NON-QUALIFIED PENSION PLANS
Components of Net Periodic Pension Costs
|
|
Year Ended December 31, 2015
|
||||||||||||||||||||
|
Duke
|
|
Duke
|
|
Duke
|
|
Duke
|
|
Duke
|
|
||||||||||||
|
Duke
|
|
Energy
|
|
Progress
|
|
Energy
|
|
Energy
|
|
Energy
|
|
Energy
|
|
||||||||
|
(in millions)
|
Energy
|
|
Carolinas
|
|
Energy
|
|
Progress
|
|
Florida
|
|
Ohio
|
|
Indiana
|
|
|||||||
|
Service cost
|
$
|
3
|
|
$
|
—
|
|
$
|
1
|
|
$
|
—
|
|
$
|
—
|
|
$
|
—
|
|
$
|
—
|
|
|
Interest cost on projected benefit obligation
|
13
|
|
1
|
|
4
|
|
1
|
|
2
|
|
—
|
|
—
|
|
|||||||
|
Amortization of actuarial loss
|
6
|
|
—
|
|
2
|
|
1
|
|
2
|
|
—
|
|
1
|
|
|||||||
|
Amortization of prior service credit
|
(1
|
)
|
—
|
|
(1
|
)
|
—
|
|
—
|
|
—
|
|
—
|
|
|||||||
|
Net periodic pension costs
|
$
|
21
|
|
$
|
1
|
|
$
|
6
|
|
$
|
2
|
|
$
|
4
|
|
$
|
—
|
|
$
|
1
|
|
|
|
Year Ended December 31, 2014
|
||||||||||||||||||||
|
Duke
|
|
Duke
|
|
Duke
|
|
Duke
|
|
Duke
|
|
||||||||||||
|
Duke
|
|
Energy
|
|
Progress
|
|
Energy
|
|
Energy
|
|
Energy
|
|
Energy
|
|
||||||||
|
(in millions)
|
Energy
|
|
Carolinas
|
|
Energy
|
|
Progress
|
|
Florida
|
|
Ohio
|
|
Indiana
|
|
|||||||
|
Service cost
|
$
|
3
|
|
$
|
—
|
|
$
|
1
|
|
$
|
1
|
|
$
|
—
|
|
$
|
—
|
|
$
|
—
|
|
|
Interest cost on projected benefit obligation
|
14
|
|
1
|
|
5
|
|
1
|
|
2
|
|
—
|
|
—
|
|
|||||||
|
Amortization of actuarial loss
|
3
|
|
—
|
|
2
|
|
—
|
|
—
|
|
—
|
|
—
|
|
|||||||
|
Amortization of prior service credit
|
(1
|
)
|
—
|
|
(1
|
)
|
—
|
|
—
|
|
—
|
|
—
|
|
|||||||
|
Net periodic pension costs
|
$
|
19
|
|
$
|
1
|
|
$
|
7
|
|
$
|
2
|
|
$
|
2
|
|
$
|
—
|
|
$
|
—
|
|
|
|
Year Ended December 31, 2013
|
||||||||||||||||||||
|
Duke
|
|
Duke
|
|
Duke
|
|
Duke
|
|
Duke
|
|
||||||||||||
|
Duke
|
|
Energy
|
|
Progress
|
|
Energy
|
|
Energy
|
|
Energy
|
|
Energy
|
|
||||||||
|
(in millions)
|
Energy
|
|
Carolinas
|
|
Energy
|
|
Progress
|
|
Florida
|
|
Ohio
|
|
Indiana
|
|
|||||||
|
Service cost
|
$
|
3
|
|
$
|
—
|
|
$
|
1
|
|
$
|
1
|
|
$
|
—
|
|
$
|
—
|
|
$
|
—
|
|
|
Interest cost on projected benefit obligation
|
13
|
|
1
|
|
7
|
|
1
|
|
1
|
|
—
|
|
—
|
|
|||||||
|
Amortization of actuarial loss
|
5
|
|
—
|
|
3
|
|
1
|
|
1
|
|
—
|
|
—
|
|
|||||||
|
Amortization of prior service credit
|
(1
|
)
|
—
|
|
(1
|
)
|
—
|
|
—
|
|
—
|
|
—
|
|
|||||||
|
Net periodic pension costs
|
$
|
20
|
|
$
|
1
|
|
$
|
10
|
|
$
|
3
|
|
$
|
2
|
|
$
|
—
|
|
$
|
—
|
|
208
PART II
DUKE ENERGY CORPORATION - DUKE ENERGY CAROLINAS, LLC - PROGRESS ENERGY, INC. –
DUKE ENERGY PROGRESS, LLC – DUKE ENERGY FLORIDA, LLC - DUKE ENERGY OHIO, INC. - DUKE ENERGY INDIANA, INC.
Combined Notes To Consolidated Financial Statements – (Continued)
Amounts Recognized in Accumulated Other Comprehensive Income and Regulatory Assets and Liabilities
|
|
Year Ended December 31, 2015
|
||||||||||||||||||||
|
Duke
|
|
Duke
|
|
Duke
|
|
Duke
|
|
Duke
|
|
||||||||||||
|
Duke
|
|
Energy
|
|
Progress
|
|
Energy
|
|
Energy
|
|
Energy
|
|
Energy
|
|
||||||||
|
(in millions)
|
Energy
|
|
Carolinas
|
|
Energy
|
|
Progress
|
|
Florida
|
|
Ohio
|
|
Indiana
|
|
|||||||
|
Regulatory assets, net (decrease) increase
|
$
|
(13
|
)
|
$
|
2
|
|
$
|
(16
|
)
|
$
|
(1
|
)
|
$
|
(15
|
)
|
$
|
—
|
|
$
|
(1
|
)
|
|
Accumulated other comprehensive (income) loss
|
|
|
|
|
|
|
|
|
|
|
|
|
|
|
|||||||
|
Deferred income tax benefit
|
$
|
(7
|
)
|
$
|
—
|
|
$
|
(5
|
)
|
$
|
—
|
|
$
|
—
|
|
$
|
—
|
|
$
|
—
|
|
|
Amortization of prior service credit
|
1
|
|
—
|
|
—
|
|
—
|
|
—
|
|
—
|
|
—
|
|
|||||||
|
Actuarial gains arising during the year
|
17
|
|
—
|
|
13
|
|
—
|
|
—
|
|
—
|
|
—
|
|
|||||||
|
Net amount recognized in accumulated other comprehensive loss (income)
|
$
|
11
|
|
$
|
—
|
|
$
|
8
|
|
$
|
—
|
|
$
|
—
|
|
$
|
—
|
|
$
|
—
|
|
|
|
Year Ended December 31, 2014
|
||||||||||||||||||||
|
Duke
|
|
Duke
|
|
Duke
|
|
Duke
|
|
Duke
|
|
||||||||||||
|
Duke
|
|
Energy
|
|
Progress
|
|
Energy
|
|
Energy
|
|
Energy
|
|
Energy
|
|
||||||||
|
(in millions)
|
Energy
|
|
Carolinas
|
|
Energy
|
|
Progress
|
|
Florida
|
|
Ohio
|
|
Indiana
|
|
|||||||
|
Regulatory assets, net increase
|
$
|
44
|
|
$
|
1
|
|
$
|
14
|
|
$
|
4
|
|
$
|
19
|
|
$
|
1
|
|
$
|
2
|
|
|
Regulatory liabilities, net decrease
|
$
|
(7
|
)
|
$
|
—
|
|
$
|
—
|
|
$
|
—
|
|
$
|
—
|
|
$
|
—
|
|
$
|
—
|
|
|
Accumulated other comprehensive (income) loss
|
|
|
|
|
|
|
|
|
|
|
|
|
|
|
|||||||
|
Deferred income tax benefit
|
$
|
4
|
|
$
|
—
|
|
$
|
5
|
|
$
|
—
|
|
$
|
—
|
|
$
|
—
|
|
$
|
—
|
|
|
Actuarial gains arising during the year
|
(9
|
)
|
—
|
|
(11
|
)
|
—
|
|
—
|
|
—
|
|
—
|
|
|||||||
|
Net amount recognized in accumulated other comprehensive loss (income)
|
$
|
(5
|
)
|
$
|
—
|
|
$
|
(6
|
)
|
$
|
—
|
|
$
|
—
|
|
$
|
—
|
|
$
|
—
|
|
Reconciliation of Funded Status to Net Amount Recognized
|
|
Year Ended December 31, 2015
|
||||||||||||||||||||
|
Duke
|
|
Duke
|
|
Duke
|
|
Duke
|
|
Duke
|
|
||||||||||||
|
Duke
|
|
Energy
|
|
Progress
|
|
Energy
|
|
Energy
|
|
Energy
|
|
Energy
|
|
||||||||
|
(in millions)
|
Energy
|
|
Carolinas
|
|
Energy
|
|
Progress
|
|
Florida
|
|
Ohio
|
|
Indiana
|
|
|||||||
|
Change in Projected Benefit Obligation
|
|
|
|
|
|
|
|
|
|
|
|
|
|
|
|||||||
|
Obligation at prior measurement date
|
$
|
337
|
|
$
|
16
|
|
$
|
116
|
|
$
|
35
|
|
$
|
61
|
|
$
|
4
|
|
$
|
5
|
|
|
Service cost
|
3
|
|
—
|
|
1
|
|
—
|
|
—
|
|
—
|
|
—
|
|
|||||||
|
Interest cost
|
13
|
|
1
|
|
4
|
|
1
|
|
2
|
|
—
|
|
—
|
|
|||||||
|
Actuarial losses (gains)
|
10
|
|
1
|
|
(1
|
)
|
—
|
|
(14
|
)
|
—
|
|
—
|
|
|||||||
|
Transfers
|
4
|
|
—
|
|
—
|
|
—
|
|
—
|
|
—
|
|
—
|
|
|||||||
|
Benefits paid
|
(26
|
)
|
(2
|
)
|
(8
|
)
|
(3
|
)
|
(3
|
)
|
—
|
|
—
|
|
|||||||
|
Obligation at measurement date
|
$
|
341
|
|
$
|
16
|
|
$
|
112
|
|
$
|
33
|
|
$
|
46
|
|
$
|
4
|
|
$
|
5
|
|
|
Accumulated Benefit Obligation at measurement date
|
$
|
336
|
|
$
|
16
|
|
$
|
112
|
|
$
|
33
|
|
$
|
46
|
|
$
|
4
|
|
$
|
5
|
|
|
Change in Fair Value of Plan Assets
|
|
|
|
|
|
|
|
|
|
|
|
|
|
|
|||||||
|
Plan assets at prior measurement date
|
—
|
|
—
|
|
—
|
|
—
|
|
—
|
|
—
|
|
—
|
|
|||||||
|
Benefits paid
|
(26
|
)
|
(2
|
)
|
(8
|
)
|
(3
|
)
|
(3
|
)
|
—
|
|
—
|
|
|||||||
|
Employer contributions
|
26
|
|
2
|
|
8
|
|
3
|
|
3
|
|
—
|
|
—
|
|
|||||||
|
Plan assets at measurement date
|
$
|
—
|
|
$
|
—
|
|
$
|
—
|
|
$
|
—
|
|
$
|
—
|
|
$
|
—
|
|
$
|
—
|
|
209
PART II
DUKE ENERGY CORPORATION - DUKE ENERGY CAROLINAS, LLC - PROGRESS ENERGY, INC. –
DUKE ENERGY PROGRESS, LLC – DUKE ENERGY FLORIDA, LLC - DUKE ENERGY OHIO, INC. - DUKE ENERGY INDIANA, INC.
Combined Notes To Consolidated Financial Statements – (Continued)
|
|
Year Ended December 31, 2014
|
||||||||||||||||||||
|
Duke
|
|
Duke
|
|
Duke
|
|
Duke
|
|
Duke
|
|
||||||||||||
|
Duke
|
|
Energy
|
|
Progress
|
|
Energy
|
|
Energy
|
|
Energy
|
|
Energy
|
|
||||||||
|
(in millions)
|
Energy
|
|
Carolinas
|
|
Energy
|
|
Progress
|
|
Florida
|
|
Ohio
|
|
Indiana
|
|
|||||||
|
Change in Projected Benefit Obligation
|
|
|
|
|
|
|
|
|
|
|
|
|
|
||||||||
|
Obligation at prior measurement date
|
$
|
304
|
|
$
|
15
|
|
$
|
140
|
|
$
|
34
|
|
$
|
39
|
|
$
|
3
|
|
$
|
5
|
|
|
Service cost
|
3
|
|
—
|
|
1
|
|
1
|
|
—
|
|
—
|
|
—
|
|
|||||||
|
Interest cost
|
14
|
|
1
|
|
5
|
|
1
|
|
2
|
|
—
|
|
—
|
|
|||||||
|
Actuarial losses
(a)
|
43
|
|
2
|
|
11
|
|
2
|
|
20
|
|
1
|
|
1
|
|
|||||||
|
Settlements
|
—
|
|
—
|
|
—
|
|
—
|
|
—
|
|
—
|
|
—
|
|
|||||||
|
Plan amendments
|
—
|
|
—
|
|
—
|
|
—
|
|
—
|
|
—
|
|
—
|
|
|||||||
|
Transfers
|
—
|
|
—
|
|
(32
|
)
|
—
|
|
4
|
|
—
|
|
—
|
|
|||||||
|
Benefits paid
|
(27
|
)
|
(2
|
)
|
(9
|
)
|
(3
|
)
|
(4
|
)
|
—
|
|
(1
|
)
|
|||||||
|
Obligation at measurement date
|
$
|
337
|
|
$
|
16
|
|
$
|
116
|
|
$
|
35
|
|
$
|
61
|
|
$
|
4
|
|
$
|
5
|
|
|
Accumulated Benefit Obligation at measurement date
|
$
|
333
|
|
$
|
15
|
|
$
|
116
|
|
$
|
35
|
|
$
|
61
|
|
$
|
4
|
|
$
|
5
|
|
|
Change in Fair Value of Plan Assets
|
|
|
|
|
|
|
|
|
|
|
|
|
|
|
|||||||
|
Plan assets at prior measurement date
|
—
|
|
—
|
|
—
|
|
—
|
|
—
|
|
—
|
|
—
|
|
|||||||
|
Benefits paid
|
(27
|
)
|
(2
|
)
|
(9
|
)
|
(3
|
)
|
(4
|
)
|
—
|
|
(1
|
)
|
|||||||
|
Employer contributions
|
27
|
|
2
|
|
9
|
|
3
|
|
4
|
|
—
|
|
1
|
|
|||||||
|
Plan assets at measurement date
|
$
|
—
|
|
$
|
—
|
|
$
|
—
|
|
$
|
—
|
|
$
|
—
|
|
$
|
—
|
|
$
|
—
|
|
|
(a)
|
Includes an increase in benefit obligation of
$21 million
as a result of changes in Duke Energy's mortality assumptions.
|
Amounts Recognized in the Consolidated Balance Sheets
|
|
December 31, 2015
|
||||||||||||||||||||
|
Duke
|
|
Duke
|
|
Duke
|
|
Duke
|
|
Duke
|
|
||||||||||||
|
Duke
|
|
Energy
|
|
Progress
|
|
Energy
|
|
Energy
|
|
Energy
|
|
Energy
|
|
||||||||
|
(in millions)
|
Energy
|
|
Carolinas
|
|
Energy
|
|
Progress
|
|
Florida
|
|
Ohio
|
|
Indiana
|
|
|||||||
|
Current pension liability
(a)
|
$
|
27
|
|
$
|
2
|
|
$
|
8
|
|
$
|
3
|
|
$
|
3
|
|
$
|
—
|
|
$
|
—
|
|
|
Noncurrent pension liability
(b)
|
314
|
|
14
|
|
104
|
|
30
|
|
43
|
|
4
|
|
5
|
|
|||||||
|
Total accrued pension liability
|
$
|
341
|
|
$
|
16
|
|
$
|
112
|
|
$
|
33
|
|
$
|
46
|
|
$
|
4
|
|
$
|
5
|
|
|
Regulatory assets
|
$
|
76
|
|
$
|
7
|
|
$
|
16
|
|
$
|
6
|
|
$
|
10
|
|
$
|
1
|
|
$
|
1
|
|
|
Accumulated other comprehensive (income) loss
|
|
|
|
|
|
|
|
|
|
|
|
|
|||||||||
|
Deferred income tax liability
|
$
|
(3
|
)
|
$
|
—
|
|
$
|
(3
|
)
|
$
|
—
|
|
$
|
—
|
|
$
|
—
|
|
$
|
—
|
|
|
Net actuarial loss
|
9
|
|
—
|
|
9
|
|
—
|
|
—
|
|
—
|
|
—
|
|
|||||||
|
Net amounts recognized in accumulated other comprehensive income
|
$
|
6
|
|
$
|
—
|
|
$
|
6
|
|
$
|
—
|
|
$
|
—
|
|
$
|
—
|
|
$
|
—
|
|
|
Amounts to be recognized in net periodic pension expense in the next year
|
|
|
|
|
|
|
|
|
|
|
|
|
|||||||||
|
Unrecognized net actuarial loss
|
$
|
8
|
|
$
|
—
|
|
$
|
1
|
|
$
|
—
|
|
$
|
—
|
|
$
|
—
|
|
$
|
—
|
|
|
Unrecognized prior service credit
|
(1
|
)
|
—
|
|
—
|
|
—
|
|
—
|
|
—
|
|
—
|
|
|||||||
210
PART II
DUKE ENERGY CORPORATION - DUKE ENERGY CAROLINAS, LLC - PROGRESS ENERGY, INC. –
DUKE ENERGY PROGRESS, LLC – DUKE ENERGY FLORIDA, LLC - DUKE ENERGY OHIO, INC. - DUKE ENERGY INDIANA, INC.
Combined Notes To Consolidated Financial Statements – (Continued)
|
|
December 31, 2014
|
||||||||||||||||||||
|
Duke
|
|
Duke
|
|
Duke
|
|
Duke
|
|
Duke
|
|
||||||||||||
|
Duke
|
|
Energy
|
|
Progress
|
|
Energy
|
|
Energy
|
|
Energy
|
|
Energy
|
|
||||||||
|
(in millions)
|
Energy
|
|
Carolinas
|
|
Energy
|
|
Progress
|
|
Florida
|
|
Ohio
|
|
Indiana
|
|
|||||||
|
Current pension liability
(a)
|
$
|
27
|
|
$
|
2
|
|
$
|
8
|
|
$
|
3
|
|
$
|
4
|
|
$
|
—
|
|
$
|
—
|
|
|
Noncurrent pension liability
(b)
|
310
|
|
14
|
|
108
|
|
32
|
|
57
|
|
4
|
|
5
|
|
|||||||
|
Total accrued pension liability
|
$
|
337
|
|
$
|
16
|
|
$
|
116
|
|
$
|
35
|
|
$
|
61
|
|
$
|
4
|
|
$
|
5
|
|
|
Regulatory assets
|
$
|
89
|
|
$
|
5
|
|
$
|
32
|
|
$
|
7
|
|
$
|
25
|
|
$
|
1
|
|
$
|
2
|
|
|
Regulatory liabilities
|
$
|
—
|
|
$
|
—
|
|
$
|
—
|
|
$
|
—
|
|
$
|
—
|
|
$
|
—
|
|
$
|
—
|
|
|
Accumulated other comprehensive (income) loss
|
|
|
|
|
|
|
|
|
|
|
|
|
|
|
|||||||
|
Deferred income tax asset
|
$
|
4
|
|
$
|
—
|
|
$
|
2
|
|
$
|
—
|
|
$
|
—
|
|
$
|
—
|
|
$
|
—
|
|
|
Prior service credit
|
(1
|
)
|
—
|
|
—
|
|
—
|
|
—
|
|
—
|
|
—
|
|
|||||||
|
Net actuarial gain
|
(8
|
)
|
—
|
|
(4
|
)
|
—
|
|
—
|
|
—
|
|
—
|
|
|||||||
|
Net amounts recognized in accumulated other comprehensive loss
|
$
|
(5
|
)
|
$
|
—
|
|
$
|
(2
|
)
|
$
|
—
|
|
$
|
—
|
|
$
|
—
|
|
$
|
—
|
|
|
(a)
|
Included in Other within Current Liabilities on the Consolidated Balance Sheets.
|
|
(b)
|
Included in Accrued pension and other post-retirement benefit costs on the Consolidated Balance Sheets.
|
Information for Plans with Accumulated Benefit Obligation in Excess of Plan Assets
|
|
December 31, 2015
|
||||||||||||||||||||
|
Duke
|
|
Duke
|
|
Duke
|
|
Duke
|
|
Duke
|
|
||||||||||||
|
Duke
|
|
Energy
|
|
Progress
|
|
Energy
|
|
Energy
|
|
Energy
|
|
Energy
|
|
||||||||
|
(in millions)
|
Energy
|
|
Carolinas
|
|
Energy
|
|
Progress
|
|
Florida
|
|
Ohio
|
|
Indiana
|
|
|||||||
|
Projected benefit obligation
|
$
|
341
|
|
$
|
16
|
|
$
|
112
|
|
$
|
33
|
|
$
|
46
|
|
$
|
4
|
|
$
|
5
|
|
|
Accumulated benefit obligation
|
336
|
|
16
|
|
112
|
|
33
|
|
46
|
|
4
|
|
5
|
|
|||||||
|
|
December 31, 2014
|
||||||||||||||||||||
|
Duke
|
|
Duke
|
|
Duke
|
|
Duke
|
|
Duke
|
|
||||||||||||
|
Duke
|
|
Energy
|
|
Progress
|
|
Energy
|
|
Energy
|
|
Energy
|
|
Energy
|
|
||||||||
|
(in millions)
|
Energy
|
|
Carolinas
|
|
Energy
|
|
Progress
|
|
Florida
|
|
Ohio
|
|
Indiana
|
|
|||||||
|
Projected benefit obligation
|
$
|
337
|
|
$
|
16
|
|
$
|
116
|
|
$
|
35
|
|
$
|
61
|
|
$
|
4
|
|
$
|
5
|
|
|
Accumulated benefit obligation
|
333
|
|
15
|
|
116
|
|
35
|
|
61
|
|
4
|
|
5
|
|
|||||||
Assumptions Used for Pension Benefits Accounting
The discount rate used to determine the current year pension obligation and following year’s pension expense is based on a bond selection-settlement portfolio approach. This approach develops a discount rate by selecting a portfolio of high quality corporate bonds that generate sufficient cash flow to provide for projected benefit payments of the plan. The selected bond portfolio is derived from a universe of non-callable corporate bonds rated Aa quality or higher. After the bond portfolio is selected, a single interest rate is determined that equates the present value of the plan’s projected benefit payments discounted at this rate with the market value of the bonds selected.
The average remaining service period of active covered employees is
10 years
for Duke Energy and Progress Energy,
seven years
for Duke Energy Carolinas, Duke Energy Ohio and Duke Energy Indiana,
12 years
for Duke Energy Progress and
17 years
for Duke Energy Florida.
The following tables present the assumptions used for pension benefit accounting.
|
|
December 31,
|
||||||||
|
|
2015
|
|
2014
|
|
2013
|
|
|||
|
Benefit Obligations
|
|
|
|
|
|
|
|||
|
Discount rate
|
4.40
|
%
|
4.10
|
%
|
4.70
|
%
|
|||
|
Salary increase
|
4.40
|
%
|
4.40
|
%
|
4.40
|
%
|
|||
|
Net Periodic Benefit Cost
|
|
|
|
|
|
|
|||
|
Discount rate
|
4.10
|
%
|
4.70
|
%
|
4.10
|
%
|
|||
|
Salary increase
|
4.40
|
%
|
4.40
|
%
|
4.30
|
%
|
|||
211
PART II
DUKE ENERGY CORPORATION - DUKE ENERGY CAROLINAS, LLC - PROGRESS ENERGY, INC. –
DUKE ENERGY PROGRESS, LLC – DUKE ENERGY FLORIDA, LLC - DUKE ENERGY OHIO, INC. - DUKE ENERGY INDIANA, INC.
Combined Notes To Consolidated Financial Statements – (Continued)
Expected Benefit Payments
|
Duke
|
|
Duke
|
|
Duke
|
|
Duke
|
|
Duke
|
|
||||||||||||
|
Duke
|
|
Energy
|
|
Progress
|
|
Energy
|
|
Energy
|
|
Energy
|
|
Energy
|
|
||||||||
|
(in millions)
|
Energy
|
|
Carolinas
|
|
Energy
|
|
Progress
|
|
Florida
|
|
Ohio
|
|
Indiana
|
|
|||||||
|
Years ending December 31,
|
|
|
|
|
|
|
|
||||||||||||||
|
2016
|
$
|
28
|
|
$
|
2
|
|
$
|
8
|
|
$
|
3
|
|
$
|
3
|
|
$
|
—
|
|
$
|
—
|
|
|
2017
|
29
|
|
2
|
|
8
|
|
3
|
|
3
|
|
—
|
|
—
|
|
|||||||
|
2018
|
25
|
|
2
|
|
8
|
|
3
|
|
3
|
|
—
|
|
—
|
|
|||||||
|
2019
|
26
|
|
2
|
|
8
|
|
3
|
|
3
|
|
—
|
|
—
|
|
|||||||
|
2020
|
25
|
|
2
|
|
8
|
|
3
|
|
3
|
|
—
|
|
1
|
|
|||||||
|
2021 - 2025
|
126
|
|
9
|
|
38
|
|
12
|
|
16
|
|
1
|
|
2
|
|
|||||||
OTHER POST-RETIREMENT BENEFIT PLANS
Duke Energy provides, and the Subsidiary Registrants participate in, some health care and life insurance benefits for retired employees on a contributory and non-contributory basis. Employees are eligible for these benefits if they have met age and service requirements at retirement, as defined in the plans. The health care benefits include medical, dental, and prescription drug coverage and are subject to certain limitations, such as deductibles and co-payments.
Duke Energy did not make any pre-funding contributions to its other post-retirement benefit plans during the years ended
December 31, 2015
,
2014
or
2013
.
Components of Net Periodic Other Post-Retirement Benefit Costs
|
|
Year Ended December 31, 2015
|
||||||||||||||||||||||||||
|
Duke
|
|
Duke
|
|
Duke
|
|
Duke
|
|
Duke
|
|
||||||||||||||||||
|
Duke
|
|
Energy
|
|
Progress
|
|
Energy
|
|
Energy
|
|
Energy
|
|
Energy
|
|
||||||||||||||
|
(in millions)
|
Energy
|
|
Carolinas
|
|
Energy
|
|
Progress
|
|
Florida
|
|
Ohio
|
|
Indiana
|
|
|||||||||||||
|
Service cost
|
$
|
6
|
|
$
|
1
|
|
$
|
1
|
|
$
|
1
|
|
$
|
1
|
|
$
|
—
|
|
$
|
1
|
|
||||||
|
Interest cost on accumulated post-retirement benefit obligation
|
36
|
|
9
|
|
15
|
|
8
|
|
7
|
|
2
|
|
4
|
|
|||||||||||||
|
Expected return on plan assets
|
(13
|
)
|
(8
|
)
|
—
|
|
—
|
|
—
|
|
(1
|
)
|
(1
|
)
|
|||||||||||||
|
Amortization of actuarial loss (gain)
|
16
|
|
(2
|
)
|
28
|
|
18
|
|
10
|
|
(2
|
)
|
(2
|
)
|
|||||||||||||
|
Amortization of prior service credit
|
(140
|
)
|
(14
|
)
|
(102
|
)
|
(68
|
)
|
(35
|
)
|
—
|
|
—
|
|
|||||||||||||
|
Net periodic post-retirement benefit costs
(a)(b)
|
$
|
(95
|
)
|
$
|
(14
|
)
|
$
|
(58
|
)
|
$
|
(41
|
)
|
$
|
(17
|
)
|
$
|
(1
|
)
|
$
|
2
|
|
||||||
|
|
Year Ended December 31, 2014
|
||||||||||||||||||||||||||
|
Duke
|
|
Duke
|
|
Duke
|
|
Duke
|
|
Duke
|
|
||||||||||||||||||
|
Duke
|
|
Energy
|
|
Progress
|
|
Energy
|
|
Energy
|
|
Energy
|
|
Energy
|
|
||||||||||||||
|
(in millions)
|
Energy
|
|
Carolinas
|
|
Energy
|
|
Progress
|
|
Florida
|
|
Ohio
|
|
Indiana
|
|
|||||||||||||
|
Service cost
|
$
|
10
|
|
$
|
2
|
|
$
|
4
|
|
$
|
1
|
|
$
|
3
|
|
$
|
—
|
|
$
|
1
|
|
||||||
|
Interest cost on accumulated post-retirement benefit obligation
|
49
|
|
12
|
|
22
|
|
11
|
|
12
|
|
2
|
|
5
|
|
|||||||||||||
|
Expected return on plan assets
|
(13
|
)
|
(9
|
)
|
—
|
|
—
|
|
—
|
|
—
|
|
(1
|
)
|
|||||||||||||
|
Amortization of actuarial loss (gain)
|
39
|
|
3
|
|
42
|
|
31
|
|
10
|
|
(2
|
)
|
—
|
|
|||||||||||||
|
Amortization of prior service credit
|
(125
|
)
|
(11
|
)
|
(95
|
)
|
(73
|
)
|
(21
|
)
|
—
|
|
—
|
|
|||||||||||||
|
Net periodic post-retirement benefit costs
(a)(b)
|
$
|
(40
|
)
|
$
|
(3
|
)
|
$
|
(27
|
)
|
$
|
(30
|
)
|
$
|
4
|
|
$
|
—
|
|
$
|
5
|
|
||||||
212
PART II
DUKE ENERGY CORPORATION - DUKE ENERGY CAROLINAS, LLC - PROGRESS ENERGY, INC. –
DUKE ENERGY PROGRESS, LLC – DUKE ENERGY FLORIDA, LLC - DUKE ENERGY OHIO, INC. - DUKE ENERGY INDIANA, INC.
Combined Notes To Consolidated Financial Statements – (Continued)
|
|
Year Ended December 31, 2013
|
||||||||||||||||||||||||||
|
Duke
|
|
Duke
|
|
Duke
|
|
Duke
|
|
Duke
|
|
||||||||||||||||||
|
Duke
|
|
Energy
|
|
Progress
|
|
Energy
|
|
Energy
|
|
Energy
|
|
Energy
|
|
||||||||||||||
|
(in millions)
|
Energy
|
|
Carolinas
|
|
Energy
|
|
Progress
|
|
Florida
|
|
Ohio
|
|
Indiana
|
|
|||||||||||||
|
Service cost
|
$
|
24
|
|
$
|
2
|
|
$
|
18
|
|
$
|
9
|
|
$
|
7
|
|
$
|
1
|
|
$
|
1
|
|
||||||
|
Interest cost on accumulated post-retirement benefit obligation
|
68
|
|
13
|
|
41
|
|
22
|
|
16
|
|
2
|
|
5
|
|
|||||||||||||
|
Expected return on plan assets
|
(14
|
)
|
(11
|
)
|
—
|
|
—
|
|
—
|
|
(1
|
)
|
(1
|
)
|
|||||||||||||
|
Amortization of actuarial loss (gain)
|
52
|
|
3
|
|
57
|
|
34
|
|
16
|
|
(1
|
)
|
1
|
|
|||||||||||||
|
Amortization of prior service credit
|
(41
|
)
|
(7
|
)
|
(30
|
)
|
(20
|
)
|
(6
|
)
|
(1
|
)
|
—
|
|
|||||||||||||
|
Net periodic post-retirement benefit costs
(a)(b)
|
$
|
89
|
|
$
|
—
|
|
$
|
86
|
|
$
|
45
|
|
$
|
33
|
|
$
|
—
|
|
$
|
6
|
|
||||||
|
(a)
|
Duke Energy amounts exclude
$10 million
,
$9 million
, and
$8 million
for the years ended December 2015, 2014, and 2013, respectively, of regulatory asset amortization resulting from purchase accounting adjustments associated with Duke Energy's merger with Cinergy in April 2006.
|
|
(b)
|
Duke Energy Ohio amounts exclude
$3 million
,
$2 million
, and
$2 million
for the years ended December 2015, 2014, and 2013, respectively, of regulatory asset amortization resulting from purchase accounting adjustments associated with Duke Energy's merger with Cinergy in April 2006.
|
Amounts Recognized in Accumulated Other Comprehensive Income and Regulatory Assets and Liabilities
|
|
Year Ended December 31, 2015
|
||||||||||||||||||||||||||
|
Duke
|
|
Duke
|
|
Duke
|
|
Duke
|
|
Duke
|
|
||||||||||||||||||
|
Duke
|
|
Energy
|
|
Progress
|
|
Energy
|
|
Energy
|
|
Energy
|
|
Energy
|
|
||||||||||||||
|
(in millions)
|
Energy
|
|
Carolinas
|
|
Energy
|
|
Progress
|
|
Florida
|
|
Ohio
|
|
Indiana
|
|
|||||||||||||
|
Regulatory assets, net increase (decrease)
|
$
|
1
|
|
$
|
—
|
|
$
|
1
|
|
$
|
—
|
|
$
|
1
|
|
$
|
—
|
|
$
|
(7
|
)
|
||||||
|
Regulatory liabilities, net increase (decrease)
|
$
|
(92
|
)
|
$
|
(8
|
)
|
$
|
(71
|
)
|
$
|
(36
|
)
|
$
|
(35
|
)
|
$
|
2
|
|
$
|
(8
|
)
|
||||||
|
Accumulated other comprehensive (income) loss
|
|
|
|
|
|
|
|
|
|
|
|
|
|||||||||||||||
|
Deferred income tax benefit
|
$
|
2
|
|
$
|
—
|
|
$
|
(1
|
)
|
$
|
—
|
|
$
|
—
|
|
$
|
—
|
|
$
|
—
|
|
||||||
|
Actuarial losses (gains) arising during the year
|
(5
|
)
|
—
|
|
2
|
|
—
|
|
—
|
|
—
|
|
—
|
|
|||||||||||||
|
Transfer with the disposal group
|
(3
|
)
|
—
|
|
—
|
|
—
|
|
—
|
|
—
|
|
—
|
|
|||||||||||||
|
Amortization of prior year prior service credit
|
3
|
|
—
|
|
(1
|
)
|
—
|
|
—
|
|
—
|
|
—
|
|
|||||||||||||
|
Net amount recognized in accumulated other comprehensive income
|
$
|
(3
|
)
|
$
|
—
|
|
$
|
—
|
|
$
|
—
|
|
$
|
—
|
|
$
|
—
|
|
$
|
—
|
|
||||||
|
|
Year Ended December 31, 2014
|
||||||||||||||||||||||||||
|
Duke
|
|
Duke
|
|
Duke
|
|
Duke
|
|
Duke
|
|
||||||||||||||||||
|
Duke
|
|
Energy
|
|
Progress
|
|
Energy
|
|
Energy
|
|
Energy
|
|
Energy
|
|
||||||||||||||
|
(in millions)
|
Energy
|
|
Carolinas
|
|
Energy
|
|
Progress
|
|
Florida
|
|
Ohio
|
|
Indiana
|
|
|||||||||||||
|
Regulatory assets, net increase (decrease)
|
$
|
162
|
|
$
|
34
|
|
$
|
129
|
|
$
|
97
|
|
$
|
(4
|
)
|
$
|
—
|
|
$
|
(7
|
)
|
||||||
|
Regulatory liabilities, net increase (decrease)
|
$
|
249
|
|
$
|
76
|
|
$
|
122
|
|
$
|
61
|
|
$
|
61
|
|
$
|
(2
|
)
|
$
|
14
|
|
||||||
|
Accumulated other comprehensive (income) loss
|
|
|
|
|
|
|
|
|
|
|
|
|
|||||||||||||||
|
Deferred income tax benefit
|
$
|
1
|
|
$
|
—
|
|
$
|
1
|
|
$
|
—
|
|
$
|
—
|
|
$
|
—
|
|
$
|
—
|
|
||||||
|
Actuarial losses (gains) arising during the year
|
1
|
|
—
|
|
(2
|
)
|
—
|
|
—
|
|
—
|
|
—
|
|
|||||||||||||
|
Prior year service credit arising during the year
|
(6
|
)
|
—
|
|
—
|
|
—
|
|
—
|
|
—
|
|
—
|
|
|||||||||||||
|
Amortization of prior year prior service credit
|
2
|
|
—
|
|
—
|
|
—
|
|
—
|
|
—
|
|
—
|
|
|||||||||||||
|
Net amount recognized in accumulated other comprehensive income
|
$
|
(2
|
)
|
$
|
—
|
|
$
|
(1
|
)
|
$
|
—
|
|
$
|
—
|
|
$
|
—
|
|
$
|
—
|
|
||||||
213
PART II
DUKE ENERGY CORPORATION - DUKE ENERGY CAROLINAS, LLC - PROGRESS ENERGY, INC. –
DUKE ENERGY PROGRESS, LLC – DUKE ENERGY FLORIDA, LLC - DUKE ENERGY OHIO, INC. - DUKE ENERGY INDIANA, INC.
Combined Notes To Consolidated Financial Statements – (Continued)
Reconciliation of Funded Status to Accrued Other Post-Retirement Benefit Costs
|
|
Year Ended December 31, 2015
|
||||||||||||||||||||||||||
|
Duke
|
|
Duke
|
|
Duke
|
|
Duke
|
|
Duke
|
|
||||||||||||||||||
|
Duke
|
|
Energy
|
|
Progress
|
|
Energy
|
|
Energy
|
|
Energy
|
|
Energy
|
|
||||||||||||||
|
(in millions)
|
Energy
|
|
Carolinas
|
|
Energy
|
|
Progress
|
|
Florida
|
|
Ohio
|
|
Indiana
|
|
|||||||||||||
|
Change in Projected Benefit Obligation
|
|
|
|
|
|
|
|
|
|||||||||||||||||||
|
Accumulated post-retirement benefit obligation at prior measurement date
|
$
|
916
|
|
$
|
220
|
|
$
|
379
|
|
$
|
207
|
|
$
|
170
|
|
$
|
39
|
|
$
|
96
|
|
||||||
|
Service cost
|
6
|
|
1
|
|
1
|
|
1
|
|
1
|
|
—
|
|
1
|
|
|||||||||||||
|
Interest cost
|
36
|
|
9
|
|
15
|
|
8
|
|
7
|
|
2
|
|
4
|
|
|||||||||||||
|
Plan participants' contributions
|
20
|
|
4
|
|
7
|
|
4
|
|
3
|
|
1
|
|
2
|
|
|||||||||||||
|
Actuarial (gains) losses
|
(39
|
)
|
(18
|
)
|
(1
|
)
|
(13
|
)
|
11
|
|
(3
|
)
|
1
|
|
|||||||||||||
|
Transfers
|
—
|
|
2
|
|
—
|
|
—
|
|
—
|
|
—
|
|
—
|
|
|||||||||||||
|
Plan amendments
|
(9
|
)
|
—
|
|
—
|
|
—
|
|
—
|
|
(1
|
)
|
(4
|
)
|
|||||||||||||
|
Benefits paid
|
(100
|
)
|
(18
|
)
|
(47
|
)
|
(19
|
)
|
(28
|
)
|
(3
|
)
|
(13
|
)
|
|||||||||||||
|
Obligation transferred with the Disposal Group
|
(3
|
)
|
—
|
|
—
|
|
—
|
|
—
|
|
—
|
|
—
|
|
|||||||||||||
|
Accrued retiree drug subsidy
|
1
|
|
—
|
|
—
|
|
—
|
|
—
|
|
—
|
|
—
|
|
|||||||||||||
|
Accumulated post-retirement benefit obligation at measurement date
|
$
|
828
|
|
$
|
200
|
|
$
|
354
|
|
$
|
188
|
|
$
|
164
|
|
$
|
35
|
|
$
|
87
|
|
||||||
|
Change in Fair Value of Plan Assets
|
|
|
|
|
|
|
|
|
|
|
|
|
|
|
|||||||||||||
|
Plan assets at prior measurement date
|
$
|
227
|
|
$
|
145
|
|
$
|
—
|
|
$
|
(1
|
)
|
$
|
—
|
|
$
|
8
|
|
$
|
23
|
|
||||||
|
Actual return on plan assets
|
(1
|
)
|
(1
|
)
|
1
|
|
1
|
|
1
|
|
—
|
|
(1
|
)
|
|||||||||||||
|
Benefits paid
|
(100
|
)
|
(18
|
)
|
(47
|
)
|
(19
|
)
|
(28
|
)
|
(3
|
)
|
(13
|
)
|
|||||||||||||
|
Employer contributions
|
62
|
|
4
|
|
39
|
|
15
|
|
25
|
|
2
|
|
8
|
|
|||||||||||||
|
Plan participants' contributions
|
20
|
|
4
|
|
7
|
|
4
|
|
3
|
|
1
|
|
2
|
|
|||||||||||||
|
Plan assets at measurement date
|
$
|
208
|
|
$
|
134
|
|
$
|
—
|
|
$
|
—
|
|
$
|
1
|
|
$
|
8
|
|
$
|
19
|
|
||||||
|
|
Year Ended December 31, 2014
|
||||||||||||||||||||||||||
|
Duke
|
|
Duke
|
|
Duke
|
|
Duke
|
|
Duke
|
|
||||||||||||||||||
|
Duke
|
|
Energy
|
|
Progress
|
|
Energy
|
|
Energy
|
|
Energy
|
|
Energy
|
|
||||||||||||||
|
(in millions)
|
Energy
|
|
Carolinas
|
|
Energy
|
|
Progress
|
|
Florida
|
|
Ohio
|
|
Indiana
|
|
|||||||||||||
|
Change in Projected Benefit Obligation
|
|
|
|
|
|
|
|
||||||||||||||||||||
|
Accumulated post-retirement benefit obligation at prior measurement date
|
$
|
1,106
|
|
$
|
265
|
|
$
|
533
|
|
$
|
233
|
|
$
|
253
|
|
$
|
42
|
|
$
|
118
|
|
||||||
|
Service cost
|
10
|
|
2
|
|
4
|
|
1
|
|
3
|
|
—
|
|
1
|
|
|||||||||||||
|
Interest cost
|
49
|
|
12
|
|
22
|
|
11
|
|
12
|
|
2
|
|
5
|
|
|||||||||||||
|
Plan participants' contributions
|
25
|
|
10
|
|
8
|
|
4
|
|
4
|
|
—
|
|
2
|
|
|||||||||||||
|
Actuarial gains
(a)
|
(87
|
)
|
(35
|
)
|
(19
|
)
|
(21
|
)
|
—
|
|
—
|
|
(20
|
)
|
|||||||||||||
|
Transfers
|
—
|
|
1
|
|
(48
|
)
|
(2
|
)
|
—
|
|
(1
|
)
|
—
|
|
|||||||||||||
|
Plan amendments
|
(85
|
)
|
(4
|
)
|
(77
|
)
|
—
|
|
(78
|
)
|
(1
|
)
|
—
|
|
|||||||||||||
|
Benefits paid
|
(103
|
)
|
(31
|
)
|
(44
|
)
|
(19
|
)
|
(24
|
)
|
(3
|
)
|
(10
|
)
|
|||||||||||||
|
Accrued retiree drug subsidy
|
1
|
|
—
|
|
—
|
|
—
|
|
—
|
|
—
|
|
—
|
|
|||||||||||||
|
Accumulated post-retirement benefit obligation at measurement date
|
$
|
916
|
|
$
|
220
|
|
$
|
379
|
|
$
|
207
|
|
$
|
170
|
|
$
|
39
|
|
$
|
96
|
|
||||||
|
Change in Fair Value of Plan Assets
|
|
|
|
|
|
|
|
|
|
|
|
|
|
|
|||||||||||||
|
Plan assets at prior measurement date
|
$
|
214
|
|
$
|
143
|
|
$
|
—
|
|
$
|
—
|
|
$
|
—
|
|
$
|
8
|
|
$
|
18
|
|
||||||
|
Actual return on plan assets
|
18
|
|
12
|
|
—
|
|
—
|
|
—
|
|
—
|
|
2
|
|
|||||||||||||
|
Benefits paid
|
(103
|
)
|
(31
|
)
|
(44
|
)
|
(19
|
)
|
(24
|
)
|
(3
|
)
|
(10
|
)
|
|||||||||||||
|
Transfers
|
—
|
|
(1
|
)
|
—
|
|
—
|
|
—
|
|
—
|
|
—
|
|
|||||||||||||
|
Employer contributions
|
73
|
|
12
|
|
36
|
|
14
|
|
20
|
|
3
|
|
11
|
|
|||||||||||||
|
Plan participants' contributions
|
25
|
|
10
|
|
8
|
|
4
|
|
4
|
|
—
|
|
2
|
|
|||||||||||||
|
Plan assets at measurement date
|
$
|
227
|
|
$
|
145
|
|
$
|
—
|
|
$
|
(1
|
)
|
$
|
—
|
|
$
|
8
|
|
$
|
23
|
|
||||||
|
(a)
|
Includes an increase in benefit obligation of
$7 million
as a result of changes in Duke Energy's mortality assumptions.
|
214
PART II
DUKE ENERGY CORPORATION - DUKE ENERGY CAROLINAS, LLC - PROGRESS ENERGY, INC. –
DUKE ENERGY PROGRESS, LLC – DUKE ENERGY FLORIDA, LLC - DUKE ENERGY OHIO, INC. - DUKE ENERGY INDIANA, INC.
Combined Notes To Consolidated Financial Statements – (Continued)
Amounts Recognized in the Consolidated Balance Sheets
|
|
December 31, 2015
|
||||||||||||||||||||||||||
|
Duke
|
|
Duke
|
|
Duke
|
|
Duke
|
|
Duke
|
|
||||||||||||||||||
|
Duke
|
|
Energy
|
|
Progress
|
|
Energy
|
|
Energy
|
|
Energy
|
|
Energy
|
|
||||||||||||||
|
(in millions)
|
Energy
|
|
Carolinas
|
|
Energy
|
|
Progress
|
|
Florida
|
|
Ohio
|
|
Indiana
|
|
|||||||||||||
|
Current post-retirement liability
(a)
|
$
|
37
|
|
$
|
—
|
|
$
|
31
|
|
$
|
16
|
|
$
|
15
|
|
$
|
2
|
|
$
|
—
|
|
||||||
|
Noncurrent post-retirement liability
(b)
|
583
|
|
66
|
|
323
|
|
172
|
|
149
|
|
25
|
|
68
|
|
|||||||||||||
|
Total accrued post-retirement liability
|
$
|
620
|
|
$
|
66
|
|
$
|
354
|
|
$
|
188
|
|
$
|
164
|
|
$
|
27
|
|
$
|
68
|
|
||||||
|
Regulatory assets
|
$
|
1
|
|
$
|
—
|
|
$
|
1
|
|
$
|
—
|
|
$
|
1
|
|
$
|
—
|
|
$
|
57
|
|
||||||
|
Regulatory liabilities
|
$
|
288
|
|
$
|
68
|
|
$
|
51
|
|
$
|
25
|
|
$
|
26
|
|
$
|
21
|
|
$
|
83
|
|
||||||
|
Accumulated other comprehensive (income) loss
|
|
|
|
|
|
|
|
|
|
|
|
|
|
|
|||||||||||||
|
Deferred income tax liability
|
$
|
7
|
|
$
|
—
|
|
$
|
—
|
|
$
|
—
|
|
$
|
—
|
|
$
|
—
|
|
$
|
—
|
|
||||||
|
Prior service credit
|
(6
|
)
|
—
|
|
(1
|
)
|
—
|
|
—
|
|
—
|
|
—
|
|
|||||||||||||
|
Net actuarial gain
|
(13
|
)
|
—
|
|
—
|
|
—
|
|
—
|
|
—
|
|
—
|
|
|||||||||||||
|
Net amounts recognized in accumulated other comprehensive income
|
$
|
(12
|
)
|
$
|
—
|
|
$
|
(1
|
)
|
$
|
—
|
|
$
|
—
|
|
$
|
—
|
|
$
|
—
|
|
||||||
|
Amounts to be recognized in net periodic pension expense in the next year
|
|
|
|
|
|
|
|
|
|
|
|
|
|
|
|||||||||||||
|
Unrecognized net actuarial loss (gain)
|
$
|
6
|
|
$
|
(3
|
)
|
$
|
22
|
|
$
|
13
|
|
$
|
9
|
|
$
|
(2
|
)
|
$
|
(2
|
)
|
||||||
|
Unrecognized prior service credit
|
(142
|
)
|
(14
|
)
|
(103
|
)
|
(68
|
)
|
(35
|
)
|
—
|
|
(1
|
)
|
|||||||||||||
|
|
December 31, 2014
|
||||||||||||||||||||||||||
|
Duke
|
|
Duke
|
|
Duke
|
|
Duke
|
|
Duke
|
|
||||||||||||||||||
|
Duke
|
|
Energy
|
|
Progress
|
|
Energy
|
|
Energy
|
|
Energy
|
|
Energy
|
|
||||||||||||||
|
(in millions)
|
Energy
|
|
Carolinas
|
|
Energy
|
|
Progress
|
|
Florida
|
|
Ohio
|
|
Indiana
|
|
|||||||||||||
|
Current post-retirement liability
(a)
|
$
|
35
|
|
$
|
—
|
|
$
|
29
|
|
$
|
16
|
|
$
|
14
|
|
$
|
2
|
|
$
|
—
|
|
||||||
|
Noncurrent post-retirement liability
(b)
|
654
|
|
75
|
|
350
|
|
192
|
|
156
|
|
29
|
|
73
|
|
|||||||||||||
|
Total accrued post-retirement liability
|
$
|
689
|
|
$
|
75
|
|
$
|
379
|
|
$
|
208
|
|
$
|
170
|
|
$
|
31
|
|
$
|
73
|
|
||||||
|
Regulatory assets
|
$
|
—
|
|
$
|
—
|
|
$
|
—
|
|
$
|
—
|
|
$
|
—
|
|
$
|
—
|
|
$
|
64
|
|
||||||
|
Regulatory liabilities
|
$
|
380
|
|
$
|
76
|
|
$
|
122
|
|
$
|
61
|
|
$
|
61
|
|
$
|
19
|
|
$
|
91
|
|
||||||
|
Accumulated other comprehensive (income) loss
|
|
|
|
|
|
|
|
|
|
|
|
|
|
|
|||||||||||||
|
Deferred income tax liability
|
$
|
5
|
|
$
|
—
|
|
$
|
1
|
|
$
|
—
|
|
$
|
—
|
|
$
|
—
|
|
$
|
—
|
|
||||||
|
Prior service credit
|
(9
|
)
|
—
|
|
—
|
|
—
|
|
—
|
|
—
|
|
—
|
|
|||||||||||||
|
Net actuarial gain
|
(5
|
)
|
—
|
|
(2
|
)
|
—
|
|
—
|
|
—
|
|
—
|
|
|||||||||||||
|
Net amounts recognized in accumulated other comprehensive income
|
$
|
(9
|
)
|
$
|
—
|
|
$
|
(1
|
)
|
$
|
—
|
|
$
|
—
|
|
$
|
—
|
|
$
|
—
|
|
||||||
|
(a)
|
Included in Other within Current Liabilities on the Consolidated Balance Sheets.
|
|
(b)
|
Included in Accrued pension and other post-retirement benefit costs on the Consolidated Balance Sheets.
|
Assumptions Used for Other Post-Retirement Benefits Accounting
The discount rate used to determine the current year other post-retirement benefits obligation and following year’s other post-retirement benefits expense is based on a bond selection-settlement portfolio approach. This approach develops a discount rate by selecting a portfolio of high quality corporate bonds that generate sufficient cash flow to provide for projected benefit payments of the plan. The selected bond portfolio is derived from a universe of non-callable corporate bonds rated Aa quality or higher. After the bond portfolio is selected, a single interest rate is determined that equates present value of the plan’s projected benefit payments discounted at this rate with the market value of the bonds selected.
215
PART II
DUKE ENERGY CORPORATION - DUKE ENERGY CAROLINAS, LLC - PROGRESS ENERGY, INC. –
DUKE ENERGY PROGRESS, LLC – DUKE ENERGY FLORIDA, LLC - DUKE ENERGY OHIO, INC. - DUKE ENERGY INDIANA, INC.
Combined Notes To Consolidated Financial Statements – (Continued)
The following tables present the assumptions used for other post-retirement benefits accounting.
|
|
December 31,
|
||||||||
|
|
2015
|
|
2014
|
|
2013
|
|
|||
|
Benefit Obligations
|
|
|
|
|
|
||||
|
Discount rate
|
4.40
|
%
|
4.10
|
%
|
4.70
|
%
|
|||
|
Net Periodic Benefit Cost
|
|
|
|
|
|
||||
|
Discount rate
|
4.10
|
%
|
4.70
|
%
|
4.10
|
%
|
|||
|
Expected long-term rate of return on plan assets
|
6.50
|
%
|
6.75
|
%
|
7.75
|
%
|
|||
|
Assumed tax rate
|
35
|
%
|
35
|
%
|
35
|
%
|
|||
Assumed Health Care Cost Trend Rate
|
|
December 31,
|
||||
|
|
2015
|
|
2014
|
|
|
|
Health care cost trend rate assumed for next year
|
7.50
|
%
|
6.75
|
%
|
|
|
Rate to which the cost trend is assumed to decline (the ultimate trend rate)
|
4.75
|
%
|
4.75
|
%
|
|
|
Year that rate reaches ultimate trend
|
2023
|
|
2023
|
|
|
Sensitivity to Changes in Assumed Health Care Cost Trend Rates
|
|
Year Ended December 31, 2015
|
||||||||||||||||||||
|
Duke
|
|
Duke
|
|
Duke
|
|
Duke
|
|
Duke
|
|
||||||||||||
|
Duke
|
|
Energy
|
|
Progress
|
|
Energy
|
|
Energy
|
|
Energy
|
|
Energy
|
|
||||||||
|
(in millions)
|
Energy
|
|
Carolinas
|
|
Energy
|
|
Progress
|
|
Florida
|
|
Ohio
|
|
Indiana
|
|
|||||||
|
1-Percentage Point Increase
|
|
|
|
|
|
|
|
|
|||||||||||||
|
Effect on total service and interest costs
|
$
|
2
|
|
$
|
—
|
|
$
|
1
|
|
$
|
1
|
|
$
|
—
|
|
$
|
—
|
|
$
|
—
|
|
|
Effect on post-retirement benefit obligation
|
29
|
|
7
|
|
12
|
|
6
|
|
6
|
|
1
|
|
3
|
|
|||||||
|
1-Percentage Point Decrease
|
|
|
|
|
|
|
|
|
|
|
|
|
|
|
|||||||
|
Effect on total service and interest costs
|
(1
|
)
|
—
|
|
(1
|
)
|
(1
|
)
|
—
|
|
—
|
|
—
|
|
|||||||
|
Effect on post-retirement benefit obligation
|
(26
|
)
|
(6
|
)
|
(11
|
)
|
(6
|
)
|
(5
|
)
|
(1
|
)
|
(3
|
)
|
|||||||
Expected Benefit Payments
|
Duke
|
|
Duke
|
|
Duke
|
|
Duke
|
|
Duke
|
|
||||||||||||
|
Duke
|
|
Energy
|
|
Progress
|
|
Energy
|
|
Energy
|
|
Energy
|
|
Energy
|
|
||||||||
|
(in millions)
|
Energy
|
|
Carolinas
|
|
Energy
|
|
Progress
|
|
Florida
|
|
Ohio
|
|
Indiana
|
|
|||||||
|
Years ending December 31,
|
|
|
|
|
|
|
|
|
|||||||||||||
|
2016
|
$
|
76
|
|
$
|
16
|
|
$
|
31
|
|
$
|
16
|
|
$
|
15
|
|
$
|
4
|
|
$
|
10
|
|
|
2017
|
76
|
|
17
|
|
31
|
|
16
|
|
15
|
|
3
|
|
10
|
|
|||||||
|
2018
|
74
|
|
18
|
|
30
|
|
16
|
|
14
|
|
3
|
|
9
|
|
|||||||
|
2019
|
73
|
|
18
|
|
29
|
|
15
|
|
14
|
|
3
|
|
9
|
|
|||||||
|
2020
|
71
|
|
18
|
|
29
|
|
15
|
|
13
|
|
3
|
|
8
|
|
|||||||
|
2021 – 2025
|
312
|
|
80
|
|
129
|
|
68
|
|
60
|
|
14
|
|
33
|
|
|||||||
PLAN ASSETS
Description and Allocations
Duke Energy Master Retirement Trust
Assets for both the qualified pension and other post-retirement benefits are maintained in the Duke Energy Master Retirement Trust. Approximately
98 percent
of the Duke Energy Master Retirement Trust assets were allocated to qualified pension plans and approximately
2 percent
were allocated to other post-retirement plans, as of
December 31, 2015
and
2014
. The investment objective of the Duke Energy Master Retirement Trust is to achieve reasonable returns, subject to a prudent level of portfolio risk, for the purpose of enhancing the security of benefits for plan participants.
216
PART II
DUKE ENERGY CORPORATION - DUKE ENERGY CAROLINAS, LLC - PROGRESS ENERGY, INC. –
DUKE ENERGY PROGRESS, LLC – DUKE ENERGY FLORIDA, LLC - DUKE ENERGY OHIO, INC. - DUKE ENERGY INDIANA, INC.
Combined Notes To Consolidated Financial Statements – (Continued)
As of
December 31, 2015
, Duke Energy assumes pension and other post-retirement plan assets will generate a long-term rate of return of 6.50 percent. The expected long-term rate of return was developed using a weighted average calculation of expected returns based primarily on future expected returns across asset classes considering the use of active asset managers, where applicable. The asset allocation targets were set after considering the investment objective and the risk profile. Equity securities are held for their higher expected return. Debt securities are primarily held to hedge the qualified pension plan liability. Hedge funds, real estate and other global securities are held for diversification. Investments within asset classes are diversified to achieve broad market participation and reduce the impact of individual managers or investments.
In 2013, Duke Energy adopted a de-risking investment strategy for the Duke Energy Master Retirement Trust. As the funded status of the pension plans increase, the targeted allocation to return seeking assets will be reduced and the targeted allocation to fixed-income assets will be increased to better manage Duke Energy’s pension liability and reduce funded status volatility. Duke Energy regularly reviews its actual asset allocation and periodically rebalances its investments to the targeted allocation when considered appropriate.
The Duke Energy Retirement Master Trust is authorized to engage in the lending of certain plan assets. Securities lending is an investment management enhancement that utilizes certain existing securities of the Duke Energy Retirement Master Trust to earn additional income. Securities lending involves the loaning of securities to approved parties. In return for the loaned securities, the Duke Energy Retirement Master Trust receives collateral in the form of cash and securities as a safeguard against possible default of any borrower on the return of the loan under terms that permit the Duke Energy Retirement Master Trust to sell the securities. The Master Trust mitigates credit risk associated with securities lending arrangements by monitoring the fair value of the securities loaned, with additional collateral obtained or refunded as necessary. The fair value of securities on loan was approximately
$305 million
and
$383 million
at
December 31, 2015
and
2014
, respectively. Cash and securities obtained as collateral exceeded the fair value of the securities loaned at
December 31, 2015
and
2014
, respectively. Securities lending income earned by the Master Trust was immaterial for the years ended
December 31, 2015
,
2014
and
2013
, respectively.
Qualified pension and other post-retirement benefits for the Subsidiary Registrants are derived from the Duke Energy Master Retirement Trust, as such, each are allocated their proportionate share of the assets discussed below.
The following table includes the target asset allocations by asset class at
December 31, 2015
and the actual asset allocations for the Duke Energy Master Retirement Trust.
|
|
|
Actual Allocation at
|
||||||
|
December 31,
|
||||||||
|
Target
|
|
|||||||
|
|
Allocation
|
|
2015
|
|
2014
|
|
||
|
U.S. equity securities
|
10
|
%
|
11
|
%
|
10
|
%
|
||
|
Non-U.S. equity securities
|
8
|
%
|
8
|
%
|
8
|
%
|
||
|
Global equity securities
|
10
|
%
|
10
|
%
|
10
|
%
|
||
|
Global private equity securities
|
3
|
%
|
2
|
%
|
3
|
%
|
||
|
Debt securities
|
63
|
%
|
63
|
%
|
63
|
%
|
||
|
Hedge funds
|
2
|
%
|
2
|
%
|
3
|
%
|
||
|
Real estate and cash
|
2
|
%
|
2
|
%
|
1
|
%
|
||
|
Other global securities
|
2
|
%
|
2
|
%
|
2
|
%
|
||
|
Total
|
100
|
%
|
100
|
%
|
100
|
%
|
||
VEBA I
Duke Energy also invests other post-retirement assets in the Duke Energy Corporation Employee Benefits Trust (VEBA I). The investment objective of VEBA I is to achieve sufficient returns, subject to a prudent level of portfolio risk, for the purpose of promoting the security of plan benefits for participants. VEBA I is passively managed.
The following table presents target and actual asset allocations for VEBA I at
December 31, 2015
.
|
|
|
Actual Allocation at
|
||||||
|
Target
|
|
December 31,
|
||||||
|
|
Allocation
|
|
2015
|
|
2014
|
|
||
|
U.S. equity securities
|
30
|
%
|
29
|
%
|
29
|
%
|
||
|
Debt securities
|
45
|
%
|
28
|
%
|
28
|
%
|
||
|
Cash
|
25
|
%
|
43
|
%
|
43
|
%
|
||
|
Total
|
100
|
%
|
100
|
%
|
100
|
%
|
||
Fair Value Measurements
Duke Energy classifies recurring and non-recurring fair value measurements based on the fair value hierarchy as discussed in Note
16
.
Valuation methods of the primary fair value measurements disclosed below are as follows:
217
PART II
DUKE ENERGY CORPORATION - DUKE ENERGY CAROLINAS, LLC - PROGRESS ENERGY, INC. –
DUKE ENERGY PROGRESS, LLC – DUKE ENERGY FLORIDA, LLC - DUKE ENERGY OHIO, INC. - DUKE ENERGY INDIANA, INC.
Combined Notes To Consolidated Financial Statements – (Continued)
Investments in equity securities
Investments in equity securities are typically valued at the closing price in the principal active market as of the last business day of the reporting period. Principal active markets for equity prices include published exchanges such as NASDAQ and NYSE. Foreign equity prices are translated from their trading currency using the currency exchange rate in effect at the close of the principal active market. Prices have not been adjusted to reflect after-hours market activity. The majority of investments in equity securities are valued using Level 1 measurements. When the price of an institutional commingled fund is unpublished, it is not categorized in the fair value hierarchy, even though the funds are readily available at the fair value.
Investments in corporate debt securities and U.S. government securities
Most debt investments are valued based on a calculation using interest rate curves and credit spreads applied to the terms of the debt instrument (maturity and coupon interest rate) and consider the counterparty credit rating. Most debt valuations are Level 2 measurements. If the market for a particular fixed income security is relatively inactive or illiquid, the measurement is Level 3. U.S. Treasury debt is typically Level 2.
Investments in short-term investment funds
Investments in short-term investment funds are valued at the net asset value of units held at year end and are readily redeemable at the measurement date. Investments in short-term investment funds with published prices are valued as Level 1. Investments in short-term investment funds with unpublished prices are valued as Level 2.
Investments in real estate limited partnerships
Investments in real estate limited partnerships are valued by the trustee at each valuation date (monthly). As part of the trustee’s valuation process, properties are externally appraised generally on an annual basis, conducted by reputable, independent appraisal firms, and signed by appraisers that are members of the Appraisal Institute, with the professional designation MAI. Fair value is defined as the price that would be received to sell an asset or paid to transfer a liability in an orderly transaction between market participants at the measurement date. There are three valuation techniques that can be used to value investments in real estate assets: the market, income or cost approach. The appropriateness of each valuation technique depends on the type of asset or business being valued. In addition, the trustee may cause additional appraisals to be performed as warranted by specific asset or market conditions. Property valuations and the salient valuation-sensitive assumptions of each direct investment property are reviewed by the trustee quarterly and values are adjusted if there has been a significant change in circumstances related to the investment property since the last valuation. Value adjustments for interim capital expenditures are only recognized to the extent that the valuation process acknowledges a corresponding increase in fair value. An independent firm is hired to review and approve quarterly direct real estate valuations. Key inputs and assumptions used to determine fair value includes among others, rental revenue and expense amounts and related revenue and expense growth rates, terminal capitalization rates and discount rates. Development investments are valued using cost incurred to date as a primary input until substantive progress is achieved in terms of mitigating construction and leasing risk at which point a discounted cash flow approach is more heavily weighted. Key inputs and assumptions in addition to those noted above used to determine the fair value of development investments include construction costs, and the status of construction completion and leasing. Investments in real estate limited partnerships are valued at net asset value of units held at year end and are not readily redeemable at the measurement date. Investments in real estate limited partnerships are not categorized within the fair value hierarchy.
218
PART II
DUKE ENERGY CORPORATION - DUKE ENERGY CAROLINAS, LLC - PROGRESS ENERGY, INC. –
DUKE ENERGY PROGRESS, LLC – DUKE ENERGY FLORIDA, LLC - DUKE ENERGY OHIO, INC. - DUKE ENERGY INDIANA, INC.
Combined Notes To Consolidated Financial Statements – (Continued)
Duke Energy Master Retirement Trust
The following tables provide the fair value measurement amounts for the Duke Energy Master Retirement Trust qualified pension and other post-retirement assets.
|
|
December 31, 2015
|
||||||||||||||||||
|
Total Fair
|
|
Not
|
|
||||||||||||||||
|
(in millions)
|
Value
|
|
Level 1
|
|
Level 2
|
|
Level 3
|
|
Categorized
(b)
|
|
|||||||||
|
Equity securities
|
$
|
2,160
|
|
$
|
1,470
|
|
$
|
2
|
|
$
|
—
|
|
688
|
|
|||||
|
Corporate debt securities
|
4,362
|
|
—
|
|
4,362
|
|
—
|
|
—
|
|
|||||||||
|
Short-term investment funds
|
404
|
|
192
|
|
212
|
|
—
|
|
—
|
|
|||||||||
|
Partnership interests
|
185
|
|
—
|
|
—
|
|
—
|
|
185
|
|
|||||||||
|
Hedge funds
|
210
|
|
—
|
|
—
|
|
—
|
|
210
|
|
|||||||||
|
Real estate limited partnerships
|
118
|
|
—
|
|
—
|
|
—
|
|
118
|
|
|||||||||
|
U.S. government securities
|
748
|
|
—
|
|
748
|
|
—
|
|
—
|
|
|||||||||
|
Guaranteed investment contracts
|
31
|
|
—
|
|
—
|
|
31
|
|
—
|
|
|||||||||
|
Governments bonds – foreign
|
34
|
|
—
|
|
34
|
|
—
|
|
—
|
|
|||||||||
|
Cash
|
10
|
|
10
|
|
—
|
|
—
|
|
—
|
|
|||||||||
|
Government and commercial mortgage backed securities
|
9
|
|
—
|
|
9
|
|
—
|
|
—
|
|
|||||||||
|
Net pending transactions and other investments
|
(28
|
)
|
(36
|
)
|
8
|
|
—
|
|
—
|
|
|||||||||
|
Total assets
(a)
|
$
|
8,243
|
|
$
|
1,636
|
|
$
|
5,375
|
|
$
|
31
|
|
|
$
|
1,201
|
|
|||
|
(a)
|
Duke Energy Carolinas, Progress Energy, Duke Energy Progress, Duke Energy Florida, Duke Energy Ohio and Duke Energy Indiana were allocated approximately
28 percent
,
32 percent
,
15 percent
,
16 percent
,
5 percent
and
8 percent
, respectively, of the Duke Energy Master Retirement Trust assets at
December 31, 2015
. Accordingly, all amounts included in the table above are allocable to the Subsidiary Registrants using these percentages.
|
|
(b)
|
Certain investments are not categorized. These investments are measured based on the fair value of the underlying investments but may not be readily redeemable at that fair value.
|
|
|
December 31, 2014
|
||||||||||||||||||
|
Total Fair
|
|
Not
|
|
||||||||||||||||
|
(in millions)
|
Value
|
|
Level 1
|
|
Level 2
|
|
Level 3
|
|
Categorized
(b)
|
|
|||||||||
|
Equity securities
|
$
|
2,346
|
|
$
|
1,625
|
|
$
|
3
|
|
$
|
—
|
|
$
|
718
|
|
||||
|
Corporate debt securities
|
4,349
|
|
—
|
|
4,348
|
|
1
|
|
—
|
|
|||||||||
|
Short-term investment funds
|
333
|
|
171
|
|
162
|
|
—
|
|
—
|
|
|||||||||
|
Partnership interests
|
298
|
|
—
|
|
—
|
|
—
|
|
298
|
|
|||||||||
|
Hedge funds
|
146
|
|
—
|
|
—
|
|
—
|
|
146
|
|
|||||||||
|
Real estate limited partnerships
|
104
|
|
—
|
|
—
|
|
—
|
|
104
|
|
|||||||||
|
U.S. government securities
|
917
|
|
—
|
|
916
|
|
1
|
|
—
|
|
|||||||||
|
Guaranteed investment contracts
|
32
|
|
—
|
|
—
|
|
32
|
|
—
|
|
|||||||||
|
Governments bonds – foreign
|
44
|
|
—
|
|
44
|
|
—
|
|
—
|
|
|||||||||
|
Cash
|
30
|
|
30
|
|
—
|
|
—
|
|
—
|
|
|||||||||
|
Government and commercial mortgage backed securities
|
9
|
|
—
|
|
9
|
|
—
|
|
—
|
|
|||||||||
|
Net pending transactions and other investments
|
10
|
|
(10
|
)
|
20
|
|
—
|
|
—
|
|
|||||||||
|
Total assets
(a)
|
$
|
8,618
|
|
$
|
1,816
|
|
$
|
5,502
|
|
$
|
34
|
|
$
|
1,266
|
|
||||
|
(a)
|
Duke Energy Carolinas, Progress Energy, Duke Energy Progress, Duke Energy Florida, Duke Energy Ohio and Duke Energy Indiana were allocated approximately
28 percent
,
31 percent
,
15 percent
,
16 percent
,
5 percent
and
8 percent
, respectively, of the Duke Energy Master Retirement Trust assets at
December 31, 2014
. Accordingly, all amounts included in the table above are allocable to the Subsidiary Registrants using these percentages.
|
|
(b)
|
Certain investments are not categorized. These investments are measured based on the fair value of the underlying investments but may not be readily redeemable at that fair value.
|
219
PART II
DUKE ENERGY CORPORATION - DUKE ENERGY CAROLINAS, LLC - PROGRESS ENERGY, INC. –
DUKE ENERGY PROGRESS, LLC – DUKE ENERGY FLORIDA, LLC - DUKE ENERGY OHIO, INC. - DUKE ENERGY INDIANA, INC.
Combined Notes To Consolidated Financial Statements – (Continued)
The following table provides a reconciliation of beginning and ending balances of assets of master trusts measured at fair value on a recurring basis where the determination of fair value includes significant unobservable inputs (Level 3).
|
(in millions)
|
2015
|
|
2014
|
|
|||
|
Balance at January 1
|
$
|
34
|
|
$
|
37
|
|
|
|
Sales
|
(2
|
)
|
(4
|
)
|
|||
|
Total gains (losses) and other, net
|
(1
|
)
|
1
|
|
|||
|
Balance at December 31
|
$
|
31
|
|
$
|
34
|
|
|
VEBA I
The following tables provide the fair value measurement amounts for VEBA I other post-retirement assets.
|
|
December 31, 2015
|
||||||||||||
|
Total Fair
|
|
||||||||||||
|
(in millions)
|
Value
|
|
Level 1
|
|
Level 2
|
|
Level 3
|
|
|||||
|
Cash and cash equivalents
|
$
|
18
|
|
—
|
|
$
|
18
|
|
—
|
|
|||
|
Equity securities
|
12
|
|
—
|
|
12
|
|
—
|
|
|||||
|
Debt securities
|
12
|
|
—
|
|
12
|
|
—
|
|
|||||
|
Total assets
|
$
|
42
|
|
—
|
|
$
|
42
|
|
—
|
|
|||
|
|
December 31, 2014
|
||||||||||||
|
Total Fair
|
|
||||||||||||
|
(in millions)
|
Value
|
|
Level 1
|
|
Level 2
|
|
Level 3
|
|
|||||
|
Cash and cash equivalents
|
$
|
21
|
|
—
|
|
$
|
21
|
|
—
|
|
|||
|
Equity securities
|
14
|
|
—
|
|
14
|
|
—
|
|
|||||
|
Debt securities
|
13
|
|
—
|
|
13
|
|
—
|
|
|||||
|
Total assets
|
$
|
48
|
|
—
|
|
$
|
48
|
|
—
|
|
|||
EMPLOYEE SAVINGS PLANS
Duke Energy sponsors, and the Subsidiary Registrants participate in, employee savings plans that cover substantially all U.S. employees. Most employees participate in a matching contribution formula where Duke Energy provides a matching contribution generally equal to
100 percent
of employee before-tax and Roth 401(k) contributions, and, as applicable, after-tax contributions, of up to
6 percent
of eligible pay per pay period. Dividends on Duke Energy shares held by the savings plans are charged to retained earnings when declared and shares held in the plans are considered outstanding in the calculation of basic and diluted earnings per share.
As of January 1, 2014, for new and rehired non-union and certain unionized employees who are not eligible to participate in Duke Energy’s defined benefit plans, an additional employer contribution of
4 percent
of eligible pay per pay period, which is subject to a three-year vesting schedule, is provided to the employee’s savings plan account.
The following table includes pretax employer matching contributions made by Duke Energy and expensed by the Subsidiary Registrants.
|
Duke
|
|
Duke
|
|
Duke
|
|
Duke
|
|
Duke
|
|
||||||||||||||||||
|
Duke
|
|
Energy
|
|
Progress
|
|
Energy
|
|
Energy
|
|
Energy
|
|
Energy
|
|
||||||||||||||
|
(in millions)
|
Energy
|
|
Carolinas
|
|
Energy
|
|
Progress
|
|
Florida
|
|
Ohio
|
|
Indiana
|
|
|||||||||||||
|
Years ended December 31,
|
|
|
|
|
|
|
|
||||||||||||||||||||
|
2015
(a)
|
$
|
159
|
|
$
|
54
|
|
$
|
48
|
|
$
|
34
|
|
$
|
13
|
|
$
|
3
|
|
$
|
7
|
|
||||||
|
2014
(a)
|
143
|
|
47
|
|
43
|
|
30
|
|
14
|
|
3
|
|
7
|
|
|||||||||||||
|
2013
|
134
|
|
45
|
|
45
|
|
25
|
|
14
|
|
3
|
|
7
|
|
|||||||||||||
|
(a)
|
For 2014 and 2015, amounts include the additional employer contribution of
4 percent
of eligible pay per pay period for employees not eligible to participate in a defined benefit plan.
|
220
PART II
DUKE ENERGY CORPORATION - DUKE ENERGY CAROLINAS, LLC - PROGRESS ENERGY, INC. –
DUKE ENERGY PROGRESS, LLC – DUKE ENERGY FLORIDA, LLC - DUKE ENERGY OHIO, INC. - DUKE ENERGY INDIANA, INC.
Combined Notes To Consolidated Financial Statements – (Continued)
22. INCOME TAXES
Income Tax Expense
Components of Income Tax Expense
|
|
Year Ended December 31, 2015
|
||||||||||||||||||||
|
Duke
|
|
Duke
|
|
Duke
|
|
Duke
|
|
Duke
|
|
||||||||||||
|
Duke
|
|
Energy
|
|
Progress
|
|
Energy
|
|
Energy
|
|
Energy
|
|
Energy
|
|
||||||||
|
(in millions)
|
Energy
|
|
Carolinas
|
|
Energy
|
|
Progress
|
|
Florida
|
|
Ohio
|
|
Indiana
|
|
|||||||
|
Current income taxes
|
|
|
|
|
|
|
|
||||||||||||||
|
Federal
|
$
|
—
|
|
$
|
216
|
|
$
|
(193
|
)
|
$
|
(56
|
)
|
$
|
1
|
|
$
|
(18
|
)
|
$
|
(86
|
)
|
|
State
|
(12
|
)
|
14
|
|
1
|
|
(4
|
)
|
(7
|
)
|
(1
|
)
|
(12
|
)
|
|||||||
|
Foreign
|
99
|
|
—
|
|
—
|
|
—
|
|
—
|
|
—
|
|
—
|
|
|||||||
|
Total current income taxes
|
87
|
|
230
|
|
(192
|
)
|
(60
|
)
|
(6
|
)
|
(19
|
)
|
(98
|
)
|
|||||||
|
Deferred income taxes
|
|
|
|
|
|
|
|||||||||||||||
|
Federal
|
1,089
|
|
345
|
|
694
|
|
334
|
|
290
|
|
96
|
|
245
|
|
|||||||
|
State
|
181
|
|
57
|
|
27
|
|
27
|
|
58
|
|
5
|
|
17
|
|
|||||||
|
Foreign
|
(17
|
)
|
—
|
|
—
|
|
—
|
|
—
|
|
—
|
|
—
|
|
|||||||
|
Total deferred income taxes
(a)
|
1,253
|
|
402
|
|
721
|
|
361
|
|
348
|
|
101
|
|
262
|
|
|||||||
|
Investment tax credit amortization
|
(14
|
)
|
(5
|
)
|
(7
|
)
|
(7
|
)
|
—
|
|
(1
|
)
|
(1
|
)
|
|||||||
|
Income tax expense from continuing operations
|
1,326
|
|
627
|
|
522
|
|
294
|
|
342
|
|
81
|
|
163
|
|
|||||||
|
Tax expense (benefit) from discontinued operations
|
19
|
|
—
|
|
(1
|
)
|
—
|
|
—
|
|
22
|
|
—
|
|
|||||||
|
Total income tax expense included in Consolidated Statements of Operations
|
$
|
1,345
|
|
$
|
627
|
|
$
|
521
|
|
$
|
294
|
|
$
|
342
|
|
$
|
103
|
|
$
|
163
|
|
|
(a)
|
Includes benefits of net operating loss (NOL) carryforwards and utilization of NOL and tax credit carryforwards of
$264 million
at Duke Energy,
$15 million
at Duke Energy Carolinas,
$119 million
at Progress Energy,
$21 million
at Duke Energy Progress,
$84 million
at Duke Energy Florida,
$3 million
at Duke Energy Ohio and
$45 million
at Duke Energy Indiana.
|
|
|
Year Ended December 31, 2014
|
||||||||||||||||||||
|
Duke
|
|
Duke
|
|
Duke
|
|
Duke
|
|
Duke
|
|
||||||||||||
|
Duke
|
|
Energy
|
|
Progress
|
|
Energy
|
|
Energy
|
|
Energy
|
|
Energy
|
|
||||||||
|
(in millions)
|
Energy
|
|
Carolinas
|
|
Energy
|
|
Progress
|
|
Florida
|
|
Ohio
|
|
Indiana
|
|
|||||||
|
Current income taxes
|
|
|
|
|
|
|
|
||||||||||||||
|
Federal
|
$
|
—
|
|
$
|
161
|
|
$
|
(466
|
)
|
$
|
(184
|
)
|
$
|
(53
|
)
|
$
|
(73
|
)
|
$
|
(112
|
)
|
|
State
|
56
|
|
51
|
|
(8
|
)
|
14
|
|
1
|
|
3
|
|
1
|
|
|||||||
|
Foreign
|
144
|
|
—
|
|
—
|
|
—
|
|
—
|
|
—
|
|
—
|
|
|||||||
|
Total current income taxes
|
200
|
|
212
|
|
(474
|
)
|
(170
|
)
|
(52
|
)
|
(70
|
)
|
(111
|
)
|
|||||||
|
Deferred income taxes
|
|
|
|
|
|
|
|
||||||||||||||
|
Federal
|
1,517
|
|
407
|
|
938
|
|
436
|
|
350
|
|
113
|
|
294
|
|
|||||||
|
State
|
35
|
|
(25
|
)
|
84
|
|
25
|
|
52
|
|
1
|
|
15
|
|
|||||||
|
Foreign
|
(67
|
)
|
—
|
|
—
|
|
—
|
|
—
|
|
—
|
|
—
|
|
|||||||
|
Total deferred income taxes
(a)(b)
|
1,485
|
|
382
|
|
1,022
|
|
461
|
|
402
|
|
114
|
|
309
|
|
|||||||
|
Investment tax credit amortization
|
(16
|
)
|
(6
|
)
|
(8
|
)
|
(6
|
)
|
(1
|
)
|
(1
|
)
|
(1
|
)
|
|||||||
|
Income tax expense from continuing operations
|
1,669
|
|
588
|
|
540
|
|
285
|
|
349
|
|
43
|
|
197
|
|
|||||||
|
Tax benefit from discontinued operations
|
(295
|
)
|
—
|
|
(4
|
)
|
—
|
|
—
|
|
(300
|
)
|
—
|
|
|||||||
|
Total income tax expense (benefit) included in Consolidated Statements of Operations
|
$
|
1,374
|
|
$
|
588
|
|
$
|
536
|
|
$
|
285
|
|
$
|
349
|
|
$
|
(257
|
)
|
$
|
197
|
|
|
(a)
|
There were no benefits of NOL carryforwards.
|
|
(b)
|
Includes utilization of NOL and tax credit carryforwards of
$1,544 million
at Duke Energy,
$345 million
at Duke Energy Carolinas,
$530 million
at Progress Energy,
$291 million
at Duke Energy Progress,
$64 million
at Duke Energy Florida,
$56 million
at Duke Energy Ohio and
$141 million
at Duke Energy Indiana.
|
221
PART II
DUKE ENERGY CORPORATION - DUKE ENERGY CAROLINAS, LLC - PROGRESS ENERGY, INC. –
DUKE ENERGY PROGRESS, LLC – DUKE ENERGY FLORIDA, LLC - DUKE ENERGY OHIO, INC. - DUKE ENERGY INDIANA, INC.
Combined Notes To Consolidated Financial Statements – (Continued)
|
|
Year Ended December 31, 2013
|
||||||||||||||||||||
|
Duke
|
|
Duke
|
|
Duke
|
|
Duke
|
|
Duke
|
|
||||||||||||
|
Duke
|
|
Energy
|
|
Progress
|
|
Energy
|
|
Energy
|
|
Energy
|
|
Energy
|
|
||||||||
|
(in millions)
|
Energy
|
|
Carolinas
|
|
Energy
|
|
Progress
|
|
Florida
|
|
Ohio
|
|
Indiana
|
|
|||||||
|
Current income taxes
|
|
|
|
|
|
|
|
||||||||||||||
|
Federal
|
$
|
(141
|
)
|
$
|
49
|
|
$
|
(221
|
)
|
$
|
(70
|
)
|
$
|
(143
|
)
|
$
|
(24
|
)
|
$
|
(88
|
)
|
|
State
|
(40
|
)
|
11
|
|
(37
|
)
|
(10
|
)
|
(13
|
)
|
(4
|
)
|
7
|
|
|||||||
|
Foreign
|
151
|
|
—
|
|
—
|
|
—
|
|
—
|
|
—
|
|
—
|
|
|||||||
|
Total current income taxes
|
(30
|
)
|
60
|
|
(258
|
)
|
(80
|
)
|
(156
|
)
|
(28
|
)
|
(81
|
)
|
|||||||
|
Deferred income taxes
|
|
|
|
|
|
|
|
||||||||||||||
|
Federal
|
1,092
|
|
464
|
|
555
|
|
316
|
|
326
|
|
65
|
|
276
|
|
|||||||
|
State
|
144
|
|
75
|
|
84
|
|
59
|
|
44
|
|
6
|
|
29
|
|
|||||||
|
Foreign
|
14
|
|
—
|
|
—
|
|
—
|
|
—
|
|
—
|
|
—
|
|
|||||||
|
Total deferred income taxes
(a)
|
1,250
|
|
539
|
|
639
|
|
375
|
|
370
|
|
71
|
|
305
|
|
|||||||
|
Investment tax credit amortization
|
(15
|
)
|
(5
|
)
|
(8
|
)
|
(7
|
)
|
(1
|
)
|
—
|
|
(1
|
)
|
|||||||
|
Income tax expense from continuing operations
|
1,205
|
|
594
|
|
373
|
|
288
|
|
213
|
|
43
|
|
223
|
|
|||||||
|
Tax expense (benefit) from discontinued operations
|
29
|
|
—
|
|
(26
|
)
|
—
|
|
—
|
|
32
|
|
—
|
|
|||||||
|
Total income tax expense included in Consolidated Statements of Operations
|
$
|
1,234
|
|
$
|
594
|
|
$
|
347
|
|
$
|
288
|
|
$
|
213
|
|
$
|
75
|
|
$
|
223
|
|
|
(a)
|
Includes benefits of NOL carryforwards of
$808 million
at Duke Energy,
$458 million
at Progress Energy,
$64 million
at Duke Energy Progress,
$301 million
at Duke Energy Florida and
$179 million
at Duke Energy Indiana.
|
Duke Energy Income from Continuing Operations before Income Taxes
|
|
Years Ended December 31,
|
||||||||||
|
(in millions)
|
2015
|
2014
|
2013
|
||||||||
|
Domestic
|
$
|
3,828
|
|
$
|
3,600
|
|
$
|
3,183
|
|
||
|
Foreign
|
309
|
|
534
|
|
612
|
|
|||||
|
Income from continuing operations before income taxes
|
$
|
4,137
|
|
$
|
4,134
|
|
$
|
3,795
|
|
||
222
PART II
DUKE ENERGY CORPORATION - DUKE ENERGY CAROLINAS, LLC - PROGRESS ENERGY, INC. –
DUKE ENERGY PROGRESS, LLC – DUKE ENERGY FLORIDA, LLC - DUKE ENERGY OHIO, INC. - DUKE ENERGY INDIANA, INC.
Combined Notes To Consolidated Financial Statements – (Continued)
Statutory Rate Reconciliation
The following tables present a reconciliation of income tax expense at the U.S. federal statutory tax rate to the actual tax expense from continuing operations.
|
|
Year Ended December 31, 2015
|
||||||||||||||||||||
|
Duke
|
|
Duke
|
|
Duke
|
|
Duke
|
|
Duke
|
|
||||||||||||
|
Duke
|
|
Energy
|
|
Progress
|
|
Energy
|
|
Energy
|
|
Energy
|
|
Energy
|
|
||||||||
|
(in millions)
|
Energy
|
|
Carolinas
|
|
Energy
|
|
Progress
|
|
Florida
|
|
Ohio
|
|
Indiana
|
|
|||||||
|
Income tax expense, computed at the statutory rate of 35 percent
|
$
|
1,448
|
|
$
|
598
|
|
$
|
555
|
|
$
|
302
|
|
$
|
330
|
|
$
|
81
|
|
$
|
168
|
|
|
State income tax, net of federal income tax effect
|
109
|
|
46
|
|
18
|
|
15
|
|
33
|
|
2
|
|
2
|
|
|||||||
|
Tax differential on foreign earnings
|
(27
|
)
|
—
|
|
—
|
|
—
|
|
—
|
|
—
|
|
—
|
|
|||||||
|
AFUDC equity income
|
(58
|
)
|
(34
|
)
|
(19
|
)
|
(17
|
)
|
(3
|
)
|
(1
|
)
|
(4
|
)
|
|||||||
|
Renewable energy production tax credits
|
(72
|
)
|
—
|
|
(1
|
)
|
—
|
|
—
|
|
—
|
|
—
|
|
|||||||
|
Audit adjustment
|
(22
|
)
|
—
|
|
(23
|
)
|
1
|
|
(24
|
)
|
—
|
|
—
|
|
|||||||
|
Tax true-up
|
2
|
|
2
|
|
(3
|
)
|
(4
|
)
|
2
|
|
(5
|
)
|
(9
|
)
|
|||||||
|
Other items, net
|
(54
|
)
|
15
|
|
(5
|
)
|
(3
|
)
|
4
|
|
4
|
|
6
|
|
|||||||
|
Income tax expense from continuing operations
|
$
|
1,326
|
|
$
|
627
|
|
$
|
522
|
|
$
|
294
|
|
$
|
342
|
|
$
|
81
|
|
$
|
163
|
|
|
Effective tax rate
|
32.1
|
%
|
36.7
|
%
|
32.9
|
%
|
34.2
|
%
|
36.3
|
%
|
35.2
|
%
|
34.0
|
%
|
|||||||
|
|
Year Ended December 31, 2014
|
||||||||||||||||||||
|
Duke
|
|
Duke
|
|
Duke
|
|
Duke
|
|
Duke
|
|
||||||||||||
|
Duke
|
|
Energy
|
|
Progress
|
|
Energy
|
|
Energy
|
|
Energy
|
|
Energy
|
|
||||||||
|
(in millions)
|
Energy
|
|
Carolinas
|
|
Energy
|
|
Progress
|
|
Florida
|
|
Ohio
|
|
Indiana
|
|
|||||||
|
Income tax expense, computed at the statutory rate of 35 percent
|
$
|
1,447
|
|
$
|
581
|
|
$
|
497
|
|
$
|
263
|
|
$
|
314
|
|
$
|
39
|
|
$
|
195
|
|
|
State income tax, net of federal income tax effect
|
59
|
|
17
|
|
49
|
|
25
|
|
34
|
|
3
|
|
10
|
|
|||||||
|
Tax differential on foreign earnings
(a)
|
(110
|
)
|
—
|
|
—
|
|
—
|
|
—
|
|
—
|
|
—
|
|
|||||||
|
AFUDC equity income
|
(47
|
)
|
(32
|
)
|
(9
|
)
|
(9
|
)
|
—
|
|
(1
|
)
|
(5
|
)
|
|||||||
|
Renewable energy production tax credits
|
(67
|
)
|
—
|
|
—
|
|
—
|
|
—
|
|
—
|
|
—
|
|
|||||||
|
International tax dividend
(b)
|
373
|
|
—
|
|
—
|
|
—
|
|
—
|
|
—
|
|
—
|
|
|||||||
|
Other items, net
|
14
|
|
22
|
|
3
|
|
6
|
|
1
|
|
2
|
|
(3
|
)
|
|||||||
|
Income tax expense (benefit) from continuing operations
|
$
|
1,669
|
|
$
|
588
|
|
$
|
540
|
|
$
|
285
|
|
$
|
349
|
|
$
|
43
|
|
$
|
197
|
|
|
Effective tax rate
|
40.4
|
%
|
35.4
|
%
|
38.0
|
%
|
37.9
|
%
|
38.9
|
%
|
38.9
|
%
|
35.5
|
%
|
|||||||
|
(a)
|
Includes a $57 million benefit as a result of the merger of two Chilean subsidiaries and a change in income tax rates in various countries primarily relating to Peru.
|
|
(b)
|
During 2014, Duke Energy declared a taxable dividend of foreign earnings in the form of notes payable that was expected to result in the repatriation of approximately
$2.7 billion
of cash held, and expected to be generated, by International Energy over a period of up to eight years. In 2015, approximately
$1.5 billion
was remitted. As a result of the decision to repatriate cumulative historical undistributed foreign earnings Duke Energy recorded U.S. income tax expense of approximately
$373 million
in 2014.
|
|
|
Year Ended December 31, 2013
|
||||||||||||||||||||
|
Duke
|
|
Duke
|
|
Duke
|
|
Duke
|
|
Duke
|
|
||||||||||||
|
Duke
|
|
Energy
|
|
Progress
|
|
Energy
|
|
Energy
|
|
Energy
|
|
Energy
|
|
||||||||
|
(in millions)
|
Energy
|
|
Carolinas
|
|
Energy
|
|
Progress
|
|
Florida
|
|
Ohio
|
|
Indiana
|
|
|||||||
|
Income tax expense, computed at the statutory rate of 35 percent
|
$
|
1,328
|
|
$
|
549
|
|
$
|
361
|
|
$
|
276
|
|
$
|
188
|
|
$
|
39
|
|
$
|
203
|
|
|
State income tax, net of federal income tax effect
|
66
|
|
56
|
|
31
|
|
31
|
|
20
|
|
2
|
|
23
|
|
|||||||
|
Tax differential on foreign earnings
|
(49
|
)
|
—
|
|
—
|
|
—
|
|
—
|
|
—
|
|
—
|
|
|||||||
|
AFUDC equity income
|
(55
|
)
|
(32
|
)
|
(18
|
)
|
(15
|
)
|
(3
|
)
|
—
|
|
(5
|
)
|
|||||||
|
Renewable energy production tax credits
|
(62
|
)
|
—
|
|
—
|
|
—
|
|
—
|
|
—
|
|
—
|
|
|||||||
|
Other items, net
|
(23
|
)
|
21
|
|
(1
|
)
|
(4
|
)
|
8
|
|
2
|
|
2
|
|
|||||||
|
Income tax expense from continuing operations
|
$
|
1,205
|
|
$
|
594
|
|
$
|
373
|
|
$
|
288
|
|
$
|
213
|
|
$
|
43
|
|
$
|
223
|
|
|
Effective tax rate
|
31.8
|
%
|
37.8
|
%
|
36.2
|
%
|
36.5
|
%
|
39.6
|
%
|
39.1
|
%
|
38.4
|
%
|
|||||||
223
PART II
DUKE ENERGY CORPORATION - DUKE ENERGY CAROLINAS, LLC - PROGRESS ENERGY, INC. –
DUKE ENERGY PROGRESS, LLC – DUKE ENERGY FLORIDA, LLC - DUKE ENERGY OHIO, INC. - DUKE ENERGY INDIANA, INC.
Combined Notes To Consolidated Financial Statements – (Continued)
Valuation allowances have been established for certain foreign and state NOL carryforwards and state income tax credits that reduce deferred tax assets to an amount that will be realized on a more-likely-than-not basis. The net change in the total valuation allowance is included in Tax differential on foreign earnings and State income tax, net of federal income tax effect in the above tables.
Undistributed Foreign Earnings
As of December 31, 2015, Duke Energy’s intention was to indefinitely reinvest undistributed earnings generated by Duke Energy's foreign subsidiaries. As a result, no U.S. tax is recorded on such earnings of approximately
$250 million
. The amount of unrecognized deferred tax liability related to undistributed earnings was approximately
$12 million
.
On February 18, 2016, Duke Energy announced it had initiated a process to divest the International Energy business segment, excluding the investment in NMC. See Note 2 for further information. Accordingly, Duke Energy no longer intends to indefinitely reinvest the undistributed foreign earnings of International Energy and will therefore record U.S. taxes related to International Energy's undistributed foreign earnings during the first quarter of 2016.
DEFERRED TAXES
Net Deferred Income Tax Liability Components
|
|
December 31, 2015
|
||||||||||||||||||||
|
Duke
|
|
Duke
|
|
Duke
|
|
Duke
|
|
Duke
|
|
||||||||||||
|
Duke
|
|
Energy
|
|
Progress
|
|
Energy
|
|
Energy
|
|
Energy
|
|
Energy
|
|
||||||||
|
(in millions)
|
Energy
|
|
Carolinas
|
|
Energy
|
|
Progress
|
|
Florida
|
|
Ohio
|
|
Indiana
|
|
|||||||
|
Deferred credits and other liabilities
|
$
|
245
|
|
$
|
38
|
|
$
|
115
|
|
$
|
25
|
|
$
|
66
|
|
$
|
29
|
|
$
|
5
|
|
|
Capital lease obligations
|
63
|
|
9
|
|
—
|
|
—
|
|
—
|
|
—
|
|
2
|
|
|||||||
|
Pension, post-retirement and other employee benefits
|
580
|
|
46
|
|
186
|
|
92
|
|
82
|
|
24
|
|
40
|
|
|||||||
|
Progress Energy merger purchase accounting adjustments
(a)
|
1,009
|
|
—
|
|
—
|
|
—
|
|
—
|
|
—
|
|
—
|
|
|||||||
|
Tax credits and NOL carryforwards
|
3,719
|
|
170
|
|
997
|
|
163
|
|
177
|
|
25
|
|
215
|
|
|||||||
|
Investments and other assets
|
—
|
|
—
|
|
—
|
|
—
|
|
—
|
|
3
|
|
—
|
|
|||||||
|
Other
|
206
|
|
20
|
|
48
|
|
2
|
|
46
|
|
37
|
|
20
|
|
|||||||
|
Valuation allowance
|
(160
|
)
|
—
|
|
(38
|
)
|
—
|
|
—
|
|
—
|
|
—
|
|
|||||||
|
Total deferred income tax assets
|
5,662
|
|
283
|
|
1,308
|
|
282
|
|
371
|
|
118
|
|
282
|
|
|||||||
|
Investments and other assets
|
(1,584
|
)
|
(1,057
|
)
|
(412
|
)
|
(228
|
)
|
(201
|
)
|
—
|
|
(7
|
)
|
|||||||
|
Accelerated depreciation rates
|
(13,070
|
)
|
(4,429
|
)
|
(4,169
|
)
|
(2,325
|
)
|
(1,868
|
)
|
(1,356
|
)
|
(1,797
|
)
|
|||||||
|
Regulatory assets and deferred debits, net
|
(3,633
|
)
|
(943
|
)
|
(1,517
|
)
|
(756
|
)
|
(762
|
)
|
(169
|
)
|
(135
|
)
|
|||||||
|
Total deferred income tax liabilities
|
(18,287
|
)
|
(6,429
|
)
|
(6,098
|
)
|
(3,309
|
)
|
(2,831
|
)
|
(1,525
|
)
|
(1,939
|
)
|
|||||||
|
Net deferred income tax liabilities
|
$
|
(12,625
|
)
|
$
|
(6,146
|
)
|
$
|
(4,790
|
)
|
$
|
(3,027
|
)
|
$
|
(2,460
|
)
|
$
|
(1,407
|
)
|
$
|
(1,657
|
)
|
|
(a)
|
Primarily related to capital lease obligations and debt fair value adjustments.
|
The following table presents the expiration of tax credits and NOL carryforwards.
|
|
December 31, 2015
|
||||||||
|
(in millions)
|
Amount
|
|
Expiration Year
|
||||||
|
Investment tax credits
|
$
|
864
|
|
2029
|
—
|
2035
|
|||
|
Alternative minimum tax credits
|
1,121
|
|
Indefinite
|
||||||
|
Federal NOL carryforwards
|
484
|
|
2030
|
—
|
2033
|
||||
|
State NOL carryforwards and credits
(a)
|
299
|
|
2016
|
—
|
2035
|
||||
|
Foreign NOL carryforwards
(b)
|
100
|
|
2026
|
—
|
2034
|
||||
|
Foreign Tax Credits
|
851
|
|
2024
|
||||||
|
Total tax credits and NOL carryforwards
|
$
|
3,719
|
|
|
|
|
|||
|
(a)
|
A valuation allowance of
$81 million
has been recorded on the state Net Operating Loss carryforwards, as presented in the Net Deferred Income Tax Liability Components table.
|
|
(b)
|
A valuation allowance of
$79 million
has been recorded on the foreign Net Operating Loss carryforwards, as presented in the Net Deferred Income Tax Liability Components table.
|
224
PART II
DUKE ENERGY CORPORATION - DUKE ENERGY CAROLINAS, LLC - PROGRESS ENERGY, INC. –
DUKE ENERGY PROGRESS, LLC – DUKE ENERGY FLORIDA, LLC - DUKE ENERGY OHIO, INC. - DUKE ENERGY INDIANA, INC.
Combined Notes To Consolidated Financial Statements – (Continued)
|
|
December 31, 2014
|
||||||||||||||||||||
|
Duke
|
|
Duke
|
|
Duke
|
|
Duke
|
|
Duke
|
|
||||||||||||
|
Duke
|
|
Energy
|
|
Progress
|
|
Energy
|
|
Energy
|
|
Energy
|
|
Energy
|
|
||||||||
|
(in millions)
|
Energy
|
|
Carolinas
|
|
Energy
|
|
Progress
|
|
Florida
|
|
Ohio
|
|
Indiana
|
|
|||||||
|
Deferred credits and other liabilities
|
$
|
188
|
|
$
|
53
|
|
$
|
108
|
|
$
|
28
|
|
$
|
78
|
|
$
|
(8
|
)
|
$
|
12
|
|
|
Capital lease obligations
|
63
|
|
10
|
|
—
|
|
—
|
|
—
|
|
—
|
|
2
|
|
|||||||
|
Pension, post-retirement and other employee benefits
|
546
|
|
4
|
|
188
|
|
96
|
|
93
|
|
17
|
|
43
|
|
|||||||
|
Progress Energy merger purchase accounting adjustments
(a)
|
1,124
|
|
—
|
|
—
|
|
—
|
|
—
|
|
—
|
|
—
|
|
|||||||
|
Tax credits and NOL carryforwards
|
3,540
|
|
157
|
|
980
|
|
91
|
|
252
|
|
38
|
|
260
|
|
|||||||
|
Investments and other assets
|
—
|
|
—
|
|
—
|
|
—
|
|
—
|
|
14
|
|
—
|
|
|||||||
|
Other
|
—
|
|
12
|
|
—
|
|
55
|
|
—
|
|
35
|
|
11
|
|
|||||||
|
Valuation allowance
|
(184
|
)
|
—
|
|
(13
|
)
|
(1
|
)
|
—
|
|
—
|
|
—
|
|
|||||||
|
Total deferred income tax assets
|
5,277
|
|
236
|
|
1,263
|
|
269
|
|
423
|
|
96
|
|
328
|
|
|||||||
|
Investments and other assets
|
(1,625
|
)
|
(1,051
|
)
|
(427
|
)
|
(232
|
)
|
(245
|
)
|
—
|
|
(4
|
)
|
|||||||
|
Accelerated depreciation rates
|
(11,715
|
)
|
(4,046
|
)
|
(3,284
|
)
|
(2,030
|
)
|
(1,252
|
)
|
(1,660
|
)
|
(1,603
|
)
|
|||||||
|
Regulatory assets and deferred debits, net
|
(3,694
|
)
|
(953
|
)
|
(1,602
|
)
|
(809
|
)
|
(792
|
)
|
(141
|
)
|
(106
|
)
|
|||||||
|
Other
|
(44
|
)
|
—
|
|
(151
|
)
|
—
|
|
(246
|
)
|
—
|
|
—
|
|
|||||||
|
Total deferred income tax liabilities
|
(17,078
|
)
|
(6,050
|
)
|
(5,464
|
)
|
(3,071
|
)
|
(2,535
|
)
|
(1,801
|
)
|
(1,713
|
)
|
|||||||
|
Net deferred income tax liabilities
|
$
|
(11,801
|
)
|
$
|
(5,814
|
)
|
$
|
(4,201
|
)
|
$
|
(2,802
|
)
|
$
|
(2,112
|
)
|
$
|
(1,705
|
)
|
$
|
(1,385
|
)
|
|
(a)
|
Primarily related to capital lease obligations and debt fair value adjustments.
|
On July 23, 2013, HB 998 was signed into law. HB 998 reduces the North Carolina corporate income tax rate from a statutory
6.9 percent
to
6.0 percent
in January 2014 with a further reduction to
5.0 percent
in January 2015. Duke Energy recorded a net reduction of approximately
$145 million
to its North Carolina deferred tax liability in the third quarter of 2013. The significant majority of this deferred tax liability reduction was offset by recording a regulatory liability pending NCUC determination of the disposition of the amounts related to Duke Energy Carolinas and Duke Energy Progress. The impact of HB 998 did not have a significant impact on the financial position, results of operation, or cash flows of Duke Energy, Duke Energy Carolinas, Progress Energy or Duke Energy Progress.
On August 6, 2015, pursuant to N.C. Gen. Stat. 105-130.3C, the North Carolina Department of Revenue announced the North Carolina corporate income tax rate would be reduced from a statutory rate of 5.0 percent to
4.0 percent
beginning January 1, 2016. Duke Energy recorded a net reduction of approximately
$95 million
to its North Carolina deferred tax liability in the third quarter of 2015. The significant majority of this deferred tax liability reduction was offset by recording a regulatory liability pending NCUC determination of the disposition of amounts related to Duke Energy Carolinas and Duke Energy Progress. The impact did not have a significant impact on the financial position, results of operation, or cash flows of Duke Energy, Duke Energy Carolinas, Progress Energy or Duke Energy Progress.
Balance Sheet Classification of Deferred Taxes
As discussed in Note 1, the FASB issued revised accounting guidance for the Balance Sheet classification of deferred taxes. As shown in the table below, all deferred tax assets and liabilities are presented as noncurrent as of December 31, 2015. However, for December 31, 2014, the revised guidance was not applied. As a result, a portion of deferred tax assets and liabilities is shown as current at December 31, 2014.
225
PART II
DUKE ENERGY CORPORATION - DUKE ENERGY CAROLINAS, LLC - PROGRESS ENERGY, INC. –
DUKE ENERGY PROGRESS, LLC – DUKE ENERGY FLORIDA, LLC - DUKE ENERGY OHIO, INC. - DUKE ENERGY INDIANA, INC.
Combined Notes To Consolidated Financial Statements – (Continued)
|
|
December 31, 2015
|
||||||||||||||||||||
|
Duke
|
|
Duke
|
|
Duke
|
|
Duke
|
|
Duke
|
|
||||||||||||
|
Duke
|
|
Energy
|
|
Progress
|
|
Energy
|
|
Energy
|
|
Energy
|
|
Energy
|
|
||||||||
|
(in millions)
|
Energy
|
|
Carolinas
|
|
Energy
|
|
Progress
|
|
Florida
|
|
Ohio
|
|
Indiana
|
|
|||||||
|
Investments and Other Assets: Other
|
80
|
|
—
|
|
—
|
|
—
|
|
—
|
|
—
|
|
—
|
|
|||||||
|
Deferred Credits and Other Liabilities: Deferred income taxes
|
(12,705
|
)
|
(6,146
|
)
|
(4,790
|
)
|
(3,027
|
)
|
(2,460
|
)
|
(1,407
|
)
|
(1,657
|
)
|
|||||||
|
Net deferred income tax liabilities
|
$
|
(12,625
|
)
|
$
|
(6,146
|
)
|
$
|
(4,790
|
)
|
$
|
(3,027
|
)
|
$
|
(2,460
|
)
|
$
|
(1,407
|
)
|
$
|
(1,657
|
)
|
|
|
December 31, 2014
|
||||||||||||||||||||
|
Duke
|
|
Duke
|
|
Duke
|
|
Duke
|
|
Duke
|
|
||||||||||||
|
Duke
|
|
Energy
|
|
Progress
|
|
Energy
|
|
Energy
|
|
Energy
|
|
Energy
|
|
||||||||
|
(in millions)
|
Energy
|
|
Carolinas
|
|
Energy
|
|
Progress
|
|
Florida
|
|
Ohio
|
|
Indiana
|
|
|||||||
|
Current Assets: Other
|
$
|
1,593
|
|
$
|
3
|
|
$
|
558
|
|
$
|
106
|
|
$
|
340
|
|
$
|
60
|
|
$
|
206
|
|
|
Investments and Other Assets: Other
|
29
|
|
—
|
|
—
|
|
—
|
|
—
|
|
—
|
|
—
|
|
|||||||
|
Current Liabilities: Other
|
—
|
|
(5
|
)
|
—
|
|
—
|
|
—
|
|
—
|
|
—
|
|
|||||||
|
Deferred Credits and Other Liabilities: Deferred income taxes
|
(13,423
|
)
|
(5,812
|
)
|
(4,759
|
)
|
(2,908
|
)
|
(2,452
|
)
|
(1,765
|
)
|
(1,591
|
)
|
|||||||
|
Net deferred income tax liabilities
|
$
|
(11,801
|
)
|
$
|
(5,814
|
)
|
$
|
(4,201
|
)
|
$
|
(2,802
|
)
|
$
|
(2,112
|
)
|
$
|
(1,705
|
)
|
$
|
(1,385
|
)
|
226
PART II
DUKE ENERGY CORPORATION - DUKE ENERGY CAROLINAS, LLC - PROGRESS ENERGY, INC. –
DUKE ENERGY PROGRESS, LLC – DUKE ENERGY FLORIDA, LLC - DUKE ENERGY OHIO, INC. - DUKE ENERGY INDIANA, INC.
Combined Notes To Consolidated Financial Statements – (Continued)
UNRECOGNIZED TAX BENEFITS
The following tables present changes to unrecognized tax benefits.
|
|
Year Ended December 31, 2015
|
|||||||||||||||||
|
Duke
|
|
Duke
|
|
Duke
|
|
Duke
|
|
|||||||||||
|
Duke
|
|
Energy
|
|
Progress
|
|
Energy
|
|
Energy
|
|
Energy
|
|
|||||||
|
(in millions)
|
Energy
|
|
Carolinas
|
|
Energy
|
|
Progress
|
|
Florida
|
|
Indiana
|
|
||||||
|
Unrecognized tax benefits – January 1
|
$
|
213
|
|
$
|
160
|
|
$
|
32
|
|
$
|
23
|
|
$
|
8
|
|
$
|
1
|
|
|
Unrecognized tax benefits increases (decreases)
|
||||||||||||||||||
|
Gross increases – tax positions in prior periods
|
—
|
|
—
|
|
1
|
|
1
|
|
—
|
|
—
|
|
||||||
|
Gross decreases – tax positions in prior periods
|
(48
|
)
|
(45
|
)
|
—
|
|
—
|
|
—
|
|
—
|
|
||||||
|
Decreases due to settlements
|
(45
|
)
|
(43
|
)
|
—
|
|
—
|
|
—
|
|
—
|
|
||||||
|
Reduction due to lapse of statute of limitations
|
(32
|
)
|
—
|
|
(32
|
)
|
(21
|
)
|
(8
|
)
|
—
|
|
||||||
|
Total changes
|
(125
|
)
|
(88
|
)
|
(31
|
)
|
(20
|
)
|
(8
|
)
|
—
|
|
||||||
|
Unrecognized tax benefits – December 31
|
$
|
88
|
|
$
|
72
|
|
$
|
1
|
|
$
|
3
|
|
$
|
—
|
|
$
|
1
|
|
|
|
Year Ended December 31, 2014
|
|||||||||||||||||
|
Duke
|
|
Duke
|
|
Duke
|
|
Duke
|
|
|||||||||||
|
Duke
|
|
Energy
|
|
Progress
|
|
Energy
|
|
Energy
|
|
Energy
|
|
|||||||
|
(in millions)
|
Energy
|
|
Carolinas
|
|
Energy
|
|
Progress
|
|
Florida
|
|
Indiana
|
|
||||||
|
Unrecognized tax benefits – January 1
|
$
|
230
|
|
$
|
171
|
|
$
|
32
|
|
$
|
22
|
|
$
|
8
|
|
$
|
1
|
|
|
Unrecognized tax benefits (decreases) increases
|
||||||||||||||||||
|
Gross increases – tax positions in prior periods
|
—
|
|
—
|
|
1
|
|
1
|
|
—
|
|
—
|
|
||||||
|
Gross decreases – tax positions in prior periods
|
(2
|
)
|
—
|
|
—
|
|
—
|
|
—
|
|
—
|
|
||||||
|
Decreases due to settlements
|
(15
|
)
|
(11
|
)
|
(1
|
)
|
—
|
|
—
|
|
—
|
|
||||||
|
Total changes
|
(17
|
)
|
(11
|
)
|
—
|
|
1
|
|
—
|
|
—
|
|
||||||
|
Unrecognized tax benefits – December 31
|
$
|
213
|
|
$
|
160
|
|
$
|
32
|
|
$
|
23
|
|
$
|
8
|
|
$
|
1
|
|
|
|
Year Ended December 31, 2013
|
||||||||||||||||||||
|
Duke
|
|
Duke
|
|
Duke
|
|
Duke
|
|
Duke
|
|
||||||||||||
|
Duke
|
|
Energy
|
|
Progress
|
|
Energy
|
|
Energy
|
|
Energy
|
|
Energy
|
|
||||||||
|
(in millions)
|
Energy
|
|
Carolinas
|
|
Energy
|
|
Progress
|
|
Florida
|
|
Ohio
|
|
Indiana
|
|
|||||||
|
Unrecognized tax benefits – January 1
|
$
|
540
|
|
$
|
271
|
|
$
|
131
|
|
$
|
67
|
|
$
|
44
|
|
$
|
36
|
|
$
|
32
|
|
|
Unrecognized tax benefits increases (decreases)
|
|||||||||||||||||||||
|
Gross decreases – tax positions in prior periods
|
(231
|
)
|
(100
|
)
|
(86
|
)
|
(45
|
)
|
(37
|
)
|
(36
|
)
|
(31
|
)
|
|||||||
|
Decreases due to settlements
|
(66
|
)
|
—
|
|
—
|
|
—
|
|
—
|
|
—
|
|
—
|
|
|||||||
|
Reduction due to lapse of statute of limitations
|
(13
|
)
|
—
|
|
(13
|
)
|
—
|
|
1
|
|
—
|
|
—
|
|
|||||||
|
Total changes
|
(310
|
)
|
(100
|
)
|
(99
|
)
|
(45
|
)
|
(36
|
)
|
(36
|
)
|
(31
|
)
|
|||||||
|
Unrecognized tax benefits – December 31
|
$
|
230
|
|
$
|
171
|
|
$
|
32
|
|
$
|
22
|
|
$
|
8
|
|
$
|
—
|
|
$
|
1
|
|
The following table includes additional information regarding the Duke Energy Registrants' unrecognized tax benefits. It is reasonably possible that Duke Energy could reflect an approximate
$65 million
reduction and Duke Energy Carolinas could reflect an approximate
$63 million
reduction in unrecognized tax benefits within the next 12 months. All other Duke Energy Registrants do not anticipate a material increase or decrease in unrecognized tax benefits within the next 12 months.
|
|
December 31, 2015
|
||||||||||||||||||||
|
Duke
|
|
Duke
|
|
Duke
|
|
Duke
|
|
Duke
|
|
||||||||||||
|
Duke
|
|
Energy
|
|
Progress
|
|
Energy
|
|
Energy
|
|
Energy
|
|
Energy
|
|
||||||||
|
(in millions)
|
Energy
|
|
Carolinas
|
|
Energy
|
|
Progress
|
|
Florida
|
|
Ohio
|
|
Indiana
|
|
|||||||
|
Amount that if recognized, would affect the
effective tax rate or regulatory liability
(a)
|
$
|
62
|
|
$
|
54
|
|
$
|
2
|
|
$
|
3
|
|
$
|
1
|
|
$
|
—
|
|
$
|
2
|
|
|
Amount that if recognized, would be recorded as a
component of discontinued operations
|
4
|
|
—
|
|
—
|
|
—
|
|
—
|
|
—
|
|
—
|
|
|||||||
|
(a)
|
Duke Energy, Duke Energy Carolinas, Progress Energy, Duke Energy Progress, Duke Energy Florida and Duke Energy Indiana are unable to estimate the specific amounts that would affect the effective tax rate versus the regulatory liability.
|
227
PART II
DUKE ENERGY CORPORATION - DUKE ENERGY CAROLINAS, LLC - PROGRESS ENERGY, INC. –
DUKE ENERGY PROGRESS, LLC – DUKE ENERGY FLORIDA, LLC - DUKE ENERGY OHIO, INC. - DUKE ENERGY INDIANA, INC.
Combined Notes To Consolidated Financial Statements – (Continued)
OTHER TAX MATTERS
The following tables include interest recognized in the Consolidated Statements of Operations and the Consolidated Balance Sheets.
|
|
Year Ended December 31, 2015
|
||||||||||||||||||||
|
Duke
|
|
Duke
|
|
Duke
|
|
Duke
|
|
Duke
|
|
||||||||||||
|
Duke
|
|
Energy
|
|
Progress
|
|
Energy
|
|
Energy
|
|
Energy
|
|
Energy
|
|
||||||||
|
(in millions)
|
Energy
|
|
Carolinas
|
|
Energy
|
|
Progress
|
|
Florida
|
|
Ohio
|
|
Indiana
|
|
|||||||
|
Net interest income recognized related to income taxes
|
$
|
12
|
|
$
|
—
|
|
$
|
2
|
|
$
|
2
|
|
$
|
1
|
|
$
|
—
|
|
$
|
1
|
|
|
Net interest expense recognized related to income taxes
|
—
|
|
1
|
|
—
|
|
—
|
|
—
|
|
—
|
|
—
|
|
|||||||
|
Interest receivable related to income taxes
|
3
|
|
—
|
|
—
|
|
—
|
|
—
|
|
—
|
|
3
|
|
|||||||
|
Interest payable related to income taxes
|
—
|
|
14
|
|
—
|
|
1
|
|
—
|
|
—
|
|
—
|
|
|||||||
|
|
Year Ended December 31, 2014
|
||||||||||||||||
|
Duke
|
|
Duke
|
|
Duke
|
|
Duke
|
|
Duke
|
|
||||||||
|
Duke
|
|
Energy
|
|
Progress
|
|
Energy
|
|
Energy
|
|
Energy
|
|
Energy
|
|
||||
|
(in millions)
|
Energy
|
|
Carolinas
|
|
Energy
|
|
Progress
|
|
Florida
|
|
Ohio
|
|
Indiana
|
|
|||
|
Net interest income recognized related to income taxes
|
$
|
6
|
|
$
|
—
|
|
3
|
|
—
|
|
1
|
|
4
|
|
$
|
4
|
|
|
Net interest expense recognized related to income taxes
|
—
|
|
1
|
|
—
|
|
1
|
|
—
|
|
—
|
|
—
|
|
|||
|
Interest receivable related to income taxes
|
—
|
|
—
|
|
—
|
|
—
|
|
—
|
|
—
|
|
2
|
|
|||
|
Interest payable related to income taxes
|
13
|
|
13
|
|
5
|
|
3
|
|
5
|
|
—
|
|
—
|
|
|||
|
|
Year Ended December 31, 2013
|
||||||||||||||||||
|
Duke
|
|
Duke
|
|
Duke
|
|
Duke
|
|
Duke
|
|
||||||||||
|
Duke
|
|
Energy
|
|
Progress
|
|
Energy
|
|
Energy
|
|
Energy
|
|
Energy
|
|
||||||
|
(in millions)
|
Energy
|
|
Carolinas
|
|
Energy
|
|
Progress
|
|
Florida
|
|
Ohio
|
|
Indiana
|
|
|||||
|
Net interest income recognized related to income taxes
|
$
|
2
|
|
$
|
2
|
|
$
|
6
|
|
$
|
7
|
|
$
|
—
|
|
4
|
|
1
|
|
|
Interest payable related to income taxes
|
27
|
|
8
|
|
10
|
|
2
|
|
7
|
|
—
|
|
—
|
|
|||||
Duke Energy and its subsidiaries are no longer subject to U.S. federal examination for years before 2008. The years 2008 through 2011 are in Appeals. The IRS is currently auditing the federal income tax returns for years 2012 through 2014. With few exceptions, Duke Energy and its subsidiaries are no longer subject to state, local or non-U.S. income tax examinations by tax authorities for years before 2004.
228
PART II
DUKE ENERGY CORPORATION - DUKE ENERGY CAROLINAS, LLC - PROGRESS ENERGY, INC. –
DUKE ENERGY PROGRESS, LLC – DUKE ENERGY FLORIDA, LLC - DUKE ENERGY OHIO, INC. - DUKE ENERGY INDIANA, INC.
Combined Notes To Consolidated Financial Statements – (Continued)
23. OTHER INCOME AND EXPENSES, NET
The components of Other income and expenses, net on the Consolidated Statements of Operations are as follows.
|
|
Year Ended December 31, 2015
|
||||||||||||||||||||||||||
|
Duke
|
|
Duke
|
|
Duke
|
|
Duke
|
|
Duke
|
|
||||||||||||||||||
|
Duke
|
|
Energy
|
|
Progress
|
|
Energy
|
|
Energy
|
|
Energy
|
|
Energy
|
|
||||||||||||||
|
(in millions)
|
Energy
|
|
Carolinas
|
|
Energy
|
|
Progress
|
|
Florida
|
|
Ohio
|
|
Indiana
|
|
|||||||||||||
|
Interest income
|
$
|
38
|
|
$
|
2
|
|
$
|
4
|
|
$
|
2
|
|
$
|
2
|
|
$
|
4
|
|
$
|
6
|
|
||||||
|
Foreign exchange losses
|
(4
|
)
|
—
|
|
—
|
|
—
|
|
—
|
|
—
|
|
—
|
|
|||||||||||||
|
AFUDC equity
|
164
|
|
96
|
|
54
|
|
47
|
|
7
|
|
3
|
|
11
|
|
|||||||||||||
|
Post in-service equity returns
|
73
|
|
60
|
|
13
|
|
13
|
|
—
|
|
—
|
|
—
|
|
|||||||||||||
|
Nonoperating income (expense), other
|
36
|
|
2
|
|
26
|
|
9
|
|
15
|
|
(1
|
)
|
(6
|
)
|
|||||||||||||
|
Other income and expense, net
|
$
|
307
|
|
$
|
160
|
|
$
|
97
|
|
$
|
71
|
|
$
|
24
|
|
$
|
6
|
|
$
|
11
|
|
||||||
|
|
Year Ended December 31, 2014
|
||||||||||||||||||||||||||
|
Duke
|
|
Duke
|
|
Duke
|
|
Duke
|
|
Duke
|
|
||||||||||||||||||
|
Duke
|
|
Energy
|
|
Progress
|
|
Energy
|
|
Energy
|
|
Energy
|
|
Energy
|
|
||||||||||||||
|
(in millions)
|
Energy
|
|
Carolinas
|
|
Energy
|
|
Progress
|
|
Florida
|
|
Ohio
|
|
Indiana
|
|
|||||||||||||
|
Interest income
|
$
|
57
|
|
$
|
4
|
|
$
|
3
|
|
$
|
—
|
|
$
|
2
|
|
$
|
8
|
|
$
|
6
|
|
||||||
|
Foreign exchange gains
|
3
|
|
—
|
|
—
|
|
—
|
|
—
|
|
—
|
|
—
|
|
|||||||||||||
|
AFUDC equity
|
135
|
|
91
|
|
26
|
|
25
|
|
—
|
|
4
|
|
14
|
|
|||||||||||||
|
Post in-service equity returns
|
89
|
|
71
|
|
17
|
|
17
|
|
—
|
|
—
|
|
—
|
|
|||||||||||||
|
Nonoperating income (expense), other
|
67
|
|
6
|
|
31
|
|
9
|
|
18
|
|
(2
|
)
|
2
|
|
|||||||||||||
|
Other income and expense, net
|
$
|
351
|
|
$
|
172
|
|
$
|
77
|
|
$
|
51
|
|
$
|
20
|
|
$
|
10
|
|
$
|
22
|
|
||||||
|
|
Year Ended December 31, 2013
|
||||||||||||||||||||||||||
|
Duke
|
|
Duke
|
|
Duke
|
|
Duke
|
|
Duke
|
|
||||||||||||||||||
|
Duke
|
|
Energy
|
|
Progress
|
|
Energy
|
|
Energy
|
|
Energy
|
|
Energy
|
|
||||||||||||||
|
(in millions)
|
Energy
|
|
Carolinas
|
|
Energy
|
|
Progress
|
|
Florida
|
|
Ohio
|
|
Indiana
|
|
|||||||||||||
|
Interest income
|
$
|
26
|
|
$
|
1
|
|
$
|
7
|
|
$
|
1
|
|
$
|
3
|
|
$
|
5
|
|
$
|
6
|
|
||||||
|
Foreign exchange losses
|
(18
|
)
|
—
|
|
—
|
|
—
|
|
—
|
|
—
|
|
—
|
|
|||||||||||||
|
AFUDC equity
|
157
|
|
91
|
|
50
|
|
42
|
|
8
|
|
1
|
|
15
|
|
|||||||||||||
|
Post in-service equity returns
|
39
|
|
32
|
|
7
|
|
7
|
|
—
|
|
—
|
|
—
|
|
|||||||||||||
|
Nonoperating income (expense), other
|
58
|
|
(4
|
)
|
30
|
|
7
|
|
19
|
|
(4
|
)
|
(3
|
)
|
|||||||||||||
|
Other income and expense, net
|
$
|
262
|
|
$
|
120
|
|
$
|
94
|
|
$
|
57
|
|
$
|
30
|
|
$
|
2
|
|
$
|
18
|
|
||||||
24. SUBSEQUENT EVENTS
For information on subsequent events related to significant accounting policies, acquisitions and dispositions, business segments, regulatory matters, commitments and contingencies, debt and credit facilities, asset retirement obligations, derivatives and hedging and income taxes see Notes 1, 2, 3, 4, 5, 6, 9, 14 and 22, respectively.
229
PART II
DUKE ENERGY CORPORATION - DUKE ENERGY CAROLINAS, LLC - PROGRESS ENERGY, INC. –
DUKE ENERGY PROGRESS, LLC – DUKE ENERGY FLORIDA, LLC - DUKE ENERGY OHIO, INC. - DUKE ENERGY INDIANA, INC.
Combined Notes To Consolidated Financial Statements – (Continued)
25. QUARTERLY FINANCIAL DATA (UNAUDITED)
DUKE ENERGY
Quarterly EPS amounts may not sum to the full-year total due to changes in the weighted average number of common shares outstanding and rounding.
|
First
|
|
Second
|
|
Third
|
|
Fourth
|
|
||||||||||||
|
(in millions, except per share data)
|
Quarter
|
|
Quarter
|
|
Quarter
|
|
Quarter
|
|
Total
|
|
|||||||||
|
2015
|
|
|
|
|
|
||||||||||||||
|
Operating revenues
|
$
|
6,065
|
|
$
|
5,589
|
|
$
|
6,483
|
|
$
|
5,322
|
|
$
|
23,459
|
|
||||
|
Operating income
|
1,456
|
|
1,246
|
|
1,688
|
|
977
|
|
5,367
|
|
|||||||||
|
Income from continuing operations
|
776
|
|
604
|
|
940
|
|
491
|
|
2,811
|
|
|||||||||
|
Income (loss) from discontinued operations, net of tax
|
91
|
|
(57
|
)
|
(5
|
)
|
(9
|
)
|
20
|
|
|||||||||
|
Net income
|
867
|
|
547
|
|
935
|
|
482
|
|
2,831
|
|
|||||||||
|
Net income attributable to Duke Energy Corporation
|
864
|
|
543
|
|
932
|
|
477
|
|
2,816
|
|
|||||||||
|
Earnings per share:
|
|
|
|
|
|
||||||||||||||
|
Income from continuing operations attributable to Duke Energy Corporation common stockholders
|
|
|
|
|
|
||||||||||||||
|
Basic
|
$
|
1.09
|
|
$
|
0.87
|
|
$
|
1.36
|
|
$
|
0.70
|
|
$
|
4.02
|
|
||||
|
Diluted
|
$
|
1.09
|
|
$
|
0.87
|
|
$
|
1.36
|
|
$
|
0.70
|
|
$
|
4.02
|
|
||||
|
Income (loss) from discontinued operations attributable to Duke Energy Corporation common stockholders
|
|||||||||||||||||||
|
Basic
|
$
|
0.13
|
|
$
|
(0.09
|
)
|
$
|
(0.01
|
)
|
$
|
(0.01
|
)
|
$
|
0.03
|
|
||||
|
Diluted
|
$
|
0.13
|
|
$
|
(0.09
|
)
|
$
|
(0.01
|
)
|
$
|
(0.01
|
)
|
$
|
0.03
|
|
||||
|
Net income attributable to Duke Energy Corporation common stockholders
|
|
|
|
|
|
||||||||||||||
|
Basic
|
$
|
1.22
|
|
$
|
0.78
|
|
$
|
1.35
|
|
$
|
0.69
|
|
$
|
4.05
|
|
||||
|
Diluted
|
$
|
1.22
|
|
$
|
0.78
|
|
$
|
1.35
|
|
$
|
0.69
|
|
$
|
4.05
|
|
||||
|
2014
|
|
|
|
|
|
||||||||||||||
|
Operating revenues
|
$
|
6,263
|
|
$
|
5,708
|
|
$
|
6,395
|
|
$
|
5,559
|
|
$
|
23,925
|
|
||||
|
Operating income
|
1,362
|
|
1,289
|
|
1,619
|
|
988
|
|
5,258
|
|
|||||||||
|
Income from continuing operations
|
750
|
|
726
|
|
891
|
|
98
|
|
2,465
|
|
|||||||||
|
(Loss) Income from discontinued operations, net of tax
|
(843
|
)
|
(113
|
)
|
378
|
|
2
|
|
(576
|
)
|
|||||||||
|
Net (loss) income
|
(93
|
)
|
613
|
|
1,269
|
|
100
|
|
1,889
|
|
|||||||||
|
Net (loss) income attributable to Duke Energy Corporation
|
(97
|
)
|
609
|
|
1,274
|
|
97
|
|
1,883
|
|
|||||||||
|
Earnings per share:
|
|
|
|
|
|
||||||||||||||
|
Income from continuing operations attributable to Duke Energy Corporation common stockholders
|
|
|
|
|
|
||||||||||||||
|
Basic
|
$
|
1.05
|
|
$
|
1.02
|
|
$
|
1.25
|
|
$
|
0.14
|
|
$
|
3.46
|
|
||||
|
Diluted
|
$
|
1.05
|
|
$
|
1.02
|
|
$
|
1.25
|
|
$
|
0.14
|
|
$
|
3.46
|
|
||||
|
(Loss) Income from discontinued operations attributable to Duke Energy Corporation common stockholders
|
|||||||||||||||||||
|
Basic
|
$
|
(1.19
|
)
|
$
|
(0.16
|
)
|
$
|
0.55
|
|
$
|
—
|
|
$
|
(0.80
|
)
|
||||
|
Diluted
|
$
|
(1.19
|
)
|
$
|
(0.16
|
)
|
$
|
0.55
|
|
$
|
—
|
|
$
|
(0.80
|
)
|
||||
|
Net (loss) income attributable to Duke Energy Corporation common stockholders
|
|
|
|
|
|
||||||||||||||
|
Basic
|
$
|
(0.14
|
)
|
$
|
0.86
|
|
$
|
1.80
|
|
$
|
0.14
|
|
$
|
2.66
|
|
||||
|
Diluted
|
$
|
(0.14
|
)
|
$
|
0.86
|
|
$
|
1.80
|
|
$
|
0.14
|
|
$
|
2.66
|
|
||||
230
PART II
DUKE ENERGY CORPORATION - DUKE ENERGY CAROLINAS, LLC - PROGRESS ENERGY, INC. –
DUKE ENERGY PROGRESS, LLC – DUKE ENERGY FLORIDA, LLC - DUKE ENERGY OHIO, INC. - DUKE ENERGY INDIANA, INC.
Combined Notes To Consolidated Financial Statements – (Continued)
The following table includes unusual or infrequently occurring items in each quarter during the two most recently completed fiscal years. All amounts discussed below are pretax.
|
First
|
|
Second
|
|
Third
|
|
Fourth
|
|
||||||||||||
|
(in millions)
|
Quarter
|
|
Quarter
|
|
Quarter
|
|
Quarter
|
|
Total
|
|
|||||||||
|
2015
|
|
|
|
|
|
||||||||||||||
|
Costs to Achieve, Mergers
|
$
|
(21
|
)
|
$
|
(22
|
)
|
$
|
(24
|
)
|
$
|
(30
|
)
|
$
|
(97
|
)
|
||||
|
Edwardsport Settlement (see Note 4)
|
—
|
|
—
|
|
(90
|
)
|
(3
|
)
|
(93
|
)
|
|||||||||
|
Ash Basin Settlement and Penalties (see Note 5)
|
—
|
|
—
|
|
(7
|
)
|
(7
|
)
|
(14
|
)
|
|||||||||
|
State Tax Adjustment related to Midwest Generation Sale
|
—
|
|
(41
|
)
|
—
|
|
—
|
|
(41
|
)
|
|||||||||
|
Cost Savings Initiatives (see Note 19)
|
—
|
|
—
|
|
—
|
|
(142
|
)
|
(142
|
)
|
|||||||||
|
Total
|
$
|
(21
|
)
|
$
|
(63
|
)
|
$
|
(121
|
)
|
$
|
(182
|
)
|
$
|
(387
|
)
|
||||
|
2014
|
|
|
|
|
|
|
|||||||||||||
|
Costs to Achieve, Mergers
|
$
|
(55
|
)
|
$
|
(61
|
)
|
$
|
(56
|
)
|
$
|
(33
|
)
|
$
|
(205
|
)
|
||||
|
Midwest Generation Impairment
|
(1,287
|
)
|
—
|
|
477
|
|
(39
|
)
|
(849
|
)
|
|||||||||
|
Coal Ash Plea Agreements Reserve (see Note 5)
|
—
|
|
—
|
|
—
|
|
(102
|
)
|
(102
|
)
|
|||||||||
|
International Tax Adjustment (see Note 22)
|
—
|
|
—
|
|
—
|
|
(373
|
)
|
(373
|
)
|
|||||||||
|
Asset Impairment
|
(94
|
)
|
—
|
|
—
|
|
—
|
|
(94
|
)
|
|||||||||
|
Total
|
$
|
(1,436
|
)
|
$
|
(61
|
)
|
$
|
421
|
|
$
|
(547
|
)
|
$
|
(1,623
|
)
|
||||
DUKE ENERGY CAROLINAS
|
First
|
|
Second
|
|
Third
|
|
Fourth
|
|
||||||||||||
|
(in millions)
|
Quarter
|
|
Quarter
|
|
Quarter
|
|
Quarter
|
|
Total
|
|
|||||||||
|
2015
|
|
|
|
|
|
||||||||||||||
|
Operating revenues
|
$
|
1,901
|
|
$
|
1,707
|
|
$
|
2,061
|
|
$
|
1,560
|
|
$
|
7,229
|
|
||||
|
Operating income
|
515
|
|
483
|
|
666
|
|
296
|
|
1,960
|
|
|||||||||
|
Net income
|
292
|
|
265
|
|
383
|
|
141
|
|
1,081
|
|
|||||||||
|
2014
|
|
|
|
|
|
||||||||||||||
|
Operating revenues
|
$
|
2,000
|
|
$
|
1,755
|
|
$
|
1,938
|
|
$
|
1,658
|
|
$
|
7,351
|
|
||||
|
Operating income
|
509
|
|
438
|
|
630
|
|
318
|
|
1,895
|
|
|||||||||
|
Net income
|
286
|
|
270
|
|
377
|
|
139
|
|
1,072
|
|
|||||||||
The following table includes unusual or infrequently occurring items in each quarter during the two most recently completed fiscal years. All amounts discussed below are pretax.
|
First
|
|
Second
|
|
Third
|
|
Fourth
|
|
||||||||||||
|
(in millions)
|
Quarter
|
|
Quarter
|
|
Quarter
|
|
Quarter
|
|
Total
|
|
|||||||||
|
2015
|
|
|
|
|
|
||||||||||||||
|
Costs to Achieve, Mergers
|
$
|
(9
|
)
|
$
|
(11
|
)
|
$
|
(11
|
)
|
|
$
|
(16
|
)
|
$
|
(47
|
)
|
|||
|
Ash Basin Settlement and Penalties (see Note 5)
|
—
|
|
—
|
|
(1
|
)
|
(7
|
)
|
(8
|
)
|
|||||||||
|
Cost Savings Initiatives (see Note 19)
|
—
|
|
—
|
|
—
|
|
(93
|
)
|
(93
|
)
|
|||||||||
|
Total
|
$
|
(9
|
)
|
$
|
(11
|
)
|
$
|
(12
|
)
|
$
|
(116
|
)
|
$
|
(148
|
)
|
||||
|
2014
|
|
|
|
|
|
||||||||||||||
|
Costs to Achieve, Mergers
|
$
|
(29
|
)
|
$
|
(38
|
)
|
$
|
(25
|
)
|
$
|
(17
|
)
|
$
|
(109
|
)
|
||||
|
Coal Ash Plea Agreements Reserve (see Note 5)
|
—
|
|
—
|
|
—
|
|
(72
|
)
|
(72
|
)
|
|||||||||
|
Total
|
$
|
(29
|
)
|
$
|
(38
|
)
|
$
|
(25
|
)
|
$
|
(89
|
)
|
$
|
(181
|
)
|
||||
231
PART II
DUKE ENERGY CORPORATION - DUKE ENERGY CAROLINAS, LLC - PROGRESS ENERGY, INC. –
DUKE ENERGY PROGRESS, LLC – DUKE ENERGY FLORIDA, LLC - DUKE ENERGY OHIO, INC. - DUKE ENERGY INDIANA, INC.
Combined Notes To Consolidated Financial Statements – (Continued)
PROGRESS ENERGY
|
First
|
|
Second
|
|
Third
|
|
Fourth
|
|
||||||||||||
|
(in millions)
|
Quarter
|
|
Quarter
|
|
Quarter
|
|
Quarter
|
|
Total
|
|
|||||||||
|
2015
|
|
|
|
|
|
||||||||||||||
|
Operating revenues
|
$
|
2,536
|
|
$
|
2,476
|
|
$
|
2,929
|
|
$
|
2,336
|
|
$
|
10,277
|
|
||||
|
Operating income
|
549
|
|
504
|
|
756
|
|
351
|
|
2,160
|
|
|||||||||
|
Income from continuing operations
|
264
|
|
217
|
|
452
|
|
132
|
|
1,065
|
|
|||||||||
|
Net income
|
263
|
|
217
|
|
451
|
|
131
|
|
1,062
|
|
|||||||||
|
Net income attributable to Parent
|
260
|
|
215
|
|
448
|
|
128
|
|
1,051
|
|
|||||||||
|
2014
|
|
|
|
|
|
||||||||||||||
|
Operating revenues
|
$
|
2,541
|
|
$
|
2,421
|
|
$
|
2,863
|
|
$
|
2,341
|
|
$
|
10,166
|
|
||||
|
Operating income
|
477
|
|
488
|
|
665
|
|
388
|
|
2,018
|
|
|||||||||
|
Income from continuing operations
|
204
|
|
207
|
|
330
|
|
139
|
|
880
|
|
|||||||||
|
Net income
|
203
|
|
202
|
|
330
|
|
139
|
|
874
|
|
|||||||||
|
Net income attributable to Parent
|
202
|
|
202
|
|
329
|
|
136
|
|
869
|
|
|||||||||
The following table includes unusual or infrequently occurring items in each quarter during the two most recently completed fiscal years. All amounts discussed below are pretax.
|
First
|
|
Second
|
|
Third
|
|
Fourth
|
|
||||||||||||
|
(in millions)
|
Quarter
|
|
Quarter
|
|
Quarter
|
|
Quarter
|
|
Total
|
|
|||||||||
|
2015
|
|
|
|
|
|
||||||||||||||
|
Costs to Achieve, Mergers
|
$
|
(8
|
)
|
$
|
(8
|
)
|
$
|
(8
|
)
|
$
|
(10
|
)
|
$
|
(34
|
)
|
||||
|
Ash Basin Settlement and Penalties (see Note 5)
|
—
|
|
—
|
|
(6
|
)
|
—
|
|
(6
|
)
|
|||||||||
|
Cost Savings Initiatives (see Note 19)
|
—
|
|
—
|
|
—
|
|
(36
|
)
|
(36
|
)
|
|||||||||
|
Total
|
$
|
(8
|
)
|
$
|
(8
|
)
|
$
|
(14
|
)
|
$
|
(46
|
)
|
$
|
(76
|
)
|
||||
|
2014
|
|
|
|
|
|
|
|||||||||||||
|
Costs to Achieve, Mergers
|
$
|
(19
|
)
|
$
|
(12
|
)
|
$
|
(21
|
)
|
$
|
(13
|
)
|
$
|
(65
|
)
|
||||
|
Coal Ash Plea Agreements Reserve (see Note 5)
|
—
|
|
—
|
|
—
|
|
(30
|
)
|
(30
|
)
|
|||||||||
|
Total
|
$
|
(19
|
)
|
$
|
(12
|
)
|
$
|
(21
|
)
|
$
|
(43
|
)
|
$
|
(95
|
)
|
||||
DUKE ENERGY PROGRESS
|
First
|
|
Second
|
|
Third
|
|
Fourth
|
|
||||||||||||
|
(in millions)
|
Quarter
|
|
Quarter
|
|
Quarter
|
|
Quarter
|
|
Total
|
|
|||||||||
|
2015
|
|
|
|
|
|
||||||||||||||
|
Operating revenues
|
$
|
1,449
|
|
$
|
1,193
|
|
$
|
1,488
|
|
$
|
1,160
|
|
$
|
5,290
|
|
||||
|
Operating income
|
316
|
|
184
|
|
394
|
|
130
|
|
1,024
|
|
|||||||||
|
Net income
|
183
|
|
85
|
|
229
|
|
69
|
|
566
|
|
|||||||||
|
2014
|
|
|
|
|
|
||||||||||||||
|
Operating revenues
|
$
|
1,422
|
|
$
|
1,191
|
|
$
|
1,367
|
|
$
|
1,196
|
|
$
|
5,176
|
|
||||
|
Operating income
|
258
|
|
212
|
|
285
|
|
180
|
|
935
|
|
|||||||||
|
Net income
|
133
|
|
101
|
|
157
|
|
76
|
|
467
|
|
|||||||||
The following table includes unusual or infrequently occurring items in each quarter during the two most recently completed fiscal years. All amounts discussed below are pretax.
|
First
|
|
Second
|
|
Third
|
|
Fourth
|
|
||||||||||||
|
(in millions)
|
Quarter
|
|
Quarter
|
|
Quarter
|
|
Quarter
|
|
Total
|
|
|||||||||
|
2015
|
|
|
|
|
|
||||||||||||||
|
Costs to Achieve, Mergers
|
$
|
(5
|
)
|
$
|
(5
|
)
|
$
|
(6
|
)
|
$
|
(6
|
)
|
$
|
(22
|
)
|
||||
|
Ash Basin Settlement and Penalties (see Note 5)
|
—
|
|
—
|
|
(6
|
)
|
—
|
|
(6
|
)
|
|||||||||
|
Cost Savings Initiatives (see Note 19)
|
—
|
|
—
|
|
—
|
|
(28
|
)
|
(28
|
)
|
|||||||||
|
Total
|
$
|
(5
|
)
|
|
$
|
(5
|
)
|
|
$
|
(12
|
)
|
|
$
|
(34
|
)
|
|
$
|
(56
|
)
|
|
2014
|
|
|
|
|
|
||||||||||||||
|
Costs to Achieve, Mergers
|
$
|
(14
|
)
|
$
|
(3
|
)
|
$
|
(15
|
)
|
$
|
(10
|
)
|
$
|
(42
|
)
|
||||
|
Coal Ash Plea Agreements Reserve (see Note 5)
|
—
|
|
—
|
|
—
|
|
(30
|
)
|
(30
|
)
|
|||||||||
|
Total
|
$
|
(14
|
)
|
$
|
(3
|
)
|
$
|
(15
|
)
|
$
|
(40
|
)
|
$
|
(72
|
)
|
||||
232
PART II
DUKE ENERGY CORPORATION - DUKE ENERGY CAROLINAS, LLC - PROGRESS ENERGY, INC. –
DUKE ENERGY PROGRESS, LLC – DUKE ENERGY FLORIDA, LLC - DUKE ENERGY OHIO, INC. - DUKE ENERGY INDIANA, INC.
Combined Notes To Consolidated Financial Statements – (Continued)
DUKE ENERGY FLORIDA
|
First
|
|
Second
|
|
Third
|
|
Fourth
|
|
||||||||||||
|
(in millions)
|
Quarter
|
|
Quarter
|
|
Quarter
|
|
Quarter
|
|
Total
|
|
|||||||||
|
2015
|
|
|
|
|
|
||||||||||||||
|
Operating revenues
|
$
|
1,086
|
|
$
|
1,281
|
|
$
|
1,436
|
|
$
|
1,174
|
|
$
|
4,977
|
|
||||
|
Operating income
|
227
|
|
315
|
|
357
|
|
216
|
|
1,115
|
|
|||||||||
|
Net income
|
113
|
|
165
|
|
216
|
|
105
|
|
599
|
|
|||||||||
|
2014
|
|
|
|
|
|
||||||||||||||
|
Operating revenues
|
$
|
1,116
|
|
$
|
1,225
|
|
$
|
1,491
|
|
$
|
1,143
|
|
$
|
4,975
|
|
||||
|
Operating income
|
219
|
|
276
|
|
378
|
|
205
|
|
1,078
|
|
|||||||||
|
Net income
|
108
|
|
142
|
|
205
|
|
93
|
|
548
|
|
|||||||||
The following table includes unusual or infrequently occurring items in each quarter during the two most recently completed fiscal years. All amounts discussed below are pretax.
|
First
|
|
Second
|
|
Third
|
|
Fourth
|
|
||||||||||||
|
(in millions)
|
Quarter
|
|
Quarter
|
|
Quarter
|
|
Quarter
|
|
Total
|
|
|||||||||
|
2015
|
|
|
|
|
|
||||||||||||||
|
Costs to Achieve, Mergers
|
$
|
(3
|
)
|
$
|
(3
|
)
|
$
|
(3
|
)
|
$
|
(4
|
)
|
$
|
(13
|
)
|
||||
|
Cost Savings Initiatives (see Note 19)
|
—
|
|
—
|
|
—
|
|
(8
|
)
|
(8
|
)
|
|||||||||
|
Total
|
$
|
(3
|
)
|
$
|
(3
|
)
|
$
|
(3
|
)
|
$
|
(12
|
)
|
$
|
(21
|
)
|
||||
|
2014
|
|
|
|
|
|
||||||||||||||
|
Costs to Achieve, Mergers
|
$
|
(5
|
)
|
$
|
(9
|
)
|
$
|
(6
|
)
|
$
|
(3
|
)
|
$
|
(23
|
)
|
||||
DUKE ENERGY OHIO
|
First
|
|
Second
|
|
Third
|
|
Fourth
|
|
||||||||||||
|
(in millions)
|
Quarter
|
|
Quarter
|
|
Quarter
|
|
Quarter
|
|
Total
|
|
|||||||||
|
2015
|
|
|
|
|
|
||||||||||||||
|
Operating revenues
|
$
|
586
|
|
$
|
405
|
|
$
|
462
|
|
$
|
452
|
|
$
|
1,905
|
|
||||
|
Operating income
|
111
|
|
43
|
|
76
|
|
73
|
|
303
|
|
|||||||||
|
Income (loss) from discontinued operations, net of tax
|
90
|
|
(65
|
)
|
(2
|
)
|
—
|
|
23
|
|
|||||||||
|
Net income (loss)
|
149
|
|
(52
|
)
|
32
|
|
43
|
|
172
|
|
|||||||||
|
2014
|
|
|
|
|
|
||||||||||||||
|
Operating revenues
|
$
|
575
|
|
$
|
412
|
|
$
|
446
|
|
$
|
480
|
|
$
|
1,913
|
|
||||
|
Operating (loss) income
|
(7
|
)
|
60
|
|
58
|
|
76
|
|
187
|
|
|||||||||
|
(Loss) Income from discontinued operations, net of tax
|
(875
|
)
|
(135
|
)
|
413
|
|
34
|
|
(563
|
)
|
|||||||||
|
Net (loss) income
|
(890
|
)
|
(107
|
)
|
439
|
|
63
|
|
(495
|
)
|
|||||||||
The following table includes unusual or infrequently occurring items in each quarter during the two most recently completed fiscal years. All amounts discussed below are pretax.
|
First
|
|
Second
|
|
Third
|
|
Fourth
|
|
||||||||||||
|
(in millions)
|
Quarter
|
|
Quarter
|
|
Quarter
|
|
Quarter
|
|
Total
|
|
|||||||||
|
2015
|
|
|
|
|
|
||||||||||||||
|
Costs to Achieve, Mergers
|
$
|
(1
|
)
|
$
|
(1
|
)
|
$
|
(1
|
)
|
$
|
(1
|
)
|
$
|
(4
|
)
|
||||
|
Cost Savings Initiatives (see Note 19)
|
—
|
|
—
|
|
—
|
|
(2
|
)
|
(2
|
)
|
|||||||||
|
Total
|
$
|
(1
|
)
|
$
|
(1
|
)
|
$
|
(1
|
)
|
$
|
(3
|
)
|
$
|
(6
|
)
|
||||
|
2014
|
|
|
|
|
|
||||||||||||||
|
Costs to Achieve, Mergers
|
$
|
(2
|
)
|
$
|
(4
|
)
|
$
|
(3
|
)
|
$
|
(2
|
)
|
$
|
(11
|
)
|
||||
|
Midwest Generation Impairment
|
(1,318
|
)
|
—
|
|
477
|
|
(39
|
)
|
(880
|
)
|
|||||||||
|
Asset Impairment
|
(94
|
)
|
—
|
|
—
|
|
—
|
|
(94
|
)
|
|||||||||
|
Total
|
$
|
(1,414
|
)
|
$
|
(4
|
)
|
$
|
474
|
|
$
|
(41
|
)
|
$
|
(985
|
)
|
||||
233
PART II
DUKE ENERGY CORPORATION - DUKE ENERGY CAROLINAS, LLC - PROGRESS ENERGY, INC. –
DUKE ENERGY PROGRESS, LLC – DUKE ENERGY FLORIDA, LLC - DUKE ENERGY OHIO, INC. - DUKE ENERGY INDIANA, INC.
Combined Notes To Consolidated Financial Statements – (Continued)
DUKE ENERGY INDIANA
|
First
|
|
Second
|
|
Third
|
|
Fourth
|
|
||||||||||||
|
(in millions)
|
Quarter
|
|
Quarter
|
|
Quarter
|
|
Quarter
|
|
Total
|
|
|||||||||
|
2015
|
|
|
|
|
|
||||||||||||||
|
Operating revenues
|
$
|
788
|
|
$
|
686
|
|
$
|
749
|
|
$
|
667
|
|
$
|
2,890
|
|
||||
|
Operating income
|
210
|
|
146
|
|
117
|
|
171
|
|
644
|
|
|||||||||
|
Net income
|
108
|
|
68
|
|
46
|
|
94
|
|
316
|
|
|||||||||
|
2014
|
|
|
|
|
|
||||||||||||||
|
Operating revenues
|
$
|
845
|
|
$
|
748
|
|
$
|
790
|
|
$
|
792
|
|
$
|
3,175
|
|
||||
|
Operating income
|
215
|
|
178
|
|
182
|
|
130
|
|
705
|
|
|||||||||
|
Net income
|
113
|
|
87
|
|
101
|
|
58
|
|
359
|
|
|||||||||
The following table includes unusual or infrequently occurring items in each quarter during the two most recently completed fiscal years. All amounts discussed below are pretax.
|
First
|
|
Second
|
|
Third
|
|
Fourth
|
|
||||||||||||
|
(in millions)
|
Quarter
|
|
Quarter
|
|
Quarter
|
|
Quarter
|
|
Total
|
|
|||||||||
|
2015
|
|
|
|
|
|
||||||||||||||
|
Costs to Achieve, Mergers
|
$
|
(2
|
)
|
$
|
(1
|
)
|
$
|
(2
|
)
|
$
|
(2
|
)
|
$
|
(7
|
)
|
||||
|
Edwardsport Settlement (see Note 4)
|
—
|
|
—
|
|
(90
|
)
|
(3
|
)
|
(93
|
)
|
|||||||||
|
Cost Savings Initiatives (see Note 19)
|
—
|
|
—
|
|
—
|
|
(6
|
)
|
(6
|
)
|
|||||||||
|
Total
|
$
|
(2
|
)
|
$
|
(1
|
)
|
$
|
(92
|
)
|
$
|
(11
|
)
|
$
|
(106
|
)
|
||||
|
2014
|
|
|
|
|
|
||||||||||||||
|
Costs to Achieve, Mergers
|
$
|
(2
|
)
|
$
|
(5
|
)
|
$
|
(3
|
)
|
$
|
(2
|
)
|
$
|
(12
|
)
|
||||
234
None.
Disclosure Controls and Procedures
Disclosure controls and procedures are controls and other procedures that are designed to ensure that information required to be disclosed by the Duke Energy Registrants in the reports they file or submit under the Securities Exchange Act of 1934 (Exchange Act) is recorded, processed, summarized and reported, within the time periods specified by the SEC rules and forms.
Disclosure controls and procedures include, without limitation, controls and procedures designed to provide reasonable assurance that information required to be disclosed by the Duke Energy Registrants in the reports they file or submit under the Exchange Act is accumulated and communicated to management, including the Chief Executive Officer and Chief Financial Officer, as appropriate, to allow timely decisions regarding required disclosure.
Under the supervision and with the participation of management, including the Chief Executive Officer and Chief Financial Officer, the Duke Energy Registrants have evaluated the effectiveness of their disclosure controls and procedures (as such term is defined in Rule 13a-15(e) and 15d-15(e) under the Exchange Act) as of
December 31, 2015
, and, based upon this evaluation, the Chief Executive Officer and Chief Financial Officer have concluded that these controls and procedures are effective in providing reasonable assurance of compliance.
Changes in Internal Control Over Financial Reporting
Under the supervision and with the participation of management, including the Chief Executive Officer and Chief Financial Officer, the Duke Energy Registrants have evaluated changes in internal control over financial reporting (as such term is defined in Rules 13a-15(f) and 15d-15(f) under the Exchange Act) that occurred during the fiscal quarter ended
December 31, 2015
, and have concluded no change has materially affected, or is reasonably likely to materially affect, internal control over financial reporting.
Management’s Annual Report On Internal Control Over Financial Reporting
The Duke Energy Registrants’ management is responsible for establishing and maintaining an adequate system of internal control over financial reporting, as such term is defined in Exchange Act Rules 13a−15(f) and 15d−15(f). The Duke Energy Registrants’ internal control system was designed to provide reasonable assurance regarding the reliability of financial reporting and the preparation of financial statements for external purposes, in accordance with generally accepted accounting principles in the United States. Due to inherent limitations, internal control over financial reporting may not prevent or detect misstatements. Also, projections of any evaluation of effectiveness of the internal control over financial reporting to future periods are subject to the risk that controls may become inadequate because of changes in conditions, or that the degree of compliance with policies and procedures may deteriorate.
The Duke Energy Registrants’ management, including their Chief Executive Officer and Chief Financial Officer, has conducted an evaluation of the effectiveness of their internal control over financial reporting as of
December 31, 2015
, based on the framework in the Internal Control – Integrated Framework (2013) issued by the Committee of Sponsoring Organizations of the Treadway Commission. Based on that evaluation, management concluded that its internal controls over financial reporting were effective as of
December 31, 2015
.
Deloitte & Touche LLP, Duke Energy’s independent registered public accounting firm, has issued an attestation report on the effectiveness of Duke Energy’s internal control over financial reporting. This attestation report is included in Part II, Item 8 of this Form 10-K. This report is not applicable to the Subsidiary Registrants as these companies are not accelerated or large accelerated filers.
235
PART III
Duke Energy will provide information that is responsive to this Item 10 in its definitive proxy statement or in an amendment to this Annual Report not later than 120 days after the end of the fiscal year covered by this Annual Report. That information is incorporated in this Item 10 by reference.
Duke Energy will provide information that is responsive to this Item 11 in its definitive proxy statement or in an amendment to this Annual Report not later than 120 days after the end of the fiscal year covered by this Annual Report. That information is incorporated in this Item 11 by reference.
Duke Energy will provide information that is responsive to this Item 12 in its definitive proxy statement or in an amendment to this Annual Report not later than 120 days after the end of the fiscal year covered by this Annual Report. That information is incorporated in this Item 12 by reference.
Duke Energy will provide information that is responsive to this Item 13 in its definitive proxy statement or in an amendment to this Annual Report not later than 120 days after the end of the fiscal year covered by this Annual Report. That information is incorporated in this Item 13 by reference.
Deloitte & Touche LLP, and the member firms of Deloitte Touche Tohmatsu and their respective affiliates (collectively, Deloitte) provided professional services to the Duke Energy Registrants. The following tables present the Deloitte fees for services rendered to the Duke Energy Registrants during
2015
and
2014
.
|
|
Year Ended December 31, 2015
|
||||||||||||||||||||||||||
|
Duke
|
|
Duke
|
|
Duke
|
|
Duke
|
|
Duke
|
|
||||||||||||||||||
|
Duke
|
|
Energy
|
|
Progress
|
|
Energy
|
|
Energy
|
|
Energy
|
|
Energy
|
|
||||||||||||||
|
(in millions)
|
Energy
|
|
Carolinas
|
|
Energy
|
|
Progress
|
|
Florida
|
|
Ohio
|
|
Indiana
|
|
|||||||||||||
|
Types of Fees
|
|
|
|
|
|
|
|
||||||||||||||||||||
|
Audit Fees
(a)
|
$
|
12.5
|
|
$
|
4.6
|
|
$
|
5.1
|
|
$
|
2.9
|
|
$
|
2.2
|
|
$
|
0.8
|
|
$
|
1.3
|
|
||||||
|
Audit-Related Fees
(b)
|
2.7
|
|
—
|
|
—
|
|
—
|
|
—
|
|
1.2
|
|
—
|
|
|||||||||||||
|
Tax Fees
(c)
|
0.2
|
|
0.1
|
|
—
|
|
—
|
|
—
|
|
—
|
|
—
|
|
|||||||||||||
|
Total Fees
|
$
|
15.4
|
|
$
|
4.7
|
|
$
|
5.1
|
|
$
|
2.9
|
|
$
|
2.2
|
|
$
|
2.0
|
|
$
|
1.3
|
|
||||||
|
|
Year Ended December 31, 2014
|
||||||||||||||||||||||||||
|
Duke
|
|
Duke
|
|
Duke
|
|
Duke
|
|
Duke
|
|
||||||||||||||||||
|
Duke
|
|
Energy
|
|
Progress
|
|
Energy
|
|
Energy
|
|
Energy
|
|
Energy
|
|
||||||||||||||
|
(in millions)
|
Energy
|
|
Carolinas
|
|
Energy
|
|
Progress
|
|
Florida
|
|
Ohio
|
|
Indiana
|
|
|||||||||||||
|
Types of Fees
|
|
|
|
|
|
|
|
||||||||||||||||||||
|
Audit Fees
(a)
|
$
|
12.0
|
|
$
|
4.2
|
|
$
|
4.6
|
|
$
|
2.6
|
|
$
|
2.0
|
|
$
|
1.2
|
|
$
|
1.2
|
|
||||||
|
Audit-Related Fees
(b)
|
4.2
|
|
0.1
|
|
0.1
|
|
0.1
|
|
—
|
|
2.6
|
|
—
|
|
|||||||||||||
|
Tax Fees
(c)
|
0.7
|
|
0.3
|
|
0.3
|
|
0.2
|
|
0.1
|
|
0.1
|
|
0.1
|
|
|||||||||||||
|
Total Fees
|
$
|
16.9
|
|
$
|
4.6
|
|
$
|
5.0
|
|
$
|
2.9
|
|
$
|
2.1
|
|
$
|
3.9
|
|
$
|
1.3
|
|
||||||
|
(a)
|
Audit Fees are fees billed or expected to be billed for professional services for the audit of the Duke Energy Registrants’ financial statements included in the annual report on Form 10-K and the review of financial statements included in quarterly reports on Form 10‑Q, for services that are normally provided by Deloitte in connection with statutory, regulatory or other filings or engagements, or for any other service performed by Deloitte to comply with generally accepted auditing standards.
|
|
(b)
|
Audit-Related Fees are fees for assurance and related services that are reasonably related to the performance of an audit or review of financial statements, including assistance with acquisitions and divestitures and internal control reviews.
|
|
(c)
|
Tax Fees are fees for tax return assistance and preparation, tax examination assistance, and professional services related to tax planning and tax strategy.
|
236
To safeguard the continued independence of the independent auditor, the Audit Committee of the Board of Directors (Audit Committee) of Duke Energy adopted a policy that all services provided by the independent auditor require preapproval by the Audit Committee. Pursuant to the policy, certain audit services, audit-related services, tax services and other services have been specifically preapproved up to fee limits. In the event the cost of any of these services may exceed the fee limits, the Audit Committee must preapprove the service. All services performed in
2015
and
2014
by the independent accountant were approved by the Audit Committee pursuant to their preapproval policy.
237
PART IV
|
(a)
|
Consolidated Financial Statements, Supplemental Financial Data and Supplemental Schedules included in Part II of this annual report are as follows:
|
Duke Energy Corporation
Consolidated Financial Statements
Consolidated Statements of Operations for the Years Ended December 31, 2015, 2014 and 2013
Consolidated Statements of Comprehensive Income for the Years Ended December 31, 2015, 2014 and 2013
Consolidated Balance Sheets as of December 31, 2015 and 2014
Consolidated Statements of Cash Flows for the Years Ended December 31, 2015, 2014 and 2013
Consolidated Statements of Changes in Equity for the Years Ended December 31, 2015, 2014 and 2013
Notes to the Consolidated Financial Statements
Quarterly Financial Data, (unaudited, included in Note 25 to the Consolidated Financial Statements)
Report of Independent Registered Public Accounting Firm
All other schedules are omitted because they are not required, or because the required information is included in the Consolidated Financial Statements or Notes.
Duke Energy Carolinas, LLC
Consolidated Financial Statements
Consolidated Statements of Operations and Comprehensive Income for the Years Ended December 31, 2015, 2014 and 2013
Consolidated Balance Sheets as of December 31, 2015 and 2014
Consolidated Statements of Cash Flows for the Years Ended December 31, 2015, 2014 and 2013
Consolidated Statements of Changes in Equity for the Years Ended December 31, 2015, 2014 and 2013
Notes to the Consolidated Financial Statements
Quarterly Financial Data, (unaudited, included in Note 25 to the Consolidated Financial Statements)
Report of Independent Registered Public Accounting Firm
All other schedules are omitted because they are not required, or because the required information is included in the Consolidated Financial Statements or Notes.
Progress Energy, Inc.
Consolidated Financial Statements
Consolidated Statements of Operations and Comprehensive Income for the Years Ended December 31, 2015, 2014 and 2013
Consolidated Balance Sheets as of December 31, 2015 and 2014
Consolidated Statements of Cash Flows for the Years Ended December 31, 2015, 2014 and 2013
Consolidated Statements of Changes in Equity for the Years Ended December 31, 2015, 2014 and 2013
Notes to the Consolidated Financial Statements
Quarterly Financial Data, (unaudited, included in Note 25 to the Consolidated Financial Statements)
Report of Independent Registered Public Accounting Firm
All other schedules are omitted because they are not required, or because the required information is included in the Consolidated Financial Statements or Notes.
Duke Energy Progress, LLC (formerly Duke Energy Progress, Inc.)
Consolidated Financial Statements
Consolidated Statements of Operations and Comprehensive Income for the Years Ended December 31, 2015, 2014 and 2013
Consolidated Balance Sheets as of December 31, 2015 and 2014
Consolidated Statements of Cash Flows for the Years Ended December 31, 2015, 2014 and 2013
Consolidated Statements of Changes in Equity for the Years Ended December 31, 2015, 2014 and 2013
Notes to the Consolidated Financial Statements
Quarterly Financial Data, (unaudited, included in Note 25 to the Consolidated Financial Statements)
Report of Independent Registered Public Accounting Firm
All other schedules are omitted because they are not required, or because the required information is included in the Consolidated Financial Statements or Notes.
Duke Energy Florida, LLC (formerly Duke Energy Florida, Inc.)
Consolidated Financial Statements
Consolidated Statements of Operations and Comprehensive Income for the Years Ended December 31, 2015, 2014 and 2013
Consolidated Balance Sheets as of December 31, 2015 and 2014
Consolidated Statements of Cash Flows for the Years Ended December 31, 2015, 2014 and 2013
Consolidated Statements of Changes in Equity for the Years Ended December 31, 2015, 2014 and 2013
Notes to the Consolidated Financial Statements
Quarterly Financial Data, (unaudited, included in Note 25 to the Consolidated Financial Statements)
Report of Independent Registered Public Accounting Firm
All other schedules are omitted because they are not required, or because the required information is included in the Consolidated Financial Statements or Notes.
238
PART IV
Duke Energy Ohio, Inc.
Consolidated Financial Statements
Consolidated Statements of Operations and Comprehensive Income for the Years Ended December 31, 2015, 2014 and 2013
Consolidated Balance Sheets as of December 31, 2015 and 2014
Consolidated Statements of Cash Flows for the Years Ended December 31, 2015, 2014 and 2013
Consolidated Statements of Changes in Equity for the Years Ended December 31, 2015, 2014 and 2013
Notes to the Consolidated Financial Statements
Quarterly Financial Data, (unaudited, included in Note 25 to the Consolidated Financial Statements)
Report of Independent Registered Public Accounting Firm
All other schedules are omitted because they are not required, or because the required information is included in the Consolidated Financial Statements or Notes.
Duke Energy Indiana, Inc. (subsequently Duke Energy Indiana, LLC)
Consolidated Financial Statements
Consolidated Statements of Operations and Comprehensive Income for the Years Ended December 31, 2015, 2014 and 2013
Consolidated Balance Sheets as of December 31, 2015 and 2014
Consolidated Statements of Cash Flows for the Years Ended December 31, 2015, 2014 and 2013
Consolidated Statements of Changes in Equity for the Years Ended December 31, 2015, 2014 and 2013
Notes to the Consolidated Financial Statements
Quarterly Financial Data, (unaudited, included in Note 25 to the Consolidated Financial Statements)
Report of Independent Registered Public Accounting Firm
All other schedules are omitted because they are not required, or because the required information is included in the Consolidated Financial Statements or Notes.
(b) Exhibits – See Exhibit Index immediately following the signature page.
239
PART IV
SIGNATURES
Pursuant to the requirements of Section 13 or 15(d) of the Securities Exchange Act of 1934, the registrants have duly caused this report to be signed on their behalf by the undersigned, thereunto duly authorized.
Date:
February 25, 2016
|
DUKE ENERGY CORPORATION
(Registrant)
|
|||
|
By:
|
/s/ LYNN J. GOOD
|
||
|
Lynn J. Good
Chairman, President and Chief Executive Officer
|
|||
Pursuant to the requirements of the Securities Exchange Act of 1934, this report has been signed below by the following persons on behalf of the registrant and in the capacities and on the date indicated.
|
(i)
|
/s/ LYNN J. GOOD
|
|
|
||
|
|
Lynn J. Good
|
|
|||
|
|
Chairman, President and Chief Executive Officer (Principal Executive Officer and Director)
|
||||
|
|
|
|
|||
|
(ii)
|
/s/ STEVEN K. YOUNG
|
|
|
||
|
|
Steven K. Young
|
|
|||
|
|
Executive Vice President and Chief Financial Officer (Principal Financial Officer)
|
||||
|
|
|
|
|||
|
(iii)
|
/s/ BRIAN D. SAVOY
|
|
|
||
|
|
Brian D. Savoy
|
|
|||
|
|
Senior Vice President, Chief Accounting Officer and Controller (Principal Accounting Officer)
|
||||
|
|
|
|
|
||
|
(iv)
|
Directors:
|
|
|
||
|
|
|
|
|
||
|
|
Michael J. Angelakis*
|
John T. Herron*
|
|||
|
|
|
|
|
||
|
|
Michael G. Browning*
|
James B. Hyler, Jr.*
|
|||
|
|
|
|
|
||
|
|
Harris E. DeLoach, Jr.*
|
William E. Kennard*
|
|
||
|
|
|
|
|
||
|
|
Daniel R. DiMicco*
|
E. Marie McKee*
|
|
||
|
|
|
|
|
||
|
John H. Forsgren*
|
Richard A. Meserve*
|
||||
|
|
Ann Maynard Gray*
|
James T. Rhodes*
|
|
||
|
|
|
|
|||
|
|
James H. Hance, Jr.*
|
Carlos A. Saladrigas*
|
|
||
|
|
|
|
|||
|
|
|
||||
Steven K. Young, by signing his name hereto, does hereby sign this document on behalf of the registrant and on behalf of each of the above-named persons previously indicated by asterisk (*) pursuant to a power of attorney duly executed by the registrant and such persons, filed with the Securities and Exchange Commission as an exhibit hereto.
|
|
|
|
||
|
|
By:
|
/s/ STEVEN K. YOUNG
|
||
|
|
Attorney-In-Fact
|
|
||
|
|
|
|
|
|
Date:
February 25, 2016
240
PART IV
SIGNATURES
Pursuant to the requirements of Section 13 or 15(d) of the Securities Exchange Act of 1934, the registrant has duly caused this report to be signed on its behalf by the undersigned, thereunto duly authorized.
Date:
February 25, 2016
|
DUKE ENERGY CAROLINAS, LLC
(Registrant)
|
|||
|
By:
|
/s/ LYNN J. GOOD
|
||
|
Lynn J. Good
Chief Executive Officer
|
|||
Pursuant to the requirements of the Securities Exchange Act of 1934, this report has been signed below by the following persons on behalf of the registrant and in the capacities and on the date indicated.
|
|
|
|
|
(i)
|
/s/ LYNN J. GOOD
|
|
|
|
Lynn J. Good
|
|
|
|
Chief Executive Officer (Principal Executive Officer)
|
|
|
|
|
|
|
(ii)
|
/s/ STEVEN K.YOUNG
|
|
|
|
Steven K. Young
|
|
|
|
Executive Vice President and Chief Financial Officer (Principal Financial Officer)
|
|
|
|
|
|
|
(iii)
|
/s/ BRIAN D. SAVOY
|
|
|
|
Brian D. Savoy
|
|
|
|
Senior Vice President, Chief Accounting Officer and Controller (Principal Accounting Officer)
|
|
|
|
|
|
|
(iv)
|
Directors:
|
|
|
|
|
|
|
|
/s/ LYNN J. GOOD
|
|
|
|
Lynn J. Good
|
|
|
|
|
|
|
|
/s/ DHIAA M. JAMIL
|
|
|
|
Dhiaa M. Jamil
|
|
|
|
|
|
|
|
/s/ LLOYD M. YATES
|
|
|
|
Lloyd M. Yates
|
|
Date:
February 25, 2016
241
PART IV
SIGNATURES
Pursuant to the requirements of Section 13 or 15(d) of the Securities Exchange Act of 1934, the registrant has duly caused this report to be signed on its behalf by the undersigned, thereunto duly authorized.
Date:
February 25, 2016
|
PROGRESS ENERGY, INC.
(Registrant)
|
|||
|
By:
|
/s/ LYNN J. GOOD
|
||
|
Lynn J. Good
Chief Executive Officer
|
|||
Pursuant to the requirements of the Securities Exchange Act of 1934, this report has been signed below by the following persons on behalf of the registrant and in the capacities and on the date indicated.
|
|
|
|
|
(i)
|
/s/ LYNN J. GOOD
|
|
|
|
Lynn J. Good
|
|
|
|
Chief Executive Officer (Principal Executive Officer)
|
|
|
|
|
|
|
(ii)
|
/s/ STEVEN K. YOUNG
|
|
|
|
Steven K. Young
|
|
|
|
Executive Vice President and Chief Financial Officer (Principal Financial Officer)
|
|
|
|
|
|
|
(iii)
|
/s/ BRIAN D. SAVOY
|
|
|
|
Brian D. Savoy
|
|
|
|
Chief Accounting Officer and Controller (Principal Accounting Officer)
|
|
|
|
|
|
|
(iv)
|
Directors:
|
|
|
|
|
|
|
|
/s/ LYNN J. GOOD
|
|
|
|
Lynn J. Good
|
|
|
|
|
|
|
|
/s/ JULIA S. JANSON
|
|
|
|
Julia S. Janson
|
|
|
|
|
|
|
|
|
|
Date:
February 25, 2016
242
PART IV
SIGNATURES
Pursuant to the requirements of Section 13 or 15(d) of the Securities Exchange Act of 1934, the registrant has duly caused this report to be signed on its behalf by the undersigned, thereunto duly authorized.
Date:
February 25, 2016
|
DUKE ENERGY PROGRESS, LLC
(Registrant)
|
|||
|
By:
|
/s/ LYNN J. GOOD
|
||
|
Lynn J. Good
Chief Executive Officer
|
|||
Pursuant to the requirements of the Securities Exchange Act of 1934, this report has been signed below by the following persons on behalf of the registrant and in the capacities and on the date indicated.
|
(i)
|
/s/ LYNN J. GOOD
|
|
|
|
Lynn J. Good
|
|
|
|
Chief Executive Officer (Principal Executive Officer)
|
|
|
|
|
|
|
(ii)
|
/s/ STEVEN K. YOUNG
|
|
|
|
Steven K. Young
|
|
|
|
Executive Vice President and Chief Financial Officer (Principal Financial Officer)
|
|
|
|
|
|
|
(iii)
|
/s/ BRIAN D. SAVOY
|
|
|
|
Brian D. Savoy
|
|
|
|
Senior Vice President, Chief Accounting Officer and Controller (Principal Accounting Officer)
|
|
|
|
|
|
|
(iv)
|
Directors:
|
|
|
|
|
|
|
/s/ DOUGLAS F ESAMANN
|
||
|
Douglas F Esamann
|
||
|
|
|
|
|
|
/s/ LYNN J. GOOD
|
|
|
|
Lynn J. Good
|
|
|
|
|
|
|
|
/s/ DHIAA M. JAMIL
|
|
|
|
Dhiaa M. Jamil
|
|
|
|
|
|
|
|
/s/ JULIA S. JANSON
|
|
|
|
Julia S. Janson
|
|
|
|
|
|
|
|
/s/ LLOYD M. YATES
|
|
|
|
Lloyd M. Yates
|
|
Date:
February 25, 2016
243
PART IV
SIGNATURES
Pursuant to the requirements of Section 13 or 15(d) of the Securities Exchange Act of 1934, the registrant has duly caused this report to be signed on its behalf by the undersigned, thereunto duly authorized.
Date:
February 25, 2016
|
DUKE ENERGY FLORIDA, LLC
(Registrant)
|
|||
|
By:
|
/s/ LYNN J. GOOD
|
||
|
Lynn J. Good
Chief Executive Officer
|
|||
Pursuant to the requirements of the Securities Exchange Act of 1934, this report has been signed below by the following persons on behalf of the registrant and in the capacities and on the date indicated.
|
|
|
|
|
(i)
|
/s/ LYNN J. GOOD
|
|
|
|
Lynn J. Good
|
|
|
|
Chief Executive Officer (Principal Executive Officer)
|
|
|
|
|
|
|
(ii)
|
/s/ STEVEN K. YOUNG
|
|
|
|
Steven K. Young
|
|
|
|
Executive Vice President and Chief Financial Officer (Principal Financial Officer)
|
|
|
|
|
|
|
(iii)
|
/s/ BRIAN D. SAVOY
|
|
|
|
Brian D. Savoy
|
|
|
|
Senior Vice President, Chief Accounting Officer and Controller (Principal Accounting Officer)
|
|
|
|
|
|
|
(iv)
|
Directors:
|
|
|
/s/ DOUGLAS F ESAMANN
|
||
|
|
Douglas F Esamann
|
|
|
|
/s/ LYNN J. GOOD
|
|
|
|
Lynn J. Good
|
|
|
|
|
|
|
|
/s/ DHIAA M. JAMIL
|
|
|
Dhiaa M. Jamil
|
||
|
|
|
|
|
|
/s/ JULIA S. JANSON
|
|
|
Julia S. Janson
|
||
|
|
|
|
|
|
/s/ LLOYD M. YATES
|
|
|
|
Lloyd M. Yates
|
|
Date:
February 25, 2016
244
PART IV
SIGNATURES
Pursuant to the requirements of Section 13 or 15(d) of the Securities Exchange Act of 1934, the registrant has duly caused this report to be signed on its behalf by the undersigned, thereunto duly authorized.
Date:
February 25, 2016
|
DUKE ENERGY OHIO, INC.
(Registrant)
|
|||
|
By:
|
/s/ LYNN J. GOOD
|
||
|
Lynn J. Good
Chief Executive Officer
|
|||
Pursuant to the requirements of the Securities Exchange Act of 1934, this report has been signed below by the following persons on behalf of the registrant and in the capacities and on the date indicated.
|
|
|
|
|
(i)
|
/s/ LYNN J. GOOD
|
|
|
|
Lynn J. Good
|
|
|
|
Chief Executive Officer (Principal Executive Officer)
|
|
|
|
|
|
|
(ii)
|
/s/ STEVEN K. YOUNG
|
|
|
|
Steven K. Young
|
|
|
|
Executive Vice President and Chief Financial Officer (Principal Financial Officer)
|
|
|
|
|
|
|
(iii)
|
/s/ BRIAN D. SAVOY
|
|
|
|
Brian D. Savoy
|
|
|
|
Senior Vice President, Chief Accounting Officer and Controller (Principal Accounting Officer)
|
|
|
|
|
|
|
(iv)
|
Directors:
|
|
|
/s/ DOUGLAS F ESAMANN
|
||
|
Douglas F Esamann
|
||
|
|
|
|
|
|
/s/ LYNN J. GOOD
|
|
|
|
Lynn J. Good
|
|
|
|
|
|
|
|
/s/ DHIAA M. JAMIL
|
|
|
|
Dhiaa M. Jamil
|
|
Date:
February 25, 2016
245
PART IV
SIGNATURES
Pursuant to the requirements of Section 13 or 15(d) of the Securities Exchange Act of 1934, the registrant has duly caused this report to be signed on its behalf by the undersigned, thereunto duly authorized.
Date:
February 25, 2016
|
DUKE ENERGY INDIANA, LLC
(Registrant)
|
|||
|
By:
|
/s/ LYNN J. GOOD
|
||
|
Lynn J. Good
Chief Executive Officer
|
|||
Pursuant to the requirements of the Securities Exchange Act of 1934, this report has been signed below by the following persons on behalf of the registrant and in the capacities and on the date indicated.
|
|
|
|
|
(i)
|
/s/ LYNN J. GOOD
|
|
|
|
Lynn J. Good
|
|
|
|
Chief Executive Officer (Principal Executive Officer)
|
|
|
|
|
|
|
(ii)
|
/s/ STEVEN K. YOUNG
|
|
|
|
Steven K. Young
|
|
|
|
Executive Vice President and Chief Financial Officer (Principal Financial Officer)
|
|
|
|
|
|
|
(iii)
|
/s/ BRIAN. D. SAVOY
|
|
|
|
Brian D. Savoy
|
|
|
|
Senior Vice President, Chief Accounting Officer and Controller (Principal Accounting Officer)
|
|
|
|
|
|
|
(iv)
|
Directors:
|
|
|
/s/ MELODY BIRMINGHAM-BYRD
|
||
|
Melody Birmingham-Byrd
|
||
|
|
|
|
|
|
/s/ DOUGLAS F ESAMANN
|
|
|
Douglas F Esamann
|
||
|
|
|
|
|
|
/s/ KELLEY A. KARN
|
|
|
Kelley A. Karn
|
||
Date:
February 25, 2016
246
EXHIBIT INDEX
Exhibits filed herewithin are designated by an asterisk (*). All exhibits not so designated are incorporated by reference to a prior filing, as indicated. Items constituting management contracts or compensatory plans or arrangements are designated by a double asterisk (**). The Company agrees to furnish upon request to the Commission a copy of any omitted schedules or exhibits upon request on all items designated by a triple asterisk (***). A management contract or compensation plan or arrangement under legacy Progress Energy that is required to be filed as an exhibit to this report pursuant to Item 15(b) of Form 10-K is designated by a plus (+).
|
Duke
|
Duke
|
Duke
|
Duke
|
Duke
|
||||||||||
|
Exhibit
|
Duke
|
Energy
|
Progress
|
Energy
|
Energy
|
Energy
|
Energy
|
|||||||
|
Number
|
Energy
|
Carolinas
|
Energy
|
Progress
|
Florida
|
Ohio
|
Indiana
|
|||||||
|
2.1
|
Agreement and Plan of Merger between Duke Energy Corporation, Diamond Acquisition Corporation and Progress Energy, Inc., dated as of January 8, 2011, (incorporated by reference to Exhibit 2.1 to Duke Energy Corporation's Current Report on Form 8-K filed on January 11, 2011, File No. 1-32853).
|
X
|
|
|
|
|
|
|
|
|
|
|
|
|
|
2.2
|
Agreement and Plan of Merger between Piedmont Natural Gas Company, Duke Energy Corporation and Forest Subsidiary, Inc. (incorporated by reference to Exhibit 2.1 to Duke Energy Corporation's Current Report on Form 8-K filed on October 26, 2015, File No. 1-32853).
|
X
|
||||||||||||
|
3.1
|
Amended and Restated Certificate of Incorporation (incorporated by reference to Exhibit 3.1 to Duke Energy Corporation's Current Report on Form 8-K filed on May 20, 2014, File No. 1-32853).
|
X
|
||||||||||||
|
3.2
|
Amended and Restated By-Laws of Duke Energy Corporation (incorporated by reference to Exhibit 3.1 to Duke Energy Corporation's Current Report on Form 8-K filed on January 4, 2016, File No. 1-32853).
|
X
|
||||||||||||
|
3.3
|
Articles of Organization including Articles of Conversion (incorporated by reference to Exhibit 3.1 to Duke Energy Carolinas, LLC's Current Report on Form 8-K filed on April 7, 2006, File No. 1-4928).
|
|
|
X
|
|
|
|
|
|
|
|
|
|
|
|
3.3.1
|
Amended Articles of Organization, effective October 1, 2006, (incorporated by reference to Exhibit 3.1 to Duke Energy Carolinas, LLC's Quarterly Report on Form 10-Q for the quarter ended September 30, 2006, filed on November 13, 2006, File No. 1-4928).
|
|
|
X
|
|
|
|
|
|
|
|
|
|
|
|
3.4
|
Amended Articles of Consolidation of Duke Energy Ohio, Inc. (formerly The Cincinnati Gas & Electric Company), effective October 23, 1996, (incorporated by reference to Exhibit 3(a) to registrant's Quarterly Report on Form 10-Q for the quarter ended September 30, 1996, filed on November 13, 1996, File No. 1-1232).
|
|
|
|
|
|
|
|
|
|
|
X
|
|
|
|
3.4.1
|
Amended Articles of Consolidation, effective October 1, 2006, (incorporated by reference to Exhibit 3.1 to Duke Energy Ohio, Inc.'s (formerly The Cincinnati Gas & Electric Company) Quarterly Report on Form 10-Q for the quarter ended September 30, 2006 filed on November 17, 2006, File No. 1-1232).
|
|
|
|
|
|
|
|
|
|
|
X
|
|
|
|
3.5
|
Certificate of Conversion of Duke Energy Indiana, Inc. (incorporated by reference to Exhibit 3.1 to registrant's Current Report on Form 8-K filed on January 4, 2016, File No. 1-3543).
|
|
|
|
|
|
|
|
|
|
|
|
|
X
|
|
3.5.1
|
Articles of Entity Conversion of Duke Energy Indiana, Inc. (incorporated by reference to Exhibit 3.2 to registrant's Current Report on Form 8-K filed on January 4, 2016, File No. 1-3543).
|
|
|
|
|
|
|
|
|
|
|
|
|
X
|
|
3.5.2
|
Plan of Entity Conversion of Duke Energy Indiana, Inc. (incorporated by reference to Exhibit 3.3 to registrant's Current Report on Form 8-K filed on January 4, 2016, File No. 1-3543).
|
|
|
|
|
|
|
|
|
|
|
|
|
X
|
|
3.5.3
|
Articles of Organization of Duke Energy Indiana, LLC (incorporated by reference to Exhibit 3.4 to registrant's Current Report on Form 8-K filed on January 4, 2016, File No. 1-3543).
|
X
|
||||||||||||
|
3.5.4
|
Limited Liability Company Operating Agreement of Duke Energy Indiana, LLC (incorporated by reference to Exhibit 3.5 to registrant's Current Report on Form 8-K filed on January 4, 2016, File No. 1-3543).
|
X
|
||||||||||||
|
3.6
|
Limited Liability Company Operating Agreement of Duke Energy Carolinas, LLC (incorporated by reference to Exhibit 3.2 to registrant's Current Report on Form 8-K filed on April 7, 2006, File No. 1-4928).
|
|
|
X
|
|
|
|
|
|
|
|
|
|
|
|
3.7
|
Regulations of Duke Energy Ohio, Inc. (formerly The Cincinnati Gas & Electric Company), effective July 23, 2003, (incorporated by reference to Exhibit 3.2 to registrant's Quarterly Report on Form 10-Q for the quarter ended June 30, 2003, filed on August 13, 2003, File No. 1-1232).
|
|
|
|
|
|
|
|
|
|
|
X
|
|
|
|
3.8
|
Articles of Organization including Articles of Conversion for Duke Energy Progress, LLC (incorporated by reference to Exhibit 3.1 to registrant's Current Report on Form 8-K filed on August 4, 2015, File No. 1-3382).
|
|
|
|
|
|
|
X
|
|
|
|
|
|
|
|
3.8.1
|
Plan of Conversion of Duke Energy Progress, Inc. (incorporated by reference to Exhibit 3.2 to registrant's Current Report on Form 8-K filed on August 4, 2015, File No. 1-3382).
|
X
|
||||||||||||
|
3.8.2
|
Limited Liability Company Operating Agreement of Duke Energy Progress, LLC (incorporated by reference to Exhibit 3.3 to registrant's Current Report on Form 8-K filed on August 4, 2015, File No. 1-3382).
|
X
|
||||||||||||
|
3.9
|
Amended and Restated Articles of Incorporation of Progress Energy, Inc. (formerly CP&L Energy, Inc.), effective June 15, 2000, (incorporated by reference to Exhibit 3(a)(1) to registrant's Quarterly Report on Form 10-Q for the quarter ended June 30, 2000 filed on August 14, 2000, File No. 1-3382).
|
|
|
|
|
X
|
|
|
|
|
|
|
|
|
|
3.9.1
|
Articles of Amendment to the Amended and Restated Articles of Incorporation of Progress Energy, Inc. (formerly CP&L Energy, Inc.), effective December 4, 2000, (incorporated by reference to Exhibit 3(b)(1) to registrant's Annual Report on Form 10-K for the year ended December 31, 2001, filed on March 28, 2002, File No. 1-3382).
|
|
|
|
|
X
|
|
|
|
|
|
|
|
|
|
3.9.2
|
Articles of Amendment to the Amended and Restated Articles of Incorporation of Progress Energy, Inc. (formerly CP&L Energy, Inc.), effective May 10, 2006, (incorporated by reference to Exhibit 3(a) to registrant's Quarterly Report on Form 10-Q for the quarter ended June 30, 2006, filed on August 9, 2006, File No. 1-15929).
|
|
|
|
|
X
|
|
|
|
|
|
|
|
|
|
3.9.3
|
By-Laws of Progress Energy, Inc. (formerly CP&L Energy, Inc.), effective May 10, 2006, (incorporated by reference to Exhibit 3(b) to registrant's Quarterly Report on Form 10-Q for the quarter ended June 30, 2006, filed on August 9, 2006, File No. 1-15929).
|
X
|
||||||||||||
|
4.1
|
Articles of Conversion for Duke Energy Florida, LLC (incorporated by reference to Exhibit 3.4 to registrant's Current Report on Form 8-K filed on August 4, 2015, File No. 1-3274).
|
|
|
|
|
|
|
|
|
X
|
|
|
|
|
|
4.1.2
|
Articles of Organization for Duke Energy Florida, LLC (incorporated by reference to Exhibit 3.5 to registrant's Current Report on Form 8-K filed on August 4, 2015, File No. 1-3274).
|
|
|
|
|
|
|
|
X
|
|
|
|
|
|
|
4.1.3
|
Plan of Conversion of Duke Energy Florida, Inc. (incorporated by reference to Exhibit 3.6 to registrant's Current Report on Form 8-K filed on August 4, 2015, File No. 1-3274).
|
|
|
|
|
|
|
|
|
X
|
|
|
|
|
|
4.1.4
|
Limited Liability Company Operating Agreement of Duke Energy Florida, LLC (incorporated by reference to Exhibit 3.7 to registrant's Current Report on Form 8-K filed on August 4, 2015, File No. 1-3274).
|
X
|
||||||||||||
|
4.2
|
Indenture between Duke Energy Corporation and The Bank of New York Mellon Trust Company, N.A., as Trustee, dated as of June 3, 2008, (incorporated by reference to Exhibit 4.1 to Duke Energy Corporation's Current Report on Form 8-K filed on June 16, 2008, File No. 1-32853).
|
X
|
|
|
|
|
|
|
|
|
|
|
|
|
|
4.2.1
|
First Supplemental Indenture, dated as of June 16, 2008, (incorporated by reference to Exhibit 4.2 to Duke Energy Corporation's Current Report on Form 8-K filed on June 16, 2008, File No. 1-32853).
|
X
|
|
|
|
|
|
|
|
|
|
|
|
|
|
4.2.2
|
Second Supplemental Indenture, dated as of January 26, 2009, (incorporated by reference to Exhibit 4.1 to Duke Energy Corporation's Current Report on Form 8-K filed on January 26, 2009, File No. 1-32853).
|
X
|
|
|
|
|
|
|
|
|
|
|
|
|
|
4.2.3
|
Third Supplemental Indenture, dated as of August 28, 2009, (incorporated by reference to Exhibit 4.1 to Duke Energy Corporation's Current Report on Form 8-K filed on August 28, 2009, File No. 1-32853).
|
X
|
|
|
|
|
|
|
|
|
|
|
|
|
|
4.2.4
|
Fourth Supplemental Indenture, dated as of March 25, 2010, (incorporated by reference to Exhibit 4.1 to Duke Energy Corporation's Current Report on Form 8-K filed on March 25, 2010, File No. 1-32853).
|
X
|
|
|
|
|
|
|
|
|
|
|
|
|
|
4.2.5
|
Fifth Supplemental Indenture, dated as of August 25, 2011, (incorporated by reference to Exhibit 4.1 to Duke Energy Corporation's Current Report on Form 8-K filed on August 25, 2011, File No. 1-32853).
|
X
|
|
|
|
|
|
|
|
|
|
|
|
|
|
4.2.6
|
Sixth Supplemental Indenture, dated as of November 17, 2011, (incorporated by reference to Exhibit 4.1 to Duke Energy Corporation's Current Report on Form 8-K filed on November 17, 2011, File No. 1-32853).
|
X
|
|
|
|
|
|
|
|
|
|
|
|
|
|
4.2.7
|
Seventh Supplemental Indenture, dated as of August 16 , 2012, (incorporated by reference to Exhibit 4.1 to Duke Energy Corporation's Current Report on Form 8-K filed on August 16, 2012, File No. 1-32853).
|
X
|
|
|
|
|
|
|
|
|
|
|
|
|
|
4.2.8
|
Eighth Supplemental Indenture, dated as of January 14, 2013, (incorporated by reference to Exhibit 2 to Duke Energy Corporation's Form 8-A filed on January 14, 2013, File No. 1-32853).
|
X
|
|
|
|
|
|
|
|
|
|
|
|
|
|
4.2.9
|
Ninth Supplemental Indenture, dated as of June 13, 2013, (incorporated by reference to Exhibit 4.1 to Duke Energy Corporation's Current Report on Form 8-K filed on June 13, 2013, File No. 1-32853).
|
X
|
|
|
|
|
|
|
|
|
|
|
|
|
|
4.2.10
|
Tenth Supplemental Indenture, dated as of October 11, 2013, (incorporated by reference to Exhibit 4.1 to Duke Energy Corporation's Current Report on Form 8-K filed on October 11, 2013, File No. 1-32853).
|
X
|
|
|
|
|
|
|
|
|
|
|
|
|
|
4.2.11
|
Eleventh Supplemental Indenture, dated as of April 4, 2014, (incorporated by reference to Exhibit 4.1 to Duke Energy Corporation's Current Report on Form 8-K filed on April 4, 2014, File No. 1-32853).
|
X
|
||||||||||||
|
4.2.12
|
Twelfth Supplemental Indenture, dated as of November 19, 2015, (incorporated by reference to Exhibit 4.2 to Duke Energy Corporation's Current Report on Form 8-K filed on November 19, 2015, File No. 1-32853).
|
X
|
||||||||||||
|
4.3
|
Senior Indenture between Duke Energy Carolinas, LLC and The Bank of New York Mellon Trust Company, N.A., as successor trustee to JPMorgan Chase Bank (formerly known as The Chase Manhattan Bank), dated as of September 1, 1998, (incorporated by reference to Exhibit 4-D-1 to registrant's Post-Effective Amendment No. 2 to Registration Statement on Form S-3 filed on April 7, 1999, File No. 333-14209).
|
|
|
X
|
|
|
|
|
|
|
|
|
|
|
|
4.3.1
|
Fifteenth Supplemental Indenture, dated as of April 3, 2006, (incorporated by reference to Exhibit 4.4.1 to registrant's Registration Statement on Form S-3 filed on October 3, 2007, File No. 333-146483-03).
|
|
X
|
|
|
|
|
|
|
|
|
|
|
|
|
4.3.2
|
Sixteenth Supplemental Indenture, dated as of June 5, 2007, (incorporated by reference to Exhibit 4.1 registrant's Current Report on Form 8-K filed on June 6, 2007, File No. 1-4928).
|
|
|
X
|
|
|
|
|
|
|
|
|
|
|
|
4.4
|
First and Refunding Mortgage from Duke Energy Carolinas, LLC to The Bank of New York Mellon Trust Company, N.A., successor trustee to Guaranty Trust Company of New York, dated as of December 1, 1927, (incorporated by reference to Exhibit 7(a) to registrant's Form S-1, effective October 15, 1947, File No. 2-7224).
|
|
|
X
|
|
|
|
|
|
|
|
|
|
|
|
4.4.1
|
Instrument of Resignation, Appointment and Acceptance among Duke Energy Carolinas, LLC, JPMorgan Chase Bank, N.A., as Trustee, and The Bank of New York Mellon Trust Company, N.A., as Successor Trustee, dated as of September 24, 2007, (incorporated by reference to Exhibit 4.6.1 to registrant's Registration Statement on Form S-3 filed on October 3, 2007, File No. 333-146483).
|
|
|
X
|
|
|
|
|
|
|
|
|
|
|
|
4.4.2
|
Ninth Supplemental Indenture, dated as of February 1, 1949, (incorporated by reference to Exhibit 7(j) to registrant's Form S-1 filed on February 3, 1949, File No. 2-7808).
|
|
|
X
|
|
|
|
|
|
|
|
|
|
|
|
4.4.3
|
Twentieth Supplemental Indenture, dated as of June 15, 1964, (incorporated by reference to Exhibit 4-B-20 to registrant's Form S-1 filed on August 23, 1966, File No. 2-25367).
|
|
|
X
|
|
|
|
|
|
|
|
|
|
|
|
4.4.4
|
Twenty-third Supplemental Indenture, dated as of February 1, 1968, (incorporated by reference to Exhibit 2-B-26 to registrant's Form S-9 filed on January 21, 1969, File No. 2-31304).
|
|
|
X
|
|
|
|
|
|
|
|
|
|
|
|
4.4.5
|
Sixtieth Supplemental Indenture, dated as of March 1, 1990, (incorporated by reference to Exhibit 4-B-61 to registrant's Annual Report on Form 10-K for the year ended December 31, 1990, File No.1-4928).
|
|
|
X
|
|
|
|
|
|
|
|
|
|
|
|
4.4.6
|
Sixty-third Supplemental Indenture, dated as of July 1, 1991, (incorporated by reference to Exhibit 4-B-64 to registrant's Registration Statement on Form S-3 filed on February 13, 1992, File No. 33-45501).
|
|
|
X
|
|
|
|
|
|
|
|
|
|
|
|
4.4.7
|
Eighty-fourth Supplemental Indenture, dated as of March 20, 2006, (incorporated by reference to Exhibit 4.6.9 to registrant's Registration Statement on Form S-3 filed on October 3, 2007, File No. 333-146483-03).
|
|
X
|
|
|
|
|
|
|
|
|
|
|
|
|
4.4.8
|
Eighty-fifth Supplemental Indenture, dated as of January 10, 2008, (incorporated by reference to Exhibit 4.1 to Duke Energy Carolinas, LLC’s Current Report on Form 8-K filed on January 11, 2008, File No.1-4928).
|
|
|
X
|
|
|
|
|
|
|
|
|
|
|
|
4.4.9
|
Eighty-seventh Supplemental Indenture, dated as of April 14, 2008, (incorporated by reference to Exhibit 4.1 to Duke Energy Carolinas, LLC’s Current Report on Form 8-K filed on April 15, 2008, File No.1-4928).
|
|
|
X
|
|
|
|
|
|
|
|
|
|
|
|
4.4.10
|
Eighty-eighth Supplemental Indenture, dated as of November 17, 2008, (incorporated by reference to Exhibit 4.1 to Duke Energy Carolinas, LLC’s Current Report on Form 8-K filed on November 20, 2008, File No.1-4928).
|
|
|
X
|
|
|
|
|
|
|
|
|
|
|
|
4.4.11
|
Ninetieth Supplemental Indenture, dated as of November 19, 2009, (incorporated by reference to Exhibit 4.1 to Duke Energy Carolinas, LLC’s Current Report on Form 8-K filed on November 19, 2009, File No.1-4928).
|
|
|
X
|
|
|
|
|
|
|
|
|
|
|
|
4.4.12
|
Ninety-first Supplemental Indenture, dated as of June 7, 2010, (incorporated by reference to Exhibit 4.1 to Duke Energy Carolinas, LLC’s Current Report on Form 8-K filed on June 7, 2010, File No.1-4928).
|
|
|
X
|
|
|
|
|
|
|
|
|
|
|
|
4.4.13
|
Ninety-third Supplemental Indenture, dated as of May 19, 2011, (incorporated by reference to Exhibit 4.1 to Duke Energy Carolinas, LLC’s Current Report on Form 8-K filed on May 19, 2011, File No.1-4928).
|
|
|
X
|
|
|
|
|
|
|
|
|
|
|
|
4.4.14
|
Ninety-fourth Supplemental Indenture, dated as of December 8, 2011, (incorporated by reference to Exhibit 4.1 to Duke Energy Carolinas, LLC’s Current Report on Form 8-K filed on December 8, 2011, File No.1-4928).
|
|
|
X
|
|
|
|
|
|
|
|
|
|
|
|
4.4.15
|
Ninety-fifth Supplemental Indenture, dated as of September 21, 2012, (incorporated by reference to Exhibit 4.1 to Duke Energy Carolinas, LLC’s Current Report on Form 8-K filed on September 21, 2012, File No.1-4928).
|
|
|
X
|
|
|
|
|
|
|
|
|
|
|
|
4.4.16
|
Ninety-sixth Supplemental Indenture, dated as of March 12, 2015, between Duke Energy Carolinas, LLC and The Bank of New York Mellon Trust Company, N.A., as Trustee (incorporated by reference to Exhibit 4.1 to Duke Energy Carolina, LLC's Current Report on Form 8-K filed on March 12, 2015, File No. 1-4928).
|
X
|
||||||||||||
|
4.5
|
Mortgage and Deed of Trust between Duke Energy Progress, Inc. (formerly Carolina Power & Light Company) and The Bank of New York Mellon (formerly Irving Trust Company) and Frederick G. Herbst (Tina D. Gonzalez, successor), as Trustees, dated as of May 1, 1940.
|
|
|
|
|
|
|
X
|
|
|
|
|
|
|
|
4.5.1
|
First through Fifth Supplemental Indentures thereto (Exhibit 2(b), File No. 2-64189); the Sixth through Sixty-sixth Supplemental Indentures (Exhibit 2(b)-5, File No. 2-16210; Exhibit 2(b)-6, File No. 2-16210; Exhibit 4(b)-8, File No. 2-19118; Exhibit 4(b)-2, File No. 2-22439; Exhibit 4(b)-2, File No. 2-24624; Exhibit 2(c), File No. 2-27297; Exhibit 2(c), File No. 2-30172; Exhibit 2(c), File No. 2-35694; Exhibit 2(c), File No. 2-37505; Exhibit 2(c), File No. 2-39002; Exhibit 2(c), File No. 2-41738; Exhibit 2(c), File No. 2-43439; Exhibit 2(c), File No. 2-47751; Exhibit 2(c), File No. 2-49347; Exhibit 2(c), File No. 2-53113; Exhibit 2(d), File No. 2-53113; Exhibit 2(c), File No. 2-59511; Exhibit 2(c), File No. 2-61611; Exhibit 2(d), File No. 2-64189; Exhibit 2(c), File No. 2-65514; Exhibits 2(c) and 2(d), File No. 2-66851; Exhibits 4(b)-1, 4(b)-2, and 4(b)-3, File No. 2-81299; Exhibits 4(c)-1 through 4(c)-8, File No. 2-95505; Exhibits 4(b) through 4(h), File No. 33-25560; Exhibits 4(b) and 4(c), File No. 33-33431; Exhibits 4(b) and 4(c), File No. 33-38298; Exhibits 4(h) and 4(i), File No. 33-42869; Exhibits 4(e)-(g), File No. 33-48607; Exhibits 4(e) and 4(f), File No. 33-55060; Exhibits 4(e) and 4(f), File No. 33-60014; Exhibits 4(a) and 4(b) to Post-Effective Amendment No. 1, File No. 33-38349; Exhibit 4(e), File No. 33-50597; Exhibit 4(e) and 4(f) to Registration Statement on Form S-3, File No. 33-57835, filed on February 24, 1995; Exhibit to the Current Report on Form 8-K filed on August 28, 1997, File No. 1-3382; Exhibit 4(b) to Registration Statement on Form S-3, File No. 333-69237, filed on December 18, 1998; and Exhibit 4(c) to the Current Report on Form 8-K filed on March 19, 1999, File No. 1-3382).
|
|
|
|
|
|
|
X
|
|
|
|
|
|
|
|
4.5.2
|
Seventy-second Supplemental Indenture, dated as of September 1, 2003, (incorporated by reference to Exhibit 4 to Duke Energy Progress, Inc.'s (formerly Carolina Power & Light Company (d/b/a Progress Energy Carolinas, Inc.)) Current Report on Form 8-K filed on September 12, 2003, File No. 1-3382).
|
|
|
|
|
|
|
X
|
|
|
|
|
|
|
|
4.5.3
|
Seventy-third Supplemental Indenture, dated as of March 1, 2005, (incorporated by reference to Exhibit 4 to Duke Energy Progress, Inc.'s (formerly Carolina Power & Light Company (d/b/a Progress Energy Carolinas, Inc.)) Current Report on Form 8-K filed on March 22, 2005, File No. 1-3382).
|
|
|
|
|
|
|
X
|
|
|
|
|
|
|
|
4.5.4
|
Seventy-fourth Supplemental Indenture, dated as of November 1, 2005, (incorporated by reference to Exhibit 4 to Duke Energy Progress, Inc.'s (formerly Carolina Power & Light Company (d/b/a Progress Energy Carolinas, Inc.)) Current Report on Form 8-K filed on November 30, 2005, File No. 1-3382).
|
|
|
|
|
|
|
X
|
|
|
|
|
|
|
|
4.5.5
|
Seventy-fifth Supplemental Indenture, dated as of March 1, 2008, (incorporated by reference to Exhibit 4 to Duke Energy Progress, Inc.'s (formerly Carolina Power & Light Company (d/b/a Progress Energy Carolinas, Inc.)) Current Report on Form 8-K filed on March 13, 2008, File No. 1-3382).
|
|
|
|
|
|
|
X
|
|
|
|
|
|
|
|
4.5.6
|
Seventy-sixth Supplemental Indenture, dated as of January 1, 2009, (incorporated by reference to Exhibit 4 to Duke Energy Progress, Inc.'s (formerly Carolina Power & Light Company (d/b/a Progress Energy Carolinas, Inc.)) Current Report on Form 8-K filed on January 15, 2009, File No. 1-3382).
|
|
|
|
|
|
|
X
|
|
|
|
|
|
|
|
4.5.7
|
Seventy-seventh Supplemental Indenture, dated as of June 18, 2009, (incorporated by reference to Exhibit 4 to Duke Energy Progress, Inc.'s (formerly Carolina Power & Light Company (d/b/a Progress Energy Carolinas, Inc.)) Current Report on Form 8-K filed on June 23, 2009, File No. 1-3382).
|
|
|
|
|
|
|
X
|
|
|
|
|
|
|
|
4.5.8
|
Seventy-eighth Supplemental Indenture, dated as of September 1, 2011, (incorporated by reference to Exhibit 4 to Duke Energy Progress, Inc.'s (formerly Carolina Power & Light Company (d/b/a Progress Energy Carolinas, Inc.)) Current Report on Form 8-K filed on September 15, 2011, File No. 1-3382).
|
|
|
|
|
|
|
X
|
|
|
|
|
|
|
|
4.5.9
|
Seventy-ninth Supplemental Indenture, dated as of May 1, 2012, (incorporated by reference to Exhibit 4 to Duke Energy Progress, Inc.'s (formerly Carolina Power & Light Company (d/b/a Progress Energy Carolinas, Inc.)) Current Report on Form 8-K filed on May 18, 2012, File No. 1-3382).
|
|
|
|
|
|
|
X
|
|
|
|
|
|
|
|
4.5.10
|
Eightieth Supplemental Indenture, dated as of March 1, 2013, (incorporated by reference to Exhibit 4.1 to Duke Energy Progress, Inc.'s (formerly Carolina Power & Light Company (d/b/a Progress Energy Carolinas, Inc.)) Current Report on Form 8-K filed on March 12, 2013, File No. 1-3382).
|
|
|
|
|
|
|
X
|
|
|
|
|
|
|
|
4.5.11
|
Eighty-second Supplemental Indenture, dated as of March 1, 2014, between the Company and The Bank of New York Mellon (formerly Irving Trust Company) and Tina D. Gonzalez (successor to Frederick G. Herbst) and forms of global notes (incorporated by reference to Exhibit 4.1 to Duke Energy Progress, Inc.'s Current Report on Form 8-K filed on March 6, 2014, File No. 1-3382).
|
X
|
||||||||||||
|
4.5.12
|
Eighty-third Supplemental Indenture, dated as of November 1, 2014, between the Company and The Bank of New York Mellon (formerly Irving Trust Company) and Tina D. Gonzalez (successor to Frederick G. Herbst) and forms of global notes (incorporated by reference to Exhibit 4.1 to Duke Energy Progress, Inc.'s Current Report on Form 8-K filed on November 20, 2014, File No. 1-3382).
|
X
|
||||||||||||
|
4.5.13
|
Eighty-fifth Supplemental Indenture, dated as of August 1, 2015, (incorporated by reference to Exhibit 4.1 to Duke Energy Progress, LLC's Current Report on Form 8-K filed on August 13, 2015, File No. 1-3382).
|
X
|
||||||||||||
|
4.6
|
Indenture (for Debt Securities) between Duke Energy Progress, Inc. (formerly Carolina Power & Light Company) and The Bank of New York Mellon (successor in interest to The Chase Manhattan Bank), as Trustee (incorporated by reference to Exhibit 4(a) to registrant's Current Report on Form 8-K filed on November 5, 1999, File No. 1-3382).
|
|
|
|
|
|
|
X
|
|
|
|
|
|
|
|
4.7
|
Indenture (for [Subordinated] Debt Securities) (open ended) (incorporated by reference to Exhibit 4(a)(2) to Duke Energy Progress, Inc.'s (formerly Carolina Power & Light Company (d/b/a Progress Energy Carolinas, Inc.)) Registration Statement on Form S-3 filed on November 18, 2008, File No. 333-155418).
|
|
|
|
|
|
|
X
|
|
|
|
|
|
|
|
4.8
|
Indenture (for First Mortgage Bonds) between Duke Energy Florida, Inc. (formerly Florida Power Corporation) and The Bank of New York Mellon (as successor to Guaranty Trust Company of New York and The Florida National Bank of Jacksonville), as Trustee, dated as of January 1, 1944, (incorporated by reference to Exhibit B-18 to registrant's Form A-2, File No. 2-5293).
|
|
|
|
|
|
|
|
|
X
|
|
|
|
|
|
4.8.1
|
Seventh Supplemental Indenture (incorporated by reference to Exhibit 4(b) to Duke Energy Florida, Inc.'s (formerly Florida Power Corporation) Registration Statement on Form S-3 filed on September 27, 1991, File No. 33-16788).
|
|
|
|
|
|
|
|
|
X
|
|
|
|
|
|
4.8.2
|
Eighth Supplemental Indenture (incorporated by reference to Exhibit 4(c) to Duke Energy Florida, Inc.'s (formerly Florida Power Corporation) Registration Statement on Form S-3 filed on September 27, 1991, File No. 33-16788).
|
|
|
|
|
|
|
|
|
X
|
|
|
|
|
|
4.8.3
|
Sixteenth Supplemental Indenture (incorporated by reference to Exhibit 4(d) to Duke Energy Florida, Inc.'s (formerly Florida Power Corporation) Registration Statement on Form S-3 filed on September 27, 1991, File No. 33-16788).
|
|
|
|
|
|
|
|
|
X
|
|
|
|
|
|
4.8.4
|
Twenty-ninth Supplemental Indenture (incorporated by reference to Exhibit 4(c) to Duke Energy Florida, Inc.'s (formerly Florida Power Corporation) Registration Statement on Form S-3 filed on September 17, 1982, File No. 2-79832).
|
|
|
|
|
|
|
|
|
X
|
|
|
|
|
|
4.8.5
|
Thirty-eighth Supplemental Indenture, dated as of July 25, 1994, (incorporated by reference to exhibit 4(f) to Duke Energy Florida, Inc.'s (formerly Florida Power Corporation) Registration Statement on Form S-3 filed on August 29, 1994, File No. 33-55273).
|
|
|
|
|
|
|
|
|
X
|
|
|
|
|
|
4.8.6
|
Forty-first Supplemental Indenture, dated as of February 1, 2003, (incorporated by reference to Exhibit 4 to Duke Energy Florida, Inc.'s (formerly Duke Energy Florida Power Corporation (d/b/a Progress Energy Florida, Inc.)) Current Report on Form 8-K filed on February 21, 2003, File No. 1-3274).
|
|
|
|
|
|
|
|
|
X
|
|
|
|
|
|
4.8.7
|
Forty-second Supplemental Indenture, dated as of April 1, 2003, (incorporated by reference to Exhibit 4 to Duke Energy Florida, Inc.'s (formerly Florida Power Corporation (d/b/a Progress Energy Florida, Inc.)) Quarterly Report on Form 10-Q for the quarter ended June 30, 2003, filed on August 11, 2003, File No. 1-3274).
|
|
|
|
|
|
|
|
|
X
|
|
|
|
|
|
4.8.8
|
Forty-third Supplemental Indenture, dated as of November 1, 2003, (incorporated by reference to Exhibit 4 to Duke Energy Florida, Inc.'s (formerly Florida Power Corporation (d/b/a Progress Energy Florida, Inc.)) Current Report on Form 8-K filed on November 21, 2003, File No. 1-3274).
|
|
|
|
|
|
|
|
|
X
|
|
|
|
|
|
4.8.9
|
Forty-fourth Supplemental Indenture, dated as of August 1, 2004, (incorporated by reference to Exhibit 4(m) to Duke Energy Florida, Inc.'s (formerly Florida Power Corporation (d/b/a Progress Energy Florida, Inc.)) Annual Report on Form 10-K for the year ended December 31, 2004 filed on March 16, 2005, File No. 1-3274).
|
|
|
|
|
|
|
|
|
X
|
|
|
|
|
|
4.8.10
|
Forty-sixth Supplemental Indenture, dated as of September 1, 2007, (incorporated by reference to Exhibit 4 to Duke Energy Florida, Inc.'s (formerly Florida Power Corporation (d/b/a Progress Energy Florida, Inc.)) Current Report on Form 8-K filed on September 19, 2007, File No. 1-3274).
|
|
|
|
|
|
|
|
|
X
|
|
|
|
|
|
4.8.11
|
Forty-seventh Supplemental Indenture, dated as of December 1, 2007, (incorporated by reference to Exhibit 4 to Duke Energy Florida, Inc.'s (formerly Florida Power Corporation (d/b/a Progress Energy Florida, Inc.)) Current Report on Form 8-K filed on December 13, 2007, File No. 1-3274).
|
|
|
|
|
|
|
|
|
X
|
|
|
|
|
|
4.8.12
|
Forty-eighth Supplemental Indenture, dated as of June 1, 2008, (incorporated by reference to Exhibit 4 to Duke Energy Florida, Inc.'s (formerly Florida Power Corporation (d/b/a Progress Energy Florida, Inc.)) Current Report on Form 8-K filed on June 18, 2008, File No. 1-3274).
|
|
|
|
|
|
|
|
|
X
|
|
|
|
|
|
4.8.13
|
Forty-ninth Supplemental Indenture, dated as of March 1, 2010, (incorporated by reference to Exhibit 4 to Duke Energy Florida, Inc.'s (formerly Florida Power Corporation (d/b/a Progress Energy Florida, Inc.)) Current Report on Form 8-K filed on March 25, 2010, File No. 1-3274).
|
|
|
|
|
|
|
|
|
X
|
|
|
|
|
|
4.8.14
|
Fiftieth Supplemental Indenture, dated as of August 11, 2011, (incorporated by reference to Exhibit 4 to Duke Energy Florida, Inc.'s (formerly Florida Power Corporation (d/b/a Progress Energy Florida, Inc.)) Current Report on Form 8-K filed on August 18, 2011, File No. 1-3274).
|
|
|
|
|
|
|
|
|
X
|
|
|
|
|
|
4.8.15
|
Fifty-first Supplemental Indenture, dated as of November 1, 2012, (incorporated by reference to Exhibit 4.1 to Duke Energy Florida, Inc.'s (formerly Florida Power Corporation (d/b/a Progress Energy Florida, Inc.)) Current Report on Form 8-K filed on November 20, 2012, File No. 1-3274).
|
|
|
|
|
|
|
|
|
X
|
|
|
|
|
|
4.9
|
Indenture (for Debt Securities) between Duke Energy Florida, Inc. (formerly Florida Power Corporation (d/b/a Progress Energy Florida, Inc.)) and The Bank of New York Mellon Trust Company, National Association (successor in interest to J.P. Morgan Trust Company, National Association), as Trustee, dated as of December 7, 2005, (incorporated by reference to Exhibit 4(a) to registrant's Current Report on Form 8-K filed on December 13, 2005, File No. 1-3274).
|
|
|
|
|
|
|
|
|
X
|
|
|
|
|
|
4.10
|
Indenture (for [Subordinated] Debt Securities) (open ended) (incorporated by reference to Exhibit 4(a)(2) Duke Energy Florida, Inc.'s (formerly Florida Power Corporation (d/b/a Progress Energy Florida, Inc.)) Registration Statement on Form S-3 filed on November 18, 2008, File No. 333-155418).
|
|
|
|
|
|
|
|
|
X
|
|
|
|
|
|
4.11
|
Original Indenture (Unsecured Debt Securities) between Duke Energy Ohio, Inc. (formerly The Cincinnati Gas & Electric Company) and The Bank of New York Mellon Trust Company, N.A., as Successor Trustee, dated as of May 15, 1995, (incorporated by reference to Exhibit 3 to registrant's Form 8-A filed on July 27, 1995, File No. 1-1232).
|
|
|
|
|
|
|
|
|
|
|
X
|
|
|
|
4.11.1
|
First Supplemental Indenture, dated as of June 1, 1995, (incorporated by reference to Exhibit 4 B to Duke Energy Ohio, Inc.'s (formerly The Cincinnati Gas & Electric Company) Quarterly Report on Form 10-Q for the quarter ended June 30, 1995, filed on August 11, 1995, File No. 1-1232).
|
|
|
|
|
|
|
|
|
|
|
X
|
|
|
|
4.11.2
|
Seventh Supplemental Indenture, dated as of June 15, 2003, (incorporated by reference to Exhibit 4.1 to Duke Energy Ohio, Inc.'s (formerly The Cincinnati Gas & Electric Company) Quarterly Report on Form 10-Q for the quarter ended June 30, 2003, filed on August 13, 2003, File No. 1-1232).
|
|
|
|
|
|
|
|
|
|
|
X
|
|
|
|
4.12
|
Original Indenture (First Mortgage Bonds) between Duke Energy Ohio, Inc. (formerly The Cincinnati Gas & Electric Company) and The Bank of New York Mellon Trust Company, N.A., as Successor Trustee, dated as of August 1, 1936, (incorporated by reference to an exhibit to registrant's Registration Statement No. 2-2374).
|
|
|
|
|
|
|
|
|
|
|
X
|
|
|
|
4.12.1
|
Fortieth Supplemental Indenture, dated as of March 23, 2009, (incorporated by reference to Exhibit 4.1 to Duke Energy Ohio, Inc.’s (formerly The Cincinnati Gas & Electric Company) Current Report on Form 8-K filed on March 24, 2009, File No. 1-1232).
|
|
|
|
|
|
|
|
|
|
|
X
|
|
|
|
4.12.2
|
Forty-second Supplemental Indenture, dated as of September 6, 2013, (incorporated by reference to Exhibit 4.1 to Duke Energy Ohio, Inc.’s (formerly The Cincinnati Gas & Electric Company) Current Report on Form 8-K filed on September 6, 2013, File No. 1-1232).
|
|
|
|
|
|
|
|
|
|
|
X
|
|
|
|
4.13
|
Indenture between Duke Energy Indiana, Inc. (formerly PSI Energy, Inc.) and The Bank of New York Mellon Trust Company, N.A., as Successor Trustee, dated as of November 15, 1996, (incorporated by reference to Exhibit 4(v) to registrant's Annual Report on Form 10-K for the year ended December 31, 1996, filed on March 27, 1997, File No. 1-3543).
|
|
|
|
|
|
|
|
|
|
|
|
|
X
|
|
4.13.1
|
Third Supplemental Indenture, dated as of March 15, 1998, (incorporated by reference to Exhibit 4 to Duke Energy Indiana, Inc.'s (formerly PSI Energy, Inc.) Annual Report on Form 10-K for the year ended December 31, 1997, filed on March 27, 1998, File No. 1-3543).
|
|
|
|
|
|
|
|
|
|
|
|
|
X
|
|
4.13.2
|
Eighth Supplemental Indenture, dated as of September 23, 2003, (incorporated by reference to Exhibit 4.2 to Duke Energy Indiana, Inc.'s (formerly PSI Energy, Inc.) Quarterly Report on Form 10-Q for the quarter ended September 30, 2003, filed on November 13, 2003, File No. 1-3543).
|
|
|
|
|
|
|
|
|
|
|
|
|
X
|
|
4.13.3
|
Ninth Supplemental Indenture, dated as of October 21, 2005, (incorporated by reference to Exhibit 4.7.3 to Duke Energy Indiana, Inc.'s (formerly PSI Energy, Inc.) Registration Statement on Form S-3 filed on September 29, 2010, File No. 333-169633).
|
|
|
|
|
|
|
|
|
|
|
|
|
X
|
|
4.13.4
|
Tenth Supplemental Indenture, dated as of June 9, 2006, (incorporated by reference to Exhibit 4.1 to Duke Energy Indiana, Inc.’s (formerly PSI Energy, Inc.) Current Report on Form 8-K filed on June 15, 2006, File No. 1-3543).
|
|
|
|
|
|
|
|
|
|
|
|
|
X
|
|
4.14
|
Original Indenture (First Mortgage Bonds) between Duke Energy Indiana, Inc. (formerly PSI Energy, Inc.) and Deutsche Bank National Trust Company, as Successor Trustee, dated as of September 1, 1939, (filed as an exhibit in File No. 70-258).
|
|
|
|
|
|
|
|
|
|
|
|
|
X
|
|
4.14.1
|
Tenth Supplemental Indenture, dated as of July 1, 1952, (filed as an exhibit in File No. 2-9687).
|
|
|
|
|
|
|
|
|
|
|
|
|
X
|
|
4.14.2
|
Twenty-third Supplemental Indenture, dated as of January 1, 1977, (filed as an exhibit in File No. 2-57828).
|
|
|
|
|
|
|
|
|
|
|
|
|
X
|
|
4.14.3
|
Twenty-fifth Supplemental Indenture, dated as of September 1, 1978, (filed as an exhibit in File No. 2-62543).
|
|
|
|
|
|
|
|
|
|
|
|
|
X
|
|
4.14.4
|
Twenty-sixth Supplemental Indenture, dated as of September 1, 1978, (filed as an exhibit in File No. 2-62543).
|
|
|
|
|
|
|
|
|
|
|
|
|
X
|
|
4.14.5
|
Thirtieth Supplemental Indenture, dated as of August 1, 1980, (filed as an exhibit in File No. 2-68562).
|
|
|
|
|
|
|
|
|
|
|
|
|
X
|
|
4.14.6
|
Thirty-fifth Supplemental Indenture, dated as of March 30, 1984, (filed as an exhibit to registrant's Annual Report on Form 10-K for the year ended December 31, 1984, File No. 1-3543).
|
|
|
|
|
|
|
|
|
|
|
|
|
X
|
|
4.14.7
|
Forty-sixth Supplemental Indenture, dated as of June 1, 1990, (filed as an exhibit to registrant's Annual Report on Form 10-K for the year ended December 31, 1991, File No. 1-3543).
|
|
|
|
|
|
|
|
|
|
|
|
|
X
|
|
4.14.8
|
Forty-seventh Supplemental Indenture, dated as of July 15, 1991, (filed as an exhibit to registrant's Annual Report on Form 10-K for the year ended December 31, 1991, File No. 1-3543).
|
|
|
|
|
|
|
|
|
|
|
|
|
X
|
|
4.14.9
|
Forty-eighth Supplemental Indenture, dated as of July 15, 1992, (filed as an exhibit to registrant's Annual Report on Form 10-K for the year ended December 31, 1992, File No. 1-3543).
|
|
|
|
|
|
|
|
|
|
|
|
|
X
|
|
4.14.10
|
Fifty-second Supplemental Indenture, dated as of April 30, 1999, (incorporated by reference to Exhibit 4 to Duke Energy Indiana, Inc.’s (formerly PSI Energy, Inc.) Quarterly Report on Form 10-Q for the quarter ended March 31, 1999, filed on May 13, 1999, File No. 1-3543).
|
|
|
|
|
|
|
|
|
|
|
|
|
X
|
|
4.14.11
|
Fifty-seventh Supplemental Indenture, dated as of August 21, 2008, (incorporated by reference to Exhibit 4.1 to Duke Energy Indiana, Inc.’s (formerly PSI Energy, Inc.) Current Report Form 8-K filed on August 21, 2008, File No. 1-3543).
|
|
|
|
|
|
|
|
|
|
|
|
|
X
|
|
4.14.12
|
Fifty-eighth Supplemental Indenture, dated as of December 19, 2008, (incorporated by reference to Exhibit 4.8.12 to Duke Energy Indiana, Inc.’s (formerly PSI Energy, Inc.) Registration Statement on Form S-3 filed on September 29, 2010, File No. 333-169633-02).
|
|
|
|
|
|
|
|
|
|
|
|
|
X
|
|
4.14.13
|
Fifty-ninth Supplemental Indenture, dated as of March 23, 2009, (incorporated by reference to Exhibit 4.1 to Duke Energy Indiana, Inc.’s (formerly PSI Energy, Inc.) Current Report on Form 8-K filed on March 24, 2009, File No. 1-3543).
|
|
|
|
|
|
|
|
|
|
|
|
|
X
|
|
4.14.14
|
Sixtieth Supplemental Indenture, dated as of June 1, 2009, (incorporated by reference to Exhibit 4.8.14 to Duke Energy Indiana, Inc.’s (formerly PSI Energy, Inc.) Registration Statement on Form S-3 filed on September 29, 2010, File No. 333-169633-02).
|
|
|
|
|
|
|
|
|
|
|
|
|
X
|
|
4.14.15
|
Sixty-first Supplemental Indenture, dated as of October 1, 2009, (incorporated by reference to Exhibit 4.8.15 to Duke Energy Indiana, Inc.’s (formerly PSI Energy, Inc.) Registration Statement on Form S-3 filed on September 29, 2010, File No. 333-169633-02).
|
|
|
|
|
|
|
|
|
|
|
|
|
X
|
|
4.14.16
|
Sixty-second Supplemental Indenture, dated as of July 9, 2010, (incorporated by reference to Exhibit 4.1 to Duke Energy Indiana, Inc.’s (formerly PSI Energy, Inc.) Current Report on Form 8-K filed on July 9, 2010, File No. 1-3543).
|
|
|
|
|
|
|
|
|
|
|
|
|
X
|
|
4.14.17
|
Sixty-third Supplemental Indenture, dated as of September 23, 2010, (incorporated by reference to Exhibit 4.8.17 to Duke Energy Indiana, Inc.’s (formerly PSI Energy, Inc.) Registration Statement on Form S-3 filed on September 29, 2010, File No. 333-169633-02).
|
|
|
|
|
|
|
|
|
|
|
|
|
X
|
|
4.14.18
|
Sixty-fourth Supplemental Indenture, dated as of December 1, 2011, (incorporated by reference to Exhibit 4(d)(2)(xviii) to Duke Energy Indiana, Inc.’s (formerly PSI Energy, Inc.) Registration Statement on Form S-3 filed on September 30, 2013, File No. 333-191462-03).
|
|
|
|
|
|
|
|
|
|
|
|
|
X
|
|
4.14.19
|
Sixty-fifth Supplemental Indenture, dated as of March 15, 2012, (incorporated by reference to Exhibit 4.1 to Duke Energy Indiana, Inc.’s (formerly PSI Energy, Inc.) Current Report on Form 8-K filed on March 15, 2012, File No. 1-3543).
|
|
|
|
|
|
|
|
|
|
|
|
|
X
|
|
4.14.20
|
Sixty-sixth Supplemental Indenture, dated as of July 11, 2013, (incorporated by reference to Exhibit 4.1 to Duke Energy Indiana, Inc.’s (formerly PSI Energy, Inc.) Current Report on Form 8-K filed on July 11, 2013, File No. 1-3543).
|
|
|
|
|
|
|
|
|
|
|
|
|
X
|
|
4.15
|
Repayment Agreement between Duke Energy Ohio, Inc. (formerly The Cincinnati Gas & Electric Company) and The Dayton Power and Light Company, dated as of December 23, 1992, (filed with registrant's Annual Report on Form 10-K for the year ended December 31, 1992, File No. 1-1232).
|
|
|
|
|
|
|
|
|
|
|
X
|
|
|
|
4.16
|
Unsecured Promissory Note between Duke Energy Indiana, Inc. (formerly PSI Energy, Inc.) and the Rural Utilities Service, dated as of October 14, 1998, (incorporated by reference to Exhibit 4 to registrant's Annual Report on Form 10-K for the year ended December 31, 1998, filed on March 8, 1999, File No. 1-3543).
|
|
|
|
|
|
|
|
|
|
|
|
|
X
|
|
4.17
|
6.302% Subordinated Note between Duke Energy Indiana, Inc. (formerly PSI Energy, Inc.) and Cinergy Corp., dated as of February 5, 2003, (incorporated by reference to Exhibit 4(yyy) to registrant's Quarterly Report on Form 10-Q for the quarter ended March 31, 2003, filed on May 12,2003, File No. 1-3543).
|
|
|
|
|
|
|
|
|
|
|
|
|
X
|
|
4.18
|
6.403% Subordinated Note between Duke Energy Indiana, Inc. (formerly PSI Energy, Inc.) and Cinergy Corp., dated as of February 5, 2003, (incorporated by reference to Exhibit 4(zzz) to registrant's Quarterly Report on Form 10-Q for the quarter ended March 31, 2003, filed on May 12, 2003, File No. 1-3543).
|
|
|
|
|
|
|
|
|
|
|
|
|
X
|
|
4.19
|
Form of Duke Energy InterNote (Fixed Rate), dated as of November 13, 2012, (incorporated by reference to Exhibit 4.1 to Duke Energy Corporation's Current Report on Form 8-K filed on November 14, 2012, File No. 1-32853).
|
X
|
|
|
|
|
|
|
|
|
|
|
|
|
|
4.20
|
Form of Duke Energy InterNote (Floating Rate), dated as of November 13, 2012, (incorporated by reference to Exhibit 4.2 to Duke Energy Corporation's Current Report on Form 8-K filed on November 14, 2012, File No. 1-32853).
|
X
|
|
|
|
|
|
|
|
|
|
|
|
|
|
4.21
|
Contingent Value Obligation Agreement between Progress Energy, Inc. (formerly CP&L Energy, Inc.) and The Chase Manhattan Bank, as Trustee, dated as of November 30, 2000, (incorporated by reference to Exhibit 4.1 to registrant's Current Report on Form 8-K filed on December 1, 2000, File No. 1-3382).
|
|
|
|
|
X
|
|
|
|
|
|
|
|
|
|
4.22
|
Forty-second Supplemental Indenture between Duke Energy Ohio, Inc. (formerly The Cincinnati Gas & Electric Company) and The Bank of New York Mellon Trust Company, N.A., as Trustee, dated as of September 6, 2013, (incorporated by reference to Exhibit 4.1 to registrant's Current Report on Form 8-K filed on September 6, 2013, File No. 1-1232).
|
|
|
|
|
|
|
|
|
|
|
X
|
|
|
|
4.23
|
Sixty-sixth Supplemental Indenture between Duke Energy Indiana, Inc. (formerly PSI Energy, Inc.) and Deutsche Bank National Trust Company, as Trustee, dated as of July 11, 2013, (incorporated by reference to Exhibit 4.1 to registrant's Current Report on Form 8-K filed on July 11, 2013, File No. 1-3543).
|
|
|
|
|
|
|
|
|
|
|
|
|
X
|
|
10.1
|
Purchase and Sale Agreement between Duke Energy Americas, LLC and LSP Bay II Harbor Holding, LLC, dated as of January 8, 2006, (incorporated by reference to Exhibit 10.2 to registrant's Quarterly Report on Form 10-Q for the quarter ended March 31, 2006, filed on May 10, 2006, File No. 1-32853).
|
X
|
|
X
|
|
|
|
|
|
|
|
|
|
|
|
10.1.1
|
Amendment to Purchase and Sale Agreement between Duke Energy Americas, LLC, LS Power Generation, LLC (formerly LSP Bay II Harbor Holding, LLC), LSP Gen Finance Co, LLC, LSP South Bay Holdings, LLC, LSP Oakland Holdings, LLC, and LSP Morro Bay Holdings, LLC, dated as of May 4, 2006, (incorporated by reference to Exhibit 10.2.1 to registrant's Quarterly Report on Form 10-Q for the quarter ended March 31, 2006, filed on May 10, 2006, File No.1-32853).
|
X
|
|
X
|
|
|
|
|
|
|
|
|
|
|
|
10.2**
|
Directors’ Charitable Giving Program (incorporated by reference to Exhibit 10-P to Duke Energy Carolinas, LLC's Annual Report on Form 10-K for the year ended December 31, 1992, File No. 1-4928).
|
X
|
|
|
|
|
|
|
|
|
|
|
|
|
|
10.2.1**
|
Amendment to Directors’ Charitable Giving Program, dated as of June 18, 1997, (incorporated by reference to Exhibit 1-1.1 to Duke Energy Carolinas, LLC's Annual Report on Form 10-K for the year ended December 31, 2003, filed on March 15, 2004, File No. 1-4928).
|
X
|
|
|
|
|
|
|
|
|
|
|
|
|
|
10.2.2**
|
Amendment to Directors’ Charitable Giving Program, dated as of July 28, 1997, (incorporated by reference to Exhibit 10-1.2 to Duke Energy Carolinas, LLC's Annual Report on Form 10-K for the year ended December 31, 2003, filed on March 15, 2004, File No. 1-4928).
|
X
|
|
|
|
|
|
|
|
|
|
|
|
|
|
10.2.3**
|
Amendment to Directors’ Charitable Giving Program, dated as of February 18, 1998, (incorporated by reference to Exhibit 10-1.3 to Duke Energy Carolinas, LLC's Annual Report on Form 10-K for the year ended December 31, 2003, filed on March 15, 2004, File No. 1-4928).
|
X
|
|
|
|
|
|
|
|
|
|
|
|
|
|
10.3
|
Agreements with Piedmont Electric Membership Corporation, Rutherford Electric Membership Corporation and Blue Ridge Electric Membership Corporation to provide wholesale electricity and related power scheduling services from September 1, 2006 through December 31, 2021 (incorporated by reference to Exhibit 10.15 to Duke Energy Corporation's Quarterly Report on Form 10-Q for the quarter ended June 30, 2006, filed on August 9, 2006, File No. 1-32853).
|
X
|
|
|
|
|
|
|
|
|
|
|
|
|
|
10.4
|
Asset Purchase Agreement between Saluda River Electric Cooperative, Inc., as Seller, and Duke Energy Carolinas, LLC, as Purchaser, dated as of December 20, 2006, (incorporated by reference to Exhibit 10.1 to registrant's Current Report on Form 8-K filed on December 27, 2006, File No. 1-4928).
|
|
|
X
|
|
|
|
|
|
|
|
|
|
|
|
10.5
|
Settlement between Duke Energy Corporation, Duke Energy Carolinas, LLC and the U.S. Department of Justice resolving Duke Energy's used nuclear fuel litigation against the U.S. Department of Energy, dated as of March 6, 2007, (incorporated by reference to Item 8.01 to registrant's Current Report on Form 8-K filed on March 12, 2007, File No. 1-4928).
|
|
|
X
|
|
|
|
|
|
|
|
|
|
|
|
10.6
|
Engineering, Procurement and Construction Agreement between Duke Energy Carolinas, LLC and Stone & Webster National Engineering P.C., dated as of July 11, 2007, (incorporated by reference to Exhibit 10.1 to registrant's Quarterly Report on Form 10-Q for the quarter ended September 30, 2007, filed on November 12, 2007, File No. 1-4928). (Portions of the exhibit have been omitted and filed separately with the Securities and Exchange Commission pursuant to a request for confidential treatment pursuant to Rule 24b-2 under the Securities Exchange Act of 1934, as amended.)
|
|
|
X
|
|
|
|
|
|
|
|
|
|
|
|
10.7
|
Amended and Restated Engineering, Procurement and Construction Agreement between Duke Energy Carolinas, LLC and Stone & Webster National Engineering P.C., dated as of February 20, 2008, (incorporated by reference to Exhibit 10.1 to registrant's Quarterly Report on Form 10-Q for the quarter ended March 31, 2008, filed on May 14, 2008, File No. 1-4928). (Portions of the exhibit have been omitted and filed separately with the Securities and Exchange Commission pursuant to a request for confidential treatment pursuant to Rule 24b-2 under the Securities Exchange Act of 1934, as amended).
|
|
|
X
|
|
|
|
|
|
|
|
|
|
|
|
10.8
|
Asset Purchase Agreement between Cinergy Capital & Trading, Inc. (Capital & Trading), CinCap Madison, LLC and Duke Energy Indiana, Inc. (formerly PSI Energy, Inc.), dated as of February 5, 2003, (incorporated by reference to Exhibit 10(tt) to registrant's Quarterly Report on Form 10-Q for the quarter ended March 31, 2003, filed on May 12, 2003, File No. 1-3543).
|
|
|
|
|
|
|
|
|
|
|
|
|
X
|
|
10.9
|
Amended and Restated Engineering and Construction Agreement between Duke Energy Carolinas, LLC and Shaw North Carolina, Inc., dated as of December 21, 2009, (incorporated by reference to Item 1.01 to registrant's Current Report on Form 8-K filed on December 28, 2009, File No. 1-4928).
|
|
|
X
|
|
|
|
|
|
|
|
|
|
|
|
10.10
|
Asset Purchase Agreement between Capital & Trading, CinCap VII, LLC and Duke Energy Indiana, Inc. (formerly PSI Energy, Inc.), dated as of February 5, 2003, (incorporated by reference to Exhibit 10(uu) to registrant's Quarterly Report on Form 10-Q for the quarter ended March 31, 2003, filed on May 12, 2003, File No. 1-3543).
|
|
|
|
|
|
|
|
|
|
|
|
|
X
|
|
10.11
|
Asset Purchase Agreement between Duke Energy Indiana, Inc. (formerly PSI Energy, Inc.) and Duke Energy Ohio, Inc. (formerly The Cincinnati Gas & Electric Company) and Allegheny Energy Supply Company, LLC, Allegheny Energy Supply Wheatland Generating Facility, LLC and Lake Acquisition Company, L.L.C., dated as of May 6, 2005, (incorporated by reference to registrant's Quarterly Report on Form 10-Q for the quarter ended June 30, 2005, filed on August 4, 2005, File No. 1-1232).
|
|
|
|
|
|
|
|
|
|
|
X
|
|
|
|
10.12
|
Asset Purchase Agreement between Duke Energy Indiana, Inc. (formerly PSI Energy, Inc.) and CG&E and Allegheny Energy Supply Company, LLC, Allegheny Energy Supply Wheatland Generating Facility, LLC and Lake Acquisition Company, L.L.C., dated as of May 6, 2005, (incorporated by reference to Exhibit 10(kkkk) to registrant's Quarterly Report on Form 10-Q for the quarter ended June 30, 2005 filed, on August 4, 2005, File No. 1-3543).
|
|
|
|
|
|
|
|
|
|
|
|
|
X
|
|
10.13
|
Keepwell Agreement between Duke Capital LLC and Duke Energy Ohio, Inc. (formerly The Cincinnati Gas & Electric Company), dated as of April 10, 2006, (incorporated by reference to Exhibit 10.1 to registrant's Current Report on Form 8-K filed on April 14, 2006, File No. 1-1232).
|
|
|
|
|
|
|
|
|
|
|
X
|
|
|
|
10.14
|
Agreements between Piedmont Electric Membership Corporation, Rutherford Electric Membership Corporation and Blue Ridge Electric Membership Corporation to provide wholesale electricity and related power scheduling services from September 1, 2006 through December 31, 2021 (incorporated by reference to Exhibit 10.15 to Duke Energy Corporation's Quarterly Report on Form 10-Q for the quarter ended June 30, 2006 filed, on August 9, 2006, File No. 1-32853).
|
X
|
|
|
|
|
|
|
|
|
|
|
|
|
|
10.15
|
Asset Purchase Agreement between Duke Energy Indiana, Inc., (formerly PSI Energy, Inc.), as Seller, and Wabash Valley Power Association, Inc., as Buyer, dated as of December 1, 2006, (incorporated by reference to Exhibit 10.1 to registrant's Current Report on Form 8-K filed on December 7, 2006, File No. 1-3543).
|
|
|
|
|
|
|
|
|
|
|
|
|
X
|
|
10.16
|
Purchase and Sale Agreement between Cinergy Capital & Trading, Inc., as Seller, and Fortis Bank, S.A./N.V., as Buyer, dated as of June 26, 2006, (incorporated by reference to Exhibit 10.1 to Duke Energy Corporation's Current Report on Form 8-K filed on June 30, 2006, File No. 1-32853).
|
X
|
|
|
|
|
|
|
|
|
|
|
|
|
|
10.17
|
Engineering, Procurement and Construction Management Agreement between Duke Energy Indiana, Inc. (formerly PSI Energy, Inc.) and Bechtel Power Corporation, dated as of December 15, 2008, (incorporated by reference to Exhibit 10.16 to registrant's Annual Report on Form 10-K for the year ended December 31, 2008, filed on March 13, 2009, File No. 1-3543). (Portions of the exhibit have been omitted and filed separately with the Securities and Exchange Commission pursuant to a request for confidential treatment pursuant to Rule 24b-2 under the Securities Exchange Act of 1934, as amended).
|
|
|
|
|
|
|
|
|
|
|
|
|
X
|
|
10.18
|
Formation and Sale Agreement between Duke Ventures, LLC, Crescent Resources, LLC, Morgan Stanley Real Estate Fund V U.S. L.P., Morgan Stanley Real Estate Fund V Special U.S., L.P., Morgan Stanley Real Estate Investors V U.S., L.P., MSP Real Estate Fund V, L.P., and Morgan Stanley Strategic Investments, Inc., dated as of September 7, 2006, (incorporated by reference to Exhibit 10.3 to Duke Energy Corporation's Quarterly Report on Form 10-Q for the quarter ended September 30, 2006, filed on November 9, 2006, File No. 1-32853).
|
X
|
|
|
|
|
|
|
|
|
|
|
|
|
|
10.19
|
Engineering, Procurement and Construction Agreement between Duke Energy Carolinas, LLC and Stone & Webster National Engineering P.C., dated as of July 11, 2007, (incorporated by reference to Exhibit 10.2 to Duke Energy Corporation's Quarterly Report on Form 10-Q for the quarter ended September 30, 2007 filed on November 9, 2007, File No. 1-32853). (Portions of the exhibit have been omitted and filed separately with the Securities and Exchange Commission pursuant to a request for confidential treatment pursuant to Rule 24b-2 under the Securities Exchange Act of 1934, as amended).
|
X
|
|
|
|
|
|
|
|
|
|
|
|
|
|
10.20
|
Amended and Restated Engineering, Procurement and Construction Agreement between Duke Energy Carolinas, LLC and Stone & Webster National Engineering P.C., dated as of February 20, 2008, (incorporated by reference to Exhibit 10.1 to Duke Energy Corporation's Quarterly Report on Form 10-Q for the quarter ended March 31, 2008, filed on May 9, 2008, File No. 1-32853). (Portions of the exhibit have been omitted and filed separately with the Securities and Exchange Commission pursuant to a request for confidential treatment pursuant to Rule 24b-2 under the Securities Exchange Act of 1934, as amended).
|
X
|
|
|
|
|
|
|
|
|
|
|
|
|
|
10.21
|
Agreement and Plan of Merger between DEGS Wind I, LLC, DEGS Wind Vermont, Inc., Catamount Energy Corporation, dated as of June 25, 2008, (incorporated by reference to Exhibit 10.2 to Duke Energy Corporation's Quarterly Report on Form 10-Q for the quarter ended June 30, 2008, filed on August 11, 2008, File No. 1-32853).
|
X
|
|
|
|
|
|
|
|
|
|
|
|
|
|
10.22
|
Amended and Restated Engineering and Construction Agreement between Duke Energy Carolinas, LLC and Shaw North Carolina, Inc., dated as of December 21, 2009, (incorporated by reference to Exhibit 10.41 to Duke Energy Corporation's Annual Report on Form 10-K for the year ended December 31, 2009, filed on February 26, 2010, File No.1-32853).
|
X
|
|
|
|
|
|
|
|
|
|
|
|
|
|
10.23
|
Operating Agreement of Pioneer Transmission, LLC (incorporated by reference to Exhibit 10.1 to Duke Energy Corporation's Quarterly Report on Form 10-Q for the quarter ended September 30, 2008, filed on November 7, 2008, File No. 1-32853).
|
X
|
|
|
|
|
|
|
|
|
|
|
|
|
|
10.24**
|
Amended and Restated Duke Energy Corporation Directors' Saving Plan, dated as of January 1, 2014, (incorporated by reference to Exhibit 10.32 to Duke Energy Corporation's Annual Report on Form 10-K for the year ended December 31, 2013, filed on February 28, 2014, File No. 1-32853).
|
X
|
|
|
|
|
|
|
|
|
|
|
|
|
|
10.25
|
Engineering, Procurement and Construction Management Agreement between Duke Energy Indiana, Inc. (formerly PSI Energy, Inc.) and Bechtel Power Corporation, dated as of December 15, 2008, (incorporated by reference to Item 1.01 to registrant's Current Report on Form 8-K filed on December 19, 2008, File Nos. 1-32853 and 1-3543). (Portions of the exhibit have been omitted and filed separately with the Securities and Exchange Commission pursuant to a request for confidential treatment pursuant to Rule 24b-2 under the Securities Exchange Act of 1934, as amended).
|
X
|
|
|
|
|
|
|
|
|
|
|
|
X
|
|
10.26
|
Amended and Restated Engineering and Construction Agreement between Duke Energy Carolinas, LLC and Shaw North Carolina, Inc., dated as of March 8, 2010, (incorporated by reference to Exhibit 10.1 to registrant's Quarterly Report on Form 10-Q for the quarter ended March 31, 2010, filed on May 7, 2010, File Nos. 1-32853 and 1-4928).
|
X
|
|
X
|
|
|
|
|
|
|
|
|
|
|
|
10.27**
|
Duke Energy Corporation Executive Severance Plan (incorporated by reference to Exhibit 10.1 to registrant's Current Report on Form 8-K filed on January 10, 2011, File No. 1-32853).
|
X
|
|
|
|
|
|
|
|
|
|
|
|
|
|
10.28
|
$6,000,000,000 Five-Year Credit Agreement between Duke Energy Corporation, Duke Energy Carolinas, LLC, Duke Energy Ohio, Inc., Duke Energy Indiana, Inc., Duke Energy Kentucky, Inc., Carolina Power and Light Company d/b/a Duke Energy Progress, Inc. and Florida Power Corporation, d/b/a Duke Energy Florida, Inc., as Borrowers, the lenders listed therein, Wells Fargo Bank, National Association, as Administrative Agent, Bank of America, N.A. and The Royal Bank of Scotland plc, as Co-Syndication Agents and Bank of China, New York Branch, Barclays Bank PLC, Citibank, N.A., Credit Suisse AG, Cayman Islands Branch, Industrial and Commercial Bank of China Limited, New York Branch, JPMorgan Chase Bank, N.A. and UBS Securities LLC, as Co-Documentation Agents, dated as of November 18, 2011, (incorporated by reference to Exhibit 10.1 to registrant's Current Report on Form 8-K filed on November 25, 2011, File Nos. 1-32853, 1-4928, 1-1232 and 1-3543).
|
X
|
|
X
|
|
|
|
|
|
|
|
X
|
|
X
|
|
10.28.1
|
Amendment No. 1 and Consent between Duke Energy Corporation, Duke Energy Carolinas, LLC, Duke Energy Ohio, Inc., Duke Energy Indiana, Inc., Duke Energy Kentucky, Inc., Duke Energy Progress, Inc., Duke Energy Florida, Inc., and Wells Fargo Bank, National Association, dated as of December 18, 2013, (incorporated by reference to Exhibit 10.1 to registrant's Current Report on Form 8-K filed on December 23, 2013, File Nos. 1-32853, 1-4928, 1-3382, 1-3274, 1-1232 and 1-3543).
|
X
|
X
|
X
|
X
|
X
|
X
|
|||||||
|
10.28.2
|
Amendment No. 2 and Consent between Duke Energy Corporation, Duke Energy Carolinas, LLC, Duke Energy Ohio, Inc., Duke Energy Indiana, Inc., Duke Energy Kentucky, Inc., Duke Energy Progress, Inc., and Duke Energy Florida, Inc., the Lenders party hereto, the issuing Lenders party hereto, Wells Fargo Bank, National Association, as Administrative Agent and Swingline Lender, dated as of January 30, 2015 (incorporated by reference to Exhibit 10.1 of registrant's Current Report on Form 8-K filed on February 5, 2015, File Nos. 1-32853, 1-4928, 1-1232, 1-3543, 1-3382 and 1-3274).
|
X
|
X
|
X
|
X
|
X
|
X
|
|||||||
|
10.29**
|
Duke Energy Corporation 2010 Long-term Incentive Plan (incorporated by reference to Appendix A to registrant's Form DEF 14A filed on March 22, 2010, File No. 1-32853).
|
X
|
|
|
|
|
|
|
|
|
|
|
|
|
|
10.29.1**
|
Amendment to Duke Energy Corporation 2010 Long-Term Incentive Plan (incorporated by reference to Exhibit 10.3 to registrant's Quarterly Report on Form 10-Q for the quarter ended June 30, 2012, filed on August 8, 2012, File No. 1-32853).
|
X
|
|
|
|
|
|
|
|
|
|
|
|
|
|
10.30**
|
Form of Performance Award Agreement of Duke Energy Corporation under the Duke Energy Corporation 2010 Long-Term Incentive Plan (incorporated by reference to Exhibit 10.1 to registrant's Current Report on Form 8-K filed on February 22, 2011, File No. 1-32853).
|
X
|
||||||||||||
|
10.31**
|
Form of Phantom Stock Award Agreement of Duke Energy Corporation under the Duke Energy Corporation 2010 Long-Term Incentive Plan (incorporated by reference to Exhibit 10.2 to registrant's Current Report on Form 8-K filed on February 22, 2011, File No. 1-32853).
|
X
|
||||||||||||
|
10.32**
|
Duke Energy Corporation 2015 Long-Term Incentive Plan (incorporated by reference to Appendix A to registrant's DEF 14A filed on March 26, 2015, File No. 1-32853).
|
X
|
||||||||||||
|
10.33**
|
Form of Restricted Stock Unit Award Agreement of Duke Energy Corporation under the Duke Energy Corporation 2015 Long-Term Incentive Plan (incorporated by reference to Exhibit 10.1 to registrant's Current Report on Form 8-K filed on May 12, 2015, File No. 1-32853).
|
X
|
||||||||||||
|
10.34**
|
Form of Performance Award Agreement of Duke Energy Corporation under the Duke Energy Corporation 2015 Long-Term Incentive Plan (incorporated by reference to Exhibit 10.2 to registrant's Current Report on Form 8-K filed on May 12, 2015, File No. 1-32853).
|
X
|
||||||||||||
|
10.35**
|
Form of Performance Award Agreement of Duke Energy Corporation under the Duke Energy Corporation 2015 Long-Term Incentive Plan (incorporated by reference to Exhibit 10.1 to registrant's Current Report on Form 8-K filed on February 18, 2016, File No. 1-32853).
|
X
|
||||||||||||
|
10.36**
|
Form of Restricted Stock Unit Award Agreement of Duke Energy Corporation under the Duke Energy Corporation 2015 Long-Term Incentive Plan (incorporated by reference to Exhibit 10.2 to registrant's Current Report on Form 8-K filed on February 18, 2016, File No. 1-32853).
|
X
|
||||||||||||
|
10.37
|
Settlement Agreement between Duke Energy Corporation, the North Carolina Utilities Commission Staff and the North Carolina Public Staff, dated as of November 28, 2012, (incorporated by reference to Exhibit 10.1 to registrant's Current Report on Form 8-K filed on November 29, 2012, File No. 1-32853).
|
X
|
|
|
|
|
|
|
|
|
|
|
|
|
|
10.38
|
Settlement Agreement between Duke Energy Corporation and the North Carolina Attorney General, dated as of December 3, 2012, (incorporated by reference Item 7.01 to registrant's Current Report on Form 8-K filed on December 3, 2012, File No. 1-32853).
|
X
|
|
|
|
|
|
|
|
|
|
|
|
|
|
10.39**
|
Form of Change-in-Control Agreement (incorporated by reference to Exhibit 10.58 to Duke Energy Corporation's Annual Report on Form 10-K for the year ended December 31, 2012, filed on March 1, 2013, File No. 1-32853).
|
X
|
|
|
|
|
|
|
|
|
|
|
|
|
|
10.40**
|
Form of Performance Share Award (incorporated by reference to Exhibit 10.64 to Duke Energy Corporation's Annual Report on Form 10-K for the year ended December 31, 2012, filed on March 1, 2013, File No. 1-32853).
|
X
|
|
|
|
|
|
|
|
|
|
|
|
|
|
10.41**
|
Amended and Restated Duke Energy Corporation Executive Cash Balance Plan, dated as of January 1, 2014, (incorporated by reference to Exhibit 10.52 to Duke Energy Corporation's Annual Report on Form 10-K for the year ended December 31, 2013, filed on February 28, 2014, File No. 1-32852).
|
X
|
|
|
|
|
|
|
|
|
|
|
|
|
|
10.42
|
Purchase, Construction and Ownership Agreement, dated as of July 30, 1981, between Duke Energy Progress, Inc. (formerly Carolina Power & Light Company) and North Carolina Municipal Power Agency Number 3 and Exhibits, together with resolution, dated as of December 16, 1981, changing name to North Carolina Eastern Municipal Power Agency, amending letter, dated as of February 18, 1982, and amendment, dated as of February 24, 1982, (incorporated by reference to Exhibit 10(a) to registrant's File No. 33-25560).
|
|
|
|
|
|
|
X
|
|
|
|
|
|
|
|
10.43
|
Operating and Fuel Agreement, dated as of July 30, 1981, between Duke Energy Progress, Inc. (formerly Carolina Power & Light Company) and North Carolina Municipal Power Agency Number 3 and Exhibits, together with resolution, dated as of December 16, 1981, changing name to North Carolina Eastern Municipal Power Agency, amending letters, dated as of August 21, 1981 and December 15, 1981, and amendment, dated as of February 24, 1982, (incorporated by reference to Exhibit 10(b) to registrant's File No. 33-25560).
|
|
|
|
|
|
|
X
|
|
|
|
|
|
|
|
10.44
|
Power Coordination Agreement, dated as of July 30, 1981, between Duke Energy Progress, Inc. (formerly Carolina Power & Light Company) and North Carolina Municipal Power Agency Number 3 and Exhibits, together with resolution, dated as of December 16, 1981, changing name to North Carolina Eastern Municipal Power Agency and amending letter, dated as of January 29, 1982, (incorporated by reference to Exhibit 10(c) to registrant's File No. 33-25560).
|
|
|
|
|
|
|
X
|
|
|
|
|
|
|
|
10.45
|
Amendment, dated as of December 16, 1982, to Purchase, Construction and Ownership Agreement, dated as of July 30, 1981, between Duke Energy Progress, Inc. (formerly Carolina Power & Light Company) and North Carolina Eastern Municipal Power Agency (incorporated by reference to Exhibit 10(d) to registrant's File No. 33-25560).
|
|
|
|
|
|
|
X
|
|
|
|
|
|
|
|
10.46+
|
Progress Energy, Inc. 2007 Equity Incentive Plan (incorporated by reference to Exhibit C to registrant's Form DEF 14A filed on March 30, 2007, File No. 1-15929).
|
|
|
|
|
X
|
|
|
|
|
|
|
|
|
|
10.47+
|
Form of Letter Agreement executed by certain officers of Progress Energy, Inc., waiving certain rights under Progress Energy, Inc.’s Management Change-in-Control Plan and their employment agreements, dated as of January 8, 2011, (incorporated by reference to Exhibit 10.1 to registrant's Current Report on Form 8-K filed on January 8, 2011, File No. 1-15929).
|
|
|
|
|
X
|
|
|
|
|
|
|
|
|
|
10.48+
|
Progress Energy, Inc. Management Change-in-Control Plan, Amended and Restated, effective July 13, 2011, (incorporated by reference to Exhibit 10(d) to registrant's Quarterly Report on Form 10-Q for the quarter ended September 30, 2011, filed on November 8, 2011, File Nos. 1-15929, 1-3382 and 1-3274).
|
|
|
|
|
X
|
|
X
|
|
X
|
|
|
|
|
|
10.49+
|
Form of Progress Energy, Inc. Restricted Stock Unit Award Agreement (Graded Vesting), effective September 15, 2011.
|
|
|
|
|
X
|
|
X
|
|
X
|
|
|
|
|
|
10.50+
|
Form of Progress Energy, Inc. Restricted Stock Unit Award Agreement (Cliff Vesting), effective September 15, 2011.
|
|
|
|
|
X
|
|
X
|
|
X
|
|
|
|
|
|
10.51
|
Precedent and Related Agreements between Duke Energy Florida, Inc. (formerly Florida Power Corporation d/b/a Progress Energy Florida, Inc. (“PEF”)), Southern Natural Gas Company, Florida Gas Transmission Company (“FGT”), and BG LNG Services, LLC (“BG”), including:
a) Precedent Agreement between Southern Natural Gas Company and PEF, dated as of December 2, 2004;
b) Gas Sale and Purchase Contract between BG and PEF, dated as of December 1, 2004;
c) Interim Firm Transportation Service Agreement by and between FGT and PEF, dated as of December 2, 2004;
d) Letter Agreement between FGT and PEF, dated as of December 2, 2004 and Firm Transportation Service Agreement between FGT and PEF to be entered into upon satisfaction of certain conditions precedent;
e) Discount Agreement between FGT and PEF, dated as of December 2, 2004;
f) Amendment to Gas Sale and Purchase Contract between BG and PEF, dated as of January 28, 2005; and
g) Letter Agreement between FGT and PEF, dated as of January 31, 2005, (incorporated by reference to Exhibit 10.1 to registrant's Current Report on Form 8-K/A filed on March 15, 2005, File Nos. 1-15929 and 1-3274). (Portions of the exhibit have been omitted and filed separately with the Securities and Exchange Commission pursuant to a request for confidential treatment pursuant to Rule 24b-2 under the Securities Exchange Act of 1934, as amended).
|
|
|
|
|
X
|
|
|
|
X
|
|
|
|
|
|
10.52
|
Engineering, Procurement and Construction Agreement between Duke Energy Florida, Inc. (formerly Florida Power Corporation d/b/a/ Progress Energy Florida, Inc.), as owner, and a consortium consisting of Westinghouse Electric Company LLC and Stone & Webster, Inc., as contractor, for a two-unit AP1000 Nuclear Power Plant, dated as of December 31, 2008, (incorporated by reference to Exhibit 10.1 to registrant's Current Report on Form 8-K filed on March 2, 2009, File Nos. 1-15929 and 1-3274). (Portions of the exhibit have been omitted and filed separately with the Securities and Exchange Commission pursuant to a request for confidential treatment pursuant to Rule 24b-2 under the Securities Exchange Act of 1934, as amended).
|
|
|
|
|
X
|
|
|
|
X
|
|
|
|
|
|
10.53**
|
Employment Agreement between Duke Energy Corporation and Lynn J. Good, dated as of June 17, 2013, (incorporated by reference to Exhibit 10.1 to Duke Energy Corporation's Current Report on Form 8-K filed on June 18, 2013, File No. 1-32853).
|
X
|
|
|
|
|
|
|
|
|
|
|
|
|
|
10.53.1**
|
Amendment to Employment Agreement between Duke Energy Corporation and Lynn J. Good, dated as of June 25, 2015, (incorporated by reference to Exhibit 10.1 to Duke Energy Corporation's Current Report on Form 8-K filed on June 29, 2015, File No. 1-32853).
|
X
|
||||||||||||
|
10.54**
|
Duke Energy Corporation Executive Short-Term Incentive Plan, effective February 25, 2013, (incorporated by reference to Exhibit 10.1 to Duke Energy Corporation's Current Report on Form 8- filed on May 7, 2013, File No. 1-32853).
|
X
|
|
|
|
|
|
|
|
|
|
|
|
|
|
*10.55**
|
Duke Energy Corporation 2016 Director Compensation Program Summary
|
X
|
||||||||||||
|
10.56**
|
Amended and Restated Duke Energy Corporation Executive Savings Plan, dated as of January 1, 2014, (incorporated by reference to Exhibit 10.82 to Duke Energy Corporation's Annual Report on Form 10-K for the year ended December 31, 2013 filed on February 28, 2014, File No. 1-32853).
|
X
|
||||||||||||
|
10.57
|
Agreement between Duke Energy SAM, LLC, Duke Energy Ohio, Inc., Duke Energy Commercial Enterprise, Inc. and Dynegy Resource I, LLC, dated as of August 21, 2014, (incorporated by reference to Exhibit 10.61 to Duke Energy Corporation's Annual Report on Form 10-K for the year ended December 31, 2014, filed on March 2, 2015, File No. 1-32853).
|
X
|
X
|
|||||||||||
|
10.58
|
Asset Purchase Agreement between Duke Energy Progress, Inc. and North Carolina Eastern Municipal Power Agency, dated as of September 5, 2014, (incorporated by reference to Exhibit 10.62 to Duke Energy Corporation's Annual Report on Form 10-K for the year ended December 31, 2014, filed on March 2, 2015, File No. 1-32853).
|
X
|
X
|
|||||||||||
|
10.59
|
Change in Control Agreement between Duke Energy Corporation and Lloyd M. Yates, dated as of April 30, 2014, (incorporated by reference to Exhibit 10.1 to Duke Energy Corporation's Current Report on Form 8-K filed on May 6, 2014, File No. 1-32853).
|
X
|
||||||||||||
|
10.60
|
Accelerated Stock Repurchase Program executed by Goldman, Sachs & Co., and JPMorgan Chase Bank, N.A. on April 6, 2015, under an agreement with Duke Energy Corporation, (incorporated by reference to Exhibit 10.1 to Duke Energy Corporation's Current Report on Form 8-K filed on April 6, 2015, File No. 1-32853).
|
X
|
||||||||||||
|
10.61
|
Plea Agreement between Duke Energy Corporation and the Court of the Eastern District of North Carolina in connection with the May 14, 2015, Dan River Grand Jury Settlement, (incorporated by reference to Exhibit 10.3 to Duke Energy Corporation's Quarterly Report on Form 10-Q for the quarter ended June 30, 2015, filed on August 7, 2015, File No. 1-32853).
|
X
|
||||||||||||
|
10.62
|
Plea Agreement between Duke Energy Corporation and the Court of the Eastern District of North Carolina in connection with the May 14, 2015, Dan River Grand Jury Settlement, (incorporated by reference to Exhibit 10.4 to Duke Energy Corporation's Quarterly Report on Form 10-Q for the quarter ended June 30, 2015 filed on August 7, 2015, File No. 1-32853).
|
X
|
||||||||||||
|
*12.1
|
Computation of Ratio of Earnings to Fixed Charges – DUKE ENERGY CORPORATION
|
X
|
|
|
|
|
|
|
|
|
|
|
|
|
|
*12.2
|
Computation of Ratio of Earnings to Fixed Charges – DUKE ENERGY CAROLINAS, LLC
|
|
|
X
|
|
|
|
|
|
|
|
|
|
|
|
*12.3
|
Computation of Ratio of Earnings to Fixed Charges – PROGRESS ENERGY, INC.
|
|
|
|
|
X
|
|
|
|
|
|
|
|
|
|
*12.4
|
Computation of Ratio of Earnings to Fixed Charges – DUKE ENERGY PROGRESS, LLC
|
|
|
|
|
|
|
X
|
|
|
|
|
|
|
|
*12.5
|
Computation of Ratio of Earnings to Fixed Charges – DUKE ENERGY FLORIDA, LLC
|
|
|
|
|
|
|
|
|
X
|
|
|
|
|
|
*12.6
|
Computation of Ratio of Earnings to Fixed Charges – DUKE ENERGY OHIO, INC.
|
|
|
|
|
|
|
|
|
|
|
X
|
|
|
|
*12.7
|
Computation of Ratio of Earnings to Fixed Charges – DUKE ENERGY INDIANA, INC.
|
|
|
|
|
|
|
|
|
|
|
|
|
X
|
|
*21
|
List of Subsidiaries
|
X
|
|
|
|
|
|
|
|
|
|
|
|
|
|
*23.1.1
|
Consent of Independent Registered Public Accounting Firm.
|
X
|
|
|
|
|
|
|
|
|
|
|
|
|
|
*23.1.2
|
Consent of Independent Registered Public Accounting Firm.
|
|
|
X
|
|
|
|
|
|
|
|
|
|
|
|
*23.1.3
|
Consent of Independent Registered Public Accounting Firm.
|
|
|
|
|
|
|
X
|
|
|
|
|
|
|
|
*23.1.4
|
Consent of Independent Registered Public Accounting Firm.
|
|
|
|
|
|
|
|
|
X
|
|
|
|
|
|
*23.1.5
|
Consent of Independent Registered Public Accounting Firm.
|
|
|
|
|
|
|
|
|
|
|
X
|
|
|
|
*23.1.6
|
Consent of Independent Registered Public Accounting Firm.
|
|
|
|
|
|
|
|
|
|
|
|
|
X
|
|
*24.1
|
Power of attorney authorizing Lynn J. Good and others to sign the annual report on behalf of the registrant and certain of its directors and officers.
|
X
|
|
|
|
|
|
|
|
|
|
|
|
|
|
*24.2
|
Certified copy of resolution of the Board of Directors of the registrant authorizing power of attorney.
|
X
|
|
|
|
|
|
|
|
|
|
|
|
|
|
*31.1.1
|
Certification of the Chief Executive Officer Pursuant to Section 302 of the Sarbanes-Oxley Act of 2002.
|
X
|
|
|
|
|
|
|
|
|
|
|
|
|
|
*31.1.2
|
Certification of the Chief Executive Officer Pursuant to Section 302 of the Sarbanes-Oxley Act of 2002.
|
|
|
X
|
|
|
|
|
|
|
|
|
|
|
|
*31.1.3
|
Certification of the Chief Executive Officer Pursuant to Section 302 of the Sarbanes-Oxley Act of 2002.
|
|
|
|
|
X
|
|
|
|
|
|
|
|
|
|
*31.1.4
|
Certification of the Chief Executive Officer Pursuant to Section 302 of the Sarbanes-Oxley Act of 2002.
|
|
|
|
|
|
|
X
|
|
|
|
|
|
|
|
*31.1.5
|
Certification of the Chief Executive Officer Pursuant to Section 302 of the Sarbanes-Oxley Act of 2002.
|
|
|
|
|
|
|
|
|
X
|
|
|
|
|
|
*31.1.6
|
Certification of the Chief Executive Officer Pursuant to Section 302 of the Sarbanes-Oxley Act of 2002.
|
|
|
|
|
|
|
|
|
|
|
X
|
|
|
|
*31.1.7
|
Certification of the Chief Executive Officer Pursuant to Section 302 of the Sarbanes-Oxley Act of 2002.
|
|
|
|
|
|
|
|
|
|
|
|
|
X
|
|
*31.2.1
|
Certification of the Chief Financial Officer Pursuant to Section 302 of the Sarbanes-Oxley Act of 2002.
|
X
|
|
|
|
|
|
|
|
|
|
|
|
|
|
*31.2.2
|
Certification of the Chief Financial Officer Pursuant to Section 302 of the Sarbanes-Oxley Act of 2002.
|
|
|
X
|
|
|
|
|
|
|
|
|
|
|
|
*31.2.3
|
Certification of the Chief Financial Officer Pursuant to Section 302 of the Sarbanes-Oxley Act of 2002.
|
|
|
|
|
X
|
|
|
|
|
|
|
|
|
|
*31.2.4
|
Certification of the Chief Financial Officer Pursuant to Section 302 of the Sarbanes-Oxley Act of 2002.
|
|
|
|
|
|
|
X
|
|
|
|
|
|
|
|
*31.2.5
|
Certification of the Chief Financial Officer Pursuant to Section 302 of the Sarbanes-Oxley Act of 2002.
|
|
|
|
|
|
|
|
|
X
|
|
|
|
|
|
*31.2.6
|
Certification of the Chief Financial Officer Pursuant to Section 302 of the Sarbanes-Oxley Act of 2002.
|
|
|
|
|
|
|
|
|
|
|
X
|
|
|
|
*31.2.7
|
Certification of the Chief Financial Officer Pursuant to Section 302 of the Sarbanes-Oxley Act of 2002.
|
|
|
|
|
|
|
|
|
|
|
|
|
X
|
|
*32.1.1
|
Certification Pursuant to 18 U.S.C. Section 1350, as Adopted Pursuant to Section 906 of the Sarbanes-Oxley Act of 2002.
|
X
|
|
|
|
|
|
|
|
|
|
|
|
|
|
*32.1.2
|
Certification Pursuant to 18 U.S.C. Section 1350, as Adopted Pursuant to Section 906 of the Sarbanes-Oxley Act of 2002.
|
|
|
X
|
|
|
|
|
|
|
|
|
|
|
|
*32.1.3
|
Certification Pursuant to 18 U.S.C. Section 1350, as Adopted Pursuant to Section 906 of the Sarbanes-Oxley Act of 2002.
|
|
|
|
|
X
|
|
|
|
|
|
|
|
|
|
*32.1.4
|
Certification Pursuant to 18 U.S.C. Section 1350, as Adopted Pursuant to Section 906 of the Sarbanes-Oxley Act of 2002.
|
|
|
|
|
|
|
X
|
|
|
|
|
|
|
|
*32.1.5
|
Certification Pursuant to 18 U.S.C. Section 1350, as Adopted Pursuant to Section 906 of the Sarbanes-Oxley Act of 2002.
|
|
|
|
|
|
|
|
|
X
|
|
|
|
|
|
*32.1.6
|
Certification Pursuant to 18 U.S.C. Section 1350, as Adopted Pursuant to Section 906 of the Sarbanes-Oxley Act of 2002.
|
|
|
|
|
|
|
|
|
|
|
X
|
|
|
|
*32.1.7
|
Certification Pursuant to 18 U.S.C. Section 1350, as Adopted Pursuant to Section 906 of the Sarbanes-Oxley Act of 2002.
|
|
|
|
|
|
|
|
|
|
|
|
|
X
|
|
*32.2.1
|
Certification Pursuant to 18 U.S.C. Section 1350, as Adopted Pursuant to Section 906 of the Sarbanes-Oxley Act of 2002.
|
X
|
|
|
|
|
|
|
|
|
|
|
|
|
|
*32.2.2
|
Certification Pursuant to 18 U.S.C. Section 1350, as Adopted Pursuant to Section 906 of the Sarbanes-Oxley Act of 2002.
|
|
|
X
|
|
|
|
|
|
|
|
|
|
|
|
*32.2.3
|
Certification Pursuant to 18 U.S.C. Section 1350, as Adopted Pursuant to Section 906 of the Sarbanes-Oxley Act of 2002.
|
|
|
|
|
X
|
|
|
|
|
|
|
|
|
|
*32.2.4
|
Certification Pursuant to 18 U.S.C. Section 1350, as Adopted Pursuant to Section 906 of the Sarbanes-Oxley Act of 2002.
|
|
|
|
|
|
|
X
|
|
|
|
|
|
|
|
*32.2.5
|
Certification Pursuant to 18 U.S.C. Section 1350, as Adopted Pursuant to Section 906 of the Sarbanes-Oxley Act of 2002.
|
|
|
|
|
|
|
|
|
X
|
|
|
|
|
|
*32.2.6
|
Certification Pursuant to 18 U.S.C. Section 1350, as Adopted Pursuant to Section 906 of the Sarbanes-Oxley Act of 2002.
|
|
|
|
|
|
|
|
|
|
|
X
|
|
|
|
*32.2.7
|
Certification Pursuant to 18 U.S.C. Section 1350, as Adopted Pursuant to Section 906 of the Sarbanes-Oxley Act of 2002.
|
|
|
|
|
|
|
|
|
|
|
|
|
X
|
|
*101.INS
|
XBRL Instance Document
|
X
|
|
X
|
|
X
|
|
X
|
|
X
|
|
X
|
|
X
|
|
*101.SCH
|
XBRL Taxonomy Extension Schema Document
|
X
|
|
X
|
|
X
|
|
X
|
|
X
|
|
X
|
|
X
|
|
*101.CAL
|
XBRL Taxonomy Calculation Linkbase Document
|
X
|
|
X
|
|
X
|
|
X
|
|
X
|
|
X
|
|
X
|
|
*101.LAB
|
XBRL Taxonomy Label Linkbase Document
|
X
|
|
X
|
|
X
|
|
X
|
|
X
|
|
X
|
|
X
|
|
*101.PRE
|
XBRL Taxonomy Presentation Linkbase Document
|
X
|
|
X
|
|
X
|
|
X
|
|
X
|
|
X
|
|
X
|
|
*101.DEF
|
XBRL Taxonomy Definition Linkbase Document
|
X
|
|
X
|
|
X
|
|
X
|
|
X
|
|
X
|
|
X
|
The total amount of securities of the registrant or its subsidiaries authorized under any instrument with respect to long-term debt not filed as an exhibit does not exceed 10 percent of the total assets of the registrant and its subsidiaries on a consolidated basis. The registrant agrees, upon request of the SEC, to furnish copies of any or all of such instruments to it.
E-1
TABLE OF CONTENTS
Part IItem 4. Mine Safety DisclosuresPart IIItem 5. Market For Registrant's Common Equity, Related Stockholder Matters and Issuer Purchases Of Equity SecuritiesItem 6. Selected Financial DataItem 7. Management S Discussion and Analysis Of Financial Condition and Results Of OperationsItem 7A. Quantitative and Qualitative Disclosures About Market RiskItem 8. Financial Statements and Supplementary DataItem 9. Changes in and Disagreements with Accountants on Accounting and Financial DisclosureItem 9A. Controls and ProceduresPart IIIItem 10. Directors, Executive Officers and Corporate GovernanceItem 11. Executive CompensationItem 12. Security Ownership Of Certain Beneficial Owners and Management and Related Stockholder MattersItem 13. Certain Relationships and Related Transactions, and Director IndependenceItem 14. Principal Accounting Fees and ServicesPart IVItem 15. Exhibits and Financial Statement Schedules