DXC TECHNOLOGY CO
UNITED STATES
SECURITIES AND EXCHANGE COMMISSION
SECURITIES AND EXCHANGE COMMISSION
WASHINGTON, D.C. 20549
FORM 10-K
|
(Mark One)
|
|
|
x
|
ANNUAL REPORT PURSUANT TO SECTION 13 OR 15(d) OF THE SECURITIES EXCHANGE ACT OF 1934
|
For the fiscal year ended
March 31, 2019
OR
|
o
|
TRANSITION REPORT PURSUANT TO SECTION 13 OR 15(d) OF THE SECURITIES EXCHANGE ACT OF 1934
|
For the transition period from
to
Commission File No.: 1-4850

|
DXC TECHNOLOGY COMPANY
|
|
(Exact name of Registrant as specified in its charter)
|
|
|
Nevada
|
61-1800317
|
|
|
(State of incorporation or organization)
|
(I.R.S. Employer Identification No.)
|
|
|
1775 Tysons Boulevard
|
||
|
Tysons, Virginia
|
22102
|
|
|
(Address of principal executive offices)
|
(zip code)
|
|
|
Registrant's telephone number, including area code:
(703) 245-9675
|
||
|
Securities registered pursuant to Section 12(b) of the Act:
|
||
|
Title of each class
|
Trading Symbol(s)
|
Name of each exchange on which registered
|
|
Common Stock, $0.01 par value per share
|
DXC
|
New York Stock Exchange
|
|
2.750% Senior Notes Due 2025
|
DXC 25
|
New York Stock Exchange
|
|
1.750% Senior Notes Due 2026
|
DXC 26
|
New York Stock Exchange
|
|
Securities registered pursuant to Section 12(g) of the Act:
None
|
||
Indicate by check mark if the registrant is a well-known seasoned issuer, as defined in Rule 405 of the Securities Act.
x
Yes
o
No
Indicate by check mark if the registrant is not required to file reports pursuant to Section 13 or Section 15(d) of the Act.
o
Yes
x
No
Indicate by check mark whether the Registrant (1) has filed all reports required to be filed by Section 13 or 15(d) of the Securities Exchange Act of 1934 during the preceding 12 months (or for such shorter period that the registrant was required to file such reports) and (2) has been subject to such filing requirements for the past 90 days.
x
Yes
o
No
Indicate by check mark whether the registrant has submitted electronically every Interactive Data File required to be submitted pursuant to Rule 405 of Regulation S-T during the preceding 12 months (or for such shorter period that the registrant was required to submit and post such files).
x
Yes
o
No
Indicate by check mark whether the registrant is a large accelerated filer, an accelerated filer, a non-accelerated filer, a smaller reporting company, or an emerging growth company. See the definitions of "large accelerated filer," "accelerated filer," "smaller reporting company," and "emerging growth company" in Rule 12b-2 of the Exchange Act.
|
Large Accelerated Filer
x
|
Accelerated Filer
o
|
|||
|
Non-accelerated Filer
o
|
Smaller reporting company
o
|
|||
|
Emerging growth company
o
|
||||
If an emerging growth company, indicate by check mark if the registrant has elected not to use the extended transition period for complying with any new or revised financial accounting standards provided pursuant to Section 13(a) of the Exchange Act.
o
Indicate by check mark whether the registrant is a shell company (as defined in Rule 12b-2 of the Exchange Act).
o
Yes
x
No
The aggregate market value of the registrant's common stock held by non-affiliates of the registrant on September 28, 2018, the last business day of the registrant's most recently completed second fiscal quarter, based upon the closing price of a share of the registrant’s common stock on that date, was
$26,235,616,834
.
268,597,251
shares of common stock, par value $0.01 per share, were outstanding as of May 10, 2019.
DOCUMENTS INCORPORATED BY REFERENCE
Portions of the registrant's definitive Proxy Statement relating to its 2019 Annual Meeting of Stockholders (the "2019 Proxy Statement"), which will be filed with the Securities and Exchange Commission pursuant to Regulation 14A within 120 days after the registrant's fiscal year end of March 31, 2019, are incorporated by reference into Part III of this Annual Report on Form 10-K where indicated.
TABLE OF CONTENTS
|
Item
|
Page
|
||
|
1.
|
|||
|
1A.
|
|||
|
1B.
|
|||
|
2.
|
|||
|
3.
|
|||
|
4.
|
|||
|
5.
|
|||
|
6.
|
|||
|
7.
|
|||
|
7A.
|
|||
|
8.
|
|||
|
9.
|
|||
|
9A.
|
|||
|
9B.
|
|||
|
10.
|
|||
|
11.
|
|||
|
12.
|
|||
|
13.
|
|||
|
14.
|
|||
|
PART IV
|
|||
|
15.
|
|||
|
16.
|
|||
CAUTIONARY STATEMENT REGARDING FORWARD-LOOKING STATEMENTS
All statements and assumptions contained in this Annual Report on Form 10-K and in the documents incorporated by reference that do not directly and exclusively relate to historical facts constitute “forward-looking statements.” Forward-looking statements often include words such as “anticipates,” “believes,” “estimates,” “expects,” “forecast,” “goal,” “intends,” “objective,” “plans,” “projects,” “strategy,” “target” and “will” and words and terms of similar substance in discussions of future operating or financial performance. These statements represent current expectations and beliefs, and no assurance can be given that the results described in such statements will be achieved.
Forward-looking statements include, among other things, statements with respect to our financial condition, results of operations, cash flows, business strategies, operating efficiencies or synergies, divestitures, competitive position, growth opportunities, share repurchases, dividend payments, plans and objectives of management and other matters. Such statements are subject to numerous assumptions, risks, uncertainties and other factors that could cause actual results to differ materially from those described in such statements, many of which are outside of our control. Important factors that could cause actual results to differ materially from those described in forward-looking statements include, but are not limited to:
|
•
|
the integration of Computer Sciences Corporation's ("CSC") and Enterprise Services business of Hewlett Packard Enterprise Company's ("HPES") businesses, operations, and culture and the ability to operate as effectively and efficiently as expected, and the combined company's ability to successfully manage and integrate acquisitions generally;
|
|
•
|
the ability to realize the synergies and benefits expected to result from the HPES Merger within the anticipated time frame or in the anticipated amounts;
|
|
•
|
other risks related to the HPES Merger including anticipated tax treatment, unforeseen liabilities and future capital expenditures;
|
|
•
|
the U.S. Public Sector business ("USPS") Separation and Mergers (defined below) could result in substantial tax liability to DXC and our stockholders;
|
|
•
|
changes in governmental regulations or the adoption of new laws or regulations that may make it more difficult or expensive to operate our business;
|
|
•
|
changes in senior management, the loss of key employees or the ability to retain and hire key personnel and maintain relationships with key business partners;
|
|
•
|
the risk of liability or damage to our reputation resulting from security breaches or disclosure of sensitive data or failure to comply with data protection laws and regulations;
|
|
•
|
business interruptions in connection with our technology systems;
|
|
•
|
the competitive pressures faced by our business;
|
|
•
|
the effects of macroeconomic and geopolitical trends and events;
|
|
•
|
the need to manage third-party suppliers and the effective distribution and delivery of our products and services;
|
|
•
|
the protection of our intellectual property assets, including intellectual property licensed from third parties;
|
|
•
|
the risks associated with international operations;
|
|
•
|
the development and transition of new products and services and the enhancement of existing products and services to meet customer needs and respond to emerging technological trends;
|
|
•
|
the execution and performance of contracts by us and our suppliers, customers, clients and partners;
|
|
•
|
the resolution of pending investigations, claims and disputes;
|
|
•
|
risks relating to the respective abilities of the parties to the Luxoft Acquisition (defined below) to satisfy the conditions to, and to otherwise consummate, the Luxoft Acquisition and to achieve the expected results therefrom; and
|
|
•
|
the other factors described under Item 1A. “Risk Factors.”
|
No assurance can be given that any goal or plan set forth in any forward-looking statement can or will be achieved, and readers are cautioned not to place undue reliance on such statements which speak only as of the date they are made. Any forward-looking statement made by us in this Annual Report on Form 10-K speaks only as of the date on which this Annual Report on Form 10-K was first filed. We do not undertake any obligation to update or release any revisions to any forward-looking statement or to report any events or circumstances after the date of this report or to reflect the occurrence of unanticipated events, except as required by law.
1
Throughout this report, we refer to DXC Technology Company, together with its consolidated subsidiaries, as “we,” “us,” “our,” “DXC,” or the “Company.” In order to make this report easier to read, we also refer throughout to (i) our Consolidated Financial Statements as our “financial statements,” (ii) our Consolidated Statements of Operations as our “statements of operations,” (iii) our Consolidated Balance Sheets as our “balance sheets” and (iv) our Consolidated Statements of Cash Flows as our “statements of cash flows.” In addition, references throughout to numbered “Notes” refer to the numbered Notes to our Financial Statements that we include in the Financial Statements section of this report.
PART I
ITEM 1. BUSINESS
Overview
As the world's leading independent, end-to-end IT services company, DXC leads digital transformations for clients by modernizing and integrating their mainstream IT, and by deploying digital solutions at scale to produce better business outcomes. The company’s technology independence, global talent, and extensive partner network enable 6,000 private and public-sector clients in 70 countries to thrive on change.
Businesses in today's complex and demanding business environment are increasingly seeking to integrate digital technology into every aspect of their business resulting in fundamental changes to how they operate and deliver value to their customers. DXC designs and deploys new digital solutions – at scale – that integrate with our clients' mainstream IT infrastructure. We work with our clients to solve challenges in ways that maximize opportunity and minimize business risk. Our world-class talent becomes part of our clients’ teams, innovating with them, putting the right technology to work for their organizations and leading them through accelerating change to deliver better business outcomes.
Our business strategy is supported by a framework that focuses on the following three pillars:
|
•
|
Help clients advance their digital transformations by modernizing and simplifying their mainstream IT; which can help fund their digital initiatives;
|
|
•
|
Invest in our people to nurture digital skills and leadership development; and
|
|
•
|
Deliver value by achieving results for our clients and stakeholders.
|
History and Development
DXC, a Nevada corporation, was formed on April 1, 2017, by the merger of CSC and HPES (the "HPES Merger"). See Note
2
- "
Acquisitions
" for more information.
USPS Separation and Mergers
On May 31, 2018, DXC completed the separation of USPS (the "Separation"), and combination with Vencore Holding Corp. ("Vencore") and KeyPoint Government Solutions ("Keypoint") (the "Mergers") to form Perspecta Inc. ("Perspecta"), an independent public company (collectively, the "USPS Separation and Mergers"). Under the terms of the separation agreements, on May 31, 2018, stockholders who held DXC common stock at the close of business on May 25, 2018 (the “Record Date”), received a distribution of one share of Perspecta common stock for every two shares of DXC common stock held as of the Record Date (the "Distribution"). See Note 3 - "Divestitures" for more information.
2
Acquisitions and Divestitures
In addition to the USPS Separation, during the fiscal year ended March 31, 2019 ("fiscal 2019"), we completed the acquisition of Molina Medicaid Solutions ("MMS"), a Medicaid Management Information Systems business, from Molina Healthcare, Inc. The combination of MMS with DXC expanded our ability to provide services to state agencies in the administration of Medicaid programs, including business processing, information technology development and administrative services. We also completed other acquisitions during fiscal 2019 to complement our Microsoft Dynamics and ServiceNow offerings and to provide opportunities for future growth. See Note
2
- "
Acquisitions
" for more information.
On January 7, 2019, DXC and Luxoft Holding, Inc ("Luxoft") announced a definitive agreement for DXC to acquire Luxoft, a global-scale digital innovator providing digital strategy consulting and engineering services for companies across North America, Europe and the Asia Pacific region (the "Luxoft Acquisition"). Pursuant to the agreement between DXC and Luxoft, all of the issued and outstanding Luxoft Class A and Class B ordinary shares will receive $59.00 per share in cash, representing a total equity value of approximately $2 billion. The transaction is anticipated to close by June 2019, subject to regulatory and other approvals. Such approvals include the termination or expiration of the relevant waiting period under, and the approvals required to be obtained in connection with or in compliance with, (i) the Hart-Scott-Rodino Antitrust Improvements Act of 1976, as amended, which was satisfied on January 31, 2019; (ii) the European Union Merger Regulation, which was satisfied on March 25, 2019; and (iii) Russia merger control regulations, which was satisfied on June 11, 2019.
Segments and Services
As a result of the Separation, USPS is no longer included as a reportable segment. Our reportable segments are Global Business Services ("GBS") and Global Infrastructure Services ("GIS").
Global Business Services
GBS provides innovative technology solutions that help our clients address key business challenges and accelerate digital transformations tailored to each client’s industry and specific objectives. GBS offerings include:
|
•
|
Enterprise, Cloud Applications and Consulting.
We provide industry, business process systems integration and technical delivery experience to maximize value from enterprise application portfolios. We also help clients accelerate their digital transformations and business results with industry, business, technology and complex integration services.
|
|
•
|
Application Services.
Our comprehensive services help clients modernize, develop, test and manage their applications.
|
|
•
|
Analytics.
Our portfolio of analytics services and robust partner ecosystem helps clients gain rapid insights and accelerate their digital transformation journeys.
|
|
•
|
Business Process Services.
We provide seamless digital integration and optimization of front and back office processes, including our Agile Process Automation approach.
|
|
•
|
Industry Software and Solutions.
Our industry-specific solutions enable businesses to quickly integrate technology, transform their operations and develop new ways of doing business. Our vertical-specific IP includes insurance, healthcare and life sciences, travel and transportation, and banking and capital markets solutions.
|
Global Infrastructure Services
GIS provides a portfolio of offerings that deliver predictable outcomes and measurable results, while reducing business risk and operational costs for clients. GIS offerings include:
|
•
|
Cloud and Platform Services.
We help clients maximize their private cloud, public cloud and legacy infrastructures, as well as securely manage their hybrid environments.
|
|
•
|
Workplace and Mobility
. Our workplace, mobility and Internet of Things ("IoT") services provide a consumer-like experience with enterprise security and instant connectivity for our clients.
|
|
•
|
Security.
Our security solutions help predict attacks, proactively respond to threats, ensure compliance and protect data, applications, infrastructure and endpoints.
|
See Note
18
- "
Segment and Geographic Information
" for additional information related to our reportable segments, including the disclosure of segment revenues, segment profit and financial information by geographic area.
3
Sales and Marketing
We market and sell our services directly to clients through our direct sales force, operating out of sales offices around the world. Our clients include commercial businesses of many sizes and in many industries and public sector enterprises. No individual customer exceeded 10% of our consolidated revenues for fiscal 2019, 2018 or 2017.
Seasonality
General economic conditions have an impact on our business and financial results. The markets in which we sell our products, services and solutions occasionally experience weak economic conditions that may negatively affect sales. We also experience some seasonal trends in the sale of our services. For example, contract awards are often tied to the timing of our clients' fiscal year-ends, and we also experience seasonality related to our own fiscal year-end selling activities.
Competition
The IT and professional services markets in which we compete are highly competitive and are not dominated by a single company or a small number of companies. A substantial number of companies offer services that overlap and are competitive with those we offer. In addition, the increased importance of offshore labor centers has brought several foreign-based firms into competition with us.
Our competitors include:
|
•
|
large multinational enterprises that offer some or all of the services and solutions that we do;
|
|
•
|
smaller companies that offer focused services and solutions similar to those that we offer;
|
|
•
|
offshore service providers in lower-cost locations, particularly in India, that sell directly to end-users;
|
|
•
|
solution or service providers that compete with us in a specific industry segment or service area; and
|
|
•
|
in-house functions of corporations that use their own resources, rather than engage an outside IT services provider.
|
The principal methods of competition in the markets for our solutions and services include:
|
•
|
vision and strategic advisory ability;
|
|
•
|
digital services capabilities;
|
|
•
|
performance and reliability;
|
|
•
|
responsiveness to client needs;
|
|
•
|
competitive pricing of services;
|
|
•
|
technical and industry expertise;
|
|
•
|
reputation and experience;
|
|
•
|
quality of solutions and services; and
|
|
•
|
financial stability and strong corporate governance.
|
Our ability to obtain new business and retain existing business is dependent upon the following:
|
•
|
technology, industry and systems know-how with an independent perspective on the best client solutions across software, hardware, and service providers;
|
|
•
|
ability to offer improved strategic frameworks and technical solutions;
|
|
•
|
investments in our digital services and solutions;
|
|
•
|
focus on responsiveness to customer needs, quality of services and competitive prices;
|
|
•
|
successful management of our relationships with leading strategic and solution partners in hardware, networking, cloud, applications and software;
|
|
•
|
project management experience and capabilities;
|
|
•
|
end-to-end spectrum of IT and professional services we provide; and
|
|
•
|
financial stability and strong corporate governance.
|
4
Intellectual Property
We rely on a combination of trade secrets, patents, copyrights, and trademarks, as well as contractual protections, to protect our business interests. While our technical services and products are not generally dependent upon patent protection, we do selectively seek patent protection for certain inventions likely to be incorporated into products and services or where obtaining such proprietary rights will improve our competitive position.
As our patent portfolio has been built over time, the remaining terms of the individual patents across the patent portfolio vary. We believe that our patents and patent applications are important for maintaining the competitive differentiation of our solutions and services and enhancing our freedom of action to sell solutions and services in markets in which we choose to participate. No single patent is in itself essential to our company as a whole or to any business segment.
Additionally, we own or have rights to various trademarks, logos, service marks, and trade names that are used in the operation of our business. We also own or have the rights to copyrights that protect the content of our products and other proprietary materials.
In addition to developing our intellectual property portfolio, we license intellectual property rights from third parties as we deem appropriate. We have also granted and plan to continue to grant to others licenses under our intellectual property rights when we consider these arrangements to be in our interest. These license arrangements include a number of cross-licenses with third parties.
Environmental Regulation
Our operations are subject to regulation under various federal, state, local, and foreign laws concerning the environment, including laws addressing the discharge of pollutants into the air and water, the management and disposal of hazardous substances and wastes and the clean-up of contaminated sites. Environmental costs and accruals are presently not material to our operations, cash flows or financial position, and we do not currently anticipate material capital expenditures for environmental control facilities. However, we could incur substantial costs, including clean-up costs, fines and civil or criminal sanctions and third-party damage or personal injury claims, if we were to violate or become liable under environmental laws, or if new environmental legislation is passed which impacts our business.
Employees
As of
March 31, 2019
, we employed approximately
130,000
employees and had offices and operations in
70
countries.
Available Information
We use our corporate website,
www.dxc.technology
, as a routine channel for distribution of important information, including detailed company information, financial news, SEC filings, Annual Reports, historical stock information and links to a recent earnings call webcast. DXC’s Annual Reports on Form 10-K, Quarterly Reports on Form 10-Q, Current Reports on Form 8-K, all amendments to those reports, and the Proxy Statements for our Annual Meetings of Stockholders are made available, free of charge, on our corporate website as soon as reasonably practicable after such reports have been filed with or furnished to the SEC. They are also available through the SEC at
www.sec.gov/edgar/searchedgar/companysearch.html.
Our corporate governance guidelines, Board of Directors' committee charters (including the charters of the Audit Committee, Compensation Committee and Nominating/Corporate Governance Committee) and code of ethics entitled "Code of Business Conduct" are also available on our website. The information on our website is not incorporated by reference into, and is not a part of, this report.
5
Information About Our Executive Officers
|
Name
|
Age
|
Year First Elected as Officer
|
Term as an Officer
|
Position Held With the Registrant as of the filing date
|
Family Relationship
|
|||||
|
J. Michael Lawrie
|
65
|
2017
|
Indefinite
|
Chairman, President and Chief Executive Officer
|
None
|
|||||
|
Paul N. Saleh
|
62
|
2017
|
Indefinite
|
Executive Vice President and Chief Financial Officer
|
None
|
|||||
|
William L. Deckelman, Jr.
|
61
|
2017
|
Indefinite
|
Executive Vice President, General Counsel and Secretary
|
None
|
|||||
|
Joanne Mason
|
51
|
2017
|
Indefinite
|
Executive Vice President and Chief Human Resources Officer
|
None
|
|||||
|
Edward Ho
|
56
|
2018
|
Indefinite
|
Executive Vice President and General Manager, Offerings
|
None
|
|||||
|
James R. Smith
|
51
|
2017
|
Indefinite
|
Executive Vice President, Digital Transformation and Customer Advocacy
|
None
|
|||||
|
Neil A. Manna
|
56
|
2017
|
Indefinite
|
Senior Vice President, Corporate Controller and
Principal Accounting Officer
|
None
|
|||||
Business Experience of Executive Officers
J. Michael Lawrie
has served as Chairman, President and Chief Executive Officer of DXC and as a member of the Board of Directors of DXC since the completion of the HPES Merger. Mr. Lawrie previously served as Chairman, President and Chief Executive Officer of CSC. Mr. Lawrie joined CSC as President and Chief Executive Officer on March 19, 2012, and as a member of its Board of Directors in February 2012. On December 15, 2015, Mr. Lawrie was appointed chairman of the CSC Board of Directors. Prior to joining CSC, he served as the Chief Executive Officer of U.K.-based Misys plc, a leading global IT solutions provider to the financial services industry, from November 2006 to March 2012. Mr. Lawrie also served as the Executive Chairman of Allscripts-Misys Healthcare Solutions, Inc., from October 2008 to August 2010. From 2005 to 2006, Mr. Lawrie was a general partner with ValueAct Capital, a San Francisco-based private investment firm. He also served as Chief Executive Officer of Siebel Systems, Inc., an international software and solutions company, from 2004 to 2005. Mr. Lawrie also spent 27 years with IBM where he rose to Senior Vice President and Group Executive, responsible for sales and distribution of all IBM products and services worldwide. From 1998 to 2001, Mr. Lawrie was General Manager for IBM’s business in Europe, the Middle East and Africa, which included operations in 124 countries and 90,000 employees. Prior to that, Mr. Lawrie served as General Manager of Industries for IBM’s business operations in Asia Pacific, based in Tokyo. Mr. Lawrie is a Trustee of Drexel University, Philadelphia and chairman of the board of directors of Perspecta. We believe Mr. Lawrie’s knowledge and extensive experience in the IT solutions industry and many years of experience as the Chief Executive Officer of DXC and CSC make him well-qualified to serve as a member of our board of directors.
Paul N. Saleh
has served as Executive Vice President and Chief Financial Officer of DXC since the completion of the HPES Merger. Mr. Saleh previously served as Executive Vice President and Chief Financial Officer of CSC. Mr. Saleh joined CSC as Vice President and Chief Financial Officer on May 23, 2012. Prior to joining CSC, Mr. Saleh served as the Chief Financial Officer of Gannett Co. from 2010 to 2012. Prior to his tenure at Gannett Co., from 2008 to 2010, Mr. Saleh was a Managing Partner at Menza Partners, an operational and financial advisory group focusing on media, telecommunications and technology industries. Prior to that, he served as Chief Financial Officer of Sprint Nextel Communications from 2001 to 2007 and as Interim Chief Executive Officer of Sprint Nextel until 2008. He served as Senior Vice President and Chief Financial Officer of Walt Disney International where he also held various other senior positions from 1997 to 2001. Mr. Saleh serves as a Director of Perspecta.
William L. Deckelman, Jr.
has served as Executive Vice President, General Counsel and Secretary of DXC since the completion of the HPES Merger. Mr. Deckelman previously served as Executive Vice President and General Counsel of CSC. Mr. Deckelman joined CSC in January 2008 and served as Vice President, General Counsel and Secretary from 2008 to 2012, and as Executive Vice President and General Counsel from 2012 to August 2014. Prior to joining CSC, Mr. Deckelman served as Executive Vice President and General Counsel of Affiliated Computer Services Inc. from 2000 to 2008, and served as a director from 2000 to 2003, holding various executive positions there since 1989.
6
Joanne Mason
has served as Executive Vice President and Chief Human Resources Officer of DXC since the completion of the HPES Merger. Ms. Mason served as Chief Human Resource Officer and Vice President of CSC since March 2015. Ms. Mason joined CSC in March 2012 as Chief of Staff and Head of Change Management and Execution Office. Prior to joining CSC, from October 2006 to March 2012, Ms. Mason served as Chief of Staff and Operation Director at Misys plc. Ms. Mason previously served in various management roles at Zouk Capital from 2004 to 2006, Lendlease Group from 2002 to 2004 and Energis Communications Ltd. from 1999 to 2002.
Edward Ho
joined DXC on January 2018 and serves as Executive Vice President and General Manager, Offerings. Mr. Ho previously served as the President of Global Payment Solutions of D+H Corporation, a publicly traded, leading, global financial technology company, from April 2015 to November 2017, where he was responsible for leadership of its digital, global transaction banking business. From January 2013 to April 2015, Mr. Ho served as the President and Chief Operating Officer of Fundtech Corporation, a private equity owned, leading provider of digital payments banking software and services, where he was responsible of sales, marketing, product management, development, professional services, customer support and certain general and administrative functions. Prior to his role at Fundtech, he served for 9 years as Executive Vice President and General Manager of the capital markets division at Misys plc, a provider of banking, treasury, trading and risk management software solutions. Previously, he had been Chief Executive Officer and President of IQ Financial Systems, a developer and marketer of commercial lending and risk management software systems. Mr. Ho also spent 15 years as a banker with Bank of America, Bankers Trust and Deutsche Bank.
James R. Smith
serves as Executive Vice President, Digital Transformation and Customer Advocacy of DXC. Mr. Smith previously served as CSC's Executive Vice President and General Manager for GBS since he joined in August 2013. Prior to joining CSC, Mr. Smith served as Chief Executive Officer of Motricity, a provider of cloud-based mobile enterprise and analytics solutions from 2009 to 2012. Under his direction, Motricity had a successful initial public offering on NASDAQ after completing a business model transformation and global expansion. Mr. Smith held various executive leadership positions at Avaya from 2001 to 2008 where he helped drive a 10-fold increase in the company’s market capitalization and reinvented a global software platform. Prior to that, he was an Associate Partner at Accenture.
Neil A. Manna
has served as Senior Vice President, Corporate Controller and Principal Accounting Officer of DXC since the completion of the HPES Merger. Mr. Manna previously served as Principal Accounting Officer, Vice President and Controller of CSC. Mr. Manna joined CSC on June 7, 2016. Prior to joining CSC, he served as the Chief Accounting Officer and Senior Vice President of CA, Inc. from December 2008 to June 3, 2016. He served as Principal Accounting Officer and Vice President of Worldwide Accounting for RealNetworks, Inc. from July 2007 to November 2008. He served as the Chief Financial Officer of TimePlus Systems, LLC (formerly TimePlus, Inc.) from November 2005 to April 2007. From February 2000 to October 2005, he served as a Director of Finance for the Payroll Division of Intuit and Controller of Employee Matters, Inc. From July 1990 to February 2000 he served as the Principal Accounting Officer, Vice President of Finance, Controller and Treasurer of CHI Energy, Inc. He is a Certified Public Accountant and holds a Bachelor’s degree in Accounting and a Master’s degree in Business Administration.
7
|
Item 1A.
|
RISK FACTORS
|
Any of the following risks could materially and adversely affect our business, financial condition, and results of operations, and the actual outcome of matters as to which forward-looking statements are made in this Annual Report. In such case, the trading price for DXC common stock could decline, and you could lose all or part of your investment. The risks described below are not the only risks that DXC currently faces. Additional risks and uncertainties not currently known or that are currently expected to be immaterial may also materially and adversely affect our business, financial condition, and results of operations or the price of our common stock in the future. Past financial performance may not be a reliable indicator of future performance, and historical trends should not be used to anticipate results or trends in future periods.
Risks Relating to Our Business
Achieving our growth objectives may prove unsuccessful. We may be unable to identify future attractive acquisitions and strategic partnerships, which may adversely affect our growth. In addition, if we are unable to integrate acquisitions and implement strategic partnerships or achieve anticipated revenue improvements and cost reductions, our profitability may be materially and adversely affected.
We may fail to complete strategic transactions. Closing strategic transactions is subject to uncertainties and risks, including the risk that we will be unable to satisfy conditions to closing, such as regulatory and financing conditions and the absence of material adverse changes to our business. In addition, our inability to successfully integrate the operations we acquire and leverage these operations to generate substantial cost savings, as well as our inability to avoid revenue erosion and earnings decline, could have a material adverse effect on our results of operations, cash flows and financial position. In order to achieve successful acquisitions, we will need to:
|
•
|
successfully integrate the operations, as well as the accounting, financial controls, management information, technology, human resources and other administrative systems, of acquired businesses with existing operations and systems;
|
|
•
|
maintain third-party relationships previously established by acquired companies;
|
|
•
|
attract and retain senior management and other key personnel at acquired businesses; and
|
|
•
|
successfully manage new business lines, as well as acquisition-related workload.
|
We may not be successful in meeting these challenges or any others encountered in connection with historical and future acquisitions. In addition, the anticipated benefits of one or more acquisitions may not be realized and future acquisitions could require dilutive issuances of equity securities and/or the assumption of contingent liabilities. The occurrence of any of these events could adversely affect our business, financial condition and results of operations.
We have also entered into and intend to identify and enter into additional strategic partnerships with other industry participants that will allow us to expand our business. However, we may be unable to identify attractive strategic partnership candidates or complete these partnerships on terms favorable to us. In addition, if we are unable to successfully implement our partnership strategies or our strategic partners do not fulfill their obligations or otherwise prove disadvantageous to our business, our investments in these partnerships and our anticipated business expansion could be adversely affected.
8
Our ability to continue to develop and expand our service offerings to address emerging business demands and technological trends, including the demand for digital technologies and services, may impact our future growth. If we are not successful in meeting these business challenges, our results of operations and cash flows may be materially and adversely affected.
Our ability to implement solutions for our customers, incorporating new developments and improvements in technology that translate into productivity improvements for our customers, and our ability to develop digital and other new service offerings that meet current and prospective customers' needs, as well as evolving industry standards, are critical to our success. The markets we serve are highly competitive and characterized by rapid technological change
which has resulted in deflationary pressure in the price of services which in turn can adversely impact our margins.
Our competitors may develop solutions or services that make our offerings obsolete
or may force us to decrease prices on our services which can result in lower margins.
Our ability to develop and implement up to date solutions utilizing new technologies that meet evolving customer needs in digital cloud, information technology outsourcing, consulting, industry software and solutions, application services markets
, and in areas such as artificial intelligence, automation, Internet of Things and as-a-service solutions,
in a timely or cost-effective manner, will impact our ability to retain and attract customers and our future revenue growth and earnings.
If we are unable to continue to
develop
digital and other new service offerings in a highly competitive and rapidly evolving environment or if we are unable to commercialize such services and solutions, expand and scale them with sufficient speed and versatility, our growth, productivity objectives and profit margins could be negatively affected.
Technological developments may materially affect the cost and use of technology by our customers. Some of these technologies have reduced and replaced some of our traditional services and solutions and may continue to do so in the future. This has caused, and may in the future cause, customers to delay spending under existing contracts and engagements and to delay entering into new contracts while they evaluate new technologies. Such delays can negatively impact our results of operations if the pace and level of spending on new technologies is not sufficient to make up any
shortfall
. Our growth strategy focuses on responding to these types of developments by driving innovation that will enable us to expand our business into new growth areas. If we do not sufficiently invest in new technology and adapt to industry developments, or evolve and expand our business at sufficient speed and scale, or if we do not make the right strategic investments to respond to these developments and successfully drive innovation, our services and solutions, our results of operations, and our ability to develop and maintain a competitive advantage and to execute on our growth strategy could be negatively affected.
Our ability to compete in certain markets we serve is dependent on our ability to continue to expand our capacity in certain offshore locations. However, as our presence in these locations increases, we are exposed to risks inherent to these locations which may adversely affect our revenue and profitability.
A significant portion of our application outsourcing and software development activities has been shifted to India and we plan to continue to expand our presence there and in other lower cost locations. As a result, we are exposed to the risks inherent in operating in India or other locations including (1) a highly competitive labor market for skilled workers which may result in significant increases in labor costs, as well as shortages of qualified workers in the future and (2) the possibility that the U.S. Federal Government or the European Union may enact legislation that creates significant disincentives for customers to locate certain of their operations offshore, which would reduce the demand for the services we provide in such locations and may adversely impact our cost structure and profitability. In addition, India has experienced, and other countries may experience, political instability, civil unrest and hostilities with neighboring countries. Negative or uncertain political climates in countries or locations where we operate, including but not limited to military activity or civil hostilities, criminal activities and other acts of violence, infrastructure disruption, natural disasters or other conditions could adversely affect our operations.
We are subject to the U.S. Foreign Corrupt Practices Act of 1977, as amended ("FCPA") and similar anti-bribery laws in other jurisdictions. We pursue opportunities in certain parts of the world that experience government corruption and in certain circumstances, compliance with anti-bribery laws may conflict with local customs and practices. Our internal policies mandate compliance with all applicable anti-bribery laws. We require our employees, partners, subcontractors, agents, and others to comply with the FCPA and other anti-bribery laws. There is no assurance that our policies or procedures will protect us against liability under the FCPA or other laws for actions taken by our employees and intermediaries. If we are found to be liable for FCPA violations (either due
9
to our own acts or our omissions, or due to the acts or omissions of others), we could suffer from severe criminal or civil penalties or other sanctions, which could have a material adverse effect on our reputation, business, results of operations or cash flows. In addition, detecting, investigating and resolving actual or alleged violations of the FCPA or other anti-bribery violations is expensive and could consume significant time and attention of our senior management.
We could be held liable for damages, our reputation could suffer or we may experience service interruptions from security breaches, cyber attacks or disclosure of confidential information or personal data, which could cause significant financial loss.
As a provider of IT services to private and public sector customers operating in a number of regulated industries and countries, we store and process increasingly large amounts of data for our clients, including sensitive and personally identifiable information. We also manage IT infrastructure of our own and of clients. We possess valuable proprietary information, including copyrights, trade secrets and other intellectual property and, we collect and store certain personal and financial information from customers and employees.
At the same time, the continued occurrence of high-profile data breaches and cyber-attacks, including by state actors, reflects an external environment that is increasingly hostile to information and corporate security. Cybersecurity incidents can result from unintentional events or deliberate attacks by insiders or third parties, including criminals, competitors, nation-states, and hacktivists. Like other companies, we face an evolving array of cybersecurity and data security threats that pose risks to us and our clients. We can also be harmed by attacks on third parties, such as denial-of-service attacks. We see regular unauthorized efforts to access our systems, which we evaluate for severity and frequency. While incidents experienced thus far have not resulted in significant disruption to our business, it is possible that we could suffer a severe attack or incident, with potentially material and adverse effects on our business, reputation, customer relations, results of operations or financial condition.
We must expend capital and other resources to protect against attempted security breaches and cyber-attacks and to alleviate problems caused by successful breaches or attacks. We consider information security to be a top priority and are undertaking cybersecurity planning and activities throughout the company. This includes the acquisition of technology and services, review and refinement of cybersecurity and data security policies and procedures and employee training, among many other investments. Senior management and the Board of Directors are appropriately and actively engaged in cybersecurity risk management.
Our security measures are designed to identify and protect against security breaches and cyber-attacks; no threat incident identified to date has resulted in a material adverse effect on us or our customers. However, there is no perfect security system, and our failure to detect, prevent or adequately respond to a future threat incident could subject us to liability and reputational damage, and have a material adverse effect on our business. In addition, the cost and operational consequences of responding to breaches and cyber-attacks and implementing remediation measures could be significant.
We rely on internal and external information and technological systems to manage our operations and are exposed to risk of loss resulting from breaches in the security or other failures of these systems. Security breaches such as through an advanced persistent threat attack, or the accidental loss, inadvertent disclosure or unapproved dissemination of proprietary information or sensitive or confidential data about us, our clients or our customers, could expose us to risk of loss of this information, regulatory scrutiny, actions and penalties, extensive contractual liability and other litigation, reputational harm, and a loss of customer confidence which could potentially have an adverse impact on future business with current and potential customers.
Advances in computer capabilities, new discoveries in the field of cryptography or other events or developments may result in a compromise or breach of the algorithms that we use to protect our data and that of clients, including sensitive customer transaction data. A party who is able to circumvent our security measures or those of our contractors, partners or vendors could access our systems and misappropriate proprietary information, the confidential data of our customers, employees or business partners or cause interruption in our or their operations.
10
Experienced computer programmers and hackers may be able to penetrate our network security and misappropriate or compromise our confidential information or that of third parties, create system disruptions or cause shutdowns. Computer programmers and hackers also may be able to develop and deploy ransomware, malware and other malicious software programs through phishing and other methods that attack our products or otherwise exploit any security vulnerabilities of these products. In addition, sophisticated hardware and operating system software and applications produced or procured from third parties may contain defects in design or manufacture, including “bugs” and other problems that could unexpectedly interfere with the security and operation of our systems, or harm those of third parties with whom we may interact. The costs to eliminate or alleviate cyber or other security problems, including ransomware, malware, bugs, malicious software programs and other security vulnerabilities, could be significant, and our efforts to address these problems may not be successful and could result in interruptions, delays, cessation of service and loss of existing or potential customers, which may impede our sales, distribution or other critical functions.
Increasing cybersecurity, data privacy and information security obligations around the world could also impose additional regulatory pressures on our customers’ businesses and, indirectly, on our operations, or lead to inquiries or enforcement actions. In the United States, we are seeing increasing obligations and expectations from federal and non-federal customers. In response, some of our customers have sought and may continue to seek, to contractually impose certain strict data privacy and information security obligations on us. Some of our customer contracts may not limit our liability for the loss of confidential information. If we are unable to adequately address these concerns, our business and results of operations could suffer.
Compliance with new privacy and security laws, requirements and regulations, such as the European Union General Data Protection Regulation, which became effective in May 2018, where required or undertaken by us, may result in cost increases due to expanded compliance obligations, potential systems changes, the development of additional administrative processes and increased enforcement actions, fines and penalties. While we strive to comply with all applicable data protection laws and regulations, as well as internal privacy policies, any failure or perceived failure to comply or any misappropriation, loss or other unauthorized disclosure of sensitive or confidential information may result in proceedings or actions against us by government or other entities, private lawsuits against us (including class actions) or the loss of customers, which could potentially have an adverse effect on our business, reputation and results of operations.
Portions of our infrastructure also may experience interruptions, delays or cessations of service or produce errors in connection with systems integration or migration work that takes place from time to time. We may not be successful in implementing new systems and transitioning data, which could cause business disruptions and be expensive, time-consuming, disruptive and resource intensive. Such disruptions could adversely impact our ability to fulfill orders and respond to customer requests and interrupt other processes. Delayed sales, lower margins or lost customers resulting from these disruptions could reduce our revenues, increase our expenses, damage our reputation, and adversely affect our stock price.
Our ability to raise additional capital for future needs may impact our ability to compete.
We currently maintain investment grade credit ratings with Moody's Investors Service, Fitch Rating Services, and
Standard & Poor's Ratings Services. Our credit ratings are based upon information furnished by us or obtained by a rating agency from its own sources and are subject to revision, suspension or withdrawal by one or more rating agencies at any time. Rating agencies may review the ratings assigned to us due to developments that are beyond our control, including potential new standards requiring the agencies to reassess rating practices and methodologies. If changes in our credit ratings were to occur, it could result in higher interest costs under certain of our credit facilities. It would also cause our future borrowing costs to increase and limit our access to capital markets. Any downgrades could negatively impact the perception of our company by lenders and other third parties. In addition, certain of our major contracts provide customers with a right of termination in certain circumstances in the event of a rating downgrade below investment grade.
Information regarding our credit ratings is included in Part II, Item 7 of this Annual Report on Form 10-K under the caption "Liquidity and Capital Resources."
11
We have a substantial amount of indebtedness, which could have a material adverse effect on our business, financial condition and results of operations.
We have a significant amount of indebtedness totaling approximately
$7.4 billion
as of
March 31, 2019
(including capital lease obligations). We may incur substantial additional indebtedness in the future for many reasons, including to fund acquisitions. Our existing indebtedness, together with the incurrence of additional indebtedness and the restrictive covenants contained in, or expected to be contained in the documents evidencing such indebtedness, may, among other things:
|
•
|
require the use of a substantial portion of our cash flow from operations to make debt service payments;
|
|
•
|
limit the ability to obtain additional financing for working capital, capital expenditures, investments,
|
acquisitions or other general business purposes;
|
•
|
cause events of default if we fail to comply with the financial and other covenants contained in the
|
agreements governing our debt instruments, which could require us to negotiate a waiver or could
cause us to incur additional fees and expenses;
|
•
|
subject us to the risk of increased sensitivity to interest rate increases in our outstanding variable-rate
|
indebtedness and could cause our debt service obligations to increase significantly;
|
•
|
increase the risk of a future credit ratings downgrade of our debt, which could increase future debt costs
|
and limit the future availability for debt financing; and
|
•
|
place us at a competitive disadvantage compared to less leveraged competitors.
|
In addition, we could be unable to refinance our outstanding indebtedness on reasonable terms or at all.
A substantial portion of our borrowing capacity bears interest at a variable rate based on the London Interbank Offered Rate ("LIBOR"). In July 2017, the United Kingdom’s Financial Conduct Authority (“FCA”), which regulates LIBOR, announced that it intends to phase out LIBOR by the end of 2021. The U.S. Federal Reserve, in conjunction with the Alternative Reference Rates Committee, a steering committee comprised of large U.S. financial institutions, is considering replacing LIBOR with the Secured Overnight Financing Rate ("SOFR"), a new index calculated by short-term repurchase agreements, backed by Treasury securities.
Certain of our financing agreements include language to determine a replacement rate for LIBOR, if necessary. However, if LIBOR ceases to exist, we may need to renegotiate some financing agreements extending beyond 2021 that utilize LIBOR as a factor in determining the interest rate. We are evaluating the potential impact of the eventual replacement of the LIBOR benchmark interest rate, however, we are not able to predict whether LIBOR will cease to be available after 2021, whether SOFR will become a widely accepted benchmark in place of LIBOR, or what the impact of such a possible transition to SOFR may be on our business, financial condition, and results of operations.
12
Our primary markets are highly competitive. If we are unable to compete in these highly competitive markets, our results of operations may be materially and adversely affected.
Our competitors include large, technically competent and well capitalized companies, some of which have emerged as a result of industry consolidation, as well as “pure-play” companies that have a single product focus. This competition may place downward pressure on operating margins in our industry, particularly for technology outsourcing contract extensions or renewals. As a result, we may not be able to maintain our current operating margins, or achieve favorable operating margins, for technology outsourcing contracts extended or renewed in the future. If we fail to effectively reduce our cost structure during periods with declining margins, our results of operations may be adversely affected.
We encounter aggressive competition from numerous and varied competitors. Our competitiveness is based on factors including technology, innovation, performance, price, quality, reliability, brand, reputation, range of products and services, account relationships, customer training, service and support and security. If we are unable to compete based on such factors, our results of operations and business prospects could be harmed. We have a large portfolio of services and we need to allocate financial, personnel and other resources across all services while competing with companies that have smaller portfolios or specialize in one or more of our service lines. As a result, we may invest less in certain business areas than our competitors do, and competitors may have greater financial, technical and marketing resources available to them compared to the resources allocated to our services. Industry consolidation may also affect competition by creating larger, more homogeneous and potentially stronger competitors in the markets in which we operate. Additionally, competitors may affect our business by entering into exclusive arrangements with existing or potential customers or suppliers.
Companies with whom we have alliances in certain areas may be or become competitors in other areas. In addition, companies with whom we have alliances also may acquire or form alliances with competitors, which could reduce their business with us. If we are unable to effectively manage these complicated relationships with alliance partners, our business and results of operations could be adversely affected.
We face aggressive price competition and may have to lower prices to stay competitive, while simultaneously seeking to maintain or improve revenue and gross margin. In addition, competitors who have a greater presence in some of the lower-cost markets in which we compete, or who can obtain better pricing, more favorable contractual terms and conditions, may be able to offer lower prices than we are able to offer. Our cash flows, results of operations and financial condition may be adversely affected by these and other industry-wide pricing pressures.
If we are unable to accurately estimate the cost of services and the timeline for completion of contracts, the profitability of our contracts may be materially and adversely affected.
Our commercial contracts are typically awarded on a competitive basis. Our bids are based upon, among other items, the expected cost to provide the services. We generally provide services under time and materials contracts, unit price contracts, fixed-price contracts, and multiple-element software sales. We are dependent on our internal forecasts and predictions about our projects and the marketplace and, to generate an acceptable return on our investment in these contracts, we must be able to accurately estimate our costs to provide the services required by the contract and to complete the contracts in a timely manner. We face a number of risks when pricing our contracts, as many of our projects entail the coordination of operations and workforces in multiple locations and utilizing workforces with different skill sets and competencies across geographically diverse service locations. In addition, revenues from some of our contracts are recognized using the percentage-of-completion method, which requires estimates of total costs at completion, fees earned on the contract, or both. This estimation process, particularly due to the technical nature of the services being performed and the long-term nature of certain contracts, is complex and involves significant judgment. Adjustments to original estimates are often required as work progresses, experience is gained, and additional information becomes known, even though the scope of the work required under the contract may not change. If we fail to accurately estimate our costs or the time required to complete a contract, the profitability of our contracts may be materially and adversely affected.
13
Some IT outsourcing services agreements contain pricing provisions that permit a client to request a benchmark study by a mutually acceptable third party. The benchmarking process typically compares the contractual price of services against the price of similar services offered by other specified providers in a peer comparison group, subject to agreedupon adjustment, and normalization factors. Generally, if the benchmarking study shows that the pricing differs from the peer group outside a specified range, and the difference is not due to the unique requirements of the client, then the parties will negotiate in good faith appropriate adjustments to the pricing. This may result in the reduction of rates for the benchmarked services performed after the implementation of those pricing adjustments, which could harm the financial performance of our services business.
Some IT service agreements require significant investment in the early stages that is expected to be recovered through billings over the life of the agreement. These agreements often involve the construction of new IT systems and communications networks and the development and deployment of new technologies. Substantial performance risk exists in each agreement with these characteristics, and some or all elements of service delivery under these agreements are dependent upon successful completion of the development, construction, and deployment phases. Failure to perform satisfactorily under these agreements may expose us to legal liability, result in the loss of customers or harm our reputation, which could harm the financial performance of our IT services business.
Performance under contracts, including those on which we have partnered with third parties, may be adversely affected if we or the third parties fail to deliver on commitments or if we incur legal liability in connection with providing our services and solutions.
Our contracts are complex and, in some instances, may require that we partner with other parties, including software and hardware vendors, to provide the complex solutions required by our customers. Our ability to deliver the solutions and provide the services required by our customers is dependent on our and our partners' ability to meet our customers' delivery schedules. If we or our partners fail to deliver services or products on time, our ability to complete the contract may be adversely affected. Additionally, our customers may perform audits or require us to perform audits and provide audit reports with respect to the controls and procedures that we use in the performance of services for such customers. Our ability to acquire new customers and retain existing customers may be adversely affected and our reputation could be harmed if we receive a qualified opinion, or if we cannot obtain an unqualified opinion in a timely manner, with respect to our controls and procedures in connection with any such audit. We could also incur liability if our controls and procedures, or the controls and procedures we manage for a customer, were to result in an internal control failure or impair our customer’s ability to comply with its own internal control requirements. If we or our partners fail to meet our contractual obligations or otherwise breach obligations to our customers, we could be subject to legal liability, which may have a material and adverse impact on our revenues and profitability.
Our ability to provide customers with competitive services is dependent on our ability to attract and retain qualified personnel.
Our ability to grow and provide our customers with competitive services is partially dependent on our ability to attract and retain highly motivated people with the skills necessary to serve our customers. The markets we serve are highly competitive and competition for skilled employees in the technology outsourcing, consulting, and systems integration and enterprise services markets is intense for both onshore and offshore locales. The loss of personnel could impair our ability to perform under certain contracts, which could have a material adverse effect on our consolidated financial position, results of operations and cash flows.
We also must manage leadership development and succession planning throughout our business. The loss of our key personnel, coupled with an inability to adequately develop and train personnel and assimilate key new hires or promoted employees could have a material adverse effect on relationships with third parties, our financial condition and results of operations.
14
In addition, due to the HPES Merger, uncertainty around future employment opportunities, facility locations, organizational and reporting structures, and other related concerns may impair our ability to attract and retain qualified personnel. If employee attrition is higher than expected due to difficulties encountered in the integration process, it may adversely impact our ability to realize the anticipated benefits of the HPES Merger.
If we do not hire, train, motivate, and effectively utilize employees with the right mix of skills and experience in the right geographic regions and for the right offerings to meet the needs of our clients, our financial performance could suffer. For example, if our employee utilization rate is too low, our profitability, and the level of engagement of our employees could decrease. If that utilization rate is too high, it could have an adverse effect on employee engagement and attrition and the quality of the work performed, as well as our ability to staff projects. If we are unable to hire and retain enough employees with the skills or backgrounds needed to meet current demand, we may need to redeploy existing personnel, increase our reliance on subcontractors or increase employee compensation levels, all of which could also negatively affect our profitability. In addition, if we have more employees than necessary with certain skill sets or in certain geographies, we may incur increased costs as we work to rebalance our supply of skills and resources with client demand in those geographies.
Our international operations are exposed to risks, including fluctuations in exchange rates, which may be beyond our control.
Our exposure to currencies other than the U.S. dollar may impact our results, as they are expressed in U.S. dollars. Currency variations also contribute to variations in sales of products and services in affected jurisdictions. For example, in the event that one or more European countries were to replace the Euro with another currency, sales in that country or in Europe generally may be adversely affected until stable exchange rates are established. While historically we have partially mitigated currency risk, including exposure to fluctuations in currency exchange rates by matching costs with revenues in a given currency, our exposure to fluctuations in other currencies against the U.S. dollar increases, as revenue in currencies other than the U.S. dollar increases and as more of the services we provide are shifted to lower cost regions of the world. Approximately
63%
of revenues earned during fiscal 2019 were derived from sales denominated in currencies other than the U.S. dollar and are expected to continue to represent a significant portion of our revenues. Also, we believe that our ability to match revenues and expenses in a given currency will decrease as more work is performed at offshore locations.
We may use forward and option contracts to protect against currency exchange rate risks. The effectiveness of these hedges will depend on our ability to accurately forecast future cash flows, which may be particularly difficult during periods of uncertain demand and highly volatile exchange rates. We may incur significant losses from our hedging activities due to factors such as demand volatility and currency variations. In addition, certain or all of our hedging activities may be ineffective, may expire and not be renewed or may not offset the adverse financial impact resulting from currency variations. Losses associated with hedging activities may also impact our revenues and to a lesser extent our cost of sales and financial condition.
In June 2016, the United Kingdom held a referendum in which British citizens voted to exit from the European Union, commonly referred to as “Brexit.” In March 2017, the U.K. government initiated a process to withdraw from the European Union and began negotiating the terms of its separation. Current uncertainty over the negotiations between the United Kingdom and the European Union may cause significant volatility in global financial markets and may adversely affect our operations and financial results. Risks we associate with Brexit include, for example, that Brexit could potentially result in restrictions on the movement of capital and the mobility of personnel between the remaining 27 European Union states and the United Kingdom, in addition to volatility in currency exchange rates. Brexit also creates uncertainty in areas currently regulated by European Union law, such as cross border data transfers. Brexit is also expected to lead to short- and medium-term uncertainty in future trade arrangements between U.K.-based operations and the various European Union markets that they serve.
15
Our future business and financial performance could suffer due to a variety of international factors, including:
|
•
|
ongoing instability or changes in a country’s or region’s economic or geopolitical and security conditions, including inflation, recession, interest rate fluctuations, and actual or anticipated military or political conflict, civil unrest, crime, political instability, human rights concerns, and terrorist activity;
|
|
•
|
natural or man-made disasters, industrial accidents, public health issues, cybersecurity incidents, interruptions of service from utilities, transportation or telecommunications providers, or other catastrophic events;
|
|
•
|
longer collection cycles and financial instability among customers;
|
|
•
|
trade regulations and procedures and actions affecting production, pricing and marketing of products, including policies adopted by countries that may champion or otherwise favor domestic companies and technologies over foreign competitors;
|
|
•
|
local labor conditions and regulations;
|
|
•
|
managing our geographically dispersed workforce;
|
|
•
|
changes in the international, national or local regulatory and legal environments;
|
|
•
|
differing technology standards or customer requirements;
|
|
•
|
difficulties associated with repatriating earnings generated or held abroad in a tax-efficient manner and
|
|
•
|
changes in tax laws.
|
Our business operations are subject to various and changing federal, state, local and foreign laws and regulations that could result in costs or sanctions that adversely affect our business and results of operations.
We operate in approximately
70
countries in an increasingly complex regulatory environment. Among other things, we provide complex industry specific insurance processing in the United Kingdom, which is regulated by authorities in the United Kingdom. and elsewhere, such as the U.K.’s Financial Conduct Authority and Her Majesty’s Treasury and the U.S. Department of Treasury, which increases our exposure to compliance risk. For example, in February 2017, CSC submitted an initial notification of voluntary disclosure to the U.S. Department of Treasury's Office of Foreign Assets Control (“OFAC”) regarding certain possible violations of U.S. sanctions laws pertaining to insurance premium data and claims data processed by two partially-owned joint ventures of Xchanging, which CSC acquired during the first quarter of fiscal 2017. A copy of the disclosure was also provided to Her Majesty’s Treasury Office of Financial Sanctions Implementation in the United Kingdom. Our related internal investigation is continuing, and we have undertaken to cooperate with and provide a full report of our findings to OFAC when completed. Our retail investment account management business in Germany is another example of a regulated business, which must maintain a banking license, is regulated by the German Federal Financial Supervisory Authority and the European Central Bank and must comply with German banking laws and regulations.
In addition, businesses in the countries in which we operate are subject to local, legal and political environments and regulations including with respect to employment, tax, statutory supervision and reporting and trade restriction. These regulations and environments are also subject to change.
Adjusting business operations to changing environments and regulations may be costly and could potentially render the particular business operations uneconomical, which may adversely affect our profitability or lead to a change in the business operations. Notwithstanding our best efforts, we may not be in compliance with all regulations in the countries in which we operate at all times and may be subject to sanctions, penalties or fines as a result. These sanctions, penalties or fines may materially and adversely impact our profitability.
16
We may not achieve some or all of the expected benefits of our restructuring plans and our restructuring may adversely affect our business.
Our Board of Directors has approved several restructuring plans to realign our cost structure due to the changing nature of our business and to achieve operating efficiencies to reduce our costs. We may not be able to obtain the costs savings and benefits that were initially anticipated in connection with our restructuring plans. Additionally, as a result of our restructuring, we may experience a loss of continuity, loss of accumulated knowledge and/or inefficiency during transitional periods. Reorganization and restructuring can require a significant amount of management and other employees' time and focus, which may divert attention from operating and growing our business. If we fail to achieve some or all of the expected benefits of restructuring, it could have a material adverse effect on our competitive position, business, financial condition, results of operations and cash flows. For more information about our restructuring plans, see Note
20
- "
Restructuring Costs
".
In the course of providing services to customers, we may inadvertently infringe on the intellectual property rights of others and be exposed to claims for damages.
The solutions we provide to our customers may inadvertently infringe on the intellectual property rights of third parties resulting in claims for damages against us or our customers. Our contracts generally indemnify our clients from claims for intellectual property infringement for the services and equipment we provide under the applicable contracts. We also indemnify certain vendors and customers against claims of intellectual property infringement made by third parties arising from the use by such vendors and customers of software products and services and certain other matters. Some of the applicable indemnification arrangements may not be subject to maximum loss clauses. The expense and time of defending against these claims may have a material and adverse impact on our profitability. If we lose our ability to continue using any such services and solutions because they are found to infringe the rights of others, we will need to obtain substitute solutions or seek alternative means of obtaining the technology necessary to continue to provide such services and solutions. Our inability to replace such solutions, or to replace such solutions in a timely or cost-effective manner, could materially adversely affect our results of operations. Additionally, the publicity resulting from infringing intellectual property rights may damage our reputation and adversely impact our ability to develop new business.
We may be exposed to negative publicity and other potential risks if we are unable to achieve and maintain effective internal controls over financial reporting.
The Sarbanes-Oxley Act of 2002 and the related regulations require our management to report on, and our independent registered public accounting firm to attest to, the effectiveness of our internal control over financial reporting. Effective internal controls are necessary for us to provide reliable financial reports and effectively prevent fraud. However, a control system, no matter how well conceived and operated, can provide only reasonable, not absolute, assurance that the objectives of the control system are met. There can be no assurance that all control issues or fraud will be detected. As we continue to grow our business, our internal controls continue to become more complex and require more resources.
Any failure to maintain effective controls could prevent us from timely and reliably reporting financial results and may harm our operating results. In addition, if we are unable to conclude that we have effective internal control over financial reporting or, if our independent registered public accounting firm is unable to provide an unqualified report as to the effectiveness of our internal control over financial reporting, as of each fiscal year end, we may be exposed to negative publicity, which could cause investors to lose confidence in our reported financial information. Any failure to maintain effective internal controls and any such resulting negative publicity may negatively affect our business and stock price.
17
Additionally, the existence of any material weaknesses or significant deficiencies would require management to devote significant time and incur significant expense to remediate any such material weaknesses or significant deficiencies and management may not be able to remediate any such material weaknesses or significant deficiencies in a timely manner. The existence of any material weakness in our internal control over financial reporting could also result in errors in our financial statements that could require us to restate our financial statements, cause us to fail to meet our reporting obligations and cause stockholders to lose confidence in our reported financial information, all of which could materially and adversely affect us and the market price of our common stock.
We could suffer additional losses due to asset impairment charges.
We acquired a substantial quantity of goodwill and other intangibles as a result of the HPES Merger, increasing our exposure to this risk. We test our goodwill for impairment during the second quarter of every year and on an interim date should events or changes in circumstances indicate that it is more likely than not that the fair value of a reporting unit is below its carrying amount. If the fair value of a reporting unit is revised downward due to declines in business performance or other factors, an impairment could result and a non-cash charge could be required. We test intangible assets with finite lives for impairment whenever events or changes in circumstances indicate that the carrying amount of an asset may not be recoverable. This assessment of the recoverability of finite-lived intangible assets could result in an impairment and a non-cash charge could be required.
We also test certain equipment and deferred cost balances associated with contracts when the contract is materially underperforming or is expected to materially underperform in the future, as compared to the original bid model or budget. If the projected cash flows of a particular contract are not adequate to recover the unamortized cost balance of the asset group, the balance is adjusted in the tested period based on the contract's fair value. Either of these impairments could materially affect our reported net earnings.
We may not be able to pay dividends or repurchase shares of our common stock in accordance with our announced intent or at all.
On April 3, 2017, we announced the establishment of a share repurchase plan approved by the Board of Directors with an initial authorization of up to $2.0 billion for future repurchases of outstanding shares of our common stock. On November 8, 2018, DXC announced that its Board of Directors approved an incremental $2.0 billion share repurchase authorization. Starting fiscal 2018, we paid quarterly cash dividends to our stockholders in accordance with our announced dividend policy. We intend to continue to pay a quarterly cash dividend during fiscal 2020 but the declaration and payment of future dividends, the amount of any such dividends, and the establishment of record and payment dates for dividends, if any, are subject to final determination by our Board of Directors after review of our current strategy and financial performance and position, among other things.
The Board of Directors’ determinations regarding dividends and share repurchases will depend on a variety of factors, including net income, cash flow generated from operations, amount and location of our cash and investment balances, overall liquidity position and potential alternative uses of cash, such as acquisitions, as well as economic conditions and expected future financial results. There can be no guarantee that we will achieve our financial goals in the amounts or within the expected time frame, or at all. Our ability to declare future dividends will depend on our future financial performance, which in turn depends on the successful implementation of our strategy and on financial, competitive, regulatory and other factors, general economic conditions, demand and prices for our services and other factors specific to our industry or specific projects, many of which are beyond our control. Therefore, our ability to generate cash flow depends on the performance of our operations and could be limited by decreases in our profitability or increases in costs, regulatory changes, capital expenditures or debt servicing requirements.
Any failure to achieve our financial goals could negatively impact our reputation, harm investor confidence in us, and cause the market price of our common stock to decline.
18
We are defendants in pending litigation that may have a material and adverse impact on our profitability and liquidity.
As noted in Note
21
- "
Commitments and Contingencies
", we are currently party to a number of disputes that involve or may involve litigation, including a securities class action and other lawsuits in which we and our directors have been named as a defendant. The result of these lawsuits and any other future legal proceedings cannot be predicted with certainty. Regardless of their subject matter or merits, such legal proceedings may result in significant cost to us, which may not be covered by insurance, may divert the attention of management or may otherwise have an adverse effect on our business, financial condition and results of operations. Negative publicity from litigation, whether or not resulting in a substantial cost, could materially damage our reputation and could have a material adverse effect on our business, financial condition, results of operations, and the price of our common stock. In addition, such legal proceedings may make it more difficult to finance our operations.
We may be adversely affected by disruptions in the credit markets, including disruptions that reduce our customers' access to credit and increase the costs to our customers of obtaining credit.
The credit markets have historically been volatile and therefore it is not possible to predict the ability of our clients and customers to access short-term financing and other forms of capital. If a disruption in the credit markets were to occur, it could pose a risk to our business if customers or suppliers are unable to obtain financing to meet payment or delivery obligations to us. In addition, customers may decide to downsize, defer or cancel contracts which could negatively affect our revenues.
Further, as of March 31, 2019, we have
$2.4 billion
of floating interest rate debt. Accordingly, a spike in interest rates could adversely affect our results of operations and cash flows.
Our hedging program is subject to counterparty default risk.
We enter into foreign currency forward contracts and interest rate swaps with a number of counterparties. As a result, we are subject to the risk that the counterparty to one or more of these contracts defaults on its performance under the contract. During an economic downturn, the counterparty's financial condition may deteriorate rapidly and with little notice and we may be unable to take action to protect our exposure. In the event of a counterparty default, we could incur significant losses, which may harm our business and financial condition. In the event that one or more of our counterparties becomes insolvent or files for bankruptcy, our ability to eventually recover any losses suffered as a result of that counterparty's default may be limited by the liquidity of the counterparty.
We derive significant revenues and profit from contracts awarded through competitive bidding processes, which can impose substantial costs on us and we may not achieve revenue and profit objectives if we fail to bid on these projects effectively.
We derive significant revenues and profit from government contracts that are awarded through competitive bidding processes. We expect that most of the non-U.S. government business we seek in the foreseeable future will be awarded through competitive bidding. Competitive bidding is expensive and presents a number of risks, including:
|
•
|
the substantial cost and managerial time and effort that we spend to prepare bids and proposals for contracts that may or may not be awarded to us;
|
|
•
|
the need to estimate accurately the resources and costs that will be required to service any contracts we are awarded, sometimes in advance of the final determination of their full scope and design;
|
|
•
|
the expense and delay that may arise if our competitors protest or challenge awards made to us pursuant to competitive bidding;
|
|
•
|
the requirement to resubmit bids protested by our competitors and in the termination, reduction, or modification of the awarded contracts; and
|
|
•
|
the opportunity cost of not bidding on and winning other contracts we might otherwise pursue.
|
19
If our customers experience financial difficulties, we may not be able to collect our receivables, which would materially and adversely affect our profitability.
Over the course of a long-term contract, a customer's financial condition may decline and lower its ability to pay its obligations. This would cause our cash collections to decrease and bad debt expense to increase. While we may resort to alternative methods to pursue claims or collect receivables, these methods are expensive and time consuming and successful collection is not guaranteed. Failure to collect our receivables or prevail on claims would have an adverse effect on our profitability and cash flows.
Failure to comply with customer contracts or government contracting regulations or requirements could adversely affect our business and results of operations.
Contracts with customers may include unique and specialized performance requirements. In particular, our contracts with federal, state, provincial, and local governmental customers are generally subject to various procurement regulations, contract provisions, and other requirements relating to their formation, administration, and performance, including the maintenance of necessary security clearances. Contracts with U.S. government agencies are also subject to audits and investigations, which may include a review of performance on contracts, pricing practices, cost structure, and compliance with applicable laws and regulations.
Any failure on our part to comply with the specific provisions in customer contracts or any violation of government contracting regulations or other requirements could result in the imposition of various civil and criminal penalties, which may include termination of contracts, forfeiture of profits, suspension of payments, and, in the case of government contracts, fines and suspension from future government contracting. Such failures could also cause reputational damage to our business. In addition, we may be subject to
qui tam
litigation brought by private individuals on behalf of the government relating to government contracts, which could include claims for treble damages. Further, any negative publicity with respect to customer contracts or any related proceedings, regardless of accuracy, may damage our business by harming our ability to compete for new contracts.
Contracts with the U.S. federal government and related agencies are also subject to issues with respect to federal budgetary and spending limits or matters. Any changes to the fiscal policies of the U.S. federal government may decrease overall government funding, result in delays in the procurement of products and services due to lack of funding, cause the U.S. federal government and government agencies to reduce their purchases under existing contracts, or cause them to exercise their rights to terminate contracts at will or to abstain from exercising options to renew contracts, any of which would have an adverse effect on our business, financial condition, results of operations and/or cash flows.
If our customer contracts are terminated, if we are suspended or disbarred from government work, or our ability to compete for new contracts is adversely affected, our financial performance could suffer.
Recent U.S. tax legislation may materially affect our financial condition, results of operations and cash flows.
Recently enacted U.S. tax legislation has significantly changed the U.S. federal income taxation of U.S. corporations, including by reducing the U.S. corporate income tax rate, limiting interest deductions, permitting immediate expensing of certain capital expenditures, adopting elements of a territorial tax system, imposing a one-time transition tax (or “repatriation tax”) on all undistributed earnings and profits of certain U.S.-owned foreign corporations, revising the rules governing net operating losses and the rules governing foreign tax credits, and introducing new anti-base erosion provisions. Many of these changes were effective immediately, without any transition periods or grandfathering for existing transactions. The legislation is unclear in many respects and could be subject to potential amendments and technical corrections, as well as interpretations and implementing regulations by the U.S. Department of the Treasury and Internal Revenue Service ("IRS"), any of which could lessen or increase certain impacts of the legislation. In addition, state and local jurisdictions continue to issue guidance on how these U.S. federal income tax changes will affect state and local taxation, which often uses federal taxable income as a starting point for computing state and local tax liabilities.
20
While our analysis and interpretation of this legislation is ongoing, based on our current evaluation, we recorded a provisional reduction of our deferred income tax liabilities resulting in a material non-cash benefit to earnings during fiscal 2018, the period in which the tax legislation was enacted, which was adjusted in fiscal 2019 and may be subject to further adjustment in subsequent periods upon the filing of the associated October 31, 2018 U.S. federal and state income tax returns. Additionally, the repatriation tax resulted in a material amount of additional U.S. tax liability, the majority of which was reflected as an income tax expense in fiscal 2018, when the tax legislation was enacted, despite the fact that the resulting tax may be paid over eight years. Further, there may be other material adverse effects resulting from future guidance, including technical corrections.
While some of the changes made by the tax legislation may adversely affect the Company in one or more reporting periods and prospectively, other changes may be beneficial on a going forward basis. We continue to work with our tax advisors to determine the full impact that the tax legislation as a whole will have on us. We urge our investors to consult with their legal and tax advisors with respect to such legislation and the potential tax consequences of investing in our securities.
Changes in our tax rates could affect our future results.
Our future effective tax rates could be affected by changes in the mix of earnings in countries with differing statutory tax rates, changes in the valuation of deferred tax assets and liabilities, or by changes in tax laws or their interpretation. We are subject to the continuous examination of our income tax returns by the IRS and other tax authorities. We regularly assess the likelihood of adverse outcomes resulting from these examinations to determine the adequacy of our provision for taxes. There can be no assurance that the outcomes from these examinations will not have a material adverse effect on our financial condition and operating results.
Risks Related to the HPES Merger
We may not realize the anticipated benefits from the HPES Merger.
There can be no assurance that we will be able to realize the intended benefits of the HPES Merger or that we will perform as anticipated. Specifically, the HPES Merger could cause disruptions in the combined company's business, including by disrupting operations or causing customers to delay or to defer decisions to purchase products or renew contracts or to end their relationships. Similarly, it is possible that current or prospective employees could experience uncertainty about their future roles, which could harm our ability to attract and retain key personnel.
Our success in realizing cost and revenues synergies, growth opportunities, and other financial and operating benefits as a result of the HPES Merger, and the timing of this realization, depends on the successful integration of our business operations. Even if we successfully integrate, we cannot predict with certainty if or when these cost and revenue synergies, growth opportunities and benefits will occur, or the extent to which they actually will be achieved. For example, the benefits from the HPES Merger may be offset by costs incurred in integrating CSC and HPES or in required capital expenditures related to the business combination with HPES. In addition, the quantification of previously announced synergies expected to result from the HPES Merger is based on significant estimates and assumptions that are subjective in nature and inherently uncertain. Realization of any benefits and synergies could be affected by a number of factors beyond our control, including, without limitation, general economic conditions, increased operating costs, regulatory developments and other risks. The amount of synergies actually realized, if any, and the time periods in which any such synergies are realized, could differ materially from the expected synergies, regardless of whether the two business operations are combined successfully. If the integration is unsuccessful or if we are unable to realize the anticipated synergies and other benefits of the HPES Merger, there could be a material adverse effect on our business, financial condition and results of operations.
21
Our business and financial performance could suffer if we do not manage properly the risks associated with the HPES Merger.
The HPES business relies on its ability to retain significant services clients and maintain or increase the level of revenues from these clients. Before the HPES Merger, HPES was in the process of addressing challenges relating to the market shift to cloud-related IT infrastructure, software, and services. HPES was experiencing commoditization in the IT infrastructure services business market that is placing pressure on traditional information technology outsourcing pricing and cost structures. There is also an industrywide shift to highly automated, asset-light delivery of IT infrastructure and applications leading to headcount consolidation. To be successful in addressing these challenges, our integration of HPES must continue executing on the HPES multi-year turnaround plan, which includes a cost reduction initiative to align its costs with its revenue trajectory, a focus on new logo wins and strategic enterprise services, and initiatives to improve execution in sales performance and accountability, contracting practices and pricing. If we do not succeed in these efforts, or if these efforts are more costly or time consuming than expected, the HPES business and results of operations may be adversely affected.
Our results may be negatively affected if we are unable to adequately replace or provide resources formerly provided by HPE, or replace them at the same or lower cost.
HPES has historically received benefits and services from HPE. While HPE agreed to provide certain transition services to us for a period following the HPES Merger, it cannot be assured that we will be able to adequately replace or provide resources formerly provided by HPE, or replace them at the same or lower cost. If we are not able to replace the resources provided by HPE or are unable to replace them without incurring significant additional costs or are delayed in replacing the resources provided by HPE, or if the potential customers or other partners of the HPES business do not view our business relationships as equivalent to HPE’s, our results of operations may be harmed.
In connection with the HPES Merger, HPE and DXC and, in some cases, CSC, entered into several agreements that govern the relationship between the parties going forward, including an Employee Matters Agreement, a Tax Matters Agreement, an Intellectual Property Matters Agreement, a Transition Services Agreement, and a Real Estate Matters Agreement. Changes in the strategic direction of HPE, or any successor of HPE, could, over time, impact the positioning and offerings of HPE’s brands and programs, including those being made available to us.
The integration following the HPES Merger may continue to present significant challenges.
There is a significant degree of difficulty inherent in the process of integrating HPES and CSC. These difficulties include:
|
•
|
integration activities while carrying on ongoing operations;
|
|
•
|
the challenge of integrating the business cultures of HPES and CSC;
|
|
•
|
the challenge and cost of integrating certain IT systems and other systems; and
|
|
•
|
the potential difficulty in retaining key officers and other personnel.
|
The ongoing process of integrating operations could cause an interruption of, or loss of momentum in, the activities of one or more of our businesses. Members of senior management may be required to devote considerable amounts of time to this integration process, which would decrease the time they have to manage our business, service existing businesses and develop new services or strategies. In addition, certain existing contractual restrictions limit the ability to engage in certain integration activities for varying periods after the HPES Merger. There is no assurance we will be able to continue to manage this integration to the extent or in the time horizon anticipated, particularly given the larger scale of the HPES business in comparison to CSC's business. If senior management is not able to timely and effectively manage the integration process, or if any significant business activities are interrupted as a result of the integration process, our business could suffer. The delay or inability to achieve anticipated integration goals could have a material adverse effect on our business, financial condition and results of operations after the HPES Merger.
22
The unaudited pro forma condensed combined financial information of CSC and HPES is not intended to reflect what actual results of operations would have been had CSC and HPES been a combined company for the periods presented, and therefore these results may not be indicative of DXC's future operating performance.
The unaudited pro forma condensed combined financial information presented in this document is for illustrative purposes only and is based in part on certain assumptions regarding the HPES Merger that management believes are reasonable.
The business combination involving CSC and HPES was a reverse merger acquisition, with HPES deemed the legal acquirer in this combination and CSC deemed the acquirer for accounting purposes under GAAP. The unaudited pro forma condensed combined financial information does not reflect the costs of any integration activities or transaction related costs or incremental capital spend that management believes are necessary to realize the anticipated synergies from the HPES Merger. Accordingly, the pro forma financial information included in this document does not reflect what DXC’s results of operations or operating condition would have been had CSC and HPES been a consolidated entity during all periods presented, or what DXC’s results of operations and financial condition will be in the future.
We could have an indemnification obligation to HPE if the stock distribution in connection with the HPES business separation (the "Distribution") were determined not to qualify for tax-free treatment, which could materially adversely affect our financial condition.
If, due to any of our representations being untrue or our covenants being breached, the Distribution was determined not to qualify for tax-free treatment under Section 355 of the Internal Revenue Code (the "Code"), HPE would generally be subject to tax as if it sold the DXC common stock in a taxable transaction, which could result in a material tax liability. In addition, each HPE stockholder who received DXC common stock in the Distribution would generally be treated as receiving a taxable Distribution in an amount equal to the fair market value of the DXC common stock received by the stockholder in the Distribution.
In addition, the Distribution would be taxable to HPE (but not to HPE stockholders) pursuant to Section 355(e) of the Code if one or more persons acquire a 50% or greater interest (measured by vote or value) in the stock of HPE or us, directly or indirectly (including through acquisitions of our stock after the HPES Merger), as part of a plan or series of related transactions that includes the Distribution. In addition, Section 355(e) of the Code generally creates a presumption that any direct or indirect acquisition of stock of HPE or us within two years before or after the Distribution is part of a plan that includes the Distribution, although the parties may be able to rebut that presumption in certain circumstances. The process for determining whether an acquisition is part of a plan under these rules is complex, inherently factual in nature, and subject to a comprehensive analysis of the facts and circumstances of the particular case. If the IRS were to determine that direct or indirect acquisitions of stock of HPE or us, either before or after the Distribution, were part of a plan that includes the Distribution, such determination could cause Section 355(e) of the Code to apply to the Distribution, which could result in a material tax liability.
Under the Tax Matters Agreement, we were required to indemnify HPE against taxes resulting from the Distribution or certain aspects of the HPES Merger arising as a result of an Everett Tainting Act (as defined in the Tax Matters Agreement). If we were required to indemnify HPE for taxes resulting from an Everett Tainting Act, that indemnification obligation would likely be substantial and could materially adversely affect our financial condition.
To address compliance with Section 355(e) of the Code, in the Tax Matters Agreement, we agreed to certain restrictions that may limit our ability to pursue certain strategic transactions or engage in other transactions, including stock issuances, certain asset dispositions, mergers, consolidations and other strategic transactions for a period of time following the HPES Merger. As a result, we may determine to forgo certain transactions that otherwise could be advantageous.
23
If the HPES Merger does not qualify as a reorganization under Section 368(a) of the Code, CSC's former stockholders may incur significant tax liabilities.
The completion of the HPES Merger was conditioned upon the receipt by HPE and CSC of opinions of counsel to the effect that, for U.S. federal income tax purposes, the HPES Merger will qualify as a "reorganization" within the meaning of Section 368(a) of the Code (the "HPES Merger Tax Opinions"). The parties did not seek a ruling from the IRS regarding such qualification. The HPES Merger Tax Opinions were based on current law and relied upon various factual representations and assumptions, as well as certain undertakings made by HPE, HPES and CSC. If any of those representations or assumptions is untrue or incomplete in any material respect or any of those undertakings is not complied with, or if the facts upon which the HPES Merger Tax Opinions are based are materially different from the actual facts that existed at the time of the HPES Merger, the conclusions reached in the HPES Merger Tax Opinions could be adversely affected and the HPES Merger may not qualify for tax-free treatment. Opinions of counsel are not binding on the IRS or the courts. No assurance can be given that the IRS will not challenge the conclusions set forth in the HPES Merger Tax Opinions or that a court would not sustain such a challenge. If the HPES Merger were determined to be taxable, previous holders of CSC common stock would be considered to have made a taxable disposition of their shares to HPES, and such stockholders would generally recognize taxable gain or loss on their receipt of HPES common stock in the HPES Merger.
We assumed certain material pension benefit obligations in connection with the HPES Merger. These liabilities and the related future funding obligations could restrict our cash available for operations, capital expenditures and other requirements, and may materially adversely affect our financial condition and liquidity.
Pursuant to the Employee Matters Agreement entered into in connection with the HPES Merger, while HPE retained all U.S. defined benefit pension plan liabilities, DXC retained all liabilities relating to the International Retirement Guarantee (“IRG”) programs for all HPES employees. The IRG is a non-qualified retirement plan for employees who transfer internationally at the request of the HPE Group. The IRG determines the country of guarantee, which is generally the country in which an employee has spent the longest portion of his or her career with the HPE Group, and the present value of a full career benefit for the employee under the HPE defined benefit pension plan and social security or social insurance system in the country of guarantee. The IRG then offsets the present value of the retirement benefits from plans and social insurance systems in the countries in which the employee earned retirement benefits for his or her total period of HPE Group employment. The net benefit value is payable as a single sum as soon as practicable after termination or retirement. This liability could restrict cash available for our operations, capital expenditures and other requirements, and may materially affect our financial condition and liquidity.
In addition, pursuant to the Employee Matters Agreement, DXC assumed certain other defined benefit pension liabilities in a number of non-U.S. countries (including the United Kingdom, Germany and Switzerland). Unless otherwise agreed or required by local law, where a defined benefit pension plan was maintained solely by a member of the HPES business, DXC assumed all assets and liabilities arising out of those non-U.S. defined benefit pension plans, and where a defined benefit pension plan was not maintained solely by a member of the HPES business, DXC assumed all assets and liabilities for those eligible HPES employees in connection with the HPES Merger. These liabilities and the related future payment obligations could restrict cash available for our operations, capital expenditures and other requirements, and may materially affect our financial condition and liquidity.
Risks Related to the Luxoft Acquisition
The proposed Luxoft Acquisition is contingent upon the satisfaction of a number of conditions, and the Luxoft Acquisition may not be consummated on the terms or timeline currently contemplated.
On January 7, 2019, we announced that we had entered into a definitive agreement to acquire Luxoft. We currently expect that the Luxoft Acquisition, if completed, will occur by June 2019. The terms and conditions of the Luxoft Acquisition are as set forth in the Merger Agreement dated as of January 6, 2019 by and among DXC, Luxoft and Luna Equities, Inc. (the “Luxoft Merger Agreement”). Luxoft and DXC have made customary representations and warranties and agreed to customary covenants in the Luxoft Merger Agreement. The parties
24
to the Luxoft Merger Agreement have also agreed to use their respective reasonable best efforts to obtain any approvals from governmental authorities to complete the Luxoft Acquisition, including antitrust approvals, subject to certain exceptions. Antitrust approvals include the termination or expiration of the relevant waiting period under, and the approvals required to be obtained in connection with or in compliance with, (i) the Hart-Scott-Rodino Antitrust Improvements Act of 1976, as amended, which was satisfied on January 31, 2019; (ii) the European Union Merger Regulation, which was satisfied on March 25, 2019; and (iii) Russia merger control regulations, which was satisfied on June 11, 2019. Luxoft may not engage in any discussions regarding a potential acquisition of Luxoft with any party other than DXC or its affiliates or otherwise enter into any agreement with respect to, or solicit, initiate, propose or knowingly encourage any proposal regarding an alternative transaction. The Luxoft Merger Agreement contains certain customary termination rights for both Luxoft and DXC.
The consummation of the Luxoft Acquisition is subject to certain conditions, including (i) the receipt of antitrust clearances, (ii) the absence of any law, order or other governmental action preventing or restraining the consummation of the Luxoft Acquisition, (iii) the accuracy of the representations and warranties of each party in the Luxoft Merger Agreement, (iv) compliance in all material respects by each party with its covenants under the Luxoft Merger Agreement, and (v) the absence of a material adverse effect on Luxoft. For these and other reasons, the Luxoft Acquisition may not be completed by the end of June 2019 or otherwise on the terms or timeline contemplated, if at all.
The proposed Luxoft Acquisition may result in disruptions to relationships with customers and other business partners.
If we complete the proposed Luxoft Acquisition, the proposed transaction could cause disruptions in our business and the Luxoft business, including by disrupting operations or causing customers to delay or to defer decisions or to end their relationships, or otherwise limiting the ability to compete for or perform certain contracts or services. If we and Luxoft face difficulties in integrating our businesses, or the Luxoft business faces difficulties in its business generally, the Luxoft Acquisition, if completed, may not achieve the intended results.
Further, it is possible that current or prospective employees of our business and the Luxoft business could experience uncertainty about their future roles with the combined company, which could harm our ability to attract and retain key personnel. Any of the foregoing could adversely affect our business, financial condition and results of operations and prospects.
The actions required to implement the Luxoft Acquisition will take management time and attention and may require us to incur additional costs.
The Luxoft Acquisition will require management's time and resources, which will be in addition to, and may divert from, management's time and attention to the operation of our existing businesses and the execution of our other strategic initiatives. Additionally, we may incur additional costs in connection with the Luxoft Acquisition beyond those that are currently anticipated. Some of these costs must be paid regardless of whether the Luxoft Acquisition is consummated.
25
Risks Related to Previous Spin-Offs
The USPS Separation and Mergers and NPS Separation could result in substantial tax liability to DXC and our stockholders.
Among the closing conditions to completing the USPS Separation and Mergers, we received a legal opinion of tax counsel substantially to the effect that, for U.S. federal income tax purposes: (i) the USPS Separation qualifies as a “reorganization” within the meaning of Section 368(a)(1)(D) of the Internal Revenue Code of 1986, as amended (the “Code”); (ii) each of DXC and Perspecta is a “party to a reorganization” within the meaning of Section 368(b) of the Code with respect to the USPS Separation; (iii) the Distribution qualifies as (1) a tax-free spin-off, resulting in nonrecognition under Sections 355(a), 361 and 368(a) of the Code, and (2) a transaction in which the stock distributed thereby should constitute “qualified property” for purposes of Sections 355(d), 355(e) and 361(c) of the Code; and (iv) none of the Mergers causes Section 355(e) of the Code to apply to the Distribution. If, notwithstanding the conclusions expressed in these opinions, the USPS Separation and Mergers were determined to be taxable, DXC and its stockholders could incur significant tax liabilities.
In addition, prior to the HPES Merger, CSC spun off its North American Public Sector business ("NPS") on November 27, 2015 (the "NPS Separation"). In connection with the NPS Separation, CSC received an opinion of counsel substantially to the effect that, for U.S. federal income tax purposes, the NPS Separation qualified as a tax-free transaction to CSC and holders of CSC common stock under Section 355 and related provisions of the Code. The completion of the HPES Merger was conditioned upon the receipt of CSC of an opinion of counsel to the effect that the HPES Merger should not cause Section 355(e) of the Code to apply to the NPS Separation or otherwise affect the qualification of the NPS Separation as a tax-free distribution under Section 355 of the Code
.
If, notwithstanding the conclusions expressed in these opinions, the NPS Separation were determined to be taxable, CSC and CSC stockholders that received CSRA Inc ("CSRA") stock in the NPS Separation could incur significant tax liabilities.
The opinions of counsel we received were based on, among other things, various factual representations and assumptions, as well as certain undertakings made by DXC, Perspecta and CSRA. If any of those representations or assumptions is untrue or incomplete in any material respect or any of those undertakings is not complied with, the conclusions reached in the opinion could be adversely affected and the USPS Separation or the NPS Separation may not qualify for tax-free treatment. Furthermore, an opinion of counsel is not binding on the IRS or the courts. Accordingly, no assurance can be given that the IRS will not challenge the conclusions set forth in the opinions or that a court would not sustain such a challenge. If, notwithstanding our receipt of the opinions, the USPS Separation or NPS Separation is determined to be taxable, we would recognize taxable gain as if we had sold the shares of Perspecta or CSRA in a taxable sale for its fair market value, which could result in a substantial tax liability. In addition, if the USPS Separation or NPS Separation is determined to be taxable, each holder of our common stock who received shares of Perspecta or CSRA would generally be treated as receiving a taxable distribution in an amount equal to the fair market value of the shares received, which could materially increase such holder’s tax liability.
Additionally, even if the USPS Separation otherwise qualifies as a tax-free transaction, the Distribution could be taxable to us (but not to our shareholders) in certain circumstances if future significant acquisitions of our stock or the stock of Perspecta are deemed to be part of a plan or series of related transactions that includes the Distribution. In this event, the resulting tax liability could be substantial. In connection with the USPS Separation, we entered into a tax matters agreement with Perspecta, under which it agreed not to undertake any transaction without our consent that could reasonably be expected to cause the USPS Separation to be taxable to us and to indemnify us for any tax liabilities resulting from such transactions. These obligations and potential tax liabilities could be substantial.
ITEM 1B. UNRESOLVED STAFF COMMENTS
None.
26
ITEM 2. PROPERTIES
Our corporate headquarters are located at a leased facility in Tysons, VA. We own or lease numerous general office facilities, global security operations centers, strategic delivery centers and data centers around the world. We do not identify properties by segment, as they are interchangeable in nature and used by multiple segments.
During fiscal 2019 and fiscal 2018, we initiated facilities rationalization programs to reduce our space capacity at low utilization and sub-scale locations, increase co-location, align locations by skill type and optimize our data center footprint. At a number of the locations described below, we are not currently occupying all of the space under our control. Where commercially reasonable and to the extent it is not needed for future expansion, we seek to sell, lease or sublease this excess space.
The following tables provide a summary of properties we own and lease as of
March 31, 2019
:
|
Geographic Area
|
Approximate
Square Footage
(in thousands)
|
|||||||||||
|
Number of
Locations
|
Owned
|
Leased
|
Total
|
|||||||||
|
United States
|
152
|
|
4,792
|
|
3,515
|
|
8,307
|
|
||||
|
India
|
39
|
|
741
|
|
4,164
|
|
4,905
|
|
||||
|
Other Europe locations
|
96
|
|
364
|
|
3,261
|
|
3,625
|
|
||||
|
United Kingdom
|
80
|
|
1,146
|
|
2,056
|
|
3,202
|
|
||||
|
Australia & other Pacific Rim locations
|
47
|
|
—
|
|
1,582
|
|
1,582
|
|
||||
|
France
|
33
|
|
956
|
|
196
|
|
1,152
|
|
||||
|
Germany
|
43
|
|
318
|
|
718
|
|
1,036
|
|
||||
|
Malaysia
|
5
|
|
199
|
|
561
|
|
760
|
|
||||
|
Brazil
|
10
|
|
228
|
|
477
|
|
705
|
|
||||
|
Spain
|
16
|
|
—
|
|
522
|
|
522
|
|
||||
|
Canada
|
15
|
|
217
|
|
304
|
|
521
|
|
||||
|
Philippines
|
5
|
|
—
|
|
516
|
|
516
|
|
||||
|
China
|
13
|
|
5
|
|
506
|
|
511
|
|
||||
|
Rest of World
|
60
|
|
212
|
|
1,367
|
|
1,579
|
|
||||
|
Total
|
614
|
|
9,178
|
|
19,745
|
|
28,923
|
|
||||
We believe that the facilities described above are well-maintained, suitable and adequate to meet our current and anticipated requirements. See Note
8
- "
Property and Equipment
", which provides additional information related to our land, buildings and leasehold improvements, and Note
21
- "
Commitments and Contingencies
" under the caption "Commitments", which provides additional information related to our real estate lease commitments.
ITEM 3. LEGAL PROCEEDINGS
See Note
21
- "
Commitments and Contingencies
" under the caption “Contingencies” for information regarding legal proceedings in which we are involved.
ITEM 4. MINE SAFETY DISCLOSURES
Not applicable.
27
PART II
ITEM 5. MARKET FOR REGISTRANT'S COMMON EQUITY, RELATED STOCKHOLDER MATTERS AND ISSUER PURCHASES OF EQUITY SECURITIES
Market Information
Our common stock trades on the New York Stock Exchange under the symbol "DXC".
Number of Holders
As of
May 10, 2019
, there were
46,945
holders of record of our common stock.
Dividends
Cash dividends declared on DXC common stock for each quarter of fiscal
2019
are included in Selected Quarterly Financial Data (Unaudited) in Part II, Item 8 of this Annual Report.
We intend to continue to pay a quarterly cash dividend during fiscal
2020
, and on May 23, 2019 we announced that our Board of Directors declared a regular quarterly dividend payment for the quarter ending March 31, 2019 of $0.21 per share on the Company's common stock. The declaration and payment of future dividends, the amount of any such dividends, and the establishment of record and payment dates for dividends, if any, are subject to final determination by our Board of Directors after review of our current strategy and financial performance and position, among other things.
Issuer Purchases of Equity Securities
Share repurchase activity during the three months ended
March 31, 2019
was as follows:
|
|
||||||||||||||
|
Period
|
Total Number
of Shares
Purchased
|
Average Price
Paid Per Share
|
Total Number
of Shares
Purchased as
Part of Publicly
Announced Plans or Programs
(1)
|
Approximate
Dollar Value
of Shares that
May Yet be Purchased
Under the Plans or Programs
|
||||||||||
|
January 1, 2019 to January 31, 2019
|
1,662,149
|
|
$
|
54.97
|
|
1,662,149
|
|
$
|
2,523,936,426
|
|
||||
|
February 1, 2019 to February 28, 2019
|
—
|
|
$
|
—
|
|
—
|
|
$
|
2,523,936,426
|
|
||||
|
March 1, 2019 to March 31, 2019
|
—
|
|
$
|
—
|
|
—
|
|
$
|
2,523,936,426
|
|
||||
(1)
On April 3, 2017, we announced the establishment of a share repurchase plan approved by the Board of Directors with an initial authorization of $2.0 billion for future repurchases of outstanding shares of our common stock. On November 8, 2018, our Board of Directors approved an incremental $2.0 billion share repurchase authorization. An expiration date has not been established for this repurchase plan. Share repurchases may be made from time to time through various means, including in open market purchases, 10b5-1 plans, privately-negotiated transactions, accelerated stock repurchases, block trades and other transactions, in compliance with Rule 10b-18 under the Exchange Act as well as, to the extent applicable, other federal and state securities laws and other legal requirements. The timing, volume, and nature of share repurchases pursuant to the share repurchase plan are at the discretion of management and may be suspended or discontinued at any time. See Note
14
- "
Stockholders' Equity
" for further discussion regarding share repurchases.
28
Performance Graph
The following graph shows a comparison from April 3, 2017 (the date our common stock commenced trading on the NYSE) through March 31, 2019 of the cumulative total return for our common stock, the Standard & Poor’s 500 Stock Index ("S&P 500 Index") and the Standard & Poor’s North American Technology Index ("S&P North American Technology Index"). The graph assumes that $100 was invested at the market close on April 3, 2017 in our common stock, the S&P 500 Index, and the S&P North American Technology Index and that dividends have been reinvested. The stock price performance of the following graph is not necessarily indicative of future stock price performance.
Comparison of Cumulative Total Return

The following table provides indexed returns assuming $100 was invested on April 3, 2017, with annual returns using our fiscal year-end date.
|
Indexed Return
|
||||||
|
Return 2018
|
Return 2019
|
|||||
|
DXC Technology Company
|
48.7
|
%
|
(24.4
|
)%
|
||
|
S&P 500 Index
|
12.0
|
%
|
9.8
|
%
|
||
|
S&P North American Technology Index
|
30.0
|
%
|
17.9
|
%
|
||
Equity Compensation Plans
See Item 12 contained in Part III of this Annual Report for information regarding our equity compensation plans.
29
ITEM 6. SELECTED FINANCIAL DATA (UNAUDITED)
The following table sets forth our selected consolidated historical financial data as of the dates and for the periods indicated and should be read in conjunction with the financial statements and notes and “Item 7. Management’s Discussion and Analysis of Financial Condition and Results of Operations” which are included elsewhere in this Annual Report on Form 10-K.
Our selected consolidated financial data set forth below, as of March 31, 2019 and March 31, 2018, and for the fiscal years ended March 31, 2019, March 31, 2018, and March 31, 2017, have been derived from the audited consolidated financial statements included elsewhere herein. Our selected consolidated financial data set forth below, as of March 31, 2017, April 1, 2016, and April 3, 2015 and for the fiscal years ended April 1, 2016, and April 3, 2015, are derived from our consolidated financial statements not included elsewhere herein.
Selected consolidated financial data as of and for the fiscal years ended March 31, 2019 and March 31, 2018 are not directly comparable to prior periods which reflect CSC's financial results before the HPES Merger. Additionally, as a result of the USPS Separation, the statement of operations, balance sheets, and related financial information reflect USPS's operations, assets and liabilities as discontinued operations. See Note
1
- "
Summary of Significant Accounting Policies
".
Statement of Operations Data:
|
Fiscal Years Ended
|
||||||||||||||||||||
|
(in millions, except per-share amounts)
|
March 31, 2019
(1)
|
March 31, 2018
(2)
|
March 31, 2017
(3)
|
April 1, 2016
(4)
|
April 3, 2015
(5)
|
|||||||||||||||
|
Revenues
|
$
|
20,753
|
|
$
|
21,733
|
|
$
|
7,607
|
|
$
|
7,106
|
|
$
|
8,117
|
|
|||||
|
Income (loss) from continuing operations, before taxes
|
1,515
|
|
1,304
|
|
(174
|
)
|
10
|
|
(671
|
)
|
||||||||||
|
Income tax expense (benefit)
|
288
|
|
(242
|
)
|
(74
|
)
|
(62
|
)
|
(464
|
)
|
||||||||||
|
Income (loss) from continuing operations
|
1,227
|
|
1,546
|
|
(100
|
)
|
72
|
|
(207
|
)
|
||||||||||
|
Income from discontinued operations, net of taxes
|
35
|
|
236
|
|
—
|
|
191
|
|
224
|
|
||||||||||
|
Net income (loss) attributable to DXC common stockholders
|
1,257
|
|
1,751
|
|
(123
|
)
|
251
|
|
2
|
|
||||||||||
|
Earnings (loss) per common share:
|
||||||||||||||||||||
|
Basic:
|
||||||||||||||||||||
|
Continuing operations
|
$
|
4.40
|
|
$
|
5.32
|
|
$
|
(0.88
|
)
|
$
|
0.51
|
|
$
|
(1.45
|
)
|
|||||
|
Discontinued operations
|
0.13
|
|
0.83
|
|
—
|
|
1.31
|
|
1.46
|
|
||||||||||
|
$
|
4.53
|
|
$
|
6.15
|
|
$
|
(0.88
|
)
|
$
|
1.82
|
|
$
|
0.01
|
|
||||||
|
Diluted:
|
||||||||||||||||||||
|
Continuing operations
|
$
|
4.35
|
|
$
|
5.23
|
|
$
|
(0.88
|
)
|
$
|
0.50
|
|
$
|
(1.45
|
)
|
|||||
|
Discontinued operations
|
0.12
|
|
0.81
|
|
—
|
|
1.28
|
1.46
|
|
|||||||||||
|
$
|
4.47
|
|
$
|
6.04
|
|
$
|
(0.88
|
)
|
$
|
1.78
|
|
$
|
0.01
|
|
||||||
|
Weighted average common shares outstanding for:
|
||||||||||||||||||||
|
Basic EPS
|
277.54
|
|
284.93
|
|
140.39
|
|
138.28
|
|
142.56
|
|
||||||||||
|
Diluted EPS
|
281.43
|
|
289.77
|
|
140.39
|
|
141.33
|
|
142.56
|
|
||||||||||
|
Cash dividend per common share
|
$
|
0.76
|
|
$
|
0.72
|
|
$
|
0.56
|
|
$
|
2.99
|
|
$
|
0.92
|
|
|||||
30
Balance Sheet Data:
|
As of
|
||||||||||||||||||||
|
(in millions)
|
March 31, 2019
|
March 31, 2018
|
March 31, 2017
|
April 1, 2016
|
April 3, 2015
|
|||||||||||||||
|
Cash and cash equivalents
|
$
|
2,899
|
|
$
|
2,593
|
|
$
|
1,268
|
|
$
|
1,181
|
|
$
|
2,079
|
|
|||||
|
Total assets
|
29,574
|
|
33,921
|
|
8,663
|
|
7,736
|
|
10,221
|
|
||||||||||
|
Debt
|
||||||||||||||||||||
|
Long-term debt, net of current maturities
|
$
|
5,470
|
|
$
|
6,092
|
|
$
|
2,225
|
|
$
|
1,934
|
|
$
|
1,635
|
|
|||||
|
Short-term debt and current maturities of long-term debt
|
1,942
|
|
1,918
|
|
738
|
|
710
|
|
883
|
|
||||||||||
|
Total Debt
|
$
|
7,412
|
|
$
|
8,010
|
|
$
|
2,963
|
|
$
|
2,644
|
|
$
|
2,518
|
|
|||||
|
Total equity
|
$
|
11,725
|
|
$
|
13,837
|
|
$
|
2,166
|
|
$
|
2,032
|
|
$
|
2,965
|
|
|||||
|
Net debt-to-total capitalization
(6)
|
23.6
|
%
|
24.8
|
%
|
33.0
|
%
|
31.3
|
%
|
8.0
|
%
|
||||||||||
(1)
Fiscal 2019 included
$465 million
of restructuring costs.
(2)
Fiscal 2018 net income attributable to DXC common stockholders and earnings per common share were impacted by the Tax Cuts and Jobs Act. See Note
11
- "
Income Taxes
" for further details. Fiscal 2018 included
$789 million
of restructuring costs.
(3)
Fiscal 2017 included
$238 million
of restructuring costs.
(4)
Fiscal 2016 included
$95 million
of debt extinguishment costs.
(5)
Fiscal 2015 included
$256 million
of restructuring costs and
$197 million
of SEC settlement related charges.
(6)
Net debt-to-total capitalization is a non-GAAP measure used by management to assess our ability to service our debts using only our cash and cash equivalents. See Part II, Item 7 of this Annual Report on Form 10-K under the heading "Liquidity and Capital Resources" for additional information.
31
ITEM 7. MANAGEMENT'S DISCUSSION AND ANALYSIS OF FINANCIAL CONDITION AND RESULTS OF OPERATIONS
Introduction
The purpose of the MD&A is to present information that management believes is relevant to an assessment and understanding of our results of operations and cash flows for the fiscal year ended March 31, 2019 and our financial condition as of March 31, 2019. The MD&A is provided as a supplement to, and should be read in conjunction with, our financial statements and notes.
The MD&A is organized in the following sections:
|
•
|
Background
|
|
•
|
Results of Operations
|
|
•
|
Liquidity and Capital Resources
|
|
•
|
Off-Balance Sheet Arrangements
|
|
•
|
Contractual Obligations
|
|
•
|
Critical Accounting Policies and Estimates
|
The following discussion includes a comparison of our results of operations and liquidity and capital resources for fiscal 2019 and fiscal 2018. A discussion of changes in our results of operations from fiscal 2017 to fiscal 2018 may be found in “Item 7. Management’s Discussion and Analysis of Financial Condition and Results of Operations” of Exhibit 99.1 to our Current Report on Form 8-K filed with the Securities and Exchange Commission on August 16, 2018.
Background
As the world's leading independent, end-to-end IT services company, DXC leads digital transformations for clients by modernizing and integrating their mainstream IT, and by deploying digital solutions at scale to produce better business outcomes. The company’s technology independence, global talent, and extensive partner network enable 6,000 private and public-sector clients in 70 countries to thrive on change. DXC is a recognized leader in corporate responsibility.
We generate revenue by offering a wide range of information technology services and solutions primarily in North America, Europe, Asia and Australia. We operate through two segments: GBS and GIS. We market and sell our services directly to clients through our direct sales force operating out of sales offices around the world. Our clients include commercial businesses of many sizes and in many industries and public sector enterprises.
32
Results of Operations
The following table sets forth certain financial data for fiscal 2019 and 2018:
|
Fiscal Years Ended
|
||||||||
|
(In millions, except per-share amounts)
|
March 31, 2019
|
March 31, 2018
|
||||||
|
Revenues
|
$
|
20,753
|
|
$
|
21,733
|
|
||
|
Income from continuing operations, before taxes
|
1,515
|
|
1,304
|
|
||||
|
Income tax expense (benefit)
|
288
|
|
(242
|
)
|
||||
|
Income from continuing operations
|
1,227
|
|
1,546
|
|
||||
|
Income from discontinued operations, net of taxes
|
35
|
|
236
|
|
||||
|
Net income
|
$
|
1,262
|
|
$
|
1,782
|
|
||
|
Diluted earnings per share:
|
||||||||
|
Continuing operations
|
$
|
4.35
|
|
$
|
5.23
|
|
||
|
Discontinued operations
|
0.12
|
|
0.81
|
|
||||
|
$
|
4.47
|
|
$
|
6.04
|
|
|||
Fiscal 2019 Highlights
Fiscal 2019 financial highlights include the following:
|
•
|
Fiscal 2019 revenues were
$20,753 million
.
|
|
•
|
Fiscal 2019 income from continuing operations and diluted EPS from continuing operations were
$1,227 million
and
$4.35
, respectively, including the cumulative impact of certain items of
$1,125 million
, or
$3.99
per share, reflecting restructuring costs, transaction, separation and integration-related costs, amortization of acquired intangible assets, pension and other post-retirement benefit ("OPEB") actuarial and settlement losses and a tax adjustment related to U.S. tax reform.
|
|
•
|
Our cash and cash equivalents were
$2,899 million
at March 31, 2019.
|
|
•
|
We generated
$1,783 million
of cash from operations during fiscal 2019.
|
|
•
|
We returned
$1,549 million
to shareholders in the form of common stock dividends and share repurchases during fiscal 2019.
|
33
Revenues
|
Fiscal Years Ended
|
||||||||||||||
|
(in millions)
|
March 31, 2019
|
March 31, 2018
|
Change
|
Percentage Change
|
||||||||||
|
GBS
|
$
|
8,684
|
|
$
|
9,254
|
|
$
|
(570
|
)
|
(6.2)%
|
||||
|
GIS
|
12,069
|
|
12,479
|
|
(410
|
)
|
(3.3)%
|
|||||||
|
Total Revenues
|
$
|
20,753
|
|
$
|
21,733
|
|
$
|
(980
|
)
|
(4.5)%
|
||||
The decrease in revenues for fiscal 2019 compared with fiscal 2018 reflects an ongoing decline in our traditional application maintenance business and legacy infrastructure services. Fiscal 2019 revenues included an unfavorable foreign currency exchange rate impact of
1.6%
, primarily driven by the strengthening of the U.S. dollar against the Euro and British Pound.
During fiscal 2019 and fiscal 2018, the distribution of our revenues across geographies was as follows:
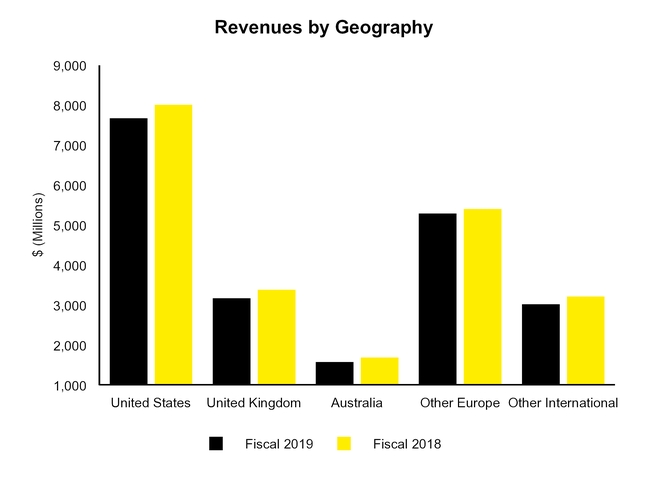
For a discussion of risks associated with our foreign operations, see Part I, Item 1A "Risk Factors" of this Annual Report.
34
As a global company, approximately
63%
of our fiscal 2019 revenues were earned internationally. As a result, the comparison of revenues denominated in currencies other than the U.S. dollar from period to period is impacted, and we expect will continue to be impacted, by fluctuations in foreign currency exchange rates. Constant currency revenues are a non-GAAP measure calculated by translating current period activity into U.S. dollars using the comparable prior period’s currency conversion rates. This information is consistent with how management views our revenues and evaluates our operating performance and trends. The table below summarizes our constant currency revenues:
|
Fiscal Years Ended
|
||||||||||||||
|
(in millions)
|
Constant Currency March 31, 2019
|
March 31, 2018
|
Change
|
Percentage Change
|
||||||||||
|
GBS
|
$
|
8,823
|
|
$
|
9,254
|
|
$
|
(431
|
)
|
(4.7)%
|
||||
|
GIS
|
12,282
|
|
12,479
|
|
(197
|
)
|
(1.6)%
|
|||||||
|
Total Revenues
|
$
|
21,105
|
|
$
|
21,733
|
|
$
|
(628
|
)
|
(2.9)%
|
||||
Global Business Services
Our GBS segment revenues were
$8.7 billion
for fiscal 2019, representing a decrease of
$0.6 billion
, or
6.2%
, compared to fiscal 2018. The revenue decline included an unfavorable foreign currency exchange rate impact of
$0.1 billion
, or
1.5%
. GBS revenues in constant currency were
$8.8 billion
for fiscal 2019, representing a decrease of
$0.4 billion
, or
4.7%
. The decrease in GBS revenue in fiscal 2019 reflects a decline in the traditional application maintenance and management business and includes the impact of accelerated cloud adoption.
Global Infrastructure Services
Our GIS segment revenues were
$12.1 billion
for fiscal 2019, representing a decrease of
$0.4 billion
, or
3.3%
, compared to fiscal 2018. The revenue decline included an unfavorable foreign currency exchange rate impact of
$0.2 billion
, or
1.7%
.GIS revenues in constant currency were
$12.3 billion
for fiscal 2019, representing a decrease of
$0.2 billion
, or
1.6%
. The decrease in GIS revenue in fiscal 2019 reflects the ongoing migration out of legacy infrastructure environments, partially offset by growth in our cloud infrastructure and digital workplace offerings.
During fiscal 2019, GBS and GIS had contract awards of
$9.3 billion
and
$11.4 billion
, respectively, compared with $10.2 billion and $11.6 billion, respectively, during fiscal 2018.
Costs and Expenses
Our total costs and expenses were as follows:
|
Fiscal Years Ended
|
Percentage of Revenues
|
|||||||||||||
|
(in millions)
|
March 31, 2019
|
March 31, 2018
|
2019
|
2018
|
||||||||||
|
Costs of services (excludes depreciation and amortization and restructuring costs)
|
$
|
14,946
|
|
$
|
16,317
|
|
72.1
|
%
|
75.0
|
%
|
||||
|
Selling, general and administrative (excludes depreciation and amortization and restructuring costs)
|
1,959
|
|
1,890
|
|
9.4
|
|
8.7
|
|
||||||
|
Depreciation and amortization
|
1,968
|
|
1,795
|
|
9.5
|
|
8.3
|
|
||||||
|
Restructuring costs
|
465
|
|
789
|
|
2.2
|
|
3.6
|
|
||||||
|
Interest expense, net
|
206
|
|
231
|
|
1.0
|
|
1.1
|
|
||||||
|
Other income, net
|
(306
|
)
|
(593
|
)
|
(1.5
|
)
|
(2.7
|
)
|
||||||
|
Total costs and expenses
|
$
|
19,238
|
|
$
|
20,429
|
|
92.7
|
%
|
94.0
|
%
|
||||
35
The
1.3%
improvement in costs and expenses, as a percentage of revenue for fiscal 2019, reflects continued execution of our synergy initiatives, including workforce optimization, supply chain efficiencies and rationalization of our real estate footprint.
Costs of Services
Cost of services (excluding depreciation and amortization and restructuring costs) ("COS"), was
$14.9 billion
for fiscal 2019, as compared to
$16.3 billion
for fiscal 2018. COS decreased
$1.4 billion
, and as a percentage of revenue decreased
2.9%
, compared to fiscal 2018. This decrease was driven by headcount reduction and procurement efficiencies. Employee labor costs, as a percentage of revenue, decreased in both segments and across our geographic regions, year-over-year.
Selling, General and Administrative
Selling (general and administrative expense, excluding depreciation and amortization and restructuring costs) ("SG&A"), was
$2.0 billion
for fiscal 2019, as compared to
$1.9 billion
for fiscal 2018. SG&A increased
$0.1 billion
, and as a percentage of revenue increased
0.7%
, compared to fiscal 2018. The increase in SG&A reflects an increase in integration, separation, and transaction-related costs and allocated worldwide support costs.
Integration, separation and transaction-related costs, included in SG&A, were
$401 million
during fiscal 2019, as compared to
$359 million
during fiscal 2018.
Depreciation and Amortization
Depreciation and amortization expense ("D&A") was
$2.0 billion
for fiscal 2019, compared to
$1.8 billion
for fiscal 2018. The increase in D&A was primarily due to an increase in depreciation expense from leased equipment and an increase in amortization expense related to accelerated transition and transformation contract costs as compared to fiscal 2018.
Restructuring Costs
Restructuring costs represent severance related to workforce optimization programs and expense associated with facilities and data center rationalization.
During fiscal 2019 we initiated certain restructuring actions across our segments and geographies. The fiscal 2019 global cost savings initiatives were designed to better align our organizational structure with our strategic initiatives and continue the integration of HPES and other acquisitions.
Total restructuring costs recorded, net of reversals, during fiscal
2019
and
2018
were
$465 million
and
$789 million
, respectively. The net amounts recorded included
$2 million
and
$13 million
of pension benefit augmentations for fiscal
2019
and
2018
, respectively, owed to certain employees under legal or contractual obligations. These augmentations will be paid as part of normal pension distributions over several years.
See Note
20
- "
Restructuring Costs
" for additional information about our restructuring actions.
Interest Expense and Interest Income
Interest expense for fiscal
2019
was
$334 million
as compared to
$320 million
in fiscal
2018
. Interest income for fiscal
2019
was
$128 million
, as compared to
$89 million
in fiscal
2018
. The year-over-year increase in interest expense and interest income was primarily due to our cash pool arrangements. The increase in cash pool expense was partially offset by a decrease in interest expense related to our borrowings.
Other Income, Net
Other income, net includes non-service cost components of net periodic pension income, movement in foreign currency exchange rates on our foreign currency denominated assets and liabilities and the related economic hedges, equity earnings of unconsolidated affiliates, gain on sale of non-operating assets and other miscellaneous gains and losses.
36
The components of other income, net for fiscal 2019 and fiscal 2018 are as follows:
|
Fiscal Years Ended
|
||||||||
|
(in millions)
|
March 31, 2019
|
March 31, 2018
|
||||||
|
Non-service cost components of net periodic pension income
|
$
|
(182
|
)
|
$
|
(509
|
)
|
||
|
Foreign currency loss (gain)
|
31
|
|
(71
|
)
|
||||
|
Other gain
|
(155
|
)
|
(13
|
)
|
||||
|
Total
|
$
|
(306
|
)
|
$
|
(593
|
)
|
||
The
$287 million
decrease in other income for fiscal 2019 was due to a year-over-year decrease of $327 million in non-service components of net periodic pension income and a year-over-year unfavorable foreign currency impact of $102 million resulting primarily from a gain recognized as a result of a change in the functional currency of a European holding company during fiscal 2018, which was not present in the current fiscal year. These decreases were partially offset by a $142 million increase in other gains primarily due to sales of non-operating assets during fiscal 2019.
Taxes
Our effective tax rate ("ETR") on income (loss) from continuing operations, before taxes, for fiscal
2019
and
2018
was
19.0%
and
(18.6)%
respectively. A reconciliation of the differences between the U.S. federal statutory rate and the ETR, as well as other information about our income tax provision, is provided in Note
11
- "
Income Taxes
."
In fiscal 2019, the ETR was primarily impacted by:
|
•
|
Local tax losses on investments in Luxembourg that decreased the foreign tax rate differential and decreased the ETR by $
360 million
and
23.7%
, respectively, with an offsetting increase in the ETR due to an increase in the valuation allowance of the same amount.
|
|
•
|
A change in the net valuation allowance on certain deferred tax assets, primarily in Luxembourg, Germany, Spain, UK, and Switzerland, which increased income tax expense and increased the ETR by
$256 million
and
16.9%
, respectively.
|
|
•
|
A decrease in the transition tax liability and a change in tax accounting method for deferred revenue, which decreased income tax expense and decreased the ETR by $
66 million
and
4.3%
, respectively.
|
In fiscal 2018, the ETR was primarily impacted by:
|
•
|
Due to the Company's change in repatriation policy, the reversal of a deferred tax liability relating to the outside basis difference of foreign subsidiaries which increased the income tax benefit and decreased the ETR by
$554 million
and
42.5%
, respectively.
|
|
•
|
The accrual of the one-time transition tax on estimated unremitted foreign earnings, which decreased the income tax benefit and increased the ETR by
$361 million
and
27.7%
, respectively.
|
|
•
|
The remeasurement of deferred tax assets and liabilities, which increased the income tax benefit and decreased the ETR by
$338 million
and
25.9%
, respectively.
|
As of March 31, 2018, our net deferred tax assets in certain DXC German entities were primarily the result of net operating loss carryforwards, pension, restructuring, and other miscellaneous accruals. A full valuation allowance was recorded against these net deferred tax assets as of that reporting date. For the period ended December 31, 2018 management determined that the positive evidence, including the duration of the current profitability due to realization of cost synergies relating to the HPES merger, a legal entity restructuring allowing the future utilization of net operating loss carryforwards and the nonrecurring nature of the factors that primarily drove historical losses outweighs the negative evidence of a three-year cumulative loss. Therefore, as of December 31, 2018, management had a change in judgment and concluded that it is now more likely than not that the net deferred tax assets in these DXC German entities will be fully utilized. As a result, we have recorded a valuation allowance release of $
113 million
. As of March 31, 2019, management had no change in our conclusions regarding the positive and negative evidence and future realizability of these DXC German entities' deferred tax assets.
The IRS is examining CSC's federal income tax returns for fiscal 2008 through 2017. With respect to CSC's fiscal 2008 through 2010 federal tax returns, we previously entered into negotiations for a resolution through settlement with the IRS
37
Office of Appeals. The IRS examined several issues for this audit that resulted in various audit adjustments. We have an agreement in principle with the IRS Office of Appeals as to some but not all of these adjustments. We have agreed to extend the statute of limitations associated with this audit through November 30, 2019. In addition, during the first quarter of fiscal 2018, we received a Revenue Agent’s Report with proposed adjustments to CSC's fiscal 2011 through 2013 federal returns. We have filed a protest of certain of these adjustments to the IRS Office of Appeals. The IRS is also examining CSC's fiscal 2014 through 2017 federal income tax returns. We have not received any proposed adjustments for this cycle. We continue to believe that our tax positions are more likely than not sustainable and that we will ultimately prevail. The Company now expects to reach a resolution for all years no earlier than fiscal 2021.
In addition, we may settle certain other tax examinations, have lapses in statutes of limitations, or voluntarily settle income tax positions in negotiated settlements for different amounts than we have accrued as uncertain tax positions. We may need to accrue and ultimately pay additional amounts for tax positions that previously met a more likely than not standard if such positions are not upheld. Conversely, we could settle positions by payment with the tax authorities for amounts lower than those that have been accrued or extinguish a position through payment. We believe the outcomes that are reasonably possible within the next twelve months may result in a reduction in liability for uncertain tax positions of $9 million, excluding interest, penalties, and tax carryforwards.
Income from Discontinued Operations
Income from discontinued operations reflects the net income generated by USPS. As the Separation occurred on May 31, 2018, there are only two months of USPS results included in fiscal 2019.
Earnings Per Share
Diluted EPS from continuing operations for fiscal
2019
was
$4.35
, a decrease of
$0.88
per share compared with the prior fiscal year. The EPS decrease was due to a decrease of
$319 million
in income from continuing operations.
Diluted EPS for fiscal
2019
includes
$1.25
per share of restructuring costs,
$1.06
per share of transaction, separation and integration-related costs,
$1.42
per share of amortization of acquired intangible assets,
$0.41
per share of pension and OPEB actuarial and settlement losses and
$(0.16)
per share of tax adjustment related to U.S. tax reform.
Non-GAAP Financial Measures
We present non-GAAP financial measures of performance which are derived from the statements of operations of DXC. These non-GAAP financial measures include earnings before interest and taxes ("EBIT"), adjusted EBIT, non-GAAP income before income taxes, non-GAAP net income and non-GAAP EPS, constant currency revenues and net debt-to-total capitalization.
We present these non-GAAP financial measures to provide investors with meaningful supplemental financial information, in addition to the financial information presented on a GAAP basis. Non-GAAP financial measures exclude certain items from GAAP results which DXC management believes are not indicative of core operating performance. DXC management believes these non-GAAP measures allow investors to better understand the financial performance of DXC exclusive of the impacts of corporate-wide strategic decisions. DXC management believes that adjusting for these items provides investors with additional measures to evaluate the financial performance of our core business operations on a comparable basis from period to period. DXC management believes the non-GAAP measures provided are also considered important measures by financial analysts covering DXC, as equity research analysts continue to publish estimates and research notes based on our non-GAAP commentary, including our guidance around non-GAAP EPS targets.
There are limitations to the use of the non-GAAP financial measures presented in this report. One of the limitations is that they do not reflect complete financial results. We compensate for this limitation by providing a reconciliation between our non-GAAP financial measures and the respective most directly comparable financial measure calculated and presented in accordance with GAAP. Additionally, other companies, including companies in our industry, may calculate non-GAAP financial measures differently than we do, limiting the usefulness of those measures for comparative purposes between companies.
38
Non-GAAP financial measures and the respective most directly comparable financial measures calculated and presented in accordance with GAAP include:
|
Fiscal Years Ended
|
|||||||||||||||
|
(in millions)
|
March 31, 2019
|
March 31, 2018
|
Change
|
Percent Change
|
|||||||||||
|
Income from continuing operations
|
$
|
1,515
|
|
$
|
1,304
|
|
$
|
211
|
|
16.2
|
%
|
||||
|
Non-GAAP income from continuing operations
|
$
|
3,063
|
|
$
|
2,758
|
|
$
|
305
|
|
11.1
|
%
|
||||
|
Net income
|
$
|
1,262
|
|
$
|
1,782
|
|
$
|
(520
|
)
|
(29.2
|
)%
|
||||
|
Adjusted EBIT
|
$
|
3,269
|
|
$
|
2,989
|
|
$
|
280
|
|
9.4
|
%
|
||||
Reconciliation of Non-GAAP Financial Measures
Our non-GAAP adjustments include:
|
•
|
Restructuring - reflects costs, net of reversals, related to workforce optimization and real estate charges.
|
|
•
|
Transaction, separation and integration-related costs - reflects costs related to integration planning, financing and advisory fees associated with the HPES Merger and other acquisitions and costs related to the separation of USPS.
|
|
•
|
Amortization of acquired intangible assets - reflects amortization of intangible assets acquired through business combinations.
|
|
•
|
Pension and OPEB actuarial and settlement gains and losses - reflects pension and OPEB actuarial and settlement gains and losses.
|
|
•
|
Tax adjustment - reflects the estimated non-recurring benefit of the Tax Cuts and Jobs Act of 2017 for fiscal 2019 and the application of an approximate 28% tax rate for fiscal 2018, which is within the targeted effective tax rate range for the prior year.
|
39
A reconciliation of reported results to non-GAAP results is as follows:
|
Fiscal Year Ended March 31, 2019
|
||||||||||||||||||||||||||||
|
(in millions, except per-share amounts)
|
As Reported
|
Restructuring Costs
|
Transaction, Separation and Integration-Related Costs
|
Amortization of Acquired Intangible Assets
|
Pension and OPEB Actuarial and Settlement Losses
|
Tax Adjustment
|
Non-GAAP Results
|
|||||||||||||||||||||
|
Costs of services (excludes depreciation and amortization and restructuring costs)
|
$
|
14,946
|
|
$
|
—
|
|
$
|
—
|
|
$
|
—
|
|
$
|
—
|
|
$
|
—
|
|
$
|
14,946
|
|
|||||||
|
Selling, general and administrative (excludes depreciation and amortization and restructuring costs)
|
1,959
|
|
—
|
|
(401
|
)
|
—
|
|
—
|
|
—
|
|
1,558
|
|
||||||||||||||
|
Income from continuing operations, before taxes
|
1,515
|
|
465
|
|
401
|
|
539
|
|
143
|
|
—
|
|
3,063
|
|
||||||||||||||
|
Income tax expense
|
288
|
|
112
|
|
102
|
|
138
|
|
27
|
|
44
|
|
711
|
|
||||||||||||||
|
Income from continuing operations
|
1,227
|
|
353
|
|
299
|
|
401
|
|
116
|
|
(44
|
)
|
2,352
|
|
||||||||||||||
|
Income from discontinued operations, net of taxes
|
35
|
|
—
|
|
—
|
|
—
|
|
—
|
|
—
|
|
35
|
|
||||||||||||||
|
Net income
|
1,262
|
|
353
|
|
299
|
|
401
|
|
116
|
|
(44
|
)
|
2,387
|
|
||||||||||||||
|
Less: net income attributable to non-controlling interest, net of tax
|
5
|
|
—
|
|
—
|
|
—
|
|
—
|
|
—
|
|
5
|
|
||||||||||||||
|
Net income attributable to DXC common stockholders
|
$
|
1,257
|
|
$
|
353
|
|
$
|
299
|
|
$
|
401
|
|
$
|
116
|
|
$
|
(44
|
)
|
$
|
2,382
|
|
|||||||
|
Effective Tax Rate
|
19.0
|
%
|
23.2
|
%
|
||||||||||||||||||||||||
|
Basic EPS from continuing operations
|
$
|
4.40
|
|
$
|
1.27
|
|
$
|
1.08
|
|
$
|
1.44
|
|
$
|
0.42
|
|
$
|
(0.16
|
)
|
$
|
8.46
|
|
|||||||
|
Diluted EPS from continuing operations
|
$
|
4.35
|
|
$
|
1.25
|
|
$
|
1.06
|
|
$
|
1.42
|
|
$
|
0.41
|
|
$
|
(0.16
|
)
|
$
|
8.34
|
|
|||||||
|
Weighted average common shares outstanding for:
|
||||||||||||||||||||||||||||
|
Basic EPS
|
277.54
|
|
277.54
|
|
277.54
|
|
277.54
|
|
277.54
|
|
277.54
|
|
277.54
|
|
||||||||||||||
|
Diluted EPS
|
281.43
|
|
281.43
|
|
281.43
|
|
281.43
|
|
281.43
|
|
281.43
|
|
281.43
|
|
||||||||||||||
*
The net periodic pension cost within income from continuing operations includes
$700 million
of actual return on plan assets, whereas the net periodic pension cost within non-GAAP income from continuing operations includes
$570 million
of expected long-term return on pension assets of defined benefit plans subject to interim remeasurement.
40
|
Fiscal Year Ended March 31, 2018
|
||||||||||||||||||||||||||||
|
(in millions, except per-share amounts)
|
As Reported
|
Restructuring Costs
|
Transaction, Separation and Integration-Related Costs
|
Amortization of Acquired Intangible Assets
|
Pension and OPEB Actuarial and Settlement Gains
|
Tax Adjustment
|
Non-GAAP Results
|
|||||||||||||||||||||
|
Costs of services (excludes depreciation and amortization and restructuring costs)
|
$
|
16,317
|
|
$
|
—
|
|
$
|
—
|
|
$
|
—
|
|
$
|
—
|
|
$
|
—
|
|
$
|
16,317
|
|
|||||||
|
Selling, general and administrative (excludes depreciation and amortization and restructuring costs)
|
1,890
|
|
—
|
|
(359
|
)
|
—
|
|
—
|
|
—
|
|
1,531
|
|
||||||||||||||
|
Income from continuing operations, before taxes
|
1,304
|
|
789
|
|
359
|
|
526
|
|
(220
|
)
|
—
|
|
2,758
|
|
||||||||||||||
|
Income tax (benefit) expense
|
(242
|
)
|
—
|
|
—
|
|
—
|
|
—
|
|
1,013
|
|
771
|
|
||||||||||||||
|
Income from continuing operations
|
1,546
|
|
789
|
|
359
|
|
526
|
|
(220
|
)
|
(1,013
|
)
|
1,987
|
|
||||||||||||||
|
Income from discontinued operations, net of taxes
|
236
|
|
—
|
|
—
|
|
—
|
|
—
|
|
—
|
|
236
|
|
||||||||||||||
|
Net income
|
1,782
|
|
789
|
|
359
|
|
526
|
|
(220
|
)
|
(1,013
|
)
|
2,223
|
|
||||||||||||||
|
Less: net income attributable to non-controlling interest, net of tax
|
31
|
|
—
|
|
—
|
|
—
|
|
—
|
|
—
|
|
31
|
|
||||||||||||||
|
Net income attributable to DXC common stockholders
|
$
|
1,751
|
|
$
|
789
|
|
$
|
359
|
|
$
|
526
|
|
$
|
(220
|
)
|
$
|
(1,013
|
)
|
$
|
2,192
|
|
|||||||
|
Effective Tax Rate
|
(18.6
|
)%
|
28.0
|
%
|
||||||||||||||||||||||||
|
Basic EPS from continuing operations
|
$
|
5.32
|
|
$
|
2.77
|
|
$
|
1.26
|
|
$
|
1.85
|
|
$
|
(0.77
|
)
|
$
|
(3.56
|
)
|
$
|
6.86
|
|
|||||||
|
Diluted EPS from continuing operations
|
$
|
5.23
|
|
$
|
2.72
|
|
$
|
1.24
|
|
$
|
1.82
|
|
$
|
(0.76
|
)
|
$
|
(3.50
|
)
|
$
|
6.75
|
|
|||||||
|
Weighted average common shares outstanding for:
|
||||||||||||||||||||||||||||
|
Basic EPS
|
284.93
|
|
284.93
|
|
284.93
|
|
284.93
|
|
284.93
|
|
284.93
|
|
284.93
|
|
||||||||||||||
|
Diluted EPS
|
289.77
|
|
289.77
|
|
289.77
|
|
289.77
|
|
289.77
|
|
289.77
|
|
289.77
|
|
||||||||||||||
*
The net periodic pension cost within income from continuing operations includes
$371 million
of actual return on plan assets, whereas the net periodic pension cost within non-GAAP income from continuing operations includes
$534 million
of expected long-term return on pension assets of defined benefit plans subject to interim remeasurement.
Reconciliations of net income to adjusted EBIT and pro forma adjusted EBIT are as follows:
|
Fiscal Years Ended
|
||||||||
|
(in millions)
|
March 31, 2019
|
March 31, 2018
|
||||||
|
Net income
|
$
|
1,262
|
|
$
|
1,782
|
|
||
|
Income from discontinued operations, net of taxes
|
(35
|
)
|
(236
|
)
|
||||
|
Income tax expense (benefit)
|
288
|
|
(242
|
)
|
||||
|
Interest income
|
(128
|
)
|
(89
|
)
|
||||
|
Interest expense
|
334
|
|
320
|
|
||||
|
EBIT
|
1,721
|
|
1,535
|
|
||||
|
Restructuring costs
|
465
|
|
789
|
|
||||
|
Transaction, separation and integration-related costs
|
401
|
|
359
|
|
||||
|
Amortization of acquired intangible assets
|
539
|
|
526
|
|
||||
|
Pension and OPEB actuarial and settlement losses (gains)
|
143
|
|
(220
|
)
|
||||
|
Adjusted EBIT
|
$
|
3,269
|
|
$
|
2,989
|
|
||
41
Liquidity and Capital Resources
Cash and Cash Equivalents and Cash Flows
As of March 31, 2019, our cash and cash equivalents ("cash") were
$2.9 billion
, of which
$1.4 billion
was held outside of the United States. A substantial portion of funds can be returned to the U.S. from funds advanced previously to finance our foreign acquisition initiatives. As a result of the Tax Cuts and Jobs Act of 2017, and after the mandatory one-time income inclusion (deemed repatriation) of the historically untaxed earnings of our foreign subsidiaries and current income inclusions for global intangible low taxed income, we expect a significant portion of the cash held by our foreign subsidiaries will no longer be subject to U.S. federal income tax consequences upon subsequent repatriation to the U.S. However, a portion of this cash may still be subject to foreign income tax consequences upon future remittance. Therefore, if additional funds held outside the U.S. are needed for our operations in the U.S. we plan to repatriate these funds.
Cash and cash equivalents increased
$0.3 billion
during fiscal 2018 to
$2.9 billion
, primarily due to changes in operating activities. The cash flows of USPS have not been segregated and are included in the statements of cash flows for the fiscal year ended March 31, 2018 and through the separation date of May 31, 2018 in the statements of cash flows for the fiscal year ended March 31, 2019.
The following table summarizes our cash flow activity:
|
Fiscal Year Ended
|
||||||||||||
|
(in millions)
|
March 31, 2019
|
March 31, 2018
|
March 31, 2017
|
|||||||||
|
Net cash provided by operating activities
|
$
|
1,783
|
|
$
|
2,567
|
|
$
|
619
|
|
|||
|
Net cash provided by (used in) investing activities
|
69
|
|
719
|
|
(565
|
)
|
||||||
|
Net cash (used in) provided by financing activities
|
(1,663
|
)
|
(1,890
|
)
|
93
|
|
||||||
|
Effect of exchange rate changes on cash and cash equivalents
|
(19
|
)
|
65
|
|
(60
|
)
|
||||||
|
Net increase in cash and cash equivalents
|
170
|
|
1,461
|
|
87
|
|
||||||
|
Cash and cash equivalents at beginning of year
|
2,729
|
|
1,268
|
|
1,181
|
|
||||||
|
Cash and cash equivalents at the end of period
|
$
|
2,899
|
|
$
|
2,729
|
|
$
|
1,268
|
|
|||
Operating cash flow
Net cash provided by operating activities during fiscal 2019 was
$1,783 million
as compared to
$2,567 million
during fiscal 2018. The decrease of
$784 million
was predominately due to a decrease in net income of $520 million, a change in net accounts receivables of
$483 million
, and other working capital. This was partially offset by additional deferred tax adjustments of $939 million.
Net cash provided by operating activities during fiscal 2018 was
$2,567 million
as compared to
$619 million
during fiscal 2017. The increase of
$1,948 million
was predominately due to an increase in net income of
$1,882 million
. The increase in cash provided by operating activities during fiscal 2018 was partially offset by additional deferred tax adjustments to operating activities of $842 million and an increase in the gain on pension and other post-employment benefits of $307 million.
Investing cash flow
Net cash provided by investing activities during fiscal 2019
decreased
$650 million
to
$69 million
. The decrease was due to net cash provided by acquisitions of
$735 million
during fiscal 2018, compared with cash paid for acquisitions of
$365 million
during fiscal 2019. In addition, there was an increase in cash payments for outsourcing contract costs of
$66 million
, software purchases of
$50 million
and purchase of property and equipment of
$73 million
. The decrease in net cash provided by investing activities was offset by additional proceeds from sale of assets of
$299 million
and cash collections from deferred purchase price receivables of
$399 million
.
42
Net cash provided by (used in) investing activities during fiscal 2018 was
$719 million
as compared to
$(565) million
for fiscal 2017. The increase was predominantly due to net cash provided by acquisitions of $735 million during fiscal 2018, compared with cash paid for acquisitions of $434 million during fiscal 2017. The increase in net cash provided by (used in) investing activities was partially offset by an increase in cash payments for outsourcing contract costs of $227 million and software purchases of $71 million.
Financing cash flow
Net cash used in financing activities during fiscal 2019 was
$1,663 million
, as compared to
$1,890 million
during fiscal 2018. The
$227 million
decrease in net cash used in financing activities was primarily due to repayments of
$737 million
in fiscal 2018, which did not recur in the current year, additional draws on long-term debt of
$1,025 million
, and borrowings of
$1,114 million
for the USPS Separation. This was partially offset by additional payments on long-term debt obligations of
$1,078 million
, repurchases of common stock of
$1,212 million
, and a decrease in cash proceeds from bond issuance of
$236 million
.
Net cash (used in) provided by financing activities during fiscal 2018 was $(1,890) million, as compared to $93 million during fiscal 2017. The $1,983 million increase in net cash used by financing activities was primarily due to a decrease in credit facility draws, net of repayments of $868 million, additional payments on capitalized lease obligations of $915 million, additional payments on long-term debt obligations of $1,379 million and $132 million in payments for repurchases of common stock. These cash outflows were partially offset by draws on long-term debt of $462 million and cash proceeds from bond issuance of $989 million.
Capital Resources
See Note
21
- "
Commitments and Contingencies
" for a discussion of the general purpose of guarantees and commitments. The anticipated sources of funds to fulfill such commitments are listed below and under the subheading "Liquidity."
The following table summarizes out total debt:
|
As of
|
||||||||
|
(in millions)
|
March 31, 2019
|
March 31, 2018
|
||||||
|
Short-term debt and current maturities of long-term debt
|
$
|
1,942
|
|
$
|
1,918
|
|
||
|
Long-term debt, net of current maturities
|
5,470
|
|
6,092
|
|
||||
|
Total debt
|
$
|
7,412
|
|
$
|
8,010
|
|
||
The
$0.6 billion
decrease in total debt during fiscal 2019 was primarily attributed to the repayment of $899 million principal amount of the USD term loan due 2022. This debt repayment was financed from the cash payment received from Perspecta in connection with the Separation.
During fiscal 2019, we completed a senior note offering in an aggregate principal of
€650 million
due 2026 and entered into term loan credit agreements in aggregate principal amounts of
£450 million
maturing in fiscal 2022 and AUD 800 million maturing in fiscal 2021. The proceeds of these credit facilities were used to repay debt and for general corporate purposes. Also, we amended our commercial paper program to issue short-term commercial paper notes up to a maximum aggregate amount outstanding at any time of €1 billion or its equivalent in U.S. dollars.
Additionally, during fiscal 2019, we entered into a term loan credit agreement consisting of three tranches (the "delayed draw term loan"): (i) $500 million maturing five years following the funding date; (ii) €750 million maturing two years following the funding date; and (iii) €750 million maturing three years following the funding date. The proceeds of this term loan will be used to finance in part the acquisition of Luxoft and for general corporate purposes. The term loan is undrawn as of March 31, 2019.
43
We were in compliance with all financial covenants associated with our borrowings as of March 31, 2019 and March 31, 2018.
The maturity chart below summarizes the future maturities of long-term debt principal for fiscal years subsequent to
March 31, 2019
and excludes maturities of borrowings for assets acquired under long-term financing and capitalized lease liabilities. For more information on our debt, see Note
12
- "
Debt
" to the financial statements.
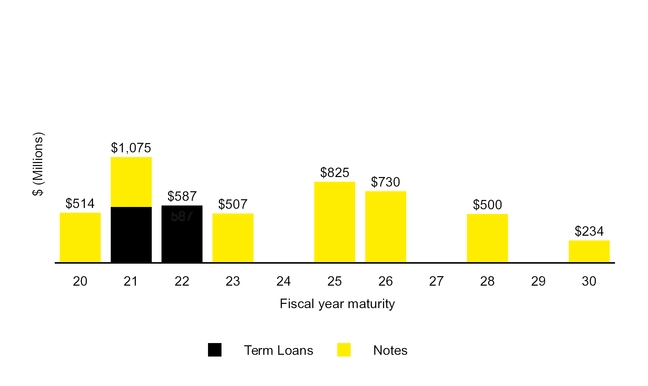
The following table summarizes our capitalization ratios:
|
As of
|
||||||||
|
(in millions)
|
March 31, 2019
|
March 31, 2018
|
||||||
|
Total debt
|
$
|
7,412
|
|
$
|
8,010
|
|
||
|
Cash and cash equivalents
|
2,899
|
|
2,593
|
|
||||
|
Net debt
(1)
|
$
|
4,513
|
|
$
|
5,417
|
|
||
|
Total debt
|
$
|
7,412
|
|
$
|
8,010
|
|
||
|
Equity
|
11,725
|
|
13,837
|
|
||||
|
Total capitalization
|
$
|
19,137
|
|
$
|
21,847
|
|
||
|
Debt-to-total capitalization
|
38.7
|
%
|
36.7
|
%
|
||||
|
Net debt-to-total capitalization
(1)
|
23.6
|
%
|
24.8
|
%
|
||||
(1)
Net debt and Net debt-to-total capitalization are non-GAAP measures used by management to assess our ability to service our debts using only our cash and cash equivalents. We present these non-GAAP measures to assist investors in analyzing our capital structure in a more comprehensive way compared to gross debt based ratios alone.
44
The decrease in net debt-to-total capitalization was due to a
$0.9 billion
decrease in net debt, attributed to a
$0.6 billion
decrease in total debt. The decrease in net debt was partially offset by a
$2.1 billion
decrease in equity resulting primarily from the Separation of USPS and share repurchases.
As of
March 31, 2019
, our credit ratings were as follows:
|
Rating Agency
|
Rating
|
Outlook
|
Short Term Ratings
|
|||
|
Fitch
|
BBB+
|
Stable
|
F-2
|
|||
|
Moody's
|
Baa2
|
Stable
|
P-2
|
|||
|
S&P
|
BBB
|
Stable
|
-
|
|||
Subsequent to the January 2019 announcement by DXC and Luxoft of a definitive agreement for DXC to acquire Luxoft, Fitch, Moody's and S&P affirmed their ratings and outlook for DXC.
See Note
21
- "
Commitments and Contingencies
" for a discussion of the general purpose of guarantees and commitments. The anticipated sources of funds to fulfill such commitments are listed below.
Liquidity
We expect our existing cash and cash equivalents, together with cash generated from operations, will be sufficient to meet our normal operating requirements for the next 12 months. We expect to continue using cash generated by operations as a primary source of liquidity; however, should we require funds greater than that generated from our operations to fund discretionary investment activities, such as business acquisitions, we have the ability to draw on our multi-currency revolving credit facility or raise capital through the issuance of capital market debt instruments such as commercial paper, term loans, and bonds. In addition, we currently utilize, and will further utilize, our cross currency cash pool for liquidity needs. However, there is no guarantee that we will be able to obtain debt financing, if required, on terms and conditions acceptable to us, if at all, in the future.
Our exposure to operational liquidity risk is primarily from long-term contracts which require significant investment of cash during the initial phases of the contracts. The recovery of these investments is over the life of the contract and is dependent upon our performance as well as customer acceptance.
The following table summarizes our total liquidity:
|
As of
|
||||
|
(in millions)
|
March 31, 2019
|
|||
|
Cash and cash equivalents
|
$
|
2,899
|
|
|
|
Available borrowings under our revolving credit facility
|
4,000
|
|
||
|
Available borrowings under our delayed draw term loan
|
2,185
|
|
||
|
Total liquidity
|
$
|
9,084
|
|
|
Share Repurchases
During fiscal 2018, our Board of Directors authorized the repurchase of up to
$2.0 billion
of our common stock and on November 8, 2018, we announced that our Board of Directors had approved an incremental
$2.0 billion
share repurchase authorization. An expiration date has not been established for this repurchase plan. During fiscal 2019, we repurchased
19,342,586
shares of our common stock at an aggregate cost of
$1,339 million
.
Dividends
During fiscal 2019, our Board of Directors declared aggregate cash dividends to our stockholders of
$0.76
per share, or approximately
$209 million
. Future dividends are subject to customary board review and approval prior to declaration.
45
Off-Balance Sheet Arrangements
In the normal course of business, we are a party to arrangements that include guarantees, the receivables securitization facility and certain other financial instruments with off-balance sheet risk, such as letters of credit and surety bonds. We also use performance letters of credit to support various risk management insurance policies. No liabilities related to these arrangements are reflected in balance sheets. See Note
5
- "
Receivables
" and Note
21
- "
Commitments and Contingencies
" for additional information regarding these off-balance sheet arrangements.
Contractual Obligations
Our contractual obligations as of
March 31, 2019
, were as follows:
|
(in millions)
|
Less than
1 year
|
2-3 years
|
4-5 years
|
More than
5 years
|
Total
|
|||||||||||||||
|
Debt
(1)
|
$
|
766
|
|
$
|
1,920
|
|
$
|
557
|
|
$
|
2,290
|
|
$
|
5,533
|
|
|||||
|
Capitalized lease liabilities
|
482
|
|
490
|
|
155
|
|
—
|
|
1,127
|
|
||||||||||
|
Operating Leases
|
657
|
|
637
|
|
288
|
|
274
|
|
1,856
|
|
||||||||||
|
Purchase Obligations
(2)
|
2,286
|
|
1,514
|
|
675
|
|
25
|
|
4,500
|
|
||||||||||
|
U.S. Tax Reform - Transition Tax
(3)
|
26
|
|
52
|
|
75
|
|
145
|
|
298
|
|
||||||||||
|
Interest and preferred dividend payments
(4)
|
184
|
|
283
|
|
185
|
|
224
|
|
876
|
|
||||||||||
|
Total
(5)
|
$
|
4,401
|
|
$
|
4,896
|
|
$
|
1,935
|
|
$
|
2,958
|
|
$
|
14,190
|
|
|||||
(1)
Amounts represent scheduled principal payments of long-term debt and mandatory redemption of preferred stock of a consolidated subsidiary.
(2)
Includes long-term purchase agreements with certain software, hardware, telecommunication and other service providers and exclude agreements that are cancelable without penalty. If we do not meet the specified service minimums, we may have an obligation to pay the service provider a portion of or the entire shortfall.
(3)
The transition tax, which has now been determined to be complete, resulted in recording a total transition tax obligation of $316 million, of which $324 million was recorded as income tax liability and $(8) million recorded as a reduction in our unrecognized tax benefits, which has been omitted from this table. The transition tax is payable over eight years; 8% of net tax liability in each of years 1-5, 15% in year 6, 20% in year 7, and 25% in year 8. We have made our first payment. See Note
11
- "
Income Taxes
" for additional information about the transition tax.
(4)
Amounts represent scheduled interest payments on long-term debt and scheduled dividend payments associated with the mandatorily redeemable preferred stock of a consolidated subsidiary excluding contingent dividends associated with the participation and variable appreciation premium features.
(5)
See Note
13
- "
Pension and Other Benefit Plans
" for the estimated liability related to estimated future benefit payments under our Pension and OPEB plans that have been omitted from this table.
Critical Accounting Policies and Estimates
The preparation of financial statements, in accordance with GAAP, requires us to make estimates and judgments that affect the reported amounts of assets, liabilities, revenues and expenses, as well as the disclosure of contingent assets and liabilities. These estimates may change in the future if underlying assumptions or factors change. Accordingly, actual results could differ materially from our estimates under different assumptions, judgments or conditions. We consider the following policies to be critical because of their complexity and the high degree of judgment involved in implementing them: revenue recognition, income taxes, business combinations, defined benefit plans and valuation of assets. We have discussed the selection of our critical accounting policies and the effect of estimates with the audit committee of our board of directors.
Revenue Recognition
Most of our revenues are recognized based on objective criteria and do not require significant estimates that may change over time. However, some arrangements may require significant estimates, including contracts which include multiple performance obligations
.
46
Contracts with Multiple performance obligations
Many of our contracts require us to provide a range of services or performance obligations to our customers, which may include a combination of services, products or both. As a result, significant judgment may be required to determine the appropriate accounting, including whether the elements specified in contracts with multiple performance obligations should be treated as separate performance obligations for revenue recognition purposes, and, when considered appropriate, how the total transaction price should be allocated among the performance obligations and the timing of revenue recognition for each. For contracts with multiple performance obligations, we allocate the contract’s transaction price to each performance obligation based on the relative standalone selling price of each distinct good or service in the contract. Other than software sales involving multiple performance obligations, the primary method used to estimate standalone selling price is the expected cost plus a margin approach, under which we forecast our expected costs of satisfying a performance obligation and then add an appropriate margin for that distinct good or service. Certain of our contracts involve the sale of DXC proprietary software, post contract customer support and other software-related services. The standalone selling price generally is determined for each performance obligation using an adjusted market assessment approach based on the price charged where each deliverable is sold separately. In certain limited cases (typically for software licenses) when the historical selling price is highly variable, the residual approach is used. This approach allocates revenue to the performance obligation equal to the difference between the total transaction price and the observable standalone selling prices for the other performance obligations. These methods involve significant judgments and estimates that we assess periodically by considering market and entity-specific factors, such as type of customer, features of the products or services and market conditions.
Once the total revenues have been allocated to the various performance obligations, revenues for each are recognized based on the relevant revenue recognition method for each. Estimates of total revenues at contract inception often differ materially from actual revenues due to volume differences, changes in technology or other factors which may not be foreseen at inception.
Costs to obtain contracts with customers
Accounting for the costs to obtain contracts with customers requires significant judgments and estimates with regards to the determination of sales commission payments that qualify for deferral of costs and the related amortization period. Most of our sales commission plans are quota-based and payments are made by achieving targets related to a large number of new and renewed contracts. Certain sales commissions earned by our sales force are considered incremental and recoverable costs of obtaining a contract with a customer. We defer and amortize these costs on a straight-line basis over an average period of benefit of five years, which is determined and regularly assessed by considering the length of our customer contracts, our technology and other factors. Significant changes in these estimates or impairment may result if material contracts terminate earlier than the expected benefit period, or if there are material changes in the average contract period.
Income Taxes
We are subject to income taxes in the United States (federal and state) and numerous foreign jurisdictions. Significant judgment is required in determining our provision for income taxes, analyzing our income tax reserves, the determination of the likelihood of recoverability of deferred tax assets and any corresponding adjustment of valuation allowances. In addition, our tax returns are routinely audited and settlements of issues raised in these audits sometimes affect our tax provisions.
As a global enterprise, our ETR is affected by many factors, including our global mix of earnings among countries with differing statutory tax rates, the extent to which our non-U.S. earnings are indefinitely reinvested outside the U.S., changes in the valuation allowance for deferred tax assets, changes in tax regulations, acquisitions, dispositions and the tax characteristics of our income. We cannot predict what our ETR will be in the future because there is uncertainty regarding these factors.
47
As a result of the Tax Cuts and Jobs Act (the "Act"), in the fiscal year ending March 31, 2018, we changed our ASC 740-30 assertion with respect to the remaining CSC foreign subsidiaries and no longer consider current and accumulated earnings for all non-U.S. subsidiaries permanently reinvested, except for current year Indian earnings. The
$554 million
deferred tax liability relating to HPES foreign subsidiaries was released and the
$46 million
liability for the India dividend distribution tax was reversed in the current period as the Company changed its reinvestment assertion relating to certain India earnings due to a change in cash requirements of the U.S. parent and India.
Considerations impacting the recoverability of deferred tax assets include the period of expiration of the tax asset, planned use of the tax asset and historical and projected taxable income as well as tax liabilities for the tax jurisdiction to which the tax asset relates. In determining whether the deferred tax assets are realizable, we consider all available positive and negative evidence, including future reversals of existing taxable temporary differences, taxable income in prior carryback years, projected future taxable income, tax planning strategies and recent financial operations. We recorded a valuation allowance against deferred tax assets of approximately $
1.6 billion
as of March 31, 2019 due to uncertainties related to the ability to utilize these assets. However, valuation allowances are subject to change in future reporting periods due to changes in various factors.
Changes in tax laws, such as the Act or changes in tax laws resulting from the Organization for Economic Co-operation and Development’s multi-jurisdictional plan of action to address “base erosion and profit shifting” could impact our effective tax rate. The calculation of our tax liabilities involves uncertainties in the application of complex changing tax regulations. As discussed in Note 11 - "Income Taxes", for example, the Act provides provisions that limit interest expense, provide for immediate expensing of qualified assets, further limits executive compensation deductions, generally eliminates Federal tax on foreign dividend distributions, subjects certain payments from U.S. corporations to foreign related parties to additional taxes, places restrictions or eliminates certain exclusions, deductions and credits and generally broadens the tax base. Further guidance for these provisions is forthcoming and the laws are subject to change in future periods.
Business Combinations
We account for the acquisition of a business using the acquisition method of accounting, which requires us to estimate the fair values of the assets acquired and liabilities assumed. This includes acquired intangible assets such as customer-related intangibles, the liabilities assumed and contingent consideration, if any. Liabilities assumed may include litigation and other contingency reserves existing at the time of acquisition and require judgment in ascertaining the related fair values. Independent appraisals may be used to assist in the determination of the fair value of certain assets and liabilities. Such appraisals are based on significant estimates provided by us, such as forecasted revenues or profits utilized in determining the fair value of contract-related acquired intangible assets or liabilities. Significant changes in assumptions and estimates subsequent to completing the allocation of the purchase price to the assets and liabilities acquired, as well as differences in actual and estimated results, could result in material impacts to our financial results. Adjustments to the fair value of contingent consideration are recorded in earnings. Additional information related to the acquisition date fair value of acquired assets and liabilities obtained during the allocation period, not to exceed one year, may result in changes to the recorded values of acquired assets and liabilities, resulting in an offsetting adjustment to the goodwill associated with the business acquired.
Defined Benefit Plans
The computation of our pension and other post-retirement benefit costs and obligations is dependent on various assumptions. Inherent in the application of the actuarial methods are key assumptions, including discount rates, expected long-term rates of return on plan assets, mortality rates, rates of compensation increases and medical cost trend rates. Our management evaluates these assumptions annually and updates assumptions as necessary. The fair value of assets is determined based on observable inputs for similar assets or on significant unobservable inputs if not available. Two of the most significant assumptions are the expected long-term rate of return on plan assets and the discount rate.
48
Our weighted average rates used were:
|
March 31, 2019
|
March 31, 2018
|
March 31, 2017
|
|||||||
|
Discount rates
|
2.5
|
%
|
2.5
|
%
|
3.1
|
%
|
|||
|
Expected long-term rates of return on assets
|
5.3
|
%
|
4.9
|
%
|
6.3
|
%
|
|||
The assumption for the expected long-term rate of return on plan assets is impacted by the expected asset mix of the plan; judgments regarding the correlation between historical excess returns and future excess returns and expected investment expenses. The discount rate assumption is based on current market rates for high-quality, fixed income debt instruments with maturities similar to the expected duration of the benefit payment period. The following table provides the impact changes in the weighted-average assumptions would have had on our net periodic pension benefits and settlement and contractual termination charges for fiscal 2019:
|
(in millions)
|
Change
|
Approximate Change in Net Periodic Pension Expense
|
Approximate Change in Settlement, Contractual Termination, and Mark-to-Market Charges
|
|||||||
|
Expected long-term return on plan assets
|
0.5%
|
$
|
(54
|
)
|
$
|
53
|
|
|||
|
Expected long-term return on plan assets
|
(0.5)%
|
$
|
54
|
|
$
|
(53
|
)
|
|||
|
Discount rate
|
0.5%
|
$
|
19
|
|
$
|
(898
|
)
|
|||
|
Discount rate
|
(0.5)%
|
$
|
(24
|
)
|
$
|
1,138
|
|
|||
Valuation of Assets
We review long-lived ("assets, intangible assets, and goodwill") for impairment in accordance with our accounting policy disclosed in Note
1
-
Summary of Significant Accounting Policies
. Assessing the fair value of assets involves significant estimates and assumptions including estimation of future cash flows, the timing of such cash flows, and discount rates reflecting the risk inherent in projecting future cash flows. The valuation of long-lived and intangible assets involves management estimates about future values and remaining useful lives of assets, particularly purchased intangible assets. These estimates are subjective and can be affected by a variety of factors, including external factors such as industry and economic trends, and internal factors such as changes in our business strategy and forecasts.
Evaluation of goodwill for impairment requires judgment, including the identification of reporting units, assignment of assets, liabilities, and goodwill to reporting units and determination of the fair value of each reporting unit. The estimates used to calculate the fair value of a reporting unit change from year to year based on operating results, market conditions, and other factors. Changes in these estimates and assumptions include a significant change in the business climate, established business plans, operating performance indicators or competition which could materially affect the determination of fair value for each reporting unit.
We estimate the fair value of our reporting units using a combination of an income approach, utilizing a discounted cash flow analysis, and a market approach, using market multiples. The discount rate used in an income approach is based on our weighted-average cost of capital and may be adjusted for the relevant risks associated with business-specific characteristics and any uncertainty related to a reporting unit's ability to execute on the projected future cash flows.
49
ITEM 7A. QUANTITATIVE AND QUALITATIVE DISCLOSURES ABOUT MARKET RISK
As a multinational company, we are exposed to certain market risks such as changes in foreign currency exchange rates and interest rates. Changes in foreign currency exchange rates can impact our foreign currency denominated monetary assets and liabilities and forecasted transactions in foreign currency, whereas changes in benchmark interest rates can impact interest expense associated with our floating interest rate debt and the fair value of our fixed interest rate debt. A variety of practices are employed to manage these risks, including operating and financing activities and the use of derivative instruments. We do not use derivatives for trading or speculative purposes.
Presented below is a description of our risks together with a sensitivity analysis of each of these risks based on selected changes in market rates. The foreign currency model incorporates the impact of diversification from holding multiple currencies and the correlation of revenues, costs and any related short-term contract financing in the same currency. In order to determine the impact of changes in interest rates on our future results of operations and cash flows, we calculated the increase or decrease in the index underlying these rates. We estimate the fair value of our long-term debt primarily using an expected present value technique using interest rates offered to us for instruments with similar terms and remaining maturities. These analyses reflect management's view of changes that are reasonably possible to occur over a one-year period.
Foreign Currency Risk
We are exposed to both favorable and unfavorable movements in foreign currency exchange rates. In the ordinary course of business, we enter into contracts denominated in foreign currencies. Exposure to fluctuations in foreign currency exchange rates arising from these contracts is analyzed during the contract bidding process. We generally manage these contracts by incurring costs in the same currency in which revenues are received and any related short-term contract financing requirements are met by borrowing in the same currency. Thus, by generally matching revenues, costs and borrowings to the same currency, we are able to mitigate a portion of the foreign currency risk to earnings. However, due to our increased use of offshore labor centers, we have become more exposed to fluctuations in foreign currency exchange rates. We experienced significant foreign currency fluctuations during fiscal 2019 due primarily to the volatility of the British pound and Euro in relation to the U.S. dollar. Significant foreign currency fluctuations during fiscal 2018 was due primarily to the volatility of Euro in relation to the U.S. dollar and during fiscal 2017 due primarily to the volatility of the British pound in relation to the U.S. dollar.
We have policies and procedures to manage exposure to fluctuations in foreign currency by using short-term foreign currency forward contracts to economically hedge certain foreign currency denominated assets and liabilities, including intercompany accounts and loans. For accounting purposes, these foreign currency forward contracts are not designated as hedges and changes in their fair value are reported in current period earnings within other (income) expense, net in the statements of operations. We also use foreign currency forward contracts to reduce foreign currency exchange rate risk related to certain Indian rupee denominated intercompany obligations and forecasted transactions. For accounting purposes these foreign currency forward contracts are designated as cash flow hedges with critical terms that match the hedged items; therefore, the changes in fair value of these forward contracts are recorded in accumulated other comprehensive income, net of taxes in the statements of comprehensive income and subsequently classified into net income in the period during which the hedged transactions are recognized in net income.
50
We have foreign currency risks related to our revenue and operating expenses denominated in currencies other than U.S. dollar, see Note
18
- "
Segment and Geographic Information
". During fiscal
2019
, approximately
63%
of our revenues were generated outside of the United States. For the year ended
March 31, 2019
, a hypothetical
10%
change in the value of the U.S. dollar against all currencies would have changed revenues by approximately
6.3%
, or
$1.3 billion
. The majority of this fluctuation would be offset by expenses incurred in local currency and as a result, there would not be a material change to our income from continuing operations, before taxes. As such, in the view of management, the resulting impact would not be material to our results of operations or cash flows.
Interest Rate Risk
As of
March 31, 2019
, we had outstanding debt with varying maturities for an aggregate carrying amount of
$7.4 billion
, of which
$2.4 billion
was floating interest rate debt. Most of our floating interest rate debt is based upon varying terms of adjusted LIBOR rates; consequently, changes in LIBOR result in the most volatility to our interest expense. As of
March 31, 2019
, an assumed
10%
unfavorable change in interest rates would not be material to our consolidated results of operations or cash flows. A change in interest rates related to our long-term debt would not have a material impact on our financial statements as we do not record our debt at fair value.
51
ITEM 8. FINANCIAL STATEMENTS AND SUPPLEMENTARY DATA
Index to Consolidated Financial Statements
|
Page
|
|
52
REPORT OF INDEPENDENT REGISTERED PUBLIC ACCOUNTING FIRM
To the Board of Directors and Stockholders of
DXC Technology Company
Tysons, Virginia
Opinion on the Financial Statements
We have audited the accompanying consolidated balance sheets of DXC Technology Company and subsidiaries (the "Company") as of March 31, 2019 and 2018, the related consolidated statements of operations, comprehensive income (loss), cash flows and changes in equity, for each of the three years in the period ended March 31, 2019, and the related notes (collectively referred to as the "financial statements"). In our opinion, the financial statements present fairly, in all material respects, the financial position of the Company as of March 31, 2019 and 2018, and the results of its operations and its cash flows for each of the three years in the period ended March 31, 2019, in conformity with accounting principles generally accepted in the United States of America.
We have also audited, in accordance with the standards of the Public Company Accounting Oversight Board (United States) (PCAOB), the Company's internal control over financial reporting as of March 31, 2019, based on criteria established in
Internal Control - Integrated Framework (2013)
issued by the Committee of Sponsoring Organizations of the Treadway Commission and our report dated
June 12, 2019
, expressed an unqualified opinion on the Company's internal control over financial reporting.
Basis for Opinion
These financial statements are the responsibility of the Company's management. Our responsibility is to express an opinion on the Company's financial statements based on our audits. We are a public accounting firm registered with the PCAOB and are required to be independent with respect to the Company in accordance with the U.S. federal securities laws and the applicable rules and regulations of the Securities and Exchange Commission and the PCAOB.
We conducted our audits in accordance with the standards of the PCAOB. Those standards require that we plan and perform the audit to obtain reasonable assurance about whether the financial statements are free of material misstatement, whether due to error or fraud. Our audits included performing procedures to assess the risks of material misstatement of the financial statements, whether due to error or fraud, and performing procedures that respond to those risks. Such procedures included examining, on a test basis, evidence regarding the amounts and disclosures in the financial statements. Our audits also included evaluating the accounting principles used and significant estimates made by management, as well as evaluating the overall presentation of the financial statements. We believe that our audits provide a reasonable basis for our opinion.
/s/ DELOITTE & TOUCHE LLP
McLean, Virginia
June 12, 2019
We have served as the Company's auditor since at least 1965; however, the specific year has not been determined.
53
DXC TECHNOLOGY COMPANY
CONSOLIDATED BALANCE SHEETS
|
As of
|
||||||||
|
(in millions, except per share and share amounts)
|
March 31, 2019
|
March 31, 2018
|
||||||
|
ASSETS
|
|
|||||||
|
Current assets:
|
||||||||
|
Cash and cash equivalents
|
$
|
2,899
|
|
$
|
2,593
|
|
||
|
Receivables, net of allowance for doubtful accounts of $60 and $40
|
5,181
|
|
5,481
|
|
||||
|
Prepaid expenses
|
627
|
|
496
|
|
||||
|
Other current assets
|
359
|
|
469
|
|
||||
|
Assets of discontinued operations
|
—
|
|
581
|
|
||||
|
Total current assets
|
9,066
|
|
9,620
|
|
||||
|
Intangible assets, net of accumulated amortization of $3,399 and $2,603
|
5,939
|
|
6,376
|
|
||||
|
Goodwill
|
7,606
|
|
7,619
|
|
||||
|
Deferred income taxes, net
|
355
|
|
373
|
|
||||
|
Property and equipment, net of accumulated depreciation of $3,958 and $3,686
|
3,179
|
|
3,363
|
|
||||
|
Other assets
|
3,429
|
|
3,207
|
|
||||
|
Assets of discontinued operations - non-current
|
—
|
|
3,363
|
|
||||
|
Total Assets
|
$
|
29,574
|
|
$
|
33,921
|
|
||
|
LIABILITIES and EQUITY
|
||||||||
|
Current liabilities:
|
||||||||
|
Short-term debt and current maturities of long-term debt
|
$
|
1,942
|
|
$
|
1,918
|
|
||
|
Accounts payable
|
1,666
|
|
1,513
|
|
||||
|
Accrued payroll and related costs
|
652
|
|
744
|
|
||||
|
Accrued expenses and other current liabilities
|
3,355
|
|
3,120
|
|
||||
|
Deferred revenue and advance contract payments
|
1,630
|
|
1,641
|
|
||||
|
Income taxes payable
|
208
|
|
127
|
|
||||
|
Liabilities of discontinued operations
|
—
|
|
789
|
|
||||
|
Total current liabilities
|
9,453
|
|
9,852
|
|
||||
|
Long-term debt, net of current maturities
|
5,470
|
|
6,092
|
|
||||
|
Non-current deferred revenue
|
256
|
|
795
|
|
||||
|
Non-current pension obligations
|
790
|
|
879
|
|
||||
|
Non-current income tax liabilities and deferred tax liabilities
|
1,184
|
|
1,166
|
|
||||
|
Other long-term liabilities
|
696
|
|
844
|
|
||||
|
Liabilities of discontinued operations - long-term
|
—
|
|
456
|
|
||||
|
Total Liabilities
|
17,849
|
|
20,084
|
|
||||
|
Commitments and contingencies
|
|
|
|
|
||||
|
DXC stockholders’ equity:
|
||||||||
|
Preferred stock, par value $0.01 per share; authorized 1,000,000 shares; none issued as of March 31, 2019 and March 31, 2018
|
—
|
|
—
|
|
||||
|
Common stock, par value $0.01 per share; authorized 750,000,000 shares; issued 270,213,891 as of March 31, 2019 and 286,393,147 as of March 31, 2018
|
3
|
|
3
|
|
||||
|
Additional paid-in capital
|
11,301
|
|
12,210
|
|
||||
|
Retained earnings
|
478
|
|
1,301
|
|
||||
|
Accumulated other comprehensive (loss) income
|
(244
|
)
|
58
|
|
||||
|
Treasury stock, at cost, 1,788,658 and 1,016,947 shares as of March 31, 2019 and March 31, 2018
|
(136
|
)
|
(85
|
)
|
||||
|
Total DXC stockholders’ equity
|
11,402
|
|
13,487
|
|
||||
|
Non-controlling interest in subsidiaries
|
323
|
|
350
|
|
||||
|
Total Equity
|
11,725
|
|
13,837
|
|
||||
|
Total Liabilities and Equity
|
$
|
29,574
|
|
$
|
33,921
|
|
||
The accompanying notes are an integral part of these consolidated financial statements.
54
DXC TECHNOLOGY COMPANY
CONSOLIDATED STATEMENTS OF OPERATIONS
CONSOLIDATED STATEMENTS OF OPERATIONS
|
Fiscal Years Ended
|
||||||||||||
|
(in millions, except per-share amounts)
|
March 31, 2019
|
March 31, 2018
|
March 31, 2017
|
|||||||||
|
Revenues
|
$
|
20,753
|
|
$
|
21,733
|
|
$
|
7,607
|
|
|||
|
Costs of services (excludes depreciation and amortization and restructuring costs)
|
14,946
|
|
16,317
|
|
5,549
|
|
||||||
|
Selling, general and administrative (excludes depreciation and amortization and restructuring costs)
|
1,959
|
|
1,890
|
|
1,282
|
|
||||||
|
Depreciation and amortization
|
1,968
|
|
1,795
|
|
647
|
|
||||||
|
Restructuring costs
|
465
|
|
789
|
|
238
|
|
||||||
|
Interest expense
|
334
|
|
320
|
|
117
|
|
||||||
|
Interest income
|
(128
|
)
|
(89
|
)
|
(35
|
)
|
||||||
|
Other income, net
|
(306
|
)
|
(593
|
)
|
(17
|
)
|
||||||
|
Total costs and expenses
|
19,238
|
|
20,429
|
|
7,781
|
|
||||||
|
Income (loss) from continuing operations, before taxes
|
1,515
|
|
1,304
|
|
(174
|
)
|
||||||
|
Income tax expense (benefit)
|
288
|
|
(242
|
)
|
(74
|
)
|
||||||
|
Income (loss) from continuing operations
|
1,227
|
|
1,546
|
|
(100
|
)
|
||||||
|
Income from discontinued operations, net of taxes
|
35
|
|
236
|
|
—
|
|
||||||
|
Net income (loss)
|
1,262
|
|
1,782
|
|
(100
|
)
|
||||||
|
Less: net income attributable to non-controlling interest, net of tax
|
5
|
|
31
|
|
23
|
|
||||||
|
Net income (loss) attributable to DXC common stockholders
|
$
|
1,257
|
|
$
|
1,751
|
|
$
|
(123
|
)
|
|||
|
Income (loss) per common share
|
||||||||||||
|
Basic:
|
||||||||||||
|
Continuing operations
|
$
|
4.40
|
|
$
|
5.32
|
|
$
|
(0.88
|
)
|
|||
|
Discontinued operations
|
0.13
|
|
0.83
|
|
—
|
|
||||||
|
$
|
4.53
|
|
$
|
6.15
|
|
$
|
(0.88
|
)
|
||||
|
Diluted:
|
||||||||||||
|
Continuing operations
|
$
|
4.35
|
|
$
|
5.23
|
|
$
|
(0.88
|
)
|
|||
|
Discontinued operations
|
0.12
|
|
0.81
|
|
—
|
|
||||||
|
$
|
4.47
|
|
$
|
6.04
|
|
$
|
(0.88
|
)
|
||||
The accompanying notes are an integral part of these consolidated financial statements.
55
DXC TECHNOLOGY COMPANY
CONSOLIDATED STATEMENTS OF COMPREHENSIVE INCOME (LOSS)
CONSOLIDATED STATEMENTS OF COMPREHENSIVE INCOME (LOSS)
|
Fiscal Years Ended
|
||||||||||||||
|
(in millions)
|
March 31, 2019
|
March 31, 2018
|
March 31, 2017
|
|||||||||||
|
Net income (loss)
|
$
|
1,262
|
|
$
|
1,782
|
|
$
|
(100
|
)
|
|||||
|
Other comprehensive (loss) income, net of taxes:
|
||||||||||||||
|
Foreign currency translation adjustments, net of tax (benefit) expense of $(1), $75 and $5
|
(259
|
)
|
197
|
|
(75
|
)
|
||||||||
|
Cash flow hedges adjustment, net of tax (benefit) expense of $(3), $(3) and $12
|
(12
|
)
|
(11
|
)
|
21
|
|
||||||||
|
Available-for-sale securities, net of tax expense of $0, $2 and $0
|
—
|
|
9
|
|
—
|
|
||||||||
|
Pension and other post-retirement benefit plans, net of tax:
|
||||||||||||||
|
Prior service cost, net of tax (benefit) expense of $(5), $8 and $0
|
(21
|
)
|
38
|
|
—
|
|
||||||||
|
Amortization of transition obligation, net of tax expense of $0, $0, and $0
|
—
|
|
1
|
|
1
|
|
||||||||
|
Amortization of prior service cost, net of tax benefit of $2, $4 and $5
|
(13
|
)
|
(14
|
)
|
(12
|
)
|
||||||||
|
Foreign currency exchange loss, net of tax benefit of $0, $0 and $1
|
—
|
|
—
|
|
(2
|
)
|
||||||||
|
Pension and other post-retirement benefit plans, net of tax
|
(34
|
)
|
25
|
|
(13
|
)
|
||||||||
|
Other comprehensive (loss) income, net of taxes
|
(305
|
)
|
220
|
|
(67
|
)
|
||||||||
|
Comprehensive income (loss)
|
957
|
|
2,002
|
|
(167
|
)
|
||||||||
|
Less: comprehensive income attributable to non-controlling interest
|
2
|
|
31
|
|
7
|
|
||||||||
|
Comprehensive income (loss) attributable to DXC common stockholders
|
$
|
955
|
|
$
|
1,971
|
|
$
|
(174
|
)
|
|||||
The accompanying notes are an integral part of these consolidated financial statements.
56
DXC TECHNOLOGY COMPANY
CONSOLIDATED STATEMENTS OF CASH FLOWS
CONSOLIDATED STATEMENTS OF CASH FLOWS
|
Fiscal Years Ended
|
||||||||||||
|
(in millions)
|
March 31, 2019
|
March 31, 2018
(1) (2)
|
March 31, 2017
(1)
|
|||||||||
|
Cash flows from operating activities:
|
||||||||||||
|
Net income (loss)
|
$
|
1,262
|
|
$
|
1,782
|
|
$
|
(100
|
)
|
|||
|
Adjustments to reconcile net income (loss) to net cash provided by operating activities:
|
||||||||||||
|
Depreciation and amortization
|
2,023
|
|
2,014
|
|
658
|
|
||||||
|
Pension & other post-employment benefits, actuarial & settlement losses (gains)
|
143
|
|
(220
|
)
|
87
|
|
||||||
|
Share-based compensation
|
74
|
|
93
|
|
75
|
|
||||||
|
Deferred taxes
|
97
|
|
(842
|
)
|
(92
|
)
|
||||||
|
(Gain) loss on dispositions
|
(163
|
)
|
4
|
|
6
|
|
||||||
|
Provision for losses on accounts receivable
|
(10
|
)
|
45
|
|
4
|
|
||||||
|
Unrealized foreign currency exchange losses
|
30
|
|
22
|
|
24
|
|
||||||
|
Impairment losses and contract write-offs
|
—
|
|
41
|
|
8
|
|
||||||
|
Amortization of debt issuance costs and (premium) discount
|
(10
|
)
|
(4
|
)
|
17
|
|
||||||
|
Cash surrender value in excess of premiums paid
|
(11
|
)
|
(11
|
)
|
(7
|
)
|
||||||
|
Other non-cash charges, net
|
11
|
|
4
|
|
—
|
|
||||||
|
Changes in assets and liabilities, net of effects of acquisitions and dispositions:
|
||||||||||||
|
Increase in receivables
|
(947
|
)
|
(464
|
)
|
(25
|
)
|
||||||
|
Increase in prepaid expenses and other current assets
|
(632
|
)
|
(196
|
)
|
(29
|
)
|
||||||
|
(Decrease) increase in accounts payable and accruals
|
(52
|
)
|
(96
|
)
|
54
|
|
||||||
|
(Decrease) increase in income taxes payable and income tax liability
|
(107
|
)
|
303
|
|
(32
|
)
|
||||||
|
(Decrease) increase in advance contract payments and deferred revenue
|
(74
|
)
|
130
|
|
(67
|
)
|
||||||
|
Other operating activities, net
|
149
|
|
(38
|
)
|
38
|
|
||||||
|
Net cash provided by operating activities
|
1,783
|
|
2,567
|
|
619
|
|
||||||
|
Cash flows from investing activities:
|
||||||||||||
|
Purchases of property and equipment
|
(297
|
)
|
(224
|
)
|
(246
|
)
|
||||||
|
Payments for transition and transformation contract costs
|
(394
|
)
|
(328
|
)
|
(101
|
)
|
||||||
|
Software purchased and developed
|
(261
|
)
|
(211
|
)
|
(140
|
)
|
||||||
|
Cash acquired through HPES Merger
|
—
|
|
938
|
|
—
|
|
||||||
|
Payments for acquisitions, net of cash acquired
|
(365
|
)
|
(203
|
)
|
(434
|
)
|
||||||
|
Business dispositions
|
(65
|
)
|
—
|
|
3
|
|
||||||
|
Cash collections related to deferred purchase price receivable
|
1,084
|
|
685
|
|
359
|
|
||||||
|
Proceeds from sale of assets
|
357
|
|
58
|
|
57
|
|
||||||
|
Other investing activities, net
|
10
|
|
4
|
|
(63
|
)
|
||||||
|
Net cash provided by (used in) investing activities
|
69
|
|
719
|
|
(565
|
)
|
||||||
|
Cash flows from financing activities:
|
||||||||||||
|
Borrowings of commercial paper
|
2,747
|
|
2,413
|
|
2,191
|
|
||||||
|
Repayments of commercial paper
|
(2,840
|
)
|
(2,297
|
)
|
(2,086
|
)
|
||||||
|
Borrowings under lines of credit
|
—
|
|
—
|
|
920
|
|
||||||
|
Repayment of borrowings under lines of credit
|
—
|
|
(737
|
)
|
(789
|
)
|
||||||
|
Borrowings on long-term debt, net of discount
|
1,646
|
|
621
|
|
159
|
|
||||||
|
Principal payments on long-term debt
|
(2,625
|
)
|
(1,547
|
)
|
(168
|
)
|
||||||
|
Payments on capital leases and borrowings for asset financing
|
(944
|
)
|
(1,060
|
)
|
(145
|
)
|
||||||
|
Borrowings for USPS spin transaction
|
1,114
|
|
—
|
|
—
|
|
||||||
|
Proceeds from bond issuance
|
753
|
|
989
|
|
—
|
|
||||||
57
|
Proceeds from structured sale of facility
|
—
|
|
—
|
|
85
|
|
||||||
|
Proceeds from stock options and other common stock transactions
|
47
|
|
138
|
|
54
|
|
||||||
|
Taxes paid related to net share settlements of share-based compensation awards
|
(54
|
)
|
(76
|
)
|
(13
|
)
|
||||||
|
Repurchase of common stock
|
(1,344
|
)
|
(132
|
)
|
—
|
|
||||||
|
Dividend payments
|
(210
|
)
|
(174
|
)
|
(78
|
)
|
||||||
|
Other financing activities, net
|
47
|
|
(28
|
)
|
(37
|
)
|
||||||
|
Net cash (used in) provided by financing activities
|
(1,663
|
)
|
(1,890
|
)
|
93
|
|
||||||
|
Effect of exchange rate changes on cash and cash equivalents
|
(19
|
)
|
65
|
|
(60
|
)
|
||||||
|
Net increase in cash and cash equivalents
|
170
|
|
1,461
|
|
87
|
|
||||||
|
Cash and cash equivalents at beginning of year
|
2,729
|
|
1,268
|
|
1,181
|
|
||||||
|
Cash and cash equivalents at end of year
|
$
|
2,899
|
|
$
|
2,729
|
|
$
|
1,268
|
|
|||
|
(1)
|
Fiscal 2018 and fiscal 2017 have been adjusted to give effect to the retrospective adoption of ASU 2016-15. See Note 22 - "
Reconciliation of Previously Reported Amounts to Recast Financial Statements
."
|
|
(2)
|
As a result of the USPS Separation, the Consolidated Statements of Operations, Consolidated Balance Sheets, and related financial information reflect USPS's operations and assets and liabilities as discontinued operations for all periods presented. The cash flows of USPS have not been segregated and are included in the Consolidated Statement of Cash flows for the fiscal year ended March 31, 2018 and through the separation date of May 31, 2018 in the Consolidated Statement of Cash Flows for the fiscal year ended March 31, 2019.
|
The accompanying notes are an integral part of these consolidated financial statements.
58
DXC TECHNOLOGY COMPANY
CONSOLIDATED STATEMENTS OF CHANGES IN EQUITY
CONSOLIDATED STATEMENTS OF CHANGES IN EQUITY
|
(in millions, except shares in thousands)
|
Common Stock
|
Additional
Paid-in Capital
|
Retained Earnings (Accumulated Deficit)
|
Accumulated
Other
Comprehensive Loss
|
Treasury Stock
|
Total
DXC Equity
|
Non-
Controlling Interest
|
Total Equity
|
|||||||||||||||||||
|
Shares
|
Amount
|
||||||||||||||||||||||||||
|
Reported balance at April 1, 2016
|
148,747
|
|
$
|
149
|
|
$
|
2,439
|
|
$
|
33
|
|
$
|
(111
|
)
|
$
|
(485
|
)
|
$
|
2,025
|
|
$
|
7
|
|
$
|
2,032
|
|
|
|
Recapitalization adjustment
(1)
|
—
|
|
(148
|
)
|
148
|
|
—
|
|
—
|
|
—
|
|
—
|
|
—
|
|
—
|
|
|||||||||
|
Recast balance at April 1, 2016
|
148,747
|
|
$
|
1
|
|
$
|
2,587
|
|
$
|
33
|
|
$
|
(111
|
)
|
$
|
(485
|
)
|
$
|
2,025
|
|
$
|
7
|
|
$
|
2,032
|
|
|
|
Net (loss) income
|
(123
|
)
|
(123
|
)
|
23
|
|
(100
|
)
|
|||||||||||||||||||
|
Other comprehensive loss
|
(51
|
)
|
(51
|
)
|
(16
|
)
|
(67
|
)
|
|||||||||||||||||||
|
Share-based compensation expense
|
73
|
|
73
|
|
73
|
|
|||||||||||||||||||||
|
Acquisition of treasury stock
|
(12
|
)
|
(12
|
)
|
(12
|
)
|
|||||||||||||||||||||
|
Stock option exercises and other common stock transactions
(1)
|
3,185
|
|
|
56
|
|
56
|
|
56
|
|
||||||||||||||||||
|
Dividends declared ($0.56 per share)
|
(80
|
)
|
(80
|
)
|
(80
|
)
|
|||||||||||||||||||||
|
Noncontrolling interest distributions and other
|
—
|
|
(17
|
)
|
(17
|
)
|
|||||||||||||||||||||
|
Noncontrolling interest from acquisition
(2)
|
—
|
|
281
|
|
281
|
|
|||||||||||||||||||||
|
Balance at March 31, 2017
|
151,932
|
|
$
|
1
|
|
$
|
2,716
|
|
$
|
(170
|
)
|
$
|
(162
|
)
|
$
|
(497
|
)
|
$
|
1,888
|
|
$
|
278
|
|
$
|
2,166
|
|
|
|
Recapitalization adjustment
(1)
|
(10,633
|
)
|
—
|
|
(497
|
)
|
—
|
|
—
|
|
497
|
|
—
|
|
—
|
|
—
|
|
|||||||||
|
Recast balance at March 31, 2017
|
141,299
|
|
$
|
1
|
|
$
|
2,219
|
|
$
|
(170
|
)
|
$
|
(162
|
)
|
$
|
—
|
|
$
|
1,888
|
|
$
|
278
|
|
$
|
2,166
|
|
|
|
(1)
|
Certain prior year amounts were adjusted to retroactively reflect the legal capital of DXC.
|
|
(2)
|
See Note 2 - "Acquisitions"
|
|
(in millions, except shares in thousands)
|
Common Stock
|
Additional
Paid-in Capital
|
(Accumulated Deficit) Retained Earnings
|
Accumulated
Other
Comprehensive
(Loss) Income
|
Treasury Stock
|
Total
DXC Equity
|
Non-
Controlling Interest
|
Total Equity
|
|||||||||||||||||||
|
Shares
|
Amount
|
||||||||||||||||||||||||||
|
Reported balance at March 31, 2017
|
151,932
|
|
$
|
152
|
|
$
|
2,565
|
|
$
|
(170
|
)
|
$
|
(162
|
)
|
$
|
(497
|
)
|
$
|
1,888
|
|
$
|
278
|
|
$
|
2,166
|
|
|
|
Recapitalization adjustment
(1)
|
(10.633
|
)
|
(151
|
)
|
(346
|
)
|
497
|
|
|||||||||||||||||||
|
Recast balance at March 31, 2017
|
141,299
|
|
$
|
1
|
|
$
|
2,219
|
|
$
|
(170
|
)
|
$
|
(162
|
)
|
$
|
—
|
|
$
|
1,888
|
|
$
|
278
|
|
$
|
2,166
|
|
|
|
Business acquired in purchase, net of issuance costs
(2)
|
141,741
|
|
2
|
|
9,848
|
|
9,850
|
|
50
|
|
9,900
|
|
|||||||||||||||
|
Net income
|
1,751
|
|
1,751
|
|
31
|
|
1,782
|
|
|||||||||||||||||||
|
Other comprehensive income
|
220
|
|
220
|
|
|
220
|
|
||||||||||||||||||||
|
Share-based compensation expense
|
92
|
|
92
|
|
92
|
|
|||||||||||||||||||||
|
Acquisition of treasury stock
|
(85
|
)
|
(85
|
)
|
(85
|
)
|
|||||||||||||||||||||
|
Share repurchase program
|
(1,538
|
)
|
(66
|
)
|
(71
|
)
|
(137
|
)
|
(137
|
)
|
|||||||||||||||||
|
Stock option exercises and other common stock transactions
|
4,891
|
|
117
|
|
117
|
|
117
|
|
|||||||||||||||||||
|
Dividends declared ($0.72 per share)
|
(209
|
)
|
(209
|
)
|
(209
|
)
|
|||||||||||||||||||||
|
Noncontrolling interest distributions and other
|
—
|
|
(9
|
)
|
(9
|
)
|
|||||||||||||||||||||
|
Balance at March 31, 2018
|
286,393
|
|
$
|
3
|
|
$
|
12,210
|
|
$
|
1,301
|
|
$
|
58
|
|
$
|
(85
|
)
|
$
|
13,487
|
|
$
|
350
|
|
$
|
13,837
|
|
|
|
(1)
|
Certain prior year amounts were adjusted to retroactively reflect the legal capital of DXC.
|
|
(2)
|
See Note 2 - "Acquisitions"
|
59
|
(in millions, except shares in thousands)
|
Common Stock
|
Additional
Paid-in Capital
|
Retained Earnings
|
Accumulated
Other
Comprehensive
Income (Loss)
|
Treasury Stock
(1)
|
Total
DXC Equity
|
Non-
Controlling Interest
|
Total Equity
|
|||||||||||||||||||
|
Shares
|
Amount
|
||||||||||||||||||||||||||
|
Balance at March 31, 2018
|
286,393
|
|
$
|
3
|
|
$
|
12,210
|
|
$
|
1,301
|
|
$
|
58
|
|
$
|
(85
|
)
|
$
|
13,487
|
|
$
|
350
|
|
$
|
13,837
|
|
|
|
Cumulative effect of adopting the new revenue standard
|
114
|
|
114
|
|
114
|
|
|||||||||||||||||||||
|
Net income
|
1,257
|
|
1,257
|
|
5
|
|
1,262
|
|
|||||||||||||||||||
|
Other comprehensive loss
|
(302
|
)
|
(302
|
)
|
(3
|
)
|
(305
|
)
|
|||||||||||||||||||
|
Share-based compensation expense
|
74
|
|
74
|
|
74
|
|
|||||||||||||||||||||
|
Acquisition of treasury stock
|
(51
|
)
|
(51
|
)
|
(51
|
)
|
|||||||||||||||||||||
|
Share repurchase program
|
(19,343
|
)
|
(845
|
)
|
(494
|
)
|
(1,339
|
)
|
(1,339
|
)
|
|||||||||||||||||
|
Stock option exercises and other common stock transactions
|
3,164
|
|
37
|
|
37
|
|
37
|
|
|||||||||||||||||||
|
Dividends declared ($0.76 per share)
|
(209
|
)
|
(209
|
)
|
(209
|
)
|
|||||||||||||||||||||
|
Noncontrolling interest distributions and other
|
|
—
|
|
(29
|
)
|
(29
|
)
|
||||||||||||||||||||
|
Divestiture of USPS
|
(175
|
)
|
(1,491
|
)
|
(1,666
|
)
|
(1,666
|
)
|
|||||||||||||||||||
|
Balance at March 31, 2019
|
270,214
|
|
$
|
3
|
|
$
|
11,301
|
|
$
|
478
|
|
$
|
(244
|
)
|
$
|
(136
|
)
|
$
|
11,402
|
|
$
|
323
|
|
$
|
11,725
|
|
|
|
(1)
|
1,788,658
treasury shares as of March 31, 2019
|
The accompanying notes are an integral part of these consolidated financial statements.
60
DXC TECHNOLOGY COMPANY - NOTES TO CONSOLIDATED FINANCIAL STATEMENTS
Note
1
-
Summary of Significant Accounting Policies
Business
DXC Technology Company ("DXC" or the "Company") leads digital transformations for clients by modernizing and integrating their mainstream IT, and by deploying digital solutions at scale to produce better business outcomes. The company’s technology independence, global talent, and extensive partner network enable
6,000
private and public-sector clients in approximately
70
countries to thrive on change. DXC is a recognized leader in corporate responsibility.
Merger with HPES
On April 1, 2017, Computer Sciences Corporation ("CSC") completed its previously announced combination with the Enterprise Services business of Hewlett Packard Enterprise Company ("HPES"), which resulted in CSC becoming a wholly owned subsidiary of DXC (the "HPES Merger"). DXC common stock began regular-way trading under the symbol "DXC" on the New York Stock Exchange on April 3, 2017. See Note
2
- "
Acquisitions
" for further information.
Separation of USPS
On May 31, 2018, DXC completed the separation of its U.S. Public Sector business ("USPS") (the "Separation"), and combination of USPS with Vencore Holding Corp. ("Vencore") and KeyPoint Government Solutions ("Keypoint") (the "Mergers") to form Perspecta Inc. ("Perspecta"), an independent public company (collectively, the "USPS Separation and Mergers"). Under the terms of the separation agreements, on May 31, 2018, stockholders who held DXC common stock at the close of business on May 25, 2018 (the “Record Date”), received a distribution of one share of Perspecta common stock for every two shares of DXC common stock held as of the Record Date (the "Distribution"). See Note
3
- "
Divestitures
" for more information.
As a result of the Separation, the Consolidated Statements of Operations, Consolidated Balance Sheets, and related financial information reflect USPS's operations, assets and liabilities as discontinued operations for all periods presented. The cash flows of USPS have not been segregated and are included in the Consolidated Statement of Cash flows for the fiscal year ended March 31, 2018 and through the separation date of May 31, 2018 in the Consolidated Statement of Cash Flows for the fiscal year ended March 31, 2019. In addition, USPS is no longer a reportable segment. DXC's reportable segments are Global Business Services ("GBS") and Global Infrastructure Services ("GIS").
Basis of Presentation
In order to make this report easier to read, DXC refers throughout to (i) the Consolidated Financial Statements as the “financial statements,” (ii) the Consolidated Statements of Operations as the “statements of operations,” (iii) the Consolidated Statement of Comprehensive Income (loss) as the "statements of comprehensive Income," (iv) the Consolidated Balance Sheets as the “balance sheets,” and (v) the Consolidated Statements of Cash Flows as the “statements of cash flows.” In addition, references throughout to numbered “Notes” refer to the numbered Notes in these Notes to Consolidated Financial Statements, unless otherwise noted.
The accompanying financial statements have been prepared in accordance with the rules and regulations of the U.S. Securities and Exchange Commission for annual reports and accounting principles generally accepted in the United States ("GAAP"). The financial statements include the accounts of DXC, its consolidated subsidiaries, and those business entities in which DXC maintains a controlling interest. Investments in business entities in which the Company does not have control, but has the ability to exercise significant influence over operating and financial policies, are accounted for by the equity method. Other investments are accounted for by the cost method. Non-controlling interests are presented as a separate component within equity in the balance sheets. Net earnings attributable to the non-controlling interests are presented separately in the statements of operations, and comprehensive income attributable to non-controlling interests are presented separately in the statements of comprehensive income. All intercompany transactions and balances have been eliminated.
61
DXC TECHNOLOGY COMPANY - NOTES TO CONSOLIDATED FINANCIAL STATEMENTS
In connection with the HPES Merger, CSC was deemed the accounting acquirer of HPES for accounting purposes under GAAP, therefore, CSC is considered DXC's predecessor and the historical financial statements of CSC prior to April 1, 2017, are reflected in this Annual Report on Form 10-K as DXC's historical financial statements. Accordingly, the financial results of DXC as of and for any periods ending prior to April 1, 2017 do not include the financial results of HPES, and therefore, are not directly comparable.
During fiscal 2018, the Company changed its primary segment performance measure to segment profit from the previously reported consolidated segment operating income. See Note
18
- "
Segment and Geographic Information
" for more information. In addition, DXC effected a recapitalization of its common stock and preferred stock (the “Recapitalization”). The Recapitalization, which converted DXC's historical share price from par value
$1.00
per share to par value
$0.01
per share, resulted in no change to DXC's total stockholders’ equity or earnings per share.
Certain prior year amounts have been reclassified in the financial statements to conform to the current year presentation, specifically transition and transformation contract costs were reclassified from intangible assets, net to other assets within the balance sheets. Additionally, certain other reclassification were made as a result of the adoption of new accounting standards effective April 1, 2018. See New Accounting Standards below for more information.
Use of Estimates
The preparation of the financial statements, in accordance with GAAP, requires the Company's management to make estimates and assumptions that affect reported amounts of assets and liabilities at the date of the financial statements and the reported amounts of revenues and expenses during the reporting period. The Company bases its estimates on assumptions regarding historical experience, currently available information and anticipated developments that it believes are reasonable and appropriate. However, because the use of estimates involves an inherent degree of uncertainty, actual results could differ from those estimates. Estimates are used for, but not limited to, contracts accounted for using the percentage-of-completion method, cash flows used in the evaluation of impairment of goodwill and other long-lived assets, reserves for uncertain tax positions, valuation allowances on deferred tax assets, loss accruals for litigation and obligations related to our pension plans. In the opinion of the Company's management, the accompanying financial statements contain all adjustments necessary, including those of a normal recurring nature, to fairly present the financial statements.
Revenue Recognition
Effective April 1, 2018, the Company adopted ASU 2014-09, “Revenue from Contracts with Customers (ASC 606),” using the modified retrospective method. Refer to New Accounting Standards below and Note
19
- “
Revenue
” for further discussion of the impact of adoption and other required disclosures. The Company’s accounting policy related to the new revenue standard is summarized below.
The Company's primary service offerings are information technology outsourcing, other professional services, or a combination thereof. Revenues are recognized when control of the promised goods or services is transferred to DXC's customers, in an amount that reflects the consideration the Company expects to be entitled to in exchange for those goods or services.
DXC determines revenue recognition through the five-step model as follows:
|
•
|
Identification of the contract, or contracts, with a customer
|
|
•
|
Identification of the performance obligations in the contract
|
|
•
|
Determination of the transaction price
|
|
•
|
Allocation of the transaction price to the performance obligations in the contract
|
|
•
|
Recognition of revenue when, or as, the Company satisfies a performance obligation
|
62
DXC TECHNOLOGY COMPANY - NOTES TO CONSOLIDATED FINANCIAL STATEMENTS
DXC's IT outsourcing arrangements typically reflect a single performance obligation that comprises a series of distinct services which are substantially the same and provided over a period of time using the same measure of progress. Revenue derived from these arrangements is recognized over time based upon the level of services delivered in the distinct periods in which they are provided based on time increments. DXC's contracts often include upfront fees billed for activities to familiarize DXC with the client's operations, take control over their administration and operation, and adapt them to DXC's solutions. Upfront fees are generally recognized ratably over the contract period, which approximates the manner in which the services are provided. These activities typically do not qualify as performance obligations, and the related revenues are allocated to the relevant performance obligations and recognized ratably over time as the performance obligation is satisfied during the period in which DXC provides the related service, which is typically the life of the contract. Software transactions that include multiple performance obligations are described below.
For contracts with multiple performance obligations, DXC allocates the contract’s transaction price to each performance obligation based on the relative standalone selling price of each distinct good or service in the contract. Other than software sales involving multiple performance obligations, the primary method used to estimate standalone selling price is the expected cost plus a margin approach, under which the Company forecasts its expected costs of satisfying a performance obligation and then adds an appropriate margin for that distinct good or service.
The transaction price of a contract is determined based on fixed and variable consideration. Variable consideration related to the Company’s IT outsourcing offerings often include volume-based pricing that are allocated to the distinct days of the services to which the variable consideration pertains. However, in certain cases, estimates of variable consideration, including penalties, contingent milestone payments and rebates are necessary. The Company only includes estimates of variable consideration in the transaction price to the extent it is probable that a significant reversal of cumulative revenue recognized will not occur. These judgments involve consideration of historical and expected experience with the customer and other similar customers, and the facts and circumstances specific to the arrangement.
The Company generally provides its services under time and materials contracts, unit price contracts, fixed-price contracts, and software contracts for which revenue is recognized in the following manner:
Time and materials contracts
. Revenue is recognized over time at agreed-upon billing rates when services are provided.
Unit-price contracts.
Revenue is recognized over time based on unit metrics multiplied by the agreed upon contract unit price or when services are delivered.
Fixed-price contracts.
For certain fixed-price contracts, revenue is recognized over time using a method that measures the extent of progress towards completion of a performance obligation, generally using a cost-input method (referred to as the percentage-of-completion cost-to-cost method). Under the percentage-of-completion cost-to-cost method, revenue is recognized based on the proportion of total cost incurred to estimated total costs at completion. A performance obligation's estimate at completion includes all direct costs such as materials, labor, subcontractor costs, overhead, and a ratable portion of general and administrative costs. If output or input measures are not available or cannot be reasonably estimated, revenue is deferred until progress can be measured and costs are not deferred unless they meet the criteria for capitalization. Under the percentage-of-completion cost-to-cost method, progress towards completion is measured based on either achievement of specified contract milestones, costs incurred as a proportion of estimated total costs, or other measures of progress when appropriate. Profit in a given period is reported at the estimated profit margin to be achieved on the overall contract.
Software contracts.
Certain of DXC's arrangements involve the sale of DXC proprietary software, post contract customer support, and other software-related services. The standalone selling price generally is determined for each performance obligation using an adjusted market assessment approach based on the price charged where each deliverable is sold separately. In certain limited cases (typically for software licenses) when the historical selling price is highly variable, the residual approach is used. This approach allocates revenue to the performance obligation equal to the difference between the total transaction price and the observable standalone selling prices for the other performance obligations. Revenue from distinct software licenses is recognized at a point in time when the customer can first use the software license. If significant customization is required, software revenue is recognized as the related software customization services are performed in accordance with the percentage-of-completion method described above. Revenue for post contract customer support and other software services is recognized over time as those services are provided.
63
DXC TECHNOLOGY COMPANY - NOTES TO CONSOLIDATED FINANCIAL STATEMENTS
Practical Expedients and Exemptions
DXC does not adjust the promised amount of consideration for the effects of a significant financing component when the period between when DXC transfers a promised good or service to a customer and when the customer pays for that good or service will be one year or less.
In addition, the Company reports revenue net of any revenue-based taxes assessed by a governmental authority that are imposed on and concurrent with specific revenue-producing transactions, such as sales taxes and value-added taxes.
Contract Balances
The timing of revenue recognition, billings and cash collections results in accounts receivable (billed receivables, unbilled receivables and contract assets) and deferred revenue and advance contract payments (contract liabilities) on the Company's balance sheets. In arrangements that contain an element of customized software solutions, amounts are generally billed as work progresses in accordance with agreed-upon contractual terms, either at periodic intervals (e.g. monthly) or upon achievement of certain contractual milestones. Generally, billing occurs subsequent to revenue recognition, sometimes resulting in contract assets if the related billing is conditional upon more than just the passage of time. However, the Company sometimes receives advances or deposits from customers, before revenue is recognized, which results in the generation of contract liabilities. Payment terms vary by type of product or service being provided as well as by customer, although the term between invoicing and when payment is due is generally an insignificant period of time.
Costs to Obtain a Contract
Certain sales commissions earned by the Company's sales force are considered incremental and recoverable costs of obtaining a contract with a customer. The majority of sales commissions are paid based on the achievement of quota-based targets. These costs are deferred and amortized on a straight-line basis over an average period of benefit determined to be
five
years. The Company determined the period of benefit considering the length of its customer contracts, its technology and other factors. The period of benefit approximates the average stated contract terms, excluding expected future renewals, because sales commissions are paid upon contract renewal in a manner commensurate with the initial commissions. Some commission payments are not capitalized because they are expensed during the fiscal year as the related revenue is recognized. Capitalized sales commissions costs are classified within other assets and amortized in selling, general and administrative expenses.
Costs to Fulfill a Contract
Certain contract setup costs incurred upon initiation or renewal of an outsourcing contract that generate or enhance resources to be used in satisfying future performance obligations are capitalized when they are deemed recoverable. Judgment is applied to assess whether contract setup costs are capitalizable. Costs that generate or enhance resources often pertain to activities that enhance the capabilities of the services, improve customer experience and establish a more effective and efficient IT environment. The Company recognizes these transition and transformation contract costs as other assets, which are amortized over the respective contract life.
Pension and Other Benefit Plans
The Company accounts for its pension, other post-retirement benefit ("OPEB"), defined contribution and deferred compensation plans using the guidance of ASC 710 "Compensation - General" and ASC 715 "Compensation - Retirement Benefits". The Company recognizes actuarial gains and losses and changes in fair value of plan assets in earnings at the time of plan remeasurement as a component of net periodic benefit expense. Typically plan remeasurement occurs annually during the fourth quarter of each fiscal year. The remaining components of pension and OPEB expense, primarily current period service and interest costs and expected return on plan assets, are recorded on a quarterly basis.
64
DXC TECHNOLOGY COMPANY - NOTES TO CONSOLIDATED FINANCIAL STATEMENTS
Inherent in the application of the actuarial methods are key assumptions, including, but not limited to, discount rates, expected long-term rates of return on plan assets, mortality rates, rates of compensation increases, and medical cost trend rates. Company management evaluates these assumptions annually and updates assumptions as necessary. The fair value of assets is determined based on the prevailing market prices or estimated fair value of investments when quoted prices are not available.
Software Development Costs
After establishing technological feasibility, and until such time as the software products are available for general release to customers, the Company capitalizes costs incurred to develop commercial software products to be sold, leased or otherwise marketed. Costs incurred to establish technological feasibility are charged to expense as incurred. Enhancements to software products are capitalized where such enhancements extend the life or significantly expand the marketability of the products. Amortization of capitalized software development costs is determined separately for each software product. Annual amortization expense is calculated based on the greater of the ratio of current gross revenues for each product to the total of current and anticipated future gross revenues for the product or the straight-line amortization method over the estimated useful life of the product.
Unamortized capitalized software costs associated with commercial software products are periodically evaluated for impairment on a product-by-product basis by comparing the unamortized balance to the product’s net realizable value. The net realizable value is the estimated future gross revenues from that product reduced by the related estimated future costs. When the unamortized balance exceeds the net realizable value, the unamortized balance is written down to the net realizable value and an impairment charge is recorded.
The Company capitalizes costs incurred to develop internal-use computer software during the application development stage. Costs related to preliminary project activities and post-implementation activities are expensed as incurred. Internal and external costs incurred in connection with development of upgrades or enhancements that result in additional functionality are also capitalized. Capitalized costs associated with internal-use software are amortized on a straight-line basis over the estimated useful life of the software. Purchased software is capitalized and amortized over the estimated useful life of the software. Internal-use software assets are evaluated for impairment whenever events or changes in circumstances occur that could impact the recoverability of these assets.
Share-Based Compensation
Share-based awards are accounted for under the fair value method. The Company provides different forms of share-based compensation to its employees and non-employee directors. This includes stock options and restricted stock units ("RSUs"), including performance-based restricted stock units ("PSUs"). The fair value of the awards is determined on the grant date, based on the Company's closing stock price. For awards settled in shares, the Company recognizes compensation expense based on the grant-date fair value net of estimated forfeitures over the vesting period. For awards settled in cash, the Company recognizes compensation expense based on the fair value at each reporting date net of estimated forfeitures.
The Company uses the Black-Scholes-Merton model to compute the estimated fair value of options granted. This model includes assumptions regarding expected term, risk-free interest rates, expected volatility and dividend yields which are periodically evaluated. The expected term is calculated based on the Company’s historical experience with respect to its stock plan activity and an estimate of when vested and unexercised option shares will be exercised. The expected term of options is based on job tier classifications, which have different historical exercise behavior. The risk-free interest rate is based on the zero-coupon interest rate of U.S. government issued treasury STRIPS with a period commensurate with the expected term of the options.
Expected volatility is based on a blended approach, which uses a two-thirds weighting for historical volatility and one-third weighting for implied volatility. The Company’s historical volatility calculation is based on employee class and historical closing prices of the Company's peer group, in order to better align this factor with the expected terms of the stock options. DXC’s implied stock price volatility is derived from the price of exchange traded options on DXC’s stock with the longest remaining contractual term. Implied volatility is a prospective, forward looking measure representing market
65
DXC TECHNOLOGY COMPANY - NOTES TO CONSOLIDATED FINANCIAL STATEMENTS
participants’ expectations of DXC's future stock price volatility. The dividend yield assumption is based on the respective fiscal year dividend payouts. Forfeitures are estimated based on historical experience.
Business Combinations
Companies acquired during each reporting period are reflected in the results of the Company effective from their respective dates of acquisition through the end of the reporting period. The Company allocates the fair value of purchase consideration to the assets acquired and liabilities assumed based on their fair values at the acquisition date. The excess of the fair value of purchase consideration over the fair value of the assets acquired and liabilities assumed in the acquired entity is recorded as goodwill. If the Company obtains new information about facts and circumstances that existed as of the acquisition date during the measurement period, which may be up to one year from the acquisition date, the Company may record adjustments to the assets acquired and liabilities assumed, with the corresponding offset to goodwill. Upon the conclusion of the measurement period or final determination of the values of assets acquired or liabilities assumed, whichever comes first, any subsequent adjustments are recorded to the Company's statements of operations. For contingent consideration recorded as a liability, the Company initially measures the amount at fair value as of the acquisition date and adjusts the liability, if needed, to fair value each reporting period. Changes in the fair value of contingent consideration, other than measurement period adjustments, are recognized as income or expense. Acquisition-related expenses and post-acquisition integration costs are recognized separately from the business combination and are expensed as incurred.
Goodwill Impairment Analysis
The Company tests goodwill for impairment on an annual basis, as of the first day of the second fiscal quarter, and between annual tests if circumstances change, or if an event occurs that would more likely than not reduce the fair value of a reporting unit below its carrying amount. The Company has defined its reporting units as its reportable segments. A significant amount of judgment is involved in determining whether an event indicating impairment has occurred between annual testing dates. Such indicators include: a significant decline in expected future cash flows, a significant adverse change in legal factors or in the business climate, unanticipated competition, the disposal of a significant component of a reporting unit and the testing for recoverability of a significant asset group within a reporting unit.
The Company follows GAAP-prescribed rules when determining if goodwill has been impaired. Initially, an assessment of qualitative factors is conducted in order to determine whether it is more likely than not that the fair value of a reporting unit is less than its carrying amount. This qualitative analysis, which is commonly referred to as step zero under ASC Topic 350 "Goodwill and Other Intangible Assets", considers all relevant factors specific to the reporting units, including macroeconomic conditions; industry and market considerations; overall financial performance and relevant entity-specific events.
If the Company determines that it is not more likely that the carrying amount for a reporting unit is less than its fair value, then the subsequent two-step goodwill impairment testing process is not required. If the Company determines that it is more likely than not that the carrying amount for a reporting unit is greater than its fair value, then it proceeds with the subsequent two-step process.
The Company has the option to bypass the initial qualitative assessment stage and proceed directly to perform step one of the two-step process. Step one of the process compares each reporting unit’s fair value to its carrying value. If the reporting unit’s fair value exceeds its carrying value, no further procedures are required. However, if a reporting unit’s fair value is less than its carrying value, an impairment of goodwill may exist, requiring a second step to measure the amount of impairment loss. In the second step, the reporting unit’s fair value is determined and allocated to the assets and liabilities of the reporting unit, including any unrecognized intangible assets, in order to calculate the implied fair value of goodwill in the same manner as if the reporting unit was being acquired in a business combination. If the implied fair value of goodwill is less than the recorded goodwill, an impairment charge is recorded for the difference.
When the Company performs step one of the two-step test for a reporting unit, it estimates the fair value of the reporting unit using both the income approach and the market approach. The income approach incorporates the use of a discounted cash flow method in which the estimated future cash flows and terminal values for each reporting unit are discounted to present value using a discount rate. Cash flow projections are based on management's estimates of
66
DXC TECHNOLOGY COMPANY - NOTES TO CONSOLIDATED FINANCIAL STATEMENTS
economic and market conditions, which drive key assumptions of revenue growth rates, operating margins, capital expenditures and working capital requirements. The discount rate is based on the specific risk characteristics of each reporting unit, the weighted-average cost of capital and its underlying forecasts. The market approach estimates fair value by applying performance-metric multiples to the reporting unit's prior and expected operating performance. The multiples are derived from comparable publicly traded companies that have operating and investment characteristics similar to those of the reporting unit. If the fair value of the reporting unit derived using one approach is significantly different from the fair value estimate using the other approach, the Company reevaluates its assumptions used in the two models. Assumptions are modified as considered appropriate under the circumstances until the two models yield similar and reasonable results. The fair values determined by the market approach and income approach, as described above, are weighted to determine the fair value for each reporting unit. The weighting ascribed to the market approach fair value assigned to each reporting unit is influenced by two primary factors: 1) the number of comparable publicly traded companies used in the market approach, and 2) the similarity of the operating and investment characteristics of the reporting units to the comparable publicly traded companies used in the market approach.
If DXC performs a step one analysis for all of its reporting units in conjunction with its annual goodwill testing, it also compares the sum of all of its reporting units’ fair values to the Company's market capitalization (per-share stock price multiplied by the number of shares outstanding) and calculates an implied control premium (the excess of the sum of the reporting units’ fair values over the market capitalization). The Company evaluates the reasonableness of the control premium by comparing it to control premiums derived from recent comparable business combinations. If the implied control premium is not reasonable in light of the comparable business combinations, the Company reevaluates its fair value estimates of the reporting units by adjusting the discount rates and/or other assumptions. As a result, when DXC’s stock price and thus market capitalization is low relative to the sum of the estimated fair value of its reporting units, this reevaluation can result in reductions to the estimated fair values for the reporting units.
Fair Value
The Company applies fair value accounting for its financial assets and liabilities and non-financial assets and liabilities that are recognized or disclosed at fair value in the financial statements on a recurring basis. The objective of a fair value measurement is to estimate the price to sell an asset or transfer a liability in an orderly transaction between market participants at the measurement date under current market conditions. Such transactions to sell an asset or transfer a liability are assumed to occur in the principal market for that asset or liability, or in the absence of the principal market, the most advantageous market.
Assets and liabilities subject to fair value measurement disclosures are required to be classified according to a three-level fair value hierarchy with respect to the inputs used to determine fair value. The level in which an asset or liability is disclosed within the fair value hierarchy is based on the lowest level input that is significant to the related fair value measurement in its entirety. The levels of input are defined as follows:
|
Level 1:
|
Quoted prices unadjusted for identical assets or liabilities in an active market.
|
|
Level 2:
|
Quoted prices for similar assets or liabilities in an active market, quoted prices for identical similar assets or liabilities in markets that are not active, inputs other than quoted prices that are observable and market-corroborated inputs which are derived principally from or corroborated by observable market data.
|
|
Level 3:
|
Unobservable inputs that reflect the entity's own assumptions which market participants would use in pricing the asset or liability.
|
Receivables
The Company records receivables at their face amounts less an allowance for doubtful accounts. Receivables consist of amounts billed and currently due from customers, amounts earned but unbilled (including contracts measured under the percentage-of-completion method of accounting), amounts retained by the customer until the completion of a specified contract, negotiation of contract modification and claims. Unbilled recoverable amounts under contracts in progress generally become billable upon achievement of project milestones or upon acceptance by the customer.
Allowances for uncollectible billed trade receivables are estimated based on a combination of write-off history, aging analysis and any known collectability issues. Unbilled amounts under contracts in progress that are recoverable do not
67
DXC TECHNOLOGY COMPANY - NOTES TO CONSOLIDATED FINANCIAL STATEMENTS
have an allowance for credit losses. Adjustments to unbilled amounts under contracts in progress related to credit quality, should they occur, would be recorded as a reduction of revenues.
DXC uses receivables securitization facilities or receivables sales facilities in the normal course of business as part of managing its cash flows. The Company accounts for receivables sold under these facilities as a sale of financial assets pursuant to ASC 860 “Transfers and Servicing” and derecognizes these receivables, as well as the related allowances, from its balance sheets. Generally, the fair value of the sold receivables approximates the book value due to the short-term nature and, as a result, no gain or loss on sale of receivables is recorded. Under the receivables securitization facility, the deferred purchase price receivable is recorded at fair value, which is determined by calculating the expected amount of cash to be received based on unobservable inputs consisting of the face amount of the receivables adjusted for anticipated credit losses.
The Company reflects cash flows related to its beneficial interests in securitization transactions, which is the deferred purchase price (the “DPP”) recorded in connection with the Company's Receivables Securitization Facility, within investing activities in its statements of cash flows.
Property and Equipment
Property and equipment, which includes assets under capital leases, are stated at cost less accumulated depreciation. Depreciation is computed predominantly on a straight-line basis over the estimated useful lives of the assets or the remaining lease term, whichever is shorter. The estimated useful lives of DXC's property and equipment are as follows:
|
Buildings
|
Up to 40 years
|
|
Computers and related equipment
|
4 to 5 years
|
|
Furniture and other equipment
|
3 to 15 years
|
|
Leasehold improvements
|
Shorter of lease term or useful life up to 20 years
|
Intangible Assets
The Company's estimated useful lives for finite-lived intangibles are shown in the table below:
|
Software
|
2 to 10 years
|
|
Customer related intangibles
|
Expected customer service life
|
|
Acquired contract related intangibles
|
Contract life and first contract renewal, where applicable
|
Software is amortized using predominately the straight-line method. Acquired contract related and customer related intangible assets are amortized in proportion to the estimated undiscounted cash flows projected over the estimated life of the asset or on a straight-line basis if such cash flows cannot be reliably estimated.
Impairment of Long-Lived Assets and Finite-Lived Intangible Assets
Long-lived assets such as property and equipment and finite-lived intangible assets are reviewed for impairment whenever events or changes in circumstances indicate that the carrying amount of an asset or group of assets may not be recoverable. Recoverability of long-lived assets or groups of assets is assessed based on a comparison of the carrying amount of such assets to the estimated future net cash flows. If estimated future net cash flows are less than the carrying amount of such assets, an expense is recorded in the amount required to reduce the carrying amount of such assets to fair value. Fair value is determined based on a discounted cash flow approach or, when available and appropriate, comparable market values. Long-lived assets to be disposed of are reported at the lower of their carrying amount or their fair value less costs to sell.
Income Taxes
The Company uses the liability method in accounting for income taxes. Deferred tax assets and liabilities are recorded for the expected future tax consequences of temporary differences between financial statement carrying amounts of assets and liabilities and their respective tax bases, using statutory tax rates in effect for the year in which the differences are
68
DXC TECHNOLOGY COMPANY - NOTES TO CONSOLIDATED FINANCIAL STATEMENTS
expected to reverse. The effect of a change in tax rates on deferred tax assets and liabilities is recognized in the results of operations in the period that includes the related enactment date.
A valuation allowance is established when it is more likely than not that all or a portion of a deferred tax asset will not be realized. Changes in valuation allowances from period to period are included in the Company’s tax provision during the period in which the change occurred. In determining whether a valuation allowance is warranted, the Company considers all available positive and negative evidence, including future reversals of existing taxable temporary differences, taxable income in prior carryback years, projected future taxable income, tax planning strategies and recent financial operations. The Company recognizes uncertain tax positions when it is more likely than not that the tax position will be sustained upon examination. Uncertain tax positions are measured based on the probabilities that the uncertain tax position will be realized upon final settlement.
All tax-related cash flows resulting from excess tax benefits related to the settlement of share-based awards are classified as cash flows from operating activities and cash paid by directly withholding shares for tax withholding purposes is classified as a financing activity in the statements of cash flows.
Cash and Cash Equivalents
The Company considers investments with an original maturity of three months or less to be cash equivalents. The Company’s cash equivalents consist of time deposits, money market funds and money market deposit accounts with a number of institutions that have high credit ratings.
Foreign Currency
The local currency of the Company's foreign affiliates is generally their functional currency. Accordingly, the assets and liabilities of the foreign affiliates are translated from their respective functional currency to U.S. dollars using fiscal year-end exchange rates, income and expense accounts are translated at the average rates in effect during the fiscal year and equity accounts are translated at historical rates. The resulting translation adjustment is reported in the statements of comprehensive income and recorded as part of accumulated other comprehensive income ("AOCI").
Derivative Instruments
The Company designates certain derivative instruments as hedges for purposes of hedge accounting, as defined under ASC 815 “Derivatives and Hedging.” For such derivative instruments, the Company documents its risk management objectives and strategy for undertaking hedging transactions, as well as all relationships between hedging and hedged risks. The Company's derivative instruments designated for hedge accounting include interest rate swaps and foreign currency forward and option contracts. Changes in the fair value measurements of these derivative instruments are reflected as adjustments to other comprehensive income and subsequently reclassified into earnings in the period during which the hedged transactions occurred. Any ineffectiveness or excluded portion of a designated hedge is recognized in earnings.
The Company also has entered into certain net investment hedges. Changes in the fair value of net investment hedges are recorded in the currency translation adjustment section of other comprehensive income and subsequently reclassified into earnings in the period the hedged item affects earnings. The Company excludes forward points from the effectiveness assessment of its net investment hedges. Changes in fair value of the excluded component are recognized in earnings.
The derivative instruments not designated as hedges for purposes of hedge accounting include total return swaps and certain short-term foreign currency forward contracts. These instruments are recorded at their respective fair values and the change in their value is reported in current period earnings. The Company does not use derivative instruments for trading or speculative purpose. The Company reports the effective portion of its cash flow hedges in the same financial statement line item as changes in the fair value of the hedged item. All cash flows associated with the Company's derivative instruments are classified as operating activities in the statements of cash flows.
69
DXC TECHNOLOGY COMPANY - NOTES TO CONSOLIDATED FINANCIAL STATEMENTS
Recently Adopted Accounting Pronouncements
During fiscal
2019
, DXC adopted the following Accounting Standards Updates ("ASU") issued by the Financial Accounting Standards Board:
|
Date Issued and ASU
|
Date Adopted and Method
|
Description
|
Impact
|
|
May 2014
ASU 2014-09 “Revenue from Contracts with Customers (Topic 606)"
|
April 1, 2018 Modified-retrospective
|
The core principle of this update, and the subsequent amendments, is that revenue is recognized when the transfer of goods or services to customers occurs in an amount that reflects the consideration to which DXC expects to be entitled in exchange for those goods or services. The guidance also addresses the timing of recognition of certain costs incurred to obtain or fulfill a customer contract. Further, it requires the disclosure of sufficient information to enable readers of DXC’s financial statements to understand the nature, amount, timing and uncertainty of revenue and cash flows arising from customer contracts, and information regarding significant judgments and changes in judgments made. This update provides two methods of adoption: full retrospective and modified retrospective. Under the full retrospective method, the standard would be applied to all periods presented with previously disclosed periods restated under the new guidance. Under the modified retrospective method, prior periods would not be restated but rather a cumulative catch-up adjustment would be recorded on the adoption date.
|
The Company adopted this standard using the modified retrospective method. The Company has applied the standard to only those contracts that were not completed at the adoption date. The adoption resulted in the following impacts.
The Company recorded a net increase to opening retained earnings, net of income taxes, of approximately $114 million as of April 1, 2018 due to the cumulative impact of adopting Topic 606, with the impact primarily related to the capitalization of certain sales commissions of approximately $158 million offset by a reduction in income tax assets and liabilities of approximately $40 million. In addition, the Company has recorded a reduction in contract liabilities of approximately $381 million and other current assets and other assets of $385 million, primarily related to the net down of certain long-term contract asset and contract liability balances and the change in timing of revenue and costs recognized related to the Company's software contracts.
Refer to Note 19 - “Revenue” for further discussion of the impact of adoption and other required disclosures.
|
|
March 2017
ASU 2017-07 “Compensation - Retirement Benefits (Topic 715): Improving the Presentation of Net Periodic Pension Cost and Net Periodic Postretirement Benefit Cost"
|
April 1, 2018 Retrospective
|
This update is intended to improve the presentation of net periodic pension cost and net periodic post-retirement benefit cost in an entity's financial statements by requiring the service cost component be disaggregated from other components of net benefit costs and presented in the same line item or items as other compensation costs for the employees. Additionally, only the service cost component of net benefit cost is eligible for capitalization when applicable. This update must be applied retrospectively.
|
DXC reclassified non-service cost components of net periodic pension (income) expense from "costs of services" and "selling, general and administrative" to "other income, net" in the statements of operations for the twelve months ended March 31, 2018 and March 31, 2017, respectively, as previously reported within Exhibit 99.1 to the Company's Current Report on Form 8-K filed with the Securities and Exchange Commission on August 16, 2018.
|
70
DXC TECHNOLOGY COMPANY - NOTES TO CONSOLIDATED FINANCIAL STATEMENTS
|
August 2016
ASU 2016-15 “Statement of Cash Flows (Topic 230): Classification of Certain Cash Receipts and Cash Payments"
|
April 1, 2018 Retrospective
|
This update addressed eight cash flow classification issues that have created diversity in practice, providing definitive guidance on classification of certain cash receipts and payments. This update must be adopted retrospectively for all periods presented but may be applied prospectively if retrospective application would be impracticable
|
ASU 2016-15 requires the company to classify cash receipts related to its beneficial interests in securitization transactions, which is the deferred purchase price (the “DPP”) recorded in connection with the Company's Receivables Securitization Facility, within investing activities in its statements of cash flows. The Company adopted ASU 2016-15 effective April 1, 2018, and retrospectively adjusted prior fiscal periods, using each month’s transactional activity as the unit of account in determining the portions of transferred trade receivables as operating activities and investing activities. As disclosed in prior quarters the Company was evaluating the unit of account used in implementing ASU 2016-15. During the third quarter of fiscal 2019, the Company completed its evaluation and determined that it was necessary to change the unit of account from each month's transactional activity to each day's transactional activity. The Company reflected this change on a retrospective basis as further discussed in Note 22 - "Reconciliation of Previously Reported Amounts to Recast Financial Statements. See Note 5 - "Receivables" for more information about the Receivables Securitization Facility.
|
|
November 2016
ASU 2016-18 “Statement of Cash Flows (Topic 230): Restricted Cash (A Consensus of the FASB Emerging Issues Task Force")
|
April 1, 2018 Retrospective
|
This update requires that amounts described as restricted cash or restricted cash equivalents must be included with cash and cash equivalents when reconciling the beginning-of-period and end-of-period total amounts shown on the statement of cash flows. This update must be applied retrospectively.
|
DXC reclassified restricted cash to beginning-of-period and end-of-period cash and cash equivalents on the statement of cash flows. $68 million of restricted cash is included within assets of discontinued operations in the Company's balance sheet as of March 31, 2018.
|
|
August 2017
ASU 2017-12 "Derivatives & Hedging (Topic 815)"
|
Early adopted
January 1, 2019 Modified-retrospective
|
This update is intended to improve the financial reporting of hedge relationships to better portray the economic results of an entity's risk management activities in its financial statements, by revising and expanding items eligible for hedge accounting, simplifying hedge effectiveness testing and changing the timing of recognition and presentation of certain hedge items. Early adoption is permitted.
|
The adoption of this standard had no material impact on DXC's financial statements.
|
71
DXC TECHNOLOGY COMPANY - NOTES TO CONSOLIDATED FINANCIAL STATEMENTS
New Accounting Pronouncements:
The following ASUs were recently issued but have not yet been adopted by DXC:
|
Date Issued and ASU
|
DXC Effective Date
|
Description
|
Impact
|
|
February 2016
ASU 2016-02 "Leases (Topic 842)"
|
Fiscal 2020
|
This update is intended to increase transparency and comparability among organizations by recognizing virtually all lease assets and lease liabilities on the balance sheet and disclosing key information about lease arrangements. Early adoption of this update is permitted. This update must be adopted using a modified retrospective transition at the beginning of the earliest period presented or at the adoption date recognizing a cumulative adjustment to the opening balance of retained earnings in the period of adoption. This update provides for certain practical expedients.
|
DXC will adopt this update on April 1, 2019 utilizing the simplified transition method allowing the Company to not restate comparative periods and apply Topic 842 beginning on April 1, 2019. The Company expects that the cumulative adjustment to the opening balance of retained earnings will be immaterial. In preparation for the adoption of this update, the Company has implemented changes in its systems, including the implementation of new lease accounting software, internal controls, business processes, and accounting policies related to both the implementation of, and ongoing compliance with, the new guidance.
Although the Company is still finalizing its evaluation of the update and the quantification of its impact, the Company expects its adoption will result in an increase in assets and liabilities on the balance sheets of approximately $1.6 billion to $1.8 billion due to the recording of right-of-use assets and lease liabilities for lease obligations that were historically classified as operating leases. The company does not expect the guidance will have a material impact on the statements of operations or statements of cash flows.
DXC expects to elect the practical expedient package permitted under Topic 842, which among other things, permits the Company not to reassess historical conclusions related to contracts that contain leases, lease classification and initial direct costs for leases that commenced prior to the adoption date. DXC expects to elect the lessee component election, allowing the Company to account for lease and non-lease components as a single lease component. Also, DXC expects to make an accounting policy election to keep leases with an initial term of 12 months or less that do not contain a ‘reasonably certain’ purchase option off the balance sheets.
|
|
February 2018
ASU 2018-02 - "Income Statement - Reporting Comprehensive Income (Topic 220): Reclassification of Certain Tax Effects from Accumulated Other Comprehensive Income"
|
Fiscal 2020
|
This update provides an option to reclassify stranded tax effects within AOCI to retained earnings in each period in which the effect (or portion thereof) of the change in the U.S. federal corporate income tax rate in the Tax Cuts and Jobs Act is recorded.
|
The Company will adopt this update in the first quarter of fiscal 2020 and expects to not elect to reclassify any stranded tax effects within AOCI to retained earnings.
|
72
DXC TECHNOLOGY COMPANY - NOTES TO CONSOLIDATED FINANCIAL STATEMENTS
|
June 2016
ASU 2016-13, “Financial Instruments - Credit Losses (Topic 326): Measurement of Credit Losses on Financial Instruments”
|
Fiscal 2021
|
This update is intended to provide financial statement users with more decision-useful information about the expected credit losses on financial instruments and other commitments to extend credit held by a reporting entity at each reporting date. To achieve this objective, the amendments in this update replace the existing incurred loss impairment methodology with a methodology that reflects expected credit losses and requires consideration of a broader range of reasonable and supportable information to inform credit loss estimates. This update must be adopted using a prospective transition approach for debt securities for which an other-than-temporary impairment has been recognized before the effective date
|
DXC is currently evaluating its trade receivables and financial arrangements for the potential impact this update may have on its financial statements in future reporting periods.
|
Other recently issued ASUs effective after
March 31, 2019
are not expected to have a material effect on DXC's consolidated financial statements.
Note
2
-
Acquisitions
Fiscal 2019 Acquisitions
Molina Medicaid Solutions Acquisition
On October 1, 2018, DXC completed its acquisition of Molina Medicaid Solutions ("MMS"), a Medicaid Management Information Systems business, from Molina Healthcare, Inc. for total consideration of
$233 million
. The combination of MMS with DXC expands DXC’s ability to provide services to state agencies in the administration of Medicaid programs, including business processing, information technology development and administrative services.
The Company’s purchase price allocation for the MMS acquisition is preliminary and subject to revision as additional information related to the fair value of assets and liabilities becomes available. The preliminary purchase price allocation was based upon the current determination of fair values at the date of acquisition as follows:
$91 million
to current assets,
$112 million
to intangible assets other than goodwill,
$11 million
to other assets,
$50 million
to current liabilities,
$22 million
to other liabilities and
$91 million
to goodwill. The goodwill is associated with the Company's GBS segment and is tax deductible. The intangible assets acquired include customer relationships and developed technology which have a
13
-year weighted average estimated useful life.
Other Acquisitions
In addition to the MMS acquisition, DXC completed
seven
acquisitions to complement the Company's Microsoft Dynamics and ServiceNow offerings and to provide opportunities for future growth. The acquired businesses are included in the results for the GBS segment. The purchase consideration of
$228 million
included cash of
$187 million
and contingent consideration with an estimated fair value of
$41 million
. The Company's purchase price allocation for these acquisitions is preliminary and subject to revision as additional information related to the fair value of assets and liabilities becomes available. The purchase price is allocated to assets acquired and liabilities assumed based upon determination of fair values at the dates of acquisition as follows:
$73 million
to current assets,
$71 million
to intangible assets other than goodwill,
$10 million
to other non-current assets,
$63 million
to current liabilities and
$137 million
to goodwill. The goodwill is associated with the Company's GBS segment some of which is tax deductible.
73
DXC TECHNOLOGY COMPANY - NOTES TO CONSOLIDATED FINANCIAL STATEMENTS
Fiscal 2018 Acquisitions
HPES Merger
On April 1, 2017, CSC, Hewlett Packard Enterprise Company (“HPE”), Everett SpinCo, Inc. (“Everett”), and New Everett Merger Sub Inc., a wholly-owned subsidiary of Everett (“Merger Sub”), completed the strategic combination of CSC with the Enterprise Services business of HPE to form DXC. The combination was accomplished through a series of transactions that included the transfer by HPE of its Enterprise Services business, HPES, to Everett, and spin-off by HPE of Everett on March 31, 2017, and the merger of Merger Sub with and into CSC on April 1, 2017. At the time of the HPES Merger, Everett was renamed DXC, and as a result of the HPES Merger, CSC became a direct wholly owned subsidiary of DXC. DXC common stock began regular-way trading on the New York Stock Exchange on April 3, 2017. The strategic combination of the two complementary businesses was to create a versatile global technology services business, well positioned to innovate, compete and serve clients in a rapidly changing marketplace.
The transaction involving HPES and CSC is a reverse merger acquisition, in which DXC is considered the legal acquirer of the business and CSC is considered the accounting acquirer. While purchase consideration transferred in a business combination is typically measured by reference to the fair value of equity issued or other assets transferred by the accounting acquirer, CSC did not issue any consideration in the HPES Merger. CSC stockholders received
one
share of DXC common stock for every one share of CSC common stock held immediately prior to the HPES Merger. DXC issued a total of
141,298,797
shares of DXC common stock to CSC stockholders, representing approximately
49.9%
of the outstanding shares of DXC common stock immediately following the HPES Merger.
The reverse merger is deemed a capital transaction and the net assets of CSC (the accounting acquirer) are carried forward to DXC (the legal acquirer and the reporting entity) at their carrying value before the combination. The acquisition process utilizes the capital structure of the Company and the assets and liabilities of CSC, which are recorded at historical cost. The equity of the Company is the historical equity of CSC, retroactively restated to reflect the number of shares issued by DXC in the transaction.
Under the acquisition method of accounting, total consideration exchanged was:
|
(in millions)
|
Amount
|
|||
|
Fair value of purchase consideration received by HPE stockholders
(1)
|
$
|
9,782
|
|
|
|
Fair value of HPES options assumed by CSC
(2)
|
68
|
|
||
|
Total consideration transferred
|
$
|
9,850
|
|
|
|
(1)
|
Represents the fair value of consideration received by HPE stockholders to give them
50.1%
ownership in the combined company. The fair value of the purchase consideration transferred was based on a total of
141,865,656
shares of DXC common stock distributed to HPE stockholders as of the close of business on the record date (
141,741,712
after the effect of
123,944
cancelled shares) at CSC's closing price of
$69.01
per share on March 31, 2017.
|
|
(2)
|
Represents the fair value of certain stock-based awards of HPES employees that were unexercised on March 31, 2017, which were converted to DXC stock-based awards.
|
74
DXC TECHNOLOGY COMPANY - NOTES TO CONSOLIDATED FINANCIAL STATEMENTS
The purchase price allocation for the HPES Merger was finalized during the fourth quarter of fiscal 2018. The Company's allocation of the purchase price to the assets acquired and liabilities assumed as of the HPES Merger date is as follows:
|
(in millions)
|
Fair Value
|
|||
|
Cash and cash equivalents
|
$
|
938
|
|
|
|
Accounts receivable
(1)
|
4,102
|
|
||
|
Other current assets
|
530
|
|
||
|
Total current assets
|
5,570
|
|
||
|
Property and equipment
|
2,581
|
|
||
|
Intangible assets
(2)
|
6,016
|
|
||
|
Other assets
(2)
|
1,939
|
|
||
|
Total assets acquired
|
16,106
|
|
||
|
Accounts payable, accrued payroll, accrued expenses, and other current liabilities
|
(4,605
|
)
|
||
|
Deferred revenue
|
(1,315
|
)
|
||
|
Long-term debt, net of current maturities
|
(4,806
|
)
|
||
|
Long-term deferred tax liabilities and income tax payable
|
(1,550
|
)
|
||
|
Other liabilities
|
(1,322
|
)
|
||
|
Total liabilities assumed
|
(13,598
|
)
|
||
|
Net identifiable assets acquired
|
2,508
|
|
||
|
Add: Fair value of non-controlling interests
|
(50
|
)
|
||
|
Goodwill
|
7,392
|
|
||
|
Total consideration transferred
|
$
|
9,850
|
|
|
|
(1)
|
Includes aggregate adjustments of
$203 million
received from HPE in accordance with the provisions of the Separation Agreement.
|
|
(2)
|
Previously reported amounts were adjusted to reflect the reclassification of transition and transformation contract costs from intangible assets to other assets to conform to the current year presentation.
|
Goodwill represents the excess of the purchase price over the fair value of identifiable assets acquired and liabilities assumed at the HPES Merger date. The goodwill recognized with the HPES Merger was attributable to the synergies expected to be achieved by combining the businesses of CSC and HPES, expected future contracts and the acquired workforce. The goodwill arising from the HPES Merger was allocated to the Company's reportable segments as
$2.8 billion
to the Global Business Services ("GBS") segment,
$2.6 billion
to the Global Infrastructure Services ("GIS") segment and
$2.0 billion
to the United States Public Sector ("USPS") segment. The goodwill is not deductible for tax purposes. See Note
10
- "
Goodwill
."
The Company valued current assets and liabilities, with the exception of the current portion of deferred revenue and capital leases, using existing carrying values as the fair value of those items as of the HPES Merger date. The Company valued acquired property and equipment using predominately the market method, and in certain specific cases, the cost method. The Company valued deferred tax assets and liabilities based on statutory tax rates in the jurisdictions of the legal entities where the acquired non-current assets and liabilities are taxed. The Company valued intangible assets predominately using the multi-period excess earnings method. Intangible assets include customer relationships which have useful lives of
10
-
13
years and third-party purchased software which have useful lives of
2
-
7
years.
Subsequent to the HPES Merger, the Company divested USPS which was acquired in the HPES Merger. See Note 3 - "Divestitures" for additional information about the divestiture of USPS
75
DXC TECHNOLOGY COMPANY - NOTES TO CONSOLIDATED FINANCIAL STATEMENTS
Pro Forma Results of Operations
The following table provides unaudited pro forma results of operations for the Company for the fiscal year ended March 31, 2017, as if the HPES Merger had been consummated on April 2, 2016, the first day of DXC's fiscal year ended March 31, 2017. These unaudited pro forma results do not reflect any cost saving synergies from operating efficiencies. The Company presents these unaudited pro forma results for informational purposes only, and they are not necessarily indicative of what the actual results of operations of DXC would have been if the HPES Merger had occurred at the beginning of the period presented, nor are they indicative of future results of operations.
CSC reported its results based on a fiscal year convention that comprised four thirteen-week quarters. HPES reported its results on a fiscal year basis ended January 31. As a consequence of CSC and HPES having different fiscal year-end dates, all references to the unaudited pro forma statement of operations include the results of operations of CSC for the twelve months ended
March 31, 2017
and of HPES for the twelve months ended January 31, 2017.
|
(in millions, except per-share amounts)
|
Twelve Months Ended March 31, 2017
|
|||
|
Revenues
|
$
|
25,394
|
|
|
|
Net loss
|
(23
|
)
|
||
|
Net loss attributable to the Company
|
(51
|
)
|
||
|
Loss per common share:
|
||||
|
Basic
|
$
|
(0.18
|
)
|
|
|
Diluted
|
$
|
(0.18
|
)
|
|
The unaudited pro forma information above is based on events that are (i) directly attributable to the HPES Merger, (ii) factually supportable, and (iii) are expected to have a continuing impact on the results of operations of DXC. Nonrecurring transaction costs associated with the HPES Merger of
$26 million
for the twelve months ended
March 31, 2018
are not included in the unaudited pro forma information above.
Tribridge Acquisition
On July 1, 2017, DXC acquired all of the outstanding capital stock of Tribridge Holdings LLC, an independent integrator of Microsoft Dynamics 365, for total consideration of
$152 million
. The acquisition includes the Tribridge affiliate company, Concerto Cloud Services LLC. The combination of Tribridge with DXC expands DXC’s Microsoft Dynamics 365 global systems integration business.
The purchase price is allocated to assets acquired and liabilities assumed based upon determination of fair values at the date of acquisition as follows:
$32 million
to current assets,
$4 million
to property and equipment,
$62 million
to intangible assets other than goodwill,
$24 million
to current liabilities and
$78 million
to goodwill. The goodwill is primarily associated with the Company's GBS segment and is tax deductible. The intangible assets acquired include customer relationships which have a
12
-year estimated useful life.
76
DXC TECHNOLOGY COMPANY - NOTES TO CONSOLIDATED FINANCIAL STATEMENTS
Fiscal 2017 Acquisitions
Xchanging Acquisition
On May 5, 2016, CSC acquired Xchanging plc ("Xchanging"), a publicly owned company and a provider of technology-enabled business solutions to organizations in global insurance and financial services, healthcare, manufacturing, real estate and the public sector in a step acquisition. Total consideration paid to and on behalf of the Xchanging shareholders of
$693 million
(or
$492 million
net of cash acquired). Transaction costs associated with the acquisition of
$17 million
were included within selling, general and administrative expenses. The acquisition expanded the Company's market coverage in the global insurance industry and enabled the Company to offer access to a broader, partner-enriched portfolio of services including property and casualty insurance and wealth management business processing services.
The purchase price was allocated to assets acquired and liabilities assumed based upon the determination of fair value at date of acquisition as follows:
$396 million
to current assets,
$99 million
to non-current assets,
$582 million
to intangible assets other than goodwill,
$267 million
to current liabilities,
$516 million
to long-term liabilities,
$680 million
to goodwill, and
$281 million
to non-controlling interest. The goodwill arising from the acquisition was allocated to the Company's reportable segment of
$646 million
to GBS and
$34 million
to GIS segments and is not deductible for tax purposes. The intangible assets acquired include developed technology, customer relationships and trade names, which have estimated useful lives of
7 to 8
,
15
years and
3 to 5
years, respectively.
Note
3
-
Divestitures
Fiscal 2019 Separation of USPS
On May 31, 2018, DXC completed the USPS Separation and Mergers to form Perspecta, an independent public company.
Implementation of the USPS Separation and DXC's post-Separation relationship with Perspecta is governed by several agreements, including the following:
•
a Separation and Distribution Agreement;
•
an Employee Matters Agreement;
•
a Tax Matters Agreement;
•
an Intellectual Property Matters Agreement;
•
a Transition Services Agreement;
•
a Real Estate Matters Agreement; and,
•
a Non-US Agency Agreement.
These agreements provide for the allocation of assets, employees, liabilities and obligations (including property, employee benefits, litigation, and tax-related assets and liabilities) between DXC and Perspecta attributable to periods prior to, at and after the USPS Separation. In addition, DXC and Perspecta have service and commercial contracts that generally extend through fiscal 2023.
Pursuant to the Separation and Distribution Agreement, Perspecta made a net cash payment of
$984 million
to DXC, which reflects transaction consideration of
$1,050 million
less
$66 million
in principal amount of debt that was outstanding at a subsidiary of Perspecta. Perspecta financed the payment through borrowings under a new senior secured term loan facility.
J. Michael Lawrie serves as DXC's Chairman and Chief Executive Officer and Paul N. Saleh serves as DXC's Chief Financial Officer. Effective as of the Separation, Mr. Lawrie also serves as Chairman of Perspecta and Mr. Saleh also serves as a Director of Perspecta. Due to Mr. Lawrie's and Mr. Saleh's leadership positions at DXC and Perspecta, Perspecta is considered a related party under ASC 850 "Related Party Disclosures" for periods subsequent to the Separation. Transactions with Perspecta were immaterial to the Company's financial statements for the fiscal year ended
March 31, 2019
and balances due to and from Perspecta were immaterial to the Company's balance sheet as of
March 31, 2019
.
77
DXC TECHNOLOGY COMPANY - NOTES TO CONSOLIDATED FINANCIAL STATEMENTS
The following is a summary of the assets and liabilities distributed as part of the Separation of USPS on May 31, 2018:
|
(in millions)
|
As of May 31, 2018
|
|||
|
Assets:
|
||||
|
Cash and cash equivalents
|
$
|
95
|
|
|
|
Receivables, net
|
458
|
|
||
|
Prepaid expenses
|
82
|
|
||
|
Other current assets
|
35
|
|
||
|
Total current assets of discontinued operations
|
670
|
|
||
|
Intangible assets, net
(1)
|
870
|
|
||
|
Goodwill
|
2,029
|
|
||
|
Property and equipment, net
|
294
|
|
||
|
Other assets
(1)
|
169
|
|
||
|
Total non-current assets of discontinued operations
|
3,362
|
|
||
|
Total assets
|
$
|
4,032
|
|
|
|
Liabilities:
|
||||
|
Short-term debt and current maturities of long-term debt
|
$
|
161
|
|
|
|
Accounts payable
|
165
|
|
||
|
Accrued payroll and related costs
|
17
|
|
||
|
Accrued expenses and other current liabilities
|
358
|
|
||
|
Deferred revenue and advance contract payments
|
53
|
|
||
|
Income tax payable
|
18
|
|
||
|
Total current liabilities of discontinued operations
|
772
|
|
||
|
Long-term debt, net of current maturities
|
1,320
|
|
||
|
Non-current deferred revenue
|
5
|
|
||
|
Non-current income tax liabilities and deferred tax liabilities
|
196
|
|
||
|
Other long-term liabilities
|
71
|
|
||
|
Total long-term liabilities of discontinued operations
|
1,592
|
|
||
|
Total liabilities
|
$
|
2,364
|
|
|
|
(1)
|
Previously reported amounts were adjusted to reflect the reclassification of transition and transformation contract costs from intangible assets to other assets to conform to the current year presentation.
|
78
DXC TECHNOLOGY COMPANY - NOTES TO CONSOLIDATED FINANCIAL STATEMENTS
The following is a summary of the assets and liabilities of USPS that have been classified as assets and liabilities of discontinued operations:
|
(in millions)
|
As of March 31, 2018
|
|||
|
Assets:
|
||||
|
Cash and cash equivalents
|
$
|
68
|
|
|
|
Receivables, net
|
432
|
|
||
|
Prepaid expenses
|
75
|
|
||
|
Other current assets
|
6
|
|
||
|
Total current assets of discontinued operations
|
581
|
|
||
|
Intangible assets, net
(1)
|
879
|
|
||
|
Goodwill
|
2,033
|
|
||
|
Property and equipment, net
|
283
|
|
||
|
Other assets
(1)
|
168
|
|
||
|
Total non-current assets of discontinued operations
|
3,363
|
|
||
|
Total assets
|
$
|
3,944
|
|
|
|
Liabilities:
|
||||
|
Short-term debt and current maturities of long-term debt
|
$
|
155
|
|
|
|
Accounts payable
|
195
|
|
||
|
Accrued payroll and related costs
|
22
|
|
||
|
Accrued expenses and other current liabilities
|
346
|
|
||
|
Deferred revenue and advance contract payments
|
53
|
|
||
|
Income tax payable
|
18
|
|
||
|
Total current liabilities of discontinued operations
|
789
|
|
||
|
Long-term debt, net of current maturities
|
214
|
|
||
|
Non-current deferred revenue
|
7
|
|
||
|
Non-current income tax liabilities and deferred tax liabilities
|
163
|
|
||
|
Other long-term liabilities
|
72
|
|
||
|
Total long-term liabilities of discontinued operations
|
456
|
|
||
|
Total liabilities
|
$
|
1,245
|
|
|
|
(1)
|
Previously reported amounts were adjusted to reflect the reclassification of transition and transformation contract costs from intangible assets to other assets to conform to the current year presentation.
|
79
DXC TECHNOLOGY COMPANY - NOTES TO CONSOLIDATED FINANCIAL STATEMENTS
The following is a summary of the operating results of USPS which have been reflected within income from discontinued operations, net of tax:
|
(in millions)
|
Fiscal Year Ended March 31, 2019
(1)
|
Fiscal Year Ended March 31, 2018
|
|||||
|
Revenue
|
$
|
431
|
|
$
|
2,823
|
|
|
|
Costs of services
|
311
|
|
2,104
|
|
|||
|
Selling, general and administrative
|
50
|
|
152
|
|
|||
|
Depreciation and amortization
|
33
|
|
169
|
|
|||
|
Restructuring costs
|
1
|
|
14
|
|
|||
|
Interest expense
|
8
|
|
15
|
|
|||
|
Other (income) expense, net
|
(25
|
)
|
2
|
|
|||
|
Total costs and expenses
|
378
|
|
2,456
|
|
|||
|
Total income from discontinued operations, before income taxes
|
53
|
|
367
|
|
|||
|
Income tax expense
|
18
|
|
131
|
|
|||
|
Total income from discontinued operations
|
$
|
35
|
|
$
|
236
|
|
|
(1)
Results for the fiscal year ended March 31, 2019 reflect operations through the Separation date of May 31, 2018, not the full twelve-month period as shown for the prior period.
There was
no
gain or loss on disposition recognized as a result of the Separation.
The following selected financial information of USPS is included in the statements of cash flows:
|
(in millions)
|
Fiscal Year Ended March 31, 2019
(1)
|
Fiscal Year Ended March 31, 2018
|
|||||
|
Depreciation
|
$
|
16
|
|
$
|
70
|
|
|
|
Amortization
|
$
|
17
|
|
$
|
99
|
|
|
|
Capital expenditures
|
$
|
—
|
|
$
|
(18
|
)
|
|
|
Significant operating non-cash items:
|
|||||||
|
Gain on dispositions
|
$
|
24
|
|
$
|
—
|
|
|
(1)
Results for the fiscal year ended March 31, 2019 reflect operations through the Separation date of May 31, 2018, not the full twelve-month period as shown for the prior period.
80
DXC TECHNOLOGY COMPANY - NOTES TO CONSOLIDATED FINANCIAL STATEMENTS
Note
4
-
Earnings Per Share
Basic EPS are computed using the weighted average number of common shares outstanding during the period. Diluted EPS reflect the incremental shares issuable upon the assumed exercise of stock options and equity awards. The following table reflects the calculation of basic and diluted EPS:
|
|
|
Fiscal Years Ended
|
||||||||||
|
(in millions, except per-share amounts)
|
|
March 31, 2019
|
|
March 31, 2018
|
|
March 31, 2017
|
||||||
|
Net income (loss) attributable to DXC common shareholders:
|
||||||||||||
|
From continuing operations
|
$
|
1,222
|
|
$
|
1,515
|
|
$
|
(123
|
)
|
|||
|
From discontinued operations
|
35
|
|
236
|
|
—
|
|
||||||
|
$
|
1,257
|
|
$
|
1,751
|
|
$
|
(123
|
)
|
||||
|
Common share information:
|
||||||||||||
|
Weighted average common shares outstanding for basic EPS
|
277.54
|
|
284.93
|
|
140.39
|
|
||||||
|
Dilutive effect of stock options and equity awards
|
3.89
|
|
4.84
|
|
—
|
|
||||||
|
Weighted average common shares outstanding for diluted EPS
|
281.43
|
|
289.77
|
|
140.39
|
|
||||||
|
EPS:
|
||||||||||||
|
Basic
|
||||||||||||
|
Continuing operations
|
$
|
4.40
|
|
$
|
5.32
|
|
$
|
(0.88
|
)
|
|||
|
Discontinued operations
|
0.13
|
|
0.83
|
|
—
|
|
||||||
|
Total
|
$
|
4.53
|
|
$
|
6.15
|
|
$
|
(0.88
|
)
|
|||
|
Diluted
|
||||||||||||
|
Continuing operations
|
$
|
4.35
|
|
$
|
5.23
|
|
$
|
(0.88
|
)
|
|||
|
Discontinued operations
|
0.12
|
|
0.81
|
|
—
|
|
||||||
|
Total
|
$
|
4.47
|
|
$
|
6.04
|
|
$
|
(0.88
|
)
|
|||
Certain share based equity awards were excluded from the computation of dilutive EPS because inclusion of these awards would have had an anti-dilutive effect. The following table reflects awards excluded:
|
Fiscal Years Ended
|
|||||||||
|
March 31, 2019
|
March 31, 2018
|
March 31, 2017
|
|||||||
|
Stock Options
|
—
|
|
—
|
|
3,317,041
|
|
|||
|
RSUs
|
46,051
|
|
54,637
|
|
845,315
|
|
|||
|
PSUs
|
25,086
|
|
96,029
|
|
1,540,152
|
|
|||
81
DXC TECHNOLOGY COMPANY - NOTES TO CONSOLIDATED FINANCIAL STATEMENTS
Note
5
-
Receivables
Receivables, net of allowance for doubtful accounts consist of the following:
|
As of
|
||||||||
|
(in millions)
|
March 31, 2019
|
March 31, 2018
|
||||||
|
Billed trade receivables
|
$
|
2,508
|
|
$
|
3,110
|
|
||
|
Unbilled receivables
|
1,114
|
|
1,273
|
|
||||
|
Other receivables
|
1,559
|
|
1,098
|
|
||||
|
Total
|
$
|
5,181
|
|
$
|
5,481
|
|
||
The following table summarizes activity for the allowance for doubtful accounts:
|
As of and for Fiscal Years Ended
|
||||||||||||
|
(in millions)
|
March 31, 2019
|
March 31, 2018
|
March 31, 2017
|
|||||||||
|
Beginning balance
|
$
|
40
|
|
$
|
26
|
|
$
|
31
|
|
|||
|
Additions charged to costs and expenses
|
19
|
|
45
|
|
10
|
|
||||||
|
Deductions
(1)
|
(4
|
)
|
(37
|
)
|
(13
|
)
|
||||||
|
Other
(2)
|
5
|
|
6
|
|
(2
|
)
|
||||||
|
Ending balance
|
$
|
60
|
|
$
|
40
|
|
$
|
26
|
|
|||
|
(1)
|
Represents write-offs and recoveries of prior year charges.
|
|
(2)
|
Includes changes in foreign currency exchange rates and the impact of the AR securitization facility.
|
Sale of Receivables
Receivables Securitization Facility
The Company has a
$600 million
accounts receivable securitization facility (as amended or supplemented to date, the "Receivables Facility") with certain unaffiliated financial institutions (the "Purchasers") for the sale of commercial accounts receivable in the United States. Under the Receivables Facility, the Company and certain of its subsidiaries (the "Sellers") sell billed and unbilled accounts receivable to DXC Receivables LLC ("DXC Receivables"), a wholly owned bankruptcy-remote entity. DXC Receivables subsequently sells the purchased accounts receivable in their entirety to the Purchasers pursuant to a receivables purchase agreement. Sales of receivables by DXC Receivables occur continuously and are settled on a monthly basis. The proceeds from the sale of these receivables comprise a combination of cash and a deferred purchase price receivable ("DPP"). The DPP is realized by the Company upon the ultimate collection of the underlying receivables sold to the Purchasers. The adoption of ASU 2016-15 described in Note
1
- "
Summary of Significant Accounting Policies
" requires cash receipts on the DPP to be classified as cash flows from investing activities instead of the Company's previous presentation as cash flows from operating activities.
The amount available under the Receivables Facility fluctuates over time based on the total amount of eligible receivables generated during the normal course of business after deducting excess concentrations. As of
March 31, 2019
, the total availability under the Receivables Facility was approximately
$434 million
and the drawn amount was
$413 million
. As of
March 31, 2019
, the Company recorded a
$21 million
receivable within receivables, net because the amount of cash proceeds received by the Company under the Receivables Facility was less than the total availability. The Receivables Facility terminates on August 21, 2019, but provides for one or more optional
one
-year extensions, if agreed to by the Purchasers. The Company uses the proceeds from sales under the Receivables Facility for general corporate purposes.
82
DXC TECHNOLOGY COMPANY - NOTES TO CONSOLIDATED FINANCIAL STATEMENTS
The fair value of the sold receivables approximated their book value due to their short-term nature, and as a result
no
gain or loss on the sale of receivables was recorded during fiscal 2019 and 2018.
The Company’s risk of loss following the transfer of accounts receivable under the Receivables Facility is limited to the DPP outstanding and any short-falls in collections for specified non-credit related reasons after sale. Payment of the DPP is not subject to significant risks other than delinquencies and credit losses on accounts receivable sold under the Receivables Facility.
Certain obligations of sellers under the Receivables Facility and DXC, as initial servicer, are guaranteed by the Company under a performance guaranty, made in favor of an administrative agent on behalf of the Purchasers. However, the performance guaranty does not cover DXC Receivables’ obligations to pay yield, fees or invested amounts to the administrative agent or any of the Purchasers.
The following table is a reconciliation of the beginning and ending balances of the DPP:
|
As of and for the Fiscal Year Ended
|
||||||||
|
(in millions)
|
March 31, 2019
|
March 31, 2018
|
||||||
|
Beginning balance
|
$
|
233
|
|
$
|
252
|
|
||
|
Transfers of receivables
|
5,435
|
|
2,192
|
|
||||
|
Collections
|
(4,393
|
)
|
(2,225
|
)
|
||||
|
Change in funding availability
|
(246
|
)
|
30
|
|
||||
|
Facility amendments
|
(457
|
)
|
—
|
|
||||
|
Fair value adjustment
|
2
|
|
(16
|
)
|
||||
|
Ending balance
|
$
|
574
|
|
$
|
233
|
|
||
Federal Receivables Sales Facility
Since July 14, 2017, the Company has given a parent guaranty in connection with a federal receivables sales facility with certain financial institutions, under which certain subsidiaries of the Company previously sold eligible federal government obligor receivables, including billed and certain unbilled receivables. In connection with the Separation, the sellers and servicers of the receivables sold under the Federal Receivables Sales Facility were divested and, effective May 31, 2018, the parent guaranty was terminated.
The following table reflects activity of the Federal Receivables Sales Facility, prior to the Separation:
|
(in millions)
|
As of and for the Fiscal Year Ended March 31, 2019
(1)
|
|||
|
Transfers of receivables
|
$
|
464
|
|
|
|
Collections
|
$
|
521
|
|
|
|
Operating cash flow effect
|
$
|
(57
|
)
|
|
(1)
Results for the twelve months ended March 31, 2019 reflect operations through the Separation date of May 31, 2018, not the full twelve month period.
83
DXC TECHNOLOGY COMPANY - NOTES TO CONSOLIDATED FINANCIAL STATEMENTS
Note
6
-
Fair Value
Fair Value Measurements on a Recurring Basis
The following table presents the Company’s assets and liabilities that are measured at fair value on a recurring basis, excluding pension assets and derivative assets and liabilities. See Note
13
- "
Pension and Other Benefit Plans
" and Note
7
- "
Derivative Instruments
" for information about the fair value of our pension assets and derivative assets and liabilities, respectively. There were
no
transfers between any of the levels during the periods presented.
|
Fair Value Hierarchy
|
||||||||||||||||
|
(in millions)
|
As of March 31, 2019
|
|||||||||||||||
|
Assets:
|
Fair Value
|
Level 1
|
Level 2
|
Level 3
|
||||||||||||
|
Money market funds and money market deposit accounts
|
$
|
6
|
|
$
|
6
|
|
$
|
—
|
|
$
|
—
|
|
||||
|
Time deposits
(1)
|
194
|
|
194
|
|
—
|
|
—
|
|
||||||||
|
Other debt securities
(2)
|
53
|
|
—
|
|
49
|
|
4
|
|
||||||||
|
Deferred purchase price receivable
|
574
|
|
—
|
|
—
|
|
574
|
|
||||||||
|
Total assets
|
$
|
827
|
|
$
|
200
|
|
$
|
49
|
|
$
|
578
|
|
||||
|
Liabilities:
|
||||||||||||||||
|
Contingent consideration
|
$
|
41
|
|
$
|
—
|
|
$
|
—
|
|
$
|
41
|
|
||||
|
Total liabilities
|
$
|
41
|
|
|
$
|
—
|
|
|
$
|
—
|
|
|
$
|
41
|
|
|
|
As of March 31, 2018
|
||||||||||||||||
|
Assets:
|
Fair Value
|
Level 1
|
Level 2
|
Level 3
|
||||||||||||
|
Money market funds and money market deposit accounts
|
$
|
84
|
|
$
|
84
|
|
$
|
—
|
|
$
|
—
|
|
||||
|
Time deposits
(1)
|
114
|
|
114
|
|
—
|
|
—
|
|
||||||||
|
Other debt securities
(2)
|
59
|
|
—
|
|
53
|
|
6
|
|
||||||||
|
Deferred purchase price receivable
|
233
|
|
—
|
|
—
|
|
233
|
|
||||||||
|
Total assets
|
$
|
490
|
|
$
|
198
|
|
$
|
53
|
|
$
|
239
|
|
||||
|
Liabilities:
|
||||||||||||||||
|
Contingent consideration
|
$
|
5
|
|
$
|
—
|
|
$
|
—
|
|
$
|
5
|
|
||||
|
Total Liabilities
|
$
|
5
|
|
$
|
—
|
|
$
|
—
|
|
$
|
5
|
|
||||
(1)
Cost basis approximated fair value due to the short period of time to maturity.
(2)
Other debt securities include available-for-sale investments with Level 2 inputs that have a cost basis of
$38 million
and
$42 million
, and unrealized gains of
$11 million
and
$11 million
, as of March 31, 2019 and March 31, 2018, respectively.
The fair value of money market funds and money market deposit accounts, and time deposits, included in cash and cash equivalents, are based on quoted market prices. The fair value of other debt securities, included in other long-term assets, is based on actual market prices. Fair value of the DPP, included in receivables, net, is determined by calculating the expected amount of cash to be received and is principally based on unobservable inputs consisting primarily of the face amount of the receivables adjusted for anticipated credit losses. The fair value of contingent consideration, included in other liabilities, is based on contractually defined targets of financial performance and other considerations.
The increase in the fair value of contingent consideration during the twelve months ended March 31, 2019 was due to the acquisitions described in Note 2 - "
Acquisitions
"
84
DXC TECHNOLOGY COMPANY - NOTES TO CONSOLIDATED FINANCIAL STATEMENTS
Other Fair Value Disclosures
The carrying amounts of the Company’s financial instruments with short-term maturities, primarily accounts receivable, accounts payable, short-term debt, and financial liabilities included in other accrued liabilities, are deemed to approximate their market values due to their short-term nature. If measured at fair value, these financial instruments would be classified in Level 2 or Level 3 of the fair value hierarchy.
The Company estimates the fair value of its long-term debt, primarily by using quoted prices obtained from third party providers such as Bloomberg, and by using an expected present value technique that is based on observable market inputs for instruments with similar terms currently available to the Company. The estimated fair value of the Company's long-term debt, excluding capitalized lease liabilities, was
$5.6 billion
and
$6.1 billion
as of
March 31, 2019
and
March 31, 2018
, respectively, as compared with carrying value of
$5.6 billion
and
$5.9 billion
as of
March 31, 2019
and
March 31, 2018
, respectively. If measured at fair value, long-term debt, excluding capitalized lease liabilities would be classified in Level 1 or Level 2 of the fair value hierarchy.
Non-financial assets such as goodwill, tangible assets, intangible assets and other contract related long-lived assets are recorded at fair value in the period they are initially recognized, and such fair value may be adjusted in subsequent periods if an event occurs or circumstances change that indicate that the asset may be impaired. The fair value measurements, in such instances, would be classified in Level 3 of the fair value hierarchy. There were no significant impairments recorded during the fiscal periods covered by this report.
Note
7
-
Derivative Instruments
In the normal course of business, the Company is exposed to interest rate and foreign exchange rate fluctuations. As part of its risk management strategy, the Company uses derivative instruments, primarily foreign currency forward contracts and interest rate swaps, to hedge certain foreign currency and interest rate exposures. The Company’s objective is to reduce earnings volatility by offsetting gains and losses resulting from these exposures with losses and gains on the derivative contracts used to hedge them. The Company does not use derivative instruments for trading or any speculative purpose.
Derivatives Designated for Hedge Accounting
Cash flow hedges
The Company uses interest rate swap agreements designated as cash flow hedges to mitigate its exposure to interest rate risk associated with the variability of cash outflows for interest payments on certain floating interest rate debt, which effectively converts the debt into fixed interest rate debt. During fiscal 2019, the Company terminated interest rate swap agreements with aggregate notional values of
$375 million
and fair values of
$5 million
and derecognized the relative derivative asset. The hedge gain of
$5 million
is recognized over the remaining original life of the swap against interest expense in the statements of operations. The Company had no interest rate swap agreements as of
March 31, 2019
. As of
March 31, 2018
, the Company had interest rate swap agreements with a total notional amount of
$635 million
.
The Company has designated certain foreign currency forward contracts as cash flow hedges to reduce foreign currency risk related to certain Indian Rupee denominated intercompany obligations and forecasted transactions. The notional amounts of foreign currency forward contracts designated as cash flow hedges as of
March 31, 2019
and
March 31, 2018
was
$277 million
and
$634 million
, respectively. As of
March 31, 2019
, the related forecasted transactions extend through March 2020.
For the fiscal years ended
March 31, 2019
and
March 31, 2018
, the Company performed an assessment at the inception of the cash flow hedge transactions and determined all critical terms of the hedging instruments and hedged items matched. The Company performs an assessment of critical terms on an ongoing basis throughout the hedging period. During the fiscal years ended
March 31, 2019
and
March 31, 2018
, the Company had no cash flow hedges for which it was probable that the hedged transaction would not occur. As of
March 31, 2019
,
$1 million
of the existing gain related to the cash flow hedge reported in AOCI is expected to be reclassified into earnings within the next 12 months.
85
DXC TECHNOLOGY COMPANY - NOTES TO CONSOLIDATED FINANCIAL STATEMENTS
Net investment hedges
The Company has designated certain foreign currency forward contracts as net investment hedges to protect its investment in certain foreign operations against adverse changes in exchange rates between the EUR and USD. As of
March 31, 2019
, the notional amount of foreign currency forward contracts designated as net investment hedges was
$1.7 billion
. As of
March 31, 2018
, the Company had no foreign currency forward contracts designated as net investment hedges.
The pre-tax loss on derivatives designated for hedge accounting recognized in other comprehensive income was
$1 million
and in income from continuing operations was
$10 million
during the fiscal year ended
March 31, 2019
.
Derivatives Not Designated For Hedge Accounting
The derivative instruments not designated as hedges for purposes of hedge accounting include certain short-term foreign currency forward contracts. Derivatives that are not designated as hedging instruments are adjusted to fair value through earnings in the financial statement line item to which the derivative relates.
Interest rate swap agreements
During fiscal 2019, the Company elected to de-designate its interest rate swap agreements. The Company derecognized the related derivative asset and recognized the amount in earnings. The Company had no interest rate swap agreements as of
March 31, 2019
.
Foreign currency forward contracts
The Company manages the exposure to fluctuations in foreign currencies by using foreign currency forward contracts to hedge certain foreign currency denominated assets and liabilities, including intercompany accounts and forecasted transactions. The notional amount of the foreign currency forward contracts outstanding as of
March 31, 2019
and
March 31, 2018
was
$2.5 billion
and
$3.1 billion
, respectively.
The following table presents the pretax amounts impacting income related to foreign currency forward contracts:
|
Fiscal Years Ended
|
||||||||||||||
|
(in millions)
|
Statement of Operations Line Item
|
March 31, 2019
|
March 31, 2018
|
March 31, 2017
|
||||||||||
|
Foreign currency forward contracts
|
Other expense (income), net
|
$
|
16
|
|
$
|
118
|
|
$
|
(84
|
)
|
||||
86
DXC TECHNOLOGY COMPANY - NOTES TO CONSOLIDATED FINANCIAL STATEMENTS
Fair Value of Derivative Instruments
All derivative instruments are recorded at fair value. The Company’s accounting treatment for these derivative instruments is based on its hedge designation. The following tables present the fair values of derivative instruments included in the balance sheets:
|
Derivative Assets
|
||||||||||
|
As of
|
||||||||||
|
(in millions)
|
Balance Sheet Line Item
|
March 31, 2019
|
March 31, 2018
|
|||||||
|
Derivatives designated for hedge accounting:
|
||||||||||
|
Interest rate swaps
|
Other assets
|
$
|
—
|
|
$
|
6
|
|
|||
|
Foreign currency forward contracts
(1)
|
Other current assets
|
38
|
|
14
|
|
|||||
|
Total fair value of derivatives designated for hedge accounting
|
$
|
38
|
|
$
|
20
|
|
||||
|
Derivatives not designated for hedge accounting:
|
||||||||||
|
Foreign currency forward contracts
|
Other current assets
|
$
|
5
|
|
$
|
4
|
|
|||
|
Total fair value of derivatives not designated for hedge accounting
|
$
|
5
|
|
$
|
4
|
|
||||
|
Derivative Liabilities
|
||||||||||
|
As of
|
||||||||||
|
(in millions)
|
Balance Sheet Line Item
|
March 31, 2019
|
March 31, 2018
|
|||||||
|
Derivatives designated for hedge accounting:
|
||||||||||
|
Foreign currency forward contracts
(1)
|
Accrued expenses and other current liabilities
|
$
|
4
|
|
$
|
3
|
|
|||
|
Total fair value of derivatives designated for hedge accounting:
|
$
|
4
|
|
$
|
3
|
|
||||
|
Derivatives not designated for hedge accounting:
|
||||||||||
|
Foreign currency forward contracts
|
Accrued expenses and other current liabilities
|
$
|
9
|
|
$
|
6
|
|
|||
|
Total fair value of derivatives not designated for hedge accounting
|
$
|
9
|
|
$
|
6
|
|
||||
|
(1)
|
Foreign currency forward contracts designated for hedge accounting includes designated cash flow hedges and net investment hedges.
|
The fair value of foreign currency forward contracts represents the estimated amount required to settle the contracts using current market exchange rates and is based on the period-end foreign currency exchange rates and forward points which are classified as Level 2 inputs.
Other risks
The Company is exposed to the risk of losses in the event of non-performance by the counterparties to its derivative contracts. The amount subject to credit risk related to derivative instruments is generally limited to the amount, if any, by which a counterparty's obligations exceed the obligations of the Company with that counterparty. To mitigate counterparty credit risk, the Company regularly reviews its credit exposure and the creditworthiness of the counterparties. With respect to its foreign currency derivatives, as of March 31, 2019, there were
five
counterparties with concentration of credit risk, and based on gross fair value, the maximum amount of loss that the Company could incur is approximately
$29 million
.
87
DXC TECHNOLOGY COMPANY - NOTES TO CONSOLIDATED FINANCIAL STATEMENTS
The Company also enters into enforceable master netting arrangements with some of its counterparties. However, for financial reporting purposes, it is the Company's policy not to offset derivative assets and liabilities despite the existence of enforceable master netting arrangements. The potential effect of such netting arrangements on the Company's balance sheets is not material for the periods presented.
Note
8
-
Property and Equipment
Property and equipment consisted of the following:
|
As of
|
||||||||
|
(in millions)
|
March 31, 2019
|
March 31, 2018
|
||||||
|
Property and equipment — gross:
|
||||||||
|
Land, buildings and leasehold improvements
|
$
|
2,180
|
|
$
|
2,464
|
|
||
|
Computers and related equipment
|
4,719
|
|
4,185
|
|
||||
|
Furniture and other equipment
|
224
|
|
323
|
|
||||
|
Construction in progress
|
14
|
|
77
|
|
||||
|
7,137
|
|
7,049
|
|
|||||
|
Less: accumulated depreciation
|
3,958
|
|
3,686
|
|
||||
|
Property and equipment, net
|
$
|
3,179
|
|
$
|
3,363
|
|
||
Depreciation expense for fiscal
2019
,
2018
and
2017
was
$820 million
,
$709 million
and
$338 million
, respectively.
88
DXC TECHNOLOGY COMPANY - NOTES TO CONSOLIDATED FINANCIAL STATEMENTS
Note
9
-
Intangible Assets
Intangible assets consisted of the following:
|
As of March 31, 2019
|
||||||||||||
|
(in millions)
|
Gross Carrying Value
|
Accumulated Amortization
|
Net Carrying Value
|
|||||||||
|
Software
|
$
|
3,864
|
|
$
|
2,235
|
|
$
|
1,629
|
|
|||
|
Customer related intangible assets
|
5,389
|
|
1,139
|
|
4,250
|
|
||||||
|
Other intangible assets
|
85
|
|
25
|
|
60
|
|
||||||
|
Total intangible assets
|
$
|
9,338
|
|
$
|
3,399
|
|
$
|
5,939
|
|
|||
|
As of March 31, 2018
|
||||||||||||
|
(in millions)
|
Gross Carrying Value
|
Accumulated Amortization
|
Net Carrying Value
|
|||||||||
|
Software
|
$
|
3,484
|
|
$
|
1,918
|
|
$
|
1,566
|
|
|||
|
Customer related intangible assets
|
5,405
|
|
666
|
|
4,739
|
|
||||||
|
Other intangible assets
|
90
|
|
19
|
|
71
|
|
||||||
|
Total intangible assets
|
$
|
8,979
|
|
$
|
2,603
|
|
$
|
6,376
|
|
|||
Transition and transformation contract costs as of March 31, 2018 have been reclassified from intangible assets, net to other assets within the balance sheets to conform to the current year presentation.
The components of amortization expense were as follows:
|
Fiscal Years Ended
|
||||||||||||
|
(in millions)
|
March 31, 2019
|
March 31, 2018
|
March 31, 2017
|
|||||||||
|
Intangible asset amortization
|
$
|
890
|
|
$
|
860
|
|
$
|
230
|
|
|||
|
Transition and transformation contract cost amortization
|
258
|
|
226
|
|
79
|
|
||||||
|
Total amortization expense
|
$
|
1,148
|
|
$
|
1,086
|
|
$
|
309
|
|
|||
Estimated future amortization as of
March 31, 2019
is as follows:
|
Fiscal Year
|
(in millions)
|
|
||
|
2020
|
$
|
954
|
|
|
|
2021
|
$
|
919
|
|
|
|
2022
|
$
|
780
|
|
|
|
2023
|
$
|
696
|
|
|
|
2024
|
$
|
639
|
|
|
89
DXC TECHNOLOGY COMPANY - NOTES TO CONSOLIDATED FINANCIAL STATEMENTS
Note
10
-
Goodwill
The following tables summarize the changes in the carrying amounts of goodwill, by segment, for the fiscal years ended
March 31, 2019
and
March 31, 2018
, respectively:
|
(in millions)
|
GBS
|
GIS
|
Total
|
|||||||||
|
Balance as of March 31, 2018, net
|
4,531
|
|
3,088
|
|
7,619
|
|
||||||
|
|
||||||||||||
|
Acquisitions
|
228
|
|
—
|
|
228
|
|
||||||
|
Divestitures
|
(12
|
)
|
—
|
|
(12
|
)
|
||||||
|
Foreign currency translation
|
(148
|
)
|
(81
|
)
|
(229
|
)
|
||||||
|
Goodwill, gross
|
5,300
|
|
5,068
|
|
10,368
|
|
||||||
|
Accumulated impairment losses
|
(701
|
)
|
(2,061
|
)
|
(2,762
|
)
|
||||||
|
Balance as of March 31, 2019, net
|
$
|
4,599
|
|
$
|
3,007
|
|
$
|
7,606
|
|
|||
|
(in millions)
|
GBS
|
GIS
|
Total
|
|||||||||
|
Balance as of March 31, 2017, net
|
1,470
|
|
385
|
|
1,855
|
|
||||||
|
Acquisitions
|
2,877
|
|
2,598
|
|
5,475
|
|
||||||
|
Foreign currency translation
|
184
|
|
105
|
|
289
|
|
||||||
|
Goodwill, gross
|
5,232
|
|
5,149
|
|
10,381
|
|
||||||
|
Accumulated impairment losses
|
(701
|
)
|
(2,061
|
)
|
(2,762
|
)
|
||||||
|
Balance as of March 31, 2018, net
|
$
|
4,531
|
|
$
|
3,088
|
|
$
|
7,619
|
|
|||
As a result of the USPS Separation on May 31, 2018, as more fully described in Note
3
- "
Divestitures
", USPS is no longer a reportable segment. The fiscal
2019
and
2018
additions to goodwill were due to the acquisitions described in Note
2
- "
Acquisitions
". The foreign currency translation amount reflects the impact of currency movements on non-U.S. dollar-denominated goodwill balances.
90
DXC TECHNOLOGY COMPANY - NOTES TO CONSOLIDATED FINANCIAL STATEMENTS
Goodwill Impairment Analyses
Fiscal 2019
The Company’s annual goodwill impairment analysis, which was performed as of July 1, 2018, did not result in an impairment charge. As of March 31, 2019, the Company assessed whether there were events or changes in circumstances that would more likely than not reduce the fair value of any of its reporting units below its carrying amount and require goodwill to be tested for impairment. The Company determined that there have been no such indicators and therefore, it was unnecessary to perform an interim goodwill impairment test as of March 31, 2019.
Fiscal 2018
The Company’s annual goodwill impairment analysis, which was performed qualitatively as of July 1, 2017, did not result in an impairment charge. At the end of the fiscal 2018, the Company assessed whether there were events or changes in circumstances that would more likely than not reduce the fair value of any of its reporting units below its carrying amount and require goodwill to be tested for impairment. The Company determined that there have been no such indicators, and, therefore, it was unnecessary to perform an interim goodwill impairment test as of March 31, 2018.
Fiscal 2017
For the Company’s annual goodwill impairment assessment as of July 2, 2016, the Company chose to bypass the initial qualitative assessment and proceeded directly to the first step of the impairment test for all reporting units. Based on the results of the first step of the impairment test, the Company concluded that the fair value of each reporting unit exceeded its carrying value and therefore the second step of the goodwill impairment test was not required.
As of March 31, 2017, the Company assessed whether there were events or changes in circumstances that would more likely than not reduce the fair value of any of its reporting units below its carrying amount and require goodwill to be tested for impairment. The Company determined that there have been no such indicators and therefore, it was unnecessary to perform an interim goodwill impairment test as of March 31, 2017.
Note
11
-
Income Taxes
The sources of income (loss) from continuing operations, before income taxes, classified between domestic entities and those entities domiciled outside of the United States, are as follows:
|
Fiscal Years Ended
|
||||||||||||
|
(in millions)
|
March 31, 2019
|
March 31, 2018
|
March 31, 2017
|
|||||||||
|
Domestic entities
|
$
|
511
|
|
$
|
454
|
|
$
|
(157
|
)
|
|||
|
Entities outside the United States
|
1,004
|
|
850
|
|
(17
|
)
|
||||||
|
Total
|
$
|
1,515
|
|
$
|
1,304
|
|
$
|
(174
|
)
|
|||
91
DXC TECHNOLOGY COMPANY - NOTES TO CONSOLIDATED FINANCIAL STATEMENTS
On December 22, 2017, the President of the United States signed into law comprehensive tax legislation commonly referred to as the Tax Cuts and Jobs Act (the "Act"). The Act makes significant changes to the Internal Revenue Code of 1986 with varying effective dates. The Act reduces the maximum corporate income tax rate to
21%
effective as of January 1, 2018, requires companies to pay a one-time transition tax on certain un-repatriated earnings of foreign subsidiaries, broadens the tax base, generally eliminates U.S. federal income taxes on dividends from foreign subsidiaries, creates a new limitation on the deductibility of interest expense, limits the deductibility of certain executive compensation, and allows for immediate capital expensing of certain qualified property. It also requires companies to pay minimum taxes on foreign earnings and subjects certain payments from U.S. corporations to foreign related parties to additional taxes. As a fiscal year taxpayer, the Company did not become subject to many of the tax law provisions until fiscal year 2019; however, GAAP requires companies to revalue their deferred tax assets and liabilities with resulting tax effects accounted for in the reporting period of enactment, including retroactive effects. Section 15 of the Internal Revenue Code stipulates that for the Company's fiscal years ending
March 31, 2019
and March 31, 2018, the Company has weighted corporate U.S. federal income tax rates of
21.0%
and
31.5%
, respectively. These income tax rates are based on the applicable tax rates before and after the effective date of the Act and the number of days in the Company's federal tax year ending on October 31st.
The SEC staff issued Staff Accounting Bulletin 118 ("SAB 118"), which provides guidance on accounting for the tax effects of the Act in the reporting period that includes the December 22, 2017 enactment date. SAB 118 allowed companies to provide provisional amounts during a measurement period that could not extend beyond one year from the Act's enactment date. In accordance with SAB 118, a company was required to reflect the income tax effects of the Act for which the accounting under ASC 740 is complete. To the extent that a company’s accounting for certain income tax effects of the Act was incomplete but the company was able to determine a reasonable estimate, it was required to record a provisional estimate in the financial statements. If a company could not determine a provisional estimate to be included in the financial statements, it was required to continue to apply ASC 740 on the basis of the provisions of the tax laws that were in effect immediately before the enactment of the Act. The one year SAB 118 measurement period closed for the Company in the third quarter ended on December 31, 2018.
As of December 31, 2018, the Company's assessment of the Act is complete. While the measurement period under SAB 118 is now closed, DXC may, in future periods, need to further refine the Company's U.S. federal and state calculations, related to the Act, as the taxing authorities provide additional guidance and clarification.
The Company recorded the following amounts in accordance with SAB 118:
Capital expensing:
During fiscal 2018, the Company recorded a provisional benefit of $
87 million
, which was based on its intent to fully expense all qualifying expenses for U.S. federal tax purposes. This resulted in a decrease of approximately $
87 million
to the Company's current income taxes payable and a corresponding increase to its net deferred tax liabilities. During Q3 FY19, the Company finalized its estimate of the impact of the law change for purposes of SAB 118 and determined the incremental benefit of capital expensing was approximately $
61 million
. This resulted in a decrease of approximately $
61 million
to the Company's current income taxes payable and a corresponding increase to its net deferred tax liabilities. The Company filed its October 31, 2017 U.S federal tax return and several of its state tax returns in the periods ending September 30, 2018 and December 31, 2018, respectively. In the three months ended December 31, 2018 the Company completed all of the computations necessary, including an analysis of expenditures that qualify for immediate expensing, noting no measurement period adjustments were required.
Executive compensation
: As a result of changes made by the Act, starting with compensation paid in fiscal 2019, Section 162(m) will limit compensation deductions, including performance-based compensation, in excess of $
1 million
paid to anyone who, starting in 2018, serves as the Chief Executive Officer or Chief Financial Officer, or who is among the three most highly compensated executive officers for any fiscal year. The only exception to this rule is for compensation that is paid pursuant to a binding contract in effect on November 2, 2017 that would have otherwise been deductible under the prior Section 162(m) rules. Accordingly, any compensation paid in the future pursuant to new compensation arrangements entered into after November 2, 2017, even if performance-based, will count towards the $
1 million
fiscal year deduction limit if paid to a covered executive. During fiscal 2018, the Company recorded a provisional income tax expense estimate of $
2 million
for executive compensation relating to the change in covered individuals. The Company completed an analysis of the binding contract requirement on the various compensation plans and determined the impact of the law
92
DXC TECHNOLOGY COMPANY - NOTES TO CONSOLIDATED FINANCIAL STATEMENTS
change was not material. As part of the fiscal 2019 income tax provision, the Company estimated the Section 162(m) adjustment under the new guidance for compensation arrangements entered into after November 2, 2017.
Reduction of U.S. federal corporate income tax rate:
As discussed above, the Act reduces the corporate tax rate to
21%
, effective January 1, 2018. For certain deferred tax assets and deferred tax liabilities, the Company previously recorded a provisional deferred income tax discrete benefit of
$338 million
, resulting in a
$338 million
decrease in net deferred tax liabilities as of March 31, 2018. The Company filed its October 31, 2017 U.S. federal tax return in the period ending September 30, 2018, which impacted the provisional amount recorded. The adjustment was not material. The Company finalized its analysis of the scheduling of the deferred tax assets and liabilities and determined the impact was not material. No additional measurement period adjustments were recorded during the period ended December 31, 2018.
Deemed Repatriation Transition Tax:
The deemed repatriation one-time transition tax is a tax on previously untaxed accumulated and current earnings and profits ("E&P") of certain of the Company's non-U.S. subsidiaries. To determine the amount of the transition tax, the Company determined, in addition to other factors, the amount of post-1986 E&P of the relevant non-U.S. subsidiaries, as well as the amount of non-U.S. income taxes paid on such earnings and the impact of various guidance including proposed regulations. The Company was able to calculate the transition tax and recorded a provisional transition tax obligation of $
361 million
in fiscal 2018. Due to the revised E&P and cash computations that were completed during the reporting periods, the Company recognized an additional measurement-period adjustment to the transition tax obligation of
$25 million
for the three months ended June 30, 2018. During the three month period ending December 31, 2018, the Company recorded a corresponding adjustment of
$(69) million
. The effect of the total measurement-period adjustments of $
(44) million
for the nine months ended December 31, 2018 on the fiscal 2019 effective tax rate was
(3.9)%
. The transition tax, which has now been determined to be complete, resulted in recording a total transition tax obligation of
$316 million
, of which $
324 million
was recorded as income tax liability and $
(8) million
recorded as a reduction in our unrecognized tax benefits.
Indefinite reinvestment assertion:
Beginning January 1, 2018, the Act provides a 100% deduction for dividends received from 10-percent owned non-U.S. corporations by U.S. corporate shareholders, subject to a one-year holding period. Although such dividend income is now generally exempt from U.S. federal tax for U.S. corporate shareholders, companies must still account for the tax consequences of outside basis differences and other tax impacts of their investments in non-U.S. subsidiaries. During fiscal 2018, the Company recorded a provisional estimate for those subsidiaries for which DXC was able to make a reasonable estimate of the tax effects of such repatriation for withholding taxes, state taxes, and India dividend distribution tax of
$12 million
,
$7 million
and
$80 million
, respectively. For the three months ended December 31, 2018, the Company recognized an additional measurement-period adjustment of
$9 million
for state tax purposes recorded to discrete income tax expense. The Company completed its analysis of the non-U.S. tax rules for certain non-U.S. subsidiaries for U.S. federal and state tax purposes for all material provisional amounts during the measurement-period.
Global intangible low taxed income (GILTI):
The Company continues to evaluate the impact of the GILTI provisions under the Act, which are complex and subject to continuing regulatory interpretation by the IRS. The Company is required to make an accounting policy election of either (1) treating taxes due on future U.S. inclusions in taxable income related to GILTI as a current-period expense when incurred (the “period cost method”), or (2) factoring such amounts into the Company’s measurement of its deferred taxes (the “deferred method”). The Company determined that it will account for the new GILTI tax rules under the period cost method.
The income tax expense (benefit) on income (loss) from continuing operations is comprised of:
93
DXC TECHNOLOGY COMPANY - NOTES TO CONSOLIDATED FINANCIAL STATEMENTS
|
Fiscal Years Ended
|
||||||||||||
|
(in millions)
|
March 31, 2019
|
March 31, 2018
|
March 31, 2017
|
|||||||||
|
Current:
|
||||||||||||
|
Federal
|
$
|
(50
|
)
|
$
|
392
|
|
$
|
(32
|
)
|
|||
|
State
|
42
|
|
16
|
|
14
|
|
||||||
|
Foreign
|
218
|
|
247
|
|
36
|
|
||||||
|
210
|
|
655
|
|
18
|
|
|||||||
|
Deferred:
|
||||||||||||
|
Federal
|
95
|
|
(899
|
)
|
(7
|
)
|
||||||
|
State
|
23
|
|
(59
|
)
|
(1
|
)
|
||||||
|
Foreign
|
(40
|
)
|
61
|
|
(84
|
)
|
||||||
|
78
|
|
(897
|
)
|
(92
|
)
|
|||||||
|
Total income tax expense (benefit)
|
$
|
288
|
|
$
|
(242
|
)
|
$
|
(74
|
)
|
|||
The current federal (benefit) and tax expense for fiscal years 2019 and 2018 includes a $
(44) million
transition tax benefit and
$332 million
transition tax expense, respectively. The current expense (benefit) for fiscal
2019
,
2018
and
2017
, includes interest and penalties of
$1 million
,
$2 million
and
$(9) million
, respectively, for uncertain tax positions.
The Act implemented a mandatory one-time deemed repatriation tax on previously untaxed accumulated and current earnings and profits of certain of the Company’s non-U.S. subsidiaries, and requires current income inclusions for global intangible low taxed income. As a result of these tax law changes, the HPES Merger, and changes in U.S. cash requirements, the Company changed its permanent reinvestment assertion in fiscal 2018 on the remaining foreign subsidiaries and determined we will no longer consider current and accumulated earnings for all non-U.S. subsidiaries permanently reinvested, except for current year India earnings. We expect a significant portion of the cash held by our foreign subsidiaries will no longer be subject to U.S federal income tax upon repatriation to the U.S.; however, a portion of this cash may still be subject to foreign and U.S. state tax consequences when remitted.
In accordance with the prior fiscal year change in our permanent reinvestment assertion, a deferred tax liability of
$554 million
previously recorded for U.S. income taxes based on the estimated historical taxable earnings of the HPES foreign subsidiaries was released. The Company had previously recorded an estimated liability of
$46 million
for the India dividend distribution tax based on estimated historical taxable earnings of the HPES India subsidiary. Due to a change in cash requirements of the U.S. parent and the HPES India subsidiary, the Company changed its reinvestment assertion relating to certain India earnings and reversed this estimated dividend distribution tax liability in the current period. As of March 31, 2019, the Company recorded foreign withholding taxes and state taxes of
$17 million
and
$11 million
, respectively, for the tax effects of this future cash repatriation.
In connection with the HPES Merger, the Company entered into a tax matters agreement with HPE. HPE generally will be responsible for pre-HPES Merger tax liabilities including adjustments made by tax authorities to HPES U.S. and non-U.S. income tax returns. Likewise, DXC is liable to HPE for income tax receivables and refunds which it receives related to pre-HPES Merger periods. Pursuant to the tax matters agreement, the Company recorded a net receivable of
$20 million
due to
$49 million
of tax indemnification receivable related to uncertain tax positions net of related deferred tax benefits,
$133 million
of tax indemnification receivable related to other tax payables and
$162 million
of tax indemnification payable related to other tax receivables.
In connection with the USPS Separation, the Company entered into a tax matters agreement with Perspecta. Pursuant to
the tax matters agreement, the Company generally will be responsible for tax liabilities arising prior to the USPS
Separation. Income tax liabilities transferred to Perspecta primarily relate to pre-HPES Merger periods, for which the
Company is indemnified by HPE pursuant to the tax matters agreement between the Company and HPE. The Company
remains liable to HPE for tax receivables and refunds which it receives from Perspecta related to pre-HPES Merger
periods that were transferred to Perspecta. Pursuant to the tax matters agreement, the Company recorded a net receivable of $
24 million
due to $
94 million
of tax indemnification receivable related to government tax refunds owed to Perspecta and $
70 million
of tax indemnification payable related to government tax payments due from Perspecta.
94
DXC TECHNOLOGY COMPANY - NOTES TO CONSOLIDATED FINANCIAL STATEMENTS
The major elements contributing to the difference between the U.S. federal statutory tax rate and the effective tax rate ("ETR") for continuing operations is below. Due to the Company's fiscal year, the U.S. federal weighted statutory tax rate for the fiscal years ended March 31, 2019 and March 31, 2018 were of
21.0%
and
31.5%
, respectively.
|
Fiscal Years Ended
|
|||||||||
|
March 31, 2019
|
March 31, 2018
|
March 31, 2017
|
|||||||
|
Statutory rate
|
21.0
|
%
|
31.5
|
%
|
(35.0
|
)%
|
|||
|
State income tax, net of federal tax
|
3.2
|
|
2.0
|
|
(4.0
|
)
|
|||
|
United States Tax Reform
|
(3.4
|
)
|
(40.6
|
)
|
—
|
|
|||
|
Change in Indefinite Reinvestment Assertion
|
(3.1
|
)
|
3.3
|
|
—
|
|
|||
|
Loss of attributes due to merger
|
—
|
|
5.1
|
|
—
|
|
|||
|
Change in uncertain tax positions
|
(1.5
|
)
|
(0.2
|
)
|
(3.4
|
)
|
|||
|
Foreign tax rate differential
|
(18.4
|
)
|
(5.7
|
)
|
(40.0
|
)
|
|||
|
Capitalized transaction costs
|
0.1
|
|
1.0
|
|
12.1
|
|
|||
|
Change in valuation allowances
|
16.9
|
|
(7.7
|
)
|
34.3
|
|
|||
|
Excess tax benefits for stock compensation
|
(1.1
|
)
|
(3.0
|
)
|
(11.3
|
)
|
|||
|
Prepaid tax asset amortization
|
—
|
|
0.3
|
|
7.1
|
|
|||
|
Income Tax and Foreign Tax Credits
|
(0.6
|
)
|
(7.6
|
)
|
(2.0
|
)
|
|||
|
U.S. Tax on Foreign Income
|
2.4
|
|
2.1
|
|
(2.6
|
)
|
|||
|
Withholding Taxes
|
3.5
|
|
2.3
|
|
(1.1
|
)
|
|||
|
Other items, net
|
—
|
|
(1.4
|
)
|
3.4
|
|
|||
|
Effective tax rate
|
19.0
|
%
|
(18.6
|
)%
|
(42.5
|
)%
|
|||
In fiscal 2019, the ETR was primarily impacted by:
|
•
|
Local tax losses on investments in Luxembourg that decreased the foreign tax rate differential and decreased the ETR by $
360 million
and
23.7%
, respectively, with an offsetting increase in the ETR due to an increase in the valuation allowance of the same amount.
|
|
•
|
A change in the net valuation allowance on certain deferred tax assets, primarily in Luxembourg, Germany, Spain, UK, and Switzerland, which increased income tax expense and increased the ETR by $
256 million
and
16.9%
, respectively.
|
|
•
|
A decrease in the transition tax liability and a change in tax accounting method for deferred revenue, which decreased income tax expense and decreased the ETR by $
66 million
and
4.3%
, respectively.
|
In fiscal 2018, the ETR was primarily impacted by:
|
•
|
Due to the Company's change in repatriation policy, the reversal of a deferred tax liability relating to the outside basis difference of foreign subsidiaries which increased the income tax benefit and decreased the ETR by $
554 million
and
42.5%
, respectively.
|
|
•
|
The accrual of the one-time transition tax imposed by the Act on estimated unremitted foreign earnings, which decreased the income tax benefit and increased the ETR by
$361 million
and
27.7%
, respectively.
|
|
•
|
The remeasurement of deferred tax assets and liabilities as a result of the Act, which increased the income tax benefit and decreased the ETR by
$338 million
and
25.9%
, respectively.
|
In fiscal 2017, the ETR was primarily impacted by:
|
•
|
A change in the valuation allowance that primarily consists of an aggregate income tax expense for the increase in the valuation allowances on tax attributes in the United States, Germany and Luxembourg, which decreased the overall income tax benefit and decreased the ETR by
$135 million
and
78%
, respectively. This was partially offset by an income tax benefit from the release of valuation allowances on tax attributes in Denmark, Japan and the United Kingdom, which increased the overall income tax benefit and increased the ETR by
$75 million
and
43%
, respectively.
|
95
DXC TECHNOLOGY COMPANY - NOTES TO CONSOLIDATED FINANCIAL STATEMENTS
|
•
|
An income tax detriment for transaction costs incurred that are not tax deductible, which resulted in a decrease to the overall tax benefit and decreased the ETR by
$21 million
and
12.1%
, respectively.
|
|
•
|
An income tax benefit from excess tax benefits realized from employee share-based payment awards, which resulted in an increase in the overall income tax benefit and increased the ETR by
$20 million
and
11.3%
, respectively.
|
The deferred tax assets (liabilities) were as follows:
|
As of
|
||||||||
|
(in millions)
|
March 31, 2019
|
March 31, 2018
|
||||||
|
Deferred tax assets
|
||||||||
|
Employee benefits
|
$
|
79
|
|
$
|
156
|
|
||
|
Tax loss/credit carryforwards
|
1,917
|
|
1,665
|
|
||||
|
Accrued interest
|
16
|
|
18
|
|
||||
|
Contract accounting
|
130
|
|
134
|
|
||||
|
Other assets
|
139
|
|
232
|
|
||||
|
Total deferred tax assets
|
2,281
|
|
2,205
|
|
||||
|
Valuation allowance
|
(1,575
|
)
|
(1,440
|
)
|
||||
|
Net deferred tax assets
|
706
|
|
765
|
|
||||
|
Deferred tax liabilities
|
||||||||
|
Depreciation and amortization
|
(994
|
)
|
(888
|
)
|
||||
|
Investment basis differences
|
(61
|
)
|
(62
|
)
|
||||
|
Other liabilities
|
(63
|
)
|
(94
|
)
|
||||
|
Total deferred tax liabilities
|
(1,118
|
)
|
(1,044
|
)
|
||||
|
Total net deferred tax assets (liabilities)
|
$
|
(412
|
)
|
$
|
(279
|
)
|
||
Income tax related assets are included in the accompanying balance sheets as follows:
|
As of
|
||||||||
|
(in millions)
|
March 31, 2019
|
March 31, 2018
|
||||||
|
Current:
|
||||||||
|
Income tax receivables and prepaid taxes
|
$
|
113
|
|
$
|
154
|
|
||
|
$
|
113
|
|
$
|
154
|
|
|||
|
Non-current:
|
||||||||
|
Income taxes receivable and prepaid taxes
|
$
|
137
|
|
$
|
30
|
|
||
|
Deferred tax assets
|
355
|
|
373
|
|
||||
|
$
|
492
|
|
$
|
403
|
|
|||
|
Total
|
$
|
605
|
|
$
|
557
|
|
||
96
DXC TECHNOLOGY COMPANY - NOTES TO CONSOLIDATED FINANCIAL STATEMENTS
Income tax related liabilities are included in the accompanying balance sheet as follows:
|
As of
|
||||||||
|
(in millions)
|
March 31, 2019
|
March 31, 2018
|
||||||
|
Current:
|
||||||||
|
Liability for uncertain tax positions
|
$
|
—
|
|
$
|
(15
|
)
|
||
|
Income taxes payable
|
(208
|
)
|
(112
|
)
|
||||
|
$
|
(208
|
)
|
$
|
(127
|
)
|
|||
|
Non-current:
|
||||||||
|
Deferred taxes
|
(767
|
)
|
(652
|
)
|
||||
|
Income taxes payable
|
(201
|
)
|
(278
|
)
|
||||
|
Liability for uncertain tax positions
|
(216
|
)
|
(236
|
)
|
||||
|
$
|
(1,184
|
)
|
$
|
(1,166
|
)
|
|||
|
Total
|
$
|
(1,392
|
)
|
$
|
(1,293
|
)
|
||
Significant management judgment is required in determining the Company's provision for income taxes, deferred tax assets and liabilities and any valuation allowance recorded against deferred tax assets. A valuation allowance has been recorded against deferred tax assets of approximately
$1.6 billion
as of
March 31, 2019
due to uncertainties related to the ability to utilize these assets. In assessing whether its deferred tax assets are realizable, the Company considers whether it is more likely than not that some portion or all of the deferred tax assets will not be realized and adjusts the valuation allowance accordingly. The Company considers all available positive and negative evidence including future reversals of existing taxable temporary differences, taxable income in prior carryback years, projected future taxable income, tax planning strategies and recent financial operations. As of March 31, 2018, DXC's net deferred tax assets in certain DXC German entities were primarily the result of net operating loss carryforwards, pension, restructuring, and other miscellaneous accruals. A full valuation allowance was recorded against these net deferred tax assets as of that reporting date. For the period ended December 31, 2018, management determined that the positive evidence, including the duration of the current profitability due to realization of cost synergies relating to the HPES merger, a legal entity restructuring allowing the future utilization of net operating loss carryforwards and the nonrecurring nature of the factors that primarily drove historical losses outweighs the negative evidence of a three-year cumulative loss. Therefore, as of December 31, 2018, management had a change in judgment and concluded that it is now more likely than not that the net deferred tax assets in these DXC German entities will be fully utilized. As a result, we recorded a valuation allowance release of $
113 million
. As of March 31, 2019, management had no change in our conclusions regarding the positive and negative evidence and the future realizability of these DXC German entities' deferred tax assets.
The net increase in the valuation allowance of
$135 million
in fiscal
2019
, is primarily due to the increase in Luxembourg tax losses, an adjustment for currency translation of
$122 million
primarily in Luxembourg, partially offset by a valuation allowance release with respect to certain deferred tax assets of German entities.
97
DXC TECHNOLOGY COMPANY - NOTES TO CONSOLIDATED FINANCIAL STATEMENTS
The following table provides information on the Company's various tax carryforwards:
|
As of March 31, 2019
|
As of March 31, 2018
|
|||||||||||||||||||||||||||
|
(in millions)
|
Total
|
|
With No Expiration
|
|
With Expiration
|
|
Expiration Dates Through
|
Total
|
With No Expiration
|
With Expiration
|
Expiration Dates Through
|
|||||||||||||||||
|
Net operating loss carryforwards
|
||||||||||||||||||||||||||||
|
Federal
|
$
|
25
|
|
$
|
—
|
|
$
|
25
|
|
2037
|
$
|
41
|
|
$
|
—
|
|
$
|
41
|
|
2037
|
||||||||
|
State
|
$
|
845
|
|
$
|
9
|
|
$
|
836
|
|
2039
|
$
|
873
|
|
$
|
—
|
|
$
|
873
|
|
2038
|
||||||||
|
Foreign
|
$
|
7,595
|
|
$
|
7,292
|
|
$
|
303
|
|
2039
|
$
|
6,522
|
|
$
|
6,287
|
|
$
|
235
|
|
2038
|
||||||||
|
Tax credit carryforwards
|
|
|||||||||||||||||||||||||||
|
Federal
|
$
|
—
|
|
$
|
—
|
|
$
|
—
|
|
N/A
|
$
|
—
|
|
$
|
—
|
|
$
|
—
|
|
N/A
|
||||||||
|
State
|
$
|
23
|
|
$
|
7
|
|
$
|
16
|
|
2039
|
$
|
28
|
|
$
|
7
|
|
$
|
21
|
|
2038
|
||||||||
|
Foreign
|
$
|
18
|
|
$
|
—
|
|
$
|
18
|
|
2020
|
$
|
21
|
|
$
|
—
|
|
$
|
21
|
|
2020
|
||||||||
|
Capital loss carryforwards
|
|
|||||||||||||||||||||||||||
|
Federal
|
$
|
—
|
|
$
|
—
|
|
$
|
—
|
|
N/A
|
$
|
—
|
|
$
|
—
|
|
$
|
—
|
|
N/A
|
||||||||
|
State
|
$
|
—
|
|
$
|
—
|
|
$
|
—
|
|
N/A
|
$
|
—
|
|
$
|
—
|
|
$
|
—
|
|
N/A
|
||||||||
|
Foreign
|
$
|
236
|
|
$
|
211
|
|
$
|
25
|
|
2023
|
$
|
240
|
|
$
|
193
|
|
$
|
47
|
|
2023
|
||||||||
The Company is currently the beneficiary of tax holiday incentives in India, which expire in various fiscal years through
2026
, and was a beneficiary of Malaysian tax holiday incentives in fiscal 2018 and 2017. As a result of these tax holiday incentives, the Company recorded an income tax benefit of approximately
$2 million
,
$5 million
and
$1 million
, during fiscal
2019
,
2018
and
2017
, respectively. The per share effects were
$0.01
,
$0.02
and
$0.01
, for fiscal
2019
,
2018
and
2017
, respectively.
The Company accounts for income tax uncertainties in accordance with ASC 740 Income Taxes, which prescribes a recognition threshold and measurement criteria for the financial statement recognition and measurement of a tax position taken or expected to be taken in a tax return. Benefits from tax positions should be recognized in the financial statements only when it is more likely than not that the tax position will be sustained upon examination by the appropriate taxing authority that would have full knowledge of all relevant information. A tax position that meets the more likely than not recognition threshold is measured at the largest amount of benefit that is greater than fifty percent likely of being realized upon ultimate settlement. Tax positions that previously failed to meet the more likely than not recognition threshold should be recognized in the first subsequent financial reporting period in which that threshold is met. Previously recognized tax positions that no longer meet the more likely than not recognition threshold should be derecognized in the first subsequent financial reporting period in which that threshold is no longer met. ASC 740 also provides guidance on the accounting for and disclosure of liabilities for uncertain tax positions, interest and penalties.
In accordance with ASC 740, the Company’s liability for uncertain tax positions was as follows:
|
Fiscal Years Ended
|
||||||||
|
(in millions)
|
March 31, 2019
|
|
March 31, 2018
|
|
||||
|
Tax
|
$
|
165
|
|
$
|
219
|
|
||
|
Interest
|
41
|
|
40
|
|
||||
|
Penalties
|
25
|
|
25
|
|
||||
|
Net of tax attributes
|
(15
|
)
|
(33
|
)
|
||||
|
Total
|
$
|
216
|
|
$
|
251
|
|
||
98
DXC TECHNOLOGY COMPANY - NOTES TO CONSOLIDATED FINANCIAL STATEMENTS
The following table summarizes the activity related to the Company’s uncertain tax positions (excluding interest and penalties and related tax attributes):
|
Fiscal Years Ended
|
||||||||||||
|
(in millions)
|
March 31, 2019
|
March 31, 2018
|
March 31, 2017
|
|||||||||
|
Balance at beginning of fiscal year
|
$
|
219
|
|
$
|
192
|
|
$
|
180
|
|
|||
|
Gross increases related to prior year tax positions
|
4
|
|
10
|
|
14
|
|
||||||
|
Gross decreases related to prior year tax positions
|
(27
|
)
|
(12
|
)
|
(12
|
)
|
||||||
|
Gross increases related to current year tax positions
|
—
|
|
7
|
|
10
|
|
||||||
|
Settlements and statute of limitation expirations
|
(23
|
)
|
(19
|
)
|
(7
|
)
|
||||||
|
Acquisitions
|
—
|
|
39
|
|
6
|
|
||||||
|
Foreign exchange and others
|
(8
|
)
|
2
|
|
1
|
|
||||||
|
Balance at end of fiscal year
|
$
|
165
|
|
$
|
219
|
|
$
|
192
|
|
|||
The Company’s liability for uncertain tax positions at
March 31, 2019
,
March 31, 2018
and
March 31, 2017
, includes
$138 million
,
$170 million
and
$149 million
, respectively, related to amounts that, if recognized, would affect the effective tax rate (excluding related interest and penalties).
The Company recognizes interest accrued related to uncertain tax positions and penalties as a component of income tax expense. During the year ended March 31, 2019, the Company had a net increase in interest expense of
$2 million
(
$1 million
net of tax) and a net decrease in accrued expense for penalties of
$1 million
and, as of March 31, 2019, recognized a liability for interest of
$41 million
(
$36 million
net of tax) and penalties of
$25 million
. During the year ended March 31, 2018, the Company had a net increase in interest of
$2 million
(
$2 million
net of tax) and
no
net increase in accrued expense for penalties, and as of March 31, 2018, has recognized a liability for interest of
$40 million
(
$36 million
net of tax) and penalties of
$25 million
. The following table presents the change in interest and penalties from the previous reported period, as well as the liability at the end of each period presented:
|
As of and for the Fiscal Years Ended
|
||||||||||||
|
March 31, 2019
|
March 31, 2018
|
March 31, 2017
|
||||||||||
|
(in millions)
|
Increase (Decrease)
|
|||||||||||
|
Interest
|
$
|
2
|
|
$
|
2
|
|
$
|
(8
|
)
|
|||
|
Interest, net of tax
|
$
|
1
|
|
$
|
2
|
|
$
|
(9
|
)
|
|||
|
Accrued penalties
|
$
|
(1
|
)
|
$
|
—
|
|
$
|
—
|
|
|||
|
Liability for interest
|
$
|
41
|
|
$
|
40
|
|
$
|
25
|
|
|||
|
Liability for interest, net of tax
|
$
|
36
|
|
$
|
36
|
|
$
|
20
|
|
|||
|
Liability for penalties
|
$
|
25
|
|
$
|
25
|
|
$
|
11
|
|
|||
99
DXC TECHNOLOGY COMPANY - NOTES TO CONSOLIDATED FINANCIAL STATEMENTS
The Company is currently under examination in several tax jurisdictions. A summary of the tax years that remain subject to examination in certain of the Company’s major tax jurisdictions are:
|
Jurisdiction:
|
Tax Years that Remain Subject to Examination
(Fiscal Year Ending):
|
|
|
United States – Federal
|
2008 and forward
|
|
|
United States – Various States
|
2008 and forward
|
|
|
Australia
|
2012 and forward
|
|
|
Canada
|
2010 and forward
|
|
|
France
|
2013 and forward
|
|
|
Germany
|
2010 and forward
|
|
|
India
|
1998 and forward
|
|
|
United Kingdom
|
2013 and forward
|
|
The IRS is examining CSC's federal income tax returns for fiscal 2008 through 2017. With respect to CSC's fiscal 2008 through 2010 federal tax returns, the Company previously entered into negotiations for a resolution through settlement with the IRS Office of Appeals. The IRS examined several issues for this audit that resulted in various audit adjustments. The Company and the IRS Office of Appeals have an agreement in principle as to some but not all of these adjustments. The Company has agreed to extend the statute of limitations associated with this audit through November 30, 2019. In addition, during the first quarter of fiscal 2018, the Company received a Revenue Agent’s Report with proposed adjustments to CSC's fiscal 2011 through 2013 federal returns. The Company has filed a protest of certain of these adjustments to the IRS Office of Appeals. The IRS is also examining CSC's fiscal 2014 through 2017 federal income tax returns. The Company has not received any proposed adjustments for these tax years. The Company continues to believe that its tax positions are more likely than not sustainable and that the Company will ultimately prevail. The Company now expects to reach a resolution for all years no earlier than fiscal 2021.
In addition, the Company may settle certain other tax examinations, have lapses in statutes of limitations, or voluntarily settle income tax positions in negotiated settlements for different amounts than the Company has accrued as uncertain tax positions. The Company may need to accrue and ultimately pay additional amounts for tax positions that previously met a more likely than not standard if such positions are not upheld. Conversely, the Company could settle positions with the tax authorities for amounts lower than those that have been accrued or extinguish a position though payment. The Company believes the outcomes which are reasonably possible within the next twelve months may result in a reduction in liability for uncertain tax positions of
$9 million
, excluding interest, penalties, and tax carryforwards.
100
DXC TECHNOLOGY COMPANY - NOTES TO CONSOLIDATED FINANCIAL STATEMENTS
Note
12
-
Debt
The following is a summary of the Company's debt:
|
As of
|
||||||||||||
|
(in millions)
|
Interest Rates
|
Fiscal Year Maturities
|
March 31, 2019
|
March 31, 2018
|
||||||||
|
Short-term debt and current maturities of long-term debt
|
||||||||||||
|
Euro-denominated commercial paper
(1)
|
(0.1) - 0.02%
(2)
|
2020
|
$
|
694
|
|
$
|
863
|
|
||||
|
Current maturities of long-term debt
|
Various
|
2020
|
766
|
|
439
|
|
||||||
|
Current maturities of capitalized lease liabilities
|
1.0% - 12.0%
|
2020
|
482
|
|
616
|
|
||||||
|
Short-term debt and current maturities of long-term debt
|
$
|
1,942
|
|
$
|
1,918
|
|
||||||
|
Long-term debt, net of current maturities
|
||||||||||||
|
GBP term loan
|
1.3% -1.5%
(3)
|
2019
|
$
|
—
|
|
$
|
260
|
|
||||
|
EUR term loan
|
1.75%
(4)
|
2019
|
—
|
|
493
|
|
||||||
|
AUD term loan
|
2.7% - 2.9%
(5)
|
2021
|
567
|
|
—
|
|
||||||
|
AUD term loan
|
2.9% - 3.3%
(6)
|
2022
|
—
|
|
210
|
|
||||||
|
GBP term loan
|
1.60%
(7)
|
2022
|
583
|
|
—
|
|
||||||
|
EUR term loan
|
0.90%
(8)
|
2022
|
—
|
|
187
|
|
||||||
|
USD term loan
|
3.1% - 3.3%
(9)
|
2022
|
—
|
|
899
|
|
||||||
|
$500 million Senior notes
|
2.875%
|
2020
|
502
|
|
502
|
|
||||||
|
$500 million Senior notes
|
3.0% - 3.8%
(10)
|
2021
|
498
|
|
646
|
|
||||||
|
$274 million Senior notes
|
4.45%
|
2023
|
277
|
|
278
|
|
||||||
|
$171 million Senior notes
|
4.45%
|
2023
|
172
|
|
173
|
|
||||||
|
$500 million Senior notes
|
4.25%
|
2025
|
506
|
|
507
|
|
||||||
|
£
250 million Senior notes
|
2.75%
|
2025
|
322
|
|
346
|
|
||||||
|
€650 million Senior notes
|
1.75%
|
2026
|
725
|
|
—
|
|
||||||
|
$500 million Senior notes
|
4.75%
|
2028
|
508
|
|
509
|
|
||||||
|
$234 million Senior notes
|
7.45%
|
2030
|
273
|
|
277
|
|
||||||
|
Lease credit facility
|
2.2% - 3.5%
|
2020 - 2023
|
25
|
|
46
|
|
||||||
|
Capitalized lease liabilities
|
1.0% - 12.0%
|
2020 - 2024
|
1,127
|
|
1,235
|
|
||||||
|
Borrowings for assets acquired under long-term financing
|
2.3% - 4.5%
|
2020 - 2024
|
462
|
|
405
|
|
||||||
|
Mandatorily redeemable preferred stock outstanding
|
6.00%
|
2023
|
62
|
|
61
|
|
||||||
|
Other borrowings
|
0.5% - 7.4%
|
2020 - 2022
|
109
|
|
113
|
|
||||||
|
Long-term debt
|
6,718
|
|
7,147
|
|
||||||||
|
Less: current maturities
|
1,248
|
|
1,055
|
|
||||||||
|
Long-term debt, net of current maturities
|
$
|
5,470
|
|
$
|
6,092
|
|
||||||
101
DXC TECHNOLOGY COMPANY - NOTES TO CONSOLIDATED FINANCIAL STATEMENTS
|
(1)
|
At DXC's option, DXC can borrow up to a maximum of
€1 billion
.
|
|
(2)
|
Approximate weighted average interest rate.
|
(3)
Three-month LIBOR rate plus
0.65%
.
(4)
Three-month EURIBOR rate plus
1.75%
.
(5)
Variable interest rate equal to the bank bill swap bid rate for a one-, two-, three- or six-month interest period plus
0.60%
to
0.95%
based on the published credit ratings of DXC.
(6)
Variable interest rate equal to the bank bill swap bid rate for a one, two, three or six-month interest period plus
0.95%
to
1.45%
based on the published credit ratings of DXC.
(7)
Three-month LIBOR plus
0.80%
.
(8)
At DXC’s option, the EUR term loan bears interest at the Eurocurrency Rate for a one-, two-, three-, or six-month interest period, plus a margin of between
0.75%
and
1.35%
, based on published credit ratings of DXC.
(9)
At DXC’s option, the USD term loan bears interest at the Eurocurrency Rate for a one-, two-, three-, or six-month interest period, plus a margin of between
1.00%
and
1.75%
, based on published credit ratings of DXC or the Base Rate plus a margin of between
0.00%
and
0.75%
, based on published credit ratings of DXC.
(10)
Three-month LIBOR plus
0.95%
.
Senior Notes and Term Loans
Interest on the Company's term loans is payable monthly or quarterly in arrears at the election of the borrowers. The Company fully and unconditionally guarantees term loans issued by its
100%
owned subsidiaries. Interest on the Company's senior notes is payable semi-annually in arrears, except for interest on the
£250 million
Senior notes due
2025
and
€650 million
Senior Notes due 2026 which is payable annually in arrears, and interest on the
$500 million
Senior notes due
2021
which is payable quarterly in arrears. Generally, the Company's notes are redeemable at the Company's discretion at the then-applicable redemption premium plus accrued interest.
102
DXC TECHNOLOGY COMPANY - NOTES TO CONSOLIDATED FINANCIAL STATEMENTS
Capital Lease and Financing Obligations
Capitalized lease liabilities represent obligations due under capital leases for the use of computers and other equipment. The gross amount of assets recorded under capital leases was
$2.2 billion
with accumulated amortization of
$1.0 billion
as of
March 31, 2019
, and
$3.5 billion
with accumulated amortization of
$2.3 billion
as of
March 31, 2018
. The future minimum lease payments required to be made under the capital leases as of
March 31, 2019
, are as follows:
|
Fiscal Year
|
(in millions)
|
|||
|
2020
|
$
|
509
|
|
|
|
2021
|
310
|
|
||
|
2022
|
212
|
|
||
|
2023
|
128
|
|
||
|
2024
|
36
|
|
||
|
Thereafter
|
—
|
|
||
|
Total minimum lease payments
|
1,195
|
|
||
|
Less: Amount representing interest and executory costs
|
(68
|
)
|
||
|
Present value of net minimum lease payments
|
1,127
|
|
||
|
Less: Current maturities of capital lease obligations
|
(482
|
)
|
||
|
Long-term capitalized lease liabilities
|
$
|
645
|
|
|
Future Maturities of Long-term Debt
Expected maturities of long-term debt, including borrowings for asset financing but excluding minimum capital lease payments, for fiscal years subsequent to
March 31, 2019
, are as follows:
|
Fiscal Year
|
(in millions)
|
|||
|
2020
|
$
|
766
|
|
|
|
2021
|
1,221
|
|
||
|
2022
|
722
|
|
||
|
2023
|
547
|
|
||
|
2024
|
21
|
|
||
|
Thereafter
|
2,314
|
|
||
|
Total
|
$
|
5,591
|
|
|
103
DXC TECHNOLOGY COMPANY - NOTES TO CONSOLIDATED FINANCIAL STATEMENTS
Note
13
-
Pension and Other Benefit Plans
The Company offers a number of pension and OPEB plans, life insurance benefits, deferred compensation and defined contribution plans. Most of the Company's pension plans are not admitting new participants; therefore, changes to pension liabilities are primarily due to market fluctuations of investments for existing participants and changes in interest rates.
Defined Benefit Plans
The Company sponsors a number of defined benefit and post-retirement medical benefit plans for the benefit of eligible employees. The benefit obligations of the Company's U.S. pension, U.S. OPEB, and non-U.S. OPEB plans represent an insignificant portion of the Company's pension and other post-retirement benefit plans. As a result, the disclosures below include the Company's U.S. and non-U.S. pension plans on a global consolidated basis.
Eligible employees are enrolled in defined benefit pension plans in their country of domicile. The Contributory defined benefit pension plan in the United Kingdom represents the largest plan. In addition, healthcare, dental and life insurance benefits are also provided to certain non-U.S. employees. A significant number of employees outside the United States are covered by government sponsored programs at no direct cost to the Company other than related payroll taxes.
During fiscal 2018, the Company adopted amendments to certain U.K. pension plans which necessitated an interim remeasurement of the plans' assets and liabilities as of December 1, 2017. The remeasurement resulted in a net gain of
$17 million
, comprising a curtailment gain of
$40 million
and an actuarial loss
$23 million
. The net gain was recognized within costs of services and selling, general and administrative.
The Company accrued
$3 million
,
$13 million
and
$1 million
, for fiscal
2019
,
2018
and
2017
, respectively, as additional contractual termination benefits for certain employees are part of the Company's restructuring plans. These amounts are reflected in the projected benefit obligation and in the net periodic pension cost.
Projected Benefit Obligations
|
As of
|
||||||||
|
(in millions)
|
March 31, 2019
|
March 31, 2018
|
||||||
|
Projected benefit obligation at beginning of year
|
$
|
11,384
|
|
$
|
3,297
|
|
||
|
Benefit obligation assumed as a result of the HPES merger
|
—
|
|
7,351
|
|
||||
|
Service cost
|
88
|
|
121
|
|
||||
|
Interest cost
|
253
|
|
249
|
|
||||
|
Plan participants’ contributions
|
13
|
|
16
|
|
||||
|
Amendments
|
27
|
|
(44
|
)
|
||||
|
Business/contract acquisitions/divestitures
|
—
|
|
69
|
|
||||
|
Contractual termination benefits
|
3
|
|
13
|
|
||||
|
Settlement/curtailment
|
(49
|
)
|
(65
|
)
|
||||
|
Actuarial loss (gain)
|
286
|
|
(332
|
)
|
||||
|
Benefits paid
|
(344
|
)
|
(447
|
)
|
||||
|
Foreign currency exchange rate changes
|
(818
|
)
|
1,170
|
|
||||
|
Other
|
173
|
|
(14
|
)
|
||||
|
Projected benefit obligation at end of year
|
$
|
11,016
|
|
$
|
11,384
|
|
||
104
DXC TECHNOLOGY COMPANY - NOTES TO CONSOLIDATED FINANCIAL STATEMENTS
The following table summarizes the weighted average rates used in the determination of the Company’s benefit obligations:
|
Fiscal Years Ended
|
||||||
|
March 31, 2019
|
March 31, 2018
|
|||||
|
Discount rate
|
2.4
|
%
|
2.5
|
%
|
||
|
Rates of increase in compensation levels
|
2.0
|
%
|
2.0
|
%
|
||
Fair Value of Plan Assets and Funded Status
|
As of
|
||||||||
|
(in millions)
|
March 31, 2019
|
March 31, 2018
|
||||||
|
Fair value of plan assets at beginning of year
|
$
|
11,574
|
|
$
|
2,998
|
|
||
|
Assets assumed as a result of the HPES merger
|
—
|
|
7,411
|
|
||||
|
Actual return on plan assets
|
700
|
|
371
|
|
||||
|
Employer contribution
|
78
|
|
83
|
|
||||
|
Plan participants’ contributions
|
13
|
|
16
|
|
||||
|
Benefits paid
|
(344
|
)
|
(447
|
)
|
||||
|
Business/contract acquisitions/divestitures
|
—
|
|
(2
|
)
|
||||
|
Contractual termination benefits
|
17
|
|
4
|
|
||||
|
Plan settlement
|
(38
|
)
|
(22
|
)
|
||||
|
Foreign currency exchange rate changes
|
(837
|
)
|
1,176
|
|
||||
|
Other
|
180
|
|
(14
|
)
|
||||
|
Fair value of plan assets at end of year
|
$
|
11,343
|
|
$
|
11,574
|
|
||
|
Funded status at end of year
|
$
|
327
|
|
$
|
190
|
|
||
During fiscal 2017, the Company, along with the Trustee of CSC Computer Sciences Ltd. Main Pension Scheme (“CSC UK Pension”), the Trustee of the Rebus Pension Scheme (“Xchanging UK Pension”), and a financial institution (the "Institution"), entered into a multi-party arrangement whereby the Company’s corporate campus in Aldershot, U.K. (the "Property") was monetized for approximately
$85 million
in proceeds net of stamp duties paid. The Company concurrently contributed $
85 million
to the CSC UK Pension and Xchanging UK Pension plans as a special discretionary employer contribution. The transaction was executed by contributing the Property to a property limited partnership and all such limited partnership interests were contributed to a Jersey Unit Trust owned
1%
by the Company and
99%
by the Institution.
Under the structured sale transaction, the Company entered into a
15
-year master lease arrangement as master tenant, at approximately
$4 million
rent per year. Under U.S. GAAP, due to the continuing interest of the Company as master tenant, residual profit participation retained by the Company, Xchanging UK Pension and CSC UK Pension, and the Company's ownership of the general partner of the property limited partnership that owns the Property, the structured sale transaction resulted in accounting treatment as a financing transaction. As a consequence, the Property remains accounted for as an asset on the balance sheet of the Company at historical cost basis and accumulated depreciation thereon, with
no
gain or loss recorded. A corresponding
$85 million
liability was recorded during fiscal 2017 as other long-term liabilities on the Company's balance sheet.
105
DXC TECHNOLOGY COMPANY - NOTES TO CONSOLIDATED FINANCIAL STATEMENTS
Selected Information
|
As of
|
||||||||
|
(in millions)
|
March 31, 2019
|
March 31, 2018
|
||||||
|
Other assets
|
$
|
1,157
|
|
$
|
1,118
|
|
||
|
Accrued expenses and other current liabilities
|
(20
|
)
|
(28
|
)
|
||||
|
Non-current pension obligations
|
(790
|
)
|
(879
|
)
|
||||
|
Other long-term liabilities - OPEB
|
(20
|
)
|
(21
|
)
|
||||
|
Net amount recorded
|
$
|
327
|
|
$
|
190
|
|
||
|
Accumulated benefit obligation
|
$
|
10,893
|
|
$
|
11,241
|
|
||
|
Benefit Plans with Projected Benefit Obligation in Excess of Plan Assets
|
Benefit Plans with Accumulated Benefit Obligation in Excess of Plan Assets
|
|||||||||||||||
|
(in millions)
|
March 31, 2019
|
March 31, 2018
|
March 31, 2019
|
March 31, 2018
|
||||||||||||
|
Projected benefit obligation
|
$
|
2,329
|
|
$
|
2,488
|
|
$
|
2,070
|
|
$
|
2,250
|
|
||||
|
Accumulated benefit obligation
|
$
|
2,230
|
|
$
|
2,363
|
|
$
|
2,004
|
|
$
|
2,162
|
|
||||
|
Fair value of plan assets
|
$
|
1,494
|
|
$
|
1,552
|
|
$
|
1,255
|
|
$
|
1,338
|
|
||||
Net Periodic Pension Cost
|
Fiscal Years Ended
|
||||||||||||
|
(in millions)
|
March 31, 2019
|
March 31, 2018
|
March 31, 2017
|
|||||||||
|
Service cost
|
$
|
88
|
|
$
|
121
|
|
$
|
23
|
|
|||
|
Interest cost
|
253
|
|
|
249
|
|
82
|
|
|||||
|
Expected return on assets
|
(570
|
)
|
(534
|
)
|
(161
|
)
|
||||||
|
Amortization of transition obligation
|
—
|
|
1
|
|
1
|
|
||||||
|
Amortization of prior service costs
|
(15
|
)
|
(18
|
)
|
(17
|
)
|
||||||
|
Contractual termination benefit
|
3
|
|
13
|
|
1
|
|
||||||
|
Settlement/curtailment gain
|
(10
|
)
|
(42
|
)
|
—
|
|
||||||
|
Recognition of actuarial loss (gain)
|
153
|
|
(178
|
)
|
87
|
|
||||||
|
Net periodic pension (income) expense
|
$
|
(98
|
)
|
$
|
(388
|
)
|
$
|
16
|
|
|||
The service cost component of net periodic pension (income) expense is presented in cost of services and selling, general and administrative and the other components of net periodic pension income are presented in other income, net in the
Company’s statements of operations. See Note 1 - "Summary of Significant Accounting Policies," for further discussion of
the Company's adoption of ASU 2017-07 and its impact on the presentation of net periodic pension costs.
Estimated prior service credit of
$9 million
will be amortized from AOCI into net periodic pension cost over the next fiscal year. The weighted-average rates used to determine net periodic pension cost were:
|
Fiscal Years Ended
|
|||||||||
|
March 31, 2019
|
March 31, 2018
|
March 31, 2017
|
|||||||
|
Discount or settlement rates
|
2.5
|
%
|
2.5
|
%
|
3.1
|
%
|
|||
|
Expected long-term rates of return on assets
|
5.3
|
%
|
4.9
|
%
|
6.3
|
%
|
|||
|
Rates of increase in compensation levels
|
2.1
|
%
|
2.7
|
%
|
2.6
|
%
|
|||
106
DXC TECHNOLOGY COMPANY - NOTES TO CONSOLIDATED FINANCIAL STATEMENTS
The following is a summary of amounts in AOCI, before tax effects:
|
Fiscal Years Ended
|
||||||||
|
(in millions)
|
March 31, 2019
|
March 31, 2018
|
||||||
|
Prior service cost
|
$
|
(195
|
)
|
$
|
(298
|
)
|
||
Estimated Future Contributions and Benefits Payments
|
(in millions)
|
||||
|
Employer contributions:
|
||||
|
2020
|
$
|
82
|
|
|
|
Benefit Payments:
|
||||
|
2020
|
$
|
319
|
|
|
|
2021
|
305
|
|
||
|
2022
|
358
|
|
||
|
2023
|
300
|
|
||
|
2024
|
302
|
|
||
|
2025 and thereafter
|
1,610
|
|
||
|
Total
|
$
|
3,194
|
|
|
Fair Value of Plan Assets
The tables below set forth the fair value of plan assets by asset category within the fair value hierarchy:
|
As of March 31, 2019
|
|||||||||||||||||
|
(in millions)
|
Level 1
|
Level 2
|
Level 3
|
Total
|
|||||||||||||
|
Equity:
|
|||||||||||||||||
|
US Domestic Stocks
|
$
|
1
|
|
$
|
—
|
|
$
|
—
|
|
$
|
1
|
|
|||||
|
Global Stocks
|
10
|
|
13
|
|
—
|
|
23
|
|
|||||||||
|
Global/International Equity commingled funds
|
399
|
|
2,156
|
|
—
|
|
2,555
|
|
|||||||||
|
Global equity mutual funds
|
49
|
|
325
|
|
—
|
|
374
|
|
|||||||||
|
U.S./North American Equity commingled funds
|
1
|
|
10
|
|
—
|
|
11
|
|
|||||||||
|
Fixed Income:
|
|||||||||||||||||
|
Non-U.S. Government funds
|
215
|
|
29
|
|
—
|
|
244
|
|
|||||||||
|
Fixed income commingled funds
|
6
|
|
4,807
|
|
—
|
|
4,813
|
|
|||||||||
|
Fixed income mutual funds
|
2
|
|
1
|
|
—
|
|
3
|
|
|||||||||
|
Corporate bonds
|
—
|
|
2
|
|
—
|
|
2
|
|
|||||||||
|
Alternatives:
|
|||||||||||||||||
|
Other Alternatives
(1)
|
6
|
|
1,880
|
|
982
|
|
2,868
|
|
|||||||||
|
Hedge Funds
(2)
|
—
|
|
8
|
|
—
|
|
8
|
|
|||||||||
|
Other Assets
|
—
|
|
—
|
|
36
|
|
36
|
|
|||||||||
|
Insurance contracts
|
—
|
|
108
|
|
14
|
|
122
|
|
|||||||||
|
Cash and cash equivalents
|
99
|
|
184
|
|
—
|
|
283
|
|
|||||||||
|
Totals
|
$
|
788
|
|
$
|
9,523
|
|
$
|
1,032
|
|
$
|
11,343
|
|
|||||
107
DXC TECHNOLOGY COMPANY - NOTES TO CONSOLIDATED FINANCIAL STATEMENTS
|
As of March 31, 2018
|
|||||||||||||||||
|
(in millions)
|
Level 1
|
Level 2
|
Level 3
|
Total
|
|||||||||||||
|
Equity:
|
|||||||||||||||||
|
Global/International Equity commingled funds
|
$
|
465
|
|
$
|
1,978
|
|
$
|
—
|
|
$
|
2,443
|
|
|||||
|
Global equity mutual funds
|
8
|
|
333
|
|
—
|
|
341
|
|
|||||||||
|
U.S./North American Equity commingled funds
|
3
|
|
46
|
|
—
|
|
49
|
|
|||||||||
|
Fixed Income:
|
|||||||||||||||||
|
U.S. Government funds
|
—
|
|
1
|
|
—
|
|
1
|
|
|||||||||
|
Non-U.S. Government funds
|
2
|
|
54
|
|
—
|
|
56
|
|
|||||||||
|
Fixed income commingled funds
|
3
|
|
6,092
|
|
—
|
|
6,095
|
|
|||||||||
|
Fixed income mutual funds
|
3
|
|
—
|
|
—
|
|
3
|
|
|||||||||
|
Alternatives:
|
|||||||||||||||||
|
Other Alternatives
(1)
|
4
|
|
1,228
|
|
874
|
|
2,106
|
|
|||||||||
|
Hedge Funds
(2)
|
—
|
|
2
|
|
—
|
|
2
|
|
|||||||||
|
Other Assets
|
—
|
|
—
|
|
3
|
|
3
|
|
|||||||||
|
Insurance contracts
|
—
|
|
160
|
|
10
|
|
170
|
|
|||||||||
|
Cash and cash equivalents
|
300
|
|
5
|
|
—
|
|
305
|
|
|||||||||
|
Totals
|
$
|
788
|
|
$
|
9,899
|
|
$
|
887
|
|
$
|
11,574
|
|
|||||
(1)
Represents real estate and other commingled funds consisting mainly of equities, bonds, or commodities.
(2)
Represents investments in diversified fund of hedge funds.
Changes in fair value measurements of level 3 investments for the defined benefit plans were as follows:
|
(in millions)
|
||||
|
Balance as of April 1, 2017
|
$
|
348
|
|
|
|
Actual return on plan assets held at the reporting date
|
34
|
|
||
|
Purchases, sales and settlements
|
443
|
|
||
|
Changes due to exchange rates
|
62
|
|
||
|
Balance as of March 31, 2018
|
887
|
|
||
|
Actual return on plan assets held at the reporting date
|
(13
|
)
|
||
|
Purchases, sales and settlements
|
217
|
|
||
|
Transfers in and / or out of Level 3
|
5
|
|
||
|
Changes due to exchange rates
|
(64
|
)
|
||
|
Balance as of March 31, 2019
|
$
|
1,032
|
|
|
Domestic and global equity accounts are categorized as Level 1 if the securities trade on national or international exchanges and are valued at their last reported closing price. Equity assets in commingled funds reporting a net asset value are categorized as Level 2 and valued using broker dealer bids or quotes of securities with similar characteristics.
Fixed income accounts are categorized as Level 1 if traded on a publicly quoted exchange or as level 2 if investments in corporate bonds are primarily investment grade bonds, generally priced using model-based pricing methods that use observable market data as inputs. Broker dealer bids or quotes of securities with similar characteristics may also be used.
108
DXC TECHNOLOGY COMPANY - NOTES TO CONSOLIDATED FINANCIAL STATEMENTS
Alternative investment fund securities are categorized as Level 1 if held in a mutual fund or in a separate account structure and actively traded through a recognized exchange, or as Level 2 if they are held in commingled or collective account structures and are actively traded. Alternative investment fund securities are classified as Level 3 if they are held in Limited Company or Limited Partnership structures or cannot otherwise be classified as Level 1 or Level 2.
Other assets represent property holdings by certain pension plans. As above, the property holdings represent a master lease arrangement entered into by DXC in the United Kingdom and certain U.K. pension plans as a financing transaction.
Insurance contracts purchased to cover benefits payable to retirees are valued using the assumptions used to value the projected benefit obligation.
Cash equivalents that have quoted prices in active markets are classified as Level 1. Short-term money market commingled funds are categorized as Level 2 and valued at cost plus accrued interest which approximates fair value.
Plan Asset Allocations
|
As of
|
||||||
|
Asset Category
|
March 31, 2019
|
March 31, 2018
|
||||
|
Equity securities
|
26
|
%
|
25
|
%
|
||
|
Debt securities
|
45
|
%
|
53
|
%
|
||
|
Alternatives
|
25
|
%
|
18
|
%
|
||
|
Cash and other
|
4
|
%
|
4
|
%
|
||
|
Total
|
100
|
%
|
100
|
%
|
||
Plan assets are held in a trust that includes commingled funds subject to country specific regulations and invested primarily in commingled funds. For the U.K. pension plans, the Company's largest pension plans by assets and projected liabilities, a target allocation by asset class was developed to achieve their long-term objectives. Asset allocations are monitored closely and investment reviews regarding asset strategy are conducted regularly with internal and external advisors.
The Company’s investment goals and risk management strategy for plan assets evaluates a number of factors, including the time horizon of the plans’ obligations. Plan assets are invested in various asset classes that are expected to produce a sufficient level of diversification in order to reduce risk, yet produces a reasonable amount of return on investment over the long term. Sufficient liquidity is maintained to meet benefit obligations as they become due. Third party investment managers are employed to invest assets in both passively-indexed and actively-managed strategies. Equities are primarily invested broadly in domestic and foreign companies across market capitalizations and industries. Fixed income securities are invested broadly, primarily in government treasury, corporate credit, mortgage backed and asset backed investments. Alternative investment allocations are included in selected plans to achieve greater portfolio diversity intended to reduce the overall volatility risk of the plans.
Plan asset risks include longevity, inflation, and other changes in market conditions that could reduce the value of plan assets. Also, a decline in the yield of high quality corporate bonds may adversely affect discount rates resulting in an increase in DXC's pension and other post-retirement obligations. These risks, among others, could cause the plans’ funded status to deteriorate, resulting in an increased reliance on Company contributions. Derivatives are permitted although their current use is limited within traditional funds and broadly allowed within alternative funds. Derivatives are used for inflation risk management and within the liability driven investing strategy. The Company also has investments in insurance contracts to pay plan benefits in certain countries.
109
DXC TECHNOLOGY COMPANY - NOTES TO CONSOLIDATED FINANCIAL STATEMENTS
Return on Assets
The Company consults with internal and external advisors regarding the expected long-term rate of return on assets. The Company uses various sources in its approach to compute the expected long-term rate of return of the major asset classes expected in each of the plans. DXC utilizes long-term, asset class return assumptions of typically 30 years, which are provided by external advisors. Consideration is also given to the extent active management is employed in each asset class and also to management expenses. A single expected long-term rate of return is calculated for each plan by assessing the plan's expected asset allocation strategy, the benefits of diversification therefrom, historical excess returns from actively managed traditional investments, expected long-term returns for alternative investments and expected investment expenses. The resulting composite rate of return is reviewed by internal and external parties for reasonableness.
Retirement Plan Discount Rate
The U.K. discount rate is based on the yield curve approach using the U.K. Aon Hewitt GBP Single Agency AA Corporates-Only Curve.
U.K. Pension Equalization Ruling
On October 26, 2018 the High Court of Justice in the United Kingdom (the "High Court") issued a ruling related to the equalization of benefits payable to men and women for the effect of guaranteed minimum pensions under U.K. defined benefit pension plans. As a result of this ruling, the Company estimated the impact of retroactively increasing benefits in its U.K. plans in accordance with the High Court ruling. The Company treated the additional benefits as a prior service cost which resulted in an increase to its projected benefit obligation and accumulated other comprehensive loss of
$28 million
. The Company will amortize this cost over the average remaining life expectancy of the U.K. participants. Given the immaterial effect on the U.K. plan's projected benefit, an interim remeasurement was not performed.
Defined Contribution Plans
The Company sponsors defined contribution plans for substantially all U.S. employees and certain foreign employees. The plans allow employees to contribute a portion of their earnings in accordance with specified guidelines. Matching contributions are made annually in January to participants employed on December 31 of the prior year and vest in
one year
. However, if a participant retires from the Company or dies prior to December 31, the participant will be eligible to receive matching contributions approximately 30 days following separation from service. During fiscal
2019
,
2018
and
2017
, the Company contributed
$219 million
,
$245 million
and
$124 million
, respectively, to its defined contribution plans. As of
March 31, 2019
, plan assets included
3,737,298
shares of the Company’s common stock.
Deferred Compensation Plans
Effective as of the HPES Merger, DXC assumed sponsorship of the Computer Sciences Corporation Deferred Compensation Plan, which was renamed the “DXC Technology Company Deferred Compensation Plan” (the “DXC DCP”), and adopted the Enterprise Services Executive Deferred Compensation Plan (the “ES DCP”). Both plans are non-qualified deferred compensation plans maintained for a select group of management, highly compensated employees and non-employee directors.
The DXC DCP covers eligible employees who participated in CSC’s Deferred Compensation Plan prior to the HPES Merger. The ES DCP covers eligible employees who participated in the HPE Executive Deferred Compensation Plan prior to the HPES Merger. Both plans allow participating employees to defer the receipt of current compensation to a future distribution date or event above the amounts that may be deferred under DXC’s tax-qualified 401(k) plan, the DXC Technology Matched Asset Plan. Neither plan provides for employer contributions. As of April 3, 2017, the ES DCP does not admit new participants.
110
DXC TECHNOLOGY COMPANY - NOTES TO CONSOLIDATED FINANCIAL STATEMENTS
Certain management and highly compensated employees are eligible to defer all, or a portion of, their regular salary that exceeds the limitation set forth in Internal Revenue Section 401(a)(17) and all or a portion of their incentive compensation. Non-employee directors are eligible to defer up to
100%
of their cash compensation. The liability under the plan, which is included in other long-term liabilities in the Company's balance sheets, amounted to
$59 million
as of
March 31, 2019
and
$65 million
as of
March 31, 2018
. The Company’s expense under the Plan totaled
$2 million
,
$4 million
and
$5 million
, for fiscal
2019
,
2018
and
2017
, respectively.
Note
14
-
Stockholders' Equity
Description of Capital Stock
The Company has authorized share capital consisting of
750,000,000
shares of common stock, par value
$0.01
per share, and
1,000,000
shares of preferred stock, par value
$0.01
per share.
Each share of common stock is equal in all respects to every other share of common stock of the Company. Each share of common stock is entitled to
one
vote per share at each annual or special meeting of stockholders for the election of directors and upon any other matter coming before such meeting. Subject to all the rights of the preferred stock, dividends may be paid to holders of common stock as and when declared by the Board of Directors.
The Company's charter requires that preferred stock must be all of one class but may be issued from time to time in one or more series, each of such series to have such full or limited voting powers, if any, and such designations, preferences and relative, participating, optional or other special rights or qualifications, limitations or restrictions as provided in a resolution adopted by the Board of Directors. Each share of preferred stock will rank on a parity with each other share of preferred stock, regardless of series, with respect to the payment of dividends at the respectively designated rates and with respect to the distribution of capital assets according to the amounts to which the shares of the respective series are entitled.
Share Repurchase Program
On April 3, 2017, DXC announced the establishment of a share repurchase program approved by the Board of Directors with an initial authorization of up to
$2.0 billion
for future repurchases of outstanding shares of DXC common stock. On November 8, 2018, DXC announced that its board of directors approved an incremental
$2.0 billion
share repurchase authorization. An expiration date has not been established for this repurchase plan.
The shares repurchased are retired immediately and included in the category of authorized but unissued shares. The excess of purchase price over par value of the common shares is allocated between additional paid-in capital and retained earnings. The details of shares repurchased are shown below:
|
Fiscal Year
|
Number of shares repurchased
|
Average Price Per Share
|
Amount (In millions)
|
|||||||
|
2019
|
19,342,586
|
|
$69.20
|
$
|
1,339
|
|
||||
|
2018
|
1,537,782
|
|
$89.41
|
$
|
137
|
|
||||
|
2017
|
—
|
|
—
|
|
—
|
|
||||
Treasury Stock Transactions
In fiscal
2019
,
2018
and
2017
the Company accepted
42,008
,
332,558
and
72,231
shares of its common stock, respectively, in lieu of cash in connection with the exercise of stock options. In fiscal
2019
,
2018
and
2017
, the Company accepted
729,703
,
684,389
and
195,201
shares of its common stock, respectively, in lieu of cash in connection with the tax withholdings associated with the release of common stock upon vesting of restricted stock and RSUs. As a result, the Company holds
1,788,658
treasury shares as of
March 31, 2019
. Treasury shares held before the HPES Merger were extinguished in connection with the HPES Merger.
111
DXC TECHNOLOGY COMPANY - NOTES TO CONSOLIDATED FINANCIAL STATEMENTS
Dividends
|
Dividends Declared
|
||||||||||||
|
(in millions, except per share amounts)
|
Per Common Share
|
Total
|
Unpaid at Fiscal Year End
|
|||||||||
|
Fiscal 2019
|
$
|
0.76
|
|
$
|
209
|
|
$
|
53
|
|
|||
|
Fiscal 2018
|
$
|
0.72
|
|
$
|
209
|
|
$
|
51
|
|
|||
|
Fiscal 2017
|
$
|
0.56
|
|
$
|
80
|
|
$
|
20
|
|
|||
Accumulated Other Comprehensive (Loss) Income
The following table shows the changes in accumulated other comprehensive income (loss), net of taxes:
|
(in millions)
|
Foreign Currency Translation Adjustments
|
Cash Flow Hedges
|
Available-for-sale Securities
|
Pension and Other Post-retirement Benefit Plans
|
Accumulated Other Comprehensive (Loss) Income
|
|||||||||||||||
|
Balance at April 1, 2016
|
$
|
(399
|
)
|
$
|
(1
|
)
|
$
|
—
|
|
$
|
289
|
|
$
|
(111
|
)
|
|||||
|
Current-period other comprehensive (loss) income
|
(59
|
)
|
21
|
|
—
|
|
(2
|
)
|
(40
|
)
|
||||||||||
|
Amounts reclassified from accumulated other comprehensive (loss) income, net of taxes
|
—
|
|
—
|
|
—
|
|
(11
|
)
|
(11
|
)
|
||||||||||
|
Balance at March 31, 2017
|
$
|
(458
|
)
|
$
|
20
|
|
$
|
—
|
|
$
|
276
|
|
$
|
(162
|
)
|
|||||
|
Current-period other comprehensive (loss) income
|
197
|
|
(11
|
)
|
9
|
|
—
|
|
195
|
|
||||||||||
|
Amounts reclassified from accumulated other comprehensive (loss) income, net of taxes
|
—
|
|
—
|
|
—
|
|
25
|
|
25
|
|
||||||||||
|
Balance at March 31, 2018
|
$
|
(261
|
)
|
$
|
9
|
|
$
|
9
|
|
$
|
301
|
|
$
|
58
|
|
|||||
|
Current-period other comprehensive loss
|
(256
|
)
|
(22
|
)
|
—
|
|
(21
|
)
|
(299
|
)
|
||||||||||
|
Amounts reclassified from accumulated other comprehensive (loss) income, net of taxes
|
—
|
|
10
|
|
—
|
|
(13
|
)
|
(3
|
)
|
||||||||||
|
Balance at March 31, 2019
|
$
|
(517
|
)
|
$
|
(3
|
)
|
$
|
9
|
|
$
|
267
|
|
$
|
(244
|
)
|
|||||
Note
15
-
Stock Incentive Plans
Equity Plans
As a result of the Separation of USPS, shared-based awards issued by the Company were modified. The number of stock options and exercise price were adjusted to generally preserve the intrinsic value immediately prior to the Separation. There was no incremental share-based compensation expense recognized as a result of the modification of the awards.
As a result of the HPES Merger, all outstanding CSC awards of stock options, stock appreciation rights, restricted stock units ("CSC RSUs"), including performance-based restricted stock units, relating to CSC common stock granted
112
DXC TECHNOLOGY COMPANY - NOTES TO CONSOLIDATED FINANCIAL STATEMENTS
under the 2011 Omnibus Incentive Plan, the 2007 Employee Incentive Plan and the 2010 Non-Employee Director Incentive Plan (the “CSC Equity Incentive Plans”) held by CSC employees and non-employee directors were converted into an adjusted award relating to DXC common shares subject to the same terms and conditions after the HPES Merger as the terms and conditions applicable to such awards prior to the HPES Merger.
Under the terms of the CSC Equity Incentive Plans and the individual award agreements, all unvested equity incentive awards, including all stock options and CSC RSUs held by all participants under the plans, including its named executive officers and directors, are subject to accelerated vesting in whole or in part upon the occurrence of a change in control or upon the participant’s termination of employment on or after the occurrence of a change in control under certain circumstances ("CIC events"). As a result of CIC events triggered by the HPES Merger, approximately
3.6 million
unvested awards became vested on
April 1, 2017
and
$26 million
of incremental stock compensation expense was recognized. CSC options granted in fiscal 2017 vested
33%
upon the HPES Merger; the remaining
67%
were converted into DXC RSUs based on the accounting value of the options. These RSUs will vest on the second and third anniversaries of the original option grant date. For equity incentive awards granted by HPE under HPE equity incentive plans to HPES employees prior to the HPES Merger, outstanding options (vested and unvested) and unvested RSU awards were converted upon the HPES Merger into economically equivalent DXC option and RSU awards, with terms and conditions substantially the same as the terms of such awards prior to the HPES Merger.
In March 2017, prior to the HPES Merger, the board of directors and shareholders of HPES approved DXC’s 2017 Omnibus Incentive Plan (the “DXC Employee Equity Plan”), DXC’s 2017 Non-Employee Director Incentive Plan (the “DXC Director Equity Plan”) and DXC’s 2017 Share Purchase Plan (“DXC Share Purchase Plan”). The terms of the DXC Employee Equity Plan and DXC Director Equity Plans are substantially similar to the terms of the CSC Equity Incentive Plans. The former allows DXC to grant stock options (including incentive stock options), stock appreciation rights ("SARs"), restricted stock, RSUs (including PSUs), and cash awards intended to qualify for the performance-based compensation exemption to the
$1 million
deduction limit under Section 162(m) of the Internal Revenue Code (collectively the "Awards"). Awards are typically subject to vesting over the
3
-year period following the grant date. Vested stock options are generally exercisable for a term of
10
years from the grant date. All of DXC’s employees are eligible for awards under the plan. The Company issues authorized but previously unissued shares upon the granting of stock options and the settlement of RSUs and PSUs.
The Compensation Committee of the Board of Directors (the "Board") has broad authority to grant awards and otherwise administer the DXC Employee Equity Plan. The plan became effective March 30, 2017 and will continue in effect for a period of
10
years thereafter, unless terminated earlier by the Board. The Board has the authority to amend the plan in such respects as it deems desirable, subject to approval of DXC’s stockholders for material modifications.
RSUs represent the right to receive
one
share of DXC common stock upon a future settlement date, subject to vesting and other terms and conditions of the award, plus any dividend equivalents accrued during the award period. In general, if the employee’s status as a full-time employee is terminated prior to the vesting of the RSU grant in full, then the RSU grant is automatically canceled on the termination date and any unvested shares and dividend equivalents are forfeited. Certain executives were awarded service-based "career share" RSUs for which the shares are settled over the
10
anniversaries following the executive's separation from service as a full-time employee, provided the executive complies with certain non-competition covenants during that period.
The Company also grants PSUs, which generally vest over a period of
3 years
. The number of PSUs that ultimately vest is dependent upon the Company’s achievement of certain specified financial performance criteria over a
3
-year period. If the specified performance criteria are met, awards are settled for shares of DXC common stock and dividend equivalents upon the filing with the SEC of the Annual Report on Form 10-K for the last fiscal year of the performance period. PSU awards include the potential for up to
25%
of the shares granted to be earned after the first and second fiscal years if certain of the Company's performance targets are met early, subject to vesting based on the participant's continued employment through the end of the
3
-year performance period.
The terms of the DXC Director Equity Plan allow DXC to grant RSU awards to non-employee directors of DXC. Such RSU awards vest in full at the earlier of (i) the first anniversary of the grant date or (ii) the next annual meeting date, and are automatically redeemed for DXC common stock and dividend equivalents either at that time or, if an RSU deferral election form is submitted, upon the date or event elected by the director. Distributions made upon a director’s separation from the Board may occur in either a lump sum or in annual installments over periods of
5
,
10
, or
15 years
, per the director’s election. In addition, RSUs vest in full upon a change in control of DXC.
113
DXC TECHNOLOGY COMPANY - NOTES TO CONSOLIDATED FINANCIAL STATEMENTS
The DXC Share Purchase Plan allows DXC’s employees located in the United Kingdom to purchase shares of DXC’s common stock at the fair market value of such shares on the applicable purchase date. There were
13,137
shares purchased under this plan during fiscal
2019
.
The Board has reserved for issuance shares of DXC common stock, par value
$0.01
per share, under each of the plans as detailed below:
|
As of March 31, 2019
|
|||||
|
Reserved for issuance
|
Available for future grants
|
||||
|
DXC Employee Equity Plan
|
34,200,000
|
|
21,832,963
|
|
|
|
DXC Director Equity Plan
|
230,000
|
|
104,310
|
|
|
|
DXC Share Purchase Plan
|
250,000
|
|
235,389
|
|
|
|
Total
|
34,680,000
|
|
22,172,662
|
|
|
The Company recognized share-based compensation expense for fiscal
2019
,
2018
and
2017
as follows:
|
Fiscal Years Ended
|
||||||||||||
|
(in millions)
|
March 31, 2019
|
March 31, 2018
|
March 31, 2017
|
|||||||||
|
Total share-based compensation cost
|
$
|
74
|
|
$
|
93
|
|
$
|
75
|
|
|||
|
Related income tax benefit
|
$
|
15
|
|
$
|
21
|
|
$
|
25
|
|
|||
|
Total intrinsic value of options exercised
|
$
|
44
|
|
$
|
136
|
|
$
|
73
|
|
|||
|
Tax benefits from exercised stock options and awards
|
$
|
39
|
|
$
|
84
|
|
$
|
34
|
|
|||
As of
March 31, 2019
, total unrecognized compensation expense related to unvested DXC stock options and unvested DXC RSUs, net of expected forfeitures was less than
$1 million
and
$111 million
, respectively. The unrecognized compensation expense for unvested RSUs is expected to be recognized over a weighted-average period of
1.87 years
.
114
DXC TECHNOLOGY COMPANY - NOTES TO CONSOLIDATED FINANCIAL STATEMENTS
The Company uses the Black-Scholes-Merton model in determining the fair value of stock options granted. The weighted average fair values of stock options granted during fiscal
2017
was
$13.00
per share. There were no stock options granted during fiscal 2018 and 2019. In calculating the compensation expense for its stock incentive plans, the Company used the following weighted average assumptions:
|
Fiscal Years Ended
|
|||
|
March 31, 2017
|
|||
|
Risk-free interest rate
|
1.60
|
%
|
|
|
Expected volatility
|
29
|
%
|
|
|
Expected term (in years)
|
6.09
|
|
|
|
Dividend yield
|
1.56
|
%
|
|
Stock Options
The Company’s stock options vest one-third annually on each of the first three anniversaries of the grant date. Stock options are generally granted for a term of ten years. Information concerning stock options granted under stock incentive plans was as follows:
|
Number
of Option Shares
|
Weighted
Average
Exercise
Price
|
Weighted
Average
Remaining
Contractual
Term
|
Aggregate
Intrinsic
Value
(in millions)
|
||||||||||
|
Outstanding as of April 1, 2016
|
5,366,621
|
|
$
|
24.83
|
|
7.06
|
$
|
51
|
|
||||
|
Granted
|
2,450,976
|
|
$
|
50.91
|
|
||||||||
|
Exercised
|
(2,544,955
|
)
|
$
|
21.84
|
|
$
|
73
|
|
|||||
|
Canceled/Forfeited
|
(448,505
|
)
|
$
|
36.94
|
|
||||||||
|
Expired
|
(56,741
|
)
|
$
|
14.36
|
|
||||||||
|
Outstanding as of March 31, 2017
|
4,767,396
|
|
$
|
38.70
|
|
8.01
|
$
|
145
|
|
||||
|
HPE options converted to DXC options at HPES Merger
|
2,654,970
|
|
$
|
46.56
|
|
||||||||
|
CSC options converted to RSUs due to HPE Merger
|
(1,521,519
|
)
|
$
|
51.00
|
|
||||||||
|
Exercised
|
(2,916,045
|
)
|
$
|
40.39
|
|
$
|
136
|
|
|||||
|
Canceled/Forfeited
|
(14,890
|
)
|
$
|
69.52
|
|
||||||||
|
Expired
|
(36,411
|
)
|
$
|
36.69
|
|
||||||||
|
Outstanding as of March 31, 2018
(1)
|
2,933,501
|
|
$
|
32.54
|
|
5.24
|
$
|
185
|
|
||||
|
Issued due to Separation modification
|
400,170
|
|
$
|
31.72
|
|
||||||||
|
Exercised
|
(969,103
|
)
|
$
|
37.33
|
|
$
|
44
|
|
|||||
|
Canceled/Forfeited
|
(14,607
|
)
|
$
|
48.33
|
|
||||||||
|
Expired
|
(31,193
|
)
|
$
|
25.03
|
|
||||||||
|
Outstanding as of March 31, 2019
|
2,318,768
|
|
$
|
30.40
|
|
4.80
|
$
|
79
|
|
||||
|
Vested and expected to vest in the future as of March 31, 2019
|
2,318,406
|
|
$
|
30.40
|
|
4.80
|
$
|
79
|
|
||||
|
Exercisable as of March 31, 2019
|
2,314,206
|
|
$
|
30.35
|
|
4.80
|
$
|
79
|
|
||||
(1)
The amount of the weighted average exercise price per share has been revised to reflect the impact of the Separation.
115
DXC TECHNOLOGY COMPANY - NOTES TO CONSOLIDATED FINANCIAL STATEMENTS
|
As of March 31, 2019
|
||||||||||||||||
|
Options Outstanding
|
Options Exercisable
|
|||||||||||||||
|
Range of Option Exercise Price
|
Number
Outstanding
|
Weighted
Average
Exercise
Price
|
Weighted
Average
Remaining
Contractual
Term
|
Number
Exercisable
|
Weighted
Average
Exercise
Price
|
|||||||||||
|
$8.96 - $24.47
|
652,585
|
|
$
|
18.88
|
|
3.44
|
652,585
|
|
$
|
18.88
|
|
|||||
|
$25.14 - $41.92
|
1,120,399
|
|
$
|
29.68
|
|
4.83
|
1,120,399
|
|
$
|
29.68
|
|
|||||
|
$42.05 - $62.44
|
545,784
|
|
$
|
45.64
|
|
6.35
|
541,222
|
|
$
|
45.55
|
|
|||||
|
2,318,768
|
|
2,314,206
|
|
|||||||||||||
The total fair value of stock options vested during fiscal
2019
,
2018
and
2017
was
$0 million
,
$22 million
and
$8 million
, respectively. The cash received from stock options exercised during fiscal
2019
,
2018
and
2017
was
$34 million
,
$98 million
and
$54 million
, respectively.
Restricted Stock Units
RSUs represent the right to receive
one
share of DXC common stock upon a future settlement date, subject to vesting and other terms and conditions of the award, plus any dividend equivalents accrued during the award period. In general, if the employee’s status as a full-time employee is terminated prior to the vesting of the RSU grant in full, then the RSU grant is automatically canceled on the termination date and any unvested shares and dividend equivalents are forfeited. Certain executives were awarded service-based "career share" RSUs for which the shares are settled over the
10
anniversaries following the executive's separation from service as a full-time employee, provided the executive complies with certain non-competition covenants during that period.
Performance Stock Units
The Company also grants PSUs, which generally vest over a period of
three
years. The number of PSUs that ultimately vest is dependent upon the Company’s achievement of certain specified financial performance criteria over a
three
-year period. If the specified performance criteria are met, awards are settled for shares of DXC common stock and dividend equivalents upon the filing with the SEC of the Annual Report on Form 10-K for the last fiscal year of the performance period. PSU awards include the potential for accelerated vesting of
25%
of the shares granted after each of the first and second fiscal years if certain of the Company's performance targets are met early, and are subject to final vesting based on the participant's continued employment through the end of the
three
-year performance period. Compensation expense during the performance period is estimated at each reporting date using management's expectation of the probable achievement of the specified performance criteria and is adjusted to the extent the expected achievement changes. In the table below, such awards are reflected at the number of shares originally granted.
116
DXC TECHNOLOGY COMPANY - NOTES TO CONSOLIDATED FINANCIAL STATEMENTS
Information concerning RSUs and PSUs granted under the stock incentive plans was as follows:
|
Number of
Shares |
Weighted
Average
Grant Date
Fair Value
|
|||||
|
Outstanding as of April 1, 2016
|
3,597,999
|
|
$
|
29.25
|
|
|
|
Granted
|
1,150,185
|
|
$
|
47.70
|
|
|
|
Settled
|
(602,467
|
)
|
$
|
27.29
|
|
|
|
Canceled/Forfeited
|
(434,732
|
)
|
$
|
32.86
|
|
|
|
Outstanding as of March 31, 2017
|
3,710,985
|
|
$
|
34.86
|
|
|
|
Granted
|
1,828,667
|
|
$
|
82.34
|
|
|
|
HPE RSUs converted to DXC RSUs due to HPES Merger
|
95,816
|
|
$
|
69.34
|
|
|
|
Options converted to RSUs due to HPES Merger
|
609,416
|
|
$
|
32.58
|
|
|
|
Settled
|
(1,934,446
|
)
|
$
|
35.93
|
|
|
|
Canceled/Forfeited
|
(324,822
|
)
|
$
|
59.34
|
|
|
|
Outstanding as of March 31, 2018
(1)
|
3,985,616
|
|
$
|
47.25
|
|
|
|
Granted
|
1,136,002
|
|
$
|
77.10
|
|
|
|
Issued due to Separation modification
|
649,649
|
|
$
|
51.98
|
|
|
|
Settled
|
(2,207,467
|
)
|
$
|
33.05
|
|
|
|
Canceled/Forfeited
|
(754,025
|
)
|
$
|
62.01
|
|
|
|
Outstanding as of March 31, 2019
|
2,809,775
|
|
$
|
67.27
|
|
|
(1)
The amount of the weighted average fair value per share has been revised to reflect the impact of the USPS Separation.
Non-employee Director Incentives
The Company has
one
stock incentive plan which authorizes the issuance of stock options, restricted stock and other share-based incentives to non-employee directors upon terms approved by the Company’s Board of Directors. As of
March 31, 2019
,
104,310
shares of DXC common stock remained available for the grant of future RSUs or other share-based incentives to nonemployee directors.
RSU awards to non-employee directors are granted at a price of
$0
. For RSU awards granted in fiscal 2014 and thereafter, RSUs vest and settle at the earlier of (i) the
one
-year anniversary of the grant date, or (ii) the date of the Company's first Annual Meeting of the Stockholders held after the grant date. Alternatively, settlement of the RSU may be deferred per election of the non-employee director. For awards granted in fiscal 2013 and prior, vested RSUs were automatically settled for shares of DXC common stock and dividend equivalents when the non-employee director ceases to be a director of the Company. At the holder’s election, the RSUs may be settled (i) in their entirety, upon the day the holder ceases to be a director, or (ii) in substantially equal amounts upon the first
five
,
ten
or
fifteen
anniversaries of such termination of service.
117
DXC TECHNOLOGY COMPANY - NOTES TO CONSOLIDATED FINANCIAL STATEMENTS
Information concerning RSUs granted to non-employee directors was as follows:
|
Number of
Shares |
Weighted
Average
Grant Date
Fair Value
|
|||||
|
Outstanding as of April 1, 2016
|
89,046
|
|
$
|
27.00
|
|
|
|
Granted
|
33,600
|
|
$
|
47.35
|
|
|
|
Settled
|
(32,080
|
)
|
$
|
28.58
|
|
|
|
Canceled/Forfeited
|
(4,800
|
)
|
$
|
30.31
|
|
|
|
Outstanding as of March 31, 2017
|
85,766
|
|
$
|
34.19
|
|
|
|
Granted
|
22,900
|
|
$
|
84.40
|
|
|
|
Settled
|
(39,980
|
)
|
$
|
45.25
|
|
|
|
Canceled/Forfeited
|
(2,300
|
)
|
$
|
85.35
|
|
|
|
Outstanding as of March 31, 2018
(1)
|
66,386
|
|
$
|
37.26
|
|
|
|
Granted
|
19,200
|
|
$
|
87.88
|
|
|
|
Issued due to Separation modification
|
10,488
|
|
$
|
37.69
|
|
|
|
Settled
|
(20,324
|
)
|
$
|
51.59
|
|
|
|
Canceled/Forfeited
|
—
|
|
$
|
—
|
|
|
|
Outstanding as of March 31, 2019
|
75,750
|
|
$
|
46.31
|
|
|
(1)
The amount of the weighted average fair value per share has been revised to reflect the impact of the USPS Separation.
Note
16
-
Cash Flows
Cash payments for interest on indebtedness and income taxes and other select non-cash activities are as follows:
|
Fiscal Years Ended
|
||||||||||||
|
(in millions)
|
March 31, 2019
|
March 31, 2018
|
March 31, 2017
|
|||||||||
|
Cash paid for:
|
||||||||||||
|
Interest
|
$
|
308
|
|
$
|
288
|
|
$
|
103
|
|
|||
|
Taxes on income, net of refunds
(1)
|
$
|
197
|
|
$
|
376
|
|
$
|
63
|
|
|||
|
Non-cash activities:
|
||||||||||||
|
Operating:
|
||||||||||||
|
Prepaid assets acquired under long-term financing
|
$
|
48
|
|
$
|
209
|
|
$
|
—
|
|
|||
|
Investing:
|
||||||||||||
|
Capital expenditures in accounts payable and accrued expenses
|
$
|
45
|
|
$
|
46
|
|
$
|
43
|
|
|||
|
Capital expenditures through capital lease obligations
|
$
|
668
|
|
$
|
664
|
|
$
|
52
|
|
|||
|
Assets acquired under long-term financing
|
$
|
200
|
|
$
|
238
|
|
$
|
87
|
|
|||
|
Increase in deferred purchase price receivable
|
$
|
1,489
|
|
$
|
665
|
|
$
|
595
|
|
|||
|
Contingent consideration
|
$
|
41
|
|
$
|
—
|
|
$
|
—
|
|
|||
|
Financing:
|
||||||||||||
|
Dividends declared but not yet paid
|
$
|
53
|
|
$
|
51
|
|
$
|
20
|
|
|||
|
Stock issued for the acquisition of HPES
|
$
|
—
|
|
$
|
9,850
|
|
$
|
—
|
|
|||
(1)
Income tax refunds were
$174 million
,
$38 million
, and
$23 million
for fiscal
2019
,
2018
, and
2017
, respectively.
118
DXC TECHNOLOGY COMPANY - NOTES TO CONSOLIDATED FINANCIAL STATEMENTS
Note
17
-
Other Income
The following table summarizes components of other income, net:
|
Fiscal Years Ended
|
||||||||||||
|
(in millions)
|
March 31, 2019
|
March 31, 2018
|
March 31, 2017
|
|||||||||
|
Non-service cost components of net periodic pension income
|
$
|
(182
|
)
|
$
|
(509
|
)
|
$
|
(7
|
)
|
|||
|
Foreign currency loss (gain)
|
31
|
|
(71
|
)
|
(8
|
)
|
||||||
|
Other gain
|
(155
|
)
|
(13
|
)
|
(2
|
)
|
||||||
|
Totals
|
$
|
(306
|
)
|
$
|
(593
|
)
|
$
|
(17
|
)
|
|||
Non-service cost components of net periodic pension income expense were reclassified from costs of services and selling, general and administrative to other income expense, net in the statements of operations upon adoption of ASU2017-07 “Compensation - Retirement Benefits (Topic 715): Improving the Presentation of Net Periodic Pension Cost and Net Periodic Postretirement Benefit Cost". See Note
1
-
Summary of Significant Accounting Policies
for more information.
Foreign currency loss (gain) resulted from the movement of foreign currency exchange rates on the Company’s foreign currency denominated assets and liabilities, related hedges including options to manage its exposure to economic risk and the cost of the Company’s hedging program. Other gain for the fiscal year ended March 31, 2019 primarily comprises gain on sale of non-operating assets and for the fiscal year ended March 31, 2018 consists of investment income.
Note
18
-
Segment and Geographic Information
DXC has a matrix form of organization and is managed in several different and overlapping groupings including services, industries and geographic regions. As a result, and in accordance with accounting standards, operating segments are organized by the type of services provided. DXC's chief operating decision maker ("CODM"), the chief executive officer, obtains, reviews, and manages the Company’s financial performance based on these segments. The CODM uses these results, in part, to evaluate the performance of, and allocate resources to, each of the segments.
As a result of the Separation, USPS is no longer included as a reportable segment and its results have been reclassified to discontinued operations, net of taxes, for all periods presented. See Note
3
- "
Divestitures
." DXC now operates in two reportable segments as described below:
Global Business Services
GBS provides innovative technology solutions that help its clients address key business challenges and accelerate digital transformations tailored to each client’s industry and specific objectives. GBS offerings include:
119
DXC TECHNOLOGY COMPANY - NOTES TO CONSOLIDATED FINANCIAL STATEMENTS
|
•
|
Enterprise, Cloud Applications and Consulting.
GBS provides industry, business process systems integration and technical delivery experience to maximize value from enterprise application portfolios. GBS also helps clients accelerate their digital transformations and business results with industry, business, technology and complex integration services.
|
|
•
|
Application Services.
GBS's comprehensive services helps clients modernize, develop, test and manage their applications.
|
|
•
|
Analytics.
GBS's portfolio of analytics services and robust partner ecosystem helps clients gain rapid insights and accelerate their digital transformation journeys.
|
|
•
|
Business Process Services.
GBS provides seamless digital integration and optimization of front and back office processes, including its Agile Process Automation approach.
|
|
•
|
Industry Software and Solutions.
GBS's industry-specific solutions enable businesses to quickly integrate technology, transform their operations and develop new ways of doing business. GBS's vertical-specific IP includes insurance, healthcare and life sciences, travel and transportation, and banking and capital markets solutions.
|
Global Infrastructure Services
GIS provides a portfolio of offerings that deliver predictable outcomes and measurable results while reducing business risk and operational costs for clients. GIS offerings include:
|
•
|
Cloud and Platform Services.
GIS helps clients maximize their private cloud, public cloud and legacy infrastructures, as well as securely manage their hybrid environments.
|
|
•
|
Workplace and Mobility
. GIS's workplace, mobility and Internet of Things ("IoT") services provides a consumer-like experience with enterprise security and instant connectivity for its clients.
|
|
•
|
Security.
GIS's security solutions help predict attacks, proactively respond to threats, ensure compliance and protect data, applications, infrastructure and endpoints.
|
Segment Measures
The following table summarizes operating results regularly provided to the CODM by reportable segment and a reconciliation to the financial statements:
|
(in millions)
|
GBS
|
GIS
|
Total Reportable Segments
|
All Other
|
Totals
|
|||||||||||||||
|
Fiscal Year Ended March 31, 2019
|
||||||||||||||||||||
|
Revenues
|
$
|
8,684
|
|
$
|
12,069
|
|
$
|
20,753
|
|
$
|
—
|
|
$
|
20,753
|
|
|||||
|
Segment Profit
|
$
|
1,645
|
|
$
|
1,911
|
|
$
|
3,556
|
|
$
|
(287
|
)
|
$
|
3,269
|
|
|||||
|
Depreciation and amortization
(1)
|
$
|
90
|
|
$
|
1,212
|
|
$
|
1,302
|
|
$
|
127
|
|
$
|
1,429
|
|
|||||
|
Fiscal Year Ended March 31, 2018
|
||||||||||||||||||||
|
Revenues
|
$
|
9,254
|
|
$
|
12,479
|
|
$
|
21,733
|
|
$
|
—
|
|
$
|
21,733
|
|
|||||
|
Segment Profit
|
$
|
1,525
|
|
$
|
1,643
|
|
$
|
3,168
|
|
$
|
(179
|
)
|
$
|
2,989
|
|
|||||
|
Depreciation and amortization
(1)
|
$
|
99
|
|
$
|
1,078
|
|
$
|
1,177
|
|
$
|
92
|
|
$
|
1,269
|
|
|||||
|
Fiscal Year Ended March 31, 2017
|
||||||||||||||||||||
|
Revenues
|
$
|
4,173
|
|
$
|
3,434
|
|
$
|
7,607
|
|
$
|
—
|
|
$
|
7,607
|
|
|||||
|
Segment Profit
|
$
|
492
|
|
$
|
306
|
|
$
|
798
|
|
$
|
(180
|
)
|
$
|
618
|
|
|||||
|
Depreciation and amortization
(1)
|
$
|
107
|
|
$
|
399
|
|
$
|
506
|
|
$
|
64
|
|
$
|
570
|
|
|||||
(1)
Depreciation and amortization as presented excludes amortization of acquired intangible assets of
$539 million
,
$526 million
, and
$77 million
for fiscal
2019
,
2018
, and
2017
, respectively.
120
DXC TECHNOLOGY COMPANY - NOTES TO CONSOLIDATED FINANCIAL STATEMENTS
Reconciliation of Reportable Segment Profit to Consolidation
The Company's management uses segment profit as the measure for assessing performance of its segments. Segment profit is defined as segment revenues less cost of services, segment selling, general and administrative, depreciation and amortization, and other income (excluding the movement in foreign currency exchange rates on DXC's foreign currency denominated assets and liabilities and the related economic hedges). The Company does not allocate to its segments certain operating expenses managed at the corporate level. These unallocated costs include certain corporate function costs, stock-based compensation expense, pension and OPEB actuarial and settlement gains and losses, restructuring costs, transaction, separation, and integration-related costs, amortization of acquired intangible assets.
|
Fiscal Years Ended
|
||||||||||||
|
(in millions)
|
March 31, 2019
|
March 31, 2018
|
March 31, 2017
|
|||||||||
|
Profit
|
||||||||||||
|
Total profit for reportable segments
|
$
|
3,556
|
|
$
|
3,168
|
|
$
|
798
|
|
|||
|
All other loss
|
(287
|
)
|
(179
|
)
|
(180
|
)
|
||||||
|
Interest income
|
128
|
|
89
|
|
35
|
|
||||||
|
Interest expense
|
(334
|
)
|
(320
|
)
|
(117
|
)
|
||||||
|
Restructuring costs
|
(465
|
)
|
(789
|
)
|
(238
|
)
|
||||||
|
Transaction, separation, and integration-related costs
|
(401
|
)
|
(359
|
)
|
(308
|
)
|
||||||
|
Amortization of acquired intangible assets
|
(539
|
)
|
(526
|
)
|
(77
|
)
|
||||||
|
Pension and OPEB actuarial and settlement (losses) gains
|
(143
|
)
|
220
|
|
(87
|
)
|
||||||
|
Income (loss) from continuing operations, before taxes
|
$
|
1,515
|
|
$
|
1,304
|
|
$
|
(174
|
)
|
|||
Management does not use total assets by segment to evaluate segment performance or allocate resources. As a result, assets are not tracked by segment and therefore, total assets by segment is not disclosed.
Geographic Information
See Note
19
- "
Revenue
" for the Company's revenue by geography. Property and equipment, net, which is based on the physical location of the assets, was as follows:
|
As of
|
|||||||||
|
March 31, 2019
|
March 31, 2018
|
March 31, 2017
|
|||||||
|
United States
|
1,352
|
|
1,270
|
|
389
|
|
|||
|
United Kingdom
|
512
|
|
535
|
|
235
|
|
|||
|
Australia
|
144
|
|
191
|
|
58
|
|
|||
|
Other Europe
|
553
|
|
465
|
|
134
|
|
|||
|
Other International
|
618
|
|
902
|
|
87
|
|
|||
|
Total Property and Equipment, net
|
3,179
|
|
3,363
|
|
903
|
|
|||
No single customer exceeded
10%
of the Company’s revenues during fiscal
2019
, fiscal
2018
or fiscal
2017
.
Note
19
-
Revenue
Revenue Recognition
The following table presents DXC's revenues disaggregated by geography, based on the location of incorporation of the DXC entity providing the related goods or services:
121
DXC TECHNOLOGY COMPANY - NOTES TO CONSOLIDATED FINANCIAL STATEMENTS
|
Twelve Months Ended
|
||||||||||||
|
(in millions)
|
March 31, 2019
|
March 31, 2018
(1)
|
March 31, 2017
(1)
|
|||||||||
|
United States
|
$
|
7,677
|
|
$
|
8,015
|
|
$
|
2,986
|
|
|||
|
United Kingdom
|
3,175
|
|
3,392
|
|
1,482
|
|
||||||
|
Australia
|
1,582
|
|
1,694
|
|
921
|
|
||||||
|
Other Europe
|
5,294
|
|
5,409
|
|
1,594
|
|
||||||
|
Other International
|
3,025
|
|
3,223
|
|
624
|
|
||||||
|
Total Revenues
|
$
|
20,753
|
|
$
|
21,733
|
|
$
|
7,607
|
|
|||
|
(1)
|
Prior period amounts have not been recast under the modified retrospective transition method.
|
The revenue by geography pertains to both of the Company’s reportable segments. Refer to Note
18
- "
Segment and Geographic Information
" for the Company’s segment disclosures.
Remaining Performance Obligations
Remaining performance obligations represent the aggregate amount of the transaction price in contracts allocated to performance obligations not delivered, or partially undelivered, as of the end of the reporting period. Remaining performance obligation estimates are subject to change and are affected by several factors, including terminations, changes in the scope of contracts, periodic revalidations, adjustments for revenue that has not materialized and adjustments for currency. As of
March 31, 2019
, approximately
$28.9 billion
of revenue is expected to be recognized from remaining performance obligations. The Company expects to recognize revenue on approximately
40%
of these remaining performance obligations in Fiscal 2020, with the remainder of the balance recognized thereafter.
Contract Balances
The following table provides information about the balances of the Company's trade receivables and contract assets and contract liabilities:
|
As of
|
||||||||
|
(in millions)
|
March 31, 2019
|
April 1, 2018
|
||||||
|
Trade receivables, net
|
$
|
3,232
|
|
$
|
3,937
|
|
||
|
Contract assets
|
$
|
390
|
|
$
|
444
|
|
||
|
Contract liabilities
|
$
|
1,886
|
|
$
|
2,053
|
|
||
Change in contract liabilities were as follows:
|
(in millions)
|
Twelve Months Ended March 31, 2019
|
|||
|
ASC 605 Balance, beginning of period
|
$
|
2,434
|
|
|
|
Adjustment related to Topic 606 adoption
|
(381
|
)
|
||
|
ASC 606 Balance, beginning of period
|
2,053
|
|
||
|
Deferred revenue
|
2,681
|
|
||
|
Recognition of deferred revenue
|
(2,664
|
)
|
||
|
Currency translation adjustment
|
(167
|
)
|
||
|
Other
|
(17
|
)
|
||
|
Balance, end of period
|
$
|
1,886
|
|
|
122
DXC TECHNOLOGY COMPANY - NOTES TO CONSOLIDATED FINANCIAL STATEMENTS
The following tables provides information about the Company’s capitalized costs to obtain and fulfill a contract:
|
(in millions)
|
As of March 31, 2019
|
|||
|
Capitalized sales commission cost
(1)
|
$
|
228
|
|
|
|
Transition and transformation contract costs, net
(2)
|
$
|
966
|
|
|
|
(1)
|
Capitalized sales commission costs are included within other assets in the accompanying balance sheets. For the twelve months ended
March 31, 2019
, amortization expense of
$62 million
related to the capitalized sales commission assets is included in selling, general, and administrative expenses in the accompanying statements of operations.
|
|
(2)
|
Transition and transformation contract costs, net reflect the Company’s setup costs incurred upon initiation of an outsourcing contract that are classified as other assets in the accompanying balance sheets. For the twelve months ended
March 31, 2019
, amortization expense of
$258 million
is included within depreciation and amortization in the accompanying statements of operations.
|
Financial Statement Impact
The impact of adoption of ASC 606 on the selected captions of the Company's statements of operations and balance sheets was as follows:
|
Statement of Operations (Selected Captions)
|
||||||||||||
|
Twelve Months Ended March 31, 2019
|
||||||||||||
|
(in millions)
|
As Reported
|
Amounts Without Adoption of ASC 606
|
Effect of Change Higher/(Lower)
|
|||||||||
|
Revenues
|
$
|
20,753
|
|
$
|
20,723
|
|
$
|
30
|
|
|||
|
Costs of services
|
$
|
14,946
|
|
$
|
14,944
|
|
$
|
2
|
|
|||
|
Selling, general and administrative
|
$
|
1,959
|
|
$
|
2,032
|
|
$
|
(73
|
)
|
|||
|
Interest income
|
$
|
(128
|
)
|
$
|
(141
|
)
|
$
|
(13
|
)
|
|||
|
Income tax expense
|
$
|
288
|
|
$
|
266
|
|
$
|
22
|
|
|||
|
Net income attributable to DXC common stockholders
|
$
|
1,257
|
|
$
|
1,191
|
|
$
|
66
|
|
|||
123
DXC TECHNOLOGY COMPANY - NOTES TO CONSOLIDATED FINANCIAL STATEMENTS
|
Balance Sheet (Selected Captions)
|
||||||||||||
|
As of March 31, 2019
|
||||||||||||
|
(in millions)
|
As Reported
|
Amounts Without Adoption of ASC 606
|
Effect of Change Higher/(Lower)
|
|||||||||
|
Assets:
|
||||||||||||
|
Receivables and contract assets, net of allowance for doubtful accounts
|
$
|
5,181
|
|
$
|
5,199
|
|
$
|
(18
|
)
|
|||
|
Other current assets
|
$
|
359
|
|
$
|
411
|
|
$
|
(52
|
)
|
|||
|
Deferred income taxes, net
|
$
|
355
|
|
$
|
376
|
|
$
|
(21
|
)
|
|||
|
Other assets
|
$
|
3,429
|
|
$
|
3,451
|
|
$
|
(22
|
)
|
|||
|
Liabilities:
|
||||||||||||
|
Accrued expenses and other current liabilities
|
$
|
3,355
|
|
$
|
3,356
|
|
$
|
(1
|
)
|
|||
|
Deferred revenue and advance contract payments
|
$
|
1,630
|
|
$
|
1,717
|
|
$
|
(87
|
)
|
|||
|
Income taxes payable
|
$
|
208
|
|
$
|
206
|
|
$
|
2
|
|
|||
|
Non-current deferred revenue
|
$
|
256
|
|
$
|
491
|
|
$
|
(235
|
)
|
|||
|
Non-current income tax liabilities and deferred tax liabilities
|
$
|
1,184
|
|
$
|
1,148
|
|
$
|
36
|
|
|||
|
Equity:
|
||||||||||||
|
Retained earnings
|
$
|
478
|
|
$
|
301
|
|
$
|
177
|
|
|||
|
Accumulated other comprehensive loss
|
$
|
(244
|
)
|
$
|
(239
|
)
|
$
|
(5
|
)
|
|||
The adoption of ASC 606 did not materially impact the statement of cash flows.
Note
20
-
Restructuring Costs
The Company recorded restructuring costs, net of reversals, of
$465 million
,
$789 million
and
$238 million
for fiscal
2019
,
2018
and
2017
, respectively. The costs recorded during fiscal
2019
were largely the result of implementing the Fiscal
2019
Plan, as described below.
The composition of restructuring liabilities by financial statement line items is as follows:
|
As of
|
||||||||
|
(in millions)
|
March 31, 2019
|
March 31, 2018
|
||||||
|
Accrued expenses and other current liabilities
|
$
|
273
|
|
$
|
367
|
|
||
|
Other long-term liabilities
|
106
|
|
153
|
|
||||
|
Total
|
$
|
379
|
|
$
|
520
|
|
||
Summary of Restructuring Plans
Fiscal 2019 Plan
During fiscal 2019, management approved global cost savings initiatives designed to better align the Company's organizational structure with its strategic initiatives and continue the integration of HPES and other acquisitions (the "Fiscal 2019 Plan"). The Fiscal 2019 Plan includes workforce optimization and rationalization of facilities and data center assets.
124
DXC TECHNOLOGY COMPANY - NOTES TO CONSOLIDATED FINANCIAL STATEMENTS
Fiscal 2018 Plan
In June 2017, management approved a post-HPES Merger restructuring plan to optimize the Company's operations in response to a continuing business contraction (the "Fiscal 2018 Plan"). The additional restructuring initiatives are intended to reduce the Company's core structure and related operating costs, improve its competitiveness, and facilitate the achievement of acceptable and sustainable profitability. The Fiscal 2018 Plan focuses mainly on optimizing specific aspects of global workforce, increasing the proportion of work performed in low cost offshore locations and re-balancing the pyramid structure. Additionally, this plan included global facility restructuring, including a global data center restructuring program. Costs incurred to date under the Fiscal 2018 Plan total $
782 million
, comprising $
594 million
in workforce reductions and $
188 million
of facilities costs.
Fiscal 2017 Plan
In May 2016, the Company initiated a restructuring plan to realign the Company's cost structure and resources to take advantage of operational efficiencies following recent acquisitions. During the fourth quarter of Fiscal 2017, the Company expanded the plan to strengthen the Company's competitiveness and to optimize the workforce by increasing work performed in low-cost locations (the "Fiscal 2017 Plan"). Total costs incurred to date under the Fiscal 2017 Plan total $
216 million
, comprising $
207 million
in employee severance and $
9 million
of facilities costs.
Other Prior Year Plans
Other prior year plans are comprised of the Fiscal 2016 Plan and Fiscal 2015 Plan. As of March 31, 2019, activities under these plans are substantially complete.
Acquired Restructuring Liabilities
As a result of the HPES Merger, DXC acquired restructuring liabilities under restructuring plans that were initiated for HPES under plans approved by the HPE Board of Directors.
125
DXC TECHNOLOGY COMPANY - NOTES TO CONSOLIDATED FINANCIAL STATEMENTS
Restructuring activities, summarized by plan year, were as follows:
|
Restructuring Liability as of March 31, 2018
|
Costs Expensed,
Net of Reversals (1) |
Costs Not Affecting Restructuring Liability
(2)
|
Cash Paid
|
Other
(3)
|
Restructuring Liability as of March 31, 2019
|
|||||||||||||||||||
|
Fiscal 2019 Plan
|
||||||||||||||||||||||||
|
Workforce Reductions
|
$
|
—
|
|
$
|
363
|
|
$
|
(2
|
)
|
$
|
(218
|
)
|
$
|
(5
|
)
|
$
|
138
|
|
||||||
|
Facilities Costs
|
—
|
|
144
|
|
(6
|
)
|
(68
|
)
|
(2
|
)
|
68
|
|
||||||||||||
|
Total
|
$
|
—
|
|
$
|
507
|
|
$
|
(8
|
)
|
$
|
(286
|
)
|
$
|
(7
|
)
|
$
|
206
|
|
||||||
|
Fiscal 2018 Plan
|
||||||||||||||||||||||||
|
Workforce Reductions
|
$
|
257
|
|
$
|
(30
|
)
|
$
|
—
|
|
$
|
(151
|
)
|
$
|
(17
|
)
|
$
|
59
|
|
||||||
|
Facilities Costs
|
98
|
|
(14
|
)
|
(3
|
)
|
(40
|
)
|
(6
|
)
|
35
|
|
||||||||||||
|
Total
|
$
|
355
|
|
$
|
(44
|
)
|
$
|
(3
|
)
|
$
|
(191
|
)
|
$
|
(23
|
)
|
$
|
94
|
|
||||||
|
Fiscal 2017 Plan
|
||||||||||||||||||||||||
|
Workforce Reductions
|
$
|
19
|
|
$
|
—
|
|
$
|
—
|
|
$
|
(12
|
)
|
$
|
—
|
|
$
|
7
|
|
||||||
|
Facilities Costs
|
3
|
|
—
|
|
—
|
|
(3
|
)
|
—
|
|
—
|
|
||||||||||||
|
Total
|
$
|
22
|
|
$
|
—
|
|
$
|
—
|
|
$
|
(15
|
)
|
$
|
—
|
|
$
|
7
|
|
||||||
|
Other Prior Year Plans
|
||||||||||||||||||||||||
|
Workforce Reductions
|
$
|
4
|
|
$
|
—
|
|
$
|
—
|
|
$
|
(2
|
)
|
$
|
—
|
|
$
|
2
|
|
||||||
|
Facilities Costs
|
2
|
|
—
|
|
—
|
|
(1
|
)
|
—
|
|
1
|
|
||||||||||||
|
Total
|
$
|
6
|
|
$
|
—
|
|
$
|
—
|
|
$
|
(3
|
)
|
$
|
—
|
|
$
|
3
|
|
||||||
|
Acquired Liabilities
|
||||||||||||||||||||||||
|
Workforce Reductions
|
$
|
110
|
|
$
|
2
|
|
$
|
—
|
|
$
|
(58
|
)
|
$
|
(3
|
)
|
$
|
51
|
|
||||||
|
Facilities Costs
|
27
|
|
—
|
|
—
|
|
(9
|
)
|
—
|
|
18
|
|
||||||||||||
|
Total
|
$
|
137
|
|
$
|
2
|
|
$
|
—
|
|
$
|
(67
|
)
|
$
|
(3
|
)
|
$
|
69
|
|
||||||
(1)
Costs expensed, net of reversals include
$48 million
,
$3 million
, and
$1 million
of costs reversed from the Fiscal 2018 Plan, Fiscal 2017 Plan and Other Prior Year Plans, respectively.
(2)
Pension benefit augmentations recorded as a pension liability and asset impairment.
(3)
Foreign currency translation adjustments.
126
DXC TECHNOLOGY COMPANY - NOTES TO CONSOLIDATED FINANCIAL STATEMENTS
|
Restructuring Liability as of March 31, 2017
|
Acquired Balance as of April 1, 2017
|
Costs Expensed, Net of Reversals
(1)
|
Costs Not Affecting Restructuring Liability
(2)
|
Cash Paid
|
Other
(3)
|
Restructuring Liability as of March 31, 2018
|
||||||||||||||||||||||
|
Fiscal 2018 Plan
|
||||||||||||||||||||||||||||
|
Workforce Reductions
|
$
|
—
|
|
n/a
|
|
$
|
624
|
|
$
|
(10
|
)
|
$
|
(367
|
)
|
$
|
10
|
|
$
|
257
|
|
||||||||
|
Facilities Costs
|
—
|
|
n/a
|
|
202
|
|
(4
|
)
|
(102
|
)
|
2
|
|
98
|
|
||||||||||||||
|
Total
|
$
|
—
|
|
n/a
|
|
$
|
826
|
|
$
|
(14
|
)
|
$
|
(469
|
)
|
$
|
12
|
|
$
|
355
|
|
||||||||
|
Fiscal 2017 Plan
|
||||||||||||||||||||||||||||
|
Workforce Reductions
|
$
|
155
|
|
n/a
|
|
$
|
(32
|
)
|
$
|
(2
|
)
|
$
|
(112
|
)
|
$
|
10
|
|
$
|
19
|
|
||||||||
|
Facilities Costs
|
6
|
|
n/a
|
|
—
|
|
—
|
|
(5
|
)
|
2
|
|
3
|
|
||||||||||||||
|
Total
|
$
|
161
|
|
n/a
|
|
$
|
(32
|
)
|
$
|
(2
|
)
|
$
|
(117
|
)
|
$
|
12
|
|
$
|
22
|
|
||||||||
|
Fiscal 2016 Plan
|
||||||||||||||||||||||||||||
|
Workforce Reductions
|
$
|
8
|
|
n/a
|
|
$
|
(2
|
)
|
$
|
1
|
|
$
|
(4
|
)
|
$
|
—
|
|
$
|
3
|
|
||||||||
|
Facilities Costs
|
5
|
|
n/a
|
|
—
|
|
—
|
|
(3
|
)
|
—
|
|
2
|
|
||||||||||||||
|
Total
|
$
|
13
|
|
n/a
|
|
$
|
(2
|
)
|
$
|
1
|
|
$
|
(7
|
)
|
$
|
—
|
|
$
|
5
|
|
||||||||
|
Fiscal 2015 Plan
|
||||||||||||||||||||||||||||
|
Workforce Reductions
|
$
|
3
|
|
n/a
|
|
$
|
—
|
|
$
|
—
|
|
$
|
(2
|
)
|
$
|
—
|
|
$
|
1
|
|
||||||||
|
Facilities Costs
|
—
|
|
n/a
|
|
—
|
|
—
|
|
—
|
|
—
|
|
—
|
|
||||||||||||||
|
Total
|
$
|
3
|
|
n/a
|
|
$
|
—
|
|
$
|
—
|
|
$
|
(2
|
)
|
$
|
—
|
|
$
|
1
|
|
||||||||
|
Acquired Liabilities
|
||||||||||||||||||||||||||||
|
Workforce Reductions
|
n/a
|
|
$
|
255
|
|
$
|
—
|
|
$
|
(2
|
)
|
$
|
(152
|
)
|
$
|
9
|
|
$
|
110
|
|
||||||||
|
Facilities Costs
|
n/a
|
|
70
|
|
(3
|
)
|
(3
|
)
|
(37
|
)
|
—
|
|
27
|
|
||||||||||||||
|
Total
|
n/a
|
|
$
|
325
|
|
$
|
(3
|
)
|
$
|
(5
|
)
|
$
|
(189
|
)
|
$
|
9
|
|
$
|
137
|
|
||||||||
(1)
Costs expensed, net of reversals include
$34 million
,
$3 million
, and
$3 million
of costs reversed from the Fiscal 2017 Plan, Fiscal 2016 Plan and Acquired Plans, respectively.
(2)
Pension benefit augmentations recorded as a pension liability and asset impairment.
(3)
Foreign currency translation adjustments.
Note
21
-
Commitments and Contingencies
Commitments
The Company has operating leases for the use of certain real estate and equipment. Substantially all operating leases are non-cancelable or cancelable only through payment of penalties. Lease payments are typically based upon the period of the lease but may include payments for insurance, maintenance and property taxes. There are no purchase options on operating leases at favorable terms. Most real estate leases have one or more renewal options. Certain leases on real estate are subject to annual escalations for increases in utilities and property taxes. Lease rental expense amounted to
$810 million
,
$797 million
and
$146 million
, for the fiscal years ended
March 31, 2019
,
March 31, 2018
and
March 31, 2017
, respectively.
127
DXC TECHNOLOGY COMPANY - NOTES TO CONSOLIDATED FINANCIAL STATEMENTS
Minimum fixed rentals required for the next five years and thereafter under operating leases in effect at
March 31, 2019
, were as follows:
|
Fiscal year
|
||||||||
|
(in millions)
|
Real Estate
|
Equipment
|
||||||
|
2020
|
$
|
409
|
|
$
|
248
|
|
||
|
2021
|
288
|
|
119
|
|
||||
|
2022
|
203
|
|
27
|
|
||||
|
2023
|
159
|
|
4
|
|
||||
|
2024
|
124
|
|
1
|
|
||||
|
Thereafter
|
274
|
|
—
|
|
||||
|
Minimum fixed rentals
|
1,457
|
|
399
|
|
||||
|
Less: Sublease rental income
|
(149
|
)
|
—
|
|
||||
|
Totals
|
$
|
1,308
|
|
$
|
399
|
|
||
The Company signed long-term purchase agreements with certain software, hardware, telecommunication and other service providers to obtain favorable pricing and terms for services and products that are necessary for the operations of business activities. Under the terms of these agreements, the Company is contractually committed to purchase specified minimums over periods ranging from
1
to
6
years. If the Company does not meet the specified minimums, the Company would have an obligation to pay the service provider all, or a portion, of the shortfall. Minimum purchase commitments as of
March 31, 2019
were as follows:
|
Fiscal year
|
Minimum Purchase Commitment
(1)
|
|||
|
(in millions)
|
||||
|
2020
|
$
|
2,286
|
|
|
|
2021
|
1,026
|
|
||
|
2022
|
488
|
|
||
|
2023
|
432
|
|
||
|
2024
|
243
|
|
||
|
Thereafter
|
25
|
|
||
|
Total
|
$
|
4,500
|
|
|
(1)
A significant portion of the minimum purchase commitments in fiscal 2020 relate to the amounts committed under the HPE preferred vendor agreements.
In the normal course of business, the Company may provide certain clients with financial performance guarantees, and at times performance letters of credit or surety bonds. In general, the Company would only be liable for the amounts of these guarantees in the event that non-performance by the Company permits termination of the related contract by the Company’s client. The Company believes it is in compliance with its performance obligations under all service contracts for which there is a financial performance guarantee, and the ultimate liability, if any, incurred in connection with these guarantees will not have a material adverse effect on its consolidated results of operations or financial position.
The Company also uses stand-by letters of credit, in lieu of cash, to support various risk management insurance policies. These letters of credit represent a contingent liability and the Company would only be liable if it defaults on its payment obligations on these policies.
128
DXC TECHNOLOGY COMPANY - NOTES TO CONSOLIDATED FINANCIAL STATEMENTS
The following table summarizes the expiration of the Company’s financial guarantees and stand-by letters of credit outstanding as of
March 31, 2019
:
|
(in millions)
|
Fiscal 2020
|
Fiscal 2021
|
Fiscal 2022 and Thereafter
|
Totals
|
||||||||||||
|
Surety bonds
|
$
|
254
|
|
$
|
125
|
|
$
|
145
|
|
$
|
524
|
|
||||
|
Letters of credit
|
190
|
|
28
|
|
364
|
|
582
|
|
||||||||
|
Stand-by letters of credit
|
81
|
|
81
|
|
13
|
|
175
|
|
||||||||
|
Totals
|
$
|
525
|
|
$
|
234
|
|
$
|
522
|
|
$
|
1,281
|
|
||||
The Company generally indemnifies licensees of its proprietary software products against claims brought by third parties alleging infringement of their intellectual property rights, including rights in patents (with or without geographic limitations), copyrights, trademarks and trade secrets. DXC’s indemnification of its licensees relates to costs arising from court awards, negotiated settlements, and the related legal and internal costs of those licensees. The Company maintains the right, at its own cost, to modify or replace software in order to eliminate any infringement. The Company has not incurred any significant costs related to licensee software indemnification.
Contingencies
Vincent Forcier v. Computer Sciences Corporation and The City of New York:
On October 27, 2014, the United States Attorney’s Office for the Southern District of New York and the Attorney General for the State of New York filed complaints-in-intervention on behalf of the United States and the State of New York, respectively, against CSC and The City of New York. This action arose out of a
qui tam
complaint originally filed under seal in 2012 by Vincent Forcier, a former employee of CSC. The complaints allege that from 2008 to 2012 New York City and CSC, in its role as fiscal agent for New York City’s Early Intervention Program ("EIP"), a federal program that provides services for infants and toddlers with manifest or potential developmental delays, violated the federal and state False Claims Acts and various common law standards by allegedly orchestrating a billing fraud against Medicaid through the misapplication of default billing codes and the failure to exhaust private insurance coverage before submitting claims to Medicaid. The New York Attorney General’s complaint also alleges that New York City and CSC failed to reimburse Medicaid in certain instances where insurance had paid a portion of the claim. The lawsuits seek treble statutory damages, other civil penalties and attorneys’ fees and costs.
On January 26, 2015, CSC and the City of New York moved to dismiss Forcier’s amended
qui tam
complaint as well as the federal and state complaints-in-intervention. In June 2016, the Court dismissed Forcier’s amended complaint in its entirety. With regard to the complaints-in-intervention, the Court dismissed the federal claims alleging misuse of default diagnosis codes when the provider had entered an invalid code, and the state claims alleging failure to reimburse Medicaid when claims were subsequently paid by private insurance. The Court denied the motions to dismiss with respect to the federal and state claims relating to (i) submission of insurance claims with a code signifying that the patient’s policy ID was unknown, and (ii) submission of claims to Medicaid after the statutory deadline for payment by private insurance had passed, and state common law claims. In accordance with the ruling, the United States and the State of New York each filed amended complaints-in-intervention on September 6, 2016. In addition to reasserting the claims upheld by the Court, the amended complaints assert new claims alleging that the compensation provisions of CSC’s contract with New York City rendered it ineligible to serve as a billing agent under state law.
On November 9, 2016, CSC filed motions to dismiss the amended complaints in their entirety. On August 10, 2017, the Court granted in part and denied in part the motions to dismiss, allowing the remaining causes of action to proceed. On January 9, 2018, the Company answered the complaints, and asserted a counterclaim against the State of New York on a theory of contribution and indemnification. On January 30, 2018, the State of New York filed a motion to dismiss the Company’s counterclaim. In a ruling dated September 20, 2018, the Court allowed the Company’s counterclaim for indemnification to proceed with respect to liability for claims not arising under the Federal False Claims Act. The Parties participated in a non-binding mediation on November 29, 2017, but no settlement has been reached to date. Discovery has now commenced. The Company believes that these claims are without merit and intends to continue to defend itself vigorously.
129
DXC TECHNOLOGY COMPANY - NOTES TO CONSOLIDATED FINANCIAL STATEMENTS
Strauch Fair Labor Standards Act Collective Action:
On July 1, 2014, plaintiffs Joseph Strauch, Timothy Colby, Charles Turner, and Vernon Carre filed an action in the U.S. District Court for the District of Connecticut on behalf of themselves and a putative nationwide collective of CSC system administrators, alleging CSC’s failure to properly classify these employees as non-exempt under the federal Fair Labor Standards Act ("FLSA"). Plaintiffs allege similar state-law Rule 23 class claims pursuant to Connecticut and California statutes, including the Connecticut Minimum Wage Act, the California Unfair Competition Law, California Labor Code, California Wage Order No. 4-2001 and the California Private Attorneys General Act. Plaintiffs claim double overtime damages, liquidated damages, pre- and post-judgment interest, civil penalties, and other state-specific remedies.
In 2015 the Court entered an order granting conditional certification under the FLSA of the collective of over
4,000
system administrators, and notice of the right to participate in the FLSA collective action was mailed to the system administrators. Approximately
1,000
system administrators, prior to the announced deadline, filed consents with the Court to participate in the FLSA collective.
On June 30, 2017, the Court granted Rule 23 certification of a Connecticut state-law class and a California state-law class consisting of professional system administrators and associate professional system administrators. Senior professional system administrators were found not to qualify for Rule 23 certification under the state-law claims. On July 14, 2017, the Company petitioned the Second Circuit Court of Appeals for permission to file an appeal of the Rule 23 decision. That petition was denied on November 21, 2017.
As a result of the Court's findings in its Rule 23 certification order, the parties entered into a stipulation to decertify the senior professional system administrators from the FLSA collective. On August 2, 2017, the Court approved the stipulation, and the FLSA collective action is currently made up of approximately
700
individuals who held the title of associate professional or professional system administrator.
A jury trial commenced on December 11, 2017. On December 20, 2017, the jury returned a verdict in favor of plaintiffs, finding that the Company had misclassified the class of employees as exempt under federal and state laws, and finding that it had done so willfully. In a ruling dated September 21, 2018, the Court denied the Company’s motions for judgment as a matter of law, and for decertification. Further rulings on the scope of damages are pending. The Company disagrees with the verdict and intends to continue to defend itself vigorously, including by appealing the verdict and the final judgment of the Court.
Computer Sciences Corporation v. Eric Pulier, et al.:
On May 12, 2015, CSC and its wholly owned subsidiary, ServiceMesh Inc. ("SMI"), filed a civil complaint in the Court of Chancery of the State of Delaware against Eric Pulier, the former CEO of SMI, which had been acquired by CSC on November 15, 2013. Following the acquisition, Mr. Pulier signed a retention agreement with SMI pursuant to which he received a grant of restricted stock units of CSC and agreed to be bound by CSC’s rules and policies, including CSC’s Code of Business Conduct. Mr. Pulier resigned from SMI on April 22, 2015 amid allegations that he had engaged in fraudulent transactions with
two
employees of the Commonwealth Bank of Australia Ltd. (“CBA”). The original complaint against Mr. Pulier asserted claims for fraud, breach of contract and breach of fiduciary duty. In an amended complaint, CSC named TechAdvisors, LLC and Shareholder Representative Services LLC ("SRS") as additional defendants. In ruling on a motion to dismiss filed by Mr. Pulier, the Court dismissed CSC’s claim for breach of the implied covenant of good faith, but allowed substantially all of the remaining claims to proceed. Mr. Pulier asserted counter-claims for breach of contract, fraud, negligent representation, rescission, and violations of the California Blue Sky securities law. With the exception of the claim for breach of his retention agreement, the Court dismissed in whole or in part each of Mr. Pulier’s counterclaims.
On December 17, 2015, CSC entered into a settlement agreement with the majority of the former equityholders of SMI, as well as with SRS acting in its capacity as the agent and attorney-in-fact for the settling equityholders. Pursuant to the settlement agreement, CSC received
$16.5 million
, which amount was equal to the settling equityholders’ pro rata share of the funds remaining in escrow from the transaction, which was recorded as an offset to selling, general and administrative costs in CSC’s statements of operations for the fiscal year ended March 31, 2016. On February 20, 2017, CSC, SRS and the former equityholders of SMI who remain named defendants entered into a partial settlement agreement by which CSC received payment of some of the funds remaining in escrow.
130
DXC TECHNOLOGY COMPANY - NOTES TO CONSOLIDATED FINANCIAL STATEMENTS
On July 20, 2017, the Court granted a motion by the United States for a 90-day stay of discovery pending the completion of a criminal investigation. On September 27, 2017, a grand jury empaneled by the United States District Court for the Central District of California returned an indictment against Mr. Pulier, charging him with conspiracy, securities and wire fraud, obstruction of justice, and other violations of federal law (United States v. Eric Pulier, CR 17-599-AB). The Government sought an extension of the stay which the Delaware Chancery Court granted on November 3, 2017.
On December 18, 2018, the Government filed an application to dismiss the indictment against Mr. Pulier, and on December 20, 2018, the United States District Court for the Central District of California granted the application and dismissed the indictment with prejudice.
On December 21, 2018, CSC filed a motion to lift the stay in its civil lawsuit against Mr. Pulier in Delaware Chancery Court, and a motion for a temporary restraining order and preliminary injunction preventing Mr. Pulier from dissipating approximately
$4.9
million previously seized by the Government in connection with its criminal investigation. On January 30, 2019, the Court granted the motion to lift the stay. On March 5, 2019, the Court denied the motion for a temporary restraining order and preliminary injunction. The Court has set a trial date of April 20, 2020. Discovery is ongoing.
In addition, law enforcement officials in Australia have brought bribery-related charges against the
two
former CBA employees.
One
of these has since pled guilty, and in 2016 received a sentence of imprisonment. In 2016, the United States Attorney’s Office for the Central District of California announced similar criminal charges against this same CBA employee for securities fraud and wire fraud. These criminal charges were dismissed on December 20, 2018. In April 2018 the other former CBA employee was committed to stand trial in the Australian criminal courts. The Company is cooperating with and assisting the Australian authorities in their investigation.
On February 17, 2016, Mr. Pulier filed a complaint in Delaware Chancery Court against CSC and its subsidiary - CSC Agility Platform, Inc., formerly known as SMI - seeking advancement of his legal fees and costs. On May 12, 2016, the Court ruled that CSC Agility Platform - as the successor to SMI - is liable for advancing
80%
of Mr. Pulier’s fees and costs in the underlying civil action. Mr. Pulier also filed a complaint for advancement of the legal fees and costs incurred in connection with his defense of criminal investigations by the U.S. Government and other entities. On August 7, 2017, the Court ruled substantially in Mr. Pulier's favor. On January 30, 2018, the Court reduced the Company’s advancement obligation to only
80%
of the criminal defense fees and costs sought by Mr. Pulier. In undertakings previously provided to SMI, Mr. Pulier agreed to repay all amounts advanced to him if it should ultimately be determined that he is not entitled to indemnification.
Kemper Corporate Services, Inc. v. Computer Sciences Corporation:
In October 2015, Kemper Corporate Services, Inc. (“Kemper”) filed a demand for arbitration against CSC with the American Arbitration Association (“AAA”), alleging that CSC breached the terms of a 2009 Master Software License and Services Agreement and related Work Orders (the “Agreement”) by failing to complete a software translation and implementation plan by certain contractual deadlines. Kemper claimed breach of contract, seeking approximately
$100 million
in damages measured in part by the amount of the fees paid under the contract, as well as pre-judgment interest, and in the alternative claimed rescission of the Agreement. CSC answered the demand for arbitration denying Kemper’s claims and asserting a counterclaim for unpaid invoices for services rendered by CSC.
A single arbitrator conducted an evidentiary hearing on the merits of the claims and counterclaims in April 2017. Oral argument took place on August 28, 2017. On October 2, 2017, the arbitrator issued a partial final award, finding for Kemper on its breach of contract theory, awarding Kemper
$84.2 million
in compensatory damages plus prejudgment interest, denying Kemper’s claim for rescission as moot, and denying CSC’s counterclaim. Kemper moved on October 10, 2017, in federal district court in Texas to confirm the award. On November 16, 2017, the arbitrator issued a Final Award which reiterated his findings of fact and law, calculated the amount of prejudgment interest, and awarded Kemper its costs of arbitration including reasonable attorneys’ fees and expenses. On December 6, 2017, the Company filed a motion to vacate the award in federal district court in New York. A week later, the New York court stayed the action in deference to the Texas court’s decision as to which venue was more appropriate to address the vacatur arguments. On January 12, 2018, the Company appeared in the Texas action seeking a stay of the confirmation proceedings or a transfer of venue to New York. On March 2, 2018, the Texas court denied the venue transfer motion. The pending vacatur motion was accordingly transferred to the Texas court, and a new memorandum of law in support of the motion was filed in that jurisdiction on March 30, 2018. On August 27, 2018, the Magistrate Judge issued its Report and Recommendation
131
DXC TECHNOLOGY COMPANY - NOTES TO CONSOLIDATED FINANCIAL STATEMENTS
denying the vacatur motion. On September 10, 2018, the Company filed its objections to this report to the United States District Judge who reviews the decision
de novo
.
On September 18, 2018, the District Court summarily accepted the Report and Recommendation without further briefing and entered a Final Judgment in the case. On September 27, 2018, the Company filed a notice of appeal to the Fifth Circuit Court of Appeals. The Company has also paid the portion of the judgment that is uncontested on appeal, and Kemper recorded this partial satisfaction of the judgment on September 26, 2018. On January 16, 2019, the Company filed its opening brief with the Fifth Circuit Court of Appeals. Kemper filed its brief on March 1, 2019, and the Company filed its reply brief on March 29, 2019. No further dates have been set at this time
.
The Company disagrees with the decision of the arbitrator and intends to continue to defend itself vigorously. The Company is also pursuing coverage for the full scope of the award, interest, and legal fees and expenses, under the Company's applicable insurance policies.
Forsyth, et al. v. HP Inc. and Hewlett Packard Enterprise:
This purported class and collective action was filed on August 18, 2016 in the U.S. District Court for the Northern District of California, against HP and HPE alleging violations of the Federal Age Discrimination in Employment Act (“ADEA”), the California Fair Employment and Housing Act, California public policy and the California Business and Professions Code. Former business units of HPE now owned by the Company will be proportionately liable for any recovery by plaintiffs in this matter. Plaintiffs filed an amended complaint on December 19, 2016. Plaintiffs seek to certify a nationwide class action under the ADEA comprised of all U.S. residents employed by defendants who had their employment terminated pursuant to a work force reduction (“WFR”) plan on or after December 9, 2014 (deferral states) and April 8, 2015 (non-deferral states), and who were 40 years of age or older at the time of termination. Plaintiffs also seek to represent a Rule 23 class under California law comprised of all persons 40 years or older employed by defendants in the state of California and terminated pursuant to a WFR plan on or after August 18, 2012. On January 30, 2017, defendants filed a partial motion to dismiss and a motion to compel arbitration of claims by certain named and opt-in plaintiffs who had signed releases as part of their WFR packages. On September 20, 2017, the Court denied the partial motion to dismiss without prejudice, but granted defendants’ motions to compel arbitration for those named and opt-in plaintiffs. Accordingly, the Court has stayed the entire action pending arbitration for these individuals, and administratively closed the case. Plaintiffs filed a motion for reconsideration as well as a notice of appeal to the Ninth Circuit (which has been denied as premature). The reconsideration motion was denied without oral argument. In that same decision, the Court held that a joint arbitration was permissible. The Company subsequently sought and obtained leave of Court to file a motion for reconsideration arguing that joint arbitration is not permitted under the relevant employee agreements. The Court denied the motion on April 17, 2018, ruling that interpretation of the employee agreements is an issue delegated to the arbitrator. The American Arbitration Association, which was designated to manage the arbitration process, has selected a single arbitrator to conduct the proceedings. An initial case management conference before the arbitrator was held on June 29, 2018. Pursuant to the release agreements, however, mediation is a precondition to arbitration. A mediation was held on October 4-5, 2018, and a settlement was reached with all
16
named and opt-in plaintiffs who were compelled to arbitrate.
Seven
of the plaintiffs were aligned to the Company
.
A settlement agreement has been signed. The case will continue to proceed in Court, however, with respect to other putative class members. Former business units of the Company now owned by Perspecta will be proportionately liable for any recovery by plaintiffs in this matter.
Oracle America, Inc., et al. v. Hewlett Packard Enterprise Company:
On March 22, 2016, Oracle filed a complaint against HPE in the Northern District of California, alleging copyright infringement, interference with contract, intentional interference with prospective economic relations, and unfair competition. The litigation relates in part to former business units of HPE that are now owned by the Company. The Company may be required to indemnify HPE for a portion of any recovery by Oracle in the litigation related to these business units.
Oracle’s claims arise primarily out of HPE’s prior relationship with a third-party maintenance provider named Terix Computer Company, Inc. (“Terix”). Oracle claims that Terix infringed its copyrights while acting as HPE’s subcontractor for certain customers of HPE’s multivendor support business. Oracle claims that HPE is liable for vicarious and contributory infringement arising from the alleged actions of Terix and for direct infringement arising from its own alleged conduct.
On June 14, 2018, the court heard oral argument on the parties’ cross-motions for summary judgment. On January 29, 2019, the court granted HPE’s motion for summary judgment and denied Oracle’s motion for summary judgment,
132
DXC TECHNOLOGY COMPANY - NOTES TO CONSOLIDATED FINANCIAL STATEMENTS
resolving the matter in HPE’s favor. Oracle has appealed the judgment to the U.S. Court of Appeals for the Ninth Circuit. The parties are scheduled to submit briefs in the appellate case between June and July 2019.
In re DXC Technology Company Securities Litigation:
On December 27, 2018, a purported class action lawsuit was filed in the United States District Court for the Eastern District of Virginia against the Company and
two
of its current officers. The lawsuit asserts claims under Sections 10(b) and 20(a) of the Securities Exchange Act of 1934, as amended, and is premised on allegedly false and/or misleading statements, and alleged non-disclosure of material facts, regarding the Company’s business, operations, prospects and performance during the proposed class period of February 8, 2018 to November 6, 2018.
In March 2019,
three
related shareholder derivative lawsuits were filed in the District Court of the State of Nevada, in and for Clark County, against
two
of the Company’s current officers and the members of the Company’s board of directors, asserting claims for breach of fiduciary duty, waste of corporate assets
,
and unjust enrichment.
The Company believes the claims are without merit and intends to vigorously defend all claims asserted.
Voluntary Disclosure of Certain Possible Sanctions Law Violations:
On February 2, 2017, CSC submitted an initial notification of voluntary disclosure to the U.S. Department of Treasury, Office of Foreign Assets Control ("OFAC") regarding certain possible violations of U.S. sanctions laws pertaining to insurance premium data and claims data processed by
two
partially-owned joint ventures of Xchanging, which CSC acquired during the first quarter of fiscal 2017. A copy of the disclosure was also provided to Her Majesty’s Treasury Office of Financial Sanctions Implementation in the United Kingdom. The Company has substantially completed its internal investigation, and has requested a meeting with OFAC to report its findings.
In addition to the matters noted above, the Company is currently subject in the normal course of business to various claims and contingencies arising from, among other things, disputes with customers, vendors, employees, contract counterparties and other parties, as well as securities matters, environmental matters, matters concerning the licensing and use of intellectual property, and inquiries and investigations by regulatory authorities and government agencies. Some of these disputes involve or may involve litigation. The financial statements reflect the treatment of claims and contingencies based on management's view of the expected outcome. DXC consults with outside legal counsel on issues related to litigation and regulatory compliance and seeks input from other experts and advisors with respect to matters in the ordinary course of business. Although the outcome of these and other matters cannot be predicted with certainty, and the impact of the final resolution of these and other matters on the Company’s results of operations in a particular subsequent reporting period could be material and adverse, management does not believe based on information currently available to the Company, that the resolution of any of the matters currently pending against the Company will have a material adverse effect on the financial position of the Company or the ability of the Company to meet its financial obligations as they become due. Unless otherwise noted, the Company is unable to determine at this time a reasonable estimate of a possible loss or range of losses associated with the foregoing disclosed contingent matters.
133
DXC TECHNOLOGY COMPANY - NOTES TO CONSOLIDATED FINANCIAL STATEMENTS
Note
22
-
Reconciliation of Previously Reported Amounts to Recast Financial Statements
As described under "Recent Accounting Pronouncements" in Note 1–Summary of Significant Accounting Policies," during fiscal 2019 the Company adopted ASU 2016-15. The adoption of this standard requires the Company to recast each prior period presented consistent with the new guidance. A reconciliation of the amounts previously reported within Exhibit 99.1 to the Company's Current Report on Form 8-K filed with the Securities and Exchange Commission on August 16, 2018
to those as adjusted within the accompanying financial statements is shown in the tables below for selected financial amounts:
Consolidated Statements of Cash Flows
|
Fiscal Year Ended March 31, 2018
|
||||||||||||
|
(in millions)
|
As Previously Reported
|
Retrospective Adoption of ASU 2016-15
|
As Adjusted
|
|||||||||
|
Decrease (increase) in receivables
|
$
|
74
|
|
$
|
(538
|
)
|
$
|
(464
|
)
|
|||
|
Net cash provided by operating activities
|
$
|
3,105
|
|
$
|
(538
|
)
|
$
|
2,567
|
|
|||
|
Deferred purchase price receivable
|
$
|
147
|
|
$
|
538
|
|
$
|
685
|
|
|||
|
Net cash provided by investing activities
|
$
|
181
|
|
$
|
538
|
|
$
|
719
|
|
|||
|
Fiscal Year Ended March 31, 2017
|
||||||||||||
|
(in millions)
|
As Previously Reported
|
Retrospective Adoption of ASU 2016-15
|
As Adjusted
|
|||||||||
|
Decrease (increase) in receivables
|
$
|
193
|
|
$
|
(218
|
)
|
$
|
(25
|
)
|
|||
|
Net cash provided by operating activities
|
$
|
837
|
|
$
|
(218
|
)
|
$
|
619
|
|
|||
|
Deferred purchase price receivable
|
$
|
141
|
|
$
|
218
|
|
$
|
359
|
|
|||
|
Net cash used in investing activities
|
$
|
(783
|
)
|
$
|
218
|
|
$
|
(565
|
)
|
|||
Note
23
-
Subsequent Events
No events, other than those described in these notes, have occurred that would require recognition or disclosure in the consolidated financial statements.
134
DXC TECHNOLOGY COMPANY
ITEM 8.
Supplementary Data
All financial statement schedules have been omitted since they are either not required, not applicable, or the required information is shown in the financial statements or related notes. As a result of the USPS Separation, the statement of operations, balance sheets, and related financial information reflect USPS's operations, assets and liabilities as discontinued operations. See Note
3
- "
Divestitures
".
Selected Quarterly Financial Data (Unaudited)
|
Fiscal 2019
|
||||||||||||||||
|
(in millions, except per-share amounts)
|
1st Quarter
|
2nd Quarter
|
3rd Quarter
|
4th Quarter
|
||||||||||||
|
Revenues
|
$
|
5,282
|
|
$
|
5,013
|
|
$
|
5,178
|
|
$
|
5,280
|
|
||||
|
Costs of services (excludes depreciation and amortization and restructuring costs)
|
3,867
|
|
3,518
|
|
3,725
|
|
3,836
|
|
||||||||
|
Gross profit
|
$
|
1,415
|
|
$
|
1,495
|
|
$
|
1,453
|
|
$
|
1,444
|
|
||||
|
Restructuring costs
|
$
|
185
|
|
$
|
157
|
|
$
|
76
|
|
$
|
47
|
|
||||
|
Income from continuing operations before taxes
|
$
|
360
|
|
$
|
332
|
|
$
|
469
|
|
$
|
354
|
|
||||
|
Income from continuing operations, net of taxes
|
$
|
231
|
|
$
|
259
|
|
$
|
466
|
|
$
|
271
|
|
||||
|
Income from discontinued operations, net of taxes
|
$
|
35
|
|
$
|
—
|
|
$
|
—
|
|
$
|
—
|
|
||||
|
Net income attributable to DXC common shareholders
|
$
|
259
|
|
$
|
262
|
|
$
|
462
|
|
$
|
274
|
|
||||
|
Earnings per common share
(1)
|
||||||||||||||||
|
Basic:
|
||||||||||||||||
|
Continuing operations
|
$
|
0.79
|
|
$
|
0.93
|
|
$
|
1.68
|
|
$
|
1.02
|
|
||||
|
Discontinued operations
|
$
|
0.12
|
|
$
|
—
|
|
$
|
—
|
|
$
|
—
|
|
||||
|
Diluted:
|
||||||||||||||||
|
Continuing operations
|
$
|
0.78
|
|
$
|
0.92
|
|
$
|
1.66
|
|
$
|
1.01
|
|
||||
|
Discontinued operations
|
$
|
0.12
|
|
$
|
—
|
|
$
|
—
|
|
$
|
—
|
|
||||
|
Cash dividend per common share
|
$
|
0.19
|
|
$
|
0.19
|
|
$
|
0.19
|
|
$
|
0.19
|
|
||||
135
DXC TECHNOLOGY COMPANY
Selected Quarterly Financial Data (Unaudited)
|
Fiscal 2018
|
||||||||||||||||
|
(in millions, except per-share amounts)
|
1
st
Quarter
|
2
nd
Quarter
|
3
rd
Quarter
|
4
th
Quarter
|
||||||||||||
|
Revenues
|
$
|
5,236
|
|
$
|
5,453
|
|
$
|
5,460
|
|
$
|
5,584
|
|
||||
|
Costs of services (excludes depreciation and amortization and restructuring costs)
|
4,309
|
|
3,870
|
|
4,051
|
|
4,087
|
|
||||||||
|
Gross profit
|
$
|
927
|
|
$
|
1,583
|
|
$
|
1,409
|
|
$
|
1,497
|
|
||||
|
Restructuring costs
|
$
|
187
|
|
$
|
188
|
|
$
|
210
|
|
$
|
204
|
|
||||
|
Income from continuing operations before taxes
|
$
|
91
|
|
$
|
284
|
|
$
|
341
|
|
$
|
588
|
|
||||
|
Income from continuing operations, net of taxes
|
$
|
108
|
|
$
|
205
|
|
$
|
706
|
|
$
|
527
|
|
||||
|
Income from discontinued operations, net of taxes
|
$
|
65
|
|
$
|
60
|
|
$
|
73
|
|
$
|
38
|
|
||||
|
Net income attributable to CSC common shareholders
|
$
|
159
|
|
$
|
256
|
|
$
|
776
|
|
$
|
560
|
|
||||
|
Earnings per common share
(1)
|
||||||||||||||||
|
Basic:
|
||||||||||||||||
|
Continuing operations
|
$
|
0.33
|
|
$
|
0.69
|
|
$
|
2.46
|
|
$
|
1.83
|
|
||||
|
Discontinued operations
|
$
|
0.23
|
|
$
|
0.21
|
|
$
|
0.26
|
|
$
|
0.13
|
|
||||
|
Diluted:
|
||||||||||||||||
|
Continuing operations
|
$
|
0.33
|
|
$
|
0.67
|
|
$
|
2.43
|
|
$
|
1.80
|
|
||||
|
Discontinued operations
|
$
|
0.22
|
|
$
|
0.21
|
|
$
|
0.25
|
|
$
|
0.13
|
|
||||
|
|
|
|
|
|
|
|
|
|||||||||
|
Cash dividend per common share
|
$
|
0.18
|
|
$
|
0.18
|
|
$
|
0.18
|
|
$
|
0.18
|
|
||||
|
(1)
|
Quarterly EPS amounts may not total to the full-year EPS. EPS is calculated based on weighted average shares outstanding for the period. Quarterly weighted average shares may not equal the full-year weighted average shares for the fiscal year.
|
136
ITEM 9. CHANGES IN AND DISAGREEMENTS WITH ACCOUNTANTS ON ACCOUNTING AND FINANCIAL DISCLOSURE
None.
ITEM 9A. CONTROLS AND PROCEDURES
Evaluation of Disclosure Controls and Procedures
Under the direction and with the participation of our Chief Executive Officer and Chief Financial Officer, we have evaluated the effectiveness of the design and operation of our disclosure controls and procedures, as defined in Rules 13a-15(e) and 15d-15(e) under the Securities Exchange Act of 1934, as amended, as of the end of the period covered by this report to ensure that information required to be disclosed by us in the SEC reports (i) is recorded, processed, summarized and reported, within the time periods specified in the SEC's rules and forms and (ii) is accumulated and communicated to our management, including the principal executive and principal financial officers, or persons performing similar functions, as appropriate, to allow timely decisions regarding required disclosure.
Based on this evaluation, the Chief Executive Officer and Chief Financial Officer have concluded that DXC's disclosure controls and procedures were effective as of the end of the period covered by this report and that our financial statements for the periods covered by and included in this Annual Report are fairly stated in all material respects in accordance with generally accepted accounting principles in the United States of America for each of the periods presented herein.
Management’s Report on Internal Control over Financial Reporting
Our management is responsible for establishing and maintaining adequate internal control over financial reporting. Internal control over financial reporting is a process designed to provide reasonable assurance regarding the reliability of financial reporting and the preparation of financial statements for external purposes in accordance with accounting principles generally accepted in the United States of America.
Our internal control over financial reporting includes policies and procedures that (i) pertain to the maintenance of records that, in reasonable detail, accurately and fairly reflect transactions and dispositions of assets; (ii) provide reasonable assurance that transactions are recorded as necessary for preparation of our financial statements and receipts and expenditures are being made only in accordance with authorization of management and the directors of DXC; and (iii) provide reasonable assurance regarding prevention or timely detection of unauthorized acquisition, use or disposition of our assets that could have a material effect on our financial statements. Because of its inherent limitations, internal control over financial reporting may not prevent or detect misstatements. Also, projections of any evaluation of effectiveness to future periods are subject to the risk controls may become inadequate because of changes in conditions, or the degree of compliance with the policies or procedures may deteriorate.
Management assessed the effectiveness of our internal control over financial reporting based on the criteria and framework established in
Internal Control - Integrated Framework (2013)
issued by the Committee of Sponsoring Organizations of the Treadway Commission. Based on this evaluation, management concluded that our internal control over financial reporting was
effective as of
March 31, 2019
.
During the year DXC made eight acquisitions with acquisition dates ranging from April 4, 2018 to February 15, 2019 that were excluded from management's assessment of internal control over financial reporting. The combined financial statements of these eight acquisitions constitute 1.1% of total assets and 1.2% of revenues of the consolidated financial statement amounts as of and for the year ended March 31, 2019.
The effectiveness of DXC's internal control over financial reporting as of
March 31, 2019
has been audited by Deloitte & Touche LLP, an independent registered public accounting firm, as stated in their report appearing on page 139 of this Annual Report.
137
Changes in Internal Controls Over Financial Reporting
There were no changes in our internal control over financial reporting during fiscal 2019 that have materially affected, or are reasonably likely to materially affect, our internal control over financial reporting.
138
REPORT OF INDEPENDENT REGISTERED PUBLIC ACCOUNTING FIRM
To the Board of Directors and Stockholders of
DXC Technology Company
Tysons, Virginia
Opinion on Internal Control over Financial Reporting
We have audited the internal control over financial reporting of DXC Technology Company and subsidiaries (the “Company”) as of March 31, 2019, based on criteria established in
Internal Control - Integrated Framework (2013)
issued by the Committee of Sponsoring Organizations of the Treadway Commission (COSO). In our opinion, the Company maintained, in all material respects, effective internal control over financial reporting as of March 31, 2019, based on criteria established in
Internal Control - Integrated Framework (2013)
issued by COSO.
We have also audited, in accordance with the standards of the Public Company Accounting Oversight Board (United States) (PCAOB), the consolidated financial statements as of and for the year ended March 31, 2019, of the Company and our report dated
June 12, 2019
, expressed an unqualified opinion on those financial statements.
As described in Management’s Report on Internal Control over Financial Reporting, during the year DXC made eight acquisitions with acquisition dates ranging from April 4, 2018 to February 15, 2019 that were excluded from management's assessment of internal control over financial reporting. The combined financial statements of these eight acquisitions constitute 1.1% of total assets and 1.2% of revenues of the consolidated financial statement amounts as of and for the year ended March 31, 2019. Accordingly, our audit did not include the internal control over financial reporting at these eight acquisitions.
Basis for Opinion
The Company’s management is responsible for maintaining effective internal control over financial reporting and for its assessment of the effectiveness of internal control over financial reporting, included in the accompanying Management’s Report on Internal Control over Financial Reporting. Our responsibility is to express an opinion on the Company’s internal control over financial reporting based on our audit. We are a public accounting firm registered with the PCAOB and are required to be independent with respect to the Company in accordance with the U.S. federal securities laws and the applicable rules and regulations of the Securities and Exchange Commission and the PCAOB.
We conducted our audit in accordance with the standards of the PCAOB. Those standards require that we plan and perform the audit to obtain reasonable assurance about whether effective internal control over financial reporting was maintained in all material respects. Our audit included obtaining an understanding of internal control over financial reporting, assessing the risk that a material weakness exists, testing and evaluating the design and operating effectiveness of internal control based on the assessed risk, and performing such other procedures as we considered necessary in the circumstances. We believe that our audit provides a reasonable basis for our opinion.
Definition and Limitations of Internal Control over Financial Reporting
A company’s internal control over financial reporting is a process designed to provide reasonable assurance regarding the reliability of financial reporting and the preparation of financial statements for external purposes in accordance with generally accepted accounting principles. A company’s internal control over financial reporting includes those policies and procedures that (1) pertain to the maintenance of records that, in reasonable detail, accurately and fairly reflect the transactions and dispositions of the assets of the company; (2) provide reasonable assurance that transactions are recorded as necessary to permit preparation of financial statements in accordance with generally accepted accounting principles, and that receipts and expenditures of the company are being made only in accordance with authorizations of management and directors of the company; and (3) provide reasonable assurance regarding prevention or timely detection of unauthorized acquisition, use, or disposition of the company’s assets that could have a material effect on the financial statements.
139
Because of its inherent limitations, internal control over financial reporting may not prevent or detect misstatements. Also, projections of any evaluation of effectiveness to future periods are subject to the risk that controls may become inadequate because of changes in conditions, or that the degree of compliance with the policies or procedures may deteriorate.
/s/ DELOITTE & TOUCHE LLP
McLean, Virginia
June 12, 2019
140
ITEM 9B. OTHER INFORMATION
None.
PART III
Certain information required by Part III is omitted from this Annual Report on Form 10-K and is incorporated herein by reference to the definitive proxy statement with respect to our 2018 Annual Meeting of Stockholders (the "2018 Proxy Statement"), which we will file with the Securities and exchange Commission no later than 120 days after the end of the fiscal year covered by this Annual Report.
ITEM 10. DIRECTORS, EXECUTIVE OFFICERS AND CORPORATE GOVERNANCE
Information relating to our executive officers appears in Part I, Item I of this Annual Report on Form 10-K under the heading "Information About Our Executive Officers."
Other information required by this item will appear under the headings "Proposal 1-Election of Directors”, "Section 16(a) Beneficial Ownership Reporting Compliance", “Corporate Governance”, and “Additional Information-Business for 2019 Annual Meeting" in our 2019 Proxy Statement, which will be filed with the SEC pursuant to Regulation 14A not later than 120 days after
March 31, 2019
, and such information is incorporated herein by reference.
We have a written Code of Business Conduct that applies to our Chief Executive Officer, Chief Financial Officer and our Principal Accounting Officer and every other officer and employee of DXC. Our Code of Business Conduct is available on our website,
www.dxc.technology,
under the heading Leadership and Governance. If any amendment to, or a waiver from, a provision of the Code Business Conduct is made, we intend to disclose such information on our website within four business days.
ITEM 11. EXECUTIVE COMPENSATION
Information required by this item will appear in our 2019 Proxy Statement under the headings "Executive Compensation" and "Corporate Governance" and are incorporated herein by reference.
ITEM 12. SECURITY OWNERSHIP OF CERTAIN BENEFICIAL OWNERS AND MANAGEMENT AND RELATED STOCKHOLDER MATTERS
The following table gives information about our common stock that may be issued under our equity compensation plans as of
March 31, 2019
. See Note
15
- "
Stock Incentive Plans
" of the consolidated financial statements included herein for information regarding the material features of these plans.
|
Number of securities to be issued upon exercise of outstanding options, warrants and rights
|
Weighted-average exercise price of outstanding options, warrants and rights
|
Number of securities remaining available for future issuance under equity compensation plans excluding securities reflected in column (a)
|
|||||||
|
Plan Category
|
(a)
|
(b)
|
(c)
|
||||||
|
Equity compensation plans approved by security holders
|
5,204,293
|
|
13.54
|
|
21,937,273
|
|
|||
|
Equity compensation plans not approved by security holders
|
—
|
|
—
|
|
—
|
|
|||
|
Total
|
5,204,293
|
|
—
|
|
21,937,273
|
|
|||
Other information required by this Item will appear in the 2019 Proxy Statement under the heading "Security Ownership," which section is incorporated by reference.
141
ITEM 13. CERTAIN RELATIONSHIPS AND RELATED TRANSACTIONS, AND DIRECTOR INDEPENDENCE
Information required by this item will appear in our 2019 Proxy Statement under the headings "Corporate Governance" and "Certain Relationships and Related Transactions" and is incorporated herein by reference.
ITEM 14. PRINCIPAL ACCOUNTING FEES AND SERVICES
Information required by this item will appear in our 2019 Proxy Statement under the heading "Proposal 2-Ratification of the appointment of Deloitte & Touche LLP as our independent registered public accounting firm for the fiscal year ending March 31, 2020-Fees" and is incorporated herein by reference.
PART IV
ITEM 15. EXHIBITS, FINANCIAL STATEMENT SCHEDULES
(1) Consolidated Financial Statements
The financial statements are included under Item 8 of this Annual Report. See the index on page 52.
(2) Exhibits
The following exhibits are filed herewith unless otherwise indicated.
|
Exhibit
Number |
Description of Exhibit
|
|
2.1
|
|
|
2.2
|
|
|
2.3
|
|
|
2.4
|
|
|
2.5
|
|
|
2.6
|
|
|
2.7
|
|
|
2.8
|
|
|
2.9
|
|
142
|
2.10
|
|
|
2.11
|
|
|
2.12
|
|
|
2.13
|
|
|
2.14
|
|
|
2.15
|
|
|
2.16
|
|
|
2.17
|
|
|
2.18
|
|
|
2.19
|
|
|
2.20
|
|
|
2.21
|
|
|
2.22
|
|
|
3.1
|
|
|
3.2
|
|
|
4.1
|
|
|
4.2
|
|
|
4.3
|
|
|
4.4
|
|
|
4.5
|
|
|
4.6
|
|
143
|
4.7
|
|
|
4.8
|
|
|
4.9
|
|
|
4.10
|
|
|
4.11
|
|
|
4.12
|
|
|
4.13
|
|
|
4.14
|
|
|
4.15
|
|
|
4.16
|
|
|
4.17
|
|
|
4.18
|
|
|
4.19
|
|
|
4.20
|
|
|
4.21
|
|
|
10.1
|
|
|
10.2
|
|
|
10.3
|
|
|
10.4
|
|
|
10.5
|
|
|
10.6
|
|
|
10.7
|
|
144
|
10.8
|
|
|
10.9
|
|
|
10.10
|
|
|
10.11
|
|
|
10.12
|
|
|
10.13
|
|
|
10.14
|
|
|
10.15
|
|
|
10.16
|
|
|
10.17
|
|
|
10.18
|
|
|
10.19
|
|
|
10.20
|
|
|
10.21
|
|
|
10.22
|
|
|
10.23
|
|
|
10.24
|
|
145
|
10.25
|
|
|
10.26
|
|
|
10.27
|
|
|
10.28
|
|
|
10.29
|
|
|
10.30
|
|
|
10.31
|
|
|
10.32
|
|
|
10.33
|
|
|
10.34
|
|
|
10.35
|
|
|
10.36*
|
|
|
10.37*
|
|
|
10.38*
|
|
|
10.39*
|
|
|
10.40*
|
|
|
10.41*
|
|
|
10.42*
|
|
146
|
10.43*
|
|
|
10.44*
|
|
|
10.45*
|
|
|
10.46*
|
|
|
10.47*
|
|
|
10.48*
|
|
|
10.49*
|
|
|
10.50*
|
|
|
10.51*
|
|
|
10.52*
|
|
|
10.53*
|
|
|
21
|
|
|
23
|
|
|
31.1
|
|
|
31.2
|
|
|
32.1
|
|
|
32.2
|
|
|
101.INS
|
XBRL Instance
|
|
101.SCH
|
XBRL Taxonomy Extension Schema
|
|
101.CAL
|
XBRL Taxonomy Extension Calculation
|
|
101.LAB
|
XBRL Taxonomy Extension Labels
|
|
101.PRE
|
XBRL Taxonomy Extension Presentation
|
|
*Management contract or compensatory plan or agreement
|
|
147
ITEM 16. FORM 10-K SUMMARY
None.
148
SIGNATURES
Pursuant to the requirements of the Securities Exchange Act of 1934, the Registrant has duly caused this report to be signed on its behalf by the undersigned, thereunto duly authorized.
|
DXC TECHNOLOGY COMPANY
|
|||
|
Dated:
|
June 12, 2019
|
By:
|
/s/ Paul N. Saleh
|
|
Name:
|
Paul N. Saleh
|
||
|
Title:
|
Executive Vice President and Chief Financial Officer
|
||
Pursuant to the requirements of the Securities and Exchange Act of 1934, this report has been signed by the following persons on behalf of the Registrant and in the capacities and on the dates indicated:
|
Signature
|
Title
|
Date
|
||
|
/s/ J. Michael Lawrie
|
Chairman, President and Chief Executive Officer
|
June 12, 2019
|
||
|
J. Michael Lawrie
|
(Principal Executive Officer)
|
|||
|
/s/ Paul N. Saleh
|
Executive Vice President and Chief Financial Officer
|
June 12, 2019
|
||
|
Paul N. Saleh
|
(Principal Financial Officer)
|
|||
|
/s/ Neil A. Manna
|
Senior Vice President and Corporate Controller
|
June 12, 2019
|
||
|
Neil A. Manna
|
(Principal Accounting Officer)
|
|||
|
/s/ Mukesh Aghi
|
Director
|
June 12, 2019
|
||
|
Mukesh Aghi
|
||||
|
/s/ Amy E. Alving
|
Director
|
June 12, 2019
|
||
|
Amy E. Alving
|
||||
|
/s/ David Herzog
|
Director
|
June 12, 2019
|
||
|
David Herzog
|
||||
|
/s/ Mary Louise Krakauer
|
Director
|
June 12, 2019
|
||
|
Mary Louise Krakauer
|
||||
|
/s/ Sachin Lawande
|
Director
|
June 12, 2019
|
||
|
Sachin Lawande
|
||||
149
|
/s/ Julio A. Portalatin
|
Director
|
June 12, 2019
|
||
|
Julio A. Portalatin
|
||||
|
/s/ Peter Rutland
|
Director
|
June 12, 2019
|
||
|
Peter Rutland
|
||||
|
/s/ Manoj P. Singh
|
Director
|
June 12, 2019
|
||
|
Manoj P. Singh
|
||||
|
/s/ Robert F. Woods
|
Director
|
June 12, 2019
|
||
|
Robert F. Woods
|
||||
150
TABLE OF CONTENTS
Part IItem 1. BusinessItem 1A. Risk FactorsItem 1B. Unresolved Staff CommentsItem 2. PropertiesItem 3. Legal ProceedingsItem 4. Mine Safety DisclosuresPart IIItem 5. Market For Registrant's Common Equity, Related Stockholder Matters and Issuer Purchases Of Equity SecuritiesItem 6. Selected Financial Data (unaudited)Item 7. Management's Discussion and Analysis Of Financial Condition and Results Of OperationsItem 7A. Quantitative and Qualitative Disclosures About Market RiskItem 8. Financial Statements and Supplementary DataNote 1 - Summary Of Significant Accounting PoliciesNote 2 - AcquisitionsNote 3 - DivestituresNote 4 - Earnings Per ShareNote 5 - ReceivablesNote 6 - Fair ValueNote 7 - Derivative InstrumentsNote 8 - Property and EquipmentNote 9 - Intangible AssetsNote 10 - GoodwillNote 11 - Income TaxesNote 12 - DebtNote 13 - Pension and Other Benefit PlansNote 14 - Stockholders' EquityNote 15 - Stock Incentive PlansNote 16 - Cash FlowsNote 17 - Other IncomeNote 18 - Segment and Geographic InformationNote 19 - RevenueNote 20 - Restructuring CostsNote 21 - Commitments and ContingenciesNote 22 - Reconciliation Of Previously Reported Amounts To Recast Financial StatementsNote 23 - Subsequent EventsItem 8. Supplementary DataItem 9. Changes in and Disagreements with Accountants on Accounting and Financial DisclosureItem 9A. Controls and ProceduresItem 9B. Other InformationPart IIIItem 10. Directors, Executive Officers and Corporate GovernanceItem 11. Executive CompensationItem 12. Security Ownership Of Certain Beneficial Owners and Management and Related Stockholder MattersItem 13. Certain Relationships and Related Transactions, and Director IndependenceItem 14. Principal Accounting Fees and ServicesPart IVItem 15. Exhibits, Financial Statement SchedulesItem 16. Form 10-k Summary