DEXCOM INC
10-Ks and 10-Qs
|
|
|
|
|
|
|
|
|
|
|
|
|
|
|
|
|
|
|
|
|
|
|
|
|
|
|
|
|
|
|
|
|
|
|
|
|
|
|
|
|
|
|
|
|
|
|
|
|
|
|
|
|
|
|
|
UNITED STATES
SECURITIES AND EXCHANGE COMMISSION
Washington, D.C. 20549
FORM
10-Q
|
|
QUARTERLY REPORT PURSUANT TO SECTION 13 OR 15(d) OF THE SECURITIES EXCHANGE ACT OF 1934 | ||||
|
For the quarterly period ended
|
|||||
| or | |||||
|
|
TRANSITION REPORT PURSUANT TO SECTION 13 OR 15(d) OF THE SECURITIES EXCHANGE ACT OF 1934 | ||||
| For the transition period from to | |||||
Commission File Number:
000-51222

(Exact name of registrant as specified in its charter)
|
|
|
|||||||
| (State or other jurisdiction of incorporation or organization) | (I.R.S. Employer Identification No.) | |||||||
|
|
|
|||||||
| (Address of principal executive offices) | (Zip Code) | |||||||
(
858
)
200-0200
(Registrant’s telephone number, including area code)
Securities registered pursuant to Section 12(b) of the Act:
| Title of each class | Trading Symbol(s) | Name of each exchange on which registered | ||||||||||||
|
|
|
|
||||||||||||
Indicate by check mark whether the registrant (1) has filed all reports required to be filed by Section 13 or 15(d) of the Securities Exchange Act of 1934 during the preceding 12 months (or for such shorter period that the registrant was required to file such reports), and (2) has been subject to such filing requirements for the past 90 days.
Yes
☒ No ☐
Indicate by check mark whether the registrant has submitted electronically every Interactive Data File required to be submitted pursuant to Rule 405 of Regulation S-T (§232.405 of this chapter) during the preceding 12 months (or for such shorter period that the registrant was required to submit such files).
Yes
☒ No ☐
Indicate by check mark whether the registrant is a large accelerated filer, an accelerated filer, a non-accelerated filer, a smaller reporting company, or an emerging growth company. See the definitions of “large accelerated filer,” “accelerated filer,” “smaller reporting company,” and “emerging growth company” in Rule 12b-2 of the Exchange Act.
|
|
☒ | Accelerated filer | ☐ | |||||||||||
| Non-accelerated filer | ☐ | Smaller reporting company |
|
|||||||||||
| Emerging growth company |
|
|||||||||||||
If an emerging growth company, indicate by check mark if the registrant has elected not to use the extended transition period for complying with any new or revised financial accounting standards provided pursuant to Section 13(a) of the Exchange Act. ☐
Indicate by check mark whether the registrant is a shell company (as defined in Rule 12b-2 of the Exchange Act). Yes
☐
No ☒
As of
April 18, 2024, there were
397,683,837
shares of the registrant’s common stock outstanding.
| DexCom, Inc. | ||
| Table of Contents | ||
| Page | ||||||||
|
Consolidated Balance Sheets (unaudited) as of
March 31, 2024
and
December 31, 2023
|
||||||||
|
Consolidated Statements of Operations (unaudited) for the
three m
onths ended
March 31, 2024
and
2023
|
||||||||
|
Consolidated Statements of Comprehensive Income (unaudited) for the
three
months ended
March 31, 2024
and
2023
|
||||||||
|
Consolidated Statements of Stockholders’ Equity (unaudited) for the
three
months ended
March 31, 2024
and
2023
|
||||||||
|
Consolidated Statements of Cash Flows (unaudited) for the
three months ended
March 31, 2024
and
2023
|
||||||||
2
|
CAUTIONARY NOTE REGARDING FORWARD-LOOKING STATEMENTS
|
||
Except for historical financial information contained herein, the matters discussed in this Quarterly Report on Form 10-Q may be considered forward-looking statements within the meaning of Section 27A of the Securities Act of 1933, as amended, or the Securities Act, and Section 21E of the Securities Exchange Act of 1934, as amended, or the Exchange Act, and subject to the safe harbor created by the Private Securities Litigation Reform Act of 1995. Such statements include declarations regarding our operations, financial condition and prospects, and business strategies, and are based on management’s current intent, beliefs, expectations, and assumptions. Investors are cautioned that any such forward-looking statements are not guarantees of future performance and involve a number of risks, uncertainties and other factors, some of which are beyond our control; actual results could differ materially from those indicated or implied by such forward-looking statements. Important factors that could cause actual results to differ materially from those indicated by such forward-looking statements include, but are not limited to: (i) that the information is of a preliminary nature and may be subject to further adjustment; (ii) those risks and uncertainties identified under “Risk Factors” in our Annual Report on Form 10-K for the fiscal year ended December 31, 2023 filed with the Securities and Exchange Commission, or the SEC, on February 8, 2024, together with any updates identified under “Risk Factors” in our subsequent Quarterly Reports on Form 10-Q; and (iii) the other risks detailed from time-to-time in our other reports and registration statements filed with the SEC. Except as required by law, we undertake no obligation to revise or update publicly any forward-looking statements, whether as a result of new information, future events or otherwise.
|
AVAILABLE INFORMATION
|
||
Our website address is located at dexcom.com and our investor relations website is located at investors.dexcom.com. We file electronically with the SEC our Annual Reports on Form 10-K, Quarterly Reports on Form 10-Q, Current Reports on Form 8-K, and other reports filed or furnished pursuant to Section 13(a) or 15(d) of the Exchange Act. We make available on our website, free of charge, copies of these reports and other information as soon as reasonably practicable after we electronically file such material with, or furnish it to, the SEC. Information that is based on estimates, forecasts, projections, market research or similar methodologies is inherently subject to uncertainties and actual events or circumstances may differ materially from events and circumstances reflected in this information. Unless otherwise expressly stated, we obtained industry, business, market, and other data from reports, research surveys, studies, and similar data prepared by market research firms and other third parties, industry, medical and general publications, government data, and similar sources.
We announce material information to the public about us, our products, and other matters through a variety of means, including filings with the SEC, press releases, public conference calls, presentations, webcasts, and our investor relations website in order to achieve broad, non-exclusionary distribution of information to the public and to comply with our disclosure obligations under Regulation FD. The information disclosed by the foregoing channels could be deemed to be material information. As such, we encourage investors, the media, and others to follow the channels listed above and review the information disclosed through such channels.
Except as expressly set forth in this Quarterly Report on Form 10-Q, the contents of our website are not incorporated by reference into, or otherwise to be regarded as part of, this Quarterly Report on Form 10-Q or any other report or document we file with the SEC, and any references to our website are intended to be inactive textual references only.
“Dexcom”, “Dexcom Clarity”, “Dexcom One”, and other trademarks of ours appearing in this Quarterly Report on Form 10-Q are our property. Other service marks, trademarks and trade names referred to in this Quarterly Report on Form 10-Q are the property of their respective owners.
3
|
PART I. FINANCIAL INFORMATION
|
||
|
ITEM 1. FINANCIAL STATEMENTS
|
||
| DexCom, Inc. | ||
| Consolidated Balance Sheets | ||
| (Unaudited) | ||
|
(In millions, except share and par value data)
|
March 31, 2024 | December 31, 2023 | |||||||||
| Assets | |||||||||||
| Current assets: | |||||||||||
| Cash and cash equivalents | $ |
|
$ |
|
|||||||
| Short-term marketable securities |
|
|
|||||||||
| Accounts receivable, net |
|
|
|||||||||
| Inventory |
|
|
|||||||||
| Prepaid and other current assets |
|
|
|||||||||
| Total current assets |
|
|
|||||||||
| Property and equipment, net |
|
|
|||||||||
| Operating lease right-of-use assets |
|
|
|||||||||
| Goodwill |
|
|
|||||||||
| Intangibles, net |
|
|
|||||||||
| Deferred tax assets |
|
|
|||||||||
| Other assets |
|
|
|||||||||
| Total assets | $ |
|
$ |
|
|||||||
| Liabilities and Stockholders’ Equity | |||||||||||
| Current liabilities: | |||||||||||
| Accounts payable and accrued liabilities | $ |
|
$ |
|
|||||||
| Accrued payroll and related expenses |
|
|
|||||||||
| Short-term operating lease liabilities |
|
|
|||||||||
| Deferred revenue |
|
|
|||||||||
| Total current liabilities |
|
|
|||||||||
| Long-term senior convertible notes |
|
|
|||||||||
| Long-term operating lease liabilities |
|
|
|||||||||
| Other long-term liabilities |
|
|
|||||||||
| Total liabilities |
|
|
|||||||||
| Commitments and contingencies |
|
|
|||||||||
| Stockholders’ equity: | |||||||||||
|
Preferred stock, $
|
|
|
|||||||||
|
Common stock, $
|
|
|
|||||||||
| Additional paid-in capital |
|
|
|||||||||
|
Accumulated other comprehensive loss
|
(
|
(
|
|||||||||
| Retained earnings |
|
|
|||||||||
|
Treasury stock, at cost;
|
(
|
(
|
|||||||||
| Total stockholders’ equity |
|
|
|||||||||
| Total liabilities and stockholders’ equity | $ |
|
$ |
|
|||||||
See accompanying notes
4
| DexCom, Inc. | ||
| Consolidated Statements of Operations | ||
| (Unaudited) | ||
|
Three Months Ended
March 31, |
|||||||||||
| (In millions, except per share data) | 2024 | 2023 | |||||||||
| Revenue | $ |
|
$ |
|
|||||||
| Cost of sales |
|
|
|||||||||
| Gross profit |
|
|
|||||||||
| Operating expenses: | |||||||||||
| Research and development |
|
|
|||||||||
| Selling, general and administrative |
|
|
|||||||||
| Total operating expenses |
|
|
|||||||||
| Operating income |
|
|
|||||||||
|
Other income (expense), net
|
|
|
|||||||||
| Income before income taxes |
|
|
|||||||||
| Income tax expense (benefit) |
(
|
|
|||||||||
| Net income | $ |
|
$ |
|
|||||||
| Basic net income per share | $ |
|
$ |
|
|||||||
| Shares used to compute basic net income per share |
|
|
|||||||||
| Diluted net income per share | $ |
|
$ |
|
|||||||
| Shares used to compute diluted net income per share |
|
|
|||||||||
See accompanying notes
5
| DexCom, Inc. | ||
| Consolidated Statements of Comprehensive Income | ||
| (Unaudited) | ||
|
Three Months Ended
March 31, |
|||||||||||
| (In millions) | 2024 | 2023 | |||||||||
| Net income | $ |
|
$ |
|
|||||||
| Other comprehensive income (loss), net of tax: | |||||||||||
| Translation adjustments and other |
(
|
|
|||||||||
| Unrealized gain (loss) on marketable debt securities |
(
|
|
|||||||||
| Total other comprehensive income (loss), net of tax |
(
|
|
|||||||||
| Comprehensive income | $ |
|
$ |
|
|||||||
See accompanying notes
6
| DexCom, Inc. | ||
| Consolidated Statements of Stockholders’ Equity | ||
| (Unaudited) | ||
| Three Months Ended March 31, 2024 | ||||||||||||||||||||||||||||||||||||||||||||
| (In millions) | Common Stock |
Additional
Paid-In Capital |
Accumulated Other Comprehensive Loss | Retained Earnings | Treasury Stock |
Total
Stockholders’ Equity |
||||||||||||||||||||||||||||||||||||||
| Shares | Amount | |||||||||||||||||||||||||||||||||||||||||||
| Balance at December 31, 2023 |
|
$ |
|
$ |
|
$ |
(
|
$ |
|
$ |
(
|
$ |
|
|||||||||||||||||||||||||||||||
| Issuance of common stock under equity incentive plans |
|
— | — | — | — | — | — | |||||||||||||||||||||||||||||||||||||
| Issuance of common stock for Employee Stock Purchase Plan |
|
— |
|
— | — | — |
|
|||||||||||||||||||||||||||||||||||||
| Issuance of common stock in connection with achievement of sales-based milestone, net of issuance costs |
|
— |
(
|
— | — |
|
|
|||||||||||||||||||||||||||||||||||||
| Exercise and settlement of warrants |
|
— |
(
|
— | — |
|
|
|||||||||||||||||||||||||||||||||||||
| Share-based compensation expense | — | — |
|
— | — | — |
|
|||||||||||||||||||||||||||||||||||||
| Net income | — | — | — | — |
|
— |
|
|||||||||||||||||||||||||||||||||||||
| Other comprehensive loss, net of tax | — | — | — |
(
|
— | — |
(
|
|||||||||||||||||||||||||||||||||||||
| Balance at March 31, 2024 |
|
$ |
|
$ |
|
$ |
(
|
$ |
|
$ |
(
|
$ |
|
|||||||||||||||||||||||||||||||
| Three Months Ended March 31, 2023 | ||||||||||||||||||||||||||||||||||||||||||||
| (In millions) | Common Stock |
Additional
Paid-In Capital |
Accumulated Other Comprehensive Loss | Retained Earnings | Treasury Stock |
Total
Stockholders’ Equity |
||||||||||||||||||||||||||||||||||||||
| Shares | Amount | |||||||||||||||||||||||||||||||||||||||||||
| Balance at December 31, 2022 |
|
$ |
|
$ |
|
$ |
(
|
$ |
|
$ |
(
|
$ |
|
|||||||||||||||||||||||||||||||
| Issuance of common stock under equity incentive plans |
|
— | — | — | — | — | — | |||||||||||||||||||||||||||||||||||||
| Issuance of common stock for Employee Stock Purchase Plan |
|
— |
|
— | — | — |
|
|||||||||||||||||||||||||||||||||||||
| Share-based compensation expense | — | — |
|
— | — | — |
|
|||||||||||||||||||||||||||||||||||||
| Net income | — | — | — | — |
|
— |
|
|||||||||||||||||||||||||||||||||||||
| Other comprehensive income, net of tax | — | — | — |
|
— | — |
|
|||||||||||||||||||||||||||||||||||||
| Balance at March 31, 2023 |
|
$ |
|
$ |
|
$ |
(
|
$ |
|
$ |
(
|
$ |
|
|||||||||||||||||||||||||||||||
See accompanying notes
7
| DexCom, Inc. | ||
| Consolidated Statements of Cash Flows | ||
| (Unaudited) | ||
|
Three Months Ended
March 31, |
|||||||||||
| (In millions) | 2024 | 2023 | |||||||||
| Operating activities | |||||||||||
| Net income | $ |
|
$ |
|
|||||||
|
Adjustments to reconcile net income to cash provided by operating activities:
|
|||||||||||
| Depreciation and amortization |
|
|
|||||||||
| Share-based compensation |
|
|
|||||||||
| Non-cash interest expense |
|
|
|||||||||
| Deferred income taxes |
(
|
(
|
|||||||||
| Other non-cash income and expenses |
(
|
(
|
|||||||||
| Changes in operating assets and liabilities: | |||||||||||
| Accounts receivable, net |
(
|
|
|||||||||
| Inventory |
(
|
(
|
|||||||||
| Prepaid and other assets |
|
(
|
|||||||||
| Operating lease right-of-use assets and liabilities, net |
(
|
(
|
|||||||||
| Accounts payable and accrued liabilities |
|
|
|||||||||
| Accrued payroll and related expenses |
(
|
(
|
|||||||||
| Deferred revenue and other liabilities |
|
|
|||||||||
| Net cash provided by operating activities |
|
|
|||||||||
| Investing activities | |||||||||||
| Purchases of marketable securities |
(
|
(
|
|||||||||
| Proceeds from sale and maturity of marketable securities |
|
|
|||||||||
| Purchases of property and equipment |
(
|
(
|
|||||||||
| Other investing activities |
|
|
|||||||||
| Net cash provided by (used in) investing activities |
|
(
|
|||||||||
| Financing activities | |||||||||||
| Net proceeds from issuance of common stock |
|
|
|||||||||
| Other financing activities |
(
|
(
|
|||||||||
| Net cash provided by financing activities |
|
|
|||||||||
| Effect of exchange rate changes on cash, cash equivalents and restricted cash |
(
|
|
|||||||||
| Increase (decrease) in cash, cash equivalents and restricted cash |
|
(
|
|||||||||
| Cash, cash equivalents and restricted cash, beginning of period |
|
|
|||||||||
| Cash, cash equivalents and restricted cash, end of period | $ |
|
$ |
|
|||||||
| Reconciliation of cash, cash equivalents and restricted cash, end of period: | |||||||||||
| Cash and cash equivalents | $ |
|
$ |
|
|||||||
| Restricted cash |
|
|
|||||||||
| Total cash, cash equivalents and restricted cash | $ |
|
$ |
|
|||||||
| Supplemental disclosure of non-cash investing and financing transactions: | |||||||||||
| Acquisition of property and equipment included in accounts payable and accrued liabilities | $ |
|
$ |
|
|||||||
| Right-of-use assets obtained in exchange for operating lease liabilities | $ |
|
$ |
|
|||||||
| Right-of-use assets obtained in exchange for finance lease liabilities | $ |
|
$ |
|
|||||||
See accompanying notes
8
| DexCom, Inc. | ||
| Notes to Consolidated Financial Statements | ||
| (Unaudited) | ||
| 1. Organization and Significant Accounting Policies | ||
| Organization and Business | ||
We are a medical device company primarily focused on the design, development and commercialization of continuous glucose monitoring, or CGM, systems for the management of diabetes by patients, caregivers, and clinicians around the world. Unless the context requires otherwise, the terms “we,” “us,” “our,” the “company,” or “Dexcom” refer to DexCom, Inc. and its subsidiaries.
| Basis of Presentation and Principles of Consolidation | ||
We have prepared the accompanying unaudited consolidated financial statements in accordance with U.S. generally accepted accounting principles, or GAAP, for interim financial information and with the instructions to Form 10-Q and Article 10 of Securities and Exchange Commission, or SEC, Regulation S-X. Accordingly, they do not include all of the information and disclosures required by GAAP for complete financial statements. In the opinion of management, all adjustments, which include only normal recurring adjustments considered necessary for a fair presentation, have been included.
Operating results for the three months ended March 31, 2024 are not necessarily indicative of the results that may be expected for the fiscal year ending December 31, 2024.
These consolidated financial statements should be read in conjunction with the audited consolidated financial statements and related notes thereto for the fiscal year ended December 31, 2023 included in the Annual Report on Form 10-K that we filed with the SEC on February 8, 2024.
These consolidated financial statements include the accounts of DexCom, Inc. and our wholly owned subsidiaries. All significant intercompany balances and transactions have been eliminated in consolidation.
We have reclassified certain amounts previously reported in our financial statements to conform to the current presentation.
We determine the functional currencies of our international subsidiaries by reviewing the environment where each subsidiary primarily generates and expends cash. For international subsidiaries whose functional currencies are the local currencies, we translate the financial statements into U.S. dollars using period-end exchange rates for assets and liabilities and average exchange rates for each period for revenue, costs and expenses. We include translation-related adjustments in comprehensive income and in accumulated other comprehensive loss in the equity section of our consolidated balance sheets. We record gains and losses resulting from transactions with customers and vendors that are denominated in currencies other than the functional currency and from certain intercompany transactions in other income (expense), net in our consolidated statements of operations.
| Significant Accounting Policies | ||
| Use of Estimates | ||
The preparation of consolidated financial statements in conformity with GAAP requires us to make certain estimates and assumptions that affect the amounts reported in our consolidated financial statements and the disclosures made in the accompanying notes. Areas requiring significant estimates include rebates, excess or obsolete inventories and the valuation of inventory, accruals for litigation contingencies, and the amount of our worldwide tax provision and the realizability of deferred tax assets. Despite our intention to establish accurate estimates and use reasonable assumptions, actual results may differ from our estimates.
9
| Concentration of Credit Risk | ||
Financial instruments which potentially subject us to concentrations of credit risk consist primarily of cash, cash equivalents, short-term marketable securities, and accounts receivable. We limit our exposure to credit risk by placing our cash and investments with a few major financial institutions. We have also established guidelines regarding diversification of our investments and their maturities that are designed to maintain principal and maximize liquidity. We review these guidelines periodically and modify them to take advantage of trends in yields and interest rates and changes in our operations and financial position.
|
Contract Balances
|
||
Contract balances represent amounts presented in our consolidated balance sheets when either we have transferred goods or services to the customer or the customer has paid consideration to us under the contract. These contract balances include accounts receivable and deferred revenue. Payment terms vary by contract type and type of customer and generally range from
30
to
90
days.
Accounts receivable as of March 31, 2024 included unbilled accounts receivable of $
10.1
million. We expect to invoice and collect all unbilled accounts receivable within twelve months.
We record deferred revenue when we have entered into a contract with a customer and cash payments are received or due prior to transfer of control or satisfaction of the related performance obligation.
Our performance obligations are generally satisfied within twelve months of the initial contract date. The deferred revenue balances related to performance obligations that will be satisfied after twelve months were $
7.4
million
as of March 31, 2024 and December 31, 2023. These balances are included in other long-term liabilities in our consolidated balance sheets.
Revenue recognized in the period from performance obligations satisfied in previous periods was not material for the periods presented.
| Net Income Per Share | ||
Basic net income per share attributable to common stockholders is calculated by dividing the net income attributable to common stockholders by the weighted-average number of common shares outstanding during the period. Diluted net income per share is computed using the weighted average number of common shares outstanding during the period and, when dilutive, potential common share equivalents.
Potentially dilutive common shares consist of shares issuable from restricted stock units, or RSUs, performance stock units, or PSUs, warrants, our senior convertible notes, and collaborative sales-based milestones. Potentially dilutive common shares issuable upon vesting of RSUs, PSUs, and exercise of warrants are determined using the average share price for each period under the treasury stock method. Potentially dilutive common shares issuable upon conversion of our senior convertible notes are determined using the if-converted method. In periods of net losses, we exclude all potentially dilutive common shares from the computation of the diluted net loss per share for those periods as the effect would be anti-dilutive.
10
The following table sets forth the computation of basic and diluted net income per share for the periods shown:
|
Three Months Ended
March 31, |
|||||||||||
| (In millions, except per share data) | 2024 | 2023 | |||||||||
| Net income | $ |
|
$ |
|
|||||||
| Add back interest expense, net of tax attributable to assumed conversion of senior convertible notes |
|
|
|||||||||
| Net income - diluted | $ |
|
$ |
|
|||||||
| Net income per common share | |||||||||||
| Basic | $ |
|
$ |
|
|||||||
| Diluted | $ |
|
$ |
|
|||||||
| Basic weighted average shares outstanding |
|
|
|||||||||
|
Dilutive potential securities:
|
|||||||||||
|
Collaborative sales-based milestones
|
|
|
|||||||||
|
RSUs and PSUs
|
|
|
|||||||||
| Senior convertible notes |
|
|
|||||||||
| Warrants |
|
|
|||||||||
| Diluted weighted average shares outstanding |
|
|
|||||||||
Outstanding anti-dilutive securities not included in the calculations of diluted net income per share attributable to common stockholders were as follows:
|
Three Months Ended
March 31, |
|||||||||||
| (In millions) | 2024 | 2023 | |||||||||
|
RSUs and PSUs
|
|
|
|||||||||
| Senior convertible notes |
|
|
|||||||||
| Total |
|
|
|||||||||
11
| Recent Accounting Guidance | ||
Recently Issued Accounting Pronouncements
In November 2023, the Financial Accounting Standards Board, or FASB, issued Accounting Standards Update, or ASU, 2023-07,
Segment Reporting (Topic 280): Improvements to Reportable Segment Disclosures
. The ASU expands public entities’ segment disclosures by requiring disclosure of significant segment expenses that are regularly reviewed by the chief operating decision maker, or CODM, and included within each reported measure of segment profit or loss, an amount and description of its composition for other segment items, and interim disclosures of a reportable segment’s profit or loss and assets. The ASU also allows, in addition to the measure that is most consistent with U.S. GAAP, the disclosure of additional measures of segment profit or loss that are used by the CODM in assessing segment performance and deciding how to allocate resources. All disclosure requirements under ASU 2023-07 are also required for public entities with a single reportable segment. The ASU is effective for fiscal years beginning after December 15, 2023, and interim periods within fiscal years beginning after December 15, 2024, on a retrospective basis, with early adoption permitted.
We
are currently evaluating the impact of this standard on our disclosures.
In December 2023, the FASB issued ASU 2023-09,
Improvements to Income Tax Disclosures
. The ASU requires greater disaggregation of information about a reporting entity's effective tax rate reconciliation as well as information on income taxes paid. The ASU applies to all entities subject to income taxes and is intended to help investors better understand an entity’s exposure to potential changes in jurisdictional tax legislation and assess income tax information that affects cash flow forecasts and capital allocation decisions. The ASU is effective for annual periods beginning after December 15, 2024, with early adoption permitted. The ASU should be applied on a prospective basis although retrospective application is permitted.
We
are currently evaluating the impact of this standard on our disclosures.
On March 6, 2024, the SEC adopted SEC Release Nos. 33-11275; 34-99678,
The Enhancement and Standardization of Climate-Related Disclosures for Investor,
to require the disclosure of certain climate-related information in registration statements and annual reports, including Scope 1 and 2 emissions and information about climate-related risks that have materially impacted, or are reasonably likely to have a material impact on, a company’s business strategy, results of operations, or financial condition. In addition, under the final rules, certain disclosures related to severe weather events and other natural conditions will be required in audited financial statements. The disclosure requirements will begin phasing in for our reports and registration statements including financial information in the fiscal year ending December 31, 2025. On April 4, 2024, the SEC issued an order staying the final rules until the completion of judicial review. We are currently evaluating the impact of this final rule on our disclosures.
12
| 2. Development and Other Agreements | ||
| Collaboration with Verily Life Sciences | ||
On November 20, 2018, we entered into an Amended and Restated Collaboration and License Agreement with Verily Life Sciences LLC (an Alphabet Company) and Verily Ireland Limited (collectively, “Verily”), which we refer to as the Restated Collaboration Agreement. This replaced our original Collaboration and License Agreement with Verily dated August 10, 2015, as amended in October 2016, including the royalty obligations provisions under that original agreement. Pursuant to the Restated Collaboration Agreement, we and Verily agreed to jointly develop a certain next-generation CGM product, and potentially additional CGM products, for which we will have exclusive commercialization rights.
The Restated Collaboration Agreement also provides us with an exclusive license to use intellectual property of Verily resulting from the collaboration, and certain Verily patents, in the development, manufacture and commercialization of blood-based or interstitial glucose monitoring products more generally (subject to certain exclusions, which are outside of the CGM field as it is commonly understood). It also provides us with non-exclusive license rights under Verily’s other intellectual property rights to develop, manufacture and commercialize those kinds of glucose monitoring products and certain CGM-product companion software functionalities. In connection with the Restated Collaboration Agreement, we developed, launched and commercialized a CGM product in connection with the collaboration.
In consideration of Verily’s performance of its obligations under the joint development plan of the Restated Collaboration Agreement, the licenses granted to us and the amendment of the original agreement, we made upfront, incentive, and the product regulatory approval payments, and payments for contingent sales-based milestones upon the achievement of certain revenue targets.
We account for the contingent milestones payable in shares of our common stock as equity instruments within the scope of ASC Topic 718. The product regulatory approval and sales-based milestones are accounted for as performance-based awards that vest when the performance conditions have been achieved and are recognized when the achievement of the respective contingent milestone is deemed probable. The value of the contingent milestones is based on our closing stock price on December 28, 2018, which was $
29.57
per share.
Upfront and Incentive payments
In the fourth quarter of 2018, we made an initial payment for an upfront fee of $
250.0
million through the issuance of
7.4
million shares of our common stock. We recorded a $
217.7
million charge in our consolidated statements of operations during 2018 relating to the issuance of this common stock because this milestone payment did not meet the capitalization criteria. The value of the charge was based on our closing stock price of $
29.57
per share on December 28, 2018, the date on which we obtained the necessary regulatory approvals and represents the date the performance- based awards were issued. In 2019, we made a cash incentive payment of $
3.2
million due to the completion of certain development obligations and we recorded these payments as research and development expense in our consolidated statements of operations.
Contingent milestones
In the fourth quarter of 2021, we determined the achievement of the regulatory approval milestone to be probable and recorded an $
87.1
million research and development charge in our consolidated statements of operations. This charge is associated with in-process research and development obtained in an asset acquisition prior to regulatory approval and therefore does not have an alternative future use.
In the first quarter of 2022, we received regulatory approval and issued
2.9
million shares of our common stock in connection with our achievement of the related milestone.
In the fourth quarter of 2022, we received approval from the Food and Drug Administration and determined the achievement of the sales-based milestones to be probable. As such, we capitalized the full value of the sales-based milestones, $
152.4
million, as an intangible asset. The sales-based milestones are contingent upon the achievement of certain revenue targets. The value of the sales-based milestones is based on: 1)
5.2
million shares of our common stock, as agreed upon in November 2018 and 2) our closing stock price on December 28, 2018 of $
29.57
per share. December 28, 2018 is the date on which we obtained the necessary regulatory approvals and represents the date the performance-based awards were issued. The intangible asset will be amortized using the straight-line method over its estimated useful life of
64
months through March 2028. The related amortization expense is recognized in cost of sales in our consolidated statements of operations.
13
In the fourth quarter of 2023, we issued
3.7
million shares of our common stock in connection with our achievement of the first sales-based milestone.
In the first quarter of 2024, we issued
1.5
million shares of our common stock in connection with our achievement of the second sales-based milestone.
All milestones were paid in cash or shares of our common stock, at our election.
14
| 3. Fair Value Measurements | ||
Assets and Liabilities Measured at Fair Value on a Recurring Basis
We estimate the fair value of our Level 1 financial instruments, which are in active markets, using unadjusted quoted market prices for identical instruments.
We obtain the fair values for our Level 2 financial instruments, which are not in active markets, from a primary professional pricing source that uses quoted market prices for identical or comparable instruments, rather than direct observations of quoted prices in active markets. Fair values obtained from this professional pricing source can also be based on pricing models whereby all significant observable inputs, including maturity dates, issue dates, settlement dates, benchmark yields, reported trades, broker-dealer quotes, issue spreads, benchmark securities, bids, offers or other market related data, are observable or can be derived from, or corroborated by, observable market data for substantially the full term of the asset. We validate the quoted market prices provided by our primary pricing service by comparing the fair values of our Level 2 marketable securities portfolio balance provided by our primary pricing service against the fair values provided by our investment managers.
The following table summarizes financial assets that we measured at fair value on a recurring basis as of March 31, 2024, classified in accordance with the fair value hierarchy:
| Fair Value Measurements Using | |||||||||||||||||||||||
| (In millions) | Level 1 | Level 2 | Level 3 | Total | |||||||||||||||||||
| Cash equivalents | $ |
|
$ |
|
$ |
|
$ |
|
|||||||||||||||
| Debt securities, available-for-sale: | |||||||||||||||||||||||
|
U.S. government agencies
(1)
|
|
|
|
|
|||||||||||||||||||
| Commercial paper |
|
|
|
|
|||||||||||||||||||
| Corporate debt |
|
|
|
|
|||||||||||||||||||
| Total debt securities, available-for-sale |
|
|
|
|
|||||||||||||||||||
|
Other assets
(2)
|
|
|
|
|
|||||||||||||||||||
| Total assets measured at fair value on a recurring basis | $ |
|
$ |
|
$ |
|
$ |
|
|||||||||||||||
(1)
Includes debt obligations issued by U.S. government-sponsored enterprises or U.S. government agencies.
(2)
Includes assets which are held pursuant to a deferred compensation plan for senior management, which consist mainly of mutual funds.
15
The following table summarizes financial assets that we measured at fair value on a recurring basis as of December 31, 2023, classified in accordance with the fair value hierarchy:
| Fair Value Measurements Using | |||||||||||||||||||||||
| (In millions) | Level 1 | Level 2 | Level 3 | Total | |||||||||||||||||||
| Cash equivalents | $ |
|
$ |
|
$ |
|
$ |
|
|||||||||||||||
| Debt securities, available-for-sale: | |||||||||||||||||||||||
|
U.S. government agencies
(1)
|
|
|
|
|
|||||||||||||||||||
| Commercial paper |
|
|
|
|
|||||||||||||||||||
| Corporate debt |
|
|
|
|
|||||||||||||||||||
| Total debt securities, available-for-sale |
|
|
|
|
|||||||||||||||||||
|
Other assets
(2)
|
|
|
|
|
|||||||||||||||||||
| Total assets measured at fair value on a recurring basis | $ |
|
$ |
|
$ |
|
$ |
|
|||||||||||||||
(1)
Includes debt obligations issued by U.S. government-sponsored enterprises or U.S. government agencies.
(2)
Includes assets which are held pursuant to a deferred compensation plan for senior management, which consist mainly of mutual funds.
There were
no
transfers into or out of Level 3 securities during the three months ended March 31, 2024
and
March 31, 2023.
Fair Value of Senior Convertible Notes
The fair value, based on trading prices (Level 1 inputs), of our senior convertible notes were as follows as of the dates indicated:
| Fair Value Measurements Using Level 1 | |||||||||||
| (In millions) | March 31, 2024 | December 31, 2023 | |||||||||
| Senior Convertible Notes due 2025 |
|
|
|||||||||
| Senior Convertible Notes due 2028 |
|
|
|||||||||
| Total fair value of outstanding senior convertible notes | $ |
|
$ |
|
|||||||
See Note 5 “
Debt—Senior Convertible Notes
” to the consolidated financial statements in Part I, Item I of this Quarterly Report on Form 10-Q for more information regarding the carrying values of our senior convertible notes.
Foreign Currency and Derivative Financial Instruments
We enter into foreign currency forward contracts to hedge monetary assets and liabilities denominated in foreign currencies. Our foreign currency forward contracts are not designated as hedging instruments. Therefore, changes in the fair values of these contracts are recognized in earnings, thereby offsetting the current earnings effect of the related foreign currency assets and liabilities. The duration of these contracts is generally one month. The derivative gains and losses are included in other income (expense), net in our consolidated statements of operations.
As of March 31, 2024 and December 31, 2023, the notional amounts of outstanding foreign currency forward contracts were $
80.0
million and $
71.0
million, respectively. The resulting impact on our consolidated financial statements from currency hedging activities was not significant for the three months ended March 31, 2024 and March 31, 2023.
Our foreign currency exposures vary but are primarily concentrated in the Australian Dollar, the British Pound, the Canadian Dollar, the Euro, and the Malaysian Ringgit. We monitor the costs and the impact of foreign currency risks upon our financial results as part of our risk management program. We do not use derivative financial instruments for speculation or trading purposes or for activities other than risk management. We do not require and are not required to pledge collateral for these financial instruments and we do not carry any master netting arrangements to mitigate the credit risk.
16
Assets and Liabilities Measured at Fair Value on a Non-Recurring Basis
In accordance with authoritative guidance, we measure certain non-financial assets and liabilities at fair value on a non-recurring basis. These measurements are usually performed using the discounted cash flow method or cost method and Level 3 inputs. These include items such as non-financial assets and liabilities initially measured at fair value in a business combination and non-financial long-lived assets measured at fair value for an impairment assessment. In general, non-financial assets, including goodwill, intangible assets, and property and equipment, are measured at fair value when there are indicators of impairment and are recorded at fair value only when an impairment is recognized.
We hold certain other investments that we do not measure at fair value on a recurring basis. The carrying values of these investments
are
$
39.8
million as of March 31, 2024 and $
38.5
million as of December 31, 2023. We include them in other assets in our consolidated balance sheets. It is impracticable for us to estimate the fair value of these investments on a recurring basis due to the fact that these entities are privately held and limited information is available. We monitor the information that becomes available from time to time and adjust the carrying values of these investments if there are identified events or changes in circumstances that have a significant effect on the fair values.
There were
no
significant impairment losses during the three months ended March 31, 2024 and March 31, 2023.
17
|
4. Balance Sheet Details and Other Financial Information
|
||
| Short-Term Marketable Securities | ||
Short-term marketable securities, consisting of available-for-sale debt securities, were as follows as of the dates indicated:
| March 31, 2024 | |||||||||||||||||||||||
| (In millions) |
Amortized
Cost |
Gross
Unrealized Gains |
Gross
Unrealized Losses |
Estimated
Market Value |
|||||||||||||||||||
| Debt securities, available-for-sale: | |||||||||||||||||||||||
|
U.S. government agencies
(1)
|
$ |
|
$ |
|
$ |
(
|
$ |
|
|||||||||||||||
| Commercial paper |
|
|
(
|
|
|||||||||||||||||||
| Corporate debt |
|
|
(
|
|
|||||||||||||||||||
| Total debt securities, available-for-sale | $ |
|
$ |
|
$ |
(
|
$ |
|
|||||||||||||||
(1)
Includes debt obligations issued by U.S. government-sponsored enterprises or U.S. government agencies.
| December 31, 2023 | |||||||||||||||||||||||
| (In millions) |
Amortized
Cost |
Gross
Unrealized Gains |
Gross
Unrealized Losses |
Estimated
Market Value |
|||||||||||||||||||
| Debt securities, available-for-sale: | |||||||||||||||||||||||
|
U.S. government agencies
(1)
|
$ |
|
$ |
|
$ |
(
|
$ |
|
|||||||||||||||
| Commercial paper |
|
|
(
|
|
|||||||||||||||||||
| Corporate debt |
|
|
(
|
|
|||||||||||||||||||
| Total debt securities, available-for-sale | $ |
|
$ |
|
$ |
(
|
$ |
|
|||||||||||||||
(1)
Includes debt obligations issued by U.S. government-sponsored enterprises or U.S. government agencies.
As of March 31, 2024, the estimated market value of our short-term debt securities with contractual maturities up to
12
months and up to
18
months was $
1.77
billion and $
275.6
million, respectively. As of December 31, 2023, the estimated market value of our short-term debt securities with contractual maturities up to
12
months was $
2.16
billion. Gross realized gains and losses on sales of our short-term debt securities for the three months ended March 31, 2024 and March 31, 2023 were not significant.
We periodically review our portfolio of debt securities to determine if any investment is impaired due to credit loss or other potential valuation concerns. For debt securities where the fair value of the investment is less than the amortized cost basis, we have assessed at the individual security level for various quantitative factors including, but not limited to, the nature of the investments, changes in credit ratings, interest rate fluctuations, industry analyst reports, and the severity of impairment. Unrealized losses on available-for-sale debt securities at March 31, 2024 were primarily due to increases in interest rates, including market credit spreads, and not due to increased credit risks associated with specific securities. Accordingly, we have not recorded an allowance for credit losses. We do not intend to sell these investments and it is not more likely than not that we will be required to sell the investments before recovery of their amortized cost bases, which may be at maturity.
|
Inventory
|
||
| (In millions) | March 31, 2024 | December 31, 2023 | |||||||||
| Raw materials | $ |
|
$ |
|
|||||||
| Work-in-process |
|
|
|||||||||
| Finished goods |
|
|
|||||||||
| Total inventory | $ |
|
$ |
|
|||||||
18
| Prepaid and Other Current Assets | ||
| (In millions) | March 31, 2024 | December 31, 2023 | |||||||||
| Prepaid expenses | $ |
|
$ |
|
|||||||
| Prepaid inventory |
|
|
|||||||||
| Deferred compensation plan assets |
|
|
|||||||||
| Income tax receivables |
|
|
|||||||||
| Other current assets |
|
|
|||||||||
| Total prepaid and other current assets | $ |
|
$ |
|
|||||||
|
Property and Equipment
|
||
| (In millions) | March 31, 2024 | December 31, 2023 | |||||||||
| Land and land improvements | $ |
|
$ |
|
|||||||
| Building |
|
|
|||||||||
| Furniture and fixtures |
|
|
|||||||||
| Computer software and hardware |
|
|
|||||||||
| Machinery and equipment |
|
|
|||||||||
| Leasehold improvements |
|
|
|||||||||
| Construction in progress |
|
|
|||||||||
| Total cost |
|
|
|||||||||
|
Less: accumulated depreciation and amortization
|
(
|
(
|
|||||||||
| Total property and equipment, net | $ |
|
$ |
|
|||||||
|
Other Assets
|
||
| (In millions) | March 31, 2024 | December 31, 2023 | |||||||||
| Long-term investments | $ |
|
$ |
|
|||||||
| Long-term deposits |
|
|
|||||||||
| Other assets |
|
|
|||||||||
| Total other assets | $ |
|
$ |
|
|||||||
|
Accounts Payable and Accrued Liabilities
|
||
|
(In millions)
|
March 31, 2024 | December 31, 2023 | |||||||||
| Accounts payable trade | $ |
|
$ |
|
|||||||
| Accrued tax, audit, and legal fees |
|
|
|||||||||
| Accrued rebates |
|
|
|||||||||
| Accrued warranty |
|
|
|||||||||
|
Income tax payable
|
|
|
|||||||||
| Deferred compensation plan liabilities |
|
|
|||||||||
| Other accrued liabilities |
|
|
|||||||||
| Total accounts payable and accrued liabilities | $ |
|
$ |
|
|||||||
19
|
Accrued Payroll and Related Expenses
|
||
| (In millions) | March 31, 2024 | December 31, 2023 | |||||||||
| Accrued wages, bonus and taxes | $ |
|
$ |
|
|||||||
| Other accrued employee benefits |
|
|
|||||||||
| Total accrued payroll and related expenses | $ |
|
$ |
|
|||||||
|
Other Long-Term Liabilities
|
||
| (In millions) | March 31, 2024 | December 31, 2023 | |||||||||
|
Finance lease obligations
|
$ |
|
$ |
|
|||||||
| Deferred revenue, long-term |
|
|
|||||||||
| Asset retirement obligation |
|
|
|||||||||
| Other tax liabilities |
|
|
|||||||||
| Other liabilities |
|
|
|||||||||
| Total other long-term liabilities | $ |
|
$ |
|
|||||||
|
Other Income (Expense), Net
|
||
|
Three Months Ended
March 31, |
|||||||||||
| (In millions) | 2024 | 2023 | |||||||||
|
Interest and dividend income
|
$ |
|
$ |
|
|||||||
|
Interest expense
|
(
|
(
|
|||||||||
|
Other expense, net
|
(
|
(
|
|||||||||
|
Total other income (expense), net
|
$ |
|
$ |
|
|||||||
20
| 5. Debt | ||
| Senior Convertible Notes | ||
The carrying amounts of our senior convertible notes were as follows as of the dates indicated:
| (In millions) | March 31, 2024 | December 31, 2023 | |||||||||
| Principal amount: | |||||||||||
| Senior Convertible Notes due 2025 |
|
|
|||||||||
| Senior Convertible Notes due 2028 |
|
|
|||||||||
| Total principal amount |
|
|
|||||||||
| Unamortized debt issuance costs |
(
|
(
|
|||||||||
| Carrying amount of senior convertible notes | $ |
|
$ |
|
|||||||
For our senior convertible notes for which the if-converted value exceeded the principal amount, the amount in excess of principal was as follows as of the dates indicated:
| (In millions) | March 31, 2024 | December 31, 2023 | |||||||||
| Senior Convertible Notes due 2025 |
|
|
|||||||||
| Senior Convertible Notes due 2028 |
|
|
|||||||||
|
Total by which the notes
’
if-converted value exceeds their principal amount
|
$ |
|
$ |
|
|||||||
The following table summarizes the components of interest expense and the effective interest rates for our senior convertible notes for the periods shown:
|
Three Months Ended
March 31, |
|||||||||||
| (In millions) | 2024 | 2023 | |||||||||
| Cash interest expense: | |||||||||||
|
Contractual coupon interest
(1)
|
$ |
|
$ |
|
|||||||
| Non-cash interest expense: | |||||||||||
| Amortization of debt issuance costs |
|
|
|||||||||
| Total interest expense recognized on senior notes | $ |
|
$ |
|
|||||||
| Effective interest rate: | |||||||||||
|
Senior Convertible Notes due 2023
(2)
|
* |
|
% | ||||||||
| Senior Convertible Notes due 2025 |
|
% |
|
% | |||||||
| Senior Convertible Notes due 2028 |
|
% | * | ||||||||
|
(1)
Interest on our unsecured senior convertible notes due 2023, or the 2023 Notes, began accruing upon issuance and was payable semi-annually on June 1 and December 1 of each year until the 2023 Notes matured on December 1, 2023. Interest on our unsecured senior convertible notes due 2025, or the 2025 Notes, began accruing upon issuance and is payable semi-annually on May 15 and November 15 of each year. Interest on our unsecured senior convertible notes due 2028, or the 2028 Notes, began accruing upon issuance and is payable semi-annually on May 15 and November 15 of each year.
|
|||||||||||
|
(2)
The effective interest rate presented represents the rate applicable for the period outstanding. The 2023 Notes matured on December 1, 2023 and are no longer outstanding.
|
|||||||||||
|
* Not applicable as no notes were outstanding at this date.
|
|||||||||||
21
Convertible Debt Summary
The following table summarizes the key details for the 2023 Notes, 2025 Notes, and 2028 Notes:
|
Senior Convertible Notes
|
Offering Completion Date
|
Maturity Date
|
Stated Interest Rate
|
Aggregate Principal Amount Issued
|
Net Proceeds
(1)
|
Initial Conversion Rate
(2)
(per $1,000 principal amount)
|
Conversion Price
(per share)
|
Settlement Methods
(3)
|
||||||||||||||||||
|
2023 Notes
(4)
|
November 2018
|
December 1, 2023
|
|
$
|
$
|
24.3476 shares
|
$
|
Cash and/or shares
|
||||||||||||||||||
|
2025 Notes
|
May 2020
|
November 15, 2025
|
|
$
|
$
|
6.6620 shares
|
$
|
Cash and/or shares
|
||||||||||||||||||
|
2028 Notes
|
May 2023
|
May 15, 2028
|
|
$
|
$
|
6.1571 shares
|
$
|
Cash and/or shares
|
||||||||||||||||||
|
(1)
Net proceeds is calculated by deducting the initial purchasers’ discounts and estimated costs directly related to the offering from the aggregate principal amount of the applicable series of notes.
|
||||||||||||||||||||||||||
|
(2)
Subject to adjustments as defined in the applicable indentures.
|
||||||||||||||||||||||||||
|
(3)
The 2025 Notes and 2028 Notes may be settled in cash, stock, or a combination thereof, solely at our discretion. The 2023 Notes, while outstanding, could be settled in cash, stock, or a combination thereof, solely at our discretion.
|
||||||||||||||||||||||||||
|
(4)
The 2023 Notes matured on December 1, 2023 and are no longer outstanding.
|
||||||||||||||||||||||||||
We use the if-converted method for assumed conversion of our senior convertible notes to compute the weighted average shares of common stock outstanding for diluted earnings per share.
No principal payments are due on the senior convertible notes prior to maturity. Other than restrictions relating to certain fundamental changes and consolidations, mergers or asset sales and customary anti-dilution adjustments, the indenture relating to our senior convertible notes include customary terms and covenants, including certain events of default after which the senior convertible notes may be due and payable immediately.
2023 Note Hedge
In connection with the offering of the 2023 Notes, in November 2018 we entered into convertible note hedge transactions, or the 2023 Note Hedge, with
two
of the initial purchasers of the 2023 Notes, which we refer to as the 2023 Counterparties, entitling us to purchase up to
20.7
million shares of our common stock. The 2023 Note Hedge expired on December 1, 2023. See below for a description of conversion activity related to the 2023 Notes and shares received as the result of exercising the remaining portion of the 2023 Note Hedge in 2023.
2023 Warrants
In November 2018, we also sold warrants, or the 2023 Warrants, to the 2023 Counterparties to acquire up to
20.7
million shares of our common stock. The 2023 Warrants require net share settlement and a pro-rated number of warrants will expire on each of the
60
scheduled trading days starting on March 1, 2024. We received $
183.8
million in cash proceeds from the sale of the 2023 Warrants, which we recorded in additional paid-in capital during 2018. The 2023 Warrants could have a dilutive effect on our earnings per share to the extent that the price of our common stock during a given measurement period exceeds the strike price of the 2023 Warrants. The strike price of the 2023 Warrants was initially $
49.60
per share, subject to certain adjustments under the terms of the warrant agreements. We use the treasury share method for assumed conversion of the 2023 Warrants when computing the weighted average common shares outstanding for diluted earnings per share.
On February 13, 2024, we entered into a warrant termination agreement with one of the 2023 Counterparties to terminate outstanding warrants to purchase an aggregate of
10.3
million shares of common stock. In consideration of the termination of these warrants, we delivered
6.0
million shares of our common stock to the holder.
During the first quarter of 2024, a portion of the 2023 Warrants was exercised and we issued
1.9
million shares of our common stock in addition to the aforementioned
6.0
million shares issued in connection with the warrant termination agreement.
22
2028 Capped Call Transactions
In May 2023, in connection with the offering of the 2028 Notes, we entered into privately negotiated capped call transactions, or the 2028 Capped Calls, with certain financial institutions. The 2028 Capped Calls cover, subject to anti-dilution adjustments substantially similar to those applicable to the 2028 Notes, the number of shares of our common stock initially underlying the 2028 Notes. The 2028 Capped Calls are expected generally to reduce potential dilution to our common stock upon conversion of the 2028 Notes and/or offset any cash payments that we are required to make in excess of the principal amount of converted 2028 Notes, as the case may be, with such reduction and/or offset subject to a cap. The 2028 Capped Calls have an initial cap price of $
212.62
per share, subject to adjustments, which represents a premium of
80
% over the closing price of our common stock of $
118.12
per share on the Nasdaq Global Select Market on May 2, 2023. The cost to purchase the 2028 Capped Calls of $
101.3
million was recorded as a reduction to additional paid-in capital in our consolidated balance sheets as the 2028 Capped Calls met the criteria for classification in stockholders’ equity.
Conversion Activity for Senior Convertible Notes
The 2023 Notes matured on December 1, 2023 and all outstanding principal was settled.
There was no conversion activity for the 2025 Notes or 2028 Notes for the three months ended March 31, 2024
.
See the following table for the details of conversion activity for the 2023 Notes for the fiscal year ended December 31, 2023:
|
Fiscal Period
|
Converted Notes
|
Aggregate Principal Amount Converted
|
Shares Issued for Settlement
|
Shares Received from Exercise of 2023 Note Hedge
|
||||||||||
|
1/1/2023 - 12/31/2023
|
2023 Notes
|
$
|
|
|
||||||||||
23
Conversion Rights for Senior Convertible Notes
Holders of our outstanding senior convertible notes have the right to require us to repurchase for cash all or a portion of their notes at
100
% of their principal amount, plus any accrued and unpaid interest, upon the occurrence of a fundamental change (as defined in the applicable indenture relating to the notes). We are also required to increase the conversion rate for holders who convert their notes in connection with certain fundamental changes occurring prior to the maturity date or following the delivery by Dexcom of a notice of redemption.
The following table outlines the conversion options related for each of our senior convertible notes:
|
Summary of Conversions Rights at the Option of the Holders for the 2025 Notes and 2028 Notes, which we refer to collectively as the Notes
|
||||||||
|
Conversion Rights at the Option of the Holders
|
Holders of the Notes have the ability to convert all or a portion of their notes in multiples of $1,000 principal amount, at their option prior to 5:00 p.m., New York City time, on the business day immediately preceding August 15, 2025 and February 15, 2028 for the 2025 Notes and 2028 Notes, respectively, only under the following circumstances:
|
|||||||
|
Circumstance 1
(1)
|
During any calendar quarter commencing after the applicable period (and only during such calendar quarter), if the last reported sale price of Dexcom’s common stock for at least
|
|||||||
|
Circumstance 2
|
During the
|
|||||||
|
Circumstance 3
|
If we call any or all of the Notes for redemption, at any time prior to the close of business on the scheduled trading day immediately preceding the redemption date (only with respect to the notes called or deemed called for redemption)
|
|||||||
|
Circumstance 4
|
Upon the occurrence of specified corporate events
|
|||||||
|
Circumstance 5
(2)
|
Holders of the Notes may convert all or a portion of their Notes regardless of the foregoing circumstances prior to the close of business on the business day immediately preceding the maturity date for the 2025 Notes and prior to the close of business on the second scheduled trading day immediately preceding the maturity date for the 2028 Notes
|
|||||||
|
(1)
Circumstance 1 is available after the calendar quarter ended September 30, 2020 and September 30, 2023 for the 2025 Notes and 2028 Notes, respectively.
|
||||||||
|
(2)
Circumstance 5 is available on or after August 15, 2025 and February 15, 2028 for the 2025 Notes and 2028 Notes, respectively.
|
||||||||
|
Summary of Conversion Right at the Option of the Company for the 2025 Notes and 2028 Notes
|
||||||||
|
Conversion Right at Our Option
(1)
|
Dexcom may redeem for cash all or part of the Notes, at its option, if the last reported sale price of our common stock has been at least
|
|||||||
|
(1)
Dexcom does not have the right to redeem the Notes prior to May 20, 2023 and May 20, 2026 for the 2025 Notes and 2028 Notes, respectively. Dexcom has the right to redeem the notes on or after May 20, 2023 and prior to August 15, 2025 for the 2025 Notes, and on or after May 20, 2026 and prior to February 15, 2028 for the 2028 Notes.
|
||||||||
24
| Revolving Credit Agreement | ||
Terms of the Revolving Credit Agreement
In June 2023, we entered into the First Amendment to the Second Amended and Restated Credit Agreement, as amended, or the Amended Credit Agreement, which we had previously entered into in October 2021. The Amended Credit Agreement is a
five-year
revolving credit facility, or the Credit Facility, that provides for an available principal amount of $
200.0
million which can be increased up to $
500.0
million at our option subject to customary conditions and approval of our lenders. The Amended Credit Agreement will mature on October 13, 2026. Borrowings under the Amended Credit Agreement are available for general corporate purposes, including working capital and capital expenditures.
Information related to availability and outstanding borrowings on our Amended Credit Agreement is as follows as of the date indicated:
| (In millions) | March 31, 2024 | ||||
| Available principal amount |
|
||||
| Letters of credit sub-facility |
|
||||
| Outstanding borrowings |
|
||||
| Outstanding letters of credit |
|
||||
| Total available balance | $ |
|
|||
Revolving loans under the Amended Credit Agreement bear interest at our choice of one of three base rates plus a range of applicable rates that are based on our leverage ratio.
The minimum and maximum range of applicable rates per annum with respect to any ABR Loan, Term Benchmark Revolving Loan, or RFR Revolving Loan, each as defined in the Amended Credit Agreement under the captions “ABR Spread”, “Term Benchmark/CDOR Spread”, and “RFR Spread”, or “Unused Commitment Fee Rate”, respectively, are outlined in the following table:
|
Range
|
ABR Spread
|
Term Benchmark/CDOR Spread and RFR Spread
|
Unused Commitment Fee Rate
|
||||||||
|
Minimum
|
|
|
|
||||||||
|
Maximum
|
|
|
|
||||||||
Our obligations under the Amended Credit Agreement are guaranteed by our existing and future wholly-owned domestic subsidiaries, and are secured by a first-priority security interest in substantially all of the assets of Dexcom and the guarantors, including all or a portion of the equity interests of our domestic subsidiaries and first-tier foreign subsidiaries but excluding real property and intellectual property (which is subject to a negative pledge). The Amended Credit Agreement contains covenants that limit certain indebtedness, liens, investments, transactions with affiliates, dividends and other restricted payments, subordinated indebtedness and amendments to subordinated indebtedness documents, and sale and leaseback transactions of Dexcom or any of its domestic subsidiaries. The Amended Credit Agreement also requires us to maintain a maximum leverage ratio and a minimum fixed charge coverage ratio. We were in compliance with these covenants as of March 31, 2024.
As of March 31, 2024, we have no other material guarantee facilities or lines of credit.
25
| 6. Contingencies | ||
| Litigation | ||
We are subject to various claims, complaints and legal actions that arise from time to time in the normal course of business, including commercial insurance, product liability, intellectual property and employment related matters. In addition, from time to time we may bring claims or initiate lawsuits against various third parties with respect to matters arising out of the ordinary course of our business, including commercial and employment related matters.
Between June 2021 through the three months ended March 31, 2024, we and certain Abbott Diabetes Care, Inc. (“Abbott”) entities have served patent infringement complaints against each other in multiple jurisdictions against certain continuous glucose monitoring products of each company.
Abbott’s patent infringement trial, “D1”, against Dexcom commenced in the U.S.D.C., District of Delaware in March 2024. In the lead up to trial, the U.S.D.C., District of Delaware invalidated one of Abbott’s patents on factory calibration and Abbott dropped four other patents from the litigation. The claims litigated were isolated to the inserter mechanism and the wearable seal and mount of Dexcom’s G6. On March 22, 2024, a jury returned a mixed verdict. The jury found that Dexcom infringes one patent, that Dexcom did not infringe a second patent, and that Dexcom also did not infringe a third patent, which the jury also found invalid. The jury found that any infringement was not willful. It could not reach unanimity as to a fourth patent. No determination of damages was made or awarded by the jury. Dexcom will challenge the sole finding of infringement and continue to defend itself vigorously.
We analyzed the potential for a loss from this litigation in accordance with ASC 450, Contingencies. We believe it is not probable that we will have an unfavorable outcome and incur a material loss contingency due to our beliefs about our position in the case. In addition, the jury did not award damages for the one patent they believe we infringed nor can we reasonably estimate the amount of loss we would incur if we do not prevail. As a result, we have not recorded an accrual for a contingent liability.
Due to uncertainty surrounding the other patent litigation procedures initiated by Dexcom and Abbott throughout multiple jurisdictions, we are unable to reasonably estimate the ultimate outcome of any of the litigation matters at this time. We intend to protect our intellectual property and defend against Abbott’s claims vigorously in all of these actions.
We do not believe we are party to any other currently pending legal proceedings, the outcome of which could have a material adverse effect on our business, financial condition, or results of operations. There can be no assurance that existing or future legal proceedings arising in the ordinary course of business or otherwise will not have a material adverse effect on our business, financial condition, or results of operations.
| 7. Income Taxes | ||
We estimate our annual effective tax rate to be
23.8
% for the full year 2024, which differs from the U.S. federal statutory rate due to state and foreign income taxes and nondeductible executive compensation, partially offset by federal tax credits generated. Our negative effective tax rate of
10.5
% for the three months ended March 31, 2024 was primarily due to income tax expense from normal, recurring operations, offset by tax benefits recognized for share-based compensation for employees, net of disallowed executive compensation, and the Verily milestone payment.
The Organization for Economic Co-operation and Development has a framework to implement a global minimum corporate tax of 15% for companies with global revenues and profits above certain thresholds (referred to as Pillar 2), with certain aspects of Pillar 2 effective January 1, 2024 and other aspects effective January 1, 2025. While it is uncertain whether the United States will enact legislation to adopt Pillar 2, certain countries in which we operate have adopted legislation, and other countries in which we operate are in the process of introducing legislation to implement Pillar 2. We have assessed the impact of Pillar 2 and the impact is immaterial.
In January 2024, the California Franchise Tax Board commenced an audit of our California income tax returns for the 2020 and 2021 years primarily related to our research and development tax credit carryforwards. We do not expect any significant adjustments as a result of the audit.
26
| 8. Stockholders’ Equity | ||
Share-Based Compensation
Our share-based compensation expense is associated with RSUs, PSUs, and our Employee Stock Purchase Plan, or ESPP. The following table summarizes our share-based compensation expense included in our consolidated statements of operations for the periods shown:
|
Three Months Ended
March 31, |
|||||||||||
| (In millions) | 2024 | 2023 | |||||||||
| Cost of sales | $ |
|
$ |
|
|||||||
| Research and development |
|
|
|||||||||
| Selling, general and administrative |
|
|
|||||||||
| Total share-based compensation expense | $ |
|
$ |
|
|||||||
As of March 31, 2024, unrecognized estimated compensation costs related to RSUs and PSUs totaled $
362.5
million and are expected to be recognized over a weighted-average period of approximately
2.2
years.
Treasury Shares
In the first quarter of 2024, we issued
7.9
million treasury shares to settle a portion of the 2023 Warrants. See Note 5 “
Debt—Senior Convertible Notes
” to the consolidated financial statements for more information.
In the first quarter of 2024, we issued
1.5
million treasury shares in connection with our achievement of the second sales-based milestone under the Restated Collaboration Agreement. See Note 2 “
Development and Other Agreements—Collaboration with Verily Life Sciences
” to the consolidated financial statements for more information.
Repurchased shares of our common stock are held as treasury shares until they are reissued or retired. We have not yet determined the ultimate disposition of repurchased shares and consequently we continue to hold them as treasury shares rather than retiring them. Authorization of future stock repurchase programs is subject to the final determination of our Board of Directors.
27
| 9. Business Segment and Geographic Information | ||
Reportable Segments
An operating segment is identified as a component of a business that has discrete financial information available and for which the CODM must decide the level of resource allocation. In addition, the guidance for segment reporting indicates certain quantitative materiality thresholds. None of the components of our business meet the definition of an operating segment.
We currently consider our operations to be, and manage our business globally within,
one
reportable segment, which is consistent with how our President and Chief Executive Officer, who is our CODM, reviews our business, makes investment and resource allocation decisions, and assesses operating performance.
Disaggregation of Revenue
We disaggregate revenue by geographic region and by major sales channel. We have determined that disaggregating revenue into these categories achieves the ASC Topic 606 disclosure objectives of depicting how the nature, amount, timing and uncertainty of revenue and cash flows are affected by economic factors.
Revenue by geographic region
During the three months ended March 31, 2024 and March 31, 2023, no individual country outside the United States generated revenue that represented more than 10% of our total revenue.
The following table sets forth revenue by our
two
primary geographical markets, the United States and International, based on the geographic location to which we deliver the components, for the periods shown:
|
Three Months Ended
March 31, 2024 |
Three Months Ended
March 31, 2023 |
||||||||||||||||||||||
| (In millions) | Amount | % of Total | Amount | % of Total | |||||||||||||||||||
| United States | $ |
|
|
% | $ |
|
|
% | |||||||||||||||
| International |
|
|
% |
|
|
% | |||||||||||||||||
| Total revenue | $ |
|
|
% | $ |
|
|
% | |||||||||||||||
Revenue by customer sales channel
We sell our CGM systems through a direct sales organization and through distribution arrangements that allow distributors to sell our products.
The following table sets forth revenue by major sales channel for the periods shown:
|
Three Months Ended
March 31, 2024 |
Three Months Ended
March 31, 2023 |
||||||||||||||||||||||
| (In millions) | Amount | % of Total | Amount | % of Total | |||||||||||||||||||
| Distributor | $ |
|
|
% | $ |
|
|
% | |||||||||||||||
| Direct |
|
|
% |
|
|
% | |||||||||||||||||
| Total revenue | $ |
|
|
% | $ |
|
|
% | |||||||||||||||
28
|
ITEM 2 - MANAGEMENT’S DISCUSSION AND ANALYSIS OF FINANCIAL CONDITION AND RESULTS OF OPERATIONS
|
||
This Quarterly Report on Form 10-Q, including the following Management’s Discussion and Analysis of Financial Condition and Results of Operations, contains forward-looking statements that are not purely historical regarding Dexcom’s or its management’s intentions, beliefs, expectations and strategies for the future. These forward-looking statements fall within the meaning of the federal securities laws that relate to future events or our future financial performance. In some cases, you can identify forward-looking statements by terminology such as “may,” “will,” “expect,” “plan,” “anticipate,” “believe,” “estimate,” “intend,” “potential” or “continue” or the negative of these terms or other comparable terminology. Forward-looking statements are made as of the date of this Quarterly Report on Form 10-Q, deal with future events, are subject to various risks and uncertainties, and actual results could differ materially from those anticipated in the forward looking statements. The risks and uncertainties that could cause actual results to differ materially are more fully described under “Risk Factors” in our Annual Report on Form 10-K for the fiscal year ended December 31, 2023 filed with the SEC on February 8, 2024, together with any updates identified under “Risk Factors” in
our Annual Report on Form 10-K for the fiscal year ended December 31, 2023 filed with the SEC on February 8, 2024, together with any updates identified under “Risk Factors” in
Part II, Item 1A of this Quarterly Report on Form 10-Q, elsewhere in this Quarterly Report on Form 10-Q, and in our other reports filed with the SEC. We assume no obligation to update any of the forward-looking statements after the date of this report or to conform these forward-looking statements to actual results. You should read the following discussion and analysis together with our consolidated financial statements and related notes in Part I, Item 1 of this Quarterly Report on Form 10-Q.
| Overview | ||
| Who We Are | |||||
|
We are a medical device company primarily focused on the design, development and commercialization of continuous glucose monitoring, or CGM, systems for the management of diabetes by patients, caregivers, and clinicians around the world.
We received approval from the Food and Drug Administration, or FDA, and commercialized our first product in 2006. We launched our latest generation system, the Dexcom G6
®
integrated Continuous Glucose Monitoring System, or G6, in 2018, and we launched the Dexcom G7
®
, or G7,
in 2023. In March 2024, we received marketing clearance from the FDA on Stelo, our new 15-day sensor designed for people with Type 2 diabetes who do not use insulin, as the first glucose biosensor that does not require a prescription.
Unless the context requires otherwise, the terms “we,” “us,” “our,” the “company,” or “Dexcom” refer to DexCom, Inc. and its subsidiaries.
|
|||||
| Global Presence | |||||
|
We have built a direct sales organization in North America and certain international markets to call on health care professionals, such as endocrinologists, physicians and diabetes educators, who can educate and influence patient adoption of continuous glucose monitoring. To complement our direct sales efforts, we have entered into distribution arrangements in North America and several international markets that allow distributors to sell our products.
|
|||||
| Future Developments | |||||
|
Product Development:
We plan to develop future generations of technologies that are focused on improved performance and convenience and that will enable intelligent insulin administration. Over the longer term, we plan to continue to develop and improve networked platforms with open architecture, connectivity and transmitters capable of communicating with other devices. We also intend to expand our efforts to accumulate CGM patient data and metrics and apply predictive modeling and machine learning to generate interactive CGM insights that can inform patient behavior.
|
|||||
|
Partnerships:
We also continue to pursue and support development partnerships with insulin pump companies and companies or institutions developing insulin delivery systems, including automated insulin delivery systems.
|
|||||
|
New Opportunities:
We are also exploring how to extend our offerings to other opportunities, including for people with Type 2 diabetes that are non-insulin using, people with pre-diabetes, people who are obese, people who are pregnant, and people in the hospital setting. Eventually, we may apply our technological expertise to products beyond glucose monitoring.
|
|||||
29
| Critical Accounting Estimates | ||
The discussion and analysis of our financial condition and results of operations are based on our consolidated financial statements, which we have prepared in accordance with GAAP. The preparation of these consolidated financial statements requires us to make estimates and assumptions that affect the reported amounts of assets and liabilities and the disclosure of contingent assets and liabilities at the date of the consolidated financial statements as well as the reported revenue and expenses during the reporting periods. On an ongoing basis, we evaluate our estimates and judgments. We base our estimates on historical experience and on various other factors that we believe are reasonable under the circumstances, the results of which form the basis for making judgments about the carrying value of assets and liabilities that are not readily apparent from other sources. Actual results may differ from these estimates under different assumptions or conditions.
We believe that the estimates, assumptions and judgments involved in the accounting policies described in “
Management’s Discussion and Analysis of Financial Condition and Results of Operations
” in Part II, Item 7 of our Annual Report on Form 10-K for the fiscal year ended December 31, 2023, have the greatest potential impact on our financial statements, so we consider them to be our critical accounting policies and estimates. There were no material changes to our critical accounting estimates during the three months ended March 31, 2024.
| Overview of Financial Results | ||||||||||||||||||||||||||||||||||||||
|
The most important financial indicators that we use to assess our business are revenue, gross profit, operating income, net income, and operating cash flow.
|
||||||||||||||||||||||||||||||||||||||
|
Key Highlights for the Three Months Ended March 31, 2024 include the following:
|
||||||||||||||||||||||||||||||||||||||
| Revenue | Gross Profit | Operating Income | Net Income |
Operating
Cash Flow |
||||||||||||||||||||||||||||||||||
| $921.0 million | $561.9 million | $101.1 million | $146.4 million | $209.2 million | ||||||||||||||||||||||||||||||||||
|
up 24% from the same period 2023
|
up 21% from the same period 2023
|
up 114% from the same period 2023
|
up 201% from the same period 2023
|
up 35% from the same period 2023
|
||||||||||||||||||||||||||||||||||
We ended the first quarter of 2024 with cash, cash equivalents and short-term marketable securities totaling $2.90 billion.
30
| Results of Operations | ||
| Financial Overview | ||
|
Three Months Ended March 31, 2024 Compared to Three Months Ended March 31, 2023
|
|||||||||||||||||||||||||||||||||||
| Three Months Ended March 31, | 2024 - 2023 | ||||||||||||||||||||||||||||||||||
| (In millions, except per share amounts) | 2024 |
% of Revenue
(1)
|
2023 |
% of Revenue
(1)
|
$ Change | % Change | |||||||||||||||||||||||||||||
| Revenue | $ | 921.0 | 100 | % | $ | 741.5 | 100 | % | $ | 179.5 | 24 | % | |||||||||||||||||||||||
| Cost of sales | 359.1 | 39 | % | 278.9 | 38 | % | 80.2 | 29 | % | ||||||||||||||||||||||||||
| Gross profit | 561.9 | 61.0 | % | 462.6 | 62.4 | % | 99.3 | 21 | % | ||||||||||||||||||||||||||
| Operating expenses: | |||||||||||||||||||||||||||||||||||
| Research and development | 141.5 | 15 | % | 119.0 | 16 | % | 22.5 | 19 | % | ||||||||||||||||||||||||||
| Selling, general and administrative | 319.3 | 35 | % | 296.4 | 40 | % | 22.9 | 8 | % | ||||||||||||||||||||||||||
| Total operating expenses | 460.8 | 50 | % | 415.4 | 56 | % | 45.4 | 11 | % | ||||||||||||||||||||||||||
| Operating income | 101.1 | 11 | % | 47.2 | 6 | % | 53.9 | 114 | % | ||||||||||||||||||||||||||
| Other income (expense), net | 31.4 | 3 | % | 17.3 | 2 | % | 14.1 | 82 | % | ||||||||||||||||||||||||||
| Income before income taxes | 132.5 | 14 | % | 64.5 | 9 | % | 68.0 | ** | |||||||||||||||||||||||||||
| Income tax expense (benefit) | (13.9) | (2) | % | 15.9 | 2 | % | (29.8) | ** | |||||||||||||||||||||||||||
| Net income | $ | 146.4 | 16 | % | $ | 48.6 | 7 | % | $ | 97.8 | 201 | % | |||||||||||||||||||||||
| Basic net income per share | $ | 0.38 | ** | $ | 0.13 | ** | $ | 0.25 | ** | ||||||||||||||||||||||||||
| Diluted net income per share | $ | 0.36 | ** | $ | 0.12 | ** | $ | 0.24 | ** | ||||||||||||||||||||||||||
|
(1)
The sum of the individual percentages may not equal the total due to rounding.
|
|||||||||||||||||||||||||||||||||||
|
** Not meaningful
|
|||||||||||||||||||||||||||||||||||
Revenue
We generate our revenue from the sale of disposable sensors and our reusable transmitter and receiver, collectively referred to as Reusable Hardware.
We expect that the revenue we generate from the sales of our products will fluctuate from quarter to quarter. We typically experience seasonality, with lower sales in the first quarter of each year compared to the immediately preceding fourth quarter. This seasonal sales pattern relates to U.S. annual insurance deductible resets and unfunded flexible spending accounts.
Cost of sales
Cost of sales includes direct labor and materials costs related to each product sold or produced, including assembly, test labor and scrap, as well as factory overhead supporting our manufacturing operations. Factory overhead includes facilities, material procurement and control, manufacturing engineering, quality assurance, supervision and management. These costs are primarily salary, fringe benefits, share-based compensation, facility expense, supplies and purchased services. All of our manufacturing costs are included in cost of sales. In addition, amortization of certain licensing related intangibles are also included in cost of sales.
Research and development
Our research and development expenses primarily consist of engineering and research expenses related to our sensing technology, clinical trials, regulatory expenses, quality assurance programs, employee compensation, and business process outsourcers.
Amortization of intangible assets
Our amortization expense primarily relates to acquired technology and intellectual property and other acquired intangible assets.
31
Selling, general and administrative
Our selling, general and administrative expenses primarily consist of employee compensation for our executive, financial, sales, marketing, information technology and administrative functions. Other significant expenses include commissions, marketing and advertising, IT software license costs, insurance, professional fees for our outside legal counsel and independent auditors, litigation expenses, patent application expenses and consulting expenses.
Income from equity investments
Income from equity investments is comprised of realized gains from the sale of an equity investment.
Other income (expense), net
Other income (expense), net consists primarily of interest and dividend income on our cash, cash equivalents and short-term marketable securities portfolio, foreign currency transaction gains and losses due to the effects of foreign currency fluctuations, and interest expense related to our senior convertible notes.
32
|
Three Months Ended March 31, 2024 Compared to Three Months Ended March 31, 2023
|
||||||||||||||

| Three Months Ended March 31, | 2024 - 2023 | |||||||||||||||||||||||||||||||||||||
| 2024 | 2023 | Change in Revenues | ||||||||||||||||||||||||||||||||||||
| (In millions) | Revenue | % of Total | Revenue | % of Total | $ |
%
|
||||||||||||||||||||||||||||||||
|
United States
|
$ | 653.2 | 71% | $ | 526.0 | 71% | $ | 127.2 | 24% | |||||||||||||||||||||||||||||
| International | 267.8 | 29% | 215.5 | 29% | 52.3 | 24% | ||||||||||||||||||||||||||||||||
| Total Revenue | $ | 921.0 | 100% | $ | 741.5 | 100% | $ | 179.5 | 24% | |||||||||||||||||||||||||||||
|
Three Months Ended March 31, 2024 Compared to
Three Months Ended March 31, 2023
|
||||||||||||||||||||||||||||||||||||||
| Revenue |
The revenue increase was primarily driven by increased sales volume of our disposable sensors due to the continued growth of our worldwide customer base. We added approximately 600,000 users to our worldwide customer base in 2023.
Disposable sensor and other revenue comprised approximately 93% of total revenue and Reusable Hardware revenue comprised approximately 7% of total revenue for the three months ended March 31, 2024. Disposable sensor and other revenue comprised approximately 88% of total revenue and Reusable Hardware revenue comprised approximately 12% of total revenue for the three months ended March 31, 2023.
|
|||||||||||||||||||||||||||||||||||||
| Cost of sales & Gross profit |
Cost of sales and gross profit increased primarily due to an increase in sales volume driven by the addition of approximately 600,000 users to our worldwide customer base in 2023.
The decrease in gross profit margin percentage in the first quarter of 2024 compared to the first quarter of 2023 was primarily driven by product and channel mix changes.
|
|||||||||||||||||||||||||||||||||||||
33
|
|
Three Months Ended March 31, 2024 Compared to
Three Months Ended March 31, 2023
|
|||||||
| Research and development expense |
Research and development expense increased primarily due to $6.8 million in compensation-related costs most notably due to higher headcount, $5.0 million in supplies and other support costs, and $3.2 million in clinical trials costs.
We continue to believe that focused investments in research and development are critical to our future growth and competitive position in the marketplace, and to the development of new and updated products and services that are central to our core business strategy.
|
|||||||
| Selling, general and administrative expense |
Selling, general and administrative expense increased primarily due to $16.0 million in compensation-related costs most notably due to higher headcount, $5.9 million of travel related expenses, and $2.5 million related to the divestiture of certain non-CGM assets, partially offset by $9.6 million in lower advertising and marketing costs.
|
|||||||
| Other income (expense), net |
Other income (expense), net, increased primarily due to $14.0 million in interest and dividend income on our cash, cash equivalents, and marketable securities portfolio. The increase in interest income was related to a change in market interest rates, as well as an increase in the average invested balances compared to the same period in 2023.
|
|||||||
| Income tax expense (benefit) |
The income tax benefit recorded for the three months ended March 31, 2024 was primarily attributable to income tax expense from normal, recurring operations
at an estimated annual effective tax rate of 23.8%, offset by discrete excess tax benefits recognized for share-based compensation for employees, net of disallowed executive compensation and the Verily milestone payment.
The income tax expense recorded for the three months ended March 31, 2023 was primarily attributable to income tax expense from normal, recurring operations, partially offset by discrete excess tax benefits recognized for share-based compensation for employees, net of disallowed executive compensation. The decrease in our effective tax rate for the three months ended March 31, 2024 compared to the same period in 2023 is primarily attributable to impacts of the prior year tax restructuring and the Verily milestone payment.
|
|||||||
34
| Liquidity and Capital Resources | ||
| Overview, Capital Resources, and Capital Requirements | ||
Our principal sources of liquidity are our existing cash, cash equivalents and marketable securities, cash generated from operations, proceeds from our senior convertible notes issuances, and access to our Credit Facility. Our primary uses of cash have been for research and development programs, selling and marketing activities, capital expenditures, acquisitions of businesses, and debt service costs.
We expect that cash provided by our operations may fluctuate in future periods as a result of a number of factors, including fluctuations in our operating results, working capital requirements and capital deployment decisions. We have historically invested our cash primarily in U.S. dollar-denominated, investment grade, highly liquid obligations of U.S. government agencies, commercial paper, corporate debt, and money market funds. Certain of these investments are subject to general credit, liquidity and other market risks. The general condition of the financial markets and the economy may increase those risks and may affect the value and liquidity of investments and restrict our ability to access the capital markets.
Our future capital requirements will depend on many factors, including but not limited to:
|
The evolution of the international expansion of our business and the revenue generated by sales of our approved products and any future products;
|
Our ability to efficiently scale our operations to meet demand for our current and any future products; | The success of our research and development efforts; | |||||||||||||||||||||
| The expenses we incur in manufacturing, developing, selling and marketing our products; | The costs, timing and risks of delays of additional regulatory approvals; | The costs of filing, prosecuting, defending and enforcing any patent claims and other intellectual property rights; | |||||||||||||||||||||
| The quality levels of our products and services; | The emergence of competing or complementary technological developments; | The terms and timing of any collaborative, licensing and other arrangements that we may establish; and | |||||||||||||||||||||
| The third-party reimbursement of our products for our customers; | The rate of progress and cost of our clinical trials and other development activities; | The acquisition of businesses, products and technologies and our ability to integrate and manage any acquired businesses, products and technologies. | |||||||||||||||||||||
We expect that existing cash and short-term investments and cash flows from our future operations will generally be sufficient to fund our ongoing core business. As current borrowing sources become due, we may be required to access the capital markets for additional funding. As we assess inorganic growth strategies, we may need to supplement our internally generated cash flow with outside sources. In the event that we are required to access the debt market, we believe that we will be able to secure reasonable borrowing rates. As part of our liquidity strategy, we will continue to monitor our current level of earnings and cash flow generation as well as our ability to access the market in light of those earning levels.
A substantial portion of our operations are located in the United States, and the majority of our sales since inception have been made in U.S. dollars. We will be exposed to additional foreign currency exchange risk related to our international operations as we expand our manufacturing internationally and as our business continues to increase in international markets. See “
Foreign Currency Exchange Risk
” in Part II, Item 7A of our Annual Report on Form 10-K for the fiscal year ended
December 31, 2023
,
for more information.
35
Main Sources of Liquidity
Cash, cash equivalents and short-term marketable securities
Our cash, cash equivalents and short-term marketable securities totaled $2.90 billion as of March 31, 2024. None of those funds were restricted and $2.67 billion (approximately 92%) of those funds were located in the United States.
Cash flow from Operations
For the three months ended March 31, 2024, we had positive cash flows of $209.2 million from operating activities. We anticipate that we will continue to generate positive cash flows from operations for the foreseeable future.
Senior Convertible Notes
We received net proceeds of $1.19 billion in May 2020 from the 2025 Notes offering, and net proceeds of $1.23 billion in May 2023 from the 2028 Notes offering. We used $282.6 million of the net proceeds from the offering of the 2025 Notes to repurchase a portion of our senior convertible notes due in 2022. We used $289.9 million of the net proceeds from the offering of the 2028 Notes to purchase capped call transactions and repurchase shares of our common stock in May 2023. We intend to use the remainder of the net proceeds from the 2025 Notes offering and 2028 Notes offering for general corporate purposes and capital expenditures, including working capital needs. We may also use the net proceeds to expand our current business through in-licensing or acquisitions of, or investments in, other businesses, products or technologies; however, we do not have any significant commitments with respect to any such acquisitions or investments at this time.
In connection with the 2028 Notes offering, we purchased the 2028 Capped Calls. See Note 5 “
Debt
” to the consolidated financial statements in Part I, Item 1 of this Quarterly Report on Form 10-Q for more information about our senior convertible notes and the 2028 Capped Calls.
Revolving Credit Agreement
As of March 31, 2024, we had no outstanding borrowings, $7.6 million in outstanding letters of credit, and a total available balance of $192.4 million under the Amended Credit Agreement. We monitor counterparty risk associated with the institutional lenders that are providing the Credit Facility. We currently believe that the Credit Facility will be available to us should we choose to borrow under it. Revolving loans will be available for general corporate purposes, including working capital and capital expenditures. See Note 5 “
Debt
” to the consolidated financial statements in Part I, Item 1 of this Quarterly Report on Form 10-Q for more information on the Revolving Credit Agreement.
Short-term Liquidity Requirements
Our short-term liquidity requirements primarily consist of regular operating costs, interest payments related to our senior convertible notes, capital expenditures for the development of our manufacturing facilities and office spaces, and short-term material cash requirements as described below. As of March 31, 2024, we had a working capital ratio of 2.90 and a quick ratio of 2.43, which indicates that our current assets are more than enough to cover our short-term liabilities. We expect to have significant capital expenditures for the next year to scale-up capacity in Mesa, Arizona and drive our strategic initiatives of building out our manufacturing facilities and/or equipment in Malaysia and Ireland.
We believe that our cash, cash equivalents, and marketable securities balances, projected cash contributions from our commercial operations, and borrowings under our Credit Facility will be sufficient to meet our anticipated seasonal working capital needs, all capital expenditure requirements, material cash requirements as described below, and other liquidity requirements associated with our operations for at least the next 12 months. We may use cash to repurchase Dexcom shares or for other strategic initiatives that strengthen our foundation for long-term growth.
Long-term Liquidity Requirements
Our long-term liquidity requirements primarily consist of interest and principal payments related to our senior convertible notes, capital expenditures for the development of our manufacturing facilities and office spaces, and long-term material cash requirements as described below. As of March 31, 2024, we had a debt-to-assets ratio of 0.38, which indicates that our total assets are more than enough to cover our short-term and long-term debts. As demand grows for our products, we will continue to expand global operations to meet demand through investments in manufacturing and operations. We expect to meet our long-term liquidity requirements from our main sources of liquidity as described above to support our future operations, capital expenditures, acquisitions, and other liquidity requirements associated with our operations beyond the next 12 months.
36
As of March 31, 2024, we have outstanding senior convertible notes that will mature in November 2025 and May 2028. However, the outstanding principal of our senior convertible notes could be converted into cash and/or shares of our common stock prior to maturity once certain conditions are met. See Note 5 “
Debt
—
Senior Convertible Notes
” to the consolidated financial statements in Part I, Item 1 of this Quarterly Report on Form 10-Q for information on conversion rights prior to maturity.
Material Cash Requirements
From time to time in the ordinary course of business, we enter into a variety of purchase arrangements including but not limited to, purchase arrangements related to capital expenditures, components used in manufacturing, and research and development activities. See “
Contractual Obligations
” below for more information.
Our obligations under the 2025 Notes and 2028 Notes include both principal and interest for these notes. Although the 2025 Notes and 2028 Notes mature in November 2025 and May 2028, respectively, they may be converted into cash and/or shares of our common stock prior to maturity if certain conditions are met. Any conversion prior to maturity may result in repayment of the principal amounts due under the Notes sooner than the scheduled repayment.
As market conditions warrant, we may, from time to time, repurchase our outstanding debt securities in the open market, in privately negotiated transactions, by exchange transaction or otherwise. Such repurchases, if any, will depend on prevailing market conditions, our liquidity and other factors and may be commenced or suspended at any time. The amounts involved and total consideration paid may be material.
See Note 5 “
Debt—Senior Convertible Notes
” to the consolidated financial statements in Part I, Item 1 of this Quarterly Report on Form 10-Q for more information about the terms of the Credit Agreement, our senior convertible notes, and the 2028 Capped Calls.
We are party to various leasing arrangements, primarily for office, manufacturing and warehouse space that expire at various times through December 2030, excluding any renewal options. We also have land leases in Penang, Malaysia that expire in 2082 and Athenry, Ireland that expire in 3023 for our international manufacturing facilities. We anticipate incurring significant expenditures related to our Malaysia manufacturing facility and equipment over the next year and the build-out of the Ireland manufacturing facility and equipment over the next five years. See Note 6 “
Leases and Other Commitments—Leases
” to the consolidated financial statements in Part II, Item 8 of our Annual Report for the fiscal year ended December 31, 2023 for more information about our leases.
37
|
Cash Flows
|
||
The following table sets forth a summary of our cash flows for the periods indicated. See the consolidated financial statements in Part I, Item 1 of this Quarterly Report on Form 10-Q for complete consolidated statements of cash flows for these periods.
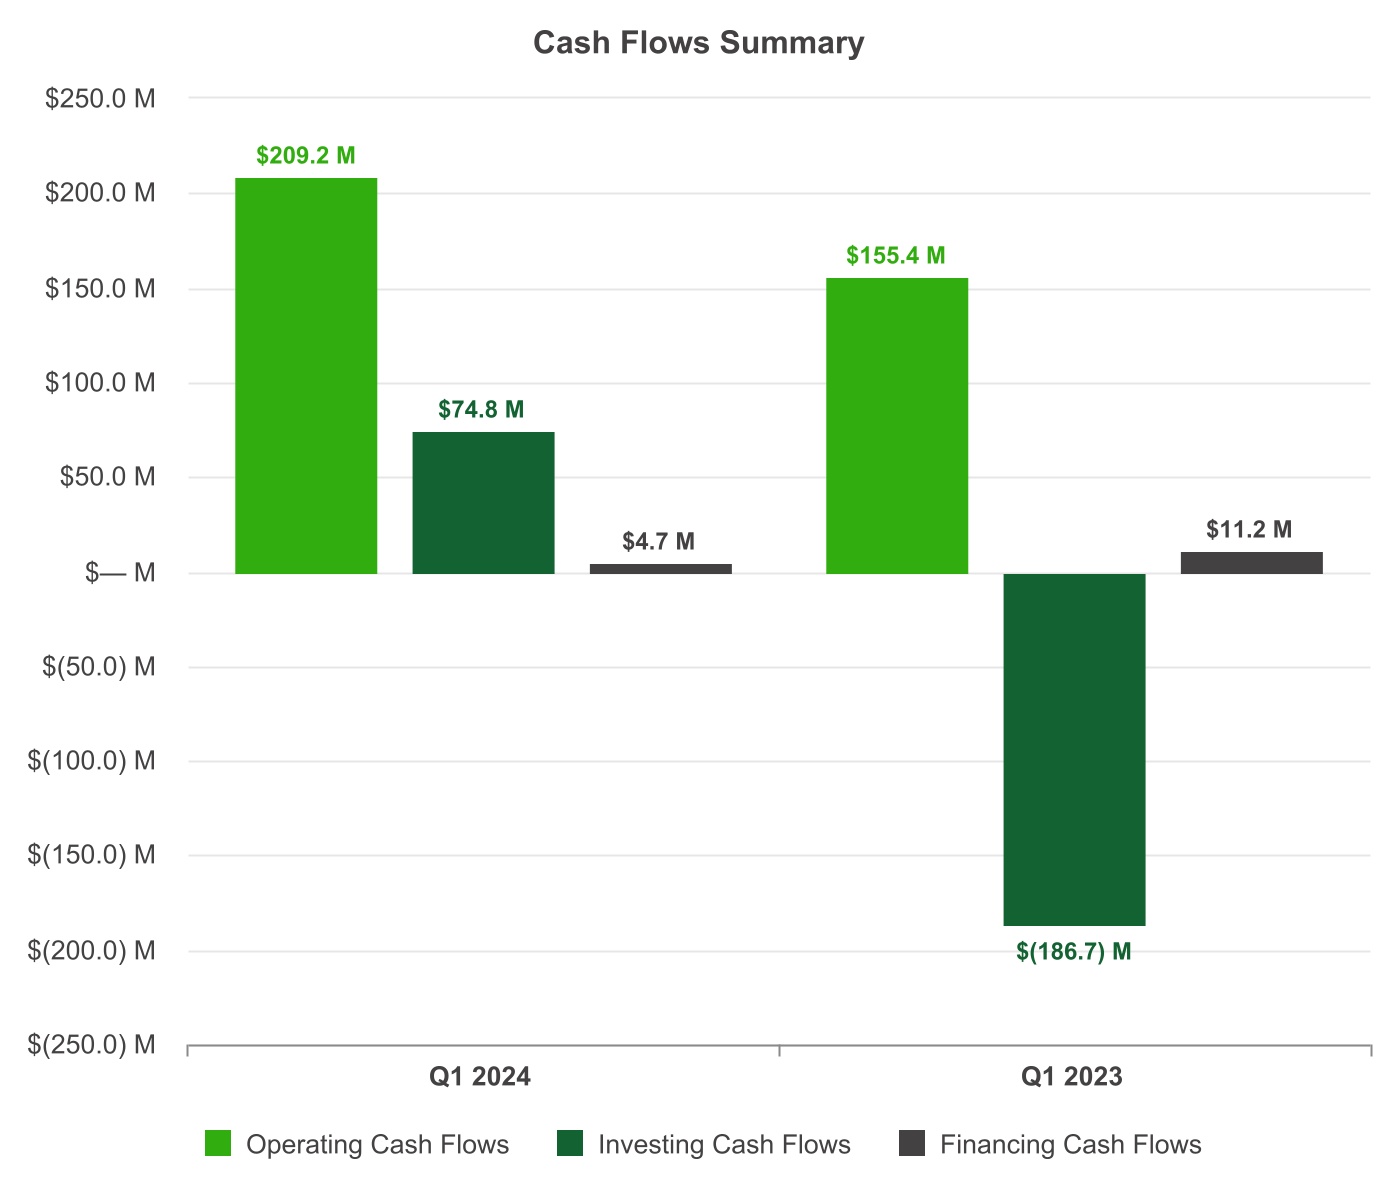
As of March 31, 2024, we had $2.90 billion in cash, cash equivalents and short-term marketable securities, which is an increase of $172.9 million compared to $2.72 billion as of December 31, 2023.
The primary cash flows during the three months ended March 31, 2024 and March 31, 2023 are described below. See the consolidated financial statements in Part I, Item 1 of this Quarterly Report on Form 10-Q for complete consolidated statements of cash flows for these periods.
38
| Three Months Ended | ||||||||||||||||||||
| March 31, 2024 | March 31, 2023 | |||||||||||||||||||
| Operating Cash Flows | + |
$146.4 million of net income, $43.8 million of net non-cash adjustments, and a net increase of $19.0 million in changes of working capital balances
|
+ |
$48.6 million of net income, $55.3 million of net non-cash adjustments, and a net increase of $51.5 million in changes of working capital balances
|
||||||||||||||||
|
Net non-cash adjustments were primarily related to depreciation and amortization, share-based compensation, and deferred income taxes.
|
Net non-cash adjustments were primarily related to depreciation and amortization and share-based compensation.
|
|||||||||||||||||||
| Investing Cash Flows | + |
$129.4 million in net proceeds from marketable securities
|
- |
$112.0 million in net purchases of marketable securities
|
||||||||||||||||
| - |
$56.9 million in capital expenditures
|
- |
$74.7 million in capital expenditures
|
|||||||||||||||||
| Financing Cash Flows | + |
$13.4 million in proceeds from issuance of common stock under our employee stock plans
|
+ |
$12.3 million in proceeds from issuance of common stock under our employee stock plans
|
||||||||||||||||
| Contractual Obligations | ||
We presented our contractual obligations as of December 31, 2023 in Note 6 “
Leases and Other Commitments
” in our Annual Report on Form 10-K for the fiscal year ended December 31, 2023. There were no material changes to our lease or contractual obligations outside the ordinary course of business during the three months ended March 31, 2024. See Note 5 “
Debt
—
Senior Convertible Notes
” to the consolidated financial statements in Part I, Item 1 of this Quarterly Report on Form 10-Q for more information on our senior convertible notes.
| Recent Accounting Guidance | ||
See Note 1 “
Organization and Significant Accounting Policies
” to the consolidated financial statements in Part I, Item 1 of this Quarterly Report on Form 10-Q for more information regarding recently issued accounting pronouncements and the potential impact on our consolidated financial statements, if any.
| ITEM 3 - QUANTITATIVE AND QUALITATIVE DISCLOSURES ABOUT MARKET RISK | ||
There were no material changes to our quantitative and qualitative disclosures about market risk during the three months ended March 31, 2024. See Part II, Item 7A “
Quantitative and Qualitative Disclosures about Market Risk
” of our Annual Report on Form 10-K for the fiscal year ended December 31, 2023, for a detailed discussion of our market risks.
| ITEM 4 - CONTROLS AND PROCEDURES | ||
Evaluation of Disclosure Controls and Procedures
Regulations under the Exchange Act require public companies to maintain “disclosure controls and procedures,” as defined in Rules 13a-15(e) and 15d-15(e) of the Exchange Act. Disclosure controls and procedures include, without limitation, controls and other procedures that are designed to ensure that information required to be disclosed in the reports that we file or submit under the Exchange Act is accumulated and timely communicated to management, including our Chief Executive Officer (our principal executive officer) and Chief Financial Officer (our principal financial officer), recorded, processed, summarized, and reported within the time periods specified in the SEC’s rules and forms. Our management, with the participation of our Chief Executive Officer and our Chief Financial Officer, conducted an evaluation of the effectiveness of our disclosure controls and procedures as of the end of the period covered by this Quarterly Report on Form 10-Q. Based on their evaluation as of March 31, 2024, our Chief Executive Officer and our Chief Financial Officer concluded that our disclosure controls and procedures were effective at a reasonable assurance level as of such date.
39
Changes in Internal Control over Financial Reporting
There were no changes in our internal control over financial reporting (as such term is defined in Rules 13a-15(f) and 15d-15(f) under the Exchange Act) during the most recently completed fiscal quarter that have materially affected, or are reasonably likely to materially affect, our internal control over financial reporting.
Limitation on Effectiveness of Controls
It should be noted that any system of controls, including ours, however well designed and operated, can provide only reasonable, and not absolute, assurance that the objectives of the system are met. The design of any control system is based, in part, upon the benefits of the control system relative to its costs. Control systems can be circumvented by the individual acts of some persons, by collusion of two or more people, or by management override of the control. In addition, over time, controls may become inadequate because of changes in conditions, or the degree of compliance with the policies or procedures may deteriorate. Because of these and other inherent limitations of control systems, we cannot guarantee that any design will succeed in achieving its stated goals under all potential future conditions, regardless of how remote.
40
| PART II. OTHER INFORMATION | ||
| ITEM 1 - LEGAL PROCEEDINGS | ||
We are subject to various claims, complaints and legal actions that arise from time to time in the normal course of business, including commercial insurance, product liability, intellectual property and employment related matters. In addition, from time to time we may bring claims or initiate lawsuits against various third parties with respect to matters arising out of the ordinary course of our business, including commercial and employment related matters.
Since June 2021, we and certain Abbott Diabetes Care, Inc. (“Abbott”) entities have served patent infringement complaints against each other in multiple jurisdictions against certain continuous glucose monitoring products of each company.
In June 2021, we initiated patent infringement litigation against Abbott in the United States (U.S.D.C., Western District of Texas) and Germany (National Court (“N.C.”) in Mannheim). In May 2023, we filed additional patent infringement actions in Germany (N.C. in Munich). In July and August 2023, we initiated patent infringement litigation in the United Patent Court (“UPC”) (Paris & Munich) and in Spain (Commercial Courts of Barcelona). In October and November 2023, we initiated patent infringement litigation in Germany (N.C. in Munich) and in the UPC (Paris & Munich). In January 2024, we initiated patent infringement litigation in Germany (N.C. in Hamburg).
In July 2021, one day after we initiated litigation in the U.S.D.C., Western District of Texas, Abbott initiated patent infringement litigation against Dexcom in the United States (U.S.D.C., Delaware (“D1”)). Shortly thereafter, Abbott filed additional patent infringement litigation actions in the United Kingdom (Business and Property Courts of England and Wales) and Germany (N.C. in Mannheim and Dusseldorf).
In response to the lawsuits initiated by Abbott in the United Kingdom, Dexcom also filed patent infringement counterclaims in the Business and Property Courts of England and Wales. Three trials on liability have already been conducted in the United Kingdom. On October 18, 2023, judgment was handed down in favor of Dexcom in one of these trials. On January 15, 2024, judgment was handed down invalidating both Abbott and Dexcom’s patents in another one of these trials. The parties are awaiting rulings on the remaining trial. Dexcom and Abbott sought injunctive relief and monetary damages as a result of their respective claims.
In December 2021, Abbott filed a breach of contract lawsuit against Dexcom in the United States (U.S.D.C., District of Delaware) alleging that Dexcom breached the parties' Settlement and License Agreement dated July 2, 2014 (“SLA”). The U.S.D.C., District of Delaware consolidated Abbott’s breach of contract lawsuit with Dexcom’s patent infringement lawsuit which had been transferred from the U.S.D.C., Western District of Texas (“D3”). Dexcom asserted counterclaims that Abbott also breached the SLA. A jury trial on Abbott’s breach of contract claims commenced on July 10, 2023. On July 14, 2023, the jury verdict determined that Abbott was not licensed to thirteen claims of certain Dexcom patents and that Abbott was licensed to five claims. In April 2022, Abbott initiated the inter partes review (“IPR”) process on the asserted claims of Dexcom’s patents in D3. The U.S. Patent and Trademark Office (the “PTO”) denied institution of one of Dexcom’s patents and instituted IPR on the other four. Ultimately, in November 2023, the PTO issued its Final Written Decision, upholding claims of two Dexcom patents to be patentable, which cover factory calibration and certain alarms and alerts, and two to be unpatentable, which cover certain sensor code and sensor configurations. We will continue to enforce the remaining claims of the patents asserted in Delaware with trial set for February 2025.
In February 2023, Abbott filed patent infringement litigation against us in Germany (N.C. in Hamburg and Munich). In March 2023, Abbott filed a patent infringement litigation in the United States (U.S.D.C., Delaware (“D4”)) and we filed counterclaims for patent infringement in that action in June 2023. In June 2023, Abbott filed patent infringement litigation actions in the United Kingdom (Business and Property Courts of England and Wales). In response to the lawsuits initiated by Abbott in the United Kingdom, Dexcom also filed patent infringement counterclaims in that jurisdiction.
Abbott’s patent infringement trial, “D1”, against Dexcom commenced in the U.S.D.C., District of Delaware in March 2024. In the lead up to trial, the U.S.D.C., District of Delaware invalidated one of Abbott’s patents on factory calibration and Abbott dropped four other patents from the litigation. The claims litigated were isolated to the inserter mechanism and the wearable seal and mount of Dexcom’s G6. On March 22, 2024, a jury returned a mixed verdict. The jury found that Dexcom infringes one patent, that Dexcom did not infringe a second patent, and that Dexcom also did not infringe a third patent, which the jury also found invalid. The jury found that any infringement was not willful. It could not reach unanimity as to a fourth patent. No determination of damages was made or awarded. Dexcom will challenge the sole finding of infringement and continue to defend itself vigorously.
41
Commencing in January 2024, Abbott has several patent infringement hearings against Dexcom in Germany (N.C. in Hamburg and Munich) wherein Abbott is seeking damages and injunctive relief. On January 31, 2024, the Court in Munich in two such hearings provided Dexcom additional time to brief certain issues Abbott raised late in the proceedings, thus postponing a decision in both proceedings until May 2024. In March and April of 2024, Dexcom has several patent infringement hearings in the N.C. in Mannheim and Munich against Abbott, wherein Dexcom is seeking damages and injunctive relief. Dexcom has hearings in May and June 2024 in its first two proceedings in the UPC and in July 2024 in the N.C. in Munich.
Due to uncertainty surrounding patent litigation procedures initiated by Dexcom and Abbott throughout multiple jurisdictions, we are unable to reasonably estimate the ultimate outcome of any of the litigation matters at this time. We intend to protect our intellectual property and defend against Abbott’s claims vigorously in all of these actions.
We do not believe we are party to any other currently pending legal proceedings, the outcome of which could have a material adverse effect on our business, financial condition, or results of operations. There can be no assurance that existing or future legal proceedings arising in the ordinary course of business or otherwise will not have a material adverse effect on our business, financial condition, or results of operations.
| ITEM 1A - RISK FACTORS | ||
There were no material changes to the risk factors previously disclosed and included in our Annual Report on Form 10-K for the fiscal year ended December 31, 2023. Our short and long-term success is subject to numerous risks and uncertainties, many of which involve factors that are difficult to predict or beyond our control. Before making a decision to invest in, hold or sell our common stock, stockholders and potential stockholders should carefully consider the risks and uncertainties described in Part I, Item 1A, “
Risk Factors
” in our Annual Report on Form 10-K for the fiscal year ended December 31, 2023, which could materially and adversely affect our business, financial condition, results of operations and prospects. In that case, the value of our common stock could decline and stockholders may lose all or part of their investment.
Furthermore, additional risks and uncertainties of which we are currently unaware, or which we currently consider to be immaterial, could have a material adverse effect on our business, financial condition, results of operations or prospects. Refer to our disclaimer regarding forward-looking statements at the beginning of Part I, Item 1 of this Quarterly Report on Form 10-Q.
| ITEM 2 - UNREGISTERED SALES OF EQUITY SECURITIES AND USE OF PROCEEDS | ||
None.
| ITEM 3 - DEFAULTS UPON SENIOR SECURITIES | ||
None.
| ITEM 4 - MINE SAFETY DISCLOSURES | ||
None.
42
| ITEM 5 - OTHER INFORMATION | ||
Trading Plans
During the three months ended March 31, 2024, the following Section 16 officers and directors adopted a “Rule 10b5-1 trading arrangement” (as defined in Item 408 of Regulation S-K of the Exchange Act) intended to satisfy the affirmative defense of Rule 10b5-1(c):
| Name | Title | Action |
Action Date
|
Aggregate Number of Shares to be Sold
(1)
|
Expiration Date
(2)
|
||||||||||||
|
|
|
|
|
|
3/15/2025 | ||||||||||||
|
|
|
|
|
|
3/21/2025 | ||||||||||||
|
|
|
|
|
|
3/15/2025 | ||||||||||||
|
(1)
The actual number of shares sold may depend on the net shares vested as a result of tax withholding obligations, the vesting of certain PSUs, the number of shares purchased under employee stock purchase plans, one or more limit orders, as applicable, and therefore, may not be determinable at this time.
|
|||||||||||||||||
|
(2)
Each trading arrangement permitted or permits transactions through and including the date listed in the table.
|
|||||||||||||||||
|
(3)
Adopted on behalf of a trust for which Mr. Foletta serves as a trustee.
|
|||||||||||||||||
Each of the Rule 10b5-1 trading arrangements disclosed in the above table was adopted in accordance with our insider trading policy. Transactions made pursuant to such trading arrangements will be disclosed publicly in Section 16 filings with the SEC in accordance with applicable securities laws, rules and regulations.
No Section 16 officers or directors
adopted
, modified, or
terminated
a “non-Rule 10b5-1 trading arrangement” (as defined in Item 408 of Regulation S-K of the Exchange Act) during the three months ended March 31, 2024.
43
| ITEM 6 - EXHIBITS | ||
| Incorporated by Reference | ||||||||||||||||||||||||||||||||||||||||||||||||||
|
Exhibit
Number |
Exhibit Description | Form | File No. |
Date of
First Filing |
Exhibit
Number |
Provided
Herewith |
||||||||||||||||||||||||||||||||||||||||||||
| 8-K | 000-51222 | February 15, 2024 |
10.1
|
|||||||||||||||||||||||||||||||||||||||||||||||
| — | — | — | — | X | ||||||||||||||||||||||||||||||||||||||||||||||
| — | — | — | — | X | ||||||||||||||||||||||||||||||||||||||||||||||
| — | — | — | — | X | ||||||||||||||||||||||||||||||||||||||||||||||
| — | — | — | — | X | ||||||||||||||||||||||||||||||||||||||||||||||
| 101.INS |
Inline XBRL Instance Document - the instance document does not appear in the Interactive Data File because its XBRL tags are embedded within the Inline XBRL document
|
X | ||||||||||||||||||||||||||||||||||||||||||||||||
| 101.SCH | Inline XBRL Taxonomy Extension Schema Document | X | ||||||||||||||||||||||||||||||||||||||||||||||||
| 101.CAL | Inline XBRL Taxonomy Extension Calculation Linkbase Document | X | ||||||||||||||||||||||||||||||||||||||||||||||||
| 101.DEF | Inline XBRL Taxonomy Extension Definition Linkbase Document | X | ||||||||||||||||||||||||||||||||||||||||||||||||
| 101.LAB | Inline XBRL Taxonomy Extension Label Linkbase Document | X | ||||||||||||||||||||||||||||||||||||||||||||||||
| 101.PRE | Inline XBRL Taxonomy Extension Presentation Linkbase Document | X | ||||||||||||||||||||||||||||||||||||||||||||||||
44
| Incorporated by Reference | ||||||||||||||||||||||||||||||||||||||||||||||||||
|
Exhibit
Number |
Exhibit Description | Form | File No. |
Date of
First Filing |
Exhibit
Number |
Provided
Herewith |
||||||||||||||||||||||||||||||||||||||||||||
| 104 |
Cover Page Interactive Data File - the cover page from the Registrant’s Quarterly Report on Form 10-Q for the quarter ended March 31, 2024 is formatted in Inline XBRL
|
X | ||||||||||||||||||||||||||||||||||||||||||||||||
| * | Portions of this exhibit have been omitted pursuant to Item 601(b)(10)(iv) of Regulation S-K. | |||||||
| ** |
This certification is not deemed “filed” for purposes of Section 18 of the Exchange Act, or otherwise subject to the liability of that section. Such certification will not be deemed to be incorporated by reference into any filing under the Securities Act or the Exchange Act, except to the extent that Dexcom specifically incorporates it by reference.
|
|||||||
45
| SIGNATURES | ||
Pursuant to the requirements of the Securities Exchange Act of 1934, the registrant has duly caused this report to be signed on its behalf by the undersigned thereunto duly authorized.
|
DEXCOM, INC.
(Registrant)
|
|||||||||||||||||
| Dated: | April 25, 2024 | By: | /s/ KEVIN R. SAYER | ||||||||||||||
|
Kevin R. Sayer,
Chairman of the Board of Directors,
President and Chief Executive Officer
(Principal Executive Officer)
|
|||||||||||||||||
| Dated: | April 25, 2024 | By: | /s/ JEREME M. SYLVAIN | ||||||||||||||
|
Jereme M. Sylvain,
Executive Vice President and Chief Financial Officer
(Principal Financial and Accounting Officer)
|
|||||||||||||||||
46
TABLE OF CONTENTS
Part I. Financial InformationItem 1. Financial StatementsItem 2 - Management S Discussion and Analysis Of Financial Condition and Results Of OperationsItem 3 - Quantitative and Qualitative Disclosures About Market RiskItem 4 - Controls and ProceduresPart II. Other InformationItem 1 - Legal ProceedingsItem 1A - Risk FactorsItem 2 - Unregistered Sales Of Equity Securities and Use Of ProceedsItem 3 - Defaults Upon Senior SecuritiesItem 4 - Mine Safety DisclosuresItem 5 - Other InformationItem 6 - Exhibits