DXP ENTERPRISES INC
10-Ks and 10-Qs
|
|
|
|
|
|
|
|
|
|
|
|
|
|
|
|
|
|
|
|
|
|
|
|
|
|
|
|
|
|
|
|
|
|
|
|
|
|
|
|
|
|
|
|
UNITED STATES
SECURITIES AND EXCHANGE COMMISSION
Washington, D.C. 20549
Form 10-K
(Mark One)
| ☒ | ANNUAL REPORT PURSUANT TO SECTION 13 OR 15(d) OF THE SECURITIES EXCHANGE ACT OF 1934. For the fiscal year ended December 31, 2015 |
or
| ☐ | TRANSITION REPORT PURSUANT TO SECTION 13 OR 15(d) OF THE SECURITIES EXCHANGE ACT OF 1934. For the transition period from to |
Commission file number 0-21513
DXP Enterprises, Inc.
(Exact name of registrant as specified in its charter)
|
Texas
|
76-0509661
|
|
|
(State or other jurisdiction of incorporation or organization)
|
(I.R.S. Employer Identification Number)
|
|
7272 Pinemont, Houston, Texas
|
77040
|
(713) 996-4700
|
||
|
(Address of principal executive offices)
|
(Zip Code)
|
(Registrant’s telephone number, including area code)
|
Securities registered pursuant to Section 12(b) of the Act:
|
Common Stock, $0.01 Par Value
|
NASDAQ
|
|
|
(Title of Class)
|
(Name of exchange on which registered) |
Securities registered pursuant to Section 12(g) of the Act:
None
Indicate by check mark if the registrant is a well-known seasoned issuer, as defined in Rule 405 of the Securities Act. Yes ☐ No ☒
Indicate by check mark if the registrant is not required to file reports pursuant to Section 13 or Section 15(d) of the Act. Yes ☐ No ☒
Indicate by check mark whether the registrant (1) has filed all reports required to be filed by Section 13 or 15(d) of the Securities Exchange Act of 1934 during the preceding 12 months (or for such shorter period that the registrant was required to file such reports), and (2) has been subject to such filing requirements for the past 90 days. Yes ☒ No ☐
Indicate by check mark whether the registrant has submitted electronically and posted on its corporate Web site, if any, every Interactive Data File required to be submitted and posted pursuant to Rule 405 of Regulation S-T during the preceding 12 months (or for such shorter period that the registrant was required to submit and post such files).
☒ Yes ☐ No
Indicate by check mark if disclosure of delinquent filers pursuant to Item 405 of Regulation S-K is not contained herein, and will not be contained, to the best of registrant's knowledge, in definitive proxy or information statements incorporated by reference in Part III of this Form 10-K or any amendment to this Form 10-K. ☐
Indicate by check mark whether the registrant is a large accelerated filer, an accelerated filer, a non-accelerated filer, or a smaller reporting company. (See definitions of “large accelerated filer”, “accelerated filer”, and “smaller reporting company” in Rule 12b-2 of the Exchange Act).
|
Large accelerated filer ☒
|
Accelerated filer ☐
|
|
Non-accelerated filer ☐ (Do not check if a smaller reporting company)
|
Smaller reporting company ☐
|
Indicate by check mark whether the registrant is a shell company (as defined in Rule 12b-2 of the Act). Yes ☐ No ☒
Aggregate market value of the registrant's Common Stock held by non-affiliates of registrant as of June 30, 2015: $585,588,218
Number of shares of registrant's Common Stock outstanding as of February 29, 2016: 14,415,961.
Documents incorporated by reference: Portions of the definitive proxy statement for the annual meeting of shareholders to be held in 2016 are incorporated by reference into Part III hereof.
2
DESCRIPTION
|
Item
|
Page
|
|
|
PART I
|
||
|
1.
|
4
|
|
|
1A.
|
14
|
|
|
1B.
|
19
|
|
|
2.
|
19
|
|
|
3.
|
20
|
|
|
4.
|
20
|
|
|
PART II
|
||
|
5.
|
20
|
|
|
6.
|
22
|
|
|
7.
|
23
|
|
|
7A.
|
42
|
|
|
8.
|
42
|
|
|
9.
|
72
|
|
|
9A.
|
73
|
|
|
9B.
|
74
|
|
|
PART III
|
||
|
10.
|
75
|
|
|
11.
|
75
|
|
|
12.
|
75
|
|
|
13.
|
75
|
|
|
14.
|
75
|
|
|
PART IV
|
||
|
15.
|
76
|
|
|
79
|
DISCLOSURE REGARDING FORWARD-LOOKING STATEMENTS
This Annual Report on Form 10-K (this “Report”) contains statements that constitute “forward-looking statements” within the meaning of the Private Securities Litigation Reform Act of 1995, as amended. Such statements can be identified by the use of forward-looking terminology such as “believes”, “expects”, “may”, “might”, “estimates”, “will”, “should”, “could”, “plans” or “anticipates” or the negative thereof or other variations thereon or comparable terminology, or by discussions of strategy. Any such forward-looking statements are not guarantees of future performance and may involve significant risks and uncertainties, and actual results may vary materially from those discussed in the forward-looking statements as a result of various factors. These factors include the effectiveness of management’s strategies and decisions, our ability to implement our internal growth and acquisition growth strategies, general economic and business conditions specific to our primary customers, changes in government regulations, our ability to effectively integrate businesses we may acquire, new or modified statutory or regulatory requirements, availability of materials and labor, inability to obtain or delay in obtaining government or third-party approvals and permits, non-performance by third parties of their contractual obligations, unforeseen hazards such as weather conditions, acts or war or terrorist acts and the governmental or military response thereto, cyber-attacks adversely affecting our operations, other geological, operating and economic considerations and changing prices and market conditions, including supply or demand for maintenance, repair and operating products, equipment and service. This Report identifies other factors that could cause such differences. We cannot assure that these are all of the factors that could cause actual results to vary materially from the forward-looking statements. Factors that could cause or contribute to such differences include, but are not limited to, those discussed in "Risk Factors", and elsewhere in this Report. We assume no obligation and do not intend to update these forward-looking statements. Unless the context otherwise requires, references in this Report to the "Company", "DXP", “we” or “our” shall mean DXP Enterprises, Inc., a Texas corporation, together with its subsidiaries.
PART I
Company Overview
DXP was incorporated in Texas in 1996 to be the successor to SEPCO Industries, Inc., founded in 1908. Since our predecessor company was founded, we have primarily been engaged in the business of distributing maintenance, repair and operating (MRO) products, equipment and service to industrial customers. The Company is organized into three business segments: Service Centers, Supply Chain Services and Innovative Pumping Solutions. Sales, operating income, and other financial information for 2013, 2014 and 2015, and identifiable assets at the close of such years for our business segments are presented in Note 17 of the Notes to Consolidated Financial Statements “financial statements” in Item 8 of this Report.
Our total sales have increased from $125 million in 1996 to $1.2 billion in 2015 through a combination of internal growth and business acquisitions. At December 31, 2015 we operated from 191 locations in forty-one states in the U.S., nine provinces in Canada, Dubai and one state in Mexico, serving more than 50,000 customers engaged in a variety of industrial end markets. We have grown sales and profitability by adding additional products, services, locations and becoming customer driven experts in maintenance, repair and operating solutions.
Our principal executive office is located at 7272 Pinemont Houston, Texas 77040, and our telephone number is (713) 996-4700. Our website address on the Internet is www.dxpe.com and emails may be sent to info@dxpe.com. The reference to our website address does not constitute incorporation by reference of the information contained on the website and such information should not be considered part of this Report.
Industry Overview
The industrial distribution market is highly fragmented. Based on 2014 sales as reported by Industrial Distribution magazine, we were the 20th largest distributor of MRO products in the United States. Most industrial customers currently purchase their industrial supplies through numerous local distribution and supply companies. These distributors generally provide the customer with repair and maintenance services, technical support and application expertise with respect to one product category. Products typically are purchased by the distributor for resale directly from the manufacturer and warehoused at distribution facilities of the distributor until sold to the customer. The customer also typically will purchase an amount of product inventory for its near term anticipated needs and store those products at its industrial site until the products are used.
We believe that the distribution system for industrial products, as described in the preceding paragraph, creates inefficiencies at both the customer and the distributor levels through excess inventory requirements and duplicative cost structures. To compete more effectively, our customers and other users of MRO products are seeking ways to enhance efficiencies and lower MRO product and procurement costs. In response to this customer desire, three primary trends have emerged in the industrial supply industry:
| · | Industry Consolidation. Industrial customers have reduced the number of supplier relationships they maintain to lower total purchasing costs, improve inventory management, assure consistently high levels of customer service and enhance purchasing power. This focus on fewer suppliers has led to consolidation within the fragmented industrial distribution industry. |
| · | Customized Integrated Service. As industrial customers focus on their core manufacturing or other production competencies, they increasingly are demanding customized integration services, consisting of value-added traditional distribution, supply chain services, modular equipment and repair and maintenance services |
| · | Single Source, First-Tier Distribution. As industrial customers continue to address cost containment, there is a trend toward reducing the number of suppliers and eliminating multiple tiers of distribution. Therefore, to lower overall costs to the customer, some MRO product distributors are expanding their product coverage to eliminate second-tier distributors and become a “one stop source”. |
We believe we have increased our competitive advantage through our traditional fabrication of integrated system pump packages and integrated supply programs, which are designed to address our customers’ specific product and procurement needs. We offer our customers various options for the integration of their supply needs, ranging from serving as a single source of supply for all or specific lines of products and product categories to offering a fully integrated supply package in which we assume procurement and management functions, which can include ownership of inventory, at the customer's location. Our approach to integrated supply allows us to design a program that best fits the needs of the customer. Customers purchasing large quantities of product are able to outsource all or most of those needs to us. For customers with smaller supply needs, we are able to combine our traditional distribution capabilities with our broad product categories and advanced ordering systems to allow the customer to engage in one-stop sourcing without the commitment required under an integrated supply contract.
Business Segments
The Company is organized into three business segments: Service Centers (SC), Supply Chain Services (SCS) and Innovative Pumping Solutions (IPS). Our segments provide management with a comprehensive financial view of our key businesses. The segments enable the alignment of strategies and objectives and provide a framework for timely and rational allocation of resources within our businesses. The following table sets forth DXP’s sales recognition by business segments as of December 31, 2015:
|
Segment
|
2015 Sales
(
in thousands
)
|
% of Sales
|
End-Markets
|
Locations
|
Employees
|
|
SC
|
$ 826,588
|
66.3%
|
Oil & Gas, Food & Beverage,
General Industrial, Chemical
& Petrochemical,
Transportation
|
171 service centers
8 distribution centers
|
1,982
|
|
SCS
|
$ 165,626
|
13.3%
|
Oil & Gas
Food & Beverage,
Mining & Transportation
|
69 customer facilities
|
284
|
|
IPS
|
$ 254,829
|
20.4%
|
Oil & Gas
Mining
Utilities
|
12 fabrication facilities
|
653
|
Service Centers
The Service Centers are engaged in providing MRO products, equipment and integrated services, including technical expertise and logistics capabilities, to industrial customers with the ability to provide same day delivery. We offer our customers a single source of supply on an efficient and competitive basis by being a first-tier distributor that can purchase products directly from manufacturers. As a first-tier distributor, we are able to reduce our customers' costs and improve efficiencies in the supply chain. We offer a wide range of industrial MRO products, equipment and integrated services through a continuum of customized and efficient MRO solutions. We also provide services such as field safety supervision, in-house and field repair and predictive maintenance.
A majority of our Service Center segment sales are derived from customer purchase orders for products. Sales are directly solicited from customers by our sales force. DXP Service Centers are stocked and staffed with knowledgeable sales associates and backed by a centralized customer service team of experienced industry professionals. At December 31, 2015, our Service Centers’ products and services were distributed from 171 service centers and 8 distribution centers.
DXP Service Centers provide a wide range of MRO products in the rotating equipment, bearing, power transmission, hose, fluid power, metal working, industrial supply and safety product and service categories. We currently serve as a first-tier distributor of more than 1,000,000 items of which more than 60,000 are stock keeping units (SKUs) for use primarily by customers engaged in the oil and gas, food and beverage, petrochemical, transportation and other general industrial industries. Other industries served by our Service Centers include mining, construction, chemical, municipal, agriculture and pulp and paper.
The Service Centers segment’s long-lived assets are located in the United States, Canada, Dubai and Mexico. Approximately 12.6% of the Service Centers segment’s revenues were in Canada and the remainder was virtually all in the U.S.
At December 31, 2015, the Service Centers segment had approximately 1,982 full-time employees.
Supply Chain Services
DXP’s Supply Chain Services (SCS) segment manages all or part of its customers’ supply chains, including procurement and inventory management. The SCS segment enters into long-term contracts with its customers that can be cancelled on little or no notice under certain circumstances. The SCS segment provides fully outsourced MRO solutions for sourcing MRO products including, but not limited to, the following: inventory optimization and management; store room management; transaction consolidation and control; vendor oversight and procurement cost optimization; productivity improvement services; and customized reporting. Our mission is to help our customers become more competitive by reducing their indirect material costs and order cycle time by increasing productivity and by creating enterprise-wide inventory and procurement visibility and control.
DXP has developed assessment tools and master plan templates aimed at taking cost out of supply chain processes, streamlining operations and boosting productivity. This multi-faceted approach allows us to manage the entire MRO products channel for maximum efficiency and optimal control, which ultimately provides our customers with a low-cost solution.
DXP takes a consultative approach to determine the strengths and opportunities for improvement within a customer’s MRO products supply chain. This assessment determines if and how we can best streamline operations, drive value within the procurement process, and increase control in storeroom management.
Decades of supply chain inventory management experience and comprehensive research, as well as a thorough understanding of our customers’ businesses and industries have allowed us to design standardized programs that are flexible enough to be fully adaptable to address our customers’ unique MRO products supply chain challenges. These standardized programs include:
| · | SmartAgreement, a planned, pro-active MRO products procurement solution for MRO categories leveraging DXP’s local Service Centers. |
| · | SmartBuy, DXP’s on-site or centralized MRO procurement solution. |
| · | SmartSource SM , DXP’s on-site procurement and storeroom management by DXP personnel. |
| · | SmartStore, DXP’s customized e-Catalog solution. |
| · | SmartVend, DXP’s industrial dispensing solution. It allows for inventory-level optimization, user accountability and item usage reduction by 20-40%. |
| · | SmartServ, DXP’s integrated service pump solution. It provides a more efficient way to manage the entire life cycle of pumping systems and rotating equipment. |
DXP’s SmartSolutions programs listed above help customers to cut product costs, improve supply chain efficiencies and obtain expert technical support. DXP represents manufacturers of up to 90% of all the maintenance, repair and operating products of our customers. Unlike many other distributors who buy products from second-tier sources, DXP takes customers to the source of the products they need.
At December 31, 2015, the Supply Chain Services segment operated supply chain installations in sixty-nine (69) of our customers’ facilities.
At December 31, 2015, all of the Supply Chain Services segment’s long-lived assets are located in the U.S. and all of 2015 sales were recognized in the U.S.
At December 31, 2015, the Supply Chain Services segment had approximately 284 full-time employees.
Innovative Pumping Solutions
DXP’s Innovative Pumping Solutions® (IPS) segment provides integrated, custom pump skid packages, pump remanufacturing and manufactures branded private label pumps to meet the capital equipment needs of our global customer base. Our IPS segment provides a single source for engineering, systems design and fabrication for unique customer specifications.
Our sales of integrated pump packages, remanufactured pumps or branded private label pumps are generally derived from customer purchase orders containing the customers’ unique specifications. Sales are directly solicited from customers by our dedicated sales force.
DXP’s engineering staff can design a complete custom pump package to meet our customers’ project specifications. Drafting programs such as Solidworks® and AutoCAD® allow our engineering team to verify the design and layout of packages with our customers prior to the start of fabrication. Finite Elemental Analysis programs such as Cosmos Professional® are used to design the package to meet all normal and future loads and forces. This process helps maximize the pump packages’ life and minimizes any impact to the environment.
With over 100 years of fabrication experience, DXP has acquired the technical expertise to ensure that our pumps and pump packages are built to meet the highest standards. DXP utilizes manufacturer authorized equipment and manufacturer certified personnel. Pump packages require MRO products and original equipment manufacturers’ (OEM) equipment such as pumps, motors, valves, and consumable products, such as welding supplies. DXP leverages its MRO product inventories and breadth of authorized products to lower the total cost and maintain the quality of our pump packages.
DXP’s fabrication facilities provide convenient technical support and pump repair services. The facilities contain state of the art equipment to provide the technical expertise our customers require including, but not limited to, the following:
| · | Structural welding |
| · | Pipe welding |
| · | Custom skid assembly |
| · | Custom coatings |
| · | Hydrostatic pressure testing |
| · | Mechanical string testing |
Examples of our innovative pump packages include, but are not limited to:
| · | Diesel and electric driven firewater packages |
| · | Pipeline booster packages |
| · | Potable water packages |
| · | Pigging pump packages |
| · | Lease Automatic Custody Transfer (LACT) charge units |
| · | Chemical injection pump packages wash down units |
| · | Seawater lift pump packages |
| · | Jockey pump packages |
| · | Condensate pump packages |
| · | Cooling water packages |
| · | Seawater/produced water injection packages |
| · | Variety of packages to meet customer required industry specifications such as API, ANSI and NFPA |
At December 31, 2015, the Innovative Pumping Solutions segment operated out of twelve facilities, ten of which are located in the United States and two in Canada.
Approximately 1.7% of the IPS segment’s long-lived assets are located in Canada and the remainder were located in the U.S. Approximately 9.4% of the IPS segment’s 2015 revenues were recognized in Canada and 90.6% were in the U.S.
At December 31, 2015, the IPS segment had approximately 653 full-time employees.
Total backlog, representing firm orders for the IPS segment products that have been received and entered into our production systems, was $85.5 million and $140.6 million at December 31, 2015 and 2014, respectively.
Products
Most industrial customers currently purchase their MRO products through local or national distribution companies that are focused on single or unique product categories. As a first-tier distributor, our network of service and distribution centers stock more than 60,000 SKUs and provide customers with access to more than 1,000,000 items. Given our breadth of product and our industrial distribution customers’ focus around specific product categories, we have become customer driven experts in five key product categories. As such, our three business segments are supported by the following five key product categories: rotating equipment, bearings & power transmission, industrial supplies, metal working and safety products & services. Each business segment tailors its inventory and leverages product experts to meet the needs of its local customers.
Key product categories that we offer include:
| · | Rotating Equipment . Our rotating equipment products include a full line of centrifugal pumps for transfer and process service applications, such as petrochemicals, refining and crude oil production; rotary gear pumps for low- to- medium pressure service applications, such as pumping lubricating oils and other viscous liquids; plunger and piston pumps for high-pressure service applications such as disposal of produced water and crude oil pipeline service; and air-operated diaphragm pumps. We also provide a large variety of pump accessories. |
| · | Bearings & Power Transmission . Our bearing products include several types of mounted and un-mounted bearings for a variety of applications. The power transmission products we distribute include speed reducers, flexible-coupling drives, chain drives, sprockets, gears, conveyors, clutches, brakes and hoses. |
| · | Industrial Supplies . We offer a broad range of industrial supplies, such as abrasives, tapes and adhesive products, coatings and lubricants, fasteners, hand tools, janitorial products, pneumatic tools, welding supplies and welding equipment. |
| · | Metal Working . Our metal working products include a broad range of cutting tools, abrasives, coolants, gauges, industrial tools and machine shop supplies. |
| · | Safety Products & Services . We sell a broad range of safety products including eye and face protection, first aid, hand protection, hazardous material handling, instrumentation and respiratory protection products. Additionally, we provide safety services including hydrogen sulfide (H 2 S) gas protection and safety, specialized and standby fire protection, safety supervision, training, monitoring, equipment rental and consulting. Our safety services include safety supervision, medic services, safety audits, instrument repair and calibration, training, monitoring, equipment rental and consulting. |
We acquire our products through numerous OEMs. We are authorized to distribute certain manufacturers' products only in specific geographic areas. All of our oral or written distribution authorizations are subject to cancellation by the manufacturer, some upon little or no notice. For the last three fiscal years, no manufacturer provided products that accounted for 10% or more of our revenues. We believe that alternative sources of supply could be obtained in a timely manner if any distribution authorization were canceled. Accordingly, we do not believe that the loss of any one distribution authorization would have a material adverse effect on our business, financial condition or results of operations.
Over 90% of our business relates to sales of products. Service revenues are less than 10% of sales.
The Company has operations in the United States of America, Canada, Dubai, and Mexico. Information regarding financial data by geographic areas is set forth in Note 17 of the Notes to Consolidated Financial Statements.
Recent Acquisitions
A key component of our growth strategy includes effecting acquisitions of businesses with complementary or desirable product lines, locations or customers. Since 2004, we have completed 33 acquisitions across our three business segments. Below is a summary of recent acquisitions since the beginning of 2011.
On October 10, 2011, DXP acquired substantially all of the assets of Kenneth Crosby ("KC"). DXP acquired this business to expand DXP's geographic presence in the eastern U.S. and strengthen DXP's metal working and supply chain services offerings. DXP paid approximately $15.6 million for KC, which was borrowed under our then-existing credit facility.
On December 30, 2011, DXP acquired substantially all of the assets of C.W. Rod Tool Company ("CW Rod"). DXP acquired this business to strengthen DXP's metal working offering in Texas and Louisiana. DXP paid approximately $1.1 million of DXP's common stock (35,714 shares) and approximately $42 million in cash for CW Rod, which was borrowed during 2011 and 2012 under our then-existing credit facility.
On January 31, 2012, DXP acquired substantially all of the assets of Mid-Continent Safety ("Mid-Continent"). DXP acquired this business to expand DXP's geographic presence in the Midwestern U.S. and strengthen DXP's safety products offering. DXP paid approximately $3.7 million for Mid-Continent, which was borrowed under our then-existing credit facility.
On February 29, 2012, DXP acquired substantially all of the assets of Pump & Power Equipment, Inc. ("Pump & Power"). DXP acquired this business to expand DXP's geographic presence in the Midwestern U.S. and strengthen DXP's municipal pump products and services offering. DXP paid approximately $1.9 million for Pump & Power which was borrowed under our then-existing credit facility.
On April 2, 2012, DXP acquired the stock of Aledco, Inc. ("Aledco") and Force Engineered Products, Inc. (“Force”). DXP acquired this business to establish a presence within the Marcellus Shale, as well as the Northeast United States industrial rotating equipment market. DXP paid approximately $8.1 million for Aledco and Force which was borrowed under our then-existing credit facility.
On May 1, 2012, DXP completed the acquisition of Industrial Paramedic Services, Ltd. (“Industrial Paramedic Services”) through its wholly owned subsidiary, DXP Canada Enterprises Ltd. Industrial Paramedic Services is a provider of industrial medical and safety services to industrial customers operating in remote locations and large facilities in western Canada. DXP acquired this business to expand DXP's geographic presence into Canada and to expand our safety services offering. Industrial Paramedic Services is headquartered in Calgary, Alberta and operates out of three locations in Calgary, Nisku and Dawson Creek, Canada. The $25.3 million purchase price was financed with $20.6 million of borrowings under DXP's then-existing credit facility, $2.5 million of promissory notes bearing a 5% interest rate and 19,685 shares of DXP common stock.
On May 31, 2012, DXP completed the acquisition of Austin and Denholm Industrial Sales Alberta, Inc (“ADI”). DXP acquired this business to expand our presence in pumping solutions in Western Canada. DXP Canada Enterprises Ltd., acquired all of the outstanding common shares of ADI for $2.7 million which was borrowed under our then-existing credit facility.
On July 11, 2012, DXP completed the acquisition of HSE Integrated Ltd. (“HSE"). DXP Canada Enterprises Ltd. acquired all of the outstanding common shares of HSE by way of a plan of arrangement under the
Business Corporations Act
(Alberta) (the "Arrangement"). Pursuant to the Arrangement, HSE shareholders received CDN $1.80 in cash per each common share of HSE held. The total transaction value was approximately $85 million, including approximately $4 million in debt and approximately $3 million in transaction costs. The purchase price was financed with borrowings under our then-existing credit facility. DXP acquired HSE to expand our industrial health and safety services offering in Canada and the United States.
On October 1, 2012, DXP acquired substantially all of the assets of Jerzy Supply, Inc. (“Jerzy”). DXP acquired this business in the Southern U.S. to strengthen DXP's industrial and hydraulic hose offering. DXP paid approximately $5.3 million for Jerzy, which was borrowed under our then-existing credit facility.
On April 16, 2013, DXP acquired all of the stock of National Process Equipment Inc. (“NatPro”) through its wholly owned subsidiary, DXP Canada Enterprises Ltd. DXP acquired this business to expand DXP’s geographic presence in Canada and strengthen DXP’s pump, integrated system packaging, compressor, and related equipment offering. The $40.1 million purchase price was financed with $36.6 million of borrowings under our then-existing credit facility and 52,542 shares of DXP common stock. Additionally, the purchase agreement included an earn-out provision, which stated that former owners of NatPro may earn CDN $6.0 million based on achievement of an earnings target during the first year of DXP’s ownership. The fair value of the earn-out recorded at the acquisition date was $2.8 million. As of December 31, 2013 the $2.8 million accrued liability associated with this earn-out provision was reversed and included in 2013 operating income. See Note 8 of the financial statements regarding the 2014 impairment of NatPro assets.
On May 17, 2013, DXP acquired substantially all of the assets of Tucker Tool Company, Inc. (“Tucker Tool”). DXP acquired this business to expand DXP's geographic presence in the northern U.S. and strengthen DXP's industrial cutting tools offering. DXP paid approximately $5.0 million for Tucker Tool which was borrowed under our then-existing credit facility.
On July 1, 2013, DXP acquired all of the stock of Alaska Pump & Supply, Inc. (APS). DXP acquired this business to expand DXP's geographic presence in Alaska. DXP paid approximately $13.0 million for APS which was borrowed under our then-existing credit facility.
On July 31, 2013, DXP acquired substantially all of the assets of Tool-Tech Industrial Machine & Supply, Inc. (“Tool-Tech”). DXP acquired this business to enhance our metal working product offering in the southwest region of the United States. DXP paid approximately $7.2 million for Tool-Tech which was borrowed under our then-existing credit facility.
On January 2, 2014, the Company acquired all of the equity securities and units of
B27, LLC (“B27”). DXP acquired this business to expand DXP’s pump packaging offering
. The total transaction value was approximately $304.9 million, including working capital payments and excluding approximately $1.0 million in transaction costs. The purchase price was financed with borrowings under our then-existing credit facility and approximately $4.0 million (36,000 shares) of DXP common stock. See Note 8 of the Notes to Consolidated Financial Statements regarding the 2014 and 2015 impairments of B27 goodwill. After the acquisition of B27, there was a working capital dispute between the Company and the sellers. During the third quarter of 2015, an accounting expert issued his report on the working capital dispute between DXP and the sellers of B27. The report required DXP to pay the sellers of B27 an additional $11.3 million. Because the time period to allow adjustments of purchase accounting had expired, $7.3 million of the payment was expensed. The remaining $4.0 million of the required payment represents tax refunds, and the $3.6 million federal portion of the refunds has been received.
On May 1, 2014, the Company completed the acquisition of all of the equity interests of Machinery Tooling and Supply, LLC (MT&S) to expand DXP’s cutting tools offering in the North Central region of the United States. DXP paid approximately $14.7 million for MT&S, which was borrowed under our then-existing credit facility.
On April 1, 2015, the Company completed the acquisition of all of the equity interests of Tool Supply, Inc. (“TSI”) to expand DXP’s cutting tools offering in the Northwest region of the United States. DXP paid approximately $5.0 million for TSI, which was borrowed under our then-existing credit Facility.
On September 1, 2015, the Company completed the acquisition of all of the equity interests of Cortech Engineering, LLC (“Cortech”) to expand DXP’s rotating equipment offering to the Western seaboard. DXP paid approximately $14.9 million for Cortech. The purchase was financed with borrowings under our then-existing credit facility as well as $4.4 million (148.8 thousand shares) of DXP common stock.
Competition
Our business is highly competitive. In the Service Centers segment we compete with a variety of industrial supply distributors, some of which may have greater financial and other resources than we do. Some of our competitors are small enterprises selling to customers in a limited geographic area. We also compete with catalog distributors, large warehouse stores and, to a lesser extent, manufacturers. While many of our competitors offer traditional distribution of some of the product groupings that we offer, we are not aware of any major competitor that offers on a non-catalog basis a variety of products and services as broad as our offerings. Further, while certain catalog distributors provide product offerings as broad as ours, these competitors do not offer the product application, technical expertise and after-the-sale services that we provide. In the Supply Chain Services segment we compete with larger distributors that provide integrated supply programs and outsourcing services, some of which might be able to supply their products in a more efficient and cost-effective manner than we can provide. In the Innovative Pumping Solutions segment we compete against a variety of manufacturers, distributors and fabricators, many of which may have greater financial and other resources than we do. We generally compete on expertise, responsiveness and price in all of our segments.
Insurance
We maintain liability and other insurance that we believe to be customary and generally consistent with industry practice. We retain a portion of the risk for medical claims, general liability, worker’s compensation and property losses. The various deductibles of our insurance policies generally do not exceed $250,000 per occurrence. There are also certain risks for which we do not maintain insurance. There can be no assurance that such insurance will be adequate for the risks involved, that coverage limits will not be exceeded or that such insurance will apply to all liabilities. The occurrence of an adverse claim in excess of the coverage limits that we maintain could have a material adverse effect on our financial condition and results of operations. The premiums for insurance have increased significantly over the past three years. This trend could continue. Additionally, we are partially self-insured for our group health plan, worker’s compensation, auto liability and general liability insurance. The cost of claims for the group health plan has increased over the past three years. This trend is expected to continue.
Government Regulation and Environmental Matters
We are subject to various laws and regulations relating to our business and operations, and various health and safety regulations including those established by the Occupational Safety and Health Administration and Canadian Occupational Health and Safety.
Certain of our operations are subject to federal, state and local laws and regulations as well as provincial regulations controlling the discharge of materials into or otherwise relating to the protection of the environment.
Although we believe that we have adequate procedures to comply with applicable discharge and other environmental laws, such laws and regulations could result in costs to remediate releases of regulated substances into the environment or costs to remediate sites to which we sent regulated substances for disposal. In some cases, these laws can impose strict liability for the entire cost of clean-up on any responsible party without regard to negligence or fault and impose liability on us for the conduct of others or conditions others have caused, or for our acts that complied with all applicable requirements when we performed them. New laws have been enacted and regulations are being adopted by various regulatory agencies on a continuing basis and the costs of compliance with these new laws can only be broadly appraised until their implementation becomes more defined.
The risks of accidental contamination or injury from the discharge of controlled or hazardous materials and chemicals cannot be eliminated completely. In the event of such a discharge, we could be held liable for any damages that result, and any such liability could have a material adverse effect on us. We are not currently aware of any situation or condition that we believe is likely to have a material adverse effect on our results of operations or financial condition.
Employees
At December 31, 2015, DXP had approximately 3,234 full-time employees. We believe that we maintain positive relationships with all of our employees. Less than two percent (2%) of our employees are unionized.
Background of Executive Officers
The following is a list of DXP’s executive officers, their age, positions, and a description of each officer’s business experience as of February 29, 2016. All of our executive officers hold office at the pleasure of DXP’s Board of Directors.
|
NAME
|
POSITION
|
AGE
|
|
David R. Little
|
Chairman of the Board, President and Chief Executive Officer
|
64
|
|
Mac McConnell
|
Senior Vice President/Finance, Chief Financial Officer and Secretary
|
62
|
|
David C. Vinson
|
Senior Vice President/Innovative Pumping Solutions
|
65
|
|
John J. Jeffery
|
Senior Vice President/Supply Chain Services & Marketing
|
48
|
|
Todd Hamlin
|
Senior Vice President/Service Centers
|
44
|
|
Kent Yee
|
Senior Vice President/Corporate Development
|
40
|
|
Wayne Crane
|
Senior Vice President/Information Technology
|
53
|
|
Gary Messersmith
|
Senior Vice President/General Counsel
|
67
|
David R. Little
. Mr. Little has served as Chairman of the Board, President and Chief Executive Officer of DXP since its organization in 1996 and also has held these positions with SEPCO Industries, Inc., predecessor to the Company (“SEPCO”), since he acquired a controlling interest in SEPCO in 1986. Mr. Little has been employed by SEPCO since 1975 in various capacities, including Staff Accountant, Controller, Vice President/Finance and President. Mr. Little gives our Board insight and in-depth knowledge of our industry and our specific operations and strategies. He also provides leadership skills and knowledge of our local community and business environment, which he has gained through his long career with DXP and its predecessor companies.
Mac McConnell.
Mr. McConnell was elected Senior Vice President/Finance and Chief Financial Officer in September 2000. From February 1998 until September 2000, Mr. McConnell served as Senior Vice President, Chief Financial Officer and a director of Transportation Components, Inc., a NYSE-listed distributor of truck parts. From December 1992 to February 1998, he served as Chief Financial Officer of Sterling Electronics Corporation, a NYSE-listed electronics parts distributor, which was acquired by Marshall Industries, Inc. in 1998. From 1990 to 1992, Mr. McConnell was Vice President-Finance of Interpak Holdings, Inc., a publicly-traded company involved in packaging and warehousing thermoplastic resins. From 1976 to 1990, he served in various capacities, including as a partner, with Ernst & Young LLP.
David C. Vinson.
Mr. Vinson was elected Senior Vice President/Innovative Pumping Solutions in January 2006. He served as Senior Vice President/Operations of DXP from October 2000 to December 2005. From 1996 until October 2000, Mr. Vinson served as Vice President/Traffic, Logistics and Inventory. Mr. Vinson has served in various capacities with DXP since his employment in 1981.
John J. Jeffery
. Mr. Jeffery serves as Senior Vice President of Supply Chain Services, Marketing and Information Technology. He oversees the strategic direction for the Supply Chain Services business unit while leveraging both Marketing and Information Technology to drive innovative business development initiatives for organizational growth and visibility. He began his career with T.L. Walker, which was later acquired by DXP in 1991. During his tenure with DXP, Mr. Jeffery has served in various significant capacities including branch, area, regional and national sales management as well as sales, marketing and Service Center vice president roles. He holds a Bachelor of Science in Industrial Distribution from Texas A&M University and is also a graduate of the Executive Business Program at Rice University.
Todd Hamlin.
Mr. Hamlin was elected Senior Vice President of DXP Service Centers in June of 2010. Mr. Hamlin joined the Company in 1995. From February 2006 until June 2010 he served as Regional Vice President of the Gulf Coast Region. Prior to serving as Regional Vice President of the Gulf Coast Region he served in various capacities, including application engineer, product specialist and sales representative. From April 2005 through February 2006, Mr. Hamlin worked as a sales manager for the UPS Supply Chain Services division of United Parcel Service, Inc. He holds a Bachelors of Science in Industrial Distribution from Texas A&M University and a Master in Distribution from Texas A&M University. Mr. Hamlin serves on the Advisory Board for Texas A&M’s Master in Distribution degree program. In 2014, Mr. Hamlin was elected to the Bearing Specialists Association’s Board of Directors.
Kent Yee
. Mr. Yee currently serves as Senior Vice President Corporate Development and leads DXP's mergers and acquisitions, business integration and internal strategic project activities. During March 2011, Mr. Yee joined DXP from Stephens Inc.'s Industrial Distribution and Services team where he served in various positions and most recently as Vice President from August 2005 to February 2011. Prior to Stephens, Mr. Yee was a member of The Home Depot’s Strategic Business Development Group with a primary focus on acquisition activity for HD Supply. Mr. Yee was also an Associate in the Global Syndicated Finance Group at JPMorgan Chase. He has executed over 43 transactions including more than $1.4 billion in M&A and $3.4 billion in financing transactions primarily for change of control deals and numerous industrial and distribution acquisition and sale assignments. He holds a Bachelors of Arts in Urban Planning from Morehouse College and an MBA from Harvard University Graduate School of Business.
Wayne Crane
.
Wayne Crane currently serves as Senior Vice President and Chief Information Officer and leads DXP's information technology and telecommunications activities. Joining DXP in August 2011, Mr. Crane offers 25 years’ experience directing business and technology transformation for Fortune 1000 corporations and other technology based companies.
Prior to DXP, Mr. Crane served as Chief Information Officer for CDS Global, a global technology solutions provider and wholly owned subsidiary of the Hearst Corporation. Until 2008, Mr. Crane served as CIO for the Attachmate/NetIQ, a publically traded systems and security management software company, where he was responsible for all technology efforts, including several business and product lines. Previously, Mr. Crane managed global technology efforts for BJ Services Company, a publicly traded oilfield services company. Mr. Crane holds a Master of Computer Science degree and an MBA.
Gary Messersmith
. Mr. Messersmith serves as Senior Vice President and General Counsel of DXP Enterprises, Inc. Mr. Messersmith joined DXP on January 1, 2013 after practicing law for more than 39 years with Looper Reed & McGraw and with Fouts & Moore. During this period, Mr. Messersmith’s practice included corporate, real estate and oil and gas matters. From 1982 until 2001, Gary served as Managing Partner of Fouts & Moore. Gary obtained his Bachelor of Science Degree in Finance from Indiana University in 1971 and his J.D. from South Texas School of Law in 1975.
All officers of DXP hold office until the regular meeting of the board of directors following the Annual Meeting of Shareholders or until their respective successors are duly elected and qualified or their earlier resignation or removal.
Available Information
Our Annual Report on Form 10-K, Quarterly Reports on Form 10-Q, Current Reports on Form 8-K, and amendments to those reports filed or furnished pursuant to Section 13(a) or 15(d) of the Securities Exchange Act of 1934 as amended (the “Exchange Act”), are available free of charge through our Internet website (
www.dxpe.com
) as soon as reasonably practicable after we electronically file such material with, or furnish it to, the Securities and Exchange Commission. Additionally, we make the following available free of charge through our Internet website
ir.dxpe.com
:
|
-
|
DXP Code of Ethics for Senior Financial Officers;
|
|
-
|
DXP Code of Conduct;
|
|
-
|
Compensation Committee Charter;
|
|
-
|
Nominating and Governance Committee Charter; and
|
|
-
|
Audit Committee Charter
|
We are subject to various risks and uncertainties in the course of our business. Investing in DXP involves risk. In deciding whether to invest in DXP, you should carefully consider the risk factors below as well as those matters referenced in the foregoing pages under “Disclosure Regarding Forward-Looking Statements” and other information included and incorporated by reference into this Report and other reports and materials filed by us with the Securities and Exchange Commission. Any of these risk factors could have a significant or material adverse effect on our businesses, results of operations, financial condition or liquidity. They could also cause significant fluctuations and volatility in the trading price of our securities. Readers should not consider any descriptions of these factors to be a complete set of all potential risks that could affect DXP. Further, many of these risks are interrelated and could occur under similar business and economic conditions, and the occurrence of certain of them may in turn cause the emergence or exacerbate the effects of others. Such a combination could materially increase the severity of the impact of these risks on our results of operations, liquidity and financial condition.
Decreased capital expenditures in the energy industry can adversely impact our customers’ demand for our products and services.
A significant portion of our revenue depends upon the level of capital and operating expenditures in the oil and natural gas industry, including capital expenditures in connection with the upstream, midstream, and downstream phases in the energy industry. Therefore, a significant decline in oil or natural gas prices could lead to a decrease in our customers’ capital and other expenditures and could adversely affect our revenues.
Demand for our products could decrease if the manufacturers of those products sell them directly to end users.
Typically, MRO products
have been purchased through distributors and not directly from the manufacturers of those products. If customers were to purchase our products directly from manufacturers, or if manufacturers sought to increase their efforts to sell directly to end users, we could experience a significant decrease in sales and earnings.
Changes in our customer and product mix, or adverse changes to the cost of goods we sell, could cause our gross margin percentage to fluctuate or decrease, and we may not be able to maintain historical margins.
Changes in our customer mix have resulted from geographic expansion, daily selling activities within current geographic markets, and targeted selling activities to new customers. Changes in our product mix have resulted from marketing activities to existing customers and needs communicated to us from existing and prospective customers. There can be no assurance that we will be able to maintain our historical gross margins. In addition, we may also be subject to price increases from vendors that we may not be able to pass along to our customers.
We rely upon third-party transportation providers for our merchandise shipments and are subject to increased shipping costs as well as the potential inability of our third-party transportation providers to deliver products on a timely basis.
We rely upon independent third-party transportation providers for our merchandise shipments, including shipments to and from all of our service centers. Our utilization of these delivery services for shipments is subject to risks, including increases in fuel prices, labor availability, labor strikes and inclement weather, which may impact a shipping company’s ability to provide delivery services that adequately meet our shipping needs. If we change the shipping companies we use, we could face logistical difficulties that could adversely affect deliveries and we would incur costs and expend resources in connection with such change. In addition, we may not be able to obtain favorable terms as we have with our current third-party transportation providers.
Adverse weather events or natural disasters could negatively disrupt our operations.
Certain areas in which we operate are susceptible to adverse weather conditions or natural disasters, such as hurricanes, tornadoes, floods and earthquakes. These events can disrupt our operations, result in damage to our properties and negatively affect the local economies in which we operate. Additionally, we may experience communication disruptions with our customers, vendors and employees.
We cannot predict whether or to what extent damage caused by these events will affect our operations or the economies in regions where we operate. These adverse events could result in disruption of our purchasing or distribution capabilities, interruption of our business that exceeds our insurance coverage, our inability to collect from customers and increased operating costs. Our business or results of operations may be adversely affected by these and other negative effects of these events.
The loss of or the failure to attract and retain key personnel could adversely impact our results of operations.
The loss of the services of any of the executive officers of the Company could have a material adverse effect on our financial condition and results of operations. In addition, our ability to grow successfully will be dependent upon our ability to attract and retain qualified management and technical and operational personnel. The failure to attract and retain such persons could materially adversely affect our financial condition and results of operations.
The loss of any key supplier could adversely affect DXP’s sales and profitability.
We have distribution rights for certain product lines and depend on these distribution rights for a substantial portion of our business. Many of these distribution rights are pursuant to contracts that are subject to cancellation upon little or no prior notice. Although we believe that we could obtain alternate distribution rights and/or sources of similar products in the event of such a cancellation, the termination or limitation by any key supplier of its relationship with the Company could result in a temporary disruption of our business and, in turn, could adversely affect our results of operations and financial condition.
We are subject to various government regulations.
We are subject to laws and regulations in every jurisdiction where we operate. Compliance with laws and regulations increases our cost of doing business. We are subject to a variety of laws and regulations, including without limitation import and export requirements, the Foreign Corrupt Practices Act, tax laws (including U.S. taxes on our foreign subsidiaries), data privacy requirements, labor laws and anti-competition regulations. We are also subject to audits and inquiries in the ordinary course of business. Changes to the legal and regulatory environments could increase the cost of doing business, and such costs may increase in the future as a result of changes in these laws and regulations or in their interpretation. Although we have implemented policies and procedures designed to comply with laws and regulations, there can be no assurance that employees, contractors or agents will not violate such laws and regulations. Any such violations could individually or in the aggregate materially adversely affect our financial condition or results of operations.
We are subject to environmental, health and safety laws and regulations.
We are subject to federal, state, local, foreign and provincial environmental, health and safety laws and regulations. Fines and penalties may be imposed for non-compliance with applicable environmental, health and safety requirements and the failure to have or to comply with the terms and conditions of required permits. The failure by us to comply with applicable environmental, health and safety requirements could result in fines, penalties, enforcement actions, third party claims for property damage and personal injury, requirements to clean up property or to pay for the costs of cleanup, or regulatory or judicial orders requiring corrective measures.
A general slowdown in the economy could negatively impact DXP’s sales growth.
Economic and industry trends affect DXP’s business. Demand for our products is subject to economic trends affecting our customers and the industries in which they compete in particular. Many of these industries, such as the oil and gas industry, are subject to volatility while others, such as the petrochemical industry, are cyclical and materially affected by changes in the economy. As a result, demand for our products could be adversely impacted by changes in the markets of our customers. We traditionally do not enter into long-term contracts with our customers.
Risks Associated With Conducting Business in Foreign Countries
We conduct a meaningful amount of business outside of the United States of America. We could be adversely affected by economic, legal, political and regulatory developments in countries that we conduct business in. We have meaningful operations in Canada in which the functional currency is denominated in Canadian dollars. As the value of currencies in foreign countries in which we have operations increases or decreases related to the U.S. dollar, the sales, expenses, profits, losses assets and liabilities of our foreign operations, as reported in our consolidated financial statements, increase or decrease, accordingly.
The trading price of our common stock may be volatile.
The market price of our common stock could be subject to wide fluctuations in response to, among other things, the risk factors described in this and other periodic reports, and other factors beyond our control, such as fluctuations in the valuation of companies perceived by investors to be comparable to us. Furthermore, the stock markets have experienced price and volume fluctuations that have affected and continue to affect the market prices of equity securities of many companies. These fluctuations often have been unrelated or disproportionate to the operating performance of those companies. These broad market and industry fluctuations, as well as general economic, political, and market conditions, such as recessions, interest rate changes or international currency fluctuations, may negatively affect the market price of our common stock. In the past, many companies that have experienced volatility in the market price of their stock have been subject to securities class action litigation. We may be the target of this type of litigation in the future. Securities litigation against us could result in substantial costs and divert our management's attention from other business concerns, which could adversely affect our business.
Our future results will be impacted by our ability to implement our internal growth strategy.
Our future results will depend in part on our success in implementing our internal growth strategy, which includes expanding our existing geographic areas, selling additional products to existing customers and adding new customers. Our ability to implement this strategy will depend on our success in selling more products and services to existing customers, acquiring new customers, hiring qualified sales persons, and marketing integrated forms of supply management such as those being pursued by us through our SmartSource
SM
program. Although we intend to increase sales and product offerings to existing customers, there can be no assurance that we will be successful in these efforts. Additionally, we sell products and services in very competitive markets. We could experience a material adverse effect to the extent that our competitors are successful in reducing our customers’ purchases of products and services from us. Competition could also cause us to lower our prices, which could reduce our margins and profitability. Consolidation in our industry could heighten the impacts of competition on our business and results of operations discussed above. The fact that we do not traditionally enter into long-term contracts with our suppliers or customers may provide opportunities for our competitors.
We are subject to personal injury and product liability claims involving allegedly defective products.
A variety of products we distribute are used in potentially hazardous applications that can result in personal injury and product liability claims. A catastrophic occurrence at a location where the products we distribute are used may result in us being named as a defendant in lawsuits asserting potentially large claims and applicable law may render us liable for damages without regard to negligence or fault.
Risks Associated With Acquisition Strategy
Our future results will depend in part on our ability to successfully implement our acquisition strategy.
We may not be able to consummate acquisitions at rates similar to the past, which could adversely impact our growth rate and stock price.
This strategy includes taking advantage of a consolidation trend in the industry and effecting acquisitions of businesses with complementary or desirable product lines, strategic distribution locations, attractive customer bases or manufacturer relationships.
Promising acquisitions are difficult to identify and complete for a number of reasons, including high valuations, competition among prospective buyers, the need for regulatory (including antitrust) approvals and the availability of affordable funding in the capital markets. In addition, competition for acquisitions in our business areas is significant and may result in higher purchase prices. Changes in accounting or regulatory requirements or instability in the credit markets could also adversely impact our ability to consummate acquisitions.
In addition, acquisitions involve a number of special risks, including possible adverse effects on our operating results, diversion of management’s attention, failure to retain key personnel of the acquired business, difficulties in integrating operations, technologies, services and personnel of acquired companies, potential loss of customers of acquired companies, preserving business relationships of the acquired companies, risks associated with unanticipated events or liabilities, and expenses associated with obsolete inventory of an acquired business, some or all of which could have a material adverse effect on our business, financial condition and results of operations.
Our ability to grow at or above our historic rates depends in part upon our ability to identify and successfully acquire and integrate companies and businesses at appropriate prices and realize anticipated cost savings.
Risks Related to Acquisition Financing
We may need to finance acquisitions by using shares of Common Stock for a portion or all of the consideration to be paid. In the event that the Common Stock does not maintain a sufficient market value, or potential acquisition candidates are otherwise unwilling to accept Common Stock as part of the consideration for the sale of their businesses, we may be required to use more of our cash resources, if available, to maintain our acquisition program. These cash resources may include borrowings under our credit agreement or equity or debt financings. Our current credit agreement with our bank lenders contains certain restrictions that could adversely affect our ability to implement and finance potential acquisitions. Such restrictions include provisions which limit our ability to merge or consolidate with, or acquire all or a substantial part of the properties or capital stock of, other entities without the prior written consent of the lenders. There can be no assurance that we will be able to obtain the lenders’ consent to any of our proposed acquisitions. If we do not have sufficient cash resources, our growth could be limited unless we are able to obtain additional capital through debt or equity financings.
Ability to Comply with Financial Covenants of Credit Facility
Our credit facility requires the Company to comply with certain specified covenants, restrictions, financial ratios and other financial and operating tests. The Company’s ability to comply with any of the foregoing restrictions will depend on its future performance, which will be subject to prevailing economic conditions and other factors, including factors beyond the Company’s control. A failure to comply with any of these obligations could result in an event of default under the credit facility, which could permit acceleration of the Company’s indebtedness under the credit facility. The Company from time to time has been unable to comply with some of the financial covenants contained in the credit facility (relating to, among other things, the maintenance of prescribed financial ratios) and has, when necessary, obtained waivers or amendments to the covenants from its lenders. There can be no assurance that in the future the Company will be able to comply with the covenants or, if is not able to do so, that its lenders will be willing to waive such non-compliance or further amend such covenants. The Company currently believes that it may not be able to comply with some of the financial covenants in its credit facility in the next quarter unless it is able to amend its credit facility or obtain alternative financing. If it is unable to comply with those financial covenants or obtain a waiver or amendment of those covenants or obtain alternative financing, the Company’s business and financial condition would be adversely affected.
Ability to Refinance
We may not be able to refinance existing debt or the terms of any refinancing may not be as favorable as the terms of our existing debt. If principal payments due upon default or at maturity cannot be refinanced, extended or repaid with proceeds from other sources, such as new equity capital, our cash flow may not be sufficient to repay all maturing debt in years when significant payments come due.
Goodwill and intangible assets recorded as a result of our acquisitions could become impaired.
Goodwill represents the difference between the purchase price of acquired companies and the related fair values of net assets acquired. We test goodwill for impairment annually and whenever events or changes in circumstances indicate that impairment may have occurred. Goodwill and intangibles represent a significant amount of our total assets.
As of December 31, 2015, our combined goodwill and intangible assets amounted to $309.7 million, net of accumulated amortization. To the extent we do not generate sufficient cash flows to recover the net amount of any investments in goodwill and other intangible assets recorded, the investment could be considered impaired and subject to write-off which would directly impact earnings. We expect to record additional goodwill and other intangible assets as a result of future business acquisitions. Future amortization of such other intangible assets or impairments, if any, of goodwill or intangible assets would adversely affect our results of operations in any given period. See Note 8 of the Notes to Consolidated Financial Statements regarding the 2014 and 2015 impairments of B27 and NatPro goodwill and intangible assets.
Our business has substantial competition that could adversely affect our results.
Our business is highly competitive. We compete with a variety of industrial supply distributors, some of which may have greater financial and other resources than us. Although many of our traditional distribution competitors are small enterprises selling to customers in a limited geographic area, we also compete with larger distributors that provide integrated supply programs such as those offered through outsourcing services similar to those that are offered by our SCS segment. Some of these large distributors may be able to supply their products in a more timely and cost-efficient manner than us. Our competitors include catalog suppliers, large warehouse stores and, to a lesser extent, certain manufacturers. Competitive pressures could adversely affect DXP’s sales and profitability.
Interruptions in the proper functioning of our information systems could disrupt operations and cause increases in costs and/or decreases in revenues.
The proper functioning of DXP’s information systems is critical to the successful operation of our business. Although DXP’s information systems are protected through physical and software safeguards and remote processing capabilities exist, our information systems are still vulnerable to natural disasters, power losses, telecommunication failures and other problems. If critical information systems fail or are otherwise unavailable, DXP’s ability to procure products to sell, process and ship customer orders, identify business opportunities, maintain proper levels of inventories, collect accounts receivable and pay accounts payable and expenses could be adversely affected.
Risks Associated with Insurance
In the ordinary course of business we at times may become the subject of various claims, lawsuits or administrative proceedings seeking damages or other remedies concerning our commercial operations, the products we distribute, employees and other matters, including potential claims by individuals alleging exposure to hazardous materials as a result of the products we distribute or our operations. Some of these claims may relate to the activities of businesses that we have acquired, even though these activities may have occurred prior to acquisition. The products we distribute are subject to inherent risks that could result in personal injury, property damage, pollution, death or loss of production. Any defects in the products we distribute could result in personal injury, death, property damage, pollution or loss of production.
We maintain insurance to cover potential losses, and we are subject to various deductibles and caps under our insurance. It is possible, however, that judgments could be rendered against us in cases in which we would be uninsured and beyond the amounts that we currently have reserved or anticipate incurring for such matters. Even a partially uninsured claim, if successful and of significant size, could have a material adverse effect on our business, results of operations and financial condition. Furthermore, we may not be able to continue to obtain insurance on commercially reasonable terms in the future, and we may incur losses from interruption of our business that exceed our insurance coverage. In cases where we maintain insurance coverage, our insurers may raise various objections and exceptions to coverage which could make uncertain the timing and amount of any possible insurance recovery.
Risks Associated with Cyber-Security
Through our sales channels and electronic communications with customers generally, we collect and maintain confidential information that
customers provide to us in order to purchase products or services. We also acquire and retain information about suppliers and employees in the
normal course of business. Computer hackers may attempt to penetrate
our information systems or our vendors' information systems and, if successful, misappropriate confidential customer, supplier, employee or other
business information. In addition, one of our employees, contractors or other third party may attempt to
circumvent security measures in order to obtain such information or inadvertently cause a breach involving such information. Loss of information could expose us to
claims from customers, suppliers, financial institutions, regulators, payment card associations, employees and other persons, any of which
could have an adverse effect on our financial condition and results of operations.
None.
We own our headquarters facility in Houston, Texas, which has approximately 48,000 square feet of office space. At December 31, 2015, we had approximately 191 facilities which contained 171 services centers, 8 distribution centers and 12 fabrication facilities.
At December 31, 2015, the Service Centers segment owned or leased 171 service center
facilities. Of these facilities, 137 were located in the U.S. in 35 states, 32 were located in 9 Canadian provinces, one was located in Sonora, Mexico and one was located in Dubai. All of the distribution centers were located in the U.S., specifically in California, Georgia, Illinois, Massachusetts, Montana, Nebraska, and Texas. At December 31, 2015, the Innovative Pumping Solutions segment operated out of 12 fabrication facilities located in 5 states in the U.S. and two provinces in Canada. At December 31, 2015, the Supply Chain Services segment operated supply chain installations in 69 of our customers’ facilities in 28 U.S. states.
At December 31, 2015, our owned facilities ranged from 5,000 square feet to 48,000 square feet in size. We leased facilities for terms generally ranging from one to fifteen years. The leased facilities ranged from approximately 500 square feet to 170,000 square feet in size. The leases provide for periodic specified rental payments and certain leases are renewable at our option. We believe that our facilities are suitable and adequate for the needs of our existing business. We believe that if the leases for any of our facilities were not renewed, other suitable facilities could be leased with no material adverse effect on our business, financial condition or results of operations.
From time to time, the Company is a party to various legal proceedings arising in the ordinary course of business. While DXP is unable to predict the outcome of these lawsuits, it believes that the ultimate resolution will not have, either individually or in the aggregate, a material adverse effect on DXP’s business, consolidated financial position, cash flows, or results of operations.
Not applicable.
PART II
| ITEM 5. | Market for the Registrant's Common Equity, Related Shareholder Matters and Issuer Purchases of Equity Securities |
Our common stock trades on The NASDAQ Global Select Market under the stock symbol "DXPE".
The following table sets forth on a per share basis the high and low sales prices for our common stock as reported by NASDAQ for the periods indicated:
|
High
|
Low
|
|||||||
|
2015
|
||||||||
|
Fourth Quarter
|
$
|
33.44
|
$
|
22.66
|
||||
|
Third Quarter
|
$
|
45.26
|
$
|
26.32
|
||||
|
Second Quarter
|
$
|
48.85
|
$
|
39.94
|
||||
|
First Quarter
|
$
|
50.20
|
$
|
39.19
|
||||
|
2014
|
||||||||
|
Fourth Quarter
|
$
|
73.30
|
$
|
44.74
|
||||
|
Third Quarter
|
$
|
82.81
|
$
|
69.12
|
||||
|
Second Quarter
|
$
|
113.21
|
$
|
64.58
|
||||
|
First Quarter
|
$
|
112.00
|
$
|
91.07
|
||||
On February 29, 2016, we had approximately registered 410 holders of record for outstanding shares of our common stock. This number does not include shareholders for whom shares are held in “nominee” or “street name”.
We anticipate that future earnings will be retained to finance the continuing development of our business. In addition, our bank credit facility prohibits us from declaring or paying any cash dividends or other distributions on our capital stock, except for the monthly $0.50 per share dividend on our Series B convertible preferred stock, which amounts to $90,000 in the aggregate per year. Accordingly, we do not anticipate paying cash dividends on our common stock in the foreseeable future. The payment of any future dividends will be at the discretion of our Board of Directors and will depend upon, among other things, future earnings, the success of our business activities, regulatory and capital requirements, lenders, and general financial and business conditions.
Stock Performance
The following performance graph compares the performance of DXP Common Stock to the NASDAQ Industrial Index and the NASDAQ Composite (US). The graph assumes that the value of the investment in DXP Common Stock and in each index was $100 at December 31, 2010 and that all dividends were reinvested.
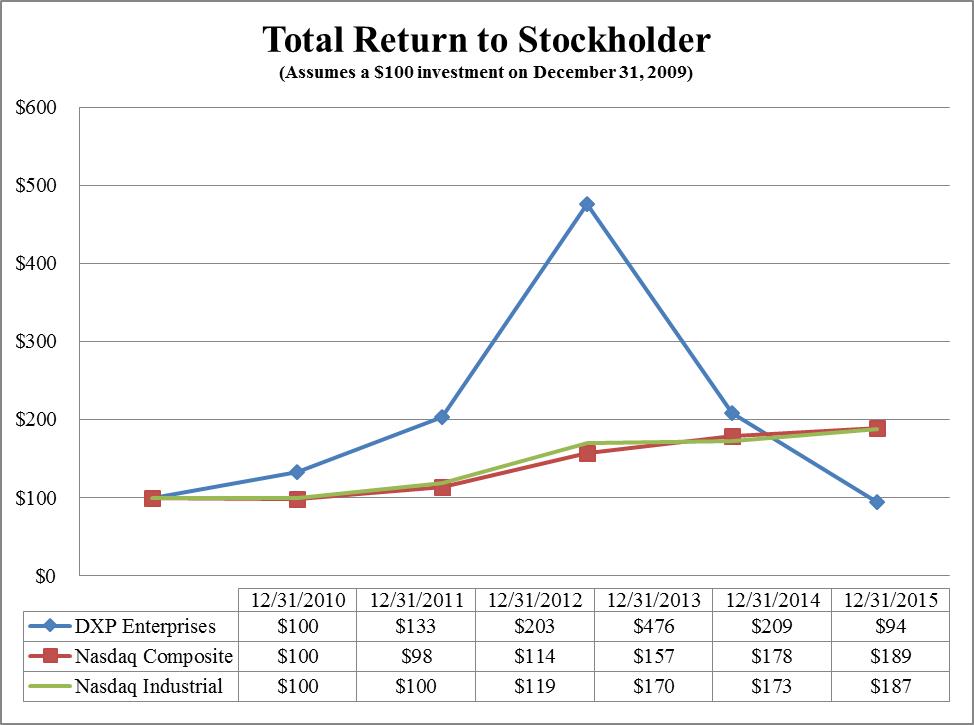
Investors are cautioned against drawing conclusions from the data contained in the graph above as past results are not necessarily indicative of future performance.
Equity Compensation Table
The following table provides information regarding shares covered by the Company’s equity compensation plans as of December 31, 2015:
|
Plan category
|
Number
of Securities
to be issued
upon exercise
of outstanding
options
|
Weighted
average
exercise
price of
outstanding
options
|
Non-vested
restricted
shares
outstanding
|
Weighted
average
grant
price
|
Number of
securities
remaining
available for
future
issuance
under equity
compensation
plans
|
|||||||||||||||
|
Equity compensation plans approved by shareholders
|
N/A
|
|
N/A
|
|
126,657
|
$
|
55.54
|
81,527
(1)
|
|
|||||||||||
|
Equity compensation plans not approved by shareholders
|
N/A
|
|
N/A
|
|
N/A
|
|
N/A
|
|
N/A
|
|
||||||||||
|
Total
|
N/A
|
|
N/A
|
|
126,657
|
$
|
55.54
|
81,527
(1)
|
|
|||||||||||
|
(1) Represents shares of common stock authorized for issuance under the 2005 Restricted Stock Plan.
|
||||||||||||||||||||
Unregistered Shares
DXP issued 52,542 unregistered shares of DXP Common Stock as part of the consideration for the April 16, 2013 acquisition of NatPro. The unregistered shares were issued to certain sellers of NatPro.
DXP issued 36,000 unregistered shares of DXP Common Stock as part of the consideration for the January 2, 2014 acquisition of B27. The unregistered shares were issued to certain sellers of B27.
DXP issued 148,769 unregistered shares of DXP Common Stock as part of the consideration for the September 1, 2015 acquisition of Cortech. The unregistered shares were issued to the sellers of Cortech.
We relied on Section 4(2) of the Securities Exchange Act as a basis for exemption from registration. All issuances were as a result of private negotiation, and not pursuant to public solicitation. In addition, we believe the shares were issued to “accredited investors” as defined by Rule 501 of the Securities Act.
Recent Sales of Common Stock
On May 29, 2013, the Company filed with the Securities and Exchange Commission a Form S-3 Registration Statement, commonly referred to as a “shelf registration”, whereby the Company registered an indeterminate number of shares of common stock as shall have an aggregate initial offering price not to exceed $150.0 million. In December 2013, pursuant to this registration statement, the Company issued 235,976 shares of common stock at a weighted average price of $105.94 per share. Net proceeds were approximately $24.4 million. The Company has not had any subsequent sales of common stock.
Repurchases of Common Stock
On December 17, 2014, DXP publicly announced an authorization from the Board of Directors that allows DXP from time to time to purchase up to 400,000 shares of DXP's common stock over 24 months. Purchases could be made in open market or in privately negotiated transactions. DXP has purchased 191,420 shares for $8.9 million under this authorization as of December 31, 2015. No shares were purchased during the fourth quarter of 2015.
The selected historical consolidated financial data set forth below for each of the years in the five-year period ended December 31, 2015 has been derived from our audited consolidated financial statements. This information should be read in conjunction with "Management's Discussion and Analysis of Financial Condition and Results of Operations" and the consolidated financial statements and notes thereto included elsewhere in this Report.
|
Years Ended December 31,
|
||||||||||||||||||||
|
2015
(2)
|
2014
(1)
|
2013
|
2012
|
2011
|
||||||||||||||||
|
(
in thousands, except per share amounts
)
|
||||||||||||||||||||
|
Consolidated Statement of Earnings Data:
|
||||||||||||||||||||
|
Sales
|
$
|
1,247,043
|
$
|
1,499,662
|
$
|
1,241,510
|
$
|
1,097,110
|
$
|
807,005
|
||||||||||
|
Gross Profit
|
351,986
|
432,840
|
372,345
|
319,091
|
231,836
|
|||||||||||||||
|
Impairment expense
|
68,735
|
117,569
|
-
|
-
|
-
|
|||||||||||||||
|
B27 settlement
|
7,348
|
-
|
-
|
-
|
-
|
|||||||||||||||
|
Operating income (loss)
|
(27,916
|
)
|
(12,628
|
)
|
100,924
|
90,522
|
55,485
|
|||||||||||||
|
Income (loss) before income taxes
|
(38,920
|
)
|
(25,556
|
)
|
94,717
|
85,009
|
51,995
|
|||||||||||||
|
Net income (loss)
|
(39,070
|
)
|
(45,238
|
)
|
60,237
|
50,985
|
31,437
|
|||||||||||||
|
Net income (loss) attributable to noncontrolling interest
|
(534
|
) |
-
|
-
|
-
|
-
|
||||||||||||||
|
Net income (loss) attributable to DXP Enterprises, Inc.
|
(38,536
|
)
|
(45,328
|
)
|
60,237
|
50,985
|
31,437
|
|||||||||||||
|
Per share amounts
|
||||||||||||||||||||
|
Basic earnings (loss) per common share
3
|
$
|
(2.68
|
)
|
$
|
(3.10
|
)
|
$
|
4.17
|
$
|
3.54
|
$
|
2.19
|
||||||||
|
Common shares outstanding
3
|
14,423
|
14,639
|
14,439
|
14,374
|
14,301
|
|||||||||||||||
|
Diluted earnings (loss) per share
3
|
$
|
(2.68
|
)
|
$
|
(3.10
|
)
|
$
|
3.94
|
$
|
3.35
|
$
|
2.08
|
||||||||
|
Common and common equivalent shares Outstanding
3
|
14,423
|
14,639
|
15,279
|
15,214
|
15,141
|
|||||||||||||||
(1) The impairment expense in 2014, further discussed in Note 8 of the Notes to Consolidated Financial Statements, reduced operating income by $117.6 million, increased the net loss by $102.0 million, and increased basic and diluted loss per share by $6.97.
(2) The impairment expense in 2015, further discussed in Note 8 of the Notes to Consolidated Financial Statements, reduced operating income by $68.7 million, increased the net loss by $58.4 million, and increased basic and diluted loss per share by $4.05.
(3) See Note 12 of the Notes to Consolidated Financial Statements for the calculation of basic and diluted earnings per share.
|
Consolidated Balance Sheet Data:
|
As of December 31,
|
|||||||||||||||||||
|
2015
|
2014
|
2013
|
2012
|
2011
|
||||||||||||||||
|
(in thousands)
|
||||||||||||||||||||
|
Total assets
|
$
|
683,980
|
$
|
841,632
|
$
|
636,615
|
$
|
569,732
|
$
|
405,338
|
||||||||||
|
Long-term debt obligations
|
300,726
|
372,908
|
168,372
|
216,339
|
114,205
|
|||||||||||||||
|
Shareholders’ equity
|
198,870
|
242,952
|
296,250
|
208,493
|
156,675
|
|||||||||||||||
The following discussion and analysis should be read in conjunction with the Consolidated Financial Statements and related notes contained within Item 8, Financial Statements and Supplementary Data and the other financial information found elsewhere in this Report. Management’s Discussion and Analysis uses forward-looking statements that involve certain risks and uncertainties as described previously in our Disclosure Regarding Forward-Looking Statements and Item 1A. Risk Factors.
General Overview
Our products are marketed in the United States, Canada, Dubai and Mexico to over 50,000 customers that are engaged in a variety of industries, many of which may be countercyclical to each other. Demand for our products generally is subject to changes in the United States and Canada, and global and micro-economic trends affecting our customers and the industries in which they compete in particular. Certain of these industries, such as the oil and gas industry, are subject to volatility driven by a variety of factors, while others, such as the petrochemical industry and the construction industry, are cyclical and materially affected by changes in the United States and global economy. As a result, we may experience changes in demand within particular markets, segments and product categories as changes occur in our customers' respective markets.
During 2011, the general economy and the oil and gas exploration and production business continued to improve. Our employee headcount increased by 18% primarily as a result of two acquisitions and hiring additional personnel to support increased sales. Sales for the year ended December 31, 2011 increased $150.8 million, or 23.0%, to approximately $807.0 million from $656.2 million in 2010. Sales by KC, acquired October 10, 2011, accounted for $11.9 million of 2011 sales. Sales by businesses acquired in 2010, on a same store sales basis, accounted for $35.6 million of 2011 sales. Excluding 2011 sales by businesses acquired in 2010 and 2011, on a same store sales basis, sales increased 15.8% from 2010. The majority of the 2011 sales increase came from a broad-based increase in sales of pumps, bearings, safety products and industrial supplies to customers engaged in oilfield service, oil and gas exploration and production, mining, manufacturing and petrochemical processing.
During 2012, the general economy and the oil and gas exploration and production business remained positive. Our employee headcount increased by 35% primarily as a result of multiple acquisitions and hiring additional personnel to support increased sales. Sales for the year ended December 31, 2012 increased $290.1 million, or 35.9%, to $1,097.1 million from $807.0 million in 2011. Sales by businesses acquired in 2012 accounted for $86.3 million of 2012 sales. Sales by businesses acquired in 2011 accounted for $107.7 million of 2012 sales, on a same store sales basis. Excluding 2012 sales of $194.0 million by businesses acquired in 2011 and 2012, on a same store sales basis, sales increased 11.9% from 2011. The majority of this 11.9% sales increase came from a broad-based increase in sales of pumps, bearings, safety products and industrial supplies to customers engaged in oilfield service, oil and gas exploration and production, mining, manufacturing and petrochemical processing.
During 2013, the growth rate of the general economy slowed from 2012 and sales of metal working and bearing and power transmission products to manufacturers of oil field equipment declined. Our employee headcount increased by 13.8% primarily as a result of multiple acquisitions. Sales for the year ended December 31, 2013 increased $144.4 million, or 13.2%, to $1.2 billion from $1.1 billion in 2012. Sales by businesses acquired in 2013 accounted for $63.7 million of 2013 sales. Sales by businesses acquired in 2012 accounted for $75.9 million of 2013 sales, on a same store sales basis. Excluding 2013 sales of $139.6 million by businesses acquired in 2012 and 2013, on a same store sales basis, sales increased $4.8 million, or 0.4%, from 2012.
During 2014, the growth rate of the general economy increased slightly from 2013. However, oil prices declined significantly during the fourth quarter of 2014. Our employee headcount increased 15.5% primarily as a result of the two acquisitions completed during the year. Sales for the year ended December 31, 2014 increased $258.2 million, or 20.8%, to approximately $1,499.7 million from $1,241.5 million in 2013. Sales by businesses acquired in 2014 accounted for $176.4 million of 2014 sales. Sales by businesses acquired in 2013 accounted for $35.1 million of the 2014 increase, on a same store sales basis. Excluding 2014 sales of $211.5 million by businesses acquired in 2014 and 2013, on a same store sales basis, sales increased by $46.7 million, or 3.8%, from 2013. This sales increase is primarily the result of increased sales by the Service Centers segment of $22.1 million, IPS segment of $8.1 million, and SCS segment of $16.5 million, on a same store sales basis. The majority of these 2014 sales increases came from a broad based increase in sales of pumps, bearings, industrial supplies, metal working and safety products to customers engaged in oilfield service, oil and gas exploration and production, mining, manufacturing and petrochemical processing.
During 2015, the growth rate of the general economy was flat with 2014. However, the growth rate of the industrial economy slowed. Oil prices significantly declined during the year, falling approximately 35%. Our employee headcount decreased 12.7%, despite two acquisitions, primarily as a result of headcount reductions stemming from reduced capital spending by oil and gas producers. Sales for the year ended December 31, 2015 decreased $252.6 million, or 16.9%, to approximately $1,247.0 million from $1,499.7 million in 2014. Sales by businesses acquired in 2014 and 2015 reduced the decline by $14.5 million and $9.1 million, respectively. Excluding 2015 sales of $23.6 million by businesses acquired in 2014 and 2015, on a same store sales basis, sales decreased by $276.2 million, or 18.4%, from 2014. This sales decrease is primarily the result of decreased sales by the Service Centers segment of $184.6 million and IPS segment of $93.3 million, which were partially offset by increased sales by the Supply Chain Services segment of $1.7 million, on a same store sales basis. The majority of these 2015 sales decreases resulted from declines in sales of rotating equipment, bearings, metal working products, industrial supplies and safety products and services to customers engaged in oil and gas production, mining and manufacturing. The sales declines were primarily the result of reduced capital spending by oil and gas producers.
Our sales growth strategy in recent years has focused on internal growth and acquisitions. Key elements of our sales strategy include leveraging existing customer relationships by cross-selling new products, expanding product offerings to new and existing customers, and increasing business-to-business solutions using system agreements and supply chain solutions for our integrated supply customers. We will continue to review opportunities to grow through the acquisition of distributors and other businesses that would expand our geographic reach and/or add additional products and services. Our results will depend on our success in executing our internal growth strategy and, to the extent we complete any acquisitions, our ability to integrate such acquisitions effectively.
Our strategies to increase productivity include consolidated purchasing programs, centralizing product distribution centers, and customer service and inside sales functions, converting selected locations from full warehouse and customer service operations to service centers, and using information technology to increase employee productivity.
Results of Operations
|
Years Ended December 31,
|
||||||||||||||||||||||||
|
2015
|
%
|
2014
|
%
|
2013
|
%
|
|||||||||||||||||||
|
(
in millions, except percentages and per share amounts
)
|
||||||||||||||||||||||||
|
Sales
|
$
|
1,247.0
|
100.00
|
$
|
1,499.7
|
100.0
|
$
|
1,241.5
|
100.0
|
|||||||||||||||
|
Cost of sales
|
895.1
|
71.8
|
1,066.8
|
71.1
|
869.2
|
70.0
|
||||||||||||||||||
|
Gross profit
|
351.9
|
28.2
|
432.9
|
28.9
|
372.3
|
30.0
|
||||||||||||||||||
|
Selling, general & administrative expense
|
303.8
|
24.4
|
327.9
|
21.9
|
271.4
|
21.9
|
||||||||||||||||||
|
Impairment expense
|
68.7
|
5.5
|
117.6
|
7.8
|
-
|
-
|
||||||||||||||||||
|
B27 settlement
|
7.3
|
0.6
|
-
|
-
|
-
|
-
|
||||||||||||||||||
|
Operating income (loss)
|
(27.9
|
)
|
(2.2
|
)
|
(12.6
|
)
|
(0.8
|
)
|
100.9
|
8.1
|
||||||||||||||
|
Interest expense
|
10.9
|
0.9
|
12.8
|
0.9
|
6.3
|
0.5
|
||||||||||||||||||
|
Other expense (income)
|
0.1
|
-
|
0.1
|
-
|
(0.1
|
)
|
-
|
|||||||||||||||||
|
Income before income taxes
|
(38.9
|
)
|
(3.1
|
)
|
(25.5
|
)
|
(1.7
|
)
|
94.7
|
7.6
|
||||||||||||||
|
Provision for income taxes
|
0.1
|
-
|
19.7
|
1.3
|
34.5
|
2.8
|
||||||||||||||||||
|
Net income (loss)
|
(39.0
|
)
|
(3.1
|
)
|
(45.2
|
)
|
(3.0
|
)
|
60.2
|
4.8
|
||||||||||||||
|
Net income (loss) attributable to noncontrolling interest
|
(0.5
|
)
|
-
|
-
|
-
|
-
|
-
|
|||||||||||||||||
|
Net income (loss) attributable to DXP Enterprises, Inc.
|
$
|
(38.5
|
)
|
(3.1
|
) |
$
|
(45.2
|
)
|
(3.0
|
)
|
$
|
60.2
|
4.8
|
|
||||||||||
|
Per share
|
||||||||||||||||||||||||
|
Basic earnings (loss) per share
|
$
|
(2.68
|
)
|
$
|
(3.10
|
)
|
$
|
4.17
|
||||||||||||||||
|
Diluted earnings (loss) per share
|
$
|
(2.68
|
)
|
$
|
(3.10
|
)
|
$
|
3.94
|
||||||||||||||||
DXP is organized into three business segments: Service Centers, Supply Chain Services (“SCS”) and Innovative Pumping Solutions (“IPS”). The Service Centers are engaged in providing maintenance, repair and operating (“MRO”) products and equipment, including technical expertise and logistics capabilities, to industrial customers with the ability to provide same day delivery. The Service Centers provide a wide range of MRO products and expertise in the rotating equipment, bearing, power transmission, hose, fluid power, metal working, industrial supply and safety product and service categories. The SCS segment manages all or part of our customer’s MRO products supply chain, including warehouse and inventory management. The IPS segment fabricates and assembles integrated pump system packages custom made to customer specifications, remanufactures pumps and manufactures branded private label pumps.
Results of operations for the Service Centers segment are as follows:
|
Years Ended December 31,
|
||||||||||||||||||||||||
|
2015
|
%
|
2014
|
%
|
2013
|
%
|
|||||||||||||||||||
|
(in millions, except percentages and per share amounts)
|
||||||||||||||||||||||||
|
Sales
|
$
|
826.6
|
100.0
|
$
|
987.6
|
100.0
|
$
|
884.8
|
100.0
|
|||||||||||||||
|
Cost of sales
|
575.0
|
69.6
|
687.2
|
69.6
|
605.4
|
68.4
|
||||||||||||||||||
|
Gross profit
|
251.6
|
30.4
|
300.4
|
30.4
|
279.4
|
31.6
|
||||||||||||||||||
|
Selling, general & administrative expense
|
173.4
|
21.0
|
192.7
|
19.5
|
172.3
|
19.5
|
||||||||||||||||||
|
Impairment expense
|
15.8
|
1.9
|
10.2
|
1.0
|
-
|
0.0
|
||||||||||||||||||
|
Operating income (loss)
|
$
|
62.4
|
7.5
|
$
|
97.5
|
9.9
|
107.1
|
12.1
|
||||||||||||||||
|
Operating income excluding impairment
|
$
|
78.2
|
9.5
|
$
|
107.7
|
10.9
|
$
|
107.1
|
12.1
|
|||||||||||||||
Results of operations for the IPS segment are as follows:
|
Years Ended December 31,
|
||||||||||||||||||||||||
|
2015
|
%
|
2014
|
%
|
2013
|
%
|
|||||||||||||||||||
|
(in millions, except percentages and per share amounts)
|
||||||||||||||||||||||||
|
Sales
|
$
|
254.8
|
100.0
|
$
|
348.1
|
100.0
|
$
|
209.2
|
100.0
|
|||||||||||||||
|
Cost of sales
|
191.6
|
75.2
|
250.8
|
72.0
|
149.0
|
71.2
|
||||||||||||||||||
|
Gross profit
|
63.2
|
24.8
|
97.3
|
28.0
|
60.2
|
28.8
|
||||||||||||||||||
|
Selling, general & administrative expense
|
41.6
|
16.3
|
46.1
|
13.2
|
26.4
|
12.6
|
||||||||||||||||||
|
Impairment expense
|
52.9
|
20.8
|
107.4
|
30.9
|
-
|
0.0
|
||||||||||||||||||
|
Operating income (loss)
|
$
|
(31.3
|
)
|
(12.3
|
)
|
$
|
(56.2
|
)
|
(16.1
|
)
|
$
|
33.8
|
16.2
|
|||||||||||
|
Operating income excluding impairment
|
$
|
21.6
|
8.5
|
$
|
51.2
|
14.7
|
$
|
33.8
|
16.2
|
|||||||||||||||
Results of operations for the SCS segment are as follows:
|
Years Ended December 31,
|
||||||||||||||||||||||||
|
2015
|
%
|
2014
|
%
|
2013
|
%
|
|||||||||||||||||||
|
(in millions, except percentages and per share amounts)
|
||||||||||||||||||||||||
|
Sales
|
$
|
165.6
|
100.0
|
$
|
164.0
|
100.0
|
$
|
147.5
|
100.0
|
|||||||||||||||
|
Cost of sales
|
128.4
|
77.5
|
128.9
|
78.6
|
114.8
|
77.8
|
||||||||||||||||||
|
Gross profit
|
37.2
|
22.5
|
35.1
|
21.4
|
32.7
|
22.2
|
||||||||||||||||||
|
Selling, general & administrative expense
|
23.0
|
13.9
|
21.3
|
13.0
|
20.2
|
13.7
|
||||||||||||||||||
|
Operating income (loss)
|
$
|
14.2
|
8.6
|
$
|
13.8
|
8.4
|
12.5
|
8.5
|
||||||||||||||||
Year Ended December 31, 2015 compared to Year Ended December 31, 2014
SALES. Sales for the year ended December 31, 2015 decreased $252.6 million, or 16.9%, to approximately $1,247.0 million from $1,499.7 million in 2014. Sales by businesses acquired in 2015 accounted for $9.1 million of 2015 sales. Sales by a business acquired in 2014 reduced the sales decline by $14.5 million, on a same store sales basis. Excluding 2015 sales of $23.6 million by businesses acquired in 2015 and 2014, on a same store sales basis, sales decreased by $276.2 million, or 18.4%, from 2014. This sales decrease is primarily the result of decreased sales by the Service Centers segment of $184.6 million and IPS segment of $93.3 million, which were partially offset by increased sales by the SCS segment of $1.7 million, on a same store sales basis. These increases are explained in the segment discussions below. The strength of the U.S. dollar also contributed to the sales decline. Sales for our Canadian operations were $127.8 million for 2015. The change in the exchange rate reduced sales by approximately $20.0 million compared to the amount which would be calculated using the 2014 average exchange rate.
GROSS PROFIT. Gross profit as a percentage of sales decreased approximately 65 basis points to 28.2% for 2015 compared to 28.9% for 2014. On a same store sales basis, gross profit as a percentage of sales also decreased by approximately 65 basis points. This decline is primarily the result of an approximate 315 basis point decline in the 2015 gross profit percentage for our IPS segment, which was partially offset by an increase of approximately 105 basis points for the SCS segment. Gross profit as a percentage of sales for the Service Centers segment remained flat. Gross profit as a percentage of sales for each segment are explained below.
SELLING, GENERAL AND ADMINISTRATIVE EXPENSE. Selling, general and administrative (or “SG&A”) expense for 2015 decreased by approximately $24.1 million, or 7.3%, when compared to 2014. Selling, general and administrative expense by businesses acquired in 2015 was $3.5 million. Selling, general and administrative expense for a business acquired in 2014 reduced the decline by $2.4 million, on a same store sales basis. Excluding 2015 expenses of $5.9 million by businesses acquired in 2015 and 2014, on a same store sales basis, selling, general and administrative expenses decreased by $30.0 million, or 9.2%. The decline in SG&A, on a same store sales basis, is partially the result of a $15.5 million decrease in variable compensation. Amortization expense for 2015 decreased by $1.9 million compared to 2014. Salary expense fell approximately $4.4 million due to headcount reductions. In addition, the strength of the U.S. dollar contributed to the decline. Expenses for our Canadian operations were $37.6 million. The change in exchange rate reduced SG&A by approximately $5.9 million compared to the amount which would be calculated using the average exchange rate for the year ended 2014. As a percentage of sales, 2015 SG&A increased by approximately 250 basis points from the prior corresponding period, on a same store sales basis, primarily as a result of the percentage decrease in sales exceeding the percentage decrease in SG&A.
IMPAIRMENT EXPENSE. As a result of the sustained decline in crude oil prices, reduced capital spending by oil and gas customers and reduced revenue expectations, DXP performed interim impairment tests at the end of the third quarter of 2015 and at the end of the fourth quarter of 2015. The Company recognized a total impairment expense of $67.6 million of the goodwill associated with the acquisition of B27. Additionally, DXP recorded $1.1 million of impairment expense in 2015 to write off an acquired intangible asset related to an ITT Goulds distribution agreement, which was terminated by ITT Goulds during 2015. See Notes 4 and 8 of the Notes to Consolidated Financial Statements.
B27 SETTLEMENT. During 2015, an accounting expert issued his report on the working capital dispute between DXP and the sellers of B27. The report required DXP to pay the sellers of B27 an additional $11.3 million. Because the time period to allow adjustments of purchase accounting had expired, $7.3 million of the payment was expensed. The remaining $4.0 million of the required payment represents tax refunds, and the $3.6 million federal portion of the refunds has been received.
OPERATING INCOME. Excluding impairment expense and the B27 settlement, operating income for 2015 decreased approximately $56.8 million, or 54.1%, from $104.9 million to $48.2 million, compared to 2014. Businesses acquired in 2015 and 2014 reduced the decline by $1.0 million, on a same store sales basis. Excluding operating income from businesses acquired, the B27 settlement, and impairment expense, operating income decreased $57.7 million or 55.0%. This decrease in operating income, on a same store sales basis, is primarily related to the decreased gross profit percentage and the percentage decline in sales exceeding the percentage decline in SG&A discussed above.
INTEREST EXPENSE. Interest expense for 2015 decreased by $1.9 million, or 14.6%, from 2014 primarily due to paying down debt during 2015.
INCOME TAXES. Our provision for income taxes, which was at an effective rate of -0.4%, differed from the U. S. statutory rate of 35% primarily due to the mostly non-deductible impairment of goodwill, the mostly non-deductible B27 settlement, the Domestic Production Activity Deduction, research and development credits and foreign tax credits. Our effective tax rate for 2015 of 27.7%, before the effect of the mostly non-deductible impairment of goodwill and B27 settlement, decreased from 38.3% from the prior corresponding period, primarily as a result of increased research and development and foreign tax credits.
SERVICE CENTERS SEGMENT. Sales for the Service Centers decreased $161.0 million, or 16.3%, in 2015 compared to 2014. Sales by businesses acquired in 2015 accounted for $9.1 million of 2015 sales. Sales by businesses acquired in 2014 reduced the sales decline by $14.5 million, on a same store sales basis. Excluding 2015 sales of $23.6 million by businesses acquired in 2015 and 2014, on a same stores sales basis, Service Centers’ sales decreased $184.6 million, or 18.7%, on a same stores sales basis, from the prior corresponding period. The majority of the 2015 sales decrease is the result of decreased sales of rotating equipment, bearings, metal working products, industrial supplies and safety products and services to customers engaged in the upstream oil and gas market or manufacturing equipment for the upstream oil and gas market. If crude oil and natural gas prices remain at, or below, prices experienced during the during 2015, this decline in sales to the upstream oil and gas industry would be expected to continue during 2016. The strength of the U.S. dollar also contributed to the sales decline. Service Center sales for our Canadian operations were $104.6 million. The change in the exchange rate reduced sales by $16.4 million compared to the amount which would be calculated using the average exchange rate for 2014. Excluding year-to-date Service Centers segment operating income from acquired businesses of $1.9 million and 2015 impairment expense of $15.8 million, Service Centers segment operating income for 2015 decreased by $31.5 million, or 29.2%, primarily as a result of the decline in sales discussed above and the percentage decrease in sales exceeding the percentage decrease in SG&A.
SUPPLY CHAIN SERVICES SEGMENT. Sales for Supply Chain Services increased by $1.7 million, or 1.0%, in 2015 compared to 2014. None of the 2015 or 2014 acquisitions contributed sales to this segment. The increase is primarily related to increased sales to new and existing customers in the transportation, mining, chemical and alternative energy industries. These were partially offset by decreased sales to customers engaged in the oilfield services and oilfield manufacturing industries. We suspect the customers, which purchased more products from DXP, did so because the customers increased production during the period. We suspect customers in the oilfield services and oilfield equipment manufacturing industries purchased less from DXP because of the decline in the number of drilling rigs operating in the U.S and Canada. Gross profit as a percentage of sales increased approximately 105 basis points in 2015 compared to the prior corresponding period as a result of decreased sales of lower margin products to oil and gas and trucking related customers. Operating income for the SCS segment increased $0.4 million, or 3.0%, primarily as a result of the 105 basis point increase in gross profit as a percentage of sales.
INNOVATIVE PUMPING SOLUTIONS SEGMENT. Sales for Innovative Pumping Solutions decreased by $93.3 million, or 26.8%, in 2015 compared to 2014. The sales decrease primarily resulted from a significant decline in capital spending by our oil and gas producers and related businesses stemming from the decline in the price of oil. This decline in IPS sales could continue in 2016 if crude oil and natural gas prices remain at or below prices experienced during 2015. Gross profit as a percentage of sales declined approximately 315 basis point in 2015 compared to 2014 primarily as a result of competitive pressures resulting in lower margin jobs and $3.0 million of unabsorbed manufacturing overhead related to the start-up of manufacturing our ANSI pumps. Additionally, gross profit margins for individual orders for the IPS segment can fluctuate significantly because each order is for a unique package built to customer specifications and subject to varying competition. Excluding impairment expense of $52.9 million, operating income decreased $29.6 million, or 57.8%, primarily as a result of the 26.8% decline in sales and approximate 315 basis point decline in the gross profit percentage discussed above.
Year Ended December 31, 2014 compared to Year Ended December 31, 2013
SALES. Sales for the year ended December 31, 2014 increased $258.2 million, or 20.8%, to approximately $1,499.7 million from $1,241.5 million in 2013. Sales by businesses acquired in 2014 accounted for $176.4 million of 2014 sales. Sales by businesses acquired in 2013 accounted for $35.1 million of the 2014 increase, on a same store sales basis. Excluding 2014 sales of $211.5 million by businesses acquired in 2014 and 2013, on a same store sales basis, sales increased by $46.7 million, or 3.8%, from 2013. This sales increase is primarily the result of increased sales by the Service Centers segment of $22.1 million, IPS segment of $8.1 million, and SCS segment of $16.5 million, on a same store sales basis. These increases are explained in the segment discussions below.
GROSS PROFIT. Gross profit as a percentage of sales decreased approximately 110 basis points to 28.9% for 2014 compared to 30.0% for 2013. This decrease is primarily the result of businesses acquired in 2014 having a lower gross profit percentage of 24.8% than the 29.5% gross profit percentage for the remainder of DXP. On a same store sales basis, gross profit as a percentage of sales decreased by approximately 50 basis points in 2014, to 29.5%, compared to 30.0% for the prior corresponding period. This decline is primarily the result of an approximate 350 basis point decline in 2014 in the gross profit percentage for $209.9 million of 2014 sales of safety related products and services. The decline in the gross profit percentage to 33.9%, from 37.4% for 2013, for safety related products and services is primarily the result of a decline in sales of higher margin safety services work and equipment rentals primarily related to work over rigs in the U.S. and drilling and well completions in Canada. The decline in sales of safety services and equipment rentals to the upstream oil and gas industry was offset with increased sales of lower margin safety products to industrial customers, which contributed to the decline in the gross profit percentage. We believe our customers purchased fewer services because of eliminating costs in the U.S. and limitations on the ability to transport oil within Canada. We expect the decline in higher margin safety service sales to upstream oil and gas customers to continue due to the decline in the rig count resulting from the significant decline in oil prices during the fourth quarter of 2014.
SELLING, GENERAL AND ADMINISTRATIVE EXPENSE. Selling, general and administrative expense for 2014 increased by approximately $56.5 million, or 20.8%, when compared to 2013. Selling, general and administrative expense by businesses acquired in 2014 was $32.5 million. Selling, general and administrative expense for acquisitions that occurred in 2013 accounted for $9.9 million of the 2013 increase, on a same store sales basis. Excluding 2014 expenses of $42.4 million by businesses acquired in 2014 and 2013, on a same store sales basis, selling, general and administrative expenses increased by $14.1 million, or 5.2%. This increase is partially related to a $3.1 million, or 25.7%, increase in health care claims for 2014, and the 2013 $2.8 million reduction in selling, general and administrative expenses from eliminating DXP’s earn-out liability for the purchase of NatPro. This earn-out is further discussed in Note 13 to the financial statements. The remaining $8.2 million (3.0% of 2013 selling, general and administrative expenses) of the increase is consistent with the 3.8% increase in sales on a same stores basis. As a percentage of sales, the 2014 expense increased approximately 30 basis points on a same store sales basis due to the items described above.
IMPAIRMENT EXPENSE. DXP recognized an impairment expense of $117.6 million during the fourth quarter of 2014. Impairment expense of $107.4 million is included in operating income for the IPS segment. The remaining $10.2 million in impairment expense is included in operating income for the Service Centers segment. See Notes 4 and 8 of the Notes to Consolidated Financial Statements.
OPERATING INCOME. Excluding impairment expense, operating income for 2014 increased approximately $4.0 million, or 4.0%, from $100.9 million to $104.9 million, compared to 2013. Businesses acquired in 2014 and 2013 (primarily B27) accounted for a $10.0 million increase in operating income, on a same store sales basis. Excluding operating income from businesses acquired and impairment expense, operating income decreased $6.0 million or 6.0%. This decrease in operating income, on a same store sales basis, is primarily related to the decline in gross profit as a percentage of sales and the increase in SG&A previously discussed.
INTEREST EXPENSE. Interest expense for 2014 increased by $6.5 million, or 103.7%, from 2013. The increase in interest expense was primarily the result of increased borrowings to fund our January 2, 2014 acquisition of B27, LLC and our May 1, 2014 acquisition of Machinery Tooling and Supply, LLC, further discussed in Note 13 of the Notes to Consolidated Financial Statements.
INCOME TAXES. Our provision for income taxes, which was at an effective rate of -77.0%, differed from the U. S. statutory rate of 35% primarily due to a mostly non-deductible impairment of goodwill, state income taxes and non-deductible expenses. Our effective tax rate for 2014 of 38.3%, before the effect of a mostly non-deductible impairment of goodwill, increased from 36.4% from the prior corresponding period, primarily as a result of increased state income tax expense.
SERVICE CENTERS SEGMENT. Sales for the Service Centers increased $102.7 million, or 11.6%, in 2014 compared to 2013. Sales by businesses acquired in 2014 accounted for $55.3 million of 2014 sales. Sales by businesses acquired in 2013 accounted for $25.3 million of the 2013 increase, on a same store sales basis. Excluding 2014 sales of $80.6 million by businesses acquired in 2014 and 2013, on a same stores sales basis, Service Centers’ sales increased $22.1 million, or 2.5%, on a same stores sales basis, from the prior corresponding period. The majority of the 2014 sales increase came from a broad increase in sales of pumps, bearings, industrial supplies, metal working and safety products to customers engaged in oilfield service, oil and gas exploration and production, mining, manufacturing and petrochemical processing. We believe our customers increased purchases of our products and services primarily because of increased oil production in the U.S during recent years and a modest improvement in the general economy. Excluding year-to-date Service Centers segment operating income from acquired businesses of $7.6 million and 2014 impairment expense of $10.2 million, Service Centers segment operating income for 2014 decreased by $7.0 million partially as a result of an approximate 70 basis point decline in gross profit percentage to 30.9%, from 31.6% for 2013. The decline in gross profit as a percentage of sales, on a same store sales basis, is primarily the result of an approximate 360 basis point decline in 2014 in the gross profit percentage for $199.0 million of 2014 sales of safety related products and services. The decline in the gross profit percentage to 34.7% for 2014, from 38.3% for 2013, for safety related products and services is primarily the result of a decline in sales of higher margin safety services work and equipment rentals primarily related to work over rigs in the U.S. and drilling and well completions in Canada. The decline in sales of safety services and equipment rentals to the upstream oil and gas industry was offset with increased sales of lower margin safety products to industrial customers, which contributed to the decline in the gross profit percentage. We believe our customers purchased fewer safety services because of eliminating costs in the U.S. and limitations on the ability to transport oil to markets in Canada. We expect the decline in higher margin safety service sales to oil and gas customers to continue due to the decline in the rig count resulting from the significant decline in oil prices during the fourth quarter of 2014. Excluding impairment expense, the decline in operating income for Service Centers, on a same store sales basis, was partially the result of the 2013 reduction in selling, general and administrative expenses to eliminate DXP’s earn-out liability related to the acquisition of NatPro, further discussed in Note 13 of the financial statements.
SUPPLY CHAIN SERVICES SEGMENT. Sales for Supply Chain Services increased by $16.5 million, or 11.2%, in 2014 compared to 2013. None of the 2014 or 2013 acquisitions contributed sales to this segment. The increase in sales is related to increases in sales to customers in the oil and gas, automotive, and general manufacturing industries as well as sales to new customers in both the mining and automotive industries. Operating income for the SCS segment increased $1.3 million, or 10.5%, from the prior corresponding period primarily as a result of the 11.2% increase in sales.
INNOVATIVE PUMPING SOLUTIONS SEGMENT. Sales for Innovative Pumping Solutions increased by $139.0 million, or 66.4%, in 2014 compared to 2013. Sales by B27, acquired in 2014, accounted for $121.2 million of 2014 sales. Sales by NatPro, acquired in 2013, accounted for $9.7 million of the 2013 increase, on a same store sales basis. Excluding 2014 sales of $130.9 million by businesses acquired in 2014 and 2013, on a same stores sales basis, IPS’ sales increased $8.1 million, or 3.9%, on a same stores sales basis, from the prior corresponding period. The sales increase primarily resulted from increased capital spending by our oil and gas customers. Gross profit as a percentage of sales declined to 27.9% for 2014 from 28.8% for 2013. Excluding the business acquired in 2014 and 2013, on a same store sales basis, gross profit as a percentage of sales for 2014 increased approximately 110 basis points to 29.9%, from 28.8% for the prior corresponding period. The increase in the gross profit as a percentage of sales is primarily the result of an approximate 1,100 basis point improvement in the gross profit as a percentage of sales for NatPro. This improvement was the result of organizational changes made in connection with integrating NatPro with DXP. Excluding impairment expense of $107.4 million, operating income for the IPS segment increased $17.4 million, or 51.5%. Excluding 2014 and 2013 acquisitions and 2014 impairment expense, operating income increased $3.5 million, or 10.5%, on a same stores sales basis, from the prior corresponding period. The increase in operating income is primarily the result of the increase in gross profit.
Pro Forma Results
The pro forma unaudited results of operations for the Company on a consolidated basis for the twelve months ended December 31, 2015 and 2014, assuming the acquisition of businesses completed in 2015 and 2014 (previously discussed in Item 1,
Business
) were consummated as of January 1, 2014 are as follows (
in millions, except per share amounts
):
|
Years Ended
December 31,
|
||||||||
|
2015
|
2014
|
|||||||
|
Net sales
|
$
|
1,263
|
$
|
1,541
|
||||
|
Net income (loss) attributable to DXP Enterprises, Inc.
|
$
|
(37
|
)
|
$
|
(44
|
)
|
||
|
Per share data attributable to DXP Enterprises, Inc.
|
||||||||
|
Basic earnings (loss)
|
$
|
(2.60
|
)
|
$
|
(2.99
|
)
|
||
|
Diluted earnings (loss)
|
$
|
(2.60
|
)
|
$
|
(2.99
|
)
|
||
The pro forma unaudited results of operations for the Company on a consolidated basis for the twelve months ended December 31, 2014 and 2013, assuming the acquisition of businesses completed in 2014 and 2013 (previously discussed in Item 1,
Business
) were consummated as of January 1, 2013 are as follows (
in millions, except per share amounts
):
|
Years Ended
December 31,
|
||||||||
|
2014
|
2013
|
|||||||
|
Net sales
|
$
|
1,513
|
$
|
1,496
|
||||
|
Net income (loss)
|
$
|
(45
|
)
|
$
|
71
|
|||
|
Per share data
|
||||||||
|
Basic earnings (loss)
|
$
|
(3.08
|
)
|
$
|
4.90
|
|||
|
Diluted earnings (loss)
|
$
|
(3.08
|
)
|
$
|
4.64
|
|||
Liquidity and Capital Resources
General Overview
As a distributor of MRO products and services, we require significant amounts of working capital to fund inventories and accounts receivable. Additional cash is required for capital items such as information technology, warehouse equipment, metal working equipment and capital expenditures for our safety products and services category. We also require cash to pay our lease obligations and to service our debt.
We generated approximately $98.0 million of cash in operating activities in 2015 as compared to generating $98.7 million in 2014. This small change between the two years was primarily attributable to the 2015 reduction in working capital offsetting the effect of the 2015 decline in net income excluding goodwill impairments.
During 2015 we paid $15.5 million in cash and $4.4 million in common stock for two businesses compared to paying $300.8 million in cash, net of $3.3 million of cash acquired, and $4.0 in common stock, for the purchase of two businesses during 2014.
We purchased approximately $14.0 million of capital assets during 2015 compared to $11.1 million for 2014. Capital expenditures during 2015 were related primarily building improvements, manufacturing equipment, and patterns. Capital expenditures for 2016 are expected to be within the range of capital expenditures during 2014 through 2015.
At December 31, 2015, our total long-term debt, including the current portion and less unamortized debt issuance fees, was $349.5 million, or 63.7% of total capitalization (total long-term debt including current portion plus shareholders’ equity) of $548.4 million. Approximately $347.1 million of this outstanding debt bears interest at various floating rates. Therefore, as an example, a 200 basis point increase in interest rates would increase our annual interest expense by approximately $6.9 million.
Our normal trade terms for our customers require payment within 30 days of invoice date. In response to competition and customer demands we will offer extended terms to selected customers with good credit history. Customers that are financially strong tend to request extended terms more often than customers that are not financially strong. Many of our customers, including companies listed in the Fortune 500, do not pay us within stated terms for a variety of reasons, including a general business philosophy to pay vendors as late as possible.
During 2015, the amount available to be borrowed under our credit facility decreased from $51.0 million at December 31, 2014, to $19.8 million at December 31, 2015. This decrease in availability is a result of a $65.1 million decrease in 2015 earnings before interest, taxes, amortization and depreciation when compared to 2014. We believe that we may not be able to comply with the financial covenants in our credit facility in the upcoming quarter and will need to amend our credit facility or obtain alternative financing. If such an amendment or alternate financing is obtained, then we believe that the liquidity of our balance sheet and credit facility at December 31, 2015 provides us with the ability to meet our working capital needs, scheduled principal payments, capital expenditures and Series B convertible preferred stock dividend payments during 2016.
Credit Facility
On July 11, 2012, DXP entered into a credit facility with Wells Fargo Bank National Association, as Issuing Lender, Swingline Lender and Administrative Agent for the lenders (as amended, the “Original Facility”). On January 2, 2014, the Company entered into an Amended and Restated Credit Agreement with Wells Fargo Bank, National Association, as Issuing Lender and Administrative Agent for other lenders ( as thereafter amended or restated the “Facility”), amending and restating the Original Facility. On August 6, 2015 and September 30, 2015, DXP amended the Facility.
The Facility provides a term loan and a $350 million revolving line of credit to the Company. At December 31, 2015, the term loan component of the Facility was $175.0 million. The Facility expires on January 2, 2019.
The Facility provides the option of interest at LIBOR (or CDOR for Canadian dollar loans) plus an applicable margin ranging from 1.25% to 2.75% or prime plus an applicable margin from 0.25% to 1.75% where the applicable margin is determined by the Company’s leverage ratio as defined by the Facility as of the last day of the fiscal quarter most recently ended prior to the date of borrowing. Commitment fees of 0.20% to 0.50% per annum are payable on the portion of the Facility capacity not in use at any given time on the line of credit. Commitment fees are included as interest in the consolidated statements of income.
On December 31, 2015, the LIBOR based rate of the Facility was LIBOR plus 2.25% the prime based rate of the Facility was prime plus 1.25%, and the commitment fee was 0.40%. At December 31, 2015, $347.1 million was borrowed under the Facility at a weighted average interest rate of approximately 2.67% under the LIBOR options. At December 31, 2015, the Company had $19.8 million available for borrowing under the Facility.
At December 31, 2015, the Facility’s principal financial covenants included:
Consolidated Leverage Ratio – The Facility requires that the Company’s Consolidated Leverage Ratio, determined at the end of each fiscal quarter, not exceed 4.25 to 1.00 as of the last day of each quarter through September 30, 2016, not to exceed 4.00 to 1.00 on December 31, 2016, not to exceed 3.75 to 1.00 from March 31, 2017 through June 30, 2017, not to exceed 3.50 to 1.00 from September 30, 2017 through December 31, 2017, and not to exceed 3.25 to 1.00 on March 31, 2018 and thereafter. The Consolidated Leverage Ratio is defined as the outstanding indebtedness divided by Consolidated EBITDA for the period of four consecutive fiscal quarters ending on or immediately prior to such date. Indebtedness is defined under the Facility for financial covenant purposes as: (a) all obligations of DXP for borrowed money including but not limited to obligations evidenced by bonds, debentures, notes or other similar instruments; (b) obligations to pay deferred purchase price of property or services; (c) capital lease obligations; (d) obligations under conditional sale or other title retention agreements relating to property purchased; and (e) contingent obligations for funded indebtedness. At December 31, 2015, the Company’s Leverage Ratio was 4.02 to 1.00.
Consolidated Fixed Charge Coverage Ratio – The Facility requires that the Consolidated Fixed Charge Coverage Ratio on the last day of each quarter be not less than 1.15 to 1.00 through December 31, 2016 and not less than 1.25 to 1.00 on March 31, 2017 and thereafter, with “Consolidated Fixed Charge Coverage Ratio” defined as the ratio of (a) Consolidated EBITDA for the period of 4 consecutive fiscal quarters ending on such date minus capital expenditures during such period (excluding acquisitions) minus income tax expense paid minus the aggregate amount of restricted payments defined in the agreement to (b) the interest expense paid in cash, scheduled principal payments in respect of long-term debt and the current portion of capital lease obligations for such 12-month period, determined in each case on a consolidated basis for DXP and its subsidiaries. At December 31, 2015, the Company's Consolidated Fixed Charge Coverage Ratio was 1.23 to 1.00.
Asset Coverage Ratio –The Facility requires that the Asset Coverage Ratio at any time be not less than 1.0 to 1.0 with “Asset Coverage Ratio” defined as the ratio of (a) the sum of 85% of net accounts receivable plus 65% of net inventory to (b) the aggregate outstanding amount of the revolving credit on such date. At December 31, 2015, the Company's Asset Coverage Ratio was 1.15 to 1.00.
Consolidated EBITDA as defined under the Facility for financial covenant purposes means, without duplication, for any period the consolidated net income of DXP plus, to the extent deducted in calculating consolidated net income, depreciation, amortization (except to the extent that such non-cash charges are reserved for cash charges to be taken in the future), non-cash compensation including stock option or restricted stock expense, interest expense and income tax expense for taxes based on income, certain one-time costs associated with our acquisitions, integration costs, facility consolidation and closing costs, severance costs and expenses, write-down of cash expenses incurred in connection with the existing credit agreement and extraordinary losses less interest income and extraordinary gains. Consolidated EBITDA shall be adjusted to give pro forma effect to disposals or business acquisitions assuming that such transaction(s) had occurred on the first day of the period excluding all income statement items attributable to the assets or equity interests that is subject to such disposition made during the period and including all income statement items attributable to property or equity interests of such acquisitions permitted under the Facility.
The following table sets forth the computation of the Leverage Ratio as of December 31, 2015 (
in thousands, except for ratios
):
|
For the Twelve Months ended
December 31, 2015
|
Leverage
Ratio
|
|||
|
Loss before taxes
|
$
|
(38,920
|
)
|
|
|
Loss attributable to noncontrolling interest
|
813
|
|||
|
Interest expense
|
10,932
|
|||
|
Depreciation and amortization
|
33,243
|
|||
|
Impairment expense
|
68,735
|
|||
|
Stock compensation expense
|
2,973
|
|||
|
Pro forma acquisition EBITDA
|
2,244
|
|||
|
B27 settlment
|
7,348
|
|||
|
(A)
Defined EBITDA
|
$
|
87,368
|
||
|
As of December 31, 2015
|
||||
|
Total long-term debt, including current maturities
|
$
|
349,509
|
||
|
Unamortized debt issuance costs
|
2,046
|
|||
|
(B)
Defined indebtedness
|
$
|
351,555
|
||
|
Leverage Ratio (B)/(A)
|
4.02
|
|||
The following table sets forth the computation of the Fixed Charge Coverage Ratio as of December 31, 2015 (
in thousands, except for ratios
):
|
For the Twelve Months ended
December 31, 2015
|
||||
|
Defined EBITDA
|
$
|
87,368
|
||
|
Cash paid for income taxes
|
13,792
|
|||
|
Capital expenditures
|
13,992
|
|||
|
(A)
Defined EBITDA minus capital expenditures & cash income taxes
|
$
|
59,584
|
||
|
Cash interest payments
|
$
|
9,721
|
||
|
Dividends
|
90
|
|||
|
Scheduled principal payments
|
38,666
|
|||
|
(B)
Fixed Charges
|
$
|
48,477
|
||
|
Fixed Charge Coverage Ratio (A)/(B)
|
1.23
|
|||
The following table sets forth the computation of the Asset Coverage Ratio as of December 31, 2015 (
in thousands, except for ratios
):
|
Credit facility outstanding balance
|
$
|
172,148
|
||
|
Outstanding letters of credit
|
6,305
|
|||
|
Defined indebtedness
|
$
|
178,453
|
||
|
Accounts receivable (net), valued at 85% of gross
|
$
|
138,486
|
||
|
Inventory, valued at 65% of gross
|
67,482
|
|||
|
$
|
205,968
|
|||
|
Asset Coverage Ratio
|
1.15
|
Borrowings (in thousands):
|
December 31, 2015
|
December 31, 2014
|
Increase (Decrease)
|
||||||||||
|
Current portion of long-term debt
|
$
|
50,829
|
$
|
38,608
|
$
|
12,221
|
||||||
|
Long-term debt, less debt issuance costs
|
298,680
|
370,194
|
(71,514
|
)
|
||||||||
|
Total long-term debt
|
$
|
349,509
|
$
|
408,802
|
$
|
(59,293
|
)
|
|||||
|
Amount available
|
$
|
19,754
|
$
|
50,955
|
(1)
|
$
|
(31,201
|
)
|
||||
(1) Represents amount available to be borrowed at the indicated date under the Facility. The decrease in availability is a result of a $56.7 million decrease in 2015 Defined EBITDA when compared to 2014.
Performance Metrics (in days):
|
Three Months Ended
December 31,
|
||||||||||||
|
2015
|
2014
|
Increase (Decrease)
|
||||||||||
|
Days of sales outstanding
|
56.9
|
59.6
|
(2.7
|
)
|
||||||||
|
Inventory turns
|
7.7
|
9.5
|
(1.8
|
)
|
||||||||
Accounts receivable days of sales outstanding were 56.9 days at December 31, 2015 compared to 59.6 days at December 31, 2014. The 2.7 days decrease was primarily due to a 31.8% decrease in December 2015 sales compared to December 2014 sales. Inventory turns were 7.7 times at December 31, 2015 compared to 9.5 times at December 31, 2014. The 1.8 turns decrease is primarily related to our 2015 organic sales decline, which resulted in sales decreasing faster than inventory decreased.
|
Three Months Ended
December 31,
|
||||||||||||
|
2014
|
2013
|
Increase (Decrease)
|
||||||||||
|
Days of sales outstanding
|
59.6
|
58.9
|
0.7
|
|||||||||
|
Inventory turns
|
9.5
|
8.3
|
1.2
|
|||||||||
Accounts receivable days of sales outstanding were 59.6 days at December 31, 2014 compared to 58.9 days at December 31, 2013. The 0.7 days increase resulted primarily from our B27 acquisition that has more days sales in receivables. Inventory turns were 9.5 times at December 31, 2014 compared to 8.3 times at December 31, 2013. The slight increase is primarily related to our acquisition of B27 that has higher inventory turns.
Funding Commitments
We believe our cash generated from operations will meet our normal working capital needs during the next twelve months. However, we may require additional debt outside of the Facility or equity financing to fund potential acquisitions. Such additional financings may include additional bank debt or the public or private sale of debt or equity securities. In connection with any such financing, we may issue securities that substantially dilute the interests of our shareholders. We may not be able to obtain additional financing on attractive terms, if at all. Refer to the Contractual Obligations table below. Additionally, we believe that we may need to amend the financial covenants in our Facility or obtain alternative financing next quarter to avoid breaching the Facility.
Share Repurchases
On December 17, 2014, DXP publicly announced an authorization from the Board of Directors that allows DXP from time to time to purchase up to 400,000 shares of DXP's common stock over 24 months. Purchases could be made in open market or in privately negotiated transactions. As of December 31, 2015, DXP has purchased 191,420 shares of DXP’s common stock at an average price of $46.53 under this authorization.
On May 7, 2014, the Board of Directors authorized DXP from time to time to purchase up to 200,000 shares of DXP's common stock over 24 months. DXP publicly announced the authorization on May 14, 2014. Purchases could be made in open market or in privately negotiated transactions. During 2014, DXP purchased 200,000 shares of DXP’s common stock at an average price of $59.27 under this authorization.
During 2013, DXP purchased 5,400 shares of DXP’s common stock at an average price of $56.25.
Contractual Obligations
The impact that our contractual obligations as of December 31, 2015 are expected to have on our liquidity and cash flow in future periods is as follows (
in thousands
):
|
Payments Due by Period
|
||||||||||||||||||||
|
Less than 1
Year
|
1–3 Years
|
3-5
Years
|
More than
5 Years
|
Total
|
||||||||||||||||
|
Long-term debt, including current portion
(1)
|
$
|
50,829
|
$
|
126,737
|
$
|
173,989
|
$
|
-
|
$
|
351,555
|
||||||||||
|
Operating lease obligations
|
23,951
|
31,891
|
11,555
|
9,861
|
77,258
|
|||||||||||||||
|
Estimated interest payments
(2)
|
3,791
|
3,221
|
54
|
-
|
7,066
|
|||||||||||||||
|
Total
|
$
|
78,571
|
$
|
161,849
|
$
|
185,598
|
$
|
9,861
|
$
|
435,879
|
||||||||||
(1) Amounts represent the expected cash payments of our long-term debt and do not include any fair value adjustment.
(2) Assumes interest rates in effect at December 31, 2015. Assumes debt is paid on maturity date and not replaced. Does not include interest on the revolving line of credit as borrowings under the Facility fluctuate. The amounts of interest incurred for borrowings under the revolving lines of credit were approximately $4.5 million, $3.0 million and $1.9 million for the years ended 2015, 2014 and 2013, respectively.
Off-Balance Sheet Arrangements
As part of our ongoing business, we do not participate in transactions that generate relationships with unconsolidated entities or financial partnerships, such as entities often referred to as structured finance or special purpose entities ("SPE's"), which would have been established for the purpose of facilitating off-balance sheet arrangements or other contractually narrow or limited purposes. As of December 31, 2015, we were not involved in any unconsolidated SPE transactions.
The Company has not made any guarantees to customers or vendors nor does the Company have any off-balance sheet arrangements or commitments, that have, or are reasonably likely to have, a current or future effect on the Company’s financial condition, change in financial condition, revenue, expenses, results of operations, liquidity, capital expenditures or capital resources that are material to investors.
Indemnification
In the ordinary course of business, DXP enters into contractual arrangements under which DXP may agree to indemnify customers from any losses incurred relating to the services we perform. Such indemnification obligations may not be subject to maximum loss clauses. Historically, payments made related to these indemnities have been immaterial.
DISCUSSION OF CRITICAL ACCOUNTING POLICIES
Critical accounting policies are those that are both most important to the portrayal of a company’s financial position and results of operations, and require management’s subjective or complex judgments. These policies have been discussed with the Audit Committee of the Board of Directors of DXP.
The Company’s financial statements are prepared in accordance with accounting principles generally accepted in the United States of America (“USGAAP”). The accompanying consolidated financial statements include the accounts of the Company, its wholly owned subsidiaries and its variable interest entity (“VIE”).
Variable Interest Entity (VIE)
DXP is the primary beneficiary of a VIE in which DXP owns 47.5% of the equity. DXP consolidates the financial statements of the VIE with the financial statements of DXP. As of December 31, 2015, the total assets of the VIE were approximately $4.0 million including $0.3 million of cash and approximately $3.6 million of fixed assets. DXP is the sole customer of the VIE. Consolidation of the VIE increased cost of sales by approximately $1.4 million for the twelve months ended December 31, 2015. The Company recognized a related income tax benefit of $0.3 million related to the VIE for the year ended December 31, 2015. At December 31, 2015, the owners of the 52.5% of the equity not owned by DXP included an executive officer and other employees of DXP.
Receivables and Credit Risk
Trade receivables consist primarily of uncollateralized customer obligations due under normal trade terms, which usually require payment within 30 days of the invoice date. However, these payment terms are extended in select cases and customers may not pay within stated trade terms.
The Company has trade receivables from a diversified customer base located primarily in the Rocky Mountain, Northeastern, Midwestern, Southeastern and Southwestern regions of the United States, and Canada. The Company believes no significant concentration of credit risk exists. The Company evaluates the creditworthiness of its customers' financial positions and monitors accounts on a regular basis, but generally does not require collateral. Provisions to the allowance for doubtful accounts are made monthly and adjustments are made periodically (as circumstances warrant) based upon management’s best estimate of the collectability of such accounts. The Company writes-off uncollectible trade accounts receivable when the accounts are determined to be uncollectible. No customer represents more than 10% of consolidated sales.
Uncertainties require the Company to make frequent judgments and estimates regarding a customer’s ability to pay amounts due in order to assess and quantify an appropriate allowance for doubtful accounts. The primary factors used to quantify the allowance are customer delinquency, bankruptcy, and the Company’s estimate of its ability to collect outstanding receivables based on the number of days a receivable has been outstanding.
The majority of the Company’s customers operate in the energy industry. The cyclical nature of the industry may affect customers’ operating performance and cash flows, which could impact the Company’s ability to collect on these obligations.
The Company continues to monitor the economic climate in which its customers operate and the aging of its accounts receivable. The allowance for doubtful accounts is based on the aging of accounts and an individual assessment of each invoice. At December 31, 2015, the allowance was 5.4% of the gross accounts receivable, compared to an allowance of 4.7% a year earlier. While credit losses have historically been within expectations and the provisions established, should actual write-offs differ from estimates, revisions to the allowance would be required.
Impairment of Goodwill and Other Indefinite Intangible Assets
The Company tests goodwill and other indefinite lived intangible assets for
impairment on an annual basis in the fourth quarter and when events or changes in circumstances indicate that the carrying amount may not be recoverable
. The Company assigns the carrying value of these intangible assets to its "reporting units" and applies the test for goodwill at the reporting unit level. A reporting unit is defined as an operating segment or one level below a segment (a "component") if the component is a business and discrete information is prepared and reviewed regularly by segment management. As of December 31, 2015 DXP Core Service Centers (“Core SC”), DXP Core IPS, DXP Core Supply Chain Services (“Core SCS”) and B27 Service Centers (“B27 SC”) reporting units had goodwill.
The Company’s goodwill impairment assessment first permits evaluating qualitative factors to determine if a reporting unit's carrying value would more likely than not exceed its fair value. If the Company concludes, based on the qualitative assessment, that a reporting unit's carrying value would more likely than not exceed its fair value, the Company would perform a two-step quantitative test for that reporting unit. When a quantitative assessment is performed, the first step is to identify a potential impairment, and the second step measures the amount of the impairment loss, if any. Goodwill is deemed to be impaired if the carrying amount of a reporting unit’s goodwill exceeds its estimated fair value.
The Company determines fair value using widely accepted valuation techniques, including discounted cash flows and market multiples analyses, and through use of independent fixed asset valuation firms, as appropriate. These types of analyses contain uncertainties as they require management to make assumptions and to apply judgments regarding industry economic factors and the profitability of future business strategies. The Company’s policy is to conduct impairment testing based on current business strategies, taking into consideration current industry and economic conditions, as well as the Company’s future expectations. Key assumptions used in the discounted cash flow valuation model include, among others, discount rates, growth rates, cash flow projections and terminal value rates. Discount rates and cash flow projections are the most sensitive and susceptible to change as they require significant management judgment. Discount rates are determined using a weighted average cost of capital (“WACC”). The WACC considers market an industry data, as well as Company-specific risk factors for each reporting unit in determining the appropriate discount rate to be used. The discount rate utilized for each reporting unit is indicative of the return an investor would expect to receive for investing in a similar business. Management uses industry considerations and Company-specific historical and projected results to develop cash flow projections for each reporting unit. Additionally, as part of the market multiples approach, the Company utilizes market data from publicly traded entities whose businesses operate in industries comparable to the Company’s reporting units, adjusted for certain factors that increase comparability.
The Company cannot predict the occurrence of events or circumstances that could adversely affect the fair value of goodwill. Such events may include, but are not limited to, deterioration of the economic environment, increase in the Company’s weighted average cost of capital, material negative changes in relationships with significant customers, reductions in valuations of other public companies in the Company’s industry, or strategic decisions made in response to economic and competitive conditions. If actual results are not consistent with the Company’s current estimates and assumptions, impairment of goodwill could be required.
During the third quarter of 2015, the price of DXP’s common stock and the price of crude oil declined over 40% and over 20%, respectively. The decline in oil prices reduced spending by our customers and reduced our revenue expectations. This sustained decline in crude oil prices, reduced capital spending by customers and reduced revenue expectations were determined to be a triggering event during the third quarter of 2015. This triggering event required us to perform testing for possible goodwill impairment in two of our reporting units, and our step one testing indicated there was an impairment in the B27 IPS and B27 SC reporting units. No triggering event was identified in our other reporting units during the third quarter. Accounting Standards Codification 350
Intangibles – Goodwill and Other
(“ASC 350”) step two of the goodwill impairment testing for the reporting units was performed preliminarily during the third quarter of 2015. Our preliminary analysis concluded that $48.0 million of our B27 IPS reporting unit’s goodwill and $9.8 of our B27 SC reporting unit’s goodwill was impaired. The remaining goodwill for the B27 IPS and B27 SC reporting units at September 30, 2015 was $4.9 million and $10.3 million, respectively. The third quarter of 2015 ASC 350 step two testing was completed in the fourth quarter of 2015 without any adjustment to the amount recorded in the third quarter of 2015.
As of October 1, 2015, DXP performed a qualitative assessment (“Step 0”) to determine whether DXP was required to proceed to ASC 350 step one of the impairment analysis for any of its reporting units. It is the position of DXP that the factors taken into the Step 0 analysis failed to meet the more likely than not criteria that the fair value of any of our reporting units had fallen below its carrying value as of October 1, 2015.
During the fourth quarter of 2015, the price of DXP’s common stock and the price of crude oil declined over 16% and over 18%, respectively. Actual earnings before interest, taxes, depreciation and amortization (“EBITDA”) for the fourth quarter of 2015 for the Core SCS and Core SC reporting units exceeded the EBITDA amounts in the October 1, 2015 Step 0 analysis. Therefore, evidence of a fourth quarter triggering event for these two reporting units does not exist. Additionally, the fair value of each of these reporting units is substantially in excess of each reporting units carrying value as of October 1, 2015. Actual EBITDA for the fourth quarter of 2015 for the Core IPS reporting unit was below the EBITDA amount in the October 1, 2015 Step 0 analysis. Therefore, DXP updated the 2016 through 2020 forecasts for the Core IPS reporting unit. The forecasted EBITDA for 2016 through 2020 in the updated forecast declined less than $1 million from the October 1, 2015 forecast. The effect of this decline was more than offset by a $12 million reduction in the carrying value of the Core IPS reporting unit at December 31, 2015 from the October 1, 2015 value. Therefore, evidence of a triggering event for this reporting unit does not exist. Additionally, the fair value of this reporting unit is substantially in excess of its carrying value as of October 1, 2015.
Actual EBITDA for the fourth quarter of 2015 for the B27 IPS and B27 SC reporting units were below the EBITDA amounts in the October 1, 2015 Step 0 analysis. Therefore, DXP updated the 2016 through 2020 forecasts for the B27 IPS and B27 SC reporting units. The forecasted EBITDA for 2016 through 2020 in the updated forecasts declined significantly from the October 1, 2015 forecast. The declines in the forecasted EBITDA for these two reporting units were determined to be a triggering event during the fourth quarter of 2015. This triggering event required us to perform testing for possible goodwill impairment in these two reporting units, and our ASC 350 step one testing indicated there may be an impairment in our B27 IPS and B27 SC reporting units. ASC 350 step two testing for reporting units was performed during the fourth quarter of 2015. Our analysis concluded that $4.9 million of our B27 IPS reporting unit’s goodwill was impaired, and $5.0 million of our B27 SC reporting unit’s goodwill was impaired. The remaining goodwill for the B27 IPS and B27 SC reporting units at December 31, 2015 was zero and $5.3 million, respectively.
Because the carrying value of the B27 SC reporting unit equals the fair value of the reporting unit, a future decline in the estimated cash flows of the reporting unit could result in an impairment loss. A future decline in the estimated cash flows could result from a significant decline in capital spending by oil and gas producers and related businesses.
As of October 1, 2014, the Core SCS, Core IPS and Core SCS, Canada Service Centers and NatPro Service Centers reporting units had goodwill. The fair value of each of these reporting units as of October 1, 2014 was substantially in excess of each reporting unit’s carrying value. The aggregate goodwill associated with these reporting units was $180.3 million, and the aggregate excess fair value of these reporting units over the carrying value at the measurement date was over 200%. The two reporting units with the lowest excess fair value are 90% and 17%, respectively, and the reporting unit with 17% excess fair value represented less than 5% of goodwill at December 31, 2014. The remaining reporting units, B2 SC, B27 IPS and NatPro IPS, recorded impairment losses during the fourth quarter of 2014. The NatPro IPS goodwill was reduced to zero with the impairment, and the remaining goodwill for the B27 SC and B27 IPS reporting units was $73 million at December 31, 2014.
DXP acquired B27 on January 1, 2014. At the time of acquisition, B27 management forecasted 2014 revenues to increase significantly over 2013 revenues based on their expectation of receiving several large orders from oil companies in South America. During the first half of 2014, the oil companies delayed the issuance of the expected purchase orders. However, oil prices increased during the period, which supported the probability the projects would be funded. During the third quarter of 2014 oil prices declined and it appeared the projects related to the expected orders were being deferred indefinitely. The indefinite delay in the pending large oil and gas production related projects in South America combined with the effect of the third quarter decline in oil prices on the domestic market reduced the expected fair value of the B27 reporting units. Considering the actual results of the B27 reporting units for the nine months ended September 30, 2014 and the decline in oil prices, DXP did not believe it was reasonable to expect B27 to be able to achieve the future operating results forecasted at the time of acquisition.
During 2014 DXP was working to improve the profitability of the NatPro IPS reporting unit. The decline in oil prices during the third quarter of 2014 significantly lowered the forecasts for oil and gas activity in Canada because Canada has high costs for oil production. This decline in forecasted oil and gas activity delayed the expected achievement of profitability for the NatPro IPS reporting unit. Considering the actual results of the NatPro IPS reporting unit for the nine months ended September 30, 2014 and the decline in oil prices, DXP did not believe it was reasonable to expect the NatPro IPS reporting unit to achieve the improved operating results in the time frame forecasted at the date of acquisition.
Impairment of Long-Lived Assets, Excluding Goodwill
The Company tests long-lived assets or asset groups for recoverability on an annual basis and when events or changes in circumstances indicate that their carrying amount may not be recoverable. Circumstances which could trigger a review include, but are not limited to: significant decreases in the market price of the asset; significant adverse changes in the business climate or legal factors; accumulation of costs significantly in excess of the amount originally expected for the acquisition or construction of the asset; current period cash flow or operating losses combined with a history of losses or a forecast of continuing losses associated with the use of the asset; and current expectation that the asset will more likely than not be sold or disposed significantly before the end of its estimated useful life. Recoverability is assessed based on the carrying amount of the asset and its fair value which is generally determined based on the sum of the undiscounted cash flows expected to result from the use and the eventual disposal of the asset, as well as specific appraisal in certain instances. An impairment loss is recognized when the carrying amount is not recoverable and exceeds fair value. No impairment was recorded for property and equipment and intangible assets with indefinite or determinable lives during 2015, 2014 and 2013.
Revenue Recognition
For binding, long-term agreements to fabricate tangible assets to customer specifications, the Company recognizes revenues using the percentage of completion method. Under this method, revenues are recognized as costs are incurred and include estimated profits calculated on the basis of the relationship between costs incurred and total estimated costs at completion. Changes in estimated profitability may periodically result in revisions to revenue and expenses and are recognized in the period such revisions become probable. If at any time expected costs exceed the value of the contract, the loss is recognized immediately. Revenues of approximately $47.5 million, $65.9 million, and $12.7 million were recognized on contracts in process for the years ended December 31, 2015, 2014, and 2013, respectively. The typical time span of these contracts is approximately one to two years.
For other sales, the Company recognizes revenues when an agreement is in place, the price is fixed, title for product passes to the customer or services have been provided and collectability is reasonably assured. Revenues are recorded net of sales taxes.
The Company reserves for potential customer returns based upon the historical level of returns. Reserves for customer accounts were $0.2 and $0.2 million at December 31, 2015 and 2014, respectively.
Self-insured Insurance and Medical Claims
We generally retain up to $100,000 of risk for each claim for workers compensation, general liability, automobile and property loss. We accrue for the estimated loss on the self-insured portion of these claims. The accrual is adjusted quarterly based upon reported claims information. The actual cost could deviate from the recorded estimate.
We generally retain up to $250,000 of risk on each medical claim for our employees and their dependents. We accrue for the estimated outstanding balance of unpaid medical claims for our employees and their dependents. The accrual is adjusted monthly based on recent claims experience. The actual claims could deviate from recent claims experience and be materially different from the reserve.
The accrual for these claims at December 31, 2015 and 2014 was approximately $3.4 million and $2.9 million, respectively.
Purchase Accounting
DXP estimates the fair value of assets, including property, machinery and equipment and their related useful lives and salvage values, intangibles and liabilities when allocating the purchase price of an acquisition.
The fair value estimates are developed using the best information available. Third party valuation specialists assist in valuing the Company’s significant acquisitions. Our purchase price allocation methodology contains uncertainties because it requires management to make assumptions and to apply judgment to estimate the fair value of acquired assets and liabilities. Management estimates the fair value of assets and liabilities based upon quoted market prices, the carrying value of the acquired assets and widely accepted valuation techniques, including the income approach and the market approach. Unanticipated events or circumstances may occur which could affect the accuracy of our fair value estimates, including assumptions regarding industry economic factors and business strategies. We typically engage an independent valuation firm to assist in estimating the fair value of goodwill and other intangible assets. We do not expect that there will be material change in the future estimates or assumptions we use to complete the purchase price allocation and estimate the fair values of acquired assets and liabilities for those acquisitions completed in fiscal 2013, fiscal 2014 and fiscal 2015. However, if actual results are not consistent with our estimates or assumptions, we may be exposed to losses or gains that could be material.
Income Taxes
The Company utilizes the asset and liability method of accounting for income taxes. Deferred income tax assets and liabilities are computed for differences between the financial statement and income tax bases of assets and liabilities. Such deferred income tax asset and liability computations are based on enacted tax laws and rates applicable to periods in which the differences are expected to reverse. Valuation allowances are established to reduce deferred income tax assets to the amounts expected to be realized under a more likely than not criterion.
Accounting for Uncertainty in Income Taxes
A position taken or expected to be taken in a tax return is recognized in the financial statements when it is more likely than not (i.e. a likelihood of more than fifty percent) that the position would be sustained upon examination by tax authorities. A recognized tax position is then measured at the largest amount of benefit that is greater than fifty percent likely of being realized upon ultimate settlement. The Company and its subsidiaries file income tax returns in the U.S. federal jurisdiction and various states. With few exceptions, the Company is no longer subject to U. S. federal, state and local tax examination by tax authorities for years prior to 2009. The Company's policy is to recognize interest related to unrecognized tax benefits as interest expense and penalties as operating expenses. The Company believes that it has appropriate support for the income tax positions taken and to be taken on its tax returns and that its accruals for tax liabilities are adequate for all open years based on an assessment of many factors including past experience and interpretations of tax law applied to the facts of each matter.
RECENT ACCOUNTING PRONOUNCEMENTS
In November 2015, the FASB issued ASU No. 2015-17,
Income Taxes (Topic 740), Balance Sheet Classification of Deferred Taxes.
The update requires entities to present deferred tax assets and liabilities as noncurrent in a classified balance sheet. The update simplifies the current guidance, which requires entities to separately present deferred tax assets and liabilities as current and noncurrent in a classified balance sheet. This pronouncement is effective for financial statements issued for annual periods beginning after December 15, 2016, and interim periods within. Early adoption is permitted. The Company is currently assessing the impact that this standard will have on its consolidated financial statements.
In April 2015, the FASB issued ASU No. 2015-03,
Interest – Imputation of Interest (Subtopic 835-30): Simplifying the Presentation of Debt Issuance Costs
, which requires entities to recognize debt issuance costs related to a recognized debt liability as a direct deduction from the carrying amount of that debt liability. This pronouncement is effective for fiscal years, and interim periods within those years, beginning after December 15, 2016, however, early adoption is permitted. DXP adopted this guidance for the first quarter of 2015 and adjusted the balance sheet for all periods presented.
In May 2014, the FASB issued ASU No. 2014-09,
Revenue from Contracts with Customers (Topic 606),
which provides guidance on revenue recognition. The core principal of this guidance is that an entity should recognize revenue to depict the transfer of promised goods or services to customers in an amount that reflects the consideration to which the entity expects to be entitled in exchange for those goods or services. This guidance requires entities to apply a five-step method to (1) identify the contract(s) with customers; (2) identify the performance obligation(s) in the contract; (3) determine the transaction price; (4) allocate the transaction price to the performance obligation(s) in the contract; and (5) recognize revenue when (or as) the entity satisfies a performance obligation. This pronouncement was originally effective for fiscal years, and interim periods within those years, beginning after December 15, 2016. In April 2015, the FASB approved a proposal to defer the effective date to fiscal years, and interim periods within those years, beginning after December 15, 2017. We are evaluating the impact that the adoption of this standard will have on our consolidated financial statements.
In July 2015, the FASB issued ASU No. 2015-11, Inventory ("ASU 2015-11"). The amendments in ASU 2015-11 clarify the subsequent measurement of inventory requiring an entity to subsequently measure inventory at the lower of cost and net realizable value. Net realizable value is the estimated selling price in the ordinary course of business, less reasonably predictable costs of completion, disposal, and transportation. This ASU applies only to inventory that is measured using the first-in, first-out (FIFO) or average cost method. Subsequent measurement is unchanged for inventory measured using last-in, first-out (LIFO) or the retail inventory method. The amendments in ASU 2015-11 should be applied prospectively and are effective for financial statements issued for fiscal years beginning after December 15, 2016, and interim periods within those fiscal years, with early adoption permitted. The Company is currently assessing the impact that this standard will have on its consolidated financial statements.
Inflation
We do not believe the effects of inflation have any material adverse effect on our results of operations or financial condition. We attempt to minimize inflationary trends by passing manufacturer price increases on to the customer whenever practicable.
Our market risk results primarily from volatility in interest rates. Our exposure to interest rate risk relates primarily to our debt portfolio. Using floating interest rate debt outstanding at December 31, 2015, a 100 basis point increase in interest rates would increase our annual interest expense by approximately $3.5 million. Also see “Risk Factors,” included in Item 1A of this Report for additional risk factors associated with our business.
The table below provides information about the Company’s market sensitive financial instruments and constitutes a forward-looking statement.
|
Principal Amount By Expected Maturity
(in thousands, except percentages)
|
||||||||||||||||||||||||||||||||
|
2016
|
2017
|
2018
|
2019
|
2020
|
There-
after
|
Total
|
Fair Value
|
|||||||||||||||||||||||||
|
Fixed Rate Long- term Debt
|
$
|
829
|
$
|
856
|
$
|
881
|
$
|
908
|
$
|
934
|
$
|
-
|
$
|
4,408
|
$
|
4,408
|
||||||||||||||||
|
Fixed Interest Rate
|
2.9
|
%
|
2.9
|
%
|
2.9
|
%
|
2.9
|
%
|
2.9
|
%
|
-
|
-
|
-
|
|||||||||||||||||||
|
Floating Rate Long-term Debt
|
$
|
50,000
|
$
|
62,500
|
$
|
62,500
|
$ |
172,147
|
-
|
-
|
$
|
347,147
|
$
|
347,147
|
||||||||||||||||||
|
Average Interest Rate (1)
|
2.67
|
%
|
2.67
|
%
|
2.67
|
%
|
$
|
2.67
|
% |
-
|
-
|
-
|
-
|
|||||||||||||||||||
|
Total Maturities
|
$
|
50,829
|
$
|
63,356
|
$
|
63,381
|
$
|
173,055
|
$
|
934
|
$
|
-
|
$
|
351,555
|
$
|
351,555
|
||||||||||||||||
|
(1) Assumes weighted average floating interest rates in effect at December 31, 2015.
|
||||||||||||||||||||||||||||||||
TABLE OF CONTENTS
|
Page
|
|
|
Reports of Independent Registered Public Accounting Firms
|
43
|
|
Consolidated Balance Sheets
|
46
|
|
Consolidated Statements of Income and Comprehensive Income
|
47
|
|
Consolidated Statements of Shareholders’ Equity
|
48
|
|
Consolidated Statements of Cash Flows
|
49
|
|
Notes to Consolidated Financial Statements
|
50
|
Report of Independent Registered Public Accounting Firm
Board of Directors and Shareholders
DXP Enterprises, Inc. and Subsidiaries
We have audited the accompanying consolidated balance sheets of DXP Enterprises, Inc. (a Delaware corporation) and subsidiaries (the “Company”) as of December 31, 2015 and 2014, and the related consolidated statements of income (loss) and comprehensive income (loss), shareholders’ equity, and cash flows for each of the two years in the period ended December 31, 2015. These financial statements are the responsibility of the Company’s management. Our responsibility is to express an opinion on these financial statements based on our audits.
We conducted our audits in accordance with the standards of the Public Company Accounting Oversight Board (United States). Those standards require that we plan and perform the audit to obtain reasonable assurance about whether the financial statements are free of material misstatement. An audit includes examining, on a test basis, evidence supporting the amounts and disclosures in the financial statements. An audit also includes assessing the accounting principles used and significant estimates made by management, as well as evaluating the overall financial statement presentation. We believe that our audits provide a reasonable basis for our opinion.
In our opinion, the consolidated financial statements referred to above present fairly, in all material respects, the financial position of DXP Enterprises, Inc. and subsidiaries as of December 31, 2015 and 2014, and the results of their operations and their cash flows for each of the two years in the period ended December 31, 2015 in conformity with accounting principles generally accepted in the United States of America.
As discussed in Note 3 to the consolidated financial statements, the Company adopted new accounting guidance in 2015 and 2014, related to the presentation for debt issuance costs.
We also have audited, in accordance with the standards of the Public Company Accounting Oversight Board (United States), the Company’s internal control over financial reporting as of December 31, 2015, based on criteria established in the 2013
Internal Control—Integrated Framework
issued by the Committee of Sponsoring Organizations of the Treadway Commission (COSO), and our report dated February 29, 2016 expressed an unqualified opinion.
/s/ GRANT THORNTON LLP
Houston, Texas
February 29, 2016
Report Of Independent Registered Public Accounting Firm
Board of Directors and Shareholders
DXP Enterprises, Inc. and Subsidiaries
We have audited the internal control over financial reporting of DXP Enterprises, Inc. (a Delaware corporation) and subsidiaries (the “Company”) as of December 31, 2015, based on criteria established in the 2013
Internal Control—Integrated Framework
issued by the Committee of Sponsoring Organizations of the Treadway Commission (COSO). The Company’s management is responsible for maintaining effective internal control over financial reporting and for its assessment of the effectiveness of internal control over financial reporting, included in the accompanying Management’s Report on Internal Control over Financial Reporting. Our responsibility is to express an opinion on the Company’s internal control over financial reporting based on our audit.
We conducted our audit in accordance with the standards of the Public Company Accounting Oversight Board (United States). Those standards require that we plan and perform the audit to obtain reasonable assurance about whether effective internal control over financial reporting was maintained in all material respects. Our audit included obtaining an understanding of internal control over financial reporting, assessing the risk that a material weakness exists, testing and evaluating the design and operating effectiveness of internal control based on the assessed risk, and performing such other procedures as we considered necessary in the circumstances. We believe that our audit provides a reasonable basis for our opinion.
A company’s internal control over financial reporting is a process designed to provide reasonable assurance regarding the reliability of financial reporting and the preparation of financial statements for external purposes in accordance with generally accepted accounting principles. A company’s internal control over financial reporting includes those policies and procedures that (1) pertain to the maintenance of records that, in reasonable detail, accurately and fairly reflect the transactions and dispositions of the assets of the company; (2) provide reasonable assurance that transactions are recorded as necessary to permit preparation of financial statements in accordance with generally accepted accounting principles, and that receipts and expenditures of the company are being made only in accordance with authorizations of management and directors of the company; and (3) provide reasonable assurance regarding prevention or timely detection of unauthorized acquisition, use, or disposition of the company’s assets that could have a material effect on the financial statements.
Because of its inherent limitations, internal control over financial reporting may not prevent or detect misstatements. Also, projections of any evaluation of effectiveness to future periods are subject to the risk that controls may become inadequate because of changes in conditions, or that the degree of compliance with the policies or procedures may deteriorate.
In our opinion, the Company maintained, in all material respects, effective internal control over financial reporting as of December 31, 2015, based on criteria established in the 2013
Internal Control—Integrated Framework
issued by COSO.
We also have audited, in accordance with the standards of the Public Company Accounting Oversight Board (United States), the consolidated financial statements of the Company as of and for the year ended December 31, 2015, and our report dated February 29, 2016 expressed an unqualified opinion on those financial statements.
/s/ GRANT THORNTON LLP
Houston, Texas
February 29, 2016
Report of Independent Registered Public Accounting Firm on Financial Statements
To the Board of Directors and Shareholders of
DXP Enterprises, Inc. and Subsidiaries
Houston, Texas
We have audited the accompanying consolidated balance sheet of DXP Enterprises, Inc. and Subsidiaries as of December 31, 2013, and the related consolidated statements of income and comprehensive income, shareholders’ equity and cash flows for the year ended December 31, 2013. These consolidated financial statements and financial statement schedule are the responsibility of the Company’s management. Our responsibility is to express an opinion on these consolidated financial statements and schedule based on our audits.
We conducted our audits in accordance with the standards of the Public Company Accounting Oversight Board (United States). Those standards require that we plan and perform the audit to obtain reasonable assurance about whether the financial statements are free of material misstatement. An audit includes examining, on a test basis, evidence supporting the amounts and disclosures in the financial statements. An audit also includes assessing the accounting principles used and significant estimates made by management, as well as evaluating the overall financial statement presentation. We believe that our audits provide a reasonable basis for our opinion.
In our opinion, the consolidated financial statements referred to above present fairly, in all material respects, the financial position of DXP Enterprises, Inc. and Subsidiaries as of December 31, 2013, and the results of their operations and their cash flows for the year ended December 31, 2013, in conformity with U.S. generally accepted accounting principles.
We have also audited, in accordance with the standards of the Public Company Accounting Oversight Board (United States), DXP Enterprises, Inc. and Subsidiaries internal control over financial reporting as of December 31, 2013, based on the criteria established in
Internal Control—Integrated Framework
issued by the Committee of Sponsoring Organizations of the Treadway Commission in 1992, and our report dated March 11, 2014, expressed an unqualified opinion on the effectiveness of DXP Enterprises, Inc.’s internal control over financial reporting.
Hein & Associates LLP
Houston, Texas
March 11, 2014
DXP ENTERPRISES, INC. AND SUBSIDIARIES
CONSOLIDATED BALANCE SHEETS
(in thousands, except share and per share amounts)
|
December 31, 2015
|
December 31, 2014
|
|||||||
|
ASSETS
|
||||||||
|
Current assets:
|
||||||||
|
Cash
|
$
|
1,693
|
$
|
47
|
||||
|
Trade accounts receivable, net of allowances for doubtful accounts of $9,364 in 2015 and $8,713 in 2014
|
162,925
|
239,236
|
||||||
|
Inventories
|
103,819
|
115,658
|
||||||
|
Costs and estimated profits in excess of billings on uncompleted contracts
|
22,045
|
20,083
|
||||||
|
Prepaid expenses and other current assets
|
2,644
|
3,004
|
||||||
|
Federal income taxes recoverable
|
1,839
|
-
|
||||||
|
Deferred income taxes
|
8,996
|
8,250
|
||||||
|
Total current assets
|
303,961
|
386,278
|
||||||
|
Property and equipment, net
|
68,503
|
69,979
|
||||||
|
Goodwill
|
197,362
|
253,312
|
||||||
|
Other intangible assets, net of accumulated amortization of $87,594 in 2015 and $66,412 in 2014
|
112,297
|
130,333
|
||||||
|
Other long-term assets
|
1,857
|
1,730
|
||||||
|
Total assets
|
$
|
683,980
|
$
|
841,632
|
||||
|
LIABILITIES AND SHAREHOLDERS’ EQUITY
|
||||||||
|
Current liabilities:
|
||||||||
|
Current maturities of long-term debt
|
$
|
50,829
|
$
|
38,608
|
||||
|
Trade accounts payable
|
77,108
|
100,774
|
||||||
|
Accrued wages and benefits
|
20,864
|
26,967
|
||||||
|
Federal income taxes payable
|
-
|
8,130
|
||||||
|
Customer advances
|
1,076
|
4,262
|
||||||
|
Billings in excess of costs and profits on uncompleted contracts
|
8,021
|
8,840
|
||||||
|
Other current liabilities
|
22,220
|
19,621
|
||||||
|
Total current liabilities
|
180,118
|
207,202
|
||||||
|
Long-term debt, less current maturities
|
300,726
|
372,908
|
||||||
|
Less unamortized debt issuance costs
|
(2,046
|
)
|
(2,714
|
)
|
||||
|
Long-term debt less unamortized debt issuance costs
|
298,680
|
370,194
|
||||||
|
Non-current deferred income taxes
|
6,312
|
21,284
|
||||||
|
Commitments and Contingencies (Notes 13)
|
||||||||
|
Shareholders’ equity:
|
||||||||
|
Series A preferred stock, 1/10
th
vote per share; $1.00 par value; liquidation preference of $100 per share ($112 at December 31, 2015 and 2014); 1,000,000 shares authorized; 1,122 shares issued and outstanding
|
1
|
1
|
||||||
|
Series B convertible preferred stock, 1/10
th
vote per share; $1.00 par value; $100 stated value; liquidation preference of $100 per share ($1,500 at December 31, 2015 and 2014); 1,000,000 shares authorized; 15,000 shares issued and outstanding
|
15
|
15
|
||||||
|
Common stock, $0.01 par value, 100,000,000 shares authorized; 14,655,356 in 2015 and 14,655,356 in 2014 shares issued
|
146
|
146
|
||||||
|
Additional paid-in capital
|
110,306
|
115,605
|
||||||
|
Retained earnings
|
109,783
|
148,409
|
||||||
|
Accumulated other comprehensive (loss) income
|
(10,616
|
)
|
(5,700
|
)
|
||||
|
Treasury stock, at cost (264,297 shares at December 31, 2015 and 280,195 shares at December 31, 2014)
|
(12,577
|
)
|
(15,524
|
)
|
||||
|
Total DXP Enterprises, Inc. shareholders’ equity
|
197,058
|
242,952
|
||||||
|
Noncontrolling interest
|
1,812
|
-
|
||||||
|
Total shareholders’ equity
|
$
|
198,870
|
$
|
242,952
|
||||
|
Total liabilities and shareholders’ equity
|
$
|
683,980
|
$
|
841,632
|
||||
The accompanying notes are an integral part of these consolidated financial statements.
DXP ENTERPRISES, INC. AND SUBSIDIARIES
CONSOLIDATED STATEMENTS OF INCOME (LOSS)
AND COMPREHENSIVE INCOME (LOSS)
(in thousands, except per share amounts)
|
Years Ended December 31,
|
||||||||||||
|
2015
|
2014
|
2013
|
||||||||||
|
Sales
|
$
|
1,247,043
|
$
|
1,499,662
|
$
|
1,241,510
|
||||||
|
Cost of sales
|
895,057
|
1,066,822
|
869,165
|
|||||||||
|
Gross profit
|
351,986
|
432,840
|
372,345
|
|||||||||
|
Selling, general and administrative expense
|
303,819
|
327,899
|
271,421
|
|||||||||
|
Impairment expense
|
68,735
|
117,569
|
-
|
|||||||||
|
B27 settlement
|
7,348
|
-
|
-
|
|||||||||
|
Operating income (loss)
|
(27,916
|
)
|
(12,628
|
)
|
100,924
|
|||||||
|
Other expense (income), net
|
72
|
131
|
(75
|
)
|
||||||||
|
Interest expense
|
10,932
|
12,797
|
6,282
|
|||||||||
|
Income (loss) before income taxes
|
(38,920
|
)
|
(25,556
|
)
|
94,717
|
|||||||
|
Provision for income taxes
|
150
|
19,682
|
34,480
|
|||||||||
|
Net income (loss)
|
(39,070
|
)
|
(45,238
|
)
|
60,237
|
|||||||
|
Net income (loss) attributable to noncontrolling interest
|
(534
|
)
|
-
|
-
|
||||||||
|
Net income (loss) attributable to DXP Enterprises, Inc.
|
(38,536
|
)
|
(45,238
|
)
|
60,237
|
|||||||
|
Preferred stock dividend
|
90
|
90
|
90
|
|||||||||
|
Net income (loss) attributable to common shareholders
|
$
|
(38,626
|
)
|
$
|
(45,328
|
)
|
$
|
60,147
|
||||
|
Net income (loss)
|
$
|
(39,070
|
)
|
$
|
(45,238
|
)
|
$
|
60,237
|
||||
|
(Loss) gain on long-term investment, net of income taxes
|
-
|
(55
|
)
|
(387
|
)
|
|||||||
|
Cumulative translation adjustment, net of income taxes
|
(4,916
|
)
|
(3,277
|
)
|
(3,040
|
)
|
||||||
|
Comprehensive income (loss)
|
$
|
(43,986
|
)
|
$
|
(48,570
|
)
|
$
|
56,810
|
||||
|
Basic earnings (loss) per share
|
$
|
(2.68
|
)
|
$
|
(3.10
|
)
|
$
|
4.17
|
||||
|
Weighted average common shares outstanding
|
14,423
|
14,639
|
14,439
|
|||||||||
|
Diluted earnings (loss) per share
|
$
|
(2.68
|
)
|
$
|
(3.10
|
)
|
$
|
3.94
|
||||
|
Weighted average common shares and common equivalent shares outstanding
|
14,423
|
14,639
|
15,279
|
|||||||||
The accompanying notes are an integral part of these consolidated financial statements.
DXP ENTERPRISES, INC.
CONSOLIDATED STATEMENTS OF SHAREHOLDERS’ EQUITY
Years Ended December 31, 2015, 2014 and 2013
(in thousands, except share amounts)
|
Series A
Preferred
Stock
|
Series B
Preferred
Stock
|
Common
Stock
|
Paid-In
Capital
|
Retained
Earnings
|
Treasury
Stock
|
NCI
|
AOCI
|
Total
|
||||||||||||||||||||||||||||
|
BALANCES AT
DECEMBER 31, 2012
|
$
|
1
|
$
|
15
|
$
|
141
|
$
|
78,554
|
$
|
133,590
|
$
|
(4,867
|
)
|
$
|
-
|
$
|
1,059
|
$
|
208,493
|
|||||||||||||||||
|
Dividends paid
|
-
|
-
|
-
|
-
|
(90
|
)
|
-
|
-
|
-
|
(90
|
)
|
|||||||||||||||||||||||||
|
Issuance of common stock
|
2
|
24,356
|
24,358
|
|||||||||||||||||||||||||||||||||
|
Compensation expense for restricted stock
|
-
|
-
|
-
|
2,832
|
-
|
-
|
-
|
-
|
2,832
|
|||||||||||||||||||||||||||
|
Net loss on long-term investment for comprehensive income
|
-
|
-
|
-
|
-
|
-
|
-
|
-
|
(387
|
)
|
(387
|
)
|
|||||||||||||||||||||||||
|
Issuance of 52,542 shares in connection with an acquisition
|
-
|
-
|
1
|
3,517
|
-
|
-
|
-
|
-
|
3,518
|
|||||||||||||||||||||||||||
|
Vesting of restricted stock for 67,021 shares of common stock
|
-
|
-
|
-
|
633
|
-
|
-
|
-
|
-
|
633
|
|||||||||||||||||||||||||||
|
Acquisition of 5,400 shares of treasury stock
|
-
|
-
|
-
|
-
|
-
|
(304
|
)
|
-
|
-
|
(304
|
)
|
|||||||||||||||||||||||||
|
Cumulative translation adjustment
|
-
|
-
|
-
|
-
|
-
|
-
|
-
|
(3,040
|
)
|
(3,040
|
)
|
|||||||||||||||||||||||||
|
Net income
|
-
|
-
|
-
|
-
|
60,237
|
-
|
-
|
-
|
60,237
|
|||||||||||||||||||||||||||
|
BALANCES AT DECEMBER 31, 2013
|
$
|
1
|
$
|
15
|
$
|
144
|
$
|
109,892
|
$
|
193,737
|
$
|
(5,171
|
)
|
$
|
-
|
$
|
(2,368
|
)
|
$
|
296,250
|
||||||||||||||||
|
Dividends paid
|
-
|
-
|
-
|
-
|
(90
|
)
|
-
|
-
|
-
|
(90
|
)
|
|||||||||||||||||||||||||
|
Compensation expense for restricted stock
|
-
|
-
|
-
|
3,560
|
-
|
-
|
-
|
-
|
3,560
|
|||||||||||||||||||||||||||
|
Net loss on sale of long-term investment for comprehensive income
|
-
|
-
|
-
|
-
|
-
|
-
|
-
|
(55
|
)
|
(55
|
)
|
|||||||||||||||||||||||||
|
Issuance of 36,000 shares in connection with an acquisition
|
-
|
-
|
2
|
4,031
|
-
|
-
|
-
|
-
|
4,033
|
|||||||||||||||||||||||||||
|
Vesting of restricted stock for 69,675 shares of common stock
|
-
|
-
|
-
|
(376
|
)
|
-
|
-
|
-
|
-
|
(376
|
)
|
|||||||||||||||||||||||||
|
Acquisition of 200,000 shares of treasury stock
|
-
|
-
|
-
|
-
|
-
|
(11,855
|
)
|
-
|
-
|
(11,855
|
)
|
|||||||||||||||||||||||||
|
Issuance of 66,676 treasury shares for vesting of restricted stock
|
-
|
-
|
-
|
(1,502
|
)
|
-
|
1,502
|
-
|
-
|
|||||||||||||||||||||||||||
|
Cumulative translation adjustment
|
-
|
-
|
-
|
-
|
-
|
-
|
-
|
(3,277
|
)
|
(3,277
|
)
|
|||||||||||||||||||||||||
|
Net loss
|
-
|
-
|
-
|
-
|
(45,238
|
)
|
-
|
-
|
-
|
(45,238
|
)
|
|||||||||||||||||||||||||
|
BALANCES AT DECEMBER 31, 2014
|
$
|
1
|
$
|
15
|
$
|
146
|
$
|
115,605
|
$
|
148,409
|
$
|
(15,524
|
)
|
$
|
-
|
$
|
(5,700
|
)
|
$
|
242,952
|
||||||||||||||||
|
Dividends paid
|
-
|
-
|
-
|
-
|
(90
|
)
|
-
|
-
|
-
|
(90
|
)
|
|||||||||||||||||||||||||
|
Compensation expense for restricted stock
|
-
|
-
|
-
|
2,973
|
-
|
-
|
-
|
-
|
2,973
|
|||||||||||||||||||||||||||
|
Issuance of 148,769 treasury shares in connection with an acquisition
|
-
|
-
|
-
|
(4,825
|
)
|
-
|
9,223
|
-
|
-
|
4,398
|
||||||||||||||||||||||||||
|
Acquisition of 191,420 shares of treasury stock
|
-
|
-
|
-
|
-
|
-
|
(8,908
|
)
|
-
|
-
|
(8,908
|
)
|
|||||||||||||||||||||||||
|
Issuance of 57,401 treasury shares upon vesting of restricted stock
|
-
|
-
|
-
|
(3,447
|
)
|
-
|
2,632
|
-
|
-
|
(815
|
)
|
|||||||||||||||||||||||||
|
Noncontrolling interest
|
-
|
-
|
-
|
-
|
-
|
-
|
2,346
|
2,346
|
||||||||||||||||||||||||||||
|
Cumulative translation adjustment
|
-
|
-
|
-
|
-
|
-
|
-
|
-
|
(4,916
|
)
|
(4,916
|
)
|
|||||||||||||||||||||||||
|
Net income (loss)
|
-
|
-
|
-
|
-
|
(38,536
|
)
|
-
|
(534
|
) |
-
|
(39,070
|
)
|
||||||||||||||||||||||||
|
BALANCES AT DECEMBER 31, 2015
|
$
|
1
|
$
|
15
|
$
|
146
|
$
|
110,306
|
$
|
109,783
|
$
|
(12,577
|
)
|
$
|
1,812
|
$
|
(10,616
|
)
|
$
|
198,870
|
||||||||||||||||
The accompanying notes are an integral part of these consolidated financial statements.
DXP ENTERPRISES, INC. AND SUBSIDIARIES
CONSOLIDATED STATEMENTS OF CASH FLOWS
(in thousands)
|
Years Ended
December 31,
|
||||||||||||
|
2015
|
2014
|
2013
|
||||||||||
|
CASH FLOWS FROM OPERATING ACTIVITIES:
|
||||||||||||
|
Net income (loss) attributable to DXP Enterprises, Inc.
|
$
|
(38,536
|
)
|
$
|
(45,238
|
)
|
$
|
60,237
|
||||
|
Less net income (loss) attributable to noncontrolling interest
|
(534
|
)
|
-
|
-
|
||||||||
|
Net income (loss)
|
(39,070
|
)
|
(45,238
|
)
|
60,237
|
|||||||
|
Adjustments to reconcile net income (loss) to net cash provided by operating activities:
|
||||||||||||
|
Depreciation
|
12,622
|
12,598
|
9,830
|
|||||||||
|
Amortization of intangible assets
|
20,621
|
22,480
|
11,830
|
|||||||||
|
Impairment of goodwill
|
68,735
|
117,569
|
-
|
|||||||||
|
Bad debt expense
|
2,014
|
2,365
|
2,018
|
|||||||||
|
Amortization of debt issuance costs
|
1,211
|
1,157
|
793
|
|||||||||
|
Gain on reversal of earn-out
|
-
|
-
|
(2,805
|
)
|
||||||||
|
Compensation expense for restricted stock
|
2,973
|
3,560
|
2,832
|
|||||||||
|
Tax benefit related to vesting of restricted stock
|
-
|
(960
|
)
|
(958
|
)
|
|||||||
|
Deferred income taxes
|
(9,024
|
)
|
(12,122
|
)
|
2,834
|
|||||||
|
Changes in operating assets and liabilities, net of assets and liabilities acquired in business acquisitions:
|
||||||||||||
|
Trade accounts receivable
|
71,261
|
(14,002
|
)
|
(6,683
|
)
|
|||||||
|
Cost in excess of billings on uncompleted contracts
|
(2,047
|
)
|
(405
|
)
|
2,857
|
|||||||
|
Inventories
|
12,724
|
(1,913
|
)
|
3,860
|
||||||||
|
Prepaid expenses and other assets
|
159
|
1,948
|
1,422
|
|||||||||
|
Accounts payable and accrued expenses
|
(43,677
|
)
|
11,099
|
(6,380
|
)
|
|||||||
|
Billings in excess of costs on uncompleted contracts
|
(513
|
)
|
2,359
|
511
|
||||||||
|
Net cash provided by operating activities
|
97,989
|
100,495
|
82,198
|
|||||||||
|
CASH FLOWS FROM INVESTING ACTIVITIES:
|
||||||||||||
|
Purchase of property and equipment
|
(13,992
|
)
|
(11,104
|
)
|
(7,745
|
)
|
||||||
|
Sale of investments
|
-
|
1,688
|
(68
|
)
|
||||||||
|
Acquisitions of businesses, net of cash acquired
|
(15,501
|
)
|
(300,844
|
)
|
(61,195
|
)
|
||||||
|
Net cash used in investing activities
|
(29,493
|
)
|
(310,260
|
)
|
(69,008
|
)
|
||||||
|
CASH FLOWS FROM FINANCING ACTIVITIES:
|
||||||||||||
|
Proceeds from debt
|
393,551
|
744,050
|
458,446
|
|||||||||
|
Principal payments on revolving line of credit and other long-term debt
|
(453,480
|
)
|
(527,030
|
)
|
(501,990
|
)
|
||||||
|
Debt issuance fees
|
(543
|
)
|
(1,823
|
)
|
-
|
|||||||
|
Contributions from noncontrolling interest holders, net of losses
|
2,346
|
-
|
-
|
|||||||||
|
Preferred dividends paid
|
(90
|
)
|
(90
|
)
|
(90
|
)
|
||||||
|
Purchase of treasury stock
|
(8,908
|
)
|
(11,855
|
)
|
(304
|
)
|
||||||
|
Proceeds from issuance of common shares, net
|
-
|
-
|
24,358
|
|||||||||
|
Tax benefit related to vesting of restricted stock
|
-
|
960
|
958
|
|||||||||
|
Net cash provided by (used in) financing activities
|
(67,124
|
)
|
204,212
|
(18,622
|
)
|
|||||||
|
EFFECT OF FOREIGN CURRENCY ON CASH
|
274
|
131
|
446
|
|||||||||
|
(DECREASE) INCREASE IN CASH
|
1,646
|
(5,422
|
)
|
(4,986
|
)
|
|||||||
|
CASH AT BEGINNING OF YEAR
|
47
|
5,469
|
10,455
|
|||||||||
|
CASH AT END OF YEAR
|
$
|
1,693
|
$
|
47
|
$
|
5,469
|
||||||
|
SUPPLEMENTAL CASH FLOW INFORMATION:
|
||||||||||||
|
Cash paid for Interest
|
$
|
9,721
|
$
|
11,641
|
$
|
5,489
|
||||||
|
Cash paid for Income Taxes
|
$
|
13,792
|
$
|
28,784
|
$
|
35,697
|
||||||
Purchases of businesses in 2013 exclude $3.6 million in common stock in connection with an acquisition. Purchases of businesses in 2014 exclude $4.0 million in common stock issued in connection with an acquisition. Purchases of businesses in 2015 exclude $4.4 million in common stock issued in connection with an acquisition.
The accompanying notes are an integral part of these consolidated financial statements.
DXP ENTERPRISES INC. AND SUBSIDIARIES
NOTES TO CONSOLIDATED FINANCIAL STATEMENTS
NOTE 1 - THE COMPANY
DXP Enterprises, Inc. together with its subsidiaries (collectively “DXP,” “Company,” “us,” “we,” or “our”) was incorporated in Texas on July 26, 1996, to be the successor to SEPCO Industries, Inc. DXP Enterprises, Inc. and its subsidiaries are engaged in the business of distributing maintenance, repair and operating (MRO) products, and service to industrial customers. Additionally, DXP provides integrated, custom pump skid packages, pump remanufacturing and manufactures branded private label pumps to industrial customers. The Company is organized into three business segments: Service Centers, Supply Chain Services (SCS) and Innovative Pumping Solutions (IPS). See Note 17 for discussion of the business segments.
NOTE 2 - SUMMARY OF SIGNIFICANT ACCOUNTING AND BUSINESS POLICIES
Basis of Presentation
The Company’s financial statements are prepared in accordance with accounting principles generally accepted in the United States of America (“USGAAP”). The accompanying consolidated financial statements include the accounts of the Company, its wholly owned subsidiaries and its variable interest entity (“VIE”).
DXP is the primary beneficiary of a VIE in which DXP owns 47.5% of the equity. DXP consolidates the financial statements of the VIE with the financial statements of DXP. As of December 31, 2015, the total assets of the VIE were approximately $4.0 million including $0.3 million of cash and approximately $3.6 million of fixed assets. DXP is the sole customer of the VIE. Consolidation of the VIE increased cost of sales by approximately $1.4 million for the twelve months ended December 31, 2015. The Company recognized a related income tax benefit of $0.3 million related to the VIE for the year ended December 31, 2015. At December 31, 2015, the owners of the 52.5% of the equity not owned by DXP included an executive officer and other employees of DXP.
All significant intercompany accounts and transactions have been eliminated in consolidation. Certain prior year amounts have been reclassified to conform to the current year presentation; none affected net income.
Out-of-Period Items
During the first quarter of 2015, we identified a $2.5 million ($1.6 million net of tax) overstatement of an accrual at December 31, 2014, which overstated 2014 selling, general and administrative expense. We recorded an out-of-period adjustment to correct this overstatement in the quarter ended March 31, 2015. During the fourth quarter of 2015, we realized $1.5 million of net tax benefits related to events which occurred in earlier years. These out-of-period items reduced the 2015 net loss by $3.1 million and 2015 basic and diluted net loss per share by $0.21. We assessed the materiality of this overstatement and concluded the overstatement was not material to the results of operations or financial condition for the years ended December 31, 2015 and 2014.
Foreign Currency
The financial statements of the Company’s Canadian subsidiaries are measured using local currencies as their functional currencies. Assets and liabilities are translated into U.S. dollars at current exchange rates, while income and expenses are translated at average exchange rates. Translation gains and losses are reported in other comprehensive income (loss). Gains and losses on transactions denominated in foreign currency are reported in consolidated statements of income (loss).
Use of Estimates
The preparation of financial statements in conformity with
USGAAP
requires management to make estimates and assumptions in determining the reported amounts of assets and liabilities and disclosure of contingent assets and liabilities at the date of the financial statements and the reported amounts of revenues and expenses during the reporting period. In the opinion of management, all adjustments necessary in order to make the financial statements not misleading have been included. Actual results could differ from those estimates.
Cash and Cash Equivalents
The Company’s presentation of cash includes cash equivalents. Cash equivalents are defined as short-term investments with maturity dates of 90 days or less at time of purchase. The Company places its cash and cash equivalents with institutions with high credit quality. However, at certain times, such cash and cash equivalents may be in excess of Federal Deposit Insurance Corporation (“FDIC”) insurance limits.
Receivables and Credit Risk
Trade receivables consist primarily of uncollateralized customer obligations due under normal trade terms, which usually require payment within 30 days of the invoice date. However, these payment terms are extended in select cases and customers may not pay within stated trade terms.
The Company has trade receivables from a diversified customer base located primarily in the Rocky Mountain, Northeastern, Midwestern, Southeastern and Southwestern regions of the United States, and Canada. The Company believes no significant concentration of credit risk exists. The Company evaluates the creditworthiness of its customers' financial positions and monitors accounts on a regular basis, but generally does not require collateral. Provisions to the allowance for doubtful accounts are made monthly and adjustments are made periodically (as circumstances warrant) based upon management’s best estimate of the collectability of such accounts. The Company writes-off uncollectible trade accounts receivable when the accounts are determined to be uncollectible. No customer represents more than 10% of consolidated sales.
We maintain an allowance for losses based upon the expected collectability of accounts receivable. Changes in this allowance for 2015, 2014 and 2013 were as follows:
|
Year Ended December 31,
|
||||||||||||
|
2015
|
2014
|
2013
|
||||||||||
|
Balance at beginning of year
|
$
|
8,713
|
$
|
8,798
|
$
|
7,204
|
||||||
|
Charged to costs and expenses
|
2,014
|
2,365
|
2,018
|
|||||||||
|
Charged to other accounts
|
1,255
|
2
|
1,140
|
2
|
560
|
2
|
||||||
|
Deductions
|
(2,618
|
)
1
|
(3,590
|
)
1
|
(984
|
)
1
|
||||||
|
Balance at end of year
|
$
|
9,364
|
$
|
8,713
|
$
|
8,798
|
||||||
(
1) Uncollectible accounts written off, net of recoveries
(2) Includes allowance for doubtful accounts from acquisitions
Fair Value of Financial Instruments
The Company is required to maximize the use of observable inputs and minimize the use of unobservable inputs when measuring fair value. USGAAP establishes a fair value hierarchy based on the level of independent, objective evidence surrounding the inputs used to measure fair value. A financial instrument’s categorization within the fair value hierarchy is based upon the lowest level of input that is significant to the fair value measurement. USGAAP prioritizes the inputs into three levels that may be used to measure fair value:
Level 1
Level 1 applies to assets or liabilities for which there are quoted prices in active markets for identical assets or liabilities.
Level 2
Level 2 applies to assets or liabilities for which there are inputs other than quoted prices that are observable for the asset or liability such as quoted prices for similar assets or liabilities in active markets; quoted prices for identical assets or liabilities in markets with insufficient volume or infrequent transactions (less active markets); or model-derived valuations in which significant inputs are observable or can be derived principally from, or corroborated by, observable market data.
Level 3
Level 3 applies to assets or liabilities for which there are unobservable inputs to the valuation methodology that are significant to the measurement of the fair value of the assets or liabilities.
See Note 4 for further information regarding the Company’s financial instruments.
Inventories
Inventories consist principally of finished goods and are priced at lower of cost or market, cost being determined using the first-in, first-out (“FIFO”) method. Reserves are provided against inventories for estimated obsolescence based upon the aging of the inventories and market trends and are applied as a reduction in cost of associated inventory.
Property and Equipment
Property and equipment are carried on the basis of cost. Depreciation of property and equipment is computed using the straight-line method over their estimated useful lives. Maintenance and repairs of depreciable assets are charged against earnings as incurred. When properties are retired or otherwise disposed of, the cost and accumulated depreciation are removed from the accounts and gains or losses are credited or charged to earnings.
The principal estimated useful lives used in determining depreciation are as follows:
|
Buildings
|
20-39 years
|
|
Building improvements
|
10-20 years
|
|
Furniture, fixtures and equipment
|
3-20 years
|
|
Leasehold improvements
|
Shorter of estimated useful life or related lease term
|
Impairment of Goodwill and Other Intangible Assets
The Company tests goodwill and other indefinite lived intangible assets for
impairment on an annual basis in the fourth quarter and when events or changes in circumstances indicate that the carrying amount may not be recoverable
. The Company assigns the carrying value of these intangible assets to its "reporting units" and applies the test for goodwill at the reporting unit level. A reporting unit is defined as an operating segment or one level below a segment (a "component") if the component is a business and discrete information is prepared and reviewed regularly by segment management.
The Company’s goodwill impairment assessment first permits evaluating qualitative factors to determine if a reporting unit's carrying value would more likely than not exceed its fair value. If the Company concludes, based on the qualitative assessment, that a reporting unit's carrying value would more likely than not exceed its fair value, the Company would perform a two-step quantitative test for that reporting unit. When a quantitative assessment is performed, the first step is to identify a potential impairment, and the second step measures the amount of the impairment loss, if any. Goodwill is deemed to be impaired if the carrying amount of a reporting unit’s goodwill exceeds its estimated fair value. During the third and fourth quarter of 2015, DXP performed interim impairment tests using a quantitative approach and recognized goodwill impairments of $57.8 million and $9.8 million, respectively. During the fourth quarter ended December 31, 2014, the Company performed its annual goodwill impairment test using a quantitative approach and recognized a goodwill impairment of $117.6 million (see Note 8).
No impairment of goodwill was required in 2013.
Impairment of Long-Lived Assets, Excluding Goodwill
The Company tests long-lived assets or asset groups for recoverability on an annual basis and when events or changes in circumstances indicate that their carrying amount may not be recoverable. Circumstances which could trigger a review include, but are not limited to: significant decreases in the market price of the asset; significant adverse changes in the business climate or legal factors; accumulation of costs significantly in excess of the amount originally expected for the acquisition or construction of the asset; current period cash flow or operating losses combined with a history of losses or a forecast of continuing losses associated with the use of the asset; and current expectation that the asset will more likely than not be sold or disposed significantly before the end of its estimated useful life. Recoverability is assessed based on the carrying amount of the asset and its fair value which is generally determined based on the sum of the undiscounted cash flows expected to result from the use and the eventual disposal of the asset, as well as specific appraisal in certain instances. An impairment loss is recognized when the carrying amount is not recoverable and exceeds fair value.
Share-based Compensation
The Company uses restricted stock for share-based compensation programs. The Company measures compensation cost with respect to equity instruments granted as stock-based payments to employees based upon the estimated fair value of the equity instruments at the date of the grant. The cost as measured is recognized as expense over the period which an employee is required to provide services in exchange for the award.
Revenue Recognition
For binding agreements to fabricate tangible assets to customer specifications, the Company recognizes revenues using the percentage of completion method. Under this method, revenues are recognized as costs are incurred and include estimated profits calculated on the basis of the relationship between costs incurred and total estimated costs at completion. If at any time expected costs exceed the value of the contract, the loss is recognized immediately. Revenues of approximately $47.5 million, $65.9 million, and $12.7 million were recognized on contracts in process for the years ended December 31, 2015, 2014, and 2013, respectively. The typical time span of these contracts is approximately one to two years.
For other sales, the Company recognizes revenues when an agreement is in place, the price is fixed, title for product passes to the customer or services have been provided and collectability is reasonably assured. Revenues are recorded net of sales taxes.
The Company reserves for potential customer returns based upon the historical level of returns.
Shipping and Handling Costs
The Company classifies shipping and handling charges billed to customers as sales. Shipping and handling charges paid to others are classified as a component of cost of sales.
Self-insured Insurance and Medical Claims
We generally retain up to $100,000 of risk for each claim for workers compensation, general liability, automobile and property loss. We accrue for the estimated loss on the self-insured portion of these claims. The accrual is adjusted quarterly based upon reported claims information. The actual cost could deviate from the recorded estimate.
We generally retain up to $250,000 of risk on each medical claim for our employees and their dependents. We accrue for the estimated outstanding balance of unpaid medical claims for our employees and their dependents. The accrual is adjusted monthly based on recent claims experience. The actual claims could deviate from recent claims experience and be materially different from the reserve.
The accrual for these claims at December 31, 2015 and 2014 was approximately $3.4 million and $2.9 million, respectively.
Purchase Accounting
DXP estimates the fair value of assets, including property, machinery and equipment and their related useful lives and salvage values, intangibles and liabilities when allocating the purchase price of an acquisition.
The fair value estimates are developed using the best information available. Third party valuation specialists assist in valuing the Company’s significant acquisitions.
Cost of Sales and Selling, General and Administrative Expense
Cost of sales includes product and product related costs, inbound freight charges, internal transfer costs and depreciation. Selling, general and administrative expense includes purchasing and receiving costs, inspection costs, warehousing costs, depreciation and amortization.
Debt Issuance Cost Amortization
Fees paid to DXP’s lender to secure a firm commitment on a term loan and revolving line of credit are presented as a direct deduction from the carrying amount of the debt liability. For the term loan, fees paid by DXP are amortized over the life of the loan as additional interest. Fees paid to secure a firm commitment from our lender on a revolving line of credit are amortized on a straight-line basis over the entire term of the arrangement. The total unamortized debt issuance costs reported on the consolidated balance sheets as of December 31, 2015 and 2014 was $2.0 million and $2.7 million, respectively.
Income Taxes
The Company utilizes the asset and liability method of accounting for income taxes. Deferred income tax assets and liabilities are computed for differences between the financial statement and income tax bases of assets and liabilities. Such deferred income tax asset and liability computations are based on enacted tax laws and rates applicable to periods in which the differences are expected to reverse. Valuation allowances are established to reduce deferred income tax assets to the amounts expected to be realized under a more likely than not criterion.
Comprehensive Income
Comprehensive income includes net income, foreign currency translation adjustments, unrecognized gains (losses) on postretirement and other employment-related plans, changes in fair value of certain derivatives, and unrealized gains and losses on certain investments in debt and equity securities. The Company’s other comprehensive (loss) income is comprised of changes in the market value of an investment with quoted market prices in an active market for identical instruments and translation adjustments from translating foreign subsidiaries to the reporting currency.
Accounting for Uncertainty in Income Taxes
A position taken or expected to be taken in a tax return is recognized in the financial statements when it is more likely than not (i.e. a likelihood of more than fifty percent) that the position would be sustained upon examination by tax authorities. A recognized tax position is then measured at the largest amount of benefit that is greater than fifty percent likely of being realized upon ultimate settlement. The Company and its subsidiaries file income tax returns in the U.S. federal jurisdiction and various states. With few exceptions, the Company is no longer subject to U. S. federal, state and local tax examination by tax authorities for years prior to 2009. The Company's policy is to recognize interest related to unrecognized tax benefits as interest expense and penalties as operating expenses. The Company believes that it has appropriate support for the income tax positions taken and to be taken on its tax returns and that its accruals for tax liabilities are adequate for all open years based on an assessment of many factors including past experience and interpretations of tax law applied to the facts of each matter.
NOTE 3 - RECENT ACCOUNTING PRONOUNCEMENTS
In November 2015, the FASB issued ASU No. 2015-17,
Income Taxes (Topic 740), Balance Sheet Classification of Deferred Taxes.
The update requires entities to present deferred tax assets and liabilities as noncurrent in a classified balance sheet. The update simplifies the current guidance, which requires entities to separately present deferred tax assets and liabilities as current and noncurrent in a classified balance sheet. This pronouncement is effective for financial statements issued for annual periods beginning after December 15, 2016, and interim periods within. Early adoption is permitted. The Company is currently assessing the impact that this standard will have on its consolidated financial statements.
In April 2015, the FASB issued ASU No. 2015-03,
Interest – Imputation of Interest (Subtopic 835-30): Simplifying the Presentation of Debt Issuance Costs
, which requires entities to recognize debt issuance costs related to a recognized debt liability as a direct deduction from the carrying amount of that debt liability. This pronouncement is effective for fiscal years, and interim periods within those years, beginning after December 15, 2016, however, early adoption is permitted. DXP adopted this guidance for the first quarter of 2015 and adjusted the balance sheet for all periods presented.
In May 2014, the FASB issued ASU No. 2014-09,
Revenue from Contracts with Customers (Topic 606),
which provides guidance on revenue recognition. The core principal of this guidance is that an entity should recognize revenue to depict the transfer of promised goods or services to customers in an amount that reflects the consideration to which the entity expects to be entitled in exchange for those goods or services. This guidance requires entities to apply a five-step method to (1) identify the contract(s) with customers; (2) identify the performance obligation(s) in the contract; (3) determine the transaction price; (4) allocate the transaction price to the performance obligation(s) in the contract; and (5) recognize revenue when (or as) the entity satisfies a performance obligation. This pronouncement was originally effective for fiscal years, and interim periods within those years, beginning after December 15, 2016. In April 2015, the FASB approved a proposal to defer the effective date to fiscal years, and interim periods within those years, beginning after December 15, 2017. We are evaluating the impact that the adoption of this standard will have on our consolidated financial statements.
In July 2015, the FASB issued ASU No. 2015-11, Inventory ("ASU 2015-11"). The amendments in ASU 2015-11 clarify the subsequent measurement of inventory requiring an entity to subsequently measure inventory at the lower of cost and net realizable value. Net realizable value is the estimated selling price in the ordinary course of business, less reasonably predictable costs of completion, disposal, and transportation. This ASU applies only to inventory that is measured using the first-in, first-out (FIFO) or average cost method. Subsequent measurement is unchanged for inventory measured using last-in, first-out (LIFO) or the retail inventory method. The amendments in ASU 2015-11 should be applied prospectively and are effective for financial statements issued for fiscal years beginning after December 15, 2016, and interim periods within those fiscal years, with early adoption permitted. The company is currently assessing the impact that this standard will have on its consolidated financial statements.
NOTE 4 - FAIR VALUE OF FINANCIAL ASSETS AND LIABILITIES
Authoritative guidance for financial assets and liabilities measured on a recurring basis applies to all financial assets and financial liabilities that are being measured and reported on a fair value basis. Fair value, as defined in the authoritative guidance, is the price that would be received to sell an asset or paid to transfer a liability in an orderly transaction between market participants at the measurement date. The authoritative guidance affects the fair value measurement of an investment with quoted market prices in an active market for identical instruments, which must be classified in one of the following categories:
Level 1 Inputs
Level 1 inputs come from quoted prices (unadjusted) in active markets for identical assets or liabilities.
Level 2 Inputs
Level 2 inputs are other than quoted prices that are observable for an asset or liability. These inputs include: quoted prices for similar assets or liabilities in active markets; quoted prices for identical or similar assets or liabilities in markets that are not active; inputs other than quoted prices that are observable for the asset or liability; and inputs that are derived principally from or corroborated by observable market data by correlation or other means. At December 31, 2014, DXP did not utilize level 2 inputs for any assets or liabilities.
Level 3 Inputs
Level 3 inputs are unobservable inputs for the asset or liability which require the Company’s own assumptions.
Financial assets and liabilities are classified based on the lowest level of input that is significant to the fair value measurement. Our assessment of the significance of a particular input to the fair value measurement requires judgment and may affect the valuation of the fair value of assets and liabilities and their placement within the fair value hierarchy levels.
The following table presents the changes in Level 1 assets for the period indicated (
in thousands
):
|
Years Ended December 31,
|
||||||||
|
2015
|
2014
|
|||||||
|
Fair value at beginning of period
|
$
|
$
|
1,837
|
|||||
|
Investment during period
|
-
|
-
|
||||||
|
Realized and unrealized gains (losses) included in other comprehensive income
|
(149
|
)
|
||||||
|
Proceeds on sale of investment
|
(1,688
|
)
|
||||||
|
Fair value at end of period
|
$
|
-
|
$
|
-
|
||||
The Company paid a total of $1.7 million for an investment with quoted market prices in an active market. During the year ended December 31, 2014, the Company sold this investment for $1.7 million. The Company recognized a $0.1 million loss in 2014 on the sale of this investment, which is included in other income within our condensed consolidated statements of income.
During the third and fourth quarters of 2015, in connection with interim tests for impairment, DXP recorded impairment charges of $57.8 million and $9.8 million, respectively, in order to reflect the implied fair values of goodwill, which is a non-recurring fair value adjustment. The fair values of goodwill used in the impairment calculations were estimated based on discounted estimated future cash flows with the discount rates of 10.0% to 11.5%. The measurements utilized to determine the implied fair value of goodwill represent significant unobservable inputs (Level 3) in accordance with the fair value hierarchy.
During the fourth quarter of 2014, in connection with the annual test for impairment, DXP recorded total impairment charges of $117.6 million in order to reflect the implied fair values of goodwill, which is a non-recurring fair value adjustment. The fair values of goodwill used in the impairment calculations were estimated based on discounted estimated future cash flows with the discount rates of 10.0% to 13.5%. The measurements utilized to determine the implied fair value of goodwill represent significant unobservable inputs (Level 3) in accordance with the fair value hierarchy.
NOTE 5 - INVENTORY
The carrying values of inventories are as follows (
in thousands
):
|
December 31,
2015
|
December 31,
2014
|
|||||||
|
Finished goods
|
$
|
94,524
|
$
|
99,732
|
||||
|
Work in process
|
9,295
|
15,926
|
||||||
|
Inventories
|
$
|
103,819
|
$
|
115,658
|
||||
NOTE 6 – COSTS AND ESTIMATED EARNINGS ON UNCOMPLETED CONTRACTS
Costs and estimated earnings in excess of billings on uncompleted contracts arise in the consolidated balance sheets when revenues have been recognized but the amounts cannot be billed under the terms of the contracts. Such amounts are recoverable from customers upon various measures of performance, including achievement of certain milestones, completion of specified units, or completion of a contract.
Costs and estimated earnings on uncompleted contracts and related amounts billed for 2015 and 2014 were as follows (in thousands):
|
Year Ended December 31,
|
||||||||
|
2015
|
2014
|
|||||||
|
Costs incurred on uncompleted contracts
|
$
|
34,400
|
$
|
49,133
|
||||
|
Estimated earnings, thereon
|
13,119
|
16,749
|
||||||
|
Total
|
47,519
|
65,882
|
||||||
|
Less: billings to date
|
33,422
|
54,701
|
||||||
|
Net
|
$
|
14,097
|
$
|
11,181
|
||||
Such amounts were included in the accompanying Consolidated Balance Sheets for 2015 and 2014 under the following captions (in thousands):
|
Year Ended December 31,
|
||||||||
|
2015
|
2014
|
|||||||
|
Costs and estimated earnings in excess of billings on uncompleted contracts
|
$
|
22,045
|
$
|
20,083
|
||||
|
Billings in excess of costs and estimated earnings on uncompleted contracts
|
(8,021
|
)
|
(8,840
|
)
|
||||
|
Translation Adjustment
|
73
|
(62
|
)
|
|||||
|
Net
|
$
|
14,097
|
$
|
11,181
|
||||
NOTE 7 - PROPERTY AND EQUIPMENT
The carrying values of property and equipment are as follows (
in thousands
):
|
December 31,
2015
|
December 31,
2014
|
|||||||
|
Land
|
$
|
2,386
|
$
|
2,386
|
||||
|
Buildings and leasehold improvements
|
16,631
|
13,490
|
||||||
|
Furniture, fixtures and equipment
|
102,494
|
97,829
|
||||||
|
Less – Accumulated depreciation
|
(53,008
|
)
|
(43,726
|
)
|
||||
|
Total Property and Equipment
|
$
|
68,503
|
$
|
69,979
|
||||
Depreciation expense was $12.6 million, $12.6 million, and $9.8 million for the years ended December 31, 2014, 2013, and 2012, respectively. Capital expenditures by segment are included in Note 17.
NOTE 8 - GOODWILL AND OTHER INTANGIBLE ASSETS
The following table presents the changes in the carrying amount of goodwill and other intangible assets during the year ended December 31, 2015 (
in thousands
):
|
Goodwill
|
Other
Intangible
Assets
|
Total
|
||||||||||
|
Balance as of December 31, 2014
|
$
|
253,312
|
$
|
130,333
|
$
|
383,645
|
||||||
|
Acquired during the period
|
11,713
|
7,263
|
18,976
|
|||||||||
|
Impairment
|
(67,663
|
)
|
(1,072
|
)
|
(68,735
|
)
|
||||||
|
Translation adjustment
|
-
|
(3,606
|
)
|
(3,606
|
)
|
|||||||
|
Amortization
|
-
|
(20,621
|
)
|
(20,621
|
)
|
|||||||
|
Balance as of December 31, 2015
|
$
|
197,362
|
$
|
112,297
|
$
|
309,659
|
||||||
The following table presents the changes in the carrying amount of goodwill and other intangible assets during the year ended December 31, 2014 (
in thousands
):
|
Goodwill
|
Other
Intangible
Assets
|
Total
|
||||||||||
|
Balance as of December 31, 2013
|
$
|
188,110
|
$
|
69,722
|
$
|
257,832
|
||||||
|
Acquired during the period
|
182,771
|
85,264
|
268,035
|
|||||||||
|
Impairment
|
(117,569
|
)
|
-
|
(117,569
|
)
|
|||||||
|
Translation adjustment
|
-
|
(2,173
|
)
|
(2,173
|
)
|
|||||||
|
Amortization
|
-
|
(22,480
|
)
|
(22,480
|
)
|
|||||||
|
Balance as of December 31, 2014
|
$
|
253,312
|
$
|
130,333
|
$
|
383,645
|
||||||
The following table presents goodwill balance by reportable segment as of December 31, 2015 and 2014
(in thousands)
:
|
As of December 31,
|
||||||||
|
2015
|
2014
|
|||||||
|
Service Centers
|
$
|
164,244
|
$
|
167,302
|
||||
|
Innovative Pumping Solutions
|
15,980
|
68,872
|
||||||
|
Supply Chain Services
|
17,138
|
17,138
|
||||||
|
Total
|
$
|
197,362
|
$
|
253,312
|
||||
During the third quarter of 2015, the price of DXP’s common stock and the price of crude oil declined over 40% and over 20%, respectively. This decline in oil prices reduced spending by our customers and reduced our revenue expectations. This sustained decline in crude oil prices, reduced capital spending by customers and reduced revenue expectations were determined to be a triggering event during the third quarter of 2015. This triggering event required us to perform testing for possible goodwill impairment in two of our reporting units, and our step one testing indicated there was an impairment in the B27 IPS and B27 SC reporting units. No triggering event was identified in our other reporting units during the third quarter. ASC 350 step two of the goodwill impairment testing for the reporting units was performed preliminarily during the third quarter of 2015. Our preliminary analysis concluded that $48.0 million of our B27 IPS reporting unit’s goodwill and $9.8 million of our B27 SC reporting unit’s goodwill was impaired. The remaining goodwill for the B27 IPS and B27 SC reporting units at September 30, 2015 was $4.9 million and $10.3 million, respectively. The September 30, 2015 ASC 350 step two testing was completed in the fourth quarter of 2015 without any adjustment to the amount recorded in the third quarter of 2015. Fair value was based on expected future cash flow using Level 3 inputs under Account Standards Codification 820
Fair Value Measurements
(“ASC 820”). The cash flows are those expected to be generated by market participants, discounted at a rate of return market participants would expect. Approximately 60% of the goodwill associated with the B27 acquisition is not deductible for tax purposes. Accordingly, the financial statement tax benefit is calculated for only 40% of the goodwill impairment. The pretax impairment impacted DXP’s effective tax rate for 2015. For the year ended December 31, 2014, accumulated impairment for the B27 IPS and B27 SC reporting units was $95.1 million and $10.2 million, respectively. After recording the third quarter impairment loss, accumulated impairment expenses for the B27 IPS and B27 SC reporting units were $143.1 million and $20.0 million, respectively, at September 30, 2015.
DXP recorded $1.1 million of impairment expense in the third quarter of 2015 to write off an acquired intangible asset related to an ITT Goulds distribution agreement, which was terminated by ITT Goulds during 2015. The remaining intangible asset value of vendor distribution agreements for the year ended December 31, 2015 was zero. None of the impairment is expected to be deductible for tax purposes.
During the fourth quarter of 2015, the price of DXP’s common stock and the price of crude oil declined over 16% and over 18%, respectively. This decline in oil prices reduced spending by our customers during the fourth quarter and resulted in fourth quarter actual earnings for the B27 IPS and B27 SC reporting units declining significantly from the forecasts used in the impairment analysis at the end of the third quarter of 2015. The declines in forecasted earnings for these two reporting units were determined to be a triggering event during the fourth quarter of 2015. This triggering event required us to perform testing for possible goodwill impairment in these two reporting units, and our step one testing indicated there may be an impairment in the B27 IPS and B27 SC reporting units. No triggering event was identified in our other reporting units during the fourth quarter. ASC 350 step two of the goodwill impairment testing for the reporting units was performed during the fourth quarter of 2015. Our analysis concluded that $4.9 million of our B27 IPS reporting unit’s goodwill and $5.0 million of our B27 SC reporting unit’s goodwill was impaired. Fair value was based on expected future cash flow using Level 3 inputs under ASC 820. The cash flows are those expected to be generated by market participants, discounted at a rate of return market participants would expect. The remaining goodwill for the B27 IPS and B27 SC reporting units at December 31, 2015 was zero and $5.3 million, respectively. Approximately 60% of the goodwill associated with the B27 acquisition is not deductible for tax purposes. Accordingly, the financial statement tax benefit is calculated for only 40% of the goodwill impairment. The pretax impairment impacted DXP’s effective tax rate for 2015. After recording the fourth quarter impairment loss, accumulated impairment for the B27 IPS and B27 SC reporting units were $148.0 million and $25.0 million, respectively, for the year ended December 31, 2015. As none of the Company’s other reporting units recorded impairment losses in 2015, accumulated impairment for these units remained at $12.3 million.
During the fourth quarter of 2014, DXP performed its annual goodwill impairment test at its B27 IPS reporting unit and recognized impairment expense of $95.1 million. In performing the goodwill impairment test, Step 1 of the test failed as the fair value of the reporting unit no longer exceeded its carrying amount primarily due to actual revenues being lower than revenues forecasted as of the date of acquisition and the decline in oil prices during the third quarter of 2014. Fair value was based on expected future cash flow using Level 3 inputs under ASC 820. The cash flows are those expected to be generated by market participants, discounted at a rate of return market participants would expect. In Step 2, goodwill with a carrying amount of $148.0 million was determined to have an implied fair value of $52.9 million after the hypothetical purchase price allocation under US GAAP guidance for business combinations. Approximately 60% of the goodwill associated with the B27 acquisition is not deductible for tax purposes. Accordingly, the financial statement tax benefit is calculated for only 40% of the goodwill impairment. The pretax impairment impacted DXP’s effective tax rate for 2014. B27 IPS is reported in the IPS reportable segment. The Company has not previously recorded an impairment loss for the reporting unit. For the year ended December 31, 2014, accumulated impairment for the B27 IPS reporting unit was $95.1 million.
During the fourth quarter of 2014, DXP performed its annual goodwill impairment test at its NatPro IPS reporting unit and recognized impairment expense of $12.3 million consisting of goodwill. Fair value was based on expected future cash flows using Level 3 inputs under ASC 820. The cash flows are those expected to be generated by the market participants, discounted at a rate of return market participants would expect. Goodwill was determined to have an implied fair value of zero after the hypothetical purchase price allocation under US GAAP guidance for business combinations. None of the goodwill associated with the NatPro acquisition is deductible for tax purposes. The pretax goodwill impairment impacted DXP's effective tax rate for 2014. NatPro IPS is reported in the IPS reportable segment. The Company has not previously recorded an impairment loss for the reporting unit. For the year ended December 31, 2014, accumulated impairment for the NatPro IPS reporting unit was $12.3 million.
During the fourth quarter of 2014, DXP performed its annual goodwill impairment test at its B27 SC reporting unit and recognized a goodwill impairment expense of $10.2 million. In performing the goodwill impairment test, Step 1 of the test failed as the fair value of the reporting unit no longer exceeded its carrying amount primarily due to actual revenues being lower than revenues forecasted as of the date of acquisition and the decline in oil prices during the third quarter of 2014. Fair value was based on expected future cash flow using Level 3 inputs under ASC 820. The cash flows are those expected to be generated by market participants, discounted at a rate of return market participants would expect. In Step 2, goodwill was determined to have an implied fair value of $20.1 million after the hypothetical purchase price allocation under USGAAP guidance for business combinations. Approximately 60% of the goodwill associated with the B27 acquisition is not deductible for tax purposes. Accordingly, the financial statement tax benefit is calculated for only 40% of the impairment. The pretax impairment impacted DXP’s effective tax rate for 2014. B27 Service Centers is reported in the Service Centers reportable segment. The Company has not previously recorded an impairment loss for the reporting unit. For the year ended December 31, 2014, accumulated impairment for the B27 Service Centers reporting unit was $10.2 million.
The impairment losses during the years ended December 31, 2015 and 2014 are included in the “impairment expense” line item on the consolidated statements of income (loss).
The following table presents a summary of amortizable other intangible assets (
in thousands
):
|
As of December 31, 2015
|
As of December 31, 2014
|
|||||||||||||||||||||||
|
Gross
Carrying
Amount
|
Accumulated
Amortization
|
Carrying
Amount,
net
|
Gross
Carrying
Amount
|
Accumulated
Amortization
|
Carrying
Amount,
net
|
|||||||||||||||||||
|
Vendor agreements
|
$
|
2,496
|
$
|
(2,496
|
)
|
$
|
-
|
$
|
2,496
|
$
|
(1,330
|
)
|
$
|
1,166
|
||||||||||
|
Customer relationships
|
195,580
|
(83,741
|
)
|
111,839
|
192,512
|
(63,957
|
)
|
128,555
|
||||||||||||||||
|
Non-compete agreements
|
1,815
|
(1,357
|
)
|
458
|
1,737
|
(1,125
|
)
|
612
|
||||||||||||||||
|
Total
|
$
|
199,891
|
$
|
(87,594
|
)
|
$
|
112,297
|
$
|
196,745
|
$
|
(66,412
|
)
|
$
|
130,333
|
||||||||||
Customer relationships are amortized over their estimated useful lives. Amortization expense is recognized according to estimated economic benefits and was $20.6 million, $22.5 million, and $11.8 million for the years ended December 31, 2015, 2014, and 2013, respectively. The estimated future annual amortization of intangible assets for each of the next five years and thereafter are as follows
(in thousands)
:
|
2016
|
$
|
18,161
|
||
|
2017
|
17,304
|
|||
|
2018
|
15,657
|
|||
|
2019
|
14,212
|
|||
|
2020
|
10,778
|
|||
|
Thereafter
|
36,185
|
The weighted average remaining estimated life for customer relationships and non-compete agreements are 9.9 years and 2.9 years, respectively.
NOTE 9 – LONG-TERM DEBT
Long-term debt consisted of the following (
in thousands
):
|
December 31,
|
||||||||
|
2015
|
2014
|
|||||||
|
Line of credit
|
$
|
172,147
|
$
|
193,443
|
||||
|
Term loan
|
175,000
|
212,500
|
||||||
|
Promissory note payable in monthly installments at 2.9% through January 2021, collateralized by equipment
|
4,408
|
5,216
|
||||||
|
Unsecured subordinated notes payable in quarterly installments at 5%
|
-
|
357
|
||||||
|
Less unamortized debt issuance costs
|
(2,046
|
)
|
(2,714
|
)
|
||||
|
Total Debt
|
349,509
|
408,802
|
||||||
|
Less: Current maturities
|
(50,829
|
)
|
(38,608
|
)
|
||||
|
Total Long-term Debt
|
$
|
298,680
|
$
|
370,194
|
||||
On July 11, 2012, DXP entered into a credit facility with Wells Fargo Bank National Association, as Issuing Lender, Swingline Lender and Administrative Agent for the lenders (as amended, the “Original Facility”). On January 2, 2014, the Company entered into an Amended and Restated Credit Agreement with Wells Fargo Bank, National Association, as Issuing Lender and Administrative Agent for other lenders (as thereafter amended or restated, the “Facility”), amending and restating the Original Facility. On August 6, 2015 and September 30, 2015, DXP amended the Facility.
The Facility provides a term loan and a $350 million revolving line of credit to the Company. At December 31, 2015, the term loan component of the Facility was $175.0 million. The Facility expires on January 2, 2019.
The Facility provides the option of interest at LIBOR (or CDOR for Canadian dollar loans) plus an applicable margin ranging from 1.25% to 2.75% or prime plus an applicable margin from 0.25% to 1.75% where the applicable margin is determined by the Company’s leverage ratio as defined by the Facility as of the last day of the fiscal quarter most recently ended prior to the date of borrowing. Commitment fees of 0.20% to 0.50% per annum are payable on the portion of the Facility capacity not in use at any given time on the line of credit. Commitment fees are included as interest in the consolidated statements of income.
On December 31, 2015, the LIBOR based rate of the Facility was LIBOR plus 2.25% the prime based rate of the Facility was prime plus 1.25%, and the commitment fee was 0.40%. At December 31, 2015, $347.1 million was borrowed under the Facility at a weighted average interest rate of approximately 2.67% under the LIBOR options. At December 31, 2015, the Company had $19.8 million available for borrowing under the Facility.
The Facility contains financial covenants defining various financial measures and levels of these measures with which the Company must comply. Covenant compliance is assessed as of each quarter end. Substantially all of the Company’s assets are pledged as collateral to secure the Facility.
At December 31, 2015, the Facility’s principal financial covenants included:
Consolidated Leverage Ratio – The Facility requires that the Company’s Consolidated Leverage Ratio, determined at the end of each fiscal quarter, not exceed 4.25 to 1.00 as of the last day of each quarter through September 30, 2016, not to exceed 4.00 to 1.00 on December 31, 2016, not to exceed 3.75 to 1.00 from March 31, 2017 through June 30, 2017, not to exceed 3.50 to 1.00 from September 30, 2017 through December 31, 2017, and not to exceed 3.25 to 1.00 on March 31, 2018 and thereafter. The Consolidated Leverage Ratio is defined as the outstanding indebtedness divided by Consolidated EBITDA for the period of four consecutive fiscal quarters ending on or immediately prior to such date. Indebtedness is defined under the Facility for financial covenant purposes as: (a) all obligations of DXP for borrowed money including but not limited to obligations evidenced by bonds, debentures, notes or other similar instruments; (b) obligations to pay deferred purchase price of property or services; (c) capital lease obligations; (d) obligations under conditional sale or other title retention agreements relating to property purchased; and (e) contingent obligations for funded indebtedness. At December 31, 2015, the Company’s Leverage Ratio was 4.02 to 1.00.
Consolidated Fixed Charge Coverage Ratio – The Facility requires that the Consolidated Fixed Charge Coverage Ratio on the last day of each quarter be not less than 1.15 to 1.00 through December 31, 2016 and not less than 1.25 to 1.00 on March 31, 2017 and thereafter, with “Consolidated Fixed Charge Coverage Ratio” defined as the ratio of (a) Consolidated EBITDA for the period of 4 consecutive fiscal quarters ending on such date minus capital expenditures during such period (excluding acquisitions) minus income tax expense paid minus the aggregate amount of restricted payments defined in the agreement to (b) the interest expense paid in cash, scheduled principal payments in respect of long-term debt and the current portion of capital lease obligations for such 12-month period, determined in each case on a consolidated basis for DXP and its subsidiaries. At December 31, 2015, the Company's Consolidated Fixed Charge Coverage Ratio was 1.23 to 1.00.
Asset Coverage Ratio –The Facility requires that the Asset Coverage Ratio at any time be not less than 1.0 to 1.0 with “Asset Coverage Ratio” defined as the ratio of (a) the sum of 85% of net accounts receivable plus 65% of net inventory to (b) the aggregate outstanding amount of the revolving credit on such date. At December 31, 2015, the Company's Asset Coverage Ratio was 1.15 to 1.00.
Consolidated EBITDA as defined under the Facility for financial covenant purposes means, without duplication, for any period the consolidated net income of DXP plus, to the extent deducted in calculating consolidated net income, depreciation, amortization (except to the extent that such non-cash charges are reserved for cash charges to be taken in the future), non-cash compensation including stock option or restricted stock expense, interest expense and income tax expense for taxes based on income, certain one-time costs associated with our acquisitions, integration costs, facility consolidation and closing costs, write-down of cash expenses incurred in connection with the existing credit agreement and extraordinary losses less interest income and extraordinary gains. Consolidated EBITDA shall be adjusted to give pro forma effect to disposals or business acquisitions assuming that such transaction(s) had occurred on the first day of the period excluding all income statement items attributable to the assets or equity interests that is subject to such disposition made during the period and including all income statement items attributable to property or equity interests of such acquisitions permitted under the Facility.
The following table sets forth the computation of the Leverage Ratio as of December 31, 2015 (
in thousands, except for ratios
):
|
For the Twelve Months ended
December 31, 2015
|
Leverage
Ratio
|
|||
|
Loss before taxes
|
$
|
(38,920
|
)
|
|
|
Loss attributable to noncontrolling interest
|
813
|
|||
|
Interest expense
|
10,932
|
|||
|
Depreciation and amortization
|
33,243
|
|||
|
Impairment expense
|
68,735
|
|||
|
Stock compensation expense
|
2,973
|
|||
|
Pro forma acquisition EBITDA
|
2,244
|
|||
|
B27 settlment
|
7,348
|
|||
|
(A)
Defined EBITDA
|
$
|
87,368
|
||
|
As of December 31, 2015
|
||||
|
Total long-term debt, including current maturities
|
$
|
349,509
|
||
|
Unamortized debt issuance costs
|
2,046
|
|||
|
(B)
Defined indebtedness
|
$
|
351,555
|
||
|
Leverage Ratio (B)/(A)
|
4.02
|
|||
The following table sets forth the computation of the Fixed Charge Coverage Ratio as of December 31, 2015 (
in thousands, except for ratios
):
|
For the Twelve Months ended
December 31, 2015
|
||||
|
Defined EBITDA
|
$
|
87,368
|
||
|
Cash paid for income taxes
|
13,792
|
|||
|
Capital expenditures
|
13,992
|
|||
|
(A)
Defined EBITDA minus capital expenditures & cash income taxes
|
$
|
59,584
|
||
|
Cash interest payments
|
$
|
9,721
|
||
|
Dividends
|
90
|
|||
|
Scheduled principal payments
|
38,666
|
|||
|
(B)
Fixed Charges
|
$
|
48,477
|
||
|
Fixed Charge Coverage Ratio (A)/(B)
|
1.23
|
|||
The following table sets forth the computation of the Asset Coverage Ratio as of December 31, 2015 (
in thousands, except for ratios
):
|
Credit facility outstanding balance
|
$
|
172,147
|
||
|
Outstanding letters of credit
|
6,305
|
|||
|
Defined indebtedness
|
$
|
178,452
|
||
|
Accounts receivable (net), valued at 85% of gross
|
$
|
138,486
|
||
|
Inventory, valued at 65% of gross
|
67,482
|
|||
|
$
|
205,968
|
|||
|
Asset Coverage Ratio
|
1.15
|
As of December 31, 2015, the maturities of long-term debt for the next five years and thereafter were as follows (
in thousands
):
|
2016
|
$
|
50,829
|
||
|
2017
|
63,356
|
|||
|
2018
|
63,381
|
|||
|
2019
|
173,055
|
|||
|
2020
|
934
|
|||
|
Thereafter
|
-
|
NOTE 10 - INCOME TAXES
The components of income before income taxes are as follows (
in thousands
):
|
Years Ended December 31,
|
||||||||||||
|
2015
|
2014
|
2013
|
||||||||||
|
Domestic
|
$
|
(42,179
|
)
|
$
|
(21,349
|
)
|
$
|
86,567
|
||||
|
Foreign
|
3,259
|
(4,207
|
)
|
8,150
|
||||||||
|
Total income before taxes
|
$
|
(38,920
|
)
|
$
|
(25,556
|
)
|
$
|
94,717
|
||||
The provision for income taxes consists of the following (
in thousands
):
|
Years Ended December 31,
|
||||||||||||
|
2015
|
2014
|
2013
|
||||||||||
|
Current -
|
||||||||||||
|
Federal
|
$
|
5,182
|
$
|
24,050
|
$
|
21,481
|
||||||
|
State
|
1,499
|
5,604
|
2,681
|
|||||||||
|
Foreign
|
2,493
|
2,150
|
7,484
|
|||||||||
|
9,174
|
31,804
|
31,646
|
||||||||||
|
Deferred -
|
||||||||||||
|
Federal
|
(7,090
|
)
|
(10,544
|
)
|
8,631
|
|||||||
|
State
|
- |
|
(1,769
|
)
|
167
|
|||||||
|
Foreign
|
(1,934
|
)
|
191
|
(5,964
|
)
|
|||||||
|
(9,024
|
)
|
(12,122
|
)
|
2,834
|
||||||||
|
$
|
150
|
$
|
19,682
|
$
|
34,480
|
|||||||
The difference between income taxes computed at the federal statutory income tax rate (35%) and the provision for income taxes is as follows (
in thousands
):
|
Years Ended December 31,
|
||||||||||||
|
2015
|
2014
|
2013
|
||||||||||
|
Income taxes computed at federal statutory rate
|
$
|
(13,622
|
)
|
$
|
(8,945
|
)
|
$
|
33,150
|
||||
|
State income taxes, net of federal benefit
|
974
|
2,492
|
1,852
|
|||||||||
|
Non-tax deductible impairment expense computed at federal statutory rate
|
15,765
|
24,444
|
-
|
|||||||||
|
Foreign adjustment
|
689
|
1,353
|
-
|
|||||||||
|
Meals and entertainment
|
620
|
801
|
561
|
|||||||||
|
Domestic Production Activity Deduction
|
(1,143
|
)
|
(1,040
|
)
|
(566
|
)
|
||||||
|
Research and development tax credit
|
(1,730
|
)
|
(587
|
)
|
-
|
|||||||
|
Foreign tax credit
|
(921
|
)
|
(343
|
)
|
-
|
|||||||
|
Other, primarily non-tax deductible, or non-taxable items
|
(482
|
)
|
1,507
|
(517
|
)
|
|||||||
|
$
|
150
|
$
|
19,682
|
$
|
34,480
|
|||||||
The net current and noncurrent components of deferred income tax balances are as follows (
in thousands
):
|
December 31,
|
||||||||
|
2015
|
2014
|
|||||||
|
Net current assets
|
$
|
8,996
|
$
|
8,250
|
||||
|
Net non-current liabilities
|
(6,312
|
)
|
(21,284
|
)
|
||||
|
Net assets (liabilities)
|
$
|
2,684
|
$
|
(13,034
|
)
|
|||
Deferred tax liabilities and assets were comprised of the following (
in thousands
):
|
December 31,
|
||||||||
|
2015
|
2014
|
|||||||
|
Deferred tax assets:
|
||||||||
|
Goodwill
|
$
|
23,334
|
$
|
17,906
|
||||
|
Allowance for doubtful accounts
|
2,692
|
2,979
|
||||||
|
Inventories
|
3,312
|
2,691
|
||||||
|
Accruals
|
2,354
|
2,125
|
||||||
|
Other
|
730
|
990
|
||||||
|
Total deferred tax assets
|
32,422
|
26,691
|
||||||
|
Deferred tax liabilities
|
||||||||
|
Intangibles
|
(27,512
|
)
|
(33,874
|
)
|
||||
|
Property and equipment
|
(10,824
|
)
|
(10,343
|
)
|
||||
|
Unremitted foreign earnings
|
(259
|
)
|
(52
|
)
|
||||
|
Cumulative translation adjustment
|
8,605
|
4,014
|
||||||
|
Other
|
252
|
|
530
|
|||||
|
Net deferred tax asset (liability)
|
$
|
2,684
|
$
|
(13,034
|
)
|
|||
NOTE 11 - SHARE-BASED COMPENSATION
Restricted Stock
Under the restricted stock plan approved by our shareholders (the “Restricted Stock Plan”), directors, consultants and employees may be awarded shares of DXP’s common stock. The shares of restricted stock granted to employees and that are outstanding as of December 31, 2015 vest in accordance with one of the following vesting schedules: 100% one year after date of grant; 33.3% each year for three years after date of grant; 20% each year for five years after date of grant; or 10% each year for ten years after date of grant. The Restricted Stock Plan provides that on each July 1 during the term of the plan each non-employee director of DXP will be granted the number of whole shares calculated by dividing $75,000 by the closing price of the common stock on such July 1. The shares of restricted stock granted to non-employee directors of DXP vest one year after the grant date. The fair value of restricted stock awards is measured based upon the closing prices of DXP’s common stock on the grant dates and is recognized as compensation expense over the vesting period of the awards. Once restricted stock vests, new shares of the Company’s stock are issued.
The following table provides certain information regarding the shares authorized and outstanding under the Restricted Stock Plan at December 31, 2015:
|
Number of shares authorized for grants
|
800,000
|
|||
|
Number of shares granted
|
(862,349
|
)
|
||
|
Number of shares forfeited
|
143,876
|
|||
|
Number of shares available for future grants
|
81,527
|
|||
|
Weighted-average grant price of granted shares
|
$
|
28.21
|
Changes in restricted stock for the twelve months ended December 31, 2015 were as follows:
|
Number of
Shares
|
Weighted Average
Grant Price
|
|||||||
|
Non-vested at December 31, 2014
|
179,942
|
$
|
52.71
|
|||||
|
Granted
|
24,971
|
$
|
40.95
|
|||||
|
Forfeited
|
(20,855
|
)
|
$
|
41.34
|
||||
|
Vested
|
(57,401
|
)
|
$
|
44.99
|
||||
|
Non-vested at December 31, 2015
|
126,657
|
$
|
55.54
|
|||||
Compensation expense, associated with restricted stock, recognized in the years ended December 31, 2015, 2014 and 2013 was $3.0 million, $3.6 million, and $2.8 million, respectively. Related income tax benefits recognized in earnings in the years ended December 31, 2015, 2014 and 2013 were approximately $1.2 million, $1.4 million and $1.1 million, respectively. Unrecognized compensation expense under the Restricted Stock Plan at December 31, 2015 and December 31, 2014 was $4.9 million and $6.9 million, respectively. As of December 31, 2015, the weighted average period over which the unrecognized compensation expense is expected to be recognized is 22.9 months.
NOTE 12 - EARNINGS PER SHARE DATA
Basic earnings per share is computed based on weighted average shares outstanding and excludes dilutive securities. Diluted earnings per share is computed including the impacts of all potentially dilutive securities. In 2015, we excluded the potential dilution of convertible preferred stock, which could be converted into 840,000 shares because they would be anti-dilutive.
The following table sets forth the computation of basic and diluted earnings per share for the periods indicated (
in thousands, except per share data
):
|
December 31,
|
||||||||||||
|
2015
|
2014
|
2013
|
||||||||||
|
Basic:
|
||||||||||||
|
Weighted average shares outstanding
|
14,423
|
14,639
|
14,439
|
|||||||||
|
Net income (loss) attributable to DXP Enterprises, Inc.
|
$
|
(38,536
|
)
|
$
|
(45,238
|
)
|
$
|
60,237
|
||||
|
Convertible preferred stock dividend
|
(90
|
)
|
(90
|
)
|
(90
|
)
|
||||||
|
Net income (loss) attributable to common shareholders
|
$
|
(38,626
|
)
|
$
|
(45,328
|
)
|
$
|
60,147
|
||||
|
Per share amount
|
$
|
(2.68
|
)
|
$
|
(3.10
|
)
|
$
|
4.17
|
||||
|
Diluted:
|
||||||||||||
|
Weighted average shares outstanding
|
14,423
|
14,639
|
14,439
|
|||||||||
|
Assumed conversion of convertible preferred stock
|
-
|
-
|
840
|
|||||||||
|
Total dilutive shares
|
14,423
|
14,639
|
15,279
|
|||||||||
|
Net income (loss) attributable to common shareholders
|
$
|
(38,626
|
)
|
$
|
(45,328
|
)
|
$
|
60,147
|
||||
|
Convertible preferred stock dividend
|
-
|
-
|
90
|
|||||||||
|
Net income (loss) attributable to DXP Enterprises, Inc. for diluted earnings per share
|
$
|
(38,626
|
)
|
$
|
(45,328
|
)
|
$
|
60,237
|
||||
|
Per share amount
|
$
|
(2.68
|
)
|
$
|
(3.10
|
)
|
$
|
3.94
|
||||
Basic earnings per share have been computed by dividing net earnings by the weighted average number of common shares outstanding during the period and excludes dilutive securities. Diluted earnings per share reflects the potential dilution that could occur if the preferred stock was converted into common stock. Restricted stock is considered a participating security and is included in the computation of basic earnings per share as if vested. Because holders of Preferred Stock do not participate in losses, the loss was not allocated to Preferred Stock for fiscal year 2015. The Preferred Stock is convertible into 840,000 shares of common stock.
NOTE 13 - BUSINESS ACQUISITIONS
All of the Company’s acquisitions have been accounted for using the purchase method of accounting. Revenues and expenses of the acquired businesses have been included in the accompanying consolidated financial statements beginning on their respective dates of acquisition. The allocation of purchase price to the acquired assets and liabilities is based on estimates of fair market value and may be revised if and when additional information the Company is awaiting concerning certain asset and liability valuations is obtained, provided that such information is received no later than one year after the date of acquisition. Goodwill is calculated as the excess of the consideration transferred over the net assets recognized and represents the future economic benefits arising from other assets acquired that could not be individually identified and separately recognized. It specifically includes the expected synergies and other benefits that we believe will result from combining the operations of our acquisitions with the operations of DXP and any intangible assets that do not qualify for separate recognition such as the assembled workforce.
On January 2, 2014, the Company completed the acquisition of all of the equity securities and units of
B27, LLC (“B27”) by way of a Securities Purchase Agreement to expand DXP’s pump packaging offering
. The total transaction value was approximately $304.9 million, including working capital payments and excluding approximately $1.0 million in transaction costs recognized within SG&A in the 2013 statement of income. The purchase price was financed with borrowings under the Facility and approximately $4.0 million (36,000 shares) of DXP common stock. Estimated goodwill of $178.3 million and intangible assets of $81.1 million were recognized for this acquisition. Approximately $154.6 million of the estimated goodwill or intangible assets are expected not to be tax deductible. The estimated goodwill associated with this acquisition is included in the IPS and Service Centers segments. See Note 8 of the Notes to Consolidated Financial Statements regarding the 2015 and 2014 impairments of B27 goodwill. After the acquisition of B27, there was a working capital dispute between the Company and the sellers. During the third quarter of 2015, an accounting expert issued his report on the working capital dispute between DXP and the sellers of B27. The report required DXP to pay the sellers of B27 an additional $11.3 million. Because the time period to allow adjustments of purchase accounting had expired, $7.3 million of the payment was expensed. The remaining $4.0 million of the required payment represents tax refunds, and the $3.6 million federal portion of the refunds has been received.
On May 1, 2014, the Company completed the acquisition of all of the equity interests of Machinery Tooling and Supply, LLC (“MT&S”) to expand DXP’s cutting tools offering in the North Central region of the United States. DXP paid approximately $14.6 million for MT&S, which was borrowed under the Facility. DXP has not completed appraisals of intangibles for MT&S, the valuation of working capital items or completed analysis of tax effects, and therefore, has made preliminary estimates for purposes of this disclosure. Estimated goodwill of $4.3 million and intangible assets of $4.1 million were recognized for this acquisition. All of the estimated goodwill is included in the Service Centers segment.
On April 1, 2015, the Company completed the acquisition of all of the equity interests of Tool Supply, Inc. (“TSI”) to expand DXP’s cutting tools offering in the Northwest region of the United States. DXP paid approximately $5.0 million for TSI, which was borrowed under the Facility. Estimated goodwill of $2.9 million and intangible assets of $2.0 were recognized for this acquisition. All of the estimated goodwill is included in the Service Centers segment. None of the estimated goodwill or intangible assets are expected to be tax deductible.
On September 1, 2015, the Company completed the acquisition of all of the equity interests of Cortech Engineering, LLC (“Cortech”) to expand DXP’s rotating equipment offering to the Western seaboard. DXP paid approximately $14.9 million for Cortech. The purchase was financed with borrowings under the Facility as well as by issuing $4.4 million (148.8 thousand shares) of DXP common stock. DXP has not completed valuations of intangibles for Cortech, the valuation of working capital items or completed the analysis of the tax effects, and therefore has made preliminary estimates for the purposes of this disclosure. Estimated goodwill of $8.8 million and intangible assets of $5.2 were recognized for this acquisition. All of the estimated goodwill is included in the Service Centers segment. Approximately $4.5 million of the goodwill and intangible assets are not deductible for tax purposes.
The value assigned to the non-compete agreements and customer relationships for business acquisitions were determined by discounting the estimated cash flows associated with non-compete agreements and customer relationships as of the date the acquisition was consummated. The estimated cash flows were based on estimated revenues net of operating expenses and net of capital charges for assets that contribute to the projected cash flow from these assets. The projected revenues and operating expenses were estimated based on management estimates. Net capital charges for assets that contribute to projected cash flow were based on the estimated fair value of those assets. For B27, a discount rate of 13.5% was deemed appropriate for valuing these assets and were based on the risks associated with the respective cash flows taking into consideration the acquired company’s weighted average cost of capital.
For the twelve months ended December 31, 2015, businesses acquired during 2015 and 2014 contributed sales of $9.1 million and $171.1 million, respectively, and earnings (loss) before taxes of approximately $0.2 million and $(91.5) million, respectively. Earnings before taxes include impairment charges of $67.7 million for businesses acquired in 2014.
The following table summarizes the estimated fair values of the assets acquired and liabilities assumed during 2015 and 2014 in connection with the acquisitions described above (
in thousands
):
|
2015
|
2014
|
|||||||||||||||
|
TSI
|
CORTECH
|
B27
|
MT&S
|
|||||||||||||
|
Cash
|
$
|
-
|
$
|
-
|
$
|
2,538
|
$
|
806
|
||||||||
|
Accounts Receivable, net
|
442
|
2,293
|
51,448
|
5,656
|
||||||||||||
|
Inventory
|
475
|
1,243
|
6,472
|
2,522
|
||||||||||||
|
Property and equipment
|
42
|
253
|
14,573
|
557
|
||||||||||||
|
Goodwill and intangibles
1
|
4,929
|
14,048
|
259,412
|
8,405
|
||||||||||||
|
Other assets
|
100
|
21
|
1,791
|
59
|
||||||||||||
|
Assets acquired
|
5,988
|
17,858
|
336,234
|
18,005
|
||||||||||||
|
Current liabilities assumed
|
(335
|
)
|
(2,610
|
)
|
(26,690
|
) |
(3,336
|
) | ||||||||
|
Non-current liabilities assumed
2
|
(653
|
)
|
(349
|
)
|
(15,992
|
)
|
-
|
|||||||||
|
Net assets acquired
|
$
|
5,000
|
$
|
14,899
|
$
|
293,552
|
$
|
14,669
|
||||||||
(1) The amounts in the table above have not been reduced by the $105.3 million, or the $67.7 million, of goodwill impairment charges for B27 recorded in the fourth quarter of 2014 and the second half of 2015, respectively.
(2) Includes deferred tax liability of $0.6 million and $16.0 million related to intangible assets acquired for 2015 and 2014, respectively.
The pro forma unaudited results of operations for the Company on a consolidated basis for the twelve months ended December 31, 2015 and 2014, assuming the acquisition of businesses completed in 2015 and 2014 (previously discussed in Item 1,
Business
) were consummated as of January 1, 2014 are as follows (
in millions, except per share amounts
):
|
Years Ended
December 31,
|
||||||||
|
2015
|
2014
|
|||||||
|
Net sales
|
$
|
1,263
|
$
|
1,541
|
||||
|
Net income (loss) attributable to DXP Enterprises, Inc.
|
$
|
(37
|
)
|
$
|
(44
|
)
|
||
|
Per share data attributable to DXP Enterprises, Inc.
|
||||||||
|
Basic earnings (loss)
|
$
|
(2.60
|
)
|
$
|
(2.99
|
)
|
||
|
Diluted earnings (loss)
|
$
|
(2.60
|
)
|
$
|
(2.99
|
)
|
||
The pro forma unaudited results of operations for the Company on a consolidated basis for the twelve months ended December 31, 2014 and 2013, assuming the acquisition of businesses completed in 2014 and 2013 (previously discussed in Item 1,
Business
) were consummated as of January 1, 2013 are as follows (
in millions, except per share amounts
):
|
Years Ended
December 31,
|
||||||||
|
2014
|
2013
|
|||||||
|
Net sales
|
$
|
1,513
|
$
|
1,496
|
||||
|
Net income (loss)
|
$
|
(45
|
)
|
$
|
71
|
|||
|
Per share data
|
||||||||
|
Basic earnings (loss)
|
$
|
(3.08
|
)
|
$
|
4.90
|
|||
|
Diluted earnings (loss)
|
$
|
(3.08
|
)
|
$
|
4.64
|
|||
NOTE 14 - COMMITMENTS AND CONTINGENCIES
The Company leases equipment, automobiles and office facilities under various operating leases. The future minimum rental commitments as of December 31, 2015, for non-cancelable leases are as follows (
in thousands
):
|
2016
|
$
|
23,951
|
||
|
2017
|
19,215
|
|||
|
2018
|
12,676
|
|||
|
2019
|
7,497
|
|||
|
2020
|
4,058
|
|||
|
Thereafter
|
9,861
|
Rental expense for operating leases was $32.7 million, $32.3 million and $27.6 million for the years ended December 31, 2015, 2014 and 2013, respectively.
The Company’s commitments related to long-term debt are discussed in Note 9.
From time to time, the Company is a party to various legal proceedings arising in the ordinary course of business. While DXP is unable to predict the outcome of these lawsuits, it believes that the ultimate resolution will not have, either individually or in the aggregate, a material adverse effect on DXP’s consolidated financial position, cash flows, or results of operations.
NOTE 15 - EMPLOYEE BENEFIT PLANS
The Company offers a 401(K) plan which is eligible to substantially all employees in the United States. During 2015, 2014 and 2013, the Company elected to match employee contributions at a rate of 50 percent of up to 4 percent of salary deferral. The Company contributed $2.6 million, $2.5 million, and $2.7 million to the 401(K) plan in the years ended December 31, 2015, 2014, and 2013, respectively.
NOTE 16 - OTHER COMPREHENSIVE INCOME
Other comprehensive income generally represents all changes in shareholders’ equity during the period, except those resulting from investments by, or distributions to, shareholders.
During 2015, 2014, and 2013 the Company had net other comprehensive (loss) income of $0.0 million, ($0.1) million and ($0.6) million, respectively, related to changes in the market value of an investment with quoted market prices in an active market for identical instruments.
During 2012 and 2013, the Company acquired four entities that operate in Canada. These Canadian entities maintain financial data in Canadian dollars. Upon consolidation, the Company translates the financial data from these foreign subsidiaries into U.S. dollars and records cumulative translation adjustments in other comprehensive income. The Company recorded ($4.9) million, ($3.3) million and ($3.0) million in translation adjustments, net of tax, in other comprehensive income during the years ended December 31, 2015, 2014 and 2013, respectively. Related income tax benefits for the other comprehensive income losses on cumulative translation adjustments for the years ended December 31, 2015, 2014 and 2013 were $2.6 million, $1.7 million and $1.6 million, respectively.
NOTE 17 – SEGMENT AND GEOGRAPHICAL REPORTING
The Company’s reportable business segments are: Service Centers, Innovative Pumping Solutions and Supply Chain Services. The Service Centers segment is engaged in providing maintenance, MRO products and equipment, including logistics capabilities, to industrial customers. The Service Centers segment provides a wide range of MRO products in the rotating equipment, bearing, power transmission, hose, fluid power, metal working, fastener, industrial supply, safety products and safety services categories. The Innovative Pumping Solutions segment fabricates and assembles custom-made pump packages, remanufactures pumps and manufactures branded private label pumps. The Supply Chain Services segment manages all or part of a customer's MRO products supply chain, including warehouse and inventory management.
The high degree of integration of the Company’s operations necessitates the use of a substantial number of allocations and apportionments in the determination of business segment information. Sales are shown net of intersegment eliminations.
Business Segmented Financial Information
The following table sets out financial information relating the Company’s segments (
in thousands
):
|
Years Ended December 31,
|
Service
Centers
|
Innovative
Pumping
Solutions
|
Supply
Chain
Services
|
Total
|
||||||||||||
|
2015
|
||||||||||||||||
|
Sales
|
$
|
826,588
|
$
|
254,829
|
$
|
165,626
|
$
|
1,247,043
|
||||||||
|
Operating income for reportable segments, excluding impairment expense
|
78,170
|
21,584
|
14,213
|
113,967
|
||||||||||||
|
Identifiable assets at year end
|
451,333
|
159,365
|
50,012
|
660,710
|
||||||||||||
|
Capital expenditures
|
3,185
|
8,383
|
604
|
12,172
|
||||||||||||
|
Depreciation
|
7,734
|
2,930
|
227
|
10,891
|
||||||||||||
|
Amortization
|
10,334
|
8,406
|
1,881
|
20,621
|
||||||||||||
|
Interest expense
|
2,967
|
6,881
|
1,084
|
10,932
|
||||||||||||
|
Impairment expense by segment
|
15,842
|
52,893
|
-
|
68,735
|
||||||||||||
|
2014
|
||||||||||||||||
|
Sales
|
$
|
987,561
|
$
|
348,134
|
$
|
163,967
|
$
|
1,499,662
|
||||||||
|
Operating income for reportable segments, excluding impairment expense
|
107,699
|
51,162
|
13,794
|
172,655
|
||||||||||||
|
Identifiable assets at year end
|
568,182
|
202,228
|
54,637
|
825,047
|
||||||||||||
|
Capital expenditures
|
4,100
|
4,043
|
122
|
8,265
|
||||||||||||
|
Depreciation
|
8,416
|
2,381
|
397
|
11,194
|
||||||||||||
|
Amortization
|
11,281
|
8,993
|
2,206
|
22,480
|
||||||||||||
|
Interest expense
|
3,422
|
8,451
|
924
|
12,797
|
||||||||||||
|
Impairment expense by segment
|
10,210
|
107,359
|
-
|
117,569
|
||||||||||||
|
2013
|
||||||||||||||||
|
Sales
|
$
|
884,821
|
$
|
209,175
|
$
|
147,514
|
$
|
1,241,510
|
||||||||
|
Operating income for reportable segments
|
107,142
|
33,766
|
12,490
|
153,398
|
||||||||||||
|
Identifiable assets at year end
|
500,978
|
66,007
|
48,049
|
615,034
|
||||||||||||
|
Capital expenditures
|
6,321
|
357
|
206
|
6,884
|
||||||||||||
|
Depreciation
|
7,770
|
446
|
366
|
8,582
|
||||||||||||
|
Amortization
|
8,574
|
1,043
|
2,213
|
11,830
|
||||||||||||
|
Years Ended December 31,
|
||||||||||||
|
2015
|
2014
|
2013
|
||||||||||
|
Operating income for reportable segments, excluding impairment expense
|
$
|
113,967
|
$
|
172,655
|
$
|
153,398
|
||||||
|
Adjustments for:
|
||||||||||||
|
B27 settlement
|
7,348
|
-
|
-
|
|||||||||
|
Impairment expense
|
68,735
|
117,569
|
-
|
|||||||||
|
Amortization of intangibles
|
20,621
|
22,480
|
11,830
|
|||||||||
|
Corporate and other expense, net
|
45,179
|
45,234
|
40,644
|
|||||||||
|
Total operating income (loss)
|
(27,916
|
)
|
(12,628
|
)
|
100,924
|
|||||||
|
Interest expense
|
10,932
|
12,797
|
6,282
|
|||||||||
|
Other expenses (income), net
|
72
|
131
|
(75
|
)
|
||||||||
|
Income (loss) before income taxes
|
$
|
(38,920
|
)
|
$
|
(25,556
|
)
|
$
|
94,717
|
||||
The Company had capital expenditures at Corporate of $1.8 million, $0.8 million, and $0.9 million for the years ended December 31, 2015, 2014, and 2013, respectively. The Company had identifiable assets at Corporate of $23.3 million, $19.3 million, and $20.3 million as of December 31, 2015, 2014, and 2013, respectively. Corporate depreciation was $1.7 million, $1.4 million, and $1.2 million for the years ended December 31, 2015, 2014, and 2013, respectively.
Geographical Information
Revenues are presented in geographic area based on location of the facility shipping products or providing services. Long-lived assets are based on physical locations and are comprised of the net book value of property.
The Company’s revenues and property and equipment by geographical location are as follows
(in thousands)
:
|
Years Ended December 31,
|
||||||||||||
|
2015
|
2014
|
2013
|
||||||||||
|
Revenues
|
||||||||||||
|
United States
|
$
|
1,119,210
|
$
|
1,300,493
|
$
|
1,075,962
|
||||||
|
Canada
|
127,833
|
195,633
|
165,548
|
|||||||||
|
Other
|
-
|
3,536
|
-
|
|||||||||
|
Total
|
$
|
1,247,043
|
$
|
1,499,662
|
$
|
1,241,510
|
||||||
|
As of December 31,
|
||||||||
|
2015
|
2014
|
|||||||
|
Property and Equipment, net
|
||||||||
|
United States
|
$
|
53,695
|
$
|
49,013
|
||||
|
Canada
|
14,724
|
20,966
|
||||||
|
Dubai
|
84
|
-
|
||||||
|
Total
|
$
|
68,503
|
$
|
69,979
|
||||
NOTE 18 - QUARTERLY FINANCIAL INFORMATION (unaudited)
Summarized quarterly financial information for the years ended December 31, 2015, 2014 and 2013 is as follows (
in millions, except per share data
):
|
First
Quarter
(1)
|
Second
Quarter
(1)
|
Third
Quarter
(1)
|
Fourth
Quarter
|
|||||||||||||
|
2015
|
||||||||||||||||
|
Sales
|
$
|
341.6
|
$
|
323.7
|
$
|
303.1
|
$
|
278.6
|
||||||||
|
Gross profit
|
98.1
|
91.3
|
85.7
|
76.9
|
||||||||||||
|
Impairment expense
|
-
|
-
|
58.9
|
9.8
|
||||||||||||
|
Net income (loss)
|
9.7
|
7.2
|
(52.7
|
)
|
(3.2
|
)
|
||||||||||
|
Net income (loss) attributable to DXP Enterprises, Inc.
|
9.7
|
7.2
|
(52.4
|
)
|
(3.0
|
)
|
||||||||||
|
Earnings (loss) per share - basic
|
$
|
0.67
|
$
|
0.50
|
$
|
(3.64
|
)
|
$
|
(0.20
|
)
|
||||||
|
Earnings (loss) per share - diluted
|
$
|
0.63
|
$
|
0.47
|
$
|
(3.64
|
)
|
$
|
(0.20
|
)
|
||||||
|
2014
|
||||||||||||||||
|
Sales
|
$
|
348.5
|
$
|
381.6
|
$
|
387.0
|
$
|
382.6
|
||||||||
|
Gross profit
|
101.7
|
111.0
|
113.4
|
106.7
|
||||||||||||
|
Impairment expense
|
-
|
-
|
-
|
117.6
|
||||||||||||
|
Net income (loss)
|
10.9
|
14.9
|
17.0
|
(88.1
|
)
|
|||||||||||
|
Earnings (loss) per share - basic
|
$
|
0.74
|
$
|
1.01
|
$
|
1.16
|
$
|
(6.09
|
)
|
|||||||
|
Earnings (loss) per share - diluted
|
$
|
0.70
|
$
|
0.96
|
$
|
1.10
|
$
|
(6.09
|
)
|
|||||||
|
2013
|
||||||||||||||||
|
Sales
|
$
|
290.1
|
$
|
307.9
|
$
|
329.7
|
$
|
313.8
|
||||||||
|
Gross profit
|
89.1
|
91.5
|
97.1
|
94.6
|
||||||||||||
|
Net income
|
13.2
|
13.7
|
16.4
|
16.9
|
||||||||||||
|
Earnings per share - basic
|
$
|
0.92
|
$
|
0.95
|
$
|
1.13
|
$
|
1.17
|
||||||||
|
Earnings per share - diluted
|
$
|
0.87
|
$
|
0.90
|
$
|
1.07
|
$
|
1.10
|
||||||||
The sum of the individual quarterly earnings per share amounts may not agree with year-to-date earnings per share as each quarter’s computation is based on the weighted average number of shares outstanding during the quarter, the weighted average stock price during the quarter and the dilutive effects of the stock options and restricted stock in each quarter.
(1) During the fourth quarter of 2014, DXP finalized its purchase accounting for customer relationships for the acquisition of B27 and amortized the customer relationships on an accelerated basis. The revision increased amortization expense by $1.0 million per quarter. The first three quarters of 2014 were revised as follows:
|
Previously
Reported
First
Quarter
|
Adjusted
First
Quarter
|
Previously
Reported
Second
Quarter
|
Adjusted
Second
Quarter
|
Previously
Reported
Third
Quarter
|
Adjusted
Third
Quarter
|
|||||||||||||||||||
|
Sales
|
$
|
348.5
|
$
|
348.5
|
$
|
381.6
|
$
|
381.6
|
$
|
387.0
|
$
|
387.0
|
||||||||||||
|
Gross profit
|
101.7
|
101.7
|
111.0
|
111.0
|
113.4
|
113.4
|
||||||||||||||||||
|
Net income (loss)
|
11.6
|
10.9
|
15.5
|
14.9
|
17.6
|
17.0
|
||||||||||||||||||
|
Earnings (loss) per share
|
||||||||||||||||||||||||
|
Basic
|
$
|
0.79
|
$
|
0.74
|
$
|
1.06
|
$
|
1.01
|
$
|
1.20
|
$
|
1.16
|
||||||||||||
|
Diluted
|
$
|
0.75
|
$
|
0.70
|
$
|
1.00
|
$
|
0.96
|
$
|
1.14
|
$
|
1.10
|
||||||||||||
NOTE 19 – RELATED PARTIES
The Board uses policies and procedures, to be applied by the Audit Committee of the Board, for review, approval or ratification of any transactions with related persons. Those policies and procedures will apply to any proposed transactions in which DXP is a participant, the amount involved exceeds $120,000 and any director, executive officer or significant shareholder or any immediate family member of such a person has a direct or material indirect interest. Any related party transaction will be reviewed by the Audit Committee of the Board of Directors to determine, among other things, the benefits of any transaction to DXP, the availability of other sources of comparable products or services and whether the terms of the proposed transaction are comparable to those provided to unrelated third parties.
For the year ended December 31, 2015, the Company paid approximately $1.7 million in lease expenses to entities controlled by the Company’s Chief Executive Officer, David Little, $1.1 million in lease expenses to an entity in which a senior vice president holds a minority interest, and $0.2 million in lease expenses to an entity in which a senior vice president holds an interest, and the children of David Little hold a majority interest. The Company employs six people who work for David Little, and Mr. Little reimbursed the Company for the cost. Total cost to Mr. Little for the year ended December 31, 2015 for payroll, related payroll expenses, vehicles, fuel and supplies was $0.4 million. The Company employs two sons and two sons-in-laws of executives. Total wages and other compensation for 2015 was approximately $0.5 million for the four employees.
NOTE 20 – SUBSEQUENT EVENTS
We have evaluated subsequent events through the date the consolidated financial statements were issued. There were no subsequent events that required recognition for disclosure unless elsewhere identified in this report.
None.
MANAGEMENT’S REPORT ON INTERNAL CONTROL OVER FINANCIAL REPORTING
DXP Enterprises, Inc.’s management is responsible for establishing and maintaining adequate internal control over financial reporting. DXP Enterprises, Inc.’s internal control system was designed to provide reasonable assurance regarding the reliability of financial reporting and the preparation of financial statements for external purposes in accordance with generally accepted accounting principles.
Internal control over financial reporting cannot provide absolute assurance of achieving financial reporting objectives because of its inherent limitations. Internal control over financial reporting is a process that involves human diligence and compliance and is subject to lapses in judgment and breakdowns resulting from human failures. Internal control over financial reporting can also be circumvented by collusion or improper management override. Because of such limitations, there is a risk that material misstatements may not be prevented or detected on a timely basis by internal control over financial reporting. However, these inherent limitations are known features of the financial reporting process. Therefore, it is possible to design into the process safeguards to reduce, though not eliminate, this risk.
Management has used the 2013 framework set forth in the report entitled “Internal Control – Integrated Framework” published by the Committee of Sponsoring Organizations (“COSO”) of the Treadway Commission to evaluate the effectiveness of the Company’s internal control over financial reporting. Management has concluded that the Company’s internal control over financial reporting was effective as of December 31, 2015.
The effectiveness of our internal control over financial reporting as of December 31, 2015 has been audited by Grant Thornton LLP, the independent registered public accounting firm, which also has audited the Company’s Consolidated Financial Statements included in this Annual Report on Form 10-K.
|
/s/ David R. Little
|
/s/ Mac McConnell
|
||
|
David R. Little
|
Mac McConnell
|
||
|
Chairman of the Board and
|
Senior Vice President/Finance and
|
||
|
Chief Executive Officer
|
Chief Financial Officer
|
Disclosure Controls and Procedures
DXP carried out an evaluation, under the supervision and with the participation of its management, including the Chief Executive Officer and the Chief Financial Officer, of the effectiveness as of December 31, 2015, of the design and operation of DXP’s disclosure controls and procedures pursuant to Exchange Act Rules 13a-15 and 15d-15. Disclosure controls and procedures are the controls and other procedures of DXP that are designed to ensure that information required to be disclosed by DXP in the reports that it files or submits under the Securities Exchange Act of 1934, as amended, (the “Exchange Act”) is recorded, processed, summarized and reported, within the time periods specified in the rules and forms of the U.S. Securities and Exchange Commission (the “Commission”). Disclosure controls and procedures include, without limitation, controls and procedures designed to ensure that information required to be disclosed by DXP in the reports that it files or submits under the Exchange Act, is accumulated and communicated to the issuer’s management, including its principal executive and principal financial officers, or persons performing similar functions, as appropriate to allow timely decisions regarding required disclosure. Based upon that evaluation, the Chief Executive Officer and the Chief Financial Officer concluded that DXP’s disclosure controls and procedures were effective as of the end of the period covered by this Report.
Internal Control Over Financial Reporting
| (A) | Management’s Annual Report on Internal Control Over Financial Reporting |
Management’s report on the Company’s internal control over financial reporting is included in Item 9A of this Report under the heading Management’s Report on Internal Control Over Financial Reporting.
The effectiveness of our internal control over financial reporting at December 31, 2015 has been audited by Grant Thornton LLP, the independent registered public accounting firm that also audited our financial statements. Their report is included in Item 8 of this Report under the heading Report of Independent Registered Public Accounting Firm on Internal Controls.
| (B) | Changes in Internal Control over Financial Reporting |
None
None.
PART III
The information required by this item will be included in our definitive Proxy statement for the 2015 Annual Meeting of Shareholders that we will file with the SEC within 120 days of the end of the fiscal year to which this Report relates (the “Proxy Statement”) and is hereby incorporated by reference thereto.
The information required by this item will be included in the Proxy Statement and is hereby incorporated by reference.
| ITEM 12. | Security Ownership of Certain Beneficial Owners and Management and Related Stockholder Matters |
The information required by this item will be included in the Proxy Statement and is hereby incorporated by reference.
The information required by this item will be included in the Proxy Statement and is hereby incorporated by reference.
The information required by this item will be included in the Proxy Statement and is hereby incorporated by reference.
PART IV
(a) Documents included in this Report:
| 1. | Financial Statements – See Part II, Item 8 of this Report. |
| 2. | Financial Statement Schedules - All other schedules have been omitted since the required information is not applicable or significant or is included in the Consolidated Financial Statements or notes thereto. |
| 3. | Exhibits: |
The following exhibits are filed herewith or are incorporated by reference to exhibits previously filed with the Commission.
|
Exhibit
No.
|
Description
|
|
3.1
|
Restated Articles of Incorporation, as amended (incorporated by reference to Exhibit 4.1 to the Company’s Registration Statement on Form S-8 (Reg. No. 333-61953), filed with the Commission on August 20, 1998).
|
|
3.2
|
Bylaws (incorporated by reference to Exhibit 3.2 to the Company's Registration Statement on Form S-4 (Reg. No. 333-10021), filed with the Commission on August 12, 1996).
|
|
3.3
|
Amendment No. 1 to Bylaws of DXP Enterprises, Inc. (incorporated by reference to Exhibit A to the Company's Current Report on Form 8-K, filed with the Commission on July 28, 2011).
|
|
4.1
|
Form of Common Stock certificate (incorporated by reference to Exhibit 4.3 to the Company's Registration Statement on Form S-8 (Reg. No. 333-61953), filed with the Commission on August 20, 1998).
|
|
4.2
|
See Exhibit 3.1 for provisions of the Company's Restated Articles of Incorporation, as amended, defining the rights of security holders.
|
|
4.3
|
See Exhibit 3.2 for provisions of the Company's Bylaws defining the rights of security holders.
|
|
4.4
|
Form of Senior Debt Indenture of DXP Enterprises, Inc. (incorporated by reference to Exhibit 4.2 to the Company’s Registration Statement on Form S-3 (Reg. No. 333-166582), filed with the Commission on May 6, 2010).
|
|
4.5
|
Form of Subordinated Debt Indenture of DXP Enterprises, Inc. (incorporated by reference to Exhibit 4.3 to the Company’s Registration Statement on Form S-3 (Reg. No. 333-166582), filed with the SEC on May 6, 2010).
|
|
+10.1
|
Employment Agreement dated effective as of January 1, 2004, between DXP Enterprises, Inc. and David R. Little (incorporated by reference to Exhibit 10.10 to the Company’s Annual Report on Form 10-K for the fiscal year ended December 31, 2003, filed with the Commission on March 11, 2004).
|
|
+10.2
|
Employment Agreement dated effective as of June 1, 2004, between DXP Enterprises, Inc. and Mac McConnell (incorporated by reference to Exhibit 10.1 to the Company’s Quarterly Report on Form 10-Q for the quarterly period ended March 31, 2004, filed with the Commission on May 6, 2004).
|
|
+10.3
|
DXP Enterprises, Inc. 2005 Restricted Stock Plan (incorporated by reference to Exhibit 10.14 to the Company’s Annual Report on Form 10-K for the fiscal year ended December 31, 2005, (filed with the Commission on March 10, 2006).
|
|
+10.4
|
Amendment Number One to Employment Agreement dated effective as of January 1, 2004, between DXP Enterprises, Inc. and David R. Little (incorporated by reference to Exhibit 10.1 to the Company’s Current Report on Form 8-K, filed with the Commission on July 26, 2006).
|
|
+10.5
|
Amendment No. One to DXP Enterprises, Inc. 2005 Restricted Stock Plan (incorporated by reference to Exhibit 10.2 to the Company’s Current Report on Form 8-K, filed with the Commission on July 26, 2006).
|
|
10.6
|
Stock Purchase Agreement among DXP Enterprises, Inc., as Purchaser, Precision Industries, Inc., and the selling stockholders dated August 19, 2007, (incorporated by reference to Exhibit 10.1 to the Company’s Current Report on Form 8-K, filed with the Commission on August 21, 2007).
|
|
10.7
|
Asset Purchase Agreement among DXP Enterprises, Inc., as Purchaser, Lone Wolf Rental, LLC, Indian Fire and Safety, Inc., and the other parties named therein dated October 18, 2007, (incorporated by reference to Exhibit 10.1 to the Company’s Current Report on Form 8-K, filed with the Commission on October 22, 2007).
|
|
10.8
|
Stock Purchase Agreement among DXP Enterprises, Inc., as Purchaser, Vertex Corporate Holdings, Inc., the stockholders of Vertex Corporate Holdings, Inc. and Watermill-Vertex Enterprises, LLC, dated August 28, 2008, (incorporated by reference to Exhibit 10.1 to the Company’s Current Report on Form 8-K, filed with the Commission on August 29, 2008).
|
|
10.9
|
Amendment Number Two to Employment Agreement dated effective January 1, 2004 between DXP Enterprises, Inc. and David R. Little (incorporated by reference to Exhibit 10.1 to the Company’s Current Report on Form 8-K filed with the Commission on May 22, 2009).
|
|
10.10
|
Asset Purchase Agreement, dated as of April 1, 2010, whereby DXP Enterprises, Inc. acquired the assets of Quadna, Inc. (incorporated herein by reference to Exhibit 10.1 to the Company’s Current Report on Form 8-K, filed with the Securities and Exchange Commission on April 5, 2010).
|
|
10.11
|
Asset Purchase Agreement, dated as of November 22, 2010, whereby DXP Enterprises, Inc. acquired the assets of D&F Distributors, Inc. (incorporated herein by reference to Exhibit 10.1 to the Company’s Current Report on Form 8-K, filed with the Securities and Exchange Commission on November 23, 2010).
|
|
10.12
|
Amendment Number One to Employment Agreement dated effective June 1, 2004 between DXP Enterprises, Inc. and Mac McConnell (incorporated by reference to Exhibit 10.1 to the Company's Current Report on Form 8-K filed with the Commission on May 9, 2011).
|
|
10.13
|
David Little Equity Incentive Program dated May 4, 2011 (incorporated by reference to Exhibit 10.2 to the Company's Current Report on Form 8-K filed with the Commission on May 9, 2011).
|
|
10.14
|
Asset Purchase Agreement, dated as of October 10, 2011, whereby DXP Enterprises, Inc. acquired the assets of Kenneth Crosby (incorporated by reference to Exhibit 10.27 to the Company’s Annual Report on Form 10-K filed with the Commission on March 9, 2012).
|
|
10.15
|
Asset Purchase Agreement, dated as of December 30, 2011, whereby DXP Enterprises, Inc. acquired the assets of C.W. Rod Tool Company (incorporated by reference to Exhibit 10.28 to the Company’s Annual Report on Form 10-K filed with the Commission on March 9, 2012).
|
|
10.16
|
Arrangement Agreement, dated as of April 30, 2012, whereby DXP Enterprises, Inc. agreed to acquire all of the shares of HSE Integrated Ltd., (incorporated by reference to Exhibit 10.1 to the Company’s Current Report on Form 8-K, filed with the Commission on May 1, 2012).
|
|
10.17
|
Schedule A to the Arrangement Agreement dated April 30, 2012 between HSE Integrated Ltd., DXP Canada Enterprises Ltd. and DXP Enterprises, Inc., Plan of Arrangement under Section 193 of the Business Corporations Act (Alberta) (amended as of and effective June 28, 2012) (incorporated by reference to Exhibit 10.2 to the Company’s Current Report on Form 8-K, filed with the Commission on July 13, 2012).
|
|
10.18
|
Purchase Agreement, dated as of December 9, 2013, whereby DXP Enterprises, Inc. agreed to acquire all of the equity securities and units of B27, LLC (incorporated by reference to Exhibit 10.1 to the Company’s Current Report on Form 8K filed with the Commission on December 9, 2013).
|
|
10.19
|
Amended and Restated Credit Agreement dated as of January 2, 2014 by and among DXP Enterprises, Borrower, and Wells Fargo Bank, National Association, as Issuing Lender, and Administrative Agent for other lenders (incorporate by reference to Exhibit 10.2 to the Company’s Current Report on Form 8-K, filed with the Commission on January 6, 2014).
|
|
10.20
|
First amendment to Restated Credit Agreement dated as of August 6, 2015 by and among DXP Enterprises, Borrower, and Wells Fargo Bank, National Association, Issuing Lender, an Administrative Agent for other lenders (incorporated by reference to Exhibit 10.1 to the Registrant’s Quarterly Report Form 10-Q for the quarterly period ended June 30, 2015, filed with the Commission on August 10, 2015).
|
|
10.21
|
Second Amendment to Restated Credit Agreement dated as of September 30, 2015 by and among DXP Enterprises, Borrower, and Wells Fargo Bank, National Association as Issuing Lender and Administrative Agent for other lenders (incorporated by reference to Exhibit 10.1 to the Registrant’s Quarterly Report on Form 10-Q for the quarterly period ended September 30, 2015, filed with the Commission on November 9, 2015).
|
|
18.1
|
Letter of Independent Registered Public Accounting Firm Regarding Change in Accounting Principle (incorporated by reference to Exhibit 18.1 to the Company’s Quarterly Report on Form 10-Q for the quarterly period ended March 31, 2008, filed with the Commission on May 12, 2008.)
|
|
Subsidiaries of the Company.
|
|
|
Consent of Grant Thornton LLP, Independent Registered Public Accounting Firm.
|
|
|
Consent of Hein and Associates LLP, Independent Registered Public Accounting Firm.
|
|
|
Certification of Principal Executive Officer pursuant to Rule 13a-14(a) and Rule 15d-14(a) of the Exchange Act, as amended.
|
|
|
Certification of Principal Financial Officer pursuant to Rule 13a-14(a) and Rule 15d-14(a) of the Exchange Act, as amended.
|
|
|
Certification of Chief Executive Officer pursuant to 18 U.S.C. 1350, as adopted pursuant to Section 906 of the Sarbanes-Oxley Act of 2002, as amended.
|
|
Certification of Chief Financial Officer pursuant to 18 U.S.C. 1350, as adopted pursuant to Section 906 of the Sarbanes-Oxley Act of 2002, as amended.
|
|
|
101
|
Interactive Data Files
|
Exhibits designated by the symbol * are filed with this Report. All exhibits not so designated are incorporated by reference to a prior filing with the Commission as indicated.
+ Indicates a management contract or compensation plan or arrangement.
The Company undertakes to furnish to any shareholder so requesting a copy of any of the exhibits to this Report on upon payment to the Company of the reasonable costs incurred by the Company in furnishing any such exhibit.
Pursuant to the requirements of Section 13 or 15(d) of the Securities Exchange Act of 1934, the registrant has duly caused this report to be signed on its behalf by the undersigned, thereunto duly authorized.
|
DXP ENTERPRISES, INC. (Registrant)
|
||
|
By:
|
/s/ DAVID R. LITTLE
|
|
|
David R. Little
|
||
|
Chairman of the Board,
|
||
|
President and Chief Executive Officer
|
||
|
Dated: February 29, 2016
|
||
Each person whose signature appears below appoints David R. Little, as his or her true and lawful attorney-in-fact and agent, with full power of substitution and resubstitution, for him or her and in his or her name, place and stead, in any and all capacities, to sign any and all amendments to this Annual Report on Form 10-K, and to file the same, with all exhibits thereto, and other documents in connection therewith, with the Securities and Exchange Commission, with full power and authority to said attorney-in-fact and agent to do and perform each and every act whatsoever that is necessary, appropriate or advisable in connection with any or all of the above-described matters and to all intents and purposes as he or she might or could do in person, hereby ratifying and confirming all that said attorney-in-fact and agent or his substitute, may lawfully do or cause to be done by virtue thereof.
Pursuant to the requirements of the Securities Exchange Act of 1934, this report has been signed below by the following persons on behalf of the registrant and in the capacities and on the dates indicated:
|
NAME
|
TITLE
|
DATE
|
||
|
/s/David R. Little
|
Chairman of the Board, President
|
|||
|
David R. Little
|
Chief Executive Officer and Director
|
February 29, 2016
|
||
|
(Principal Executive Officer)
|
||||
|
/s/Mac McConnell
|
Senior Vice President/Finance and
|
February 29, 2016
|
||
|
Mac McConnell
|
Chief Financial Officer
|
|||
|
(Principal Financial and Accounting Officer)
|
||||
|
/s/Cletus Davis
|
Director
|
February 29, 2016
|
||
|
Cletus Davis
|
||||
|
/s/Timothy P. Halter
|
Director
|
February 29, 2016
|
||
|
Timothy P. Halter
|
||||
|
/s/Bryan Wimberly
|
Director
|
February 29, 2016
|
||
|
Bryan Wimberly
|
79
TABLE OF CONTENTS
Part IItem 1. BusinessItem 1A. Risk FactorsItem 1B. Unresolved Staff CommentsItem 2. PropertiesItem 3. Legal ProceedingsItem 4. Mine Safety DisclosuresPart IIItem 5. Market For The Registrant's Common Equity, Related Shareholder Matters and Issuer Purchases Of Equity SecuritiesItem 6. Selected Financial DataItem 7. Management's Discussion and Analysis Of Financial Condition and Results Of OperationsItem 7A. Quantitative and Qualitative Disclosures About Market RiskItem 8. Financial Statements and Supplementary DataNote 1 - The CompanyNote 2 - Summary Of Significant Accounting and Business PoliciesNote 3 - Recent Accounting PronouncementsNote 4 - Fair Value Of Financial Assets and LiabilitiesNote 5 - InventoryNote 6 Costs and Estimated Earnings on Uncompleted ContractsNote 7 - Property and EquipmentNote 8 - Goodwill and Other Intangible AssetsNote 9 Long-term DebtNote 10 - Income TaxesNote 11 - Share-based CompensationNote 12 - Earnings Per Share DataNote 13 - Business AcquisitionsNote 14 - Commitments and ContingenciesNote 15 - Employee Benefit PlansNote 16 - Other Comprehensive IncomeNote 17 Segment and Geographical ReportingNote 18 - Quarterly Financial Information (unaudited)Note 19 Related PartiesNote 20 Subsequent EventsItem 9. Changes in and Disagreements with Accountants on Accounting and Financial DisclosureItem 9A. Controls and ProceduresItem 9B. Other InformationPart IIIItem 10. Directors, Executive Officers and Corporate GovernanceItem 11. Executive CompensationItem 12. Security Ownership Of Certain Beneficial Owners and Management and Related Stockholder MattersItem 13. Certain Relationships and Related Transactions, and Director IndependenceItem 14. Principal Accounting Fees and ServicesPart IVItem 15. Exhibits, Financial Statement Schedules