DYCOM INDUSTRIES INC
10-Ks and 10-Qs
|
|
|
|
|
|
|
|
|
|
|
|
|
|
|
|
|
|
|
|
|
|
|
|
|
|
|
|
|
|
|
|
|
|
|
|
|
|
|
|
|
|
|
|
|
|
|
|
|
|
|
|
|
|
|
|
|
|
|
UNITED STATES SECURITIES AND EXCHANGE COMMISSION
Washington, D.C. 20549
FORM 10-K
(Mark One)
|
x
|
ANNUAL REPORT PURSUANT TO SECTION 13 OR 15(d) OF THE SECURITIES EXCHANGE ACT OF 1934
For the fiscal year ended July 26, 2014
|
|
¨
|
TRANSITION REPORT PURSUANT TO SECTION 13 OR 15(d) OF THE SECURITIES EXCHANGE ACT OF 1934
For the transition period from ________ to ________
|
Commission File Number 001-10613
DYCOM INDUSTRIES, INC.
(
Exact name of registrant as specified in its charter
)
|
Florida
|
|
59-1277135
|
|
(
State or other jurisdiction of incorporation or organization
)
|
|
(
I.R.S. Employer Identification No.
)
|
|
|
|
|
|
11770 US Highway 1, Suite 101, Palm Beach Gardens, FL
|
|
33408
|
|
(
Address of principal executive offices
)
|
|
(
Zip Code
)
|
Registrant’s telephone number, including area code: (561) 627-7171
Securities registered pursuant to Section 12(b) of the Act:
|
Title of Each Class
|
Name of Each Exchange on Which Registered
|
|
|
Common Stock, par value $0.33 1/3 per share
|
New York Stock Exchange
|
|
Securities registered pursuant to Section 12(g) of the Act: None
Indicate by check mark if the registrant is a well-known seasoned issuer, as defined in Rule 405 of the Securities Act. Yes
¨
No
x
Indicate by check mark if the registrant is not required to file reports pursuant to Section 13 or Section 15(d) of the Act. Yes
¨
No
x
Indicate by check mark whether the registrant (1) has filed all reports required to be filed by Section 13 or 15(d) of the Securities Exchange Act of 1934 during the preceding 12 months (or for such shorter period that the registrant was required to file such reports), and (2) has been subject to such filing requirements for the past 90 days. Yes
x
No
¨
Indicate by check mark whether the registrant has submitted electronically and posted on its corporate Web site, if any, every Interactive Data File required to be submitted and posted pursuant to Rule 405 of Regulation S-T (§ 232.405 of this chapter) during the preceding 12 months (or for such shorter period that the registrant was required to submit and post such files). Yes
x
No
¨
Indicate by check mark if disclosure of delinquent filers pursuant to Item 405 of Regulation S-K (§ 229.405 of this chapter) is not contained herein, and will not be contained, to the best of the registrant's knowledge, in definitive proxy of information statements incorporated by reference in Part III of this Form 10-K or any amendment to this form 10-K.
x
Indicate by check mark whether the registrant is a large accelerated filer, an accelerated filer, a non-accelerated filer, or a smaller reporting company. See the definitions of "large accelerated filer," "accelerated filer" and "smaller reporting company" in Rule 12b-2 of the Exchange Act. (Check one):
|
Large accelerated filer
x
|
Accelerated filer
¨
|
Non-accelerated filer
¨
|
Smaller reporting company
¨
|
Indicate by check mark whether the registrant is a shell company (as defined in Rule 12b-2 of the Exchange Act). Yes
¨
No
x
The aggregate market value of the common stock, par value $0.33 1/3 per share, held by non-affiliates of the registrant, computed by reference to the closing price of such stock on the New York Stock Exchange on
January 25, 2014
, was
$921,422,736
.
There were
34,000,148
shares of common stock with a par value of $0.33 1/3 outstanding at
September 5, 2014
.
DOCUMENTS INCORPORATED BY REFERENCE
|
Document
|
Part of Form 10-K into which incorporated
|
|
Portions of the registrant's Proxy Statement to be filed by November 22, 2014
|
Parts II and III
|
|
|
|
|
Such Proxy Statement, except for the portions thereof which have been specifically incorporated by reference, shall not be deemed "filed" as part of this Annual Report on Form 10-K.
|
|
|
Dycom Industries, Inc.
Table of Contents
|
||
|
|
|
|
|
|
||
|
|
||
|
|
|
|
|
|
PART I
|
|
|
|
|
|
|
|
|
|
|
|
PART II
|
|
|
|
|
|
|
|
|
|
|
|
PART III
|
|
|
|
|
|
|
|
|
|
|
|
PART IV
|
|
|
|
|
|
|
|
|
|
|
|
||
2
Cautionary Note Concerning Forward-Looking Statements
Dycom Industries, Inc. ("Dycom," the "Company," "we," "us," and "our") is making this statement pursuant to the safe harbor provisions for forward-looking statements described in the Private Securities Litigation Reform Act of 1995. This Annual Report on Form 10-K, including any documents incorporated by reference or deemed to be incorporated by reference herein, contains "forward-looking statements," which are statements relating to future events and our future financial performance, strategies, expectations, and competitive environment. Words such as "outlook," "believe," "expect," "anticipate," "estimate," "intend," "forecast," "may," "should," "could," "project," "target" and similar expressions, as well as statements in future tense, identify forward-looking statements.
You should not consider forward-looking statements as guaranteeing future performance or results. They will not necessarily indicate accurately whether such performance or results will be achieved or, if achieved, at what time. Forward-looking statements are based on information available at the time those statements are made and/or management’s good faith belief at that time with respect to future events. Such statements are subject to risks and uncertainties that could cause actual performance or results to differ materially from those expressed in or suggested by the forward-looking statements. Important factors, assumptions, uncertainties, and risks that could cause such differences include, but are not limited to:
|
•
|
anticipated outcomes of contingent events, including litigation;
|
|
•
|
projections of revenues, income or loss, or capital expenditures;
|
|
•
|
determinations as to whether the carrying value of our assets is impaired;
|
|
•
|
expected benefits and synergies of businesses acquired and future opportunities for the combined businesses;
|
|
•
|
plans for future operations, growth and acquisitions, dispositions, or financial needs;
|
|
•
|
financing availability;
|
|
•
|
outcomes of our plans for future operations, growth and services, including contract backlog;
|
|
•
|
restrictions imposed by our credit agreement and the indenture governing our senior subordinated notes;
|
|
•
|
use of our cash flow to service our debt;
|
|
•
|
future economic conditions and trends in the industries we serve;
|
|
•
|
assumptions relating to any of the foregoing;
|
and other factors discussed within Item 1,
Business
, Item 1A,
Risk Factors
and Item 7,
Management’s Discussion and Analysis of Financial Condition and Results of Operations
in this Annual Report on Form 10-K and other risks outlined in our periodic filings with the Securities and Exchange Commission ("SEC"). Our forward-looking statements are expressly qualified in their entirety by this cautionary statement. Our forward-looking statements are only made as of the date of this Annual Report on Form 10-K, and we undertake no obligation to update these forward-looking statements to reflect new information, or events or circumstances arising after such date.
Available Information
Copies of our Annual Reports on Form 10-K, Quarterly Reports on Form 10-Q, Current Reports on Form 8-K and any amendments to these reports filed or furnished pursuant to Section 13(a) or 15(d) of the Securities Exchange Act of 1934, as amended (the "Exchange Act"), are available free of charge at our website,
www.dycomind.com,
as soon as reasonably practicable after we file these reports with, or furnish these reports to, the SEC. All references to
www.dycomind.com
in this report are inactive textual references only and the information on our website is not incorporated into this Annual Report on Form 10-K.
3
Item 1.
Business.
Dycom Industries, Inc. is a leading provider of specialty contracting services throughout the United States and in Canada. The Company was incorporated in the State of Florida in 1969. Our services are provided on a decentralized basis through our subsidiary companies and include engineering, construction, maintenance and installation services to telecommunications providers, underground facility locating services to various utilities, including telecommunications providers, and other construction and maintenance services to electric and gas utilities and others. The terms "Dycom," the "Company," "we," "us," and "our" refer to Dycom Industries, Inc. and its subsidiaries.
Specialty Contracting Services
Our subsidiaries supply telecommunication providers with a broad range of specialty contracting services, from engineering, construction, maintenance, and installation to underground facility locating. Our engineering services include the design of aerial, underground and buried fiber optic, copper, and coaxial cable systems that extend from the telephone company central office, or cable operator headend, to the consumer's home or business. We also obtain rights of way and permits in support of our engineering activities and those of our customers, and provide construction management and inspection personnel in conjunction with engineering services or on a stand-alone basis.
Our construction, maintenance, and installation services include the placement and splicing of fiber, copper, and coaxial cables. In addition, we excavate trenches in which to place these cables; place related structures such as poles, anchors, conduits, manholes, cabinets and closures; place drop lines from main distribution lines to the consumer's home or business; and maintain and remove these facilities. These services are provided to both telephone companies and cable television multiple system operators in connection with the deployment of new networks and the expansion or maintenance of existing networks. We provide tower construction, lines and antenna installation, and foundation and equipment pad construction for wireless carriers, as well as equipment and material fabrication and site testing services. For cable television system operators, we install and maintain customer owned equipment such as digital video recorders, set top boxes and modems.
We also perform construction and maintenance services for electric and gas utilities and other customers. In addition, we provide underground facility locating services to a variety of utility companies, including telecommunication providers. Our underground facility locating services include locating telephone, cable television, power, water, sewer, and gas lines.
Business Strategy
Capitalize on Long-Term Growth Drivers.
We are well positioned to benefit from increased demand for network bandwidth which ensures reliable video, voice, and data services. As telecommunications networks experience increased demand, our customers must expand the capacity and improve the performance of their existing networks and, in certain instances, deploy new networks. This is increasingly important to our customers as the service offerings of telephone and cable companies converge, with each offering reliable, competitively priced voice, video, and data services to consumers and businesses. Additionally, there is a significant increase in demand for mobile broadband driven by the proliferation of smart phones and other wireless data devices. Our customers' networks, both wireline and wireless, are increasingly facing demands for greater capacity and reliability which increases the demand for our services.
Selectively Increase Market Share.
We believe our reputation for high quality and our ability to provide services nationally creates opportunities to expand our market share. Our decentralized operating structure and numerous points of contact within customer organizations position us favorably to win new opportunities with existing customers. Our significant financial resources enable us to address larger opportunities which some of our relatively capital-constrained competitors may be unable to perform. We do not intend to increase market share by pursuing unprofitable work.
Pursue Disciplined Financial and Operating Strategies.
We manage the financial aspects of our business by centralizing certain activities which allow us to reduce costs through leveraging our scope and scale. We have centralized functions such as treasury, tax and risk management, the approval of capital equipment procurements, and the design and administration of employee benefit plans. We also centralize our information technology structure to provide enhanced operating efficiency. In contrast, we decentralize the recording of transactions and the financial reporting necessary for timely operational decisions. Decentralization promotes greater accountability for business outcomes from our local decision makers. We also maintain a decentralized approach to marketing, field operations and ongoing customer service, empowering local managers to capture new business and execute contracts on a timely and cost-effective basis. Our approach enables us to utilize our capital resources efficiently while retaining the organizational agility necessary to compete with small, privately owned local competitors.
4
Pursue Selective Acquisitions.
We pursue acquisitions when we believe doing so is operationally and financially beneficial, for the Company as a whole, not simply for growth. In particular, we pursue acquisitions that we believe will provide us with incremental revenue and geographic diversification while complementing our existing operations. We generally target companies for acquisition that have defensible leadership positions in their market niches, profitability which meets or exceeds industry averages, proven operating histories, sound management and certain clearly identifiable cost synergies.
Acquisitions
As part of our growth strategy, we may acquire companies that expand, complement or diversify our business. We regularly review opportunities and periodically engage in discussions regarding possible acquisitions. Our ability to sustain our growth and maintain our competitive position may be affected by our ability to identify, acquire, and successfully integrate companies.
Fiscal 2013
- On December 3, 2012, we acquired substantially all of the telecommunications infrastructure services subsidiaries (the "Acquired Subsidiaries") of Quanta Services, Inc. for the sum of
$275.0 million
in cash, an adjustment of approximately
$40.4 million
for working capital received in excess of a target amount, and approximately
$3.7 million
for other specified items. We recognized approximately
$6.5 million
of acquisition costs during
fiscal 2013
related to the acquisition of the Acquired Subsidiaries, which are included within general and administrative expenses. The Acquired Subsidiaries provide specialty contracting services, including engineering, construction, maintenance and installation services to telecommunications providers, and other construction and maintenance services to electric and gas utilities and others. Principal business facilities are located in Arizona, California, Florida, Georgia, Minnesota, New York, Pennsylvania and Washington.
During the fourth quarter of fiscal 2013, we acquired Sage Telecommunications Corp. of Colorado, LLC ("Sage"). Sage provides telecommunications construction and project management services primarily for cable operators in the Western United States. Additionally, during the fourth quarter of fiscal 2013 we acquired certain assets of a tower construction and maintenance company.
Fiscal 2014
- During the third quarter of fiscal 2014, we acquired a telecommunications specialty construction contractor in Canada for
$0.7 million
. We also acquired Watts Brothers Cable Construction, Inc. ("Watts Brothers") for
$16.4 million
during the fourth quarter of fiscal 2014. Watts Brothers provides specialty contracting services primarily for telecommunication and cable operators in the Midwest and Southeastern United States.
Customer Relationships
We have established relationships with many leading telephone companies, cable television multiple system operators, telecommunication equipment and infrastructure providers, and electric and gas utilities and others. Our customer base is highly concentrated, with our top five customers accounting for approximately
58.3%
,
58.5%
and
59.6%
of our total revenues in fiscal
2014
,
2013
and
2012
, respectively. During
fiscal 2014
, approximately
19.2%
of our total revenues was derived from AT&T Inc.,
13.8%
from CenturyLink, Inc.,
11.7%
from Comcast Corporation,
8.2%
from Verizon Communications, Inc. and
5.5%
from Time Warner Cable Inc. We believe that a substantial portion of our total revenues and operating income will continue to be derived from a concentrated group of customers.
Our markets are served locally by dedicated and experienced personnel. The management of our subsidiaries possesses intimate knowledge of their particular markets, allowing us to be responsive to customer needs. Our sales and marketing efforts are the responsibility of management, including management of our subsidiaries, and tend to focus on contacts with managers within our customers' organizations.
A majority of our services are performed under master service agreements and other arrangements with customers which contain customer-specified service requirements, such as discrete pricing for individual tasks. We generally have multiple agreements with each of our significant customers. To the extent that such agreements specify exclusivity, there are often a number of exceptions, including the ability of the customer to issue work orders valued above a specified dollar amount to other service providers, the performance of work with the customer's own employees, and the use of other service providers when jointly placing facilities with another utility. In most cases, a customer may terminate an agreement for convenience with written notice. Historically, master service agreements have been awarded primarily through a competitive bidding process; however, occasionally we are able to extend some of these agreements on a negotiated basis. The remainder of our services are provided pursuant to contracts for specific projects. Long-term contracts relate to specific projects with terms in excess of one year from the contract date. Short-term contracts for specific projects are generally of three to four months in duration. A
5
portion of our contracts include retainage provisions by which 5% to 10% of the invoiced amounts may be withheld by the customer pending project completion.
Cyclicality and Seasonality
Demand for our services may be impacted by the cyclical nature of the industry we serve. Our revenues and results of operations are influenced by the capital expenditure and maintenance budgets of our customers, including seasonal budgetary spending patterns and timing of their budget approvals, as well as the timing and volume of customers' construction and maintenance projects. The capital expenditures and maintenance budgets of our telecommunications customers may be impacted by consumer and business demands on telecommunications providers, the introduction of new communication technologies, the physical maintenance needs of their infrastructure, the actions of our government and the Federal Communications Commission, and overall economic conditions. Changes in our mix of customers, contracts and business activities, as well as changes in the general level of construction activity also drive cyclical variations in revenues and results of operations.
Our revenues and results of operations exhibit seasonality as a significant portion of our work is performed outdoors. Consequently, our operations are impacted by extended periods of adverse weather which are more likely to occur during the winter season, impacting our second and third fiscal quarters. Several of the businesses acquired during fiscal 2013 are located and perform work in geographies more prone to cold weather, further impacting seasonal variations during our second and third fiscal quarters. Also, a disproportionate percentage of paid holidays fall within our second quarter, which decreases the number of available workdays. Additionally, our customer premise equipment installation activities for cable providers historically decrease around the calendar year-end holidays as their customers generally require less activity during this period. As a result of these factors, we may experience reduced revenue and profitability in the second and/or third quarters of our fiscal year.
Backlog
Our backlog consists of the estimated uncompleted portion of services to be performed under contractual agreements with our customers and totaled
$2.331
billion and
$2.197 billion
at
July 26, 2014
and
July 27, 2013
, respectively. We expect to complete
57.7%
of the
July 26, 2014
backlog during
fiscal 2015
. Our backlog estimates represent amounts under master service agreements and other contractual agreements for services projected to be performed over the terms of the contracts and are based on contract terms, our historical experience with customers and, more generally, our experience in similar procurements. The significant majority of our backlog estimates comprise services under master service agreements and long-term contracts.
Revenue estimates included in our backlog can be subject to change as a result of project accelerations, cancellations or delays due to various factors, including but not limited to commercial issues and adverse weather. These factors can also cause revenue amounts to be realized in periods and at levels different than originally projected. In many instances, our customers are not contractually committed to procure specific volumes of services under a contract. While we have not experienced any material cancellations during fiscal 2014, 2013 or 2012, the majority of our contracts may be canceled by our customers upon notice regardless of whether or not we are in default. Our estimates of a customer's requirements during a particular future period may prove to be inaccurate. The amount of backlog related to uncompleted projects in which a provision for estimated losses was recorded was not material.
Backlog is not a measure defined by United States generally accepted accounting principles; however, it is a common measurement used in our industry. Our methodology for determining backlog may not be comparable to the methodologies used by others.
Competition
The specialty contracting services industry in which we operate is highly fragmented. It is characterized by a large number of participants, including several large companies as well as a significant number of small, privately owned, local competitors. We also face competition from the in-house service organizations of our existing and prospective customers, particularly telecommunications providers that employ personnel who perform some of the same services that we provide. There are relatively few barriers to entry into the markets in which we operate. As a result, any organization that has adequate financial resources and access to technical expertise may become a competitor. The principal competitive factors for our services include geographic presence, breadth of service offerings, worker and general public safety, price, quality of service, and industry reputation. We believe that we meet or exceed our competitors when evaluated against these factors.
6
Employees
As of
July 26, 2014
, we employed
10,592
persons. We maintain a core group of technical and managerial personnel to supervise our projects. Our workforce fluctuates in size to meet the demands of our customers.
Materials and Subcontractors
For a majority of the contract services we perform, our customers provide all required materials while we provide the necessary personnel, tools and equipment. Materials supplied by our customers, for which the customer retains financial and performance risk, are not included in our revenue or costs of sales. Under contracts which require us to supply part or all of the required materials, we are not dependent upon any one source for materials. We do not manufacture materials for resale.
We use independent subcontractors to help manage fluctuations in work volumes and reduce the amount that we may otherwise be required to expend on fixed assets and working capital. These independent subcontractors typically are small locally owned companies. Independent subcontractors provide their own employees, vehicles, tools and insurance coverage. There are no independent subcontractors that are significant to the Company.
Safety and Risk Management
We are committed to ensuring that our employees perform their work safely, and we regularly communicate with our employees to reinforce that commitment and instill safe work habits. The safety directors of our subsidiaries review accidents and claims for our operations, examine trends and implement changes in procedures to address safety issues. Claims arising in our business generally include workers' compensation claims, various general liability and damage claims, and claims related to vehicle accidents, including personal injury and property damage. We insure against the risk of loss arising from our operations up to certain deductible limits in substantially all of the states in which we operate. In addition, we retain the risk of loss, up to certain limits, under our employee group health plan.
We carefully monitor claims and actively participate with our insurers in determining claims estimates and adjustments. The estimated costs of claims are accrued as liabilities, and include estimates for claims incurred but not reported. Due to fluctuations in our loss experience from year to year, insurance accruals have varied and can affect the consistency of our operating margins. If we experience insurance claims in excess of our umbrella coverage limit, our business could be materially and adversely affected. See Item 7,
Management's Discussion and Analysis of Financial Condition and Results of Operations
, and Note 8,
Accrued Insurance Claims
, in the Notes to Consolidated Financial Statements.
Environmental Matters
A significant portion of the work we perform is associated with the underground networks of our customers. We could be subject to potential material liabilities in the event we cause a release of hazardous substances or other environmental damage resulting from underground objects we encounter. Additionally, environmental laws and regulations which relate to our business include those regarding the removal and remediation of hazardous substances. These laws and regulations can impose significant fines and criminal sanctions for violations. Costs associated with the discharge of hazardous substances may include clean-up costs and related damages or liabilities. These costs could be significant and could adversely affect our results of operations and cash flows.
Executive Officers of the Registrant
The following table sets forth certain information concerning the Company's executive officers, all of whom serve at the pleasure of the Board of Directors.
|
Name
|
Age
|
Office
|
Executive Officer Since
|
|||
|
Steven E. Nielsen
|
51
|
Chairman, President and Chief Executive Officer
|
February 26, 1996
|
|||
|
Timothy R. Estes
|
60
|
Executive Vice President and Chief Operating Officer
|
September 1, 2001
|
|||
|
H. Andrew DeFerrari
|
45
|
Senior Vice President and Chief Financial Officer
|
November 22, 2005
|
|||
|
Richard B. Vilsoet
|
61
|
Vice President, General Counsel and Corporate Secretary
|
June 11, 2005
|
|||
7
There are no arrangements or understandings between any executive officer of the Company and any other person pursuant to which any executive officer was selected as an officer of the Company. There are no family relationships among the Company's executive officers.
Steven E. Nielsen
has been the Company's President and Chief Executive Officer since March 1999. Prior to that, Mr. Nielsen was President and Chief Operating Officer of the Company from August 1996 to March 1999, and Vice President from February 1996 to August 1996.
Timothy R. Estes
has been the Company's Executive Vice President and Chief Operating Officer since September 2001. Prior to that, Mr. Estes was the President of Ansco & Associates, Inc., one of the Company's subsidiaries, from 1997 until 2001 and Vice President from 1994 until 1997.
H. Andrew DeFerrari
has been the Company's Senior Vice President and Chief Financial Officer since April 2008. Prior to that, Mr. DeFerrari was the Company's Vice President and Chief Accounting Officer since November 2005 and was the Company's Financial Controller from July 2004 through November 2005. Mr. DeFerrari was previously a senior audit manager with Ernst & Young Americas, LLC.
Richard B. Vilsoet
has been the Company's General Counsel and Corporate Secretary since June 2005 and Vice President since November 2005. Before joining the Company, Mr. Vilsoet was a partner with Shearman & Sterling LLP. Mr. Vilsoet was with Shearman & Sterling LLP for over 15 years.
Item 1A
.
Risk Factors.
Our business is subject to a variety of risks and uncertainties, including, but not limited to, the risks and uncertainties described below. You should read the following risk factors carefully in connection with evaluating our business and the forward-looking information contained in this Annual Report on Form 10-K. If any of the risks described below, or elsewhere in this Annual Report on Form 10-K were to occur, our financial condition and results of operations could suffer and the trading price of our common stock could decline. Additionally, if other risks not presently known to us, or that we do not currently believe to be significant, occur or become significant, our financial condition and results of operations could suffer and the trading price of our common stock could decline.
Demand for our services is cyclical and vulnerable to economic downturns affecting the industries we serve
. Demand for our services has been, and will likely continue to be, cyclical in nature and vulnerable to downturns in the economy and telecommunications industry. During times of uncertain or slowing economic conditions, our customers often reduce their capital expenditures and defer or cancel pending projects. In addition, our customers generally finance their projects through cash flow from operations, the issuance of debt, or the issuance of equity. Uncertain or adverse economic conditions that create volatility in the credit and equity markets could reduce the availability of debt or equity financing for our customers. As a result of the foregoing, demand for our services may decline during periods of economic uncertainty or weakness adversely affecting our operations, cash flows and liquidity. In addition, this makes it difficult to estimate our customers' demand for our services and adds uncertainty to the determination of our backlog.
We derive a significant portion of our revenues from master service agreements and long-term contracts which may be canceled by our customers upon notice or which we may be unable to renew on negotiated terms.
During
fiscal 2014
, we derived approximately
78.9%
of our revenues from master service agreements and long-term contracts. By their terms, the majority of these contracts may be canceled by our customers upon notice regardless of whether or not we are in default. In addition, our customers generally have no obligation to assign a specific amount of work to us under these agreements. Consequently, projected expenditures by customers are not assured until a definitive work order is placed with us and the work completed. This makes it difficult to estimate our customers' demand for our services and adds uncertainty to the determination of our backlog. Furthermore, our customers generally require competitive bidding of these contracts. Accordingly, we may be underbid by our competitors if they elect to reduce their prices in order to procure business or we could be required to lower the price charged under a contract being rebid. The loss of work obtained through master service agreements and long-term contracts or the reduced profitability of such work could adversely affect our results of operations, cash flows and liquidity.
The industries we serve have experienced, and may continue to experience, rapid technological, structural and competitive changes that could reduce the need for our services and adversely affect our revenues.
The telecommunications industry is characterized by rapid technological change, intense competition and changing consumer demands. We generate a significant portion of our revenues from customers in the telecommunications industry. New technologies, or upgrades to existing technologies by customers, could reduce the need for our services and adversely affect our revenues and profitability. New,
8
developing, or existing services could displace the wireline or wireless systems that we install and that are used by our customers to deliver services to consumers and businesses. Additionally, the telecommunications industry we serve has been characterized by consolidation that may result in the loss of one or more customers. In addition, improvements in existing technology may allow telecommunication companies to improve their networks without physically upgrading them. Reduced demand for our services or a loss of a significant customer could adversely affect our results of operations, cash flows and liquidity.
We derive a significant portion of our revenues from a limited number of customers, and the loss of one or more of these customers could adversely impact our revenues and profitability.
Our customer base is highly concentrated, with our top five customers accounting for approximately
58.3%
,
58.5%
and
59.6%
of our total revenues in fiscal
2014
,
2013
and
2012
, respectively. If we were to lose one or more of our significant customers, our revenue may significantly decline. In addition, revenues under our contracts with significant customers may vary from period-to-period depending on the timing or volume of work which those customers order or perform with their in-house service organizations. Additionally, the consolidation, merger or acquisition of an existing customer may result in a change in procurement strategies employed by the surviving entity which could reduce the amount of work we receive. The loss of work from a significant customer could adversely affect our results of operations, cash flows and liquidity.
The specialty contracting services industry in which we operate is highly competitive.
We compete with other specialty contractors, including numerous small, privately owned companies, as well as several companies that may have financial, technical and marketing resources that exceed our own. Relatively few barriers to entry exist in the markets in which we operate and, as a result, any organization that has adequate financial resources and access to technical expertise may become a competitor. Additionally, our competitors may develop the expertise, experience and resources to provide services that are equal or superior in both price and quality to our services, and we may not be able to maintain or enhance our competitive position. We also face competition from the in-house service organizations of our customers whose personnel perform some of the services that we provide. We can offer no assurance that our existing or prospective customers will continue to outsource specialty contracting services in the future. Our results of operations, cash flows and liquidity could be materially and adversely affected if we are unsuccessful in bidding on projects, if our ability to win projects requires that we settle for lesser margins or if our customers reduce the amount of specialty contracting services that are outsourced.
Our financial results are based on estimates and assumptions that may differ from actual results.
In preparing our consolidated financial statements in conformity with accounting principles generally accepted in the United States of America, a number of estimates and assumptions are made by management that affect the amounts reported in the financial statements. These estimates and assumptions must be made because certain information that is used in the preparation of our financial statements is either dependent on future events or cannot be calculated with a high degree of precision from available data. In some instances, these estimates are particularly uncertain and we must exercise significant judgment. Estimates are primarily used in our assessment of the recognition of revenue for costs and estimated earnings under the percentage of completion method of accounting, allowance for doubtful accounts, the fair value of reporting units for goodwill impairment analysis, the assessment of impairment of intangibles and other long-lived assets, the purchase price allocations of businesses acquired, accrued insurance claims, income taxes, asset lives used in computing depreciation and amortization, stock-based compensation expense for performance-based stock awards, and accruals for contingencies, including legal matters. At the time they are made, we believe that such estimates are fair when considered in conjunction with our consolidated financial position and results of operations taken as a whole. However, actual results could differ from those estimates and such differences may be material to our financial statements.
Our profitability is based on our delivering services within the estimated costs established when pricing our contracts.
We recognize revenues under the percentage of completion method of accounting using the units-of-delivery or cost-to-cost measures. A significant majority of our contracts are based on units-of-delivery and revenue is recognized as each unit is completed. As the price for each of the units is fixed by the contract, our profitability could decline if our actual cost to complete each unit exceeds our original estimates. Revenues from contracts using the cost-to-cost measures of completion are recognized based on the ratio of contract costs incurred to date to total estimated contract costs. Application of the percentage of completion method of accounting requires that we estimate the costs to be incurred in performing the contract. Our process for estimating costs is based on the knowledge and experience of our project managers and financial professionals. Any changes in original cost estimates, or the assumptions underpinning such estimates, may result in changes to costs and income. These changes would be recognized in the period in which they are determined and could result in significant changes to previously reported profits.
We have a significant amount of accounts receivable and costs and estimated earnings in excess of billings.
We extend credit to our customers as a result of performing work under contract prior to billing our customers for that work. These customers include telephone companies, cable television multiple system operators, and gas and electric utilities and others. We
9
periodically assess the credit risk of our customers and continuously monitor the timeliness of payments. Slowing conditions in the industries we serve may impair the financial condition of one or more of our customers and hinder their ability to pay us on a timely basis or at all. Furthermore, bankruptcies or financial difficulties within the telecommunications sector could hinder the ability of our customers to pay us on a timely basis or at all. At
July 26, 2014
, we had net accounts receivable of
$272.7
million and costs and estimated earnings in excess of billings of
$230.6
million. The failure or delay in payment by our customers could reduce our expected cash flows and adversely impact our liquidity and profitability.
Our accounts receivable include approximately $20.1 million for past due balances from a customer on a rural project funded primarily by the Rural Utilities Service agency of the United States Department of Agriculture (the “RUS”) under the American Recovery and Reinvestment Act of 2009. The loan made by the RUS is secured by certain assets of the customer. We have stopped work on the project. We have filed construction liens with respect to work on the project representing approximately $17.7 million of the accounts receivable balance. In addition, other creditors have also filed construction liens against the customer. In July 2014, we were included in an action taken by another creditor that has filed a construction lien on one parcel of property owned by the customer to foreclose the lien on that parcel. In the event the customer does not pay the balances owed, the amount we collect through the enforcement of our liens or other actions will depend on the value realized on the assets underlying the liens as well as the amount owed to, and priority of, other creditors.
We retain the risk of loss for certain insurance related liabilities.
We retain the risk of loss, up to certain limits, for claims related to automobile liability, general liability, workers' compensation, employee group health, and damages relating to underground facility locating services. We are self-insured for the majority of all claims because most claims against us do not exceed the deductibles under our insurance policies. We estimate and develop our accrual for these claims, including losses incurred but not reported, based on facts, circumstances and historical evidence. However, the estimate for accrued insurance claims remains subject to uncertainty as it depends in part on factors that cannot be known with precision. These factors include the estimated number of future claims, the payment pattern of claims which have been incurred, changes in the medical condition of claimants, and other factors such as inflation, tort reform or other legislative changes, unfavorable jury decisions and court interpretations. Should a greater number of claims occur compared to what we have estimated, or should the dollar amount or cost of actual claims exceed what we have anticipated, our recorded reserves may not be sufficient, and we could incur substantial additional unanticipated charges. See Item 7,
Management's Discussion and Analysis of Financial Condition and Results of Operations – Critical Accounting Policies – Accrued Insurance Claims
, and Note 8,
Accrued Insurance Claims
, of Notes to the Consolidated Financial Statements in this Annual Report on Form 10-K.
Our backlog is subject to reduction or cancellation.
Our backlog consists of the uncompleted portion of services to be performed under job-specific contracts and the estimated value of future services that we expect to provide under master service agreements and other contracts. Many of our contracts are multi-year agreements, and we include in our backlog the amount of services projected to be performed over the terms of the contracts based on our historical experience with customers and, more generally, our experience in procurements of this type. In many instances, our customers are not contractually committed to procure specific volumes of services under a contract or can cancel a contract for convenience. Therefore our estimates of a customer's requirements during a particular future period may prove to be inaccurate. In addition, revenue estimates included in our backlog can be subject to change as a result of project accelerations or delays due to various factors, including but not limited to commercial issues and adverse weather. These factors can also cause revenue amounts to be realized in periods and at levels different than originally projected. As a result, our backlog as of any particular date is an uncertain indicator of future revenues and earnings.
We may incur impairment charges on goodwill or other intangible assets.
We account for goodwill and other intangibles in accordance with Financial Accounting Standards Board ("FASB") Accounting Standard Codification ("ASC") Topic 350,
Intangibles-Goodwill and Other
("ASC Topic 350"). Our reporting units' goodwill and other related indefinite-lived intangible assets are assessed annually as of the first day of the fourth fiscal quarter of each year in order to determine whether their carrying value exceeds their fair value. In addition, reporting units are tested on an interim basis if an event occurs or circumstances change between annual tests that would more likely than not reduce their fair value below carrying value. If we determine the fair value of the goodwill or other indefinite-lived intangible assets is less than their carrying value as a result of the tests, an impairment loss is recognized. Any such write-down adversely affects our results of operations. As a result of the
fiscal 2014
and
fiscal 2013
annual impairment analyses, we concluded that no impairment of goodwill or the indefinite-lived intangible asset was indicated at any reporting unit.
Our goodwill resides in multiple reporting units. The profitability of individual reporting units may suffer periodically from downturns in customer demand and other factors resulting from the cyclical nature of our business, the high level of competition existing within our industry, the concentration of our revenues from a limited number of customers, and the level of overall economic activity. Individual reporting units may be relatively more impacted by these factors than the company as a whole. Specifically, during times of slowing economic conditions, our customers may reduce capital expenditures and defer or
10
cancel pending projects. As a result, demand for the services of one or more of the reporting units could decline which could adversely affect our operations, cash flow, and liquidity, and could result in an impairment of goodwill or intangible assets. In addition, adverse changes to the key valuation assumptions contributing to the fair value of our reporting units could result in an impairment of goodwill or intangible assets.
We may be subject to periodic litigation and regulatory proceedings, including Fair Labor Standards Act and state wage and hour class action lawsuits, which may adversely affect our business and financial performance.
From time to time, we may be involved in lawsuits and regulatory actions that are brought or threatened against us in the ordinary course of business. These actions and proceedings may involve claims for, among other things, compensation for alleged personal injury, workers' compensation, employment discrimination, breach of contract or property damage. In addition, we may be subject to class action lawsuits involving allegations of violations of the Fair Labor Standards Act and state wage and hour laws. Due to the inherent uncertainties of litigation, we cannot accurately predict the ultimate outcome of any such actions or proceedings. The outcome of litigation, particularly class action lawsuits and regulatory actions, is difficult to assess or quantify, because
plaintiffs in these types of lawsuits may seek recovery of very large or indeterminate amounts, and the magnitude of the potential loss relating to such lawsuits may remain unknown for substantial periods of time
. In addition, plaintiffs in many types of actions may seek punitive damages, civil penalties, consequential damages or other losses, or injunctive or declaratory relief. The ultimate resolution of these matters through settlement, mediation or court judgment could have a material impact on our financial condition, results of operations, and cash flows. In addition, regardless of the outcome, these proceedings could result in substantial cost and may require us to devote substantial resources to defend ourselves. For a description of current legal proceedings, see Item 3,
Legal Proceedings
, and Note 18,
Commitments and Contingencies
, of Notes to the Consolidated Financial Statements in this Annual Report on Form 10-K.
The loss of certain key managers could adversely affect our business.
We depend on the services of our executive officers and the senior management of our subsidiaries. Our senior management team has many years of experience in our industry, and the loss of any one of them could negatively affect our customer relationships or the ability to execute our business strategy and adversely affect our operations. Although we have entered into employment agreements with certain of our executive officers and other key employees, we cannot guarantee that any of them or other key management personnel will remain employed by us for any length of time. We do not carry significant "key-person" life insurance on any of our employees.
Our business is labor intensive, and we may be unable to attract and retain qualified employees.
Our ability to maintain our productivity and profitability is limited by our ability to employ, train and retain the skilled personnel necessary to operate our business. We cannot be certain that we will be able to maintain the skilled labor force necessary to operate efficiently and support our growth strategy. Our ability to do so depends on a number of factors, such as general rates of employment, competitive demands for employees possessing the skills we need and the level of compensation required to hire and retain qualified employees. In addition, our labor costs may increase when there is a shortage in the supply of skilled personnel.
We may be unable to secure sufficient independent subcontractors to fulfill our obligations, or our independent subcontractors may fail to satisfy their obligations.
We utilize independent subcontractors to complete work on a portion of our projects and to manage workflow. If we are unable to secure independent subcontractors at a reasonable cost or at all, we may be delayed in completing work under a contract or the cost of completing the work may increase. In addition, we may have disputes with these independent subcontractors arising from, among other things, the quality and timeliness of the work they have performed. We may incur additional costs in order to correct such shortfalls in the work performed by subcontractors. Any of these factors could adversely affect the quality of our service, our ability to perform under certain contracts and the relationship with our customers, which could have an adverse effect on our results of operations, cash flows, and liquidity.
The nature of our business exposes us to warranty claims, which may reduce our profitability.
We typically warrant the services we provide, guaranteeing the work performed against defects in workmanship and the material we supply. Historically, warranty claims have not been material as much of the work we perform is evaluated by our customers for defects shortly after work is completed. However, if warranty claims occur, we could be required to repair or replace warrantied items at our cost. In addition, our customers may elect to repair or replace the warrantied item by using the services of another provider. Costs incurred as a result of warranty claims could adversely affect our operating results and financial condition.
Higher fuel prices may increase our cost of doing business, and we may not be able to pass along added costs to customers.
Fuel prices fluctuate based on market events outside of our control. Most of our contracts do not allow us to adjust our pricing for higher fuel costs during a contract term and we may be unable to secure price increases reflecting rising costs when renewing or bidding contracts. As a result, higher fuel costs may negatively impact our financial condition and results of operations. Although we may hedge our anticipated fuel purchases with the use of financial instruments, underlying commodity costs have been volatile in recent periods. Accordingly, there can be no assurance that, at any given time, we will have financial instruments in place to hedge against the impact of increased fuel costs. To the extent we enter into hedge transactions, declines
11
in fuel prices below the levels established in the financial instruments may require us to make payments which could have an adverse impact on our financial condition and results of operations.
Our results of operations fluctuate seasonally.
Our revenues exhibit seasonality as a significant portion of our work is performed outdoors. Consequently, our operations are impacted by extended periods of inclement weather which are more likely to occur during the winter season, impacting our second and third fiscal quarters. Also, a disproportionate percentage of paid holidays fall within our second fiscal quarter, which decreases the number of available workdays. Additionally, our customer premise equipment installation activities for cable providers historically decrease around calendar year-end holidays as their customers generally require less activity during this period. As a result, we may experience reduced revenue in the second or third quarters of our fiscal year.
Failure to integrate future acquisitions successfully could adversely affect our business and results of operations.
As part of our growth strategy, we may acquire companies that expand, complement or diversify our business. We regularly review various opportunities and periodically engage in discussions regarding possible acquisitions. Future acquisitions may divert management's attention from our existing business and expose us to operational challenges and risks, including retaining management and other key employees; unanticipated issues in integrating information, communications and other systems; assumption of unknown liabilities or liabilities for which inadequate reserves have been established; consolidating corporate and administrative infrastructures; and failure to manage successfully and coordinate the growth of the combined company. These factors could result in increased costs, decreases in the amount of expected revenues and diversion of management's time and energy, which could materially impact our business, financial condition and results of operations.
Unanticipated changes in our tax rates or exposure to additional income and other tax liabilities could affect our profitability.
We are subject to income taxes in many different jurisdictions of the United States and Canada and certain of our tax liabilities are subject to the apportionment of income to different jurisdictions. Our effective tax rate could be adversely affected by changes in the mix of earnings in locations with differing tax rates, the valuation of deferred tax assets and liabilities or tax laws. An increase to our effective tax rate may increase our tax obligations. In addition, the amount of income and other taxes we pay is subject to ongoing audits in various jurisdictions, and a material assessment by a governing tax authority could affect our profitability.
The indenture under which our senior subordinated notes were issued and our bank credit facility impose restrictions which may prevent us from engaging in beneficial transactions.
At
July 26, 2014
, we had outstanding an aggregate principal amount of
$277.5 million
in senior subordinated notes due 2021. We also have a credit agreement with a syndicate of banks, which provides for a
$125 million
term loan and a
$275 million
revolving facility, including a sublimit of
$150 million
for the issuance of letters of credit. At
July 26, 2014
, we had
$63.0 million
of outstanding borrowings under the revolving facility,
$114.1 million
outstanding under the term loan and
$49.4
million of outstanding letters of credit issued under the credit agreement. The terms of our indebtedness contain covenants that restrict our ability to, among other things: make certain payments, including the payment of dividends; redeem or repurchase our capital stock; incur additional indebtedness and issue preferred stock; make investments or create liens; enter into sale and leaseback transactions; merge or consolidate with another entity; sell certain assets; and enter into transactions with affiliates. In addition, the credit agreement requires us to comply with a consolidated leverage ratio and a consolidated interest coverage ratio. A default under our credit agreement or the indenture governing the senior subordinated notes could result in the acceleration of our obligations under either or both of those instruments as a result of cross acceleration and cross default provisions. In addition, these covenants may prevent us from engaging in transactions that benefit us, including responding to changing business and economic conditions or securing additional financing, if needed.
Many of our telecommunications customers are highly regulated, and new regulations or changes to existing regulations may adversely impact their demand for and the profitability of our specialty contracting service.
Many of our telecommunications customers are regulated by the Federal Communications Commission ("FCC"). The FCC may alter its application of current regulations and may impose additional regulations. If existing or new regulations have an adverse affect on our telecommunications customers and adversely impact the profitability of the services they provide, our customers may reduce expenditures which could impact the demand for specialty contracting services.
We may incur liabilities or suffer negative financial impact relating to occupational health and safety matters.
Our operations are subject to stringent laws and regulations governing workplace safety. Our workers frequently operate heavy machinery and work near high voltage lines. As a result, they and others are subject to potential injury and death. If any of our workers or any other persons are injured or killed in the course of our operations, we could be found to have violated relevant safety regulations, which could result in a fine or, in extreme cases, criminal sanction. In addition, if our safety record were to substantially deteriorate over time, customers could decide to cancel our contracts or not award us future business.
12
Our failure to comply with environmental laws could result in significant liabilities.
A significant portion of the work we perform is associated with the underground networks of our customers. We could be subject to potential material liabilities in the event we cause or are responsible for a release of hazardous substances or other environmental damage resulting from underground objects we encounter. Additionally, the environmental laws and regulations which relate to our business include those regarding the removal and remediation of hazardous substances. These laws and regulations can impose significant fines and criminal sanctions for violations. Costs associated with the discharge of hazardous substances may include clean-up costs and related damages or liabilities. These costs could be significant and could adversely affect our results of operations and cash flows. In addition, new laws and regulations, altered enforcement of existing laws and regulations, the discovery of previously unknown contamination or leaks, or the imposition of new clean-up requirements could require us to incur significant costs or create new or increased liabilities that could harm our financial condition and results of operations.
We may not have access in the future to sufficient funding to finance desired growth.
Using cash for operational growth, capital expenditures, share repurchases, or acquisitions may limit our financial flexibility and make us more likely to seek additional capital through future debt or equity financings. Our existing debt agreements contain significant restrictions on our operational and financial flexibility, including our ability to incur additional debt. Also, if we seek to incur more debt, we may be required to agree to additional covenants that further limit our operational and financial flexibility. If we pursue additional debt or equity financings, we cannot be certain that such funding will be available on terms acceptable to us or at all.
Our capital expenditures may fluctuate as a result of changes in business requirements.
Our anticipated capital expenditure requirements may vary from time to time as a result of changes in our business. Increased capital expenditures will use cash flow and may increase our borrowing costs if cash for capital expenditures is not available from operations.
Increases in our health insurance costs could adversely impact our results of operations and cash flows.
The costs of employee health care insurance have been increasing in recent years due to rising health care costs, legislative changes, and general economic conditions. Additionally, we may incur additional costs as a result of the Patient Protection and Affordable Care Act and the Health Care and Education Reconciliation Act of 2010 (collectively, the "Health Care Reform Laws") that were signed into law in March 2010. A continued increase in health care costs or additional costs incurred as a result of the Health Care Reform Laws could have a negative impact on our financial position and results of operations.
Several of our subsidiaries participate in multiemployer pension plans, which under certain circumstances could result in material liabilities being incurred.
Pursuant to collective bargaining agreements, several of our subsidiaries participate in various multiemployer pension plans that generally provide defined pension benefits to covered employees. Because of the nature of multiemployer plans, there are risks associated with participation in these plans that differ from single-employer plans. Assets contributed by an employer to a multiemployer plan are not segregated into a separate account and are not restricted to provide benefits only to employees of that contributing employer. Under the Employee Retirement Income Security Act, absent an applicable exception, a contributing employer to an underfunded multiemployer plan is liable upon termination or withdrawal from a plan, for its proportionate share of the plan's unfunded vested liability. We currently have no intention of withdrawing from any multiemployer plan in which we participate. However, a future withdrawal from a multiemployer pension plan in which we participate could result in a material withdrawal liability to the extent that any unfunded vested liability under such plan is allocable to the Company. In addition, if any of the plans in which we participate becomes underfunded as defined by the Pension Protection Act of 2006, we may be required to make additional cash contributions related to the underfunding of those plans.
Failure to adequately protect critical data and technology systems could materially affect our operations.
We use our own information technology systems as well as those of our business partners to maintain certain data and provide reports. Our measures protecting these systems may be compromised as a result of third-party security breaches, employee error, malfeasance or other irregularity, and may result in persons obtaining unauthorized access to our or our customers' data or accounts. The occurrence of any such event could have a material adverse effect on our business.
The market price of our common stock has been, and may continue to be, highly volatile.
During
fiscal 2014
, our common stock fluctuated from a high of
$33.52
per share to a low of
$24.77
per share. We may continue to experience significant volatility in the market price of our common stock due to numerous factors, including, but not limited to:
•
fluctuations in our operating results or the operating results of one or more of our competitors;
•
announcements by us or our competitors of significant contracts, acquisitions or capital commitments;
•
changes in recommendations or earnings estimates by securities analysts; and
•
the impact of economic conditions on the credit and stock markets and on our customers’ demand for our services.
13
In addition, factors unrelated to our operating performance, such as market disruptions, industry outlook, general economic conditions, and political events, could decrease the market price of our common stock and, as a result, investors could lose some or all of their investments.
Anti-takeover provisions of Florida law and provisions in our articles of incorporation and by-laws could make it more difficult to effect an acquisition of our company or a change in our control.
Certain provisions of our articles of incorporation and by-laws could delay or prevent an acquisition or change in control and the replacement of our incumbent directors and management. For example, our board of directors is divided into three classes. At any annual meeting of our shareholders, our shareholders only have the right to appoint approximately one-third of the directors on our board of directors. In addition, our articles of incorporation authorize our board of directors, without further shareholder approval, to issue up to 1,000,000 shares of preferred stock on such terms and with such rights as our board of directors may determine. The issuance of preferred stock could dilute the voting power of the holders of common stock, including by the grant of voting control to others. Our by-laws also restrict the right of stockholders to call a special meeting of stockholders. Lastly, we are subject to certain anti-takeover provisions of the Florida Business Corporation Act. These anti-takeover provisions could discourage or prevent a change in control.
Item 1B.
Unresolved Staff Comments.
None.
Item 2.
Properties.
We lease our executive offices located in Palm Beach Gardens, Florida. Our subsidiaries operate from owned or leased administrative offices, district field offices, equipment yards, shop facilities, and temporary storage locations throughout the United States and Canada. Our leased properties operate under both non-cancellable and cancellable leases. We believe that our facilities are adequate for our current operations and additional facilities would be available on commercially reasonable terms, if necessary.
Item 3.
Legal Proceedings.
In October 2012, a former employee of UtiliQuest, LLC ("UtiliQuest"), a wholly-owned subsidiary of the Company, commenced a lawsuit against UtiliQuest in the Superior Court of California. The lawsuit alleges that UtiliQuest violated the California Labor Code, the California Business & Professions Code and the Labor Code Private Attorneys General Act of 2004 by failing to pay for all hours worked (including overtime) and failing to provide meal breaks and accurate wage statements. The plaintiff seeks unspecified damages and other relief on behalf of himself and a putative class of current and former employees of UtiliQuest who worked as locators in the State of California in the four years preceding the filing date of the lawsuit. In January 2013, UtiliQuest removed the case to the United States District Court for the Northern District of California and the plaintiff subsequently filed a Motion to Remand the case back to the California Superior Court. In April 2013, the parties exchanged initial disclosures and in July 2013, the District Court granted plaintiff's Motion to Remand. UtiliQuest filed its second removal of the case to the District Court in October 2013. On January 8, 2014, the District Court remanded the matter back to the California Superior Court. In July 2014, the plaintiff’s attorney and UtiliQuest entered into a memorandum of understanding pursuant to which the parties agreed to the terms of a proposed settlement of the lawsuit. Approval of the proposed settlement by the Court is currently pending. As of July 26, 2014, $0.6 million was included in other accrued liabilities with respect to the settlement.
As disclosed elsewhere in this Annual Report on Form 10-K, we have filed construction liens with respect to approximately $17.7 million for past due balances from a customer on a rural project funded primarily by the Rural Utilities Service agency of the United States Department of Agriculture (the “RUS”) under the American Recovery and Reinvestment Act of 2009. In April 2014, R&R Taylor Construction, Inc. ("R&R"), a construction company, filed suit against this customer alleging that the customer failed to pay for construction services and materials. In its lawsuit, the construction company seeks to foreclose on its construction lien and, ultimately, to foreclose on the parcel of land itself. Pauley Construction, Inc. (“Pauley”), one of our wholly-owned subsidiaries, had performed work on this parcel as part of its work on the rural project described above. Pauley has filed a construction lien on the parcel with respect to past due accounts receivable relating to this project. In July 2014, R&R amended its lawsuit to include Pauley, alleging that its lien has priority over Pauley’s construction lien. Pauley has filed an answer to this amended complaint in the Montana Eighteenth Judicial District Court, a counterclaim against the construction company and a cross-claim against the customer, alleging that Pauley’s lien is superior to all other liens on such parcel of land. It is too early to evaluate the likelihood of an outcome to this matter. We intend to vigorously defend ourselves against this lawsuit as part of ongoing efforts to collect the past due amounts from this customer.
14
From time to time, we are party to various other claims and legal proceedings. It is the opinion of management, based on information available at this time, that such other pending claims or proceedings will not have a material effect on our financial statements.
Item 4.
Mine Safety Disclosures.
Not applicable.
Item 5.
Market for Registrant's Common Equity, Related Stockholder Matters and Issuer Purchases of Equity Securities.
Market Information for Our Common Stock
Our common stock is traded on the New York Stock Exchange ("NYSE") under the symbol "DY". The following table shows the range of high and low closing sales prices for each quarter within the last two fiscal years as reported on the NYSE:
|
Fiscal 2014
|
Fiscal 2013
|
||||||||||||||
|
High
|
Low
|
High
|
Low
|
||||||||||||
|
First Quarter
|
$
|
31.39
|
|
$
|
24.77
|
|
$
|
19.38
|
|
$
|
13.09
|
|
|||
|
Second Quarter
|
$
|
30.50
|
|
$
|
27.05
|
|
$
|
21.51
|
|
$
|
14.20
|
|
|||
|
Third Quarter
|
$
|
33.52
|
|
$
|
25.05
|
|
$
|
21.88
|
|
$
|
18.25
|
|
|||
|
Fourth Quarter
|
$
|
32.81
|
|
$
|
27.98
|
|
$
|
26.77
|
|
$
|
18.47
|
|
|||
Holders
As of September 5, 2014, there were approximately 554 holders of record of our $0.33 1/3 par value per share common stock.
Dividend Policy
We have not paid cash dividends since 1982. Our Board of Directors regularly evaluates our dividend policy based on our financial condition, profitability, cash flow, capital requirements, and the outlook of our business. We currently intend to retain any earnings for use in the business, including for investment in acquisitions, and consequently we do not anticipate paying any cash dividends on our common stock in the foreseeable future. Additionally, the indenture governing our senior subordinated notes contains covenants that restrict our ability to make certain payments, including the payment of dividends.
Securities Authorized for Issuance Under Equity Compensation Plans
The information required by this item is hereby incorporated by reference from our definitive proxy statement to be filed with the SEC pursuant to Regulation 14A.
15
Issuer Purchases of Equity Securities During the Fourth Quarter of
Fiscal 2014
The following table summarizes the Company's purchases of its common stock during the
three months ended
July 26, 2014
:
|
Period
|
Total Number of Shares Purchased
|
|
Average Price Paid Per Share
|
|
Total Number of Shares Purchased as Part of Publicly Announced Plans or Programs
|
|
Maximum Number of Shares that May Yet Be Purchased Under the Plans or Programs
|
|||||
|
April 27, 2014 - May 24, 2014
|
6,409 (a)
|
|
$
|
29.90
|
|
|
—
|
|
|
(b)
|
||
|
May 25, 2014 - June 21, 2014
|
—
|
|
—
|
|
|
—
|
|
|
(b)
|
|||
|
June 22, 2014 - July 26, 2014
|
—
|
|
—
|
|
|
—
|
|
|
(b)
|
|||
|
(a)
|
Shares were withheld to satisfy tax withholding obligations that arose on the vesting of restricted stock units. All shares repurchased have been canceled. The shares withheld for tax withholdings do not reduce the Company's total share repurchase authority.
|
|
(b)
|
On August 27, 2013, the Board of Directors authorized
$40.0 million
to repurchase shares of the Company's outstanding common stock over the subsequent eighteen months in open market or private transactions. As of
July 26, 2014
,
$30.0 million
authorization remained available for repurchases through February 2015.
|
Performance Graph
The performance graph below compares the cumulative total returns for our common stock against the cumulative total return (including reinvestment of dividends) of the Standard & Poor’s (S&P) 500 Composite Stock Index and two different peer group indices, the "Old Peer Group" and the "New Peer Group," for the last five fiscal years, assuming an investment of $100 in our common stock and each of the respective indices noted on July 25, 2009. The Old Peer Group includes MasTec, Inc., Quanta Services, Inc., Pike Electric Corporation, MYR Group, Inc., and Willbros Group, Inc. The New Peer Group includes MasTec, Inc., Quanta Services, Inc., MYR Group, Inc., and Willbros Group, Inc. The Company has elected to change its peer group because it believes the New Peer Group is more representative of the companies perceived by investors as specialty contractors and therefore provides a more meaningful comparison of stock performance. The comparisons in the graph are required by the Securities and Exchange Commission and are not intended to forecast or be indicative of possible future performance of our common stock.
16
COMPARISON OF 5 YEAR CUMULATIVE TOTAL RETURN*
Among Dycom Industries, Inc., the S&P 500 Index, Old Peer Group and New Peer Group
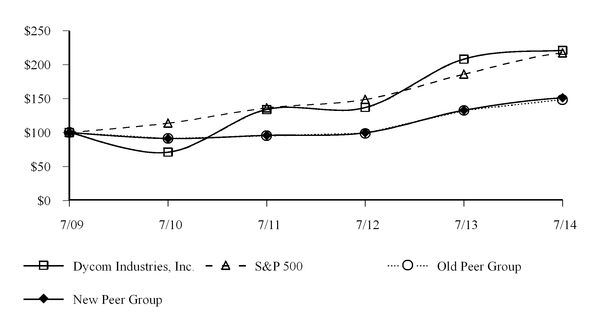
_____________
*$100 invested on 7/31/09 in stock or index, including reinvestment of dividends. Fiscal year ending July 31.
Copyright © 2014 S&P, a division of The McGraw-Hill Companies Inc. All rights reserved.
Item 6.
Selected Financial Data.
We use a fiscal year ending on the last Saturday in July. Fiscal 2014, 2013, 2012 and 2011 consisted of 52 weeks while fiscal 2010 consisted of 53 weeks. The following selected financial data is derived from the audited consolidated financial statements for the applicable fiscal year.
Amounts set forth in our selected financial data include the results and balances of acquired companies from their respective date of acquisition. This data should be read in conjunction with our consolidated financial statements and notes thereto, and with Item 7,
Management's Discussion and Analysis of Financial Condition and Results of Operations
.
|
Fiscal Year
|
|||||||||||||||||||
|
2014 (1)
|
2013 (2)
|
2012
|
2011 (3)
|
2010 (4)
|
|||||||||||||||
|
(Dollars in thousands, except per share amounts)
|
|||||||||||||||||||
|
Operating Data:
|
|||||||||||||||||||
|
Revenues
|
$
|
1,811,593
|
|
$
|
1,608,612
|
|
$
|
1,201,119
|
|
$
|
1,035,868
|
|
$
|
988,623
|
|
||||
|
Net income
|
$
|
39,978
|
|
$
|
35,188
|
|
$
|
39,378
|
|
$
|
16,107
|
|
$
|
5,849
|
|
||||
|
Earnings Per Common Share:
|
|||||||||||||||||||
|
Basic
|
$
|
1.18
|
|
$
|
1.07
|
|
$
|
1.17
|
|
$
|
0.46
|
|
$
|
0.15
|
|
||||
|
Diluted
|
$
|
1.15
|
|
$
|
1.04
|
|
$
|
1.14
|
|
$
|
0.45
|
|
$
|
0.15
|
|
||||
|
Balance Sheet Data (at end of period):
|
|||||||||||||||||||
|
Total assets
|
$
|
1,212,354
|
|
$
|
1,154,208
|
|
$
|
772,193
|
|
$
|
724,755
|
|
$
|
679,556
|
|
||||
|
Long-term liabilities (5)
|
$
|
530,888
|
|
$
|
526,032
|
|
$
|
264,699
|
|
$
|
254,391
|
|
$
|
187,798
|
|
||||
|
Stockholders' equity (6)
|
$
|
484,934
|
|
$
|
428,361
|
|
$
|
392,931
|
|
$
|
351,851
|
|
$
|
394,555
|
|
||||
|
(1)
|
During the third quarter of fiscal 2014, we acquired a telecommunications specialty construction contractor in Canada. We also acquired Watts Brothers Cable Construction, Inc. during the fourth quarter of fiscal 2014.
|
17
|
(2)
|
On December 3, 2012, we acquired substantially all of the telecommunications infrastructure services subsidiaries (the "Acquired Subsidiaries") of Quanta Services, Inc. Additionally, during the fourth quarter of fiscal 2013, we acquired Sage Telecommunications Corp. of Colorado, LLC and certain assets of a tower construction and maintenance company. In connection with the businesses acquired in fiscal 2013, we recognized approximately $6.8 million and $3.4 million of pre-tax acquisition and integration costs, respectively, during fiscal 2013 which are included within general and administrative expenses. We also recognized $0.3 million in pre-tax write-off of deferred financing costs during the second quarter of fiscal 2013 in connection with the replacement of our prior credit agreement.
|
|
(3)
|
During the second quarter of fiscal 2011, we acquired Communication Services, Inc. and NeoCom Solutions, Inc. Additionally, during fiscal 2011, we recognized debt extinguishment costs consisting of (a) $6.0 million in tender premiums and legal and professional fees associated with the tender offer to purchase the $135.35 million outstanding aggregate principal amount of our 8.125% senior subordinated notes due 2015 (the "2015 Notes") and the subsequent redemption of the remaining balance of the 2015 Notes not tendered for purchase; and (b) $2.3 million in deferred debt issuance costs that were written off as a result of the completion of the tender offer and redemption.
|
|
(4)
|
During the first quarter of fiscal 2010, we recognized a non-cash income tax charge of $1.1 million for a valuation allowance on a deferred tax asset associated with an investment that became impaired for tax purposes.
|
|
(5)
|
During fiscal 2011, we issued $187.5 million aggregate principal amount of 7.125% senior subordinated notes due 2021 in a private placement. A portion of the net proceeds was used to fund a tender offer and redemption of the $135.35 million outstanding aggregate principal amount of the 2015 Notes. On December 12, 2012, an additional $90.0 million in aggregate principal amount of 7.125% senior subordinated notes due 2021 were issued. The net proceeds of this issuance were used to repay a portion of the borrowings under our new credit facility. On December 3, 2012, we entered into a new, five-year credit agreement with various lenders which matures in December 2017. The credit agreement provides for a $275 million revolving facility, a $125 million term loan and contains a sublimit of $150 million for the issuance of letters of credit. See Note 10,
Debt
, in Notes to the Consolidated Financial Statements.
|
|
(6)
|
We repurchased 360,900 shares of our common stock in fiscal 2014 for $10.0 million at an average price of $27.71 per share, 1,047,000 shares of our common stock in fiscal 2013 for $15.2 million at an average price of $14.52 per share, 597,700 shares of our common stock in fiscal 2012 for $13.0 million at an average price of $21.68 per share, 5,389,500 shares of our common stock in fiscal 2011 for $64.5 million at an average price of $11.98 per share and 475,602 shares of our common stock in fiscal 2010 for $4.5 million at an average price of $9.44 per share.
|
Item 7.
Management’s Discussion and Analysis of Financial Condition and Results of Operations.
The following discussion and analysis should be read in conjunction with our consolidated financial statements and the accompanying notes thereto, as well as Part I, Item 1,
Business
,
and Part II, Item 1A,
Risk Factors
,
of this Annual Report on Form 10-K.
Introduction
We are a leading provider of specialty contracting services throughout the United States and in Canada. Our services are provided on a decentralized basis through our subsidiary companies and include engineering, construction, maintenance and installation services to telecommunications providers, underground facility locating services to various utilities, including telecommunications providers, and other construction and maintenance services to electric and gas utilities and others. Our subsidiaries provide the labor, tools and equipment necessary to design, engineer, locate, maintain, expand, install and upgrade the telecommunications infrastructure of our customers.
The telecommunications industry has undergone and continues to undergo significant changes due to advances in technology, increased competition as the telephone and cable companies have converged, growing consumer demand for enhanced and bundled services, and rural broadband funding through government programs. As a result of these factors, the networks of our customers increasingly face demands for more capacity and greater reliability. Telecommunications providers continue to outsource a significant portion of their engineering, construction, maintenance, and installation requirements in order to reduce their investment in capital equipment, provide flexibility in workforce sizing, expand product offerings without large increases in incremental hiring, and focus on those competencies they consider core to their business success. These factors drive customer demand for our services.
18
Demand for our services may be impacted by the cyclical nature of the industry we serve. Our revenues and results of operations are influenced by the capital expenditure and maintenance budgets of our customers, including seasonal budgetary spending patterns and timing of their budget approvals, as well as the timing and volume of customers' construction and maintenance projects. The capital expenditures and maintenance budgets of our telecommunications customers may be impacted by consumer and business demands on telecommunications providers, the introduction of new communication technologies, the physical maintenance needs of their infrastructure, the actions of our government and the Federal Communications Commission, and overall economic conditions. Changes in our mix of customers, contracts and business activities, as well as changes in the general level of construction activity also drive cyclical variations in revenues and results of operations.
Customer Relationships and Contractual Arrangements
We have established relationships with many leading telephone companies, cable television multiple system operators, telecommunication equipment and infrastructure providers, and electric and gas utilities and other. Our customer base is highly concentrated, with our top five customers accounting for approximately
58.3%
,
58.5%
and
59.6%
of our total revenues in fiscal
2014
,
2013
and
2012
, respectively. The following reflects the percentage of total revenue from those customers who contributed at least 2.5% to our total revenue in
fiscal 2014
,
2013
or
2012
:
|
|
Fiscal Year Ended
|
||||
|
|
2014
|
2013
|
2012
|
||
|
AT&T Inc.
|
19.2%
|
15.5%
|
13.7%
|
||
|
CenturyLink, Inc.
|
13.8%
|
14.6%
|
13.6%
|
||
|
Comcast Corporation
|
11.7%
|
10.9%
|
12.6%
|
||
|
Verizon Communications Inc.
|
8.2%
|
9.6%
|
11.3%
|
||
|
Time Warner Cable Inc.
|
5.5%
|
4.5%
|
4.6%
|
||
|
Windstream Corporation
|
5.3%
|
7.9%
|
8.4%
|
||
|
Charter Communications, Inc.
|
4.5%
|
5.7%
|
6.5%
|
||
In addition, another customer contributed
3.2%
to our total revenue during
fiscal 2014
. There was an immaterial amount of revenue derived from this customer during
fiscal 2013
and
fiscal 2012
.
We generally have multiple agreements with each of our significant customers. To the extent that such agreements specify exclusivity, there are often a number of exceptions, including the ability of the customer to issue work orders valued above a specified dollar amount to other service providers, the performance of work with the customer's own employees, and the use of other service providers when jointly placing facilities with another utility. In most cases, a customer may terminate an agreement for convenience with written notice. Historically, master service agreements have been awarded primarily through a competitive bidding process; however, occasionally we are able to extend some of these agreements on a negotiated basis. Revenues from multi-year master service agreements were
65.2%
,
65.2%
and
70.3%
as a percentage of total contract revenues during
fiscal 2014
,
2013
and
2012
, respectively.
The remainder of our services are provided pursuant to contracts for specific projects. Other long-term contracts relate to specific projects with terms in excess of one year from the contract date. Revenues from other long-term contracts were
13.7%
,
11.8%
and
10.3%
as a percentage of total contract revenues during
fiscal 2014
,
2013
and
2012
, respectively. The percentage of revenue from long-term contracts varies from period to period depending on the mix of work performed. Short-term contracts for specific projects are generally three to four months in duration. A portion of our contracts include retainage provisions by which 5% to 10% of the invoiced amounts may be withheld by the customer pending project completion.
Acquisitions
As part of our growth strategy, we may acquire companies that expand, complement or diversify our business. We regularly review opportunities and periodically engage in discussions regarding possible acquisitions. Our ability to sustain our growth and maintain our competitive position may be affected by our ability to identify, acquire, and successfully integrate companies.
Fiscal 2013
- On December 3, 2012, we acquired substantially all of the telecommunications infrastructure services subsidiaries (the "Acquired Subsidiaries") of Quanta Services, Inc. for the sum of
$275.0 million
in cash, an adjustment of
19
approximately
$40.4 million
for working capital received in excess of a target amount and approximately
$3.7 million
for other specified items. We recognized approximately
$6.5 million
of acquisition costs during
fiscal 2013
related to the acquisition of the Acquired Subsidiaries, which are included within general and administrative expenses. The Acquired Subsidiaries provide specialty contracting services, including engineering, construction, maintenance and installation services to telecommunications providers, and other construction and maintenance services to electric and gas utilities and others. Principal business facilities are located in Arizona, California, Florida, Georgia, Minnesota, New York, Pennsylvania and Washington.
During the fourth quarter of fiscal 2013, we acquired Sage Telecommunications Corp. of Colorado, LLC ("Sage"). Sage provides telecommunications construction and project management services primarily for cable operators in the Western United States. Additionally, during the fourth quarter of fiscal 2013 we acquired certain assets of a tower construction and maintenance company.
Fiscal 2014
- During the third quarter of fiscal 2014, we acquired a telecommunications specialty construction contractor in Canada for
$0.7 million
. We also acquired Watts Brothers Cable Construction, Inc. ("Watts Brothers") for
$16.4 million
during the fourth quarter of fiscal 2014. Watts Brothers provides specialty contracting services primarily for telecommunication and cable operators in the Midwest and Southeastern United States. Purchase price allocations of businesses acquired during fiscal 2014 are preliminary and will be completed during fiscal 2015 when the valuations for intangible assets and other amounts are finalized.
Understanding Our Results of Operations
The following information is presented in order for the reader to better understand certain factors impacting our results of operations and profitability and should be read in conjunction with
Critical Accounting Policies and Estimates
below as well as Note 1,
Accounting Policies
, in the Notes to the Consolidated Financial Statements in this Annual Report on Form 10-K.
Revenues.
We recognize revenues under the percentage of completion method of accounting as more fully described within
Critical Accounting Policies and Estimates
below.
Cost of Earned Revenues.
Cost of earned revenues includes all direct costs of providing services under our contracts, including costs for direct labor provided by employees, services by independent subcontractors, operation of capital equipment (excluding depreciation and amortization), direct materials, other direct costs and insurance claims. For insurance claims, we retain the risk of loss, up to certain limits, related to automobile liability, general liability, workers' compensation, employee group health, and damages relating to underground facility locating services. A change in claims experience or actuarial assumptions related to these risks could materially affect our results of operations.
General and Administrative Expenses
. General and administrative expenses primarily consist of employee compensation and related expenses, including stock-based compensation, legal, consulting and professional fees, information technology and development costs, provision for or recoveries of bad debt expense, acquisition and integration costs of businesses acquired, and other costs that are not directly related to the provision of our services under customer contracts. Our senior management, including the senior managers of our subsidiaries, perform substantially all of our sales and marketing functions as part of their management responsibilities and, accordingly, we have not incurred material sales and marketing expenses. Information technology and development costs included in general and administrative expenses are primarily incurred to support and to enhance our operating efficiency. To protect our rights, we have filed for patents on certain of our innovations.
Depreciation and Amortization
. Our property and equipment primarily consists of vehicles, equipment and machinery, and computer hardware and software. Property and equipment is depreciated on a straight-line basis over their estimated useful lives. In addition, certain of our reporting units have intangible assets, including customer relationships, contract backlog, trade names, and non-compete intangibles, which are amortized over their estimated useful lives.
Interest Expense, Net and Other Income, Net.
Interest expense, net, consists of interest expense on outstanding debt obligations, amortization of deferred financing costs and other interest expense. Other income, net, primarily consists of gains or losses from sales of fixed assets.
Seasonality and Quarterly Fluctuations.
Our revenues and results of operations exhibit seasonality as a significant portion of our work is performed outdoors. Consequently, our operations are impacted by extended periods of adverse weather which are more likely to occur during the winter season, impacting our second and third fiscal quarters. Several of the businesses acquired during fiscal 2013 are located and perform work in geographies more prone to cold weather, further impacting seasonal variations during our second and third fiscal quarters. Also, a disproportionate percentage of paid holidays fall within
20
our second quarter, which decreases the number of available workdays. Additionally, our customer premise equipment installation activities for cable providers historically decrease around the calendar year-end holidays as their customers generally require less activity during this period. As a result of these factors, we may experience reduced revenue and profitability in the second and/or third quarters of our fiscal year. During the second and third quarters of fiscal 2014, we experienced the impact of such adverse weather conditions, which negatively impacted productivity and our results for those periods.
We have experienced and expect to continue to experience quarterly variations in revenues and results of operations as a result of other factors as well. Such factors include fluctuations in insurance expense due to changes in claims experience and actuarial assumptions, variances in incentive pay and stock-based compensation expense a result of operating results and vesting provisions, and changes in the employer portion of payroll taxes as a result of reaching the limitation on payroll withholdings obligations. Other factors that may contribute to quarterly variations in results of operations include interest expense due to levels of borrowings, other income as a result of the timing and levels of capital assets sold during the period, and income tax expense due to levels of taxable earnings, the impact of non-deductible items and tax credits, and the impact of disqualifying dispositions of incentive stock option expenses.
Accordingly, operating results for any fiscal period are not necessarily indicative of results that may be achieved for any subsequent fiscal period.
Critical Accounting Policies and Estimates
The discussion and analysis of our financial condition and results of operations is based on our consolidated financial statements, which have been prepared in accordance with accounting principles generally accepted in the United States of America ("GAAP"). The preparation of these financial statements in conformity with GAAP requires management to make estimates and assumptions that affect the amounts reported in these consolidated financial statements and accompanying notes. These estimates and assumptions require the use of judgment as to the likelihood of various future outcomes and, as a result, actual results could differ materially from these estimates.
We have identified the accounting policies below as critical to the accounting for our business operations and the understanding of our results of operations because they involve making significant judgments and estimates that are used in the preparation of our consolidated financial statements. The impact of these policies affect our reported and expected financial results and are discussed below. We have discussed the development, selection and application of our critical accounting policies with the Audit Committee of our Board of Directors, and the Audit Committee has reviewed the disclosure relating to our critical accounting policies herein.
Other significant accounting policies, primarily those with lower levels of uncertainty than those discussed below, are also important to understanding our consolidated financial statements. The Notes to Consolidated Financial Statements in this Annual Report on Form 10-K contain additional information related to our accounting policies, including the critical accounting policies described herein, and should be read in conjunction with this discussion.
Revenue Recognition.
We recognize revenues under the percentage of completion method of accounting using the units-of-delivery or cost-to-cost measures. A majority of our services are performed under master service agreements with customers which contain customer-specified service requirements, such as discrete pricing for individual tasks. Revenue is recognized under these arrangements based on units-of-delivery and revenue is recognized as each unit is completed. There were no material amounts of unapproved change orders or claims recognized during
fiscal 2014
,
2013
or
2012
. Revenues from contracts using the cost-to-cost measures of completion are recognized based on the ratio of contract costs incurred to date to total estimated contract costs and represented less than 10% of our contract revenues during each of
fiscal 2014
,
2013
and
2012
. In addition, we have an immaterial amount of revenue for services provided under time and material contracts that are recognized as the work is performed. The current asset "Costs and estimated earnings in excess of billings" represents revenues recognized in excess of amounts billed. The current liability "Billings in excess of costs and estimated earnings" represents billings in excess of revenues recognized.
Application of the percentage of completion method of accounting requires the use of estimates of costs to be incurred for the performance of the contract. The cost estimation process is based on the knowledge and experience of our project managers and financial professionals. Factors that we consider in estimating the work to be completed and ultimate contract recovery include the availability and productivity of labor, the nature and complexity of the work to be performed, the effect of change orders, the availability of materials, the effect of any delays in performance and the recoverability of any claims. Changes in job performance, job conditions, estimated profitability and final contract settlements may result in changes to costs and income and their effects are recognized in the period in which the revisions are determined. At the time a loss on a contract
21
becomes known, the entire amount of the estimated ultimate loss is accrued. For
fiscal 2014
,
2013
and
2012
, there have been no material changes in estimates for amounts in the consolidated financial statements.
Allowance for Doubtful Accounts.
We grant credit under normal payment terms, generally without collateral, to our customers. We maintain an allowance for doubtful accounts for estimated losses resulting from the failure of our customers to make required payments. With respect to certain customers, we have statutory lien rights which may assist in our collection efforts. Management analyzes the collectability of accounts receivable balances each period. This analysis considers the aging of account balances, historical bad debt experience, changes in customer creditworthiness, current economic trends, customer payment activity and other relevant factors. Should any of these factors change, the estimate made by management may also change, which could affect the level of our future provision for doubtful accounts. We recognize an increase in the allowance for doubtful accounts when it is probable that a receivable is not collectible and the loss can be reasonably estimated. Any increase in the allowance account has a corresponding negative effect on our results of operations.
Accrued Insurance Claims.
Within our insurance program, we retain the risk of loss, up to certain limits, for claims related to automobile liability, general liability, workers' compensation, employee group health, and damages relating to underground facility locating services. We have established reserves that we believe to be adequate based on current evaluations and our experience with these types of claims. A liability for unpaid claims and the associated claim expenses, including incurred but not reported losses, is determined with the assistance of an actuary and reflected in the consolidated financial statements as accrued insurance claims. The effect on our financial statements is generally limited to the amount needed to satisfy our insurance deductibles or retentions. The liability for accrued claims and related accrued processing costs was
$66.0 million
and
$56.3 million
at
July 26, 2014
and
July 27, 2013
, respectively, and included incurred but not reported losses of approximately
$32.1 million
and
$26.0 million
, respectively. Based on prior payment patterns for similar claims,
$32.3 million
and
$29.1 million
of the amounts accrued at
July 26, 2014
and
July 27, 2013
, respectively, were expected to be paid within the next twelve months.
We estimate the liability for claims based on facts, circumstances and historical evidence. When loss reserves are recorded they are not discounted, even though they will not be paid until sometime in the future. Factors affecting the determination of the expected cost for existing and incurred but not reported claims include, but are not limited to, the estimated number of future claims, the payment pattern of claims which have been incurred, changes in the medical condition of claimants, and other factors such as inflation, tort reform or other legislative changes, unfavorable jury decisions and court interpretations.
With regard to losses occurring in fiscal 2012 through fiscal 2014, we retain the risk of loss of up to $1.0 million on a per occurrence basis for automobile liability, general liability and workers' compensation. We have maintained this same level of retention for fiscal 2015. These retention amounts are applicable to all of the states in which we operate, except with respect to workers' compensation insurance in two states in which we participate in a state sponsored insurance fund. Aggregate stop loss coverage for automobile liability, general liability and workers' compensation claims is
$56.3 million
for
fiscal 2014
and
$59.5 million
for
fiscal 2015
. The risk of loss for insured claims of the Acquired Subsidiaries, including those incurred but not reported, as of the date of acquisition has been retained by Quanta Services, Inc.
We are party to a stop-loss agreement for losses under our employee group health plan. We retain the risk of loss, on an annual basis, of the first $250,000 of claims per participant. In addition, we retain the risk of loss for the first $550,000 of claim amounts that aggregate across all participants having claims that exceed $250,000.
Stock-Based Compensation.
Our stock-based award programs are intended to attract, retain and reward talented employees, officers and directors, and to align stockholder and employee interests. We have granted stock-based awards under our 2012 Long-Term Incentive Plan ("2012 Plan"), 2003 Long-Term Incentive Plan ("2003 Plan") and 2007 Non-Employee Directors Equity Plan ("2007 Directors Plan" and, together with the 2012 Plan and 2003 Plan, the "Plans"). In addition, awards are outstanding under other plans under which no further awards will be granted. Our policy is to issue new shares to satisfy equity awards under the Plans. The Plans provide for several types of stock-based awards, including stock options, restricted shares, performance shares, restricted share units, performance share units, and stock appreciation rights. The total number of shares available for grant under the Plans as of
July 26, 2014
was
1,433,653
.
Compensation expense for stock-based awards is based on the fair value at the measurement date and is included in general and administrative expenses in the consolidated statements of operations. The fair value of time-based restricted share units ("RSUs") and performance-based restricted share units ("Performance RSUs") is estimated on the date of grant and is generally equal to the closing stock price on that date. RSUs and Performance RSUs are settled in one share of the our common stock upon vesting. RSUs vest ratably over a period of four years and generally, upon each annual vesting, 50% of the newly vested shares (net of any shares used to satisfy tax withholding obligations) are restricted from sale or transferability ("restricted holdings"). The restrictions on sale or transferability of the restricted holdings will end 90 days after termination of
22
employment of the holder. When the holder has accumulated restricted holdings having a value equal to or greater than the holder’s annual base salary then in effect, future grants will no longer be subject to the restriction on transferability. Performance RSUs vest over a period of three years from the date of grant if certain performance goals are achieved. The performance targets are based on our fiscal year operating earnings (adjusted for certain amounts) as a percentage of contract revenues and our fiscal year operating cash flow level. For the fiscal 2014 performance period, the performance targets exclude amounts recorded for the amortization of intangible assets of businesses acquired in fiscal 2013. Additionally, certain awards include three-year performance goals which, if met, result in supplemental shares awarded. The three-year performance criteria required to earn supplemental awards is more difficult than that required to earn annual target awards and is based on our three-year cumulative operating earnings (adjusted for certain amounts) as a percentage of contract revenues and our three-year cumulative operating cash flow level.
The fair value of stock option grants is estimated on the date of grant using the Black-Scholes option pricing model based on certain assumptions including: expected volatility based on the historical price of our stock over the expected life of the option; the risk free rate of return based on the U.S. Treasury yield curve in effect at the time of grant for the expected term of the option; the expected life based on the period of time the options are expected to be outstanding using historical data to estimate option exercise and employee termination; and dividend yield based on our history and expectation of dividend payments. Stock options generally vest ratably over a four-year period and are exercisable over a period of up to ten years.
The total amount of stock-based compensation expense ultimately recognized is based on the number of awards that actually vest and fluctuates as a result of performance criteria for performance-based awards, as well as the vesting period of all stock-based awards. For Performance RSUs, we evaluate compensation expense quarterly and recognize expense for performance-based awards only if we determine it is probable that the performance criteria for the awards will be met. Accordingly, the amount of compensation expense recognized during any fiscal year may not be representative of future stock-based compensation expense.
Income Taxes.
We account for income taxes under the asset and liability method. This approach requires the recognition of deferred tax assets and liabilities for the expected future tax consequences of temporary differences between the carrying amounts and the tax bases of assets and liabilities. Our effective income tax rate differs from the statutory rate for the tax jurisdictions where we operate primarily as the result of the impact of state income taxes, non-deductible and non-taxable items and tax credits recognized in relation to pre-tax results. Measurement of certain aspects of our tax position is based on interpretations of tax regulations, federal and state case law and the applicable statutes. The effect of a change in tax rates on deferred tax assets and liabilities is recognized in income in the period that includes the enactment date. We record net deferred tax assets to the extent we believe these assets will more likely than not be realized. In making such determination, we consider all available positive and negative evidence, including future reversals of existing taxable temporary differences, projected future taxable income, tax planning strategies and recent financial operations. In the event we determine that we would be able to realize deferred income tax assets in the future in excess of their net recorded amount, we would make an adjustment to the valuation allowance, which would reduce the provision for income taxes.
In the normal course of business, tax positions exist for which the ultimate outcome is uncertain. ASC Topic 740,
Income Taxes
("ASC Topic 740") prescribes a two-step process for the financial statement recognition and measurement of income tax positions taken or expected to be taken in an income tax return. The first step involves an evaluation of the underlying tax position based solely on technical merits (such as tax law) and the second step involves measuring the tax position based on the probability of it being sustained in the event of a tax examination. We recognize tax benefits at the largest amount that it deems more likely than not will be realized upon ultimate settlement of any tax uncertainty. Tax positions that fail to qualify for recognition are recognized in the period in which the more-likely-than-not standard has been reached, when the tax positions are resolved with the respective taxing authority or when the statute of limitations for tax examination has expired. We recognize interest related to unrecognized tax benefits in interest expense and penalties in general and administrative expenses.
Contingencies and Litigation.
In the ordinary course of our business, we are involved in certain legal proceedings. ASC Topic 450,
Contingencies
("ASC Topic 450") requires that an estimated loss from a loss contingency should be accrued by a charge to operating results if it is probable that an asset has been impaired or a liability has been incurred and the amount of the loss can be reasonably estimated. In determining whether a loss should be accrued, we evaluate, among other factors, the probability of an unfavorable outcome and the ability to make a reasonable estimate of the amount of loss. If only a range of probable loss can be determined, we accrue for our best estimate within the range for the contingency. In those cases where none of the estimates within the range is better than another, we accrue for the amount representing the low end of the range in accordance with ASC Topic 450. As additional information becomes available, we reassess the potential liability related to our pending contingencies and litigation and revise our estimates. Revisions of our estimates of the potential liability could materially impact our results of operations. Additionally, if the final outcome of such litigation and contingencies differs adversely from that currently expected, it would result in a charge to earnings when determined.
23
Business Combinations
. We account for business combinations under the acquisition method of accounting. The purchase price of each acquired business is allocated to the tangible and intangible assets acquired and the liabilities assumed on the basis of their respective fair values on the date of acquisition. Any excess of the purchase price over the fair value of the separately identifiable assets acquired and the liabilities assumed is allocated to goodwill. Purchase price allocations are based on information regarding the fair value of assets acquired and liabilities assumed as of the dates of acquisition. We determine the fair values used in purchase price allocations for intangible assets based on historical data, estimated discounted future cash flows, contract backlog amounts, if applicable, and expected royalty rates for trademarks and trade names as well as certain other assumptions. The valuation of assets acquired and liabilities assumed requires a number of judgments and is subject to revision as additional information about the fair value of assets and liabilities becomes available. Additional information, which existed as of the acquisition date but at that time was unknown to us, may become known during the remainder of the measurement period, a period not to exceed twelve months from the acquisition date. Adjustments in the purchase price allocation may require a recasting of the amounts allocated to goodwill and intangible assets. Acquisition costs are expensed as incurred. The results of operations of businesses acquired are included in the accompanying consolidated financial statements from their dates of acquisition.
Goodwill and Intangible Assets.
As of
July 26, 2014
, we had
$269.1 million
of goodwill,
$4.7 million
of indefinite-lived intangible assets and
$111.4 million
of finite-lived intangible assets, net of accumulated amortization. As of
July 27, 2013
, we had
$267.8 million
of goodwill,
$4.7 million
of indefinite-lived intangible assets and
$120.6 million
of finite-lived intangible assets, net of accumulated amortization. The increase in goodwill is primarily due to the acquisition of Watts Brothers. The decrease in net intangible assets is a result of the amortization of intangibles during fiscal 2014, partially offset by the increase in intangible assets due to the acquisition of Watts Brothers. See Note 7,
Goodwill and Intangible Assets
, in the Notes to the Consolidated Financial Statements in this Annual Report on Form 10-K.
We account for goodwill and other intangibles in accordance with Financial Accounting Standards Board Accounting Standard Codification ("ASC") Topic 350,
Intangibles – Goodwill and Other
("ASC Topic 350"). Our goodwill and other indefinite-lived intangible assets are assessed annually for impairment as of the first day of the fourth fiscal quarter of each year, or more frequently if events occur that would indicate a potential reduction in the fair value of a reporting unit below its carrying value. We perform our annual impairment review of goodwill at the reporting unit level. Each of our operating segments with goodwill represents a reporting unit for the purpose of assessing impairment. If we determine the fair value of the reporting units goodwill or other indefinite-lived intangible assets is less than their carrying value as a result of the tests, an impairment loss is recognized. Impairment losses, if any, are reflected in operating income or loss in the consolidated statements of operations during the period incurred.
In accordance with ASC Topic 360,
Impairment or Disposal of Long-Lived Assets
, we review finite-lived intangible assets for impairment whenever an event occurs or circumstances change which indicates that the carrying amount of such assets may not be fully recoverable. Recoverability is determined based on an estimate of undiscounted future cash flows resulting from the use of an asset and its eventual disposition. Should an asset not be recoverable, an impairment loss is measured by comparing the fair value of the asset to its carrying value. If we determine the fair value of an asset is less than the carrying value, an impairment loss is incurred. Impairment losses, if any, are reflected in operating income or loss in the consolidated statements of operations during the period incurred.
We use judgment in assessing if goodwill and intangible assets are impaired. Estimates of fair value are based on our projection of revenues, operating costs, and cash flows taking into consideration historical and anticipated future results, general economic and market conditions, as well as the impact of planned business or operational strategies. To measure fair value, we employ a combination of present value techniques which reflect market factors. Changes in our judgments and projections could result in significantly different estimates of fair value potentially resulting in additional impairments of goodwill and other intangible assets. The inputs used for fair value measurements of the reporting units and other related indefinite-lived intangible assets are the lowest level (Level 3) inputs.
Our goodwill resides in multiple reporting units. The profitability of individual reporting units may suffer periodically from downturns in customer demand and other factors resulting from the cyclical nature of our business, the high level of competition existing within our industry, the concentration of our revenues from a limited number of customers, and the level of overall economic activity, including in particular construction and housing activity. During times of slowing economic conditions, our customers may reduce capital expenditures and defer or cancel pending projects. Individual reporting units may be relatively more impacted by these factors than the Company as a whole. As a result, demand for the services of one or more of our reporting units could decline, resulting in an impairment of goodwill or intangible assets.
24
We performed our annual impairment assessment as of the first day of the fourth quarter of each of
fiscal 2014
,
2013
and
2012
and concluded that no impairment of goodwill or the indefinite-lived intangible asset was indicated at any reporting unit for any of the years. During
fiscal 2014
, we performed qualitative assessments on reporting units that comprise less than
20%
of our consolidated goodwill balance. The qualitative assessments indicated that it was more likely than not that the fair value exceeded carrying value for those reporting units. For the remaining reporting units we performed the first step of the quantitative analysis described in ASC Topic 350. The key valuation assumptions contributing to the fair value estimates of our reporting units were (a) a discount rate based on our best estimate of the weighted average cost of capital adjusted for risks associated with the reporting units; (b) terminal value based on terminal growth rates; and (c) seven expected years of cash flow before the terminal value for each annual test. The table below outlines certain assumptions in each of our
fiscal 2014
,
2013
and
2012
annual quantitative impairment analyses:
|
2014
|
2013
|
2012
|
|||
|
Terminal Growth Rate Range
|
1.5% - 3.0%
|
1.5% - 2.5%
|
1.5% - 3.0%
|
||
|
Discount Rate
|
11.5%
|
11.5%
|
13.0%
|
||
The discount rate reflects risks inherent within each reporting unit operating individually, which are greater than the risks inherent in the Company as a whole. For fiscal 2014, the discount rate was consistent with the fiscal 2013 analysis based on risk relative to industry conditions and the interest rate environment (cost of debt). The decrease in discount rates for fiscal 2013 from fiscal 2012 was a result of reduced risk relative to industry conditions and a lower interest rate environment at the time of the analysis. We believe the assumptions used in the impairment analysis each year are reflective of the risks inherent in the business models of our reporting units and within our industry.
We determined that the fair values of each of the reporting units was substantially in excess of their carrying values in the fiscal 2014 annual assessment for all but three of the reporting units. Management determined that significant changes were not likely in the factors considered to estimate fair value and analyzed the impact of such changes were they to occur. Specifically, if there was a 25% decrease in the fair value of any of the remaining reporting units due to a decline in their discounted cash flows resulting from lower operating performance, the conclusion of the assessment would not change. Additionally, if the discount rate applied in the
fiscal 2014
impairment analysis had been 100 basis points higher than estimated for each of the remaining reporting units, and all other assumptions were held constant, the conclusion of the assessment would remain unchanged and there would be no impairment of goodwill or the indefinite-lived intangible asset.
In the fiscal 2014 impairment analysis, the fair value for three of the reporting units acquired in fiscal 2013 exceeded their carrying value by less than 25% each. The excess fair value of these reporting units ranged from 12% to 20% and the goodwill balances were $10.6 million, $4.8 million and $3.6 million, respectively, as of
July 26, 2014
. The key valuation assumptions used in the analysis of these reporting units are discussed above and there was no indication of impairment. Recent operating performance, along with assumptions for specific customer and industry opportunities, were considered in the key assumptions used during the
fiscal 2014
impairment analysis. The excess fair value over the carrying value of these individual reporting units increased from the fiscal 2013 analysis; however, the excess remained below 25% of their individual carrying values. Management has determined the goodwill balance of these reporting units may have an increased likelihood of impairment if a prolonged downturn in customer demand were to occur, or if the reporting units were not able to execute against customer opportunities, and the long-term outlook for their cash flows were adversely impacted. Furthermore, changes in the long-term outlook may result in changes to other valuation assumptions. Factors monitored by management which could result in a change to the reporting units' estimates include the outcome of customer requests for proposals and subsequent awards, strategies of competitors, labor market conditions and levels of overall economic activity, including construction and housing activity. As of
July 26, 2014
, we believe the goodwill is recoverable for all of the reporting units; however, there can be no assurances that the goodwill will not be impaired in future periods.
Current operating results, including any losses, are evaluated by us in the assessment of goodwill and other intangible assets. The estimates and assumptions used in assessing the fair value of the reporting units and the valuation of the underlying assets and liabilities are inherently subject to significant uncertainties. Changes in judgments and estimates could result in a significantly different estimate of the fair value of the reporting units and could result in impairments of goodwill or intangible assets at additional reporting units. Additionally, adverse conditions in the economy and future volatility in the equity and credit markets could impact the valuation of our reporting units.
Certain of our reporting units also have other intangible assets including customer relationships, contract backlog, trade names, and non-compete intangibles. As of
July 26, 2014
, we believe that the carrying amounts of these intangible assets are recoverable. However, if adverse events were to occur or circumstances were to change indicating that the carrying amount of such assets may not be fully recoverable, the assets would be reviewed for impairment and the assets could be impaired.
25
Outlook
Significant changes in the telecommunications industry continue to drive increasing demands on the networks of our customers for more capacity and greater reliability. Telecommunications providers continue to outsource a significant portion of their engineering, construction, maintenance, and installation requirements, driving demand for our services.
Telecommunications network operators are increasingly deploying fiber optic cable technology deeper into their networks and closer to consumers and businesses in order to respond to consumer demand, competitive realities, and public policy support. Fiber deployments have enabled cable companies to offer voice services in addition to their traditional video and data services. Additionally, fiber deployments are enabling video services for local telephone companies in addition to their traditional voice and high speed data services. Several large telephone companies have pursued fiber-to-the-premise and fiber-to-the-node initiatives to compete actively with cable operators. A portion of those telephone companies previously deploying fiber-to-the-node are transitioning to fiber-to-the premise technology. Further, many industry participants are deploying networks designed to provision 1 gigabit speeds to individual consumers. These long-term initiatives and the possibility that other industry participants may pursue similar strategies present opportunities for us.
Cable companies, with increasing urgency, continue to increase the speeds of their services to residential customers and to deploy fiber to business customers. Oftentimes these services to businesses are provided over fiber optic cables using "metro Ethernet" technology. The commercial geographies targeted by cable companies for network deployments generally require incremental fiber optic cable deployment and, as a result, require our services.
Significant demand for wireless broadband is driven by the proliferation of smart phones and other mobile data devices. To respond to this demand, and other advances in technology, wireless carriers are upgrading their networks to 4G technologies. Wireless carriers are actively spending on their networks to respond to the explosion in wireless data traffic, upgrade network technologies to improve performance and efficiency and consolidate disparate technology platforms. These initiatives present long-term opportunities for us with the wireless service providers we serve. Further, the demand for mobile broadband has increased bandwidth requirements on the wired networks of our customers. As the demand for mobile broadband grows, the amount of wireless traffic that must be "backhauled" over customers' fiber networks increases and, as a result, carriers are accelerating the deployment of fiber optic cables to cellular sites and small cells. These trends are also driving the demand for our services and increasing wireless data traffic is prompting further wireline deployments.
In addition, opportunities exist to improve rural networks as a result of funding for rural projects through traditional governmental channels and Phase II of the Connect America Fund. The continuation of these rural deployments are expected to contribute to the demand for services in our industry.
Overall economic activity, including in particular construction and housing activity, also contributes to the demand for our services. Within the context of the current economy, we believe the latest trends and developments support our industry outlook. We will continue to closely monitor the effects that changes in economic and market conditions may have on our customers and our business and we will continue to manage those areas of the business we can control.
26
Results of Operations
The Company uses a fiscal year ending on the last Saturday in July. The results of operations of businesses acquired are included in the accompanying consolidated financial statements from their dates of acquisition. For a summary of the Company's acquisitions, see Note 3,
Acquisitions
, in Notes to the Consolidated Financial Statements. The following table sets forth our consolidated statements of operations for the periods indicated and the amounts as a percentage of revenue (totals may not add due to rounding):
|
|
Fiscal Year Ended
|
|||||||||||||||||||
|
|
2014
|
2013
|
2012
|
|||||||||||||||||
|
|
(Dollars in millions)
|
|||||||||||||||||||
|
Revenues
|
$
|
1,811.6
|
|
100.0
|
%
|
$
|
1,608.6
|
|
100.0
|
%
|
$
|
1,201.1
|
|
100.0
|
%
|
|||||
|
Expenses:
|
|
|
|
|
|
|
|
|
|
|
||||||||||
|
Cost of earned revenue, excluding depreciation and amortization
|
1,475.0
|
|
81.4
|
|
1,300.4
|
|
80.8
|
|
968.9
|
|
80.7
|
|
||||||||
|
General and administrative
|
161.9
|
|
8.9
|
|
145.8
|
|
9.1
|
|
104.0
|
|
8.7
|
|
||||||||
|
Depreciation and amortization
|
92.8
|
|
5.1
|
|
85.5
|
|
5.3
|
|
62.7
|
|
5.2
|
|
||||||||
|
Total
|
1,729.7
|
|
95.5
|
|
1,531.7
|
|
95.2
|
|
1,135.7
|
|
94.6
|
|
||||||||
|
Interest expense, net
|
(26.8
|
)
|
(1.5
|
)
|
(23.3
|
)
|
(1.5
|
)
|
(16.7
|
)
|
(1.4
|
)
|
||||||||
|
Other income, net
|
11.2
|
|
0.6
|
|
4.6
|
|
0.3
|
|
15.8
|
|
1.3
|
|
||||||||
|
Income before income taxes
|
66.3
|
|
3.7
|
|
58.2
|
|
3.6
|
|
64.6
|
|
5.4
|
|
||||||||
|
Provision for income taxes
|
26.3
|
|
1.5
|
|
23.0
|
|
1.4
|
|
25.2
|
|
2.1
|
|
||||||||
|
Net income
|
$
|
40.0
|
|
2.2
|
%
|
$
|
35.2
|
|
2.2
|
%
|
$
|
39.4
|
|
3.3
|
%
|
|||||
Year Ended
July 26, 2014
Compared to Year Ended
July 27, 2013
Revenues.
Revenues increased to
$1.812 billion
for
fiscal 2014
from
$1.609 billion
for
fiscal 2013
. Total revenues from subsidiaries acquired in fiscal 2013 and the fourth quarter of fiscal 2014 were $499.3 million for
fiscal 2014
and $337.9 million for
fiscal 2013
.
Excluding the amounts attributed to these subsidiaries from both periods, revenues increased $41.6 million. During fiscal 2014, revenues increased approximately $83.8 million for a significant customer investing in improvements to its wireline and wireless networks. In addition, revenues increased by $53.8 million to $56.7 million for services performed on a customer's fiber network that began during the fourth quarter of fiscal 2013, and $25.7 million for two leading cable multiple system operators from maintenance and construction services, including services to provision fiber to small and medium businesses as well as network upgrades. Partially offsetting these increases was a decrease in storm restoration revenues. During
fiscal 2013
, storm restoration revenues were $16.7 million while there were no significant revenues for storm restoration services during
fiscal 2014
. Additionally, revenues for two large telecommunications customers declined $42.5 million, on a combined basis, and revenues for services to another two telecommunications customers, including rural and stimulus services, declined $30.1 million, also on a combined basis. Further, revenues for two cable multiple system operators declined $17.4 million, on a combined basis. Other customers had net decreases in revenues of $15.0 million for
fiscal 2014
as compared to
fiscal 2013
, primarily from lower rural broadband services including a reduction in revenues of $12.5 million related to stimulus work on projects funded in part by the American Recovery and Reinvestment Act of 2009.
The percentage of our revenue by customer type from telecommunications, underground facility locating, and electric and gas utilities and other customers, was approximately
88.2%
,
7.0%
and
4.8%
, respectively, for
fiscal 2014
, compared to
87.7%
,
7.9%
and
4.4%
, respectively, for
fiscal 2013
.
Costs of Earned Revenues.
Costs of earned revenues
increased
to
$1.475 billion
during
fiscal 2014
compared to
$1.300 billion
during
fiscal 2013
. The
increase
was primarily due to a higher level of operations during
fiscal 2014
, including operations of businesses acquired during fiscal 2013 and 2014. The primary components of the total
increase
was a
$121.9 million
aggregate
increase
in direct labor and independent subcontractor costs, a
$26.4 million
increase
in direct material costs, a
$7.0 million
increase
in equipment costs, and an aggregate
$19.3 million
increase
in other direct costs. Other direct costs included charges for employment related legal settlements of $0.6 million and $0.5 million in fiscal 2014 and fiscal 2013, respectively.
27
Costs of earned revenues as a percentage of contract revenue increased 0.6% during
fiscal 2014
as compared to
fiscal 2013
. The increase was partially due to adverse weather conditions during the second and third quarters of fiscal 2014, which negatively impacted productivity. Our mix of work included a higher level of projects where we provided materials to the customer which resulted in a 0.4% increase in direct material costs as a percentage of total revenue. Additionally, total direct labor and independent subcontractor costs increased 0.2% as a percentage of total revenue and equipment costs increased 0.1% as a percentage of total revenue during
fiscal 2014
as compared to
fiscal 2013
. Partially offsetting these increases, other direct costs decreased 0.1% as a percentage of total revenue during
fiscal 2014
as compared to
fiscal 2013
.
General and Administrative Expenses.
General and administrative expenses
increased
to
$161.9 million
, or
8.9%
as a percentage of contract revenue, during
fiscal 2014
as compared to
$145.8 million
, or
9.1%
as a percentage of contract revenue during
fiscal 2013
. The increase in total general and administrative expenses for
fiscal 2014
resulted primarily from the costs of the businesses acquired in fiscal 2013 and 2014, increased payroll expenses as a result of growth and higher professional fees. Additionally, stock-based compensation increased to
$12.6 million
during
fiscal 2014
from
$9.9 million
during
fiscal 2013
, as a result of increased restricted share unit expense. These increases were partially offset by decreases in acquisition and integration costs of the fiscal 2013 acquisitions, which declined on a combined basis from $10.2 million in fiscal 2013 to $2.4 million in fiscal 2014.
Depreciation and Amortization.
Depreciation and amortization
increased
to
$92.8 million
during
fiscal 2014
from
$85.5 million
during
fiscal 2013
and totaled
5.1%
and
5.3%
as a percentage of contract revenue during the current and prior year, respectively. The increase in depreciation and amortization expense during
fiscal 2014
is a result of the addition of fixed assets and amortizing intangibles relating to the businesses acquired during fiscal 2013 and 2014. These increases were partially offset by certain fixed assets becoming fully depreciated in fiscal 2013 and 2014. Amortization expense was
$18.3 million
and
$20.7 million
during
fiscal 2014
and
fiscal 2013
, respectively.
Interest Expense, Net.
Interest expense, net was
$26.8 million
and
$23.3 million
during
fiscal 2014
and
fiscal 2013
, respectively. The
increase
for
fiscal 2014
reflects higher debt balances outstanding for a longer term during the current year primarily related to the financing of the purchase of the Acquired Subsidiaries. The additional interest cost on incremental debt was partially offset by lower cost of debt related to the replacement of our previous credit agreement during fiscal 2013.
Other Income, Net
. Other income
increased
to
$11.2 million
during
fiscal 2014
from
$4.6 million
during
fiscal 2013
. The
increase
in other income was primarily a function of the number of assets sold and prices obtained for those assets during
fiscal 2014
compared to
fiscal 2013
. Additionally, during fiscal 2013, we recognized
$0.3 million
in write-off of deferred financing costs associated with the replacement of our previous credit facility in December 2012.
Income Taxes
. The following table presents our income tax expense and effective income tax rate for fiscal
2014
and
2013
:
|
|
Fiscal Year Ended
|
||||||
|
|
2014
|
2013
|
|||||
|
|
(Dollars in millions)
|
||||||
|
Income tax provision
|
$
|
26.3
|
|
$
|
23.0
|
|
|
|
Effective income tax rate
|
39.7
|
%
|
39.5
|
%
|
|||
Variations in our effective income tax rate for
fiscal 2014
and
fiscal 2013
are primarily attributable to the impact of state income taxes, non-deductible and non-taxable items, disqualifying dispositions of incentive stock option exercises, and production-related tax credits recognized in relation to our pre-tax results during the period. Non-deductible and non-taxable items will generally have a reduced impact on the effective income tax rate in periods of greater pre-tax results. We had total unrecognized tax benefits of approximately
$2.4 million
and
$2.3 million
as of
July 26, 2014
and
July 27, 2013
, respectively, that, if recognized, would favorably affect our effective tax rate.
Net Income
. Net income was
$40.0 million
for
fiscal 2014
as compared to
$35.2 million
during
fiscal 2013
.
28
Year Ended
July 27, 2013
Compared to Year Ended
July 28, 2012
Revenues.
Revenues increased $407.5 million, or 33.9%, to $1.609 billion during fiscal 2013 as compared to $1.201 billion during fiscal 2012. Of this increase, $337.9 million was generated by businesses acquired in fiscal 2013. The percentage of our revenue by customer type from telecommunications, underground facility locating, and electric and gas utilities and other customers, was approximately 87.7%, 7.9% and 4.4%, respectively, during fiscal 2013 as compared to 84.5%, 10.9% and 4.6%, respectively, during fiscal 2012.
Revenues from specialty construction services provided to telecommunications companies, excluding amounts attributed to businesses acquired in fiscal 2013, increased 8.9%, or $90.2 million, to $1,104.8 million during fiscal 2013 compared to $1,014.6 million during fiscal 2012. During fiscal 2013 and fiscal 2012, the Company earned revenues from storm restoration services of $16.7 million and $6.0 million, respectively. During fiscal 2013, revenues increased approximately $77.7 million for a significant customer, including revenues for services performed for its wireless network under contracts entered into during fiscal 2012. Revenues increased $26.7 million for three leading cable multiple system operators for maintenance and construction services, including services to provision fiber to small and medium businesses as well as network upgrades. Revenues increased $9.4 million for another cable multiple system operator enhancing its fiberoptic network. Additionally, revenues increased $8.0 million for a telephone customer which is expanding and enhancing its broadband services related to rural access lines it acquired and for broadband stimulus initiatives. These increases were partially offset by a decrease in revenue of $12.2 million for a telephone customer from decreases in services provided under existing contracts and broadband stimulus initiatives. Additionally, we experienced a decrease in revenue of $10.4 million for a significant telephone customer as a result of reduced spending in fiscal 2013 as compared to fiscal 2012. Other telecommunications customers had net decreases in revenue of $19.7 million in fiscal 2013 as compared to fiscal 2012.
Revenues from underground facility locating customers, excluding amounts attributed to businesses acquired in fiscal 2013, decreased 3.7% to $126.4 million during fiscal 2013 compared to $131.3 million during fiscal 2012. The decrease partially resulted from a contract that ended during the second quarter of fiscal 2012 and due to reduced work from current customers. Revenues from electric and gas utilities and other construction and maintenance customers, excluding amounts attributed to businesses acquired in fiscal 2013, decreased to $39.5 million during fiscal 2013 compared to $55.2 million during fiscal 2012. The decrease was primarily attributable to decreases in work performed for several gas companies and electric utilities during fiscal 2013 as compared to fiscal 2012.
Costs of Earned Revenues.
Costs of earned revenues increased to $1,300.4 million during fiscal 2013 compared to $968.9 million during fiscal 2012. The increase was primarily due to a higher level of operations during fiscal 2013, including costs of the businesses acquired in fiscal 2013. The primary components of the total increase was a $235.8 million aggregate increase in direct labor and independent subcontractor costs, a $41.2 million increase in direct material costs, and an aggregate $54.5 million increase in other direct costs, including a pre-tax $0.5 million charge for a wage and hour class action settlement.
Costs of earned revenues as a percentage of contract revenues increased 0.2% during fiscal 2013 as compared to fiscal 2012. Direct material costs as a percentage of total revenue increased 0.3% compared to fiscal 2012 as our mix of work included a higher level of projects where we provided materials to the customer. Other direct costs increased 0.3% as a percentage of total revenue primarily as a result of the mix of work performed and increased equipment and claims related costs as compared to fiscal 2012. Offsetting these increases, fuel costs decreased 0.3% as a percentage of total revenue during fiscal 2013 as compared to fiscal 2012. Additionally, total labor and subcontractor costs decreased 0.1% as a percentage of total revenue for fiscal 2013 as compared to fiscal 2012.
General and Administrative Expenses.
General and administrative expenses increased to $145.8 million during fiscal 2013 as compared to $104.0 million for fiscal 2012. General and administrative expenses as a percentage of contract revenues were 9.1% and 8.7% for fiscal 2013 and fiscal 2012, respectively. The increase in total general and administrative expenses for fiscal 2013 resulted primarily from the general and administrative costs of the businesses acquired in fiscal 2013 and approximately $6.8 million and $3.4 million of pre-tax acquisition and integration costs, respectively, during fiscal 2013. Additionally, stock-based compensation increased to $9.9 million during fiscal 2013 from $7.0 million during fiscal 2012. Other increases in general and administrative expenses were increased payroll expenses as a result of growth, increased incentive pay expenses from improved operations, and higher professional fees for legal and accounting services.
Depreciation and Amortization.
Depreciation and amortization increased to $85.5 million during fiscal 2013 from $62.7 million during fiscal 2012 and totaled 5.3% and 5.2% as a percentage of contract revenues during the current and prior year, respectively. The increase in depreciation and amortization expense for fiscal 2013 is a result of the addition of fixed assets and
29
amortizing intangibles relating to the businesses acquired during fiscal 2013. These increases were partially offset by certain fixed assets becoming fully depreciated in fiscal 2012 and 2013.
Interest Expense, Net.
Interest expense, net was $23.3 million and $16.7 million during fiscal 2013 and 2012, respectively. The increase for fiscal 2013 reflects higher debt balances outstanding during fiscal 2013 primarily related to the financing of the purchase of the Acquired Subsidiaries. The additional debt includes $90.0 million in 7.125% senior subordinated notes due 2021 issued on December 12, 2012, as well as outstanding amounts during the period under our new five-year credit agreement (the "Credit Agreement"). The additional interest cost on incremental debt was partially offset by lower cost of debt related to the replacement of our previous credit agreement during fiscal 2013.
Other Income, Net
. Other income decreased to $4.6 million during fiscal 2013 from $15.8 million during fiscal 2012. The decreases in other income were primarily a function of the number of assets sold and prices obtained for those assets during fiscal 2013. Additionally, we recognized $0.3 million in write-off of deferred financing costs during fiscal 2013 in connection with the replacement of our credit facility in December 2012.
Income Taxes
. The following table presents our income tax expense and effective income tax rate for fiscal years 2013 and 2012:
|
|
Fiscal Year Ended
|
||||||
|
|
2013
|
2012
|
|||||
|
|
(Dollars in millions)
|
||||||
|
Income tax provision
|
$
|
23.0
|
|
$
|
25.2
|
|
|
|
Effective income tax rate
|
39.5
|
%
|
39.0
|
%
|
|||
Our effective income tax rate differs from the statutory rates for the tax jurisdictions where we operate. Variations in our effective income tax rate for fiscal 2013 and 2012 are primarily attributable to the impact of non-deductible and non-taxable items, disqualifying dispositions of incentive stock option exercises, and production-related tax credits recognized in relation to our pre-tax results during the period. Non-deductible and non-taxable items will generally have a reduced impact on the effective income tax rate in periods of greater pre-tax results. We had total unrecognized tax benefits of approximately $2.3 million and $2.2 million as of July 27, 2013 and July 28, 2012, respectively, which would reduce our effective tax rate during the periods recognized if it is determined that those liabilities are no longer required.
Net Income
. Net income was $35.2 million for fiscal 2013 as compared to $39.4 million during fiscal 2012.
Liquidity and Capital Resources
We are subject to concentrations of credit risk relating primarily to our cash and equivalents, accounts receivable, and costs and estimated earnings in excess of billings. Cash and equivalents primarily include balances on deposit with banks and totaled
$20.7 million
at
July 26, 2014
compared to
$18.6 million
at
July 27, 2013
. We maintain substantially all of our cash and equivalents at financial institutions we believe to be of high credit quality. To date, we have not experienced any loss or lack of access to cash in our operating accounts.
Sources of Cash.
Our sources of cash have been operating activities, long-term debt, equity offerings, stock option proceeds, bank borrowings, and proceeds from the sale of idle and surplus equipment and real property. Cash flow from operations is primarily influenced by demand for our services and operating margins, but can also be influenced by working capital needs associated with the services that we provide. In particular, working capital needs may increase when we have growth in operations and where project costs, primarily associated with labor, equipment, materials and subcontractors, are required to be paid before the accounts receivables resulting from the work performed are invoiced and collected from the customer. Our working capital (total current assets less total current liabilities) was
$409.2 million
at
July 26, 2014
compared to
$341.3 million
at
July 27, 2013
.
Capital resources are primarily used to purchase equipment and maintain sufficient levels of working capital in order to support our contractual commitments to customers. We periodically borrow from and repay our revolving credit facility depending on our cash requirements. Additionally, our capital requirements may increase to the extent we make acquisitions that involve consideration other than our stock, buy back our common stock, repay revolving borrowings, or repurchase or call our senior subordinated notes. We have not paid cash dividends since 1982. Our board of directors regularly evaluates our dividend policy based on our financial condition, profitability, cash flow, capital requirements, and the outlook of our business. We currently intend to retain any earnings for use in the business, including for investment in acquisitions, and consequently
30
we do not anticipate paying any cash dividends on our common stock in the foreseeable future. Additionally, the indenture governing our senior subordinated notes contains covenants that restrict our ability to make certain payments, including the payment of dividends.
We expect capital expenditures, net of disposals, to range from $80 million to $85 million for fiscal 2015. Our level of capital expenditures can vary depending on the customer demand for our services, the replacement cycle we select for our equipment, and overall growth. We intend to fund these expenditures primarily from operating cash flows, availability under our credit facility and cash on hand.
Sufficiency of Capital Resources.
We believe that our capital resources, including existing cash balances and amounts available under our Credit Agreement, are sufficient to meet our financial obligations. These obligations include interest payments required on our senior subordinated notes and outstanding borrowings under our Credit Agreement, working capital requirements, and the normal replacement of equipment at our current level of operations for at least the next twelve months. Our capital requirements may increase to the extent we seek to grow by acquisitions that involve consideration other than our stock, or to the extent we repurchase our common stock, repay revolving borrowings, or repurchase or call our senior subordinated notes. Changes in financial markets or other areas of the economy could adversely impact our ability to access the capital markets, in which case we would expect to rely on a combination of available cash and the Credit Agreement to provide short-term funding.
Management regularly monitors the financial markets and assesses general economic conditions for any impact on our financial position. If changes in financial markets or other areas of the economy adversely impact our ability to access capital markets, we would expect to rely on a combination of available cash and the existing committed credit facility to provide short-term funding. We believe that our cash investment policies are prudent and we expect that any volatility in the capital markets would not have a material impact on our cash investments.
Net cash flows.
The following table presents our net cash flows for
fiscal 2014
,
2013
and
2012
:
|
For the Fiscal Year Ended
|
|||||||||||
|
|
2014
|
2013
|
2012
|
||||||||
|
|
(Dollars in millions)
|
||||||||||
|
Net cash flows:
|
|
|
|||||||||
|
Provided by operating activities
|
$
|
84.2
|
|
$
|
106.7
|
|
$
|
65.1
|
|
||
|
Used in investing activities
|
$
|
(91.1
|
)
|
$
|
(389.1
|
)
|
$
|
(51.9
|
)
|
||
|
Provided by (used in) financing activities
|
$
|
9.0
|
|
$
|
248.3
|
|
$
|
(5.4
|
)
|
||
Cash from Operating Activities.
During
fiscal 2014
, net cash provided by operating activities was
$84.2 million
. Non-cash items during
fiscal 2014
,
2013
and
2012
were primarily depreciation and amortization, gain on sale of assets, stock-based compensation, and deferred income taxes. Changes in working capital (excluding cash) and changes in other long term assets and liabilities
used
$43.3 million
of operating cash flow during
fiscal 2014
. The primary working capital changes that used operating cash flow during
fiscal 2014
were increases in accounts receivable and net costs and estimated earnings in excess of billings of
$16.9 million
and
$25.4 million
, respectively, as a result of an increase in the level of our operations, including growth with certain customers, and slightly longer collection times during
fiscal 2014
. Net increases in other current and other non-current assets combined used
$13.4 million
of operating cash flow during
fiscal 2014
primarily for inventory. Additionally, decreases in accounts payable used
$4.2 million
of operating cash flow as a result of timing of payments. Working capital sources of cash flow during
fiscal 2014
were increases in accrued liabilities, insurance claims and other liabilities of
$10.0 million
primarily due to timing of insurance claims related payments and increases in income tax payable, net of income tax receivables, of
$6.7 million
due to the timing of payments.
Our days sales outstanding ("DSO") for accounts receivable (based on ending accounts receivable divided by average daily revenue for the most recently completed quarter) increased to 51 days as of
July 26, 2014
compared to 48 days as of
July 27, 2013
. Our payment terms for contracts of our subsidiaries vary by customer and primarily range from 30 to 60 days after invoicing the customer. Our DSO for costs and estimated earnings in excess of billings ("CIEB") increased to 41 days as of
July 26, 2014
compared to 36 days as of
July 27, 2013
.
The increase in our DSOs as compared to the prior year was in part a result of significant growth with certain key customers resulting in increased DSOs as we integrate our billing processes for these customers. DSOs have also been impacted by work performed for certain rural customers, including those projects funded in part by the American Recovery and Reinvestment Act of 2009 (the "ARRA"). These customers have increased
31
documentation requirements resulting in longer billing and collection cycle times. In addition, DSOs increased for certain customers based on their invoice approval processes. Further, certain of the Acquired Subsidiaries
have slower processing cycles for invoicing and collections compared to our legacy subsidiaries. We continue to work to integrate their systems and processes and we believe the improvements will reduce the time associated with invoicing and collections.
In addition, o
ur accounts receivable include approximately $20.1 million for past due accounts receivable from a customer on a rural project funded in part by the ARRA. We have stopped work on the project and have filed construction liens with respect to this work representing approximately $17.7 million of the accounts receivable balance.
Our CIEB balances are maintained at a detailed task-specific or project level and are evaluated regularly for realizability. Such amounts are invoiced in the normal course of business according to contract terms, which consider the completion of specific tasks and the passage of time. Project delays for commercial issues such as permitting, engineering changes, incremental documentation requirements or difficult job site conditions can extend the time needed to complete certain tasks and may delay invoicing to the customer for the work performed. W
e were not experiencing any material project delays or other circumstances that would impact the realizability of the CIEB balance as of
July 26, 2014
. Additionally, there are no material amounts of CIEB related to claims or unapproved change orders as of
July 26, 2014
or
July 27, 2013
. As of
July 26, 2014
, we believe that none of our significant customers was experiencing financial difficulties that would impact the realizability of our CIEB or the collectability of our trade accounts receivable.
During fiscal 2013, net cash provided by operating activities was $106.7 million. Changes in working capital (excluding cash) and changes in other long term assets and liabilities used $17.5 million of operating cash flow during fiscal 2013. A primary working capital source of cash flow during fiscal 2013 was a decrease in accounts receivable of $3.6 million. Included in this amount is a decrease in balances for businesses acquired in fiscal 2013 of $10.1 million for the period from the acquisition date through July 27, 2013. The remaining change in accounts receivable was from the results of our legacy businesses. Net decreases in income tax receivables was $6.0 million during the period due to the timing of payments. Working capital changes that used operating cash flow during fiscal 2013 were increases in net costs and estimated earnings in excess of billings of $12.3 million as a result of growth in operations during fiscal 2013. Other working capital changes that used operating cash flow during fiscal 2013 were decreases in accounts payable of $11.2 million as a result of timing of payments. Additionally, decreases in accrued liabilities, insurance claims and other liabilities used $2.5 million of cash flow. Net increases in other current and other non-current assets combined used $1.1 million of operating cash flow during fiscal 2013 primarily for inventory and other pre-paid costs.
Our DSO for accounts receivable (based on ending accounts receivable divided by average daily revenue for the most recently completed quarter) increased to 48 days as of
July 27, 2013
compared to 41 days as of
July 28, 2012
. Our DSO for CIEB was 36 days as of both
July 27, 2013
and
July 28, 2012
. The increase in our DSOs in fiscal 2013 as compared to fiscal 2012 was in part a result of the Acquired Subsidiaries having a generally slower processing cycle for invoicing and collections compared to our legacy subsidiaries. Additionally, several of our legacy and Acquired Subsidiaries have performed work for certain rural customers, including projects funded in part by the ARRA and have experienced longer DSOs. These customers have increased documentation requirements resulting in longer billing and collection cycle times. These projects contributed to our growth during fiscal 2013 and the increase in DSOs.
During fiscal 2012, net cash provided by operating activities was $65.1 million. Changes in working capital (excluding cash) and changes in other long term assets and liabilities used $37.9 million of operating cash flow during fiscal 2012. The primary working capital uses during fiscal 2012 were increases in accounts receivable of $3.4 million and increases in net costs and estimated earnings in excess of billings of $35.7 million. The increases in accounts receivable and costs and estimated earnings in excess of billings are a result of growth in operations during fiscal 2012 and changes to the customer mix compared to fiscal 2011. Other working capital changes that used operating cash flow during fiscal 2012 were increases in other current and other non-current assets combined of $6.3 million, primarily for higher levels of inventory, and decreases in accrued liabilities and accrued insurance claims of $1.2 million. Working capital sources of cash flow during fiscal 2012 were income taxes receivable of $5.7 million used during the period and increases in accounts payable of $3.0 million as a result of timing of higher operating levels and timing of payments.
Cash Used in Investing Activities.
Net cash used in investing activities was
$91.1 million
during
fiscal 2014
. During
fiscal 2014
we paid $16.4 million in connection with the acquisition of Watts Brothers and $0.7 million in connection with the acquisition of a telecommunications specialty construction contractor in Canada. During
fiscal 2014
, capital expenditures of
$89.1 million
were offset in part by proceeds from the sale of assets of
$15.4 million
. During fiscal 2013 capital expenditures of $64.7 million were offset in part by proceeds from the sale of assets of $5.8 million. The increase in capital expenditures, net in fiscal 2014 compared to fiscal 2013 was the result of spending for new work opportunities and the replacement of certain fleet assets. Restricted cash, primarily related to funding provisions of our insurance program, increased approximately
$0.3 million
during
fiscal 2014
.
32
Net cash used in investing activities was $389.1 million during fiscal 2013. During fiscal 2013 we paid $330.3 million in connection with the acquisition of businesses, including $319.0 million for the Acquired Subsidiaries, net of cash acquired. Additionally, during fiscal 2013 capital expenditures of $64.7 million were offset in part by proceeds from the sale of assets of $5.8 million. Restricted cash, primarily related to funding provisions of our insurance program, decreased less than $0.1 million during fiscal 2013.
Net cash used in investing activities was $51.9 million during fiscal 2012. During fiscal 2012 capital expenditures of $77.6 million were offset in part by proceeds from the sale of assets of $24.8 million, including approximately $5.5 million related to the sale of non-core cable system assets during the third quarter of fiscal 2012. Restricted cash, primarily related to funding provisions of our insurance programs, decreased $0.9 million during fiscal 2012.
Cash Provided by (Used In) Financing Activities.
Net cash provided by financing activities was
$9.0 million
during
fiscal 2014
. During
fiscal 2014
, we received
$14.6 million
from the exercise of stock options and
$3.0 million
of excess tax benefits primarily from the exercises of stock options and vesting of restricted share units during
fiscal 2014
. Additionally, net revolving borrowings under our Credit Agreement were $14.0 million, partially offset by principal payments on the term loan under our Credit Agreement of $7.8 million. Additionally, we paid a $1.0 million obligation related to a business acquired in the fourth quarter of fiscal 2013. During fiscal 2014, we repurchased 360,900 shares of our common stock in open market transactions, at an average price of $27.71 per share, for approximately $10.0 million. Additionally, we withheld shares of restricted units and paid
$3.8 million
to tax authorities in order to meet payroll tax withholdings obligations on restricted units that vested during fiscal 2014.
Net cash provided by financing activities was $248.3 million during fiscal 2013. During fiscal 2013 we received $93.8 million in gross proceeds from the issuance of an incremental $90.0 million in aggregate principal amount of our 7.125% senior subordinated notes due 2021 and $3.8 million in premium received in connection with the issuance, $125.0 million in proceeds from the term loan under our Credit Agreement and net revolving borrowings under our Credit Agreement of $49.0 million, partially offset by principal payments on the term loan of $3.1 million. Additionally, during fiscal 2013, we paid $6.7 million of debt issuance costs in connection with our new Credit Agreement and the issuance of our 7.125% senior subordinated notes due 2021. During fiscal 2013, we repurchased 1,047,000 shares of our common stock in open market transactions, at an average price of $14.52 per share, for approximately $15.2 million. We withheld shares of restricted units and paid $0.9 million to tax authorities in order to meet payroll tax withholdings obligations on restricted units that vested to employees and certain officers during fiscal 2013. Additionally, we received $5.3 million from the exercise of stock options and received excess tax benefits of $1.3 million primarily from the vesting of restricted share units and exercises of stock options during fiscal 2013.
Net cash used in financing activities was $5.4 million during fiscal 2012. During fiscal 2012, we repurchased 597,700 shares of our common stock in open market transactions, at an average price of $21.68 per share, for approximately $13.0 million. We received $6.5 million from the exercise of stock options and received excess tax benefits of $1.6 million primarily from the vesting of restricted share units and exercises of stock options during fiscal 2012. During fiscal 2012, we withheld shares of restricted units and paid $0.3 million to tax authorities in order to meet payroll tax withholdings obligations on restricted units that vested to certain officers and employees during those periods. Additionally, we paid approximately $0.2 million during fiscal 2012 for principal payments on capital leases.
Compliance with Credit Agreement and Indenture.
On December 3, 2012 we entered into our new, five-year Credit Agreement with various lenders. The Credit Agreement matures in December 2017 and provides for a $275 million revolving facility and a $125 million term loan (the "Term Loan"). Subject to certain conditions, the Credit Agreement provides for the ability to enter into one or more incremental facilities, either by increasing the revolving commitments under the Credit Agreement and/or in the form of term loans, in an aggregate amount not to exceed $100 million. Borrowings under the Credit Agreement can be used to refinance certain indebtedness, to provide general working capital, and for other general corporate purposes.
The Credit Agreement replaced our prior credit agreement, dated as of June 4, 2010, which was due to expire in June 2015. At the time of termination, there were no outstanding borrowings and all outstanding letters of credit were transferred to the Credit Agreement. We did not incur any material early termination penalties in connection with the termination of the prior credit agreement. We recognized $0.3 million in write-off of deferred financing costs during the second quarter of fiscal 2013 in connection with the replacement of the prior credit agreement.
Borrowings under the Credit Agreement (other than Swingline Loans (as defined in the Credit Agreement)) bear interest at a rate equal to either (a) the administrative agent's base rate, described in the Credit Agreement as the highest of (i) the administrative agent's prime rate, (ii) the Federal Funds Rate plus 0.50%, and (iii) a floating rate of interest equal to one month
33
LIBOR plus 1.00%, or (b) the Eurodollar Rate, plus, in each case, an applicable margin based upon our consolidated leverage ratio. Swingline Loans bear interest at a rate equal to the administrative agent's base rate plus a margin based upon our consolidated leverage ratio. As of July 26, 2014, borrowings are eligible for a margin of 1.0% for borrowings based on the administrative agent's base rate and 2.0% for borrowings based on the Eurodollar Rate. Borrowings under the Credit Agreement are guaranteed by substantially all of our subsidiaries and secured by the stock of each of the wholly-owned domestic subsidiaries (subject to specified exceptions). We incur fees under the Credit Agreement for the unutilized commitments at rates that range from 0.25% to 0.40% per annum, fees for outstanding standby letters of credit at rates that range from 1.50% to 2.25% per annum and fees for outstanding commercial letters of credit at rates that range from 0.75% to 1.125% per annum, in each case based on our consolidated leverage ratio.
We had outstanding revolver borrowings under the Credit Agreement of $63.0 million and $49.0 million as of
July 26, 2014
and
July 27, 2013
, respectively. Borrowings under the Credit Agreement accrued interest at a weighted average rate of approximately 2.55% per annum and 2.19% per annum as of
July 26, 2014
and
July 27, 2013
, respectively. As of
July 26, 2014
and
July 27, 2013
, we had $114.1 million and $121.9 million, respectively, of outstanding principal amount under the Term Loan, which accrued interest at 2.15% and 2.19% per annum, respectively.
The Term Loan is subject to annual amortization payable in equal quarterly installments of principal. The remaining amortization for the Term Loan as of
July 26, 2014
is as follows: $10.9 million during fiscal 2015; $14.1 million during fiscal 2016; $17.2 million during fiscal 2017; and $71.9 million during fiscal 2018.
The Credit Agreement contains a sublimit of $150 million for the issuance of letters of credit. Standby letters of credit of approximately $49.4 million and $46.7 million, issued as part of the Company's insurance program, were outstanding under the Credit Agreement as of July 26, 2014 and July 27, 2013, respectively. Interest on outstanding standby letters of credit accrued at 2.0% per annum at both July 26, 2014 and July 27, 2013, respectively. Unutilized commitments were at rates per annum of 0.35% at both July 26, 2014 and July 27, 2013.
The Credit Agreement contains affirmative and negative covenants which are customary for similar credit agreements, including, without limitation, limitations on us and our subsidiaries with respect to indebtedness, liens, investments, distributions, mergers and acquisitions, disposition of assets, sale-leaseback transactions, transactions with affiliates and capital expenditures. The Credit Agreement contains financial covenants which require us to (i) maintain a consolidated leverage ratio of not greater than (a) 3.50 to 1.00 for fiscal quarters ending July 27, 2013 through April 26, 2014, (b) 3.25 to 1.00 for fiscal quarters ending July 26, 2014 through April 25, 2015 and (c) 3.00 to 1.00 for fiscal quarters ending July 25, 2015 and each fiscal quarter thereafter, as measured on a trailing four quarter basis at the end of each fiscal quarter, and (ii) maintain a consolidated interest coverage ratio of not less than 3.00 to 1.00, as measured at the end of each fiscal quarter. At
July 26, 2014
and
July 27, 2013
, we were in compliance with the financial covenants of the Credit Agreement and had additional borrowing availability of
$162.6 million
and
$179.3 million
, respectively, as determined by the most restrictive covenants of the Credit Agreement.
On July 28, 2012, Dycom Investments, Inc., one of our subsidiaries, had outstanding an aggregate principal amount of $187.5 million of 7.125% senior subordinated notes due 2021 that were issued under an indenture dated January 21, 2011 (the "Indenture"). On December 12, 2012, an additional $90.0 million in aggregate principal amount of 7.125% senior subordinated notes due 2021 were issued under the Indenture at 104.25% of the principal amount. The resulting debt premium of $3.8 million is being amortized to interest expense over the remaining term of the notes and was $3.2 million and $3.6 million as of July 26, 2014 and July 27, 2013, respectively. The net proceeds of this issuance were used to repay a portion of the borrowings under our Credit Agreement. Holders of all $277.5 million aggregate principal amount of the 2021 Notes vote as one series under the Indenture.
On both July 26, 2014 and July 27, 2013, $277.5 million in aggregate principal amount of 2021 Notes was outstanding under the Indenture. The 2021 Notes are guaranteed by Dycom Investments, Inc.'s parent company and substantially all of our subsidiaries. For additional information regarding these guarantees see Note 20,
Supplemental Consolidating Financial Statements
, in Notes to the Consolidated Financial Statements. The Indenture contains covenants that limit, among other things, our ability to incur additional debt and issue preferred stock, make certain restricted payments, consummate specified asset sales, enter into transactions with affiliates, incur liens, impose restrictions on the ability of our subsidiaries to pay dividends or make payments to us and our restricted subsidiaries, merge or consolidate with another person, and dispose of all or substantially all of its assets.
34
Contractual Obligations.
The following tables set forth our outstanding contractual obligations, including related party leases, as of
July 26, 2014
:
|
|
Less than 1 Year
|
Years 1 – 3
|
Years 3 – 5
|
Greater than 5 Years
|
Total
|
||||||||||||||
|
|
(Dollars in thousands)
|
||||||||||||||||||
|
7.125% senior subordinated notes due 2021
|
$
|
—
|
|
$
|
—
|
|
$
|
—
|
|
$
|
277,500
|
|
$
|
277,500
|
|
||||
|
Credit Agreement – revolving borrowings
|
—
|
|
—
|
|
63,000
|
|
—
|
|
63,000
|
|
|||||||||
|
Credit Agreement – Term Loan
|
10,938
|
|
31,250
|
|
71,875
|
|
—
|
|
114,063
|
|
|||||||||
|
Fixed interest payments on long-term debt (a)
|
19,772
|
|
39,544
|
|
39,544
|
|
29,657
|
|
128,517
|
|
|||||||||
|
Operating lease obligations
|
14,902
|
|
19,993
|
|
7,476
|
|
8,249
|
|
50,620
|
|
|||||||||
|
Employment agreements
|
6,964
|
|
5,062
|
|
154
|
|
—
|
|
12,180
|
|
|||||||||
|
Purchase and other contractual obligations
|
20,975
|
|
—
|
|
—
|
|
—
|
|
20,975
|
|
|||||||||
|
Total
|
$
|
73,551
|
|
$
|
95,849
|
|
$
|
182,049
|
|
$
|
315,406
|
|
$
|
666,855
|
|
||||
|
(a)
|
Includes interest payments on our $277.5 million in aggregate principal amount of 2021 Notes outstanding and excludes any interest payments on our variable rate debt. Variable rate debt as of
July 26, 2014
was comprised of
$114.1 million
outstanding on our Term Loan and
$63.0 million
in outstanding revolving borrowings under our Credit Agreement.
|
Purchase and other contractual obligations in the table above primarily represent obligations under agreements to purchase vehicles and equipment which have not been received as of
July 26, 2014
. We have excluded contractual obligations under the multi-employer defined pension plans that cover certain of our employees as these obligations are determined based on our future union employee payrolls, which cannot be reliably determined as of
July 26, 2014
. During fiscal
2014
,
2013
and
2012
, our contributions to the multiemployer defined pension plan totaled approximately
$3.7 million
, $3.2 million and $2.9 million, respectively.
Our consolidated balance sheet as of
July 26, 2014
includes a long-term liability of approximately
$33.8
million for accrued insurance claims. This liability has been excluded from the above table as the timing of any cash payments is uncertain.
The liability for unrecognized tax benefits for uncertain tax positions was
$2.4 million
and
$2.3 million
at
July 26, 2014
and
July 27, 2013
, respectively, and is included in other liabilities in the consolidated balance sheet. This amount has been excluded from the contractual obligations table because we are unable to reasonably estimate the timing of the resolution of the underlying tax positions with the relevant tax authorities.
Off-Balance Sheet Arrangements.
Performance Bonds and Guarantees – We have obligations under performance and other surety contract bonds related to certain of our customer contracts. Performance bonds generally provide a customer with the right to obtain payment and/or performance from the issuer of the bond if we fail to perform our contractual obligations. As of
July 26, 2014
, we had
$446.8 million
of outstanding performance and other surety contract bonds. The estimated cost to complete projects secured by our outstanding performance and other surety contract bonds was approximately
$99.5 million
as of
July 26, 2014
. There has been no material impact on our financial statements as a result of customers exercising their rights under the bonds. Additionally, we have periodically guaranteed certain obligations of our subsidiaries, including obligations in connection with obtaining state contractor licenses and leasing real property and equipment.
Letters of Credit – We have standby letters of credit issued under our Credit Agreement as part of our insurance program. These letters of credit collateralize our obligations to our insurance carriers in connection with the settlement of potential claims. As of
July 26, 2014
and
July 27, 2013
we had
$49.4 million
and
$46.7 million
, respectively, outstanding standby letters of credit issued under the Credit Agreement.
Backlog.
Our backlog consists of the estimated uncompleted portion of services to be performed under contractual agreements with our customers and totaled
$2.331 billion
and
$2.197 billion
at
July 26, 2014
and
July 27, 2013
, respectively. We expect to complete
57.7%
of the
July 26, 2014
backlog during the next twelve months. Our backlog estimates represent amounts under master service agreements and other contractual agreements for services projected to be performed over the terms of the contracts and are based on contract terms, our historical experience with customers and, more generally, our experience in similar procurements. The significant majority of our backlog estimates comprise services under master service agreements and long-term contracts.
35
Revenue estimates included in our backlog can be subject to change as a result of project accelerations, cancellations or delays due to various factors, including but not limited to commercial issues and adverse weather. These factors can also cause revenue amounts to be realized in periods and at levels different than originally projected. In many instances, our customers are not contractually committed to procure specific volumes of services under a contract. While we have not experienced any material cancellations during fiscal 2014, 2013 or 2012, the majority of our contracts may be canceled by our customers upon notice regardless of whether or not we are in default. Our estimates of a customer's requirements during a particular future period may prove to be inaccurate. The amount of backlog related to uncompleted projects in which a provision for estimated losses was recorded was not material.
Backlog is not a measure defined by United States generally accepted accounting principles; however, it is a common measurement used in our industry. Our methodology for determining backlog may not be comparable to the methodologies used by others.
Legal Proceedings
In October 2012, a former employee of UtiliQuest, LLC ("UtiliQuest"), a wholly-owned subsidiary of the Company, commenced a lawsuit against UtiliQuest in the Superior Court of California. The lawsuit alleges that UtiliQuest violated the California Labor Code, the California Business & Professions Code and the Labor Code Private Attorneys General Act of 2004 by failing to pay for all hours worked (including overtime) and failing to provide meal breaks and accurate wage statements. The plaintiff seeks unspecified damages and other relief on behalf of himself and a putative class of current and former employees of UtiliQuest who worked as locators in the State of California in the four years preceding the filing date of the lawsuit. In January 2013, UtiliQuest removed the case to the United States District Court for the Northern District of California and the plaintiff subsequently filed a Motion to Remand the case back to the California Superior Court. In April 2013, the parties exchanged initial disclosures and in July 2013, the District Court granted plaintiff's Motion to Remand. UtiliQuest filed its second removal of the case to the District Court in October 2013. On January 8, 2014, the District Court remanded the matter back to the California Superior Court. In July 2014, the plaintiff’s attorney and UtiliQuest entered into a memorandum of understanding pursuant to which the parties agreed to the terms of a proposed settlement of the lawsuit. Approval of the proposed settlement by the Court is currently pending. As of July 26, 2014, $0.6 million was included in other accrued liabilities with respect to the settlement.
As disclosed elsewhere in this Annual Report on Form 10-K, we have filed construction liens with respect to approximately $17.7 million for past due balances from a customer on a rural project funded primarily by the Rural Utilities Service agency of the United States Department of Agriculture (the “RUS”) under the American Recovery and Reinvestment Act of 2009. In April 2014, R&R Taylor Construction, Inc. ("R&R"), a construction company, filed suit against this customer alleging that the customer failed to pay for construction services and materials. In its lawsuit, the construction company seeks to foreclose on its construction lien and, ultimately, to foreclose on the parcel of land itself. Pauley Construction, Inc. (“Pauley”), one of our wholly-owned subsidiaries, had performed work on this parcel as part of its work on the rural project described above. Pauley has filed a construction lien on the parcel with respect to past due accounts receivable relating to this project. In July 2014, R&R amended its lawsuit to include Pauley, alleging that its lien has priority over Pauley’s construction lien. Pauley has filed an answer to this amended complaint in the Montana Eighteenth Judicial District Court, a counterclaim against the construction company and a cross-claim against the customer, alleging that Pauley’s lien is superior to all other liens on such parcel of land. It is too early to evaluate the likelihood of an outcome to this matter. We intend to vigorously defend ourselves against this lawsuit as part of ongoing efforts to collect the past due amounts from this customer.
From time to time, we are party to various other claims and legal proceedings. It is the opinion of management, based on information available at this time, that such other pending claims or proceedings will not have a material effect on our financial statements.
Recently Issued Accounting Pronouncements
Refer to Note 1,
Accounting Policies
, of Notes to the Consolidated Financial Statements for a discussion of recent accounting standards and pronouncements.
36
Item 7A
. Quantitative and Qualitative Disclosures About Market Risk.
We are exposed to market risks related to interest rates on our cash and equivalents and our debt obligations. We monitor the effects of market changes on interest rates and manage interest rate risks by investing in short-term cash equivalents with market rates of interest and by maintaining a mix of fixed and variable rate debt obligations.
Our revolving credit facility permits borrowings at a variable rate of interest. On
July 26, 2014
, we had variable rate debt outstanding under the Credit Agreement of
$63.0 million
of revolver borrowings and a
$114.1 million
term loan. Interest related to the borrowings fluctuates based on LIBOR or the base rate of the bank administrative agent of the Credit Agreement. At the current level of borrowings, for every 50 basis point change in the interest rate, interest expense associated with such borrowings would correspondingly increase or decrease by approximately
$0.9 million
annually. Additionally, outstanding long-term debt on
July 26, 2014
included
$277.5 million
of principal amount of the 2021 Notes, which bear a fixed rate of interest of 7.125%. Due to the fixed rate of interest on the notes, changes in interest rates would not have an impact on the related interest expense. The fair value of the outstanding notes was approximately
$297.6 million
on
July 26, 2014
, based on quoted market prices, as compared to
$280.7 million
carrying value (including debt premium of
$3.2 million
). There exists market risk sensitivity on the fair value of the fixed rate notes with respect to changes in interest rates. A hypothetical
50
basis point change in the market interest rates in effect would result in an increase or decrease in the fair value of the notes of approximately
$7.5 million
, calculated on a discounted cash flow basis.
We also have market risk for foreign currency exchange rates related to our operations in Canada. As of
July 26, 2014
, the market risk for foreign currency exchange rates was not significant as our operations in Canada have not been material.
37
Item 8
. Financial Statements and Supplementary Data.
Index to Consolidated Financial Statements
|
Page
|
|
38
DYCOM INDUSTRIES, INC. AND SUBSIDIARIES
JULY 26, 2014 AND JULY 27, 2013
|
|
July 26, 2014
|
July 27, 2013
|
|||||
|
|
(Dollars in thousands)
|
||||||
|
ASSETS
|
|
|
|||||
|
CURRENT ASSETS:
|
|
|
|||||
|
Cash and equivalents
|
$
|
20,672
|
|
$
|
18,607
|
|
|
|
Accounts receivable, net
|
272,741
|
|
252,202
|
|
|||
|
Costs and estimated earnings in excess of billings
|
230,569
|
|
204,349
|
|
|||
|
Inventories
|
49,095
|
|
35,999
|
|
|||
|
Deferred tax assets, net
|
19,932
|
|
16,853
|
|
|||
|
Other current assets
|
12,727
|
|
13,124
|
|
|||
|
Total current assets
|
605,736
|
|
541,134
|
|
|||
|
PROPERTY AND EQUIPMENT, NET
|
205,413
|
|
202,703
|
|
|||
|
GOODWILL
|
269,088
|
|
267,810
|
|
|||
|
INTANGIBLE ASSETS, NET
|
116,116
|
|
125,275
|
|
|||
|
OTHER
|
16,001
|
|
17,286
|
|
|||
|
TOTAL NON-CURRENT ASSETS
|
606,618
|
|
613,074
|
|
|||
|
TOTAL ASSETS
|
$
|
1,212,354
|
|
$
|
1,154,208
|
|
|
|
LIABILITIES AND STOCKHOLDERS' EQUITY
|
|
|
|
|
|||
|
CURRENT LIABILITIES:
|
|
|
|
|
|||
|
Accounts payable
|
$
|
63,318
|
|
$
|
77,954
|
|
|
|
Current portion of debt
|
10,938
|
|
7,813
|
|
|||
|
Billings in excess of costs and estimated earnings
|
13,882
|
|
13,788
|
|
|||
|
Accrued insurance claims
|
32,260
|
|
29,069
|
|
|||
|
Other accrued liabilities
|
76,134
|
|
71,191
|
|
|||
|
Total current liabilities
|
196,532
|
|
199,815
|
|
|||
|
LONG-TERM DEBT (including debt premium of $3.2 million and $3.6 million at July 26, 2014 and July 27, 2013, respectively)
|
446,863
|
|
444,169
|
|
|||
|
ACCRUED INSURANCE CLAIMS
|
33,782
|
|
27,250
|
|
|||
|
DEFERRED TAX LIABILITIES, NET NON-CURRENT
|
45,361
|
|
48,612
|
|
|||
|
OTHER LIABILITIES
|
4,882
|
|
6,001
|
|
|||
|
Total liabilities
|
727,420
|
|
725,847
|
|
|||
|
COMMITMENTS AND CONTINGENCIES, Notes 10, 11 and 18
|
|
|
|
|
|||
|
STOCKHOLDERS' EQUITY:
|
|
|
|
|
|||
|
Preferred stock, par value $1.00 per share: 1,000,000 shares authorized: no shares issued and outstanding
|
—
|
|
—
|
|
|||
|
Common stock, par value $0.33 1/3 per share: 150,000,000 shares authorized: 33,990,589 and 33,264,117 issued and outstanding, respectively
|
11,330
|
|
11,088
|
|
|||
|
Additional paid-in capital
|
131,819
|
|
115,205
|
|
|||
|
Accumulated other comprehensive (loss) income
|
(158
|
)
|
103
|
|
|||
|
Retained earnings
|
341,943
|
|
301,965
|
|
|||
|
Total stockholders' equity
|
484,934
|
|
428,361
|
|
|||
|
TOTAL LIABILITIES AND STOCKHOLDERS' EQUITY
|
$
|
1,212,354
|
|
$
|
1,154,208
|
|
|
|
See notes to the consolidated financial statements.
|
|||||||
39
|
DYCOM INDUSTRIES, INC. AND SUBSIDIARIES
FOR THE YEARS ENDED JULY 26, 2014, JULY 27, 2013, AND JULY 28, 2012
|
|||||||||||
|
|
2014
|
2013
|
2012
|
||||||||
|
|
(Dollars in thousands, except per share amounts)
|
||||||||||
|
REVENUES:
|
|
|
|||||||||
|
Contract revenues
|
$
|
1,811,593
|
|
$
|
1,608,612
|
|
$
|
1,201,119
|
|
||
|
EXPENSES:
|
|
|
|
|
|||||||
|
Costs of earned revenues, excluding depreciation and amortization
|
1,475,045
|
|
1,300,416
|
|
968,949
|
|
|||||
|
General and administrative (including stock-based compensation expense of $12.6 million, $9.9 million and $7.0 million, respectively)
|
161,858
|
|
145,771
|
|
104,024
|
|
|||||
|
Depreciation and amortization
|
92,772
|
|
85,481
|
|
62,693
|
|
|||||
|
Total
|
1,729,675
|
|
1,531,668
|
|
1,135,666
|
|
|||||
|
Interest expense, net
|
(26,827
|
)
|
(23,334
|
)
|
(16,717
|
)
|
|||||
|
Other income, net
|
11,228
|
|
4,589
|
|
15,825
|
|
|||||
|
INCOME BEFORE INCOME TAXES
|
66,319
|
|
58,199
|
|
64,561
|
|
|||||
|
PROVISION (BENEFIT) FOR INCOME TAXES:
|
|
|
|
|
|||||||
|
Current
|
32,664
|
|
25,281
|
|
15,309
|
|
|||||
|
Deferred
|
(6,323
|
)
|
(2,270
|
)
|
9,874
|
|
|||||
|
Total
|
26,341
|
|
23,011
|
|
25,183
|
|
|||||
|
NET INCOME
|
$
|
39,978
|
|
$
|
35,188
|
|
$
|
39,378
|
|
||
|
EARNINGS PER COMMON SHARE:
|
|
|
|
|
|
|
|||||
|
Basic earnings per common share
|
$
|
1.18
|
|
$
|
1.07
|
|
$
|
1.17
|
|
||
|
Diluted earnings per common share
|
$
|
1.15
|
|
$
|
1.04
|
|
$
|
1.14
|
|
||
|
SHARES USED IN COMPUTING EARNINGS PER COMMON SHARE:
|
|
|
|||||||||
|
Basic
|
33,773,158
|
|
33,012,595
|
|
33,653,055
|
|
|||||
|
Diluted
|
34,816,381
|
|
33,782,187
|
|
34,481,895
|
|
|||||
|
See notes to the consolidated financial statements.
|
|||||||||||
40
|
DYCOM INDUSTRIES, INC. AND SUBSIDIARIES
CONSOLIDATED STATEMENTS OF COMPREHENSIVE INCOME
FOR THE YEARS ENDED JULY 26, 2014, JULY 27, 2013, AND JULY 28, 2012
|
|||||||||||
|
2014
|
2013
|
2012
|
|||||||||
|
(Dollars in thousands)
|
|||||||||||
|
NET INCOME
|
$
|
39,978
|
|
$
|
35,188
|
|
$
|
39,378
|
|
||
|
Foreign currency translation losses, net of tax
|
(261
|
)
|
(35
|
)
|
(161
|
)
|
|||||
|
COMPREHENSIVE INCOME
|
$
|
39,717
|
|
$
|
35,153
|
|
$
|
39,217
|
|
||
|
See notes to the consolidated financial statements.
|
|||||||||||
41
|
DYCOM INDUSTRIES, INC. AND SUBSIDIARIES
CONSOLIDATED STATEMENTS OF STOCKHOLDERS' EQUITY
FOR THE YEARS ENDED JULY 26, 2014, JULY 27, 2013, AND JULY 28, 2012
|
||||||||||||||||||||||
|
Common Stock
|
Additional
Paid-in Capital |
Accumulated Other
Comprehensive Income (Loss) |
Retained
Earnings |
Total
Equity |
||||||||||||||||||
|
|
Shares
|
Amount
|
||||||||||||||||||||
|
|
(Dollars in thousands)
|
|||||||||||||||||||||
|
Balances at July 30, 2011
|
33,487,640
|
|
$
|
11,162
|
|
$
|
112,991
|
|
$
|
299
|
|
$
|
227,399
|
|
$
|
351,851
|
|
|||||
|
Stock options exercised
|
617,103
|
|
206
|
|
6,284
|
|
—
|
|
—
|
|
6,490
|
|
||||||||||
|
Non-cash stock-based compensation expense
|
5,168
|
|
2
|
|
6,780
|
|
—
|
|
—
|
|
6,782
|
|
||||||||||
|
Issuance of restricted stock, net of tax withholdings
|
75,533
|
|
25
|
|
(354
|
)
|
—
|
|
—
|
|
(329
|
)
|
||||||||||
|
Repurchase of common stock
|
(597,700
|
)
|
(199
|
)
|
(12,761
|
)
|
—
|
|
—
|
|
(12,960
|
)
|
||||||||||
|
Other comprehensive loss
|
—
|
|
—
|
|
—
|
|
(161
|
)
|
—
|
|
(161
|
)
|
||||||||||
|
Tax benefits from stock-based compensation
|
—
|
|
—
|
|
1,880
|
|
—
|
|
—
|
|
1,880
|
|
||||||||||
|
Net income
|
—
|
|
—
|
|
—
|
|
—
|
|
39,378
|
|
39,378
|
|
||||||||||
|
Balances at July 28, 2012
|
33,587,744
|
|
11,196
|
|
114,820
|
|
138
|
|
266,777
|
|
392,931
|
|
||||||||||
|
Stock options exercised
|
544,162
|
|
181
|
|
5,072
|
|
—
|
|
—
|
|
5,253
|
|
||||||||||
|
Non-cash stock-based compensation expense
|
5,674
|
|
2
|
|
9,900
|
|
—
|
|
—
|
|
9,902
|
|
||||||||||
|
Issuance of restricted stock, net of tax withholdings
|
173,537
|
|
58
|
|
(942
|
)
|
—
|
|
—
|
|
(884
|
)
|
||||||||||
|
Repurchase of common stock
|
(1,047,000
|
)
|
(349
|
)
|
(14,854
|
)
|
—
|
|
—
|
|
(15,203
|
)
|
||||||||||
|
Other comprehensive loss
|
—
|
|
—
|
|
—
|
|
(35
|
)
|
—
|
|
(35
|
)
|
||||||||||
|
Tax benefits from stock-based compensation
|
—
|
|
—
|
|
1,209
|
|
—
|
|
—
|
|
1,209
|
|
||||||||||
|
Net income
|
—
|
|
—
|
|
—
|
|
—
|
|
35,188
|
|
35,188
|
|
||||||||||
|
Balances at July 27, 2013
|
33,264,117
|
|
11,088
|
|
115,205
|
|
103
|
|
301,965
|
|
428,361
|
|
||||||||||
|
Stock options exercised
|
803,796
|
|
268
|
|
14,300
|
|
—
|
|
—
|
|
14,568
|
|
||||||||||
|
Non-cash stock-based compensation expense
|
3,999
|
|
1
|
|
12,595
|
|
—
|
|
—
|
|
12,596
|
|
||||||||||
|
Issuance of restricted stock, net of tax withholdings
|
279,577
|
|
93
|
|
(3,874
|
)
|
—
|
|
—
|
|
(3,781
|
)
|
||||||||||
|
Repurchase of common stock
|
(360,900
|
)
|
(120
|
)
|
(9,879
|
)
|
—
|
|
—
|
|
(9,999
|
)
|
||||||||||
|
Other comprehensive loss
|
—
|
|
—
|
|
—
|
|
(261
|
)
|
—
|
|
(261
|
)
|
||||||||||
|
Tax benefits from stock-based compensation
|
—
|
|
—
|
|
3,472
|
|
—
|
|
—
|
|
3,472
|
|
||||||||||
|
Net income
|
—
|
|
—
|
|
—
|
|
—
|
|
39,978
|
|
39,978
|
|
||||||||||
|
Balances at July 26, 2014
|
33,990,589
|
|
$
|
11,330
|
|
$
|
131,819
|
|
$
|
(158
|
)
|
$
|
341,943
|
|
$
|
484,934
|
|
|||||
|
See notes to the consolidated financial statements.
|
||||||||||||||||||||||
42
|
DYCOM INDUSTRIES, INC. AND SUBSIDIARIES
FOR THE YEARS ENDED JULY 26, 2014, JULY 27, 2013, AND JULY 28, 2012
|
|||||||||||
|
2014
|
2013
|
2012
|
|||||||||
|
|
(Dollars in thousands)
|
||||||||||
|
OPERATING ACTIVITIES:
|
|
|
|||||||||
|
Net income
|
$
|
39,978
|
|
$
|
35,188
|
|
$
|
39,378
|
|
||
|
Adjustments to reconcile net income to net cash provided by operating activities, net of acquisitions:
|
|||||||||||
|
Depreciation and amortization
|
92,772
|
|
85,481
|
|
62,693
|
|
|||||
|
Bad debt expense, net
|
615
|
|
139
|
|
186
|
|
|||||
|
Gain on sale of fixed assets
|
(10,706
|
)
|
(4,683
|
)
|
(15,430
|
)
|
|||||
|
Deferred income tax (benefit) provision
|
(6,323
|
)
|
(2,270
|
)
|
9,874
|
|
|||||
|
Stock-based compensation
|
12,596
|
|
9,902
|
|
6,782
|
|
|||||
|
Write-off of deferred financing costs
|
—
|
|
321
|
|
—
|
|
|||||
|
Amortization of premium on long-term debt
|
(369
|
)
|
(218
|
)
|
—
|
|
|||||
|
Amortization of debt issuance costs and other
|
1,916
|
|
1,652
|
|
1,297
|
|
|||||
|
Excess tax benefit from share-based awards
|
(3,025
|
)
|
(1,283
|
)
|
(1,625
|
)
|
|||||
|
Other
|
—
|
|
57
|
|
(105
|
)
|
|||||
|
Change in operating assets and liabilities:
|
|||||||||||
|
Accounts receivable, net
|
(16,949
|
)
|
3,625
|
|
(3,421
|
)
|
|||||
|
Costs and estimated earnings in excess of billings, net
|
(25,356
|
)
|
(12,338
|
)
|
(35,693
|
)
|
|||||
|
Other current assets and inventory
|
(12,843
|
)
|
(1,083
|
)
|
(6,403
|
)
|
|||||
|
Other assets
|
(555
|
)
|
(31
|
)
|
62
|
|
|||||
|
Income taxes receivable/payable
|
6,685
|
|
5,994
|
|
5,747
|
|
|||||
|
Accounts payable
|
(4,244
|
)
|
(11,163
|
)
|
2,978
|
|
|||||
|
Accrued liabilities, insurance claims, and other liabilities
|
9,993
|
|
(2,546
|
)
|
(1,195
|
)
|
|||||
|
Net cash provided by operating activities
|
84,185
|
|
106,744
|
|
65,125
|
|
|||||
|
INVESTING ACTIVITIES:
|
|
|
|||||||||
|
Cash paid for acquisitions, net of cash acquired
|
(17,088
|
)
|
(330,291
|
)
|
—
|
|
|||||
|
Capital expenditures
|
(89,136
|
)
|
(64,650
|
)
|
(77,612
|
)
|
|||||
|
Proceeds from sale of assets
|
15,407
|
|
5,827
|
|
24,783
|
|
|||||
|
Changes in restricted cash
|
(303
|
)
|
60
|
|
926
|
|
|||||
|
Net cash used in investing activities
|
(91,120
|
)
|
(389,054
|
)
|
(51,903
|
)
|
|||||
|
FINANCING ACTIVITIES:
|
|
|
|||||||||
|
Proceeds from issuance of 7.125% senior subordinated notes due 2021 (including $3.8 million premium on fiscal 2013 issuance)
|
—
|
|
93,825
|
|
—
|
|
|||||
|
Proceeds from Term Loan on senior Credit Agreement
|
—
|
|
125,000
|
|
—
|
|
|||||
|
Proceeds from borrowings on senior Credit Agreement
|
502,000
|
|
404,500
|
|
—
|
|
|||||
|
Principal payments on senior Credit Agreement, including Term Loan
|
(495,813
|
)
|
(358,625
|
)
|
—
|
|
|||||
|
Debt issuance costs
|
—
|
|
(6,739
|
)
|
—
|
|
|||||
|
Repurchases of common stock
|
(9,999
|
)
|
(15,203
|
)
|
(12,960
|
)
|
|||||
|
Exercise of stock options and other
|
14,568
|
|
5,253
|
|
6,490
|
|
|||||
|
Restricted stock tax withholdings
|
(3,781
|
)
|
(884
|
)
|
(329
|
)
|
|||||
|
Excess tax benefit from share-based awards
|
3,025
|
|
1,283
|
|
1,625
|
|
|||||
|
Principal payments on other financing activities
|
(1,000
|
)
|
(74
|
)
|
(233
|
)
|
|||||
43
|
DYCOM INDUSTRIES, INC. AND SUBSIDIARIES
CONSOLIDATED STATEMENTS OF CASH FLOWS
FOR THE YEARS ENDED JULY 26, 2014, JULY 27, 2013, AND JULY 28, 2012
(continued)
|
|||||||||||
|
Net cash provided by (used in) financing activities
|
9,000
|
|
248,336
|
|
(5,407
|
)
|
|||||
|
Net increase (decrease) in cash and equivalents
|
2,065
|
|
(33,974
|
)
|
7,815
|
|
|||||
|
CASH AND EQUIVALENTS AT BEGINNING OF PERIOD
|
18,607
|
|
52,581
|
|
44,766
|
|
|||||
|
CASH AND EQUIVALENTS AT END OF PERIOD
|
$
|
20,672
|
|
$
|
18,607
|
|
$
|
52,581
|
|
||
|
SUPPLEMENTAL DISCLOSURE OF OTHER CASH FLOW ACTIVITIES AND NON-CASH INVESTING AND FINANCING ACTIVITIES:
|
|
|
|
|
|
|
|||||
|
Cash paid during the period for:
|
|
|
|
|
|
|
|||||
|
Interest
|
$
|
25,291
|
|
$
|
21,414
|
|
$
|
15,443
|
|
||
|
Income taxes
|
$
|
26,738
|
|
$
|
19,128
|
|
$
|
10,722
|
|
||
|
Purchases of capital assets included in accounts payable or other accrued liabilities at period end
|
$
|
2,651
|
|
$
|
13,639
|
|
$
|
4,593
|
|
||
|
See notes to the consolidated financial statements.
|
|||||||||||
44
NOTES TO THE CONSOLIDATED FINANCIAL STATEMENTS
1. Basis of Presentation and Accounting Policies
Basis of Presentation
Dycom Industries, Inc. ("Dycom" or the "Company") is a leading provider of specialty contracting services throughout the United States and in Canada. The Company's services include engineering, construction, maintenance and installation services to telecommunications providers, underground facility locating services to various utilities, including telecommunications providers, and other construction and maintenance services to electric and gas utilities and others.
The consolidated financial statements include the results of Dycom and its subsidiaries, all of which are wholly-owned. All intercompany accounts and transactions have been eliminated and the financial statements reflect all adjustments, consisting of only normal recurring accruals that are, in the opinion of management, necessary for a fair presentation of such statements. These financial statements have been prepared in accordance with accounting principles generally accepted in the United States of America ("GAAP") pursuant to the rules and regulations of the Securities and Exchange Commission ("SEC").
Segment Information –
The Company operates in
one
reportable segment as a specialty contractor, providing engineering, construction, maintenance and installation services to telecommunications providers, underground facility locating services to various utilities, including telecommunications providers, and other construction and maintenance services to electric and gas utilities and others. The Company operates on a decentralized basis through its operating segments, each of which consists of a legal subsidiary (or in limited cases, the combination of
two
or more subsidiaries). Management of the operating segments report to the Company's Chief Operating Officer who reports to the Chief Executive Officer, the chief operating decision maker. All of the Company's operating segments have been aggregated into one reportable segment due to their similar economic characteristics, nature of services and production processes, type of customers, and service distribution methods. The Company's services are provided by its operating segments throughout the United States and in Canada. Revenues from services provided in Canada were approximately
$12.2 million
,
$13.0 million
and
$11.9 million
during
fiscal 2014
,
2013
and
2012
, respectively. The Company had no material long-lived assets in Canada at
July 26, 2014
or
July 27, 2013
.
Significant Acquisitions –
On December 3, 2012, the Company acquired substantially all of the telecommunications infrastructure services subsidiaries of Quanta Services, Inc. The results of operations of these subsidiaries are included in the accompanying consolidated financial statements from the date of acquisition. See Note 3,
Acquisitions
, for further information regarding the Company's acquisitions.
Accounting Period –
The Company uses a fiscal year ending on the last Saturday in July.
Significant Accounting Policies & Estimates
Use of Estimates –
The preparation of financial statements in conformity with GAAP requires management to make certain estimates and assumptions that affect the amounts reported in these consolidated financial statements and accompanying notes. For the Company, key estimates include: recognition of revenue for costs and estimated earnings under the percentage of completion method of accounting, allowance for doubtful accounts, the fair value of reporting units for goodwill impairment analysis, the assessment of impairment of intangibles and other long-lived assets, the purchase price allocations of businesses acquired, accrued insurance claims, income taxes, asset lives used in computing depreciation and amortization, stock-based compensation expense for performance-based stock awards, and accruals for contingencies, including legal matters. At the time they are made, the Company believes that such estimates are fair when considered in conjunction with the consolidated financial position and results of operations taken as a whole. However, actual results could differ materially from those estimates.
Revenue Recognition –
The Company recognizes revenues under the percentage of completion method of accounting using the units-of-delivery or cost-to-cost measures. A majority of the Company’s services are performed under master service agreements with customers which contain customer-specified service requirements, such as discrete pricing for individual tasks. Revenue is recognized under these arrangements based on units-of-delivery and revenue is recognized as each unit is completed. Revenues from contracts using the cost-to-cost measures of completion are recognized based on the ratio of contract costs incurred to date to total estimated contract costs and represented less than 10% of the Company’s contract revenues during each of
fiscal 2014
,
2013
and
2012
. In addition, the Company has an immaterial amount of revenue for services provided under time and material contracts that are recognized as the work is performed. There were no material amounts of unapproved change orders or claims recognized during
fiscal 2014
,
2013
or
2012
. The current asset “Costs and estimated earnings in excess
45
of billings” represents revenues recognized in excess of amounts billed. The current liability “Billings in excess of costs and estimated earnings” represents billings in excess of revenues recognized.
Application of the percentage of completion method of accounting requires the use of estimates of costs to be incurred for the performance of the contract. The cost estimation process is based on the knowledge and experience of the Company’s project managers and financial professionals. Factors that the Company considers in estimating the work to be completed and ultimate contract recovery include the availability and productivity of labor, the nature and complexity of the work to be performed, the effect of change orders, the availability of materials, the effect of any delays in performance and the recoverability of any claims. Changes in job performance, job conditions, estimated profitability and final contract settlements may result in changes to costs and income and their effects are recognized in the period in which the revisions are determined. At the time a loss on a contract becomes known, the entire amount of the estimated ultimate loss is accrued. For
fiscal 2014
,
2013
and
2012
, there have been no material changes in estimates for amounts in the consolidated financial statements.
Cash and Equivalents
– Cash and equivalents primarily include balances on deposit in banks. The Company maintains substantially all of its cash and equivalents at financial institutions it believes to be of high credit quality. To date, the Company has not experienced any loss or lack of access to cash in its operating accounts.
Restricted Cash –
As of
July 26, 2014
and
July 27, 2013
, the Company had approximately
$4.0 million
and
$3.7 million
, respectively, in restricted cash which is held as collateral in support of the Company's insurance obligations. Restricted cash is included in other current assets and other assets in the consolidated balance sheets and changes in restricted cash are reported in cash flows used in investing activities in the consolidated statements of cash flows.
Allowance for Doubtful Accounts –
The Company grants credit under normal payment terms, generally without collateral, to its customers. The Company maintains an allowance for doubtful accounts for estimated losses resulting from the failure of its customers to make required payments. With respect to certain customers, the Company has statutory lien rights which may assist in its collection efforts. Management analyzes the collectability of accounts receivable balances each period. This analysis considers the aging of account balances, historical bad debt experience, changes in customer creditworthiness, current economic trends, customer payment activity and other relevant factors. Should any of these factors change, the estimates made by management may also change, which could affect the level of the Company’s future provision for doubtful accounts. The Company recognizes an increase in the allowance for doubtful accounts when it is probable that a receivable is not collectible and the loss can be reasonably estimated. Any increase in the allowance account has a corresponding negative effect on the Company's results of operations. See Note 4,
Accounts Receivable
, for further information regarding the Company's accounts receivable.
Inventories –
Inventories consist of materials and supplies used in the ordinary course of business and are carried at the lower of cost (using the first-in, first-out method) or market. Inventories also include certain job specific materials which are valued using the specific identification method. For contracts where the Company is required to supply part or all of the materials on behalf of the customer, the loss of the customer or declines in contract volumes could result in an impairment of the value of materials purchased.
Property and Equipment –
Property and equipment are stated at cost and depreciated on a straight-line basis over their estimated useful lives (see Note 6,
Property and Equipment
, for the range of useful lives). Maintenance and repairs are expensed as incurred and major improvements are capitalized. When assets are sold or retired, the cost and related accumulated depreciation are removed from the accounts and the resulting gain or loss is included in other income. Capitalized software is accounted for in accordance with Financial Accounting Standards Board ("FASB") Accounting Standard Codification ("ASC") Topic 350-40,
Internal Use Software.
Capitalized software consists primarily of costs to purchase and develop internal-use software and is amortized over its useful life as a component of depreciation expense. Property and equipment includes internally developed capitalized computer software gross cost and net book value of
$26.5 million
and
$16.5 million
, respectively, as of
July 26, 2014
, and gross cost and net book value of
$18.3 million
and
$11.6 million
, respectively, as of
July 27, 2013
.
Goodwill and Intangible Assets –
The Company accounts for goodwill and other intangibles in accordance with ASC Topic 350,
Intangibles-Goodwill and Other
("ASC Topic 350"). The Company's goodwill and other indefinite-lived intangible assets are assessed annually for impairment as of the first day of the fourth fiscal quarter of each year, or more frequently if events occur that would indicate a potential reduction in the fair value of a reporting unit below its carrying value. The Company performs its annual impairment review of goodwill at the reporting unit level. Each of the Company's operating segments with goodwill represents a reporting unit for the purpose of assessing impairment. If the Company determines the fair value of goodwill or other indefinite-lived intangible assets is less than their carrying value as a result of the tests, an impairment loss is
46
recognized. Impairment losses, if any, are reflected in operating income or loss in the consolidated statements of operations during the period incurred.
In accordance with ASC Topic 360,
Impairment or Disposal of Long-Lived Assets,
the Company reviews finite-lived intangible assets for impairment whenever an event occurs or circumstances change which indicates that the carrying amount of such assets may not be fully recoverable. Recoverability is determined based on an estimate of undiscounted future cash flows resulting from the use of an asset and its eventual disposition. Should an asset not be recoverable, an impairment loss is measured by comparing the fair value of the asset to its carrying value. If the Company determines the fair value of an asset is less than the carrying value, an impairment loss is incurred. Impairment losses, if any, are reflected in operating income or loss in the consolidated statements of operations during the period incurred.
The Company uses judgment in assessing if goodwill and intangible assets are impaired. Estimates of fair value are based on the Company's projection of revenues, operating costs, and cash flows taking into consideration historical and anticipated future results, general economic and market conditions, as well as the impact of planned business or operational strategies. To measure fair value, the Company employs a combination of present value techniques which reflect market factors. Changes in the Company's judgments and projections could result in significantly different estimates of fair value potentially resulting in additional impairments of goodwill and other intangible assets. The inputs used for fair value measurements of the reporting units and other related indefinite-lived intangible assets are the lowest level (Level 3) inputs.
Business Combinations –
The
Company accounts for business combinations under the acquisition method of accounting. The purchase price of each acquired business is allocated to the tangible and intangible assets acquired and the liabilities assumed on the basis of their respective fair values on the date of acquisition. Any excess of the purchase price over the fair value of the separately identifiable assets acquired and the liabilities assumed is allocated to goodwill. Purchase price allocations are based on information regarding the fair value of assets acquired and liabilities assumed as of the dates of acquisition. Management determines the fair values used in purchase price allocations for intangible assets based on historical data, estimated discounted future cash flows, contract backlog amounts, if applicable, and expected royalty rates for trademarks and trade names, as well as certain other assumptions. The valuation of assets acquired and liabilities assumed requires a number of judgments and is subject to revision as additional information about the fair value of assets and liabilities becomes available. Additional information, which existed as of the acquisition date but at that time was unknown to the Company, may become known during the remainder of the measurement period, a period not to exceed twelve months from the acquisition date. Adjustments in the purchase price allocation during the measurement period may require a recasting of the amounts allocated to goodwill and intangible assets. Acquisition costs are expensed as incurred. The results of operations of businesses acquired are included in the accompanying consolidated financial statements from their dates of acquisition.
Long-Lived Tangible Assets –
The Company reviews long-lived tangible assets for impairment whenever events or changes in circumstances indicate that the carrying amount of such assets may not be fully recoverable. Determination of recoverability is based on an estimate of undiscounted future cash flows resulting from the use of an asset group and its eventual disposition. Measurement of an impairment loss is based on the fair value of the asset compared to its carrying value. Long-lived tangible assets to be disposed of are reported at the lower of carrying amount or fair value less costs to sell.
Accrued Insurance Claims –
Within the Company's insurance program, it retains the risk of loss, up to certain limits, for claims related to automobile liability, general liability, workers' compensation, employee group health, and damages relating to underground facility locating services. The Company has established reserves that it believes to be adequate based on current evaluations and its experience with these types of claims. A liability for unpaid claims and the associated claim expenses, including incurred but not reported losses, is determined with the assistance of an actuary and reflected in the consolidated financial statements as accrued insurance claims. The effect on the Company's financial statements is generally limited to the amount needed to satisfy its insurance deductibles or retentions. The liability for accrued claims and related accrued processing costs was
$66.0 million
and
$56.3 million
at
July 26, 2014
and
July 27, 2013
, respectively, and included incurred but not reported losses of approximately
$32.1 million
and
$26.0 million
, respectively. Based on prior payment patterns for similar claims,
$32.3 million
and
$29.1 million
of the amounts accrued at
July 26, 2014
and
July 27, 2013
, respectively, were expected to be paid within the next twelve months.
The Company estimates the liability for claims based on facts, circumstances and historical evidence. When loss reserves are recorded they are not discounted, even though they will not be paid until sometime in the future. Factors affecting the determination of the expected cost for existing and incurred but not reported claims include, but are not limited to, the estimated number of future claims, the payment pattern of claims which have been incurred, changes in the medical condition of claimants, and other factors such as inflation, tort reform or other legislative changes, unfavorable jury decisions and court interpretations.
47
Per Share Data –
Basic earnings per common share is computed based on the weighted average number of shares outstanding during the period, excluding unvested restricted share units. Diluted earnings per common share includes the weighted average number of common shares outstanding during the period and dilutive potential common shares, including unvested restricted share units. Performance share awards are included in diluted weighted average number of common shares outstanding based upon the quantity that would be issued if the end of the reporting period were the end of the term of the award. Stock options, time-based restricted share units ("RSUs") and performance-based restricted share units ("Performance RSUs") are included in diluted weighted average number of common shares outstanding by applying the treasury stock method. Common stock equivalents related to stock options are excluded from diluted earnings per common share calculations if their effect would be anti-dilutive.
Stock-Based Compensation –
The Company's stock-based award programs are intended to attract, retain and reward talented employees, officers and directors, and to align stockholder and employee interests. The Company has granted stock-based awards under its 2012 Long-Term Incentive Plan ("2012 Plan"), 2003 Long-Term Incentive Plan ("2003 Plan") and the 2007 Non-Employee Directors Equity Plan ("2007 Directors Plan" and, together with the 2012 Plan and 2003 Plan, the "Plans"). In addition, awards are outstanding under other plans under which no further awards will be granted. The Company's policy is to issue new shares to satisfy equity awards under the Plans. The Plans provide for several types of stock-based awards, including stock options, restricted shares, performance shares, restricted share units, performance share units, and stock appreciation rights. The total number of shares available for grant under the Plans as of
July 26, 2014
was
1,433,653
.
Compensation expense for stock-based awards is based on the fair value at the measurement date and is included in general and administrative expenses in the consolidated statements of operations. The fair value of RSUs and Performance RSUs is estimated on the date of grant and is generally equal to the closing stock price on that date. RSUs and Performance RSUs are settled in one share of the Company’s common stock upon vesting. RSUs vest ratably over a period of
four
years and generally, upon each annual vesting,
50%
of the newly vested shares (net of any shares used to satisfy tax withholding obligations) are restricted from sale or transferability ("restricted holdings"). The restrictions on sale or transferability of the restricted holdings will end
90 days
after termination of employment of the holder.
When the holder has accumulated restricted holdings having a value equal to or greater than the holder’s annual base salary then in effect, future grants will no longer be subject to the restriction on transferability.
Performance RSUs vest over a period of
three
years from the date of grant if certain performance goals are achieved. The performance targets are based on the Company's fiscal year operating earnings (adjusted for certain amounts) as a percentage of contract revenues and the Company's fiscal year operating cash flow level. For the fiscal 2014 performance period, the performance targets exclude amounts recorded for the amortization of intangible assets of businesses acquired in fiscal 2013. Additionally, certain awards include
three
-year performance goals which, if met, result in supplemental shares awarded. The three-year performance criteria required to earn supplemental awards is more difficult than that required to earn annual target awards and is based on the Company's
three
-year cumulative operating earnings (adjusted for certain amounts) as a percentage of contract revenues and the Company's three-year cumulative operating cash flow level.
The fair value of stock option grants is estimated on the date of grant using the Black-Scholes option pricing model based on certain assumptions including: expected volatility based on the historical price of the Company's stock over the expected life of the option; the risk free rate of return based on the U.S. Treasury yield curve in effect at the time of grant for the expected term of the option; the expected life based on the period of time the options are expected to be outstanding using historical data to estimate option exercise and employee termination; and dividend yield based on the Company's history and expectation of dividend payments. Stock options generally vest ratably over a
four
-year period and are exercisable over a period of up to
ten years
.
The total amount of stock-based compensation expense ultimately recognized is based on the number of awards that actually vest and fluctuates as a result of performance criteria for performance-based awards, as well as the vesting period of all stock-based awards. For Performance RSUs, the Company evaluates compensation expense quarterly and recognizes expense for performance-based awards only if management determines it is probable that the performance criteria for the awards will be met. Accordingly, the amount of compensation expense recognized during any fiscal year may not be representative of future stock-based compensation expense.
Income Taxes –
The Company accounts for income taxes under the asset and liability method. This approach requires the recognition of deferred tax assets and liabilities for the expected future tax consequences of temporary differences between the carrying amounts and the tax bases of assets and liabilities. The Company’s effective income tax rate differs from the statutory rate for the tax jurisdictions where it operates primarily as the result of the impact of state income taxes, non-deductible and non-taxable items and tax credits recognized in relation to pre-tax results. Measurement of certain aspects of the Company’s tax positions are based on interpretations of tax regulations, federal and state case law and the applicable statutes. The effect of a change in tax rates on deferred tax assets and liabilities is recognized in income in the period that includes the enactment date. The Company records net deferred tax assets to the extent it believes these assets will more likely than not be realized. In
48
making such determination, the Company considers all available positive and negative evidence, including future reversals of existing taxable temporary differences, projected future taxable income, tax planning strategies and recent financial operations. In the event the Company determines that it would be able to realize its deferred income tax assets in the future in excess of their net recorded amount, it would make an adjustment to the valuation allowance, which would reduce the provision for income taxes.
In the normal course of business, tax positions exist for which the ultimate outcome is uncertain. ASC Topic 740,
Income Taxes
("ASC Topic 740") prescribes a two-step process for the financial statement recognition and measurement of income tax positions taken or expected to be taken in an income tax return. The first step involves an evaluation of the underlying tax position based solely on technical merits (such as tax law) and the second step involves measuring the tax position based on the probability of it being sustained in the event of a tax examination. The Company recognizes tax benefits at the largest amount that it deems more likely than not will be realized upon ultimate settlement of any tax uncertainty. Tax positions that fail to qualify for recognition are recognized in the period in which the more-likely-than-not standard has been reached, when the tax positions are resolved with the respective taxing authority or when the statute of limitations for tax examination has expired. The Company recognizes interest related to unrecognized tax benefits in interest expense and penalties in general and administrative expenses.
In September 2013, the U.S. Internal Revenue Service (the "IRS") issued new regulations for capitalizing and deducting costs incurred to acquire, produce, or improve tangible property. These new regulations are effective beginning with the Company's fiscal 2015 year. As a result of the new regulations, the Company is required to determine which, if any, income tax accounting method changes are needed and the potential financial statement impact. Because additional guidance from the IRS is anticipated, the Company is in the process of reviewing its existing income tax accounting methods related to tangible property. Based on the Company’s initial assessment, the new regulations will not have a material effect on the Company’s consolidated financial statements.
Fair Value of Financial Instruments –
The Company's financial instruments consist primarily of cash and equivalents, restricted cash, accounts receivables, income taxes receivable and payable, accounts payable and certain accrued expenses, and long-term debt. The carrying amounts of these items approximate fair value due to their short maturity, except for the Company's outstanding
7.125%
senior subordinated notes due 2021 (the "2021 Notes") which are based on observable market-based inputs (Level 2) as of
July 26, 2014
and
July 27, 2013
. See Note 10,
Debt
, for further information regarding the fair value of the 2021 Notes. The Company's cash and equivalents are based on quoted market prices in active markets for identical assets (Level 1) as of
July 26, 2014
and
July 27, 2013
. During
fiscal 2014
and
fiscal 2013
, the Company had no significant non-recurring fair value measurements of assets or liabilities subsequent to their initial recognition.
Taxes Collected from Customers
–
ASC Topic 605,
Taxes Collected from Customers and Remitted to Governmental Authorities
, addresses the income statement presentation of any taxes collected from customers and remitted to a government authority and provides that the presentation of taxes on either a gross basis or a net basis in an accounting policy decision that should be disclosed. The Company's policy is to present contract revenues net of sales taxes.
Recently Issued Accounting Pronouncements
Adoption of New Accounting Pronouncements
In July 2012, the FASB issued Accounting Standards Update No. 2012-02,
Intangibles-Goodwill and Other (Topic 350): Testing Indefinite-Lived Intangible Assets for Impairment
("ASU 2012-02"). ASU 2012-02 permits entities first to assess qualitative factors to determine whether it is more likely than not that an indefinite-lived intangible asset is impaired as a basis for determining whether it is necessary to perform the quantitative impairment test pursuant to ASC Subtopic 350-30. If the entity determines that it is more likely than not that such asset is not impaired based on its qualitative assessment, no further testing is required. The Company adopted ASU 2012-02 in fiscal 2014 and it did not have a material effect on the Company's consolidated financial statements.
Accounting Standards Not Yet Adopted
In February 2013, the FASB issued Accounting Standards Update No. 2013-04,
Liabilities (Topic 405): Obligations Resulting from Joint and Several Liability Arrangements for Which the Total Amount of the Obligation Is Fixed at the Reporting Date (a consensus of the FASB Emerging Issues Task Force)
("ASU 2013-04"). ASU 2013-04 provides guidance related to the recognition, measurement, and disclosure of obligations resulting from joint and several liability arrangements for which the total amount of the obligation is fixed at the reporting date. ASU 2013-04 will be effective for the Company's fiscal
49
years beginning fiscal 2015 and interim reporting periods within that year. The adoption of this guidance is not expected to have a material effect on the Company's consolidated financial statements.
In July 2013, the FASB issued Accounting Standards Update No. 2013-11,
Income Taxes (Topic 740): Presentation of an Unrecognized Tax Benefit When a Net Operating Loss Carryforward, a Similar Tax Loss, or a Tax Credit Carryforward Exists
("ASU 2013-11"). ASU 2013-11 is intended to end inconsistent practices regarding the presentation of unrecognized tax benefits when a net operating loss, a similar tax loss or a tax credit carryforward is available to reduce the taxable income or tax payable that would result from the disallowance of a tax position. ASU 2013-11 will be effective for the Company's fiscal years beginning fiscal 2015 and interim periods within that year. The adoption of this guidance is not expected to have a material effect on the Company's consolidated financial statements.
In April 2014, the FASB issued Accounting Standards Update No. 2014-08,
Presentation of Financial Statements (Topic 205) and Property, Plant, and Equipment (Topic 360): Reporting Discontinued Operations and Disclosures of Disposals of Components of an Entity
("ASU 2014-08"). ASU 2014-08 changes the criteria for reporting discontinued operations. In accordance with ASU 2014-08, a disposal of a component of an entity or a group of components of an entity is required to be reported in discontinued operations only if the disposal represents a strategic shift that has (or will have) a major effect on an entity’s operations and financial results. ASU 2014-08 also requires expanded disclosures about the assets, liabilities, income, and expenses of discontinued operations as well as disclosure of the pre-tax income rising from a disposal of a significant part of an organization that does not qualify for discontinued operations reporting. ASU 2014-08 will be effective for the Company's fiscal years beginning fiscal 2016 and interim reporting periods within that year. Early adoption is permitted only for disposals that have not been reported in financial statement previously issued or available for issuance. The Company is currently evaluating the effect of the adoption of this guidance on the consolidated financial statements.
In May 2014, the FASB issued Accounting Standards Update No. 2014-09,
Revenue from Contracts with Customers (Topic 606)
, ("ASU 2014-09"). ASU 2014-09 requires entities to recognize revenue to depict the transfer of promised goods or services to customers in an amount that reflects the consideration to which the entity expects to be entitled in exchange for those goods or services. ASU 2014-09 requires entities to disclose both qualitative and quantitative information that enables users of financial statements to understand the nature, amount, timing and uncertainty of revenue and cash flows arising from contracts with customers, including disclosure of significant judgments affecting the recognition of revenue. ASU 2014-09 will be effective for the Company's fiscal years beginning fiscal 2018 and interim reporting periods within that year, using either the retrospective or cumulative effect transition method. Early adoption is not permitted. The Company is currently evaluating the effect of the adoption of this guidance on the consolidated financial statements.
2. Computation of Earnings Per Common Share
The following table sets forth the computation of basic and diluted earnings per common share:
|
|
Fiscal Year Ended
|
||||||||||
|
|
2014
|
2013
|
2012
|
||||||||
|
|
(Dollars in thousands, except per share amounts)
|
||||||||||
|
Net income available to common stockholders (numerator)
|
$
|
39,978
|
|
$
|
35,188
|
|
$
|
39,378
|
|
||
|
Weighted-average number of common shares (denominator)
|
33,773,158
|
|
33,012,595
|
|
33,653,055
|
|
|||||
|
Basic earnings per common share
|
$
|
1.18
|
|
$
|
1.07
|
|
$
|
1.17
|
|
||
|
Weighted-average number of common shares
|
33,773,158
|
|
33,012,595
|
|
33,653,055
|
|
|||||
|
Potential common stock arising from stock options, and unvested restricted share units
|
1,043,223
|
|
769,592
|
|
828,840
|
|
|||||
|
Total shares-diluted (denominator)
|
34,816,381
|
|
33,782,187
|
|
34,481,895
|
|
|||||
|
Diluted earnings per common share
|
$
|
1.15
|
|
$
|
1.04
|
|
$
|
1.14
|
|
||
|
Anti-dilutive weighted shares excluded from the calculation of earnings per share
|
586,389
|
|
1,204,116
|
|
1,262,964
|
|
|||||
50
3. Acquisitions
Fiscal 2013
- On December 3, 2012, Dycom acquired substantially all of the telecommunications infrastructure services subsidiaries (the "Acquired Subsidiaries") of Quanta Services, Inc. for the sum of
$275.0 million
in cash, an adjustment of approximately
$40.4 million
for working capital received in excess of a target amount, and approximately
$3.7
million for other specified items. The acquisition was funded through a combination of borrowings under a new
$400 million
credit facility and cash on hand. On December 12, 2012, Dycom Investments, Inc., a wholly-owned subsidiary of the Company, issued
$90.0 million
of
7.125%
senior subordinated notes due 2021 and used the net proceeds to repay approximately
$90.0 million
of the credit facility borrowings. See Note 10,
Debt,
for further information regarding the Company's debt financing.
The Acquired Subsidiaries provide specialty contracting services, including engineering, construction, maintenance and installation services to telecommunications providers, and other construction and maintenance services to electric and gas utilities and others. Principal business facilities are located in Arizona, California, Florida, Georgia, Minnesota, New York, Pennsylvania and Washington.
For the Acquired Subsidiaries, the fair values used in the purchase price allocation for intangible assets were determined by management with the assistance of an independent valuation specialist and completed during the fourth quarter of fiscal 2013. The purchase price of the Acquired Subsidiaries is allocated as follows and reflects the elimination of intercompany balances (dollars in millions):
|
Assets
|
|||
|
Cash and equivalents
|
$
|
0.2
|
|
|
Accounts receivable, net
|
112.2
|
|
|
|
Costs and estimated earnings in excess of billings
|
61.5
|
|
|
|
Inventories
|
9.0
|
|
|
|
Other current assets
|
1.6
|
|
|
|
Property and equipment
|
33.3
|
|
|
|
Goodwill
|
87.9
|
|
|
|
Intangibles - customer relationships
|
70.3
|
|
|
|
Intangibles - backlog
|
15.3
|
|
|
|
Intangibles - trade names
|
5.0
|
|
|
|
Other assets
|
2.3
|
|
|
|
Total assets
|
398.6
|
|
|
|
Liabilities
|
|||
|
Accounts payable
|
42.1
|
|
|
|
Billings in excess of costs and estimated earnings
|
10.3
|
|
|
|
Accrued and other liabilities
|
27.1
|
|
|
|
Total liabilities
|
79.5
|
|
|
|
Net Assets Acquired
|
$
|
319.1
|
|
Goodwill of
$87.9 million
and amortizing intangible assets of
$90.6 million
related to the Acquired Subsidiaries is expected to be deductible for tax purposes. See Note 7,
Goodwill and Intangible Assets
, for further information on amortization and estimated useful lives of intangible assets acquired.
For
fiscal 2014
, the Acquired Subsidiaries earned revenues of
$472.2 million
and recognized intangible amortization expense of
$11.5 million
. Inclusive of charges allocated for management costs, the Acquired Subsidiaries had net income of
$6.9 million
for
fiscal 2014
. For
fiscal 2013
, the Acquired Subsidiaries earned revenues of
$335.4 million
and recognized intangible amortization expense of
$14.3 million
. The
fiscal 2013
net income from the date of acquisition through
fiscal 2013
, inclusive of charges allocated for management costs, was immaterial.
Pro forma contract revenues, income before taxes, and net income were
$1.837 billion
,
$90.0 million
and
$54.4 million
, respectively, for
fiscal 2013
, resulting in basic and diluted pro forma earnings per share of
$1.65
and
$1.61
, respectively. This unaudited pro forma information presents the Company's consolidated results of operations as if the acquisition of the Acquired Subsidiaries had occurred on July 31, 2011, the first day of the Company's 2012 fiscal year and includes certain adjustments,
51
including depreciation and amortization expense based on the estimated fair value of the assets acquired, interest expense related to the Company's debt financing of the transaction, and the income tax impact of these adjustments. Pro forma earnings during
fiscal 2013
have been adjusted to reflect amortization and depreciation as if the acquisition had occurred on July 31, 2011. This includes the impact of amortization expense, including customer relationships and contract backlog which is being recognized on an accelerated basis related to the expected economic benefit. Pro forma results also reflect depreciation expense which is recognized over the estimated useful lives of the related property and equipment. The unaudited pro forma information is not necessarily indicative of the results of operations of the combined companies had the acquisition occurred at the beginning of the periods presented nor is it indicative of future results.
During the fourth quarter of fiscal 2013, the Company acquired Sage Telecommunications Corp. of Colorado, LLC ("Sage") and certain assets of a tower construction and maintenance company for a combined total of
$11.3 million
, net of cash acquired. Sage provides telecommunications construction and project management services primarily for cable operators in the Western United States. Purchase price allocations of businesses acquired during the fourth quarter of fiscal 2013 were completed during the fourth quarter of fiscal 2014.
Fiscal 2014
- During the third quarter of fiscal 2014, the Company acquired a telecommunications specialty construction contractor in Canada for
$0.7 million
. During the fourth quarter of fiscal 2014, the Company acquired Watts Brothers Cable Construction, Inc. ("Watts Brothers") for
$16.4 million
plus
$0.5 million
to be paid in fiscal 2015. Watts Brothers provides specialty contracting services primarily for telecommunication and cable operators in the Midwest and Southeastern United States. Purchase price allocations of businesses acquired during fiscal 2014 are preliminary and will be completed during fiscal 2015 when the valuations for intangible assets and other amounts are finalized.
The results of operations of businesses acquired are included in the accompanying consolidated financial statements from their dates of acquisition. The results from businesses acquired during the fourth quarter of fiscal 2013 and fiscal 2014 were not material to the Company.
4. Accounts Receivable
Accounts receivable consists of the following:
|
July 26,
2014 |
July 27,
2013 |
||||||
|
|
(Dollars in thousands)
|
||||||
|
Contract billings
|
$
|
258,254
|
|
$
|
239,498
|
|
|
|
Retainage and other receivables
|
15,323
|
|
12,833
|
|
|||
|
Total
|
273,577
|
|
252,331
|
|
|||
|
Less: allowance for doubtful accounts
|
(836
|
)
|
(129
|
)
|
|||
|
Accounts receivable, net
|
$
|
272,741
|
|
$
|
252,202
|
|
|
The Company grants credit under normal payment terms, generally without collateral, to its customers. The Company expects to collect the outstanding balance of accounts receivable, net, including retainage and amounts supplemented with liens, within the next
twelve
months. Except as described herein, there were no material accounts receivable amounts representing claims or other similar items subject to uncertainty as of
July 26, 2014
or
July 27, 2013
.
With respect to certain customers, the Company has statutory lien rights which may assist in its collection efforts. As of
July 26, 2014
, the Company's accounts receivable include approximately
$20.1 million
for past due balances from a customer on a rural project funded primarily by the Rural Utilities Service agency of the United States Department of Agriculture (the “RUS”) under the American Recovery and Reinvestment Act of 2009. The loan made by the RUS is secured by certain assets of the customer. The Company has stopped work on the project. The Company has filed construction liens with respect to work on the project representing approximately
$17.7 million
of the accounts receivable balance. In addition, other creditors have also filed construction liens against the customer. In July 2014, the Company was included in an action taken by another creditor that has filed a construction lien on one parcel of property owned by the customer to foreclose the lien on that parcel. In the event the customer does not pay the balances owed, the amount the Company collects through the enforcement of its liens or other actions will depend on the value realized on the assets underlying the liens as well as the amount owed to, and priority of, other creditors.
52
The Company maintains an allowance for doubtful accounts for estimated losses resulting from the failure of its customers to make required payments. The allowance for doubtful accounts changed as follows:
|
Fiscal Year Ended
|
|||||||
|
July 26, 2014
|
|
July 27, 2013
|
|
||||
|
(Dollars in thousands)
|
|||||||
|
Allowance for doubtful accounts at beginning of period
|
$
|
129
|
|
$
|
270
|
|
|
|
Bad debt expense, net
|
615
|
|
139
|
|
|||
|
Amounts recovered (charged) against the allowance
|
92
|
|
(280
|
)
|
|||
|
Allowance for doubtful accounts at end of period
|
$
|
836
|
|
$
|
129
|
|
|
5. Costs and Estimated Earnings in Excess of Billings
Costs and estimated earnings in excess of billings ("CIEB") includes revenue for services from contracts based both on the units-of-delivery and the cost-to-cost measures of the percentage of completion method. Contracts in progress are as follows:
|
July 26,
2014 |
July 27,
2013 |
||||||
|
|
(Dollars in thousands)
|
||||||
|
Costs incurred on contracts in progress
|
$
|
234,766
|
|
$
|
208,250
|
|
|
|
Estimated to date earnings
|
57,335
|
|
49,150
|
|
|||
|
Total costs and estimated earnings
|
292,101
|
|
257,400
|
|
|||
|
Less: billings to date
|
(75,414
|
)
|
(66,839
|
)
|
|||
|
|
$
|
216,687
|
|
$
|
190,561
|
|
|
|
Included in the accompanying consolidated balance sheets under the captions:
|
|
|
|
|
|||
|
Costs and estimated earnings in excess of billings
|
$
|
230,569
|
|
$
|
204,349
|
|
|
|
Billings in excess of costs and estimated earnings
|
(13,882
|
)
|
(13,788
|
)
|
|||
|
|
$
|
216,687
|
|
$
|
190,561
|
|
|
As of
July 26, 2014
, the Company expects that substantially all of its CIEB will be billed to customers and collected in the normal course of business within the next twelve months. Additionally, there were no material CIEB amounts representing claims or other similar items subject to uncertainty as of
July 26, 2014
or
July 27, 2013
.
6. Property and Equipment
Property and equipment consists of the following:
|
Estimated Useful Lives
|
July 26,
2014 |
July 27,
2013 |
|||||||
|
|
(Years)
|
(Dollars in thousands)
|
|||||||
|
Land
|
—
|
$
|
3,408
|
|
$
|
3,479
|
|
||
|
Buildings
|
10-35
|
11,589
|
|
11,449
|
|
||||
|
Leasehold improvements
|
1-10
|
5,335
|
|
5,154
|
|
||||
|
Vehicles
|
1-5
|
279,631
|
|
258,211
|
|
||||
|
Computer hardware and software
|
3-10
|
73,349
|
|
64,191
|
|
||||
|
Office furniture and equipment
|
2-7
|
7,790
|
|
7,915
|
|
||||
|
Equipment and machinery
|
1-10
|
177,608
|
|
171,742
|
|
||||
|
Total
|
558,710
|
|
522,141
|
|
|||||
|
Less: accumulated depreciation
|
(353,297
|
)
|
(319,438
|
)
|
|||||
|
Property and equipment, net
|
$
|
205,413
|
|
$
|
202,703
|
|
|||
53
Depreciation expense and repairs and maintenance are as follows:
|
Fiscal Year Ended
|
|||||||||||
|
2014
|
2013
|
2012
|
|||||||||
|
(Dollars in thousands)
|
|||||||||||
|
Depreciation expense
|
$
|
74,517
|
|
$
|
64,756
|
|
$
|
56,187
|
|
||
|
Repairs and maintenance expense
|
$
|
21,829
|
|
$
|
19,408
|
|
$
|
15,623
|
|
||
7. Goodwill and Intangible Assets
Goodwill
The Company's goodwill balance was
$269.1
million as of
July 26, 2014
and
$267.8 million
as of
July 27, 2013
. Changes in the carrying amount of goodwill for
fiscal 2014
and
fiscal 2013
are as follows:
|
Goodwill
|
Accumulated Impairment Losses
|
Total
|
|||||||||
|
(Dollars in thousands)
|
|||||||||||
|
Balance as of July 28, 2012
|
$
|
370,616
|
|
$
|
(195,767
|
)
|
$
|
174,849
|
|
||
|
Goodwill from fiscal 2013 acquisitions
|
92,961
|
|
—
|
|
92,961
|
|
|||||
|
Balance as of July 27, 2013
|
463,577
|
|
(195,767
|
)
|
267,810
|
|
|||||
|
Goodwill from fiscal 2014 acquisitions
|
1,278
|
|
—
|
|
1,278
|
|
|||||
|
Balance as of July 26, 2014
|
$
|
464,855
|
|
$
|
(195,767
|
)
|
$
|
269,088
|
|
||
The full amount of goodwill related to businesses acquired during fiscal 2014 and fiscal 2013 is expected to be deductible for tax purposes. The Company's goodwill resides in multiple reporting units. The profitability of individual reporting units may suffer periodically from downturns in customer demand and other factors resulting from the cyclical nature of the Company's business, the high level of competition existing within the Company's industry, the concentration of the Company's revenues from a limited number of customers, and the level of overall economic activity, including in particular construction and housing activity. During times of slowing economic conditions, the Company's customers may reduce capital expenditures and defer or cancel pending projects. Individual reporting units may be more impacted by these factors than the Company as a whole. As a result, demand for the services of one or more of the Company's reporting units could decline, resulting in an impairment of goodwill or intangible assets.
The Company performed its annual impairment assessment as of the first day of the fourth quarter of each of
fiscal 2014
,
2013
and
2012
and concluded that no impairment of goodwill or the indefinite-lived intangible asset was indicated at any reporting unit for any of the years. During
fiscal 2014
, the Company performed qualitative assessments on reporting units that comprise less than
20%
of its consolidated goodwill balance. The qualitative assessments indicated that it was more likely than not that the fair value exceeded carrying value for those reporting units. For the remaining reporting units, the Company performed the first step of the quantitative analysis described in ASC Topic 350. The key valuation assumptions contributing to the fair value estimates of the Company's reporting units were (a) a discount rate based on the Company's best estimate of the weighted average cost of capital adjusted for risks associated with the reporting units; (b) terminal value based on terminal growth rates; and (c)
seven
expected years of cash flow before the terminal value for each annual test. The table below outlines certain assumptions in each of the Company's
fiscal 2014
,
2013
and
2012
annual quantitative impairment analyses:
|
2014
|
2013
|
2012
|
|||
|
Terminal Growth Rate Range
|
1.5% - 3.0%
|
1.5% - 2.5%
|
1.5% - 3.0%
|
||
|
Discount Rate
|
11.5%
|
11.5%
|
13.0%
|
||
The discount rate reflects risks inherent within each reporting unit operating individually, which are greater than the risks inherent in the Company as a whole. For
fiscal 2014
, the discount rate was consistent with the
fiscal 2013
analysis based on risk relative to industry conditions and the interest rate environment (cost of debt). The decrease in discount rates for
fiscal 2013
from
fiscal 2012
was a result of reduced risk relative to industry conditions and a lower interest rate environment at the
54
time of the analysis. The Company believes the assumptions used in the impairment analysis each year are reflective of the risks inherent in the business models of its reporting units and within its industry.
In the
fiscal 2014
impairment analysis, the fair value for
three
of the reporting units acquired in
fiscal 2013
exceeded their carrying value by less than
25%
each. The goodwill balances for these reporting units were
$10.6 million
,
$4.8 million
and
$3.6 million
. Recent operating performance, along with assumptions for specific customer and industry opportunities, were considered in the key assumptions used during the
fiscal 2014
impairment analysis. Management has determined the goodwill balance of these reporting units may have an increased likelihood of impairment if a prolonged downturn in customer demand were to occur, or if the reporting units were not able to execute against customer opportunities, and the long-term outlook for their cash flows were adversely impacted. Furthermore, changes in the long-term outlook may result in changes to other valuation assumptions. Factors monitored by management which could result in a change to the reporting units' estimates include the outcome of customer requests for proposals and subsequent awards, strategies of competitors, labor market conditions and levels of overall economic activity, including construction and housing activity. As of
July 26, 2014
, the Company believes the goodwill is recoverable for all of the reporting units; however, there can be no assurances that the goodwill will not be impaired in future periods.
Current operating results, including any losses, are evaluated by the Company in the assessment of goodwill and other intangible assets. The estimates and assumptions used in assessing the fair value of the reporting units and the valuation of the underlying assets and liabilities are inherently subject to significant uncertainties. Changes in judgments and estimates could result in a significantly different estimate of the fair value of the reporting units and could result in impairments of goodwill or intangible assets at additional reporting units. Additionally, adverse conditions in the economy and future volatility in the equity and credit markets could impact the valuation of the Company's reporting units.
Intangible Assets
The Company's intangible assets consist of the following:
|
|
Weighted Average Remaining Useful Lives
|
July 26,
2014 |
July 27,
2013 |
||||||
|
|
(Years)
|
(Dollars in thousands)
|
|||||||
|
Carrying amount:
|
|
|
|||||||
|
Customer relationships
|
11.7
|
$
|
173,594
|
|
$
|
164,497
|
|
||
|
Contract backlog
|
1.8
|
15,285
|
|
15,285
|
|
||||
|
Trade names
|
4.2
|
8,200
|
|
8,200
|
|
||||
|
UtiliQuest trade name
|
—
|
4,700
|
|
4,700
|
|
||||
|
Non-compete agreements
|
3.5
|
400
|
|
400
|
|
||||
|
|
202,179
|
|
193,082
|
|
|||||
|
Accumulated amortization:
|
|
|
|
|
|||||
|
Customer relationships
|
69,048
|
|
56,219
|
|
|||||
|
Contract backlog
|
13,490
|
|
9,433
|
|
|||||
|
Trade names
|
3,361
|
|
2,071
|
|
|||||
|
Non-compete agreements
|
164
|
|
84
|
|
|||||
|
|
86,063
|
|
67,807
|
|
|||||
|
Net Intangible Assets
|
$
|
116,116
|
|
$
|
125,275
|
|
|||
Amortization of the Company's customer relationships and contract backlog intangible assets is recognized on an accelerated basis as a function of the expected economic benefit. Amortization for the Company's other finite-lived intangibles is recognized on a straight-line basis over the estimated useful life of the intangible asset. Amortization expense for finite-lived intangible assets was
$18.3 million
,
$20.7 million
and
$6.5 million
for
fiscal 2014
,
2013
and
2012
, respectively.
55
Estimated total amortization expense for each of the five succeeding fiscal years and thereafter is as follows:
|
Period
|
Amount
|
|
|
(Dollars in thousands)
|
||
|
2015
|
$15,946
|
|
|
2016
|
$15,240
|
|
|
2017
|
$13,777
|
|
|
2018
|
$11,616
|
|
|
2019
|
$9,226
|
|
|
Thereafter
|
$45,611
|
|
As of
July 26, 2014
, the Company believes that the carrying amounts of its intangible assets are recoverable. However, if adverse events were to occur or circumstances were to change indicating that the carrying amount of such assets may not be fully recoverable, the assets would be reviewed for impairment and the assets could be impaired.
8. Accrued Insurance Claims
Within its insurance program the Company retains the risk of loss, up to certain limits, for claims relating to automobile liability, general liability, workers’ compensation, employee group health, and damages relating to underground facility locating services. With respect to losses occurring in
fiscal 2012
through
fiscal 2014
, the Company retains the risk of loss up to
$1.0 million
on a per occurrence basis for automobile liability, general liability and workers’ compensation. The Company has maintained this same level of retention for
fiscal 2015
. These retention amounts are applicable to all of the states in which the Company operates, except with respect to workers’ compensation insurance in two states in which the Company participates in a state-sponsored insurance fund. Aggregate stop loss coverage for automobile liability, general liability and workers’ compensation claims is
$56.3 million
for
fiscal 2014
and
$59.5 million
for
fiscal 2015
. The risk of loss for insured claims of the Acquired Subsidiaries, including those incurred but not reported, as of the date of acquisition has been retained by Quanta Services, Inc.
The Company is party to a stop-loss agreement for losses under its employee group health plan. The Company retains the risk of loss, on an annual basis, of the first
$250,000
of claims per participant. In addition, the Company retains the risk of loss for the first
$550,000
of claim amounts that aggregate across all participants having claims that exceed
$250,000
.
The liability for total accrued insurance claims and related processing costs was
$66.0 million
and
$56.3 million
at
July 26, 2014
and
July 27, 2013
, respectively, of which,
$33.8 million
and
$27.3 million
, respectively, is reflected within non-current liabilities in the consolidated financial statements.
9. Other Accrued Liabilities
Other accrued liabilities consist of the following:
|
July 26,
2014 |
July 27,
2013 |
||||||
|
|
(Dollars in thousands)
|
||||||
|
Accrued payroll and related taxes
|
$
|
18,429
|
|
$
|
19,940
|
|
|
|
Accrued employee benefit and incentive plan costs
|
17,677
|
|
15,325
|
|
|||
|
Accrued construction costs
|
20,689
|
|
20,883
|
|
|||
|
Accrued interest and related bank fees
|
872
|
|
937
|
|
|||
|
Income taxes payable
|
5,223
|
|
2,337
|
|
|||
|
Other current liabilities
|
13,244
|
|
11,769
|
|
|||
|
Total other accrued liabilities
|
$
|
76,134
|
|
$
|
71,191
|
|
|
56
The Company’s outstanding indebtedness consists of the following:
|
July 26,
2014 |
July 27,
2013 |
||||||
|
|
(Dollars in thousands)
|
||||||
|
Borrowings on senior Credit Agreement (matures December 2017)
|
$
|
63,000
|
|
$
|
49,000
|
|
|
|
Senior Credit Agreement Term Loan (matures December 2017)
|
114,063
|
|
121,875
|
|
|||
|
7.125% senior subordinated notes due 2021
|
277,500
|
|
277,500
|
|
|||
|
Long-term debt premium on 7.125% senior subordinated notes (amortizes to interest expense through January 2021)
|
3,238
|
|
3,607
|
|
|||
|
|
457,801
|
|
451,982
|
|
|||
|
Less: current portion
|
(10,938
|
)
|
(7,813
|
)
|
|||
|
Long-term debt
|
$
|
446,863
|
|
$
|
444,169
|
|
|
Senior Subordinated Notes Due 2021
On July 28, 2012, Dycom Investments, Inc., (the "Issuer"), a wholly-owned subsidiary of the Company, had outstanding an aggregate principal amount of
$187.5 million
of
7.125%
senior subordinated notes due 2021 that were issued under an indenture dated January 21, 2011 (the "Indenture"). On December 12, 2012, an additional
$90.0 million
in aggregate principal amount of 7.125% senior subordinated notes due 2021 were issued under the Indenture at
104.25%
of the principal amount. The resulting debt premium of
$3.8 million
is being amortized to interest expense over the remaining term of the notes and was
$3.2 million
and
$3.6 million
as of
July 26, 2014
and
July 27, 2013
, respectively. The net proceeds of this issuance were used to repay a portion of the borrowings under the Company's new credit facility. Holders of all
$277.5 million
aggregate principal amount of the senior subordinated notes (the "2021 Notes") vote as one series under the Indenture.
The 2021 Notes are guaranteed by the Issuer's parent company and substantially all of the Company's subsidiaries. For additional information regarding these guarantees see Note 20,
Supplemental Consolidating Financial Statements
. The Indenture contains covenants that limit, among other things, the Company's ability to incur additional debt and issue preferred stock, make certain restricted payments, consummate specified asset sales, enter into transactions with affiliates, incur liens, impose restrictions on the ability of its subsidiaries to pay dividends or make payments to the Company and its restricted subsidiaries, merge or consolidate with another person, and dispose of all or substantially all of its assets.
The Company determined that the fair value of the 2021 Notes as of
July 26, 2014
was approximately
$297.6 million
based on quoted market prices, compared to a
$280.7 million
carrying value (including the debt premium of
$3.2 million
). As of
July 27, 2013
, the fair value of the 2021 Notes was
$292.4 million
compared to a carrying value of
$281.1 million
(including the debt premium of
$3.6 million
).
Senior Credit Agreement
On December 3, 2012, the Company entered into a new,
five
-year credit agreement (the "Credit Agreement") with various lenders. The Credit Agreement matures in December 2017 and provides for a
$275 million
revolving facility and a
$125 million
term loan (the "Term Loan"). Subject to certain conditions, the Credit Agreement provides for the ability to enter into one or more incremental facilities, either by increasing the revolving commitments under the Credit Agreement and/or in the form of term loans, in an aggregate amount not to exceed
$100 million
. Borrowings under the Credit Agreement can be used to refinance certain indebtedness, to provide general working capital, and for other general corporate purposes.
The Credit Agreement replaced the Company's prior credit agreement, dated as of June 4, 2010, which was due to expire in June 2015. At the time of termination, there were
no
outstanding borrowings and all outstanding letters of credit were transferred to the Credit Agreement. The Company did not incur any material early termination penalties in connection with the termination of the prior credit agreement. The Company recognized
$0.3 million
in write-off of deferred financing costs during the second quarter of fiscal 2013 in connection with the replacement of the prior credit agreement.
Borrowings under the Credit Agreement (other than Swingline Loans (as defined in the Credit Agreement)) bear interest at a rate equal to either (a) the administrative agent's base rate, described in the Credit Agreement as the highest of (i) the administrative agent's
prime rate
, (ii) the
Federal Funds Rate
plus
0.50%
, and (iii) a floating rate of interest equal to
one month LIBOR
plus
1.00%
, or (b) the
Eurodollar Rate
, plus, in each case, an applicable margin based upon the Company's
57
consolidated leverage ratio. Swingline Loans bear interest at a rate equal to the administrative agent's
base rate
plus a margin based upon the Company's consolidated leverage ratio. As of July 26, 2014 and July 27, 2013, borrowings are eligible for a margin of
1.0%
for borrowings based on the administrative agent's base rate and
2.0%
for borrowings based on the Eurodollar Rate. Borrowings under the Credit Agreement are guaranteed by substantially all of the Company's subsidiaries and secured by the stock of each of the wholly-owned, domestic subsidiaries (subject to specified exceptions). The Company incurs fees under the Credit Agreement for the unutilized commitments at rates that range from
0.25%
to
0.40%
per annum, fees for outstanding standby letters of credit at rates that range from
1.50%
to
2.25%
per annum and fees for outstanding commercial letters of credit at rates that range from
0.75%
to
1.125%
per annum, in each case based on the Company's consolidated leverage ratio.
The Company had outstanding revolver borrowings under the Credit Agreement of
$63.0 million
and
$49.0 million
as of July 26, 2014 and July 27, 2013, respectively. Borrowings under the Credit Agreement accrued interest at a weighted average rate of approximately
2.55%
per annum and
2.19%
per annum as of July 26, 2014 and July 27, 2013, respectively. As of July 26, 2014 and July 27, 2013, the Company had
$114.1 million
and
$121.9 million
, respectively, of outstanding principal amount under the Term Loan, which accrued interest at
2.15%
and
2.19%
per annum, respectively.
The Term Loan is subject to annual amortization payable in equal quarterly installments of principal. Contractual maturities on the Company's outstanding indebtedness, including the Term Loan and excluding the issue premium, as of July 26, 2014 is as follows:
$10.9 million
during fiscal 2015,
$14.1 million
during fiscal 2016,
$17.2 million
during fiscal 2017,
$134.9 million
during fiscal 2018 and
$277.5 million
during fiscal 2021.
The Credit Agreement contains a sublimit of
$150 million
for the issuance of letters of credit. Standby letters of credit of approximately
$49.4 million
and
$46.7 million
, issued as part of the Company's insurance program, were outstanding under the Credit Agreement as of July 26, 2014 and July 27, 2013, respectively. Interest on outstanding standby letters of credit accrued at
2.0%
per annum at both July 26, 2014 and July 27, 2013, respectively. Unutilized commitments were at rates per annum of
0.35%
at both July 26, 2014 and July 27, 2013.
The Credit Agreement contains affirmative and negative covenants which are customary for similar credit agreements, including, without limitation, limitations on the Company and its subsidiaries with respect to indebtedness, liens, investments, distributions, mergers and acquisitions, disposition of assets, sale-leaseback transactions, transactions with affiliates and capital expenditures. The Credit Agreement contains financial covenants which require the Company to (i) maintain a consolidated leverage ratio of not greater than (a)
3.50
to
1.00
for fiscal quarters ending July 27, 2013 through April 26, 2014, (b)
3.25
to
1.00
for fiscal quarters ending July 26, 2014 through April 25, 2015 and (c)
3.00
to
1.00
for fiscal quarters ending July 25, 2015 and each fiscal quarter thereafter, as measured on a trailing four quarter basis at the end of each fiscal quarter, and (ii) maintain a consolidated interest coverage ratio of not less than
3.00
to
1.00
, as measured at the end of each fiscal quarter. At July 26, 2014 and July 27, 2013, the Company was in compliance with the financial covenants of the Credit Agreement and had additional borrowing availability of
$162.6 million
and
$179.3 million
, respectively, as determined by the most restrictive covenants of the Credit Agreement.
58
11. Income Taxes
The components of the provision (benefit) for income taxes are as follows:
|
Fiscal Year Ended
|
|||||||||||
|
2014
|
2013
|
2012
|
|||||||||
|
(Dollars in thousands)
|
|||||||||||
|
Current:
|
|||||||||||
|
Federal
|
$
|
27,161
|
|
$
|
22,173
|
|
$
|
11,263
|
|
||
|
Foreign
|
416
|
|
406
|
|
568
|
|
|||||
|
State
|
5,087
|
|
2,702
|
|
3,478
|
|
|||||
|
32,664
|
|
25,281
|
|
15,309
|
|
||||||
|
Deferred:
|
|||||||||||
|
Federal
|
(5,706
|
)
|
(2,866
|
)
|
9,392
|
|
|||||
|
Foreign
|
—
|
|
6
|
|
49
|
|
|||||
|
State
|
(617
|
)
|
590
|
|
433
|
|
|||||
|
(6,323
|
)
|
(2,270
|
)
|
9,874
|
|
||||||
|
Total Tax Provision
|
$
|
26,341
|
|
$
|
23,011
|
|
$
|
25,183
|
|
||
The Company is subject to federal income taxes in the United States, as well as income taxes of multiple state jurisdictions and in Canada. There were immaterial amounts of pre-tax income related to Canadian operations for fiscal
2014
,
2013
and
2012
. With few exceptions, the Company is no longer subject to U.S. federal, state and local, or Canadian income tax examinations for fiscal years ended 2010 and prior. The Company believes its provision for income taxes is adequate; however, any assessment would affect the Company’s results of operations and cash flows. Income tax receivable of
$2.2 million
and
$2.5 million
is included in other current assets as of
July 26, 2014
and
July 27, 2013
, respectively. Income taxes payable of
$5.2 million
and
$2.3 million
is included within other accrued liabilities as of
July 26, 2014
and
July 27, 2013
, respectively.
The deferred tax provision represents the change in the deferred tax assets and the liabilities representing the tax consequences of changes in the amount of temporary differences and changes in tax rates during the year. The significant components of deferred tax assets and liabilities are comprised of the following:
|
July 26, 2014
|
July 27, 2013
|
||||||
|
(Dollars in thousands)
|
|||||||
|
Deferred tax assets:
|
|||||||
|
Insurance and other reserves
|
$
|
26,964
|
|
$
|
23,089
|
|
|
|
Allowance for doubtful accounts and reserves
|
742
|
|
427
|
|
|||
|
Net operating loss carryforwards
|
994
|
|
1,183
|
|
|||
|
Stock-based compensation
|
5,402
|
|
4,231
|
|
|||
|
Other
|
1,062
|
|
1,800
|
|
|||
|
Total deferred tax assets
|
35,164
|
|
30,730
|
|
|||
|
Valuation allowance
|
(878
|
)
|
(1,788
|
)
|
|||
|
Deferred tax assets, net of valuation allowance
|
$
|
34,286
|
|
$
|
28,942
|
|
|
|
Deferred tax liabilities:
|
|||||||
|
Property and equipment
|
$
|
32,164
|
|
$
|
36,491
|
|
|
|
Goodwill and intangibles
|
26,998
|
|
23,498
|
|
|||
|
Other
|
553
|
|
712
|
|
|||
|
Deferred tax liabilities
|
$
|
59,715
|
|
$
|
60,701
|
|
|
|
Net deferred tax liabilities
|
$
|
25,429
|
|
$
|
31,759
|
|
|
59
The above valuation allowance reduces the deferred tax asset balances to the amount that the Company has determined is more likely than not to be realized. The
fiscal 2014
reduction in valuation allowance is the result of a
$0.8 million
tax benefit which expired associated with an impaired investment. As a result, the net operating loss carryforwards, and associated valuation allowance, were removed with no impact on the Company's effective tax rate. As of
July 26, 2014
, the Company had immaterial state net operating loss carryforwards, which generally begin to expire in fiscal 2022. The valuation allowance primarily relates to these net operating loss carryforwards.
The difference between the total tax provision and the amount computed by applying the statutory federal income tax rates to pre-tax income is as follows:
|
Fiscal Year Ended
|
|||||||||||
|
2014
|
2013
|
2012
|
|||||||||
|
(Dollars in thousands)
|
|||||||||||
|
Statutory rate applied to pre-tax income
|
$
|
23,212
|
|
$
|
20,370
|
|
$
|
22,600
|
|
||
|
State taxes, net of federal tax benefit
|
2,863
|
|
2,271
|
|
2,766
|
|
|||||
|
Non-deductible and non-taxable items
|
491
|
|
366
|
|
208
|
|
|||||
|
Change in accruals for uncertain tax positions
|
53
|
|
153
|
|
93
|
|
|||||
|
Valuation allowance of deferred tax asset
|
—
|
|
—
|
|
(313
|
)
|
|||||
|
Other items, net
|
(278
|
)
|
(149
|
)
|
(171
|
)
|
|||||
|
Total tax provision
|
$
|
26,341
|
|
$
|
23,011
|
|
$
|
25,183
|
|
||
As of
July 26, 2014
and
July 27, 2013
, the Company had total unrecognized tax benefits of
$2.4 million
and
$2.3 million
, respectively, which would reduce the Company’s effective tax rate during future periods if it is subsequently determined that those liabilities were not required. The Company had approximately
$0.8 million
for the payment of interest and penalties accrued at both
July 26, 2014
and
July 27, 2013
. Interest expense related to unrecognized tax benefits was immaterial for each of
fiscal 2014
,
2013
and
2012
.
A summary of unrecognized tax benefits is as follows:
|
Fiscal Year Ended
|
|||||||||||
|
2014
|
2013
|
2012
|
|||||||||
|
(Dollars in thousands)
|
|||||||||||
|
Balance at beginning of year
|
$
|
2,348
|
|
$
|
2,194
|
|
$
|
2,054
|
|
||
|
Additions based on tax positions related to the fiscal year
|
137
|
|
155
|
|
154
|
|
|||||
|
Additions based on tax positions related to prior years
|
10
|
|
19
|
|
6
|
|
|||||
|
Reductions related to the expiration of statutes of limitation
|
(94
|
)
|
(20
|
)
|
(20
|
)
|
|||||
|
Balance at end of year
|
$
|
2,401
|
|
$
|
2,348
|
|
$
|
2,194
|
|
||
12. Other Income, Net
The components of other income, net, are as follows:
|
Fiscal Year Ended
|
|||||||||||
|
2014
|
2013
|
2012
|
|||||||||
|
(Dollars in thousands)
|
|||||||||||
|
Gain on sale of fixed assets
|
$
|
10,706
|
|
$
|
4,683
|
|
$
|
15,430
|
|
||
|
Miscellaneous income, net
|
522
|
|
227
|
|
395
|
|
|||||
|
Write-off of deferred financing costs
|
—
|
|
(321
|
)
|
—
|
|
|||||
|
Total other income, net
|
$
|
11,228
|
|
$
|
4,589
|
|
$
|
15,825
|
|
||
The Company recognized
$0.3 million
in write-off of deferred financing costs during
fiscal 2013
in connection with the replacement of its prior credit agreement.
60
13. Employee Benefit Plans
The Company sponsors a defined contribution plan that provides retirement benefits to eligible employees who elect to participate. Under the plan, participating employees may defer up to
15%
of their base pre-tax eligible compensation up to the IRS limits. Beginning July 1, 2014, this deferral percentage was increased to
75%
. The Company contributes
30%
of the first
5%
of base eligible compensation that a participant contributes to the plan. The Company's contributions were
$1.9 million
,
$1.6 million
and
$1.2 million
in
fiscal 2014
,
2013
and
2012
respectively. In addition, in connection with the businesses acquired in fiscal 2013, the Company assumed the obligation to make future contributions under an employee benefit plan in effect for certain hourly employees. Contributions for
fiscal 2014
and
2013
under this plan were
$1.2 million
and
$0.8 million
, respectively.
The Company contributes to several multiemployer defined benefit pension plans under the terms of collective bargaining agreements ("CBA") that cover certain employees represented by unions. The risks of participating in a multiemployer plan are different from single-employer plans in the following aspects:
|
•
|
assets contributed to the multiemployer plan by one employer may be used to provide benefits to employees of other participating employers;
|
|
•
|
if a participating employer stops contributing to the plan, the unfunded obligations of the plan may be inherited by the remaining participating employers; and
|
|
•
|
if the Company stops participating in the multiemployer plan the Company may be required to pay the plan an amount based on the underfunded status of the plan, referred to as a withdrawal liability.
|
The information available to the Company about the multiemployer plans in which it participates, whether via request to the plan or publicly available, is generally dated due to the nature of the reporting cycle of multiemployer plans and legal requirements under the Employee Retirement Income Security Act ("ERISA") as amended by the Multiemployer Pension Plan Amendments Act ("MPPAA"). Based upon these plans' most recently available annual reports, the Company's contribution to each of the plans was less than
5%
of each such plans total contributions. The Pension, Hospitalization and Benefit Plan of the Electrical Industry – Pension Trust Fund
("the Plan") was considered individually significant and is presented separately below. All other plans are presented in the aggregate.
|
PPA Zone Status (a)
|
Company Contributions (Dollars in thousands)
|
Expiration Date of CBA
|
||||||||||||||||||||||
|
Fund
|
EIN
|
2013
|
2012
|
FIP/RP Status (b)
|
2014
|
2013
|
2012
|
Surcharge Imposed
|
||||||||||||||||
|
The Plan
|
13-6123601
|
Green
|
Green
|
No
|
$
|
3,044
|
|
$
|
2,962
|
|
$
|
2,882
|
|
No
|
05/05/2016
|
|||||||||
|
Other Plans (c)
|
635
|
|
243
|
|
—
|
|
Various
|
|||||||||||||||||
|
Total Contributions
|
$
|
3,679
|
|
$
|
3,205
|
|
$
|
2,882
|
|
|||||||||||||||
|
(a)
|
The most recent Pension Protection Act (the "PPA") zone status was provided by the Plan for Plan years ending 2013 and 2012, respectively. The zone status is based on information that the Company received from the Plan and is certified by the Plan's actuary. Generally, plans in the red zone are less that 65% funded, plans in the yellow zone are between 65% and 80% funded, and plans in the green zone are at least 80% funded.
|
|
(b)
|
The "FIR/RP Status" column indicates plans for which a financial improvement plan (FIP) or rehabilitation plan (RP), as required by the Internal Revenue Code, is either pending or has been implemented.
|
|
(c)
|
As a result of the acquisition of the Acquired Subsidiaries, the Company began contributions to a number of additional multiemployer plans for employees of certain of the Acquired Subsidiaries. Contribution requirements to these multiemployer plans are specified in the applicable collective bargaining agreements, and are typically assessed based on union employee payrolls, which vary depending on location and union resources needed in connection with certain projects. The amounts listed include contributions to multiemployer defined contribution plans. Defined contribution plans are retirement plans in which the Company contributes a fixed amount each pay period to the extent that the Company has employees covered under the plan. Future benefits to employees from defined contribution plans are not guaranteed and fluctuate on the basis of investment earnings; the Company is not obligated to make payments to the plan other than current contributions for current employees.
|
61
The Company has not incurred withdrawal liabilities related to the plans as of
July 26, 2014
.
14. Capital Stock
During
fiscal 2014
,
2013
and
2012
, the Company made the following repurchases under its share repurchase programs:
|
Fiscal Year Ended
|
Number of Shares Repurchased
|
Total Consideration
(Dollars in thousands) |
Average Price Per Share
|
||||||||
|
July 28, 2012
|
597,700
|
|
$
|
12,960
|
|
$
|
21.68
|
|
|||
|
July 27, 2013
|
1,047,000
|
|
$
|
15,203
|
|
$
|
14.52
|
|
|||
|
July 26, 2014
|
360,900
|
|
$
|
9,999
|
|
$
|
27.71
|
|
|||
All shares repurchased have been subsequently canceled. As of
July 26, 2014
, approximately
$30.0 million
of the
$40.0 million
authorized on August 27, 2013 remained authorized for repurchases through February 2015.
Shares for Tax Withholding
During
fiscal 2014
,
2013
and
2012
, the Company withheld
136,604
shares,
47,277
shares and
16,987
shares, respectively, of restricted units that vested during the periods, totaling
$3.8 million
,
$0.9 million
and
$0.3 million
, respectively, in order to meet payroll tax withholdings obligations that arose on the vesting of restricted units. All shares withheld have been canceled. The shares withheld for tax withholdings do not reduce the Company’s total share repurchase authority.
15. Stock-Based Awards
Stock-based compensation expense and the related tax benefit recognized related to stock options and restricted share units during
fiscal 2014
,
2013
and
2012
are as follows:
|
Fiscal Year Ended
|
|||||||||||
|
2014
|
2013
|
2012
|
|||||||||
|
(Dollars in thousands)
|
|||||||||||
|
Stock-based compensation
|
$
|
12,596
|
|
$
|
9,902
|
|
$
|
6,952
|
|
||
|
Tax benefit recognized in the statement of operations
|
$
|
4,819
|
|
$
|
3,782
|
|
$
|
2,412
|
|
||
The actual tax benefit realized for the tax deductions from option exercises and stock vestings totaled
$7.1 million
,
$3.4 million
and
$2.8 million
during
fiscal 2014
,
2013
and
2012
, respectively.
As of
July 26, 2014
, unrecognized compensation expense related to stock options, RSUs and target Performance RSUs was
$3.5 million
,
$6.5 million
and
$11.3 million
, respectively, based on the Company's estimate of performance goal achievement. This expense will be recognized over a weighted-average period of
2.2
years,
2.6
years and
1.5
years, respectively, which is based on the average remaining service periods of the awards. As of
July 26, 2014
, the Company may recognize an additional
$3.5 million
in compensation expense related to Performance RSUs if the maximum amount of restricted share units are earned based on certain performance goals being met.
62
The following table summarizes the valuation of stock options and restricted share units granted during
fiscal 2014
,
2013
and
2012
and the significant valuation assumptions:
|
Fiscal Year Ended
|
|||||||||||
|
2014
|
2013
|
2012
|
|||||||||
|
Weighted average fair value of RSUs granted
|
$
|
27.54
|
|
$
|
18.52
|
|
$
|
19.49
|
|
||
|
Weighted average fair value of Performance RSUs granted
|
$
|
27.66
|
|
$
|
18.08
|
|
$
|
19.47
|
|
||
|
Weighted average fair value of stock options granted
|
$
|
17.43
|
|
$
|
11.66
|
|
$
|
12.51
|
|
||
|
Stock option assumptions:
|
|||||||||||
|
Risk-free interest rate
|
2.7
|
%
|
1.6
|
%
|
1.8
|
%
|
|||||
|
Expected life (years)
|
8.8
|
|
9.3
|
|
9.4
|
|
|||||
|
Expected volatility
|
55.1
|
%
|
55.4
|
%
|
56.1
|
%
|
|||||
|
Expected dividends
|
—
|
|
—
|
|
—
|
|
|||||
Stock Options
The following table summarizes stock option award activity during
fiscal 2014
:
|
|
Stock Options
|
|||||||||||
|
|
Shares
|
Weighted Average Exercise Price
|
Weighted Average Remaining Contractual Life
|
Aggregate Intrinsic Value
|
||||||||
|
(In years)
|
(In thousands)
|
|||||||||||
|
Outstanding as of July 27, 2013
|
2,769,132
|
|
$
|
18.27
|
|
|||||||
|
Granted
|
89,956
|
|
$
|
27.50
|
|
|||||||
|
Options exercised
|
(803,796
|
)
|
$
|
18.12
|
|
|||||||
|
Forfeited or canceled
|
(10,399
|
)
|
$
|
27.00
|
|
|||||||
|
Outstanding as of July 26, 2014
|
2,044,893
|
|
$
|
18.68
|
|
4.8
|
$
|
23,545
|
|
|||
|
Exercisable options as of July 26, 2014
|
1,575,300
|
|
$
|
18.81
|
|
3.9
|
$
|
18,566
|
|
|||
The exercisable options as of
July 26, 2014
presented in the above table reflects the approximate amount of options expected to vest after giving effect to estimated forfeitures at an insignificant rate. The aggregate intrinsic values for stock options in the above table are based on the Company’s closing stock price of
$28.85
on July 25, 2014. These amounts represent the total intrinsic value that would have been received by the holders of the stock-based awards had the awards been exercised and sold as of that date, before any applicable taxes. The total intrinsic value of stock options exercised was
$8.4 million
,
$6.0 million
and
$6.4 million
for
fiscal 2014
,
2013
and
2012
, respectively. The Company received cash from the exercise of stock options of
$14.6 million
,
$5.3 million
and
$6.5 million
during
fiscal 2014
,
2013
and
2012
, respectively.
63
RSUs and Performance RSUs
The following table summarizes RSU and Performance RSU activity during
fiscal 2014
:
|
|
Restricted Stock
|
||||||||||||||||||||
|
|
RSUs
|
Performance RSUs
|
|||||||||||||||||||
|
|
Share Units
|
Weighted Average Grant Price
|
Aggregate Intrinsic Value
|
Share Units
|
Weighted Average Grant Price
|
Aggregate Intrinsic Value
|
|||||||||||||||
|
(In thousands)
|
(In thousands)
|
||||||||||||||||||||
|
Outstanding as of July 27, 2013
|
463,318
|
|
$
|
17.78
|
|
1,315,138
|
|
$
|
18.44
|
|
|||||||||||
|
Granted
|
101,615
|
|
$
|
27.54
|
|
429,485
|
|
$
|
27.66
|
|
|||||||||||
|
Share units vested
|
(158,441
|
)
|
$
|
16.53
|
|
(265,025
|
)
|
$
|
18.35
|
|
|||||||||||
|
Forfeited or canceled
|
(7,561
|
)
|
$
|
19.27
|
|
(289,414
|
)
|
$
|
18.64
|
|
|||||||||||
|
Outstanding as of July 26, 2014
|
398,931
|
|
$
|
20.61
|
|
$
|
11,509
|
|
1,190,184
|
|
$
|
21.73
|
|
$
|
34,337
|
|
|||||
The granted Performance RSUs in the above table is comprised of
373,465
target shares granted to officers and employees and
56,020
supplemental shares granted to officers. Approximately
265,000
Performance RSUs outstanding as of
July 27, 2013
were canceled during the first quarter of fiscal 2014 as a result of the fiscal 2013 performance criteria for attaining supplemental shares not being met. Approximately
48,275
target shares and
248,909
supplemental shares outstanding as of
July 26, 2014
will be canceled in fiscal 2015 as a result of the fiscal 2014 performance criteria not being fully met. The total amount of Performance RSUs outstanding as of
July 26, 2014
is comprised of
749,751
target shares and
440,433
supplemental shares.
The unvested RSUs reflect the approximate amount of units expected to vest after giving effect to estimated forfeitures. The total fair value of restricted share units vested during
fiscal 2014
,
2013
and
2012
was
$11.7 million
,
$4.2 million
and
$1.9 million
, respectively.
The aggregate intrinsic values for restricted share units are based on the Company’s closing stock price of
$28.85
on July 25, 2014. These amounts represent the total intrinsic value that would have been received by the holders of the stock-based awards had the awards been exercised and sold as of that date, before any applicable taxes.
16. Related Party Transactions
The Company leases administrative offices from entities related to officers of certain of the Company’s subsidiaries. The total expense under these arrangements was
$1.7 million
,
$1.9 million
and
$1.5 million
for
fiscal 2014
,
2013
and
2012
, respectively. The remaining future minimum lease commitments under these arrangements is approximately
$1.0 million
,
$0.9 million
,
$0.5 million
,
$0.5 million
,
$0.4 million
and
$0.4 million
during
fiscal 2015
,
2016
,
2017
,
2018
,
2019
and thereafter, respectively. Additionally, amounts paid for subcontracting services and materials to entities related to officers of certain of the Company’s subsidiaries were
$2.1 million
,
$0.7 million
and
$0.5 million
in
fiscal 2014
,
2013
and
2012
, respectively. The Company believes that all related party transactions have been conducted on an arms-length basis and the terms are similar to those that would be available to other third parties.
17. Concentration of Credit Risk
The Company is subject to concentrations of credit risk relating primarily to its cash and equivalents, trade accounts receivable and costs and estimated earnings in excess of billings. The Company grants credit under normal payment terms, generally without collateral, to its customers. These customers primarily consist of telephone companies, cable television multiple system operators, telecommunication equipment and infrastructure providers, and electric and gas utilities and other. With respect to a portion of the services provided to these customers, the Company has statutory lien rights which may in certain circumstances assist in the Company’s collection efforts. Adverse changes in overall business and economic factors may impact the Company’s customers and increase credit risks. These risks may be heightened as a result of economic weakness and market volatility. In the past, some of the Company’s customers have experienced significant financial difficulties and likewise, some may experience financial difficulties in the future. These difficulties expose the Company to increased risks related to the collectability of amounts due for services performed.
64
The Company’s customer base is highly concentrated, with its top
five
customers accounting for approximately
58.3%
,
58.5%
and
59.6%
of its total revenues in
fiscal 2014
,
2013
and
2012
, respectively. Customers whose revenues exceeded
10%
of total revenue during
fiscal 2014
,
2013
or
2012
are as follows:
|
|
Fiscal Year Ended
|
||||
|
|
2014
|
2013
|
2012
|
||
|
AT&T Inc.
|
19.2%
|
15.5%
|
13.7%
|
||
|
CenturyLink, Inc.
|
13.8%
|
14.6%
|
13.6%
|
||
|
Comcast Corporation
|
11.7%
|
10.9%
|
12.6%
|
||
|
Verizon Communications Inc.
|
8.2%
|
9.6%
|
11.3%
|
||
Customers representing
10%
or more of combined amounts of trade accounts receivable and costs and estimated earnings in excess of billings, net as of
July 26, 2014
or
July 27, 2013
had the following outstanding balances and the related percentage of the Company’s total outstanding balances:
|
|
July 26, 2014
|
July 27, 2013
|
|||||||||||
|
|
Amount
|
% of Total
|
Amount
|
% of Total
|
|||||||||
|
|
|
(Dollars in millions)
|
|
||||||||||
|
AT&T Inc.
|
$
|
87.6
|
|
17.9
|
%
|
$
|
57.4
|
|
12.6
|
%
|
|||
|
CenturyLink, Inc.
|
$
|
48.2
|
|
9.8
|
%
|
$
|
62.6
|
|
13.7
|
%
|
|||
|
Windstream Corporation
|
$
|
43.6
|
|
8.9
|
%
|
$
|
59.4
|
|
13.0
|
%
|
|||
The Company believes that none of its significant customers was experiencing financial difficulties that would materially impact the collectability of the Company's trade accounts receivable and costs in excess of billings as of
July 26, 2014
and
July 27, 2013
. See Note 4,
Accounts Receivable,
and Note 5,
Costs and Estimated Earnings in Excess of Billings,
for additional information regarding the Company's trade accounts receivable and costs and estimated earnings in excess of billings.
18. Commitments and Contingencies
In October 2012, a former employee of UtiliQuest, LLC ("UtiliQuest"), a wholly-owned subsidiary of the Company, commenced a lawsuit against UtiliQuest in the Superior Court of California. The lawsuit alleges that UtiliQuest violated the California Labor Code, the California Business & Professions Code and the Labor Code Private Attorneys General Act of 2004 by failing to pay for all hours worked (including overtime) and failing to provide meal breaks and accurate wage statements. The plaintiff seeks unspecified damages and other relief on behalf of himself and a putative class of current and former employees of UtiliQuest who worked as locators in the State of California in the four years preceding the filing date of the lawsuit. In January 2013, UtiliQuest removed the case to the United States District Court for the Northern District of California and the plaintiff subsequently filed a Motion to Remand the case back to the California Superior Court. In April 2013, the parties exchanged initial disclosures and in July 2013, the District Court granted plaintiff's Motion to Remand. UtiliQuest filed its second removal of the case to the District Court in October 2013. On January 8, 2014, the District Court remanded the matter back to the California Superior Court. In July 2014, the plaintiff’s attorney and UtiliQuest entered into a memorandum of understanding pursuant to which the parties agreed to the terms of a proposed settlement of the lawsuit. Approval of the proposed settlement by the Court is currently pending. As of July 26, 2014,
$0.6 million
was included in other accrued liabilities with respect to the settlement.
The Company has filed construction liens with respect to approximately
$17.7 million
for past due balances from a customer on a rural project funded primarily by the Rural Utilities Service agency of the United States Department of Agriculture (the “RUS”) under the American Recovery and Reinvestment Act of 2009. In April 2014, R&R Taylor Construction, Inc. ("R&R"), a construction company, filed suit against this customer alleging that the customer failed to pay for construction services and materials. In its lawsuit, the construction company seeks to foreclose on its construction lien and, ultimately, to foreclose on the parcel of land itself. Pauley Construction, Inc. (“Pauley”), a wholly-owned subsidiary of the Company, had performed work on this parcel as part of its work on the rural project described above. Pauley has filed a construction lien on the parcel with respect to past due accounts receivable relating to this project. In July 2014, R&R amended its lawsuit to include Pauley, alleging that its lien has priority over Pauley’s construction lien. Pauley has filed an answer to this amended complaint in the Montana Eighteenth Judicial District Court, a counterclaim against the construction company and a cross-claim against the customer, alleging that Pauley’s lien is superior to all other liens on such parcel of land. It is too early to evaluate the likelihood of an outcome to this matter. The Company intends to vigorously defend itself against this lawsuit as part of ongoing efforts to collect the past due amount from this customer.
65
From time to time, the Company is party to various other claims and legal proceedings. It is the opinion of management, based on information available at this time, that such other pending claims or proceedings will not have a material effect on its financial statements.
Within the Company's insurance program, it retains the risk of loss, up to certain limits, for claims related to automobile liability, general liability, workers' compensation, employee group health, and damages relating to underground facility locating services, and the Company has established reserves that it believes to be adequate based on current evaluations and experience with these types of claims. For these claims, the effect on the Company's financial statements is generally limited to the amount needed to satisfy insurance deductibles or retentions.
Commitments
The Company and its subsidiaries have operating leases covering office facilities, vehicles, and equipment that have original noncancelable terms in excess of one year. Certain of these leases contain renewal provisions and generally require the Company to pay insurance, maintenance, and other operating expenses. Total expenses incurred under these operating lease agreements, including the transactions with related parties presented in Note 16,
Related Party Transactions
, was
$17.7 million
,
$15.3 million
and
$10.6 million
for
fiscal 2014
,
2013
and
2012
, respectively. The Company also incurred rental expense of approximately
$20.4 million
,
$19.0 million
and
$9.9 million
for
fiscal 2014
,
2013
and
2012
, respectively, related to facilities, vehicles, and equipment which are being leased under original terms that are one year or less. The future minimum obligation under the leases with noncancelable terms in excess of one year, including transactions with related parties, is as follows:
|
Future Minimum Lease Payments
|
|||
|
(Dollars in thousands)
|
|||
|
2015
|
$
|
14,902
|
|
|
2016
|
12,209
|
|
|
|
2017
|
7,784
|
|
|
|
2018
|
4,459
|
|
|
|
2019
|
3,017
|
|
|
|
Thereafter
|
8,249
|
|
|
|
Total
|
$
|
50,620
|
|
Performance Bonds and Guarantees -
The Company has obligations under performance and other surety contract bonds related to certain of its customer contracts. Performance bonds generally provide the Company’s customer with the right to obtain payment and/or performance from the issuer of the bond if the Company fails to perform its contractual obligations. As of
July 26, 2014
and
July 27, 2013
, the Company had
$446.8
million and
$446.5 million
of outstanding performance and other surety contract bonds, respectively. There has been no material impact on the Company's financial statements as a result of customers exercising their rights under the bonds.
The Company has periodically guaranteed certain obligations of its subsidiaries, including obligations in connection with obtaining state contractor licenses and leasing real property and equipment.
Letters of Credit -
The Company has standby letters of credit issued under its Credit Agreement as part of its insurance program. These standby letters of credit collateralize the Company’s obligations to its insurance carriers in connection with the settlement of potential claims. As of
July 26, 2014
and
July 27, 2013
, the Company had
$49.4 million
and
$46.7 million
, respectively, of outstanding standby letters of credit issued under the Credit Agreement.
19. Quarterly Financial Data (Unaudited)
In the opinion of management, the following unaudited quarterly data from fiscal
2014
and
2013
reflect all adjustments (consisting of normal recurring accruals), which are necessary to present a fair presentation of amounts shown for such periods (the sum of the quarterly results may not equal the reported annual amounts due to rounding). The earnings per common share calculation for each quarter is based on the weighted average shares of common stock outstanding plus the dilutive effect of stock options and restricted share units, if any.
66
|
Fiscal 2014:
|
First Quarter
|
Second Quarter
|
Third Quarter
|
Fourth Quarter
|
|||||||||||
|
(Dollars in thousands, except per share amounts)
|
|||||||||||||||
|
Revenues
|
$
|
512,720
|
|
$
|
390,518
|
|
$
|
426,284
|
|
$
|
482,071
|
|
|||
|
Costs of earned revenues, excluding depreciation and amortization
|
$
|
410,119
|
|
$
|
327,353
|
|
$
|
350,352
|
|
$
|
387,221
|
|
|||
|
Gross profit
|
$
|
102,601
|
|
$
|
63,165
|
|
$
|
75,932
|
|
$
|
94,850
|
|
|||
|
Net income (loss)
|
$
|
18,660
|
|
$
|
(3,067
|
)
|
$
|
7,895
|
|
$
|
16,489
|
|
|||
|
Earnings (loss) per common share - Basic
|
$
|
0.56
|
|
$
|
(0.09
|
)
|
$
|
0.23
|
|
$
|
0.49
|
|
|||
|
Earnings (loss) per common share - Diluted
|
$
|
0.54
|
|
$
|
(0.09
|
)
|
$
|
0.23
|
|
$
|
0.47
|
|
|||
|
Fiscal 2013:
|
First Quarter
|
Second Quarter
|
Third Quarter
|
Fourth Quarter
|
|||||||||||
|
(Dollars in thousands, except per share amounts)
|
|||||||||||||||
|
Revenues
|
$
|
323,286
|
|
$
|
369,326
|
|
$
|
437,367
|
|
$
|
478,632
|
|
|||
|
Costs of earned revenues, excluding depreciation and amortization
|
$
|
257,066
|
|
$
|
301,516
|
|
$
|
357,664
|
|
$
|
384,169
|
|
|||
|
Gross profit
|
$
|
66,220
|
|
$
|
67,810
|
|
$
|
79,703
|
|
$
|
94,463
|
|
|||
|
Net income
|
$
|
11,861
|
|
$
|
1,463
|
|
$
|
7,199
|
|
$
|
14,666
|
|
|||
|
Earnings per common share - Basic
|
$
|
0.36
|
|
$
|
0.04
|
|
$
|
0.22
|
|
$
|
0.44
|
|
|||
|
Earnings per common share - Diluted
|
$
|
0.35
|
|
$
|
0.04
|
|
$
|
0.21
|
|
$
|
0.43
|
|
|||
Amounts set forth in the quarterly financial data include the results and balances of acquired companies from their respective date of acquisition.
20. Supplemental Consolidating Financial Statements
On
July 26, 2014
and
July 27, 2013
, Dycom Investments, Inc. (the "Issuer") had outstanding an aggregate principal amount of
$277.5 million
of 2021 Notes. The 2021 Notes are guaranteed by Dycom Industries, Inc. (the "Parent") and substantially all of the Company's subsidiaries. Each guarantor and non-guarantor subsidiary is
100%
owned, directly or indirectly, by the Issuer and the Parent. The 2021 Notes are fully and unconditionally guaranteed on a joint and several basis by each guarantor subsidiary and Parent. The Indenture contains certain release provisions for the guarantor subsidiaries and the Parent. With respect to the guarantor subsidiaries, these provisions include release upon (i) the sale or other disposition of all or substantially all of the assets of a guarantor or a sale or other disposition of all of the capital stock of a guarantor, in each case, to a person that is not the Issuer, the Parent or a restricted subsidiary of the Parent, (ii) the designation of a restricted subsidiary that is a guarantor as an unrestricted subsidiary, (iii) the legal defeasance, covenant defeasance or satisfaction and discharge of the Indenture, and (iv) the release of a guarantor of its guarantee of any credit facility. The Parent may not be released from its guarantee under any circumstances, except in the event of legal or covenant defeasance of the Notes or of satisfaction and discharge of the Indenture or pursuant to a provision of the Indenture which limits the Parent’s liability under its guarantee in order to prevent a fraudulent conveyance. There are no contractual restrictions limiting transfers of cash from guarantor and non-guarantor subsidiaries to Issuer or Parent, within the meaning of Rule 3-10 of Regulation S-X.
The following consolidating financial statements present, in separate columns, financial information for (i) the Parent on a parent only basis, (ii) the Issuer, (iii) the guarantor subsidiaries on a combined basis, (iv) other non-guarantor subsidiaries on a combined basis, (v) the eliminations and reclassifications necessary to arrive at the information for the Company on a consolidated basis, and (vi) the Company on a consolidated basis. The consolidating financial statements are presented in accordance with the equity method. Under this method, the investments in subsidiaries are recorded at cost and adjusted for the Company’s share of subsidiaries’ cumulative results of operations, capital contributions, distributions and other equity changes. Intercompany charges (income) between the Parent and subsidiaries are recognized in the consolidating financial statements during the period incurred and the settlement of intercompany balances is reflected in the consolidating statement of cash flows based on the nature of the underlying transactions.
67
|
DYCOM INDUSTRIES, INC. AND SUBSIDIARIES
CONSOLIDATED BALANCE SHEET
JULY 26, 2014
|
|||||||||||||||||||||||
|
|
Parent
|
Issuer
|
Subsidiary Guarantors
|
Non- Guarantor Subsidiaries
|
Eliminations and Reclassifications
|
Dycom Consolidated
|
|||||||||||||||||
|
|
(Dollars in thousands)
|
||||||||||||||||||||||
|
ASSETS
|
|||||||||||||||||||||||
|
CURRENT ASSETS:
|
|
|
|
|
|
|
|||||||||||||||||
|
Cash and equivalents
|
$
|
—
|
|
$
|
—
|
|
$
|
19,739
|
|
$
|
933
|
|
$
|
—
|
|
$
|
20,672
|
|
|||||
|
Accounts receivable, net
|
—
|
|
—
|
|
269,760
|
|
2,981
|
|
—
|
|
272,741
|
|
|||||||||||
|
Costs and estimated earnings in excess of billings
|
—
|
|
—
|
|
228,541
|
|
2,028
|
|
—
|
|
230,569
|
|
|||||||||||
|
Inventories
|
—
|
|
—
|
|
49,095
|
|
—
|
|
—
|
|
49,095
|
|
|||||||||||
|
Deferred tax assets, net
|
3,822
|
|
—
|
|
16,193
|
|
87
|
|
(170
|
)
|
19,932
|
|
|||||||||||
|
Other current assets
|
4,956
|
|
16
|
|
7,237
|
|
518
|
|
—
|
|
12,727
|
|
|||||||||||
|
Total current assets
|
8,778
|
|
16
|
|
590,565
|
|
6,547
|
|
(170
|
)
|
605,736
|
|
|||||||||||
|
PROPERTY AND EQUIPMENT, NET
|
18,108
|
|
—
|
|
171,158
|
|
16,147
|
|
—
|
|
205,413
|
|
|||||||||||
|
GOODWILL
|
—
|
|
—
|
|
269,088
|
|
—
|
|
—
|
|
269,088
|
|
|||||||||||
|
INTANGIBLE ASSETS, NET
|
—
|
|
—
|
|
115,483
|
|
633
|
|
—
|
|
116,116
|
|
|||||||||||
|
DEFERRED TAX ASSETS, NET NON-CURRENT
|
182
|
|
—
|
|
3,884
|
|
15
|
|
(4,081
|
)
|
—
|
|
|||||||||||
|
INVESTMENT IN SUBSIDIARIES
|
809,617
|
|
1,540,338
|
|
1,621
|
|
—
|
|
(2,351,576
|
)
|
—
|
|
|||||||||||
|
INTERCOMPANY RECEIVABLES
|
—
|
|
—
|
|
628,443
|
|
—
|
|
(628,443
|
)
|
—
|
|
|||||||||||
|
OTHER
|
7,748
|
|
5,636
|
|
2,466
|
|
151
|
|
—
|
|
16,001
|
|
|||||||||||
|
TOTAL NON-CURRENT ASSETS
|
835,655
|
|
1,545,974
|
|
1,192,143
|
|
16,946
|
|
(2,984,100
|
)
|
606,618
|
|
|||||||||||
|
TOTAL ASSETS
|
$
|
844,433
|
|
$
|
1,545,990
|
|
$
|
1,782,708
|
|
$
|
23,493
|
|
$
|
(2,984,270
|
)
|
$
|
1,212,354
|
|
|||||
|
LIABILITIES AND STOCKHOLDERS' EQUITY
|
|||||||||||||||||||||||
|
CURRENT LIABILITIES:
|
|
|
|
|
|
|
|
|
|
|
|
|
|||||||||||
|
Accounts payable
|
$
|
3,083
|
|
$
|
—
|
|
$
|
58,970
|
|
$
|
1,265
|
|
$
|
—
|
|
$
|
63,318
|
|
|||||
|
Current portion of debt
|
10,938
|
|
—
|
|
—
|
|
—
|
|
—
|
|
10,938
|
|
|||||||||||
|
Billings in excess of costs and estimated earnings
|
—
|
|
—
|
|
13,882
|
|
—
|
|
—
|
|
13,882
|
|
|||||||||||
|
Accrued insurance claims
|
612
|
|
—
|
|
31,599
|
|
49
|
|
—
|
|
32,260
|
|
|||||||||||
|
Deferred tax liabilities
|
—
|
|
80
|
|
66
|
|
24
|
|
(170
|
)
|
—
|
|
|||||||||||
|
Other accrued liabilities
|
12,668
|
|
566
|
|
61,284
|
|
1,616
|
|
—
|
|
76,134
|
|
|||||||||||
|
Total current liabilities
|
27,301
|
|
646
|
|
165,801
|
|
2,954
|
|
(170
|
)
|
196,532
|
|
|||||||||||
|
LONG-TERM DEBT
|
166,125
|
|
280,738
|
|
—
|
|
—
|
|
—
|
|
446,863
|
|
|||||||||||
|
ACCRUED INSURANCE CLAIMS
|
778
|
|
—
|
|
32,959
|
|
45
|
|
—
|
|
33,782
|
|
|||||||||||
|
DEFERRED TAX LIABILITIES, NET NON-CURRENT
|
—
|
|
432
|
|
48,593
|
|
417
|
|
(4,081
|
)
|
45,361
|
|
|||||||||||
|
INTERCOMPANY PAYABLES
|
162,127
|
|
454,557
|
|
—
|
|
11,759
|
|
(628,443
|
)
|
—
|
|
|||||||||||
|
OTHER LIABILITIES
|
3,168
|
|
—
|
|
1,711
|
|
3
|
|
—
|
|
4,882
|
|
|||||||||||
|
Total liabilities
|
359,499
|
|
736,373
|
|
249,064
|
|
15,178
|
|
(632,694
|
)
|
727,420
|
|
|||||||||||
|
Total stockholders' equity
|
484,934
|
|
809,617
|
|
1,533,644
|
|
8,315
|
|
(2,351,576
|
)
|
484,934
|
|
|||||||||||
|
TOTAL LIABILITIES AND STOCKHOLDERS' EQUITY
|
$
|
844,433
|
|
$
|
1,545,990
|
|
$
|
1,782,708
|
|
$
|
23,493
|
|
$
|
(2,984,270
|
)
|
$
|
1,212,354
|
|
|||||
68
|
DYCOM INDUSTRIES, INC. AND SUBSIDIARIES
CONSOLIDATED BALANCE SHEET
JULY 27, 2013
|
|||||||||||||||||||||||
|
|
Parent
|
Issuer
|
Subsidiary Guarantors
|
Non- Guarantor Subsidiaries
|
Eliminations and Reclassifications
|
Dycom Consolidated
|
|||||||||||||||||
|
|
(Dollars in thousands)
|
||||||||||||||||||||||
|
ASSETS
|
|||||||||||||||||||||||
|
CURRENT ASSETS:
|
|
|
|
|
|
|
|||||||||||||||||
|
Cash and equivalents
|
$
|
—
|
|
$
|
—
|
|
$
|
18,166
|
|
$
|
441
|
|
$
|
—
|
|
$
|
18,607
|
|
|||||
|
Accounts receivable, net
|
—
|
|
—
|
|
249,533
|
|
2,669
|
|
—
|
|
252,202
|
|
|||||||||||
|
Costs and estimated earnings in excess of billings
|
—
|
|
—
|
|
202,651
|
|
1,698
|
|
—
|
|
204,349
|
|
|||||||||||
|
Inventories
|
—
|
|
—
|
|
35,999
|
|
—
|
|
—
|
|
35,999
|
|
|||||||||||
|
Deferred tax assets, net
|
2,285
|
|
—
|
|
15,873
|
|
121
|
|
(1,426
|
)
|
16,853
|
|
|||||||||||
|
Other current assets
|
5,079
|
|
10
|
|
7,583
|
|
452
|
|
—
|
|
13,124
|
|
|||||||||||
|
Total current assets
|
7,364
|
|
10
|
|
529,805
|
|
5,381
|
|
(1,426
|
)
|
541,134
|
|
|||||||||||
|
PROPERTY AND EQUIPMENT, NET
|
13,779
|
|
—
|
|
173,254
|
|
15,670
|
|
—
|
|
202,703
|
|
|||||||||||
|
GOODWILL
|
—
|
|
—
|
|
267,810
|
|
—
|
|
—
|
|
267,810
|
|
|||||||||||
|
INTANGIBLE ASSETS, NET
|
—
|
|
—
|
|
125,275
|
|
—
|
|
—
|
|
125,275
|
|
|||||||||||
|
DEFERRED TAX ASSETS, NET NON-CURRENT
|
691
|
|
—
|
|
4,104
|
|
66
|
|
(4,861
|
)
|
—
|
|
|||||||||||
|
INVESTMENT IN SUBSIDIARIES
|
769,639
|
|
1,472,559
|
|
—
|
|
—
|
|
(2,242,198
|
)
|
—
|
|
|||||||||||
|
INTERCOMPANY RECEIVABLES
|
—
|
|
—
|
|
618,524
|
|
—
|
|
(618,524
|
)
|
—
|
|
|||||||||||
|
OTHER
|
8,739
|
|
6,331
|
|
2,133
|
|
83
|
|
—
|
|
17,286
|
|
|||||||||||
|
TOTAL NON-CURRENT ASSETS
|
792,848
|
|
1,478,890
|
|
1,191,100
|
|
15,819
|
|
(2,865,583
|
)
|
613,074
|
|
|||||||||||
|
TOTAL ASSETS
|
$
|
800,212
|
|
$
|
1,478,900
|
|
$
|
1,720,905
|
|
$
|
21,200
|
|
$
|
(2,867,009
|
)
|
$
|
1,154,208
|
|
|||||
|
LIABILITIES AND STOCKHOLDERS' EQUITY
|
|||||||||||||||||||||||
|
CURRENT LIABILITIES:
|
|
|
|
|
|
|
|
|
|
|
|
|
|||||||||||
|
Accounts payable
|
$
|
2,042
|
|
$
|
—
|
|
$
|
75,012
|
|
$
|
900
|
|
$
|
—
|
|
$
|
77,954
|
|
|||||
|
Current portion of debt
|
7,813
|
|
—
|
|
—
|
|
—
|
|
—
|
|
7,813
|
|
|||||||||||
|
Billings in excess of costs and estimated earnings
|
—
|
|
—
|
|
13,788
|
|
—
|
|
—
|
|
13,788
|
|
|||||||||||
|
Accrued insurance claims
|
619
|
|
—
|
|
28,342
|
|
108
|
|
—
|
|
29,069
|
|
|||||||||||
|
Deferred tax liabilities
|
—
|
|
155
|
|
140
|
|
1,131
|
|
(1,426
|
)
|
—
|
|
|||||||||||
|
Other accrued liabilities
|
9,151
|
|
1,321
|
|
59,374
|
|
1,345
|
|
—
|
|
71,191
|
|
|||||||||||
|
Total current liabilities
|
19,625
|
|
1,476
|
|
176,656
|
|
3,484
|
|
(1,426
|
)
|
199,815
|
|
|||||||||||
|
LONG-TERM DEBT
|
163,062
|
|
281,107
|
|
—
|
|
—
|
|
—
|
|
444,169
|
|
|||||||||||
|
ACCRUED INSURANCE CLAIMS
|
726
|
|
—
|
|
26,426
|
|
98
|
|
—
|
|
27,250
|
|
|||||||||||
|
DEFERRED TAX LIABILITIES, NET NON-CURRENT
|
—
|
|
427
|
|
52,436
|
|
610
|
|
(4,861
|
)
|
48,612
|
|
|||||||||||
|
INTERCOMPANY PAYABLES
|
185,296
|
|
426,251
|
|
—
|
|
6,977
|
|
(618,524
|
)
|
—
|
|
|||||||||||
|
OTHER LIABILITIES
|
3,142
|
|
—
|
|
2,855
|
|
4
|
|
—
|
|
6,001
|
|
|||||||||||
|
Total liabilities
|
371,851
|
|
709,261
|
|
258,373
|
|
11,173
|
|
(624,811
|
)
|
725,847
|
|
|||||||||||
|
Total stockholders' equity
|
428,361
|
|
769,639
|
|
1,462,532
|
|
10,027
|
|
(2,242,198
|
)
|
428,361
|
|
|||||||||||
|
TOTAL LIABILITIES AND STOCKHOLDERS' EQUITY
|
$
|
800,212
|
|
$
|
1,478,900
|
|
$
|
1,720,905
|
|
$
|
21,200
|
|
$
|
(2,867,009
|
)
|
$
|
1,154,208
|
|
|||||
69
|
DYCOM INDUSTRIES, INC. AND SUBSIDIARIES
CONSOLIDATED STATEMENT OF OPERATIONS
YEAR ENDED JULY 26, 2014
|
|||||||||||||||||||||||
|
|
Parent
|
Issuer
|
Subsidiary Guarantors
|
Non- Guarantor Subsidiaries
|
Eliminations and Reclassifications
|
Dycom Consolidated
|
|||||||||||||||||
|
|
(Dollars in thousands)
|
||||||||||||||||||||||
|
REVENUES:
|
|
|
|
|
|
|
|||||||||||||||||
|
Contract revenues
|
$
|
—
|
|
$
|
—
|
|
$
|
1,799,538
|
|
$
|
12,055
|
|
$
|
—
|
|
$
|
1,811,593
|
|
|||||
|
EXPENSES:
|
|
|
|
|
|
|
|
|
|
|
|
|
|||||||||||
|
Costs of earned revenues, excluding depreciation and amortization
|
—
|
|
—
|
|
1,466,221
|
|
8,824
|
|
—
|
|
1,475,045
|
|
|||||||||||
|
General and administrative
|
42,958
|
|
616
|
|
107,326
|
|
10,958
|
|
—
|
|
161,858
|
|
|||||||||||
|
Depreciation and amortization
|
4,256
|
|
—
|
|
84,178
|
|
4,338
|
|
—
|
|
92,772
|
|
|||||||||||
|
Intercompany charges (income), net
|
(53,922
|
)
|
—
|
|
54,688
|
|
(766
|
)
|
—
|
|
—
|
|
|||||||||||
|
Total
|
(6,708
|
)
|
616
|
|
1,712,413
|
|
23,354
|
|
—
|
|
1,729,675
|
|
|||||||||||
|
Interest expense, net
|
(6,827
|
)
|
(19,993
|
)
|
(7
|
)
|
—
|
|
—
|
|
(26,827
|
)
|
|||||||||||
|
Other income, net
|
119
|
|
—
|
|
10,895
|
|
214
|
|
—
|
|
11,228
|
|
|||||||||||
|
INCOME (LOSS) BEFORE INCOME TAXES AND EQUITY IN EARNINGS OF SUBSIDIARIES
|
—
|
|
(20,609
|
)
|
98,013
|
|
(11,085
|
)
|
—
|
|
66,319
|
|
|||||||||||
|
PROVISION (BENEFIT) FOR INCOME TAXES
|
—
|
|
(8,186
|
)
|
38,930
|
|
(4,403
|
)
|
—
|
|
26,341
|
|
|||||||||||
|
NET INCOME (LOSS) BEFORE EQUITY IN EARNINGS OF SUBSIDIARIES
|
—
|
|
(12,423
|
)
|
59,083
|
|
(6,682
|
)
|
—
|
|
39,978
|
|
|||||||||||
|
EQUITY IN EARNINGS OF SUBSIDIARIES
|
39,978
|
|
52,401
|
|
135
|
|
—
|
|
(92,514
|
)
|
—
|
|
|||||||||||
|
NET INCOME (LOSS)
|
$
|
39,978
|
|
$
|
39,978
|
|
$
|
59,218
|
|
$
|
(6,682
|
)
|
$
|
(92,514
|
)
|
$
|
39,978
|
|
|||||
|
Foreign currency translation loss, net of tax
|
(261
|
)
|
(261
|
)
|
—
|
|
(261
|
)
|
522
|
|
(261
|
)
|
|||||||||||
|
COMPREHENSIVE INCOME (LOSS)
|
$
|
39,717
|
|
$
|
39,717
|
|
$
|
59,218
|
|
$
|
(6,943
|
)
|
$
|
(91,992
|
)
|
$
|
39,717
|
|
|||||
70
|
DYCOM INDUSTRIES, INC. AND SUBSIDIARIES
CONSOLIDATED STATEMENT OF OPERATIONS
YEAR ENDED JULY 27, 2013
|
|||||||||||||||||||||||
|
|
Parent
|
Issuer
|
Subsidiary Guarantors
|
Non-Guarantor Subsidiaries
|
Eliminations and Reclassifications
|
Dycom Consolidated
|
|||||||||||||||||
|
|
(Dollars in thousands)
|
||||||||||||||||||||||
|
REVENUES:
|
|
|
|
|
|
|
|||||||||||||||||
|
Contract revenues
|
$
|
—
|
|
$
|
—
|
|
$
|
1,594,363
|
|
$
|
14,249
|
|
$
|
—
|
|
$
|
1,608,612
|
|
|||||
|
EXPENSES:
|
|
|
|
|
|
|
|
|
|
|
|
|
|||||||||||
|
Costs of earned revenues, excluding depreciation and amortization
|
—
|
|
—
|
|
1,288,369
|
|
12,047
|
|
—
|
|
1,300,416
|
|
|||||||||||
|
General and administrative
|
44,462
|
|
818
|
|
89,336
|
|
11,155
|
|
—
|
|
145,771
|
|
|||||||||||
|
Depreciation and amortization
|
2,920
|
|
—
|
|
77,595
|
|
4,966
|
|
—
|
|
85,481
|
|
|||||||||||
|
Intercompany charges (income), net
|
(53,377
|
)
|
—
|
|
54,720
|
|
(1,343
|
)
|
—
|
|
—
|
|
|||||||||||
|
Total
|
(5,995
|
)
|
818
|
|
1,510,020
|
|
26,825
|
|
—
|
|
1,531,668
|
|
|||||||||||
|
Interest expense, net
|
(5,675
|
)
|
(17,599
|
)
|
(60
|
)
|
—
|
|
—
|
|
(23,334
|
)
|
|||||||||||
|
Other income, net
|
(320
|
)
|
—
|
|
4,794
|
|
115
|
|
—
|
|
4,589
|
|
|||||||||||
|
INCOME (LOSS) BEFORE INCOME TAXES AND EQUITY IN EARNINGS OF SUBSIDIARIES
|
—
|
|
(18,417
|
)
|
89,077
|
|
(12,461
|
)
|
—
|
|
58,199
|
|
|||||||||||
|
PROVISION (BENEFIT) FOR INCOME TAXES
|
—
|
|
(7,281
|
)
|
35,214
|
|
(4,922
|
)
|
—
|
|
23,011
|
|
|||||||||||
|
NET INCOME (LOSS) BEFORE EQUITY IN EARNINGS OF SUBSIDIARIES
|
—
|
|
(11,136
|
)
|
53,863
|
|
(7,539
|
)
|
—
|
|
35,188
|
|
|||||||||||
|
EQUITY IN EARNINGS OF SUBSIDIARIES
|
35,188
|
|
46,324
|
|
—
|
|
—
|
|
(81,512
|
)
|
—
|
|
|||||||||||
|
NET INCOME (LOSS)
|
$
|
35,188
|
|
$
|
35,188
|
|
$
|
53,863
|
|
$
|
(7,539
|
)
|
$
|
(81,512
|
)
|
$
|
35,188
|
|
|||||
|
Foreign currency translation loss, net of tax
|
(35
|
)
|
(35
|
)
|
—
|
|
(35
|
)
|
70
|
|
(35
|
)
|
|||||||||||
|
COMPREHENSIVE INCOME (LOSS)
|
$
|
35,153
|
|
$
|
35,153
|
|
$
|
53,863
|
|
$
|
(7,574
|
)
|
$
|
(81,442
|
)
|
$
|
35,153
|
|
|||||
71
|
DYCOM INDUSTRIES, INC. AND SUBSIDIARIES
CONSOLIDATED STATEMENT OF OPERATIONS
YEAR ENDED JULY 28, 2012
|
|||||||||||||||||||||||
|
|
Parent
|
Issuer
|
Subsidiary Guarantors
|
Non-Guarantor Subsidiaries
|
Eliminations and Reclassifications
|
Dycom Consolidated
|
|||||||||||||||||
|
|
(Dollars in thousands)
|
||||||||||||||||||||||
|
REVENUES:
|
|
|
|
|
|
|
|||||||||||||||||
|
Contract revenues
|
$
|
—
|
|
$
|
—
|
|
$
|
1,186,380
|
|
$
|
14,739
|
|
$
|
—
|
|
$
|
1,201,119
|
|
|||||
|
EXPENSES:
|
|
|
|
|
|
|
|
|
|
|
|
|
|||||||||||
|
Costs of earned revenues, excluding depreciation and amortization
|
—
|
|
—
|
|
957,449
|
|
11,500
|
|
—
|
|
968,949
|
|
|||||||||||
|
General and administrative
|
28,048
|
|
574
|
|
65,185
|
|
10,217
|
|
—
|
|
104,024
|
|
|||||||||||
|
Depreciation and amortization
|
3,137
|
|
—
|
|
54,735
|
|
4,833
|
|
(12
|
)
|
62,693
|
|
|||||||||||
|
Intercompany charges (income), net
|
(34,212
|
)
|
—
|
|
33,749
|
|
463
|
|
—
|
|
—
|
|
|||||||||||
|
Total
|
(3,027
|
)
|
574
|
|
1,111,118
|
|
27,013
|
|
(12
|
)
|
1,135,666
|
|
|||||||||||
|
Interest income (expense), net
|
(3,049
|
)
|
(13,660
|
)
|
(8
|
)
|
—
|
|
—
|
|
(16,717
|
)
|
|||||||||||
|
Other income, net
|
22
|
|
—
|
|
15,281
|
|
522
|
|
—
|
|
15,825
|
|
|||||||||||
|
INCOME (LOSS) BEFORE INCOME TAXES AND EQUITY IN EARNINGS OF SUBSIDIARIES
|
—
|
|
(14,234
|
)
|
90,535
|
|
(11,752
|
)
|
12
|
|
64,561
|
|
|||||||||||
|
PROVISION (BENEFIT) FOR INCOME TAXES
|
—
|
|
(5,550
|
)
|
35,299
|
|
(4,566
|
)
|
—
|
|
25,183
|
|
|||||||||||
|
NET INCOME (LOSS) BEFORE EQUITY IN EARNINGS OF SUBSIDIARIES
|
—
|
|
(8,684
|
)
|
55,236
|
|
(7,186
|
)
|
12
|
|
39,378
|
|
|||||||||||
|
EQUITY IN EARNINGS OF SUBSIDIARIES
|
39,378
|
|
48,062
|
|
—
|
|
—
|
|
(87,440
|
)
|
—
|
|
|||||||||||
|
|
|
||||||||||||||||||||||
|
NET INCOME (LOSS)
|
$
|
39,378
|
|
$
|
39,378
|
|
$
|
55,236
|
|
$
|
(7,186
|
)
|
$
|
(87,428
|
)
|
$
|
39,378
|
|
|||||
|
Foreign currency translation loss, net of tax
|
(161
|
)
|
(161
|
)
|
—
|
|
(161
|
)
|
322
|
|
(161
|
)
|
|||||||||||
|
COMPREHENSIVE INCOME (LOSS)
|
$
|
39,217
|
|
$
|
39,217
|
|
$
|
55,236
|
|
$
|
(7,347
|
)
|
$
|
(87,106
|
)
|
$
|
39,217
|
|
|||||
72
|
DYCOM INDUSTRIES, INC. AND SUBSIDIARIES
CONSOLIDATED STATEMENT OF CASH FLOWS
YEAR ENDED JULY 26, 2014
|
|||||||||||||||||||||||
|
|
Parent
|
Issuer
|
Subsidiary Guarantors
|
Non- Guarantor Subsidiaries
|
Eliminations and Reclassifications
|
Dycom Consolidated
|
|||||||||||||||||
|
|
(Dollars in thousands)
|
||||||||||||||||||||||
|
Net cash provided by (used in) operating activities
|
$
|
7,199
|
|
$
|
(12,242
|
)
|
$
|
93,898
|
|
$
|
(4,670
|
)
|
$
|
—
|
|
$
|
84,185
|
|
|||||
|
Cash flows from investing activities:
|
|
|
|
|
|
|
|
|
|
|
|||||||||||||
|
Cash paid for acquisitions, net of cash acquired
|
—
|
|
—
|
|
(16,388
|
)
|
(700
|
)
|
—
|
|
(17,088
|
)
|
|||||||||||
|
Capital expenditures
|
(8,541
|
)
|
—
|
|
(72,962
|
)
|
(7,633
|
)
|
—
|
|
(89,136
|
)
|
|||||||||||
|
Proceeds from sale of assets
|
—
|
|
—
|
|
12,146
|
|
3,261
|
|
—
|
|
15,407
|
|
|||||||||||
|
Return of capital from subsidiaries
|
—
|
|
683
|
|
—
|
|
—
|
|
(683
|
)
|
—
|
|
|||||||||||
|
Investment in subsidiaries
|
—
|
|
(9,235
|
)
|
(785
|
)
|
—
|
|
10,020
|
|
—
|
|
|||||||||||
|
Changes in restricted cash
|
(303
|
)
|
—
|
|
—
|
|
—
|
|
—
|
|
(303
|
)
|
|||||||||||
|
Net cash (used in) provided by investing activities
|
(8,844
|
)
|
(8,552
|
)
|
(77,989
|
)
|
(5,072
|
)
|
9,337
|
|
(91,120
|
)
|
|||||||||||
|
Cash flows from financing activities:
|
|
|
|
|
|
|
|
|
|
|
|||||||||||||
|
Proceeds from issuance of 7.125% senior subordinated notes due 2021
|
—
|
|
—
|
|
—
|
|
—
|
|
—
|
|
—
|
|
|||||||||||
|
Proceeds from Term Loan on Senior Credit Agreement
|
—
|
|
—
|
|
—
|
|
—
|
|
—
|
|
—
|
|
|||||||||||
|
Proceeds from borrowings on Senior Credit Agreement
|
502,000
|
|
—
|
|
—
|
|
—
|
|
—
|
|
502,000
|
|
|||||||||||
|
Principal payments on Senior Credit Agreement
|
(495,813
|
)
|
—
|
|
—
|
|
—
|
|
—
|
|
(495,813
|
)
|
|||||||||||
|
Debt issuance costs
|
—
|
|
—
|
|
—
|
|
—
|
|
—
|
|
—
|
|
|||||||||||
|
Repurchases of common stock
|
(9,999
|
)
|
—
|
|
—
|
|
—
|
|
—
|
|
(9,999
|
)
|
|||||||||||
|
Exercise of stock options and other
|
14,568
|
|
—
|
|
—
|
|
—
|
|
—
|
|
14,568
|
|
|||||||||||
|
Restricted stock tax withholdings
|
(3,781
|
)
|
—
|
|
—
|
|
—
|
|
—
|
|
(3,781
|
)
|
|||||||||||
|
Excess tax benefit from share-based awards
|
3,025
|
|
—
|
|
—
|
|
—
|
|
—
|
|
3,025
|
|
|||||||||||
|
Principal payments on capital lease obligations and other financing
|
—
|
|
—
|
|
(1,000
|
)
|
—
|
|
—
|
|
(1,000
|
)
|
|||||||||||
|
Intercompany funding
|
(8,355
|
)
|
20,794
|
|
(13,336
|
)
|
10,234
|
|
(9,337
|
)
|
—
|
|
|||||||||||
|
Net cash provided by (used in) financing activities
|
1,645
|
|
20,794
|
|
(14,336
|
)
|
10,234
|
|
(9,337
|
)
|
9,000
|
|
|||||||||||
|
Net decrease in cash and equivalents
|
—
|
|
—
|
|
1,573
|
|
492
|
|
—
|
|
2,065
|
|
|||||||||||
|
CASH AND EQUIVALENTS AT BEGINNING OF PERIOD
|
—
|
|
—
|
|
18,166
|
|
441
|
|
—
|
|
18,607
|
|
|||||||||||
|
CASH AND EQUIVALENTS AT END OF PERIOD
|
$
|
—
|
|
$
|
—
|
|
$
|
19,739
|
|
$
|
933
|
|
$
|
—
|
|
$
|
20,672
|
|
|||||
73
|
DYCOM INDUSTRIES, INC. AND SUBSIDIARIES
CONSOLIDATED STATEMENT OF CASH FLOWS
YEAR ENDED JULY 27, 2013
|
|||||||||||||||||||||||
|
|
Parent
|
Issuer
|
Subsidiary Guarantors
|
Non- Guarantor Subsidiaries
|
Eliminations and Reclassifications
|
Dycom Consolidated
|
|||||||||||||||||
|
|
(Dollars in thousands)
|
||||||||||||||||||||||
|
Net cash provided by (used in) operating activities
|
$
|
6,952
|
|
$
|
(9,612
|
)
|
$
|
112,176
|
|
$
|
(2,772
|
)
|
$
|
—
|
|
$
|
106,744
|
|
|||||
|
Cash flows from investing activities:
|
|
|
|
|
|
|
|
|
|
|
|
|
|||||||||||
|
Cash paid for acquisitions, net of cash acquired
|
—
|
|
—
|
|
(330,291
|
)
|
—
|
|
—
|
|
(330,291
|
)
|
|||||||||||
|
Capital expenditures
|
(8,151
|
)
|
—
|
|
(51,647
|
)
|
(4,852
|
)
|
—
|
|
(64,650
|
)
|
|||||||||||
|
Proceeds from sale of assets
|
—
|
|
—
|
|
5,770
|
|
57
|
|
—
|
|
5,827
|
|
|||||||||||
|
Return of capital from subsidiaries
|
—
|
|
1,816
|
|
—
|
|
—
|
|
(1,816
|
)
|
—
|
|
|||||||||||
|
Investment in subsidiaries
|
—
|
|
(2,600
|
)
|
—
|
|
—
|
|
2,600
|
|
—
|
|
|||||||||||
|
Changes in restricted cash
|
60
|
|
—
|
|
—
|
|
—
|
|
—
|
|
60
|
|
|||||||||||
|
Net cash (used in) provided by investing activities
|
(8,091
|
)
|
(784
|
)
|
(376,168
|
)
|
(4,795
|
)
|
784
|
|
(389,054
|
)
|
|||||||||||
|
Cash flows from financing activities:
|
|
|
|
|
|
|
|
|
|
|
|
|
|||||||||||
|
Proceeds from issuance of 7.125% senior subordinates notes due 2021, (including $3.8 million premium on issuance)
|
—
|
|
93,825
|
|
—
|
|
—
|
|
—
|
|
93,825
|
|
|||||||||||
|
Proceeds from Term Loan on Senior Credit Agreement
|
125,000
|
|
—
|
|
—
|
|
—
|
|
—
|
|
125,000
|
|
|||||||||||
|
Proceeds from borrowings on Senior Credit Agreement
|
404,500
|
|
—
|
|
—
|
|
—
|
|
—
|
|
404,500
|
|
|||||||||||
|
Principal payments on Senior Credit Agreement
|
(358,625
|
)
|
—
|
|
—
|
|
—
|
|
—
|
|
(358,625
|
)
|
|||||||||||
|
Debt issuance costs
|
(4,158
|
)
|
(2,581
|
)
|
—
|
|
—
|
|
—
|
|
(6,739
|
)
|
|||||||||||
|
Repurchases of common stock
|
(15,203
|
)
|
—
|
|
—
|
|
—
|
|
—
|
|
(15,203
|
)
|
|||||||||||
|
Exercise of stock options and other
|
5,253
|
|
—
|
|
—
|
|
—
|
|
—
|
|
5,253
|
|
|||||||||||
|
Restricted stock tax withholdings
|
(884
|
)
|
—
|
|
—
|
|
—
|
|
—
|
|
(884
|
)
|
|||||||||||
|
Excess tax benefit from share-based awards
|
1,283
|
|
—
|
|
—
|
|
—
|
|
—
|
|
1,283
|
|
|||||||||||
|
Principal payments on capital lease obligations
|
—
|
|
—
|
|
(74
|
)
|
—
|
|
—
|
|
(74
|
)
|
|||||||||||
|
Intercompany funding
|
(156,027
|
)
|
(80,848
|
)
|
230,669
|
|
6,990
|
|
(784
|
)
|
—
|
|
|||||||||||
|
Net cash provided by (used in) financing activities
|
1,139
|
|
10,396
|
|
230,595
|
|
6,990
|
|
(784
|
)
|
248,336
|
|
|||||||||||
|
Net increase in cash and equivalents
|
—
|
|
—
|
|
(33,397
|
)
|
(577
|
)
|
—
|
|
(33,974
|
)
|
|||||||||||
|
CASH AND EQUIVALENTS AT BEGINNING OF PERIOD
|
—
|
|
—
|
|
51,563
|
|
1,018
|
|
—
|
|
52,581
|
|
|||||||||||
|
CASH AND EQUIVALENTS AT END OF PERIOD
|
$
|
—
|
|
$
|
—
|
|
$
|
18,166
|
|
$
|
441
|
|
$
|
—
|
|
$
|
18,607
|
|
|||||
74
|
DYCOM INDUSTRIES, INC. AND SUBSIDIARIES
CONSOLIDATED STATEMENT OF CASH FLOWS
YEAR ENDED JULY 28, 2012
|
|||||||||||||||||||||||
|
|
Parent
|
Issuer
|
Subsidiary Guarantors
|
Non- Guarantor Subsidiaries
|
Eliminations and Reclassifications
|
Dycom Consolidated
|
|||||||||||||||||
|
|
(Dollars in thousands)
|
||||||||||||||||||||||
|
Net cash provided by (used in) operating activities
|
$
|
6,755
|
|
$
|
(8,774
|
)
|
$
|
69,823
|
|
$
|
(2,679
|
)
|
$
|
—
|
|
$
|
65,125
|
|
|||||
|
Cash flows from investing activities:
|
|
|
|
|
|
|
|
|
|
|
|||||||||||||
|
Capital expenditures
|
(3,685
|
)
|
—
|
|
(69,362
|
)
|
(4,565
|
)
|
—
|
|
(77,612
|
)
|
|||||||||||
|
Proceeds from sale of assets
|
—
|
|
—
|
|
19,211
|
|
5,572
|
|
—
|
|
24,783
|
|
|||||||||||
|
Changes in restricted cash
|
926
|
|
—
|
|
—
|
|
—
|
|
—
|
|
926
|
|
|||||||||||
|
Capital contributions to subsidiaries, net
|
—
|
|
(4,943
|
)
|
—
|
|
—
|
|
4,943
|
|
—
|
|
|||||||||||
|
Net cash (used in) provided by investing activities
|
(2,759
|
)
|
(4,943
|
)
|
(50,151
|
)
|
1,007
|
|
4,943
|
|
(51,903
|
)
|
|||||||||||
|
Cash flows from financing activities:
|
|
|
|
|
|
|
|
|
|
|
|||||||||||||
|
Repurchases of common stock
|
(12,960
|
)
|
—
|
|
—
|
|
—
|
|
—
|
|
(12,960
|
)
|
|||||||||||
|
Exercise of stock options and other
|
6,490
|
|
—
|
|
—
|
|
—
|
|
—
|
|
6,490
|
|
|||||||||||
|
Restricted stock tax withholdings
|
(329
|
)
|
—
|
|
—
|
|
—
|
|
—
|
|
(329
|
)
|
|||||||||||
|
Excess tax benefit from share-based awards
|
1,625
|
|
—
|
|
—
|
|
—
|
|
—
|
|
1,625
|
|
|||||||||||
|
Principal payments on capital lease obligations
|
—
|
|
—
|
|
(233
|
)
|
—
|
|
—
|
|
(233
|
)
|
|||||||||||
|
Intercompany funding
|
1,178
|
|
13,717
|
|
(12,484
|
)
|
2,532
|
|
(4,943
|
)
|
—
|
|
|||||||||||
|
Net cash provided by (used in) financing activities
|
(3,996
|
)
|
13,717
|
|
(12,717
|
)
|
2,532
|
|
(4,943
|
)
|
(5,407
|
)
|
|||||||||||
|
Net increase in cash and equivalents
|
—
|
|
—
|
|
6,955
|
|
860
|
|
—
|
|
7,815
|
|
|||||||||||
|
CASH AND EQUIVALENTS AT BEGINNING OF PERIOD
|
—
|
|
—
|
|
44,608
|
|
158
|
|
—
|
|
44,766
|
|
|||||||||||
|
CASH AND EQUIVALENTS AT END OF PERIOD
|
$
|
—
|
|
$
|
—
|
|
$
|
51,563
|
|
$
|
1,018
|
|
$
|
—
|
|
$
|
52,581
|
|
|||||
75
REPORT OF INDEPENDENT REGISTERED PUBLIC ACCOUNTING FIRM
To the Board of Directors and Stockholders of
Dycom Industries, Inc.
Palm Beach Gardens, Florida
We have audited the accompanying consolidated balance sheets of Dycom Industries, Inc. and subsidiaries (the "Company") as of July 26, 2014 and July 27, 2013, and the related consolidated statements of operations, comprehensive income, stockholders' equity, and cash flows for each of the three years in the period ended July 26, 2014. These financial statements are the responsibility of the Company's management. Our responsibility is to express an opinion on these financial statements based on our audits.
We conducted our audits in accordance with the standards of the Public Company Accounting Oversight Board (United States). Those standards require that we plan and perform the audit to obtain reasonable assurance about whether the financial statements are free of material misstatement. An audit includes examining, on a test basis, evidence supporting the amounts and disclosures in the financial statements. An audit also includes assessing the accounting principles used and significant estimates made by management, as well as evaluating the overall financial statement presentation. We believe that our audits provide a reasonable basis for our opinion.
In our opinion, such consolidated financial statements present fairly, in all material respects, the financial position of Dycom Industries, Inc. and subsidiaries as of July 26, 2014 and July 27, 2013, and the results of their operations and their cash flows for each of the three years in the period ended July 26, 2014, in conformity with accounting principles generally accepted in the United States of America.
We have also audited, in accordance with the standards of the Public Company Accounting Oversight Board (United States), the Company's internal control over financial reporting as of July 26, 2014, based on the criteria established in
Internal Control - Integrated Framework (1992)
issued by the Committee of Sponsoring Organizations of the Treadway Commission and our report dated
September 8, 2014
expressed an unqualified opinion on the Company's internal control over financial reporting.
Deloitte & Touche LLP
Certified Public Accountants
Miami, Florida
September 8, 2014
76
Item 9.
Changes in and Disagreements with Accountants on Accounting and Financial Disclosure.
There have been no changes in or disagreements with accountants on accounting and financial disclosures within the meaning of Item 304 or Regulation S-K.
Item 9A.
Controls and Procedures.
Disclosure Controls and Procedures
The Company carried out an evaluation, under the supervision and with the participation of the Company's management, including the Company's Chief Executive Officer and its Chief Financial Officer, of the effectiveness of the design and operation of the Company's disclosure controls and procedures (as defined in Rule 13a-15(e) under the Securities Exchange Act of 1934 (the "Exchange Act")) as of
July 26, 2014
, the end of the period covered by this Annual Report on Form 10-K. Based on this evaluation, the Chief Executive Officer and Chief Financial Officer concluded that, as of
July 26, 2014
, the Company's disclosure controls and procedures are effective to provide reasonable assurance that information required to be disclosed by the Company in the reports that it files or submits under the Exchange Act is (1) recorded, processed, summarized and reported within the time periods specified by the SEC's rules and forms, and (2) accumulated and communicated to the Company's management, including the Company's Chief Executive Officer and Chief Financial Officer, in a manner that allows timely decisions regarding required disclosure.
Changes in Internal Control Over Financial Reporting
There were no changes in the Company's internal control over financial reporting (as defined in Rule 13a-15(f) under the Exchange Act) that occurred during the Company's most recent fiscal quarter that have materially affected, or are reasonably likely to materially affect, the Company's internal control over financial reporting.
Management’s Report on Internal Control over Financial Reporting
Management of Dycom Industries, Inc. and subsidiaries is responsible for establishing and maintaining a system of internal control over financial reporting as defined in Rule 13a-15(f) and 15(d)-15(f) under the Securities Exchange Act of 1934. The Company’s internal control system is designed to provide reasonable assurance that the reported financial information is presented fairly, that disclosures are adequate and that the judgments inherent in the preparation of financial statements are reasonable. There are inherent limitations in the effectiveness of any system of internal control, including the possibility of human error and overriding of controls. Consequently, an effective internal control system can only provide reasonable, not absolute assurance, with respect to reporting financial information. Further, because of changes in conditions, effectiveness of internal control over financial reporting may vary over time.
Management conducted an evaluation of the effectiveness of our internal control over financial reporting based on the 1992 framework in
Internal Control-Integrated Framework
issued by the Committee of Sponsoring Organizations of the Treadway Commission. Based on this evaluation, management concluded that the Company’s internal control over financial reporting was effective as of
July 26, 2014
.
The effectiveness of the Company’s internal control over financial reporting as of
July 26, 2014
has been audited by Deloitte & Touche LLP, the Company’s independent registered public accounting firm. Their report, which is set forth in Part II, Item 9A,
Controls and Procedures
,
of this Annual Report on Form 10-K, expresses an unqualified opinion on the effectiveness of the Company’s internal control over financial reporting as of
July 26, 2014
.
77
REPORT OF INDEPENDENT REGISTERED PUBLIC ACCOUNTING FIRM
To the Board of Directors and Stockholders of
Dycom Industries, Inc.
Palm Beach Gardens, Florida
We have audited the internal control over financial reporting of Dycom Industries, Inc. and subsidiaries (the "Company") as of July 26, 2014, based on criteria established in
Internal Control - Integrated Framework (1992)
issued by the Committee of Sponsoring Organizations of the Treadway Commission. The Company's management is responsible for maintaining effective internal control over financial reporting and for its assessment of the effectiveness of internal control over financial reporting, included in the accompanying
Management’s Report on Internal Control Over Financial Reporting
. Our responsibility is to express an opinion on the Company's internal control over financial reporting based on our audit.
We conducted our audit in accordance with the standards of the Public Company Accounting Oversight Board (United States). Those standards require that we plan and perform the audit to obtain reasonable assurance about whether effective internal control over financial reporting was maintained in all material respects. Our audit included obtaining an understanding of internal control over financial reporting, assessing the risk that a material weakness exists, testing and evaluating the design and operating effectiveness of internal control based on the assessed risk, and performing such other procedures as we considered necessary in the circumstances. We believe that our audit provides a reasonable basis for our opinion.
A company's internal control over financial reporting is a process designed by, or under the supervision of, the company's principal executive and principal financial officers, or persons performing similar functions, and effected by the company's board of directors, management, and other personnel to provide reasonable assurance regarding the reliability of financial reporting and the preparation of financial statements for external purposes in accordance with generally accepted accounting principles. A company's internal control over financial reporting includes those policies and procedures that (1) pertain to the maintenance of records that, in reasonable detail, accurately and fairly reflect the transactions and dispositions of the assets of the company; (2) provide reasonable assurance that transactions are recorded as necessary to permit preparation of financial statements in accordance with generally accepted accounting principles, and that receipts and expenditures of the company are being made only in accordance with authorizations of management and directors of the company; and (3) provide reasonable assurance regarding prevention or timely detection of unauthorized acquisition, use, or disposition of the company's assets that could have a material effect on the financial statements.
Because of the inherent limitations of internal control over financial reporting, including the possibility of collusion or improper management override of controls, material misstatements due to error or fraud may not be prevented or detected on a timely basis. Also, projections of any evaluation of the effectiveness of the internal control over financial reporting to future periods are subject to the risk that the controls may become inadequate because of changes in conditions, or that the degree of compliance with the policies or procedures may deteriorate.
In our opinion, the Company maintained, in all material respects, effective internal control over financial reporting as of July 26, 2014, based on the criteria established in
Internal Control - Integrated Framework (1992)
issued by the Committee of Sponsoring Organizations of the Treadway Commission.
We have also audited, in accordance with the standards of the Public Company Accounting Oversight Board (United States), the consolidated financial statements as of and for the year ended July 26, 2014 of the Company and our report dated
September 8, 2014
expressed an unqualified opinion on those financial statements.
Deloitte & Touche LLP
Certified Public Accountants
Miami, Florida
September 8, 2014
78
Item 9B.
Other Information.
None.
Item 10
. Directors, Executive Officers and Corporate Governance.
Information concerning directors and nominees of the Registrant and other information as required by this item are hereby incorporated by reference from the Company's definitive proxy statement to be filed with the Commission pursuant to Regulation 14A. The information set forth under the caption "Executive Officers of the Registrant" in Part I, Item 1 of this Annual Report on Form 10-K is incorporated herein by reference.
Code of Ethics
The Company has adopted a Code of Ethics for Senior Financial Officers, which is a code of ethics as that term is defined in Item 406(b) of Regulation S-K and which applies to its Chief Executive Officer, Chief Financial Officer, Controller and other persons performing similar functions. The Code of Ethics for Senior Financial Officers is available on the Company's website at
www.dycomind.com
. If the Company makes any substantive amendments to, or a waiver from, provisions of the Code of Ethics for Senior Financial Officers, it will disclose the nature of such amendment, or waiver, on its website or in a report on Form 8-K. Information on the Company's website is not deemed to be incorporated by reference into this Annual Report on Form 10-K.
Item 11.
Executive Compensation.
The information required by Item 11 regarding executive compensation is included under the headings "Compensation Discussion and Analysis," "Compensation Committee Report," and "Compensation Committee Interlocks and Insider Participation" in the Company's definitive proxy statement to be filed with the Commission pursuant to Regulation 14A, and is incorporated herein by reference.
Item 12.
Security Ownership of Certain Beneficial Owners and Management and Related Stockholder Matters.
Information concerning the ownership of certain of the Registrant's beneficial owners and management and related stockholder matters is hereby incorporated by reference from the Company's definitive proxy statement to be filed with the Commission pursuant to Regulation 14A.
Item 13.
Certain Relationships, Related Transactions and Director Independence.
Information concerning relationships and related transactions is hereby incorporated by reference from the Company's definitive proxy statement to be filed with the Commission pursuant to Regulation 14A.
Item 14.
Principal Accounting Fees and Services.
Information concerning principal accounting fees and services is hereby incorporated by reference from the Company's definitive proxy statement to be filed with the Commission pursuant to Regulation 14A.
Item 15.
Exhibits and Financial Statement Schedules.
(a) The following documents are filed as a part of this report:
1.
Consolidated financial statements
:
the consolidated financial statements and the Report of the Independent Registered Public Accounting Firm are listed on pages 39 through 44.
2.
Financial statement schedules
:
All schedules have been omitted because they are inapplicable, not required, or the information is included in the above referenced consolidated financial statements or the notes thereto.
79
3.
Exhibits furnished pursuant to the requirements of Form 10-K
:
|
Exhibit Number
|
|
|
2.1
|
Stock Purchase Agreement, dated as of November 19, 2012, among Dycom Industries, Inc., PBG Acquisition III, LLC, Quanta Services, Inc. and Infrasource FI LLC (incorporated by reference to Exhibit 2.1 to Dycom Industries, Inc.'s Current Report on Form 8-K filed with the SEC on November 20, 2012).
|
|
3(i)
|
Restated Articles of Incorporation of Dycom Industries, Inc. (incorporated by reference to Dycom Industries, Inc.’s Form 10-Q filed with the SEC on June 11, 2002).
|
|
3(ii)
|
Amended and Restated By-laws of Dycom Industries, Inc., as amended on February 24, 2009 (incorporated by reference to Dycom Industries, Inc.’s Form 8-K, filed with the SEC on March 2, 2009).
|
|
4.1
|
Indenture, dated as of January 21, 2011, among Dycom Investments, Inc., Dycom Industries, Inc. and certain subsidiaries of Dycom Industries, Inc., as guarantors, and U.S. Bank National Association, as trustee (incorporated by reference to Dycom Industries, Inc.’s Form 8-K filed with the SEC on January 24, 2011).
|
|
4.2
|
First Supplemental Indenture, dated as of January 28, 2011, among Dycom Investments, Inc., Dycom Industries, Inc. and certain subsidiaries of Dycom Industries, Inc., as guarantors, and U.S. Bank National Association, as trustee (incorporated by reference to Exhibit 4.1 to Dycom Industries, Inc.'s Current Report on Form 8-K filed with the SEC on December 12, 2012).
|
|
4.3
|
Second Supplemental Indenture, dated as of December 12, 2012, among Dycom Investments, Inc., Dycom Industries, Inc. and certain subsidiaries of Dycom Industries, Inc., as guarantors, and U.S. Bank National Association, as trustee (incorporated by reference to Exhibit 4.1 to Dycom Industries, Inc.'s Current Report on Form 8-K filed with the SEC on December 12, 2012).
|
|
4.4
|
Third Supplemental Indenture, dated as of February 26, 2013, among Dycom Investments, Inc., Dycom Industries, Inc. and certain subsidiaries of Dycom Industries, Inc., as guarantors, and U.S. Bank National Association, as trustee (incorporated by reference to Exhibit 4.5 to the First Amendment to Dycom Investments, Inc.'s Registration Statement on Form S-4 filed with the SEC on February 26, 2013).
|
|
4.5
|
Fourth Supplemental Indenture, dated as of July 26, 2013, among Dycom Investments, Inc., Dycom Industries, Inc. and certain subsidiaries of Dycom Industries, Inc., as guarantors, and U.S. Bank National Association, as trustee (incorporated by reference to Exhibit 4.5 to Dycom Industries, Inc.'s Form 10-K filed with the SEC on September 13, 2013).
|
|
4.6+
|
Fifth Supplemental Indenture, dated as of July 25, 2014, among Dycom Investments, Inc., Dycom Industries, Inc. and certain subsidiaries of Dycom Industries, Inc., as guarantors, and U.S. Bank National Association, as trustee.
|
|
10.1*
|
2003 Long-Term Incentive Plan, amended and restated effective as of September 19, 2011 (incorporated by reference to Dycom Industries, Inc.’s Form 8-K, filed with the SEC on September 23, 2011).
|
|
10.2*
|
Form of Non-Qualified Stock Option Agreement under the 2003 Long-Term Incentive Plan, as amended and restated (incorporated by reference to Dycom Industries, Inc.'s Form 10-K, filed with the SEC on September 4, 2012).
|
|
10.3*
|
Form of Incentive Stock Option Agreement under the 2003 Long-Term Incentive Plan, as amended and restated (incorporated by reference to Dycom Industries, Inc.'s Form 10-K, filed with the SEC on September 4, 2012).
|
|
10.4*
|
Form of Restricted Stock Unit Agreement under the 2003 Long-Term Incentive Plan, as amended and restated (incorporated by reference to Dycom Industries, Inc.'s Form 10-K, filed with the SEC on September 4, 2012).
|
|
10.5*
|
Form of Performance Unit Agreement under the 2003 Long-Term Incentive Plan, as amended and restated (incorporated by reference to Dycom Industries, Inc.'s Form 10-K, filed with the SEC on September 4, 2012).
|
|
10.6*
|
2012 Long-Term Incentive Plan (incorporated by reference to Dycom Industries, Inc.'s Definitive Proxy Statement filed with the SEC on October 11, 2012).
|
|
10.7*
|
Form of Non-Qualified Stock Option Agreement under the 2012 Long-Term Incentive Plan (incorporated by reference to Dycom Industries, Inc.'s Form 8-K filed with the SEC on December 20, 2012).
|
|
10.8*
|
Form of Incentive Stock Option Agreement under the 2012 Long-Term Incentive Plan (incorporated by reference to Dycom Industries, Inc.'s Form 8-K filed with the SEC on December 20, 2012).
|
80
|
10.9*
|
Form of Restricted Stock Unit Agreement under the 2012 Long-Term Incentive Plan (incorporated by reference to Dycom Industries, Inc.'s Form 8-K filed with the SEC on December 20, 2012).
|
|
10.10*
|
Form of Performance Unit Agreement under the 2012 Long-Term Incentive Plan (incorporated by reference to Dycom Industries, Inc.'s Form 8-K filed with the SEC on December 20, 2012).
|
|
10.11*
|
2007 Non-Employee Directors Equity Plan, amended and restated effective as of September 19, 2011 (incorporated by reference to Dycom Industries, Inc.’s Form 8-K filed with the SEC on September 23, 2011).
|
|
10.12*
|
Form of Non-Employee Director Non-Qualified Stock Option Agreement, under the 2007 Non-Employee Directors Equity Plan, as amended and restated (incorporated by reference to Dycom Industries, Inc.'s Form 10-K, filed with the SEC on September 4, 2012).
|
|
10.13*
|
Form of Non-Employee Director Restricted Stock Unit Agreement, under the 2007 Non-Employee Directors Equity Plan, as amended and restated (incorporated by reference to Dycom Industries, Inc.'s Form 10-K, filed with the SEC on September 4, 2012).
|
|
10.14*
|
Employment Agreement for Richard B. Vilsoet dated as of May 5, 2005 (incorporated by reference to Dycom Industries, Inc.’s Form 10-K filed with the SEC on September 9, 2005).
|
|
10.15*
|
Employment Agreement for H. Andrew DeFerrari dated as of July 14, 2004 (incorporated by reference to Dycom Industries, Inc.’s Form 8-K filed with the SEC on January 23, 2006).
|
|
10.16*
|
Amendment to the Employment Agreement of H. Andrew DeFerrari dated as of August 25, 2006 (incorporated by reference to Dycom Industries, Inc.’s Form 8-K filed with the SEC on August 31, 2006).
|
|
10.17*
|
Amendment to the Employment Agreements of H. Andrew DeFerrari and Richard B. Vilsoet dated as of May 28, 2010 (incorporated by reference to Dycom Industries, Inc.’s Form 8-K filed with the SEC on May 28, 2010).
|
|
10.18*
|
Employment Agreement for Steven E. Nielsen dated as of May 1, 2012 (incorporated by reference to Dycom Industries, Inc.’s Form 8-K filed with the SEC on May 2, 2012).
|
|
10.19*
|
Employment Agreement for Timothy R. Estes dated as of October 4, 2012 (incorporated by reference to Dycom Industries, Inc.'s Form 8-K filed with the SEC on October 4, 2012).
|
|
10.20*
|
2009 Annual Incentive Plan (incorporated by reference to Dycom Industries, Inc.’s Definitive Proxy Statement filed with the SEC on October 17, 2013).
|
|
10.21*
|
Form of Indemnification Agreement for directors and executive officers of Dycom Industries, Inc. (incorporated by reference to Dycom Industries, Inc.’s Form 10-K filed with the SEC on September 3, 2009).
|
|
10.22
|
Credit Agreement, dated as of December 3, 2012, among Dycom Industries, Inc., as the Borrower, the subsidiaries of Dycom Industries, Inc. identified therein, certain lenders named therein, Bank of America, N.A., as Administrative Agent, Swingline Lender and L/C Issuer, Merrill Lynch, Pierce, Fenner & Smith Incorporated and Wells Fargo Securities, LLC, as Joint Lead Arrangers and Joint Book Managers, Wells Fargo Bank, National Association, as Syndication Agent, and Suntrust Bank, PNC Bank, National Association and Branch Banking and Trust Company, as Co-Documentation Agents (incorporated by reference to Exhibit 10.1 to Dycom Industries, Inc.'s Current Report on Form 8-K filed with the SEC on December 5, 2012).
|
|
12.1+
|
Computation of Ratio of Earnings to Fixed Charges.
|
|
21.1+
|
Principal subsidiaries of Dycom Industries, Inc.
|
|
23.1+
|
Consent of Independent Registered Public Accounting Firm.
|
|
31.1+
|
Certification of Chief Executive Officer Pursuant to Rule 13a-14(a)/15d-14(a) as Adopted Pursuant to Section 302 of the Sarbanes-Oxley Act of 2002.
|
|
|
|
|
31.2+
|
Certification of Chief Financial Officer Pursuant to Rule 13a-14(a)/15d-14(a) as Adopted Pursuant to Section 302 of the Sarbanes-Oxley Act of 2002.
|
|
|
|
|
32.1+
|
Certification of Chief Executive Officer Pursuant to 18 U.S.C. Section 1350 as Adopted Pursuant to Section 906 of the Sarbanes-Oxley Act of 2002.
|
|
|
|
81
|
32.2+
|
Certification of Chief Financial Officer Pursuant to 18 U.S.C. Section 1350 as Adopted Pursuant to Section 906 of the Sarbanes-Oxley Act of 2002.
|
|
|
|
|
101++**
|
The following materials from the Registrant's Annual Report on Form 10-K for the fiscal year ended July 26, 2014 formatted in eXtensible Business Reporting Language: (i) the Consolidated Balance Sheets; (ii) the Consolidated Statements of Operations; (iii) the Consolidated Statements of Comprehensive Income; (iv) the Consolidated Statements of Stockholders’ Equity; (v) the Consolidated Statements of Cash Flows; and (vi) the Notes to Consolidated Financial Statements.
|
|
+
|
Filed herewith
|
|
++
|
Furnished herewith
|
|
*
|
Indicates a management contract or compensatory plan or arrangement.
|
|
**
|
Users of this data are advised pursuant to Rule 406T of Regulation S-T that this interactive data file is deemed not filed or part of a registration statement or prospectus for the purposes of section 11 or 12 of the Securities Act of 1933, as amended, is deemed not filed for purposes of section 18 of the Securities and Exchanges Act of 1934, as amended, and otherwise is not subject to liability under these sections.
|
82
SIGNATURES
Pursuant to the requirements of the Securities Exchange Act of 1934, the Registrant has duly caused this report to be signed on its behalf by the undersigned, thereunto duly authorized.
|
|
|
|
DYCOM INDUSTRIES, INC.
|
|
|
|
|
Registrant
|
|
|
|
|
|
|
Date:
|
September 8, 2014
|
|
/s/ Steven E. Nielsen
|
|
|
|
|
Name: Steven E. Nielsen
Title: President and Chief Executive Officer |
Pursuant to the requirements of the Securities Exchange Act of 1934, this report has been signed below by the following persons on behalf of the Registrant and in the capacities and on the dates indicated.
|
Name
|
Position
|
Date
|
|
|
|
|
|
/s/ Steven E. Nielsen
|
President and Chief Executive Officer
|
September 8, 2014
|
|
Steven E. Nielsen
|
|
|
|
|
|
|
|
/s/ H. Andrew DeFerrari
|
Senior Vice President and Chief Financial Officer
|
September 8, 2014
|
|
H. Andrew DeFerrari
|
(Principal Financial and Accounting Officer)
|
|
|
|
|
|
|
/s/ Thomas G. Baxter
|
Director
|
September 8, 2014
|
|
Thomas G. Baxter
|
|
|
|
|
|
|
|
/s/ Charles B. Coe
|
Director
|
September 8, 2014
|
|
Charles B. Coe
|
|
|
|
|
|
|
|
/s/ Stephen C. Coley
|
Director
|
September 8, 2014
|
|
Stephen C. Coley
|
|
|
|
|
|
|
|
/s/ Dwight B. Duke
|
Director
|
September 8, 2014
|
|
Dwight B. Duke
|
|
|
|
|
|
|
|
/s/ Anders Gustafsson
|
Director
|
September 8, 2014
|
|
Anders Gustafsson
|
|
|
|
|
|
|
|
/s/ Patricia L. Higgins
|
Director
|
September 8, 2014
|
|
Patricia L. Higgins
|
|
|
83
TABLE OF CONTENTS
Part IItem 1. BusinessItem 1A . Risk FactorsItem 1B. Unresolved Staff CommentsItem 2. PropertiesItem 3. Legal ProceedingsItem 4. Mine Safety DisclosuresPart IIItem 5. Market For Registrant's Common Equity, Related Stockholder Matters and Issuer Purchases Of Equity SecuritiesItem 6. Selected Financial DataItem 7. Management S Discussion and Analysis Of Financial Condition and Results Of OperationsItem 7A . Quantitative and Qualitative Disclosures About Market RiskItem 8 . Financial Statements and Supplementary DataItem 9. Changes in and Disagreements with Accountants on Accounting and Financial DisclosureItem 9A. Controls and ProceduresItem 9B. Other InformationPart IIIItem 10 . Directors, Executive Officers and Corporate GovernanceItem 11. Executive CompensationItem 12. Security Ownership Of Certain Beneficial Owners and Management and Related Stockholder MattersItem 13. Certain Relationships, Related Transactions and Director IndependenceItem 14. Principal Accounting Fees and ServicesPart IVItem 15. Exhibits and Financial Statement Schedules