UNITED STATES
SECURITIES AND EXCHANGE COMMISSION
Washington, D.C. 20549
FORM 10-K
|
x
|
ANNUAL REPORT PURSUANT TO SECTION 13 OR 15(d) OF THE SECURITIES EXCHANGE ACT OF 1934
|
For the fiscal year ended December 31, 2010
|
o
|
TRANSITION REPORT PURSUANT TO SECTION 13 OR 15(d) OF THE SECURITIES EXCHANGE ACT OF 1934
|
For the transition period from ________ to ________
DYNEGY INC.
DYNEGY HOLDINGS INC.
(Exact name of registrant as specified in its charter)
|
Entity
|
Commission
File Number
|
State of
Incorporation
|
I.R.S. Employer
Identification No.
|
|||
|
Dynegy Inc.
Dynegy Holdings Inc.
|
001-33443
000-29311
|
Delaware
Delaware
|
20-5653152
94-3248415
|
|||
|
|
|
|
|
|||
|
1000 Louisiana, Suite 5800
Houston, Texas
(Address of principal
executive offices)
|
77002
(Zip Code)
|
(713) 507-6400
(Registrant’s telephone number, including area code)
Securities registered pursuant to Section12(b) of the Act:
|
Title of each class
|
Name of each exchange on which registered
|
|
|
Dynegy’s common stock, $0.01 par value
|
New York Stock Exchange
|
Securities registered pursuant to Section12(g) of the Act:
|
None
|
|
(Title of Class)
|
Indicate by check mark if the registrant is a well-known seasoned issuer, as defined in Rule 405 of the Securities Act.
|
Dynegy Inc.
|
Yes
x
No
o
|
||
|
Dynegy Holdings Inc.
|
Yes
o
No
x
|
Indicate by check mark if the registrant is not required to file reports pursuant to Section 13 or Section 15(d) of the Exchange Act.
|
Dynegy Inc.
|
Yes
o
No
x
|
||
|
Dynegy Holdings Inc.
|
Yes
o
No
x
|
Indicate by check mark whether the registrant (1) has filed all reports required to be filed by Section 13 or 15(d) of the Securities Exchange Act of 1934 during the preceding 12 months (or for such shorter period that the registrant was required to file such reports), and (2) has been subject to such filing requirements for the past 90 days.
|
Dynegy Inc.
|
Yes
x
No
o
|
||
|
Dynegy Holdings Inc.
|
Yes
x
No
o
|
Indicate by check mark whether the registrant has submitted electronically and posted on its corporate web site, if any, every Interactive Data File required to be submitted and posted pursuant to Rule 405 of Regulation S-T (§232.405 of this chapter) during the preceding 12 months (or for such shorter period that the registrant was required to submit and post such files).
|
Dynegy Inc.
|
Yes
o
No
o
|
||
|
Dynegy Holdings Inc.
|
Yes
o
No
o
|
Indicate by check mark if disclosure of delinquent filers pursuant to Item 405 of Regulation S-K is not contained herein, and will not be contained, to the best of registrant’s knowledge, in definitive proxy or information statements incorporated by reference in Part III of this Form 10-K or any amendment to this Form 10-K.
|
Dynegy Inc.
|
x
|
|
|
Dynegy Holdings Inc.
|
x
|
Indicate by check mark whether the registrant is a large accelerated filer, an accelerated filer, a non-accelerated filer, or a smaller reporting company. See the definitions of “large accelerated filer,” “accelerated filer” and “smaller reporting company” in Rule 12b-2 of the Exchange Act.
|
Large accelerated
filer
|
Accelerated filer
|
Non-accelerated filer
(Do not check if a
smaller reporting
company)
|
Smaller reporting
company
|
||
|
Dynegy Inc.
|
o
|
x
|
o
|
o
|
|
|
Dynegy Holdings Inc.
|
o
|
o
|
x
|
o
|
Indicate by check mark whether the registrant is a shell company (as defined in Rule 12b-2 of the Exchange Act).
|
Dynegy Inc.
|
Yes
o
No
x
|
||
|
Dynegy Holdings Inc.
|
Yes
o
No
x
|
As of June 30, 2010, the aggregate market value of the Dynegy Inc. common stock held by non-affiliates of the registrant was $463,782,138 based on the closing sale price as reported on the New York Stock Exchange.
Number of shares outstanding of Dynegy Inc
’
s class of common stock, as of the latest practicable date: Common stock, $0.01 par value per share,
121,209,325
shares outstanding as of
March 3, 2011
.
All of Dynegy Holdings Inc.’s outstanding common stock is owned indirectly by Dynegy Inc.
This combined Form 10-K is separately filed by Dynegy Inc. and Dynegy Holdings Inc. Information contained herein relating to any individual registrant is filed by such registrant on its own behalf. Each registrant makes no representation as to information relating to a registrant other than itself.
DOCUMENTS INCORPORATED BY REFERENCE-Dynegy Inc.
Part III (Items 10, 11, 12, 13 and 14) incorporates by reference portions of the Notice and Proxy Statement for the registrant’s 2011 Annual Meeting of Stockholders, which the registrant intends to file no later than 120 days after December 31, 2010. However, if such proxy statement is not filed within such 120-day period, Items 10,11,12,13 and 14 will be filed as part of an amendment to this Form 10-K no later than the end of the 120-day period.
REDUCED DISCLOSURE FORMAT-Dynegy Holdings Inc.
Dynegy Holdings Inc. meets the conditions set forth in General Instruction (I)(1)(a) and (b) of Form 10-K and therefore is filing this Form 10-K with the reduced disclosure format.
DYNEGY INC. and DYNEGY HOLDINGS INC.
FORM 10-K
|
Page
|
||
|
PART I
|
||
|
2
|
||
|
4
|
||
|
25
|
||
|
36
|
||
|
36
|
||
|
36
|
||
|
PART II
|
||
|
37
|
||
|
41
|
||
|
44
|
||
|
95
|
||
|
98
|
||
|
98
|
||
|
98
|
||
|
100
|
||
|
101
|
||
|
PART III
|
||
|
102
|
||
|
102
|
||
|
102
|
||
|
103
|
||
|
103
|
||
|
PART IV
|
||
|
104
|
||
|
112
|
||
EXPLANATORY NOTE
This report includes the combined filing of Dynegy Inc. (“Dynegy”) and Dynegy Holdings Inc. (“DHI”). DHI is the principal subsidiary of Dynegy, providing approximately 100 percent of Dynegy’s total consolidated revenue for the year ended December 31, 2010 and constituting approximately 100 percent of Dynegy’s total consolidated asset base as of December 31, 2010.
Unless the context indicates otherwise, throughout this report, the terms “the Company”, “we”, “us”, “our” and “ours” are used to refer to both Dynegy and DHI and their direct and indirect subsidiaries. Discussions or areas of this report that apply only to Dynegy or DHI are clearly noted in such discussions or areas.
As used in this Form 10-K, the abbreviations listed below have the following meanings:
| AMT | Alternative Minimum Tax |
|
APIC
|
Additional Paid-in-Capital
|
|
ARO
|
Asset retirement obligation
|
|
ASU
|
Accounting Standards Update
|
|
BACT
|
Best Available Control Technology (air)
|
|
BART
|
Best Available Retrofit Technology
|
|
BTA
|
Best technology available (water intake)
|
|
CAA
|
Clean Air Act
|
|
CAIR
|
Clean Air Interstate Rule
|
|
CAISO
|
The California Independent System Operator
|
|
CAMR
|
Clean Air Mercury Rule
|
|
CARB
|
California Air Resources Board
|
|
CAVR
|
The Clean Air Visibility Rule
|
|
CERCLA
|
The Comprehensive Environmental Response, Compensation and Liability Act of 1980, as amended
|
|
CO
2
|
Carbon dioxide
|
|
CO
2
e
|
The climate change potential of other GHGs relative to the global warming potential of CO
2
|
|
COSO
|
Committee of Sponsoring Organizations of the Treadway Commission
|
|
CRM
|
Our former customer risk management business segment
|
|
CWA
|
Clean Water Act
|
|
CUSA
|
Chevron U.S.A. Inc.
|
|
DHI
|
Dynegy Holdings Inc., Dynegy’s primary financing subsidiary
|
|
DMSLP
|
Dynegy Midstream Services L.P.
|
|
DMT
|
Dynegy Marketing and Trade LLC
|
|
DNE
|
Dynegy Northeast Generation
|
|
DPM
|
Dynegy Power Marketing Inc.
|
|
EBITDA
|
Earnings before interest, taxes, depreciation and amortization
|
|
EPA
|
United States Environmental Protection Agency
|
|
ERISA
|
The Employee Retirement Income Security Act of 1974, as amended
|
|
EWG
|
Exempt Wholesale Generator
|
|
FASB
|
Financial Accounting Standards Board
|
|
FCM
|
Forward Capacity Market
|
|
FERC
|
Federal Energy Regulatory Commission
|
|
FTR
|
Financial Transmission Rights
|
|
GAAP
|
Generally Accepted Accounting Principles of the United States of America
|
|
GEN
|
Our power generation business
|
|
GEN-MW
|
Our power generation business—Midwest segment
|
|
GEN-NE
|
Our power generation business—Northeast segment
|
|
GEN-WE
|
Our power generation business—West segment
|
|
GHG
|
Greenhouse gas
|
|
HAPs
|
Hazardous air pollutants, as defined by the Clean Air Act
|
|
ICAP
|
Installed capacity
|
|
ICC
|
Illinois Commerce Commission
|
|
IMA
|
In-Market Availability
|
|
IRS
|
Internal Revenue Service
|
|
ISO
|
Independent System Operator
|
|
ISO-NE
|
Independent System Operator—New England
|
|
LMP
|
Locational Marginal Pricing
|
|
LPG
|
Liquefied petroleum gas
|
|
LTIP
|
Long-Term Incentive Plan
|
|
MISO
|
Midwest Independent Transmission System Operator
|
|
MGGA
|
Midwest Greenhouse Gas Accord
|
|
MGGRP
|
Midwestern Greenhouse Reduction Program
|
|
MMBtu
|
Millions of British thermal units
|
|
MW
|
Megawatts
|
|
MWh
|
Megawatt hour
|
|
NERC
|
North American Electric Reliability Corporation
|
|
NGL
|
Our natural gas liquids business segment
|
|
NOL
|
Net operating loss
|
|
NO
x
|
Nitrogen oxide
|
|
NPDES
|
National Pollutant Discharge Elimination System
|
|
NSPS
|
New Source Performance Standard
|
|
NYISO
|
New York Independent System Operator
|
|
NYSDEC
|
New York State Department of Environmental Conservation
|
|
OCI
|
Other Comprehensive Income
|
|
OTC
|
Over-the-counter
|
|
PJM
|
PJM Interconnection, LLC
|
|
PPEA
|
Plum Point Energy Associates
|
|
PPEA Holding
|
Plum Point Energy Associates Holding Company, LLC
|
|
PRB
|
Powder River Basin coal
|
|
PSD
|
Prevention of Significant Deterioration
|
|
PURPA
|
The Public Utility Regulatory Policies Act of 1978
|
|
QF
|
Qualifying Facility
|
|
RACT
|
Reasonably Available Control Technology
|
|
RCRA
|
The Resource Conservation and Recovery Act of 1976, as amended
|
|
RGGI
|
Regional Greenhouse Gas Initiative
|
|
RMR
|
Reliability Must Run
|
|
RPM
|
Reliability Pricing Model
|
|
RTO
|
Regional Transmission Organization
|
|
SCEA
|
Sandy Creek Energy Associates, LP
|
|
SCH
|
Sandy Creek Holdings, LLC
|
|
SEC
|
U.S. Securities and Exchange Commission
|
|
SFAS
|
Statement of Financial Accounting Standards
|
|
SIP
|
State Implementation Plan
|
|
SO
2
|
Sulfur dioxide
|
|
SPDES
|
State Pollutant Discharge Elimination System
|
|
VaR
|
Value at Risk
|
|
VIE
|
Variable Interest Entity
|
|
VLGC
|
Very large gas carrier
|
|
WCI
|
Western Climate Initiative
|
|
WECC
|
Western Electricity Coordinating Council
|
THE COMPANY
We are holding companies and conduct substantially all of our business operations through our subsidiaries. Our primary business is the production and sale of electric energy, capacity and ancillary services from our fleet of seventeen operating power plants in six states totaling approximately 11,800 MW of generating capacity.
Dynegy began operations in 1985. DHI is a wholly owned subsidiary of Dynegy. Dynegy became incorporated in the State of Delaware in 2007. Our principal executive office is located at 1000 Louisiana Street, Suite 5800, Houston, Texas 77002, and our telephone number at that office is (713) 507-6400.
We file annual, quarterly and current reports, proxy statements (for Dynegy) and other information with the SEC. You may read and copy any document we file at the SEC’s Public Reference Room at 100 F Street N.E., Room 1580, Washington, D.C. 20549. Please call the SEC at 1-800-SEC-0330 for further information on the SEC’s Public Reference Room. Our SEC filings are also available to the public at the SEC’s web site at
www.sec.gov
. No information from such web site is incorporated by reference herein. Our SEC filings are also available free of charge on our web site at
www.dynegy.com
, as soon as reasonably practicable after those reports are filed with or furnished to the SEC. The contents of our website are not intended to be, and should not be considered to be, incorporated by reference into this Form 10-K.
We sell electric energy, capacity and ancillary services on a wholesale basis from our power generation facilities. Energy is the actual output of electricity and is measured in MWh. The capacity of a power generation facility is its electricity production capability, measured in MW. Wholesale electricity customers will, for reliability reasons and to meet regulatory requirements, contract for rights to capacity from generating units. Ancillary services are the products of a power generation facility that support the transmission grid operation, follow real-time changes in load and provide emergency reserves for major changes to the balance of generation and load. We sell these products individually or in combination to our customers under short-, medium- and long-term contractual agreements or tariffs.
Our customers include RTOs and ISOs, integrated utilities, municipalities, electric cooperatives, transmission and distribution utilities, industrial customers, power marketers, financial participants such as banks and hedge funds, and other power generators. All of our products are sold on a wholesale basis for various lengths of time from hourly to multi-year transactions. Some of our customers, such as municipalities or integrated utilities, purchase our products for resale in order to serve their retail, commercial and industrial customers. Other customers, such as some power marketers, may buy from us to serve their own wholesale or retail customers or as a hedge against power sales they have made.
Going Concern.
Our accompanying consolidated financial statements have been prepared assuming that we will continue as a going concern, which contemplates realization of assets and the satisfaction of liabilities in the normal course of business for the twelve month period following the date of these consolidated financial statements. However, continued low power prices over the past two years have had a significant adverse impact on our business. Further, as our credit rating has declined, counterparty requirements for posting collateral in support of our risk management positions have become more stringent. Over the next twelve months, we expect that we will continue to need to utilize our Fifth Amended and Restated Credit Agreement, as amended (the “Credit Facility”), through the issuance of letters of credit and/or through the drawing of cash, or secure additional sources of capital to continue to meet our operating needs. The agreements governing our existing Credit Facility require us to meet specific financial covenants both as a matter of course and as a precondition to the incurrence of additional debt and to the making of restricted payments or asset sales, among other things. These specific financial covenants are required to be calculated on a quarterly basis and become more restrictive over the course of 2011. Using the latest available forward commodity price curves and considering our current derivative contracts, we project that it is likely that we will not be able to comply with our EBITDA to Consolidated Interest Expense covenant, as currently set forth in our Credit Facility, particularly in the third and fourth quarters of 2011. Furthermore, we expect that our available liquidity will continue to be reduced as a result of borrowing limitations under the covenant regarding the ratio of Secured Debt to EBITDA, as defined in our Credit Facility. To continue as a going concern over the next twelve months, we must either (i) meet the financial covenants so that we can access our Credit Facility, or (ii) amend or replace our Credit Facility or otherwise secure additional capital.
At December 31, 2010, we have the following obligations outstanding under the Credit Facility:
|
|
●
|
$68 million due April 2013 under the Term Loan B (as defined in Note 18—Debt—Credit Facility);
|
|
|
●
|
$850 million due April 2013 under the Term Facility (as defined in Note 18—Debt—Credit Facility) fully collateralized by $850 million of non-current restricted cash); and
|
|
|
●
|
$375 million in issued letters of credit.
|
A failure by us to comply with our financial covenants or to comply with the other restrictions in our financing agreements could result in reduced borrowing capacity or even a default, causing our debt obligations under such financing agreements (and any other indebtedness to the extent linked to it by reason of cross-default or cross-acceleration provisions) to potentially become immediately due and payable. If we are unable to cure any such default, or obtain a waiver or replacement financing, and those lenders accelerate the payment of such indebtedness, in the case that we are unable to repay those amounts, the holders of the indebtedness under our secured debt obligations would be entitled to foreclose on, and acquire control of substantially all of our assets, which would have a material adverse impact on our financial condition, results of operations and cash flows.
In light of our likely covenant non-compliance, we are attempting to amend or replace our existing Credit Facility. We expect the capacity of any amended or new credit facility to be less than the current capacity of $1.8 billion and to be at a higher cost. We may also seek additional sources of liquidity in an effort to secure sufficient cash to meet our operating needs. These additional sources of liquidity could include asset sales, public or private issuances of debt, equity or equity-linked securities, debt for equity swaps, or any combination of these. H
owever, we cannot provide any assurances that we will be successful in accomplishing any of these plans.
Our ability to continue as a going concern is dependent on many factors, including, among other things, our ability to achieve the operating results necessary to comply with the covenants in our existing Credit Facility, amend or replace our existing Credit Facility, or achieve the operating results necessary to comply with the covenants in any amended or new credit facility. Such compliance will be dependent on our ability to successfully execute our commercial strategies, manage our collateral requirements, and continue to execute the company-wide cost reduction initiatives that are ongoing. Please read Item 7—Management’s Discussion and Analysis of Financial Condition and Results of Operations—Liquidity and Capital Resources for further discussion. Also, for additional discussion of factors that may affect our ability to continue as a going concern and the potential consequences of our failure to do so please see Item 1A—Risk Factors.
Our Power Generation Portfolio
Our current operating generating facilities are as follows:
|
Facility
|
Total Net
Generating
Capacity
(MW)(1)
|
Primary
Fuel Type
|
Dispatch
Type
|
Location
|
Region
|
||||||||||
|
Baldwin
|
1,800 |
Coal
|
Baseload
|
Baldwin, IL
|
MISO
|
||||||||||
|
Kendall
|
1,200 |
Gas
|
Intermediate
|
Minooka, IL
|
PJM
|
||||||||||
|
Ontelaunee
|
580 |
Gas
|
Intermediate
|
Ontelaunee Township, PA
|
PJM
|
||||||||||
|
Havana (2)
|
441 |
Coal
|
Baseload
|
Havana, IL
|
MISO
|
||||||||||
|
Hennepin
|
293 |
Coal
|
Baseload
|
Hennepin, IL
|
MISO
|
||||||||||
|
Oglesby
|
63 |
Gas
|
Peaking
|
Oglesby, IL
|
MISO
|
||||||||||
|
Stallings
|
89 |
Gas
|
Peaking
|
Stallings, IL
|
MISO
|
||||||||||
|
Vermilion Units 1-2 (3)
|
164 |
Coal/Gas
|
Baseload
|
Oakwood, IL
|
MISO
|
||||||||||
|
Unit 3 (3)
|
12 |
Oil
|
Peaking
|
Oakwood, IL
|
MISO
|
||||||||||
|
Wood River (4)
|
446 |
Coal
|
Baseload
|
Alton, IL
|
MISO
|
||||||||||
|
Total Midwest
|
5,088 | ||||||||||||||
|
Moss Landing Units 1-2
|
1,020 |
Gas
|
Intermediate
|
Monterey County, CA
|
CAISO
|
||||||||||
|
Units 6-7
|
1,509 |
Gas
|
Peaking
|
Monterey County, CA
|
CAISO
|
||||||||||
|
Morro Bay (5)
|
650 |
Gas
|
Peaking
|
Morro Bay, CA
|
CAISO
|
||||||||||
|
South Bay (6)
|
— |
Gas
|
Peaking
|
Chula Vista, CA
|
CAISO
|
||||||||||
|
Oakland
|
165 |
Oil
|
Peaking
|
Oakland, CA
|
CAISO
|
||||||||||
|
Black Mountain (7)
|
43 |
Gas
|
Baseload
|
Las Vegas, NV
|
WECC
|
||||||||||
|
Total West
|
3,387 | ||||||||||||||
|
Independence
|
1,064 |
Gas
|
Intermediate
|
Scriba, NY
|
NYISO
|
||||||||||
|
Roseton (8)
|
1,200 |
Gas/Oil
|
Peaking
|
Newburgh, NY
|
NYISO
|
||||||||||
|
Casco Bay
|
540 |
Gas
|
Intermediate
|
Veazie, ME
|
ISO-NE
|
||||||||||
|
Danskammer Units1-2
|
123 |
Gas/Oil
|
Peaking
|
Newburgh, NY
|
NYISO
|
||||||||||
|
Units 3-4 (8)
|
370 |
Coal/Gas
|
Baseload
|
Newburgh, NY
|
NYISO
|
||||||||||
|
Total Northeast
|
3,297 | ||||||||||||||
|
Total Fleet Capacity
|
11,772 | ||||||||||||||
|
(1)
|
Unit capabilities are based on winter capacity.
|
|
(2)
|
Represents Unit 6 generating capacity. Units 1-5, with a combined net generating capacity of 228 MW, are currently in mothball status and out of operation.
|
|
(3)
|
On December 28, 2010, we announced plans to mothball the Vermilion power generation facility at approximately the end of the first quarter 2011.
|
|
(4)
|
Represents Units 4 and 5 generating capacity. Units 1-3, with a combined net generating capacity of 119 MW, are currently in mothball status and out of operation.
|
|
(5)
|
Represents Units 3 and 4 generating capacity. Units 1 and 2, with a combined net generating capacity of 352 MW, are currently in mothball status and out of operation.
|
|
(6)
|
The South Bay facility was retired on December 31, 2010 and is in the process of being decommissioned.
|
|
(7)
|
We own a 50 percent interest in this facility. Total output capacity of this facility is 85 MW.
|
|
(8)
|
We lease the Roseton facility and Units 3 and 4 of the Danskammer facility pursuant to a leveraged lease arrangement that is further described in Item 7. Management’s Discussion and Analysis of Financial Condition and Results of Operations—Liquidity and Capital Resources—Disclosure of Contractual Obligations and Contingent Financial Commitments—Off-Balance Sheet Arrangements—DNE Leveraged Lease.
|
Our Business Focus
Our business focus seeks to create value through:
|
|
●
|
a diverse portfolio of power generation assets;
|
|
|
●
|
a diverse and flexible commercial strategy that includes buying and selling electric energy, capacity and ancillary services either short-, medium- or long-term; sales and purchases of emissions credits, fuel supplies and transportation services and the capture of extrinsic value inherent in our portfolio, to the extent permitted given liquidity constraints;
|
|
|
●
|
safe, low cost plant operations, with a focus on having our plants available and “in the market” when it is economical to do so; and
|
|
|
●
|
maintaining a capital structure to support our business and commercial operations.
|
Maintain a Diverse Portfolio to Capitalize on Market Opportunities and Mitigate Risk.
We operate a portfolio of generation assets that is diversified in terms of dispatch profile, fuel type and geography. Baseload generation is generally low-cost and economically attractive to dispatch around the clock throughout the year. A baseload facility is usually expected to run in excess of 70 percent of the hours in a given year. Intermediate generation may not be as efficient and/or economical as baseload generation, but is typically intended to be dispatched during higher load times such as during daylight hours and sometimes on weekends. Peaking generation is the least efficient and highest cost generation, and is generally dispatched to serve load during the highest load times such as hot summer and cold winter days.
Power prices have significantly declined since the summer of 2008. This decline reflects a similar decline in natural gas prices, which is exacerbated by shale gas proliferation, and the impact of general economic conditions, including a recessionary environment that has negatively impacted the demand for electricity. Despite these effects, we continue to believe that, over the longer term, power demand and power pricing should increase, as more stringent environmental regulations force the retirement of older, less efficient power generation units that have not invested in environmental upgrades. As a result, we believe our coal-fired, baseload fleet that have received environmental upgrades, should benefit from the impact of higher power prices in the Midwest, allowing us to capture higher margins over time. We anticipate that our combined cycle units also should benefit from increased run-times as heat rates expand, with improved margins and cash flows as demand increases in our key markets.
In addition, we believe that our portfolio of assets helps to mitigate certain risks inherent in our business. For example, weather patterns, regulatory regimes and commodity prices often differ by region and state. Geographic diversity lessens the impact of an individual risk in any one region, and we are better positioned to improve the level and consistency of our earnings and cash flows.
Employ a Flexible Commercial Strategy to Maintain Long-Term Market Upside Potential While Protecting Against Downside Risks.
We expect to see tightening reserve margins through time in the regions in which our assets are located. As these reserve margins tighten, in the longer term we expect to see our generating assets increase in value through improved cash flows and earnings as capacity utilization and power prices improve. Given current market pricing and conditions, we see limited long-term attractive commercial arrangements.
We plan to continue to volumetrically hedge the expected output from our facilities over a rolling 1-3 year time frame with the goal of achieving an efficient balance of risk and reward; however, liquidity constraints may limit our ability to post the collateral necessary to support this hedging strategy. Keeping the portfolio completely open and selling in the day-ahead market, for instance, would force us to take weather and general economic-related risks, as well as price risk of correlated commodities. These risks can cause significant swings in financial performance in any one year and are not consistent with our efforts to improve predictability of short- and medium-term earnings and cash flows.
Our commercial strategy seeks to balance the goal of protecting cash flow in the short- and medium-term with maintaining the ability to capture value longer term as markets tighten. In order to maximize the value of our assets, we seek to capture intrinsic and extrinsic value. Opportunities to capture extrinsic value – that is, value beyond that ascribed to our generating capacity based solely on a current price strip – arise from time to time in the form of price volatility, differences in counterparties’ views of forward prices and other market conditions. In order to execute our strategy, we utilize a wide range of products and contracts such as power purchase agreements, fuel supply contracts, capacity auctions, bilateral capacity contracts, power and natural gas swap agreements, power and natural gas options and other financial instruments.
We also, to the extent we have sufficient liquidity, seek to balance predictability of earnings and cash flow with achieving the highest level of earnings and cash flow. Short-term market volatility can negatively impact our profitability; we will seek to reduce those negative impacts through the disciplined use of short- and medium-term forward economic hedging instruments. Through the use of forward economic hedging instruments, including various products and contracts such as options and swaps, we seek to capture the extrinsic value inherent in our portfolio. Due to a number of variables – including changes in correlations between gas and power, time decay, changes in commodity prices, volatility and liquidity – we intend to actively and continuously balance our asset and hedge portfolios. However, our ability to execute our strategy may be limited as a result of liquidity constraints.
In carrying out this commercial strategy, we either prepay obligations or post significant amounts of collateral. Various commodity trading counterparties make collateral demands that reflect our non-investment grade credit ratings and the counterparties’ views of our creditworthiness, as well as changes in commodity prices. We use a portion of our capital resources, in the form of cash, short-term investments, lien capacity, and letters of credit, to satisfy these counterparty collateral demands. Our commodity agreements are tied to market pricing and may require us to post additional collateral under certain circumstances. If conditions change such that counterparties demand additional collateral, additional strains on our liquidity could result.
As further discussed at Note 1—Organization and Operations—Going Concern, using the latest available forward commodity price curves and considering our current hedging contracts, we project that it is likely that we will not be able to comply with our EBITDA to Consolidated Interest Expense covenant, as set forth in our Credit Facility, particularly in the third and fourth quarters of 2011. In light of our probable covenant non-compliance, we are attempting to amend or replace our existing Credit Facility. We expect the capacity of any amended or new credit facility to be less than the current capacity of $1.8 billion. Depending on the ultimate capacity available, our ability to use forward economic hedging instruments could be limited due to the collateral requirements the use of such instruments entails. Reduced hedging activity would expose us to future increases and decreases in commodity prices and limit our ability to capture the extrinsic value associated with our portfolio of assets.
We set specific limits for “gross margin at risk” for our assets and economic hedges. These limits require power hedging above minimum levels, while requiring that corresponding fuel supplies are appropriately hedged as we progress through time. We also specifically attempt to manage basis risk to more liquid market hubs that are not the natural sales hub for a facility. Any reduction in our hedging activity to reduce liquidity needs will result in a corresponding inability to limit our gross margin at risk.
Operate Our Assets Safely and Cost-Efficiently to Maximize Revenue Opportunities and Operating Margins.
We have a history of strong plant operations and are committed to operating our facilities in a safe, reliable, low-cost and environmentally compliant manner. By maintaining and operating our assets in an effort to ensure plant availability, high dispatch and capacity factors and an increased focus on operating and capital costs, we believe we are positioned to capture opportunities in the marketplace to benefit our operating margins.
Our power generation facilities are managed to require a relatively predictable level of maintenance capital expenditures without compromising operational integrity. Our capital expenditures are applied to the maintenance of our facilities to ensure their continued reliability and to investment in new equipment for either environmental compliance or increasing profitability. We seek to operate and maintain our generation fleet efficiently and safely, with an eye toward increased reliability and environmental stewardship. This increased reliability impacts our results to the extent that our generation units are available during times that it is economically sound to run. For units that are subject to contracts for capacity, our ability to secure availability payments from customers is dependent on plant availability.
Maintain a Capital Structure that is Integrated with our Operating Strategy.
We believe that the power industry is a commodity cyclical business with significant commodity price volatility and considerable capital investment requirements. Thus, operating in this market environment requires a capital structure that can withstand fuel and power price volatility as well as a commercial strategy that seeks to capture the value associated with both medium- and long-term price trends. We seek to employ a suitable capital structure, including debt amounts and maturities, debt covenants and overall liquidity, that is appropriate for our commercial strategy and the commodity cyclical market in which we operate. As discussed in Note 1—Organization and Operations—Going Concern, we are attempting to amend or replace our existing Credit Facility in order to continue to meet our operating needs over the next twelve months and/or seek additional sources of liquidity, which could impact our capital structure.
SEGMENT DISCUSSION
Our business operations are focused primarily on the wholesale power generation sector of the energy industry. We report the results of our power generation business, based on geographical location and how we have allocated our resources, as three separate segments in our consolidated financial statements: (i) GEN-MW, (ii) GEN-WE and (iii) GEN-NE. Our consolidated financial results also reflect corporate-level expenses such as general and administrative and interest. Please read Note 25—Segment Information for further information regarding the financial results of our business segments.
NERC Regions, RTOs and ISOs.
In discussing our business, we often refer to NERC regions. The NERC and its regional reliability entities were formed to ensure the reliability and security of the electricity system. The regional reliability entities set standards for reliable operation and maintenance of power generation facilities and transmission systems. For example, each NERC region establishes a minimum operating reserve requirement to ensure there is sufficient generating capacity to meet expected demand within its region. Each NERC region reports seasonally and annually on the status of generation and transmission in each region.
Separately, RTOs and ISOs administer the transmission infrastructure and markets across a regional footprint in most of the markets in which we operate. They are responsible for dispatching all generation facilities in their respective footprints and are responsible for both maximum utilization and reliable and efficient operation of the transmission system. RTOs and ISOs administer energy and ancillary service markets in the short-term, usually day ahead and real-time markets. Several RTOs and ISOs also ensure long-term planning reserves through monthly, semi-annual, annual and multi-year capacity markets. The RTOs and ISOs that oversee most of the wholesale power markets currently impose, and will likely continue to impose, both bid and price limits. They may also enforce caps and other mechanisms to guard against the exercise of market dominance in these markets. NERC regions and RTOs/ISOs often have different geographic footprints, and while there may be geographic overlap between NERC regions and RTOs/ISOs, their respective roles and responsibilities do not generally overlap.
In RTO and ISO regions with centrally dispatched market structures, all generators selling into the centralized market receive the same price for energy sold based on the bid price associated with the production of the last MWh that is needed to balance supply with demand within a designated zone or at a given location (different zones or locations within the same RTO/ISO may produce different prices respective to other zones within the same RTO/ISO due to losses and congestion). For example, a less-efficient and/or less economical natural gas-fired unit may be needed in some hours to meet demand. If this unit’s production is required to meet demand on the margin, its bid price will set the market clearing price that will be paid for all dispatched generation (although the price paid at other zones or locations may vary because of congestion and losses), regardless of the price that any other unit may have offered into the market. In RTO and ISO regions with centrally dispatched market structures and location-based marginal pricing clearing structures (e.g. PJM, NYISO, MISO and ISO-NE), generators will receive the location-based marginal price for their output. The location-based marginal price, absent congestion, would be the marginal price of the most expensive unit needed to meet demand. In regions that are outside the footprint of RTOs/ISOs, prices are determined on a bilateral basis between buyers and sellers.
Market-Based Rates.
Our ability to charge market-based rates for wholesale sales of electricity, as opposed to cost-based rates, is governed by FERC. We have been granted market-based rate authority for wholesale power sales from our EWG facilities, as well as wholesale power sales by our power marketing entities, DYPM and DMT. The Dynegy EWG facilities include all of our facilities except our investment in the Nevada Cogeneration Associates #2 (“Black Mountain”) facility. This facility is known as a QF, and has various exemptions from federal regulation and sells electricity directly to purchasers under negotiated and previously approved power purchase agreements.
Our market-based rate authority is predicated on a finding by FERC that our entities with market-based rates do not have market power, and a market power analysis is generally conducted once every three years for each region on a rolling basis (known as the triennial market power review). The next triennial market power review for our MISO facilities will be filed with FERC in June 2012. The next triennial market power review for our GEN-NE and PJM facilities will be filed at FERC in June 2011. The triennial market power reviews for our GEN-WE facilities was filed in June 2010 and accepted by FERC in December 2010 with a finding that the GEN-WE facilities satisfied FERC’s requirement that such facilities do not have horizontal or vertical market power.
Power Generation—Midwest Segment
GEN-MW is comprised of eight facilities in Illinois and one in Pennsylvania with a total generating capacity of 5,088 MW. As of December 31, 2010, GEN-MW operated entirely within either the MISO or the PJM.
RTO/ISO Discussion
MISO.
The MISO market includes all of Wisconsin and Michigan and portions of Ohio, Kentucky, Indiana, Illinois, Nebraska, Kansas, Missouri, Iowa, Minnesota, North Dakota, Montana and Manitoba, Canada. As of December 31, 2010, we owned seven power generating facilities that sell into the MISO market and are located in Illinois, with an aggregate net generating capacity of 3,308 MW within MISO. On December 28, 2010, we announced plans to mothball the 176 MW Vermilion power generation facility at the end of the first quarter 2011.
The MISO market is designed to ensure that every electric industry participant has access to the grid and that no entity has the ability to deny access to a competitor. MISO also manages the use of transmission lines to make sure that they do not become overloaded. MISO operates physical and financial energy markets using a system known as LMP, which calculates a price for every generator and load point within MISO. This system is “price-transparent”, allowing generators and load serving entities to see real-time price effects of transmission constraints and impacts of generation and load changes to prices at each point. MISO operates day-ahead and real-time markets into which generators can offer to provide energy. MISO does not administer a centralized capacity market.
FTRs allow users to manage the cost of transmission congestion (as measured by LMP differentials, between source and sink points on the transmission grid) and corresponding price differentials across the market area. MISO implemented the Ancillary Services Market (Regulation and Operating Reserves) on January 6, 2009 and implemented an enforceable Planning Reserve Margin for each planning year effective June 1, 2009. A feature of the Ancillary Services Market is the addition of scarcity pricing that, during supply shortages, can raise the combined price of energy and ancillary services significantly higher than the previous cap of $1,000/MWh. An independent market monitor is responsible for ensuring that MISO markets are operating competitively and without exercise of market power.
PJM.
The PJM market includes all or parts of Delaware, Illinois, Indiana, Kentucky, Maryland, Michigan, New Jersey, North Carolina, Ohio, Pennsylvania, Tennessee, Virginia, West Virginia and the District of Columbia. As of December 31, 2010, we owned two generating facilities that sell into the PJM market and are located in Illinois and Pennsylvania with an aggregate net generating capacity of 1,780 MW.
PJM administers markets for wholesale electricity and provides transmission planning for the region, utilizing the LMP system described above. PJM operates day-ahead and real-time markets into which generators can bid to provide electricity and ancillary services. PJM also administers markets for capacity. An independent market monitor continually monitors PJM markets for any exercise of market power or improper behavior by any entity. PJM implemented a forward capacity auction, the RPM, which established long-term markets for capacity in 2007. In addition to entering into bilateral capacity transactions, we have participated in RPM base residual auctions through PJM’s planning year 2013-2014, which ends May 31, 2014, as well as ongoing incremental auctions to balance positions and offer residual capacity that may become available.
PJM, like MISO, dispatches power plants to meet system energy and reliability needs, and settles physical power deliveries at LMPs. This value is determined by an ISO-administered auction process, which evaluates and selects the least costly supplier offers or bids to create reliable and least-cost dispatch. The ISO-sponsored LMP energy markets consist of two separate and characteristically distinct settlement time frames. The first is a security-constrained, financially firm, day-ahead unit commitment market. The second is a security-constrained, financially settled, real-time dispatch and balancing market. Prices paid in these LMP energy markets, however, are affected by, among other things, (i) market mitigation measures, which can result in lower prices associated with certain generating units that are mitigated because they are deemed to have the potential to exercise locational market power, and (ii) existing $1,000/MWh energy market price caps that are in place.
Contracted Capacity and Energy
MISO.
Power prices in MISO are a significant driver of our overall financial performance due to the fact that a significant portion of our total power generating capacity is located in MISO and is attributable to coal-fired baseload units. We commercialize these assets through a combination of bilateral physical and financial power, fuel and capacity contracts.
PJM.
Our generation assets in PJM are natural gas-fired combined cycle intermediate dispatch facilities. We commercialize these assets through a combination of bilateral power, fuel and capacity contracts. We commercialize our capacity through either the RPM auction or on a bilateral basis. In January 2010, we executed an agreement to terminate a 280 MW tolling agreement for our Kendall facility. This agreement was replaced by two smaller tolling agreements which total 135 MW into 2012 and 85 MW into 2017.
Regulatory Considerations
MISO.
Actual reserve margins are substantially above MISO’s current required reserve margin of 15 percent. The reserve margin based on available capacity was 29 percent during the 2010 summer season as compared to 44 percent during the 2009 summer season.
PJM.
Actual reserve margins are somewhat above PJM’s current required installed reserve margin of 15 percent. The reserve margin based on deliverable capacity was 26 percent for Planning Year 2010/11 as compared to 20 percent for Planning Year 2009/10. PJM’s required installed reserve margin is 16 percent for Planning Year 2010/11.
Power Generation—West Segment
GEN-WE is comprised of three operating natural gas-fired power generation facilities located in California (2) and Nevada (1) and one fuel oil-fired power generation facility located in California, totaling 3,387 MW of electric generating capacity. Our 309 MW South Bay facility is currently out of operation and is in the process of being decommissioned.
RTO/ISO Discussion
CAISO.
CAISO covers approximately 90 percent of the State of California. At December 31, 2010, we owned three operating generation facilities in California within CAISO. The Oakland facility is designated as an RMR unit by the CAISO.
Contracted Capacity and Energy
CAISO.
In CAISO, where our assets include intermediate dispatch and peaking facilities, we seek to mitigate spark spread variability through RMR, tolling arrangements and physical and financial bilateral power and fuel contracts. All of the capacity of our Moss Landing Units 6 and 7 and Morro Bay facility are contracted under tolling arrangements through 2013. Our Oakland facility operates under RMR contracts. The RMR contract at our South Bay facility expired on December 31, 2010, and we expect the facility to be demolished.
Regulatory Considerations
CPUC/CAISO
. On the state level, there are numerous ongoing market initiatives that impact wholesale generation, principally the development of resource adequacy rules and capacity markets.
The CPUC requires a Resources Adequacy margin of 15 to 17 percent. The actual reserve margin generally moves within, or close to, this range, but seasonal and regional fluctuations exist.
Equity Investment
Black Mountain.
We have a 50 percent indirect ownership interest in the Black Mountain facility, which is a PURPA QF located near Las Vegas, Nevada, in the WECC. Capacity and energy from this facility are sold to Nevada Power Company under a long-term PURPA QF contract that runs to 2023.
Power Generation—Northeast Segment
GEN-NE is comprised of four facilities located in New York (3) and Maine (1), with a total capacity of 3,297 MW. We own and operate the Independence, Casco Bay and Danskammer Units 1 and 2 power generating facilities, and we operate the Roseton and Danskammer Units 3 and 4 facilities under long-term lease arrangements. Our Roseton and Danskammer facility sites are adjacent and share common resources such as fuel handling, a docking terminal, personnel and systems.
RTO/ISO Discussion
The market in which GEN-NE resides is characterized by two interconnected and actively traded competitive markets: the NYISO (an ISO) and the ISO-NE (an RTO). In the GEN-NE markets, load-serving entities generally lack their own generation capacity and procure their energy supplies from merchant generation owners through the ISO/RTO markets. Commodity prices are typically more volatile in the Northeast (on an as-delivered basis) than in other regions due to the distance and occasional physical constraints that impact the delivery of fuel into the region.
Although both RTOs/ISOs and their respective energy markets are functionally, administratively and operationally independent, they follow, to a certain extent, similar market designs. Both the NYISO and the ISO-NE dispatch power plants to meet system energy and reliability needs and settle physical power deliveries at LMPs as discussed above. The energy markets in both the NYISO and ISO-NE also have defined, but different, mitigation protocols for bidding.
In addition to energy delivery, the NYISO and ISO-NE administer markets for installed capacity, ancillary services and FTRs.
NYISO.
The NYISO market includes virtually the entire state of New York. At December 31, 2010, we operated three facilities within NYISO with an aggregate net generating capacity of 2,757 MW.
Capacity pricing is calculated as a function of NYISO’s annual required reserve margin, the estimated net cost of “new entrant” generation, estimated peak demand and the actual amount of capacity bid into the market at or below the demand curve. The demand curve mechanism provides for incrementally higher capacity pricing at lower reserve margins, such that “new entrant” economics become attractive as the reserve margin approaches required minimum levels. The intent of the demand curve mechanism is to ensure that existing generation facilities have enough revenue to recover their investment when capacity revenues are coupled with energy and ancillary service revenues. Additionally, the demand curve mechanism is intended to attract new investment in generation in the general sector in which it is needed most when that new capacity is needed. To calculate the price and quantity of installed capacity, three ICAP demand curves are utilized: one for Long Island, one for New York City and one for Statewide (commonly referred to as Rest of State). Our facilities operate in the Rest of State market.
Due to transmission constraints, energy prices vary across New York and are generally higher in the Southeastern part of New York, where our Roseton and Danskammer facilities are located, and in New York City and Long Island. Our Independence facility is located in the Northwest part of the state.
ISO-NE.
The ISO-NE market includes the six New England states of Vermont, New Hampshire, Massachusetts, Connecticut, Rhode Island and Maine. Much like regional zones in the NYISO, energy prices also vary among the participating states in ISO-NE, and are largely influenced by transmission constraints and fuel supply. The ISO-NE implemented an FCM in June 2010 where capacity prices are determined through auctions. As of December 31, 2010, we owned and operated one power generating facility (Casco Bay) within the ISO-NE, with an aggregate net generating capacity of 540 MW.
Contracted Capacity and Energy
NYISO.
We commercialize these assets through a combination of bilateral physical and financial power, fuel and capacity contracts.
At our Independence facility, 740 MW of capacity is contracted under a capacity sales agreement that runs through 2014. Revenue from this capacity obligation is largely fixed with a variable discount that varies each month based on the LMP at Pleasant Valley. Additionally, we supply steam and up to 44 MW of electric energy from our Independence facility to a third party at a fixed price.
For the uncommitted portion of our NYISO fleet, due to the standard capacity market operated by NYISO and liquid over-the-counter market for NYISO capacity products, we are able to sell substantially all of our remaining capacity into the market.
ISO-NE.
Four forward capacity auctions have been held to date with capacity clearing prices ranging from $4.50 kW/month for the 2010/2011 market period to $2.95 kW/month for the 2012/2013 market period. These capacity clearing prices represent the floor price and the actual rate paid to market participants that were affected by pro-rationing due to oversupply conditions.
Regulatory Considerations
NYISO.
A reserve margin of 15.5 percent has been proposed for the New York Control Area for the period beginning May 1, 2011 and ending April 30, 2012, down from the current requirement of 18 percent. The actual amount of installed capacity is somewhat above NYISO’s current required margin.
ISO-NE.
Recommended improvements and modifications to the FCM design are currently in litigation at FERC, and discussions to address improvements to the FCM design are currently underway by the ISO and its stakeholders.
Other
Corporate governance roles and functions, which are managed on a consolidated basis, and specialized support functions such as finance, accounting, commercial, risk control, tax, legal, regulatory, human resources, administration and information technology, are included in Other in our segment reporting. Corporate general and administrative expenses, income taxes and interest expenses are also included, as are corporate-related other income and expense items. Results for our legacy CRM operations, which primarily consist of a minimal number of natural gas trading positions, are also included in Other.
ENVIRONMENTAL MATTERS
Our business is subject to extensive federal, state and local laws and regulations governing discharge of materials into the environment. We are committed to operating within these regulations and to conducting our business in an environmentally responsible manner. The environmental, legal and regulatory landscape is subject to change and has become more stringent over time. The process for acquiring or maintaining permits or otherwise complying with applicable rules and regulations may create unprofitable or unfavorable operating conditions or require significant capital and operating expenditures. Any failure to acquire or maintain permits or to otherwise comply with applicable rules and regulations may result in fines and penalties or negatively impact our ability to advance projects in a timely manner, if at all. Further, changed interpretations of existing regulations may subject historical maintenance, repair and replacement activities at our facilities to claims of noncompliance.
Our aggregate expenditures (both capital and operating) for compliance with laws and regulations related to the protection of the environment were approximately $225 million in 2010 compared to approximately $320 million in 2009 and approximately $245 million in 2008. The 2010 expenditures include approximately $200 million for projects related to our Midwest Consent Decree (which is discussed below) compared to $260 million for Midwest Consent Decree projects in 2009. We estimate that total environmental expenditures in 2011 will be approximately $180 million, including approximately $150 million in capital expenditures and approximately $30 million in operating expenditures. Changes in environmental regulations or outcomes of litigation and administrative proceedings could result in additional requirements that would necessitate increased future spending and could create adverse operating conditions. Please read Note 22—Commitments and Contingencies for further discussion of this matter.
Climate Change
For the last several years, there has been a robust public debate about climate change and the potential for regulations requiring lower emissions of GHG, primarily CO
2
and methane. We believe that the focus of any federal program attempting to address climate change should include three critical, interrelated elements: (i) the environment, (ii) the economy and (iii) energy security.
We cannot confidently predict the final outcome of the current debate on climate change nor can we predict with confidence the ultimate requirements of proposed or anticipated federal and state legislation and regulations intended to address climate change. These activities, and the highly politicized nature of climate change, suggest a trend toward increased regulation of GHG that could result in a material adverse effect on our financial condition, results of operations and cash flows. Existing and anticipated federal and state regulations intended to address climate change may significantly increase the cost of providing electric power, resulting in far-reaching and significant impacts on us and others in the power generation industry over time. It is possible that federal and state actions intended to address climate change could result in costs assigned to GHG emissions that we would not be able
to fully recover through market pricing or otherwise. If capital and/or operating costs related to compliance with regulations intended to address climate change become great enough to render the operations of certain plants uneconomical, we could, at our option and subject to any applicable financing agreements or other obligations, reduce operations or cease to operate such plants and forego such capital and/or operating costs.
Power generating facilities are a major source of GHG emissions – in 2010, our facilities in GEN-MW, GEN-WE and GEN-NE emitted approximately 23.5 million, 1.5 million and 4.8 million tons of CO
2
e, respectively. The amounts of CO
2
e emitted from our facilities during any time period will depend upon their dispatch rates during the period.
Though we consider our largest risk related to climate change to be legislative and regulatory changes intended to slow or prevent it, we are subject to physical risks inherent in industrial operations including severe weather events such as hurricanes and tornadoes. To the extent that changes in climate effect changes in weather patterns (such as more severe weather events) or changes in sea level where we have generating facilities, we could be adversely affected. To the extent that climate change results in changes in sea level, we would expect such effects to be gradual and amenable to structural mitigation during the useful life of the facilities. However, if this is not the case it is possible that we would be impacted in an adverse way, potentially materially so. We could experience both risks and opportunities as a result of related physical impacts. For example, more extreme weather patterns – namely, a warmer summer or a cooler winter – could increase demand for our products. However, we also could experience more difficult operating conditions in that type of environment. We maintain various types of insurance in amounts we consider appropriate for risks associated with weather events.
Federal Legislation Regarding Greenhouse Gases.
Several bills have been introduced in Congress since 2003 that if passed would compel reductions in CO
2
emissions from power plants. In June 2009, the House of Representatives passed the American Clean Energy and Security Act of 2009 (“H.R. 2454”). Title III of H.R. 2454 would add a new Title VII to the CAA creating a Global Warming Pollution Reduction Program. H.R. 2454 would also create a national cap-and-trade program aimed at reducing CO
2
emissions to three percent below 2005 levels by 2012, 17 percent below 2005 levels by 2020, 42 percent below 2005 levels by 2030 and 83 percent below 2005 levels by 2050. The companion bill introduced in the Senate, S. 1733, was passed by the Senate Environment and Public Works Committee in November 2009 but did not gain enough support to be brought to a vote of the full Senate. While several other bills have been introduced in the Senate, none have been passed out of committee and the passage of comprehensive GHG legislation in the next two years is considered unlikely.
Federal Regulation of Greenhouse Gases.
In April 2007, the U.S. Supreme Court issued its decision in
Massachusetts v. EPA
, a case involving the regulation of GHG emissions from new motor vehicles. The Court held that GHGs meet the definition of a pollutant under the CAA and that regulation of GHG emissions is authorized by the CAA. The Court ruled that the EPA had a duty to determine whether or not GHG emissions from motor vehicles might reasonably be anticipated to endanger public health or welfare within the meaning of the CAA.
In response to the ruling in
Massachusetts v. EPA
, the Administrator of the EPA issued a proposed finding in April 2009 that GHG emissions from motor vehicles cause or contribute to air pollution that endangers the public health and welfare. After a comment period, the Administrator issued a final endangerment finding under Section 202(a) of the CAA in December 2009. The decision found that six GHGs in the atmosphere may reasonably be anticipated to endanger public health and welfare. Subsequently, Requests for Reconsideration of EPA’s endangerment finding were filed, and sixteen petitions for review of the final EPA action have been filed in the U.S. Court of Appeals for the District of Columbia by organizations representing industry, an organization representing nine members of Congress, and by the states of Alabama, Texas and Virginia. The EPA denied the Requests for Reconsideration on July 29, 2010 and the denial has been challenged in the U.S. Court of Appeals for the District of Columbia.
The EPA finalized several proposed rules concerning GHGs in 2010:
|
|
●
|
The EPA and the U.S. Department of Transportation adopted a joint rule to regulate GHG emissions from passenger cars and light trucks under Section 202(a) of the CAA. The final motor vehicle rule was published in the Federal Register on May 7, 2010. While this rule will not directly affect us, it renders GHGs, including CO
2
, “subject to regulation” under the CAA.
|
|
|
●
|
The EPA final rule requiring mandatory reporting of GHG emissions from all sectors of the economy went into effect in January 2010 and requires that reports of GHG emissions be filed annually thereafter. We have implemented new processes and procedures to report these emissions as required and anticipate filing our first report in March 2011, with annual filings thereafter.
|
|
|
●
|
The EPA Tailoring Rule proposed to “phase in” new GHG emissions applicability thresholds for the PSD permit program and for the operating permit program under Title V of the CAA. The final Tailoring Rule was published in the Federal Register on June 3, 2010. For sources already subject to the PSD program, the rule establishes a GHG emissions PSD applicability threshold at a net increase of 75,000 tons per year of CO
2
e for new and modified sources from January 2, 2011 through June 30, 2011. From July 1, 2011 through June 30, 2013 the GHG emissions PSD applicability threshold will be 100,000 tons per year for new sources even if these sources are not otherwise subject to the PSD program for other pollutants. The applicability threshold for modifications to existing sources will continue to be a net increase of 75,000 tons per year. Several parties have filed Requests for Reconsideration of the Tailoring Rule with the EPA. The Rule has also been challenged in the U.S. Court of Appeals for the District of Columbia. We cannot predict with confidence the outcome of the litigation. Application of the PSD program to GHG emissions will require implementation of BACT for new and modified sources of GHG. On November 10, 2010, the EPA issued its PSD and Title V Permitting Guidance for Greenhouse Gases. For coal-fired electric generating units, the guidance focuses on steam turbine and boiler efficiency improvements as a reasonable BACT requirement.
|
On December 30, 2010, the EPA published a Notice of Proposed Settlement Agreement of a CAA citizen suit in
New York, et al. v. EPA,
a challenge to its final NSPS for electric utility steam generating units (“EGUs”), issued on February 27, 2006. Several states and environmental organizations challenged the rule because it did not establish standards of performance for GHG emissions. Following the Supreme Court’s decision in
Massachusetts v. EPA
, the U.S. Court of Appeals for the District of Columbia Circuit remanded the rule to the EPA for further consideration of the GHG issues. The proposed settlement would require the EPA to issue a proposed NSPS under the CAA for control of GHG emissions from new and modified EGUs, as well as proposed emission guidelines for control of GHG emissions from existing EGUs, by July 26, 2011 and to finalize the standard by May 26, 2012. Any such standards would directly affect several of our power generating facilities.
State Regulation of Greenhouse Gases.
Many states where we operate generation facilities have, are considering, or are in some stage of implementing, state-only regulatory programs intended to reduce emissions of GHGs from stationary sources as a means of addressing climate change. Beginning in 2009, our generating facilities in New York and Maine were required to purchase CO
2
allowances from the states where they operate in sufficient quantities to cover CO
2
emissions. Please see “Northeast” below for further information. Beginning in 2012, our generating facilities in California are also expected to be required to purchase CO
2
allowances in sufficient quantities to cover CO
2
emissions. Please see “West” below for further information.
Midwest
.
Our assets in Illinois may become subject to a regional GHG cap-and-trade program being developed under the MGGA. The MGGA is an agreement among six states and one Canadian province to create the MGGRP to establish GHG reduction targets and timeframes consistent with member states’ targets and to develop a market-based and multi-sector cap and trade mechanism to achieve the GHG reduction targets. Illinois has set a goal of reducing GHG emissions to 1990 levels by the year 2020, and to 60 percent below 1990 levels by 2050. The MGGRP is, however, still in an early stage of development and specific targets for GHG emission reductions and regulations to achieve such targets have not yet been agreed to by the members.
West.
Our assets in California are subject to the California Global Warming Solutions Act (“AB 32”), which became effective in January 2007. AB 32 requires the CARB to develop a GHG emission control program that will reduce emissions of GHG in the state to their 1990 levels by 2020 with a fully effective regulatory program to be in place by January 2012. The formal cap-and-trade rulemaking began with the release of the Staff Report: Initial Statement of Reasons on October 28, 2010. The CARB considered the Proposed Regulation to Implement the California Cap-and-Trade Program at its public hearing on December 16, 2010. At that hearing, the Board adopted a resolution to approve the rule with specified modifications that will be made through additional rulemakings in 2011, including a rulemaking to address allowance allocations. Initially, the program will apply to large stationary sources including power generation facilities beginning in 2012. GHG emission allowances are expected to be sold at auctions beginning in February 2012.
The State of California is a party to a regional GHG cap-and-trade program being developed under the WCI to reduce GHG emissions in the participating states. The WCI is a collaborative effort among seven states and four Canadian provinces. California’s implementation of AB 32 is expected to constitute the state’s contribution to the WCI and to form the model for other participating jurisdictions.
Northeast.
On January 1, 2009, our assets in New York and Maine became subject to a state-driven GHG emission control program known as RGGI. RGGI was developed and implemented by ten New England and Mid-Atlantic states to reduce CO
2
emissions from power plants. The participating RGGI states implemented rules regulating GHG emissions using a cap-and-trade program to reduce CO
2
emissions by at least 10 percent of 2009 emission levels by the year 2018. Compliance with the allowance requirement under the RGGI cap-and-trade program can be achieved by reducing emissions, purchasing or trading allowances, or securing offset allowances from an approved offset project. While allowances are sold by year, actual compliance is measured across a three year control period. The first control period is for the 2009-2011 timeframe.
In December 2010, RGGI held its tenth auction, in which approximately 25 million allowances for the current control period, and 1.2 million allowances for future control periods, were sold at clearing prices of $1.86 per allowance. We have participated in each of the quarterly RGGI auctions (or in secondary markets, as appropriate) to secure some allowances for our affected assets. We expect that the increased operating costs resulting from purchase of CO
2
allowances will be at least partially reflected in market prices. The RGGI states plan to continue to conduct quarterly auctions in 2011.
Our generating facilities in New York and Maine emitted approximately 4.8 million tons of CO
2
during 2010. Based on the average clearing price of $2.51 for current allowances sold in all auctions held to date, we estimate our cost of allowances required to operate these facilities during 2010 would be approximately $12 million. The RGGI compliance period is three years, so the actual cost of allowances required for our 2010 operations may vary from this estimate as a result of purchases and/or sales of allowances between now and 2012, which may result in a lower or higher average allowance cost.
Climate Change Litigation.
There is a risk of litigation from those seeking injunctive relief from or to impose liability on sources of GHG emissions, including power generators, for claims of adverse effects due to climate change. Recent court decisions disagree on whether the claims are subject to resolution by the courts and whether the plaintiffs have standing to sue.
In September 2009, the U.S. Court of Appeals for the 2
nd
Circuit considered the appeal of
Connecticut v. AEP
and held that the U.S. District Court is an appropriate forum for resolving claims by eight states and New York City against six electric power generators related to climate change. Similarly, in October 2009, the U.S. Court of Appeals for the 5
th
Circuit considered the appeal of
Comer v. Murphy Oil
and held that claims related to climate change by property owners along the Mississippi Gulf Coast against energy companies could be resolved by the courts. However, the
Comer v. Murphy
decision was subsequently vacated. In September 2009, the U.S. District Court for the Northern District of California dismissed claims related to climate change by an Alaskan community against 24 companies in the energy industry, including us, in
Native Village of Kivalina and City of Kivalina v. ExxonMobil Corporation, et al.
The Kivalina case is pending before the U.S. Court of Appeals for the 9
th
Circuit. Please read Note 22—Commitments and Contingencies for further discussion of this case.
The conflict in recent court decisions illustrates the unsettled law related to claims based on the effects of climate change. The decisions affirming the jurisdiction of the courts and the standing of the plaintiffs to bring these claims could result in an increase in similar lawsuits and associated expenditures by companies like ours. On December 6, 2010, the U.S. Supreme Court agreed to review
Connecticut v. AEP
.
Carbon Initiatives.
We participate in several programs that partially offset or mitigate our GHG emissions. In the lower Mississippi River Valley, we have partnered with the U.S. Fish & Wildlife Service to restore more than 45,000 acres of hardwood forests by planting more than 2 million bottomland hardwood seedlings. In California, we are evaluating the use of bio-fuels as a means of reducing reliance on traditional fuels. In Illinois, we are funding prairie, bottomland hardwood and savannah restoration projects in partnership with the Illinois Conservation Foundation. We also have programs to reuse CCR produced at our coal-fired generation units through agreements with cement manufacturers that incorporate the material into cement products, helping to reduce CO
2
emissions from the cement manufacturing process.
Our Moss Landing facility in California is involved in a pilot project with Calera Corporation that treats flue gas emissions from the facility in a process that produces materials similar to Portland cement and aggregate. The Calera carbonate mineralization process binds CO
2
with minerals in brines or seawater in a manner that has the potential to permanently sequester the CO
2
in the solid materials it produces. If this process can be developed on a commercial scale, it would provide a means of capturing CO
2
and creating beneficial, marketable products for the building materials industry.
Other Environmental Matters
The Clean Air Act
The CAA and comparable state laws and regulations relating to air emissions impose responsibilities on owners and operators of sources of air emissions, including requirements to obtain construction and operating permits as well as compliance certifications and reporting obligations. The CAA requires that fossil-fueled electric generating plants have sufficient emission allowances to cover actual SO
2
emissions and in some regions NO
X
emissions, and that they meet certain pollutant emission standards as well. Our power generation facilities, some of which have changed their operations to accommodate new control equipment or changes in fuel mix, are currently in compliance with these requirements.
In order to ensure continued compliance with the CAA and related rules and regulations, including ozone-related requirements, we have plans to install additional emission reduction technology at our GEN-MW coal-fired facilities. When our plans are complete, our four coal-fired units at our Baldwin and Havana facilities will have dry flue gas desulphurization systems for the control of SO
2
emissions, and electrostatic precipitators and baghouses for the control of particulate emissions. Selective catalytic reduction technology for the control of NO
X
emissions has been installed and operated on three of these units for several years; GEN-MW’s remaining units use low-NO
X
burners and overfire air to lower NO
X
emissions. Our coal-fired units at our Vermilion and Hennepin facilities have electrostatic precipitators and baghouses for the control of particulate matter. We now have activated carbon injection technology for the control of mercury emissions installed and operating on approximately 95 percent of GEN-MW’s coal-fired capacity, and we will install this technology on our final unit by 2013.
Multi-Pollutant Air Emission Initiatives
In recent years, various federal and state legislative and regulatory multi-pollutant initiatives have been introduced. In early 2005, the EPA finalized several rules (i.e. CAIR and CAMR) that would collectively require reductions of approximately 70 percent each in emissions of SO
2
and NO
x
by 2015 and mercury by 2018 from coal-fired power generation units.
CAIR is intended to reduce SO
2
and NO
x
emissions from power generation sources across the eastern United States (29 states and the District of Columbia) and to address fine particulate matter and ground-level ozone National Ambient Air Quality Standards. CAIR was challenged and the U.S. Court of Appeals for the District of Columbia Circuit remanded the rule to the EPA to correct several aspects of the rule determined by the Court to be unacceptable. The rule remains effective until the EPA completes its proposed Transport Rule to replace CAIR. Our facilities in Illinois and New York are subject to state SO
2
and NO
x
limitations more stringent than those imposed by the currently effective CAIR.
Transport Rule.
On August 2, 2010, the EPA proposed its Federal Implementation Plans to Reduce Interstate Transport of Fine Particulate Matter and Ozone (the “proposed Transport Rule”). The proposed Transport Rule would be implemented through federal implementation plans that would be effective in each affected state as soon as the final rule is issued. The proposed rules are intended to reduce emissions of SO
2
and NO
x
from large electric generating units in 31 eastern states and the District of Columbia. The rules would impose cap and trade programs within each state that would cap emissions of SO
2
and NO
x
at levels predicted to eliminate that state’s contribution to nonattainment in, or interference with maintenance of attainment status by, down-wind areas with respect to the National Ambient Air Quality Standards for particulate matter smaller than 2.5 micrometers (PM
2.5
) and ozone. Our generating facilities in Illinois, New York and Pennsylvania would be subject to the rules.
The rules applicable to annual and ozone season NO
x
emissions would require compliance by January 1, 2012. The rules applicable to SO
2
emissions from electric generating units in Illinois, New York and Pennsylvania would be implemented in two stages with compliance dates of January 1, 2012 and January 1, 2014. The EPA would initially allocate NO
x
and SO
2
emission allowances to existing electric generating units based on the lower of 2009 annual emissions or projected 2012 emissions necessary to meet the EPA’s emission budget for the state. The SO
2
emission budgets in Illinois, New York and Pennsylvania would be reduced in 2014, and existing electric generating units in these states would be allocated fewer SO
2
emission allowances beginning in 2014. Electric generating units would be required to hold one emission allowance for every ton of SO
2
and/or NO
x
emitted during the applicable compliance period. Electric generating units can comply with the required emission reductions by any combination of (i) installing emission control technologies, (ii) operating existing controls more often, (iii) switching fuels, or (iv) curtailing or ceasing operation.
Allowance trading would be allowed under the proposed Transport Rule among sources within the same state with limited interstate allowance trading. Illinois, New York and Pennsylvania would be subject to three new cap and trade programs under the proposed Transport Rule capping emissions of NO
x
from May 1
st
through September 30
th
and capping emissions of SO
2
and NO
x
respectively, on an annual basis.
In the preamble to the proposed Transport Rule, the EPA solicited comments on alternatives and variations to a number of provisions of the proposal including the state emissions budgets, the emission allowance allocation approach, auction of allowances rather than allocation by the EPA, and direct control of emissions through emission rate limits. We submitted comments on the proposed rule on October 1, 2010. On January 7, 2011, the EPA issued a Notice of Data Availability and requested comment on alternative allocation methodologies based on historic heat input. We will continue to monitor the rulemaking process surrounding the proposed Transport Rule and to evaluate any potential impacts it might have on our operations.
Mercury/HAPs.
In March 2005, the EPA issued the CAMR for control of mercury emissions from coal-fired power plants and established a cap and trade program requiring states to promulgate rules at least as stringent as CAMR. In December 2006, the Illinois Pollution Control Board approved a state rule for the control of mercury emissions from coal-fired power plants that required additional capital and O&M expenditures at each of our Illinois coal-fired plants beginning in 2007. The State of New York has also approved a mercury rule that will likely require us to incur additional capital and operating costs for our Danskammer power generating facility by January 1, 2015.
In February 2008, the U.S. Court of Appeals for the District of Columbia Circuit vacated the CAMR; however, the Illinois and New York mercury regulations remain in effect. In December 2009, the EPA issued information requests under Section 114 of the CAA to many coal- and oil- fired steam electric generating companies, including certain of our operating companies. These requests required stack tests to develop information on emissions of mercury and other HAPs, including organics, acid gases and non-mercury metals, and will be used by the EPA to develop emission standards for HAPs under Section 112 of the CAA. Under a consent decree, the EPA is required to propose MACT emission standards for HAPs from coal- and oil-fired electric utility steam generating units, pursuant to CAA Section 112, by March 16, 2011 and to issue final standards by November 16, 2011. We will continue to monitor the HAP rulemaking process and evaluate any potential impacts the rulemaking might have on our operations.
Visibility.
CAVR requires states to analyze and include BART requirements for individual facilities in their SIPs to address regional haze. The requirements apply to facilities built between 1962 and 1977 that emit more than 250 tons per year of certain regulated pollutants in specific industrial categories, including utility boilers. In July 1999, the EPA published its final Regional Haze Rule which requires states to submit regional haze implementation plans to the EPA detailing their plans to reduce emissions of visibility-impairing pollutants (NO
x
, SO
2
and particulates) that affect visibility in downwind Federal Class I Areas (i.e. parks and wilderness) with a goal to restore natural visibility conditions in these areas by 2064.
The State of New York has been identified as having certain BART eligible facilities that contribute to regional haze in Class I Areas in other states, including our Roseton power generating facility and Unit 4 at our Danskammer power generating facility. On May 1, 2010, the New York State BART Rule became effective. In compliance with the rule, our Danskammer and Roseton power generating facilities performed a comprehensive, unit specific modeling analysis for their BART eligible units to determine their impact on visibility. In the fall of 2010, we submitted this analysis to NYSDEC along with a proposal to reduce NO
x
and SO
2
emission limits to address impacts on visibility. Compliance at our Roseton facility would be achieved, effective January 1, 2014, by reducing the sulfur content of our fuel oil and optimization of existing NO
x
emission controls. Compliance at Danskammer Unit 4 would be achieved, effective July 1, 2014, through optimization of existing NO
x
emission controls, co-firing with natural gas, use of alternative coal, and/or installation of additional emission controls. Our BART proposals are under review by NYSDEC and the EPA. We are continuing to review our compliance options at Danskammer, options which could result in significant expenditures for emission control equipment.
Other Air Emission Initiatives
New York NO
x
RACT Rule.
In June 2010, New York State issued a final rule establishing revised RACT limits for emissions of NO
x
from stationary combustion sources. Compliance with the revised NO
x
RACT limits is required by July 1, 2014, and compliance plans must be submitted to NYSDEC by January 1, 2012. Compliance options include meeting presumptive RACT limits, case-by-case RACT determinations, fuel switching during the ozone season (May 1 through September 30), and participation in a system averaging plan. We are continuing to review the potential impact of the revised NO
x
RACT rule on our subject power generation facilities.
Midwest Consent Decree.
In 2005, we settled a lawsuit filed by the EPA and the U.S. Department of Justice that alleged violations of the CAA and related federal and Illinois regulations concerning certain maintenance, repair and replacement activities at our Baldwin generating facility. A consent decree was finalized in July 2005 that would prohibit operation of certain of our power generating facilities after certain dates unless specified emission control equipment is installed (the “Midwest Consent Decree”). We have achieved all emission reductions to date under the Midwest Consent Decree and are in the process of installing additional emission control equipment to meet future Midwest Consent Decree emission limits. We anticipate our costs associated with the Midwest Consent Decree projects, which we expect to incur through 2013, will be approximately $960 million, which includes approximately $730 million spent to date. This estimate required a number of assumptions about uncertainties that are beyond our control, including an assumption that labor and material costs will increase at four percent per year over the remaining project term. The following are the future estimated capital expenditures required to comply with the Midwest Consent Decree:
|
2011
|
2012
|
2013
|
||||||||
|
(in millions)
|
||||||||||
| $ | 140 | $ | 80 | $ | 10 | |||||
If the costs of these capital expenditures become great enough to render operation of the affected facility or facilities uneconomical, we could, at our option, cease to operate the facility or facilities and forego these expenditures without any further obligations under the Midwest Consent Decree. Further, our production may be affected if we fail to meet certain performance standards under the Midwest Consent Decree.
Please see Item 7—Management’s Discussion and Analysis of Financial Condition and Results of Operations—Liquidity and Capital Resources for further discussion.
Information Request under Section 114 of the Clean Air Act.
In March 2009, we received an information request from the EPA regarding maintenance, repair and replacement projects undertaken between January 2000 and the present at the Danskammer power generation facility. We submitted responses to the information request in April and July 2009 and are continuing to cooperate with the EPA to provide additional information as requested. The information request is related to a nationwide enforcement initiative by the EPA targeting electric utilities. The EPA’s inquiry may lead to claims of CAA violations that could result in an enforcement action, the scope of which cannot be predicted with confidence at this time, but which could have a material adverse effect on our financial condition, results of operations and cash flows.
The Clean Water Act
Our water withdrawals and wastewater discharges are permitted under the CWA and analogous state laws. The cooling water intake structures at several of our facilities are regulated under Section 316(b) of the CWA. This provision generally directs that standards set for facilities require that the location, design, construction and capacity of cooling water intake structures reflect BTA for minimizing adverse environmental impact. These standards are developed and implemented for power generating facilities through NPDES permits or SPDES permits. Historically, standards for minimizing adverse environmental impacts of cooling water intakes have been made by permitting agencies on a case-by-case basis considering the best professional judgment of the permitting agency.
In 2004, the EPA issued the Cooling Water Intake Structures Phase II Rules (the “Phase II Rules”), which set forth standards to implement the BTA requirements for cooling water intakes at existing facilities. The rules were challenged by several environmental groups and in 2007 were struck down by the U.S. Court of Appeals for the 2
nd
Circuit in
Riverkeeper, Inc. v. EPA.
The Court’s decision remanded several provisions of the rules to the EPA for further rulemaking. Several parties sought review of the decision before the U.S. Supreme Court. In April 2009, the U.S. Supreme Court ruled that the EPA permissibly relied on cost-benefit analysis in setting the national BTA performance standard and in providing for cost-benefit variances from those standards as part of the Phase II Rules.
In July 2007, following remand of the rules by the U.S. Court of Appeals, the EPA suspended its Phase II Rules and advised that permit requirements for cooling water intake structures at existing facilities should once more be established on a case-by-case best professional judgment basis until replacement rules are issued. Under a settlement agreement, the EPA will issue proposed cooling water intake structure rules for existing facilities in March 2011 and finalize the rules in July 2012. The scope of requirements, timing for compliance and the compliance methodologies that will ultimately be allowed by future rulemaking may become more restrictive, potentially resulting in significantly increased costs.
The environmental groups that participate in our NPDES and SPDES permit proceedings generally argue that only closed cycle cooling meets the BTA requirement. The issuance and renewal of NPDES or SPDES permits for three of our power generation facilities (Danskammer, Roseton and Moss Landing) have been challenged on this basis. The Danskammer SPDES permit, which was renewed and issued in June 2006, does not require installation of a closed cycle cooling system; however, it does require aquatic organism mortality reductions resulting from NYSDEC’s determination of BTA requirements under its regulations. All appeals of this permit have been exhausted. Two permit challenges are still pending.
|
|
●
|
Roseton SPDES Permit — In April 2005, the NYSDEC issued a Draft SPDES Permit renewal for the Roseton plant. The permit is opposed by environmental groups challenging the BTA determination. In October 2006, various holdings in the administrative law judge’s ruling admitting the environmental group petitioners to party status and setting forth the issues to be adjudicated in the permit renewal hearing were appealed to the Commissioner of NYSDEC by the petitioners, NYSDEC staff and us. The permit renewal hearing will be scheduled after the Commissioner rules on those appeals. We believe that the petitioners’ claims lack merit and we plan to oppose those claims vigorously.
|
21
|
|
●
|
Moss Landing NPDES Permit — The California Regional Water Quality Control Board (“Water Board”) issued an NPDES permit for the Moss Landing power generating facility in 2000 that did not require closed cycle cooling. A local environmental group challenged the BTA determination of the permit. The Water Board’s decision was affirmed by the Superior Court in 2004 and by the Court of Appeals in 2007. The Supreme Court of California granted review in March 2008. The petitioner’s brief was filed in December 2009. We filed a motion to dismiss and our responsive brief in March 2010. The petitioner’s reply brief was filed in May 2010. Our motion to dismiss was denied in June 2010. In July 2010, the California Energy Commission filed an application for leave to file a brief in support of our argument challenging the jurisdiction of the Superior Court. In September 2010, four air quality control districts filed an application for leave to file a brief in support of jurisdiction of the Superior Court. We believe that petitioner’s claims lack merit and we plan to continue to oppose those claims vigorously.
|
Due to the nature of these claims, an adverse result in either of these proceedings could have a material effect on our financial condition, results of operations and cash flows; however, given the numerous variables and factors involved in calculating the potential costs associated with installing a closed cycle cooling system, any decision to install such a system at any of our facilities would be made on a case-by-case basis considering all relevant factors at such time. If capital expenditures related to cooling water systems become great enough to render the operation of the plant uneconomical, we could, at our option, and subject to any applicable financing agreements or other obligations to make payments as required under applicable leases, reduce operations or cease to operate that facility and forego the capital expenditures.
California Water Intake Policy.
The California State Water Board adopted its Statewide Water Quality Control Policy on the Use of Coastal and Estuarine Waters for Power Plant Cooling (the “Policy”) at its meeting on May 4, 2010, introducing and adopting several amendments making it more stringent than the proposed draft Policy. The approved Policy requires that existing power plants: (i) reduce their water intake flow rate to a level commensurate with that which can be achieved by a closed cycle cooling system; or (ii) if it is not feasible to reduce the water intake flow rate to this level, reduce impingement mortality and entrainment to a level comparable to that achieved by such a reduced water intake flow rate using operational or structural controls, or both. The Policy became effective October 1, 2010. Compliance with the Policy would be required at our Morro Bay power generation facility by December 31, 2015 and at our Moss Landing power generation facility by December 31, 2017. On October 27, 2010, Dynegy Morro Bay, LLC and Dynegy Moss Landing, LLC joined with other California power plant owners in filing a lawsuit in the Sacramento County Superior Court challenging the Policy.
On September 29, 2010, the State Water Board proposed to amend the Policy to allow an owner or operator of a power plant with previously installed combined-cycle power generating units to continue to use once-through cooling at combined-cycle units until the unit reaches the end of its useful life under certain circumstances. A hearing to receive comment and to take action on the proposed amendment was held on December 14, 2010; however, the State Water Board declined to approve the amendment. We are continuing to review the potential impact of the Policy on our affected power generation facilities and our compliance options.
It may not be possible to meet the requirements of the Policy in its final form without installing closed cycle cooling systems. Given the numerous variables and factors involved in calculating the potential costs of closed- cycle cooling systems, any decision to install such a system would be made on a case-by-case basis considering all relevant factors at the time. If capital expenditure requirements related to cooling water systems become great enough to render the continued operation of a particular plant uneconomical, we could at our option, and subject to any applicable financing agreements and other obligations, reduce operations or cease to operate the plant and forego such capital expenditures.
New York Water Intake Policy.
On March 4, 2010, the NYSDEC issued a draft policy (the “NYSDEC Policy”) on “BTA for Cooling Water Intake Structures.” The NYSDEC Policy, which was subject to comment until July 8, 2010, would establish closed cycle cooling or its equivalent as the minimum performance goal for existing power plants. If NYSDEC determines that closed cycle cooling is not available for a facility, the NYSDEC Policy would establish a performance goal of 90 percent or greater reduction in impingement mortality and entrainment from that which could be achieved by closed cycle cooling. The NYSDEC Policy would exempt certain power generation facilities that operate at very low capacity. We are continuing to review the potential impact of the NYSDEC Policy, if adopted, on our subject power generation facilities.
Given the numerous variables and factors involved in calculating the potential costs associated with closed cycle cooling, any decision to install such a system at any of our facilities, should they be required, would be made on a case-by-case basis considering all relevant factors at such time. If capital expenditures related to cooling water systems become great enough to render the operation of the plant uneconomical, we could, at our option, and subject to any applicable financing agreements or other obligations, reduce operations or cease to operate such facility and forego these capital expenditures.
The requirements applicable to water quality are expected to increase in the future. A number of efforts are under way within the EPA to evaluate water quality criteria for parameters associated with the by-products of fossil fuel combustion. These parameters relate primarily to arsenic, mercury and selenium. In addition, under a proposed consent decree, the EPA would be required to propose revisions to the Effluent Guidelines for steam electric units by July 23, 2012 and to take final action on the proposal by January 31, 2014. Significant changes in these requirements could impact discharge limits and could require us to spend significant environmental capital to install additional water treatment equipment at our facilities.
Coal Combustion Residuals
The combustion of coal to generate electric power creates large quantities of ash that are managed at power generation facilities in dry form in landfills and in liquid or slurry form in surface impoundments. Each of our coal-fired plants has at least one CCR management unit. At present, CCR management is regulated by the states as solid waste. The EPA has considered whether CCR should be regulated as a hazardous waste on two separate occasions, including most recently in 2000, and both times has declined to do so. The December 2008 failure of a CCR surface impoundment dike at the Tennessee Valley Authority’s Kingston Plant in Tennessee accompanied by a very large release of ash slurry has resulted in renewed scrutiny of CCR management.
In response to the Kingston ash slurry release, the EPA initiated an investigation of the structural integrity of certain CCR surface impoundment dams including those at our GEN-MW facilities. We responded to EPA requests for information, and our surface impoundment dams that the EPA has assessed to date were found to be in fair to satisfactory condition.
In addition, on June 21, 2010, the EPA proposed two alternative rules under RCRA for federal regulation of the management and disposal of CCR from electric utilities and independent power producers. One proposal would regulate CCR as a special waste under RCRA subtitle C rules when those wastes are destined for disposal in a landfill or surface impoundment. The subtitle C proposal would subject persons who generate, transport, treat, store or dispose of such CCR to many of the existing RCRA regulations applicable to hazardous waste. While certain types of beneficial use of CCR would be exempt from regulation under the subtitle C proposal, the impact of subtitle C regulation on the continued viability of beneficial use is debated. Regulation under subtitle C would effectively phase out the use of ash ponds for disposal of CCR.
The second alternative proposal would regulate CCR disposed in landfills or surface impoundments as a solid waste under subtitle D of RCRA. The subtitle D proposal would establish national criteria for disposal of CCR in landfills and surface impoundments, requiring new units to install composite liners. The subtitle D proposal might also require existing surface impoundments without liners to close or be retrofitted with composite liners within five years.
Certain environmental organizations have advocated designation of CCR as a hazardous waste; however, many state environmental agencies have expressed strong opposition to such designation. EPA accepted comments on its proposals through November 19, 2010 and is expected to issue final regulations governing CCR management in 2012. The nature and scope of these requirements cannot be predicted with confidence at this time, but could have a material adverse effect on our financial condition, results of operations and cash flows. Further, public perceptions of new regulations regarding the reuse of coal ash may limit or eliminate the market that currently exists for coal ash reuse, which could have material adverse effects on our financial condition, results of operations and cash flows.
Remedial Laws
We are subject to environmental requirements relating to handling and disposal of toxic and hazardous materials, including provisions of CERCLA and RCRA and similar state laws. CERCLA imposes strict liability for contributions to contaminated sites resulting from the release of “hazardous substances” into the environment. Those with potential liabilities include the current or previous owner and operator of a facility and companies that disposed, or arranged for disposal, of hazardous substances found at a contaminated facility. CERCLA also authorizes the EPA and, in some cases, private parties to take actions in response to threats to public health or the environment and to seek recovery for costs of cleaning up hazardous substances that have been released and for damages to natural resources from responsible parties. Further, it is not uncommon for neighboring landowners and other affected parties to file claims for personal injury and property damage allegedly caused by hazardous substances released into the environment. CERCLA or RCRA could impose remedial obligations with respect to a variety of our facilities and operations.
As a result of their age, a number of our facilities contain quantities of asbestos-containing materials, lead-based paint and/or other regulated materials. Existing state and federal rules require the proper management and disposal of these materials. We have developed a management plan that includes proper maintenance of existing non-friable asbestos installations and removal and abatement of asbestos-containing materials where necessary because of maintenance, repairs, replacement or damage to the asbestos itself.
COMPETITION
Demand for power may be met by generation capacity based on several competing generation technologies, such as natural gas-fired, coal-fired or nuclear generation, as well as power generating facilities fueled by alternative energy sources, including hydro power, synthetic fuels, solar, wind, wood, geothermal, waste heat and solid waste sources. Our power generation businesses in the Midwest, West and Northeast compete with other non-utility generators, regulated utilities, unregulated subsidiaries of regulated utilities, other energy service companies and financial institutions. We believe that our ability to compete effectively in these businesses will be driven in large part by our ability to achieve and maintain a low cost of production, primarily by managing fuel costs and to provide reliable service to our customers. Our ability to compete effectively will also be impacted by various governmental and regulatory activities designed to reduce GHG emissions and to support the construction and operation of renewable-fueled power generation facilities. For example, regulatory requirements for load-serving entities to acquire a percentage of their energy from renewable-fueled facilities will potentially reduce the demand for energy from coal-fired facilities such as those we own and operate. We believe our primary competitors consist of at least 20 companies in the power generation business.
SIGNIFICANT CUSTOMERS
For the year ended December 31, 2010, approximately 30 percent, 15 percent and 13 percent of our consolidated revenues were derived from transactions with MISO, NYISO and PJM, respectively. For the year ended December 31, 2009, approximately 19 percent, 12 percent and 11 percent of our consolidated revenues were derived from transactions with MISO, NYISO and PJM, respectively. For the year ended December 31, 2008, approximately 25 percent and 11 percent of our consolidated revenues were derived from transactions with MISO and NYISO, respectively. No other customer accounted for more than 10 percent of our consolidated revenues during 2010, 2009 or 2008.
EMPLOYEES
At December 31, 2010, we had approximately 419 employees at our corporate headquarters and approximately 1,235 employees at our facilities, including field-based administrative employees. In February 2011, we reduced our workforce by approximately 135 positions as part of our cost savings programs. As of March 3, 2011, we had approximately 334 employees at our corporate headquarters and approximately 1,185 employees at our facilities. Approximately 748 employees at Dynegy-operated facilities are subject to collective bargaining agreements with various unions. We believe relations with our employees are satisfactory.
FORWARD-LOOKING STATEMENTS
This Form 10-K includes statements reflecting assumptions, expectations, projections, intentions or beliefs about future events that are intended as “forward-looking statements.” All statements included or incorporated by reference in this annual report, other than statements of historical fact, that address activities, events or developments that we or our management expect, believe or anticipate will or may occur in the future are forward-looking statements. These statements represent our reasonable judgment on the future based on various factors and using numerous assumptions and are subject to known and unknown risks, uncertainties and other factors that could cause our actual results and financial position to differ materially from those contemplated by the statements. You can identify these statements by the fact that they do not relate strictly to historical or current facts. They use words such as “anticipate,” “estimate,” “project,” “forecast,” “plan,” “may,” “will”, “should”, “expect” and other words of similar meaning. In particular, these include, but are not limited to, statements relating to the following:
|
|
●
|
beliefs and assumptions regarding our ability to continue as a going concern;
|
|
|
●
|
the impact of the turnover in our executive team and Dynegy’s Board of Directors on our ability to execute our business plan;
|
|
|
●
|
beliefs and assumptions relating to our liquidity, available borrowing capacity and capital resources generally, including the extent to which such liquidity could be affected by poor economic and financial market conditions or new regulations and any resulting impacts on financial institutions and other current and potential counterparties;
|
|
|
●
|
the outcome of any legal proceedings that may be instituted against Dynegy and/or others relating to the Blackstone Merger Agreement and Icahn Merger Agreement;
|
|
|
●
|
diversion of management’s attention from ongoing business concerns;
|
|
|
●
|
limitations on our ability to utilize Dynegy’s previously incurred federal net operating losses or alternative minimum tax credits;
|
|
|
●
|
the amount of the costs, fees, expenses, and other charges related to the Blackstone Merger Agreement and the Icahn Merger Agreement;
|
|
|
●
|
the timing and anticipated benefits to be achieved through our company-wide cost savings programs;
|
|
|
●
|
expectations regarding environmental matters, including costs of compliance, availability and adequacy of emission credits, and the impact of ongoing proceedings and potential regulations or changes to current regulations, including those relating to climate change, air emissions, cooling water intake structures, coal combustion byproducts, and other laws and regulations to which we are, or could become, subject;
|
|
|
●
|
beliefs, assumptions and projections regarding the overall economy, demand for power, generation volumes and commodity pricing , including natural gas prices and the impact on such prices from shale gas proliferation and the timing of a recovery in natural gas prices, if any;
|
|
|
●
|
sufficiency of, access to and costs associated with coal, fuel oil and natural gas inventories and transportation thereof;
|
|
|
●
|
beliefs and assumptions about market competition, generation capacity and regional supply and demand characteristics of the wholesale power generation market, including the anticipation of higher market pricing over the longer term;
|
|
|
●
|
the possibility of further consolidation in the power generation industry and the impact of any such activity on Dynegy;
|
|
|
●
|
beliefs and assumptions regarding our ability to enhance or protect long-term value for stockholders;
|
|
|
●
|
the effectiveness of our strategies to capture opportunities presented by changes in commodity prices and to manage our exposure to energy price volatility;
|
|
|
●
|
beliefs and assumptions about weather and general economic conditions;
|
|
|
●
|
projected operating or financial results, including anticipated cash flows from operations, revenues and profitability;
|
|
|
●
|
expectations regarding our revolver capacity, credit facility compliance, financial covenants, collateral demands, capital expenditures, interest expense and other payments;
|
|
|
●
|
beliefs or expectations regarding the potential amendment or refinancing of our Credit Facility, or the timing thereof;
|
|
|
●
|
our focus on safety and our ability to efficiently operate our assets so as to capture revenue generating opportunities and operating margins;
|
|
|
●
|
beliefs about the outcome of legal, regulatory, administrative and legislative matters; and
|
|
|
●
|
expectations regarding performance standards and estimates regarding capital and maintenance expenditures, including the Midwest Consent Decree and its associated costs and performance standards.
|
Any or all of our forward-looking statements may turn out to be wrong. They can be affected by inaccurate assumptions or by known or unknown risks, uncertainties and other factors, many of which are beyond our control, including those set forth below.
FACTORS THAT MAY AFFECT FUTURE RESULTS
Risks Related to Our Financial Structure, Level of Indebtedness and Access to Capital Markets
We have received audit reports on our consolidated financial statements that express uncertainty about our ability to continue as a going concern.
Our independent registered public accounting firm has included an explanatory paragraph in their reports on our December 31, 2010, 2009 and 2008 consolidated financial statements regarding doubt as to our ability to continue as a going concern. This may have a negative impact on the trading price of Dynegy's common stock and may make it more difficult to amend or replace our current Credit Facility, or to seek additional sources of liquidity.
We have significant debt that could negatively impact our business.
We have and will continue to have a significant amount of debt outstanding. As of December 31, 2010, we had total consolidated debt of approximately $4.8 billion (including debt outstanding under our Credit Facility). Our significant level of debt could:
|
|
●
|
make it difficult to satisfy our financial obligations, including debt service requirements;
|
|
|
●
|
limit our ability to obtain additional financing to operate our business;
|
|
|
●
|
limit our financial flexibility in planning for and reacting to business and industry changes;
|
|
|
●
|
impact the evaluation of our creditworthiness by counterparties to commercial agreements and affect their willingness to transact with us and/or the level of collateral we are required to post under such agreements;
|
|
|
●
|
place us at a competitive disadvantage compared to less leveraged companies;
|
|
|
●
|
increase our vulnerability to general adverse economic and industry conditions, including changes in interest rates and volatility in commodity prices; and
|
|
|
●
|
require us to dedicate a substantial portion of our cash flows to principal and interest payments on our debt, thereby reducing the availability of our cash flow for other purposes including our operations, capital expenditures and future business opportunities.
|
Furthermore, we may incur or assume additional debt in the future. If new debt is added to our current debt levels and those of our subsidiaries, the related risks that we and they face could increase significantly.
Our financing agreements governing our debt obligations require us to satisfy specific financial covenants.
Using the latest available forward commodity price curves and considering our current derivative contracts, we project that it is likely that we will not be able to comply with our EBITDA to Consolidated Interest Expense covenant, particularly in the third and fourth quarters of 2011.
Our failure to comply with the financial covenants
w
ould have a material adverse impact on our business, financial condition, results of operations and cash flows
. If we are unable to successfully execute our plan to amend or replace our Credit Facility or otherwise obtain additional sources of liquidity, it may be necessary for us to seek protection from creditors under Chapter 11 of the U.S. Bankruptcy Code, or an involuntary petition for bankruptcy may be filed against us.
Our financing agreements, including the Credit Facility, require us to meet specific financial covenants both as a matter of course and as a precondition to the incurrence of additional debt and to the making of restricted payments or asset sales, among other things. Our obligations relating to ongoing financial covenants include the maintenance of specified financial ratios regarding Secured Debt to EBITDA and EBITDA to Consolidated Interest Expense (as each such term is defined in the Credit Facility) (together, the “Maintenance Covenants”). The financial covenants set forth as a condition to the events described above include the demonstration, on a pro forma basis, of a specified ratio of Total Indebtedness to EBITDA (as each such term is defined in the Credit Facility). Each of these three ratios becomes more restrictive over the course of 2011 and into 2012.
As of December 31, 2010, we were in compliance with the Maintenance Covenants. Using the latest available forward commodity price curves and considering our current derivative contracts, we project that it is likely that we will not be able to comply with our EBITDA to Consolidated Interest Expense covenant, as currently set forth in our Credit Facility, particularly in the third and fourth quarters of 2011, which could result in an event of default causing our indebtedness thereunder (and any other indebtedness to the extent linked to it by reason of cross-default or cross-acceleration provisions) to potentially become immediately due and payable. If we are unable to cure or obtain a waiver for any such default, or are unable to obtain replacement financing or otherwise pay off such amounts, and our lenders accelerate the payment of such indebtedness, our lenders would be entitled to foreclose on, and acquire control of substantially all of our assets, which would have a material adverse effect on our business, financial condition, results of operations and cash flows.
In light of our likely non-compliance, we are attempting to amend or replace our existing Credit Facility. If we are able to amend our Credit Facility or enter into a new facility, we expect that capacity of any such facility to be less than the current capacity of $1.8 billion and to be at a higher cost, which reduced capacity and increased costs could have a material adverse effect on our ability to successfully run our business. We may also seek additional sources of liquidity in an effort to secure sufficient cash to meet our operating needs. These additional sources of liquidity could include asset sales, public or private issuances of debt, equity or equity-linked securities, debt for equity swaps, or any combination of these. However, we cannot provide any assurances that we will be successful in accomplishing any of these plans. If we are unable to successfully execute our plan to amend or replace our Credit Facility or otherwise obtain additional sources of liquidity, it may be necessary for us to seek protection from creditors under Chapter 11 of the U.S. Bankruptcy Code, or an involuntary petition for bankruptcy may be filed against us.
An event of loss and certain other events relating to our Dynegy Northeast Generation facilities could trigger a substantial obligation that would be difficult for us to satisfy.
We acquired the DNE power generating facilities in January 2001 for $950 million. In May 2001, we entered into an asset-backed sale-leaseback transaction relating to these facilities to provide us with long-term acquisition financing. In this transaction, we sold four of the six generating units comprising these facilities for approximately $920 million to Danskammer OL LLC and Roseton OL LLC, and we concurrently agreed to lease them back from these entities. Obligations under these leases are guaranteed by DHI. We have no option to purchase the leased facilities at Roseton or Danskammer at the end of their respective lease terms, which end in 2035 and 2031, respectively. If one or more of the leases were to be terminated prior to the end of its term because of an event of loss (such as substantial damage to a facility or a condemnation or similar governmental taking or action), because it becomes illegal for us to comply with the lease, or because the facility becomes economically or technologically obsolete, we would be required to make a termination payment in an amount sufficient to compensate the lessor for termination of the lease, including redeeming the pass-through trust certificates related to the unit or facility for which the lease is terminated plus, in the case of an obsolescence termination (other than as a result of a change in law or the requirement by a governmental entity of significant capital improvements), a make whole premium for the remaining term of the pass through certificates. As of December 31, 2010, the termination payment would be approximately $816 million and the make whole premium would be approximately $109 million for all of our DNE facilities. It could be difficult for us to raise sufficient funds to make this termination payment if a termination of this type were to occur with respect to the DNE facilities, resulting in a material adverse effect on our financial condition, results of operations and cash flows.
Our access to the capital markets may be limited.
As previously described, we will require additional capital in the near-term. Because of our non-investment grade credit rating, the going concern emphasis paragraph in our most recent audit report, the recent changes in senior management and Dynegy’s Board of Directors, and/or general conditions in the financial and credit markets, our access to the capital markets may be limited. Moreover, the urgency of a capital-raising transaction may require us to pursue additional capital at an inopportune time. Our ability to obtain capital and the costs of such capital are dependent on numerous factors, including:
|
|
●
|
covenants in our existing debt and credit agreements;
|
|
|
●
|
investor confidence in us and the regional wholesale power markets;
|
|
|
●
|
our financial performance and the financial performance of our subsidiaries;
|
|
|
●
|
our levels of debt;
|
|
|
●
|
our requirements for posting collateral under various commercial agreements;
|
|
|
●
|
our credit ratings;
|
|
|
●
|
our cash flow;
|
|
|
●
|
our long-term business prospects; and
|
|
|
●
|
general economic and capital market conditions, including the timing and magnitude of any market recovery.
|
We may not be successful in obtaining additional capital for these or other reasons. An inability to access capital may limit our ability to meet our operating needs and, as a result, may have a material adverse effect on our financial condition, results of operations and cash flows.
Our non-investment grade status may adversely impact our operations, increase our liquidity requirements and increase the cost of refinancing opportunities. We may not have adequate liquidity to post required amounts of additional collateral.
Our credit ratings are currently below investment grade, and on March 1, 2011, Standard & Poor's downgraded our corporate family ratings to "CCC" from "B-". We cannot assure you that our credit ratings will improve, or that they will not decline, in the future. Our credit ratings may affect the evaluation of our creditworthiness by trading counterparties and lenders, which could put us at a disadvantage to competitors with higher or investment grade ratings.
In carrying out our commercial business strategy, our current non-investment grade credit ratings have resulted and will likely continue to result in requirements that we either prepay obligations or post significant amounts of collateral to support our business. Various commodity trading counterparties may be unwilling to transact with us or may make collateral demands that reflect our non-investment grade credit ratings, the counterparties’ views of our creditworthiness, as well as changes in commodity prices. We use a portion of our capital resources, in the form of cash, short-term investments, lien capacity, and letters of credit, to satisfy these counterparty collateral demands. Our commodity agreements are tied to market pricing and may require us to post additional collateral under certain circumstances. If market conditions change such that counterparties are entitled to additional collateral, our liquidity could be strained and may have a material adverse effect on our financial condition, results of operations and cash flows. Factors that could trigger increased demands for collateral include changes in our credit rating or liquidity and changes in commodity prices for power and fuel, among others. In connection with the most recent downgrade by Standard & Poor's, certain of our counterparties have requested collateral support. Other counterparties may require further collateral support in the future.
Additionally, our non-investment grade credit ratings may limit our ability to obtain additional sources of liquidity, refinance our debt obligations or access the capital markets at the lower borrowing costs that would presumably be available to competitors with higher or investment grade ratings. Should our ratings continue at their current levels, or should our ratings be further downgraded, we would expect these negative effects to continue and, in the case of a downgrade, become more pronounced.
We conduct virtually all of our operations through our subsidiaries and may be limited in our ability to access funds from these subsidiaries to service our debt.
We conduct virtually all of our operations through our subsidiaries and, therefore, depend upon dividends and other intercompany transfers of funds from our subsidiaries to meet our debt service and other obligations. In addition, the ability of our subsidiaries to pay dividends and make other payments to us may be restricted by, among other things, applicable corporate and other laws, potentially adverse tax consequences and agreements of our subsidiaries. If we are unable to access the cash flow of our subsidiaries, we may have difficulty meeting our debt obligations.
If we are unable to successfully execute our plans to amend or replace our Credit Facility or otherwise obtain alternative sources of liquidity, we may seek protection pursuant to a voluntary bankruptcy filing under Chapter 11 of the U.S. Bankruptcy Code, or an involuntary petition for bankruptcy may be filed against us.
As described in Item 7—Management’s Discussion and Analysis of Financial Condition and Results of Operations—Liquidity and Capital Resources, using the latest available forward commodity price curves and considering our current derivative contracts, we project that it is likely that we will not be able to comply with the covenant regarding the EBITDA to Consolidated Interest Expense ratio contained in our Credit Facility, particularly in the third and fourth quarters 2011, which could result in an event of default causing our indebtedness thereunder (and any other indebtedness to the extent linked to it by reason of cross-default or cross-acceleration provisions) to potentially become immediately due and payable. In light of our likely non-compliance, we are attempting to amend or replace our existing Credit Facility. We may also seek additional sources of liquidity in an effort to secure sufficient cash to meet our operating needs. These additional sources of liquidity could include asset sales, public or private issuances of debt, equity or equity-linked securities, debt for equity swaps, or any combination of these. However, we cannot provide any assurances that we will be successful in accomplishing any of these plans. If we are unsuccessful, we may consider or pursue various forms of negotiated restructurings of our debt obligations and/or asset sales under court supervision pursuant to a voluntary bankruptcy filing under Chapter 11 of the U.S. Bankruptcy Code. In addition, under certain circumstances our creditors may file an involuntary petition for bankruptcy against us.
If we file for bankruptcy protection, our business and operations will be subject to certain risks.
A bankruptcy filing by or against Dynegy, DHI and/or certain of our subsidiaries (each referred to as a “filer”) would subject our business and operations to various risks, including but not limited to, the following:
|
|
●
|
A bankruptcy filing by or against a filer may adversely affect our business prospects, including our ability to continue to obtain and maintain the contracts necessary to operate our business on competitive terms;
|
|
|
●
|
We may be unable to retain and motivate key executives and employees through the process of reorganization, and we may have difficulty attracting new employees;
|
|
|
●
|
There can be no assurance as to our ability to maintain or obtain sufficient financing sources for operations or to fund any reorganization plan and meet future obligations;
|
|
|
●
|
There can be no assurance that we will be able to successfully develop, prosecute, confirm and consummate one or more plans of reorganization that are acceptable to the bankruptcy court and our creditors, equity holders and other parties in interest;
|
|
|
●
|
Our ability to use our federal NOLs and AMT credits, which totaled $222 million and $271 million, respectively, at December 31, 2010 could be limited or modified as a result of bankruptcy proceedings; and
|
|
|
●
|
The value of Dynegy’s common stock could be reduced to zero as result of a bankruptcy filing.
|
Risks Related to the Operation of Our Business
The recent resignations of certain members of our executive team and the decision of Dynegy's board of directors to not stand for reelection at Dynegy's upcoming annual meeting could have a material adverse impact on our business, financial condition and results of operations.
On February 21, 2011, we announced that Bruce A. Williamson, the Chairman of Dynegy’s Board of Directors and our President and Chief Executive Officer, and Holli C. Nichols, our Executive Vice President and Chief Financial Officer, were resigning from their executive positions effective March 11, 2011. Mr. Williamson resigned as a director and Chairman effective February 21, 2011. Also, on February 21, 2011, Dynegy’s then-remaining directors each informed Dynegy that he or she does not currently intend to stand for reelection as a director of Dynegy at Dynegy’s upcoming annual meeting of stockholders. The loss of these executives and directors and their skills, experience and industry knowledge could have a material adverse impact on our business, financial condition and results of operations. Furthermore, our inability to attract, motivate and retain other key employees, including new senior executives, and to replace the directors that will not stand for reelection at the annual meeting with qualified and knowledgeable directors, could have a negative effect on our business, financial condition, results of operations and cash flows.
Because wholesale power prices are subject to significant volatility and because many of our power generation facilities operate without long-term power sales agreements, our revenues and profitability are subject to wide fluctuations.
Because we largely sell electric energy, capacity and ancillary services into the wholesale energy spot market or into other power markets on a term basis, we are not guaranteed any rate of return on our capital investments. Rather, our financial condition, results of operations and cash flows will depend, in large part, upon prevailing market prices for power and the fuel to generate such power. Wholesale power markets are subject to significant price fluctuations over relatively short periods of time and can be unpredictable. Such factors that may materially impact the power markets and our financial results include:
|
|
●
|
economic conditions, the existence and effectiveness of demand-side management and conservation efforts and the extent to which they impact electricity demand;
|
|
|
●
|
regulatory constraints on pricing (current or future) or the functioning of the energy trading markets and energy trading generally;
|
|
|
●
|
the proliferation of advanced shale gas drilling increasing domestic natural gas supplies;
|
|
|
●
|
fuel price volatility; and
|
|
|
●
|
increased competition or price pressure driven by generation from renewable sources.
|
Many of our facilities operate as “merchant” facilities without long-term power sales agreements. Consequently, we cannot be sure that we will be able to sell any or all of the electric energy, capacity or ancillary services from those facilities at commercially attractive rates or that our facilities will be able to operate profitably. This could lead to decreased financial results as well as future impairments of our property, plant and equipment or to the retirement of certain of our facilities resulting in economic losses and liabilities.
Given the volatility of power commodity prices, to the extent we do not secure long-term power sales agreements for the output of our power generation facilities, our revenues and profitability will be subject to increased volatility, and our financial condition, results of operations and cash flows could be materially adversely affected. Further, declines in the market prices of natural gas and wholesale electricity have reduced the outlook for cash flow that can be expected to be generated by us in the next several years.
Our commercial strategy may not be executed as planned or may result in lost opportunities.
We seek to commercialize our assets through sales arrangements of various tenors. In doing so, we attempt to balance a desire for greater predictability of earnings and cash flows in the short- and medium-term with a belief that commodity prices will rise over the longer term, creating upside opportunities for those with unhedged generation volumes. Our ability to successfully execute this strategy is dependent on a number of factors, many of which are outside our control, including market liquidity, the availability of counterparties willing to transact with us or to transact with us at prices we believe are commercially acceptable, the availability of liquidity to post collateral in support of our derivative instruments, and the reliability of the people and systems comprising our commercial operations function. The availability of market liquidity and willing counterparties could be negatively impacted by poor economic and financial market conditions, including impacts on financial institutions and other current and potential counterparties as well as counterparties' views of our creditworthiness. If we are unable to transact in the short- and medium-term, our financial condition, results of operations and cash flows will be subject to significant uncertainty and volatility. Alternatively, significant contract execution for any such period may precede a run-up in commodity prices, resulting in lost upside opportunities and mark-to-market accounting losses causing significant variability in net income and other GAAP reported measures.
We are exposed to the risk of fuel and fuel transportation cost increases and interruptions in fuel supplies because some of our facilities do not have long-term coal, natural gas or fuel oil supply agreements.
We purchase the fuel requirements for many of our power generation facilities, primarily those that are natural gas-fired, under short-term contracts or on the spot market. As a result, we face the risks of supply interruptions and fuel price volatility, as fuel deliveries may not exactly match those required for energy sales, due in part to our need to pre-purchase fuel inventories for reliability and dispatch requirements.
Moreover, profitable operation of many of our coal-fired generation facilities is highly dependent on our ability to procure coal at prices we consider reasonable. Power generators in the Midwest and the Northeast have experienced significant pressures on available coal supplies that are either transportation or supply related. In the Midwest, our coal requirements are approximately 96 percent contracted in 2011 and 99 percent contracted for 2012. All forecast coal requirements are 96 percent priced through 2011 and 69 percent are priced for 2012. Forecasted coal requirements that are currently unpriced are subject to a price collar structure. Our Midwest coal transportation requirements are 100 percent contracted and priced through 2013. We have entered into term contracts for South American coal, which we use for our GEN-NE coal facility, and for PRB coal, which we use for our GEN-MW coal facilities. We cannot assure you that we will be able to renew our coal procurement and transportation contracts when they terminate on terms that are favorable to us or at all. Further, our and our suppliers’ ability to procure South American coal is subject to local political and other factors that could have a negative impact on our coal deliveries regardless of our contract situation. Permit limitations that restrict the sulfur content of coal used at our coal facilities limit our options for coal fuel supply, creating risk for us in terms of our ability to procure coal for periods and at prices we believe are firm and favorable.
Further, any changes in the costs of coal, fuel oil, natural gas or transportation rates and changes in the relationship between such costs and the market prices of power will affect our financial results. If we are unable to procure fuel for physical delivery at prices we consider favorable, our financial condition, results of operations and cash flows could be materially adversely affected.
Our costs of compliance with existing environmental requirements are significant, and costs of compliance with new environmental requirements or factors could materially adversely affect our financial condition, results of operations and cash flows.
Our business is subject to extensive and frequently changing environmental regulation by federal, state and local authorities. Such environmental regulation imposes, among other things, restrictions, liabilities and obligations in connection with the generation, handling, use, transportation, treatment, storage and disposal of hazardous substances and waste and in connection with spills, releases and emissions of various substances (including GHG) into the environment, and in connection with environmental impacts associated with cooling water intake structures. Existing environmental laws and regulations may be revised or reinterpreted, new laws and regulations may be adopted or may become applicable to us or our facilities, and litigation or enforcement proceedings could be commenced against us. Proposals being considered by federal and state authorities (including proposals regarding regulation of GHGs) could, if and when adopted or enacted, require us to make substantial capital and operating expenditures or consider retiring certain of our facilities. If any of these events occur, our financial condition, results of operations and cash flows could be materially adversely affected.
Many environmental laws require approvals or permits from governmental authorities before construction, modification or operation of a power generation facility may commence. Certain environmental permits must be renewed periodically in order for us to continue operating our facilities. The process of obtaining and renewing necessary permits can be lengthy and complex and can sometimes result in the establishment of permit conditions that make the project or activity for which the permit was sought unprofitable or otherwise unattractive. Even where permits are not required, compliance with environmental laws and regulations can require significant capital and operating expenditures. We are required to comply with numerous environmental laws and regulations, and to obtain numerous governmental permits when we construct, modify and operate our facilities. If there is a delay in obtaining any required environmental regulatory approvals or permits, if we fail to obtain any required approval or permit, or if we are unable to comply with the terms of such approvals or permits, the operation of our facilities may be interrupted or become subject to additional costs. Further, changed interpretations of existing regulations may subject historical maintenance, repair and replacement activities at our facilities to claims of noncompliance. As a result, our financial condition, results of operations and cash flows could be materially adversely affected. Certain of our facilities are also required to comply with the terms of consent decrees or other governmental orders.
With the continuing trend toward stricter environmental standards and more extensive regulatory and permitting requirements, our capital and operating environmental expenditures are likely to be substantial and may increase in the future.
Our business is subject to complex government regulation. Changes in these regulations or in their implementation may affect costs of operating our facilities or our ability to operate our facilities, or increase competition, any of which would negatively impact our results of operations.
We are subject to extensive federal, state and local laws and regulations governing the generation and sale of energy commodities in each of the jurisdictions in which we have operations. Compliance with these ever-changing laws and regulations requires expenses (including legal representation) and monitoring, capital and operating expenditures. Potential changes in laws and regulations that could have a material impact on our business include: re-regulation of the power industry in markets in which we conduct business; the introduction, or reintroduction, of rate caps or pricing constraints; increased credit standards, collateral costs or margin requirements, as well as reduced market liquidity, as a result of potential OTC market regulation; or a variation of these. Furthermore, these and other market-based rules and regulations are subject to change at any time, and we cannot predict what changes may occur in the future or how such changes might affect any facet of our business.
The costs and burdens associated with complying with the increased number of regulations may have a material adverse effect on us, if we fail to comply with the laws and regulations governing our business or if we fail to maintain or obtain advantageous regulatory authorizations and exemptions. Moreover, increased competition within the sector resulting from potential legislative changes, regulatory changes or other factors may create greater risks to the stability of our power generation earnings and cash flows generally.
Availability and cost of emission allowances could materially impact our costs of operations.
We are required to maintain, either through allocation or purchase, sufficient emission allowances to support our operations in the ordinary course of operating our power generation facilities. These allowances are used to meet our obligations imposed by various applicable environmental laws and the trend toward more stringent regulations (including regulations regarding GHG emissions) will likely require us to obtain new or additional emission allowances. If our operational needs require more than our allocated quantity of emission allowances, we may be forced to purchase such allowances on the open market, which could be costly. If we are unable to maintain sufficient emission allowances to match our operational needs, we may have to curtail our operations so as not to exceed our available emission allowances, or install costly new emissions controls. As we use the emissions allowances that we have purchased on the open market, costs associated with such purchases will be recognized as operating expense. If such allowances are available for purchase, but only at significantly higher prices, their purchase could materially increase our costs of operations in the affected markets and materially adversely affect our financial condition, results of operations and cash flows.
Competition in wholesale power markets, together with the age of certain of our generation facilities and an oversupply of power generation capacity in certain regional markets, may have a material adverse effect on our financial condition, results of operations and cash flows.
We have numerous competitors, and additional competitors may enter the industry. Our power generation business competes with other non-utility generators, regulated utilities, unregulated subsidiaries of regulated utilities, other energy service companies and financial institutions in the sale of electric energy, capacity and ancillary services, as well as in the procurement of fuel, transmission and transportation services. Moreover, aggregate demand for power may be met by generation capacity based on several competing technologies, as well as power generating facilities fueled by alternative or renewable energy sources, including hydroelectric power, synthetic fuels, solar, wind, wood, geothermal, waste heat and solid waste sources. Regulatory initiatives designed to enhance renewable generation could increase competition from these types of facilities. In addition, a buildup of new electric generation facilities in recent years has resulted in an oversupply of power generation capacity in certain regional markets we serve.
We also compete against other energy merchants on the basis of our relative operating skills, financial position and access to credit sources. Electric energy customers, wholesale energy suppliers and transporters often seek financial guarantees, credit support such as letters of credit, and other assurances that their energy contracts will be satisfied. Companies with which we compete may have greater resources in these areas. In addition, certain of our current facilities are relatively old. Newer plants owned by competitors will often be more efficient than some of our plants, which may put these plants at a competitive disadvantage. Over time, some of our plants may become unable to compete, because of the construction of new plants which could have a number of advantages including; more efficient equipment, newer technology that could result in fewer emissions, or more advantageous locations on the electric transmission system. Additionally, these competitors may be able to respond more quickly to new laws and regulations because of the newer technology utilized in their facilities or the additional resources derived from owning more efficient facilities. Taken as a whole, the potential disadvantages of our aging fleet could result in lower run-times or even early asset retirement.
Other factors may contribute to increased competition in wholesale power markets. New forms of capital and competitors have entered the industry in the last several years, including financial investors who perceive that asset values are at levels below their true replacement value. As a result, a number of generation facilities in the United States are now owned by lenders and investment companies. Furthermore, mergers and asset reallocations in the industry could create powerful new competitors. Under any scenario, we anticipate that we will face competition from numerous companies in the industry, some of which have superior capital structures.
Moreover, many companies in the regulated utility industry, with which the wholesale power industry is closely linked, are also restructuring or reviewing their strategies. Several of those companies have discontinued or are discontinuing their unregulated activities and seeking to divest or spin-off their unregulated subsidiaries. Some of those companies have had, or are attempting to have, their regulated subsidiaries acquire assets out of their or other companies’ unregulated subsidiaries. This may lead to increased competition between the regulated utilities and the unregulated power producers within certain markets. To the extent that competition increases, our financial condition, results of operations and cash flows may be materially adversely affected.
We do not own or control transmission facilities required to sell the wholesale power from our generation facilities. If the transmission service is inadequate, our ability to sell and deliver wholesale power may be materially adversely affected. Furthermore, these transmission facilities are operated by RTOs and ISOs, which are subject to changes in structure and operation and impose various pricing limitations. These changes and pricing limitations may affect our ability to deliver power to the market that would, in turn, adversely affect the profitability of our generation facilities.
We do not own or control the transmission facilities required to sell the wholesale power from our generation facilities. If the transmission service from these facilities is unavailable or disrupted, or if the transmission capacity infrastructure is inadequate, our ability to sell and deliver wholesale power may be materially adversely affected. RTOs and ISOs provide transmission services, administer transparent and competitive power markets and maintain system reliability. Many of these RTOs and ISOs operate in the real-time and day-ahead markets in which we sell energy. The RTOs and ISOs that oversee most of the wholesale power markets impose, and in the future may continue to impose, offer caps and other mechanisms to guard against the potential exercise of market power in these markets as well as price limitations. These types of price limitations and other regulatory mechanisms may adversely affect the profitability of our generation facilities that sell energy and capacity into the wholesale power markets. Problems or delays that may arise in the formation and operation of new or maturing RTOs and similar market structures, or changes in geographic scope, rules or market operations of existing RTOs, may also affect our ability to sell, the prices we receive or the cost to transmit power produced by our generating facilities. Rules governing the various regional power markets may also change from time to time, which could affect our costs or revenues. Additionally, if the transmission service from these facilities is unavailable or disrupted, or if the transmission capacity infrastructure is inadequate, our ability to sell and deliver wholesale power may be materially adversely affected. Furthermore, the rates for transmission capacity from these facilities are set by others and thus are subject to changes, some of which could be significant. As a result, our financial condition, results of operations and cash flows may be materially adversely affected.
Our financial condition, results of operations and cash flows would be adversely impacted by strikes or work stoppages by our unionized employees.
A majority of the employees at our facilities are subject to collective bargaining agreements with various unions. Additionally, unionization activities, including votes for union certification, could occur at our non-union generating facilities in our fleet. If union employees strike, participate in a work stoppage or slowdown or engage in other forms of labor strife or disruption, we could experience reduced power generation or outages if replacement labor is not procured. The ability to procure such replacement labor is uncertain. Strikes, work stoppages or an inability to negotiate future collective bargaining agreements on commercially reasonable terms could have a material adverse effect on our financial condition, results of operations and cash flows.
Our ability to comply with our Midwest Consent Decree may be materially adversely impacted by our future operating cash flows or unforeseen labor, material and equipment costs.
As a result of the Midwest Consent Decree, we are required to not operate certain of our most profitable power generating facilities after specified dates unless certain emission control equipment is installed. We have incurred significant costs in complying with the Midwest Consent Decree and anticipate incurring additional significant costs over the course of the next three years. Further, we are exposed to the risk of substantial price increases in the costs of materials, labor and equipment used in the construction of emission control equipment. We are further exposed to risk in that counterparties to the construction contracts may fail to perform, in which case we would be forced to enter into alternative arrangements at then-current market prices that may exceed our contractual prices and possibly cause delays to the project timelines. If the costs of these capital expenditures become great enough to render the operation of the facility uneconomical, we could, at our option, cease to operate the facility or facilities and forego these capital expenditures without incurring any further obligations under the Midwest Consent Decree. Further, our production may be affected if we fail to meet certain performance standards under the Midwest Consent Decree.
We may pursue dispositions or business combinations that could fail or present unanticipated problems for our business in the future, which would adversely affect our ability to realize the anticipated benefits of those transactions.
We may seek to enter into transactions that may include disposing of assets or combining with other businesses. We may not be able to identify suitable transaction opportunities or finance and complete any particular transaction successfully. Furthermore, transactions involve a number of risks and challenges, including:
|
|
●
|
diversion of our management’s attention;
|
|
|
●
|
the ability to obtain required regulatory and other approvals;
|
|
|
●
|
the need to integrate operations;
|
|
|
●
|
potential loss of key employees;
|
|
|
●
|
difficulty in evaluating the power assets, operating costs, infrastructure requirements, environmental and other liabilities and other factors beyond our control;
|
|
|
●
|
potential lack of operating experience in new geographic/power markets or with different fuel sources;
|
|
|
●
|
an increase in our expenses and working capital requirements; and
|
|
|
●
|
the possibility that we may be required to issue a substantial amount of additional equity or debt securities or assume additional debt in connection with any such transactions.
|
Any of these factors could adversely affect our ability to achieve anticipated levels of cash flows or realize synergies or other anticipated benefits from a strategic transaction. Furthermore, the market for transactions is highly competitive, and our capital resources are such that we may not be well positioned in the market to execute a transaction, which may adversely affect our ability to find transactions that fit our strategic objectives. Consistent with industry practice, we routinely engage in discussions with industry participants regarding potential transactions, large and small. We intend to continue to engage in strategic discussions and will need to respond to potential opportunities quickly and decisively. As a result, strategic transactions may occur at any time and may be significant in size relative to our assets and operations.
Issuances or acquisitions of Dynegy's common stock, or sales or dispositions of Dynegy's common stock by stockholders could inhibit Dynegy’s ability to use its federal net operating losses or alternative minimum tax credits to offset its future taxable income may be limited under Sections 382 and 383 of the Internal Revenue Code.
Dynegy’s ability to utilize previously incurred federal NOLs and AMT credits to offset future taxable income would be limited if it were to undergo an “ownership change” within the meaning of Section 382 of the Internal Revenue Code (the “Code”). In general, an ownership change occurs whenever the percentage of the stock of a corporation owned by “5-percent shareholders” (within the meaning of Section 382 of the Code) increases by more than 50 percentage points over the lowest percentage of the stock of such corporation owned by such “5-percent shareholders” at any time over the preceding three years. Under certain circumstances, issuances or acquisitions of Dynegy's common stock or sales or dispositions of Dynegy's common stock by stockholders could trigger an “ownership change,” and apart from the application of the provisions of our current Stockholder Protection Rights Agreement, we will have limited control over the timing of any such sales or dispositions of our common stock.
More specifically, depending on prevailing interest rates and our market value at the time of such future ownership change, an ownership change under Section 382 of the Code would establish an annual limitation which might prevent full utilization of the deferred tax assets attributable to our previously incurred federal NOLs and AMT credits against the total future taxable income of a given year. The recent stockholder activity increases the likelihood that previously incurred federal NOLs and AMT credits will become subject to the limitations set forth in Sections 382 and 383 of the Code.
The magnitude of such limitations and their effect on us are difficult to assess and depend in part on our value at the time of any such ownership change and prevailing interest rates. For accounting purposes, at December 31, 2010, Dynegy’s net operating loss deferred tax asset attributable to its previously incurred federal NOLs was approximately $222 million and its AMT credits were approximately $271 million.
Not applicable.
We have included descriptions of the location and general character of our principal physical operating properties by segment in “Item 1. Business” for further discussion, which is incorporated herein by reference. Substantially all of our assets, including the power generation facilities we own, are pledged as collateral to secure the repayment of, and our other obligations under, the Credit Facility. Please read Note 18—Debt for further discussion.
Our principal executive office located in Houston, Texas is held under a lease that expires in December 2017. We also lease additional offices or warehouses in the states of California, Colorado, Illinois, Indiana, New York, Pennsylvania and Texas.
Please read Note 22—Commitments and Contingencies—Legal Proceedings for a description of our material legal proceedings, which is incorporated herein by reference.
Dynegy
Dynegy’s common stock, $0.01 par value per share, is listed and traded on the New York Stock Exchange under the ticker symbol “DYN.” The number of stockholders of record of its common stock as of March 3, 2011, based upon records of registered holders maintained by its transfer agent, was
11,763
.
On May 21, 2010, Dynegy’s stockholders approved a reverse stock split of outstanding common stock at a reverse ratio of 1-for-5. This reverse stock split was effected on May 25, 2010. The following table sets forth, for the fiscal periods indicated, the high and low closing sales prices for Dynegy’s common stock on the NYSE after giving effect to this reverse stock split (including for share prices prior to May 25, 2010), as reported on the New York Stock Exchange Composite Tape.
Summary of Dynegy’s Common Stock Price
|
High
|
Low
|
|||||||
|
2011:
|
||||||||
|
First Quarter (through March 3, 2011)
|
$ | 6.29 | $ | 5.57 | ||||
|
2010:
|
||||||||
|
Fourth Quarter
|
$ | 5.89 | $ | 4.44 | ||||
|
Third Quarter
|
5.10 | 2.78 | ||||||
|
Second Quarter
|
6.80 | 3.85 | ||||||
|
First Quarter
|
9.95 | 6.10 | ||||||
|
2009:
|
||||||||
|
Fourth Quarter
|
$ | 13.15 | $ | 9.05 | ||||
|
Third Quarter
|
12.75 | 8.90 | ||||||
|
Second Quarter
|
12.35 | 7.25 | ||||||
|
First Quarter
|
13.45 | 5.20 | ||||||
During the fiscal years ended December 31, 2010 and 2009, Dynegy’s Board of Directors did not elect to pay a cash common stock dividend. Please read “Item 7. Management’s Discussion and Analysis of Financial Condition and Results of Operations—Liquidity and Capital Resources—Dividends on Dynegy Common Stock” for further discussion of its dividend policy and the impact of dividend restrictions contained in its financing agreements. Dynegy has not paid a dividend on any class of its common stock since 2002. Any decision to pay a dividend will be at the discretion of Dynegy’s Board of Directors, and subject to the terms of its then-outstanding indebtedness, but Dynegy does not expect to pay a dividend on its common stock in the foreseeable future. Please read Note 23—Capital Stock—Common Stock for further discussion.
Stockholder Protection Rights Agreement.
On November 22, 2010, Dynegy’s Board of Directors adopted a Stockholder Protection Rights Plan (as subsequently amended, the “Rights Plan”) and declared a dividend of one stock purchase right (collectively, the “Rights”) for each share of common stock held by stockholders of record as of the close of business on December 2, 2010.
Dynegy’s Board of Directors adopted this short-term, narrowly tailored Rights Plan to prevent any person from obtaining control or de facto control of Dynegy without offering a control premium to all Dynegy stockholders. The issuance of the Rights is not intended to prevent a sale of control of Dynegy that is determined by Dynegy’s Board of Directors to be fair, advisable and in the best interests of all Dynegy stockholders. The Rights Plan provides that, unless terminated earlier by Dynegy, the Rights will expire following Dynegy’s next annual meeting of stockholders after the filing of the Form 10-K for the fiscal year 2010, unless the Rights Plan is approved by Dynegy’s stockholders (in which case it will expire at the first subsequent annual meeting at which it is not approved by a stockholder vote).
Following distribution of the Rights, each Right will entitle its holder to purchase fractions of Participating Preferred Stock having economic and voting terms similar to those of one share of Dynegy’s common stock for an exercise price of $12.50 (subject to adjustment).
The Rights will be exercisable for shares of Dynegy common stock if Dynegy announces that a person or group has acquired 20 percent or more of Dynegy’s common stock or any person or group acquires more than 30 percent of Dynegy’s common stock. Under the Rights Plan, synthetic ownership of Dynegy’s common stock in the form of certain derivative securities counts towards the 20 percent and 30 percent ownership thresholds, if Dynegy’s Board of Directors determines that the owner of such derivative securities is seeking to use the existence of such securities for the purpose or effect of changing or influencing control of Dynegy.
The Rights Plan also exempts from its provisions all-cash, fully financed offers for all outstanding shares of Dynegy’s common stock that provide for a per share price in excess of $5.00 and meet certain other requirements. If the Rights become exercisable for Dynegy’s common stock, all Rights holders (other than the person or group triggering the Rights) will be entitled to purchase Dynegy’s common stock at a 50 percent discount. For example, if at the time the Rights become exercisable for Dynegy’s common stock the exercise price is still $12.50 and Dynegy’s common stock has a per share market value of $5, each Right would be exercisable for five shares of common stock ($25 of market value) at an exercise price of $12.50, (i.e., five shares of common stock at a 50 percent discount). Rights held by the person or group triggering the Rights will become void and will not be exercisable. If any person or group acquires between 10 percent and 50 percent of Dynegy’s common stock, Dynegy’s Board of Directors may, at its option, cause the exchange of one share of Dynegy common stock for each Right.
The distribution of the Rights is not taxable to stockholders. Until their distribution, the Rights will trade with Dynegy’s common stock. Dynegy’s Board of Directors may terminate the Rights Plan prior to the time the Rights are triggered. Please read Note 23—Capital Stock—Stockholder Protection Rights Agreement for further discussion.
Shareholder Agreements.
In November 2009, as part of the transactions with LS Power, Dynegy and LS Power terminated a then-existing shareholder agreement and entered into a second shareholder agreement (the “New Shareholder Agreement”) which, among other things, generally restricts LS Power from increasing its ownership for a specified period up to 30 months. The New Shareholder Agreement does not, however, include any of the special rights (such as Board rights, special approval rights or preemption rights) previously associated with LS Power’s ownership.
Stockholder Return Performance Presentation
.
The graph below compares the cumulative 5-year total return of holders of Dynegy’s common stock with the cumulative total returns of the S&P Midcap 400 index, and a customized peer group. The peer group includes: Calpine Corp., NRG Energy Inc. and GenOn Energy. The graph tracks the performance of a $100 investment in Dynegy’s common stock, the peer group, and the index (with the reinvestment of all dividends) from December 31, 2005 to December 31, 2010.
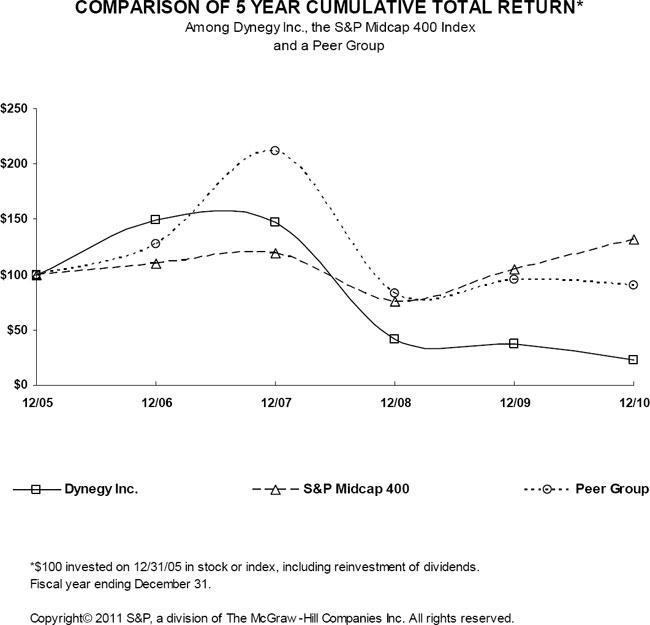
| 12/05 | 12/06 | 12/07 | 12/08 | 12/09 | 12/10 | |||||||||||||||||||
|
Dynegy Inc.
|
100.00 | 149.59 | 147.52 | 41.32 | 37.40 | 23.22 | ||||||||||||||||||
|
S&P Midcap 400
|
100.00 | 110.32 | 119.12 | 75.96 | 104.36 | 132.16 | ||||||||||||||||||
|
Peer Group
|
100.00 | 127.39 | 211.71 | 82.56 | 95.35 | 90.33 | ||||||||||||||||||
The stock price performance included in this graph is not necessarily indicative of future stock price performance.
The above stock price performance comparison and related discussion is not to be deemed incorporated by reference by any general statement incorporating by reference this Form 10-K into any filing under the Securities Act of 1933 or under the Securities Exchange Act of 1934, or otherwise, except to the extent that we specifically incorporate this stock price performance comparison and related discussion by reference, and is not otherwise deemed “filed” under the Acts.
Unregistered Sales of Equity Securities and Use of Proceeds.
When restricted stock awarded by Dynegy becomes taxable compensation to employees, shares
may be withheld to cover the employees’ withholding taxes. Information on Dynegy’s purchases of equity securities by means of such share withholdings during the quarter follows:
|
Period
|
(a)
Total
Number of
Shares
Purchased
|
(b)
Average
Price Paid
per Share
|
(c)
Total
Number of
Shares
Purchased as
Publicly
Announced
Plans or
Programs
|
(d)
Maximum
Number of
Shares that
May Yet Be
Purchased
Under the
Plans or
Programs
|
||||||||||||
|
October 1 to October 31, 2010
|
359 | $ | 4.82 | — | N/A | |||||||||||
|
November 1 to November 30, 2010
|
— | $ | — | — | N/A | |||||||||||
|
December 1 to December 31, 2010
|
— | $ | — | — | N/A | |||||||||||
|
Total
|
359 | $ | 4.82 | — | N/A | |||||||||||
These were the only repurchases of equity securities made by Dynegy during the three months ended December 31, 2010. Dynegy does not have a stock repurchase program.
DHI
All of DHI’s outstanding equity securities are held by its parent, Dynegy. There is no established trading market for such securities and they are not traded on any exchange.
Securities Authorized for Issuance Under Equity Compensation Plans
Please read Item 12. Security Ownership of Certain Beneficial Owners and Management and Related Stockholder Matters—Dynegy for information regarding securities authorized for issuance under our equity compensation plans.
The selected financial information presented below was derived from, and is qualified by, reference to our Consolidated Financial Statements, including the notes thereto, contained elsewhere herein. The selected financial information should be read in conjunction with the Consolidated Financial Statements and related notes and Item 7. Management’s Discussion and Analysis of Financial Condition and Results of Operations.
Dynegy’s Selected Financial Data
|
Year Ended December 31,
|
||||||||||||||||||||
|
2010
|
2009
|
2008
|
2007
|
2006
|
||||||||||||||||
|
(in millions, except per share data)
|
||||||||||||||||||||
|
Statement of Operations Data (1):
|
||||||||||||||||||||
|
Revenues
|
$ | 2,323 | $ | 2,468 | $ | 3,324 | $ | 2,918 | $ | 1,758 | ||||||||||
|
Depreciation and amortization expense
|
(392 | ) | (335 | ) | (346 | ) | (306 | ) | (208 | ) | ||||||||||
|
Goodwill impairment
|
— | (433 | ) | — | — | — | ||||||||||||||
|
Impairment and other charges, exclusive of goodwill impairment shown separately above
|
(148 | ) | (538 | ) | — | — | (9 | ) | ||||||||||||
|
General and administrative expenses
|
(163 | ) | (159 | ) | (157 | ) | (203 | ) | (196 | ) | ||||||||||
|
Operating income (loss)
|
(11 | ) | (834 | ) | 744 | 576 | 220 | |||||||||||||
|
Interest expense and debt extinguishment costs (2)
|
(363 | ) | (461 | ) | (427 | ) | (384 | ) | (631 | ) | ||||||||||
|
Income tax (expense) benefit
|
197 | 315 | (90 | ) | (140 | ) | 116 | |||||||||||||
|
Income (loss) from continuing operations
|
(235 | ) | (1,040 | ) | 188 | 105 | (242 | ) | ||||||||||||
|
Income (loss) from discontinued operations (3)
|
1 | (222 | ) | (17 | ) | 166 | (92 | ) | ||||||||||||
|
Cumulative effect of change in accounting principles
|
— | — | — | — | 1 | |||||||||||||||
|
Net income (loss)
|
$ | (234 | ) | $ | (1,262 | ) | $ | 171 | $ | 271 | $ | (333 | ) | |||||||
|
Net income (loss) attributable to Dynegy Inc. common stockholders
|
(234 | ) | (1,247 | ) | 174 | 264 | (342 | ) | ||||||||||||
|
Basic earnings (loss) per share from continuing operations attributable to Dynegy Inc. common stockholders
|
$ | (1.96 | ) | $ | (6.25 | ) | $ | 1.14 | $ | 1.10 | $ | (2.72 | ) | |||||||
|
Basic net income (loss) per share attributable to Dynegy Inc. common stockholders
|
(1.95 | ) | (7.60 | ) | 1.04 | 1.75 | (3.72 | ) | ||||||||||||
|
Diluted earnings (loss) per share from continuing operations attributable to Dynegy Inc. common stockholders
|
$ | (1.96 | ) | $ | (6.25 | ) | $ | 1.14 | $ | 1.10 | $ | (2.72 | ) | |||||||
|
Diluted net income (loss) per share attributable to Dynegy Inc. common stockholders
|
(1.95 | ) | (7.60 | ) | 1.04 | 1.75 | (3.72 | ) | ||||||||||||
|
Shares outstanding for basic EPS calculation
|
120 | 164 | 168 | 151 | 92 | |||||||||||||||
|
Shares outstanding for diluted EPS calculation
|
121 | 165 | 168 | 151 | 102 | |||||||||||||||
|
Cash dividends per common share
|
$ | — | $ | — | $ | — | $ | — | $ | — | ||||||||||
|
Cash Flow Data:
|
||||||||||||||||||||
|
Net cash provided by (used in) operating activities
|
$ | 423 | $ | 135 | $ | 319 | $ | 341 | $ | (194 | ) | |||||||||
|
Net cash provided by (used in) investing activities
|
(534 | ) | 251 | (102 | ) | (817 | ) | 358 | ||||||||||||
|
Net cash provided by (used in) financing activities
|
(69 | ) | (608 | ) | 148 | 433 | (1,342 | ) | ||||||||||||
|
Cash dividends or distributions to partners, net
|
— | — | — | — | (17 | ) | ||||||||||||||
|
Capital expenditures, acquisitions and investments
|
(531 | ) | (594 | ) | (640 | ) | (504 | ) | (163 | ) | ||||||||||
|
December 31,
|
||||||||||||||||||||
|
2010
|
2009
|
2008
|
2007
|
2006
|
||||||||||||||||
|
(in millions)
|
||||||||||||||||||||
|
Balance Sheet Data (4):
|
||||||||||||||||||||
|
Current assets
|
$ | 2,244 | $ | 2,038 | $ | 2,803 | $ | 1,663 | $ | 1,989 | ||||||||||
|
Current liabilities
|
1,565 | 1,847 | 1,702 | 999 | 1,166 | |||||||||||||||
|
Property and equipment, net
|
6,273 | 7,117 | 8,934 | 9,017 | 4,951 | |||||||||||||||
|
Total assets
|
10,013 | 10,953 | 14,213 | 13,221 | 7,537 | |||||||||||||||
|
Long-term debt (excluding current portion)
|
4,626 | 4,775 | 6,072 | 5,939 | 3,190 | |||||||||||||||
|
Notes payable and current portion of long-term debt
|
148 | 807 | 64 | 51 | 68 | |||||||||||||||
|
Capital leases not already included in long-term debt
|
— | 4 | 4 | 5 | 6 | |||||||||||||||
|
Total equity
|
2,746 | 2,979 | 4,485 | 4,529 | 2,267 | |||||||||||||||
|
(1)
|
The merger with LS Power (April 2, 2007) was accounted for in accordance with the purchase method of accounting and the results of operations attributable to the acquired business is included in our financial statements and operating statistics beginning on the acquisition’s effective date for accounting purposes.
|
|
(2)
|
Includes $249 million of debt conversion costs for the twelve months ended December 31, 2006.
|
|
(3)
|
Discontinued operations include the results of operations from the following businesses:
|
|
|
●
|
The Arlington Valley and Griffith power generation facilities (collectively, the Arizona power generation facilities”) (sold fourth quarter 2009);
|
|
|
●
|
Bluegrass power generating facility (sold fourth quarter 2009);
|
|
|
●
|
Heard County power generating facility (sold second quarter 2009);
|
|
|
●
|
Calcasieu power generating facility (sold first quarter 2008); and
|
|
|
●
|
CoGen Lyondell power generating facility (sold third quarter 2007).
|
|
(4)
|
The merger with LS Power (April 2, 2007) was accounted for under the purchase method of accounting. Accordingly, the purchase price was allocated to the assets acquired and liabilities assumed based on their estimated fair values as of the effective date of the transaction.
|
Dynegy Holdings’ Selected Financial Data
|
Year Ended December 31,
|
||||||||||||||||||||
|
2010
|
2009
|
2008
|
2007
|
2006
|
||||||||||||||||
|
(in millions, except per share data)
|
||||||||||||||||||||
|
Statement of Operations Data (1):
|
||||||||||||||||||||
|
Revenues
|
$ | 2,323 | $ | 2,468 | $ | 3,324 | $ | 2,918 | $ | 1,758 | ||||||||||
|
Depreciation and amortization expense
|
(392 | ) | (335 | ) | (346 | ) | (306 | ) | (208 | ) | ||||||||||
|
Goodwill impairment
|
— | (433 | ) | — | — | — | ||||||||||||||
|
Impairment and other charges, exclusive of goodwill impairment shown separately above
|
(148 | ) | (538 | ) | — | — | (9 | ) | ||||||||||||
|
General and administrative expenses
|
(158 | ) | (159 | ) | (157 | ) | (184 | ) | (193 | ) | ||||||||||
|
Operating income (loss)
|
(6 | ) | (836 | ) | 744 | 595 | 223 | |||||||||||||
|
Interest expense and debt extinguishment costs (2)
|
(363 | ) | (461 | ) | (427 | ) | (384 | ) | (579 | ) | ||||||||||
|
Income tax (expense) benefit
|
184 | 313 | (138 | ) | (105 | ) | 89 | |||||||||||||
|
Income (loss) from continuing operations
|
(243 | ) | (1,046 | ) | 222 | 165 | (217 | ) | ||||||||||||
|
Income (loss) from discontinued operations (3)
|
1 | (222 | ) | (17 | ) | 166 | (91 | ) | ||||||||||||
|
Net income (loss)
|
$ | (242 | ) | $ | (1,268 | ) | $ | 205 | $ | 331 | $ | (308 | ) | |||||||
|
Net income (loss) attributable to Dynegy Holdings Inc.
|
$ | (242 | ) | $ | (1,253 | ) | $ | 208 | $ | 324 | $ | (308 | ) | |||||||
|
Cash Flow Data:
|
||||||||||||||||||||
|
Net cash provided by (used in) operating activities
|
$ | 423 | $ | 152 | $ | 319 | $ | 368 | $ | (205 | ) | |||||||||
|
Net cash provided by (used in) investing activities
|
(520 | ) | 790 | (87 | ) | (688 | ) | 357 | ||||||||||||
|
Net cash provided by (used in) financing activities
|
(69 | ) | (1,193 | ) | 146 | 369 | (1,235 | ) | ||||||||||||
|
Capital expenditures, acquisitions and investments
|
(517 | ) | (596 | ) | (626 | ) | (350 | ) | (155 | ) | ||||||||||
|
December 31,
|
||||||||||||||||||||
|
2010
|
2009
|
2008
|
2007
|
2006
|
||||||||||||||||
|
(in millions)
|
||||||||||||||||||||
|
Balance Sheet Data (1):
|
||||||||||||||||||||
|
Current assets
|
$ | 2,180 | $ | 1,988 | $ | 2,780 | $ | 1,614 | $ | 1,828 | ||||||||||
|
Current liabilities
|
1,562 | 1,848 | 1,681 | 999 | 1,165 | |||||||||||||||
|
Property and equipment, net
|
6,273 | 7,117 | 8,934 | 9,017 | 4,951 | |||||||||||||||
|
Total assets
|
9,949 | 10,903 | 14,174 | 13,107 | 8,136 | |||||||||||||||
|
Long-term debt (excluding current portion)
|
4,626 | 4,775 | 6,072 | 5,939 | 3,190 | |||||||||||||||
|
Notes payable and current portion of long-term debt
|
148 | 807 | 64 | 51 | 68 | |||||||||||||||
|
Capital leases not already included in long-term debt
|
— | 4 | 4 | 5 | 6 | |||||||||||||||
|
Total equity
|
2,719 | 3,003 | 4,583 | 4,620 | 3,036 | |||||||||||||||
|
(1)
|
The LS Power assets were contributed to DHI contemporaneously with the merger with LS Power (April 2, 2007). This contribution was accounted for as a transaction between entities under common control. As such, the assets and liabilities were recorded by DHI at Dynegy’s historical cost on Dynegy’s date of acquisition. Additionally, the Sithe Energies assets were contributed to DHI on April 2, 2007. This contribution was accounted for as a transaction between entities under common control. As such, the assets and liabilities were recorded by DHI at Dynegy’s historical cost on Dynegy’s date of acquisition, January 31, 2005. In addition, DHI’s historical financial statements have been adjusted in all periods presented to reflect the contribution as though DHI had owned these assets beginning January 31, 2005.
|
|
(2)
|
Includes $204 million of debt conversion costs for the twelve months ended December 31, 2006.
|
|
(3)
|
Discontinued operations include the results of operations from the following businesses:
|
|
|
●
|
The Arizona power generation facilities (sold fourth quarter 2009);
|
|
|
●
|
Bluegrass power generating facility (sold fourth quarter 2009);
|
|
|
●
|
Heard County power generating facility (sold second quarter 2009);
|
|
|
●
|
Calcasieu power generating facility (sold first quarter 2008); and
|
|
|
●
|
CoGen Lyondell power generating facility (sold third quarter 2007).
|
The following discussion should be read together with the audited consolidated financial statements and the notes thereto included in this report.
OVERVIEW
We are holding companies and conduct substantially all of our business operations through our subsidiaries. Our current business operations are focused primarily on the power generation sector of the energy industry. We report the results of our power generation business as three separate segments in our consolidated financial statements: (i) GEN-MW; (ii) GEN-WE; and (iii) GEN-NE. Because of the diversity among their respective operations and how we allocate our resources, we report the results of each business as a separate segment in our consolidated financial statements. Our consolidated financial results also reflect corporate-level expenses such as general and administrative, interest and depreciation and amortization. Our investment in PPEA Holding Company, which was sold in the fourth quarter 2010, is included in GEN-MW for reporting purposes.
Going Concern.
Our accompanying consolidated financial statements have been prepared assuming that we will continue as a going concern, which contemplates realization of assets and the satisfaction of liabilities in the normal course of business for the twelve month period following the date of these consolidated financial statements. However, continued low power prices over the past two years have had a significant adverse impact on our business. Further, as our credit rating has declined, counterparty requirements for posting collateral in support of our risk management positions have become more stringent. Over the next twelve months, we expect that we will continue to need to utilize our Credit Facility, through the issuance of letters of credit and/or through the drawing of cash, or secure additional sources of capital to continue to meet our operating needs. The agreements governing our existing Credit Facility require us to meet specific financial covenants both as a matter of course and as a precondition to the incurrence of additional debt and to the making of restricted payments or asset sales, among other things. These specific financial covenants are required to be calculated on a quarterly basis and become more restrictive over the course of 2011. Using the latest available forward commodity price curves and considering our current derivative contracts, we project that it is likely that we will not be able to comply with our EBITDA to Consolidated Interest Expense covenant as currently set forth in our Credit Facility, particularly in the third and fourth quarters of 2011. Furthermore, we expect that our available liquidity will continue to be reduced as a result of borrowing limitations under the covenant regarding the ratio of Secured Debt to EBITDA, as defined in our Credit Facility. To continue as a going concern over the next twelve months, we must either (i) meet the financial covenants so that we can access our Credit Facility, or (ii) amend or replace our Credit Facility or otherwise secure additional capital.
At December 31, 2010, we have the following obligations outstanding under the Credit Facility:
|
|
●
|
$68 million due April 2013 under the Term Loan B;
|
|
|
●
|
$850 million due April 2013 under the Term Facility (fully collateralized by $850 million of non-current restricted cash); and
|
|
|
●
|
$375 million in issued letters of credit.
|
A failure by us to comply with our financial covenants or to comply with the other restrictions in our financing agreements could result in reduced borrowing capacity or even a default, causing our debt obligations under such financing agreements (and any other indebtedness to the extent linked to it by reason of cross-default or cross-acceleration provisions) to potentially become immediately due and payable. If we are unable to cure any such default, or obtain a waiver or replacement financing, and those lenders accelerate the payment of such indebtedness, in the case that we are unable to repay those amounts, the holders of the indebtedness under our secured debt obligations would be entitled to foreclose on, and acquire control of substantially all of our assets, which would have a material adverse impact on our financial condition, results of operations and cash flows.
In light of our likely covenant non-compliance, we are attempting to amend or replace our existing Credit Facility. We expect the capacity of any amended or new credit facility to be less than the current capacity of $1.8 billion and to be at a higher cost. We may also seek additional sources of liquidity in an effort to secure sufficient cash to meet our operating needs. These additional sources of liquidity could include asset sales, public or private issuances of debt, equity or equity-linked securities, debt for equity swaps, or any combination of these. H
owever, we cannot provide any assurances that we will be successful in accomplishing any of these plans.
Our ability to continue as a going concern is dependent on many factors, including, among other things, our ability to achieve the operating results necessary to comply with the covenants in our existing Credit Facility, amend or replace our existing Credit Facility, or achieve the operating results necessary to comply with the covenants in any amended or new credit facility. Such compliance will be dependent on our ability to successfully execute our commercial strategies, manage our collateral requirements, and continue to execute the company-wide cost reduction initiatives that are ongoing.
Recent transactions.
Beginning in 2010 and extending through January 2011, we engaged in an ongoing review of our operating and strategic opportunities and risks. That review was conducted against a backdrop of continuing declines in the market prices of natural gas and wholesale electricity. These declines have reduced the outlook for the cash flow that can be expected to be generated by us in the next several years. Our declining cash flow, combined with our high level of indebtedness and the probable need to incur additional indebtedness to fund operations and required environmental capital expenditures led us to conclude that the risks of pursing a standalone business strategy are considerable.
On August 13, 2010, Dynegy entered into a merger agreement with an affiliate of The Blackstone Group L.P. (as amended, the “Blackstone Merger Agreement”), pursuant to which Dynegy would be acquired and Dynegy’s stockholders would receive $4.50 per share in cash. On November 16, 2010, the agreement was amended to increase the merger consideration to $5.00 per share in cash. The Blackstone Merger Agreement was not approved by Dynegy’s stockholders at a special stockholders’ meeting on November 23, 2010 and was subsequently terminated by the parties in accordance with the terms of the agreement. The Blackstone Merger Agreement requires Dynegy to pay Blackstone a termination fee in the amount of approximately $16 million in the event that within 18 months of November 23, 2010, Dynegy consummates an alternative transaction having an aggregate value of more than $4.50 per share.
On November 23, 2010, we commenced the solicitation of transaction proposals from a broad group of potentially interested parties, including Icahn Enterprises L.P. (“Icahn”) and other potential strategic and financial buyers. As a result of those efforts, on December 15, 2010, Dynegy’s Board of Directors unanimously approved a merger agreement between Dynegy and an affiliate of Icahn (as amended, the “Icahn Merger Agreement”). In connection with the Icahn Merger Agreement, Icahn launched a cash tender offer on December 22, 2010 for all of the issued and outstanding shares of common stock at $5.50 per share (the “Tender Offer”). On January 25, 2011, Dynegy announced that it did not receive any bona fide acquisition proposals. At the expiration time of the Tender Offer on February 18, 2011, an insufficient number of shares had been tendered in response to the Tender Offer, and as a result the Icahn Merger Agreement automatically terminated. In connection with the termination and as required by the Icahn Merger Agreement, in February 2011, Dynegy paid $5 million to Icahn with respect to expenses incurred by Icahn related to the Icahn Merger Agreement, and we may be required to pay additional fees of $11 million in the event that within 18 months of February 18, 2011, Dynegy consummates an alternative transaction having an aggregate value of more than $5.50 per share.
Business Discussion
The following is a brief discussion of each of our power generation segments, including a list of key factors that have affected, and are expected to continue to affect, their respective earnings and cash flows. We also present a brief discussion of our corporate-level expenses.
Power Generation Business
We generate earnings and cash flows in the three segments within our power generation business through sales of electric energy, capacity and ancillary services. Primary factors affecting our earnings and cash flows in the power generation business include:
|
|
●
|
Prices for power, natural gas, coal and fuel oil, which in turn are largely driven by supply and demand. Demand for power can vary due to weather and general economic conditions, among other things. For example, a warm summer or a cold winter typically increases demand for electricity. Conversely, the recent recessionary economic environment has negatively impacted demand for electricity, and the proliferation of advanced shale gas drilling has increased domestic natural gas supplies, suppressing natural gas prices. Power supplies similarly vary by region and are impacted significantly by available generating capacity, transmission capacity and federal and state regulation;
|
|
|
●
|
The relationship between electricity prices and prices for natural gas and coal, commonly referred to as the “spark spread” and “dark spread”, respectively, which impacts the margin we earn on the electricity we generate; and
|
|
|
●
|
Our ability to enter into commercial transactions to mitigate short- and medium- term earnings volatility and our ability to manage our liquidity requirements resulting from potential changes in collateral requirements as prices move.
|
Other factors that have affected, and are expected to continue to affect, earnings and cash flows for this business include:
|
|
●
|
Transmission constraints, congestion, and other factors that can affect the price differential between the locations where we deliver generated power and the liquid market hub;
|
|
|
●
|
Our ability to control capital expenditures, which primarily include maintenance, safety, environmental and reliability projects, and to control operating expenses through disciplined management;
|
|
|
●
|
Our ability to optimize our assets by maintaining a high in-market availability, reliable run-time and safe, low-cost operations;
|
|
|
●
|
Our ability to operate and market our facilities during periods of planned/unplanned electric transmission outages;
|
|
|
●
|
Our ability to post the collateral necessary to execute our commercial strategy;
|
|
|
●
|
The cost of compliance with existing and future environmental requirements that are likely to be more stringent and more comprehensive (please see Item 1. Business—Environmental Matters for further discussion); and
|
|
|
●
|
Market supply conditions resulting from federal and regional renewable power mandates and initiatives.
|
Please read Item 1A. Risk Factors for additional factors that could affect our future operating results, financial condition and cash flows.
In addition to these overarching factors, other factors have influenced, and are expected to continue to influence, earnings and cash flows for our three reportable segments within the power generation business as further described below.
Power Generation—Midwest Segment.
Our assets in GEN-MW include coal-fired facilities and natural gas-fired facilities. The following specific factors affect or could affect the performance of this reportable segment:
|
|
●
|
Our ability to maintain sufficient coal inventories, which is dependent upon the continued performance of the railroads for deliveries of coal in a consistent and timely manner, and its impact on our ability to serve the critical winter and summer on-peak loads;
|
|
|
●
|
Our requirement to utilize a significant amount of cash for capital expenditures required to comply with the Midwest Consent Decree;
|
|
|
●
|
Regional renewable energy mandates and initiatives that may alter supply conditions within the ISO and our generating units’ positions in the aggregate supply stack;
|
|
|
●
|
Changes in the MISO market design or associated rules; and
|
|
|
●
|
Changes in the existing PJM RPM capacity markets or in the bilateral MISO capacity markets and any resulting effect on future capacity revenues.
|
Power Generation—West Segment.
Our assets in GEN-WE are all natural gas-fired power generating facilities with the exception of our fuel oil-fired Oakland facility. The following specific factors impact or could impact the performance of this reportable segment:
|
|
●
|
Our ability to maintain and operate our plants in a manner that ensures we receive full capacity payments under our various tolling agreements;
|
|
|
●
|
Our ability to maintain the necessary permits to continue to operate our Moss Landing and Morro Bay facilities with once-through, seawater cooling systems; and
|
|
|
●
|
The cost incurred to demolish and remediate the South Bay facility.
|
Power Generation—Northeast Segment.
Our assets in GEN-NE include natural gas, fuel oil and coal-fired power generating facilities. The following specific factors impact or could impact the performance of this reportable segment:
|
|
●
|
Our ability to maintain sufficient coal and fuel oil inventories, including continued deliveries of coal and oil in a consistent and timely manner, and continued access to uninterrupted natural gas supplies, to serve the winter and summer on-peak loads;
|
|
|
●
|
The additional costs imposed by state-driven environmental compliance initiatives aimed at reducing mercury emission levels and other constituents such as CO
2
,
NO
x
and SO
2
as well as more restrictive measures for cooling water intakes for fish protection;
|
|
|
●
|
Changes in NYISO/ISO-NE market rules or state-specific mandates that favor and/or subsidize renewable energy sources and demand response initiatives; and
|
|
|
●
|
Our ability to preserve and/or capture value around planned transmission upgrades designed to improve transfer limits around known constraints.
|
Other
Other includes corporate expenses such as general and administrative and interest. Significant items impacting future earnings and cash flows include:
|
|
●
|
Interest expense, which reflects debt with a weighted-average interest rate of approximately seven percent;
|
|
|
●
|
General and administrative costs, which will be impacted by, among other things, (i) staffing levels and associated expenses; (ii) funding requirements under our pension plans; (iii) any future corporate-level litigation reserves or settlements and (iv) our ability to realize planned cost savings reflected in our financial forecasts; and
|
|
|
●
|
Income taxes, which will be impacted by our ability to realize our net operating losses and alternative minimum tax credits.
|
Other also includes our legacy CRM operations, which primarily consists of a minimal number of legacy natural gas trading positions that will remain until 2017.
LIQUIDITY AND CAPITAL RESOURCES
Overview
In this section, we describe our liquidity and capital requirements including our sources and uses of liquidity and capital resources. Our liquidity and capital requirements are primarily a function of our debt maturities and debt service requirements, collateral requirements, fixed capacity payments and contractual obligations, capital expenditures (including required environmental expenditures) and working capital needs. Examples of working capital needs include purchases and sales of commodities and associated margin and collateral requirements, facility maintenance costs and other costs such as payroll.
Our primary sources of internal liquidity are cash flows from operations, cash on hand, short-term investments and available capacity under our Credit Facility, of which the revolver capacity of $1,080 million is scheduled to mature in April 2012 and the term letter of credit capacity of $850 million is scheduled to mature in April 2013.
Our cash on hand and short-term investments as of December 31, 2010 and our internal forecasted cash flows from operations for 2011 are not expected to be sufficient to fund our planned $265 million 2011 capital expenditure program and our $148 million 2011 debt service requirements. Furthermore, using the latest available forward commodity price curves and considering our current derivative contracts, we project that it is likely that we will not be able to comply with our EBITDA to Consolidated Interest Expense covenant contained in our Credit Facility, particularly in the third and fourth quarters of 2011. Accordingly, as described at Going Concern above, we are attempting to amend or replace our existing Credit Facility.
We may also seek additional sources of liquidity in an effort to secure sufficient cash to meet our operating needs. These additional sources of liquidity could include asset sales, public or private issuances of debt, equity or equity-linked securities, debt for equity swaps, or any combination of these. Please read Capital Structuring Transactions and Asset Dispositions below for more detail. H
owever, we cannot provide any assurances that we will be successful in accomplishing any of these plans.
Please read the discussion above regarding Going Concern, as well as the discussion below regarding our Revolver Capacity, and Note 18 Debt—Credit Facility for a further discussion of the financial covenants contained in the Credit Facility. For additional discussion of factors that may affect our ability to continue as a going concern and the potential consequences of our failure to do so, please see Item 1A—Risk Factors.
Current Liquidity.
The following table summarizes our consolidated revolver capacity and liquidity position at March 3, 2011, December 31, 2010 and December 31, 2009:
|
March 3,
2011
|
December 31,
2010
|
December 31,
2009
|
||||||||||
|
(in millions)
|
||||||||||||
|
Revolver capacity (1) (2)
|
$ | 954 | $ | 954 | $ | 1,080 | ||||||
|
Borrowings against revolver capacity
|
— | — | — | |||||||||
|
Term letter of credit capacity, net of required reserves
|
825
|
825 | 825 | |||||||||
|
Plum Point and Sandy Creek letter of credit capacity (3)
|
—
|
— | 102 | |||||||||
|
Available contingent letter of credit facility capacity (4)
|
—
|
— | — | |||||||||
|
Outstanding letters of credit (3)
|
(392
|
) | (375 | ) | (536 | ) | ||||||
|
Unused capacity
|
1,387
|
1,404 | 1,471 | |||||||||
|
Cash—DHI
|
319
|
253 | 419 | |||||||||
|
Short-term investments—DHI (5)
|
74
|
90 | — | |||||||||
|
Total available liquidity—DHI
|
1,780
|
1,747 | 1,890 | |||||||||
|
Cash—Dynegy
|
46
|
38 | 52 | |||||||||
|
Short-term investments—Dynegy (5)
|
9
|
16 | — | |||||||||
|
Total available liquidity—Dynegy
|
$ |
1,835
|
$ | 1,801 | $ | 1,942 | ||||||
|
|
(1)
|
We currently have a syndicate of lenders participating in the revolving portion of our Credit Facility with commitments ranging from $30 million to $165 million.
|
|
|
(2)
|
As of March 3, 2011 and December 31, 2010, DHI’s available liquidity under the Credit Facility was reduced by $126 million as a result of borrowing limitations under the covenant regarding the ratio of Secured Debt to EBITDA. Although our available liquidity is reduced, we have adequate liquidity to meet expected needs for the remainder of the first quarter. Further reduction in capacity may occur based on our ratio of Secured Debt to EBITDA at March 31, 2011, June 30, 2011, September 30, 2011 and December 31, 2011. Please see Revolver Capacity below for further discussion. Additionally, using the latest available forward commodity price curves and considering our current derivative contracts, we project
that it is likely that we will not be able to comply
with our EBITDA to Consolidated Interest Expense covenant, as defined in our Credit Facility,
particularly in the third and fourth quarters of
2011.
|
|
|
(3)
|
Reflects reduction of $102 million of capacity as of January 1, 2010 due to the deconsolidation of PPEA Holding
and the subsequent sale of our interest in PPEA Holding
. Please read Note 2—Summary of Significant Accounting Policies—Accounting Policies Adopted—Variable Interest Entities for further discussion.
|
|
|
(4)
|
Under the terms of the Contingent LC Facility, up to $150 million of capacity can become available, contingent on changes in forward spark spreads and power prices for 2012.
|
|
|
(5)
|
We invest our available cash balances in certain investments permitted by our internal policies and external financing agreements. Please read Note 2—Summary of Significant Accounting Policies—Short-Term Investments and Note 6—Investments for further discussion.
|
Cash on Hand.
At March 3, 2011 and December 31, 2010, Dynegy had cash on hand of $365 million and $291 million, respectively, as compared to $471 million at the end of 2009. The
increase
in cash on hand at March 3, 2011 compared with December 31, 2010 is primarily related to the expiration of an agreement and the subsequent release of $50 million of restricted cash. The decrease in cash on hand at December 31, 2010 as compared to the end of 2009 is primarily attributable to cash used for purchases of short-term investments, debt service and capital expenditures partially offset by cash generated from the operating activities of our power generation business.
At March 3, 2011 and December 31, 2010, DHI had cash on hand of $319 million and $253 million, respectively, as compared to $419 million at the end of 2009. The
increase
in cash on hand at March 3, 2011 compared with December 31, 2010 is primarily related to the expiration of an agreement and the subsequent release of $50 million of restricted cash. The decrease in cash on hand at December 31, 2010 as compared to the end of 2009 is primarily attributable to cash used for purchases of short-term investments, debt service and capital expenditures partially offset by cash generated from the operating activities of our power generation business.
Revolver Capacity
.
DHI’s available liquidity under the Credit Facility was reduced by $126 million as of December 31, 2010 as a result of borrowing limitations under the covenant regarding the ratio of Secured Debt to EBITDA (as defined therein). The effect of reduced availability under the Credit Facility is less available liquidity to DHI. Further reduction in capacity is likely to occur at March 31, 2011, June 30, 2011, September 30, 2011 and December 31, 2011. Additionally, as discussed in Going Concern above, using the latest available forward commodity price curves and considering our current derivative contracts, we project that it is likely that we will not be able to comply with our EBITDA to Consolidated Interest Expense covenant, as currently set forth in our Credit Facility, particularly in the third and fourth quarters of 2011. In such event, the Credit Facility may be terminated by the lenders and outstanding amounts thereunder accelerated. Accordingly, we are attempting to amend or replace our existing Credit Facility. Please read Going Concern above, Financial Covenants below and Note 18—Debt—Credit Facility for further discussion of our Credit Facility.
Capital-Structuring Transactions
.
In light of our probable covenant non-compliance, we are attempting to amend or replace our existing Credit Facility. We may also seek additional sources of liquidity in order to ensure that we have sufficient cash available to meet our operating needs. These additional sources of liquidity could include asset sales, public or private issuances of debt, equity or equity-linked securities,, debt for equity swaps, or any combination of these. Matters to be considered include depressed or dilutive prices for assets, cash interest expense, covenant compliance and maturity profile, all to be balanced with an attempt to maintain adequate liquidity. The receptiveness of the traditional capital markets to an offering of debt or equity securities cannot be assured and may be negatively impacted by, among other things, the going concern emphasis paragraph in our most recent audit report, recent changes to our senior management and Dynegy’s Board of Directors, our non-investment grade credit ratings, significant debt maturities, business prospects and other factors beyond our control, including current and projected market conditions. Any issuance of equity by Dynegy likely would have other effects as well, including stockholder dilution, and our ability to issue debt securities may be limited by our financing agreements, including our Credit Facility.
Operating Activities
Historical Operating Cash Flows.
Dynegy’s and DHI’s cash flow provided by operations totaled $423 million for the twelve months ended December 31, 2010. During the period, our power generation business provided positive cash flow from operations of $938 million from the operation of our power generation facilities, primarily reflecting positive earnings for the period and approximately $290 million of cash received from our futures clearing manager. The receipt of this cash is partly due to lower commodity prices and a reduction of margin requirements; the remaining cash was returned as a result of the posting of $85 million of short-term investments in substitute of cash. Corporate and other operations included a use of cash of approximately $515 million by Dynegy and DHI, primarily due to interest payments to service debt and general and administrative expenses.
Dynegy’s cash flow provided by operations totaled $135 million for the twelve months ended December 31, 2009. DHI’s cash flow provided by operations totaled $152 million for the twelve months ended December 31, 2009. During the period, our power generation business provided positive cash flow from operations of $719 million. Cash provided by the operations of our power generation facilities was partly offset by a $173 million increase in cash collateral postings. Other included a use of cash of approximately $584 million and $567 million by Dynegy and DHI, respectively, primarily due to interest payments to service debt and general and administrative expenses. Dynegy’s operating cash flow also
reflected the payment of $19 million to LS Power in conjunction with the dissolution of DLS Power Holdings and DLS Power Development.
Dynegy’s and DHI’s cash flow provided by operations totaled $319 million for the twelve months ended December 31, 2008. During the period, our power generation business provided positive cash flow from the operations of our power generation facilities of $869 million, reflecting positive earnings for the period, partly offset by additional collateral requirements due to an increase in the volume of our hedging positions and increased payments associated with our DNE leveraged lease. Please read Item 7. Management’s Discussion and Analysis of Financial Condition and Results of Operations— Liquidity and Capital Resources—Off-Balance Sheet Arrangements—DNE Leveraged Lease for further discussion of the DNE lease payments. Other included a use of approximately $550 million in cash primarily due to interest payments to service debt, general and administrative expenses and a $17 million legal settlement payment, partially offset by interest income.
Future Operating Cash Flows.
Our future operating cash flows will vary based on a number of factors, many of which are beyond our control, including the price of power, the price of natural gas and its correlation to power prices, the cost of coal and fuel oil, collateral requirements, the value of capacity and ancillary services, the run time of our generating facilities, the effectiveness of our commercial strategy, legal, environmental and regulatory requirements, our ability to achieve the cost savings contemplated in our cost reduction programs and the level of our ability to capture value associated with commodity price volatility. Given current forward commodity price curves, our future operating cash flows are likely to be insufficient to fund our planned capital expenditure program and our debt service requirements.
Collateral Postings.
We use a significant portion of our capital resources, in the form of cash, short-term investments and letters of credit, to satisfy counterparty collateral demands. These counterparty collateral demands reflect our non-investment grade credit ratings and counterparties’ views of our financial condition and ability to satisfy our performance obligations, as well as commodity prices and other factors. At December 31, 2010, we had approximately $
75
million of our cash collateral postings and $
57
million of our letter of credit collateral postings related to our hedging activities. The following table summarizes our consolidated collateral postings to third parties by line of business at March 3, 2011, December 31, 2010 and December 31, 2009:
|
March 3,
2011
|
December 31,
2010
|
December 31,
2009
|
||||||||
|
(in millions)
|
||||||||||
|
By Business
:
|
||||||||||
|
Generation business
|
$
|
459
|
$
|
377
|
$
|
638
|
||||
|
Other (1)
|
85
|
85
|
189
|
|||||||
|
Total
|
$
|
544
|
$
|
462
|
$
|
827
|
||||
|
By Type
:
|
||||||||||
|
Cash and short-term investments (2)
|
$
|
152
|
$
|
87
|
$
|
291
|
||||
|
Letters of credit
|
392
|
375
|
536
|
|||||||
|
Total
|
$
|
544
|
$
|
462
|
$
|
827
|
||||
|
|
(1)
|
March 3, 2011 and December 31, 2010 reflect the reduction of $102 million of capacity and corresponding outstanding letters of credit due to the deconsolidation and subsequent sale of our interest in PPEA Holding. Please read Note 2—Summary of Significant Accounting Policies—Accounting Policies Adopted—Variable Interest Entities for further discussion.
|
|
|
(2)
|
Includes Broker margin account on our consolidated balance sheets as well as other collateral postings included in Prepayments and other current assets on our consolidated balance sheets
.
|
The change in letters of credit postings from December 31, 2009 to December 31, 2010 and to March 3, 2011 are primarily related to a $102 million decrease due to the removal of the PPEA letter of credit as a result of the deconsolidation and subsequent sale of our interest in PPEA Holding and lower commodity prices. Collateral postings of cash and short-term investments also
decreased
from December 31, 2009 to December 31, 2010 due to lower commodity prices and a reduction of margin requirements during 2010. Collateral postings increased from December 31, 2010 to March 3, 2011 due to an increase in margin requirements in 2011.
In addition to cash and letters of credit posted as collateral, we have granted additional permitted first priority liens on the assets currently subject to first priority liens under our Credit Facility as collateral under certain of our commodity derivative agreements in order to reduce the cash collateral and letters of credit that we would otherwise be required to provide to the counterparties under such agreements. The counterparties under such agreements would share the benefits of the collateral subject to such first priority liens ratably with the lenders under the Credit Facility. The fair value of our commodity derivatives collateralized by first priority liens, netted by counterparty, included liabilities of $
20
million, $30 million and $31 million at March 3, 2011, December 31, 2010 and December 31, 2009, respectively.
Going forward, we expect counterparties’ collateral demands to continue to reflect changes in commodity prices, including seasonal changes in weather-related demand, as well as their views of our creditworthiness. If we do not have access to our Credit Facility or another borrowing facility, it will be difficult for us to satisfy counterparties’ collateral demands, including those for which no collateral is currently posted. For further discussion, see Going Concern above. Furthermore, our ability to use forward economic hedging instruments could be limited, due to the collateral requirements the use of such instruments entails. If our commercial strategy is adjusted to reduce such collateral needs, we would be exposed to future increases and decreases in commodity prices and be limited in our ability to capture the extrinsic value associated with our portfolio of assets.
Investing Activities
Capital Expenditures.
We continue to tightly manage our operating costs and capital expenditures. We had approximately $333 million, $612 million and $611 million in capital expenditures during the twelve months ended December 31, 2010, 2009 and 2008, respectively. Our capital spending by reportable segment was as follows:
|
December 31,
|
||||||||||||
|
2010
|
2009
|
2008
|
||||||||||
|
(in millions)
|
||||||||||||
|
GEN-MW
|
$ | 300 | $ | 533 | $ | 530 | ||||||
|
GEN-WE
|
19 | 45 | 29 | |||||||||
|
GEN-NE
|
8 | 28 | 36 | |||||||||
|
Other
|
6 | 6 | 16 | |||||||||
|
Total
|
$ | 333 | $ | 612 | $ | 611 | ||||||
Capital spending in our GEN-MW segment primarily consisted of environmental and maintenance capital projects, as well as approximately $104 million and $203 million spent on development capital related to the Plum Point Project during the years ended December 31, 2009 and 2008, respectively. Capital spending in our GEN-WE and GEN-NE segments primarily consisted of maintenance projects.
We expect capital expenditures for 2011 to approximate $265 million, which is comprised of $213 million, $14 million, $35 million and $3 million in GEN-MW, GEN-WE, GEN-NE and Other, respectively. The $213 million of spending planned for GEN-MW includes approximately $145 million of environmental expenditures, of which approximately $140 million is related to the Midwest Consent Decree, approximately $53 million is related to maintenance on our coal and natural gas facilities, and approximately $15 million is related to capitalized interest. Other spending primarily includes maintenance capital projects and environmental projects. The capital budget is subject to revision as opportunities arise or circumstances change. Our ability to fund these capital expenditures is dependent on our access to sufficient liquidity; see Going Concern above.
The Midwest Consent Decree was finalized in July 2005. It prohibits us from operating certain of our power generating facilities after certain dates unless specified emission control equipment is installed. Our long-term capital expenditures in the GEN-MW segment will be significantly impacted by the Midwest Consent Decree. We anticipate our total costs associated with the Midwest Consent Decree projects, which we expect to incur through 2013, to be approximately $960 million, which includes approximately $730 million spent to date. This estimate, which is broken down by year below, includes a number of assumptions about uncertainties that are beyond our control. For instance, we have assumed for purposes of this estimate that labor and material costs will increase at four percent per year over the remaining project term. The following are the estimated remaining capital expenditures required to comply with the Midwest Consent Decree:
|
2011
|
2012
|
2013
|
||||||||
|
(in millions)
|
||||||||||
| $ | 140 | $ | 80 | $ | 10 | |||||
If the costs of these capital expenditures become great enough to render the operation of the affected facility or facilities uneconomical, we could, at our option, cease to operate the facility or facilities and forego these capital expenditures without incurring any further obligations under the Midwest Consent Decree. Further, if we fail to meet certain performance standards under the Midwest Consent Decree our production may be affected Please read Note 22—Commitments and Contingencies—Other Commitments and Contingencies—Midwest Consent Decree for further discussion.
Please read Note 1 —Organization and Operations—Going Concern for further discussion.
The SPDES permits renewal application at our Roseton power generating facility and the NPDES permit at our Moss Landing power generating facility have been challenged by local environmental groups which contend the existing once-through water cooling systems currently in place should be replaced with closed-cycle cooling systems. A decision to install a closed-cycle cooling system at the Roseton or Moss Landing facilities would be made on a case-by-case basis considering all relevant factors at such time, including any relevant costs or applicable remediation requirements. If mandated installation of closed-cycle cooling systems at either of these facilities would result in a material capital expenditure that renders the operation of a plant uneconomical, we could, at our option, and subject to any applicable financing agreements or other obligations, reduce operations or cease to operate such facility and forego these capital expenditures.
Please read Item 7. Management’s Discussion and Analysis of Financial Condition and Results of Operations—Liquidity and Capital Resources—Disclosure of Contractual Obligations and Contingent Financial Commitments—Off-Balance Sheet Arrangements—DNE Leveraged Lease for further discussion of early lease termination payments. Please read Note 22—Commitments and Contingencies—Legal Proceedings—Roseton State Pollutant Discharge Elimination System Permit, and —Commitments and Contingencies—Legal Proceedings—Moss Landing National Pollutant Discharge Elimination System Permit for further discussion.
Asset Dispositions.
Proceeds from asset sales in 2009 totaled $652 million and $1,095 million for Dynegy and DHI, respectively. Of the total $936 million and $1,476 million in cash proceeds received by Dynegy and DHI, respectively, at the closing of the LS Power Transactions, $547 million and $990 million related to the disposition of assets, including our interest in the Sandy Creek Project, for Dynegy and DHI, respectively. We also received $175 million from the release of restricted cash on our consolidated balance sheets that was used to support our funding commitment to the Sandy Creek Project. Please read Note 4—Dispositions, Contract Terminations and Discontinued Operations—Dispositions—LS Power Transactions for further information. The remaining $214 million of cash received upon closing the LS Power Transactions relates to the issuance of $235 million of notes payable, and is included in Financing Activities. Please read “—Financing Activities” below and Note 19—Related Party Transactions for further discussion.
Additionally, during 2009, we sold the Heard County power generation facility for approximately $105 million, net of transaction costs. Please read Note 4—Dispositions, Contract Terminations and Discontinued Operations—Discontinued Operations—Heard County for further discussion.
Proceeds from asset sales in 2008 totaled $451 million, net of transaction costs, related to the sales of the Rolling Hills power generating facility, Calcasieu power generating facility, the NYMEX shares and seats, and the beneficial interest in Oyster Creek.
Consistent with industry practice, we regularly evaluate our generation fleet based primarily on geographic location, fuel supply, market structure, market recovery expectations, regulatory or legislative risks and cash flows. We consider divestitures of assets where the balance of the above factors suggests that such assets’ earnings potential is limited or that the benefits that can be captured through a divestiture outweigh the benefits of continuing to own and operate such assets. As future operating cash flows are likely to be insufficient to fund our planned capital expenditure program, lease obligations and our debt service requirements, additional asset divestures will be considered to supplement our liquidity position, potentially at terms not favorable to us.
Other Investing Activities.
Cash inflows related to short-term investments during the year ended December 31, 2010 totaled $326 million and $310 million for Dynegy and DHI, respectively, reflecting maturities and early redemptions of short-term investments. Cash outflows related to purchases of short-term investments during the year ended December 31, 2010 totaled $508 million and $477 million for Dynegy and DHI, respectively.
Cash inflows related to short-term investments during the year ended December 31, 2009 totaled $17 million and $16 million for Dynegy and DHI, respectively, reflecting a distribution from our short-term investments. Cash outflows related to short-term investments during the year ended December 31, 2008 totaled $27 million and $25 million for Dynegy and DHI, respectively, as a result of a reclassification from cash equivalents to short-term investments.
Dynegy made $16 million in contributions to DLS Power Holdings during the year ended December 31, 2008. We received a distribution of approximately $7 million and repayment of approximately $3 million of an affiliate receivable upon the sale of a partial interest in Sandy Creek during the year ended December 31, 2008. Please read Note 15—Variable Interest Entities—Sandy Creek for further discussion.
There was a $15 million cash outflow related to our funding commitment obligation under the PPEA Sponsor Support Agreement and a $3 million cash outflow due to changes in restricted cash balances during the year ended December 31, 2010 for both Dynegy and DHI. There was a $190 million cash inflow during the year ended December 31, 2009 for both Dynegy and DHI, related to changes in restricted cash balances primarily due to the release of $175 million of restricted cash that was used to support our funding commitment to the Sandy Creek Project. There was an $80 million cash inflow during the year ended December 31, 2008 due to changes in restricted cash balances primarily due to a reduction of our cash collateral as a result of SCEA’s sale of an 11 percent undivided interest in the Sandy Creek Project, the release of restricted cash and the use of restricted cash for the ongoing construction of the Plum Point project, partially offset by interest income.
DHI’s affiliate transactions during the year ended December 31, 2010 included $2 million. DHI’s affiliate transactions during the year ended December 31, 2009 included $97 million related to the LS Power Transactions. Dynegy repurchased 245 million of its Class B shares with a fair value of $443 million (based on a share price of $9.05 on November 30, 2009, as adjusted for the 1-for-5 reverse stock split of Dynegy’s common stock that became effective on May 25, 2010) from LS Power by exchanging assets owned by DHI for the shares. In order to effect this exchange, Dynegy paid $540 million in cash to a subsidiary of LS Power in exchange for the shares, immediately following which a separate subsidiary of LS Power paid $540 million of cash to DHI in exchange for the assets. The $97 million represents the difference between the $540 million of cash received by DHI and the $443 million fair value of the shares received by Dynegy.
Other included $3 million and $7 million of insurance proceeds received during the years ended December 31, 2009 and 2008, respectively. Additionally, included in Other for Dynegy for the year ended December 31, 2008 is $4 million of proceeds from the liquidation of an investment.
Financing Activities
Historical Cash Flow from Financing Activities.
Dynegy’s and DHI’s net cash used in financing activities during the twelve months ended December 31, 2010 totaled $69 million due to the payments of $62 million in aggregate principal amount on our Sithe 9.00 percent secured bonds due 2013 and $6 million of financing fees.
Dynegy’s net cash used in financing activities during the twelve months ended December 31, 2009 totaled $608 million. Repayments of borrowings were $890 million, and consisted of the following:
|
|
●
|
$421 million in aggregate principal amount on our 6.875 percent senior unsecured notes due 2011 (“2011 Notes”);
|
|
|
●
|
$412 million in aggregate principal amount on our 8.75 percent senior unsecured notes due 2012 (“2012 Notes”); and
|
|
|
●
|
$57 million in aggregate principal amount on our Sithe 9.00 percent secured bonds due 2013.
|
We also paid debt extinguishment costs of $46 million in connection with the repayment of the 2011 Notes and 2012 Notes.
These payments were partially offset by $328 million of net proceeds from the following borrowings:
|
|
●
|
$130 million under the PPEA Credit Agreement Facility; and
|
|
|
●
|
$214 million of cash proceeds from the LS Power Transactions allocated to the issuance of $235 million 7.5 percent senior unsecured notes due 2015.
|
These borrowings were partly offset by $16 million of financing fees related to the Credit Facility Amendment No. 4.
DHI’s net cash used in financing activities during the twelve months ended December 31, 2009 totaled $1,193 million. This included the net $608 million used in repayments and extinguishment costs, net of borrowings, incurred by Dynegy, as set forth above, as well as $585 million in aggregate dividend payments to Dynegy.
Dynegy’s net cash provided by financing activities during the twelve months ended December 31, 2008 totaled $148 million and DHI’s net cash provided by financing activities during the twelve months ended December 31, 2008 totaled $146 million. The cash provided by financing activities primarily related to $192 million of proceeds from borrowings under the PPEA Credit Agreement Facility, partly offset by a $45 million principal payment on our 9.00 percent Sithe secured bonds due 2013.
Summarized Debt and Other Obligations.
The following table depicts our consolidated third party debt obligations, including the present value of the DNE leveraged lease payments discounted at 10 percent, and the extent to which they are secured as of December 31, 2010 and 2009:
|
December 31,
2010
|
December 31,
2009
|
|||||||
|
(in millions)
|
||||||||
|
First secured obligations
|
$ | 918 | $ | 918 | ||||
|
Unsecured obligations
|
3,644 | 3,645 | ||||||
|
Lease obligations (1)
|
590 | 626 | ||||||
|
Total corporate obligations
|
5,152 | 5,189 | ||||||
|
PPEA and Sithe secured non-recourse obligations (2)
|
225 | 1,031 | ||||||
|
Total obligations
|
5,377 | 6,220 | ||||||
|
Less: Lease obligations (1)
|
(590 | ) | (626 | ) | ||||
|
Other (3)
|
(13 | ) | (12 | ) | ||||
|
Total notes payable and long-term debt (4)
|
$ | 4,774 | $ | 5,582 | ||||
|
|
(1)
|
Represents present value of future lease payments associated with the DNE lease financing discounted at 10 percent.
|
|
|
(2)
|
Includes PPEA’s non-recourse project financing of $644 million and tax-exempt bonds of $100 million as of December 31, 2009. Reflects reduction of $744 million as of January 1, 2010 due to the deconsolidation
and subsequent sale of our interest in
PPEA Holding. Please read Note 2—Summary of Significant Accounting Policies—Accounting Policies Adopted—Variable Interest Entities for further discussion.
|
|
|
(3)
|
Consists of net discounts on debt of $13 million and $12 million at December 31, 2010 and 2009, respectively.
|
|
|
(4)
|
Does not include letters of credit.
|
Please read Note 18—Debt for further discussion of these items. Our debt maturity profile as of December 31, 2010 includes $148 million in 2011, $164 million in 2012, $1,002 million in 2013, zero in 2014, $772 million in 2015 and approximately $2,688 million thereafter. Maturities for 2011 represent principal payments on our Senior Unsecured Notes due 2011 and the Sithe Senior Notes.
Financing Trigger Events.
Our debt instruments and other financial obligations include provisions which, if not met, could require early payment, additional collateral support or similar actions. These trigger events include the violation of financial covenants, including the Interest Coverage Ratio discussed below (and any other indebtedness to the extent linked to it by reason of cross-default or cross-acceleration provisions), insolvency events, defaults on scheduled principal or interest payments, acceleration of other financial obligations and change of control provisions. We do not have any trigger events tied to specified Dynegy or DHI credit ratings or Dynegy’s stock price in our debt instruments and are not party to any contracts that require us to issue equity based on credit ratings or other trigger events.
Financial Covenants.
Our Credit Facility contains certain financial covenants, including (i) a covenant (measured as of the last day of the relevant fiscal quarter) that requires DHI and certain of its subsidiaries to maintain a ratio of Secured Debt to EBITDA (each as defined therein) for DHI and its relevant subsidiaries of no greater than a specified amount; and (ii) a covenant that requires DHI and certain of its subsidiaries to maintain a ratio of EBITDA to Consolidated Interest Expense (each as defined therein) for DHI and its relevant subsidiaries as of the last day of the measurement periods as specified below of no less than a specified amount. The following table summarizes the required ratios:
|
Period Ended:
|
(i) Secured Debt:
EBITDA
|
(ii) EBITDA:
Consolidated Interest
Expense
|
||
|
No greater than:
|
No less than:
|
|||
|
December 31, 2010
|
3.50 : 1
|
1.30 : 1
|
||
|
March 31, 2011
|
3.50 : 1
|
1.35 : 1
|
||
|
June 30, 2011
|
3.50 : 1
|
1.40 : 1
|
||
|
September 30, 2011
|
3.25 : 1
|
1.60 : 1
|
||
|
December 31, 2011
|
3.00 : 1
|
1.60 : 1
|
||
|
Thereafter
|
2.50 : 1
|
1.75 : 1
|
We are in compliance with these covenants as of December 31, 2010.
As of December 31, 2010, DHI’s available liquidity under the Credit Facility was reduced by $126 million as a result of borrowing limitations under the covenant regarding the ratio of Secured Debt to EBITDA. Further reduction in capacity is likely to occur based on our ratio of Secured Debt to EBITDA at March 31, 2011, June 30, 2011, September 30, 2011 and December 31, 2011 based on our current projections. Please see Going Concern and Revolver Capacity above for further discussion.
Using the latest available forward commodity price curves and considering our current hedging contracts, we project that it is likely that we will not be able to comply with the EBITDA to Consolidated Interest Expense covenant contained in our Credit Facility, particularly in the third and fourth quarters of 2011. Please see Going Concern above for further discussion.
Subject to certain exceptions, DHI and its relevant subsidiaries are subject to restrictions on asset sales, incurring additional indebtedness, limitations on investments and certain limitations on dividends and other payments with respect to capital stock. Please read Note 18—Debt—Credit Facility for further discussion of our amended Credit Facility.
For additional discussion of factors that may affect our ability to continue as a going concern and the potential consequences of our failure to do so, please see Item 1A—Risk Factors.
Dividends on Dynegy Common Stock.
Dividend payments on Dynegy’s common stock are at the discretion of its Board of Directors and subject to limits contained in our Credit Facility and applicable law. Dynegy did not declare or pay a cash dividend on its common stock for the year ended December 31, 2010 and it does not expect to pay a dividend on its common stock in the foreseeable future.
Credit Ratings
Our credit rating status is currently “non-investment grade”; our senior unsecured debt is rated “CCC” by Standard & Poor’s, “Caa2” by Moody’s, and “CCC” by Fitch. On March 1, 2011, Standard & Poor’s downgraded our corporate family ratings to “CCC” from “B-” based on near-term risk of covenant default under the Credit Facility and the recently announced Board of Directors and management restructuring. The agency also reduced our senior secured bank facilities rating to “B-” from “B+”, and senior unsecured debt rating to “CCC” from “B-”, while removing all ratings from credit watch with negative implications. The Standard & Poor's rating outlook is negative. On October 1, 2010, Moody’s issued a rating action to conclude their prior review. The corporate family rating was downgraded to “Caa1”; the senior secured rating downgraded to “B1”; and the senior unsecured rating was confirmed at “Caa2.” The Moody's rating outlook is negative. On November 24, 2010, Fitch removed the ratings watch and downgraded the issuer default rating for Dynegy Inc. and Dynegy Holdings Inc. to “CCC” from “B-”; reduced our senior secured bank facilities to “B+” from “BB-”; and reduced our senior unsecured debt to “CCC” from “B”. The Fitch rating outlook remains negative. The downgrades did not trigger any obligations under our financing arrangements; however, as a result of the March 1, 2011 Standard & Poor's downgrade, we have received demands to post additional collateral in support of certain of our operational agreements in 2011.
Disclosure of Contractual Obligations and Contingent Financial Commitments
We have incurred various contractual obligations and financial commitments in the normal course of our operations and financing activities. Contractual obligations include future cash payments required under existing contractual arrangements, such as debt and lease agreements. These obligations may result from both general financing activities and from commercial arrangements that are directly supported by related revenue-producing activities. Contingent financial commitments represent obligations that become payable only if certain pre-defined events occur, such as financial guarantees. Details on these obligations are set forth below.
Contractual Obligations
The following table summarizes our contractual obligations as of December 31, 2010. Cash obligations reflected are not discounted and do not include accretion or dividends.
|
Expiration by Period
|
||||||||||||||||||||
|
Total
|
Less than 1 Year
|
1 – 3 Years
|
3 - 5 Years
|
More than 5 Years
|
||||||||||||||||
|
(in millions)
|
||||||||||||||||||||
|
Long-term debt (including current portion)
|
$ | 4,774 | $ | 148 | $ | 1,166 | $ | 772 | $ | 2,688 | ||||||||||
|
Interest payments on debt
|
1,798 | 357 | 635 | 514 | 292 | |||||||||||||||
|
Operating leases
|
925 | 138 | 363 | 305 | 119 | |||||||||||||||
|
Coal commitments (1)
|
647 | 215 | 262 | 170 | — | |||||||||||||||
|
Capacity payments
|
156 | 35 | 68 | 47 | 6 | |||||||||||||||
|
Interconnection obligations
|
17 | 1 | 2 | 2 | 12 | |||||||||||||||
|
Construction service agreements
|
314 | 56 | 79 | 101 | 78 | |||||||||||||||
|
Pension funding obligations
|
53 | 12 | 41 | — | — | |||||||||||||||
|
Other obligations
|
87 | 26 | 29 | 21 | 11 | |||||||||||||||
|
Total contractual obligations
|
$ | 8,771 | $ | 988 | $ | 2,645 | $ | 1,932 | $ | 3,206 | ||||||||||
|
|
(1)
|
Included based on nature of purchase obligations under associated contracts.
|
Long-Term Debt (Including Current Portion).
Total amounts of Long-term debt (including current portion) are included in the December 31, 2010 consolidated balance sheet. Please read Note 18—Debt for further discussion.
Interest Payments on Debt.
Interest payments on debt represent periodic interest payment obligations associated with our long-term debt (including current portion). Please read Note 18—Debt for further discussion.
Operating Leases.
Operating leases includes the minimum lease payment obligations associated with our DNE leveraged lease. Please read “—Liquidity and Capital Resources—Off-Balance Sheet Arrangements—DNE Leveraged Lease” for further discussion. Amounts also include minimum lease payment obligations associated with office and office equipment leases.
In addition, we are party to two charter party agreements relating to two VLGCs previously utilized in our former global liquids business. The aggregate minimum base commitments of the charter party agreements are approximately $14 million each year for the years 2011 through 2012, and approximately $17 million in aggregate for the period from 2013 through lease expiration. The charter party rates payable under the two charter party agreements vary in accordance with market-based rates for similar shipping services. The $14 million and $17 million amounts set forth above are based on the minimum obligations set forth in the two charter party agreements. The primary terms of the charter party agreements expire September 2013 and September 2014, respectively. We have sub-chartered both VLGCs to a wholly owned subsidiary of Transammonia Inc. The terms of the sub-charters are identical to the terms of the original charter agreements. We continue to rely on the sub-charters with a subsidiary of Transammonia to satisfy the obligations of our two charter party agreements. To date, the subsidiary of Transammonia has complied with the terms of the sub-charter agreements.
Coal Commitments.
At December 31, 2010, we had contracts in place to purchase coal for various of our generation facilities with minimum commitments of $647 million. Obligations related to the purchase of coal are $636 million through 2015, and obligations related to the transportation are
$11 million through 2013.
Capacity Payments.
Capacity payments include fixed obligations associated with transmission, transportation and storage arrangements totaling approximately $156 million.
Interconnection Obligations
.
Interconnection obligations represent an obligation with respect to interconnection services for our Ontelaunee facility. This agreement expires in 2027. Our obligation under this agreement is approximately $1 million per year through the term of the contract.
Construction Service Agreements.
Construction service agreements represent obligations with respect to long-term plant maintenance agreements. Our obligation under these agreements is approximately $314 million.
Pension Funding Obligations.
Amounts include estimated defined benefit pension funding obligations for 2011—$12 million, 2012—$23 million and 2013—$18 million. Although we expect to continue to incur funding obligations subsequent to 2013, we cannot confidently estimate the amount of such obligations at this time and, therefore, have not included them in the table above. Please read Note 24—Employee Compensation, Savings and Pension Plans—Pension and Other Post-Retirement Benefits—Obligations and Funded Status for further discussion.
Other Obligations.
Other obligations primarily include the following items:
|
|
●
|
Demolition and restoration obligation associated with our South Bay facility of $40 million;
|
|
|
●
|
Payments associated with a capacity contract between Independence and Con Edison. The aggregate payments through the 2014 expiration are approximately $8 million as of December 31, 2010;
|
|
|
●
|
Reserve of $5 million for expenses payable to Icahn associated with the termination of the Icahn Merger Agreement;
|
|
|
●
|
Reserves of $5 million recorded in connection with uncertain tax positions. Please read Note 20—Income Taxes—Unrecognized Tax Benefits for further discussion; and
|
|
|
●
|
Severance reserves of $15 million accrued in connection with a reduction in workforce and the closure of certain power generation facilities. Of this amount, $12 million of expense was recorded in 2010. Please read Note 7—Impairment and Restructuring Charges—Restructuring Charges for further discussion.
|
Contingent Financial Obligations
The following table provides a summary of our contingent financial obligations as of December 31, 2010 on an undiscounted basis. These obligations represent contingent obligations that may require a payment of cash upon the occurrence of specified events.
|
Expiration by Period
|
||||||||||||||||||||
|
Total
|
Less than 1
Year
|
1–3 Years
|
3-5 Years
|
More than 5
Years
|
||||||||||||||||
|
(in millions)
|
||||||||||||||||||||
|
Letters of credit (1)
|
$ | 375 | $ | 375 | $ | — | $ | — | $ | — | ||||||||||
|
Breakup Fees (2)
|
27 | 27 | — | — | — | |||||||||||||||
|
Surety bonds (3)
|
5 | 5 | — | — | — | |||||||||||||||
|
Guarantees
|
2 | 1 | 1 | — | — | |||||||||||||||
|
Total financial commitments
|
$ | 409 | $ | 408 | $ | 1 | $ | — | $ | — | ||||||||||
|
|
(1)
|
Amounts include outstanding letters of credit.
|
|
|
(2)
|
The Breakup Fees represent contractual obligations to pay $16 million to The Blackstone Group and $11 million to Icahn under certain circumstances. Please read Note 22—Commitments and Contingencies for further discussion.
|
|
|
(3)
|
Surety bonds are generally on a rolling 12-month basis. The $5 million of surety bonds are primarily supported by collateral.
|
Off-Balance Sheet Arrangements
DNE Leveraged Lease.
In May 2001, we entered into an asset-backed sale-leaseback transaction to provide us with long-term financing for our acquisition of certain power generating facilities. In this transaction, which was structured as a sale-leaseback to minimize our operating cost of the facilities on an after-tax basis and to transfer ownership to the purchaser, we sold four of the six generating units comprising the facilities to Danskammer OL LLC and Roseton OL LLC, each of which was newly formed by an unrelated third party investor, for approximately $920 million and we concurrently agreed to lease them back from these entities, which we refer to as the owner lessors. The owner lessors used $138 million in equity funding from the unrelated third party investor to fund a portion of the purchase of the respective facilities. The remaining $800 million of the purchase price and the related transaction expenses were derived from proceeds obtained in a private offering of pass-through trust certificates issued by two of our subsidiaries, Dynegy Danskammer, L.L.C. and Dynegy Roseton, L.L.C., which serve as lessees of the applicable facilities. The pass-through trust certificate structure was employed, as it has been in similar financings historically executed in the airline and energy industries, to optimize the cost of financing the assets and to facilitate a capital markets offering of sufficient size to enable the purchase of the lessor notes from the owner lessors. The pass-through trust certificates were sold to qualified institutional buyers in a private offering and the proceeds were used to purchase debt instruments, referred to as lessor notes, from the owner lessors. The pass-through trust certificates and the lessor notes are held by pass-through trusts for the benefit of the certificate holders. The lease payments on the facilities support the principal and interest payments on the pass-through trust certificates, which are ultimately secured by a mortgage on the underlying facilities.
As of December 31, 2010, future lease payments are $112 million for 2011, $179 million for 2012, $142 million for 2013, $143 million for 2014, $143 million for 2015 and $105 million in the aggregate due from 2016 through lease expiration. The Roseton lease expires on February 8, 2035 and the Danskammer lease expires on May 8, 2031. We have no option to purchase the leased facilities at the end of their respective lease terms. DHI has guaranteed the lessees’ payment and performance obligations under their respective leases on a senior unsecured basis. At December 31, 2010, the present value (discounted at 10 percent) of future lease payments was $590 million.
The following table sets forth our lease expenses and lease payments relating to these facilities for the periods presented:
|
2010
|
2009
|
2008
|
||||||||||
|
(in millions)
|
||||||||||||
|
Lease Expense
|
$ | 50 | $ | 50 | $ | 50 | ||||||
|
Lease Payments (Cash Flows)
|
$ | 95 | $ | 141 | $ | 144 | ||||||
If one or more of the leases were to be terminated because of an event of loss, because it had become illegal for the applicable lessee to comply with the lease or because a change in law had made the facility economically or technologically obsolete, DHI would be required to make a termination payment in an amount sufficient to compensate the lessor for termination of the lease, including redeeming the pass-through trust certificates related to the unit or facility for which the lease was terminated at par plus accrued and unpaid interest. As of December 31, 2010, the termination payment at par would be approximately $816 million for all of the leased facilities. If a termination of this type were to occur with respect to all of the leased facilities, it would be difficult for DHI to raise sufficient funds to make this termination payment. Alternatively, if one or more of the leases were to be terminated because we determine, for reasons other than as a result of a change in law, that it has become economically or technologically obsolete or that it is no longer useful to our business, DHI must redeem the related pass-through trust certificates at par plus a make-whole premium in an amount equal to the discounted present value of the principal and interest payments still owing on the certificates being redeemed less the unpaid principal amount of such certificates at the time of redemption. For this purpose, the discounted present value would be calculated using a discount rate equal to the yield-to-maturity on the most comparable U.S. Treasury security plus 50 basis points. At December 31, 2010, we estimate that the make-whole premium for the remaining pass through certificates would be approximately $109 million.
Commitments and Contingencies
Please read Note 22—Commitments and Contingencies, which is incorporated herein by reference, for further discussion of our material commitments and contingencies.
RESULTS OF OPERATIONS
Overview and Discussion of Comparability of Results.
In this section, we discuss our results of operations, both on a consolidated basis and, where appropriate, by segment, for the years ended December 31, 2010, 2009 and 2008. At the end of this section, we have included our business outlook for each segment.
We report results of our power generation business as three separate geographical segments as follows: (i) GEN-MW, (ii) GEN-WE and (iii) GEN-NE. Because of the diversity among their respective operations and how we allocate our resources, we report the results of each business as a separate segment in our consolidated financial statements. Our consolidated financial results also reflect corporate-level expenses such as general and administrative, interest and depreciation and amortization.
Summary Financial Information-Dynegy.
The following tables provide summary financial data regarding Dynegy’s consolidated and segmented results of operations for 2010, 2009 and 2008, respectively.
Dynegy’s Results of Operations for the Year Ended December 31, 2010
|
Power Generation
|
||||||||||||||||||||
|
GEN-MW
|
GEN-WE
|
GEN-NE
|
Other
|
Total
|
||||||||||||||||
|
(in millions)
|
||||||||||||||||||||
|
Revenues
|
$ | 1,126 | $ | 455 | $ | 742 | $ | — | $ | 2,323 | ||||||||||
|
Cost of sales
|
(516 | ) | (179 | ) | (486 | ) | — | (1,181 | ) | |||||||||||
|
Operating and maintenance expense, exclusive of depreciation and amortization expense shown separately below
|
(202 | ) | (91 | ) | (155 | ) | (2 | ) | (450 | ) | ||||||||||
|
Depreciation and amortization expense
|
(296 | ) | (66 | ) | (24 | ) | (6 | ) | (392 | ) | ||||||||||
|
Impairment and other charges
|
(4 | ) | (1 | ) | (137 | ) | (6 | ) | (148 | ) | ||||||||||
|
General and administrative expense
|
— | — | — | (163 | ) | (163 | ) | |||||||||||||
|
Operating income (loss)
|
$ | 108 | $ | 118 | $ | (60 | ) | $ | (177 | ) | $ | (11 | ) | |||||||
|
Losses from unconsolidated investments
|
(62 | ) | — | — | — | (62 | ) | |||||||||||||
|
Other items, net
|
1 | — | 1 | 2 | 4 | |||||||||||||||
|
Interest expense
|
(363 | ) | ||||||||||||||||||
|
Loss from continuing operations before income taxes
|
(432 | ) | ||||||||||||||||||
|
Income tax benefit
|
197 | |||||||||||||||||||
|
Loss from continuing operations
|
(235 | ) | ||||||||||||||||||
|
Income from discontinued operations, net of taxes
|
1 | |||||||||||||||||||
|
Net loss and net loss attributable to Dynegy Inc.
|
$ | (234 | ) | |||||||||||||||||
Dynegy’s Results of Operations for the Year Ended December 31, 2009
|
Power Generation
|
||||||||||||||||||||
|
GEN-MW
|
GEN-WE
|
GEN-NE
|
Other
|
Total
|
||||||||||||||||
|
(in millions)
|
||||||||||||||||||||
|
Revenues
|
$ | 1,257 | $ | 380 | $ | 834 | $ | (3 | ) | $ | 2,468 | |||||||||
|
Cost of sales
|
(505 | ) | (156 | ) | (534 | ) | 1 | (1,194 | ) | |||||||||||
|
Operating and maintenance expense, exclusive of depreciation and amortization expense shown separately below
|
(222 | ) | (120 | ) | (181 | ) | 4 | (519 | ) | |||||||||||
|
Depreciation and amortization expense
|
(215 | ) | (62 | ) | (47 | ) | (11 | ) | (335 | ) | ||||||||||
|
Goodwill impairments
|
(76 | ) | (260 | ) | (97 | ) | — | (433 | ) | |||||||||||
|
Impairment and other charges, exclusive of goodwill impairments shown separately above
|
(147 | ) | — | (391 | ) | — | (538 | ) | ||||||||||||
|
Loss on sale of assets
|
(96 | ) | — | (28 | ) | — | (124 | ) | ||||||||||||
|
General and administrative expense
|
— | — | — | (159 | ) | (159 | ) | |||||||||||||
|
Operating loss
|
$ | (4 | ) | $ | (218 | ) | $ | (444 | ) | $ | (168 | ) | $ | (834 | ) | |||||
|
Earnings (losses) from unconsolidated investments
|
— | (72 | ) | — | 1 | (71 | ) | |||||||||||||
|
Other items, net
|
2 | 3 | 1 | 5 | 11 | |||||||||||||||
|
Interest expense and debt extinguishment costs
|
(461 | ) | ||||||||||||||||||
|
Loss from continuing operations before income taxes
|
(1,355 | ) | ||||||||||||||||||
|
Income tax benefit
|
315 | |||||||||||||||||||
|
Loss from continuing operations
|
(1,040 | ) | ||||||||||||||||||
|
Loss from discontinued operations, net of taxes
|
(222 | ) | ||||||||||||||||||
|
Net loss
|
(1,262 | ) | ||||||||||||||||||
|
Less: Net loss attributable to the noncontrolling interests
|
(15 | ) | ||||||||||||||||||
|
Net loss attributable to Dynegy Inc.
|
$ | (1,247 | ) | |||||||||||||||||
Dynegy’s Results of Operations for the Year Ended December 31, 2008
|
Power Generation
|
||||||||||||||||||||
|
GEN-MW
|
GEN-WE
|
GEN-NE
|
Other
|
Total
|
||||||||||||||||
|
(in millions)
|
||||||||||||||||||||
|
Revenues
|
$ | 1,621 | $ | 702 | $ | 1,006 | $ | (5 | ) | $ | 3,324 | |||||||||
|
Cost of sales
|
(583 | ) | (415 | ) | (705 | ) | 10 | (1,693 | ) | |||||||||||
|
Operating and maintenance expense, exclusive of depreciation and amortization expense shown separately below
|
(203 | ) | (98 | ) | (180 | ) | 15 | (466 | ) | |||||||||||
|
Depreciation and amortization expense
|
(205 | ) | (77 | ) | (54 | ) | (10 | ) | (346 | ) | ||||||||||
|
Gain on sale of assets
|
56 | 11 | — | 15 | 82 | |||||||||||||||
|
General and administrative expense
|
— | — | — | (157 | ) | (157 | ) | |||||||||||||
|
Operating income (loss)
|
$ | 686 | $ | 123 | $ | 67 | $ | (132 | ) | $ | 744 | |||||||||
|
Losses from unconsolidated investments
|
— | (40 | ) | — | (83 | ) | (123 | ) | ||||||||||||
|
Other items, net
|
— | 5 | 6 | 73 | 84 | |||||||||||||||
|
Interest expense
|
(427 | ) | ||||||||||||||||||
|
Income from continuing operations before income taxes
|
278 | |||||||||||||||||||
|
Income tax expense
|
(90 | ) | ||||||||||||||||||
|
Income from continuing operations
|
188 | |||||||||||||||||||
|
Loss from discontinued operations, net of taxes
|
(17 | ) | ||||||||||||||||||
|
Net income
|
171 | |||||||||||||||||||
|
Less: Net loss attributable to the noncontrolling interests
|
(3 | ) | ||||||||||||||||||
|
Net income attributable to Dynegy Inc.
|
$ | 174 | ||||||||||||||||||
EBITDA and Adjusted EBITDA-Dynegy.
We define EBITDA as earnings (loss) before interest expense, income tax expense (benefit), and depreciation and amortization expense.
We define Adjusted EBITDA as EBITDA adjusted for certain items described below and presented in the accompanying reconciliation. Adjusted EBITDA is not a measure calculated in accordance with GAAP (a non-GAAP measure), and should be viewed as a supplement to and not a substitute for our results of operations presented in accordance with GAAP. Our Credit Facility includes a similar measure as a basis for certain financial covenants.
We believe that Adjusted EBITDA provides a meaningful representation of our operating performance. Adjusted EBITDA is meant to reflect the true operating performance of our power generation fleet; consequently, it excludes the impact of mark-to-market accounting and other items that could be considered
“
non-operating
”
or
“
non-core
”
in nature, and includes the contributions of those plants classified as discontinued operations. Because Adjusted EBITDA is a financial measure that management uses to allocate resources, determine Dynegy
’
s ability to fund capital expenditures, assess performance against its peers and evaluate overall financial performance, we believe it provides useful information for our investors. In addition, many analysts, fund managers and other stakeholders that communicate with us typically request our financial results in an Adjusted EBITDA format.
We believe that Adjusted EBITDA is only useful as an additional tool to help management and investors make informed decisions about Dynegy
’
s financial and operating performance. By definition, non-GAAP measures do not give a full understanding of Dynegy; therefore, to be truly valuable, they must be used in conjunction with the GAAP measures. Non-GAAP financial measures are not standardized; therefore, it may not be possible to compare Adjusted EBITDA with other companies
’
financial measures having the same or similar names. We strongly encourage investors to review our consolidated financial statements and publicly filed reports in their entirety and not rely on any single financial measure.
We use these non-GAAP financial measures in addition to, and in conjunction with, results presented in accordance with GAAP. These non-GAAP financial measures reflect an additional way of viewing aspects of our business that, when viewed with our GAAP results and the accompanying reconciliations to corresponding GAAP financial measures included in our results of operations, may provide a more complete understanding of factors and trends affecting our business. These non-GAAP financial measures should not be relied upon to the exclusion of GAAP financial measures and are by definition an incomplete understanding of Dynegy, and must be considered in conjunction with GAAP measures.
In summary, our management uses Adjusted EBITDA as a measure of operating performance to assist in comparing performance from period to period on a consistent basis and to readily view operating trends, as a measure for planning and forecasting overall expectations and for evaluating actual results against such expectations, and in communications with Dynegy
’
s Board of Directors, stockholders, creditors, analysts and investors concerning our financial performance.
When Adjusted EBITDA is discussed in reference to performance on a consolidated basis, the most directly comparable GAAP financial measure to Adjusted EBITDA is net income (loss) attributable to Dynegy. Further, because management does not allocate interest expense and income taxes on a segment level, the most directly comparable GAAP financial measure to Adjusted EBITDA when performance is discussed on a segment level or plant level is Operating income (loss).
The tables below provide a reconciliation of Adjusted EBITDA to our income (loss) from operations on a segment basis and to net income attributable to Dynegy on a consolidated basis for years ended December 31, 2010, 2009 and 2008, respectively.
Dynegy’s Adjusted EBITDA for the Year Ended December 31, 2010
|
Power Generation
|
||||||||||||||||||||
|
GEN-MW
|
GEN-WE
|
GEN-NE
|
Other
|
Total
|
||||||||||||||||
|
(in millions)
|
||||||||||||||||||||
|
Net loss and net loss attributable to Dynegy Inc.
|
$ | (234 | ) | |||||||||||||||||
|
Income tax benefit
|
(197 | ) | ||||||||||||||||||
|
Interest expense
|
363 | |||||||||||||||||||
|
Losses from unconsolidated investments
|
62 | |||||||||||||||||||
|
Income from discontinued operations, net of taxes
|
(1 | ) | ||||||||||||||||||
|
Other items, net
|
(4 | ) | ||||||||||||||||||
|
Operating income (loss)
|
$ | 108 | $ | 118 | $ | (60 | ) | $ | (177 | ) | $ | (11 | ) | |||||||
|
Depreciation and amortization expense
|
296 | 66 | 24 | 6 | 392 | |||||||||||||||
| Losses from unconsolidated investments | (62 | ) | — | — | — | (62 | ) | |||||||||||||
| Other items, net | 1 | — | 1 | 2 | 4 | |||||||||||||||
| EBITDA from continuing operations | 343 | 184 | (35 | ) | (169 | ) | 323 | |||||||||||||
| EBITDA from discontinued operations | — | 1 | — | — | 1 | |||||||||||||||
| EBITDA | 343 | 185 | (35 | ) | (169 | ) | 324 | |||||||||||||
|
Impairments
|
37 | — | 136 | — | 173 | |||||||||||||||
| Loss on sale of PPEA Holding | 28 | — | — | — | 28 | |||||||||||||||
|
Merger Agreement transaction costs
|
— | — | — | 26 | 26 | |||||||||||||||
|
Restructuring charges
|
4 | 1 | 1 | 6 | 12 | |||||||||||||||
|
Plum Point mark-to-market gains
|
(6 | ) | — | — | — | (6 | ) | |||||||||||||
|
Mark-to-market gains, net
|
12 | (33 | ) | 3 | — | (18 | ) | |||||||||||||
|
Adjusted EBITDA
|
$ | 418 | $ | 153 | $ | 105 | $ | (137 | ) | $ | 539 | |||||||||
Dynegy’s Adjusted EBITDA for the Year Ended December 31, 2009
|
Power Generation
|
||||||||||||||||||||
|
GEN-MW
|
GEN-WE
|
GEN-NE
|
Other
|
Total
|
||||||||||||||||
|
(in millions)
|
||||||||||||||||||||
|
Net loss attributable to Dynegy Inc.
|
$ | (1,247 | ) | |||||||||||||||||
|
Income tax benefit
|
(315 | ) | ||||||||||||||||||
|
Interest expense
|
461 | |||||||||||||||||||
|
Losses from unconsolidated investments
|
71 | |||||||||||||||||||
|
Loss from discontinued operations, net of taxes
|
222 | |||||||||||||||||||
|
Net loss attributable to noncontrolling interests
|
(15 | ) | ||||||||||||||||||
|
Other items, net
|
(11 | ) | ||||||||||||||||||
|
Operating loss
|
$ | (4 | ) | $ | (218 | ) | $ | (444 | ) | $ | (168 | ) | $ | (834 | ) | |||||
|
Other items
|
2 | 3 | 1 | 5 | 11 | |||||||||||||||
|
Depreciation and amortization expense
|
215 | 62 | 47 | 11 | 335 | |||||||||||||||
|
Earnings (losses) from unconsolidated investments
|
— | (72 | ) | — | 1 | (71 | ) | |||||||||||||
|
Net loss attributable to noncontrolling interests
|
15 | — | — | — | 15 | |||||||||||||||
|
EBITDA from continuing operations
|
228 | (225 | ) | (396 | ) | (151 | ) | (544 | ) | |||||||||||
|
EBITDA from discontinued operations
|
(46 | ) | (282 | ) | — | — | (328 | ) | ||||||||||||
|
EBITDA
|
182 | (507 | ) | (396 | ) | (151 | ) | (872 | ) | |||||||||||
|
Goodwill impairments
|
76 | 260 | 97 | — | 433 | |||||||||||||||
|
Impairments and other charges (1)
|
170 | 235 | 391 | — | 796 | |||||||||||||||
|
Loss on LS Power Transactions
|
118 | 82 | 28 | — | 228 | |||||||||||||||
|
Gain on sale of Heard County (2)
|
— | (10 | ) | — | — | (10 | ) | |||||||||||||
|
Loss on sale of Sandy Creek
|
— | 84 | — | — | 84 | |||||||||||||||
|
Sandy Creek mark-to-market gains
|
— | (21 | ) | — | — | (21 | ) | |||||||||||||
|
Mark-to-market losses, net
|
112 | 58 | 10 | — | 180 | |||||||||||||||
|
Net loss attributable to noncontrolling interests
|
(15 | ) | — | — | — | (15 | ) | |||||||||||||
|
Adjusted EBITDA
|
$ | 643 | $ | 181 | $ | 130 | $ | (151 | ) | $ | 803 | |||||||||
|
|
(1)
|
Includes $235 million and $23 million of impairment charges related to our Arizona and Bluegrass power generation facilities, respectively, which are included in discontinued operations.
|
|
|
(2)
|
Included in discontinued operations.
|
Dynegy’s Adjusted EBITDA for the Year Ended December 31, 2008
|
Power Generation
|
||||||||||||||||||||
|
GEN-MW
|
GEN-WE
|
GEN-NE
|
Other
|
Total
|
||||||||||||||||
|
(in millions)
|
||||||||||||||||||||
|
Net income attributable to Dynegy Inc.
|
$ | 174 | ||||||||||||||||||
|
Income tax expense
|
90 | |||||||||||||||||||
|
Interest expense
|
427 | |||||||||||||||||||
|
Losses from unconsolidated investments
|
123 | |||||||||||||||||||
|
Loss from discontinued operations, net of taxes
|
17 | |||||||||||||||||||
|
Net loss attributable to noncontrolling interests
|
(3 | ) | ||||||||||||||||||
|
Other items, net
|
(84 | ) | ||||||||||||||||||
|
Operating income (loss)
|
$ | 686 | $ | 123 | $ | 67 | $ | (132 | ) | $ | 744 | |||||||||
|
Depreciation and amortization expense
|
205 | 77 | 54 | 10 | 346 | |||||||||||||||
|
Losses from unconsolidated investments
|
— | (40 | ) | — | (83 | ) | (123 | ) | ||||||||||||
|
Other items
|
— | 5 | 6 | 73 | 84 | |||||||||||||||
|
Net loss attributable to noncontrolling interests
|
3 | — | — | — | 3 | |||||||||||||||
|
EBITDA from continuing operations
|
894 | 165 | 127 | (132 | ) | 1,054 | ||||||||||||||
|
EBITDA from discontinued operations
|
(1 | ) | (9 | ) | — | 4 | (6 | ) | ||||||||||||
|
EBITDA
|
893 | 156 | 127 | (128 | ) | 1,048 | ||||||||||||||
|
Gain on sale of Rolling Hills
|
(56 | ) | — | — | — | (56 | ) | |||||||||||||
|
Impairment of equity investment
|
— | — | — | 24 | 24 | |||||||||||||||
|
Loss on dissolution of equity investment
|
— | — | — | 47 | 47 | |||||||||||||||
|
Asset impairments
|
— | 47 | — | — | 47 | |||||||||||||||
|
Sandy Creek mark-to-market losses
|
— | 40 | — | — | 40 | |||||||||||||||
|
Gain on liquidation of foreign entity
|
— | — | — | (24 | ) | (24 | ) | |||||||||||||
|
Release of state franchise tax and sales tax liabilities
|
— | — | — | (16 | ) | (16 | ) | |||||||||||||
|
Gain on sale of NYMEX shares
|
— | — | — | (15 | ) | (15 | ) | |||||||||||||
|
Gain on sale of Sandy Creek ownership interest
|
— | (13 | ) | — | — | (13 | ) | |||||||||||||
|
Gain on sale of Oyster Creek ownership interest
|
— | (11 | ) | — | — | (11 | ) | |||||||||||||
|
Mark-to-market gains, net
|
(191 | ) | (51 | ) | (11 | ) | — | (253 | ) | |||||||||||
|
Adjusted EBITDA
|
$ | 646 | $ | 168 | $ | 116 | $ | (112 | ) | $ | 818 | |||||||||
67
Summary Financial Information-DHI.
The following tables provide summary financial data regarding DHI’s consolidated and segmented results of operations for 2010, 2009 and 2008, respectively.
DHI’s Results of Operations for the Year Ended December 31, 2010
|
Power Generation
|
||||||||||||||||||||
|
GEN-MW
|
GEN-WE
|
GEN-NE
|
Other
|
Total
|
||||||||||||||||
|
(in millions)
|
||||||||||||||||||||
|
Revenues
|
$ | 1,126 | $ | 455 | $ | 742 | $ | — | $ | 2,323 | ||||||||||
|
Cost of sales
|
(516 | ) | (179 | ) | (486 | ) | — | (1,181 | ) | |||||||||||
|
Operating and maintenance expense, exclusive of depreciation and amortization expense shown separately below
|
(202 | ) | (91 | ) | (155 | ) | (2 | ) | (450 | ) | ||||||||||
|
Depreciation and amortization expense
|
(296 | ) | (66 | ) | (24 | ) | (6 | ) | (392 | ) | ||||||||||
|
Impairment and other charges
|
(4 | ) | (1 | ) | (137 | ) | (6 | ) | (148 | ) | ||||||||||
|
General and administrative expense
|
— | — | — | (158 | ) | (158 | ) | |||||||||||||
|
Operating income (loss)
|
$ | 108 | $ | 118 | $ | (60 | ) | $ | (172 | ) | $ | (6 | ) | |||||||
|
Losses from unconsolidated investments
|
(62 | ) | — | — | — | (62 | ) | |||||||||||||
|
Other items, net
|
1 | — | 1 | 2 | 4 | |||||||||||||||
|
Interest expense
|
(363 | ) | ||||||||||||||||||
|
Loss from continuing operations before income taxes
|
(427 | ) | ||||||||||||||||||
|
Income tax benefit
|
184 | |||||||||||||||||||
|
Loss from continuing operations
|
(243 | ) | ||||||||||||||||||
|
Income from discontinued operations, net of taxes
|
1 | |||||||||||||||||||
|
Net loss
|
$ | (242 | ) | |||||||||||||||||
DHI’s Results of Operations for the Year Ended December 31, 2009
|
Power Generation
|
||||||||||||||||||||
|
GEN-MW
|
GEN-WE
|
GEN-NE
|
Other
|
Total
|
||||||||||||||||
|
(in millions)
|
||||||||||||||||||||
|
Revenues
|
$ | 1,257 | $ | 380 | $ | 834 | $ | (3 | ) | $ | 2,468 | |||||||||
|
Cost of sales
|
(505 | ) | (156 | ) | (534 | ) | 1 | (1,194 | ) | |||||||||||
|
Operating and maintenance expense, exclusive of depreciation and amortization expense shown separately below
|
(222 | ) | (120 | ) | (181 | ) | 2 | (521 | ) | |||||||||||
|
Depreciation and amortization expense
|
(215 | ) | (62 | ) | (47 | ) | (11 | ) | (335 | ) | ||||||||||
|
Goodwill impairments
|
(76 | ) | (260 | ) | (97 | ) | — | (433 | ) | |||||||||||
|
Impairment and other charges, exclusive of goodwill impairments shown separately above
|
(147 | ) | — | (391 | ) | — | (538 | ) | ||||||||||||
|
Loss on sale of assets
|
(96 | ) | — | (28 | ) | — | (124 | ) | ||||||||||||
|
General and administrative expense
|
— | — | — | (159 | ) | (159 | ) | |||||||||||||
|
Operating loss
|
$ | (4 | ) | $ | (218 | ) | $ | (444 | ) | $ | (170 | ) | $ | (836 | ) | |||||
|
Losses from unconsolidated investments
|
— | (72 | ) | — | — | (72 | ) | |||||||||||||
|
Other items, net
|
2 | 3 | 1 | 4 | 10 | |||||||||||||||
|
Interest expense and debt extinguishment costs
|
(461 | ) | ||||||||||||||||||
|
Loss from continuing operations before income taxes
|
(1,359 | ) | ||||||||||||||||||
|
Income tax benefit
|
313 | |||||||||||||||||||
|
Loss from continuing operations
|
(1,046 | ) | ||||||||||||||||||
|
Loss from discontinued operations, net of taxes
|
(222 | ) | ||||||||||||||||||
|
Net loss
|
(1,268 | ) | ||||||||||||||||||
|
Less: Net loss attributable to the noncontrolling interests
|
(15 | ) | ||||||||||||||||||
|
Net loss attributable to Dynegy Holdings Inc.
|
$ | (1,253 | ) | |||||||||||||||||
DHI’s Results of Operations for the Year Ended December 31, 2008
|
Power Generation
|
||||||||||||||||||||
|
GEN-MW
|
GEN-WE
|
GEN-NE
|
Other
|
Total
|
||||||||||||||||
|
(in millions)
|
||||||||||||||||||||
|
Revenues
|
$ | 1,621 | $ | 702 | $ | 1,006 | $ | (5 | ) | $ | 3,324 | |||||||||
|
Cost of sales
|
(583 | ) | (415 | ) | (705 | ) | 10 | (1,693 | ) | |||||||||||
|
Operating and maintenance expense, exclusive of depreciation and amortization expense shown separately below
|
(203 | ) | (98 | ) | (180 | ) | 15 | (466 | ) | |||||||||||
|
Depreciation and amortization expense
|
(205 | ) | (77 | ) | (54 | ) | (10 | ) | (346 | ) | ||||||||||
|
Gain on sale of assets
|
56 | 11 | — | 15 | 82 | |||||||||||||||
|
General and administrative expense
|
— | — | — | (157 | ) | (157 | ) | |||||||||||||
|
Operating income (loss)
|
$ | 686 | $ | 123 | $ | 67 | $ | (132 | ) | $ | 744 | |||||||||
|
Losses from unconsolidated investments
|
— | (40 | ) | — | — | (40 | ) | |||||||||||||
|
Other items, net
|
— | 5 | 6 | 72 | 83 | |||||||||||||||
|
Interest expense
|
(427 | ) | ||||||||||||||||||
|
Income from continuing operations before income taxes
|
360 | |||||||||||||||||||
|
Income tax expense
|
(138 | ) | ||||||||||||||||||
|
Income from continuing operations
|
222 | |||||||||||||||||||
|
Loss from discontinued operations, net of taxes
|
(17 | ) | ||||||||||||||||||
|
Net income
|
205 | |||||||||||||||||||
|
Less: Net loss attributable to the noncontrolling interests
|
(3 | ) | ||||||||||||||||||
|
Net income attributable to Dynegy Holdings Inc.
|
$ | 208 | ||||||||||||||||||
The following table provides summary operating statistics by segment for the years ended December 31, 2010, 2009 and 2008, respectively:
|
Year Ended December 31,
|
||||||||||||
|
2010
|
2009
|
2008
|
||||||||||
|
GEN-MW
|
||||||||||||
|
Million Megawatt Hours Generated (1) (2)
|
26.4 | 24.9 | 24.4 | |||||||||
|
In Market Availability for Coal Fired Facilities (3)
|
91 | % | 90 | % | 90 | % | ||||||
|
Average Capacity Factor for Combined Cycle Facilities (4)
|
26 | % | 29 | % | 16 | % | ||||||
|
Average Quoted On-Peak Market Power Prices ($/MWh) (5):
|
||||||||||||
|
Cinergy (Cin Hub)
|
$ | 42 | $ | 35 | $ | 67 | ||||||
|
Commonwealth Edison (NI Hub)
|
$ | 41 | $ | 35 | $ | 66 | ||||||
|
PJM West
|
$ | 54 | $ | 45 | $ | 84 | ||||||
|
Average On-Peak Market Spark Spreads ($/MWh) (6):
|
||||||||||||
|
PJM West
|
$ | 19 | $ | 12 | $ | 15 | ||||||
|
GEN-WE
|
||||||||||||
|
Million Megawatt Hours Generated (7) (8)
|
4.0 | 5.6 | 8.6 | |||||||||
|
Average Capacity Factor for Combined Cycle Facilities (4)
|
36 | % | 41 | % | 65 | % | ||||||
|
Average Quoted On-Peak Market Power Prices ($/MWh) (5):
|
||||||||||||
|
North Path 15 (NP 15)
|
$ | 40 | $ | 39 | $ | 80 | ||||||
|
Average On-Peak Market Spark Spreads ($/MWh) (6):
|
||||||||||||
|
North Path 15 (NP 15)
|
$ | 6 | $ | 8 | $ | 18 | ||||||
|
GEN-NE
|
||||||||||||
|
Million Megawatt Hours Generated
|
8.3 | 10.2 | 7.9 | |||||||||
|
In Market Availability for Coal Fired Facilities (3)
|
95 | % | 95 | % | 91 | % | ||||||
|
Average Capacity Factor for Combined Cycle Facilities (4)
|
47 | % | 44 | % | 25 | % | ||||||
|
Average Quoted On-Peak Market Power Prices ($/MWh) (5):
|
||||||||||||
|
New York—Zone G
|
$ | 59 | $ | 50 | $ | 101 | ||||||
|
New York—Zone A
|
$ | 44 | $ | 36 | $ | 68 | ||||||
|
Mass Hub
|
$ | 56 | $ | 46 | $ | 91 | ||||||
|
Average On-Peak Market Spark Spreads ($/MWh) (6):
|
||||||||||||
|
New York—Zone A
|
$ | 9 | $ | 4 | $ | 3 | ||||||
|
Mass Hub
|
$ | 18 | $ | 12 | $ | 23 | ||||||
|
Fuel Oil
|
$ | (72 | ) | $ | (53 | ) | $ | (37 | ) | |||
|
Average natural gas price—Henry Hub ($/MMBtu) (9)
|
$ | 4.38 | $ | 3.92 | $ | 8.85 | ||||||
|
|
(1)
|
Excludes less than 0.1 million MWh generated by our Bluegrass power generation facility, which we sold on November 30, 2009 and is reported in discontinued operations, for the years ended December 31, 2009 and 2008.
|
|
|
(2)
|
Includes 0.2 million MWh generated by our GEN-MW investment in the Plum Point power generation facility for the year ended December 31, 2010. Our investment in this facility was sold on November 10, 2010.
|
|
|
(3)
|
Reflects the percentage of generation available during periods when market prices are such that these units could be profitably dispatched.
|
|
|
(4)
|
Reflects actual production as a percentage of available capacity. Excludes the Arizona power generation facilities which are reported as discontinued operations with respect to the GEN-WE segment.
|
|
|
(5)
|
Reflects the average of day-ahead quoted prices for the periods presented and does not necessarily reflect prices we realized.
|
|
|
(6)
|
Reflects the simple average of the spark spread available to either a 7.0 MMBtu/MWh heat rate generator or an 11.0 MMBtu/MWh heat rate fuel oil-fired generator selling power at day-ahead prices and buying delivered natural gas or fuel oil at a daily cash market price and does not necessarily reflect spark spreads available to us.
|
|
|
(7)
|
Includes 0.4 million MWh generated by our GEN-WE investment in the Black Mountain power generation facility for the years ended December 31, 2010, 2009 and 2008, respectively.
|
|
|
(8)
|
Excludes less than 0.1 million MWh generated by our Calcasieu and Heard County power generation facilities, which we sold on March 31, 2008 and April 30, 2009, respectively, and are reported in discontinued operations, for the years ended December 31, 2009 and 2008. Excludes approximately 2.4 million MWh and 2.6 million MWh generated by our Arizona power generation facilities, which we sold on November 30, 2009 and is reported in discontinued operations, for the years ended December 31, 2009 and 2008, respectively.
|
|
|
(9)
|
Reflects the average of daily quoted prices for the periods presented and does not reflect costs incurred by the Company.
|
The following tables summarize significant items on a pre-tax basis, with the exception of the tax items, affecting net income (loss) for the periods presented.
|
Year Ended December 31, 2010
|
||||||||||||||||||||
|
Power Generation
|
||||||||||||||||||||
|
GEN-MW
|
GEN-WE
|
GEN-NE
|
Other
|
Total
|
||||||||||||||||
|
(in millions)
|
||||||||||||||||||||
|
Impairments and other charges (1)
|
$ | (41 | ) | $ | (1 | ) | $ | (137 | ) | $ | (6 | ) | $ | (185 | ) | |||||
|
Loss on sale of PPEA Holding (2)
|
(28 | ) | — | — | — | (28 | ) | |||||||||||||
|
Merger Agreement transaction costs (3)
|
— | — | — | (26 | ) | (26 | ) | |||||||||||||
|
Taxes (4)
|
— | — | — | 20 | 20 | |||||||||||||||
|
Total—DHI
|
(69 | ) | (1 | ) | (137 | ) | (12 | ) | (219 | ) | ||||||||||
|
Taxes (4)
|
— | — | — | 10 | 10 | |||||||||||||||
|
Total—Dynegy
|
$ | (69 | ) | $ | (1 | ) | $ | (137 | ) | $ | (2 | ) | $ | (209 | ) | |||||
|
|
(1)
|
Includes $37 million of impairment charges related to our equity investment in PPEA Holding, which is included in Losses from unconsolidated investments. Also includes $134 million and $2 million of impairment charges related to our Casco Bay and Roseton/Danskammer power generation facilities, respectively and $12 million related to restructuring charges in connection with a reduction in workforce and the closure of certain power generation facilities. These charges are included in Impairment and other charges on our consolidated statements of operations.
|
|
|
(2)
|
The loss on sale of our investment in PPEA Holding represents the recognition of $28 million in losses on interest rate swaps that were previously deferred in Accumulated other comprehensive loss. These charges are included in Losses from unconsolidated investments on our consolidated statements of operations.
|
|
|
(3)
|
Includes $26 million of expenses in connection with our prior proposed merger with an affiliate of The Blackstone Group. These expenses are included in General and Administrative expenses on our consolidated statements of operations.
|
|
|
(4)
|
Includes a benefit of $12 million for Dynegy and $8 million for DHI related to a change in California state tax law and a benefit of $18 million for Dynegy and $12 million for DHI related to the release of a reserve for uncertain tax positions as a result of completion of an audit, adjustments to tax positions related to prior years and various state settlements.
|
|
Year Ended December 31, 2009
|
||||||||||||||||||||
|
Power Generation
|
||||||||||||||||||||
|
GEN-MW
|
GEN-WE
|
GEN-NE
|
Other
|
Total
|
||||||||||||||||
|
(in millions)
|
||||||||||||||||||||
|
Impairments (1)
|
$ | (246 | ) | $ | (495 | ) | $ | (488 | ) | $ | — | $ | (1,229 | ) | ||||||
|
Loss on extinguishment of debt (2)
|
— | — | — | (46 | ) | (46 | ) | |||||||||||||
|
Loss on LS Power Transactions (3)
|
(118 | ) | (82 | ) | (28 | ) | — | (228 | ) | |||||||||||
|
Loss on sale of Sandy Creek Project (4)
|
— | (84 | ) | — | — | (84 | ) | |||||||||||||
|
Sandy Creek Project mark-to-market gains (5)
|
— | 21 | — | — | 21 | |||||||||||||||
|
Gain on sale of Heard County (6)
|
— | 10 | — | — | 10 | |||||||||||||||
|
Taxes (7)
|
— | — | — | (26 | ) | (26 | ) | |||||||||||||
|
Total—DHI
|
(364 | ) | (630 | ) | (516 | ) | (72 | ) | (1,582 | ) | ||||||||||
|
Taxes (7)
|
— | — | — | (7 | ) | (7 | ) | |||||||||||||
|
Total—Dynegy
|
$ | (364 | ) | $ | (630 | ) | $ | (516 | ) | $ | (79 | ) | $ | (1,589 | ) | |||||
|
|
(1)
|
Includes $235 million and $23 million of impairment charges related to our Arizona and Bluegrass power generation facilities, respectively, which are included in discontinued operations.
|
|
|
(2)
|
Related to debt extinguishment costs for repurchase of the 2011 Notes and the 2012 Notes during the fourth quarter 2009.
|
|
|
(3)
|
Includes $82 million and $22 million of losses related to our Arizona and Bluegrass power generation facilities, respectively, which are included in discontinued operations.
|
|
|
(4)
|
The loss on sale of Dynegy’s investment in the Sandy Creek Project to LS Power includes the recognition of $40 million in losses on interest rate swaps that were previously deferred in Accumulated other comprehensive loss on our consolidated balance sheets. These charges are included in Losses from unconsolidated investments on our consolidated statements of operations.
|
|
|
(5)
|
These mark-to-market gains represent our 50 percent share prior to the sale.
|
|
|
(6)
|
Included in discontinued operations.
|
|
|
(7)
|
Includes charges of $21 million for Dynegy and $16 million for DHI related to a change in California state law and charges of $12 million for Dynegy and $10 million for DHI due to revised assumptions around our ability to use certain state deferred tax assets.
|
|
Year Ended December 31, 2008
|
||||||||||||||||||||
|
Power Generation
|
||||||||||||||||||||
|
GEN-MW
|
GEN-WE
|
GEN-NE
|
Other
|
Total
|
||||||||||||||||
|
(in millions)
|
||||||||||||||||||||
|
Gain on sale of Rolling Hills
|
$ | 56 | $ | — | $ | — | $ | — | $ | 56 | ||||||||||
|
Release of state franchise tax and sales tax liability
|
— | — | — | 16 | 16 | |||||||||||||||
|
Gain on sale of NYMEX shares
|
— | — | — | 15 | 15 | |||||||||||||||
|
Gain on sale of Oyster Creek ownership interest
|
— | 11 | — | — | 11 | |||||||||||||||
|
Gain on sale of Sandy Creek Project ownership interest
|
— | 13 | — | — | 13 | |||||||||||||||
|
Gain on liquidation of foreign entity
|
— | — | — | 24 | 24 | |||||||||||||||
|
Sandy Creek Project mark-to-market losses (1)
|
— | (40 | ) | — | — | (40 | ) | |||||||||||||
|
Taxes (2)
|
— | — | — | 12 | 12 | |||||||||||||||
|
Heard County impairment (3)
|
— | (47 | ) | — | — | (47 | ) | |||||||||||||
|
Total—DHI
|
$ | 56 | $ | (63 | ) | $ | — | $ | 67 | $ | 60 | |||||||||
|
Impairment of equity investment
|
— | — | — | (24 | ) | (24 | ) | |||||||||||||
|
Loss on dissolution of equity investment
|
— | — | — | (47 | ) | (47 | ) | |||||||||||||
|
Taxes (2)
|
— | — | — | 6 | 6 | |||||||||||||||
|
Total—Dynegy
|
$ | 56 | $ | (63 | ) | $ | — | $ | 2 | $ | (5 | ) | ||||||||
|
|
(1)
|
These mark-to-market losses represent our 50 percent share.
|
|
|
(2)
|
Represents the benefit of adjustments arising from the measurement of temporary differences.
|
|
|
(3)
|
Included in discontinued operations.
|
Year Ended 2010 Compared to Year Ended 2009
Operating Income (Loss)
Operating loss for Dynegy was $11 million for the year ended December 31, 2010, compared to an operating loss of $834 million for the year ended December 31, 2009. Operating loss for DHI was $6 million for the year ended December 31, 2010, compared to an operating loss of $836 million for the year ended December 31, 2009.
Our operating loss for the year ended December 31, 2010 includes a pre-tax asset impairment of $134 million related to our Casco Bay power generating facility and related assets and $2 million related to the asset impairment of our Roseton and Danskammer power generation facilities. Our operating loss for the year ended December 31, 2009 was driven, in large part, by $538 million of asset impairments, a $433 million impairment of goodwill and a $124 million fourth quarter 2009 loss on the closing of the LS Power Transactions. Please read Note 16—Goodwill for further discussion of the goodwill impairments, Note 7—Impairment and Restructuring Charges for further discussion of the asset impairments and Note 4—Dispositions, Contract Terminations and Discontinued Operations—Dispositions—LS Power Transactions for further discussion of the loss on the LS Power Transactions.
Mark-to-market gains (losses) on commodity derivative instruments associated with our generating assets are included in Revenues in the consolidated statements of operations. Such gains totaled $21 million for the year ended December 31, 2010, compared to $180 million of mark-to-market losses for the year ended December 31, 2009. The gains in 2010 reflect an increase in the value of positions due to decreasing forward market prices, partially offset by the impact of the settlement of risk management positions that matured during the year. The losses in 2009 were a result of the impact of the settlement of risk management positions that matured during 2009, for which earnings were recognized in prior periods.
We do not designate our commodity derivative instruments as cash flow hedges for accounting purposes. Please read Note 8—Risk Management Activities, Derivatives and Financial Instruments for further discussion. The resulting mark-to-market accounting treatment results in the immediate recognition of gains and losses within revenues in the consolidated statements of operations due to changes in the fair value of the derivative instruments. As a result, these mark-to-market gains and losses are not reflected in the consolidated statements of operations in the same period as the underlying power sales from generation activity for which the derivative instruments serve as economic hedges. The expected cash impact of the settlement of our open positions (which amounted to a $34 million net asset at December 31, 2010) will be recognized over time largely through the end of 2011 and 2012 based on the prices at which such positions are contracted. Our overall mark-to-market position and the related mark-to-market value will change as we buy or sell volumes within the forward market and as forward commodity prices fluctuate.
Power Generation—Midwest Segment.
Operating income for GEN-MW was $108 million for the year ended December 31, 2010, compared to an operating loss of $4 million for the year ended December 31, 2009. Operating income for the year ended December 31, 2009 included a pre-tax charge of approximately $76 million for the impairment of goodwill, reflected in Goodwill impairments in our consolidated statement of operations, and also included is a pre-tax charge of approximately $147 million for the impairments of the Renaissance, Riverside/Foothills, Rocky Road and Tilton power generating facilities and related assets, reflected in Impairment and other charges on our consolidated statements of operations. Please read Note 16—Goodwill for further discussion of the goodwill impairments and Note 7—Impairment and Restructuring Charges for further discussion of the asset impairments. In addition, operating income for the year ended December 31, 2009 also included a $96 million pre-tax charge from the sale of our Renaissance, Riverside/Foothills, Rocky Road and Tilton power generating facilities to LS Power, reflected in Gain (loss) on sale of assets in our consolidated statements of operations.
Revenues for the year ended December 31, 2010 decreased by $131 million compared to the year ended December 31, 2009, cost of sales increased by $11 million and operating and maintenance expense decreased by $20 million, resulting in a net decrease of $122 million. The decrease was primarily driven by the following:
|
|
●
|
Energy sales – GEN-MW’s results from energy sales, including both physical and financial transactions, decreased from $701 million for the year ended December 31, 2009 to $483 million for the year ended December 31, 2010. The contribution from physical transactions increased primarily as a result of higher power prices at our coal fired facilities and improved spark spreads at our combined cycle facilities, partially offset by more unplanned outages as well as the impact of a $50 million payment received for the year ended December 31, 2009 to assign our rights to a third party pursuant to a power sales agreement. These increases were more than offset by reduced contribution from financial transactions; and
|
|
|
●
|
Decreased tolling/capacity revenues of $24 million – Tolling and capacity revenues decreased $38 million as a result of the sale of assets in the fourth quarter 2009 and another $27 million due to lower capacity prices in MISO. These decreases were partially offset by $12 million due to the monetization and replacement, at a lower volume, of a tolling agreement on the Kendall facility and a $29 million increase attributable to higher PJM capacity prices and the additional capacity made available by the termination of the previous Kendall tolling agreement.
|
These items were partly offset by the following:
|
|
●
|
Reduced Mark-to-market losses – GEN-MW’s results for the year ended December 31, 2010 included mark-to-market losses of $12 million related to forward sales and other derivative contracts, compared to $112 million of mark-to-market losses for the year ended December 31, 2009. The $12 million in 2010 mark-to-market losses reflects $68 million of losses related to positions that settled in 2010, largely offset by $56 million of gains related to positions that will settle in 2011 and beyond; and
|
|
●
|
Decreased operating and maintenance expenses – operating and maintenance expenses decreased from $222 million for the year ended December 31, 2009 to $202 million for the year ended December 31, 2010, primarily as a result of the sale of certain Midwest assets to LS Power in the fourth quarter 2009 as well as lower planned outage expenses.
|
Depreciation expense increased from $215 million for the year ended December 31, 2009 to $296 million for the year ended December 31, 2010, primarily as a result of accelerating the depreciation of our Vermilion facility, as we do not currently expect the facility to continue to operate beyond the first quarter 2011. In addition, capital projects associated with the Midwest Consent Decree and early retirement of Wood River units 1-3 and Havana units 1-5 also increased depreciation expense. This increase in depreciation was partly offset by the impact of the sale of certain Midwest assets to LS Power in 2009.
Power Generation—West Segment.
Operating income for GEN-WE was $118 million for the year ended December 31, 2010, compared to an operating loss of $218 million for the year ended December 31, 2009. Operating loss for the year ended December 31, 2009 included a pre-tax charge of approximately $260 million for the impairment of goodwill, reflected in Goodwill impairments on our consolidated statements of operations.
Revenues for the year ended December 31, 2010 increased by $75 million compared to the year ended December 31, 2009, cost of sales increased by $23 million and operating and maintenance expense decreased by $29 million, resulting in a net increase of $81 million. The increase was primarily driven by the following:
|
|
●
|
Mark-to-market gains – GEN-WE’s results for the year ended December 31, 2010 included mark to-market gains of $30 million, compared to $58 million of mark-to-market losses for the year ended December 31, 2009. Of the $30 million in 2010 mark-to-market gains, $5 million related to positions that settled in 2010, and the remaining $25 million related to positions that will settle in 2011 and beyond; and
|
|
|
●
|
Decreased operating and maintenance expenses – operating and maintenance expenses decreased from $120 million for the year ended December 31, 2009 to $91 million for the year ended December 31, 2010, primarily as a result of planned outages at our Moss Landing facility in 2009, the retirement of two units at our South Bay facility in 2009 and lower maintenance expenses.
|
These items were partly offset by the following:
|
|
●
|
Energy sales – GEN-WE’s results from energy sales, including both physical and financial transactions, decreased from $100 million for the year ended December 31, 2009 to $81 million for the year ended December 31, 2010. The contribution from physical transactions decreased primarily as a result of reduced spark spreads and forced outages. The contribution from financial transactions also decreased; and
|
|
|
●
|
Decreased tolling/RMR revenues of $16 million – Tolling/RMR revenues decreased primarily as a result of lower contracted prices and less contracted volumes for South Bay, Moss Landing unplanned outages and lower variable revenues.
|
Depreciation expense increased from $62 million for year ended December 31, 2009 to $66 million for the year ended December 31, 2010, as a result of capital projects placed into service.
Power Generation—Northeast Segment.
Operating loss for GEN-NE was $60 million for the year ended December 31, 2010, compared to an operating loss of $444 million for the year ended December 31, 2009. Operating loss for the year ended December 31, 2010 includes pre-tax charges of approximately $134 million for the impairment of our Casco Bay facility and related assets and $2 million of impairment charges related to our Roseton/Danskammer power generation facilities which are reflected in Impairment and other charges in our consolidated statements of operations. Operating loss for the year ended December 31, 2009 included a pre-tax charge of approximately $97 million for the impairment of goodwill reflected in Goodwill impairments in our consolidated statements of operations. In 2009, we also recorded a pre-tax charge of approximately $179 million for the impairment of our Bridgeport power generating facility and related assets as well as a pre-tax charge of approximately $212 million for the impairment of our Roseton and Danskammer power generation facilities and related assets which are reflected in Impairment and other charges in our consolidated statements of operations. Please read Note 7—Impairment and Restructuring Charges for further discussion. Operating loss for the year ended December 31, 2009 also included a $28 million pre-tax charge from the sale of our Bridgeport power generating facility to LS Power, reflected in Gain (loss) on sale of assets in our consolidated statements of operations.
Revenues for the year ended December 31, 2010 decreased by $92 million compared to the year ended December 31, 2009, cost of sales decreased by $48 million and operating and maintenance expense decreased by $26 million, resulting in a net decrease of $18 million. The decrease was primarily driven by the following:
|
|
●
|
Energy sales – GEN-NE’s results from energy sales, including both physical and financial transactions, decreased from $120 million for the year ended December 31, 2009 to $76 million for the year ended December 31, 2010. The contribution from physical transactions increased primarily as a result of improved spark spreads and higher weather related prices; however, these increases were more than offset by the sale of the Bridgeport facility in the fourth quarter 2009, and reduced contribution from financial transactions;
|
|
|
●
|
Decreased capacity revenues of $23 million – Capacity revenues decreased primarily due to a $21 million reduction in capacity revenue from the Bridgeport facility that was sold to LS Power in the fourth quarter 2009. This decrease was partially offset by increased capacity revenues at our other facilities due to slightly higher prices; and
|
|
|
●
|
Emissions sales – sales of emissions decreased by $10 million due to lower sale volumes and market prices of emissions credits in 2010.
|
These items were partly offset by the following:
|
|
●
|
Mark-to-market gains – GEN-NE results for the year ended December 31, 2010 included mark-to-market gains of $3 million related to forward sales, compared to mark-to-market losses of $10 million for the year ended December 31, 2009. The $3 million in 2010 mark-to-market gains reflects $1 million of losses related to positions that settled in 2010 offset by $4 million of gains related to positions that will settle in 2011 and beyond;
|
|
|
●
|
Decreased operating and maintenance expenses – Operating and maintenance expenses decreased from $181 million for the year ended December 31, 2009 to $155 million for the year ended December 31, 2010 primarily as a result of the sale of the Bridgeport facility in the fourth quarter 2009 and lower maintenance expenses;
|
|
|
●
|
A coal inventory write-down of approximately $11 million recorded during the year ended December 31, 2009; and
|
|
|
●
|
An increase of $8 million related to an opportunistic sale of excess fuel oil from our Roseton facility in 2010.
|
Depreciation expense decreased from $47 million for the year ended December 31, 2009 to $24 million for the year ended December 31, 2010, primarily due to the 2009 sale of our Bridgeport power generating facility and the 2009 impairments of our Roseton and Danskammer power generation facilities.
Other.
Dynegy’s other operating loss for the year ended December 31, 2010 was $177 million, compared to an operating loss of $168 million for the year ended December 31, 2009. DHI’s other operating loss for the year ended December 31, 2010 was $172 million, compared to an operating loss of $170 million for year ended December 31, 2009. Operating losses in both periods were comprised primarily of general and administrative expenses.
Dynegy’s consolidated general and administrative expenses increased from $159 million from the year ended December 31, 2009 to $163 million for the year ended December 31, 2010. DHI’s consolidated general and administrative expenses decreased from $159 million from the year ended December 31, 2009 to $158 million for the year ended December 31, 2010.
General and administrative expenses for the year ended December 31, 2010 include $26 million of Blackstone Merger Agreement and Icahn Merger Agreement costs and $9 million of legal expenses partially offset by reduced costs in 2010 associated with our company-wide cost savings programs compared with 2009.
Losses from Unconsolidated Investments
Dynegy’s and DHI’s losses from unconsolidated investments were $62 million related to our former GEN-MW investment in PPEA Holding Company. The losses consisted of $28 million related to the loss on sale of PPEA Holding Company, sold in fourth quarter 2010, and an impairment charge of approximately $37 million partially offset by $3 million in equity earnings primarily related to mark-to-market gains on interest rate swaps offset by financing expenses. Our investment in PPEA Holding was fully impaired at March 31, 2010 due to the uncertainty regarding PPEA’s financing structure.
Dynegy’s and DHI’s losses from unconsolidated investments were $71 million and $72 million, respectively, for the year ended December 31, 2009. The loss includes a loss of $84 million on the sale of our investment in the Sandy Creek Project to LS Power partially offset by equity earnings of $12 million.
Please
read Note 4—
Dispositions, Contract Terminations and Discontinued Operations—Dispositions—LS Power Transactions for further discussion.
In addition, Dynegy recorded $1 million of earnings related to its former investment in DLS Power Development, included in Other.
Other Items, Net
Dynegy’s and DHI’s other items, net, totaled $4 million of income for December 31, 2010, compared to $11 million and $10 million, respectively, of income for the year ended December 31, 2009. The decrease is primarily associated with insurance proceeds received in 2009 and with lower interest income due to lower cash and restricted cash balances in 2010.
Interest Expense
Dynegy’s and DHI’s interest expense and debt extinguishment costs totaled $363 million for the year ended December 31, 2010, compared to $461 million for the year ended December 31, 2009. The decrease was primarily attributable to lower outstanding debt in 2010 and $46 million of debt extinguishment costs in 2009 due to the December 2009 repurchase of $833 million in aggregate principal amount of our senior unsecured notes as well as the deconsolidation and subsequent sale of our interest in PPEA Holding in 2010. Please read Note 15—Variable Interest Entities—PPEA Holding Company LLC for further discussion. These decreases were partly offset by the December 2009 issuance of $235 million of senior unsecured notes in connection with the LS Power Transactions and higher applicable margin on our variable-rate debt resulting from an amendment to the Credit Facility in August 2009.
Income Tax Benefit
Dynegy reported an income tax benefit from continuing operations of $197 million for the year ended December 31, 2010, compared to an income tax benefit from continuing operations of $315 million for the year ended December 31, 2009. The 2010 effective tax rate was 46 percent, compared to 23 percent in 2009.
DHI reported an income tax benefit from continuing operations of $184 million for the year ended December 31, 2010, compared to an income tax benefit of $313 million from continuing operations for the year ended December 31, 2009. The 2010 effective tax rate was 43 percent, compared to 23 percent in 2009.
The difference between the statutory rate of 35 percent and the effective rates of 46 percent and 43 percent for Dynegy and DHI, respectively, for the year ended December 31, 2010 resulted primarily from the benefit of $18 million and $12 million for Dynegy and DHI, respectively, resulting from the release of a reserve for uncertain tax positions upon completion of a federal income tax audit together with an overall state tax benefit resulting from current year losses, changes in our state sales profile and a benefit of $12 million and $8 million recorded by Dynegy and DHI, respectively, resulting from a change in California state tax law.
The difference between the statutory rate of 35 percent and the effective rate of 23 percent for Dynegy and DHI for the year ended December 31, 2009 resulted primarily from the effect of the non-deductible goodwill impairment charge, non-deductible losses from the LS Power Transactions and state income taxes in the taxing jurisdictions in which our assets operate. The income tax benefit for the year ended December 31, 2009 included an overall state tax benefit resulting from current year losses, changes in our state sales profile, the exit from various states due to the LS Power Transactions, and charges of $21 million and $16 million recorded by Dynegy and DHI, respectively, resulting from a change in California state tax law. We also revised our assumptions around the ability to utilize certain state deferred tax assets, and therefore Dynegy and DHI recorded valuation allowances resulting in additional state tax expense of $12 million and $10 million, respectively, during 2009.
Discontinued Operations
Loss From Discontinued Operations Before Taxes
For the year ended December 31, 2010, our pre-tax income from discontinued operations was $1 million. For the year ended December 31, 2009, our pre-tax loss from discontinued operations was $343 million ($222 million after-tax), related to the operation of our Arizona, Bluegrass and Heard County facilities. Our GEN-WE segment included pre-tax impairment charges of $235 million ($143 million after-tax) related to our Arizona power generation facilities and a pre-tax loss of $82 million ($50 million after-tax) on the completion of the LS Power Transactions. Additionally, the GEN-WE segment included a pre-tax gain on sale of $10 million ($6 million after-tax) related to our Heard County power generation facility. Our GEN-MW segment included pre-tax impairment charges of $23 million ($14 million after-tax) related to our Bluegrass power generating facility and a pre-tax loss on the completion of the LS Power Transactions of $22 million ($13 million after-tax) .
Income Tax Benefit From Discontinued Operations
We recorded an income tax benefit from discontinued operations of $121 million during the year ended December 31, 2009. This amount reflects an effective rate of 35 percent.
Noncontrolling Interest
We recorded $15 million of noncontrolling interest losses for the year ended December 31, 2009, related to our investment in PPEA Holding. On January 1, 2010, we adopted ASU No. 2009-17. The adoption of ASU No. 2009-17 resulted in a deconsolidation of our investment in PPEA Holding which was accounted for as an equity method investment until the sale of our interest in PPEA Holding on November 10, 2010. Please read Note 15—Variable Interest Entities—PPEA Holding Company LLC for further discussion.
Year Ended 2009 Compared to Year Ended 2008
Operating Income (Loss)
Operating loss for Dynegy was $834 million for the year ended December 31, 2009, compared to operating income of $744 million for the year ended December 31, 2008. Operating loss for DHI was $836 million for the year ended December 31, 2009, compared to operating income of $744 million for year ended December 31, 2008.
Our operating loss for the year ended December 31, 2009 was driven, in large part, by $538 million of asset impairments, a $433 million impairment of goodwill and a $124 million fourth quarter 2009 loss on the closing of the LS Power Transactions. Please read Note 16—Goodwill for further discussion of the goodwill impairments, Note 7—Impairment and Restructuring Charges for further discussion of the asset impairments and Note 4—Dispositions, Contract Terminations and Discontinued Operations—Dispositions—LS Power Transactions for further discussion of the loss on the LS Power Transactions.
Mark-to-market losses on forward sales of power associated with our generating assets are included in Revenues in the consolidated statements of operations. Such losses, which totaled $180 million for the year ended December 31, 2009, were a result of the expiration of certain risk management positions during 2009, for which earnings were recognized in prior periods. These losses compared to $252 million of mark-to-market gains for the year ended December 31, 2008, when forward market power prices decreased during the period.
We do not designate our commodity derivative instruments as cash flow hedges for accounting purposes. Please read Note 8—Risk Management Activities, Derivatives and Financial Instruments for further discussion. The resulting mark-to-market accounting treatment results in the immediate recognition of gains and losses within revenues in the consolidated statements of operations due to changes in the fair value of the derivative instruments. As a result, these mark-to-market gains and losses are not reflected in the consolidated statements of operations in the same period as the underlying power sales from generation activity for which the derivative instruments serve as economic hedges. Except for those positions that settled in the year ended December 31, 2009, the expected cash impact of the settlement of our open positions (which amounted to a $17 million net asset at December 31, 2009) will be recognized over time largely through the end of 2010 and 2011 based on the prices at which such positions are contracted. Our overall mark-to-market position and the related mark-to-market value will change as we buy or sell volumes within the forward market and as forward commodity prices fluctuate.
Power Generation—Midwest Segment.
Operating loss for GEN-MW was $4 million for the year ended December 31, 2009, compared to operating income of $686
million for the year ended December 31, 2008. Such amounts do not include results from our Bluegrass power generating facility, which has been reclassified as a discontinued operation for all periods presented.
Revenues for the year ended December 31, 2009 decreased by $364 million compared to the year ended December 31, 2008, cost of sales decreased by $78 million and operating and maintenance expense increased by $19 million, resulting in a net decrease of $305 million. The decrease was primarily driven by the following:
|
|
●
|
Mark-to-market losses – GEN-MW’s results for the year ended December 31, 2009 included mark-to-market losses of $112 million related to forward sales, compared to $191 million of mark-to-market gains for the year ended December 31, 2008. Of the $112 million in 2009 mark-to-market losses, $137 million of losses related to positions that settled in 2009 representing mark-to-market gains recognized in previous periods, partly offset by $25 million of gains related to positions that will settle in 2010 and beyond;
|
|
|
●
|
Decreased tolling/capacity revenues – Tolling revenues decreased by $58 million as a result of expiring contracts at our Kendall and Rocky Road facilities. This decrease is partially offset by a $43 million increase in capacity sales due to improved capacity pricing plus the additional capacity we were able to sell from the previously tolled facilities;
|
|
|
●
|
Increased operating expense – operating expense increased from $203 million for year ended December 31, 2008 to $222 million for the year ended December 31, 2009, primarily as a result of planned outages at our coal-fired power generating facilities; and
|
|
|
●
|
Lower revenues of $13 million from sales of emissions credits.
|
These items were partly offset by the following:
|
|
●
|
Energy sales—GEN-MW’s results from energy sales, including both physical and financial transactions, increased from $647 million for the year ended December 31, 2008 to $690 million for the year ended December 31, 2009. The negative impact of lower market power prices was more than offset by contracting 2009 volumes at higher energy prices, active management of swap positions, management of option positions and other commercial activities such as the sale and assignment of a multi-year power sales contract. Additionally, GEN-MW benefited from the reduced impact of basis differential between liquid market and power delivery prices and increased contributions from our natural gas combined-cycle facilities; and
|
|
|
●
|
Midwest production volumes increased two percent due to higher run times associated with natural gas combined-cycle units, which benefited from coal-to-gas switching in PJM. Our coal volumes decreased primarily due to lower demand as a result of mild summer weather and economic impacts, as well as transmission line outages, increased off-peak wind generation and imports.
|
Depreciation expense increased from $205 million for the year ended December 31, 2008 to $215 million for the year ended December 31, 2009, primarily as a result of projects associated with the Midwest Consent Decree being placed into service. The increase in depreciation was partly offset by the impact of the assets sold to LS Power in 2009.
Operating income for the year ended December 31, 2009 included a pre-tax charge of approximately $76 million for the impairment of goodwill, reflected in Goodwill impairment on our consolidated statements of operations. Please read Note 16—Goodwill for further discussion.
In addition, for the year ended December 31, 2009, we recorded $147 million of impairments of our Renaissance, Riverside/Foothills, Rocky Road and Tilton power generating facilities and related assets, reflected in Impairment and other charges on our consolidated statements of operations. Please read Note 7—Impairment and Restructuring Charges for further discussion.
Operating income for the year ended December 31, 2009 included a $96
million pre-tax charge from sale of our Renaissance, Riverside/Foothills, Rocky Road and Tilton power generating facilities to LS Power, reflected in Gain (loss) on sale of assets in our consolidated statements of operations. Operating income for the year ended December 31, 2008 included a $56 million pre-tax gain from the sale of our Rolling Hills power generation facility, reflected in Gain (loss) on sale of assets in our consolidated statements of operations.
Power Generation—West Segment.
Operating loss for GEN-WE was $218 million for the year ended December 31, 2009, compared to operating income of $123 million for the year ended December 31, 2008. Such amounts do not include results from our Arizona and Heard County power generating facilities, which have been classified as discontinued operations for all periods presented.
Revenues for the year ended December 31, 2009 decreased by $322 million compared to the year ended December 31, 2008, cost of sales decreased by $259 million and operating and maintenance expense increased by $22 million, resulting in a net decrease of $85 million. The decrease was primarily driven by the following:
|
|
●
|
Mark-to-market losses – GEN-WE’s results for the year ended December 31, 2009 included mark to-market losses of $58 million, compared to $50 million of mark-to-market gains for the year ended December 31, 2008. Of the $58 million in 2009 mark-to-market losses, $15 million related to positions that settled in 2009, and the remaining $43 million related to positions that will settle in 2010 and beyond;
|
|
|
●
|
Energy sales—GEN-WE’s results from energy sales, including both physical and financial transactions, decreased from $98 million for the year ended December 31, 2008 to $94 million for the year ended December 31, 2009, primarily as a result of lower market spark spreads;
|
|
|
●
|
Decreased volumes – Generated volumes were 5.6 million MWh for the year ended December 31, 2009, down from 8.6 million MWh for the year ended December 31, 2008. The volume decrease was driven in large part by decreased market spark spreads and reduced dispatch opportunities; and
|
|
|
●
|
Increased operating expense – operating expense increased from $98 million for the year ended December 31, 2008 to $120 million for the year ended December 31, 2009, primarily as a result of planned outages at our Moss Landing facility as well as severance and employee retirement obligations associated with our South Bay facility.
|
These decreases were partly offset by increased tolling and capacity revenues of $46 million.
Depreciation expense decreased from $77 million for year ended December 31, 2008 to $62 million for the year ended December 31, 2009, largely as a result of an increase in the estimated useful life of one of our generation facilities.
Operating loss for the year ended December 31, 2009 included a pre-tax charge of approximately $260 million for the impairment of goodwill, reflected in Goodwill impairments in our consolidated statements of operations. Please read Note 16—Goodwill for further discussion.
In May 2008, we sold our beneficial interest in Oyster Creek Limited for approximately $11 million, and recognized a gain on the sale of approximately $11 million, reflected in Gain (loss) on sale of assets in our consolidated statements of operations. Please read Note 4—Dispositions, Contract Terminations and Discontinued Operations—Dispositions—Oyster Creek for further discussion.
Power Generation—Northeast Segment.
Operating loss for GEN-NE was $444 million for the year ended December 31, 2009, compared to operating income of $67 million for the year ended December 31, 2008.
Revenues for the year ended December 31, 2009 decreased by $172 million compared to the year ended December 31, 2008, cost of sales decreased by $171 million and operating and maintenance expense increased by $1 million, resulting in a net decrease of $2 million. The decrease was primarily driven by the following:
|
|
●
|
Mark-to-market losses – GEN-NE’s results for the year ended December 31, 2009 included mark-to-market losses of $10 million related to forward sales, compared to gains of $11 million for the year ended December 31, 2008. Of the $10 million in 2009 mark-to-market losses, $1 million related to positions that settled in 2009 and the remaining $9 million related to positions that will settle in 2010 and beyond;
|
|
|
●
|
A coal inventory write-down of approximately $11 million recorded during the year ended December 31, 2009; and
|
|
|
●
|
Increased emission allowance costs of approximately $17 million to operate our Northeast facilities due to RGGI requirements that began January 1, 2009.
|
These items were partly offset by the following:
|
|
●
|
Energy sales—GEN-NE’s results from energy sales, including both physical and financial transactions, increased from $98 million for the year ended December 31, 2008 to $120 million for the year ended December 31, 2009. The negative impact from lower market prices was more than offset by contracting 2009 volumes at higher energy prices, active management of swap positions and other commercial activities;
|
|
|
●
|
Additional capacity sales of $14 million;
|
|
|
●
|
Increased sales of emission credits of $7 million; and
|
|
|
●
|
Increased volumes – Volumes produced by our natural gas-fired combined cycle fleet increased as a result of reduced congestion and improved dispatch opportunities at our Independence facility, as well as a reduction in transmission outages at our Casco Bay facility.
|
Depreciation expense decreased from $54 million for the year ended December 31, 2008 to $47 million for the year ended December 31, 2009, primarily due to the 2009 sale of our Bridgeport power generating facility and the 2009 impairments of our Roseton and Danskammer power generation facilities.
Operating loss for the year ended December 31, 2009 included a pre-tax charge of approximately $97 million for the impairment of goodwill, reflected in Goodwill impairments in our consolidated statements of operations. Please read Note 16—Goodwill for further discussion.
In addition, we recorded a $179 million impairment of our Bridgeport power generating facility and related assets, reflected in Impairment and other charges in our consolidated statements of operations. We also recorded a $212 million impairment of our Roseton and Danskammer power generation facilities and related assets, which is also reflected in Impairment and other charges in our consolidated statements of operations. Please read Note 7—Impairment and Restructuring Charges for further discussion.
Operating loss for the year ended December 31, 2009 included a $28
million pre-tax charge from the sale of our Bridgeport power generating facility to LS Power, reflected in Gain (loss) on sale of assets in our consolidated statements of operations.
Other.
Dynegy’s other operating loss for the year ended December 31, 2009 was $168 million, compared to an operating loss of $132 million for the year ended December 31, 2008. DHI’s other operating loss for the year ended December 31, 2009 was $170 million, compared to an operating loss of $132 million for year ended December 31, 2008. Operating losses in both periods were comprised primarily of general and administrative expenses.
Cost of sales for the year ended December 31, 2008 included a benefit from the release of a $9 million liability associated with an assignment of a natural gas transportation contract. Operating and maintenance expense for the year ended December 31, 2008 included a benefit from the release of $16 million of sales and use tax liability.
Gain on sale of assets for the year ended December 31, 2008 included an approximate $15 million gain related to our sale of our remaining NYMEX shares and both membership seats.
Consolidated general and administrative expenses increased from $157 million from the year ended December 31, 2008 to $159 million for the year ended December 31, 2009.
Losses from Unconsolidated Investments
Dynegy’s and DHI’s losses from unconsolidated investments were $71 million and $72 million, respectively, for the year ended December 31, 2009. The loss includes a loss of $84 million on the sale of our investment in the Sandy Creek Project to LS Power partially offset by equity earnings of $12 million. Please read Note 4—Dispositions, Contract Terminations and Discontinued Operations—Dispositions—LS Power Transactions for
further discussion.
In addition, Dynegy recorded $1 million of earnings related to its former investment in DLS Power Development, included in Other.
Dynegy’s and DHI’s losses from unconsolidated investments were $123 million and $40 million, respectively, for the year ended December 31, 2008. $83 million of Dynegy’s losses related to its investment in DLS Power Development. These losses included a $24 million impairment charge, a $47 million loss on dissolution as a result of our decision to dissolve this venture and $12 million of equity losses. Additionally, Dynegy and DHI recognized $40 million of losses related to its investment in the Sandy Creek Project. These losses were comprised of $53 million primarily associated with our share of the partnership’s losses, partially offset by $13 million for our share of the gain on SCEA’s sale of an 11 percent undivided interest in the Sandy Creek Project. The $53 million consisted of $40 million mark-to-market losses primarily related to interest rate swap contracts and $13 million of financing costs. Please read Note 15—Variable Interest Entities—Sandy Creek Project for further discussion.
Other Items, Net
Dynegy’s and DHI’s other items, net, totaled $11 million and $10 million of income, respectively, for the year ended December 31, 2009, compared to $84 million and $83 million, respectively, of income for the year ended December 31, 2008. The decrease is primarily associated with approximately $42 million of lower interest income due to lower LIBOR rates in 2009. In addition, we recorded a $24 million gain related to the liquidation of our investment in a foreign entity during 2008, as the amount accumulated in the translation adjustment component of equity related to that entity was recognized in income upon liquidation of the entity. Furthermore, during the first quarter 2008, we recognized income of $6 million related to insurance proceeds received in excess of the book value of damaged assets.
Interest Expense
Dynegy’s and DHI’s interest expense and debt extinguishment costs totaled $461 million for the year ended December 31, 2009, compared to $427 million for the year ended December 31, 2008. The increase was primarily attributable to $46 million related to debt extinguishment costs for the 2011 Notes and 2012 Notes and $16 million of expense related to the change in value and dedesignation of interest rate swaps associated with PPEA’s Credit Agreement Facility in 2009. These items were partly offset by a decrease in LIBOR rates on our variable-rate debt in 2009.
Income Tax Benefit (Expense)
Dynegy reported an income tax benefit from continuing operations of $315 million for the year ended December 31, 2009, compared to an income tax expense from continuing operations of $90 million for the year ended December 31, 2008. The 2009 effective tax rate was 23 percent, compared to 32 percent in 2008.
DHI reported an income tax benefit from continuing operations of $313 million for the year ended December 31, 2009, compared to an income tax expense of $138 million from continuing operations for the year ended December 31, 2008. The 2009 effective tax rate was 23 percent, compared to 38 percent in 2008.
The difference between the statutory rate of 35 percent and the effective rate of 23 percent for Dynegy and DHI for the year ended December 31, 2009 resulted primarily from the effect of the non-deductible goodwill impairment charge, non-deductible losses from the LS Power Transactions and state income taxes in the taxing jurisdictions in which our assets operate. The income tax benefit for the year ended December 31, 2009 included an overall state tax benefit resulting from current year losses, changes in our state sales profile, the exit from various states due to the LS Power Transactions, and charges of $21 million and $16 million recorded by Dynegy and DHI, respectively, resulting from a change in California state tax law. We also revised our assumptions around the ability to utilize certain state deferred tax assets, and therefore Dynegy and DHI recorded valuation allowances resulting in additional state tax expense of $12 million and $10 million, respectively, during 2009.
For the period ended December 31, 2008, the difference between the effective rates of 32 and 38
percent for Dynegy and DHI, respectively, and the statutory rate of 35 percent resulted primarily from the effect of state income taxes in the taxing jurisdictions in which our assets operate. In addition, the income tax expense from continuing operations for the year ended December 31, 2008 included a benefit of $10 million related to a permanent difference arising from a gain associated with the liquidation of a foreign entity as well as a benefit of $18 million and $12 million for Dynegy and DHI, respectively, related to adjustments to state tax expense arising from the measurement of temporary differences.
Discontinued Operations
Loss From Discontinued Operations Before Taxes
For the year ended December 31, 2009, our pre-tax loss from discontinued operations was $343 million ($222 million after-tax), related to the operation of our Arizona, Bluegrass and Heard County facilities. Our GEN-WE segment included pre-tax impairment charges of $235 million ($143 million after-tax) related to our Arizona power generation facilities and a pre-tax loss of $82 million ($50 million after-tax) on the completion of the LS Power Transactions. Additionally, the GEN-WE segment included a pre-tax gain on sale of $10 million ($6 million after-tax) related to our Heard County power generation facility. Our GEN-MW segment included pre-tax impairment charges of $23 million ($14 million after-tax) related to our Bluegrass power generating facility and a pre-tax loss on the completion of the LS Power Transactions of $22 million ($13 million after-tax) .
For the year ended December 31, 2008, our pre-tax loss from discontinued operations was $31 million ($17 million after-tax). Dynegy’s GEN-WE segment included a pre-tax impairment charge of $47 million ($27 million after-tax) of our Heard County power generating facility partly offset by $14 million ($8 million after-tax) of income from the operation of our Arizona power generation facilities. Dynegy’s GEN-MW segment included losses of $2 million ($1 million after-tax) from the operation of the Bluegrass power generating facility. In addition, Dynegy recorded income of $4 million ($3 million after-tax) related to the receipt of business interruption insurance proceeds in its former NGL segment.
Income Tax Benefit From Discontinued Operations
We recorded an income tax benefit from discontinued operations of $121 million during the year ended December 31, 2009, compared to an income tax benefit of $14 million during the year ended December 31, 2008. These amounts reflect effective rates of 35 percent and 45 percent, respectively.
Noncontrolling Interest
We recorded $15 million of noncontrolling interest losses for the year ended December 31, 2009, compared with $3 million of noncontrolling interest losses for the year ended December 31, 2008 related to our investment in PPEA Holding. The change in noncontrolling interest losses is primarily related to mark-to-market losses and current period settlements recognized in 2009 related to the interest rate swap agreements associated with the PPEA Credit Agreement Facility. Effective July 28, 2009, the interest rate swap agreements were no longer accounted for as a cash flow hedges; therefore, the change in mark-to-market value is reflected in our consolidated statement of operations and is no longer reflected in accumulated other comprehensive loss.
Outlook
Our cash on hand and short-term investments as of December 31, 2010 and our internal forecasted cash flows from operations for 2011 are not expected to be sufficient to fund our planned $265 million capital expenditure program and our $148 million debt service requirements. Furthermore, using the latest available forward commodity price curves and considering our current derivative contracts, we project that it is likely that we will not be able to comply with our EBITDA to Consolidated Interest Expense covenant contained in our Credit Facility, particularly in the third and fourth quarters of 2011. Accordingly, as described at “Going Concern” above, we are attempting to amend or replace our existing Credit Facility.
We may also seek additional sources of liquidity in an effort to secure sufficient cash to meet our operating needs. These additional sources of liquidity could include asset sales, public or private issuances of debt, equity or equity-linked securities, debt for equity swaps, or any combination of these. Please read Capital Structuring Transactions and Asset Dispositions above for more detail. H
owever, we cannot provide any assurances that we will be successful in accomplishing any of these plans. For additional discussion of factors that may affect our ability to continue as a going concern and the potential consequences of our failure to do so, please see Item 1A
—Risk Factors.
Our power generation portfolio currently consists of approximately 11,800 MW of generating capacity that is diversified by fuel source (i.e., coal, natural gas and fuel oil) and dispatch type (i.e., baseload, intermediate and peaking facilities).
We expect that our future financial results will continue to be sensitive to fuel and commodity prices, especially gas prices and the impact on such prices of shale gas proliferation. Other factors to which our future financial results will remain sensitive include market structure and prices for electric energy, capacity and ancillary services, including pricing at our plant locations relative to pricing at their respective trading hubs, the volatility of fuel and electricity prices, transportation and transmission logistics, weather conditions and IMA. Further, there is a trend toward greater environmental regulation of all aspects of our business. As this trend continues, it is likely that we will experience additional costs and limitations.
We have volumetrically hedged nearly 100 percent of our expected generation volumes for 2011 and approximately 25 percent for 2012. Based on specific market conditions, at any point in time we may enter into transactions that will increase or decrease the portion of our expected output that has been contracted. Even though we have largely contracted our expected output through 2011, our future operating cash flows during this period may vary based on a number of other factors, including the value of capacity and ancillary services, the operational performance of our generating facilities, the price differential between the locations where we deliver generated power and the liquid market hub, legal, environmental, and regulatory requirements, collateral requirements and other factors. Further, we may reduce the amount of our expected generation we have volumetrically hedged in order to reduce the collateral postings required to support our current level of hedging activity.
GEN-MW.
Our Midwest Consent Decree requires substantial emission reductions from our Illinois coal-fired power plants and the completion of several supplemental environmental projects in the Midwest. We have achieved all emission reductions scheduled to date under the Midwest Consent Decree and are in the process of installing additional emission control equipment to meet future Midwest Consent Decree emission limits. We expect our costs associated with the remaining Midwest Consent Decree projects, which we have planned to incur through 2013, to be approximately $230 million. This estimate includes a number of assumptions about uncertainties beyond our control, such as costs associated with labor and materials. If the costs of these capital expenditures become great enough to render the operation of the affected power generation facility or facilities uneconomical, we could, at our option, cease to operate the power generation facility or facilities and forego these capital expenditures without incurring any further obligations under the Midwest Consent Decree. Please read Note 1—Organization and Operations—Going Concern for further discussion.
On December 28, 2010, Dynegy announced that it expects to mothball the 176-megawatt Vermilion power generation facility in Oakwood, Illinois, near the end of the first quarter 2011. Factors influencing our decision include the relatively small size of the facility, older technologies and coal delivery challenges that lead to high production costs, as well as weak electricity demand, a low power pricing environment, and uncertainties over future regulatory requirements.
Our Midwest coal requirements are approximately 96 percent contracted in 2011 and 99 percent contracted in 2012. All forecast coal requirements are 96 percent priced through 2011 and 69 percent are priced through 2012. Committed volumes that are currently unpriced are subject to a price collar structure. Our Midwest coal transportation requirements are 100 percent contracted and priced through 2013. We continue to explore various alternative contractual commitments and financial options, as well as facility modifications, to ensure stable and competitive fuel supplies and to mitigate further supply risks for near- and long-term coal supplies. Our Midwest expected generation volumes are volumetrically 100 percent hedged through 2011 and approximately 23 percent hedged for 2012.
Recent moves by certain MISO market participants expressing their intentions to exit the MISO could mitigate earlier membership increases and impact system reserve margins favorably in the future. The impacts to MISO capacity market-clearing practices and the resulting prices are unclear at this time as the MISO continues to consult with market stakeholders regarding optimal capacity auction mechanics and product offerings. In addition, competing initiatives of increased market participation by demand response resources offset by potential retirement of marginal MISO coal capacity due to expected environmental mandates could also affect MISO capacity and energy markets in the future.
GEN-WE.
Approximately 70 percent of our power plant capacity in the West is contracted through 2011 under tolling agreements with load-serving entities and RMR agreements with the CAISO. A significant portion of the remaining capacity is sold as a resource adequacy product in the California market, and much of the expected production associated with our plants without tolls or RMR agreements has been financially hedged.
The estimated useful lives of our generation facilities consider environmental regulations currently in place. With respect to units 6 and 7 at our Moss Landing facility, we are continuing to review the potential impact of the California Water Intake Policy. We are currently depreciating these units through 2024; however, depending on the ultimate impact of the California Water Intake Policy, we may determine that we will be required to install cooling systems that would render operation of the units uneconomical. If such a determination were to be made, we could decide to reduce operations or cease to operate the units as early as December 31, 2017. A decision to cease operations at the end of 2017 would result in additional depreciation expense of approximately $22 million per year, assuming such a determination was to occur in the first quarter of 2011.
South Bay’s RMR designation was terminated at the end of 2010, and as a result, the South Bay power generation facility has been decommissioned. We have a contractual obligation to demolish the facility and remediate specific parcels of the property. Our cost estimates for the demolition of the facility have not been finalized, but are currently expected to be approximately $40 million, exclusive of certain rental payments that will be due the Port of San Diego. We expect to begin the demolition in 2012.
GEN-NE.
A substantial portion of our physical coal supply and delivery requirements for 2011 are fully contracted and priced with the balance financially hedged. While we continue to source the majority of our coal supply from South America, having access to both marine and rail unloading facilities at the site affords us opportunities to explore alternative domestic and international supply and delivery options for Danskammer. In the near term, lower natural gas prices are expected to continue to compress dark spreads and alter the dispatch stack favoring natural gas-fired assets over coal-fired assets during off-peak periods in much of the Northeast.
During January 2011, we performed an inspection of our Casco Bay steam turbine. As a result of this inspection, our Casco Bay facility has been out of service since the middle of January 2011, and is not expected to return to service until the end of the first quarter of 2011, based on a lack of replacement parts available from our supplier. We plan to evaluate similar equipment at our Moss Landing and Kendall facilities later in 2011 to determine whether turbines at these facilities will need similar repairs. We expect the financial impact of this matter to be approximately
$20 million to $25 million
, resulting from lost revenues, increased operating expense and capital expenditures.
We continue to maximize revenue opportunities from our merchant plant operations in New York through active participation in the NYISO capacity auctions and ancillary services markets. While capacity prices have trended lower in New York due to surplus capacity and lower demand, we have contracted approximately 60 percent of our 2011 capacity in the NYISO and 25 percent through 2014 at prices that are favorable compared to current market prices.
In New England, four forward capacity auctions have been held since the ISO-NE transitioned to a forward capacity auction market in June of 2010. Capacity clearing prices have ranged from a high of $4.50 kW-month for the 2010-2011 market period to a low of $2.95 kW-month for the 2012-2013 market period. These capacity clearing prices represent the floor price, and the actual rate paid to Casco Bay (and other facilities) has been reduced due to oversupply conditions and pro-rationing. Efforts to implement prospective improvements in the forward capacity market design are currently underway in active proceedings at FERC and in discussions by the ISO and its stakeholders.
SEASONALITY
Our revenues and operating income are subject to fluctuations during the year, primarily due to the impact seasonal factors have on sales volumes and the prices of power and natural gas. Power marketing operations and generating facilities have higher volatility and demand, respectively, in the summer cooling months. This trend may change over time as demand for natural gas increases in the summer months as a result of increased natural gas-fired electricity generation. Further, to the extent that climate change may affect weather patterns, this could result in more extreme weather patterns which could impact demand for our products.
CRITICAL ACCOUNTING POLICIES
Our Accounting Department is responsible for the development and application of accounting policy and control procedures. This department conducts these activities independent of any active management of our risk exposures, is independent of our business segments and reports to the Chief Financial Officer.
The process of preparing financial statements in accordance with GAAP requires our management to make estimates and judgments. It is possible that materially different amounts could be recorded if these estimates and judgments change or if actual results differ from these estimates and judgments. We have identified the following seven critical accounting policies that require a significant amount of estimation and judgment and are considered important to the portrayal of our financial position and results of operations:
|
|
●
|
Revenue Recognition and Valuation of Risk Management Assets and Liabilities;
|
|
|
●
|
Estimated Useful Lives;
|
|
|
●
|
Valuation of Tangible and Intangible Assets;
|
|
|
●
|
Accounting for Contingencies, Guarantees and Indemnifications;
|
|
|
●
|
Accounting for Variable Interest Entities;
|
|
|
●
|
Accounting for Income Taxes; and
|
|
|
●
|
Valuation of Pension and Other Post-Retirement Plans Assets and Liabilities.
|
Revenue Recognition and Valuation of Risk Management Assets and Liabilities
We earn revenue from our facilities in three primary ways: (i) the sale of both fuel and energy through both physical and financial transactions to optimize the financial performance of our generating facilities; (ii) sale of capacity; and (iii) sale of ancillary services, which are the products of a generation facility that support the transmission grid operation, allow generation to follow real-time changes in load, and provide emergency reserves for major changes to the balance of generation and load. We recognize revenue from these transactions when the product or service is delivered to a customer, unless they meet the definition of a derivative. Please read “Derivative Instruments—Generation” for further discussion of the accounting for these types of transactions.
Derivative Instruments–Generation.
We enter into commodity contracts that meet the definition of a derivative. These contracts are often entered into to mitigate or eliminate market and financial risks associated with our generation business. These contracts include power sales contracts, fuel purchase contracts, options, swaps, and other instruments used to mitigate variability in earnings due to fluctuations in market prices. There are three different ways to account for these types of contracts: (i) as an accrual contract, if the criteria for the “normal purchase normal sale” exception are met and documented; (ii) as a cash flow or fair value hedge, if the criteria are met and documented; or (iii) as a mark-to-market contract with changes in fair value recognized in current period earnings. All derivative commodity contracts that do not qualify for the “normal purchase normal sale” exception are recorded at fair value in risk management assets and liabilities on the consolidated balance sheets. If the derivative commodity contract has been designated as a cash flow hedge, the changes in fair value are recognized in earnings concurrent with the hedged item. Changes in the fair value of derivative commodity contracts that are not designated as cash flow hedges are recorded currently in earnings. Because derivative contracts can be accounted for in three different ways, and as the “normal purchase normal sale” exception and cash flow and fair value hedge accounting are elective, the accounting treatment used by another party for a similar transaction could be different from the accounting treatment we use. To the extent a party elects to apply cash flow hedge accounting for qualifying transactions, there is generally less volatility in the statements of operations as the effective portion of the changes in the fair values of the derivative instruments is recognized through equity. We do not utilize hedge accounting for our commodity contracts.
Entities may choose whether or not to offset related assets and liabilities and report the net amounts on their consolidated balance sheet if the right of setoff exists. We execute a significant volume of transactions through a futures clearing manager. Our daily cash payments (receipts) to (from) our futures clearing manager consist of three parts: (i) fair value of open positions (exclusive of options) (“Daily Cash Settlements”); (ii) initial margin requirements related to open positions (exclusive of options) (“Initial Margin”); and (iii) fair value of options (“Options”, and collectively with Initial Margin, “Collateral”). We do not offset fair value amounts recognized for derivative instruments executed with the same counterparty under a master netting agreement and we elect not to offset the fair value of amounts recognized for the Daily Cash Settlements paid or received against the fair value of amounts recognized for derivative instruments executed with the same counterparty under a master netting agreement. As a result, our consolidated balance sheets present derivative assets and liabilities, as well as the related cash collateral paid or received, on a gross basis.
Derivative Instruments–Financing Activities.
We are exposed to changes in interest rate risk through our variable and fixed rate debt. In order to manage our interest rate risk, we enter into interest rate swap agreements that meet the definition of a derivative. All derivative instruments are recorded at their fair value on the consolidated balance sheet. If the derivative is designated as a cash flow hedge, the effective portions of the changes in the fair value of the derivative are recorded in OCI and the realized gains and losses related to these derivatives are recognized in earnings in the same period as the settlement of the underlying hedged transaction. If the derivative is designated as a fair value hedge, the changes in the fair value of the derivative and of the hedged item attributable to the hedged risk are recognized currently in earnings. If the derivative is not designated as a hedge, the change in value is recognized currently in earnings. To the extent a party elects to apply hedge accounting for qualifying transactions, there is generally less volatility in the statements of operations as a portion of the changes in the fair value of the derivative instruments is recognized through equity.
Fair Value Measurements.
Fair value is the price that would be received to sell an asset or paid to transfer a liability in an orderly transaction between market participants at the measurement date (exit price). We utilize a mid-market pricing convention (the mid-point price between bid and ask prices) as a practical expedient for valuing the majority of our assets and liabilities measured and reported at fair value. Where appropriate, valuation adjustments are made to account for various factors, including the impact of our credit risk, our counterparties’ credit risk and bid-ask spreads. We utilize market data or assumptions that market participants would use in pricing the asset or liability, including assumptions about risk and the risks inherent in the inputs to the valuation technique. These inputs can be readily observable, market corroborated, or generally unobservable. We primarily apply the market approach for recurring fair value measurements and endeavor to utilize the best available information. Accordingly, we utilize valuation techniques that maximize the use of observable inputs and minimize the use of unobservable inputs. We classify fair value balances based on the observability of those inputs. The inputs used to measure fair value have been placed in a hierarchy based on priority. The hierarchy gives the highest priority to unadjusted quoted prices in active markets for identical assets or liabilities (Level 1 measurement) and the lowest priority to unobservable inputs (Level 3 measurement). The three levels of the fair value hierarchy are as follows:
|
|
●
|
Level 1 – Quoted prices are available in active markets for identical assets or liabilities as of the reporting date. Active markets are those in which transactions for the asset or liability occur in sufficient frequency and volume to provide pricing information on an ongoing basis. Level 1 primarily consists of financial instruments such as listed equities.
|
|
|
●
|
Level 2 – Pricing inputs are other than quoted prices in active markets included in Level 1, which are either directly or indirectly observable as of the reporting date. Level 2 includes those financial instruments that are valued using models or other valuation methodologies. These models are primarily industry-standard models that consider various assumptions, including quoted forward prices for commodities, time value, volatility factors, and current market and contractual prices for the underlying instruments, as well as other relevant economic measures. Substantially all of these assumptions are observable in the marketplace throughout the full term of the instrument, can be derived from observable data or are supported by observable levels at which transactions are executed in the marketplace. Instruments in this category include non-exchange-traded derivatives such as over the counter forwards, options and repurchase agreements.
|
|
|
●
|
Level 3 – Pricing inputs include significant inputs that are generally less observable from objective sources. These inputs may be used with internally developed methodologies that result in management’s best estimate of fair value. Level 3 instruments include those that may be more structured or otherwise tailored to our needs. At each balance sheet date, we perform an analysis of all instruments and include in Level 3 all of those whose fair value is based on significant unobservable inputs.
|
The determination of the fair values incorporates various factors. These factors include not only the credit standing of the counterparties involved and the impact of credit enhancements (such as cash deposits, letters of credit and priority interests), but also the impact of our nonperformance risk on our liabilities. Valuation adjustments are generally based on capital market implied ratings evidence when assessing the credit standing of our counterparties and when applicable, adjusted based on management’s estimates of assumptions market participants would use in determining fair value.
Assets and liabilities from risk management activities may include exchange-traded derivative contracts and OTC derivative contracts. Some exchange-traded derivatives are valued using broker or dealer quotations, or market transactions in either the listed or OTC markets. In such cases, these exchange-traded derivatives are classified within Level 2. OTC derivative trading instruments include swaps, forwards, options and complex structures that are valued at fair value. In certain instances, these instruments may utilize models to measure fair value. Generally, we use a similar model to value similar instruments. Valuation models utilize various inputs that include quoted prices for similar assets or liabilities in active markets, quoted prices for identical or similar assets or liabilities in markets that are not active, other observable inputs for the asset or liability, and market-corroborated inputs. Where observable inputs are available for substantially the full term of the asset or liability, the instrument is categorized in Level 2. Certain OTC derivatives trade in less active markets with a lower availability of pricing information. In addition, complex or structured transactions, such as heat-rate call options, can introduce the need for internally-developed model inputs that might not be observable in or corroborated by the market. When such inputs have a significant impact on the measurement of fair value, the instrument is categorized in Level 3.
Estimated Useful Lives
The estimated useful lives of our long−lived assets are used to compute depreciation expense and future AROs and are used in impairment testing. Estimated useful lives are based, among other things, on the assumption that we provide an appropriate level of capital expenditures while the assets are still in operation. Estimated lives could be impacted by such factors as future energy prices, environmental regulations, various legal factors and competition. If the useful lives of these assets were found to be shorter than originally estimated, depreciation expense may increase, liabilities for future AROs may be insufficient and impairments in carrying values of tangible and intangible assets may result.
The estimated useful lives of our generation facilities consider environmental regulations currently in place. With respect to units 6 and 7 at our Moss Landing facility, we are continuing to review the potential impact of the California Water Intake Policy. We are currently depreciating these units through 2024; however, depending on the ultimate impact of the California Water Intake Policy, we may determine that we would be required to install cooling systems that would render operation of the units uneconomical. If such a determination were to be made, we could decide to reduce operations or cease to operate the units as early as December 31, 2017. A decision to cease operations at the end of 2017 would result in additional depreciation expense of approximately $22 million per year, assuming such a determination was to occur in the first quarter of 2011. In addition to the California Water Intake Policy, other environmental regulations could be introduced or enacted at any time, requiring us to adjust the estimated useful lives of our other generation facilities, and potentially resulting in a significant acceleration of depreciation expense.
Valuation of Tangible and Intangible Assets
We evaluate long-lived assets, such as property, plant and equipment and investments for impairment, when events or changes in circumstances indicate that the carrying value of such assets may not be recoverable. Factors we consider important, which could trigger an impairment analysis, include, among others:
|
|
●
|
significant underperformance relative to historical or projected future operating results;
|
|
|
●
|
significant changes in the manner of our use of the assets or the strategy for our overall business, including an expectation that the asset will be sold;
|
|
|
●
|
significant negative industry or economic trends; and
|
|
|
●
|
significant declines in stock value for a sustained period.
|
We assess the carrying value of our property, plant and equipment and intangible assets subject to amortization. If an impairment is indicated, the amount of the impairment loss recognized is determined by the amount the carrying value exceeds the estimated fair value of the assets. For assets identified as held for sale, the carrying value is compared to the estimated sales price less costs to sell. Please read Note 7—Impairment and Restructuring Charges for discussion of impairment charges we recognized in 2010, 2009 and 2008.
We review our equity investments by comparing the book value of the investment to the estimated fair value to determine if an impairment is required. We record a loss when the decline in value is considered other than temporary. Please read Note 15—Variable Interest Entities—for further discussion of our accounting for the impairment of our former equity investments in PPEA Holding Company and DLS Power Holdings.
Accounting standards define fair value as the price that would be received to sell an asset or paid to transfer a liability in an orderly transaction between market participants. In estimating fair value, we use discounted cash-flow projections, recent comparable market transactions, if available, or quoted prices. We consider assumptions that third parties would make in estimating fair value, including the highest and best use of the asset. There is a significant amount of judgment involved in cash-flow estimates, including assumptions regarding market convergence, discount rates and capacity prices. The assumptions used by another party could differ significantly from our assumptions.
We previously assessed the carrying value of our goodwill annually on November 1 or when circumstances warrant. Step 1 of the goodwill impairment test compares the fair value of a reporting unit to its carrying amount. Step 2 of the goodwill impairment test compares the implied fair value of each reporting unit’s goodwill with the carrying amount of such goodwill through a hypothetical purchase price allocation of the fair value of the reporting unit to the reporting unit’s tangible and intangible assets. As of March 31, 2009, our goodwill was fully impaired. Please read Note 16—Goodwill for further discussion of our impairment analysis.
Accounting for Contingencies, Guarantees and Indemnifications
We are involved in numerous lawsuits, claims, proceedings, and tax-related audits in the normal course of our operations. We record a loss contingency reserve for these matters when it is probable that a liability has been incurred and the amount of the loss can be reasonably estimated. We review our loss contingency reserves on an ongoing basis to ensure that we have appropriate reserves recorded on our consolidated balance sheets. These reserves are based on estimates and judgments made by management with respect to the likely outcome of these matters, including any applicable insurance coverage for litigation matters, and are adjusted as circumstances warrant. Our estimates and judgments could change based on new information, changes in laws or regulations, changes in management’s plans or intentions, the outcome of legal proceedings, settlements or other factors. If different estimates and judgments were applied with respect to these matters, it is likely that reserves would be recorded for different amounts. Actual results could vary materially from these reserves.
Liabilities are recorded when an environmental assessment indicates that remedial efforts are probable and the costs can be reasonably estimated. Measurement of liabilities is based, in part, on relevant past experience, currently enacted laws and regulations, existing technology, site-specific costs and cost-sharing arrangements. Recognition of any joint and several liability is based upon our best estimate of our final pro-rata share of such liability. These assumptions involve the judgments and estimates of management and any changes in assumptions could lead to increases or decreases in our ultimate liability, with any such changes recognized immediately in earnings.
We disclose and account for various guarantees and indemnifications entered into during the course of business. When a guarantee or indemnification is entered into, an estimated fair value of the underlying guarantee or indemnification is recorded. Some guarantees and indemnifications could have significant financial impact under certain circumstances and management also considers the probability of such circumstances occurring when estimating the fair value. Actual results may materially differ from the estimated fair value of such guarantees and indemnifications.
Please read Note 22—Commitments and Contingencies for further discussion of our commitments and contingencies.
Accounting for Variable Interest Entities
We evaluate certain entities to determine which party is considered the primary beneficiary of the entity and thus required to consolidate it in its financial statements. We were an investor, with independent third parties, in PPEA Holding. PPEA Holding is a variable interest entity, and there is a significant amount of judgment involved in the analysis used to determine the primary beneficiary. Effective January 1, 2010, we adopted ASU No. 2009-17, which revised the criteria for determining the primary beneficiary of a variable interest entity. The analysis required by ASU No. 2009-17 included determining the activities that most significantly impact the performance of the variable interest entity, who has the power to direct those activities and who has the obligation to absorb losses or the right to receive benefits that could potentially be significant to the variable interest entity. Under this model, we concluded that we were not the primary beneficiary of PPEA Holding because the power to direct the activities that most significantly impact PPEA Holding’s economic performance was shared by the members of PPEA Holding and the participants in the Plum Point Project. We determined the activities that most significantly impact PPEA Holding’s economic performance were changes to the costs to complete the facility, modifications to the off-take agreements, and/or changes in the financing structure. As a result, we deconsolidated our investment in PPEA Holding which was accounted for as an equity method investment until we sold our interest in the investment on November 10, 2010. Please read Note 15—Variable Interest Entities—PPEA Holding Company LLC for further discussion.
Prior to the adoption of ASU No. 2009-17, the analysis included assumptions about forecasted cash flows, construction costs, and plant performance. Under the previous accounting model, we had concluded that we were the primary beneficiary of PPEA Holding and therefore consolidated the entity in our consolidated financial statements.
If different judgment had been applied, a different conclusion about the primary beneficiary of this entity could have resulted, which would have significantly impacted our financial condition, results of operations and cash flows.
Please read Note 2—Summary of Significant Accounting Policies—Accounting Principles Adopted—Variable Interest Entities and Note 15—Variable Interest Entities for further discussion of our accounting for our variable interest entities.
Accounting for Income Taxes
We use the asset and liability method of accounting for deferred income taxes and provide deferred income taxes for all significant temporary differences.
As part of the process of preparing our consolidated financial statements, we are required to estimate our income taxes in each of the jurisdictions in which we operate. This process involves estimating our actual current tax payable and related tax expense together with assessing temporary differences resulting from differing tax and accounting treatment of certain items, such as depreciation, for tax and accounting purposes. These differences can result in deferred tax assets and liabilities, which are included within our consolidated balance sheets.
Because we operate and sell power in many different states, our effective annual state income tax rate will vary from period to period because of changes in our sales profile by state, as well as jurisdictional and legislative changes by state. As a result, changes in our estimated effective annual state income tax rate can have a significant impact on our measurement of temporary differences. We project the rates at which state tax temporary differences will reverse based upon estimates of revenues and operations in the respective jurisdictions in which we conduct business. A change of 1 percent in the estimated effective annual state income tax rate at December 31, 2010, could impact deferred tax expense by approximately $30 million for Dynegy and $22 million for DHI. State statutory tax rates in the states in which we do business range from 1.0 percent to 9.9 percent.
We must then assess the likelihood that our deferred tax assets will be recovered from future taxable income and, to the extent we believe that it is more likely than not (a likelihood of more than 50 percent) that some portion or all of the deferred tax assets will not be realized, we must establish a valuation allowance. We consider all available evidence, both positive and negative, to determine whether, based on the weight of the evidence, a valuation allowance is needed. Evidence used includes information about our current financial position and our results of operations for the current and preceding years, as well as all currently available information about future years, anticipated future performance, the reversal of deferred tax liabilities and tax planning strategies.
Management believes reversing temporary differences will be sufficient to realize deferred tax assets for which no reserve has been established. While we have considered these factors in assessing the need for a valuation allowance, there is no assurance that a valuation allowance would not need to be established in the future. Any change in the valuation allowance would impact our income tax (expense) benefit and net income (loss) in the period in which such a determination is made.
Accounting for uncertainty in income taxes requires that we determine whether it is more likely than not that a tax position we have taken will be sustained upon examination. If we determine that it is more likely than not that the position will be sustained, we recognize the largest amount of the benefit that is greater than 50 percent likely of being realized upon settlement. There is a significant amount of judgment involved in assessing the likelihood that a tax position will be sustained upon examination and in determining the amount of the benefit that will ultimately be realized. If different judgments were applied, it is likely that reserves would be recorded for different amounts. Actual amounts could vary materially from these reserves.
Please read Note 20—Income Taxes for further discussion of our accounting for income taxes, uncertain tax positions and change in our valuation allowance.
Valuation of Pension and Other Post-Retirement Plans Assets and Liabilities
Our pension and other post-retirement benefit costs are developed from actuarial valuations. Inherent in these valuations are key assumptions including the discount rate and expected long-term rate of return on plan assets. Material changes in our pension and other post-retirement benefit costs may occur in the future due to changes in these assumptions, changes in the number of plan participants, changes in the value of plan assets and changes in the level of benefits provided.
We used a yield curve approach for determining the discount rate as of December 31, 2010. The discount rate is subject to change each year, consistent with changes in applicable high-quality, long-term corporate bond indices. Projected benefit payments for the plans were matched against the discount rates in the yield curve to produce a weighted-average equivalent discount rate. Long-term interest rates decreased during 2010. Accordingly, at December 31, 2010, we used a discount rate of 5.49 percent for pension plans and 5.61 percent for other retirement plans, a decrease of 37 and 31 basis points, respectively, from the 5.86 percent for pension plans rate and 5.92 percent for other retirement plans rate used as of December 31, 2009. This decrease in the discount rate increased the underfunded status of the plans by $16 million.
The expected long-term rate of return on pension plan assets is selected by taking into account the asset mix of the plans and the expected returns for each asset category. Based on these factors, our expected long-term rate of return as of January 1, 2011 and 2010 was 8.00 percent.
A relatively small difference between actual results and assumptions used by management may have a significant effect on our financial statements. Assumptions used by another party could be different than our assumptions. The following table summarizes the sensitivity of pension expense and our projected benefit obligation, or PBO, to changes in the discount rate and the expected long-term rate of return on pension assets:
|
Impact on PBO,
December 31, 2010 |
Impact on
2011 Expense |
|||||||
|
(in millions)
|
||||||||
|
Increase in Discount Rate—50 basis points
|
$ | (17 | ) | $ | (2 | ) | ||
|
Decrease in Discount Rate—50 basis points
|
18 | 2 | ||||||
|
Increase in Expected Long-term Rate of Return—50 basis points
|
— | (1 | ) | |||||
|
Decrease in Expected Long-term Rate of Return—50 basis points
|
— | 1 | ||||||
We expect to make $12 million in cash contributions related to our pension plans during 2011. In addition, we will likely be required to continue to make contributions to the pension plans beyond 2011. Although it is difficult to estimate these potential future cash requirements due to uncertain market conditions, we currently expect that we will contribute approximately $23
million in 2012 and $18 million in 2013.
Please read Note 24—Employee Compensation, Savings and Pension Plans for further discussion of our pension-related assets and liabilities.
RECENT ACCOUNTING PRONOUNCEMENTS
Please read Note 2—Summary of Significant Accounting Policies for further discussion of accounting policies adopted.
RISK-MANAGEMENT DISCLOSURES
The following table provides a reconciliation of the risk-management data on the consolidated balance sheets:
|
As of and for the Year Ended December 31, 2010
|
||||
|
(in millions)
|
||||
|
Balance Sheet Risk-Management Accounts
|
||||
|
Fair value of portfolio at January 1, 2010
|
$ | (33 | ) | |
|
Risk-management gains recognized through the statements of operations in the period, net
|
195 | |||
|
Cash received related to risk-management contracts settled in the period, net
|
(177 | ) | ||
|
Changes in fair value as a result of a change in valuation technique (1)
|
— | |||
|
Non-cash adjustments and other (2)
|
49 | |||
|
Fair value of portfolio at December 31, 2010
|
$ | 34 | ||
|
|
(1)
|
Our modeling methodology has been consistently applied.
|
|
|
(2)
|
Includes the reduction of $50 million of risk management activity as of January 1, 2010 due to the deconsolidation and subsequent sale of our interest in PPEA Holding. Please read Note 2—Accounting Policies—Accounting Policies Adopted—Variable Interest Entities for further discussion.
|
The net risk-management asset of $34 million is the aggregate of the following line items on the consolidated balance sheets: Current Assets—Assets from risk-management activities, Other Assets—Assets from risk-management activities, Current Liabilities—Liabilities from risk-management activities and Other Liabilities—Liabilities from risk-management activities.
Net Fair Value of Risk-Management Portfolio
|
Total
|
2011
|
2012
|
2013
|
2014
|
2015
|
Thereafter
|
||||||||||||||||||||||
|
(in millions)
|
||||||||||||||||||||||||||||
|
Market Quotations (1) (2)
|
$ | 11 | $ | 43 | $ | (32 | ) | $ | — | $ | — | $ | — | $ | — | |||||||||||||
|
Value Based on Models (2)
|
23 | 18 | (10 | ) | 12 | 1 | 1 | 1 | ||||||||||||||||||||
|
Total
|
$ | 34 | $ | 61 | $ | (42 | ) | $ | 12 | $ | 1 | $ | 1 | $ | 1 | |||||||||||||
|
|
(1)
|
Price inputs obtained from actively traded, liquid markets for commodities.
|
|
|
(2)
|
The market quotations and prices based on models categorization differs from the categories of Level 1, Level 2 and Level 3 used in our fair value disclosures due to the application of the different methodologies. Please read Note 8—Risk Management Activities, Derivatives and Financial Instruments and Note 9—Fair Value Measurements for further discussion.
|
Derivative Contracts
The absolute notional contract amounts associated with our interest rate contracts are discussed in Item 7A. Quantitative and Qualitative Disclosures About Market Risk below.
We are exposed to commodity price variability related to our power generation business. In addition, fuel requirements at our power generation facilities represent additional commodity price risks to us. In order to manage these commodity price risks, we routinely utilize various fixed-price forward purchase and sales contracts, futures and option contracts traded on the New York Mercantile Exchange or the Intercontinental Exchange and swaps and options traded in the OTC financial markets to:
|
|
●
|
manage and hedge our fixed-price purchase and sales commitments;
|
|
|
●
|
reduce our exposure to the volatility of cash market prices; and
|
|
|
●
|
hedge our fuel requirements for our generating facilities.
|
The potential for changes in the market value of our commodity and interest rate portfolios is referred to as “market risk”. A description of each market risk category is set forth below:
|
|
●
|
commodity price risks result from exposures to changes in spot prices, forward prices and volatilities in commodities, such as electricity, natural gas, coal, fuel oil, emissions and other similar products; and
|
|
|
●
|
interest rate risks primarily result from exposures to changes in the level, slope and curvature of the yield curve and the volatility of interest rates.
|
In the past, we have attempted to manage these market risks through diversification, controlling position sizes and executing hedging strategies. The ability to manage an exposure may, however, be limited by adverse changes in market liquidity, our credit capacity or other factors.
VaR.
The modeling of the risk characteristics of our mark-to-market portfolio involves a number of assumptions and approximations. We estimate VaR using a Monte Carlo simulation-based methodology. Inputs for the VaR calculation are prices, positions, instrument valuations and the variance-covariance matrix. VaR does not account for liquidity risk or the potential that adverse market conditions may prevent liquidation of existing market positions in a timely fashion. While management believes that these assumptions and approximations are reasonable, there is no uniform industry methodology for estimating VaR, and different assumptions and/or approximations could produce materially different VaR estimates.
We use historical data to estimate our VaR and, to reflect current asset and liability volatilities better, this historical data is weighted to give greater importance to more recent observations. Given our reliance on historical data, VaR is effective in estimating risk exposures in markets in which there are not sudden fundamental changes or abnormal shifts in market conditions. An inherent limitation of VaR is that past changes in market risk factors, even when weighted toward more recent observations, may not produce accurate predictions of future market risk. VaR should be evaluated in light of this and the methodology’s other limitations.
VaR represents the potential loss in value of our mark-to-market portfolio due to adverse market movements over a defined time horizon within a specified confidence level. For the VaR numbers reported below, a one-day time horizon and a 95 percent confidence level were used. This means that there is a one in 20 statistical chance that the daily portfolio value will fall below the expected maximum potential reduction in portfolio value at least as large as the reported VaR. Thus, an adverse change in portfolio value greater than the expected change in portfolio value on a single trading day would be anticipated to occur, on average, about once a month. Gains or losses on a single day can exceed reported VaR by significant amounts. Gains or losses can also accumulate over a longer time horizon such as a number of consecutive trading days.
In addition, we have provided our VaR using a one-day time horizon with a 99 percent confidence level. The purpose of this disclosure is to provide an indication of earnings volatility using a higher confidence level. Under this presentation, there is a one in 100 statistical chance that the daily portfolio value will fall below the expected maximum potential reduction in portfolio value at least as large as the reported VaR. We have also disclosed a two-year comparison of daily VaR in order to provide context for the one-day amounts.
The following table sets forth the aggregate daily VaR and average VaR of the mark-to-market portion of our risk-management portfolio primarily associated with the GEN segments and the remaining legacy customer risk management business. The VaR calculation does not include market risks associated with the accrual portion of the risk-management portfolio that is designated as a cash flow hedge or a “normal purchase normal sale”, nor does it include expected future production from our generating assets.
The decrease in the December 31, 2010 one day VaR was primarily due to decreased forward commodity transactions, lower commodity prices, and lower historical volatilities levels as compared to December 31, 2009.
Daily and Average VaR for Mark-to-Market Portfolios
|
December 31,
2010
|
December 31,
2009
|
|||||||
|
(in millions)
|
||||||||
|
One day VaR—95 percent confidence level
|
$ | 14 | $ | 41 | ||||
|
One day VaR—99 percent confidence level
|
$ | 20 | $ | 57 | ||||
|
Average VaR for the year-to-date period—95 percent confidence level
|
$ | 22 | $ | 34 | ||||
Credit Risk.
Credit risk represents the loss that we would incur if a counterparty fails to perform pursuant to the terms of its contractual obligations. To reduce our credit exposure, we execute agreements that permit us to offset receivables, payables and mark-to-market exposure. We attempt to reduce credit risk further with certain counterparties by obtaining third party guarantees or collateral as well as the right of termination in the event of default.
Our Credit Department, based on guidelines approved by the Board of Directors, establishes our counterparty credit limits. Our industry typically operates under negotiated credit lines for physical delivery and financial contracts. Our credit risk system provides current credit exposure to counterparties on a daily basis.
The following table represents our credit exposure at December 31, 2010 associated with the mark-to-market portion of our risk-management portfolio, on a net basis.
Credit Exposure Summary
|
Investment
Grade Quality |
Non-
Investment Grade Quality |
Total
|
||||||||||
|
(in millions)
|
||||||||||||
|
Type of Business:
|
||||||||||||
|
Financial institutions
|
$ | 12 | $ | — | $ | 12 | ||||||
|
Utility and power generators
|
33 | — | 33 | |||||||||
|
Oil and gas producers
|
4 | — | 4 | |||||||||
|
Other
|
1 | — | 1 | |||||||||
|
Total
|
$ | 50 | $ | — | $ | 50 | ||||||
Interest Rate Risk
.
Interest rate risk primarily results from variable rate debt obligations. Although changing interest rates impact the discounted value of future cash flows, and therefore the value of our risk management portfolios, the relative near-term nature and size of our risk management portfolios minimizes the impact. Management continues to monitor our exposure to fluctuations in interest rates and may execute swaps or other financial instruments to change our risk profile for this exposure.
We are exposed to fluctuating interest rates related to variable rate financial obligations. As of December 31, 2010, the amount owed under our fixed rate debt instruments, as a percentage of the total amount owed under all of our debt instruments, was 81 percent. Adjusted for interest rate swaps (including the impact of swaps that are not designated as cash flow hedges), net notional fixed rate debt, as a percentage of total debt, was approximately 80 percent. Based on sensitivity analysis of the variable rate financial obligations in our debt portfolio as of December 31, 2010, it is estimated that a one percentage point interest rate movement in the average market interest rates (either higher or lower) over the twelve months ended December 31, 2011 would either decrease or increase interest expense by approximately $9 million. This exposure would be partially offset by an approximate $9 million increase in interest income related to the restricted cash balance of $850 million posted as collateral to support the term letter of credit facility. Over time, we may seek to adjust the variable rate exposure in our debt portfolio through the use of swaps or other financial instruments.
The absolute notional financial contract amounts associated with our interest rate contracts were as follows at December 31, 2010 and 2009, respectively:
|
December 31,
2010
|
December 31,
2009
|
|||||||
|
Fair value hedge interest rate swaps (in millions of U.S. dollars)
|
$ | 25 | $ | 25 | ||||
|
Fixed interest rate received on swaps (percent)
|
5.70 | 5.70 | ||||||
|
Interest rate risk-management contracts (in millions of U.S. dollars) (1)
|
$ | 231 | $ | 784 | ||||
|
Fixed interest rate paid (percent)
|
5.35 | 5.33 | ||||||
|
Interest rate risk-management contracts (in millions of U.S. dollars)
|
$ | 206 | $ | 206 | ||||
|
Fixed interest rate received (percent)
|
5.28 | 5.28 | ||||||
|
|
(1)
|
Reflects the reduction of $553 million of notional financial contract amounts due to the deconsolidation and sale of our interest in PPEA Holding. Please read Note 2—Summary of Significant Accounting Policies—Accounting Principles Adopted—Variable Interest Entities for further discussion.
|
Dynegy’s and DHI’s consolidated financial statements and financial statement schedules are set forth at pages F-1 through F-
98
inclusive, found at the end of this annual report, and are incorporated herein by reference.
Not applicable.
Evaluation of Disclosure Controls and Procedures
As of the end of the period covered by this report, an evaluation was carried out under the supervision and with the participation of Dynegy’s and DHI’s management, including their Chief Executive Officer and their Chief Financial Officer, of the effectiveness of the design and operation of Dynegy’s and DHI’s disclosure controls and procedures (as defined in Rules 13a-15(e) and 15d-15(e) under the Securities Exchange Act of 1934, as amended (the “Exchange Act”)). This evaluation included consideration of the various processes carried out under the direction of Dynegy’s disclosure committee. This evaluation also considered the work completed relating to our compliance with Section 404 of the Sarbanes-Oxley Act of 2002. Based on this evaluation, Dynegy’s and DHI’s CEO and CFO concluded that Dynegy’s and DHI’s disclosure controls and procedures were effective as of December 31, 2010.
Management’s Report on Internal Control over Financial Reporting
Dynegy’s and DHI’s management are responsible for establishing and maintaining adequate internal control over financial reporting (as defined in Rules 13a-15(f) and 15d-15(f) under the Exchange Act). Dynegy’s and DHI’s internal control over financial reporting is a process designed to provide reasonable assurance regarding the reliability of financial reporting and the preparation of financial statements for external purposes in accordance with GAAP. Dynegy’s and DHI’s internal control over financial reporting includes those policies and procedures that:
|
|
(i)
|
pertain to the maintenance of records that, in reasonable detail, accurately and fairly reflect the transactions and dispositions of our assets;
|
|
|
(ii)
|
provide reasonable assurance that transactions are recorded as necessary to permit preparation of financial statements in accordance with GAAP, and that receipts and expenditures of our company are being made only in accordance with authorizations of our management and directors; and
|
|
|
(iii)
|
provide reasonable assurance regarding prevention or timely detection of unauthorized acquisition, use or disposition of our assets that could have a material effect on the financial statements.
|
Because of its inherent limitations, internal control over financial reporting may not prevent or detect misstatements. Also, projections of any evaluation of effectiveness to future periods are subject to the risk that controls may become inadequate because of changes in conditions, or that the degree of compliance with the policies or procedures may deteriorate. Under the supervision and with the participation of our management, including the Chief Executive Officer and Chief Financial Officer, we assessed the effectiveness of both Dynegy’s and DHI’s internal control over financial reporting as of December 31, 2010. In making this assessment, we used the criteria set forth in
Internal Control-Integrated Framework
issued by the Committee of Sponsoring Organizations of the Treadway Commission. Based on the results of this assessment and on those criteria, we concluded that both Dynegy’s and DHI’s internal control over financial reporting was effective as of December 31, 2010.
The effectiveness of Dynegy’s internal control over financial reporting as of December 31, 2010 has been audited by Ernst & Young LLP, an independent registered public accounting firm, as stated in their report, which is included herein. This annual report does not include an attestation report of DHI’s registered public accounting firm regarding internal control over financial reporting. DHI’s management report was not subject to attestation by DHI’s registered public accounting firm pursuant to the rules of the SEC that permit DHI to provide only management’s report in this annual report.
Changes in Internal Controls Over Financial Reporting
There were no changes in Dynegy’s and DHI’s internal control over financial reporting that have materially affected or are reasonably likely to materially affect Dynegy’s and DHI’s internal control over financial reporting during the quarter ended December 31, 2010.
Report of Independent Registered
Public Accounting Firm
The Board of Directors and Stockholders
Dynegy Inc.
We have audited Dynegy Inc.’s internal control over financial reporting as of December 31, 2010, based on criteria established in Internal Control—Integrated Framework issued by the Committee of Sponsoring Organizations of the Treadway Commission (the COSO criteria). Dynegy Inc.’s management is responsible for maintaining effective internal control over financial reporting, and for its assessment of the effectiveness of internal control over financial reporting included in the accompanying Management’s Report on Internal Control over Financial Reporting. Our responsibility is to express an opinion on the Company’s internal control over financial reporting based on our audit.
We conducted our audit in accordance with the standards of the Public Company Accounting Oversight Board (United States). Those standards require that we plan and perform the audit to obtain reasonable assurance about whether effective internal control over financial reporting was maintained in all material respects. Our audit included obtaining an understanding of internal control over financial reporting, assessing the risk that a material weakness exists, testing and evaluating the design and operating effectiveness of internal control based on the assessed risk, and performing such other procedures as we considered necessary in the circumstances. We believe that our audit provides a reasonable basis for our opinion.
A company’s internal control over financial reporting is a process designed to provide reasonable assurance regarding the reliability of financial reporting and the preparation of financial statements for external purposes in accordance with generally accepted accounting principles. A company’s internal control over financial reporting includes those policies and procedures that (1) pertain to the maintenance of records that, in reasonable detail, accurately and fairly reflect the transactions and dispositions of the assets of the company; (2) provide reasonable assurance that transactions are recorded as necessary to permit preparation of financial statements in accordance with generally accepted accounting principles, and that receipts and expenditures of the company are being made only in accordance with authorizations of management and directors of the company; and (3) provide reasonable assurance regarding prevention or timely detection of unauthorized acquisition, use, or disposition of the company’s assets that could have a material effect on the financial statements.
Because of its inherent limitations, internal control over financial reporting may not prevent or detect misstatements. Also, projections of any evaluation of effectiveness to future periods are subject to the risk that controls may become inadequate because of changes in conditions, or that the degree of compliance with the policies or procedures may deteriorate.
In our opinion, Dynegy Inc. maintained, in all material respects, effective internal control over financial reporting as of December 31, 2010, based on the COSO criteria.
We also have audited, in accordance with the standards of the Public Company Accounting Oversight Board (United States), the 2010 consolidated financial statements of Dynegy Inc. and our report dated March 8, 2011 expressed an unqualified opinion thereon that included an explanatory paragraph regarding Dynegy Inc.’s ability to continue as a going concern.
/s/ Ernst & Young LLP
Houston, Texas
March 8, 2011
Not applicable.
Dynegy
Executive Officers.
We intend to include the information with respect to our executive officers required by this Item 10 in Dynegy’s definitive proxy statement for its 2011 annual meeting of stockholders under the heading “Executive Officers;” which information will be incorporated herein by reference; such proxy statement will be filed with the SEC not later than 120 days after December 31, 2010. However, if such proxy statement is not filed within such 120-day period, information with respect to Executive Officers will be filed as part of an amendment to this Form 10-K not later than the end of the 120-day period.
Code of Ethics.
We have adopted a Code of Ethics within the meaning of Item 406(b) of Regulation S-K. This Code of Ethics applies to our Chief Executive Officer, Chief Financial Officer, Controller and other persons performing similar functions designated by the Chief Financial Officer, and is filed as an exhibit to this Form 10-K.
Other Information
.
We intend to include the other information required by this Item 10 in Dynegy’s definitive proxy statement for its 2011 annual meeting of stockholders under the headings “Proposal 1—Election of Directors” and “Compliance with Section 16(a) of the Exchange Act,” which information will be incorporated herein by reference; such proxy statement will be filed with the SEC not later than 120 days after December 31, 2010. However, if such proxy statement is not filed within such 120-day period, information with respect to Other Information will be filed as part of an amendment to this Form 10-K not later than the end of the 120-day period.
DHI
Omitted pursuant to General Instruction (1)(2)(c) of Form 10-K.
Dynegy.
We intend to include information with respect to executive compensation in Dynegy’s definitive proxy statement for its 2011 annual meeting of stockholders under the heading “Executive Compensation”, which information will be incorporated herein by reference; such proxy statement will be filed with the SEC not later than 120 days after December 31, 2010. However, if such proxy statement is not filed within such 120-day period, information with respect to executive compensation will be filed as part of an amendment to this Form 10-K not later than the end of the 120-day period.
DHI.
Omitted pursuant to General Instruction (1)(2)(c) of Form 10-K.
Dynegy.
We intend to include information regarding ownership of Dynegy’s outstanding securities in Dynegy’s definitive proxy statement for its 2011 annual meeting of stockholders under the heading “Security Ownership of Certain Beneficial Owners and Management”, which information will be incorporated herein by reference; such proxy statement will be filed with the SEC not later than 120 days after December 31, 2010. However, if such proxy statement is not filed within such 120-day period, information with respect to beneficial ownership will be filed as part of an amendment to this Form 10-K not later than the end of the 120-day period.
DHI.
Omitted pursuant to General Instruction (1)(2)(c) of Form 10-K.
Dynegy.
We intend to include the information regarding related party transactions and Director independence in Dynegy’s definitive proxy statement for its 2011 annual meeting of stockholders under the headings “Transactions with Related Persons, Promoters and Certain Control Persons”, and “Corporate Governance”, respectively, which information will be incorporated herein by reference; such proxy statement will be filed with the SEC not later than 120 days after December 31, 2010. However, if such proxy statement is not filed within such 120-day period, information with respect to certain relationships will be filed as part of an amendment to this Form 10-K not later than the end of the 120-day period.
DHI.
Omitted pursuant to General Instruction (1)(2)(c) of Form 10-K.
Dynegy.
We intend to include information regarding principal accountant fees and services in Dynegy’s definitive proxy statement for its 2011 annual meeting of stockholders under the heading “Independent Registered Public Auditors—Principal Accountant Fees and Services”, which information will be incorporated herein by reference; such proxy statement will be filed with the SEC not later than 120 days after December 31, 2010. However, if such proxy statement is not filed within such 120-day period, information with respect to the principal accountant fees and services will be filed as part of an amendment to this Form 10-K not later than the end of the 120-day period.
DHI.
DHI is an indirect, wholly owned subsidiary of Dynegy and does not have a separate audit committee. Information regarding principal accountant fees and services for Dynegy and its consolidated subsidiaries, including DHI, will be contained in Dynegy’s definitive proxy statement for its 2011 annual meeting of stockholders under the heading “Independent Registered Public Auditors—Principal Accountant Fees and Services”. Such proxy statement will be filed with the SEC not later than 120 days after December 31, 2010. However, if such proxy statement is not filed within such 120-day period, information with respect to the principal accountant fees and services will be filed as part of an amendment to this Form 10-K not later than the end of the 120-day period.
(a) The following documents, which we have filed with the SEC pursuant to the Securities Exchange Act of 1934, as amended, are by this reference incorporated in and made a part of this report:
|
|
1.
|
Financial Statements—Our consolidated financial statements are incorporated under Item 8. of this report.
|
|
|
2.
|
Financial Statement Schedules—Financial Statement Schedules are incorporated under Item 8. of this report.
|
|
|
3.
|
Exhibits—The following instruments and documents are included as exhibits to this report. All management contracts or compensation plans or arrangements set forth in such list are marked with a ††.
|
|
Exhibit
Number
|
Description
|
|
|
2.1
|
Agreement and Plan of Merger, dated as of August 13, 2010, among Dynegy Inc., Denali Parent Inc. and Denali Merger Sub Inc. (incorporated by reference to Exhibit 2.1 to the Current Report on Form 8-K of Dynegy Inc. and Dynegy Holdings Inc. filed on August 13, 2010, File No. 000-29311).
|
|
|
2.2
|
Amendment No. 1 to the Agreement and Plan of Merger, dated as of November 16, 2010 (incorporated by reference to Exhibit 2.1 to the Current Report on Form 8-K of Dynegy Inc. and Dynegy Holdings Inc. filed on November 17, 2010, File No. 000-29311).
|
|
|
2.3
|
Agreement and Plan of Merger, dated as of December 15, 2010 among Dynegy Inc., IEH Merger Sub LLC, and IEP Merger Sub Corp. (incorporated herein by reference to Exhibit 2.1 to the Current Report on Form 8-K of Dynegy Inc. filed on December 15, 2010, File No. 001-33443).
|
|
|
2.4
|
Amendment No. 1 to the Agreement and Plan of Merger, dated as of February 13, 2011 among Dynegy Inc., IEH Merger Sub LLC, and IEP Merger Sub Corp. (incorporated herein by reference to Exhibit 2.1 to the Current Report on Form 8-K of Dynegy Inc. filed on February 14, 2011, File No. 001-33443).
|
|
|
3.1
|
Dynegy’s Second Amended and Restated Certificate of Incorporation, amended as of May 21, 2010 (incorporated by reference to Exhibit 3.1 to the Current Report on Form 8-K of Dynegy Inc. and Dynegy Holdings Inc. filed on May 25, 2010).
|
|
|
3.2
|
Dynegy Inc. Second Amended and Restated Bylaws, as amended on November 22, 2010 (incorporated herein by reference to Exhibit 3.1 to the Current Report on Form 8-K of Dynegy Inc. filed on November 24, 2010, File No. 001-33443).
|
|
|
3.3
|
Restated Certificate of Incorporation of Dynegy Holdings Inc. (incorporated by reference to Exhibit 3.1 to the Annual Report on Form 10-K for the Fiscal Year Ended December 31, 1999 of Dynegy Holdings Inc., File No. 000-29311).
|
|
|
3.4
|
Amended and Restated Bylaws of Dynegy Holdings Inc. (incorporated by reference to Exhibit 3.2 to the Annual Report on Form 10-K for the Fiscal Year Ended December 31, 1999 of Dynegy Holdings Inc., File No. 000-29311).
|
|
|
4.1
|
Stockholder Protection Rights Agreement, dated November 22, 2010, between Dynegy Inc. and Mellon Investor Services LLC, as Rights Agent, including as Exhibit A the forms of Rights Certificate and of Election to Exercise and as Exhibit B the form of Certificate of Designation and Terms of the Participating Preferred Stock of Dynegy Inc. (incorporated herein by reference to Exhibit 4.1 to the Current Report on Form 8-K of Dynegy Inc. filed on November 24, 2010, File No. 001-33443).
|
|
Exhibit
Number
|
Description
|
|
|
4.2
|
Amendment to Stockholder Protection Rights Agreement, dated as of December 15, 2010, between Dynegy Inc. and Mellon Investor Services LLC, as Rights Agent (incorporated herein by reference to Exhibit 4.1 to the Current Report on Form 8-K of Dynegy Inc. filed on December 15, 2010, File No. 001-33443).
|
|
|
4.3
|
Amendment No. 2 to Stockholder Protection Rights Agreement, dated as of February 21, 2011, between Dynegy Inc. and Mellon Investor Services LLC, as Rights Agent (incorporated herein by reference to Exhibit 4.1 to the Current Report on Form 8-K of Dynegy Inc. filed on February 23, 2011, File No. 001-33443).
|
|
|
4.4
|
Subordinated Debenture Indenture between NGC Corporation and The First National Bank of Chicago, as Debenture Trustee, dated as of May 28, 1997 (incorporated by reference to Exhibit 4.5 to the Quarterly Report on Form 10-Q for the Quarterly Period Ended June 30, 1997 of NGC Corporation, File No. 1-11156).
|
|
|
4.5
|
Amended and Restated Declaration of Trust among NGC Corporation, Wilmington Trust Company, as Property Trustee and Delaware Trustee, and the Administrative Trustees named therein, dated as of May 28, 1997 (incorporated by reference to Exhibit 4.6 to the Quarterly Report on Form 10-Q for the Quarterly Period Ended June 30, 1997 of NGC Corporation, File No. 1-11156).
|
|
|
4.6
|
Series A Capital Securities Guarantee Agreement executed by NGC Corporation and The First National Bank of Chicago, as Guarantee Trustee, dated as of May 28, 1997 (incorporated by reference to Exhibit 4.9 to the Quarterly Report on Form 10-Q for the Quarterly Period Ended June 30, 1997 of NGC Corporation, File No. 1-11156).
|
|
|
4.7
|
Common Securities Guarantee Agreement of NGC Corporation, dated as of May 28, 1997 (incorporated by reference to Exhibit 4.10 to the Quarterly Report on Form 10-Q for the Quarterly Period Ended June 30, 1997 of NGC Corporation, File No. 1-11156).
|
|
|
4.8
|
Registration Rights Agreement, dated as of May 28, 1997, among NGC Corporation, NGC Corporation Capital Trust I, Lehman Brothers, Salomon Brothers Inc. and Smith Barney Inc. (incorporated by reference to Exhibit 4.11 to the Quarterly Report on Form 10-Q for the Quarterly Period Ended June 30, 1997 of NGC Corporation, File No. 1-11156).
|
|
|
4.89
|
Indenture, dated as of September 26, 1996, restated as of March 23, 1998, and amended and restated as of March 14, 2001, between Dynegy Holdings Inc. and Bank One Trust Company, National Association, as Trustee (incorporated by reference to Exhibit 4.17 to the Annual Report on Form 10-K for the Fiscal Year Ended December 31, 2000 of Dynegy Holdings Inc., File No. 000-29311).
|
|
|
4.10
|
First Supplemental Indenture, dated July 25, 2003 to that certain Indenture, dated as of September 26, 1996, between Dynegy Holdings Inc. and Wilmington Trust Company, as trustee (incorporated by reference to Exhibit 99.2 to the Current Report on Form 8-K of Dynegy Inc. filed on July 28, 2003, File No. 1-15659).
|
|
|
4.11
|
Second Supplemental Indenture, dated as of April 12, 2006, to that certain Indenture, originally dated as of September 26, 1996, as amended and restated as of March 23, 1998 and again as of March 14, 2001, by and between Dynegy Holdings Inc. and Wilmington Trust Company (as successor to JPMorgan Chase Bank, N.A.), as trustee, as supplemented by that certain First Supplemental Indenture, dated as of July 25, 2003 (incorporated by reference to Exhibit 4.1 to the Current Report on Form 8-K of Dynegy Inc. filed on April 12, 2006, File No. 1-15659).
|
|
|
4.12
|
Third Supplemental Indenture, dated as of May 24, 2007, to that certain Indenture, originally dated as of September 26, 1996, as amended and restated as of March 23, 1998 and again as of March 14, 2001, by and between Dynegy Holdings Inc. and Wilmington Trust Company (as successor to JPMorgan Chase Bank, N.A.), as trustee, as supplemented by that certain First Supplemental Indenture, dated as of July 25, 2003, and that certain Second Supplemental Indenture, dated as of April 12, 2006 (incorporated by reference to Exhibit 4.1 to the Current Report on Form 8-K of Dynegy Holdings Inc. filed on May 25, 2007, File No. 000-29311).
|
|
Exhibit
Number
|
Description
|
|
|
4.13
|
Fourth Supplemental Indenture, dated as of May 24, 2007, to that certain Indenture, originally dated as of September 26, 1996, as amended and restated as of March 23, 1998 and again as of March 14, 2001, by and between Dynegy Holdings Inc. and Wilmington Trust Company (as successor to JPMorgan Chase Bank, N.A.), as trustee, as supplemented by that certain First Supplemental Indenture, dated as of July 25, 2003, that certain Second Supplemental Indenture, dated as of April 12, 2006, and that certain Third Supplemental Indenture, dated as of May 24, 2007 (incorporated by reference to Exhibit 4.2 to the Current Report on Form 8-K of Dynegy Holdings Inc. filed on May 25, 2007, File No. 000-29311).
|
|
|
4.14
|
Fifth Supplemental Indenture dated as of December 1, 2009 between Dynegy Holdings Inc. and Wilmington Trust Company (incorporated by reference to Exhibit 4.1 to the Current Report on Form 8-K of Dynegy Inc. and Dynegy Holdings Inc. filed on December 1, 2009, File No. 001-33443 and 000-29311, respectively).
|
|
|
4.15
|
7.5 percent Senior Unsecured Note Due 2015 (included in Exhibit 4.1 and incorporated by reference to Exhibit 4.2 to the Current Report on Form 8-K of Dynegy Inc. and Dynegy Holdings Inc. filed on December 1, 2009, File No. 001-33443 and 000-29311, respectively).
|
|
|
4.16
|
Sixth Supplemental Indenture dated as of December 30, 2009 between Dynegy Holdings and Wilmington Trust Company (incorporated by reference to Exhibit 10.1 to the Current Report on Form 8-K of Dynegy Inc. and Dynegy Holdings Inc. filed on January 4, 2010, File No. 001-33443 and 000-29311, respectively).
|
|
|
4.17
|
Note Repurchase Agreement by and between Dynegy Holdings Inc. and the Party Signatory thereto, dated as of December 11, 2009 (incorporated by reference to Exhibit 4.14 to the Annual Report on Form 10-K for the Fiscal Year Ended December 31, 2009 of Dynegy Inc, File No. 1-15659).
|
|
|
4.18
|
Registration Rights Agreement, effective as of July 21, 2006, by and among Dynegy Holdings Inc. RCP Debt, LLC and RCMF Debt, LLC (incorporated by reference to Exhibit 4.1 to the Current Report on Form 8-K of Dynegy Inc. filed on July 24, 2006, File No. 1-15659).
|
|
|
4.19
|
Registration Rights Agreement, dated as of May 24, 2007, by and among Dynegy Holdings Inc. and the several initial purchasers party thereto (incorporated by reference to Exhibit 4.3 to the Current Report on Form 8-K of Dynegy Holdings Inc. filed on May 25, 2007, File No. 000-29311).
|
|
|
4.20
|
Trust Indenture, dated as of January 1, 1993, among Sithe/Independence Funding Corporation, Sithe/Independence Power Partners, L.P. and IBJ Schroder Bank & Trust Company, as Trustee (incorporated by reference to Exhibit 4.22 to the Annual Report on Form 10-K for the Fiscal Year Ended December 31, 2004 of Dynegy Inc, File No. 1-15659).
|
|
|
4.21
|
First Supplemental Indenture, dated as of January 1, 1993, to the Trust Indenture dated as of January 1, 1993, among Sithe/Independence Funding Corporation, Sithe/Independence Power Partners, L.P. and IBJ Schroder Bank & Trust Company, as Trustee (incorporated by reference to Exhibit 4.23 to the Annual Report on Form 10-K for the Fiscal Year Ended December 31, 2004 of Dynegy Inc, File No. 1-15659).
|
|
|
4.22
|
Second Supplemental Indenture, dated as of October 23, 2001, to the Trust Indenture dated as of January 1, 1993, among Sithe/Independence Funding Corporation, Sithe/Independence Power Partners, L.P. and The Bank of New York, as Trustee (incorporated by reference to Exhibit 4.24 to the Annual Report on Form 10-K for the Fiscal Year Ended December 31, 2004 of Dynegy Inc, File No. 1-15659).
|
|
|
4.23
|
Global Note representing the 9.00 percent Secured Bonds due 2013 of Sithe/Independence Power Partners, L.P. (incorporated by reference to Exhibit 4.5 to the Quarterly Report on Form 10-Q for the Quarterly Period Ended March 31, 2005 of Dynegy Inc., File No. 1-15659).
|
|
Exhibit
Number
|
Description
|
|
|
4.24
|
Shareholder Agreement, dated as of August 9, 2009 between Dynegy Inc. and LS Power and its affiliates (incorporated by reference to Exhibit 10.1 to the Current Report on Form 8-K of Dynegy Inc. filed on August 13, 2009, File No. 001-33443).
|
|
|
4.25
|
Registration Rights Agreement, dated as of September 14, 2006, among Dynegy Acquisition, Inc., LS Power Partners, L.P., LS Power Associates, L.P., LS Power Equity Partners, L.P., LS Power Equity Partners PIE I, L.P. and LSP Gen Investors, L.P. (incorporated by reference to Exhibit 4.2 to the Current Report on Form 8-K of Dynegy Inc. filed on September 19, 2006, File No. 1-15659).
|
|
|
4.26
|
Amendment No. 1 to the Registration Rights Agreement dated September 14 2006 by and between Dynegy Inc. and LS Power and affiliates, dated August 9, 2009 (incorporated by reference to Exhibit 10.2 to the Current Report on Form 8-K of Dynegy Inc. filed on August 13, 2009, File No. 001-33443).
|
|
|
4.27
|
Purchase Agreement, dated as of March 29, 2006, for the sale of $750,000,000 aggregate principal amount of the 8.375 percent Senior Unsecured Notes due 2016 of Dynegy Holdings Inc. among Dynegy Holdings Inc. and the several initial purchasers named therein (incorporated by reference to Exhibit 10.11 to the Quarterly Report on Form 10-Q for the Quarter Ended March 31, 2006 of Dynegy Inc., File No. 1-15659).
|
|
|
4.28
|
Purchase Agreement, dated as of May 17, 2007, by and between Dynegy Holdings Inc. and J.P. Morgan Securities Inc. (incorporated by reference to Exhibit 10.2 to the Quarterly Report on Form 10-Q for Quarterly Period Ended June 30, 2007 of Dynegy Holdings Inc., File No. 000-29311).
|
|
|
4.29
|
Exchange Agreement, dated as of July 21, 2006, by and among Dynegy Holdings Inc., RCP Debt, LLC and RCMF Debt, LLC (incorporated by reference to Exhibit 10.1 to the Current Report on Form 8-K of Dynegy Inc. filed on July 24, 2006, File No. 1-15659).
|
|
|
4.30
|
Registration Rights Agreement dated as of December 1, 2009 by and between Dynegy Holdings Inc. and Adio Bond, LLC (incorporated herein by reference to Exhibit 10.1 to the Current Report on Form 8-K of Dynegy Inc. filed on December 1, 2009, File No. 001-33443).
|
|
|
10.1
|
Note Purchase Agreement by and between Dynegy Holdings Inc. and Adio Bond, LLC, dated August 9, 2009 (incorporated by reference to Exhibit 10.3 to the Current Report on Form 8-K of Dynegy Inc. filed on August 13, 2009, File No. 001-33443).
|
|
|
10.2
|
Purchase Agreement, dated as of December 2, 2009, by and among Credit Suisse Securities (USA) and Citigroup Global Markets Inc. (as representatives for additional purchasers named in the Purchase Agreement), Adio Bond, LLC and Dynegy Holdings Inc. (incorporated herein by reference to Exhibit 10.1 to the Current Report on Form 8-K by Dynegy Inc. filed on December 7, 2009, File No. 001-33443).
|
|
|
10.3
|
Fifth Amended and Restated Credit Agreement, dated as of April 2, 2007, by and among Dynegy Holdings Inc., as borrower, Dynegy Inc. (formerly named Dynegy Acquisition, Inc.) and Dynegy Inc., as parent guarantors, the other guarantors party thereto, the lenders party thereto and various other parties thereto (incorporated by reference to Exhibit 10.2 to the Quarterly Report on Form 10-Q for the Quarter Period ended June 30, 2009 of Dynegy Inc., File No. 001-33443).
|
|
|
10.4
|
Amendment No. 1, dated as of May 24, 2007, to the Fifth Amended and Restated Credit Agreement, dated as of April 2, 2007, by and among Dynegy Holdings Inc., as borrower, Dynegy Inc. and Dynegy Illinois Inc., as parent guarantors, the other guarantors party thereto, the lenders party thereto and various other parties thereto (incorporated by reference to Exhibit 10.1 to the Current Report on Form 8-K of Dynegy Holdings Inc. filed on May 25, 2007, File No. 000-29311).
|
|
Exhibit
Number
|
Description
|
|
|
10.5
|
Amendment No. 2, dated as of September 30, 2008, to the Fifth Amended and Restated Credit Agreement, dated as of April 2, 2007, by and among Dynegy Holdings Inc., as borrower, Dynegy Inc. and Dynegy Illinois Inc., as parent guarantors, the other guarantors party thereto, the lenders party thereto and various other parties thereto (incorporated by reference to Exhibit 10.1 to the Quarterly Report on Form 10-Q of Dynegy Holdings Inc. filed on November 6, 2008, File No. 000-29311).
|
|
|
10.6
|
Amendment No. 3, dated as of February 13, 2009, to the Fifth Amended and Restated Credit Agreement, dated as of April 2, 2007, by and among Dynegy Holdings Inc., as borrower, Dynegy Inc. and Dynegy Illinois Inc., as parent guarantors, the other guarantors party thereto, the lenders party thereto and various other parties thereto (incorporated by reference to Exhibit 10.18 to the Annual Report on Form 10-K for the Fiscal Year ended December 31, 2008, filed on February 26, 2009, File No. 001-33443).
|
|
|
10.7
|
Amendment No. 4, dated as of August 5, 2009, to the Fifth Amended and Restated Credit Agreement, dated as of April 2, 2007, by and among Dynegy Holdings Inc., as borrower, Dynegy Inc., as parent guarantor, the other guarantors party thereto, the lenders party thereto and various other parties thereto (incorporated by reference to Exhibit 10.1 to the Current Report on Form 8-K of Dynegy Inc. filed on August 10, 2009, File No. 000-29311).
|
|
|
10.8
|
Second Amended and Restated Security Agreement, dated April 2, 2007, by and among Dynegy Holdings Inc., as Borrower, the initial grantors party thereto, Wilmington Trust Company, as corporate trustee, and John M. Beeson, Jr., as individual trustee (incorporated by reference to Exhibit 10.2 to the Current Report on Form 8-K of Dynegy Holdings Inc. filed on April 6, 2007, File No. 000-29311).
|
|
|
10.9
|
Facility and Security Agreement, executed May 21, 2010 (incorporated by reference to Exhibit 10.1 to the Current Report on Form 8-K of Dynegy Inc. and Dynegy Holdings Inc. filed on May 25, 2010).
|
|
|
10.10
|
Dynegy Inc. Executive Severance Pay Plan, as amended and restated effective as of January 1, 2008 (incorporated by reference to Exhibit 10.1 to the Current Report on Form 8-K of Dynegy Inc. filed on January 4, 2008, File No. 001-33443). ††
|
|
|
10.11
|
First Amendment to the Dynegy Inc. Executive Severance Pay Plan effective as of January 1, 2010 (incorporated by reference to Exhibit 10.15 to the Annual Report on Form 10-K for the Fiscal Year Ended December 31, 2009 of Dynegy Inc, File No. 1-15659). ††
|
|
|
10.12
|
Second Amendment to the Dynegy Inc. Executive Severance Pay Plan, dated as of September 20, 2010. (incorporated by reference to Exhibit 10.4 to the Quarterly Report on Form 10-Q for the Quarter Ended September 30, 2010 of Dynegy Inc, File No. 1-15659). ††
|
|
|
10.13
|
Dynegy Inc. Executive Change in Control Severance Pay Plan effective April 3, 2008 (incorporated by reference to Exhibit 10.1 to the Current Report on Form 8-K of Dynegy Inc. filed on April 8, 1008, File No. 001-33443). ††
|
|
|
10.14
|
First Amendment to the Dynegy Inc. Executive Change In Control Severance Pay Plan, dated as of September 22, 2010 (incorporated by reference to Exhibit 10.2 to the Quarterly Report on Form 10-Q for the Quarter Ended September 30, 2010 of Dynegy Inc, File No. 1-15659). ††
|
|
|
10.15
|
Dynegy Inc. Excise Tax Reimbursement Policy, effective January 1, 2008 (incorporated by reference to Exhibit 10.2 to the Current Report on Form 8-K of Dynegy Inc. filed on January 4, 2008, File No. 001-33443). ††
|
|
|
10.16
|
Dynegy Inc. Restoration 401(k) Savings Plan, effective June 1, 2008 (incorporated by reference to Exhibit 10.2 to the Quarterly Report on Form 10-Q of Dynegy Inc. filed on August 7, 2008, File No. 001-33443). ††
|
|
Exhibit
Number
|
Description
|
|
|
10.17
|
First Amendment to the Dynegy Inc. Restoration 401(k) Savings Plan, effective June 1, 2008 (incorporated by reference to Exhibit 10.3 to the Quarterly Report on Form 10-Q of Dynegy Inc. filed on August 7, 2008, File No. 001-33443). ††
|
|
|
10.18
|
Dynegy Inc. Restoration Pension Plan, effective June 1, 2008 (incorporated by reference to Exhibit 10.4 to the Quarterly Report on Form 10-Q of Dynegy Inc. filed on August 7, 2008, File No. 001-33443). ††
|
|
|
10.19
|
First Amendment to the Dynegy Inc. Restoration Pension Plan, effective June 1, 2008 (incorporated by reference to Exhibit 10.5 to the Quarterly Report on Form 10-Q of Dynegy Inc. filed on August 7, 2008, File No. 001-33443). ††
|
|
|
10.20
|
Second Amendment to the Dynegy Inc. Restoration Pension Plan, executed on July 2, 2010 (incorporated by reference to Exhibit 10.4 to the Quarterly Report on Form 10-Q of Dynegy Inc. and Dynegy Holdings Inc. filed on August 6, 2010, File No. 000-29311). ††
|
|
|
10.21
|
Form of Performance Award Agreement with Bruce A. Williamson, dated March 3, 2010 (incorporated by reference to Exhibit 10.1 to the Current Report on Form 8-K of Dynegy Inc. filed on March 5, 2010, File No. 1-33443). ††
|
|
|
10.22
|
Form of Performance Award Agreement, dated March 3, 2010 (incorporated by reference to Exhibit 10.2 to the Current Report on Form 8-K of Dynegy Inc. filed on March 5, 2010, File No. 1-33443). ††
|
|
|
10.23
|
Form of Restricted Stock Award Agreement with Bruce A. Williamson, dated March 3, 2010 (incorporated by reference to Exhibit 10.3 to the Current Report on Form 8-K of Dynegy Inc. filed on March 5, 2010, File No. 1-33443). ††
|
|
|
10.24
|
Form of Restricted Stock Award Agreement, dated March 3, 2010 (incorporated by reference to Exhibit 10.4 to the Current Report on Form 8-K of Dynegy Inc. filed on March 5, 2010, File No. 1-33443). ††
|
|
|
10.25
|
Form of Non-Qualified Stock Option Award Agreement with Bruce A. Williamson, dated March 3, 2010 (incorporated by reference to Exhibit 10.5 to the Current Report on Form 8-K of Dynegy Inc. filed on March 5, 2010, File No. 1-33443). ††
|
|
|
10.26
|
Form of Non-Qualified Stock Option Award Agreement, dated March 3, 2010 (incorporated by reference to Exhibit 10.6 to the Current Report on Form 8-K of Dynegy Inc. filed on March 5, 2010, File No. 1-33443). ††
|
|
|
10.27
|
First Amendment to the 2009 Form of Performance Award Agreement, effective as of March 3, 2010 (incorporated by reference to Exhibit 10.7 to the Current Report on Form 8-K of Dynegy Inc. filed on March 5, 2010, File No. 1-33443). ††
|
|
|
10.28
|
The Global Amendment to Equity-Based Compensation Agreements, executed on May 25, 2010 (incorporated by reference to Exhibit 10.2 to the Current Report on Form 8-K of Dynegy Inc. and Dynegy Holdings Inc. filed on May 25, 2010). ††
|
|
|
10.29
|
Dynegy Inc. 2009 Phantom Stock Plan (incorporated by reference to Exhibit 10.3 to the Current Report onForm8-K of Dynegy Inc. filed on March 10, 2009, File No. 001-33443). ††
|
|
|
10.30
|
Dynegy Inc. Deferred Compensation Plan, amended and restated, effective January 1, 2002(incorporated by reference to Exhibit 4.6 to the Registration Statement on Form S-8 of Dynegy Inc., Registration No. 333-76080). ††
|
|
|
10.31
|
Amendment to the Dynegy Inc. Deferred Compensation Plan, dated as of April 2, 2007 (incorporated by reference to Exhibit 10.38 to the Current Report on Form 8-K of Dynegy Holdings Inc. filed on April 6, 2007, File No. 000-29311). ††
|
|
|
10.32
|
Dynegy Inc. Deferred Compensation Plan for Certain Directors, as amended and restated, effective January 1, 2008 (incorporated by reference to Exhibit 10.55 to the Annual Report on Form 10-K for the Fiscal Year ended December 31, 2009, filed on February 26, 2009, File No. 001-33443). ††
|
|
|
10.33
|
Trust under Dynegy Inc. Deferred Compensation Plan for Certain Directors, effective January 1, 2009 (incorporated by reference to Exhibit 10.56 to the Annual Report on Form 10-K for the Fiscal Year ended December 31, 2009, filed on February 26, 2009, File No. 001-33443). ††
|
|
Exhibit
Number
|
Description
|
|
|
Dynegy Inc. Incentive Compensation Plan, as amended and restated effective May 21, 2010. ††
|
||
|
10.35
|
Dynegy Inc. 2010 Long Term Incentive Plan (incorporated by reference to Exhibit 4.1 to the Registration Statement on Form S-8 of Dynegy Inc. filed on May 26, 2010, File No. 333-167091). ††
|
|
|
10.36
|
Dynegy Inc. 2000 Long Term Incentive Plan (incorporated by reference to Exhibit 10.7 to the Annual Report on Form 10-K for the Fiscal Year Ended December 31, 1999 of Dynegy Inc., File No. 1-11156). ††
|
|
|
10.37
|
Amendment to the Dynegy Inc. 2000 Long Term Incentive Plan effective January 1, 2006 (incorporated by reference to Exhibit 10.5 to the Current Report on Form 8-K of Dynegy Inc. filed on March 17, 2006, File No. 1-15659). ††
|
|
|
10.38
|
Second Amendment to the Dynegy Inc. 2000 Long Term Incentive Plan, dated as of April 2, 2007 (incorporated by reference to Exhibit 10.34 to the Current Report on Form 8-K of Dynegy Holdings Inc. filed on April 6, 2007, File No. 000-29311). ††
|
|
|
10.39
|
Dynegy Inc. 2002 Long Term Incentive Plan (incorporated by reference to Appendix A to the Definitive Proxy Statement on Schedule 14A of Dynegy Inc., File No. 1-15659, filed with the SEC on April 9, 2002). ††
|
|
|
10.40
|
Amendment to the Dynegy Inc. 2002 Long Term Incentive Plan, effective January 1, 2006 (incorporated by reference to Exhibit 10.6 to the Current Report on Form 8-K of Dynegy Inc. filed on March 17, 2006, File No. 1-15659). ††
|
|
|
10.41
|
Second Amendment to the Dynegy Inc. 2002 Long Term Incentive Plan, dated as of April 2, 2007 (incorporated by reference to Exhibit 10.36 to the Current Report on Form 8-K of Dynegy Holdings Inc. filed on April 6, 2007, File No. 000-29311). ††
|
|
|
10.42
|
Dynegy Inc. Deferred Compensation Plan Trust Agreement (incorporated by reference to Exhibit 4.7 to the Registration Statement on Form S-8 of Dynegy Inc., Registration No. 333-76080). ††
|
|
|
10.43
|
Amendment to Dynegy Inc. Deferred Compensation Plan Trust Agreement (Vanguard), dated as of April 2, 2007 (incorporated by reference to Exhibit 10.54 to the Current Report on Form 8-K of Dynegy Holdings Inc. filed on April 6, 2007, File No. 000-29311). ††
|
|
|
10.44
|
Purchase Agreement, dated as of May 17, 2007, by and between Dynegy Holdings Inc. and J.P. Morgan Securities Inc. (incorporated by reference to Exhibit 10.2 to the Quarterly Report on Form 10-Q for Quarterly Period Ended June 30, 2007 of Dynegy Holdings Inc., File No. 000-29311).
|
|
|
10.45
|
Baldwin Consent Decree, approved May 27, 2005 (incorporated by reference to Exhibit 99.1 to the Current Report on Form 8-K of Dynegy Inc. filed on May 31, 2005, File No. 1-15659).
|
|
|
10.46
|
Support Agreement among Dynegy Inc., High River Limited Partnership, Icahn Partners LP, Icahn Partners Master Fund LP, Icahn Partners Master Fund II LP and Icahn Partners Master Fund LP. (incorporated herein by reference to Exhibit 4.1 to the Current Report on Form 8-K of Dynegy Inc. filed on December 15, 2010, File No. 001-33443).
|
|
|
Severance Agreement and Release by and between Dynegy Inc. and Bruce A. Williamson.
††
|
||
|
Independent Contractor Agreement between Dynegy Inc. and David W. Biegler
|
||
|
14.1
|
Dynegy Inc. Code of Ethics for Senior Financial Professionals (incorporated by reference to Exhibit 14.1 to the Annual Report on Form 10-K for the Fiscal Year Ended December 31, 2003 of Dynegy Inc., File No. 1- 15659).
|
|
|
Subsidiaries of the Registrant (Dynegy Inc.).
|
||
|
21.2
|
Subsidiaries of the Registrant (Dynegy Holdings Inc.) — Omitted pursuant to General Instruction (1)(2)(c) of Form 10-K.
|
|
|
Consent of Ernst & Young LLP (Dynegy Inc.).
|
||
|
Consent of Ernst & Young LLP (Dynegy Holdings Inc.).
|
|
Exhibit
Number
|
Description
|
|
|
Chief Executive Officer Certification Pursuant to Rule 13a-14(a) and 15d-14(a), As Adopted Pursuant to Section 302 of the Sarbanes-Oxley Act of 2002.
|
||
|
Chief Executive Officer Certification Pursuant to Rule 13a-14(a) and 15d-14(a), As Adopted Pursuant to Section 302 of the Sarbanes-Oxley Act of 2002.
|
||
|
Chief Financial Officer Certification Pursuant to Rule 13a-14(a) and 15d-14(a), As Adopted Pursuant to Section 302 of the Sarbanes-Oxley Act of 2002.
|
||
|
Chief Financial Officer Certification Pursuant to Rule 13a-14(a) and 15d-14(a), As Adopted Pursuant to Section 302 of the Sarbanes-Oxley Act of 2002.
|
||
|
Chief Executive Officer Certification Pursuant to 18 United States Code Section 1350, As Adopted Pursuant to Section 906 of the Sarbanes-Oxley Act of 2002.
|
||
|
Chief Executive Officer Certification Pursuant to 18 United States Code Section 1350, As Adopted Pursuant to Section 906 of the Sarbanes-Oxley Act of 2002.
|
||
|
Chief Financial Officer Certification Pursuant to 18 United States Code Section 1350, As Adopted Pursuant to Section 906 of the Sarbanes-Oxley Act of 2002.
|
||
|
Chief Financial Officer Certification Pursuant to 18 United States Code Section 1350, As Adopted Pursuant to Section 906 of the Sarbanes-Oxley Act of 2002.
|
||
|
*101.INS
|
XBRL Instance Document
|
|
|
*101.SCH
|
XBRL Taxonomy Extension Schema Document
|
|
|
*101.CAL
|
XBRL Taxonomy Extension Calculation Linkbase Document
|
|
|
*101.DEF
|
XBRL Taxonomy Extension Definition Linkbase Document
|
|
|
*101.LAB
|
XBRL Taxonomy Extension Label Linkbase Document
|
|
|
*101.PRE
|
XBRL Taxonomy Extension Presentation Linkbase Document
|
|
**
|
Filed herewith
|
|
†
|
Pursuant to Securities and Exchange Commission Release No. 33-8238, this certification will be treated as “accompanying” this report and not “filed” as part of such report for purposes of Section 18 of the Securities Exchange Act of 1934, as amended, or the Exchange Act, or otherwise subject to the liability of Section 18 of the Exchange Act, and this certification will not be deemed to be incorporated by reference into any filing under the Securities Act of 1933, as amended, or the Exchange Act.
|
|
††
|
Management contract or compensation plan.
|
|
*
|
XBRL information is furnished and not filed for purposes of Section 11 and 12 of the Securities Act of 1933 and Section 18 of the Securities Exchange Act of 1934, and is not subject to liability under those sections, is not part of any registration statement or prospectus to which it relates and is not incorporated or deemed to be incorporated by reference into any registration statement, prospectus or other document.
|
Pursuant to the requirements of Section 13 or 15(d) of the Securities Exchange Act of 1934, the registrant has duly caused this report to be signed on its behalf by the undersigned, the thereunto duly authorized.
|
DYNEGY INC.
|
||
| Date: March 8, 2011 |
By:
|
/
s/
Bruce A. Williamson
|
|
Bruce A. Williamson
President and Chief Executive Officer
|
Pursuant to the requirements of the Securities Exchange Act of 1934, this report has been signed below by the following persons in the capacities and on the dates indicated.
|
/s/ BRUCE A. WILLIAMSON
|
President and Chief Executive Officer (Principal
|
March 8, 2011
|
||
|
Bruce A. Williamson
|
Executive Officer)
|
|||
|
/s/ HOLLI C. NICHOLS
|
Executive Vice President and Chief Financial
|
March 8, 2011
|
||
|
Holli C. Nichols
|
Officer (Principal Financial Officer)
|
|||
|
/s/ TRACY A. McLAUCHLIN
|
Senior Vice President and Controller (Principal
|
March 8, 2011
|
||
|
Tracy A. McLauchlin
|
Accounting Officer)
|
|||
|
/s/ PATRICIA A. HAMMICK
|
Chairman of the Board
|
March 8, 2011
|
||
|
Patricia A. Hammick
|
||||
|
/s/ DAVID W. BIEGLER
|
Director
|
March 8, 2011
|
||
|
David W. Biegler
|
||||
|
/s/ VICTOR E. GRIJALVA
|
Director
|
March 8, 2011
|
||
|
Victor E. Grijalva
|
||||
|
/s/ HOWARD B. SHEPPARD
|
Director
|
March 8, 2011
|
||
|
Howard B. Sheppard
|
||||
|
/s/ WILLIAM L. TRUBECK
|
Director
|
March 8, 2011
|
||
|
William L. Trubeck
|
Pursuant to the requirements of Section 13 or 15(d) of the Securities Exchange Act of 1934, the registrant has duly caused this report to be signed on its behalf by the undersigned, the thereunto duly authorized.
|
DYNEGY HOLDINGS INC.
|
||
| Date: March 8, 2011 |
By:
|
/s/
Bruce A. Williamson
|
|
Bruce A. Williamson
President and Chief Executive Officer
|
Pursuant to the requirements of the Securities Exchange Act of 1934, this report has been signed below by the following persons in the capacities and on the dates indicated.
|
/s/ BRUCE A. WILLIAMSON
|
President and Chief Executive Officer (Principal
|
March 8, 2011
|
||
|
Bruce A. Williamson
|
Executive Officer)
|
|||
|
/s/ HOLLI C. NICHOLS
|
Executive Vice President, Chief Financial
|
March 8, 2011
|
||
|
Holli C. Nichols
|
Officer and Director (Principal Financial Officer)
|
|||
|
/s/ TRACY A. McLAUCHLIN
|
Senior Vice President and Controller (Principal
|
March 8, 2011
|
||
|
Tracy A. McLauchlin
|
Accounting Officer)
|
|||
|
/s/ KENT R. STEPHENSON
|
Director
|
March 8, 2011
|
||
|
Kent R. Stephenson
|
||||
|
/s/ LYNN A. LEDNICKY
|
Director
|
March 8, 2011
|
||
|
Lynn A. Lednicky
|
DYNEGY INC. AND DYNGEGY HOLDINGS INC.
|
Page
|
||
|
Consolidated Financial Statements
|
||
|
F-2
|
||
|
F-3
|
||
|
F-4
|
||
|
F-5
|
||
|
F-6
|
||
|
F-7
|
||
|
F-8
|
||
|
F-9
|
||
|
F-10
|
||
|
F-11
|
||
|
F-12
|
||
|
F-13
|
||
|
F-14
|
||
|
Financial Statement Schedules
|
||
|
F-93
|
||
|
F-97
|
||
|
F-98
|
The Board of Directors and Stockholders
Dynegy Inc.
We have audited the accompanying consolidated balance sheets of Dynegy Inc. as of December 31, 2010 and 2009, and the related consolidated statements of operations, stockholders’ equity, comprehensive loss and cash flows for each of the three years in the period ended December 31, 2010. Our audits also included the financial statement schedules listed in the Index at Item 15(a). These financial statements and schedules are the responsibility of the Company’s management. Our responsibility is to express an opinion on these financial statements and schedules based on our audits.
We conducted our audits in accordance with the standards of the Public Company Accounting Oversight Board (United States). Those standards require that we plan and perform the audit to obtain reasonable assurance about whether the financial statements are free of material misstatement. An audit includes examining, on a test basis, evidence supporting the amounts and disclosures in the financial statements. An audit also includes assessing the accounting principles used and significant estimates made by management, as well as evaluating the overall financial statement presentation. We believe that our audits provide a reasonable basis for our opinion.
In our opinion, the financial statements referred to above present fairly, in all material respects, the consolidated financial position of Dynegy Inc. at December 31, 2010 and 2009, and the consolidated results of its operations and its cash flows for each of the three years in the period ended December 31, 2010, in conformity with U.S. generally accepted accounting principles. Also, in our opinion, the related financial statement schedules, when considered in relation to the basic financial statements taken as a whole, present fairly in all material respects the information set forth therein.
The accompanying consolidated financial statements have been prepared assuming that Dynegy Inc. will continue as a going concern. As more fully described in Notes 1 and 18, Dynegy Inc. projects that it is likely that it will not be able to comply with certain debt covenants throughout 2011. This condition and its impact on Dynegy Inc.’s liquidity raises substantial doubt about Dynegy Inc.’s ability to continue as a going concern. Management’s plans in regard to this matter are also described in Notes 1 and 18. The 2010 consolidated financial statements do not include any adjustments that might result from the outcome of this uncertainty.
As discussed in Notes 2 and 5 to the consolidated financial statements, effective January 1, 2009 the Company adopted authoritative guidance issued by the Financial Accounting Standards Board for noncontrolling interests. Also, as discussed in Notes 2 and 15 to the consolidated financial statements, effective January 1, 2010, the Company adopted authoritative guidance issued by the Financial Accounting Standards Board for variable interest entities.
We also have audited, in accordance with the standards of the Public Company Accounting Oversight Board (United States), Dynegy Inc.’s internal control over financial reporting as of December 31, 2010, based on criteria established in Internal Control-Integrated Framework issued by the Committee of Sponsoring Organizations of the Treadway Commission and our report dated March 8, 2011 expressed an unqualified opinion thereon.
| /s/ Ernst & Young LLP |
Houston, Texas
March 8, 2011
The Board of Directors and Stockholder
Dynegy Holdings Inc.
We have audited the accompanying consolidated balance sheets of Dynegy Holdings Inc. as of December 31, 2010 and 2009, and the related consolidated statements of operations, cash flows, comprehensive loss, and stockholder’s equity for each of the three years in the period ended December 31, 2010. Our audits also included the financial statement schedule listed in the Index at Item 15(a). These financial statements and schedule are the responsibility of the Company’s management. Our responsibility is to express an opinion on these financial statements and schedule based on our audits.
We conducted our audits in accordance with the standards of the Public Company Accounting Oversight Board (United States). Those standards require that we plan and perform the audit to obtain reasonable assurance about whether the financial statements are free of material misstatement. We were not engaged to perform an audit of the Company’s internal control over financial reporting. Our audits included consideration of internal control over financial reporting as a basis for designing audit procedures that are appropriate in the circumstances, but not for the purpose of expressing an opinion on the effectiveness of the Company’s internal control over financial reporting. Accordingly, we express no such opinion. An audit also includes examining, on a test basis, evidence supporting the amounts and disclosures in the financial statements, assessing the accounting principles used and significant estimates made by management, and evaluating the overall financial statement presentation. We believe that our audits provide a reasonable basis for our opinion.
In our opinion, the financial statements referred to above present fairly, in all material respects, the consolidated financial position of Dynegy Holdings Inc. at December 31, 2010 and 2009, and the consolidated results of its operations and its cash flows for each of the three years in the period ended December 31, 2010, in conformity with U.S. generally accepted accounting principles. Also, in our opinion, the related financial statement schedule, when considered in relation to the basic financial statements taken as a whole, presents fairly in all material respects the information set forth therein.
The accompanying consolidated financial statements have been prepared assuming that Dynegy Holdings Inc. will continue as a going concern. As more fully described in Notes 1 and 18, Dynegy Holdings Inc. projects that it is likely that it will not be able to comply with certain debt covenants throughout 2011. This condition and its impact on Dynegy Holdings Inc.’s liquidity raises substantial doubt about Dynegy Holdings Inc.’s ability to continue as a going concern. Management’s plans in regard to this matter are also described in Notes 1 and 18. The 2010 consolidated financial statements do not include any adjustments that might result from the outcome of this uncertainty.
As discussed in Notes 2 and 5 to the consolidated financial statements, effective January 1, 2009 the Company adopted authoritative guidance issued by the Financial Accounting Standards Board for noncontrolling interests. Also, as discussed in Notes 2 and 15 to the consolidated financial statements, effective January 1, 2010, the Company adopted authoritative guidance issued by the Financial Accounting Standards Board for variable interest entities.
| /s/ Ernst & Young LLP |
Houston, Texas
March 8, 2011
DYNEGY INC.
(in millions, except share data)
|
December 31,
2010 |
December 31,
2009 |
|||||||
|
ASSETS
|
||||||||
|
Current Assets
|
||||||||
|
Cash and cash equivalents
|
$ | 291 | $ | 471 | ||||
|
Restricted cash and investments
|
81 | 78 | ||||||
|
Short-term investments
|
106 | 9 | ||||||
|
Accounts receivable, net of allowance for doubtful accounts of $32 and $22, respectively
|
230 | 212 | ||||||
|
Accounts receivable, affiliates
|
1 | 2 | ||||||
|
Inventory
|
121 | 141 | ||||||
|
Assets from risk-management activities
|
1,199 | 713 | ||||||
|
Deferred income taxes
|
12 | 6 | ||||||
|
Broker margin account
|
80 | 286 | ||||||
|
Prepayments and other current assets
|
123 | 120 | ||||||
|
Total Current Assets
|
2,244 | 2,038 | ||||||
|
Property, Plant and Equipment
|
8,593 | 9,071 | ||||||
|
Accumulated depreciation
|
(2,320 | ) | (1,954 | ) | ||||
|
Property, Plant and Equipment, Net
|
6,273 | 7,117 | ||||||
|
Other Assets
|
||||||||
|
Restricted cash and investments
|
859 | 877 | ||||||
|
Assets from risk-management activities
|
72 | 163 | ||||||
|
Intangible assets
|
141 | 380 | ||||||
|
Other long-term assets
|
424 | 378 | ||||||
|
Total Assets
|
$ | 10,013 | $ | 10,953 | ||||
|
LIABILITIES AND STOCKHOLDERS’ EQUITY
|
||||||||
|
Current Liabilities
|
||||||||
|
Accounts payable
|
$ | 134 | $ | 181 | ||||
|
Accrued interest
|
36 | 36 | ||||||
|
Accrued liabilities and other current liabilities
|
109 | 127 | ||||||
|
Liabilities from risk-management activities
|
1,138 | 696 | ||||||
|
Notes payable and current portion of long-term debt
|
148 | 807 | ||||||
|
Total Current Liabilities
|
1,565 | 1,847 | ||||||
|
Long-term debt
|
4,426 | 4,575 | ||||||
|
Long-term debt to affiliates
|
200 | 200 | ||||||
|
Long-Term Debt
|
4,626 | 4,775 | ||||||
|
Other Liabilities
|
||||||||
|
Liabilities from risk-management activities
|
99 | 213 | ||||||
|
Deferred income taxes
|
641 | 780 | ||||||
|
Other long-term liabilities
|
336 | 359 | ||||||
|
Total Liabilities
|
7,267 | 7,974 | ||||||
|
Commitments and Contingencies (Note 22)
|
||||||||
|
Stockholders’ Equity
|
||||||||
|
Common Stock, $0.01 par value, 420,000,000 shares authorized at December 31, 2010 and December 31, 2009; 121,687,198 shares and 120,715,515 shares issued and outstanding at December 31, 2010 and December 31, 2009, respectively
|
1 | 1 | ||||||
|
Additional paid-in capital
|
6,067 | 6,061 | ||||||
|
Subscriptions receivable
|
(2 | ) | (2 | ) | ||||
|
Accumulated other comprehensive loss, net of tax
|
(53 | ) | (150 | ) | ||||
|
Accumulated deficit
|
(3,196 | ) | (2,937 | ) | ||||
|
Treasury stock, at cost, 628,014 shares and 557,677 shares at December 31, 2010 and December 31, 2009, respectively
|
(71 | ) | (71 | ) | ||||
|
Total Dynegy Inc. Stockholders’ Equity
|
2,746 | 2,902 | ||||||
|
Noncontrolling interests
|
— | 77 | ||||||
|
Total Stockholders’ Equity
|
2,746 | 2,979 | ||||||
|
Total Liabilities and Stockholders’ Equity
|
$ | 10,013 | $ | 10,953 | ||||
See the notes to the consolidated financial statements
DYNEGY INC.
(in millions, except per share data)
|
Year Ended December 31,
|
||||||||||||
|
2010
|
2009
|
2008
|
||||||||||
|
Revenues
|
$ | 2,323 | $ | 2,468 | $ | 3,324 | ||||||
|
Cost of sales
|
(1,181 | ) | (1,194 | ) | (1,693 | ) | ||||||
|
Operating and maintenance expense, exclusive of depreciation shown separately below
|
(450 | ) | (519 | ) | (466 | ) | ||||||
|
Depreciation and amortization expense
|
(392 | ) | (335 | ) | (346 | ) | ||||||
|
Goodwill impairments
|
— | (433 | ) | — | ||||||||
|
Impairment and other charges, exclusive of goodwill impairments shown separately above
|
(148 | ) | (538 | ) | — | |||||||
|
Gain (loss) on sale of assets, net
|
— | (124 | ) | 82 | ||||||||
|
General and administrative expenses
|
(163 | ) | (159 | ) | (157 | ) | ||||||
|
Operating income (loss)
|
(11 | ) | (834 | ) | 744 | |||||||
|
Losses from unconsolidated investments
|
(62 | ) | (71 | ) | (123 | ) | ||||||
|
Interest expense
|
(363 | ) | (415 | ) | (427 | ) | ||||||
|
Debt extinguishment costs
|
— | (46 | ) | — | ||||||||
|
Other income and expense, net
|
4 | 11 | 84 | |||||||||
|
Income (loss) from continuing operations before income taxes
|
(432 | ) | (1,355 | ) | 278 | |||||||
|
Income tax benefit (expense)
|
197 | 315 | (90 | ) | ||||||||
|
Income (loss) from continuing operations
|
(235 | ) | (1,040 | ) | 188 | |||||||
|
Income (loss) from discontinued operations, net of tax benefit (expense) of zero, $121 and $14, respectively (Note 4)
|
1 | (222 | ) | (17 | ) | |||||||
|
Net income (loss)
|
(234 | ) | (1,262 | ) | 171 | |||||||
|
Less: Net income (loss) attributable to the noncontrolling interests
|
— | (15 | ) | (3 | ) | |||||||
|
Net income (loss) attributable to Dynegy Inc.
|
$ | (234 | ) | $ | (1,247 | ) | $ | 174 | ||||
|
Earnings (Loss) Per Share (Note 21):
|
||||||||||||
|
Basic earnings (loss) per share attributable to Dynegy Inc.:
|
||||||||||||
|
Earnings (loss) from continuing operations
|
$ | (1.96 | ) | $ | (6.25 | ) | $ | 1.14 | ||||
|
Income (loss) from discontinued operations
|
0.01 | (1.35 | ) | (0.10 | ) | |||||||
|
Basic earnings (loss) per share attributable to Dynegy Inc.
|
$ | (1.95 | ) | $ | (7.60 | ) | $ | 1.04 | ||||
|
Diluted earnings (loss) per share attributable to Dynegy Inc.:
|
||||||||||||
|
Earnings (loss) from continuing operations
|
$ | (1.96 | ) | $ | (6.25 | ) | $ | 1.14 | ||||
|
Income (loss) from discontinued operations
|
0.01 | (1.35 | ) | (0.10 | ) | |||||||
|
Diluted earnings (loss) per share attributable to Dynegy Inc.
|
$ | (1.95 | ) | $ | (7.60 | ) | $ | 1.04 | ||||
|
Basic shares outstanding
|
120 | 164 | 168 | |||||||||
|
Diluted shares outstanding
|
121 | 165 | 168 | |||||||||
See the notes to the consolidated financial statements
DYNEGY INC.
(in millions)
|
Year Ended December 31,
|
||||||||||||
|
2010
|
2009
|
2008
|
||||||||||
|
CASH FLOWS FROM OPERATING ACTIVITIES:
|
||||||||||||
|
Net income (loss)
|
$ | (234 | ) | $ | (1,262 | ) | $ | 171 | ||||
|
Adjustments to reconcile income (loss) to net cash flows from operating activities:
|
||||||||||||
|
Depreciation and amortization
|
408 | 359 | 376 | |||||||||
|
Goodwill impairments
|
— | 433 | — | |||||||||
|
Impairment and other charges, exclusive of goodwill impairments shown separately above
|
136 | 796 | 47 | |||||||||
|
Losses from unconsolidated investments, net of cash distributions
|
62 | 72 | 124 | |||||||||
|
Risk-management activities
|
(19 | ) | 180 | (255 | ) | |||||||
|
Loss (gain) on sale of assets, net
|
— | 218 | (82 | ) | ||||||||
|
Deferred taxes
|
(195 | ) | (436 | ) | 73 | |||||||
|
Legal and settlement charges
|
— | 2 | 6 | |||||||||
|
Debt extinguishment costs
|
— | 46 | — | |||||||||
|
Other
|
73 | 82 | 36 | |||||||||
|
Changes in working capital:
|
||||||||||||
|
Accounts receivable
|
(16 | ) | 66 | 68 | ||||||||
|
Inventory
|
16 | 7 | 3 | |||||||||
|
Broker margin account
|
290 | (201 | ) | (50 | ) | |||||||
|
Prepayments and other assets
|
(8 | ) | 15 | (1 | ) | |||||||
|
Accounts payable and accrued liabilities
|
(18 | ) | (112 | ) | (71 | ) | ||||||
|
Changes in non-current assets
|
(67 | ) | (119 | ) | (113 | ) | ||||||
|
Changes in non-current liabilities
|
(5 | ) | (11 | ) | (13 | ) | ||||||
|
Net cash provided by operating activities
|
423 | 135 | 319 | |||||||||
|
CASH FLOWS FROM INVESTING ACTIVITIES:
|
||||||||||||
|
Capital expenditures
|
(333 | ) | (612 | ) | (611 | ) | ||||||
|
Unconsolidated investments
|
(15 | ) | 1 | (6 | ) | |||||||
|
Proceeds from asset sales, net
|
— | 652 | 451 | |||||||||
|
Maturities of short-term investments
|
317 | — | — | |||||||||
|
Purchases of short-term investments
|
(508 | ) | — | — | ||||||||
|
Decrease (increase) in restricted cash
|
(3 | ) | 190 | 80 | ||||||||
|
Other investing, net
|
8 | 20 | (16 | ) | ||||||||
|
Net cash provided by (used in) investing activities
|
(534 | ) | 251 | (102 | ) | |||||||
|
CASH FLOWS FROM FINANCING ACTIVITIES:
|
||||||||||||
|
Proceeds from long-term borrowings, net of financing costs
|
(6 | ) | 328 | 192 | ||||||||
|
Repayments of borrowings
|
(63 | ) | (890 | ) | (45 | ) | ||||||
|
Debt extinguishment costs
|
— | (46 | ) | — | ||||||||
|
Net proceeds from issuance of capital stock
|
— | — | 2 | |||||||||
|
Other financing, net
|
— | — | (1 | ) | ||||||||
|
Net cash provided by (used in) financing activities
|
(69 | ) | (608 | ) | 148 | |||||||
|
Net increase (decrease) in cash and cash equivalents
|
(180 | ) | (222 | ) | 365 | |||||||
|
Cash and cash equivalents, beginning of period
|
471 | 693 | 328 | |||||||||
|
Cash and cash equivalents, end of period
|
$ | 291 | $ | 471 | $ | 693 | ||||||
See the notes to the consolidated financial statements
DYNEGY INC.
(in millions)
|
Common
Stock |
Additional
Paid-In Capital |
Subscriptions
Receivable |
Accumulated Other Comprehensive Income (Loss)
|
Accumulated
Deficit |
Treasury
Stock |
Total
Controlling Interests |
Noncontrolling Interests
|
Total
|
||||||||||||||||||||||||||||
|
December 31, 2007 (as previously reported)
|
$ | 8 | $ | 6,463 | $ | (5 | ) | $ | (25 | ) | $ | (1,864 | ) | $ | (71 | ) | $ | 4,506 | $ | 23 | $ | 4,529 | ||||||||||||||
|
Reverse stock-split (Note 23)
|
(5 | ) | 5 | — | — | — | — | — | — | — | ||||||||||||||||||||||||||
|
December 31, 2007 (as adjusted)
|
$ | 3 | $ | 6,468 | $ | (5 | ) | $ | (25 | ) | $ | (1,864 | ) | $ | (71 | ) | $ | 4,506 | $ | 23 | $ | 4,529 | ||||||||||||||
|
Net income (loss)
|
— | — | — | — | 174 | — | 174 | (3 | ) | 171 | ||||||||||||||||||||||||||
|
Other comprehensive loss, net of tax
|
— | — | — | (190 | ) | — | — | (190 | ) | (50 | ) | (240 | ) | |||||||||||||||||||||||
|
Subscriptions receivable
|
— | — | 3 | — | — | — | 3 | — | 3 | |||||||||||||||||||||||||||
|
Options exercised
|
— | 2 | — | — | — | — | 2 | — | 2 | |||||||||||||||||||||||||||
|
401(k) plan and profit sharing stock
|
— | 5 | — | — | — | — | 5 | — | 5 | |||||||||||||||||||||||||||
|
Options and restricted stock granted
|
— | 15 | — | — | — | — | 15 | — | 15 | |||||||||||||||||||||||||||
|
December 31, 2008
|
$ | 3 | $ | 6,490 | $ | (2 | ) | $ | (215 | ) | $ | (1,690 | ) | $ | (71 | ) | $ | 4,515 | $ | (30 | ) | $ | 4,485 | |||||||||||||
|
Net loss
|
— | — | — | — | (1,247 | ) | — | (1,247 | ) | (15 | ) | (1,262 | ) | |||||||||||||||||||||||
|
Other comprehensive income, net of tax
|
— | — | — | 65 | — | — | 65 | 122 | 187 | |||||||||||||||||||||||||||
|
401(k) plan and profit sharing stock
|
— | 5 | — | — | — | — | 5 | — | 5 | |||||||||||||||||||||||||||
|
Board of directors stock compensation
|
— | (1 | ) | — | — | — | — | (1 | ) | — | (1 | ) | ||||||||||||||||||||||||
|
Retirement of Class B common stock (Note 23)
|
(2 | ) | (441 | ) | — | — | — | — | (443 | ) | — | (443 | ) | |||||||||||||||||||||||
|
Options and restricted stock granted
|
— | 8 | — | — | — | — | 8 | — | 8 | |||||||||||||||||||||||||||
|
December 31, 2009
|
$ | 1 | $ | 6,061 | $ | (2 | ) | $ | (150 | ) | $ | (2,937 | ) | $ | (71 | ) | $ | 2,902 | $ | 77 | $ | 2,979 | ||||||||||||||
|
Deconsolidation of Plum Point (See Note 15)
|
— | — | — | 77 | (25 | ) | — | 52 | (77 | ) | (25 | ) | ||||||||||||||||||||||||
|
Net loss
|
— | — | — | — | (234 | ) | — | (234 | ) | — | (234 | ) | ||||||||||||||||||||||||
|
Other comprehensive income, net of tax
|
— | — | — | 20 | — | — | 20 | — | 20 | |||||||||||||||||||||||||||
|
401(k) plan and profit sharing stock
|
— | 6 | — | — | — | — | 6 | — | 6 | |||||||||||||||||||||||||||
|
December 31, 2010
|
$ | 1 | $ | 6,067 | $ | (2 | ) | $ | (53 | ) | $ | (3,196 | ) | $ | (71 | ) | $ | 2,746 | $ | — | $ | 2,746 | ||||||||||||||
See the notes to the consolidated financial statements
DYNEGY INC.
(in millions)
|
Year Ended December 31,
|
||||||||||||
|
2010
|
2009
|
2008
|
||||||||||
|
Net income (loss)
|
$ | (234 | ) | $ | (1,262 | ) | $ | 171 | ||||
|
Cash flow hedging activities, net:
|
||||||||||||
|
Unrealized mark-to-market gains (losses) arising during period, net
|
— | 166 | (142 | ) | ||||||||
|
Reclassification of mark-to-market losses to earnings, net
|
— | 1 | 10 | |||||||||
|
Deferred losses on cash flow hedges, net
|
— | (11 | ) | (4 | ) | |||||||
|
Changes in cash flow hedging activities, net (net of tax benefit (expense) of zero, $(24) and $60, respectively)
|
— | 156 | (136 | ) | ||||||||
|
Foreign currency translation adjustments
|
— | — | (27 | ) | ||||||||
|
Actuarial gain (loss) and amortization of unrecognized prior service cost (net of tax benefit (expense) of $(1), $(8) and $29, respectively)
|
3 | 7 | (41 | ) | ||||||||
|
Unrealized loss on securities, net:
|
||||||||||||
|
Unrealized loss on securities
|
— | — | (3 | ) | ||||||||
|
Reclassification adjustments for gains realized in net loss
|
— | — | (9 | ) | ||||||||
|
Unrealized losses on securities, net (net of tax benefit) of zero, zero and $8, respectively)
|
— | — | (12 | ) | ||||||||
|
Unconsolidated investment other comprehensive income (loss), net (net of tax benefit (expense) of $(11), $(17) and $17, respectively)
|
17 | 24 | (24 | ) | ||||||||
|
Other comprehensive income (loss), net of tax
|
20 | 187 | (240 | ) | ||||||||
|
Comprehensive loss
|
(214 | ) | (1,075 | ) | (69 | ) | ||||||
|
Less: Comprehensive income (loss) attributable to the noncontrolling interests
|
— | 107 | (53 | ) | ||||||||
|
Comprehensive loss attributable to Dynegy Inc.
|
$ | (214 | ) | $ | (1,182 | ) | $ | (16 | ) | |||
See the notes to the consolidated financial statements
DYNEGY HOLDINGS INC.
(in millions)
|
December 31, 2010
|
December 31, 2009
|
|||||||
|
ASSETS
|
||||||||
|
Current Assets
|
||||||||
|
Cash and cash equivalents
|
$ | 253 | $ | 419 | ||||
|
Restricted cash and investments
|
81 | 78 | ||||||
|
Short-term investments
|
90 | 8 | ||||||
|
Accounts receivable, net of allowance for doubtful accounts of $13 and $20, respectively
|
229 | 214 | ||||||
|
Accounts receivable, affiliates
|
1 | 2 | ||||||
|
Inventory
|
121 | 141 | ||||||
|
Assets from risk-management activities
|
1,199 | 713 | ||||||
|
Deferred income taxes
|
3 | 7 | ||||||
|
Broker margin
account
|
80 | 286 | ||||||
|
Prepayments and other current assets
|
123 | 120 | ||||||
|
Total Current Assets
|
2,180 | 1,988 | ||||||
|
Property, Plant and Equipment
|
8,593 | 9,071 | ||||||
|
Accumulated depreciation
|
(2,320 | ) | (1,954 | ) | ||||
|
Property, Plant and Equipment, Net
|
6,273 | 7,117 | ||||||
|
Other Assets
|
||||||||
|
Restricted cash and investments
|
859 | 877 | ||||||
|
Assets from risk-management activities
|
72 | 163 | ||||||
|
Intangible assets
|
141 | 380 | ||||||
|
Other long-term assets
|
424 | 378 | ||||||
|
Total Assets
|
$ | 9,949 | $ | 10,903 | ||||
|
LIABILITIES AND STOCKHOLDER’S EQUITY
|
||||||||
|
Current Liabilities
|
||||||||
|
Accounts payable
|
$ | 134 | $ | 181 | ||||
|
Accrued interest
|
36 | 36 | ||||||
|
Accrued liabilities and other current liabilities
|
106 | 128 | ||||||
|
Liabilities from risk-management activities
|
1,138 | 696 | ||||||
|
Notes payable and current portion of long-term debt
|
148 | 807 | ||||||
|
Total Current Liabilities
|
1,562 | 1,848 | ||||||
|
Long-term debt
|
4,426 | 4,575 | ||||||
|
Long-term debt to affiliates
|
200 | 200 | ||||||
|
Long-Term Debt
|
4,626 | 4,775 | ||||||
|
Other Liabilities
|
||||||||
|
Liabilities from risk-management activities
|
99 | 213 | ||||||
|
Deferred income taxes
|
606 | 704 | ||||||
|
Other long-term liabilities
|
337 | 360 | ||||||
|
Total Liabilities
|
7,230 | 7,900 | ||||||
|
Commitments and Contingencies (Note 22)
|
||||||||
|
Stockholder’s Equity
|
||||||||
|
Capital Stock, $1 par value, 1,000 shares authorized at December 31, 2010 and December 31, 2009, respectively
|
— | — | ||||||
|
Additional paid-in capital
|
5,135 | 5,135 | ||||||
|
Affiliate receivable
|
(814 | ) | (777 | ) | ||||
|
Accumulated other comprehensive loss, net of tax
|
(53 | ) | (150 | ) | ||||
|
Accumulated deficit
|
(1,549 | ) | (1,282 | ) | ||||
|
Total Dynegy Holdings Inc. Stockholder’s Equity
|
2,719 | 2,926 | ||||||
|
Noncontrolling interests
|
— | 77 | ||||||
|
Total Stockholders’ Equity
|
2,719 | 3,003 | ||||||
|
Total Liabilities and Stockholder’s Equity
|
$ | 9,949 | $ | 10,903 | ||||
See the notes to the consolidated financial statements
DYNEGY HOLDINGS INC.
(in millions)
|
Year Ended December 31,
|
||||||||||||
|
2010
|
2009
|
2008
|
||||||||||
|
Revenues
|
$ | 2,323 | $ | 2,468 | $ | 3,324 | ||||||
|
Cost of sales
|
(1,181 | ) | (1,194 | ) | (1,693 | ) | ||||||
|
Operating and maintenance expense, exclusive of depreciation shown separately below
|
(450 | ) | (521 | ) | (466 | ) | ||||||
|
Depreciation and amortization expense
|
(392 | ) | (335 | ) | (346 | ) | ||||||
|
Goodwill impairments
|
— | (433 | ) | — | ||||||||
|
Impairment and other charges, exclusive of goodwill impairments shown separately above
|
(148 | ) | (538 | ) | — | |||||||
|
Gain (loss) on sale of assets
|
— | (124 | ) | 82 | ||||||||
|
General and administrative expenses
|
(158 | ) | (159 | ) | (157 | ) | ||||||
|
Operating income (loss)
|
(6 | ) | (836 | ) | 744 | |||||||
|
Losses from unconsolidated investments
|
(62 | ) | (72 | ) | (40 | ) | ||||||
|
Interest expense
|
(363 | ) | (415 | ) | (427 | ) | ||||||
|
Debt extinguishment costs
|
— | (46 | ) | — | ||||||||
|
Other income and expense, net
|
4 | 10 | 83 | |||||||||
|
Income (loss) from continuing operations before income taxes
|
(427 | ) | (1,359 | ) | 360 | |||||||
|
Income tax benefit (expense)
|
184 | 313 | (138 | ) | ||||||||
|
Income (loss) from continuing operations
|
(243 | ) | (1,046 | ) | 222 | |||||||
|
Income (loss) from discontinued operations, net of tax benefit (expense) of zero, $121 and $14, respectively (Note 4)
|
1 | (222 | ) | (17 | ) | |||||||
|
Net income (loss)
|
(242 | ) | (1,268 | ) | 205 | |||||||
|
Less: Net income (loss) attributable to the noncontrolling interests
|
— | (15 | ) | (3 | ) | |||||||
|
Net income (loss) attributable to Dynegy Holdings Inc.
|
$ | (242 | ) | $ | (1,253 | ) | $ | 208 | ||||
See the notes to the consolidated financial statements
DYNEGY HOLDINGS INC.
(in millions)
|
Year Ended December 31,
|
||||||||||||
|
2010
|
2009
|
2008
|
||||||||||
|
CASH FLOWS FROM OPERATING ACTIVITIES:
|
||||||||||||
|
Net income (loss)
|
$ | (242 | ) | $ | (1,268 | ) | $ | 205 | ||||
|
Adjustments to reconcile income (loss) to net cash flows from operating activities:
|
||||||||||||
|
Depreciation and amortization
|
408 | 359 | 376 | |||||||||
|
Goodwill impairments
|
— | 433 | — | |||||||||
|
Impairment and other charges, exclusive of goodwill impairments shown separately above
|
136 | 796 | 47 | |||||||||
|
Losses from unconsolidated investments, net of cash distributions
|
62 | 73 | 41 | |||||||||
|
Risk-management activities
|
(19 | ) | 180 | (255 | ) | |||||||
|
Loss (gain) on sale of assets, net
|
— | 218 | (82 | ) | ||||||||
|
Deferred taxes
|
(182 | ) | (430 | ) | 119 | |||||||
|
Legal and settlement charges
|
— | 2 | 6 | |||||||||
|
Debt extinguishment costs
|
— | 46 | — | |||||||||
|
Other
|
68 | 79 | 32 | |||||||||
|
Changes in working capital:
|
||||||||||||
|
Accounts receivable
|
(14 | ) | 66 | 67 | ||||||||
|
Inventory
|
16 | 7 | 3 | |||||||||
|
Broker margin account
|
290 | (201 | ) | (50 | ) | |||||||
|
Prepayments and other assets
|
(8 | ) | 15 | (1 | ) | |||||||
|
Accounts payable and accrued liabilities
|
(20 | ) | (93 | ) | (67 | ) | ||||||
|
Changes in non-current assets
|
(67 | ) | (119 | ) | (108 | ) | ||||||
|
Changes in non-current liabilities
|
(5 | ) | ( 11 | ) | (14 | ) | ||||||
|
Net cash provided by operating activities
|
423 | 152 | 319 | |||||||||
|
CASH FLOWS FROM INVESTING ACTIVITIES:
|
||||||||||||
|
Capital expenditures
|
(333 | ) | (612 | ) | (611 | ) | ||||||
|
Proceeds from asset sales, net
|
— | 1,095 | 451 | |||||||||
|
Unconsolidated investments
|
(15 | ) | — | 10 | ||||||||
|
Maturities of short-term investments
|
302 | — | — | |||||||||
|
Purchases of short-term investments
|
(477 | ) | — | — | ||||||||
|
Decrease (increase) in restricted cash
|
(3 | ) | 190 | 80 | ||||||||
|
Affiliate transactions
|
(2 | ) | 98 | 1 | ||||||||
|
Other investing, net
|
8 | 19 | (18 | ) | ||||||||
|
Net cash provided by (used in) investing activities
|
(520 | ) | 790 | (87 | ) | |||||||
|
CASH FLOWS FROM FINANCING ACTIVITIES:
|
||||||||||||
|
Proceeds from long-term borrowings, net of financing costs
|
(6 | ) | 328 | 192 | ||||||||
|
Repayments of borrowings
|
(63 | ) | (890 | ) | (45 | ) | ||||||
|
Debt extinguishment costs
|
— | (46 | ) | — | ||||||||
|
Dividends to affiliates
|
— | (585 | ) | — | ||||||||
|
Other financing, net
|
— | — | (1 | ) | ||||||||
|
Net cash provided by (used in) financing activities
|
(69 | ) | (1,193 | ) | 146 | |||||||
|
Net increase (decrease) in cash and cash equivalents
|
(166 | ) | (251 | ) | 378 | |||||||
|
Cash and cash equivalents, beginning of period
|
419 | 670 | 292 | |||||||||
|
Cash and cash equivalents, end of period
|
$ | 253 | $ | 419 | $ | 670 | ||||||
See the notes to the consolidated financial statements
DYNEGY HOLDINGS INC.
(in millions)
|
Additional
Paid-In
Capital
|
Affiliate
Receivable |
Accumulated
Other Comprehensive Income (Loss) |
Accumulated
Deficit |
Total
Controlling Interests |
Noncontrolling
Interests |
Total
|
||||||||||||||||||||||
|
December 31, 2007
|
$ | 5,684 | $ | (825 | ) | $ | (25 | ) | $ | (237 | ) | $ | 4,597 | $ | 23 | $ | 4,620 | |||||||||||
|
Net income (loss)
|
— | — | — | 208 | 208 | (3 | ) | 205 | ||||||||||||||||||||
|
Other comprehensive loss, net of tax
|
— | — | (190 | ) | — | (190 | ) | (50 | ) | (240 | ) | |||||||||||||||||
|
Affiliate activity (Note 19)
|
— | (2 | ) | — | — | (2 | ) | — | (2 | ) | ||||||||||||||||||
|
December 31, 2008
|
$ | 5,684 | $ | (827 | ) | $ | (215 | ) | $ | (29 | ) | $ | 4,613 | $ | (30 | ) | $ | 4,583 | ||||||||||
|
Net loss
|
— | — | — | (1,253 | ) | (1,253 | ) | (15 | ) | (1,268 | ) | |||||||||||||||||
|
Other comprehensive income, net of tax
|
— | — | 65 | — | 65 | 122 | 187 | |||||||||||||||||||||
|
Affiliate activity (Note 19)
|
— | 50 | — | — | 50 | — | 50 | |||||||||||||||||||||
|
Dividends to affiliates (Note 19)
|
(585 | ) | — | — | — | (585 | ) | — | (585 | ) | ||||||||||||||||||
|
Contribution of intangible assets from Dynegy Inc. (Note 19)
|
36 | — | — | — | 36 | — | 36 | |||||||||||||||||||||
|
December 31, 2009
|
$ | 5,135 | $ | (777 | ) | $ | (150 | ) | $ | (1,282 | ) | $ | 2,926 | $ | 77 | $ | 3,003 | |||||||||||
|
Deconsolidation of Plum Point
|
— | — | 77 | (25 | ) | 52 | (77 | ) | (25 | ) | ||||||||||||||||||
|
Net loss
|
— | — | — | (242 | ) | (242 | ) | — | (242 | ) | ||||||||||||||||||
|
Other comprehensive income, net of tax
|
— | — | 20 | — | 20 | — | 20 | |||||||||||||||||||||
|
Affiliate activity (Note 19)
|
— | (37 | ) | — | — | (37 | ) | — | (37 | ) | ||||||||||||||||||
|
December 31, 2010
|
$ | 5,135 | $ | (814 | ) | $ | (53 | ) | $ | (1,549 | ) | $ | 2,719 | $ | — | $ | 2,719 | |||||||||||
See the notes to the consolidated financial statements
DYNEGY HOLDINGS INC.
(in millions)
|
Year Ended December 31,
|
||||||||||||
|
2010
|
2009
|
2008
|
||||||||||
|
Net income (loss)
|
$ | (242 | ) | $ | (1,268 | ) | $ | 205 | ||||
|
Cash flow hedging activities, net:
|
||||||||||||
|
Unrealized mark-to-market gains (losses) arising during period, net
|
— | 166 | (142 | ) | ||||||||
|
Reclassification of mark-to-market losses to earnings, net
|
— | 1 | 10 | |||||||||
|
Deferred losses on cash flow hedges, net
|
— | (11 | ) | (4 | ) | |||||||
|
Changes in cash flow hedging activities, net (net of tax benefit (expense) of zero, $(24) and $60, respectively)
|
— | 156 | (136 | ) | ||||||||
|
Foreign currency translation adjustments
|
— | — | (27 | ) | ||||||||
|
Actuarial gain (loss) and amortization of unrecognized prior service cost (net of tax benefit (expense) of $(1), $(8) and $29, respectively)
|
3 | 7 | (41 | ) | ||||||||
|
Unrealized loss on securities, net:
|
||||||||||||
|
Unrealized loss on securities
|
— | — | (3 | ) | ||||||||
|
Reclassification adjustments for gains realized in net loss
|
— | — | (9 | ) | ||||||||
|
Unrealized losses on securities, net (net of tax benefit of zero, zero and $8, respectively)
|
— | — | (12 | ) | ||||||||
|
Unconsolidated investment other comprehensive income (loss), net (net of tax benefit (expense) of $(11), $(17) and $17, respectively)
|
17 | 24 | (24 | ) | ||||||||
|
Other comprehensive income (loss), net of tax
|
20 | 187 | (240 | ) | ||||||||
|
Comprehensive loss
|
(222 | ) | (1,081 | ) | (35 | ) | ||||||
|
Less: Comprehensive income (loss) attributable to the noncontrolling interests
|
— | 107 | (53 | ) | ||||||||
|
Comprehensive income (loss) to Dynegy Holdings Inc.
|
$ | (222 | ) | $ | (1,188 | ) | $ | 18 | ||||
See the notes to the consolidated financial statements
Organization and Operations.
We are holding companies and conduct substantially all of our business operations through our subsidiaries. Our current business operations are focused primarily on the power generation sector of the energy industry. We report the results of our power generation business as three separate segments in our consolidated financial statements: (i) the Midwest segment (“GEN-MW”), (ii) the West segment (“GEN-WE”), and (iii) the Northeast segment (“GEN-NE”). Our consolidated financial results also reflect corporate-level expenses such as general and administrative, interest and depreciation and amortization. The December 31, 2009 consolidated balance sheet was derived from audited consolidated financial statements, as adjusted for the 1-for-5 reverse stock split of Dynegy’s common stock that became effective on May 25, 2010. Please read Note 23—Capital Stock for further discussion.
Going Concern.
Our accompanying consolidated financial statements have been prepared assuming that we will continue as a going concern, which contemplates realization of assets and the satisfaction of liabilities in the normal course of business for the twelve month period following the date of these consolidated financial statements. However, continued low power prices over the past two years have had a significant adverse impact on our business. Further, as our credit rating has declined, counterparty requirements for posting collateral in support of our risk management positions have become more stringent. Over the next twelve months, we expect that we will continue to need to utilize our Fifth Amended and Restated Credit Agreement, as amended (the “Credit Facility”), through the issuance of letters of credit and/or through the drawing of cash, or secure additional sources of capital to continue to meet our operating needs. The agreements governing our existing Credit Facility require us to meet specific financial covenants both as a matter of course and as a condition to the incurrence of additional debt and to the making of restricted payments or asset sales, among other things. These specific financial covenants are required to be calculated on a quarterly basis and become more restrictive over the course of 2011. Using the latest available forward commodity price curves and considering our current derivative contracts, we project that it is likely that we will not be able to comply with our EBITDA to Consolidated Interest Expense covenant, as currently set forth in our Credit Facility, particularly in the third and fourth quarters of 2011. Furthermore, we expect that our available liquidity will continue to be reduced as a result of borrowing limitations under the covenant regarding the ratio of Secured Debt to EBITDA, as defined in our Credit Facility. To continue as a going concern over the next twelve months, we must either (i) meet the financial covenants so that we can access our Credit Facility, or (ii) amend or replace our Credit Facility or otherwise secure additional capital.
At December 31, 2010, we have the following obligations outstanding under the Credit Facility:
|
|
●
|
$68 million due April 2013 under the Term Loan B (as defined in Note 18—Debt—Credit Facility);
|
|
|
●
|
$850 million due April 2013 under the Term Facility (as defined in Note 18—Debt—Credit Facility) (fully collateralized by $850 million of non-current restricted cash); and
|
|
|
●
|
$375 million in issued letters of credit.
|
A failure by us to comply with our financial covenants or to comply with the other restrictions in our Credit Facility could result in reduced borrowing capacity or even a default, causing our debt obligations under such financing agreements (and any other indebtedness to the extent linked to it by reason of cross-default or cross-acceleration provisions) to potentially become immediately due and payable. If we are unable to cure any such default, or obtain a waiver or a replacement financing, and those lenders accelerate the payment of such indebtedness, in the case that we are unable to repay those amounts, the holders of the indebtedness under our secured debt obligations would be entitled to foreclose on, and acquire control of substantially all of our assets, which would have a material adverse impact on our financial condition, results of operations and cash flows.
DYNEGY INC. and DYNEGY HOLDINGS INC.
NOTES TO CONSOLIDATED FINANCIAL STATEMENTS—(Continued)
In light of our probable covenant non-compliance, we are attempting to amend or replace our existing Credit Facility. We expect the capacity of any amended or new credit facility to be less than the current capacity of $1.8 billion and to be at a higher cost. We may also seek additional sources of liquidity in order to ensure that we have sufficient cash available to meet our operating needs. These additional sources of liquidity could include asset sales, public or private issuances of debt, equity or equity-linked securities, debt for equity swaps, or any combination of these. H
owever, we cannot provide any assurances that we will be successful in accomplishing any of these plans.
Our ability to continue as a going concern is dependent on many factors, including, among other things, our ability to achieve the operating results necessary to comply with the covenants in our existing Credit Facility, amend or replace our existing Credit Facility, or achieve the operating results necessary to comply with the covenants in any amended or new Credit Facility. Such compliance will be dependent on our ability to successfully execute our commercial strategies, manage our collateral requirements, and continue to execute the company-wide cost reduction initiatives that are ongoing. The accompanying consolidated financial statements do not include any adjustments that might result from the outcome of the foregoing uncertainties.
Use of Estimates.
The preparation of consolidated financial statements in conformity with generally accepted accounting principles (“GAAP”) requires management to make informed estimates and judgments that affect our reported financial position and results of operations based on currently available information. We review significant estimates and judgments affecting our consolidated financial statements on a recurring basis and record the effect of any necessary adjustments. Uncertainties with respect to such estimates and judgments are inherent in the preparation of financial statements. Estimates and judgments are used in, among other things, (i) developing fair value assumptions, including estimates of future cash flows and discount rates, (ii) analyzing tangible and intangible assets for possible impairment, (iii) estimating the useful lives of our assets, (iv) assessing future tax exposure and the realization of deferred tax assets, (v) determining amounts to accrue for contingencies, guarantees and indemnifications, (vi) estimating various factors used to value our pension assets and liabilities and (vii) determining the primary beneficiary of variable interest entities (“VIEs”). Actual results could differ materially from our estimates.
Principles of Consolidation
.
The accompanying consolidated financial statements include our accounts and the accounts of our majority-owned or controlled subsidiaries and VIEs for which we are the primary beneficiary. Intercompany accounts and transactions have been eliminated. Certain reclassifications have been made to prior-period amounts to conform with current-period presentation.
Cash and Cash Equivalents
.
Cash and cash equivalents consist of all demand deposits and funds invested in highly liquid short-term investments with original maturities of three months or less.
Restricted Cash and Investments
.
Restricted cash and investments represent cash that is not readily available for general purpose cash needs. Restricted cash and investments are classified as a current or long-term asset based on the timing and nature of when or how the cash is expected to be used or when the restrictions are expected to lapse. We include all changes in restricted cash and investments in investing cash flows on the consolidated statements of cash flows. Please read Note 18—Debt—Restricted Cash and Investments for further discussion.
Accounts Receivable and Allowance for Doubtful Accounts
.
We record accounts receivable at the net realizable value when the product or service is delivered to the customer. We establish provisions for losses on accounts receivable if it becomes probable we will not collect all or part of outstanding balances. We review collectibility and establish or adjust our allowance as necessary. We primarily use a percent of balance methodology and methodologies involving historical levels of write-offs. The specific identification method is also used in certain circumstances.
DYNEGY INC. and DYNEGY HOLDINGS INC.
NOTES TO CONSOLIDATED FINANCIAL STATEMENTS—(Continued)
Unconsolidated Investments
.
We use the equity method of accounting for investments in affiliates over which we exercise significant influence, generally occurring in ownership interests of 20 percent to 50 percent, and also occurring in lesser ownership percentages due to voting rights or other factors and VIEs where we are not the primary beneficiary. Our share of net income (loss) from these affiliates is reflected in the consolidated statements of operations as earnings (losses) from unconsolidated investments. Any excess of our investment in affiliates, as compared to our share of the underlying equity that is not recognized as goodwill, that represents identifiable other intangible assets, is amortized over the estimated economic service lives of the underlying assets. Or, in the instances where the useful lives cannot be determined, the excess is assessed each reporting period for impairment or to determine if the useful life can be estimated. All investments in unconsolidated affiliates are periodically assessed for other-than-temporary declines in value, with write-downs recognized in earnings from unconsolidated investments in the consolidated statements of operations. When the carrying amount of an equity investment has been reduced below zero and we have a funding commitment, the negative investment balance is included in Other long-term liabilities on the consolidated balance sheets.
Please read Note 7—Impairment and Restructuring Charges for a discussion of impairment charges we recognized in 2010 related to our investment in Plum Point and in 2008 related to Dynegy’s investment in DLS Power Holdings.
Short-Term Investments.
Short-term investments consist of highly liquid investments, primarily U.S. Treasury, U.S. Agency and corporate debt securities, with original maturities over three months from the date of purchase. Our investment policy restricts investments to high credit quality investments with limits on the length to maturity and the amount invested with any one issuer. Debt securities which we have the ability and positive intent to hold to maturity are carried at amortized cost, net of unamortized premiums and unaccreted discounts, which approximates fair value. At December 31, 2010, we did not hold any short-term investments that were classified as held-to-maturity.
Debt securities not held-to-maturity are classified as available for sale and are recorded at fair value. Unrealized gains and losses, after applicable taxes, resulting from changes in fair value are recorded as a component of Other comprehensive income (loss) in the consolidated statements of comprehensive income (loss).
Declines in the value of individual equity securities that are considered other than temporary result in write-downs to the individual securities to their fair value and the write-downs are included in the consolidated statements of operations. Declines in debt securities held-to-maturity and available for sale that are considered other than temporary, result in write-downs when it is more likely than not that we will sell the securities before we recover our cost. If we do not intend to sell an impaired debt security but do not expect to recover its cost, we determine whether a credit loss exists, and if so, the credit loss is recognized in the consolidated statements of operations and any remaining impairment is recognized in Other comprehensive loss. The review for other-than-temporary declines considers the length of time and the extent to which the fair value has been less than cost, the financial condition and near-term prospects of the issuer, and our intent and ability to retain the investment for a period of time sufficient to allow for recovery.
We consider all available for sale securities, including those with maturity dates beyond twelve months, as available to support current operational liquidity needs and therefore classify these securities as short-term investments within current assets on the consolidated balance sheets. As of December 31, 2010, Dynegy and DHI held $191 million and $175 million, respectively, of available for sale securities with maturity dates within one year. Of these amounts, $85 million is included in the Broker margin account on our consolidated balance sheets as of December 31, 2010. Please read “—Derivative Instruments—Generation” below for further discussion of our Broker margin account.
DYNEGY INC. and DYNEGY HOLDINGS INC.
NOTES TO CONSOLIDATED FINANCIAL STATEMENTS—(Continued)
Interest on securities, including the amortization of premiums and the accretion of discounts, is reported in Other income and expense, net using the interest method over the lives of the securities, adjusted for actual prepayments. Gains and losses on the sale of securities are recorded on the trade date and recognized using the specific identification method and reported in Other income and expense, net.
Inventory
.
Our natural gas, coal, emissions allowances and fuel oil inventories are carried at the lower of weighted average cost or market. Our materials and supplies inventory is carried at the lower of cost or market using the specific identification method. We use the average cost method to determine cost.
We may opportunistically sell emissions allowances, subject to certain regulatory limitations and restrictions contained in our Midwest Consent Decree, or hold them in inventory until they are needed. In the past, we have sold emission allowances that relate to future periods. To the extent the proceeds received from the sale of such allowances exceed our cost, we defer the associated gain until the period to which the allowance relates, as we may be required to purchase emissions allowances in future periods. As of December 31, 2010, we had aggregate deferred gains of $9
million, which is included in Other long-term liabilities in our consolidated balance sheets. As of December 31, 2009, we had aggregate deferred gains of $10 million, which is included in Accrued liabilities and other current liabilities and Other long-term liabilities in our consolidated balance sheets. We recognized $3 million, $22 million and $32 million in revenue for the years ended December 31, 2010, 2009 and 2008, respectively, related to sales of emissions credits.
Property, Plant and Equipment.
Property, plant and equipment, which consists principally of power generating facilities, including capitalized interest, is recorded at historical cost. Expenditures for major replacements, renewals and major maintenance are capitalized and depreciated over the expected maintenance cycle. We consider major maintenance to be expenditures incurred on a cyclical basis to maintain and prolong the efficient operation of our assets. Expenditures for repairs and minor renewals to maintain assets in operating condition are expensed. Depreciation is provided using the straight-line method over the estimated economic service lives of the assets, ranging from 3 to 40 years.
Composite depreciation rates (which we refer to as composite rates) are applied to functional groups of assets having similar economic characteristics. The estimated economic service lives of our functional asset groups are as follows:
|
Asset Group
|
Range of
Years |
|||
|
Power generation facilities
|
20 to 40
|
|||
|
Buildings and improvements
|
10 to 39
|
|||
|
Office and miscellaneous equipment
|
3 to 20
|
Gains and losses on sales of individual assets or asset groups are reflected in Gain (loss) on sale of assets, net, in the consolidated statements of operations. We assess the carrying value of our property, plant and equipment to determine if an impairment is indicated when a triggering event occurs. If an impairment is indicated, the amount of the impairment loss recognized would be determined by the amount by which the book value exceeds the estimated fair value of the assets. The estimated fair value may include estimates based upon discounted cash-flow projections, recent comparable market transactions or quoted prices to determine if an impairment loss is required. For assets identified as held for sale, the book value is compared to the estimated sales price less costs to sell.
Please read Note 7—Impairment and Restructuring Charges for a discussion of impairment charges we recognized in 2010, 2009 and 2008.
In accordance with our policy, we review fixed assets for known facts that potentially would impact their estimated useful lives. Based on events occurring in September 2010, we determined that it is not currently economical to continue to operate our Vermilion facility for the remainder of its estimated useful life. As a result, effective September 1, 2010, we changed our estimate of the useful life of this facility to better reflect the estimated periods during which we expect the asset will remain in service. The facility’s previously estimated remaining useful life of 15 years was adjusted to reflect an expected retirement date of April 30, 2011. At December 31, 2010, we further adjusted the estimated useful life of the facility based on an expected retirement date of March 31, 2011. The effect of these changes in estimate was to increase depreciation expense by approximately $56 million ($34 million net of tax), or $0.28 per share (basic and diluted), for the year ended December 31, 2010.
DYNEGY INC. and DYNEGY HOLDINGS INC.
NOTES TO CONSOLIDATED FINANCIAL STATEMENTS—(Continued)
Goodwill and Other Intangible Assets.
Goodwill represents, at the time of an acquisition, the amount of purchase price paid in excess of the fair value of net assets acquired. We assess the carrying value of our goodwill for impairment on an annual basis on November 1st, and when events warrant an assessment. Our evaluation is based, in part, on our estimate of future cash flows, recent market comparable transactions, and earnings multiples of similarly situated public companies. The estimation of fair value is highly subjective, inherently imprecise and can change materially from period to period based on, among other things, an assessment of market conditions, projected cash flows and discount rates. Please read Note 16—Goodwill for further discussion of our impairment analysis. Our goodwill balance was fully impaired at March 31, 2009.
Intangible assets represent the fair value of assets, apart from goodwill, that arise from contractual rights or other legal rights. We record only those intangible assets that are distinctly separable from goodwill and can be sold, transferred, licensed, rented, or otherwise exchanged in the open market. Additionally, we recognize as intangible assets those assets that can be exchanged in combination with other rights, contracts, assets or liabilities.
We initially record and measure intangible assets based on the fair value of those rights transferred in the transaction in which the asset was acquired. Those measurements are based on quoted market prices for the asset, if available, or measurement techniques based on the best information available such as a present value of future cash flows. Present value measurement techniques involve judgments and estimates made by management about prices, cash flows, discount factors and other variables, and the actual value realized from those assets could vary materially from these judgments and estimates. We amortize our definite-lived intangible assets based on the useful life of the respective asset as measured by the life of the underlying contract or contracts. Intangible assets that are not subject to amortization are subjected to impairment testing on an annual basis or when a triggering event occurs, and an impairment loss is recognized if the carrying amount of an intangible asset exceeds its fair value.
Asset Retirement Obligations.
We record the present value of our legal obligations to retire tangible, long-lived assets on our balance sheets as liabilities when the liability is incurred. Significant judgment is involved in estimating future cash flows associated with such obligations, as well as the ultimate timing of the cash flows. Our AROs relate to activities such as ash pond and landfill capping, dismantlement of power generation facilities, future removal of asbestos containing material from certain power generation facilities, closure and post-closure costs, environmental testing, remediation, monitoring and land and equipment lease obligations. A summary of changes in our AROs is as follows:
|
Year Ended December 31,
|
||||||||||||
|
2010
|
2009
|
2008
|
||||||||||
|
(in millions)
|
||||||||||||
|
Beginning of year
|
$ | 120 | $ | 127 | $ | 107 | ||||||
|
Accretion expense
|
10 | 13 | 10 | |||||||||
|
Divestiture of assets
|
— | (6 | ) | — | ||||||||
|
Revision of previous estimate (1)
|
(10 | ) | (14 | ) | 10 | |||||||
|
End of year
|
$ | 120 | $ | 120 | $ | 127 | ||||||
|
|
(1)
|
During 2010, we revised our ARO obligation downward by $5 million based on revisions to the timing of the remediation obligations within our DMG fleet and by $5 million at our Danskammer facility based on revised cost estimates. In addition, we revised our ARO obligation downward by $14 million in 2009 and upward by $10 million in 2008 based on revised estimates of the cost to dismantle the South Bay facility.
|
DYNEGY INC. and DYNEGY HOLDINGS INC.
NOTES TO CONSOLIDATED FINANCIAL STATEMENTS—(Continued)
We may have additional potential retirement obligations for dismantlement of power generation facilities. Our current intent is to maintain these facilities in a manner such that they will be operated indefinitely. As a result, we cannot estimate any potential retirement obligations associated with these assets. Liabilities will be recorded at the time we are able to estimate these AROs.
Contingencies, Commitments, Guarantees and Indemnifications.
We are involved in numerous lawsuits, claims, proceedings and tax-related audits in the normal course of our operations. We record a loss contingency for these matters when it is probable that a liability has been incurred and the amount of the loss can be reasonably estimated. We review our loss contingencies on an ongoing basis to ensure that we have appropriate reserves recorded on our consolidated balance sheets. These reserves are based on estimates and judgments made by management with respect to the likely outcome of these matters, including any applicable insurance coverage for litigation matters, and are adjusted as circumstances warrant. Our estimates and judgment could change based on new information, changes in laws or regulations, changes in management’s plans or intentions, the outcome of legal proceedings, settlements or other factors. If different estimates and judgments were applied with respect to these matters, it is likely that reserves would be recorded for different amounts. Actual results could vary materially from these estimates and judgments.
Liabilities for environmental contingencies are recorded when an environmental assessment indicates that remedial efforts are probable and the costs can be reasonably estimated. Measurement of liabilities is based, in part, on relevant past experience, currently enacted laws and regulations, existing technology, site-specific costs and cost-sharing arrangements. Recognition of any joint and several liability is based upon our best estimate of our final pro-rata share of such liability.
These assumptions involve the judgments and estimates of management, and any changes in assumptions could lead to increases or decreases in our ultimate liability, with any such changes recognized immediately in earnings.
We disclose and account for various guarantees and indemnifications entered into during the course of business. When a guarantee or indemnification is entered into, an estimated fair value of the underlying guarantee or indemnification is recorded. Some guarantees and indemnifications could have significant financial impact under certain circumstances; however, management also considers the probability of such circumstances occurring when estimating the fair value. Actual results may materially differ from the estimated fair value of such guarantees and indemnifications.
Revenue Recognition
.
We earn revenue from our facilities in three primary ways: (i) the sale of both fuel and energy through both physical and financial transactions to optimize the financial performance of our generating facilities; (ii) sale of capacity; and (iii) sale of ancillary services, which are the products of a generation facility that support the transmission grid operation, allow generation to follow real-time changes in load, and provide emergency reserves for major changes to the balance of generation and load. We recognize revenue from these transactions when the product or service is delivered to a customer, unless they meet the definition of a derivative. Please read “—Derivative Instruments—Generation” for further discussion of the accounting for these types of transactions.
Derivative Instruments–Generation.
We enter into commodity contracts that meet the definition of a derivative. These contracts are often entered into to mitigate or eliminate market and financial risks associated with our generation business. These contracts include forward contracts, which commit us to sell commodities in the future; futures contracts, which are generally exchange-traded standard commitments to purchase or sell a commodity; option contracts, which convey the right to buy or sell a commodity; and swap agreements, which require payments to or from counterparties based upon the differential between two prices for a predetermined quantity. There are three different ways to account for these types of contracts: (i) as an accrual contract, if the criteria for the “normal purchase normal sale” exception are met and documented; (ii) as a cash flow or fair value hedge, if the specified criteria are met and documented; or (iii) as a mark-to-market contract with changes in fair value recognized in current period earnings. All derivative commodity contracts that do not qualify for the normal purchase normal sale exception are recorded at fair value in risk management assets and liabilities on the consolidated balance sheets. If the derivative commodity contract has been designated as a cash flow hedge, the changes in fair value are recognized in earnings concurrent with the hedged item. Changes in the fair value of derivative commodity contracts that are not designated as cash flow hedges are recorded currently in earnings.
DYNEGY INC. and DYNEGY HOLDINGS INC.
NOTES TO CONSOLIDATED FINANCIAL STATEMENTS—(Continued)
We execute a significant volume of transactions through a futures clearing manager. Our daily cash payments (receipts) to (from) our futures clearing manager consist of three parts: (1) fair value of open positions (exclusive of options) (“Daily Cash Settlements”); (2) initial margin requirements related to open positions (exclusive of options) (“Initial Margin”); and (3) fair value and margin requirements related to options (“Options”, and collectively with Initial Margin, “Collateral”). We do not offset fair value amounts recognized for derivative instruments executed with the same counterparty under a master netting agreement and we do not elect to offset the fair value amounts recognized for the Daily Cash Settlements paid or received against the fair value amounts recognized for derivative instruments executed with the same counterparty under a master netting agreement.
As a result, our consolidated balance sheets present derivative assets and liabilities, as well as related Daily Cash Settlements, on a gross basis. As of December 31, 2010, of the approximately $80 million included in Broker margin account on our consolidated balance sheets, approximately $75 million represents Collateral and approximately $5 million represents Daily Cash Settlements. As of December 31, 2009, of the approximately $286 million included in Broker margin account on our consolidated balance sheets, approximately $288 million represents Collateral, offset by approximately $2 million representing Daily Cash Settlements.
Derivative Instruments–Financing Activities.
We are exposed to changes in interest rates through our variable and fixed rate debt. In order to manage our interest rate risk, we enter into interest rate swap agreements.
Cash inflows and cash outflows associated with the settlement of risk management activities are recognized in net cash provided by (used in) operating activities on the consolidated statements of cash flows.
Fair Value Measurements.
Fair value is the price that would be received to sell an asset or paid to transfer a liability in an orderly transaction between market participants at the measurement date (exit price). However, we utilize a mid-market pricing convention (the mid-point price between bid and ask prices) as a practical expedient for valuing the majority of our financial assets and liabilities measured and reported at fair value. Where appropriate, our estimate of fair value reflects the impact of our credit risk, our counterparties’ credit risk and bid-ask spreads. We utilize market data or assumptions that market participants would use in pricing the asset or liability, including assumptions about risk and the risks inherent in the inputs to the valuation technique. These inputs can be readily observable, market corroborated, or generally unobservable. We primarily apply the market approach for recurring fair value measurements and endeavor to utilize the best available information. Accordingly, we utilize valuation techniques that maximize the use of observable inputs and minimize the use of unobservable inputs. We classify fair value balances based on the observability of those inputs. The inputs used to measure fair value have been placed in a hierarchy based on priority.
DYNEGY INC. and DYNEGY HOLDINGS INC.
NOTES TO CONSOLIDATED FINANCIAL STATEMENTS—(Continued)
The hierarchy gives the highest priority to unadjusted quoted prices in active markets for identical assets or liabilities (Level 1 measurement) and the lowest priority to unobservable inputs (Level 3 measurement). The three levels of the fair value hierarchy are as follows:
|
|
●
|
Level 1 – Quoted prices are available in active markets for identical assets or liabilities as of the reporting date. Active markets are those in which transactions for the asset or liability occur in sufficient frequency and volume to provide pricing information on an ongoing basis. Level 1 primarily consists of financial instruments such as exchange-traded derivatives, listed equities and U.S. government treasury securities.
|
|
|
●
|
Level 2 – Pricing inputs are other than quoted prices in active markets included in Level 1, which are either directly or indirectly observable as of the reporting date. Level 2 includes those financial instruments that are valued using models or other valuation methodologies. These models are primarily industry-standard models that consider various assumptions, including quoted forward prices for commodities, time value, volatility factors, and current market and contractual prices for the underlying instruments, as well as other relevant economic measures. Substantially all of these assumptions are observable in the marketplace throughout the full term of the instrument, can be derived from observable data or are supported by observable levels at which transactions are executed in the marketplace. Instruments in this category include non-exchange-traded derivatives such as over the counter forwards, options and repurchase agreements.
|
|
|
●
|
Level 3 – Pricing inputs include significant inputs that are generally less observable from objective sources. These inputs may be used with internally developed methodologies that result in management’s best estimate of fair value. Level 3 instruments include those that may be more structured or otherwise tailored to our needs as well as financial transmission rights. At each balance sheet date, we perform an analysis of all instruments and include in Level 3 all of those whose fair value is based on significant unobservable inputs.
|
The determination of the fair values incorporates various factors. These factors include not only the credit standing of the counterparties involved and the impact of credit enhancements (such as cash deposits, letters of credit and priority interests), but also the impact of our nonperformance risk on our liabilities. Valuation adjustments are generally based on capital market implied ratings evidence when assessing the credit standing of our counterparties and when applicable, adjusted based on management’s estimates of assumptions market participants would use in determining fair value.
Assets and liabilities from risk management activities may include exchange-traded derivative contracts and OTC derivative contracts. Some exchange-traded derivatives are valued using broker or dealer quotations, or market transactions in either the listed or OTC markets. In such cases, these exchange-traded derivatives are classified within Level 2. OTC derivative trading instruments include swaps, forwards, options and complex structures that are valued at fair value. In certain instances, these instruments may utilize models to measure fair value. Generally, we use a similar model to value similar instruments. Valuation models utilize various inputs that include quoted prices for similar assets or liabilities in active markets, quoted prices for identical or similar assets or liabilities in markets that are not active, other observable inputs for the asset or liability, and market-corroborated inputs. Where observable inputs are available for substantially the full term of the asset or liability, the instrument is categorized in Level 2. Certain OTC derivatives trade in less active markets with a lower availability of pricing information. In addition, complex or structured transactions, such as heat-rate call options, can introduce the need for internally-developed model inputs that might not be observable in or corroborated by the market. When such inputs have a significant impact on the measurement of fair value, the instrument is categorized in Level 3.
In determining fair value for nonfinancial assets and liabilities measured at fair value on a nonrecurring basis, we use discounted cash-flow projections, recent comparable market transactions, if available, or quoted prices. We consider assumptions that third parties would make in estimating fair value, including the highest and best use of the asset. These fair values are categorized in Level 3.
In determining the fair value of our reporting units, we generally use the income approach and utilize market information, such as recent sales transactions for comparable assets within the regions in which we operate to corroborate the fair values derived from the income approach. When there are not sufficient sales transactions to corroborate the income approach valuation, we use a market-based approach. The market-based approach compares our forecasted earnings and Dynegy’s market capitalization to those of similarly situated public companies by considering multiples of earnings.
DYNEGY INC. and DYNEGY HOLDINGS INC.
NOTES TO CONSOLIDATED FINANCIAL STATEMENTS—(Continued)
Income Taxes
.
We use the asset and liability method of accounting for deferred income taxes and provide deferred income taxes for all significant temporary differences.
As part of the process of preparing our consolidated financial statements, we are required to estimate our income taxes in each of the jurisdictions in which we operate. This process involves estimating our actual current tax payable and related tax expense together with assessing temporary differences resulting from differing tax and accounting treatment of certain items, such as depreciation, for tax and accounting purposes. These differences can result in deferred tax assets and liabilities, which are included within our consolidated balance sheets.
We must then assess the likelihood that our deferred tax assets will be recovered from future taxable income and, to the extent we believe that it is more likely than not (a likelihood of more than 50 percent) that some portion or all of the deferred tax assets will not be realized, we must establish a valuation allowance. We consider all available evidence, both positive and negative, to determine whether, based on the weight of the evidence, a valuation allowance is needed. Evidence used includes information about our current financial position and our results of operations for the current and preceding years, as well as all currently available information about future years, anticipated future performance, the reversal of deferred tax liabilities and tax planning strategies.
Management believes reversing temporary differences and other tax planning strategies will be sufficient to realize deferred tax assets for which no reserve has been established. While we have considered these factors in assessing the need for a valuation allowance, there is no assurance that a valuation allowance would not need to be established in the future if information about future years changes. Any change in the valuation allowance would impact our income tax benefit (expense) and net income (loss) in the period in which such a determination is made.
We recognize accrued interest expense and penalties related to unrecognized tax benefits as income tax expense.
Please read Note 20—Income Taxes for further discussion of our accounting for income taxes, uncertain tax positions and changes in our valuation allowance.
Earnings Per Share.
Basic earnings per share represent the amount of earnings for the period available to each share of common stock outstanding during the period. Diluted earnings per share amounts include the effect of issuing shares of common stock for outstanding stock options and performance based stock awards under the treasury stock method if including such potential common shares is dilutive.
Foreign Currency.
For subsidiaries whose functional currency is not the U.S. Dollar, assets and liabilities are translated at year-end exchange rates, and revenues and expenses are translated at monthly average exchange rates. Translation adjustments for the asset and liability accounts are included as a separate component of accumulated other comprehensive loss in stockholders’ equity. Currency transaction gains and losses are recorded in Other income and expense, net, in the consolidated statements of operations. We recorded gains (losses) of approximately zero, $1 million, and $24 million for the years ended December 31, 2010, 2009 and 2008, respectively. In 2008, upon substantial liquidation of a foreign entity, we recognized approximately $24 million of pre-tax income related to translation gains.
Employee Stock Options.
We use the fair-value based method of accounting for stock-based employee compensation and we used the prospective method of transition for stock options granted. Under the prospective method of transition, all stock options granted after January 1, 2003 were accounted for on a fair value basis. Options granted prior to January 1, 2003 continued to be accounted for using the intrinsic value method. Accordingly, for options granted prior to January 1, 2003, compensation expense was not reflected for employee stock options unless they were granted at an exercise price lower than market value on the grant date.
DYNEGY INC. and DYNEGY HOLDINGS INC.
NOTES TO CONSOLIDATED FINANCIAL STATEMENTS—(Continued)
We use the short-cut method to calculate the beginning balance of the APIC pool of the excess tax benefit, and to determine the subsequent impact on the APIC pool and consolidated statements of cash flows of the tax effects of employee stock-based compensation awards that were outstanding upon our adoption of authoritative guidance for the accounting for tax effects of share-based payment awards. Utilizing the short-cut method, we have determined that we have a “Pool of Windfall” tax benefits that can be utilized to offset future shortfalls that may be incurred.
Please read Note 23—Capital Stock for further discussion of our share-based compensation and expense recognized for the years ended December 31, 2010, 2009 and 2008.
Noncontrolling Interests.
Noncontrolling interests on the consolidated balance sheets includes third party investments in PPEA Holding. On January 1, 2009, we adopted authoritative guidance issued by the FASB for noncontrolling interests. Please read Note 5—Noncontrolling Interests for further discussion.
Prior to the adoption of this authoritative guidance, we allocated net income and other comprehensive income to noncontrolling interest owners in PPEA Holding based on the amounts that would be distributed to the equity interest owners in accordance with the terms of the underlying agreement. To the extent that the losses applicable to the noncontrolling interest owners would have caused the noncontrolling interest owners to exceed their obligation to fund such losses, the amounts were reallocated back to us. For the year ended December 31, 2008, we absorbed approximately $5 million of losses related to net income and approximately $99 million of losses related to other comprehensive income in excess of the minority interest holders’ funding commitments.
Accounting Principles Adopted
Variable Interest Entities
. On January 1, 2010, we adopted Accounting Standards Update (“ASU”) No. 2009-17—Consolidations (Topic 810): Improvements to Financial Reporting by Enterprises Involved with Variable Interest Entities (“ASU No. 2009-17”). This guidance replaces the previous quantitative-based analysis for determining the primary beneficiary of a variable interest entity with a framework that is based on qualitative judgments. The new guidance identifies the primary beneficiary of a variable interest entity as the party that both: (i) has the power to direct the activities of a variable interest entity that most significantly impact its economic performance and (ii) has an obligation to absorb losses or a right to receive benefits that could potentially be significant to the variable interest entity. The adoption of ASU No. 2009-17 resulted in a deconsolidation of our investment in PPEA Holding. This resulted in the cumulative effect of a change in accounting principle of approximately $41 million ($25 million after tax), which was recorded as an increase in Accumulated deficit on our consolidated balance sheets as of January 1, 2010. On November 10, 2010, we completed the sale of our interest in PPEA Holding to one of the other investors in PPEA Holding. Please read Note 15—Variable Interest Entities—PPEA Holding Company LLC for further discussion.
The adoption of ASU No. 2009-17 had no impact on our investment in the Hydroelectric Generation Facilities, which we sold in the third quarter 2010. Please read Note 15—Variable Interest Entities—Hydroelectric Generation Facilities for further discussion.
Disclosures about Fair Value Measurements.
On January 1, 2010, we adopted ASU No. 2010-06—Fair Value Measurements and Disclosures (Topic 820): Improving Disclosures about Fair Value Measurements. Please read Note 9—Fair Value Measurements for further discussion.
DYNEGY INC. and DYNEGY HOLDINGS INC.
NOTES TO CONSOLIDATED FINANCIAL STATEMENTS—(Continued)
On August 13, 2010, Dynegy entered into a merger agreement with an affiliate of The Blackstone Group L.P. (as amended, the “Blackstone Merger Agreement”), pursuant to which Dynegy would be acquired and Dynegy’s stockholders would receive $4.50 per share in cash. On November 16, 2010, the agreement was amended to increase the merger consideration to $5.00 per share in cash. The Blackstone Merger Agreement was not approved by Dynegy’s stockholders at the special stockholders’ meeting on November 23, 2010 and was subsequently terminated by the parties in accordance with the terms of the agreement. The Blackstone Merger Agreement requires Dynegy to pay Blackstone a termination fee in the amount of $16 million in the event that within 18 months of November 23, 2010, Dynegy consummates an alternative transaction having an aggregate value of more than $4.50 per share.
On November 23, 2010, we commenced the solicitation of transaction proposals from a broad group of potentially interested parties, including Icahn Enterprises L.P. (“Icahn”) and other potential strategic and financial buyers. As a result of those efforts, on December 15, 2010, Dynegy’s Board of Directors unanimously approved a merger agreement between Dynegy and an affiliate of Icahn (as amended, the “Icahn Merger Agreement”). In connection with the Icahn Merger Agreement, Icahn launched a cash tender offer on December 22, 2010 for all of the issued and outstanding shares of common stock at $5.50 per share (the “Tender Offer”). On January 25, 2011, Dynegy announced that it had not received any bona fide acquisition proposals. At the expiration of the Tender Offer on February 18, 2011, an insufficient number of shares had been tendered in response to the Tender Offer, and as a result the Icahn Merger Agreement automatically terminated. In connection with the termination and as required by the Icahn Merger Agreement, Dynegy paid $5 million to Icahn with respect to expenses incurred by Icahn related to the Icahn Merger Agreement. Further, we may be required to pay additional fees of $11 million in the event that within 18 months of February 18, 2011, we consummate an alternative transaction having an aggregate value of more than $5.50 per share.
Dispositions and Contract Terminations
LS Power Transactions.
We consummated our transactions (the “LS Power Transactions”) with LS Power in two parts, with the issuance of notes by DHI, on December 1, 2009, and the remainder of the transactions closing on November 30, 2009. At closing, Dynegy and DHI received $936 million and $1,476 million, in cash, net of closing costs. Of the proceeds, $547 million and $990 million related to the disposition of assets, including our interest in the Sandy Creek project, for Dynegy and DHI, respectively. We also received $175 million from the release of restricted cash on our consolidated balance sheets that was used to support our funding commitment to the Sandy Creek Project and $214 million for the issuance of $235 million notes payable at the close of the transaction. In addition, Dynegy received 245 million shares of Dynegy’s Class B common stock from LS Power. In exchange, we sold to LS Power five peaking and three combined-cycle generation assets, as well as our remaining interest in the Sandy Creek Project under construction in Texas, and DHI issued the notes to an affiliate of LS Power. Please read Note 19—Related Party Transactions for further discussion.
The remaining 95 million shares of Dynegy’s Class B common stock held by LS Power were converted into the same number of shares of Dynegy’s Class A common stock.
In connection with the LS Power Transactions, Dynegy and LS Power entered into a new shareholder agreement (the “New Shareholder Agreement”), which, among other things, generally restricts LS Power from increasing its ownership for up to 30 months. Dynegy and LS Power have also terminated the original shareholder agreement, dated September 14, 2006, which provided LS Power with special approval rights, board representation and certain other rights associated with its former Class B shares.
DYNEGY INC. and DYNEGY HOLDINGS INC.
NOTES TO CONSOLIDATED FINANCIAL STATEMENTS—(Continued)
In connection with our closing of the LS Power Transactions, we recorded pre-tax charges of $312 million in the fourth quarter 2009. These charges include $124 million in Gain (loss) on sale of assets, $104 million in Income (loss) from discontinued operations and $84 million in Losses from unconsolidated investments in our consolidated statements of operations. These losses are primarily the result of changes in the value of the shares received by us, changes in the book values of the assets included in the transaction and changes in working capital items not reimbursed by LS Power.
In connection with the signing of the purchase and sale agreement with LS Power on August 9, 2009, our Arlington Valley and Griffith power generation assets (collectively, the “Arizona power generation facilities”) and our Bluegrass power generation facility met the requirements for classification as discontinued operations. Accordingly, the results of operations for these facilities have been reclassified as discontinued operations for all periods presented.
We recorded pre-tax impairment charges of $326 million, inclusive of costs to sell, related to the assets included in the LS Power Transactions that did not meet the criteria for classification as discontinued operations for the year ended December 31, 2009. The charges are included in Impairment and other charges in our consolidated statements of operations. Please read Note 7—Impairment and Restructuring Charges for further discussion of these impairments.
We discontinued depreciation and amortization of property, plant and equipment included in the LS Power Transactions that did not meet the criteria for classification as discontinued operations during the third quarter 2009. Depreciation and amortization expense related to these assets totaled $24 million and $32 million in the years ended December 31, 2009 and 2008, respectively.
Rolling Hills.
On July 31, 2008, we completed the sale of the Rolling Hills power generation facility (“Rolling Hills”) for approximately $368 million, net of transaction costs. We recorded a $56 million gain during 2008 related to the sale, which is included in Gain on sale of assets in our consolidated statements of operations. The gain includes the impact of allocating approximately $5 million of goodwill associated with the GEN-MW reporting unit to Rolling Hills. The amount of goodwill allocated to Rolling Hills was based on the relative fair values of Rolling Hills and the portion of the GEN-MW reporting unit being retained.
We discontinued depreciation and amortization of Rolling Hills’ property, plant and equipment during the second quarter 2008. Depreciation and amortization expense related to Rolling Hills totaled $3 million in the year ended December 31, 2008. The sale of Rolling Hills did not meet the definition of a discontinued operation. As a result, we are reporting the results of Rolling Hills’ operations in continuing operations.
The sale of Rolling Hills represented the sale of a significant portion of a reporting unit. As a result, we assessed the goodwill of the GEN-MW reporting unit for impairment during the third quarter 2008. No impairment was indicated as a result of this assessment.
Oyster Creek.
In May 2008, we sold the beneficial interest in Oyster Creek Limited for approximately $11 million, which is included in Gain (loss) on sale of assets in our consolidated statements of operations.
PPEA Holding Company LLC.
On November 10, 2010, we completed the sale of our interest in PPEA Holding to one of the other investors in PPEA Holding. We recognized a loss of approximately $28 million on the sale, which is included in Losses from unconsolidated investments in our consolidated statements of operations. This loss represents $28 million of losses reclassified from Accumulated other comprehensive loss. Please read Note 15—Variable Interest Entities—PPEA Holding Company LLC for further discussion.
DYNEGY INC. and DYNEGY HOLDINGS INC.
NOTES TO CONSOLIDATED FINANCIAL STATEMENTS—(Continued)
Discontinued Operations
Arlington Valley, Griffith and Bluegrass
. On November 30, 2009, we completed the sale of our interests in the Arizona power generation facilities and Bluegrass power generation facility as part of the LS Power Transactions, as discussed above.
The Arizona power generation facilities, as well as our Bluegrass facility, met the criteria of held for sale during the third quarter 2009. At that time, we discontinued depreciation and amortization of the Arizona power generation facilities’ and Bluegrass’ property, plant and equipment. Depreciation and amortization expense related to the Arizona power generation facilities totaled approximately $14 million and $20 million for years ended December 31, 2009 and 2008, respectively. Depreciation and amortization expense related to the Bluegrass facility totaled approximately $1 million for the years ended December 31, 2009 and 2008, respectively. We recorded an impairment charge of $235 million related to the Arizona power generation facilities during the third quarter 2009. We previously recorded impairment charges of $5 million and $18 million related to the Bluegrass facility during the first and second quarters of 2009, respectively. Please read Note 7—Impairment and Restructuring Charges for further discussion of these impairments. The results of the Arizona power generation facilities’ operations are reported in discontinued operations for all periods presented in our GEN-WE segment. The results of Bluegrass’ operations are reported in discontinued operations for all periods presented in our GEN-MW segment.
Heard County.
On April 30, 2009, we completed the sale of our interest in the Heard County power generation facility for approximately $105 million. We recorded a pre-tax impairment of approximately $47 million in the year ended December 31, 2008, which was included in Income (loss) from discontinued operations on our consolidated statements of operations. Please read Note 7—Impairment and Restructuring Charges—2008 Impairment Charges for further discussion.
Heard County was classified as held for sale during the first quarter 2009. At that time, we discontinued depreciation and amortization of Heard County’s property, plant and equipment. Depreciation and amortization expense related to Heard County totaled approximately less than $1 million and $4 million for the years ended December 31, 2009 and 2008, respectively. We are reporting the results of Heard County’s operations in discontinued operations for all periods presented.
Calcasieu.
On March 31, 2008, we completed the sale of the Calcasieu power generation facility for approximately $56 million, net of transaction costs.
DYNEGY INC. and DYNEGY HOLDINGS INC.
NOTES TO CONSOLIDATED FINANCIAL STATEMENTS—(Continued)
The following table summarizes information related to Dynegy’s discontinued operations:
|
GEN-MW
|
GEN-WE
|
NGL
|
Total
|
|||||||||||||
|
(in millions)
|
||||||||||||||||
|
2010
|
||||||||||||||||
|
Revenues
|
$ | — | $ | — | $ | — | $ | — | ||||||||
|
Income from operations before taxes
|
— | 1 | — | 1 | ||||||||||||
|
Income from operations after taxes
|
— | 1 | — | 1 | ||||||||||||
|
2009
|
||||||||||||||||
|
Revenues
|
$ | 3 | $ | 113 | $ | — | $ | 116 | ||||||||
|
Loss from operations before taxes (1)
|
(25 | ) | (224 | ) | — | (249 | ) | |||||||||
|
Loss from operations after taxes
|
(17 | ) | (148 | ) | — | (165 | ) | |||||||||
|
Loss on sale before taxes
|
(22 | ) | (72 | ) | — | (94 | ) | |||||||||
|
Loss on sale after taxes
|
(13 | ) | (44 | ) | — | (57 | ) | |||||||||
|
2008
|
||||||||||||||||
|
Revenues
|
$ | 2 | $ | 223 | $ | — | $ | 225 | ||||||||
|
Income (loss) from operations before taxes (2)
|
(2 | ) | (33 | ) | 4 | (31 | ) | |||||||||
|
Income (loss) from operations after taxes
|
(1 | ) | (19 | ) | 3 | (17 | ) | |||||||||
|
(1)
|
Includes $23 million of impairment charges related to our Bluegrass power generation facility
in the GEN-MW segment and $
235 million of impairment charges related to our Arizona power generation facilities in the GEN-WE segment.
|
|
(2)
|
Includes $47 million of impairment charges related to our Heard power generation facility in the GEN-WE segment.
|
The following table summarizes information related to DHI’s discontinued operations:
|
GEN-MW
|
GEN-WE
|
NGL
|
Total
|
|||||||||||||
|
(in millions)
|
||||||||||||||||
|
2010
|
||||||||||||||||
|
Revenues
|
$ | — | $ | — | $ | — | $ | — | ||||||||
|
Income from operations before taxes
|
— | 1 | — | 1 | ||||||||||||
|
Income from operations after taxes
|
— | 1 | — | 1 | ||||||||||||
|
2009
|
||||||||||||||||
|
Revenues
|
$ | 3 | $ | 113 | $ | — | $ | 116 | ||||||||
|
Loss from operations before taxes (1)
|
(25 | ) | (224 | ) | — | (249 | ) | |||||||||
|
Loss from operations after taxes
|
(17 | ) | (148 | ) | — | (165 | ) | |||||||||
|
Loss on sale before taxes
|
(22 | ) | (72 | ) | — | (94 | ) | |||||||||
|
Loss on sale after taxes
|
(13 | ) | (44 | ) | — | (57 | ) | |||||||||
|
2008
|
||||||||||||||||
|
Revenues
|
$ | 2 | $ | 223 | $ | — | $ | 225 | ||||||||
|
Income (loss) from operations before taxes (2)
|
(2 | ) | (33 | ) | 4 | (31 | ) | |||||||||
|
Income (loss) from operations after taxes
|
(1 | ) | (19 | ) | 3 | (17 | ) | |||||||||
|
(1)
|
Includes $23 million of impairment charges related to our Bluegrass power generation facility in the GEN-MW segment and $235 million of impairment charges related to our Arizona power generation facilities in the GEN-WE segment.
|
|
(2)
|
Includes $47 million of impairment charges related to our Heard power generation facility in the GEN-WE segment.
|
DYNEGY INC. and DYNEGY HOLDINGS INC.
NOTES TO CONSOLIDATED FINANCIAL STATEMENTS—(Continued)
On January 1, 2009, we adopted authoritative guidance which requires: (i) ownership interests in subsidiaries held by parties other than the parent to be clearly identified, labeled, and presented in the consolidated statements of financial position within equity, but separate from the parent’s equity; (ii) the amount of consolidated net income (loss) attributable to the parent and to the noncontrolling interest to be clearly identified and presented on the face of the consolidated statements of operations; (iii) changes in a parent’s ownership interests that do not result in deconsolidation to be accounted for as equity transactions; and (iv) that a parent recognize a gain or loss in net income upon deconsolidation of a subsidiary, with any retained noncontrolling equity investment in the former subsidiary initially measured at fair value. The following table presents the net income (loss) attributable to Dynegy’s and DHI’s stockholders:
|
Dynegy Inc.
|
Dynegy Holdings Inc.
|
|||||||||||||||
|
Twelve Months Ended
December 31,
|
Twelve Months Ended
December 31,
|
|||||||||||||||
|
2009
|
2008
|
2009
|
2008
|
|||||||||||||
|
(in millions)
|
||||||||||||||||
|
Income (loss) from continuing operations
|
$ | (1,025 | ) | $ | 191 | $ | (1,031 | ) | $ | 225 | ||||||
|
Income (loss) from discontinued operations, net of tax benefit of $121, $14, $121 and $14, respectively
|
(222 | ) | (17 | ) | (222 | ) | (17 | ) | ||||||||
|
Net income (loss)
|
$ | (1,247 | ) | $ | 174 | $ | (1,253 | ) | $ | 208 | ||||||
As a result of the deconsolidation and subsequent sale of our interest in PPEA Holding, effective January 1, 2010, there are no longer any noncontrolling interests in any of our consolidated subsidiaries, and as a result, no reconciliation is needed for the twelve months ended December 31, 2010. The following table presents a reconciliation of the carrying amount of total equity, equity attributable to Dynegy and the equity attributable to the noncontrolling interests at the beginning and the end of the twelve months ended December 31, 2009:
|
Controlling
Interest |
Noncontrolling
Interests |
Total
|
||||||||||
|
(in millions)
|
||||||||||||
|
December 31, 2008
|
$ | 4,515 | $ | (30 | ) | $ | 4,485 | |||||
|
Net loss
|
(1,247 | ) | (15 | ) | (1,262 | ) | ||||||
|
Other comprehensive income (loss), net of tax:
|
||||||||||||
|
Unrealized mark-to-market gains arising during period
|
38 | 128 | 166 | |||||||||
|
Reclassification of mark-to-market (gains) losses to earnings
|
(1 | ) | 2 | 1 | ||||||||
|
Deferred losses on cash flow hedges
|
(3 | ) | (8 | ) | (11 | ) | ||||||
|
Amortization of unrecognized prior service cost and actuarial gain
|
7 | — | 7 | |||||||||
|
Unconsolidated investments other comprehensive income
|
24 | — | 24 | |||||||||
|
Total other comprehensive income, net of tax
|
65 | 122 | 187 | |||||||||
|
Other equity activity:
|
||||||||||||
|
Options and restricted stock granted
|
8 | — | 8 | |||||||||
|
401(k) plan and profit sharing stock
|
5 | — | 5 | |||||||||
|
Board of Directors stock compensation
|
(1 | ) | — | (1 | ) | |||||||
|
Retirement of Class B common stock
|
(443 | ) | — | (443 | ) | |||||||
|
December 31, 2009
|
$ | 2,902 | $ | 77 | $ | 2,979 | ||||||
DYNEGY INC. and DYNEGY HOLDINGS INC.
NOTES TO CONSOLIDATED FINANCIAL STATEMENTS—(Continued)
The following table presents a reconciliation of the carrying amount of total equity, equity attributable to Dynegy and the equity attributable to the noncontrolling interests at the beginning and the end of the twelve months ended December 31, 2008:
|
Controlling Interest
|
Noncontrolling Interests
|
Total
|
||||||||||
|
(in millions)
|
||||||||||||
|
December 31, 2007
|
$ | 4,506 | $ | 23 | $ | 4,529 | ||||||
|
Net income (loss)
|
174 | (3 | ) | 171 | ||||||||
|
Other comprehensive loss, net of tax:
|
||||||||||||
|
Unrealized mark-to-market losses arising during period
|
(95 | ) | (47 | ) | (142 | ) | ||||||
|
Reclassification of mark-to-market (gains) losses to earnings
|
11 | (1 | ) | 10 | ||||||||
|
Deferred losses on cash flow hedges
|
(2 | ) | (2 | ) | (4 | ) | ||||||
|
Foreign currency translation adjustment
|
(27 | ) | — | (27 | ) | |||||||
|
Amortization of unrecognized prior service cost and actuarial loss
|
(41 | ) | — | (41 | ) | |||||||
|
Unconsolidated investments other comprehensive loss
|
(24 | ) | — | (24 | ) | |||||||
|
Unrealized loss on securities, net
|
(12 | ) | — | (12 | ) | |||||||
|
Total other comprehensive loss, net of tax
|
(190 | ) | (50 | ) | (240 | ) | ||||||
|
Other equity activity:
|
||||||||||||
|
Options exercised
|
2 | — | 2 | |||||||||
|
Options and restricted stock granted
|
15 | — | 15 | |||||||||
|
401(k) plan and profit sharing stock
|
5 | — | 5 | |||||||||
|
Subscriptions receivable
|
3 | — | 3 | |||||||||
|
December 31, 2008
|
$ | 4,515 | $ | (30 | ) | $ | 4,485 | |||||
As a result of the deconsolidation and subsequent sale of our interest in PPEA Holding, effective January 1, 2010, there are no longer any noncontrolling interests in any of our consolidated subsidiaries, and as a result, no reconciliation is needed for the twelve months ended December 31, 2010. The following table presents a reconciliation of the carrying amount of total equity, equity attributable to DHI and the equity attributable to the noncontrolling interests at the beginning and the end of the twelve months ended December 31, 2009.
|
Controlling Interest
|
Noncontrolling Interests
|
Total
|
||||||||||
|
(in millions)
|
||||||||||||
|
December 31, 2008
|
$ | 4,613 | $ | (30 | ) | $ | 4,583 | |||||
|
Net loss
|
(1,253 | ) | (15 | ) | (1,268 | ) | ||||||
|
Other comprehensive income (loss), net of tax:
|
||||||||||||
|
Unrealized mark-to-market gains arising during period
|
38 | 128 | 166 | |||||||||
|
Reclassification of mark-to-market (gains) losses to earnings
|
(1 | ) | 2 | 1 | ||||||||
|
Deferred losses on cash flow hedges
|
(3 | ) | (8 | ) | (11 | ) | ||||||
|
Amortization of unrecognized prior service cost and actuarial gain
|
7 | — | 7 | |||||||||
|
Unconsolidated investments other comprehensive income
|
24 | — | 24 | |||||||||
|
Total other comprehensive income, net of tax
|
65 | 122 | 187 | |||||||||
|
Other equity activity:
|
||||||||||||
|
Affiliate activity
|
50 | — | 50 | |||||||||
|
Dividend to Dynegy Inc.
|
(585 | ) | — | (585 | ) | |||||||
|
Contribution from Dynegy Inc.
|
36 | — | 36 | |||||||||
|
December 31, 2009
|
$ | 2,926 | $ | 77 | $ | 3,003 | ||||||
DYNEGY INC. and DYNEGY HOLDINGS INC.
NOTES TO CONSOLIDATED FINANCIAL STATEMENTS—(Continued)
The following table presents a reconciliation of the carrying amount of total equity, equity attributable to DHI and the equity attributable to the noncontrolling interests at the beginning and the end of the twelve months ended December 31, 2008.
|
Controlling Interest
|
Noncontrolling Interests
|
Total
|
||||||||||
|
(in millions)
|
||||||||||||
|
December 31, 2007
|
$ | 4,597 | $ | 23 | $ | 4,620 | ||||||
|
Net income (loss)
|
208 | (3 | ) | 205 | ||||||||
|
Other comprehensive loss, net of tax:
|
||||||||||||
|
Unrealized mark-to-market losses arising during period
|
(95 | ) | (47 | ) | (142 | ) | ||||||
|
Reclassification of mark-to-market (gains) losses to earnings
|
11 | (1 | ) | 10 | ||||||||
|
Deferred losses on cash flow hedges
|
(2 | ) | (2 | ) | (4 | ) | ||||||
|
Foreign currency translation adjustment
|
(27 | ) | — | (27 | ) | |||||||
|
Amortization of unrecognized prior service cost and actuarial loss
|
(41 | ) | — | (41 | ) | |||||||
|
Unconsolidated investments other comprehensive loss
|
(24 | ) | — | (24 | ) | |||||||
|
Unrealized loss on securities, net
|
(12 | ) | — | (12 | ) | |||||||
|
Total other comprehensive loss, net of tax
|
(190 | ) | (50 | ) | (240 | ) | ||||||
|
Other equity activity:
|
||||||||||||
|
Affiliate activity
|
(2 | ) | — | (2 | ) | |||||||
|
December 31, 2008
|
$ | 4,613 | $ | (30 | ) | $ | 4,583 | |||||
The amortized cost basis, unrealized gains and losses and fair values of investments in available for sale investments as of December 31, 2010, is shown in the table below:
|
Cost Basis
|
Gross Unrealized Gains
|
Gross Unrealized Losses
|
Fair Value
|
|||||||||||||
|
(in millions)
|
||||||||||||||||
|
Available for Sale investments:
|
||||||||||||||||
|
Commercial Paper
|
$ | 41 | $ | — | $ | — | $ | 41 | ||||||||
|
Certificates of Deposit
|
12 | — | — | 12 | ||||||||||||
|
Corporate Securities
|
2 | — | — | 2 | ||||||||||||
|
U.S. Treasury and Government Securities (1)
|
120 | — | — | 120 | ||||||||||||
|
Total—DHI
|
$ | 175 | $ | — | $ | — | $ | 175 | ||||||||
|
Commercial Paper
|
4 | — | — | 4 | ||||||||||||
|
Certificates of Deposit
|
8 | — | — | 8 | ||||||||||||
|
Corporate Securities
|
4 | — | — | 4 | ||||||||||||
|
Total—Dynegy
|
$ | 191 | $ | — | $ | — | $ | 191 | ||||||||
|
|
(1)
|
Includes $85 million in Broker margin account on our consolidated balance sheets in support of transactions with our futures clearing manager.
|
During the twelve months ended December 31, 2010
,
we received proceeds of $58 million from the sale of available for sale securities. We realized an immaterial amount of gains and losses on the sale of these available for sale securities in earnings for the twelve months ended December 31, 2010.
DYNEGY INC. and DYNEGY HOLDINGS INC.
NOTES TO CONSOLIDATED FINANCIAL STATEMENTS—(Continued)
2010 Impairment Charges
Casco Bay Impairment.
On August 13, 2010, Dynegy entered into the Blackstone Agreement with an affiliate of The Blackstone Group L.P., pursuant to which Dynegy would be acquired and our stockholders would receive $4.50 per share in cash. On November 16, 2010, the Blackstone Merger Agreement was amended to increase the merger consideration to $5.00 per share in cash. The Blackstone Merger Agreement was not approved by Dynegy’s stockholders at the special stockholders’ meeting on November 23, 2010 and was subsequently terminated by the parties in accordance with the terms of the agreement.
In August 2010, in connection with the Blackstone Merger Agreement, we determined it was more likely than not that our Moss Landing, Morro Bay, Oakland and Casco Bay facilities would be disposed of before the end of their previously estimated useful lives, as Blackstone had entered into a separate agreement to sell these facilities to a third party upon the closing of the Blackstone Merger Agreement. Based on the terms of the Blackstone Merger Agreement and our impairment analysis of the impact of such agreement on the recoverability of the carrying value of our long-lived assets, we recorded a pre-tax impairment charge of $134 million ($81 million after-tax) during the three months ended September 30, 2010 to reduce the carrying value of our Casco Bay facility and related assets to its fair value. This charge is included in Impairment and other charges in our consolidated statements of operations in the GEN-NE segment.
In performing the impairment analysis, we concluded that the assets Blackstone planned to sell to a third party did not meet the criteria of “held for sale”, as the agreement to sell these assets was a contractual arrangement between Blackstone and the third party. Dynegy management had not committed to any plan to dispose of these assets prior to the end of their previously estimated useful lives. As such, we assessed the recoverability of the carrying value of these certain assets using expected cash flows from the proceeds from the potential sale of these assets, probability weighted with the expected cash flow from continuing to hold and use the assets. We performed this analysis considering a range of likelihoods that management considered reasonable regarding whether the sale of these assets would be completed. In any of the scenarios within this range of the probabilities we considered reasonable, the expected undiscounted cash flows from the Moss Landing, Morro Bay and Oakland facilities were sufficient to recover their carrying values, while the expected undiscounted cash flows from the Casco Bay facility were not. Therefore, we recorded an impairment charge to reduce the carrying value of the Casco Bay facility and related assets to its estimated fair value. We determined the fair value of the facility based on assumptions that reflect our best estimate of third party market participants’ considerations, and corroborated these assumptions based upon the terms of the proposed sale of the facilities. The Blackstone Merger Agreement ultimately did not receive stockholder approval, and at December 31, 2010, we no longer consider it more likely than not that these facilities will be disposed of before the end of their currently estimated useful lives.
Other.
In the first quarter of 2010, as a result of uncertainty and risk surrounding PPEA’s financing structure, we recorded a pre-tax impairment charge of approximately $37 million to reduce the carrying value of our investment in PPEA Holding to zero. In the fourth quarter 2010, we sold our interest in this investment. Please read Note 14—Unconsolidated Investments for additional information.
Our impairment analysis of our generating assets is based on forward-looking projections of our estimated future cash flows based on discrete financial forecasts developed by management for planning purposes. These projections incorporate certain assumptions including forward power and capacity prices, forward fuel costs and costs of complying with environmental regulations. As additional information becomes available regarding the significant assumptions used in our analysis, we may conclude that it is necessary to update estimated useful lives and our impairment analyses in future periods to assess the recoverability of our assets and additional impairment charges could be required.
DYNEGY INC. and DYNEGY HOLDINGS INC.
NOTES TO CONSOLIDATED FINANCIAL STATEMENTS—(Continued)
2009 Impairment Charges
The following summarizes pre-tax impairment charges recorded during 2009 which are included in Impairment and other charges in our consolidated statements of operations:
|
GEN-MW
|
GEN-WE
|
GEN-NE
|
Total
|
|||||||||||||
|
(in millions)
|
||||||||||||||||
|
Three months ended June 30, 2009:
|
||||||||||||||||
|
Assets included in the LS Power Transactions
|
$ | — | $ | — | $ | (179 | ) | $ | (179 | ) | ||||||
|
Roseton and Danskammer
|
— | — | (208 | ) | (208 | ) | ||||||||||
|
Total 2nd Quarter Impairment Charges
|
— | — | (387 | ) | (387 | ) | ||||||||||
|
Three months ended September 30, 2009:
|
||||||||||||||||
|
Assets included in the LS Power Transactions (1)
|
(147 | ) | — | — | (147 | ) | ||||||||||
|
Roseton and Danskammer
|
— | — | (1 | ) | (1 | ) | ||||||||||
|
Total 3rd Quarter Impairment Charges
|
(147 | ) | — | (1 | ) | (148 | ) | |||||||||
|
Three months ended December 31, 2009:
|
||||||||||||||||
|
Roseton and Danskammer
|
— | — | (3 | ) | (3 | ) | ||||||||||
|
Total 4th Quarter Impairment Charges
|
— | — | (3 | ) | (3 | ) | ||||||||||
|
Impairment Charges for the Twelve Months Ended December 31, 2009
|
$ | (147 | ) | $ | — | $ | (391 | ) | $ | (538 | ) | |||||
|
(1)
|
Upon classification of these assets as held for sale at August 9, 2009, we recognized impairment charges of $196 million and $19 million in our GEN-MW and GEN-NE segments, respectively. At September 30, 2009, based on an increase in the fair value of the consideration to be received, we recovered $49 million and $19 million of the impairment charges in our GEN-MW and GEN-NE segments, respectively.
|
The following summarizes pre-tax impairment charges recorded during 2009 which are included in Income (loss) from discontinued operations in our consolidated statements of operations:
|
GEN-MW
|
GEN-WE
|
GEN-NE
|
Total
|
|||||||||||||
|
(in millions)
|
||||||||||||||||
|
Three months ended March 31, 2009:
|
||||||||||||||||
|
Bluegrass (included in the LS Power Transactions)
|
$ | (5 | ) | $ | — | $ | — | $ | (5 | ) | ||||||
|
Total 1st Quarter Impairment Charges
|
(5 | ) | — | — | (5 | ) | ||||||||||
|
Three months ended June 30, 2009:
|
||||||||||||||||
|
Assets included in the LS Power Transactions
|
(18 | ) | — | — | (18 | ) | ||||||||||
|
Total 2nd Quarter Impairment Charges
|
(18 | ) | — | — | (18 | ) | ||||||||||
|
Three months ended September 30, 2009:
|
||||||||||||||||
|
Assets included in the LS Power Transactions (1)
|
— | (235 | ) | — | (235 | ) | ||||||||||
|
Total 3rd Quarter Impairment Charges
|
— | (235 | ) | — | (235 | ) | ||||||||||
|
Impairment Charges for the Twelve Months Ended December 31, 2009
|
$ | (23 | ) | $ | (235 | ) | $ | — | $ | (258 | ) | |||||
|
|
(1)
|
Upon classification of these assets as held for sale at August 9, 2009, we recognized an impairment charge of $292 million and $4 million in our GEN-WE and GEN-MW segments, respectively. At September 30, 2009, based on an increase in the fair value of the consideration to be received, we recovered $57 million and $4 million of the impairment charges in our GEN-WE and GEN-MW segments, respectively.
|
Bluegrass Impairment.
During the first quarter 2009, we performed a goodwill impairment test due to changes in market conditions that would more likely than not reduce the fair values of our GEN-MW, GEN-WE and GEN-NE reporting units below their carrying amounts. Please read Note 16—Goodwill for further discussion. This decline in value also triggered testing of the recoverability of our long-lived assets. We performed an impairment analysis and recorded a pre-tax impairment charge of $5 million ($3 million after tax). This charge, which related to the Bluegrass power generation facility, is included in Income (loss) on discontinued operations in our consolidated
statements of operations. We determined the fair value of the Bluegrass facility using assumptions that reflected our best estimate of third party market participants’ considerations.
DYNEGY INC. and DYNEGY HOLDINGS INC.
NOTES TO CONSOLIDATED FINANCIAL STATEMENTS—(Continued)
Assets Included in the LS Power Transactions.
At June 30, 2009, in connection with discussions leading to the agreement with LS Power discussed further in Note 4—Dispositions, Contract Terminations and Discontinued Operations—Dispositions—LS Power Transactions, we determined it was more likely than not that certain assets would be sold prior to the end of their previously estimated useful lives. Therefore, we updated our March 31, 2009 long-lived asset impairment analysis for each of the asset groups that we were considering for sale as part of the proposed transaction as of June 30, 2009. As a result, we recorded a pre-tax impairment charge of $197 million ($120 million after-tax). Of this charge, $179 million related to the Bridgeport power generation facility and related assets and is included in Impairment and other charges in our consolidated statements of operations in the GEN-NE segment. The remaining $18 million ($11 million after-tax) related to the Bluegrass power generation facility and related assets and is included in Income (loss) from discontinued operations in our consolidated statements of operations in the GEN-MW segment. This additional impairment charge for the Bluegrass power generation facility reflected updated assumptions regarding the terms of a potential sale as well as continued weakening of forward capacity prices in the second quarter 2009. We determined the fair value of these generation facilities and related assets using assumptions that reflect our best estimate of third party market participants’ considerations and corroborated these estimates indirectly based on our assumptions regarding the terms of and the overall value inherent in the LS Power Transactions.
In performing the June 30, 2009 impairment analysis, we used an 80 percent likelihood at June 30, 2009 of reaching an agreement for sale of the assets, and certain assumptions about the terms of such a sale. Upon reaching the agreement with LS Power discussed further in Note 4—Dispositions, Contract Terminations and Discontinued Operations—Dispositions—LS Power Transactions, the assets qualified as held for sale, and additional impairment charges were recorded, as discussed below.
On August 9, 2009, we entered into the purchase and sale agreement with LS Power. At that time, the operating assets included in that agreement met the criteria of held for sale. Accordingly, we updated our impairment analysis reflecting the estimated fair value for the consideration to be received from LS Power inclusive of costs to sell. As a result, we recognized pre–tax impairment charges of $147 million and $235 million in our GEN-MW and GEN-WE segments, respectively, for the three month period ended September 30, 2009. The $147 million charge is included in Impairment and other charges in our consolidated statements of operations. The $235 million charge is included in Income (loss) on discontinued operations in our consolidated statements of operations.
At September 30, 2009, the fair value of the consideration was based partially upon the closing stock price of Dynegy’s Class A common stock of $2.55 per share. We recorded additional losses on the sale of these assets upon close of the transaction in the fourth quarter 2009, based on changes subsequent to September 30, 2009 in the fair value of the shares to be received as part of the consideration for this transaction, changes in the fair value of debt to be issued, and changes in working capital items not reimbursed by the purchaser. In addition, we recorded a loss of $84 million on the sale of our Sandy Creek project investment included in this transaction. Please refer to Note 4—Dispositions, Contract Terminations and Discontinued Operations—Dispositions—LS Power Transactions for further discussion.
Roseton and Danskammer.
In updating our impairment analysis for assets that were being considered for sale as discussed above, we noted that the aggregate carrying value of the assets included in the proposed transaction exceeded the aggregate fair value of the consideration to be received. In addition, we noted a continued weakening in forward capacity and forward power prices in certain of the
markets in which we operate. This indicated a possible decline in the value of power generation assets in
all three of our reportable segments. Therefore, at June 30, 2009, we updated our March 31, 2009 impairment analysis for our remaining power generation facilities not currently under consideration for sale. As a result of changes in market conditions in the second quarter 2009 within the Northeast region, we recorded a pre-tax impairment charge of $208 million ($129 million after-tax) related to the Roseton and Danskammer power generation facilities. This charge is included in Impairment and other charges in our consolidated statements of operations. We determined the fair value of these facilities using assumptions that reflect our best estimate of third party market participants’ considerations. This involved using the present value technique, incorporating our best estimate of third party market participants’ assumptions about the best use of assets, future power and fuel costs and the costs of complying with environmental regulations. Based on a continuation of expected cash flow losses for these assets in 2009, we recorded additional pre-tax impairment charges of $1 million ($1 million after-tax) for the three months ended September 30, 2009 and $3 million ($2 million after-tax) for the three months ended December 31, 2009.
DYNEGY INC. and DYNEGY HOLDINGS INC.
NOTES TO CONSOLIDATED FINANCIAL STATEMENTS—(Continued)
Our impairment analysis of our generating assets is based on forward-looking projections of our estimated future cash flows based on discrete financial forecasts developed by management for planning purposes. These projections incorporate certain assumptions including forward power and capacity prices, forward fuel costs and costs of complying with environmental regulations. As additional information becomes available regarding the significant assumptions used in our analysis, we may conclude that it is necessary to update our impairment analyses in future periods to assess the recoverability of our assets and additional impairment charges could be required.
2008 Impairment Charges
At December 31, 2008, we determined that it was more likely than not that the Heard County power generation facility would be sold prior to the end of its previously estimated useful life. We performed an impairment analysis and recorded a pre-tax impairment charge of $47 million ($27 million after tax). This charge is recorded in the GEN-WE segment and is included in Income (loss) from discontinued operations in our consolidated statements of operations. We determined the fair value of the Heard County facility using the expected present value technique and probability-weighted cash flows incorporating potential sales prices due to recent negotiations.
In 2008, we recorded a $71 million pre-tax loss related to our investment in DLS Power Holdings, which consisted of an impairment of $24 million and a $47 million loss on dissolution. Please read Note 14—Unconsolidated Investments for further discussion.
Restructuring Charges
In the fourth quarter 2010, we established a plan to align our corporate cost structure with the current challenging commodity price environment. As a result of this plan, we eliminated approximately 135 positions, and we expect to pay approximately $8 million of severance benefits to affected employees in 2011. We expect to eliminate an additional 50 positions in connection with the closure of our Vermilion facility in the first half of 2011, and have accrued $1 million of severance benefits in connection with the facility’s closure. We recognized pre-tax charges of $12 million in 2010 in connection with these restructuring activities and with the closure of our South Bay facility. These charges are included in Impairment and other charges in our consolidated statements of operations and were based on contractual obligations under our existing benefit plans.
The nature of our business necessarily involves market and financial risks. Specifically, we are exposed to commodity price variability related to our power generation business. Our commercial team manages these commodity price risks with financially settled and other types of contracts consistent with our commodity risk management policy. Our commercial team also uses financial instruments in an attempt to capture the benefit of fluctuations in market prices in the geographic regions where our assets operate. Our treasury team manages our financial risks and exposures associated with interest expense variability.
DYNEGY INC. and DYNEGY HOLDINGS INC.
NOTES TO CONSOLIDATED FINANCIAL STATEMENTS—(Continued)
Our commodity risk management strategy gives us the flexibility to sell energy and capacity through a combination of spot market sales and near-term contractual arrangements (generally over a rolling 1 to 3 year time frame). Our commodity risk management goal is to protect cash flow in the near-term while keeping the ability to capture value longer-term. Many of our contractual arrangements are derivative instruments and must be accounted for at fair value. We also manage commodity price risk by entering into capacity forward sales arrangements, tolling arrangements, RMR contracts, fixed price coal purchases and other arrangements that do not receive fair value accounting treatment because these arrangements do not meet the definition of a derivative or are designated as “normal purchase normal sales”. As a result, the gains and losses with respect to these arrangements are not reflected in the consolidated statements of operations until the settlement dates.
Quantitative Disclosures Related to Financial Instruments and Derivatives
On January 1, 2009, we adopted authoritative guidance which requires disclosure of the fair values of derivative instruments and their gains and losses in a tabular format. It also provides more information about an entity’s liquidity by requiring disclosure of derivative features that are credit risk-related and it requires cross-referencing within footnotes to enable financial statement users to locate important information about derivative instruments.
The following disclosures and tables present information concerning the impact of derivative instruments on our consolidated balance sheets and statements of operations. In the table below, commodity contracts primarily consist of derivative contracts related to our power generation business that we have not designated as accounting hedges, that are entered into for purposes of economically hedging future fuel requirements and sales commitments and securing commodity prices. Interest rate contracts primarily consist of derivative contracts related to managing our interest rate risk. As of December 31, 2010, our commodity derivatives were comprised of both long and short positions; a long position is a contract to purchase a commodity, while a short position is a contract to sell a commodity. As of December 31, 2010, we had net long/(short) commodity derivative contracts outstanding and notional interest rate swaps outstanding in the following quantities:
|
Contract Type
|
Hedge Designation
|
Quantity
|
Unit of Measure
|
Net Fair Value
|
|
||||||||||
|
(in millions)
|
(in millions)
|
||||||||||||||
|
Commodity derivative contracts:
|
|||||||||||||||
|
Electric energy (1)
|
Not designated
|
(63 | ) |
MW
|
$ | 264 | |||||||||
|
Natural gas (1)
|
Not designated
|
134 |
MMBtu
|
$ | (207 | ) | |||||||||
|
Electricity/natural gas spread options
|
Not designated
|
(7)/60 |
MW/MMBtu
|
$ | (31 | ) | |||||||||
|
Other (2)
|
Not designated
|
— |
Misc.
|
$ | 8 | ||||||||||
|
Interest rate contracts:
|
|||||||||||||||
|
Interest rate swaps
|
Fair value hedge
|
(25 | ) |
Dollars
|
$ | 1 | |||||||||
|
Interest rate swaps
|
Not designated
|
206 |
Dollars
|
$ | (5 | ) | |||||||||
|
Interest rate swaps
|
Not designated
|
25 |
Dollars
|
$ | (1 | ) | |||||||||
|
Interest rate swaps
|
Not designated
|
(206 | ) |
Dollars
|
$ | 5 | |||||||||
|
|
(1)
|
Mainly comprised of swaps, options and physical forwards.
|
|
|
(2)
|
Comprised of coal, crude oil, fuel oil options, swaps and physical forwards.
|
Derivatives on the Balance Sheet.
The following table presents the fair value and balance sheet classification of derivatives in the consolidated balance sheet as of December 31, 2010 and 2009, segregated between designated, qualifying hedging instruments and those that are not, and by type of contract segregated by assets and liabilities. We do not offset fair value amounts recognized for derivative instruments executed with the same counterparty under a master netting agreement and we did not elect to adopt the netting provisions that allow an entity to offset the fair value amounts recognized for the Daily Cash Settlements paid or received against the fair value amounts recognized for derivative instruments executed with the same counterparty under a master netting agreement. As a result, our consolidated balance sheets present derivative assets and liabilities, as well as related Daily Cash Settlements, on a gross basis.
DYNEGY INC. and DYNEGY HOLDINGS INC.
NOTES TO CONSOLIDATED FINANCIAL STATEMENTS—(Continued)
|
Contract Type
|
Balance Sheet Location
|
December 31,
2010
|
December 31, 2009
|
||||||||
|
(in millions)
|
|||||||||||
|
Derivatives designated as hedging instruments:
|
|||||||||||
|
Derivative Assets:
|
|||||||||||
|
Interest rate contracts
|
Assets from risk management activities
|
$ | 1 | $ | 2 | ||||||
|
Derivative Liabilities:
|
|||||||||||
|
Interest rate contracts
|
Liabilities from risk management activities
|
— | — | ||||||||
|
Total derivatives designated as hedging instruments, net
|
1 | 2 | |||||||||
|
Derivatives not designated as hedging instruments:
|
|||||||||||
|
Derivative Assets:
|
|||||||||||
|
Commodity contracts
|
Assets from risk management activities
|
1,265 | 861 | ||||||||
|
Interest rate contracts
|
Assets from risk management activities
|
5 | 13 | ||||||||
|
Derivative Liabilities:
|
|||||||||||
|
Commodity contracts
|
Liabilities from risk management activities
|
(1,231 | ) | (844 | ) | ||||||
|
Interest rate contracts
|
Liabilities from risk management activities
|
(6 | ) | (65 | ) | ||||||
|
Total derivatives not designated as hedging instruments, net
|
33 | (35 | ) | ||||||||
|
Total derivatives, net
|
$ | 34 | $ | (33 | ) | ||||||
Impact of Derivatives on the Consolidated Statements of Operations
The following discussion and tables present the disclosure of the location and amount of gains and losses on derivative instruments in our consolidated statements of operations for the twelve months ended December 31, 2010, 2009 and 2008 segregated between designated, qualifying hedging instruments and those that are not, by type of contract.
Cash Flow Hedges.
We may enter into financial derivative instruments that qualify, and that we may elect to designate, as cash flow hedges. Interest rate swaps have been used to convert floating interest rate obligations to fixed interest rate obligations.
Our former investee, PPEA, which we consolidated through December 31, 2009, had certain interest rate swap agreements which were designated as cash flow hedges. Therefore, the effective portion of the changes in value prior to July 28, 2009 was reflected in other comprehensive income (loss). On July 28, 2009, we determined the interest rate swap agreements no longer qualified for cash flow hedge accounting because the hedged forecasted transaction (that is, the future interest payments arising from the PPEA Credit Agreement Facility) was no longer probable of occurring. We performed a final effectiveness test as of July 28, 2009 and no ineffectiveness was recorded. The associated risk management liability was classified as current at December 31, 2009, as the interest rate swap agreements could have been terminated at the discretion of a third party guarantor of PPEA’s obligations under the agreements. Effective January 1, 2010, we deconsolidated our investment in PPEA Holding, and we sold our interest in this entity in the fourth quarter of 2010. Please read Note 15—Variable Interest Entities—PPEA Holding Company LLC for further discussion of our association with PPEA. The amounts previously deferred in Accumulated other comprehensive income (loss) were recognized in earnings upon our sale of our investment in PPEA Holding in the fourth quarter of 2010, resulting in a loss of $28 million, included in Losses from unconsolidated investments on our consolidated statement of operations.
During the twelve month periods ended December 31, 2010, 2009 and 2008, we recorded zero, zero and $2 million, respectively, related to ineffectiveness from changes in fair value of derivative positions and no amounts were excluded from the assessment of hedge effectiveness related to the hedge of future cash flows in any of the periods. During the twelve month periods ended December 31, 2010, 2009 and 2008, no amounts were reclassified to earnings in connection with forecasted transactions that were considered probable of not occurring.
DYNEGY INC. and DYNEGY HOLDINGS INC.
NOTES TO CONSOLIDATED FINANCIAL STATEMENTS—(Continued)
The amount of gain (loss) recognized in Other comprehensive loss on the effective portion of interest rate swap contracts designated as cash flow hedges was a gain of $166 million and a loss of $142 million for the years ended December 31 2009 and 2008, respectively. As of July 28, 2009, these derivatives no longer qualified for cash flow hedge accounting, and therefore, no additional gains or losses have been recognized in Other comprehensive income since that date.
Fair Value Hedges.
We also enter into derivative instruments that qualify, and that we may elect to designate, as fair value hedges. We use interest rate swaps to convert a portion of our non-prepayable fixed-rate debt into floating-rate debt. The maximum length of time for which we have hedged our exposure for fair value hedges is through 2011. During the twelve month periods ended December 31, 2010, 2009 and 2008, there was no ineffectiveness from changes in the fair value of hedge positions and no amounts were excluded from the assessment of hedge effectiveness. During the twelve month periods ended December 31, 2010, 2009 and 2008, there were no gains or losses related to the recognition of firm commitments that no longer qualified as fair value hedges.
The impact of interest rate swap contracts designated as fair value hedges and the related hedged item on our consolidated statements of operations for the twelve months ended December 31, 2010, 2009 and 2008 was immaterial.
Financial Instruments Not Designated as Hedges.
We elect not to designate derivatives related to our power generation business and certain interest rate instruments as cash flow or fair value hedges. Thus, we account for changes in the fair value of these derivatives within the consolidated statements of operations (herein referred to as “mark-to-market accounting treatment”). As a result, these mark-to-market gains and losses are not reflected in the consolidated statements of operations in the same period as the underlying activity for which the derivative instruments serve as economic hedges.
For the twelve months ended December 31, 2010, our revenues included approximately $21 million of mark-to-market gains related to this activity compared to $180 million of mark-to-market losses and $252 million of mark-to-market gains in the periods ended December 31, 2009 and 2008, respectively.
The impact of derivative financial instruments that have not been designated as hedges on our consolidated statements of operations for the twelve month periods ended December 31, 2010 and 2009 is presented below. Note that this presentation does not reflect the expected gains or losses arising from the underlying physical transactions associated with these financial instruments. Therefore, this presentation is not indicative of the economic gross profit we expect to realize when the underlying physical transactions settle.
|
Derivatives Not Designated as
Hedging
|
Location of Gain
(Loss) Recognized in
Income on
|
Amount of All Gain (Loss) Recognized in Income on
Derivatives for the Twelve Months Ended
December 31,
|
||||||||||||||
|
Instruments
|
Derivatives
|
2010
|
2009
|
2008
|
||||||||||||
|
(in millions)
|
||||||||||||||||
|
Commodity contracts
|
Revenues
|
$ | 185 | $ | 337 | $ | 264 | |||||||||
|
Interest rate contracts
|
Interest expense
|
— | (12 | ) | (2 | ) | ||||||||||
DYNEGY INC. and DYNEGY HOLDINGS INC.
NOTES TO CONSOLIDATED FINANCIAL STATEMENTS—(Continued)
The following tables set forth by level within the fair value hierarchy our financial assets and liabilities that were accounted for at fair value on a recurring basis as of December 31, 2010 and 2009. These financial assets and liabilities are classified in their entirety based on the lowest level of input that is significant to the fair value measurement. Our assessment of the significance of a particular input to the fair value measurement requires judgment, and may affect the valuation of fair value assets and liabilities and their placement within the fair value hierarchy levels.
|
Fair Value as of December 31, 2010
|
||||||||||||||||
|
Level 1
|
Level 2
|
Level 3
|
Total
|
|||||||||||||
|
(in millions)
|
||||||||||||||||
|
Assets:
|
||||||||||||||||
|
Assets from commodity risk management activities:
|
||||||||||||||||
|
Electricity derivatives
|
$ | — | $ | 526 | $ | 77 | $ | 603 | ||||||||
|
Natural gas derivatives
|
— | 613 | 5 | 618 | ||||||||||||
|
Other derivatives
|
— | 44 | — | 44 | ||||||||||||
|
Total assets from commodity risk management activities
|
$ | — | $ | 1,183 | $ | 82 | $ | 1,265 | ||||||||
|
Assets from interest rate swaps
|
— | 6 | — | 6 | ||||||||||||
|
Short-term investments:
|
||||||||||||||||
|
Commercial paper
|
— | 41 | — | 41 | ||||||||||||
|
Certificates of deposit
|
— | 12 | — | 12 | ||||||||||||
|
Corporate securities
|
— | 2 | — | 2 | ||||||||||||
|
U.S. Treasury and government securities (1)
|
— | 120 | — | 120 | ||||||||||||
|
Total—DHI short-term investments
|
$ | — | $ | 175 | $ | — | $ | 175 | ||||||||
|
Total—DHI
|
— | 1,364 | 82 | 1,446 | ||||||||||||
|
Short-term investments:
|
||||||||||||||||
|
Commercial paper
|
— | 4 | — | 4 | ||||||||||||
|
Certificates of deposit
|
— | 8 | — | 8 | ||||||||||||
|
Corporate securities
|
— | 4 | — | 4 | ||||||||||||
|
Total—Dynegy
|
$ | — | $ | 1,380 | $ | 82 | $ | 1,462 | ||||||||
|
Liabilities:
|
||||||||||||||||
|
Liabilities from commodity risk management activities:
|
||||||||||||||||
|
Electricity derivatives
|
$ | — | $ | (311 | ) | $ | (28 | ) | $ | (339 | ) | |||||
|
Natural gas derivatives
|
— | (825 | ) | — | (825 | ) | ||||||||||
|
Heat rate derivatives
|
— | — | (31 | ) | (31 | ) | ||||||||||
|
Other derivatives
|
— | (36 | ) | — | (36 | ) | ||||||||||
|
Total liabilities from commodity risk management activities
|
$ | — | $ | (1,172 | ) | $ | (59 | ) | $ | (1,231 | ) | |||||
|
Liabilities from interest rate swaps
|
— | (6 | ) | — | (6 | ) | ||||||||||
|
Total
|
$ | — | $ | (1,178 | ) | $ | (59 | ) | $ | (1,237 | ) | |||||
|
|
(1)
|
Includes $85 million in Broker margin account on our consolidated balance sheets in support of transactions with our futures clearing manager.
|
DYNEGY INC. and DYNEGY HOLDINGS INC.
NOTES TO CONSOLIDATED FINANCIAL STATEMENTS—(Continued)
|
Fair Value as of December 31, 2009
|
||||||||||||||||
|
Level 1
|
Level 2
|
Level 3
|
Total
|
|||||||||||||
|
(in millions)
|
||||||||||||||||
|
Assets:
|
||||||||||||||||
|
Assets from commodity risk management activities:
|
||||||||||||||||
|
Electricity derivatives
|
$ | — | $ | 442 | $ | 57 | $ | 499 | ||||||||
|
Natural gas derivatives
|
— | 302 | 5 | 307 | ||||||||||||
|
Heat rate derivatives
|
— | — | 19 | 19 | ||||||||||||
|
Other derivatives
|
— | 36 | — | 36 | ||||||||||||
|
Total assets from commodity risk management activities
|
— | 780 | 81 | 861 | ||||||||||||
|
Assets from interest rate swaps
|
— | 15 | — | 15 | ||||||||||||
|
Other—DHI (1)
|
— | 8 | — | 8 | ||||||||||||
|
Total—DHI
|
— | 803 | 81 | 884 | ||||||||||||
|
Other—Dynegy (1)
|
— | 1 | — | 1 | ||||||||||||
|
Total—Dynegy
|
$ | — | $ | 804 | $ | 81 | $ | 885 | ||||||||
|
Liabilities:
|
||||||||||||||||
|
Liabilities from commodity risk management activities:
|
||||||||||||||||
|
Electricity derivatives
|
$ | — | $ | (361 | ) | $ | (51 | ) | $ | (412 | ) | |||||
|
Natural gas derivatives
|
— | (401 | ) | — | (401 | ) | ||||||||||
|
Heat rate derivatives
|
— | — | (2 | ) | (2 | ) | ||||||||||
|
Other derivatives
|
— | (29 | ) | — | (29 | ) | ||||||||||
|
Total liabilities from commodity risk management activities
|
— | (791 | ) | (53 | ) | (844 | ) | |||||||||
|
Liabilities from interest rate swaps
|
— | (15 | ) | (50 | ) | (65 | ) | |||||||||
|
Total
|
$ | — | $ | (806 | ) | $ | (103 | ) | $ | (909 | ) | |||||
|
|
(1)
|
Other represents short-term investments and long-term investments.
|
We primarily apply the market approach for recurring fair value measurements and endeavor to utilize the best available information. Accordingly, we utilize valuation techniques that maximize the use of observable inputs and minimize the use of unobservable inputs. For example, assets and liabilities from risk management activities may include exchange-traded derivative contracts and OTC derivative contracts. Some exchange-traded derivatives are valued using broker or dealer quotations, or market transactions in either the listed or OTC markets. In such cases, these exchange-traded derivatives are classified within Level 2. OTC derivative trading instruments include swaps, forwards, options and complex structures that are valued at fair value. In certain instances, these instruments may utilize models to measure fair value. Generally, we use a similar model to value similar instruments. Valuation models utilize various inputs that include quoted prices for similar assets or liabilities in active markets, quoted prices for identical or similar assets or liabilities in markets that are not active, other observable inputs for the asset or liability, and market-corroborated inputs. Where observable inputs are available for substantially the full term of the asset or liability, the instrument is categorized in Level 2. Certain OTC derivatives trade in less active markets with a lower availability of pricing information. In addition, complex or structured transactions, such as heat-rate call options, can introduce the need for internally-developed model inputs that might not be observable in or corroborated by the market. When such inputs have a significant impact on the measurement of fair value, the instrument is categorized in Level 3. We have consistently used this valuation technique for all periods presented. Please read Note 2—Summary of Significant Accounting Policies—Fair Value Measurements for further discussion.
DYNEGY INC. and DYNEGY HOLDINGS INC.
NOTES TO CONSOLIDATED FINANCIAL STATEMENTS—(Continued)
The following tables set forth a reconciliation of changes in the fair value of financial instruments classified as Level 3 in the fair value hierarchy:
|
Twelve Months Ended December 31, 2010
|
||||||||||||||||||||
|
Electricity
Derivatives
|
Natural Gas Derivatives
|
Heat Rate Derivatives
|
Interest Rate Swaps
|
Total
|
||||||||||||||||
|
(in millions)
|
||||||||||||||||||||
|
Balance at December 31, 2009
|
$ | 6 | $ | 5 | $ | 17 | $ | (50 | ) | $ | (22 | ) | ||||||||
|
Deconsolidation of Plum Point (See Note 15)
|
— | — | — | 50 | 50 | |||||||||||||||
|
Realized and unrealized gains, net
|
77 | — | 7 | — | 84 | |||||||||||||||
|
Purchases, issuances and settlements, net
|
(34 | ) | — | (55 | ) | — | (89 | ) | ||||||||||||
|
Balance at December 31, 2010
|
$ | 49 | $ | 5 | $ | (31 | ) | $ | — | $ | 23 | |||||||||
|
Unrealized gains (losses) relating to instruments still held as of December 31, 2010
|
$ | 64 | $ | — | $ | (9 | ) | $ | — | $ | 55 | |||||||||
|
Twelve Months Ended December 31, 2009
|
||||||||||||||||||||
|
Electricity
Derivatives
|
Natural Gas
Derivatives
|
Heat Rate
Derivatives
|
Interest Rate
Swaps
|
Total
|
||||||||||||||||
|
(in millions)
|
||||||||||||||||||||
|
Balance at December 31, 2008
|
$ | 7 | $ | 7 | $ | 46 | $ | — | $ | 60 | ||||||||||
|
Realized and unrealized gains (losses), net
|
24 | (1 | ) | 35 | (5 | ) | 53 | |||||||||||||
|
Purchases, issuances and settlements, net
|
(25 | ) | (1 | ) | (64 | ) | 5 | (85 | ) | |||||||||||
|
Transfer into Level 3
|
— | — | — | (50 | ) | (50 | ) | |||||||||||||
|
Balance at December 31, 2009
|
$ | 6 | $ | 5 | $ | 17 | $ | (50 | ) | $ | (22 | ) | ||||||||
|
Unrealized gains (losses) relating to instruments still held as of December 31, 2009
|
$ | 2 | $ | (1 | ) | $ | 5 | $ | (6 | ) | $ | — | ||||||||
|
Twelve Months Ended December 31, 2008
|
||||||||||||||||||||
|
Electricity Derivatives
|
Natural Gas Derivatives
|
Heat Rate Derivatives
|
Interest Rate Swaps
|
Total
|
||||||||||||||||
|
(in millions)
|
||||||||||||||||||||
|
Balance at December 31, 2007
|
$ | 3 | $ | 8 | $ | (27 | ) | $ | — | $ | (16 | ) | ||||||||
|
Realized and unrealized gains, net
|
10 | — | 95 | — | 105 | |||||||||||||||
|
Purchases, issuances and settlements, net
|
(5 | ) | (1 | ) | (22 | ) | — | (28 | ) | |||||||||||
|
Transfer out of Level 3
|
(1 | ) | — | — | — | (1 | ) | |||||||||||||
|
Balance at December 31, 2008
|
$ | 7 | $ | 7 | $ | 46 | $ | — | $ | 60 | ||||||||||
|
Unrealized gains relating to instruments still held as of December 31, 2008
|
$ | 7 | $ | — | $ | 79 | $ | — | $ | 86 | ||||||||||
Gains and losses (realized and unrealized) for Level 3 recurring items are included in Revenues on the consolidated statements of operations. We believe an analysis of instruments classified as Level 3 should be undertaken with the understanding that these items generally serve as economic hedges of our power generation portfolio.
Transfers in and/or out of Level 3 represent existing assets or liabilities that were either previously categorized as a higher level for which the inputs to the model became unobservable or assets and liabilities that were previously classified as Level 3 for which the lowest significant input became observable during the period. Transfers in and/or out of Level 3 are valued at the end of the period. As of December 31, 2009, PPEA held interest rate swaps with a contractual net liability of approximately $80 million. The fair value of these liabilities was estimated to be approximately $50 million due to a valuation adjustment for the deterioration of PPEA’s credit worthiness pursuant to fair value accounting standards. As a result of the significance of the credit valuation adjustment, these interest rate swaps were reflected in Level 3 at December 31, 2009. On January 1, 2010, we adopted ASU No. 2009-17. The adoption of ASU No. 2009-17 resulted in a deconsolidation of our investment in PPEA Holding which was accounted for as an equity method investment until the sale of our interest on November 10, 2010. Please read Note 15—Variable Interest Entities—PPEA Holding Company LLC for further discussion.
DYNEGY INC. and DYNEGY HOLDINGS INC.
NOTES TO CONSOLIDATED FINANCIAL STATEMENTS—(Continued)
We had approximately $80 million and $286 million of Collateral as of December 31, 2010 and 2009, respectively, included in Broker margin account on our consolidated balance sheets. Substantially all of our derivative positions with our derivative counterparties are supported by letters of credit issued pursuant to our Credit Facility (as defined below), by cash and short-term investment collateral postings or a first priority lien on certain of our assets. We do not consider the letters of credit in our valuation of our derivative liabilities, as they are third-party credit enhancements.
Nonfinancial Assets and Liabilities.
The following tables set forth by level within the fair value hierarchy our fair value measurements with respect to nonfinancial assets and liabilities that are measured at fair value on a nonrecurring basis. These assets and liabilities are classified in their entirety based on the lowest level of input that is significant to the fair value measurement. Our assessment of the significance of a particular input to the fair value measurement requires judgment, and may affect the valuation of fair value assets and liabilities and their placement within the fair value hierarchy levels.
|
Fair Value Measurements as of December 31, 2010
|
||||||||||||||||||||
|
Level 1
|
Level 2
|
Level 3
|
Total
|
Total Losses
|
||||||||||||||||
|
(in millions)
|
||||||||||||||||||||
|
Assets held and used
|
$ | — | $ | — | $ | 275 | $ | 275 | $ | (136 | ) | |||||||||
|
Equity method investment
|
— | — | — | — | (37 | ) | ||||||||||||||
|
Total
|
$ | — | $ | — | $ | 275 | $ | 275 | $ | (173 | ) | |||||||||
During the twelve months ended December 31, 2010, long-lived assets held and used were written down to their fair value of $275 million, resulting in pre-tax impairment charges of $136 million, which is included in Impairment and other charges on our consolidated statements of operations. Please read Note 7—Impairment and Restructuring Charges—2010 Impairment Charges for further discussion.
On January 1, 2010, we recorded an impairment of our investment in PPEA Holding as part of our cumulative effect of a change in accounting principle. We determined the fair value of our investment using assumptions that reflect our best estimate of third party market participants’ considerations based on the facts and circumstances related to our investment at that time. The fair value of our investment on January 1, 2010 is considered a Level 3 measurement as the fair value was determined based on probability weighted cash flows resulting from various alternative scenarios including no change in the financing structure, a restructuring of the project debt and insolvency. These scenarios and the related probability weighting are consistent with the scenarios used at December 31, 2009 in our long-lived asset impairment analysis. At March 31, 2010, we fully impaired our investment in PPEA Holding due to the uncertainty and risk surrounding PPEA’s financing structure. During the period from April 1, 2010 through November 10, 2010, the date we sold our investment in PPEA Holding, we did not recognize our share of losses from our investment in PPEA Holding as we had no further obligation to provide support. Please read Note 7—Impairment and Restructuring Charges—2010 Impairment Charges—Other and Note 15—Variable Interest Entities—PPEA Holding Company, LLC for further discussion.
DYNEGY INC. and DYNEGY HOLDINGS INC.
NOTES TO CONSOLIDATED FINANCIAL STATEMENTS—(Continued)
|
Fair Value Measurements as of December 31, 2009
|
||||||||||||||||||||
|
Level 1
|
Level 2
|
Level 3
|
Total
|
Total Losses
|
||||||||||||||||
|
(in millions)
|
||||||||||||||||||||
|
Assets/Liabilities:
|
||||||||||||||||||||
|
Goodwill
|
$ | — | $ | — | $ | — | $ | — | $ | (433 | ) | |||||||||
|
Assets and liabilities associated with assets related to the LS Power Transactions
|
— | — | — | — | (584 | ) | ||||||||||||||
|
Assets held and used
|
— | — | — | — | (212 | ) | ||||||||||||||
|
Total
|
$ | — | $ | — | $ | — | $ | — | $ | (1,229 | ) | |||||||||
During the first quarter 2009, goodwill with a carrying amount of $433 million was written down to its implied fair value of zero, resulting in an impairment charge of $433 million, which is included in Goodwill impairment on our consolidated statements of operations. Please read Note 16—Goodwill for further discussion and disclosures addressing the description of the inputs and information used to develop the inputs as well as the valuation techniques used to measure the goodwill impairment.
During 2009, long-lived assets held and used were written down to their fair value of zero, resulting in an impairment charge of $212 million, which is included in Impairment and other charges on our consolidated statements of operations. In addition, during the twelve months ended December 31, 2009, net assets/liabilities related to the LS Power Transactions were written down to their fair value of $1,258 million, less costs to sell of $25 million, resulting in an impairment charge of $584 million at September 30, 2009. Of this amount, $326 million is included in Impairment and other charges and $258 million is included in Income (loss) on discontinued operations on our consolidated statements of operations. Please read Note 7—Impairment and Restructuring Charges for further discussion.
Fair Value of Financial Instruments
.
On June 30, 2009, we adopted authoritative guidance which requires the disclosure of the estimated fair value of financial instruments. We have determined the estimated fair-value amounts using available market information and selected valuation methodologies. Considerable judgment is required in interpreting market data to develop the estimates of fair value. The use of different market assumptions or valuation methodologies could have a material effect on the estimated fair value amounts.
The carrying values of financial assets and liabilities (cash, accounts receivable, short-term investments and accounts payable), not presented in the table below, approximate fair values due to the short-term maturities of these instruments. The carrying amounts and fair values of debt are reflected in Note 18—Debt.
|
December 31, 2010
|
December 31, 2009
|
|||||||||||||||
|
Carrying
Amount
|
Fair
Value
|
Carrying
Amount
|
Fair
Value
|
|||||||||||||
|
(in millions)
|
||||||||||||||||
|
Interest rate derivatives designated as fair value accounting hedges (1)
|
$ | 1 | $ | 1 | $ | 2 | $ | 2 | ||||||||
|
Interest rate derivatives not designated as accounting hedges (1)
|
(1 | ) | (1 | ) | (52 | ) | (52 | ) | ||||||||
|
Commodity-based derivative contracts not designated as accounting hedges (1)
|
34 | 34 | 17 | 17 | ||||||||||||
|
Other—DHI (2)
|
175 | 175 | 8 | 8 | ||||||||||||
|
Other—Dynegy (3)
|
16 | 16 | 1 | 1 | ||||||||||||
|
|
(1)
|
Included in both current and non-current assets and liabilities on the consolidated balance sheets.
|
|
|
(2)
|
Other represents short-term investments, including $85 million of short-term investments included in the Broker margin account at December 31, 2010.
|
|
|
(3)
|
Other represents short-term investments at December 31, 2010.
|
DYNEGY INC. and DYNEGY HOLDINGS INC.
NOTES TO CONSOLIDATED FINANCIAL STATEMENTS—(Continued)
Concentration of Credit Risk
.
We sell our energy products and services to customers in the electric and natural gas distribution industries, financial institutions and to entities engaged in industrial businesses. These industry concentrations have the potential to impact our overall exposure to credit risk, either positively or negatively, because the customer base may be similarly affected by changes in economic, industry, weather or other conditions.
At December 31, 2010, our credit exposure as it relates to the mark-to-market portion of our risk management portfolio totaled $50 million. We seek to reduce our credit exposure by executing agreements that permit us to offset receivables, payables and mark-to-market exposure. We attempt to further reduce credit risk with certain counterparties by obtaining third party guarantees or collateral as well as the right of termination in the event of default.
Our Credit Department, based on guidelines approved by the Board of Directors, establishes our counterparty credit limits. Our industry typically operates under negotiated credit lines for physical delivery and financial contracts. Our credit risk system provides current credit exposure to counterparties on a daily basis.
We enter into master netting agreements in an attempt to both mitigate credit exposure and reduce collateral requirements. In general, the agreements include our risk management subsidiaries and allow the aggregation of credit exposure, margin and set-off. As a result, we decrease a potential credit loss arising from a counterparty default.
We include cash collateral deposited with counterparties in Broker margin account and Prepayments and other current assets on our consolidated balance sheets. We include cash collateral due to counterparties in Accrued liabilities and other current liabilities on our consolidated balance sheets.
Accumulated other comprehensive loss, net of tax, is included in Dynegy’s stockholders’ equity and DHI’s stockholder’s equity on the consolidated balance sheets, respectively, as follows:
|
Year Ended December 31,
|
||||||||
|
2010
|
2009
|
|||||||
|
(in millions)
|
||||||||
|
Cash flow hedging activities, net
|
$ | 3 | $ | (24 | ) | |||
|
Unrecognized prior service cost and actuarial loss
|
(56 | ) | (59 | ) | ||||
|
Accumulated other comprehensive loss—unconsolidated investments
|
— | — | ||||||
|
Accumulated other comprehensive loss, net of tax
|
$ | (53 | ) | $ | (83 | ) | ||
|
Less: Accumulated other comprehensive income (loss) attributable to the noncontrolling interests
|
— | 67 | ||||||
|
Accumulated other comprehensive income (loss) attributable to Dynegy Inc, net of tax
|
$ | (53 | ) | $ | (150 | ) | ||
DYNEGY INC. and DYNEGY HOLDINGS INC.
NOTES TO CONSOLIDATED FINANCIAL STATEMENTS—(Continued)
Following are Dynegy’s supplemental disclosures of cash flow and non-cash investing and financing information:
|
Year Ended December 31,
|
||||||||||||
|
2010
|
2009
|
2008
|
||||||||||
|
(in millions)
|
||||||||||||
|
Interest paid (net of amount capitalized)
|
$ | 343 | $ | 400 | $ | 413 | ||||||
|
Taxes paid, net
|
$ | 7 | $ | 4 | $ | 23 | ||||||
|
Other non-cash investing and financing activity:
|
||||||||||||
|
Non-cash capital expenditures (1)
|
$ | 1 | $ | 32 | $ | 57 | ||||||
|
Non-cash capital stock acquisition (2)
|
— | 443 | — | |||||||||
|
|
(1)
|
These expenditures related primarily to our interest in the Plum Point Project for the years ended December 31, 2009 and 2008 and capital expenditures related to the Midwest Consent Decree for all years presented. Please read Note 15—Variable Interest Entities—PPEA Holding Company LLC for further discussion of our interest in the Plum Point Project and Note 22—Commitment and Contingencies for further discussion of the Midwest Consent Decree.
|
|
|
(2)
|
Represents the reacquisition of 245 million shares of Dynegy’s Class B common stock valued at $1.81 per share (before giving effect to the reverse stock split of outstanding common stock at a reverse ratio of 1-for-5 completed on May 25, 2010). Please read Note 4—Dispositions Contract Terminations and Discontinued Operations—Dispositions—LS Power Transactions for further discussion.
|
Following are DHI’s supplemental disclosures of cash flow and non-cash investing and financing information:
|
Year Ended December 31,
|
||||||||||||
|
2010
|
2009
|
2008
|
||||||||||
|
(in millions)
|
||||||||||||
|
Interest paid (net of amount capitalized)
|
$ | 343 | $ | 400 | $ | 413 | ||||||
|
Taxes paid, net
|
$ | 4 | $ | 2 | $ | 18 | ||||||
|
Other non-cash investing and financing activity:
|
||||||||||||
|
Non-cash capital expenditures (1)
|
$ | 1 | $ | 32 | $ | 57 | ||||||
|
Contribution of intangible asset from Dynegy to DHI (2)
|
— | 36 | — | |||||||||
|
Other affiliate activity with Dynegy (3)
|
(37 | ) | (48 | ) | — | |||||||
|
|
(1)
|
These expenditures related primarily to our interest in the Plum Point Project for the years ended December 31, 2009 and 2008 and capital expenditures related to the Midwest Consent Decree for all years presented. Please read Note 15—Variable Interest Entities—PPEA Holding Company LLC for further discussion of our interest in the Plum Point Project and Note 22—Commitment and Contingencies for further discussion of the Midwest Consent Decree.
|
|
|
(2)
|
In January 2009, Dynegy contributed to DHI its interest in certain intangible assets which Dynegy received upon the dissolution of DLS Power Holdings and DLS Power Development. This contribution was accounted for as a transaction between entities under common control and as such, the intangible was transferred at historical cost. Please read Note 17—Intangible Assets—LS Power for further information.
|
|
|
(3)
|
Represents transactions with Dynegy in the normal course of business, primarily the reallocation of deferred taxes between legal entities in accordance with applicable IRS regulations.
|
DYNEGY INC. and DYNEGY HOLDINGS INC.
NOTES TO CONSOLIDATED FINANCIAL STATEMENTS—(Continued)
Please read Note 19—Related Party Transactions for a discussion of the change in DHI’s affiliate receivable.
A summary of our inventories is as follows:
|
December 31,
|
||||||||
|
2010
|
2009
|
|||||||
|
(in millions)
|
||||||||
|
Materials and supplies
|
$ | 64 | $ | 61 | ||||
|
Coal
|
47 | 52 | ||||||
|
Fuel oil
|
8 | 23 | ||||||
|
Emissions allowances
|
2 | 5 | ||||||
| $ | 121 | $ | 141 | |||||
During the twelve months ended December 31, 2010 and 2009, we recorded lower of cost or market adjustments of $3 million and $18 million, respectively. These charges are included in Cost of sales on our consolidated statements of operations.
A summary of our property, plant and equipment is as follows:
|
December 31,
|
||||||||
|
2010
|
2009
|
|||||||
|
(in millions)
|
||||||||
|
Generation assets:
|
||||||||
|
GEN–MW
|
$ | 5,891 | $ | 6,334 | ||||
|
GEN–WE
|
1,475 | 1,505 | ||||||
|
GEN–NE
|
1,113 | 1,111 | ||||||
|
IT systems and other
|
114 | 121 | ||||||
| 8,593 | 9,071 | |||||||
|
Accumulated depreciation
|
(2,320 | ) | (1,954 | ) | ||||
| $ | 6,273 | $ | 7,117 | |||||
As of December 31, 2009, our property, plant and equipment balance for GEN-MW included $611 million related to PPEA Holding. On January 1, 2010, we adopted ASU No. 2009-17 which resulted in a deconsolidation of our investment in PPEA Holding. Please read Note 2—Summary of Significant Accounting Policies—Accounting Principles Adopted—Variable Interest Entities for further discussion. Interest capitalized related to costs of construction projects in process totaled $15 million, $24 million and $23 million for the years ended December 31, 2010, 2009 and 2008, respectively.
Equity Method Investments.
Equity method investments consist of investments in affiliates that we do not control, but where we have significant influence over operations.
Cash distributions received from our equity investments during 2010, 2009 and 2008 were zero, $2 million and $16 million, respectively. Undistributed earnings from our equity investments included in accumulated deficit at December 31, 2010, 2009 and 2008 totaled zero, zero, and $101 million, respectively.
DYNEGY INC. and DYNEGY HOLDINGS INC.
NOTES TO CONSOLIDATED FINANCIAL STATEMENTS—(Continued)
Black Mountain.
We hold a 50 percent ownership interest in Black Mountain, an 85 MW power generation facility in Las Vegas, Nevada. During the twelve months ended December 31, 2010, 2009 and 2008, we recorded impairment charges of zero, zero and $1 million, respectively, related to our 50 percent interest in Black Mountain. These charges are the result of declines in value of the investment caused by an increase in the cost of fuel in relation to a third party power purchase agreement through 2023 for 100 percent of the output of the facility. This agreement provides that Black Mountain will receive payments that decrease over time.
PPEA Holding Company LLC.
Until the sale of our interest on November 10, 2010, we owned an approximate 37 percent interest in PPEA Holding, which through PPEA, its wholly-owned subsidiary, owns an approximate 57 percent undivided interest in the Plum Point Project. On January 1, 2010, we adopted ASU No. 2009-17. The adoption of ASU No. 2009-17 resulted in a deconsolidation of our investment in PPEA Holding which was accounted for as an equity method investment until we sold our interest on November 10, 2010. We made a contribution of $15 million during the year ended December 31, 2010 due to a contractual obligation. Please read Note 15—Variable Interest Entities—PPEA Holding Company LLC for further discussion.
Due to the uncertainty and risk surrounding PPEA’s financing structure as a result of events that occurred in early 2010, we concluded that there was an other-than-temporary impairment of our investment in PPEA Holding and fully impaired our equity investment at March 31, 2010. As a result, we recorded an impairment charge of approximately $37 million, which is included in Losses from unconsolidated investments in our consolidated statements of operations. The impairment was a Level 3 non-recurring fair value measurement and reflected our best estimate of third party market participants’ considerations including probabilities related to restructuring of the project debt and potential insolvency. Please read Note 9—Fair Value Measurements for further discussion.
On November 10, 2010, we completed the sale of our interest in PPEA Holding to one of the other investors in PPEA Holding. We recognized a loss of approximately $28 million on the sale, which is included in Losses from unconsolidated investments in our consolidated statements of operations. This loss represents $28 million of losses related to interest rate swaps that were previously deferred in Accumulated other comprehensive loss.
Sandy Creek Project.
On November 30, 2009, we sold our interests in SCH and SC Services to LS Power. We recorded a loss of $84 million on the sale. Please read Note 4—Dispositions Contract Terminations and Discontinued Operations—Dispositions—LS Power Transactions for further discussion.
DLS Power Development.
Dynegy previously held a 50 percent ownership interest in DLS Power Holdings and DLS Power Development LLC. The purpose of DLS Power Development was to provide services to DLS Power Holdings and the project subsidiaries related to power project development and to evaluate and pursue potential new development projects. Effective January 1, 2009, Dynegy entered into an agreement with LS Power Associates, L.P. to dissolve DLS Power Holdings and DLS Power Development LLC. Under the terms of the dissolution, Dynegy acquired exclusive rights, ownership and developmental control of substantially all repowering or expansion opportunities related to its existing portfolio of operating assets. In the first quarter 2009, Dynegy subsequently contributed these assets to DHI. LS Power received approximately $19 million in cash from Dynegy on January 2, 2009, and acquired full ownership and developmental rights associated with various “greenfield” power generation and transmission development projects not related to Dynegy’s existing operating portfolio of assets. Please read Note 15—Variable Interest Entities—DLS Power Holdings and DLS Power Development for further information.
DYNEGY INC. and DYNEGY HOLDINGS INC.
NOTES TO CONSOLIDATED FINANCIAL STATEMENTS—(Continued)
Summarized Information.
Summarized aggregate financial information for our previous unconsolidated equity investments in SCH and Sandy Creek Services and its equity share thereof was:
|
December 31,
|
||||||||||||||||
|
2009
|
2008
|
|||||||||||||||
|
Total
|
Equity Share
|
Total
|
Equity Share
|
|||||||||||||
|
(in millions)
|
||||||||||||||||
|
Current assets
|
$ | — | $ | — | $ | 10 | $ | 5 | ||||||||
|
Non-current assets
|
— | — | 384 | 192 | ||||||||||||
|
Current liabilities
|
— | — | 36 | 18 | ||||||||||||
|
Non-current liabilities
|
— | — | 536 | 268 | ||||||||||||
|
Revenues
|
2 | 1 | 2 | 1 | ||||||||||||
|
Operating income
|
1 | — | 38 | 19 | ||||||||||||
|
Net income (loss)
|
15 | 7 | (79 | ) | (40 | ) | ||||||||||
Summarized aggregate financial information for Dynegy’s previous unconsolidated equity investment in DLS Power Holdings and Dynegy’s equity share thereof was:
|
December 31,
|
||||||||||||||||
|
2009
|
2008
|
|||||||||||||||
|
Total
|
Equity Share
|
Total
|
Equity Share
|
|||||||||||||
|
(in millions)
|
||||||||||||||||
|
Current assets
|
$ | — | $ | — | $ | 4 | $ | 2 | ||||||||
|
Non-current assets
|
— | — | 10 | 5 | ||||||||||||
|
Current liabilities
|
— | — | 4 | 2 | ||||||||||||
|
Non-current liabilities
|
— | — | 2 | 1 | ||||||||||||
|
Revenues
|
— | — | — | — | ||||||||||||
|
Operating loss
|
2 | 1 | (23 | ) | (12 | ) | ||||||||||
|
Net income (loss)
|
2 | 1 | (23 | ) | (12 | ) | ||||||||||
Losses from unconsolidated investments for the year ended December 31, 2010 were $62 million for both Dynegy and DHI, which includes an impairment loss of $37 million, and a loss on the sale of $28 million. These charges were partially offset by equity earnings of $3 million, comprised primarily of mark-to-market gains related to PPEA’s interest rate swaps, partly offset by financing expenses. From April 1, 2010 through November 10, 2010, we did not recognize our share of losses from our investment in PPEA Holding as our investment in PPEA Holding was valued at zero at March 31, 2010, and we did not have an obligation to provide further financial support. Please read Note 15—Variable Interest Entities for further discussion.
Losses from unconsolidated investments for the year ended December 31, 2009 were $71 million and $72 million for Dynegy and DHI, respectively, which includes $73 million from SCH offset by income of $1 million from Sandy Creek Services. Dynegy also recorded earnings of $1 million from DLS Power Holdings. In addition to the $7 million noted above, Dynegy’s losses of $73 million from its investment in SCH include a $84 million loss on sale of unconsolidated investment offset by the elimination of $4 million in commitment fees payable to Dynegy that was expensed by SCH. The loss on the sale includes the recognition of $40 million of losses on interest rate swaps that were previously deferred in Accumulated other comprehensive loss on our consolidated balance sheets. Please read Note 15—Variable Interest Entities for further discussion.
Losses from unconsolidated investments for the year ended December 31, 2008 were $123 million and $40 million for Dynegy and DHI, respectively, which includes $41 million from SCH offset by income of $1 million from Sandy Creek Services. Dynegy also recorded losses of $83 million from DLS Power Holdings. In addition to the $12 million noted above, Dynegy’s losses of $83 million from its investment in DLS Power Holdings include a $24 million impairment and a $47 million loss on dissolution. Please read Note 15—Variable Interest Entities for further discussion.
DYNEGY INC. and DYNEGY HOLDINGS INC.
NOTES TO CONSOLIDATED FINANCIAL STATEMENTS—(Continued)
Available-for-Sale Securities.
As of December 31, 2009, Dynegy and DHI had approximately $9 million and $8 million, respectively, invested in the Reserve Primary Fund (the “Fund”), which “broke the buck” on September 16, 2008, when the value of its shares fell below $1.00. On September 22, 2008, the SEC granted the Fund’s request to suspend all rights of redemption from the Fund, in order to ensure an orderly disposition of the securities. Since distributions from the Fund were suspended on September 30, 2008, investments in the Fund were no longer readily convertible to cash, and therefore did not meet the definition of “cash and cash equivalents”. As a result, we reclassified our investment in the Fund from cash and cash equivalents to short-term investments as of December 31, 2008 and recorded a $2 million impairment, based on management’s estimate of the fair value of our proportionate share of the Fund’s holdings, which is included in Other income and expense, net, in our consolidated statements of operations. This investment was classified as a current asset at December 31, 2009 and the remaining cash held by the Fund was distributed in January 2010.
In November 2006, the New York Mercantile Exchange (“NYMEX”) completed its initial public offering. We had two membership seats on the NYMEX, and therefore, we received 90,000 NYMEX shares for each membership seat. During August 2007, we sold approximately 30,000 shares for approximately $4 million, and we recognized a gain of $4 million. During the second quarter 2008, we sold our remaining 150,000 shares and both of our membership seats for approximately $16 million, and we recognized a gain of $15 million, which is included in Gain on sale of assets in our consolidated statements of operations; partially offset by a reduction of $8 million, net of tax of $5 million, in our consolidated statements of other comprehensive income.
Hydroelectric Generation Facilities
. On January 31, 2005, Dynegy completed the acquisition of ExRes, the parent company of Sithe Energies, Inc. On April 2, 2007, Dynegy contributed its interest in the Sithe Assets to DHI. ExRes also owned through its subsidiaries four hydroelectric generation facilities in Pennsylvania. The entities owning these facilities meet the definition of VIEs. In accordance with the purchase agreement, Exelon Corporation (“Exelon”) had the sole and exclusive right to direct our efforts to decommission, sell, or otherwise dispose of the hydroelectric facilities owned through the VIEs. Exelon is obligated to reimburse us for all costs, liabilities, and obligations of the entities owning these hydroelectric generation facilities, and to indemnify us with respect to the past and present assets and operations of the entities. As a result, we are not the primary beneficiary of the entities and have not consolidated them. During December 2009, we sold two of these facilities and we sold the remaining two units during the third quarter 2010 to a third party as directed by Exelon. We did not record a gain or loss upon completion of the transactions as we did not consolidate these entities and we have no continuing involvement in these entities.
PPEA Holding Company LLC.
Until the sale of our interest on November 10, 2010, we owned an approximate 37 percent interest in PPEA Holding, which through PPEA, its wholly-owned subsidiary, owns an approximate 57 percent undivided interest in the Plum Point Project. On September 1, 2010, the Plum Point Power Station commenced commercial operation. PPEA financed its share of construction costs through debt financing. Our obligation to PPEA Holding was limited to our funding commitment of approximately $15 million, which was paid in May 2010. On November 10, 2010, we completed the sale of our interest in PPEA Holding to one of the other investors in PPEA Holding. We recognized a loss of $28 million on the sale, which is included in Losses from unconsolidated investments in our consolidated statements of operations. This loss represents $28 million of losses reclassified from Accumulated other comprehensive loss.
Due to the uncertainty and risk surrounding PPEA’s financing structure as a result of events that occurred in early 2010, we concluded that there was an other-than-temporary impairment of our investment in PPEA Holding and fully impaired our equity investment at March 31, 2010. As a result, we recorded an impairment charge of approximately $37 million, which is included in Losses from unconsolidated investments in our consolidated statements of operations. The impairment is a Level 3 non-recurring fair value measurement and reflects our best estimate of third party market participants’ considerations including probabilities related to restructuring of the project debt and potential insolvency. Please read Note 9—Fair Value Measurements for further discussion.
DYNEGY INC. and DYNEGY HOLDINGS INC.
NOTES TO CONSOLIDATED FINANCIAL STATEMENTS—(Continued)
On January 1, 2010, we adopted ASU No. 2009-17. As a result of applying this guidance, we determined that we were not the primary beneficiary of PPEA Holding Company, LLC (“PPEA Holding”) because we lacked the power to direct the activities that most significantly impact PPEA Holding’s economic performance. The activities that most significantly impacted PPEA Holding’s economic performance were changes to the costs to construct and operate the facility, modifications to the off-take agreements, and/or changes in the financing structure. As PPEA Holding’s LLC Agreement required that those activities be approved by all members, the power to direct those activities was shared with the other owners of PPEA Holding and the participants in the 665 MW coal-fired power generation facility (the “Plum Point Project”). Prior to January 1, 2010, we consolidated PPEA Holding in our consolidated financial statements.
The adoption of ASU No. 2009-17 resulted in a deconsolidation of our investment in PPEA Holding, which resulted in the cumulative effect of a change in accounting principle of approximately $41 million ($25 million after tax). This was recorded as an increase in Accumulated deficit on our consolidated balance sheets as of January 1, 2010. This pre-tax charge reflected the difference in the assets, liabilities and equity (including Other comprehensive loss) that we historically included in our consolidated balance sheets and the carrying value of the equity investment and related accumulated other comprehensive loss that we would have recorded had we accounted for our investment in PPEA Holding as an equity method investment since April 2, 2007, the date we acquired an interest in PPEA Holding. On January 1, 2010, we recorded an equity investment of approximately $19 million and accumulated other comprehensive loss of approximately $29 million ($17 million after tax). The $19 million equity investment balance at January 1, 2010 reflected the fair value of our investment at that date, after an other than temporary pre-tax impairment charge of approximately $32 million that would have been recorded in 2009 had we accounted for our investment in PPEA Holding as an equity investment at that time. Our assessment of the fair value of our investment in PPEA Holding at January 1, 2010 reflected the risk associated with PPEA Holding’s financing arrangement at that date. Please read Note 9—Fair Value Measurements for further discussion about the assumptions used to determine the fair value of our investment as of January 1, 2010. Summarized aggregate financial information for PPEA Holding, included in our consolidated financial statements as of and for the twelve months ending December 31, 2009, is included below (in millions):
|
As of:
|
||||
|
Current assets
|
$ | 6 | ||
|
Property, plant and equipment, net
|
611 | |||
|
Intangible asset
|
190 | |||
|
Other non-current asset
|
20 | |||
|
Total assets
|
827 | |||
|
Current portion of long-term debt
|
744 | |||
|
Current liabilities
|
74 | |||
|
Long-term debt
|
— | |||
|
Non-current liabilities
|
— | |||
|
Noncontrolling interest
|
77 | |||
|
Accumulated other comprehensive loss
|
(157 | ) | ||
|
For the period ending:
|
||||
|
Operating loss
|
(1 | ) | ||
|
Net loss
|
(7 | ) | ||
DLS Power Holdings and DLS Power Development.
On April 2, 2007, in connection with the LS Power Merger, Dynegy acquired a 50 percent interest in DLS Power Holdings and DLS Power Development. These entities were dissolved effective January 1, 2009. DLS Power Holdings and DLS Power Development met the definition of VIEs, as they required additional subordinated financial support from their owners to conduct normal on-going operations. Dynegy determined that it was not the primary beneficiary of the entities because LS Power, a related party, was more closely associated with the entities as they were the managing partner of the entities, owned approximately 40 percent of Dynegy’s outstanding common stock and had three seats on Dynegy’s Board of Directors. Therefore, Dynegy did not consolidate the entities.
DYNEGY INC. and DYNEGY HOLDINGS INC.
NOTES TO CONSOLIDATED FINANCIAL STATEMENTS—(Continued)
Prior to dissolution of the entities, Dynegy accounted for its investments in DLS Power Holdings and DLS Power Development as equity method investments. Dynegy made contributions to the joint ventures of approximately $16 million during the year ended December 31, 2008 to fund its share of the entities’ development efforts.
In December 2008, Dynegy executed an agreement with LS Power to dissolve DLS Power Holdings and DLS Power Development effective January 1, 2009. Under the terms of the dissolution, Dynegy acquired exclusive rights, ownership and developmental control of all repowering or expansion opportunities related to its existing portfolio of operating assets. LS Power received approximately $19 million in cash from Dynegy on January 2, 2009, and acquired full ownership and developmental rights associated with various “greenfield” projects under consideration in Arkansas, Georgia, Iowa, Michigan and Nevada, as well as other power generation and transmission development projects not related to Dynegy’s existing operating portfolio of assets.
For the year ended December 31, 2008, Dynegy recorded losses related to its equity investment of approximately $83 million. These losses consisted of a $24 million impairment charge, a $47 million loss on the dissolution and $12 million of equity losses. The impairment charge is the result of a decline in the fair value of the development projects during the fourth quarter 2008 as a result of increasing barriers to the development and construction of new generation facilities, including credit and regulatory factors. The loss on the dissolution primarily relates to consideration paid related to the following items which have value to Dynegy, but which do not qualify as assets for accounting purposes: (i) exclusive rights to the potential expansion of its existing facilities; (ii) redirection of management time and resources to other projects; (iii) the allocation to Dynegy of full access and control over current and future expansion opportunities; and (iv) enhancement of Dynegy’s strategic flexibility. These losses are included in Losses from unconsolidated investments in Dynegy’s consolidated statements of operations.
Sandy Creek Project.
In connection with its acquisition of a 50 percent interest in DLS Power Holdings, as further discussed above, Dynegy acquired a 50 percent interest in SCH, which owns all of SCEA. SCEA owns an undivided interest in the Sandy Creek Project. In August 2007, SCH became a stand-alone entity separate from DLS Power Holdings, and its wholly owned subsidiaries, including SCEA, entered into various financing agreements to construct its portion of the Sandy Creek Project.
Dynegy Sandy Creek Holdings, LLC, an indirectly wholly owned subsidiary of Dynegy, and LSP Sandy Creek Member, LLC each owned a 50 percent interest in SCH. In addition, Sandy Creek Services, LLC (“SC Services”) was formed to provide services to SCH. Dynegy Power Services and LSP Sandy Creek Services LLC each owned a 50 percent interest in SC Services.
Dynegy’s 50 percent interest in SCH, as well as a related intangible asset of approximately $23 million, were subsequently contributed to a wholly owned subsidiary of DHI. This contribution was accounted for as a transaction between entities under common control. As such, DHI’s investment in SCH, as well as the related intangible asset, were recorded by DHI at Dynegy’s historical cost on the acquisition date. DHI’s investment in SCH is included in GEN-WE.
On November 30, 2009, we sold our interests in SCH and SC Services to LS Power. We recorded a loss of $84 million on the sale of these investments in the fourth quarter of 2009. Please read Note 4—Dispositions Contract Terminations and Discontinued Operations—Dispositions—LS Power Transactions for further discussion.
DYNEGY INC. and DYNEGY HOLDINGS INC.
NOTES TO CONSOLIDATED FINANCIAL STATEMENTS—(Continued)
Assets and liabilities of companies acquired in purchase transactions are recorded at fair value at the date of acquisition. Goodwill represents the excess purchase price over the fair value of net assets acquired, plus any identifiable intangibles. We review goodwill for potential impairment as of November 1st of each year or more frequently if events or circumstances occur that would more likely than not reduce the fair value of a reporting unit below its carrying amount. During the first quarter 2009, there were several events and circumstances which, when considered in the aggregate, indicated such a reduction in the fair value of our GEN-MW, GEN-WE and GEN-NE reporting units:
|
|
●
|
The first quarter 2009 was characterized by a steep decline in forward commodity prices. Forward market prices for natural gas decreased by 27 percent and 17 percent, respectively, for the calendar years 2009 and 2010, significantly impacting the current market and corresponding forward market prices for power;
|
|
|
●
|
During the first quarter 2009, acquisition activity related to power generation facilities was very low, indicating a lack of demand for such transactions;
|
|
|
●
|
Dynegy’s market capitalization continued to decline through the first quarter 2009, with Dynegy’s stock price falling from an average of $12.55 (as adjusted for the 1-for-5 reverse stock split of Dynegy’s common stock that became effective on May 25, 2010) per share in the fourth quarter 2008 to an average of $8.65 per share (as adjusted for the 1-for-5 reverse stock split of Dynegy’s common stock that became effective on May 25, 2010) in the first quarter 2009 and a closing price of $7.05 at March 31, 2009 (as adjusted for the 1-for-5 reverse stock split of Dynegy’s common stock that became effective on May 25, 2010); and
|
|
|
●
|
General economic indicators, such as economic growth forecasts and unemployment forecasts, deteriorated further during the first quarter 2009.
|
Considered individually, none of the foregoing events and circumstances would necessarily indicate a significant reduction in the fair value of our reporting units. However, in light of the significant drop in forward power prices during the first quarter 2009 and the further deterioration in general economic indicators, it was deemed unlikely that Dynegy’s market capitalization would exceed its book equity in the near future. As a result, we concluded that an impairment test of our goodwill on our GEN-MW, GEN-WE and GEN-NE reporting units was required as of March 31, 2009.
The impairment test is performed in two steps at the reporting unit level. The first step compares the fair value of the reporting unit with its carrying amount, including goodwill. If the fair value of the reporting unit is higher than its carrying amount, no impairment of goodwill is indicated and no further testing is required. However, if the fair value of the reporting unit is below its carrying amount, a second step must be performed to determine the goodwill impairment required, if any.
Consistent with historical practice, on November 1, 2008, we determined the fair value of our reporting units using the income approach based on a discounted cash flows model. This approach used forward-looking projections of our estimated future operating results based on discrete financial forecasts developed by management for planning purposes. Cash flows beyond the discrete forecasts were estimated using a terminal value calculation, which incorporated historical and forecasted financial trends and considered long-term earnings growth rates based on growth rates observed in the power sector. In performing our impairment test at November 1, 2008, the results of our fair value assessment using the income approach were corroborated using market information about recent sales transactions for comparable assets within the regions in which we operate.
Due to further declines in our market capitalization through December 31, 2008, we determined that assumptions utilized in the November 1, 2008 analysis required updating. We evaluated key assumptions including forward natural gas and power pricing, power demand growth, and cost of capital. While some of the assumptions had changed subsequent to the November 1, 2008 analysis, we determined that the impact of updating those assumptions would not have caused the fair value of the individual reporting units to be below their respective carrying values at December 31, 2008.
DYNEGY INC. and DYNEGY HOLDINGS INC.
NOTES TO CONSOLIDATED FINANCIAL STATEMENTS—(Continued)
As a result of the events and circumstances discussed above, as of March 31, 2009, we updated our fair value assessment using the income approach, taking into account the significant drop in forward prices we observed over the three months ended March 31, 2009. As our long-term outlook on power demand remained unchanged, we did not change our expectations regarding commodity prices beyond 2011 for purposes of this analysis. Additionally, we updated the weighted average cost of capital assumptions used in our income approach to reflect current market data as of March 31, 2009.
Based on the decline in acquisition activity during the first quarter 2009 and the length of time from the most recent asset sales transactions we used to corroborate the results of our income approach valuation in November 2008, we were not able to rely fully on recent sales transactions to corroborate the results of our fair value assessment using the income approach in March 2009. Therefore, for our first quarter 2009 analysis, we also used a market-based approach, comparing our forecasted earnings and Dynegy’s market capitalization to those of similarly situated public companies by considering multiples of earnings.
For each of the reporting units included in our analysis, fair value assessed using the income approach exceeded the fair value assessed using this market-based approach. However, given that Dynegy’s market capitalization had continued to remain below its book equity for more than nine months and given the absence of recent asset sales transaction activity to reasonably corroborate the results of our income approach valuation, we determined that there had been a shift in the manner in which market participants were valuing our business, and believed that the market-based approach had become more relevant for estimating the fair value of our reporting units as of March 31, 2009. We therefore concluded that it was appropriate to place equal weight on the market-based approach (rather than relying primarily on the income approach) for the purpose of determining fair value in step one of the impairment analysis. Based on the results of our analysis discussed above, our GEN-MW, GEN-WE and GEN-NE reporting units did not pass the first step as of March 31, 2009.
Having determined that the carrying values of the GEN-MW, GEN-WE and GEN-NE reporting units exceeded their fair values, we performed the second step of the analysis. This second step compared the implied fair value of each reporting unit’s goodwill with the carrying amount of such goodwill. We performed a hypothetical allocation of the fair value of the reporting units determined in step one to all of the assets and liabilities of the unit, including any unrecognized intangible assets. After making these hypothetical allocations, we determined no residual value remained that could be allocated to goodwill within each of our GEN-MW, GEN-WE or GEN-NE segments. We recorded first quarter 2009 impairment charges on all three of these reporting units, as follows:
Changes in the carrying amount of goodwill during the years ended December 31, 2009 and 2008 were as follows:
|
GEN-MW
|
GEN-WE
|
GEN-NE
|
Total
|
|||||||||||||
|
(in millions)
|
||||||||||||||||
|
December 31, 2007
|
$ | 81 | $ | 260 | $ | 97 | $ | 438 | ||||||||
|
Sale of Rolling Hills
|
(5 | ) | — | — | (5 | ) | ||||||||||
|
December 31, 2008
|
$ | 76 | $ | 260 | $ | 97 | $ | 433 | ||||||||
|
Impairment of goodwill
|
(76 | ) | (260 | ) | (97 | ) | (433 | ) | ||||||||
|
December 31, 2009
|
$ | — | $ | — | $ | — | $ | — | ||||||||
DYNEGY INC. and DYNEGY HOLDINGS INC.
NOTES TO CONSOLIDATED FINANCIAL STATEMENTS—(Continued)
A summary of changes in our intangible assets is as follows:
|
LS Power
|
Sithe
|
Rocky Road
|
Total
|
|||||||||||||
|
(in millions)
|
||||||||||||||||
|
December 31, 2007
|
$ | 216 | $ | 333 | $ | 13 | $ | 562 | ||||||||
|
Amortization expense
|
(7 | ) | (49 | ) | (9 | ) | (65 | ) | ||||||||
|
December 31, 2008
|
$ | 209 | $ | 284 | $ | 4 | $ | 497 | ||||||||
|
Additions (1)
|
15 | — | — | 15 | ||||||||||||
|
Impairments (2)
|
(5 | ) | — | — | (5 | ) | ||||||||||
|
LS Power Transactions (3)
|
(5 | ) | — | — | (5 | ) | ||||||||||
|
Amortization expense
|
(11 | ) | (49 | ) | (4 | ) | (64 | ) | ||||||||
|
December 31, 2009
|
$ | 203 | $ | 235 | $ | — | $ | 438 | ||||||||
|
Plum Point Deconsolidation (4)
|
(193 | ) | — | — | (193 | ) | ||||||||||
|
Amortization expense
|
(7 | ) | (49 | ) | — | (56 | ) | |||||||||
|
December 31, 2010
|
$ | 3 | $ | 186 | $ | — | $ | 189 | ||||||||
|
|
(1)
|
Represents certain intangible assets we retained upon the dissolution of DLS Power Holdings and DLS Power Development partnerships. Please read Note 15—Variable Interest Entities—DLS Power Holdings and DLS Power Development for further discussion of the dissolution.
|
|
|
(2)
|
Represents the impairment of an intangible asset at our Bridgeport power generation facility.
|
|
|
(3)
|
Represents the sale of certain intangibles to LS Power in November 2009. Please read Note 4—Dispositions, Contract Terminations and Discontinued Operations—Dispositions—LS Power Transactions for further discussion of the LS Power Transactions.
|
|
|
(4)
|
On January 1, 2010, we adopted ASU No. 2009-17 which resulted in a deconsolidation of our investment in PPEA Holding. Please read
|
LS Power.
In April 2007, in connection with the purchase of certain power generation facilities and related contracts from LS Power, we recorded intangible assets of $224 million. This consisted of intangible assets of $192 million in GEN-MW and $32 million in GEN-WE. The intangible asset in GEN-MW related to the value of PPEA’s interest in the Plum Point Project as a result of the construction contracts, debt agreements and related power purchase agreements. This balance was subsequently deconsolidated on January 1, 2010. The intangible asset for GEN-WE primarily related to power tolling agreements that were amortized over their respective contract terms of 6 months to 7 years. The amortization expense is being recognized in Revenue in our consolidated statements of operations where we record the revenues received from the contract. The estimated amortization expense for the next five succeeding years is less than $1 million.
Sithe.
Pursuant to our acquisition of Sithe Energies in February 2005, we recorded intangible assets of $657 million. This consisted primarily of a $488 million intangible asset related to a firm capacity sales agreement between Sithe Independence Power Partners and Con Edison, a subsidiary of Consolidated Edison, Inc. That contract provides Independence the right to sell 740 MW of capacity until 2014 at fixed prices that are currently above the prevailing market price of capacity for the New York Rest of State market. This asset will be amortized on a straight-line basis over the remaining life of the contract through October 2014. The amortization expense is being recognized in Revenue in our consolidated statements of operations where we record the revenues received from the contract. The annual amortization of the intangible asset is expected to approximate $50 million.
Rocky Road.
Pursuant to our acquisition of NRG’s 50 percent ownership interest in the Rocky Road power plant, we recorded an intangible asset in the amount of $29 million. The amortization expense associated with this asset was recognized in Revenue in our consolidated statements of operations where we record the revenues received from the contract. This asset was fully amortized in 2009.
DYNEGY INC. and DYNEGY HOLDINGS INC.
NOTES TO CONSOLIDATED FINANCIAL STATEMENTS—(Continued)
A summary of our long-term debt is as follows:
|
December 31,
|
||||||||||||||||
|
2010
|
2009
|
|||||||||||||||
|
Carrying
Amount
|
Fair
Value
|
Carrying
Amount
|
Fair
Value
|
|||||||||||||
|
(in millions)
|
||||||||||||||||
|
Term Loan B, due 2013
|
$ | 68 | $ | 67 | $ | 68 | $ | 66 | ||||||||
|
Term Facility, floating rate due 2013
|
850 | 845 | 850 | 814 | ||||||||||||
|
Senior Notes and Debentures:
|
||||||||||||||||
|
6.875 percent due 2011
|
80 | 79 | 81 | 82 | ||||||||||||
|
8.75 percent due 2012
|
89 | 87 | 89 | 92 | ||||||||||||
|
7.5 percent due 2015
|
785 | 592 | 785 | 737 | ||||||||||||
|
8.375 percent due 2016
|
1,047 | 777 | 1,047 | 998 | ||||||||||||
|
7.125 percent due 2018
|
172 | 116 | 172 | 140 | ||||||||||||
|
7.75 percent due 2019
|
1,100 | 728 | 1,100 | 950 | ||||||||||||
|
7.625 percent due 2026
|
171 | 107 | 171 | 119 | ||||||||||||
|
Subordinated Debentures payable to affiliates, 8.316 percent, due 2027
|
200 | 83 | 200 | 107 | ||||||||||||
|
Sithe Senior Notes, 9.0 percent due 2013
|
225 | 233 | 287 | 294 | ||||||||||||
|
PPEA Credit Agreement Facility, floating rate due 2010 (1)
|
— | — | 644 | 334 | ||||||||||||
|
PPEA Tax Exempt Bonds, floating rate due 2036 (1)
|
— | — | 100 | 100 | ||||||||||||
| 4,787 | 5,594 | |||||||||||||||
|
Unamortized premium (discount) on debt, net
|
(13 | ) | (12 | ) | ||||||||||||
| 4,774 | 5,582 | |||||||||||||||
|
Less: Amounts due within one year, including non-cash amortization of basis adjustments (2)
|
148 | 807 | ||||||||||||||
|
Total Long-Term Debt
|
$ | 4,626 | $ | 4,775 | ||||||||||||
|
|
(1)
|
On January 1, 2010, we adopted ASU No. 2009-17 which resulted in a deconsolidation of our investment in PPEA Holding, which was subsequently sold on November 10, 2010. Please read Note 2—Summary of Significant Accounting Policies—Accounting Principles Adopted—Variable Interest Entities for further discussion.
|
|
|
(2)
|
Includes $744 million of PPEA’s non-recourse project financing as of December 31, 2009.
|
Aggregate maturities of the principal amounts of all long-term indebtedness as of December 31, 2010 are as follows: 2012—$164 million, 2013—$1,002 million, 2014—zero, 2015—$772 million and thereafter—$2,688 million.
Credit Facility (Including Term Loan B and Term Facility)
On April 2, 2007, we entered into the “Credit Facility with Citicorp USA, Inc. and JPMorgan Chase Bank, N.A., as co-administrative agents, JPMorgan Chase Bank, N.A., as collateral agent, Citicorp USA Inc., as payment agent, J.P. Morgan Securities Inc. and Citigroup Global Markets Inc., as joint lead arrangers and joint book-runners, and the other financial institutions party thereto as lenders or letter of credit issuers.
On May 24, 2007, September 30, 2008, February 13, 2009 and August 5, 2009, we entered into amendments to the Credit Facility. The discussion below reflects the impact of all such amendments.
The Credit Facility, as amended, currently consists of a $1.08 billion revolving credit facility (the “Revolving Facility”), an $850 million term letter of credit facility (the “Term L/C Facility”) and a $68 million senior secured term loan facility (“Term Loan B”). Loans and letters of credit are available under the Revolving Facility and letters of credit are available under the Term L/C Facility for general corporate purposes.
DYNEGY INC. and DYNEGY HOLDINGS INC.
NOTES TO CONSOLIDATED FINANCIAL STATEMENTS—(Continued)
The Revolving Facility matures on April 2, 2012, and the Term L/C Facility and Term Loan B each mature on April 2, 2013. The principal amount of the Term L/C Facility is due in a single payment at maturity; the principal amount of Term Loan B is due in quarterly installments of $175,000 in arrears commencing December 31, 2007, with the unpaid balance due at maturity.
The Credit Facility, as amended, is secured by certain assets of DHI and is guaranteed by Dynegy, Dynegy Illinois and certain subsidiaries of DHI. In addition, the obligations under the Credit Facility, as amended, and certain other obligations to the lenders thereunder and their affiliates are secured by substantially all of the assets of such guarantors.
Interest Costs.
Borrowings under the Credit Facility, as amended, bear interest, at DHI’s option, at either the base rate, which is calculated as the higher of Citibank, N.A.’s publicly announced base rate and the federal funds rate in effect from time to time, or the Eurodollar rate (which is based on rates in the London interbank Eurodollar market), in each case plus an applicable margin.
The applicable margin for borrowings under the Credit Facility, as amended, depends on the Standard & Poor’s Ratings Services (“S&P”) and Moody’s Investors Service, Inc. (“Moody’s”) credit ratings of the Credit Facility, as amended, with higher credit ratings resulting in a lower rate. The applicable margin for such borrowings will be either 2.375 percent or 2.75 percent per annum for base rate loans and either 3.375 percent or 3.75 percent per annum for Eurodollar loans, with the lower applicable margin being payable if the ratings for the Credit Facility, as amended, by S&P and Moody’s are BB+ and Ba1 or higher, respectively, and the higher applicable margin being payable if such ratings are less than BB+ and Ba1.
An unused commitment fee of either 0.625 percent or 0.75 percent is payable on the unused portion of the Revolving Facility, with the lower commitment fee being payable if the ratings for the Revolving Facility by S&P and Moody’s are BB+ and Ba1 or higher, respectively, and the higher commitment fee being payable if such ratings are less than BB+ and Ba1.
Prepayment Provisions.
The Credit Facility, as amended, contains mandatory prepayment provisions associated with specified asset sales and dispositions (including as a result of casualty or condemnation). However, as of December 31, 2010, we may designate up to $370 million of net proceeds from the sale of assets, as excluded from the asset sale, reinvestment and prepayment provisions of the Credit Facility, as amended.
Covenants and Events of Default.
The Credit Facility, as amended, contains customary affirmative and negative non-financial covenants and events of default. Subject to certain exceptions, DHI and its subsidiaries are subject to restrictions on incurring additional indebtedness, limitations on investments and certain limitations on dividends and other payments in respect of capital stock. The debt prepayment covenants were amended to provide that, in the event the maturity date of any of the 6.875 percent Senior Notes due 2011 or the 8.75 percent Senior Notes due 2012 issued by DHI is extended to a date, or refinanced with debt maturing, after April 2, 2013, DHI may prepay other longer-dated indebtedness in the amount of any such notes so extended or refinanced.
DYNEGY INC. and DYNEGY HOLDINGS INC.
NOTES TO CONSOLIDATED FINANCIAL STATEMENTS—(Continued)
The Credit Facility, as amended, also contains certain financial covenants, including (i) a covenant (measured as of the last day of the relevant fiscal quarter using a trailing four quarters of historical operating data as specified below) that requires DHI and certain of its subsidiaries to maintain a ratio of Secured Debt to Earnings before interest, taxes, depreciation and amortization (“EBITDA”) for DHI and its relevant subsidiaries of no greater than a specified amount; and (ii) a covenant that requires DHI and certain of its subsidiaries to maintain a ratio of EBITDA to Consolidated Interest Expense for DHI and its relevant subsidiaries as of the last day of the measurement period of no less than a specified amount. The following table summarizes the required ratios:
|
|
(i) Secured Debt :
EBITDA
|
(ii) EBITDA :
Consolidated Interest
Expense
|
||
|
Period Ended:
|
No greater than:
|
No less than:
|
||
|
December 31, 2010
|
3.50 : 1
|
1.30 : 1
|
||
|
March 31, 2011
|
3.50 : 1
|
1.35 : 1
|
||
|
June 30, 2011
|
3.50 : 1
|
1.40 : 1
|
||
|
September 30, 2011
|
3.25 : 1
|
1.60 : 1
|
||
|
December 31, 2011
|
3.00 : 1
|
1.60 : 1
|
||
|
Thereafter
|
2.50 : 1
|
1.75 : 1
|
We are in compliance with these covenants as of December 31, 2010. However, using the latest available forward commodity price curves and considering our current derivative contracts, we project that it is likely that we will not be able to comply with our EBITDA to Consolidated Interest Expense covenant, particularly in the third and fourth quarters of 2011.
A failure by us to comply with our financial covenants or to comply with the other restrictions in our Credit Facility could result in reduced borrowing capacity or even a default, causing our debt obligations under such financing agreements to potentially become immediately due and payable. In addition, our Senior Notes and Debentures, discussed below, could also be in default by reason of cross-default or cross-acceleration provisions. If we are unable to cure any such default, or obtain a waiver or a replacement financing, and those lenders accelerate the payment of such indebtedness, in the case that we are unable to repay those amounts, the holders of the indebtedness under our secured debt obligations would be entitled to foreclose on, and acquire control of substantially all of our assets, which would have a material adverse impact on our financial condition, results of operations and cash flows.
In light of our probable covenant non-compliance, we are attempting to amend or replace our existing credit facility. We expect the capacity of any amended or new credit facility to be less than the current capacity of $1.8 billion and to be at a higher cost. We may also seek additional sources of liquidity in order to ensure that we have sufficient cash available to meet our operating needs. These additional sources of liquidity could include asset sales, public or private issuances of debt, equity or equity-linked securities, debt for equity swaps, or any combination of these. However, we cannot provide any assurances that we will be successful in accomplishing any of these plans.
Additionally, prior to incurring certain DHI indebtedness, adding revolver commitments, making certain investments or certain sales of assets or engaging in certain other permitted activities, we must satisfy certain conditions precedent, including satisfaction, on a pro forma basis, of a separate ratio test of Total Indebtedness to EBITDA (as defined in the Credit Facility, as amended).
|
Period Ended:
|
Total Inebtedness :
EBITDA
No greater than:
|
|
|
December 31, 2010
|
6.50 : 1
|
|
|
March 31, 2011
|
6.50 : 1
|
|
|
June 30, 2011
|
6.50 : 1
|
|
|
September 30, 2011
|
6.25 : 1
|
|
|
December 31, 2011
|
6.00 : 1
|
|
|
Thereafter
|
5.00 : 1
|
Contingent LC Facility
On May 21, 2010, DHI executed a new $150 million unsecured bilateral contingent letter of credit facility (“Contingent LC Facility”) with Morgan Stanley Capital Group Inc. to provide DHI access to liquidity to support collateral posting requirements. Availability under the Contingent LC Facility is tied to increases in 2012 forward spark spreads and power prices. A facility fee will accrue on the unutilized portion of the facility at an annual rate of 0.60 percent and letter of credit availability fees will accrue at an annual rate of 7.25 percent. The facility will mature on December 31, 2012. No amounts were available under this facility at December 31, 2010.
DYNEGY INC. and DYNEGY HOLDINGS INC.
NOTES TO CONSOLIDATED FINANCIAL STATEMENTS—(Continued)
Senior Notes and Debentures
In general, DHI’s Senior Notes are senior unsecured obligations and rank equal in right of payment to all of DHI’s existing and future senior unsecured indebtedness, and are senior to all of DHI’s existing and any of its future subordinated indebtedness. They are not redeemable at DHI’s option prior to maturity. Dynegy did not guarantee the Senior Notes, and the assets that DHI owns do not support the Senior Notes. None of DHI’s subsidiaries have guaranteed the Notes and, as a result, all of the existing and future liabilities of DHI’s subsidiaries are effectively senior to the Notes.
On December 1, 2009, as part of the LS Power Transactions, DHI issued to an affiliate of LS Power $235 million aggregate principal amount of its 7.5 percent Senior Unsecured Notes due 2015 (the “Notes”) for $214 million in proceeds. In connection with the closing of the LS Power Transactions, DHI agreed to offer to exchange the Notes for a new issue of substantially identical notes registered under the Securities Act of 1933. The exchange offer closed on November 8, 2010.
On December 31, 2009, we completed a cash tender offer and consent solicitation, in which we purchased $421 million of DHI’s $500 million 6.875 percent Senior Unsecured Notes due 2011 (the “2011 Notes”) and $412 million of DHI’s $500 million 8.75 percent Senior Unsecured Notes due 2012 (the “2012 Notes). Total cash paid to repurchase the 2011 Notes and the 2012 Notes, including consent fees, was $879 million. We recorded a pre-tax charge of approximately $47 million associated with this transaction, of which $46 million is included in Debt extinguishment costs, and $1 million of acceleration of amortization of financing costs is included in Interest expense on our consolidated statements of operations.
Subordinated Debentures
In May 1997, NGC Corporation Capital Trust I (“Trust”) issued, in a private transaction, $200 million aggregate liquidation amount of 8.316 percent Subordinated Capital Income Securities (“Trust Securities”) representing preferred undivided beneficial interests in the assets of the Trust. The Trust invested the proceeds from the issuance of the Trust Securities in an equivalent amount of DHI’s 8.316 percent Subordinated Debentures (“Subordinated Debentures”). The sole assets of the Trust are the Subordinated Debentures. The Trust Securities are subject to mandatory redemption in whole, but not in part, on June 1, 2027, upon payment of the Subordinated Debentures at maturity, or in whole, but not in part, at any time, contemporaneously with the optional prepayment of the Subordinated Debentures, as allowed by the associated indenture. The Subordinated Debentures are redeemable, at DHI’s option, at specified redemption prices. The Subordinated Debentures represent DHI’s unsecured obligations and rank subordinate and junior in right of payment to all of DHI’s senior indebtedness to the extent and in the manner set forth in the associated indenture. We have irrevocably and unconditionally guaranteed, on a subordinated basis, payment for the benefit of the holders of the Trust Securities the obligations of the Trust to the extent the Trust has funds legally available for distribution to the holders of the Trust Securities. Since the Trust is considered a VIE, and the holders of the Trust Securities absorb a majority of the Trust’s expected losses, DHI’s obligation is represented by the Subordinated Debentures payable to the deconsolidated Trust. We may defer payment of interest on the Subordinated Debentures as described in the indenture, although we have not yet done so and have continued to pay interest as and when due. As of December 31, 2010 and 2009, the redemption amount associated with these securities totaled $200 million.
Sithe Senior Notes
The senior debt is secured by substantially all of the assets of Independence, but is not guaranteed by us. The premium balance of $8 million at December 31, 2010 is being accreted into interest expense over the life of the debt.
DYNEGY INC. and DYNEGY HOLDINGS INC.
NOTES TO CONSOLIDATED FINANCIAL STATEMENTS—(Continued)
The terms of the indenture governing the senior debt, among other things, prohibit cash distributions by Independence to its affiliates, including Dynegy and DHI, unless certain project reserve accounts are funded to specified levels and the required debt service coverage ratio is met. The indenture also includes other covenants and restrictions, relating to, among other things, prohibitions on asset dispositions and fundamental changes, reporting requirements and maintenance of insurance.
Plum Point (Including PPEA Credit Agreement Facility and PPEA Tax Exempt Bonds)
PPEA Credit Agreement Facility.
The PPEA Credit Agreement Facility, which was included in our consolidated financial statements at December 31, 2009, (the “PPEA Credit Agreement Facility”) consisted of a $700 million construction loan (the “Construction Loan”), a $700 million term loan commitment (the “Bank Loan”), a $17 million revolving credit facility (the “Revolver”) and a $102 million backstop letter of credit facility (the “LC Facility”). We deconsolidated our investment in PPEA Holdings at January 1, 2010, and later sold our investment in this entity in the fourth quarter of 2010. Please see Note 15—Variable Interest Entities—PPEA Holding Company LLC for further discussion. Borrowings under the PPEA Credit Agreement Facility bear interest, at PPEA’s option, at either the base rate, which is determined as the greater of the Prime Rate or the Federal Funds Rate in effect from time to time plus ½ of 1 percent, or Adjusted LIBOR, which is equal to the product of the applicable LIBOR and any Statutory Reserves plus an applicable margin equal to 0.35 percent. In addition, PPEA pays commitment fees equal to 0.125 percent per annum on the undrawn Construction Loan, Revolver and LC Facility commitments.
At December 31, 2009, PPEA’s lenders temporarily waived a requirement that PPEA fix the interest rate on a certain percentage of the floating rate debt. PPEA did not expect it would be able to meet this requirement at all times after expiration of this waiver, and therefore, PPEA expected to be in default of the requirements of the PPEA Credit Agreement Facility upon expiration of the waiver. Therefore, as this debt would be callable in the event of such default, we have classified borrowings under the PPEA Credit Agreement Facility as a current obligation at December 31, 2009.
Plum Point Tax Exempt Bonds.
On April 1, 2006, the City of Osceola (the “City”) loaned the $100 million in proceeds of a tax exempt bond issuance (the “Tax Exempt Bonds”) to PPEA. Interest expense on the Tax Exempt Bonds is based on a weekly variable rate and is payable monthly. The interest rates in effect at December 31, 2009 and 2008 were 0.3 percent and 3.50 percent, respectively. The Tax Exempt Bonds mature on April 1, 2036. An event of default under the PPEA Credit Agreement Facility which results in the expiration or cancellation of the LC Facility could result in the mandatory purchase of the bonds. Therefore, we have also classified the debt associated with the Tax Exempt Bonds as a current obligation at December 31, 2009.
On January 1, 2010, we adopted ASU No. 2009-17 which resulted in a deconsolidation of our investment in PPEA Holding, which was subsequently sold on November 10, 2010. Please read Note 2—Summary of Significant Accounting Policies—Accounting Principles Adopted—Variable Interest Entities for further discussion.
DYNEGY INC. and DYNEGY HOLDINGS INC.
NOTES TO CONSOLIDATED FINANCIAL STATEMENTS—(Continued)
Restricted Cash and Investments
The following table depicts our restricted cash and investments as of December 31, 2010 and 2009:
|
December 31,
2010
|
December 31,
2009
|
|||||||
|
(in millions)
|
||||||||
|
Credit facility (1)
|
$ | 850 | $ | 850 | ||||
|
Sithe Energy (2)
|
40 | 36 | ||||||
|
PPEA (3)
|
— | 19 | ||||||
|
GEN Finance (4)
|
50 | 50 | ||||||
|
Total restricted cash and investments
|
$ | 940 | $ | 955 | ||||
|
|
(1)
|
Includes cash posted to support the letter of credit component of our Credit Facility. We are required to post cash collateral in an amount equal to 103 percent of outstanding letters of credit.
|
|
|
(2)
|
Includes amounts related to the terms of the indenture governing the Sithe Senior Debt, which among other things, prohibit cash distributions by Independence to its affiliates, including us, unless certain project reserve accounts are funded to specified levels and the required debt service coverage ratio is met.
|
|
|
(3)
|
December 31, 2009 amount reflected proceeds from the Tax Exempt Bonds. These funds were used to finance PPEA’s undivided interest in various sewage and solid waste collection and disposal facilities which under construction. Funds were drawn from the restricted accounts as necessary for the construction of these facilities. On January 1, 2010, we deconsolidated our investment in PPEA Holding, which was subsequently sold on November 10, 2010. As a result, PPEA’s restricted cash and investments are no longer included in our consolidated balance sheet. Please read Note 2—Summary of Significant Accounting Policies—Accounting Principles Adopted—Variable Interest Entities for further discussion.
|
|
|
(4)
|
Includes amounts restricted under the terms of a security and deposit agreement associated with a collateral agreement and commodity hedges entered into by GEN Finance. These agreements were terminated and the $50 million held in restricted cash was reclassified to cash and cash equivalents during the first quarter 2011.
|
Transactions with LS Power
On November 30, 2009, we sold certain assets to LS Power, including our interest in two investments in joint ventures in which LS Power or its affiliates were also investors. Please read Note 4—Dispositions, Contract Terminations and Discontinued Operations—Dispositions—LS Power Transactions for further discussion.
We had 50 percent ownership interests in SCEA and SC Services, and subsidiaries of LS Power held the remaining 50 percent interests. We recorded a loss of approximately $84 million related to this sale in the fourth quarter 2009. Please see Note 15—Variable Interest Entities—Sandy Creek for further discussion.
We held two other investments in joint ventures in which LS Power or its affiliates were also investors. Dynegy had a 50 percent ownership interest in DLS Power Holdings and DLS Power Development. In December 2008, Dynegy and LS Power Associates, L.P. agreed to dissolve the two companies’ development joint venture. Please read Note 15—Variable Interest Entities for further discussion.
DYNEGY INC. and DYNEGY HOLDINGS INC.
NOTES TO CONSOLIDATED FINANCIAL STATEMENTS—(Continued)
Subsequent to the dissolution of DLS Power Holdings and DLS Power Development, Dynegy acquired exclusive rights, ownership and developmental control of substantially all repowering or expansion opportunities related to its existing portfolio of operating assets, and subsequently contributed approximately $15 million of these assets and approximately $21 million of deferred tax assets associated with these assets to DHI.
Upon completion of the agreement with LS Power discussed above, assets
related to repowering or expansion opportunities at the Bridgeport and Arizona power generating facilities were transferred to LS Power in connection with the sale of those facilities. Please read Note 15—Variable Interest Entities—DLS Power Holdings and DLS Power Development for further information.
DHI’s affiliate transactions during the year ended December 31, 2009 included $97 million related to the LS Power Transactions. Dynegy repurchased 245 million shares of its Class B common stock with a fair value of $443 million (based on a share price of $1.81 on November 30, 2009) from LS Power by exchanging assets owned by DHI for the shares. In order to effect this exchange, Dynegy paid $540 million cash to LS Power in exchange for the shares, immediately following which a separate subsidiary of LS Power paid $540 million of cash to DHI in exchange for the assets. The $97 million represents the difference between the $540 million cash received by DHI and the $443 million fair value of the shares received by Dynegy.
Other
December 2001 Equity Purchases.
In December 2001, ten former members of our senior management purchased Class A common stock from Dynegy in a private placement pursuant to Section 4(2) of the Securities Act of 1933. These former officers received loans from Dynegy totaling approximately $25 million to purchase Dynegy’s common stock at a price of $19.75 per share (before giving effect to the reverse stock split of outstanding common stock at a reverse ratio of 1-for-5 completed on May 25, 2010), the same price as the net proceeds per share received by Dynegy from a concurrent public offering. The loans bear interest at 3.25 percent per annum and are full recourse to the borrowers. Such loans, whose balances totaled $2 million as of December 31, 2010 and 2009, respectively, are accounted for as subscriptions receivable within Dynegy’s stockholders’ equity on the consolidated balance sheets.
Other.
DHI paid a dividend of $585 million (inclusive of a $410 million dividend to Dynegy which was used by Dynegy to repurchase a portion of the 245 million shares of Dynegy’s Class B common stock discussed previously) to Dynegy during the year ended December 31, 2009.
In the normal course of business, payments are made or cash is received by DHI on behalf of Dynegy, or by Dynegy on behalf of DHI. As a result of such transactions, DHI has recorded over time a receivable from Dynegy in the aggregate amount of $814 million and $777 million at December 31, 2010 and 2009, respectively. This receivable is classified as equity on DHI’s consolidated balance sheets as of December 31, 2010, and 2009. During the year ended December 31, 2010, DHI recorded $37 million of affiliate transactions with Dynegy, all of which were in the normal course of business, and primarily relate to the reallocation of deferred taxes between legal entities in accordance with applicable IRS regulations. During the year ended December 31, 2009, DHI recorded $50 million of affiliate transactions with Dynegy, including $97 million related to the LS Power Transactions as discussed above, partly offset by $48 million of other activity in the normal course of business, primarily related to the reallocation of deferred taxes between legal entities in accordance with applicable IRS regulations.
DYNEGY INC. and DYNEGY HOLDINGS INC.
NOTES TO CONSOLIDATED FINANCIAL STATEMENTS—(Continued)
Income Tax (Expense) Benefit-Dynegy.
We are subject to U.S. federal and state income taxes on our operations.
Dynegy’s components of income (loss) from continuing operations before income taxes were as follows:
|
Year Ended December 31,
|
||||||||||||
|
|
2010
|
2009
|
2008
|
|||||||||
|
(in millions)
|
||||||||||||
|
Income (loss) from continuing operations before income taxes:
|
||||||||||||
|
Domestic
|
$ | (432 | ) | $ | (1,355 | ) | $ | 250 | ||||
|
Foreign
|
— | — | 28 | |||||||||
| $ | (432 | ) | $ | (1,355 | ) | $ | 278 | |||||
Dynegy’s components of income tax (expense) benefit related to income (loss) from continuing operations were as follows:
|
Year Ended December 31,
|
||||||||||||
|
|
2010
|
2009
|
2008
|
|||||||||
|
(in millions)
|
||||||||||||
|
Current tax expense:
|
||||||||||||
|
Domestic
|
$ | (1 | ) | $ | (3 | ) | $ | (5 | ) | |||
|
Deferred tax benefit (expense):
|
||||||||||||
|
Domestic
|
198 | 318 | (81 | ) | ||||||||
|
Foreign
|
— | — | (4 | ) | ||||||||
|
Income tax (expense) benefit
|
$ | 197 | $ | 315 | $ | (90 | ) | |||||
Dynegy’s income tax (expense) benefit related to income (loss) from continuing operations for the years ended December 31, 2010, 2009 and 2008, was equivalent to effective rates of 46 percent, 23 percent and 32 percent, respectively. Differences between taxes computed at the U.S. federal statutory rate and Dynegy’s reported income tax benefit were as follows:
|
Year Ended December 31,
|
||||||||||||
|
|
2010
|
2009
|
2008
|
|||||||||
|
(in millions)
|
||||||||||||
|
Expected tax (expense) benefit at U.S. statutory rate (35%)
|
$ | 151 | $ | 474 | $ | (97 | ) | |||||
|
State taxes (1)
|
28 | 25 | (2 | ) | ||||||||
|
Permanent differences (2)
|
(1 | ) | (175 | ) | 7 | |||||||
|
Valuation allowance
|
(1 | ) | (12 | ) | (6 | ) | ||||||
|
IRS and state audits and settlements
|
18 | 8 | — | |||||||||
|
Other (3)
|
2 | (5 | ) | 8 | ||||||||
|
Income tax (expense) benefit
|
$ | 197 | $ | 315 | $ | (90 | ) | |||||
|
|
(1)
|
Dynegy incurred a state tax benefit for the year ended December 31, 2010 due to current year losses that will reduce future state cash taxes as well as changes in our state sales profile and a change in California tax law. Dynegy incurred a state tax benefit for the year ended December 31, 2009 due to current year losses which will reduce future state cash taxes, changes in its state sale profile, and the exit from various states due to the LS Power Transactions. Also includes a benefit of $18 million for the year ended December 31, 2008, related to adjustments arising from measurement of temporary differences.
|
DYNEGY INC. and DYNEGY HOLDINGS INC.
NOTES TO CONSOLIDATED FINANCIAL STATEMENTS—(Continued)
|
|
(2)
|
Includes $151 million related to nondeductible goodwill impairment expense and $18 million related to nondeductible losses in connection with the LS Power transaction for the year ended December 31, 2009.
|
|
|
(3)
|
Includes a benefit of $8 million for the year ended December 31, 2008 arising from the conversion of a foreign tax credit to a deduction.
|
Income Tax (Expense) Benefit-DHI.
DHI’s components of income (loss) from continuing operations before income taxes were as follows:
|
Year Ended December 31,
|
||||||||||||
|
|
2010
|
2009
|
2008
|
|||||||||
|
(in millions)
|
||||||||||||
|
Income (loss) from continuing operations before income taxes:
|
||||||||||||
|
Domestic
|
$ | (427 | ) | $ | (1,359 | ) | $ | 332 | ||||
|
Foreign
|
— | — | 28 | |||||||||
| $ | (427 | ) | $ | (1,359 | ) | $ | 360 | |||||
DHI’s components of income tax benefit related to loss from continuing operations were as follows:
|
Year Ended December 31,
|
||||||||||||
|
|
2010
|
2009
|
2008
|
|||||||||
|
(in millions)
|
||||||||||||
|
Current tax expense:
|
||||||||||||
|
Domestic
|
$ | (1 | ) | $ | (2 | ) | $ | (3 | ) | |||
|
Deferred tax benefit (expense):
|
||||||||||||
|
Domestic
|
185 | 315 | (131 | ) | ||||||||
|
Foreign
|
— | — | (4 | ) | ||||||||
|
Income tax (expense) benefit
|
$ | 184 | $ | 313 | $ | (138 | ) | |||||
DHI’s income tax (expense) benefit related to income (loss) from continuing operations for the years ended December 31, 2010, 2009 and 2008, was equivalent to effective rates of 43 percent, 23 percent and 38 percent, respectively. Differences between taxes computed at the U.S. federal statutory rate and DHI’s reported income tax benefit were as follows:
|
Year Ended December 31,
|
||||||||||||
|
|
2010
|
2009
|
2008
|
|||||||||
|
(in millions)
|
||||||||||||
|
Expected tax benefit at U.S. statutory rate (35%)
|
$ | 149 | $ | 476 | $ | (126 | ) | |||||
|
State taxes (1)
|
23 | 25 | (16 | ) | ||||||||
|
Permanent differences (2)
|
(1 | ) | (175 | ) | 7 | |||||||
|
Valuation allowance
|
(1 | ) | (11 | ) | (6 | ) | ||||||
|
IRS and state audits and settlements
|
12 | 1 | — | |||||||||
|
Other (3)
|
2 | (3 | ) | 3 | ||||||||
|
Income tax (expense) benefit
|
$ | 184 | $ | 313 | $ | (138 | ) | |||||
|
|
(1)
|
DHI incurred a state tax benefit for the year ended December 31, 2010 due to current year losses that will reduce future state cash taxes as well as changes in our state sales profile and a change in California tax law. DHI incurred a state tax benefit for the year ended December 31, 2009 due to current year losses which will reduce future state cash taxes, changes in its state sale profile, and the exit from various states due to the LS Power Transactions. Also includes a benefit of $12 million for the year ended December 31, 2008, related to adjustments arising from measurement of temporary differences.
|
DYNEGY INC. and DYNEGY HOLDINGS INC.
NOTES TO CONSOLIDATED FINANCIAL STATEMENTS—(Continued)
|
|
(2)
|
Includes $151 million related to nondeductible goodwill impairment expense and $18 million related to nondeductible losses in connection with the LS Power transaction for the year ended December 31, 2009.
|
|
|
(3)
|
Includes a benefit of $8 million for the year ended December 31, 2008 arising from the conversion of a foreign tax credit to a deduction.
|
Deferred Tax Liabilities and Assets.
Our significant components of deferred tax assets and liabilities were as follows:
|
Dynegy
|
DHI
|
|||||||||||||||
|
Year ended December 31,
|
Year ended December 31,
|
|||||||||||||||
|
2010
|
2009
|
2010
|
2009
|
|||||||||||||
|
(in millions)
|
||||||||||||||||
|
Deferred tax assets:
|
||||||||||||||||
|
Current:
|
||||||||||||||||
|
Reserves (legal, environmental and other)
|
$ | 11 | $ | 10 | $ | 10 | $ | 11 | ||||||||
|
Miscellaneous book/tax recognition differences
|
3 | — | (6 | ) | — | |||||||||||
|
Subtotal
|
14 | 10 | 4 | 11 | ||||||||||||
|
Less: valuation allowance
|
(2 | ) | (4 | ) | (1 | ) | (4 | ) | ||||||||
|
Total current deferred tax assets
|
12 | 6 | 3 | 7 | ||||||||||||
|
|
||||||||||||||||
|
Non-current:
|
||||||||||||||||
|
NOL carryforwards
|
262 | 166 | 242 | 151 | ||||||||||||
|
AMT credit carryforwards
|
271 | 272 | — | — | ||||||||||||
|
Reserves (legal, environmental and other)
|
2 | 2 | 2 | 2 | ||||||||||||
|
Other comprehensive income
|
34 | 97 | 34 | 97 | ||||||||||||
|
Miscellaneous book/tax recognition differences
|
25 | 7 | 23 | 3 | ||||||||||||
|
Subtotal
|
594 | 544 | 301 | 253 | ||||||||||||
|
Less: valuation allowance
|
(20 | ) | (31 | ) | (20 | ) | (30 | ) | ||||||||
|
Total non-current deferred tax assets
|
574 | 513 | 281 | 223 | ||||||||||||
|
Deferred tax liabilities:
|
||||||||||||||||
|
Non-current:
|
||||||||||||||||
|
Depreciation and other property differences
|
1,215 | 1,240 | 887 | 871 | ||||||||||||
|
Power contract
|
— | 53 | — | 56 | ||||||||||||
|
Total non-current deferred tax liabilities
|
1,215 | 1,293 | 887 | 927 | ||||||||||||
|
Net deferred tax liability
|
$ | 629 | $ | 774 | $ | 603 | $ | 697 | ||||||||
NOL Carryforwards-Dynegy.
At December 31, 2010, Dynegy had approximately $633
million of regular federal tax NOL carryforwards and $1,768 million of AMT NOL carryforwards. The federal and AMT NOL carryforwards will expire beginning in 2027 and 2024, respectively. As a result of the application of certain provisions of the Internal Revenue Code, Dynegy incurred an ownership change in May 2007 that placed an annual limitation on its ability to utilize certain tax carryforwards, including its NOL carryforwards. We do not expect that the ownership change will have any impact on Dynegy’s future tax liability. There was no valuation allowance established at December 31, 2010 or 2009 for Dynegy’s federal NOL carryforwards, as management believes reversing temporary differences will be sufficient to realize deferred tax assets for which no reserve has been established. At December 31, 2010 and 2009, state NOL carryforwards totaled $786 million and $843 million, respectively.
DYNEGY INC. and DYNEGY HOLDINGS INC.
NOTES TO CONSOLIDATED FINANCIAL STATEMENTS—(Continued)
NOL Carryforwards-DHI.
At December 31, 2010, DHI had approximately $577 million of regular federal tax NOL carryforwards. The federal NOL carryforwards will expire beginning in 2027. As a result of the application of certain provisions of the Internal Revenue Code, Dynegy incurred an ownership change in May 2007 that placed an annual limitation on its ability to utilize certain tax carryforwards, including its NOL carryforwards. We do not expect that the ownership change will have any impact on DHI’s future tax liability. There was no valuation allowance established at December 31, 2010 or 2009 for DHI’s federal NOL carryforwards, as management believes reversing temporary differences will be sufficient to realize deferred tax assets for which no reserve has been established. At December 31, 2010 and 2009, state NOL carryforwards totaled $775 million and $834 million, respectively.
AMT Credit Carryforwards.
At December 31, 2010, Dynegy had approximately $271 million of AMT credit carryforwards. The AMT credit carryforwards do not expire. As a result of the application of certain provisions of the Internal Revenue Code, Dynegy incurred an ownership change on May 2007 that placed an annual limitation on its liability to utilize certain tax carryforwards, including its AMT credits. We do not expect that the ownership change will have any impact on Dynegy’s future tax liability. There was no valuation allowance established at December 31, 2010 for Dynegy’s AMT credit carryforwards, as management believes the AMT credit carryforward is more likely than not to be fully realized in the future based on future reversals of existing taxable temporary differences.
Change in Valuation Allowance.
Realization of our deferred tax assets is dependent upon, among other things, our ability to generate taxable income of the appropriate character in the future. At December 31, 2010, valuation allowances related to state NOL carryforwards and credits have been established. During 2009, we eliminated our valuation allowance associated with capital loss carryforwards that expired in 2009 and other foreign book-tax differences and increased our valuation allowance on state NOL carryforwards and credits. During 2008, we decreased our valuation allowance associated with capital loss carryforwards and foreign tax credits, and increased our valuation allowance on state NOL carryforwards, foreign NOL carryforwards, and foreign book-tax differences.
The changes in the valuation allowance by attribute for Dynegy were as follows:
|
Capital Loss
Carryforwards
|
Foreign Tax
Credits
|
State NOL
Carryforwards
and Credits
|
Foreign NOL
Carryforwards
and Deferred
Tax Assets
|
Total
|
||||||||||||||||
|
(in millions)
|
||||||||||||||||||||
|
Balance as of December 31, 2007
|
$ | (17 | ) | $ | (24 | ) | $ | (21 | ) | $ | — | $ | (62 | ) | ||||||
|
Changes in valuation allowance—continuing operations
|
— | 8 | (2 | ) | (4 | ) | 2 | |||||||||||||
|
Other release
|
7 | 16 | — | — | 23 | |||||||||||||||
|
Balance as of December 31, 2008
|
(10 | ) | — | (23 | ) | (4 | ) | (37 | ) | |||||||||||
|
Changes in valuation allowance—continuing operations
|
— | — | (12 | ) | — | (12 | ) | |||||||||||||
|
Other release
|
10 | — | — | 4 | 14 | |||||||||||||||
|
Balance as of December 31, 2009
|
— | — | (35 | ) | — | (35 | ) | |||||||||||||
|
Changes in valuation allowance—continuing operations
|
— | — | 1 | — | 1 | |||||||||||||||
| Other release | — | — | 12 | — | 12 | |||||||||||||||
|
Balance as of December 31, 2010
|
$ | — | $ | — | $ | (22 | ) | $ | — | $ | (22 | ) | ||||||||
DYNEGY INC. and DYNEGY HOLDINGS INC.
NOTES TO CONSOLIDATED FINANCIAL STATEMENTS—(Continued)
The changes in the valuation allowance by attribute for DHI were as follows:
|
Capital Loss
Carryforwards
|
Foreign Tax
Credits
|
State NOL
Carryforwards
and Credits
|
Foreign NOL
Carryforwards
and Deferred
Tax Assets
|
Total
|
||||||||||||||||
|
(in millions)
|
||||||||||||||||||||
|
Balance as of December 31, 2007
|
(17 | ) | (21 | ) | (21 | ) | — | (59 | ) | |||||||||||
|
Changes in valuation allowance—continuing operations
|
— | 8 | (2 | ) | (4 | ) | 2 | |||||||||||||
|
Other release
|
7 | 13 | — | — | 20 | |||||||||||||||
|
Balance as of December 31, 2008
|
(10 | ) | — | (23 | ) | (4 | ) | (37 | ) | |||||||||||
|
Changes in valuation allowance—continuing operations
|
— | — | (11 | ) | — | (11 | ) | |||||||||||||
|
Other release
|
10 | — | — | 4 | 14 | |||||||||||||||
|
Balance as of December 31, 2009
|
— | — | (34 | ) | — | (34 | ) | |||||||||||||
|
Changes in valuation allowance—continuing operations
|
— | — | 13 | — | 13 | |||||||||||||||
|
Balance as of December 31, 2010
|
$ | — | $ | — | $ | (21 | ) | $ | — | $ | (21 | ) | ||||||||
Unrecognized Tax Benefits.
Dynegy files a consolidated income tax return in the U.S. federal jurisdiction, and we file income tax returns in various states. DHI is included in Dynegy’s consolidated federal tax returns. We are no longer subject to U.S. federal income tax examinations for the years prior to 2007, and with few exceptions, we are no longer subject to state and local examinations prior to 2004. We are no longer subject to non- U.S. income tax examinations. Our federal income tax returns are routinely audited by the IRS, and provisions are routinely made in the financial statements in anticipation of the results of these audits. We finalized the IRS audit of 2006-2007 tax years in the first quarter 2010. As a result of the settlement of our 2006-2007 audit, adjustments to tax positions related to prior years, and various state settlements, Dynegy recorded, and included in its income tax expense, a benefit of $18
million, a benefit of $5 million and a benefit of $1 million for the years ended December 31, 2010, 2009 and 2008, respectively. DHI recorded, and included in its income tax expense, a benefit of $12 million, an expense of $1 million and a benefit of $1 million for years ended December 31, 2010, 2009 and 2008, respectively.
A reconciliation of Dynegy’s and DHI’s beginning and ending amounts of unrecognized tax benefits follows:
|
Dynegy
|
DHI
|
|||||||
|
(in millions)
|
||||||||
|
Balance at January 1, 2008
|
$ | 33 | $ | 8 | ||||
|
Additions based on tax positions related to the prior year
|
2 | 2 | ||||||
|
Reductions based on tax positions related to the prior year
|
(3 | ) | (3 | ) | ||||
|
Balance at December 31, 2008
|
$ | 32 | $ | 7 | ||||
|
Additions based on tax positions related to the prior year
|
6 | 6 | ||||||
|
Reductions based on tax positions related to the prior year
|
(4 | ) | (2 | ) | ||||
|
Settlements
|
(9 | ) | 6 | |||||
|
Balance at December 31, 2009
|
$ | 25 | $ | 17 | ||||
|
Additions based on tax positions related to the prior year
|
— | — | ||||||
|
Reductions based on tax positions related to the prior year
|
(1 | ) | (1 | ) | ||||
|
Settlements
|
(19 | ) | (11 | ) | ||||
|
Balance at December 31, 2010
|
$ | 5 | $ | 5 | ||||
DYNEGY INC. and DYNEGY HOLDINGS INC.
NOTES TO CONSOLIDATED FINANCIAL STATEMENTS—(Continued)
As of December 31, 2010, 2009 and 2008, approximately $5 million, $24 million and $30 million, respectively, of unrecognized tax benefits would impact Dynegy’s effective tax rate if recognized. As of December 31, 2010, 2009 and 2008, approximately $5
million, $16 million and $6 million, respectively, of unrecognized tax benefits would impact DHI’s effective tax rate if recognized.
The changes to our unrecognized tax benefits during the twelve months ended December 31, 2010 primarily resulted from changes in various federal and state audits and positions. The adjustments to our reserves for uncertain tax positions as a result of these changes had an insignificant impact on our net income.
During the years ended December 31, 2010, 2009 and 2008, we recognized less than $1 million in interest and penalties. Dynegy and DHI had approximately $2 million, $2 million and $2 million accrued for the payment of interest and penalties at December 31, 2010, 2009 and 2008, respectively.
We expect that our unrecognized tax benefits could continue to change due to the settlement of audits and the expiration of statutes of limitation in the next twelve months; however, we do not anticipate any such change to have a significant impact on our results of operations, financial position or cash flows in the next twelve months.
The reconciliation of basic earnings (loss) per share from continuing operations to diluted earnings (loss) per share from continuing operations of Dynegy common stock outstanding during the period is shown in the following table. Diluted earnings (loss) per share represents the amount of earnings (losses) for the period available to each share of Dynegy common stock outstanding during the period plus each share that would have been outstanding assuming the issuance of common shares for all dilutive potential common shares outstanding during the period.
|
Year Ended December 31,
|
||||||||||||
|
2010
|
2009
|
2008
|
||||||||||
|
(in millions, except per share amounts)
|
||||||||||||
|
Income (loss) from continuing operations
|
$ | (235 | ) | $ | (1,040 | ) | $ | 188 | ||||
|
Less: Net loss attributable to the noncontrolling interests
|
— | (15 | ) | (3 | ) | |||||||
|
Income (loss) from continuing operations attributable to Dynegy Inc. for basic and diluted earnings (loss) per share
|
$ | (235 | ) | $ | (1,025 | ) | $ | 191 | ||||
|
Basic weighted-average shares (1)
|
120 | 164 | 168 | |||||||||
|
Effect of dilutive securities - stock options and restricted stock (1)
|
1 | 1 | — | |||||||||
|
Diluted weighted-average shares (1)
|
121 | 165 | 168 | |||||||||
|
Earnings (loss) per share from continuing operations attributable to Dynegy Inc.:
|
||||||||||||
|
Basic (1)
|
$ | (1.96 | ) | $ | (6.25 | ) | $ | 1.14 | ||||
|
Diluted (1) (2)
|
$ | (1.96 | ) | $ | (6.25 | ) | $ | 1.14 | ||||
|
|
(1)
|
On May 25, 2010, Dynegy effected a reverse stock split of its outstanding common stock at a ratio of 1-for-5 and proportionately decreased the number of authorized shares of its capital stock and all prior periods have been adjusted to reflect the reverse stock split. Please read Note 23—Capital Stock—Common Stock for further discussion.
|
DYNEGY INC. and DYNEGY HOLDINGS INC.
NOTES TO CONSOLIDATED FINANCIAL STATEMENTS—(Continued)
|
|
(2)
|
When an entity has a net loss from continuing operations adjusted for preferred dividends, it is prohibited from including potential common shares in the computation of diluted per-share amounts. Accordingly, we have utilized the basic shares outstanding amount to calculate both basic and diluted loss per share for the years ended December 31, 2010 and 2009.
|
Legal Proceedings
Set forth below is a summary of our material ongoing legal proceedings. We record reserves for contingencies when information available indicates that a loss is probable and the amount of the loss is reasonably estimable. In addition, we disclose matters for which management believes a material loss is at least reasonably possible. In all instances, management has assessed the matters below based on current information and made a judgment concerning their potential outcome, giving due consideration to the nature of the claim, the amount and nature of damages sought and the probability of success. Management’s judgment may prove materially inaccurate and such judgment is made subject to the known uncertainty of litigation.
Gas Index Pricing Litigation.
We, several of our affiliates, our former joint venture affiliate and other energy companies were named as defendants in numerous lawsuits in state and federal court claiming damages resulting from alleged price manipulation and false reporting of natural gas prices to various index publications in the 2000-2002 timeframe. Many of the cases have been resolved and those which remain are pending in Nevada federal district court. Recent developments include:
|
|
●
|
In February 2007, the Tennessee state court dismissed a class action on defendants’ motion. Plaintiffs appealed and, in October 2008, the appellate court reversed the dismissal. Thereafter, defendants appealed to the Tennessee Supreme Court which, in April 2010, reversed the appellate court ruling and dismissed all of plaintiffs’ claims. Plaintiffs’ deadline to appeal to the United States Supreme Court has expired.
|
|
|
●
|
In February 2008, the United States District Court in Las Vegas, Nevada granted defendants’ motion for summary judgment in a Colorado class action and, ultimately, dismissed the case and all of plaintiffs’ claims. The decision is subject to appeal once the remaining defendants’ claims are adjudicated.
|
|
|
●
|
The remaining five cases, three of which seek class certification, are also pending in Nevada federal court. All of the cases contain similar claims that individually, and in conjunction with other energy companies, we engaged in an illegal scheme to inflate natural gas prices in four states by providing false information to natural gas index publications. In November 2009, following defendants’ motion for reconsideration, the court invited defendants to renew their motions for summary judgment on preemption of plaintiffs’ state law claims, which were filed shortly thereafter. Plaintiffs concurrently moved to amend their complaints to add federal claims. In October 2010, the court denied plaintiffs’ motion to amend. We await an order on defendants’ motions for summary judgment or further instruction from the court. In the interim, discovery and plaintiffs’ class certification motions are stayed.
|
We continue to analyze the Gas Index Pricing Litigation and are vigorously defending the remaining individual matters. Due to the uncertainty of litigation, we cannot predict whether we will incur any liability in connection with these lawsuits. We believe these cases lack merit and we will continue to oppose plaintiffs' claims vigorously.
Cooling Water Intake Permits.
The cooling water intake structures at several of our power generation facilities are regulated under Section 316(b) of the Clean Water Act. This provision generally provides that standards set for power generation facilities require that the location, design, construction and capacity of cooling water intake structures reflect the BTA for minimizing adverse environmental impact. These standards are developed and implemented for power generating facilities through the NPDES permits or individual SPDES permits on a case- by- case basis.
DYNEGY INC. and DYNEGY HOLDINGS INC.
NOTES TO CONSOLIDATED FINANCIAL STATEMENTS—(Continued)
The environmental groups that participate in our NPDES and SPDES permit proceedings generally argue that only closed cycle cooling meets the BTA requirement. The issuance and renewal of NPDES or SPDES permits for three of our power generation facilities (Danskammer, Roseton and Moss Landing) have been challenged on this basis. The Danskammer SPDES permit, which was renewed and issued in June 2006, does not require installation of a closed cycle cooling system; however, it does require aquatic organism mortality reductions resulting from NYSDEC’s determination of BTA requirements under its regulations. All appeals of this permit have been exhausted. Two permit challenges are still pending.
|
|
●
|
Roseton SPDES Permit — In April 2005, the NYSDEC issued a Draft SPDES Permit renewal for the Roseton plant. The permit is opposed by environmental groups challenging the BTA determination. In October 2006, various holdings in the administrative law judge’s ruling admitting the environmental group petitioners to party status and setting forth the issues to be adjudicated in the permit renewal hearing were appealed to the Commissioner of NYSDEC by the petitioners, NYSDEC staff and us. The permit renewal hearing will be scheduled after the Commissioner rules on those appeals. We believe that the petitioners’ claims lack merit and we plan to oppose those claims vigorously.
|
|
|
●
|
Moss Landing NPDES Permit — The California Regional Water Quality Control Board (“Water Board”) issued an NPDES permit for the Moss Landing power generating facility in 2000 that did not require closed cycle cooling. A local environmental group challenged the BTA determination of the permit. The Water Board’s decision was affirmed by the Superior Court in 2004 and by the Court of Appeals in 2007. The Supreme Court of California granted review in March 2008. The petitioner’s brief was filed in December 2009. We filed a motion to dismiss and our responsive brief in March 2010. The petitioner’s reply brief was filed in May 2010. Our motion to dismiss was denied in June 2010. In July 2010, the California Energy Commission filed an application for leave to file a brief in support of our argument challenging the jurisdiction of the Superior Court. In September 2010, four air quality control districts filed an application for leave to file a brief in support of jurisdiction of the Superior Court. We believe that petitioner’s claims lack merit and we plan to continue to oppose those claims vigorously.
|
Due to the nature of these claims, an adverse result in either of these proceedings could have a material effect on our financial condition, results of operations and cash flows; however, given the numerous variables and factors involved in calculating the potential costs associated with installing a closed cycle cooling system, any decision to install such a system at any of our facilities would be made on a case-by-case basis considering all relevant factors at such time. If capital expenditures related to cooling water systems become great enough to render the operation of the plant uneconomical, we could, at our option, and subject to any applicable financing agreements or other obligations to make payments as required under applicable leases, reduce operations or cease to operate that facility and forego the capital expenditures.
Native Village of Kivalina and City of Kivalina v. ExxonMobil Corporation, et al.
In February 2008, the Native Village of Kivalina and the City of Kivalina, Alaska initiated an action in federal court in the Northern District of California against DHI and 23 other companies in the energy industry. Plaintiffs claim that defendants’ emissions of GHG including CO
2
contribute to climate change and have caused significant damage to a native Alaskan Eskimo village through increased vulnerability to waves, storm surges and erosion. In September 2009, the court dismissed all of the plaintiffs’ claims based on lack of subject matter jurisdiction and because plaintiffs lacked standing to bring the suit. Shortly thereafter, plaintiffs appealed to the Ninth Circuit. The appeal is fully briefed and in February 2011, the Ninth Circuit issued an order staying the scheduling of oral argument until at least June 15, 2011, pending the United States Supreme Court's ruling in
Connecticut v. AEP
. We believe the plaintiffs’ suit lacks merit and we will continue to oppose their claims vigorously.
DYNEGY INC. and DYNEGY HOLDINGS INC.
NOTES TO CONSOLIDATED FINANCIAL STATEMENTS—(Continued)
Stockholder Litigation Relating to the Blackstone Merger Agreement.
In connection with the Blackstone Merger Agreement, nineteen stockholder lawsuits were filed (one of which was subsequently voluntarily dismissed) in the District Courts of Harris County, Texas between August 13, 2010 and August 24, 2010 against Dynegy, its directors, certain Blackstone entities, NRG Energy Inc. (“NRG”), and/or certain executive officers of Dynegy. The remaining eighteen Texas state actions were consolidated on September 9, 2010 and are captioned as Colleen Witmer, et al. v. Dynegy Inc., et al., No. 2010-50609 (Consolidated) (234th Judicial District of Harris County, Texas). One stockholder derivative lawsuit was filed in a District Court in Harris County, Texas on September 16, 2010. Three stockholder lawsuits were filed against the Company, its directors, certain of its executive officers, certain Blackstone entities, and/or NRG in the United States District Court in the Southern District of Texas; the first was filed on August 31, 2010; the second was filed on September 16, 2010, and the third was filed on October 7, 2010. Six similar stockholder actions against Dynegy, its directors, certain Blackstone entities, and/or certain executive officers of Dynegy were filed in the Court of Chancery of the State of Delaware between August 17, 2010 and August 23, 2010, and were consolidated on August 24, 2010. One of these lawsuits was voluntarily dismissed on August 23, 2010.
The complaints arising out of the Blackstone Merger Agreement variously alleged, among other things, that the board and certain executive officers violated fiduciary duties and failed to disclose material information. Certain of the complaints also alleged that Dynegy, Blackstone, and/or NRG aided and abetted such alleged breaches of fiduciary duties. The plaintiffs sought various remedies, including an injunction against the merger and/or the stockholder vote, corrective disclosure, declaratory relief with respect to the alleged breaches of fiduciary duty, and monetary damages including attorneys’ fees and expenses.
On November 7, 2010, the parties entered into a memorandum of understanding providing for the full and final settlement of the Texas state stockholder class actions and the Delaware actions. In connection with the settlement, Dynegy denied all allegations of wrongdoing but agreed to make certain additional disclosures to stockholders. On November 8, 2010, Dynegy made supplemental disclosures in a supplement to the Definitive Proxy Statement filed with the SEC as Definitive Additional Materials on Schedule 14A on November 8, 2010 and subsequently mailed such supplemental disclosures to the holders of our common stock. The memorandum of understanding and settlement were expressly subject to and conditioned upon the consummation of the transactions contemplated by the Blackstone Merger Agreement. Accordingly, when the Blackstone Merger Agreement was terminated, the settlement became null and void.
On December 12, 2010, the plaintiff in the stockholder derivative action moved to nonsuit all defendants without prejudice. The court granted the motion on December 14, 2010. On December 16, 2010, the lead plaintiff in the Texas state class action moved to nonsuit without prejudice defendants Blackstone and NRG. The court granted the motion on December 17, 2010. On February 25, 2011, the plaintiffs in the federal cases moved to dismiss their claims without prejudice. The court dismissed the federal lawsuits on March 1, 2011.
In addition to the state class action, the Delaware actions also remain pending. The defendants believe that the Delaware actions, which currently arise out of the Blackstone Merger Agreement, are meritless, and in any event, are moot in light of the fact that the transaction was not consummated. The defendants will continue to vigorously defend against all related claims.
Stockholder Litigation Relating to the Icahn Merger Agreement.
On January 6, 2011, the plaintiff in the above referenced state class action filed a second amended petition challenging the Icahn Merger Agreement. The second amended petition names Dynegy, its board members, and Icahn Enterprises Holdings L.P. as defendants and generally alleges that the Dynegy board members breached their fiduciary duties in connection with approving the transaction and by providing misleading information and/or failing to disclose information in the 14D-9 filing. The second amended petition also alleges that Dynegy and Icahn aided and abetted the Dynegy board members’ alleged breaches of fiduciary duties and that all defendants engaged in a conspiracy to deprive stockholders of the full value of their shares. The plaintiff seeks, among other things, to enjoin the tender solicitation. On February 4, 2011, a new federal class action complaint was filed against Dynegy, its directors, and certain Icahn entities generally alleging claims similar to those alleged in the state court second amended petition. Shortly after filing, this case was consolidated with the other federal cases and subsequently dismissed on March 1, 2011. The defendants believe that the claims in the second amended petition are meritless and intend to vigorously defend against such claims.
DYNEGY INC. and DYNEGY HOLDINGS INC.
NOTES TO CONSOLIDATED FINANCIAL STATEMENTS—(Continued)
Illinova Generating Company Arbitration.
In May 2007, Dynegy’s subsidiary Illinova Generating Company (“IGC”) received an adverse award in an arbitration brought by Ponderosa Pine Energy, LLC (“PPE”). The award required IGC to pay PPE $17 million, which IGC paid in June 2007 under protest while simultaneously seeking to vacate the award in the District Court of Dallas County, Texas. In March 2010, the Dallas District Court vacated the award, finding that one of the arbitrators had exhibited evident partiality. PPE is appealing that decision to the Fifth District Court of Appeals in Dallas, Texas. Coinciding with the appeal, IGC filed a claim against PPE seeking recovery of the $17 million plus interest. In September 2010, the Dallas District Court ordered PPE to deposit the $17 million principal in an interest-bearing escrow account jointly owned by IGC and PPE pending the Dallas Court of Appeals decision, which has not yet been issued. As a result of the uncertainty surrounding the outcome of PPE’s appeal, our receivable from PPE is fully reserved at December 31, 2010.
Ordinary Course Litigation.
In addition to the matters discussed above, we are party to numerous legal proceedings arising in the ordinary course of business or related to discontinued business operations. In management’s judgment, which may prove to be materially inaccurate as indicated above, the disposition of these matters will not materially affect our financial condition, results of operations or cash flows.
Other Commitments and Contingencies
In conducting our operations, we have routinely entered into long-term commodity purchase and sale commitments, as well as agreements that commit future cash flow to the lease or acquisition of assets used in our businesses. These commitments have been typically associated with commodity supply arrangements, capital projects, reservation charges associated with firm transmission, transportation, storage and leases for office space, equipment, plant sites, power generation assets and LPG vessel charters. The following describes the more significant commitments outstanding at December 31, 2010.
Purchase Obligations
.
We have firm capacity payments related to transportation of natural gas. Such arrangements are routinely used in the physical movement and storage of energy. The total of such obligations was $156 million as of December 31, 2010.
Coal Commitments.
At December 31, 2010, we had contracts in place to supply coal to various of our generation facilities with minimum commitments of $647 million. Obligations related to the purchase of coal were $636 million through 2015, and obligations related to the transportation were $11 million through 2013.
Midwest Consent Decree.
In 2005, we settled a lawsuit filed by the EPA and the United States Department of Justice in the U.S. District Court for the Southern District of Illinois that alleged violations of the Clean Air Act and related federal and Illinois regulations concerning certain maintenance, repair and replacement activities at our Baldwin generating station. A consent decree (the “Midwest Consent Decree”) was finalized in July 2005. Among other provisions of the Midwest Consent Decree, we are required to not operate certain of our power generating facilities after specified dates unless certain emission control equipment is installed. We have spent approximately $730 million through December 31, 2010 related to these Midwest Consent Decree projects and anticipate incurring additional costs over the course of the next three years in connection with the Midwest Consent Decree. If the costs of these capital expenditures become great enough to render the operation of the facility uneconomical, we could, at our option, cease to operate the facility or facilities and forego these capital expenditures without incurring any further obligations. Further, our production may be affected if we fail to meet certain performance standards under the Midwest Consent Decree. Please read Note 1—Organization and Operations—Going Concern for further discussion.
DYNEGY INC. and DYNEGY HOLDINGS INC.
NOTES TO CONSOLIDATED FINANCIAL STATEMENTS—(Continued)
DNE Leveraged Lease.
In the first quarter 2001, we acquired the DNE power generation facilities. These facilities consist of a combination of baseload, intermediate and peaking facilities aggregating approximately 1,700 MW. The facilities are approximately 50 miles north of New York City and were acquired for approximately $903 million cash, plus inventory and certain working capital adjustments. In May 2001, two of our subsidiaries completed a sale-leaseback transaction to provide term financing for the DNE facilities. Under the terms of the sale-leaseback transaction, our subsidiaries sold plants and equipment and agreed to lease them back for terms expiring within 34 years, exclusive of renewal options. We have no option to purchase the leased facilities at the end of their respective lease terms. If one or more of the leases were to be terminated because of an event of loss, because it becomes illegal for the applicable lessee to comply with the lease or because a change in law makes the facility economically or technologically obsolete, DHI would be required to make a termination payment. As of December 31, 2010, the termination payment would be approximately $816 million for all of the DNE facilities.
Blackstone Merger Agreement.
On August 13, 2010, Dynegy entered into the Blackstone Merger Agreement with an affiliate of Blackstone, pursuant to which Dynegy would be acquired and Dynegy’s stockholders would receive $4.50 per share in cash. On November 16, 2010, the agreement was amended to increase the merger consideration to $5.00 per share in cash. The Blackstone Merger Agreement was not approved by Dynegy’s stockholders at a special stockholders’ meeting on November 23, 2010 and was subsequently terminated by the parties in accordance with the terms of the agreement. The Blackstone Merger Agreement requires Dynegy to pay Blackstone a termination fee in the amount of approximately $16 million in the event that within 18 months of November 23, 2010, Dynegy consummates an alternative transaction having an aggregate value of more than $4.50 per share.
Icahn Merger Agreement.
On December 15, 2010, Dynegy’s Board of Directors unanimously approved Dynegy entering into the Icahn Merger Agreement with an affiliate of Icahn. In connection with the Icahn Merger Agreement, Icahn launched the Tender Offer on December 22, 2010 for all of the issued and outstanding shares of common stock at $5.50 per share. At the expiration of the Tender Offer on February 18, 2011, an insufficient number of shares had been tendered in response to the Tender Offer, and as a result the Icahn Merger Agreement automatically terminated. In connection with the termination, Dynegy paid $5 million to Icahn with respect to expenses incurred by Icahn related to the Icahn Merger Agreement in February 2011, and may be required to pay additional fees of $11 million in the event that within 18 months of February 18, 2011 Dynegy consummates an alternative transaction having an aggregate value of more than $5.50 per share.
Other Minimum Commitments.
We have an interconnection obligation with respect to interconnection services for our Ontelaunee facility, which expires in 2027. Our obligation under this agreement is approximately $1 million per year through the term of the contract.
Minimum commitments in connection with office space, equipment, plant sites and other leased assets, including the DNE leveraged lease discussed above, at December 31, 2010, were as follows: 2011—$124 million, 2012—$186 million, 2013—$151 million, 2014—$150 million, 2015—$150 and beyond—$119 million.
Rental payments made under the terms of these arrangements totaled $107 million, $154 million and $148 million for the years ended December 31, 2010, 2009 and 2008, respectively.
We are party to two charter party agreements relating to VLGCs previously utilized in our former global liquids business. The aggregate minimum base commitments of the charter party agreements are approximately $14 million for each year from 2011 through 2012, and approximately $17 million in aggregate for the period from 2013 through lease expiration. The charter party rates payable under the two charter party agreements float in accordance with market based rates for similar shipping services. The $14 million and $17 million amounts set forth above are based on the minimum obligations set forth in the two charter party agreements. The primary term of one charter is through September 2013 while the primary term of the second charter is through September 2014. On January 1, 2003, we sub-chartered both VLGCs to a wholly owned subsidiary of Transammonia Inc. The terms of the sub-charters are identical to the terms of the original charter agreements. To date, the subsidiary of Transammonia has complied with the terms of the sub-charter agreements.
DYNEGY INC. and DYNEGY HOLDINGS INC.
NOTES TO CONSOLIDATED FINANCIAL STATEMENTS—(Continued)
Guarantees and Indemnifications
In the ordinary course of business, we routinely enter into contractual agreements that contain various representations, warranties, indemnifications and guarantees. Examples of such agreements include, but are not limited to, service agreements, equipment purchase agreements, engineering and technical service agreements, asset sales and procurement and construction contracts. Some agreements contain indemnities that cover the other party’s negligence or limit the other party’s liability with respect to third party claims, in which event we will effectively be indemnifying the other party. Virtually all such agreements contain representations or warranties that are covered by indemnifications against the losses incurred by the other parties in the event such representations and warranties are false. While there is always the possibility of a loss related to such representations, warranties, indemnifications and guarantees in our contractual agreements, and such loss could be significant, in most cases management considers the probability of loss to be remote. Related to the indemnifications discussed below, we have accrued approximately $2 million as of December 31, 2010.
LS Power Indemnities.
In connection with the LS Power Transactions we agreed in the purchase and sale agreement to indemnify LS Power against claims regarding any breaches in our representations and warranties and certain other potential liabilities. Claims for indemnification shall survive until twelve months subsequent to closing with exceptions for tax claims, which shall survive for the applicable statute of limitations plus 30 days, and certain other representations and potential liabilities, which shall survive indefinitely. The indemnifications provided to LS Power are limited to $1.3 billion in total; however, several categories of indemnifications are not available to LS Power until the liabilities incurred in the aggregate are equal to or exceed $15 million and are capped at a maximum of $100 million. Further, the purchase and sale agreement provides in part that we may not reduce or avoid liability for a valid claim based on a claim of contribution. In addition to the above indemnities related to the LS Power Transactions, we have agreed to indemnify LS Power against claims related to the Riverside/Foothills Project for certain aspects of the project. Namely, LS Power has been indemnified for any disputes that arise as to ownership, transfer of bonds related to the project, and any failure by us to obtain approval for the transfer of the payment in-lieu of taxes program already in place. The indemnities related solely to the Riverside/Foothills Project are capped at a maximum of $180 million and extend until the earlier of the expiration of the tax agreement or December 26, 2026. At this time, we have incurred no significant expenses under these indemnities. Please read Note 4—Dispositions, Contract Terminations and Discontinued Operations—Dispositions—LS Power Transactions for further discussion.
West Coast Power Indemnities.
In connection with the sale of our 50 percent interest in West Coast Power to NRG on March 31, 2006, an agreement was executed to allocate responsibility for managing certain litigation and provide for certain indemnities with respect to such litigation. The indemnification agreement in relevant part provides that NRG assumes responsibility for all defense costs and any risk of loss, subject to certain conditions and limitations, arising from a February 2002 complaint filed at FERC by the California Public Utilities Commission alleging that several parties, including West Cost Power subsidiaries, overcharged the State of California for wholesale power. FERC found the rates charged by wholesale suppliers to be just and reasonable. However, this matter was appealed to the U.S. Supreme Court, which remanded the case to FERC for further review.
Targa Indemnities.
During 2005, as part of our sale of our midstream business (“DMSLP”), we agreed to indemnify Targa Resources, Inc. (“Targa”) against losses it may incur under indemnifications DMSLP provided to purchasers of certain assets, properties and businesses disposed of by DMSLP prior to our sale of DMSLP. We have incurred no material expense under these prior indemnities. We have recorded an accrual of less than $1 million for remediation of groundwater contamination at the Breckenridge Gas Processing Plant sold by DMSLP in 2001. The indemnification provided by DMSLP to the purchaser of the plant has a limit of $5 million. We have also indemnified Targa for certain tax matters arising from periods prior to our sale of DMSLP.
DYNEGY INC. and DYNEGY HOLDINGS INC.
NOTES TO CONSOLIDATED FINANCIAL STATEMENTS—(Continued)
Illinois Power Indemnities.
Dynegy has indemnified third parties against losses resulting from possible adverse regulatory actions taken by the ICC that could prevent Illinois Power from recovering costs incurred in connection with purchased natural gas and investments in specified items. Although there is no absolute limitation on Dynegy’s liability under this indemnity, the amount of the indemnity is limited to 50 percent of any such losses. Dynegy has made certain payments in respect of these indemnities following regulatory action by the ICC, and has established reserves for further potential indemnity claims. Further events, which fall within the scope of the indemnity, may still occur. However, Dynegy is not required to accrue a liability in connection with these indemnifications, as management cannot reasonably estimate a range of outcomes or at this time considers the probability of an adverse outcome as only reasonably possible. Dynegy intends to contest any proposed regulatory actions.
Black Mountain Guarantee.
Through one of our subsidiaries, we hold a 50 percent ownership interest in Black Mountain (Nevada Cogeneration) (“Black Mountain”), in which our partner is a Chevron subsidiary. Black Mountain owns the Black Mountain power generation facility and has a power purchase agreement with a third party that extends through April 2023. In connection with the power purchase agreement, pursuant to which Black Mountain receives payments which decrease in amount over time, we agreed to guarantee 50 percent of certain payments that may be due to the power purchaser under a mechanism designed to protect it from early termination of the agreement. At December 31, 2010, if an event of default due to early termination had occurred under the terms of the mortgage on the facility entered into in connection with the power purchase agreement, we could have been required to pay the power purchaser approximately $54 million under the guarantee.
Other Indemnities.
We entered into indemnifications regarding environmental, tax, employee and other representations when completing asset sales such as, but not limited, to the Rolling Hills, Calcasieu, CoGen Lyondell and Heard County power generating facilities. As of December 31, 2010, no claims have been made against these indemnities. There is no limitation on our liability under certain of these indemnities. However, management is unaware of any existing claims.
At December 31, 2010, Dynegy had authorized capital stock consisting of 420,000,000 shares of common stock, $0.01 par value per share, and 20,000,000 of preferred stock, $0.01 per value per share. As of December 31, 2010, there were no shares of preferred stock issued or outstanding.
All of DHI’s outstanding equity securities are held by its parent, Dynegy. There is no established trading market for such securities, and they are not traded on any exchange.
Stockholder Protection Rights Agreement.
Dynegy’s Board of Directors adopted a Stockholder Protection Rights Agreement, dated as of November 22, 2010, (as subsequently amended, the “Rights Agreement”), between Dynegy and Mellon Investor Services LLC, as Rights Agent (the “Rights Agent”). Pursuant to the Rights Agreement, Dynegy’s Board of Directors declared a dividend of one stock purchase right (a “Right”) for each outstanding share of Dynegy’s common stock, par value $0.01 per share (“Common Stock”), held of record at the close of business on December 2, 2010 (the “Record Time”), or issued thereafter and prior to the Separation Time (as hereinafter defined). Each Right entitles its registered holder to purchase from Dynegy, after the Separation Time, one one-hundredth of a share of Participating Preferred Stock, par value $0.01 per share (“Participating Preferred Stock”), for $12.50 (the “Exercise Price”), subject to adjustment.
The Rights Agreement provides that, unless terminated earlier by Dynegy, the Rights will expire following Dynegy’s next annual meeting of stockholders after the filing of the Form 10-K for the fiscal year 2010, unless the Rights Agreement is approved by Dynegy’s stockholders (in which case it will expire at the first subsequent annual meeting at which it is not approved by a stockholder vote).
DYNEGY INC. and DYNEGY HOLDINGS INC.
NOTES TO CONSOLIDATED FINANCIAL STATEMENTS—(Continued)
The Rights will be transferred only with the Common Stock and will not be evidenced by separate certificates until the next business day following the earlier of (the “Separation Time”) (i) the tenth business day after the date on which any Person (as defined in the Rights Agreement) commences a tender or exchange offer which, if consummated, would result in such Person’s becoming an Acquiring Person (as defined below) other than pursuant to a Qualifying Offer (as defined below) and (ii) the time of the first event causing a Flip-in Date (as defined below) to occur. A “Flip-in Date” will occur on any Stock Acquisition Date (as defined below). A “Stock Acquisition Date” means the earlier of (a) the first date on which Dynegy publicly announces that a Person has become an Acquiring Person (as defined below) or (b) the date and time on which any Acquiring Person has acquired more than 30 percent of Dynegy’s Common Stock, in each case other than pursuant to a Qualifying Offer. An “Acquiring Person” is any Person having Beneficial Ownership (as defined in the Rights Agreement) of 20 percent or more of the outstanding shares of Common Stock, which term does not include (i) Dynegy, any wholly-owned subsidiary of Dynegy or any employee stock ownership or other employee benefit plan of Dynegy, (ii) any person who was the Beneficial Owner of 20 percent or more of the outstanding Common Stock as of the date of the Rights Agreement and who continuously thereafter is the Beneficial Owner of 20 percent or more of the outstanding Common Stock or who shall become the Beneficial Owner of 20 percent or more of the outstanding Common Stock solely as a result of an acquisition of Common Stock by Dynegy, until such time as such Person acquires additional Common Stock, other than through a dividend or stock split or similar transaction, or (iii) any Person who becomes the Beneficial Owner of 20 percent or more of the outstanding Common Stock without any plan or intent to seek or affect control of Dynegy if such Person promptly divests sufficient securities such that such 20 percent or greater Beneficial Ownership ceases. Under the Rights Agreement, synthetic ownership of Dynegy’s Common Stock in the form of certain derivative securities counts towards the 20 percent and 30 percent Beneficial Ownership thresholds, if Dynegy’s Board of Directors determines that the owner of such derivative securities is seeking to use the existence of such securities for the purpose or effect of changing or influencing control of Dynegy.
A “Qualifying Offer” is defined as an all-cash tender offer for all of Dynegy’s outstanding Common Stock at a price per share in excess of $5.00 that is fully financed, is conditioned upon the offeror acquiring shares of Common Stock representing a majority of the total voting power represented by the outstanding Common Stock (the “Minimum Tender Condition”), assures a prompt second-step acquisition of shares not purchased in the initial offer at the same price as the initial offer and meets certain other requirements. An offer meets the Minimum Tender Condition if such offer is conditioned on a minimum of at least the number of shares of Common Stock being tendered that, taken together with the number of shares of Common Stock already beneficially owned by the person making such offer, represent a majority of the outstanding shares of Common Stock on a fully diluted basis.
The Rights will not be exercisable until the Business Day (as defined in the Rights Agreement) at or following the Separation Time and prior to the Expiration Time. The Rights will expire on the earliest of (i) the Exchange Time (as defined below), (ii) the close of business on the day following the certification of voting results of Dynegy’s next annual meeting of stockholders after the filing of Dynegy’s annual report on Form 10-K for the fiscal year 2010, unless the Rights Agreement is approved by Dynegy’s stockholders (in which case it will expire at the first subsequent annual meeting at which it is not approved by a stockholder vote), (iii) the date on which the Rights are terminated as described below and (iv) immediately prior to the effective time of consolidation, merger or statutory share exchange that does not constitute a Flip-over Transaction or Event (as defined below) (in any such case, the “Expiration Time”).
The Exercise Price and the number of Rights outstanding, or in certain circumstances the securities purchasable upon exercise of the Rights, are subject to adjustment from time to time to prevent dilution in the event of a Common Stock dividend on, or a subdivision or a combination into a smaller number of shares of, Common Stock, or the issuance or distribution of any securities or assets in respect of, in lieu of or in exchange for Common Stock.
DYNEGY INC. and DYNEGY HOLDINGS INC.
NOTES TO CONSOLIDATED FINANCIAL STATEMENTS—(Continued)
In the event that prior to the Expiration Time a Flip-in Date occurs, Dynegy is obligated to take such action as is necessary to ensure and provide that each Right (other than Rights Beneficially Owned by the Acquiring Person or any affiliate or associate thereof, which Rights become void) will constitute the right to purchase from Dynegy, upon the exercise thereof in accordance with the terms of the Rights Agreement, that number of shares of Common Stock of Dynegy having an aggregate Market Price (as defined in the Rights Agreement), on the Stock Acquisition Date that gave rise to the Flip-in Date, equal to twice the Exercise Price for an amount in cash equal to the then current Exercise Price. In addition, Dynegy’s Board of Directors may, at its option, at any time after a Flip-in Date and prior to the time that an Acquiring Person becomes the Beneficial Owner of more than 50 percent of the outstanding shares of Common Stock, elect to exchange all (but not less than all) the then outstanding Rights (other than Rights Beneficially Owned by the Acquiring Person or any affiliate or associate thereof, which Rights become void) for shares of Common Stock at an exchange ratio of one share of Common Stock per Right, appropriately adjusted to reflect any stock split, stock dividend or similar transaction occurring after the date of the Separation Time (the “Exchange Ratio”). Immediately upon such action by Dynegy’s Board of Directors (the “Exchange Time”), the right to exercise the Rights will terminate and each Right will thereafter represent only the right to receive a number of shares of Common Stock equal to the Exchange Ratio.
Whenever Dynegy becomes obligated, as described in the preceding paragraph, to issue shares of Common Stock upon exercise of or in exchange for Rights, Dynegy, at its option, may substitute shares of Participating Preferred Stock, at a ratio of one one-hundredth of a share of Participating Preferred Stock for each share of Common Stock otherwise issuable.
Dynegy’s Board of Directors may, at its option, at any time prior to the Flip-in Date, terminate the Rights without any payment to the holders thereof, as provided in the Rights Agreement. Immediately upon the action of Dynegy’s Board of Directors electing to terminate the Rights, without any further action and without any notice, the right to exercise the Rights will terminate and each Right will thereafter be null and void. The holders of Rights will, solely by reason of their ownership of Rights, have no rights as stockholders of Dynegy, including, without limitation, the right to vote or to receive dividends. As long as the Rights are attached to the Common Stock, Dynegy will issue one Right with each new share of Common Stock so that all such shares will have Rights attached.
Preferred Stock.
Dynegy has authorized preferred stock consisting of 20,000,000 shares, $0.01 par value. Dynegy preferred stock may be issued from time to time in one or more series, the shares of each series to have such designations and powers, preferences, rights, qualifications, limitations and restrictions thereof as specified by Dynegy’s Board of Directors.
Common Stock.
At December 31, 2010, there were 121,687,198 shares of Dynegy common stock issued in the aggregate and 628,014 shares were held in treasury. During 2010 and 2009, no quarterly cash dividends were paid by Dynegy.
On May 25, 2010, Dynegy effected a reverse stock split of its outstanding common stock at a ratio of 1-for-5 and proportionately decreased the number of authorized shares of its capital stock. As a result, Dynegy’s authorized capital decreased from 2,100,000,000 shares of common stock to 420,000,000 shares of common stock and its issued and outstanding shares of common stock decreased on May 25, 2010 from 605,192,308 shares of common stock to 121,032,255 shares of common stock.
In addition, the December 31, 2009 consolidated balance sheet has been adjusted in this report to reflect the impact of the reverse stock split so that the basis of presentation is consistent. As a result, Dynegy’s authorized capital was adjusted from 2,100,000,000 shares of common stock to 420,000,000 shares of common stock and its issued and outstanding shares of common stock as of December 31, 2009 was adjusted from 603,577,577 shares of common stock to 120,715,515 shares of common stock.
In 2007, Dynegy established two classes of common shares, Class A and Class B. All of Dynegy’s outstanding Class B common stock was owned by the LS Power. On November 30, 2009, as part of the LS Power Transactions, Dynegy purchased 245 million shares of Dynegy’s Class B common stock. The remaining 95 million shares of Dynegy’s Class B common stock then held by LS Power were converted to Dynegy’s Class A common shares. As a result of the LS Power Transactions, there are currently no outstanding Class B common shares.
DYNEGY INC. and DYNEGY HOLDINGS INC.
NOTES TO CONSOLIDATED FINANCIAL STATEMENTS—(Continued)
Common stock activity for the three years ended December 31, 2010 was as follows:
|
Class B Common Stock
|
||||||||||||||||
|
Class A Common Stock
|
held by LS Power
|
|||||||||||||||
|
Shares
|
Amount
|
Shares
|
Amount
|
|||||||||||||
|
(in millions)
|
||||||||||||||||
|
December 31, 2007
|
101 | $ | 1 | 68 | $ | 1 | ||||||||||
|
Options exercised
|
— | — | — | — | ||||||||||||
|
401(k) plan and profit sharing
|
— | — | — | — | ||||||||||||
|
December 31, 2008
|
101 | $ | 1 | 68 | $ | 1 | ||||||||||
|
401(k) plan and profit sharing
|
1 | — | — | — | ||||||||||||
|
LS Power Transactions:
|
||||||||||||||||
|
Conversion of LS Power Class B shares to Class A shares
|
19 | — | (19 | ) | — | |||||||||||
|
Retirement of Class B shares
|
— | — | (49 | ) | (1 | ) | ||||||||||
|
December 31, 2009
|
121 | $ | 1 | — | $ | — | ||||||||||
|
Options exercised
|
— | — | — | — | ||||||||||||
|
401(k) plan and profit sharing
|
1 | — | — | — | ||||||||||||
|
December 31, 2010
|
122 | $ | 1 | — | $ | — | ||||||||||
On May 25, 2010, Dynegy effected a reverse stock split of its outstanding common stock at a ratio of 1-for-5 and proportionately decreased the number of authorized shares of its capital stock and all prior periods have been adjusted to reflect the reverse stock split.
Treasury Stock
.
During 2010, 2009 and 2008, common shares purchased into treasury totaled 70,337 shares, 44,019 shares, and 23,805 shares respectively. All of the purchases were related to shares withheld to satisfy income tax withholding requirements in connection with forfeitures of restricted stock awards.
As a result of the reverse stock split, the number of common stock shares of Dynegy held as treasury stock at May 25, 2010 decreased from 3,137,959 shares to 627,591 shares. In addition, the December 31, 2009 condensed consolidated balance sheet has been adjusted in this report to reflect the impact of the reverse stock split so that the basis of presentation is consistent. As a result, Dynegy’s shares of treasury stock as of December 31, 2009 was adjusted from 2,788,383 shares to 557,677 shares.
Stock Award Plans.
Dynegy has four stock award plans, all of which provide for the issuance of authorized shares of Dynegy’s common stock. Restricted stock awards and option grants are issued under the plans. Each option granted is exercisable at a strike price, which ranges from $5.65 per share to $240.05 per share for options currently outstanding. A brief description of each plan is provided below:
|
|
●
|
Dynegy 2000 LTIP.
This annual compensation plan, created for all employees upon Illinova’s merger with us, provided for the issuance of 2,000,000 authorized shares through June 2009. Grants from this plan vest in equal annual installments over a three-year period, and options will expire ten years from the date of the grant.
|
|
|
●
|
Dynegy 2001 Non-Executive LTIP.
This plan is a broad-based plan and provides for the issuance of 2,000,000 authorized shares through September 2011. Grants from this plan vest in equal annual installments over a three-year period, and options will expire ten years from the date of the grant. Following the approval of the Dynegy 2010 LTIP, this plan was frozen as to issuance of new awards.
|
DYNEGY INC. and DYNEGY HOLDINGS INC.
NOTES TO CONSOLIDATED FINANCIAL STATEMENTS—(Continued)
|
|
●
|
Dynegy 2002 LTIP.
This annual compensation plan provides for the issuance of 2,000,000 authorized shares through May 2012. Grants from this plan vest in equal annual installments over a three-year period, and options will expire ten years from the date of the grant. Following the approval of the Dynegy 2010 LTIP, this plan was frozen as to issuance of new awards.
|
|
|
●
|
Dynegy 2010 LTIP.
This plan is a broad-based plan and provides for the issuance of 3,700,000 authorized shares through May 2020. Any performance-based stock awards, stock units and other “full-value awards” will generally be subject to a performance period of at least one year and if not performance-based generally subject to a restriction period of at least three years (ratable or cliff vesting). Any options granted under the plan will expire no later than ten years from the date of the grant.
|
All options granted under Dynegy’s option plans cease vesting for employees who are terminated for cause. For severance eligible terminations, as defined under the applicable severance pay plan, disability, retirement or death, continued vesting and/or an extended period in which to exercise vested options may apply, dependent upon the terms of the grant agreement applying to a specific grant that was awarded. It has been Dynegy’s practice to issue shares of common stock upon exercise of stock options generally from previously unissued shares. Options awarded to Dynegy’s executive officers and others who participate in our Executive Change in Control Severance Pay Plan vest immediately upon the occurrence of a change in control.
Compensation expense related to options granted and restricted stock awarded totaled $6 million, $11 million and $15 million for the years ended December 31, 2010, 2009 and 2008, respectively. We recognize compensation expense ratably over the vesting period of the respective awards. Tax benefits for compensation expense related to options granted and restricted stock awarded totaled $2 million, $4 million and $5 million for the years ended December 31, 2010, 2009 and 2008, respectively. As of December 31, 2010, $4 million of total unrecognized compensation expense related to options granted and restricted stock awarded is expected to be recognized over a weighted-average period of 1.9 years. The total fair value of shares vested was $14 million, $12 million and $7 million for the years ended December 31, 2010, 2009 and 2008, respectively. We did not capitalize or use cash to settle any share-based compensation in the years ended December 31, 2010, 2009 or 2008, other than as described above.
Cash received from option exercises for the years ended December 31, 2010, 2009 and 2008 was zero, zero and $2 million, and the tax benefit realized for the additional tax deduction from share-based payment awards totaled zero, zero and $3 million, respectively. The total intrinsic value of options exercised and released for the years ended December 31, 2010, 2009 and 2008 was $2 million, $1 million and $5 million, respectively.
In 2010 and 2009, we granted stock-based compensation awards to certain of our employees that cliff vest after three years based partly on the achievement of certain targets for Dynegy’s stock price for February 2012 and 2013, respectively, and partly on the achievement of certain earnings targets. In 2008, we granted stock-based compensation awards to certain of our employees that cliff vest after three years based on the achievement of a certain target for Dynegy’s stock price for February 2011. A net compensation expense of $5 million was recorded during the year ended December 31, 2010. A compensation benefit of $1 million was recorded in the year ended December 31, 2009. This benefit was due to the change in fair value of our outstanding awards reflecting market conditions. Compensation expense recorded in the year ended December 31, 2008 was $5 million related to these “performance units” and was accrued in Other long-term liabilities in our consolidated balance sheets.
DYNEGY INC. and DYNEGY HOLDINGS INC.
NOTES TO CONSOLIDATED FINANCIAL STATEMENTS—(Continued)
Stock option activity for the years ended December 31, 2010, 2009 and 2008 was as follows:
| Year Ended December 31, | ||||||||||||||||||||||||
| 2010 | 2009 | 2008 | ||||||||||||||||||||||
| Options |
Weighted
Average
Exercise Price |
Options |
Weighted
Average Exercise Price |
Options |
Weighted
Average Exercise Price |
|||||||||||||||||||
|
(options in thousands)
|
||||||||||||||||||||||||
|
Outstanding at beginning of period
|
2,822 | $ | 34.35 | 1,711 | $ | 60.12 | 1,684 | $ | 63.00 | |||||||||||||||
|
Granted
|
668 | $ | 7.20 | 1,267 | $ | 5.65 | 313 | $ | 37.40 | |||||||||||||||
|
Exercised
|
(11 | ) | $ | 5.65 | (4 | ) | $ | 5.65 | (111 | ) | $ | 20.16 | ||||||||||||
|
Cancelled or expired
|
(181 | ) | $ | 142.25 | (152 | ) | $ | 86.10 | (175 | ) | $ | 72.50 | ||||||||||||
|
Outstanding at end of period
|
3,298 | $ | 23.03 | 2,822 | $ | 34.35 | 1,711 | $ | 60.12 | |||||||||||||||
|
Vested and unvested expected to vest
|
3,298 | $ | 23.03 | 2,822 | $ | 34.35 | 1,711 | $ | 60.12 | |||||||||||||||
|
Exercisable at end of period
|
1,712 | $ | 36.80 | 1,257 | $ | 61.06 | 1,165 | $ | 68.39 | |||||||||||||||
|
Year Ended December 31, 2010
|
||||||||
|
Weighted Average Remaining Contractual Life
(in years)
|
Aggregate Intrinsic Value
(in millions)
|
|||||||
|
Outstanding at end of period
|
6.90 | $ | — | |||||
|
Vested and unvested expected to vest
|
6.90 | $ | — | |||||
|
Exercisable at end of period
|
5.64 | $ | — | |||||
During the three-year period ended December 31, 2010, we did not grant any options at an exercise price less than the market price on the date of grant. On May 25, 2010, Dynegy effected a reverse stock split of its outstanding common stock at a ratio of 1-for-5 and proportionately decreased the number of authorized shares of its capital stock and all prior periods have been adjusted to reflect the reverse stock split.
Options outstanding as of December 31, 2010 are summarized below:
|
Options Outstanding
|
Options Exercisable
|
|||||||||||||||||||
|
Range of Exercise Prices
|
Number of Options Outstanding at
December 31, 2010
|
Weighted Average Remaining Contractual Life (Years)
|
Weighted Average Exercise Price
|
Number of Options Exercisable at
December 31, 2010
|
Weighted Average Exercise Price
|
|||||||||||||||
|
(options in thousands)
|
||||||||||||||||||||
|
$5.65
|
1,252 | 7.78 | $ | 5.65 | 423 | $ | 5.65 | |||||||||||||
|
$7.20
|
668 | 8.95 | $ | 7.20 | 4 | $ | 7.20 | |||||||||||||
|
$8.85 - $22.40
|
103 | 3.27 | $ | 18.51 | 103 | $ | 18.51 | |||||||||||||
|
$24.40
|
480 | 5.21 | $ | 24.40 | 480 | $ | 24.40 | |||||||||||||
|
$37.40
|
289 | 6.78 | $ | 37.40 | 196 | $ | 37.40 | |||||||||||||
|
$48.35
|
375 | 5.77 | $ | 48.35 | 375 | $ | 48.35 | |||||||||||||
|
$50.85 - $192.75
|
85 | 0.89 | $ | 125.39 | 85 | $ | 125.39 | |||||||||||||
|
$235.95
|
44 | 0.05 | $ | 235.95 | 44 | $ | 235.95 | |||||||||||||
|
$239.90
|
1 | 0.42 | $ | 239.90 | 1 | $ | 239.90 | |||||||||||||
|
$240.05
|
1 | 0.45 | $ | 240.05 | 1 | $ | 240.05 | |||||||||||||
| 3,298 | 1,712 | |||||||||||||||||||
DYNEGY INC. and DYNEGY HOLDINGS INC.
NOTES TO CONSOLIDATED FINANCIAL STATEMENTS—(Continued)
On May 25, 2010, Dynegy effected a reverse stock split of its outstanding common stock at a ratio of 1-for-5 and proportionately decreased the number of authorized shares of its capital stock and all prior periods have been adjusted to reflect the reverse stock split.
For stock options, we determine the fair value of each stock option at the grant date using a Black-Scholes model, with the following weighted-average assumptions used for grants.
|
Year Ended December 31,
|
||||||||||||
|
2010
|
2009
|
2008
|
||||||||||
|
Dividends
|
— | — | — | |||||||||
|
Expected volatility (historical)
|
62.45 | % | 61.04 | % | 45.07 | % | ||||||
|
Risk-free interest rate
|
2.865 | % | 2.834 | % | 3.80 | % | ||||||
|
Expected option life
|
6 Years
|
6 Years
|
5 Years
|
|||||||||
The expected volatility was calculated based on a six-, six- and five-year historical volatility of Dynegy’s Class A common stock price for the years ended December 31, 2010, 2009 and 2008, respectively. The risk-free interest rate was calculated based upon observed interest rates appropriate for the term of our employee stock options. Currently, we calculate the expected option life using the simplified methodology suggested by authoritative guidance issued by the SEC. For restricted stock awards, we consider the fair value to be the closing price of the stock on the grant date. We recognize the fair value of our share-based payments over the vesting periods of the awards, which is typically a three-year service period.
The weighted average grant-date fair value of options granted during the years ended December 31, 2010, 2009 and 2008 was $4.25, $3.30 and $18.15, respectively.
Restricted stock activity for the three years ended December 31, 2010 was as follows:
|
Year Ended December 31,
|
||||||||||||||||
|
2010
|
2010
Weighted
Average Grant Date Fair Value |
2009
|
2008
|
|||||||||||||
|
(restricted stock shares in thousands)
|
||||||||||||||||
|
Outstanding at beginning of period
|
352 | $ | 42.47 | 509 | 310 | |||||||||||
|
Granted
|
378 | $ | 7.20 | — | 289 | (1) | ||||||||||
|
Vested
|
(230 | ) | $ | 44.82 | (138 | ) | (73 | ) | ||||||||
|
Cancelled or expired
|
(3 | ) | $ | 38.36 | (19 | ) | (17 | ) | ||||||||
|
Outstanding at end of period
|
497 | $ | 14.60 | 352 | 509 | |||||||||||
|
|
(1)
|
We awarded 289,012 shares of restricted stock in March 2008. The closing stock price was $37.40 on the date of the award.
|
All restricted stock awards to employees vest immediately upon the occurrence of a change in control in accordance with the terms of the applicable Change in Control Severance Pay Plan.
DYNEGY INC. and DYNEGY HOLDINGS INC.
NOTES TO CONSOLIDATED FINANCIAL STATEMENTS—(Continued)
We sponsor and administer defined benefit plans and defined contribution plans for the benefit of our employees. We also provide other post retirement benefits to retirees who meet age and service requirements. The following summarizes these plans:
Short-Term Incentive Plan.
We maintain a discretionary incentive compensation plan to provide employees with rewards for the achievement of corporate goals and individual, professional accomplishments. Specific awards are determined by the Compensation and Human Resources Committee of the Board of Directors and are based on predetermined goals and objectives established at the start of each performance year.
Phantom Stock Plan.
In 2010 and 2009, Dynegy issued phantom stock units under its 2009 Phantom Stock Plan. Units awarded under this plan are long term incentive awards that grant the participant the right to receive a cash payment based on the fair market value of the of Dynegy’s stock on the vesting date of the award. As these awards must be settled in cash, we account for them as liabilities, with changes in the fair value of the liability recognized as expense in our consolidated statements of operations. Expense recognized in connection with these awards was $7 million and $12 million for the years ended December 31, 2010 and 2009, respectively.
401(k) Savings Plans.
For the three years ended December 31, 2010, 2009 and 2008, our employees participated in four 401(k) savings plans, all of which meet the requirements of Section 401(k) of the Internal Revenue Code and are defined contribution plans subject to the provisions of ERISA. The following summarizes the plans:
|
|
●
|
Dynegy Inc. 401(k) Savings Plan.
This plan and the related trust fund are established and maintained for the exclusive benefit of participating employees in the United States. Generally, all employees of designated Dynegy subsidiaries are eligible to participate in the plan. Employee pre-tax and Roth contributions to the plan are matched by the company at 100 percent, up to a maximum of five percent of base pay, subject to IRS limitations. Vesting in company contributions was previously based on years of service with 25 percent vesting per full year of service. However, effective January 1, 2009, generally, vesting in company contributions is based on years of service with 50 percent vesting per full year of service. The Plan also allows for a discretionary contribution to eligible employee accounts for each plan year, subject to the sole discretion of the Compensation and Human Resources Committee of the Board of Directors. Matching and discretionary contributions, if any, are allocated in the form of units in the Dynegy common stock fund. During the years ended December 31, 2010, 2009 and 2008, we issued approximately 0.4 million, 0.4 million and 0.2 million shares, respectively, of Dynegy’s Class A common stock in the form of matching contributions to fund the plan. No discretionary contributions were made for any of the years in the three-year period ended December 31, 2010.
|
|
|
●
|
Dynegy Midwest Generation, Inc. 401(K) Savings Plan (formerly the Illinois Power Company Incentive Savings Plan) and Dynegy Midwest Generation, Inc. 401(K) Savings Plan for Employees Covered Under a Collective Bargaining Agreement (formerly the Illinois Power Company Incentive Savings Plan for Employees Covered Under A Collective Bargaining Agreement).
We match 50 percent of employee pre-tax and Roth contributions to the plans, up to a maximum of six percent of base pay, subject to IRS limitations. Employees are immediately 100 percent vested in all contributions. The Plan also provides for an annual discretionary contribution to eligible employee accounts for a plan year, subject to the sole discretion of the Compensation and Human Resources Committee of the Board of Directors. Matching contributions and discretionary contributions, if any, to the plans are initially allocated in the form of units in the Dynegy common stock fund. During the years ended December 31, 2010, 2009 and 2008, we issued 0.2 million, 0.1 million and zero million shares, respectively, of Dynegy’s Class A common stock in the form of matching contributions to the plans. No discretionary contributions were made for any of the years in the three-year period ended December 31, 2010.
|
|
|
●
|
Dynegy Northeast Generation, Inc. Savings Incentive Plan.
Under this plan we match 50 percent of employee pre-tax contributions up to six percent of base pay for union employees and 50 percent of employee contributions up to eight percent of base pay for non-union employees, in each case subject to IRS limitations. Employees are immediately 100 percent vested in our contributions. Matching contributions to this plan are made in cash and invested according to the employee’s investment discretion.
|
DYNEGY INC. and DYNEGY HOLDINGS INC.
NOTES TO CONSOLIDATED FINANCIAL STATEMENTS—(Continued)
During the years ended December 31, 2010, 2009 and 2008, we recognized aggregate costs related to these employee compensation plans of $5 million, $5 million and $5 million, respectively.
Pension and Other Post-Retirement Benefits
We have various defined benefit pension plans and post-retirement benefit plans. Generally, all employees participate in the pension plans (subject to the plans eligibility requirements), but only some of our employees participate in the other post-retirement medical and life insurance benefit plans. Our pension plans are in the form of cash balance plans and more traditional career average or final average pay formula plans.
Restoration Plans.
In 2008, we adopted the Dynegy Inc. Restoration 401(k) Savings Plan, or the Restoration 401(k) Plan, and the Dynegy Inc. Restoration Pension Plan, or the Restoration Pension Plan, two nonqualified plans that supplement or restore benefits lost by certain of our highly compensated employees under the qualified plans as a result of Internal Revenue Code limitations that apply to the qualified plans. The Restoration 401(k) Plan is intended to supplement benefits under certain of the 401(k) plans, and the Restoration Pension Plan is intended to supplement benefits under certain of the pension plans. Employees who are eligible employees under the related qualified plans and earn in excess of certain of the qualified plan limits are eligible to participate in the restoration plans. The definitions of plan pay under the restoration plans, as well as the vesting rules, mirror those under the related qualified plans. Benefits under the restoration plans are paid as a lump sum.
Obligations and Funded Status.
The following tables contain information about the obligations and funded status of these plans on a combined basis:
|
Pension Benefits
|
Other Benefits
|
|||||||||||||||
|
2010
|
2009
|
2010
|
2009
|
|||||||||||||
|
(in millions)
|
||||||||||||||||
|
Projected benefit obligation, beginning of the year
|
$ | 242 | $ | 217 | $ | 65 | $ | 61 | ||||||||
|
Service cost
|
11 | 12 | 3 | 3 | ||||||||||||
|
Interest cost
|
14 | 13 | 4 | 3 | ||||||||||||
|
Actuarial (gain) loss
|
13 | 6 | (1 | ) | (1 | ) | ||||||||||
|
Benefits paid
|
(8 | ) | (6 | ) | (2 | ) | (1 | ) | ||||||||
|
Projected benefit obligation, end of the year
|
$ | 272 | $ | 242 | $ | 69 | $ | 65 | ||||||||
|
Fair value of plan assets, beginning of the year
|
$ | 186 | $ | 135 | $ | — | $ | — | ||||||||
|
Actual return on plan assets
|
25 | 30 | — | — | ||||||||||||
|
Employer contributions
|
18 | 27 | 2 | 1 | ||||||||||||
|
Benefits paid
|
(8 | ) | (6 | ) | (2 | ) | (1 | ) | ||||||||
|
Fair value of plan assets, end of the year
|
$ | 221 | $ | 186 | $ | — | $ | — | ||||||||
|
Funded status
|
$ | (51 | ) | $ | (56 | ) | $ | (69 | ) | $ | (65 | ) | ||||
DYNEGY INC. and DYNEGY HOLDINGS INC.
NOTES TO CONSOLIDATED FINANCIAL STATEMENTS—(Continued)
The accumulated benefit obligation for all defined benefit pension plans was $243 million and $214 million at December 31, 2010 and 2009, respectively. The following summarizes information for our defined benefit pension plans, all of which have an accumulated benefit obligation in excess of plan assets at December 31, 2010:
|
December 31,
|
||||||||
|
2010
|
2009
|
|||||||
|
(in millions)
|
||||||||
|
Projected benefit obligation
|
$ | 272 | $ | 242 | ||||
|
Accumulated benefit obligation
|
243 | 214 | ||||||
|
Fair value of plan assets
|
221 | 186 | ||||||
Pre-tax amounts recognized in Accumulated other comprehensive loss consist of:
|
Year Ended December 31,
|
||||||||||||||||
|
2010
|
2009
|
|||||||||||||||
|
Pension Benefits
|
Other Benefits
|
Pension Benefits
|
Other Benefits
|
|||||||||||||
|
(in millions)
|
||||||||||||||||
|
Prior service cost
|
$ | 4 | $ | (1 | ) | $ | 5 | $ | (1 | ) | ||||||
|
Actuarial loss
|
80 | 9 | 82 | 10 | ||||||||||||
|
Net losses recognized
|
$ | 84 | $ | 8 | $ | 87 | $ | 9 | ||||||||
Amounts recognized in the consolidated balance sheets consist of:
|
Year Ended December 31,
|
||||||||||||||||
|
2010
|
2009
|
|||||||||||||||
|
Pension Benefits
|
Other Benefits
|
Pension Benefits
|
Other Benefits
|
|||||||||||||
|
(in millions)
|
||||||||||||||||
|
Current liabilities
|
$ | — | $ | (2 | ) | $ | — | $ | (1 | ) | ||||||
|
Noncurrent liabilities
|
(51 | ) | (67 | ) | (56 | ) | (64 | ) | ||||||||
|
Net amount recognized
|
$ | (51 | ) | $ | (69 | ) | $ | (56 | ) | $ | (65 | ) | ||||
The estimated net actuarial loss and prior service cost that will be amortized from Accumulated other comprehensive loss into net periodic benefit cost during the year ended December 31, 2011 for the defined benefit pension plans are $6 million and less than $1 million, respectively. The estimated net actuarial loss and prior service cost that will be amortized from Accumulated other comprehensive loss into net periodic benefit cost during the year ended December 31, 2011 for other postretirement benefit plans are both zero. The amortization of prior service cost is determined using a straight line amortization of the cost over the average remaining service period of employees expected to receive benefits under the Plan.
Components of Net Periodic Benefit Cost.
The components of net periodic benefit cost were:
|
Pension Benefits
|
Other Benefits
|
|||||||||||||||||||||||
|
2010
|
2009
|
2008
|
2010
|
2009
|
2008
|
|||||||||||||||||||
|
(in millions)
|
||||||||||||||||||||||||
|
Service cost benefits earned during period
|
$ | 11 | $ | 12 | $ | 11 | $ | 3 | $ | 3 | $ | 3 | ||||||||||||
|
Interest cost on projected benefit obligation
|
14 | 13 | 11 | 4 | 3 | 4 | ||||||||||||||||||
|
Expected return on plan assets
|
(16 | ) | (14 | ) | (13 | ) | — | — | — | |||||||||||||||
|
Amortization of prior service costs
|
— | — | 1 | — | — | — | ||||||||||||||||||
|
Recognized net actuarial loss
|
5 | 4 | — | — | 1 | — | ||||||||||||||||||
|
Total net periodic benefit cost
|
$ | 14 | $ | 15 | $ | 10 | $ | 7 | $ | 7 | $ | 7 | ||||||||||||
DYNEGY INC. and DYNEGY HOLDINGS INC.
NOTES TO CONSOLIDATED FINANCIAL STATEMENTS—(Continued)
Assumptions.
The following weighted average assumptions were used to determine benefit obligations:
|
|
Pension Benefits
|
Other Benefits
|
|||||
|
December 31,
|
December 31,
|
||||||
|
2010
|
2009
|
2010
|
2009
|
||||
|
Discount rate (1)
|
5.49%
|
5.86%
|
5.61%
|
5.92%
|
|||
|
Rate of compensation increase
|
4.50%
|
4.50%
|
4.50%
|
4.50%
|
|||
|
|
(1)
|
We utilized a yield curve approach to determine the discount. Projected benefit payments for the plans were matched against the discount rates in the yield curve.
|
The following weighted average assumptions were used to determine net periodic benefit cost:
|
Pension Benefits
|
Other Benefits
|
|||||||||||||||||||||||
|
Year Ended December 31,
|
Year Ended December 31,
|
|||||||||||||||||||||||
|
2010
|
2009
|
2008
|
2010
|
2009
|
2008
|
|||||||||||||||||||
|
Discount rate
|
5.86 | % | 6.12 | % | 6.46 | % | 5.92 | % | 5.93 | % | 6.48 | % | ||||||||||||
|
Expected return on plan assets
|
8.00 | % | 8.25 | % | 8.25 | % | N/A | N/A | N/A | |||||||||||||||
|
Rate of compensation increase
|
4.50 | % | 4.50 | % | 4.50 | % | 4.50 | % | 4.50 | % | 4.50 | % | ||||||||||||
Our expected long-term rate of return on plan assets for the year ended December 31, 2011 will be 8 percent. This figure begins with a blend of asset class-level returns developed under a theoretical global capital asset pricing model methodology conducted by an outside consultant. In development of this figure, the historical relationships between equities and fixed income are preserved consistent with the widely accepted capital market principle that assets with higher volatility generate a greater return over the long-term. Current market factors such as inflation and interest rates are also incorporated in the assumptions. The figure also incorporates an upward adjustment reflecting the plan’s use of active management and favorable past experience.
The following summarizes our assumed health care cost trend rates:
|
December 31,
|
||||||||
|
2010
|
2009
|
|||||||
|
Health care cost trend rate assumed for next year
|
8.00 | % | 8.00 | % | ||||
|
Ultimate trend rate
|
5.00 | % | 4.90 | % | ||||
|
Year that the rate reaches the ultimate trend rate
|
2016 | 2060 | ||||||
Assumed health care cost trend rates have a significant effect on the amounts reported for the health care plans. The impact of a one percent increase/decrease in assumed health care cost trend rates is as follows:
|
Increase
|
Decrease
|
|||||||
|
(in millions)
|
||||||||
|
Aggregate impact on service cost and interest cost
|
$ | 1 | $ | (1 | ) | |||
|
Impact on accumulated post-retirement benefit obligation
|
$ | 12 | $ | (9 | ) | |||
Plan Assets.
We employ a total return investment approach whereby a mix of equities and fixed income investments are used to maximize the long-term return of plan assets for a prudent level of risk. The intent of this strategy is to minimize plan expenses by outperforming plan liabilities over the long run. Risk tolerance is established through careful consideration of plan liabilities, plan funded status, and corporate financial condition. The investment portfolio contains a diversified blend of equity and fixed income investments. Furthermore, equity investments are diversified across U.S. and non-U.S. stocks as well as growth, value, and small and large capitalizations. The target allocations for plan assets are thirty-five percent fixed income securities, forty percent U.S. equity securities, five percent non-US equity securities, and twenty percent global equity securities.
DYNEGY INC. and DYNEGY HOLDINGS INC.
NOTES TO CONSOLIDATED FINANCIAL STATEMENTS—(Continued)
Derivatives may be used to gain market exposure in an efficient and timely manner; however, derivatives may not be used to leverage the portfolio beyond the market value of the underlying investment. Investment risk is measured and monitored on an ongoing basis through quarterly investment portfolio reviews, periodic asset/liability studies, and annual liability measurements.
The following table sets forth by level within the fair value hierarchy assets that were accounted for at fair value related to our pension plans. These assets are classified in their entirety based on the lowest level of input that is significant to the fair value measurement. Our assessment of the significance of a particular input to the fair value measurement requires judgment, and may affect the valuation of fair value assets and liabilities and their placement within the fair value hierarchy levels.
|
Fair Value as of December 31, 2010
|
||||||||||||||||
|
Level 1
|
Level 2
|
Level 3
|
Total
|
|||||||||||||
|
(in millions)
|
||||||||||||||||
|
Equity securities:
|
||||||||||||||||
|
U.S. companies (1)
|
$ | — | $ | 93 | $ | — | $ | 93 | ||||||||
|
Non-U.S. companies (2)
|
— | 11 | — | 11 | ||||||||||||
|
International (3)
|
— | 46 | — | 46 | ||||||||||||
|
Fixed income securities (4)
|
35 | 36 | — | 71 | ||||||||||||
|
Total
|
$ | 35 | $ | 186 | $ | — | $ | 221 | ||||||||
|
|
(1)
|
This category comprises a domestic common collective trust not actively managed that tracks the Dow Jones total U.S. stock market.
|
|
|
(2)
|
This category comprises a common collective trust not actively managed that tracks the MSCI All Country World Ex-US Index.
|
|
|
(3)
|
This category comprises actively managed common collective trusts that hold U.S. and foreign equities. These trusts track the MSCI World Index.
|
|
|
(4)
|
This category includes a mutual fund and a trust that invest primarily in investment grade corporate bonds.
|
Contributions and Payments.
During the year ended December 31, 2010, we contributed approximately $18 million to our pension plans and $2 million to our other post-retirement benefit plans. In 2011, we expect to contribute approximately $12 million to our pension plans and $2 million to our other postretirement benefit plans.
Our expected benefit payments for future services for our pension and other postretirement benefits are as follows:
|
Pension Benefits
|
Other Benefits
|
|||||||
|
(in millions)
|
||||||||
|
2011
|
$ | 14 | $ | 2 | ||||
|
2012
|
13 | 2 | ||||||
|
2013
|
13 | 3 | ||||||
|
2014
|
13 | 3 | ||||||
|
2015
|
14 | 3 | ||||||
|
2016 – 2020
|
93 | 22 | ||||||
We report results of our power generation business in the following segments: (i) GEN-MW, (ii) GEN-WE and (iii) GEN-NE. Because of the diversity among their respective operations and how we allocate our resources, we report the results of each business as a separate segment in our consolidated financial statements. The results of our legacy operations are included in Other. Our consolidated financial results also reflect corporate-level expenses such as general and administrative and interest and depreciation and amortization.
DYNEGY INC. and DYNEGY HOLDINGS INC.
NOTES TO CONSOLIDATED FINANCIAL STATEMENTS—(Continued)
During 2010, two customers in our GEN-MW segment and one customer in our GEN-NE segment accounted for approximately 30 percent, 13 percent and 15 percent of our consolidated revenues, respectively. During 2009, two customers in our GEN-MW segment and one customer in our GEN-NE segment accounted for approximately 19 percent, 11 percent and 12 percent of our consolidated revenues, respectively. During 2008, one customer in our GEN-MW segment and one customer in our GEN-NE segment accounted for approximately 27 percent and 11 percent of our consolidated revenues, respectively.
Reportable segment information for Dynegy, including intercompany transactions accounted for at prevailing market rates, for the years ended December 31, 2010, 2009 and 2008 is presented below:
Dynegy’s Segment Data as of and for the Year Ended December 31, 2010
(in millions)
|
Power Generation
|
||||||||||||||||||||
|
GEN-MW
|
GEN-WE
|
GEN-NE
|
Other
|
Total
|
||||||||||||||||
|
Unaffiliated revenues:
|
||||||||||||||||||||
|
Domestic
|
$ | 1,126 | $ | 455 | $ | 742 | $ | — | $ | 2,323 | ||||||||||
|
Other
|
— | — | — | — | — | |||||||||||||||
|
Total revenues
|
$ | 1,126 | $ | 455 | $ | 742 | $ | — | $ | 2,323 | ||||||||||
|
Depreciation and amortization
|
$ | (296 | ) | $ | (66 | ) | $ | (24 | ) | $ | (6 | ) | $ | (392 | ) | |||||
|
Impairment and other charges
|
(4 | ) | (1 | ) | (137 | ) | (6 | ) | (148 | ) | ||||||||||
|
Operating income (loss)
|
$ | 108 | $ | 118 | $ | (60 | ) | $ | (177 | ) | $ | (11 | ) | |||||||
|
Losses from unconsolidated investments
|
(62 | ) | — | — | — | (62 | ) | |||||||||||||
|
Other items, net
|
1 | — | 1 | 2 | 4 | |||||||||||||||
|
Interest expense
|
(363 | ) | ||||||||||||||||||
|
Loss from continuing operations before taxes
|
(432 | ) | ||||||||||||||||||
|
Income tax benefit
|
197 | |||||||||||||||||||
|
Loss from continuing operations
|
(235 | ) | ||||||||||||||||||
|
Income from discontinued operations, net of taxes
|
1 | |||||||||||||||||||
|
Net loss
|
$ | (234 | ) | |||||||||||||||||
|
Identifiable assets:
|
||||||||||||||||||||
|
Domestic
|
$ | 5,027 | $ | 1,988 | $ | 1,653 | $ | 1,345 | $ | 10,013 | ||||||||||
|
Other
|
— | — | — | — | — | |||||||||||||||
|
Total
|
$ | 5,027 | $ | 1,988 | $ | 1,653 | $ | 1,345 | $ | 10,013 | ||||||||||
|
Capital expenditures and investments in unconsolidated affiliates
|
$ | (315 | ) | $ | (19 | ) | $ | (8 | ) | $ | (6 | ) | $ | (348 | ) | |||||
DYNEGY INC. and DYNEGY HOLDINGS INC.
NOTES TO CONSOLIDATED FINANCIAL STATEMENTS—(Continued)
Dynegy’s Segment Data as of and for the Year Ended December 31, 2009
(in millions)
|
Power Generation
|
||||||||||||||||||||
|
GEN-MW
|
GEN-WE
|
GEN-NE
|
Other
|
Total
|
||||||||||||||||
|
Unaffiliated revenues:
|
||||||||||||||||||||
|
Domestic
|
$ | 1,257 | $ | 380 | $ | 834 | $ | (3 | ) | $ | 2,468 | |||||||||
|
Other
|
— | — | — | — | — | |||||||||||||||
|
Total revenues
|
$ | 1,257 | $ | 380 | $ | 834 | $ | (3 | ) | $ | 2,468 | |||||||||
|
Depreciation and amortization
|
$ | (215 | ) | $ | (62 | ) | $ | (47 | ) | $ | (11 | ) | $ | (335 | ) | |||||
|
Goodwill impairments
|
(76 | ) | (260 | ) | (97 | ) | — | (433 | ) | |||||||||||
|
Impairment and other charges
|
(147 | ) | — | (391 | ) | — | (538 | ) | ||||||||||||
|
Operating loss
|
$ | (4 | ) | $ | (218 | ) | $ | (444 | ) | $ | (168 | ) | $ | (834 | ) | |||||
|
Earnings (losses) from unconsolidated investments
|
— | (72 | ) | — | 1 | (71 | ) | |||||||||||||
|
Other items, net
|
2 | 3 | 1 | 5 | 11 | |||||||||||||||
|
Interest expense and debt extinguishment costs
|
(461 | ) | ||||||||||||||||||
|
Loss from continuing operations before taxes
|
(1,355 | ) | ||||||||||||||||||
|
Income tax benefit
|
315 | |||||||||||||||||||
|
Loss from continuing operations
|
(1,040 | ) | ||||||||||||||||||
|
Loss from discontinued operations, net of taxes
|
(222 | ) | ||||||||||||||||||
|
Net loss
|
(1,262 | ) | ||||||||||||||||||
|
Less: Net loss attributable to the noncontrolling interests
|
(15 | ) | ||||||||||||||||||
|
Net loss attributable to Dynegy Inc.
|
$ | (1,247 | ) | |||||||||||||||||
|
Identifiable assets:
|
||||||||||||||||||||
|
Domestic
|
$ | 6,035 | $ | 1,762 | $ | 1,751 | $ | 1,381 | $ | 10,929 | ||||||||||
|
Other
|
— | — | — | 24 | 24 | |||||||||||||||
|
Total
|
$ | 6,035 | $ | 1,762 | $ | 1,751 | $ | 1,405 | $ | 10,953 | ||||||||||
|
Capital expenditures
|
$ | (533 | ) | $ | (45 | ) | $ | (28 | ) | $ | (6 | ) | $ | (612 | ) | |||||
DYNEGY INC. and DYNEGY HOLDINGS INC.
NOTES TO CONSOLIDATED FINANCIAL STATEMENTS—(Continued)
Dynegy’s Segment Data as of and for the Year Ended December 31, 2008
(in millions)
|
Power Generation
|
||||||||||||||||||||
|
GEN-MW
|
GEN-WE
|
GEN-NE
|
Other
|
Total
|
||||||||||||||||
|
Unaffiliated revenues:
|
||||||||||||||||||||
|
Domestic
|
$ | 1,621 | $ | 702 | $ | 890 | $ | (5 | ) | $ | 3,208 | |||||||||
|
Other
|
— | — | 116 | — | 116 | |||||||||||||||
|
Total revenues
|
$ | 1,621 | $ | 702 | $ | 1,006 | $ | (5 | ) | $ | 3,324 | |||||||||
|
Depreciation and amortization
|
$ | (205 | ) | $ | (77 | ) | $ | (54 | ) | $ | (10 | ) | $ | (346 | ) | |||||
|
Operating income (loss)
|
$ | 686 | $ | 123 | $ | 67 | $ | (132 | ) | $ | 744 | |||||||||
|
Losses from unconsolidated investments
|
— | (40 | ) | — | (83 | ) | (123 | ) | ||||||||||||
|
Other items, net
|
— | 5 | 6 | 73 | 84 | |||||||||||||||
|
Interest expense
|
(427 | ) | ||||||||||||||||||
|
Income from continuing operations before taxes
|
278 | |||||||||||||||||||
|
Income tax expense
|
(90 | ) | ||||||||||||||||||
|
Income from continuing operations
|
188 | |||||||||||||||||||
|
Loss from discontinued operations, net of taxes
|
(17 | ) | ||||||||||||||||||
|
Net income
|
171 | |||||||||||||||||||
|
Less: Net loss attributable to the noncontrolling interests
|
(3 | ) | ||||||||||||||||||
|
Net income attributable to Dynegy Inc.
|
$ | 174 | ||||||||||||||||||
|
Identifiable assets:
|
||||||||||||||||||||
|
Domestic
|
$ | 6,763 | $ | 3,410 | $ | 2,534 | $ | 1,494 | $ | 14,201 | ||||||||||
|
Other
|
— | — | 5 | 7 | 12 | |||||||||||||||
|
Total
|
$ | 6,763 | $ | 3,410 | $ | 2,539 | $ | 1,501 | $ | 14,213 | ||||||||||
|
Unconsolidated investments
|
$ | — | $ | — | $ | — | $ | 15 | $ | 15 | ||||||||||
|
Capital expenditures and investments in unconsolidated affiliates
|
$ | (530 | ) | $ | (29 | ) | $ | (36 | ) | $ | (32 | ) | $ | (627 | ) | |||||
DYNEGY INC. and DYNEGY HOLDINGS INC.
NOTES TO CONSOLIDATED FINANCIAL STATEMENTS—(Continued)
Reportable segment information for DHI, including intercompany transactions accounted for at prevailing market rates, for the years ended December 31, 2010, 2009 and 2008 is presented below:
DHI’s Segment Data as of and for the Year Ended December 31, 2010
(in millions)
|
Power Generation
|
||||||||||||||||||||
|
GEN-MW
|
GEN-WE
|
GEN-NE
|
Other
|
Total
|
||||||||||||||||
|
Unaffiliated revenues:
|
||||||||||||||||||||
|
Domestic
|
$ | 1,126 | $ | 455 | $ | 742 | $ | — | $ | 2,323 | ||||||||||
|
Other
|
— | — | — | — | — | |||||||||||||||
|
Total revenues
|
$ | 1,126 | $ | 455 | $ | 742 | $ | — | $ | 2,323 | ||||||||||
|
Depreciation and amortization
|
$ | (296 | ) | $ | (66 | ) | $ | (24 | ) | $ | (6 | ) | $ | (392 | ) | |||||
|
Impairment and other charges
|
(4 | ) | (1 | ) | (137 | ) | (6 | ) | (148 | ) | ||||||||||
|
Operating income (loss)
|
$ | 108 | $ | 118 | $ | (60 | ) | $ | (172 | ) | $ | (6 | ) | |||||||
|
Losses from unconsolidated investments
|
(62 | ) | — | — | — | (62 | ) | |||||||||||||
|
Other items, net
|
1 | — | 1 | 2 | 4 | |||||||||||||||
|
Interest expense
|
(363 | ) | ||||||||||||||||||
|
Loss from continuing operations before taxes
|
(427 | ) | ||||||||||||||||||
|
Income tax benefit
|
184 | |||||||||||||||||||
|
Loss from continuing operations
|
(243 | ) | ||||||||||||||||||
|
Income from discontinued operations, net of taxes
|
1 | |||||||||||||||||||
|
Net loss
|
$ | (242 | ) | |||||||||||||||||
|
Identifiable assets:
|
||||||||||||||||||||
|
Domestic
|
$ | 5,027 | $ | 1,988 | $ | 1,653 | $ | 1,281 | $ | 9,949 | ||||||||||
|
Other
|
— | — | — | — | — | |||||||||||||||
|
Total
|
$ | 5,027 | $ | 1,988 | $ | 1,653 | $ | 1,281 | $ | 9,949 | ||||||||||
|
Capital expenditures and investments in unconsolidated affiliates
|
$ | (315 | ) | $ | (19 | ) | $ | (8 | ) | $ | (6 | ) | $ | (348 | ) | |||||
DYNEGY INC. and DYNEGY HOLDINGS INC.
NOTES TO CONSOLIDATED FINANCIAL STATEMENTS—(Continued)
DHI’s Segment Data as of and for the Year Ended December 31, 2009
(in millions)
|
Power Generation
|
||||||||||||||||||||
|
GEN-MW
|
GEN-WE
|
GEN-NE
|
Other
|
Total
|
||||||||||||||||
|
Unaffiliated revenues:
|
||||||||||||||||||||
|
Domestic
|
$ | 1,257 | $ | 380 | $ | 834 | $ | (3 | ) | $ | 2,468 | |||||||||
|
Other
|
— | — | — | — | — | |||||||||||||||
|
Total revenues
|
$ | 1,257 | $ | 380 | $ | 834 | $ | (3 | ) | $ | 2,468 | |||||||||
|
Depreciation and amortization
|
$ | (215 | ) | $ | (62 | ) | $ | (47 | ) | $ | (11 | ) | $ | (335 | ) | |||||
|
Goodwill impairments
|
(76 | ) | (260 | ) | (97 | ) | — | (433 | ) | |||||||||||
|
Impairment and other charges
|
(147 | ) | — | (391 | ) | — | (538 | ) | ||||||||||||
|
Operating loss
|
$ | (4 | ) | $ | (218 | ) | $ | (444 | ) | $ | (170 | ) | $ | (836 | ) | |||||
|
Losses from unconsolidated investments
|
— | (72 | ) | — | — | (72 | ) | |||||||||||||
|
Other items, net
|
2 | 3 | 1 | 4 | 10 | |||||||||||||||
|
Interest expense and debt extinguishment costs
|
(461 | ) | ||||||||||||||||||
|
Loss from continuing operations before taxes
|
(1,359 | ) | ||||||||||||||||||
|
Income tax benefit
|
313 | |||||||||||||||||||
|
Loss from continuing operations
|
(1,046 | ) | ||||||||||||||||||
|
Loss from discontinued operations, net of taxes
|
(222 | ) | ||||||||||||||||||
|
Net loss
|
(1,268 | ) | ||||||||||||||||||
|
Less: Net loss attributable to the noncontrolling interests
|
(15 | ) | ||||||||||||||||||
|
Net loss attributable to Dynegy Holdings Inc.
|
$ | (1,253 | ) | |||||||||||||||||
|
Identifiable assets:
|
||||||||||||||||||||
|
Domestic
|
$ | 6,035 | $ | 1,762 | $ | 1,751 | $ | 1,331 | $ | 10,879 | ||||||||||
|
Other
|
— | — | — | 24 | 24 | |||||||||||||||
|
Total
|
$ | 6,035 | $ | 1,762 | $ | 1,751 | $ | 1,355 | $ | 10,903 | ||||||||||
|
Capital expenditures
|
$ | (533 | ) | $ | (45 | ) | $ | (28 | ) | $ | (6 | ) | $ | (612 | ) | |||||
F-89
DYNEGY INC. and DYNEGY HOLDINGS INC.
NOTES TO CONSOLIDATED FINANCIAL STATEMENTS—(Continued)
DHI’s Segment Data as of and for the Year Ended December 31, 2008
(in millions)
|
Power Generation
|
||||||||||||||||||||
|
GEN-MW
|
GEN-WE
|
GEN-NE
|
Other
|
Total
|
||||||||||||||||
|
Unaffiliated revenues:
|
||||||||||||||||||||
|
Domestic
|
$ | 1,621 | $ | 702 | $ | 890 | $ | (5 | ) | $ | 3,208 | |||||||||
|
Other
|
— | — | 116 | — | 116 | |||||||||||||||
|
Total revenues
|
$ | 1,621 | $ | 702 | $ | 1,006 | $ | (5 | ) | $ | 3,324 | |||||||||
|
Depreciation and amortization
|
$ | (205 | ) | $ | (77 | ) | $ | (54 | ) | $ | (10 | ) | $ | (346 | ) | |||||
|
Operating income (loss)
|
$ | 686 | $ | 123 | $ | 67 | $ | (132 | ) | $ | 744 | |||||||||
|
Losses from unconsolidated investments
|
— | (40 | ) | — | — | (40 | ) | |||||||||||||
|
Other items, net
|
— | 5 | 6 | 72 | 83 | |||||||||||||||
|
Interest expense
|
(427 | ) | ||||||||||||||||||
|
Income from continuing operations before taxes
|
360 | |||||||||||||||||||
|
Income tax expense
|
(138 | ) | ||||||||||||||||||
|
Income from continuing operations
|
222 | |||||||||||||||||||
|
Loss from discontinued operations, net of taxes
|
(17 | ) | ||||||||||||||||||
|
Net income
|
205 | |||||||||||||||||||
|
Less: Net loss attributable to the noncontrolling interests
|
(3 | ) | ||||||||||||||||||
|
Net income attributable to Dynegy Holdings Inc.
|
$ | 208 | ||||||||||||||||||
|
Identifiable assets:
|
||||||||||||||||||||
|
Domestic
|
$ | 6,763 | $ | 3,410 | $ | 2,534 | $ | 1,455 | $ | 14,162 | ||||||||||
|
Other
|
— | — | 5 | 7 | 12 | |||||||||||||||
|
Total
|
$ | 6,763 | $ | 3,410 | $ | 2,539 | $ | 1,462 | $ | 14,174 | ||||||||||
|
Capital expenditures
|
$ | (530 | ) | $ | (29 | ) | $ | (36 | ) | $ | (16 | ) | $ | (611 | ) | |||||
DYNEGY INC. and DYNEGY HOLDINGS INC.
NOTES TO CONSOLIDATED FINANCIAL STATEMENTS—(Continued)
The following is a summary of Dynegy’s unaudited quarterly financial information for the years ended December 31, 2010 and 2009:
|
Quarter Ended
|
||||||||||||||||
|
March
2010
|
June
2010
|
September
2010
|
December
2010
|
|||||||||||||
|
(in millions, except per share data)
|
||||||||||||||||
|
Revenues
|
$ | 858 | $ | 239 | $ | 775 | $ | 451 | ||||||||
|
Operating income (loss)
|
331 | (229 | ) | 50 | (2) | (163 | ) | |||||||||
|
Net income (loss)
|
145 | (1) | (191 | ) | (24 | ) (2) | (164 | ) (3) | ||||||||
|
Net income (loss) attributable to Dynegy Inc. common stockholders
|
145 | (1) | (191 | ) | (24 | ) (2) | (164 | ) (3) | ||||||||
|
Net income (loss) per share attributable to Dynegy Inc. common stockholders
|
$ | 1.21 | (1) | $ | (1.59 | ) | $ | (0.20 | ) (2) | $ | (1.36 | ) (3) | ||||
|
|
(1)
|
Includes $37 million of impairment charges related to our equity investment in PPEA Holding, which is included in Earnings (losses) from unconsolidated investments.
|
|
|
(2)
|
Includes impairment charges of $134 million related to our Casco Bay facility and related assets. Please read Note 7—Impairment and Restructuring Charges for further discussion.
|
|
|
(3)
|
Includes a pre-tax charge of $28 million related to the sale of PPEA Holdings. This charge is included in Earnings (losses) from unconsolidated investments. Please read Note 15—Variable Interest Entities—PPEA Holding Company LLC for further discussion
|
|
Quarter Ended
|
||||||||||||||||
|
March
2009
|
June
2009
|
September
2009
|
December
2009
|
|||||||||||||
|
(in millions, except per share data)
|
||||||||||||||||
|
Revenues
|
$ | 904 | $ | 450 | $ | 673 | $ | 441 | ||||||||
|
Operating loss
|
(146 | ) | (471 | ) | (7 | ) | (210 | ) | ||||||||
|
Net loss
|
(337 | ) (1) | (346 | ) (2) | (223 | ) (3) | (356 | ) (4) | ||||||||
|
Net loss attributable to Dynegy Inc. common stockholders
|
(335 | ) (1) | (345 | ) (2) | (212 | ) (3) | (355 | ) (4) | ||||||||
|
Net loss per share attributable to Dynegy Inc. common stockholders
|
$ | (1.99 | ) (1) | $ | (2.05 | ) (2) | $ | (1.26 | ) (3) | $ | (2.33 | ) (4) | ||||
|
|
(1)
|
Includes goodwill impairment charges of $433 million. Please read Note 16—Goodwill for further discussion. Includes impairment charges of $5 million (discontinued operations) related to the assets included in the LS Power Transactions. Please read Note 7—Impairment and Restructuring Charges for further discussion.
|
|
|
(2)
|
Includes impairment charges of $179 million (continuing operations) and $18 million (discontinued operations) related to the assets included in the LS Power Transactions and $208 million related to Roseton and Danskammer. Please read Note 7—Impairment and Restructuring Charges for further discussion.
|
|
|
(3)
|
Includes impairment charges of $147 million (continuing operations) and $235 million (discontinued operations) related to the assets included in the LS Power Transactions and $1 million related to Roseton and Danskammer. Please read Note 7—Impairment and Restructuring Charges for further discussion.
|
|
|
(4)
|
Includes pre-tax charges of $312 million related to the sale of assets to LS Power. This charge is comprised of $124 million included in Gain (loss) on sale of assets, $104 million included in Income (loss) from discontinued operations and $84 million included in Losses from unconsolidated investments. Please read Note 4—Dispositions, Contract Terminations and Discontinued Operations—Dispositions—LS Power Transactions for further discussion. In addition, includes $46 million debt extinguishment costs for the 2011 and 2012 senior unsecured debt repayment. Please read Note 18—Debt—Credit Facility for further discussion.
|
DYNEGY INC. and DYNEGY HOLDINGS INC.
NOTES TO CONSOLIDATED FINANCIAL STATEMENTS—(Continued)
The following is a summary of DHI’s unaudited quarterly financial information for the years ended December 31, 2010 and 2009:
|
Quarter Ended
|
||||||||||||||||
|
March
2010
|
June
2010
|
September
2010
|
December
2010
|
|||||||||||||
|
(in millions, except per share data)
|
||||||||||||||||
|
Revenues
|
$ | 858 | $ | 239 | $ | 775 | $ | 451 | ||||||||
|
Operating income (loss)
|
331 | (1) | (229 | ) | 54 | (2) | (162 | ) | ||||||||
|
Net income (loss)
|
138 | (1) | (191 | ) | (22 | ) (2) | (167 | ) (3) | ||||||||
|
Net income (loss) attributable to Dynegy Holdings Inc
|
138 | (1) | (191 | ) | (22 | ) (2) | (167 | ) (3) | ||||||||
|
|
(1)
|
Includes $37 million of impairment charges related to our equity investment in PPEA Holding, which is included in Earnings (losses) from unconsolidated investments.
|
|
|
(2)
|
Includes impairment charges of $134 million related to our Casco Bay facility and related assets. Please read Note 7—Impairment and Restructuring Charges for further discussion.
|
|
|
(3)
|
Includes a pre-tax charge of $28 million related to the sale of PPEA Holdings. This charge is included in Earnings (losses) from unconsolidated investments. Please read Note 15—Variable Interest Entities—PPEA Holding Company LLC for further discussion
|
|
Quarter Ended
|
||||||||||||||||
|
March
2009
|
June
2009
|
September
2009
|
December
2009
|
|||||||||||||
|
(in millions, except per share data)
|
||||||||||||||||
|
Revenues
|
$ | 904 | $ | 450 | $ | 673 | $ | 441 | ||||||||
|
Operating loss
|
(148 | ) | (471 | ) | (7 | ) | (210 | ) | ||||||||
|
Net loss
|
(337 | ) (1) | (336 | ) (2) | (232 | ) (3) | (363 | ) (4) | ||||||||
|
Net loss attributable to Dynegy Holdings Inc
|
(335 | ) (1) | (335 | ) (2) | (221 | ) (3) | (362 | ) (4) | ||||||||
|
|
(1)
|
Includes goodwill impairment charges of $433 million. Please read Note 16—Goodwill for further discussion. Includes impairment charges of $5 million (discontinued operations) related to the assets included in the LS Power Transactions. Please read Note 7—Impairment and Restructuring Charges for further discussion.
|
|
|
(2)
|
Includes impairment charges of $179 million (continuing operations) and $18 million (discontinued operations) related to the assets included in the LS Power Transactions and $208 million related to Roseton and Danskammer. Please read Note 7—Impairment and Restructuring Charges for further discussion.
|
|
|
(3)
|
Includes impairment charges of $147 million (continued operations) and $235 million (discontinued operations) related to the assets included in the LS Power sale and $1 million related to Roseton and Danskammer. Please read Note 7—Impairment and Restructuring Charges for further discussion.
|
|
|
(4)
|
Includes pre-tax charges of $312 million related to the sale of assets to LS Power. This charge is comprised of $124 million included in Gain (loss) on sale of assets, $104 million included in Income (loss) from discontinued operations and $84 million included in Losses from unconsolidated investments. Please read Note 4—Dispositions, Contract Terminations and Discontinued Operations—Dispositions—LS Power Transactions for further discussion. In addition, includes $46 million debt extinguishment costs for the 2011 and 2012 senior unsecured debt repayment. Please read Note 18—Debt—Credit Facility for further discussion.
|
DYNEGY INC.
CONDENSED BALANCE SHEETS OF THE REGISTRANT
(in millions)
|
December 31,
2010
|
December 31,
2009
|
|||||||
|
ASSETS
|
||||||||
|
Current Assets
|
||||||||
|
Cash and cash equivalents
|
$ | 38 | $ | 52 | ||||
|
Accounts receivable
|
1 | — | ||||||
|
Short term investments
|
16 | 1 | ||||||
|
Deferred income taxes
|
12 | 6 | ||||||
|
Total Current Assets
|
67 | 59 | ||||||
|
Other Assets
|
||||||||
|
Investments in affiliates
|
6,208 | 6,391 | ||||||
|
Total Assets
|
$ | 6,275 | $ | 6,450 | ||||
|
LIABILITIES AND STOCKHOLDERS’ EQUITY
|
||||||||
|
Current Liabilities
|
||||||||
|
Intercompany accounts payable
|
$ | 643 | $ | 524 | ||||
|
Other current liabilities
|
2 | — | ||||||
|
Total Current Liabilities
|
645 | 524 | ||||||
|
Intercompany long-term debt
|
2,243 | 2,244 | ||||||
|
Deferred income taxes
|
641 | 780 | ||||||
|
Total Liabilities
|
3,529 | 3,548 | ||||||
|
Commitments and Contingencies (Note 2)
|
||||||||
|
Stockholders’ Equity
|
||||||||
|
Class A Common Stock, $0.01 par value, 420,000,000 shares authorized at December 31, 2010 and December 31, 2009; 121,687,198 shares and 120,715,515 shares issued and outstanding at December 31, 2010 and December 31, 2009, respectively
|
1 | 1 | ||||||
|
Additional paid-in capital
|
6,067 | 6,061 | ||||||
|
Subscriptions receivable
|
(2 | ) | (2 | ) | ||||
|
Accumulated other comprehensive loss, net of tax
|
(53 | ) | (150 | ) | ||||
|
Accumulated deficit
|
(3,196 | ) | (2,937 | ) | ||||
|
Treasury stock, at cost, 628,014 shares and 557,677 shares at December 31, 2010 and December 31, 2009, respectively
|
(71 | ) | (71 | ) | ||||
|
Total Stockholders’ Equity
|
2,746 | 2,902 | ||||||
|
Total Liabilities and Stockholders’ Equity
|
$ | 6,275 | $ | 6,450 | ||||
See Notes to Registrant’s Financial Statements and Dynegy Inc.’s Consolidated Financial Statements
Schedule I
DYNEGY INC.
CONDENSED STATEMENTS OF OPERATIONS OF THE REGISTRANT
(in millions)
|
Year Ended December 31,
|
||||||||||||
|
2010
|
2009
|
2008
|
||||||||||
|
Operating loss
|
$ | (5 | ) | $ | — | $ | — | |||||
|
Earnings (losses) from unconsolidated investments
|
(426 | ) | (1,684 | ) | 249 | |||||||
|
Other income and expense, net
|
— | 1 | 1 | |||||||||
|
Income (loss) before income taxes
|
(431 | ) | (1,683 | ) | 250 | |||||||
|
Income tax (expense) benefit
|
197 | 436 | (76 | ) | ||||||||
|
Net income (loss)
|
$ | (234 | ) | $ | (1,247 | ) | $ | 174 | ||||
See Notes to Registrant’s Financial Statements and Dynegy Inc.’s Consolidated Financial Statements
Schedule I
DYNEGY INC.
CONDENSED STATEMENTS OF CASH FLOWS OF THE REGISTRANT
(in millions)
|
Year Ended December 31,
|
||||||||||||
|
2010
|
2009
|
2008
|
||||||||||
|
CASH FLOWS FROM OPERATING ACTIVITIES:
|
||||||||||||
|
Operating cash flow, exclusive of intercompany transactions
|
$ | (4 | ) | $ | (19 | ) | $ | — | ||||
|
Intercompany transactions
|
5 | 3 | 3 | |||||||||
|
Net cash provided by (used in) operating activities
|
1 | (16 | ) | 3 | ||||||||
|
CASH FLOWS FROM INVESTING ACTIVITIES:
|
||||||||||||
|
Unconsolidated investments
|
— | 1 | (16 | ) | ||||||||
|
Short term investments
|
(15 | ) | — | (2 | ) | |||||||
|
Net cash provided by (used in) investing activities
|
(15 | ) | 1 | (18 | ) | |||||||
|
CASH FLOWS FROM FINANCING ACTIVITIES:
|
||||||||||||
|
Dividends from affiliate
|
— | 585 | — | |||||||||
|
Redemption of capital stock
|
— | (540 | ) | — | ||||||||
|
Proceeds from issuance of capital stock
|
— | — | 2 | |||||||||
|
Net cash provided by financing activities
|
— | 45 | 2 | |||||||||
|
Net increase (decrease) in cash and cash equivalents
|
(14 | ) | 30 | (13 | ) | |||||||
|
Cash and cash equivalents, beginning of period
|
52 | 22 | 35 | |||||||||
|
Cash and cash equivalents, end of period
|
$ | 38 | $ | 52 | $ | 22 | ||||||
|
SUPPLEMENTAL CASH FLOW INFORMATION
|
||||||||||||
|
Taxes paid (net of refunds)
|
7 | 4 | 23 | |||||||||
|
SUPPLEMENTAL NONCASH FLOW INFORMATION
|
||||||||||||
|
Shares acquired through exchange of DHI assets
|
— | 97 | — | |||||||||
|
Contribution of intangibles and related deferred income taxes to DHI
|
— | 36 | — | |||||||||
|
Other affiliate activity
|
(37 | ) | (48 | ) | — | |||||||
See Notes to Registrant’s Financial Statements and Dynegy Inc.’s Consolidated Financial Statements
Schedule I
DYNEGY INC.
NOTES TO REGISTRANT’S FINANCIAL STATEMENTS
These condensed parent company financial statements have been prepared in accordance with Rule 12-04, Schedule I of Regulation S-X, as the restricted net assets of Dynegy Inc.’s subsidiaries exceeds 25 percent of the consolidated net assets of Dynegy Inc. These statements should be read in conjunction with the Consolidated Statements and notes thereto of Dynegy Inc.
We are a holding company and conduct substantially all of our business operations through our subsidiaries. We began operations in 1985 and became incorporated in the State of Delaware in 2007 in anticipation of our April 2007 merger with the Contributed Entities.
For a discussion of our commitments and contingencies, please read Note 22—Commitments and Contingencies of our consolidated financial statements.
Please read Note 18—Debt of our consolidated financial statements and Note 22—Commitments and Contingencies—Guarantees and Indemnifications of our consolidated financial statements for a discussion of our guarantees.
For a discussion of our related party transactions, please read Note 19—Related Party Transactions of our consolidated financial statements.
DYNEGY INC.
VALUATION AND QUALIFYING ACCOUNTS
Years Ended December 31, 2010, 2009 and 2008
|
Balance at Beginning of Period
|
Charged to Costs and Expenses
|
Charged to Other Accounts
|
Additions/
(Deductions)
|
Balance at End of Period
|
||||||||||||||||
|
(in millions)
|
||||||||||||||||||||
|
2010
|
||||||||||||||||||||
|
Allowance for doubtful accounts
|
$ | 22 | $ | — | $ | — | $ | 10 | (2) | $ | 32 | |||||||||
|
Allowance for risk-management assets (1)
|
— | — | — | — | — | |||||||||||||||
|
Deferred tax asset valuation allowance
|
35 | (1 | ) | (12 | ) | — | 22 | |||||||||||||
|
2009
|
||||||||||||||||||||
|
Allowance for doubtful accounts
|
$ | 22 | $ | — | $ | — | $ | — | $ | 22 | ||||||||||
|
Allowance for risk-management assets (1)
|
— | — | — | — | — | |||||||||||||||
|
Deferred tax asset valuation allowance
|
37 | 12 | (14 | ) | — | 35 | ||||||||||||||
|
2008
|
||||||||||||||||||||
|
Allowance for doubtful accounts
|
$ | 20 | $ | 4 | $ | (2 | ) | $ | — | $ | 22 | |||||||||
|
Allowance for risk-management assets (1)
|
11 | — | (11 | ) | — | — | ||||||||||||||
|
Deferred tax asset valuation allowance
|
62 | (2 | ) | — | (23 | ) (3) | 37 | |||||||||||||
|
|
(1)
|
Changes in price and credit reserves related to risk-management assets are offset in the net mark-to-market income accounts reported in revenues. In connection with adopting SFAS No. 157, “Fair Value Measurement” on January 1, 2008, our price and credit reserves related to risk management assets were no longer considered allowances as they are included in the fair value measurement of our derivative contracts.
|
|
|
(2)
|
The allowance for doubtful accounts increased by $17 million in connection with a receivable we recorded in the second quarter of 2010 for the return of an award we previously paid as a result of a 2007 arbitration decision. The award was vacated in 2010, and the recipient deposited the award into an escrow account. We have fully reserved our receivable for this amount as a result of uncertainty surrounding a pending appeal of the decision to vacate the award. This increase was partly offset by a $7 million decrease resulting from the sale of a receivable from a counterparty in bankruptcy and the settlement of a disputed balance.
|
|
|
(3)
|
Primarily represents the release of valuation allowance associated with foreign tax credits, which were previously reserved.
|
DYNEGY HOLDINGS INC.
VALUATION AND QUALIFYING ACCOUNTS
Years Ended December 31, 2010, 2009 and 2008
|
Balance at Beginning of Period
|
Charged to Costs and Expenses
|
Charged to
Other
Accounts
|
Deductions
|
Balance at End
of Period
|
||||||||||||||||
|
(in millions)
|
||||||||||||||||||||
|
2010
|
||||||||||||||||||||
|
Allowance for doubtful accounts
|
$ | 20 | $ | — | $ | — | $ | (7 | ) (2) | $ | 13 | |||||||||
|
Allowance for risk-management assets (1)
|
— | — | — | — | — | |||||||||||||||
|
Deferred tax asset valuation allowance
|
34 | (1 | ) | (12 | ) | — | 21 | |||||||||||||
|
2009
|
||||||||||||||||||||
|
Allowance for doubtful accounts
|
$ | 20 | $ | — | $ | — | $ | — | $ | 20 | ||||||||||
|
Allowance for risk-management assets (1)
|
— | — | — | — | — | |||||||||||||||
|
Deferred tax asset valuation allowance
|
37 | 11 | (14 | ) | — | 34 | ||||||||||||||
|
2008
|
||||||||||||||||||||
|
Allowance for doubtful accounts
|
$ | 15 | $ | 5 | $ | — | $ | — | $ | 20 | ||||||||||
|
Allowance for risk-management assets (1)
|
11 | — | (11 | ) | — | — | ||||||||||||||
|
Deferred tax asset valuation allowance
|
59 | (2 | ) | — | (20 | ) (3) | 37 | |||||||||||||
|
|
(1)
|
Changes in price and credit reserves related to risk-management assets are offset in the net mark-to-market income accounts reported in revenues. In connection with adopting SFAS No. 157, “Fair Value Measurement” on January 1, 2008, our price and credit reserves related to risk management assets were no longer considered allowances as they are included in the fair value measurement of our derivative contracts.
|
|
|
(2)
|
The allowance for doubtful accounts decreased by $7 million resulting from the sale of a receivable from a counterparty in bankruptcy and the settlement of a disputed balance.
|
|
|
(3)
|
Primarily represents the release of valuation allowance associated with foreign tax credits, which were previously reserved.
|
F-98
TABLE OF CONTENTS
Part IItem 1. BusinessItem 1A. Risk FactorsItem 1B. Unresolved Staff CommentsItem 2. PropertiesItem 3. Legal ProceedingsPart IIItem 5. Market For Registrant S Common Equity, Related Stockholder Matters and Issuer Purchases Of Equity SecuritiesPart OfItem 6. Selected Financial DataItem 7. Management S Discussion and Analysis Of Financial Condition and Results Of OperationsItem 7A. Quantitative and Qualitative Disclosures About Market RiskItem 8. Financial Statements and Supplementary DataItem 9. Changes in and Disagreements with Accountants on Accounting and Financial DisclosureItem 9A. Controls and ProceduresItem 9B. Other InformationPart IIIItem 10. Directors, Executive Officers and Corporate GovernanceItem 11. Executive CompensationItem 12. Security Ownership Of Certain Beneficial Owners and Management and Related Stockholder MattersItem 13. Certain Relationships and Related Transactions, and Director IndependenceItem 14. Principal Accountant Fees and ServicesPart IVItem 15. Exhibits and Financial Statement SchedulesNote 1 Organization and OperationsNote 2 Summary Of Significant Accounting PoliciesNote 3 Merger AgreementsNote 4 Dispositions, Contract Terminations and Discontinued OperationsNote 5 Noncontrolling InterestsNote 6 InvestmentsNote 7 Impairment and Restructuring ChargesNote 8 Risk Management Activities, Derivatives and Financial InstrumentsNote 9 Fair Value MeasurementsNote 10 Accumulated Other Comprehensive LossNote 11 Cash Flow InformationNote 12 InventoryNote 13 Property, Plant and EquipmentNote 14 Unconsolidated InvestmentsNote 15 Variable Interest EntitiesNote 16 GoodwillNote 17 Intangible AssetsNote 2 Summary Of Significant Accounting Policies Accounting Policies Adopted Variable Interest Entities For Further DiscussionNote 18 DebtNote 19 Related Party TransactionsNote 20 Income TaxesNote 21 Dynegy S Earnings (loss) Per ShareNote 22 Commitments and ContingenciesNote 23 Capital StockNote 24 Employee Compensation, Savings and Pension PlansNote 25 Segment InformationNote 26 Quarterly Financial Information (unaudited)Note 1 Background and Basis Of PresentationNote 2 Commitments and ContingenciesNote 3 Related Party Transactions