UNITED STATES
SECURITIES AND EXCHANGE COMMISSION
Washington, D.C. 20549
FORM 10-K
ý
ANNUAL REPORT PURSUANT TO SECTION 13 OR 15(d) OF THE SECURITIES EXCHANGE ACT OF 1934
For the fiscal year ended
December 31, 2012
o
TRANSITION REPORT PURSUANT TO SECTION 13 OR 15(d) OF THE SECURITIES EXCHANGE ACT OF 1934
For the transition period from ________ to ________
DYNEGY INC.
(Exact name of registrant as specified in its charter)
|
Entity
|
Commission File Number
|
State of
Incorporation
|
I.R.S. Employer
Identification No.
|
|||
|
Dynegy Inc.
|
001-33443
|
Delaware
|
20-5653152
|
|||
|
601 Travis, Suite 1400
|
||||||
|
Houston, Texas
|
77002
|
|||||
|
(Address of principal executive offices)
|
(Zip Code)
|
|||||
(713) 507-6400
(Registrant’s telephone number, including area code)
Securities registered pursuant to Section12(b) of the Act:
|
Title of each class
|
|
Name of each exchange on which registered
|
|
Dynegy’s common stock, $0.01 par value
|
|
New York Stock Exchange
|
Securities registered pursuant to Section12(g) of the Act:
|
|
|
None
|
|
|
|
|
|
(Title of Class)
|
|
|
Indicate by check mark if the registrant is a well-known seasoned issuer, as defined in Rule 405 of the Securities Act. Yes
o
No
ý
Indicate by check mark if the registrant is not required to file reports pursuant to Section 13 or Section 15(d) of the Exchange Act. Yes
o
No
ý
Indicate by check mark whether the registrant (1) has filed all reports required to be filed by Section 13 or 15(d) of the Securities Exchange Act of 1934 during the preceding 12 months (or for such shorter period that the registrant was required to file such reports), and (2) has been subject to such filing requirements for the past 90 days. Yes
x
No
¨
Indicate by check mark whether the registrant has submitted electronically and posted on its corporate web site, if any, every Interactive Data File required to be submitted and posted pursuant to Rule 405 of Regulation S-T (§232.405 of this chapter) during the preceding 12 months (or for such shorter period that the registrant was required to submit and post such files). Yes
x
No
¨
Indicate by check mark if disclosure of delinquent filers pursuant to Item 405 of Regulation S-K is not contained herein, and will not be contained, to the best of registrant’s knowledge, in definitive proxy or information statements incorporated by reference in Part III of this Form 10-K or any amendment to this Form 10-K.
o
Indicate by check mark whether the registrant is a large accelerated filer, an accelerated filer, a non-accelerated filer, or a smaller reporting company. See definitions of “large accelerated filer,” “accelerated filer” and “smaller reporting company” in Rule 12b-2 of the Exchange Act.
|
Large accelerated filer
o
|
|
Accelerated filer
ý
|
|
Non-accelerated filer
o
|
|
Smaller reporting company
o
|
|
(Do not check if a smaller reporting company)
|
|
|
Indicate by check mark whether the registrant is a shell company (as defined in Rule 12b-2 of the Exchange Act). Yes
¨
No
x
As of June 30, 2012, the aggregate market value of the Dynegy Inc. common stock held by non-affiliates of the registrant was $61,778,456 based on the closing sale price as reported on the New York Stock Exchange.
Indicate by check mark whether the registrant filed all documents and reports required to be filed by Sections 12, 13 or 15(d) of the Securities Exchange Act of 1934 subsequent to the distribution of securities under a plan confirmed by a court. Yes
x
No
¨
Number of shares outstanding of Dynegy Inc.’s class of common stock, as of the latest practicable date: Common stock, $0.01 par value per share
, 99,999,196
shares outstanding as of
March 8, 2013
.
DOCUMENTS INCORPORATED BY REFERENCE
Part III (Items 10, 11, 12, 13 and 14) incorporates by reference portions of the Notice and Proxy Statement for the registrant’s 2013 Annual Meeting of Stockholders, which the registrant intends to file no later than 120 days after December 31, 2012. However, if such proxy statement is not filed within such 120-day period, Items 10,11,12,13 and 14 will be filed as part of an amendment to this Form 10-K no later than the end of the 120-day period.
DYNEGY INC.
FORM 10-K
TABLE OF CONTENTS
|
|
Page
|
|
|
PART I
|
||
|
|
|
|
|
Definitions
|
||
|
Item 1.
|
Business
|
|
|
Item 1A.
|
Risk Factors
|
|
|
Item 1B.
|
Unresolved Staff Comments
|
|
|
Item 2.
|
Properties
|
|
|
Item 3.
|
Legal Proceedings
|
|
|
Item 4.
|
Mine Safety Disclosures
|
|
|
PART II
|
||
|
Item 5.
|
Market for Registrant’s Common Equity, Related Stockholder Matters and Issuer Purchases of Equity Securities
|
|
|
Item 6.
|
Selected Financial Data
|
|
|
Item 7.
|
Management’s Discussion and Analysis of Financial Condition and Results of Operations
|
|
|
Item 7A.
|
Quantitative and Qualitative Disclosures About Market Risk
|
|
|
Item 8.
|
Financial Statements and Supplementary Data
|
|
|
Item 9.
|
Changes in and Disagreements with Accountants on Accounting and Financial Disclosure
|
|
|
Item 9A.
|
Controls and Procedures
|
|
|
Item 9B.
|
Other Information
|
|
|
PART III
|
||
|
Item 10.
|
Directors, Executive Officers and Corporate Governance
|
|
|
Item 11.
|
Executive Compensation
|
|
|
Item 12.
|
Security Ownership of Certain Beneficial Owners and Management and Related Stockholder Matters
|
|
|
Item 13.
|
Certain Relationships and Related Transactions, and Director Independence
|
|
|
Item 14.
|
Principal Accountant Fees and Services
|
|
|
PART IV
|
||
|
Item 15.
|
Exhibits and Financial Statement Schedules
|
|
|
Signatures
|
||
ii
DEFINITIONS
On September 30, 2012, pursuant to the terms of the Joint Chapter 11 Plan of Reorganization (the “Plan”) for Dynegy Holdings, LLC (“DH”) and Dynegy Inc. (“Dynegy”), DH merged with and into Dynegy, with Dynegy continuing as the surviving legal entity (the “Merger”). As described in
Note 1—Organization and Operations
, the accounting treatment of the Merger is reflected as a recapitalization of DH and, similar to a reverse merger, DH is the surviving accounting entity for financial reporting purposes. Therefore, our historical results for periods prior to the Merger are the same as DH’s historical results; accordingly, we refer to Dynegy as “Legacy Dynegy” for periods prior to the Merger.
Unless the context indicates otherwise, throughout this report, the terms “Dynegy,” “the Company,” “we,” “us,” “our,” and “ours” are used to refer to Dynegy Inc. and its direct and indirect subsidiaries. Discussions or areas of this report that apply only to Dynegy, Legacy Dynegy or DH are clearly noted in such sections or areas and specific defined terms may be introduced for use only in those sections or areas. Further, as used in this Form 10-K, the abbreviations contained herein have the meanings set forth below.
|
AOCI
|
Accumulated other comprehensive income
|
|
|
ARO
|
Asset retirement obligation
|
|
|
ASC
|
|
Accounting Standards Codification
|
|
ASU
|
|
Accounting Standards Update
|
|
BACT
|
Best Available Control Technology (air)
|
|
|
BART
|
Best Available Retrofit Technology
|
|
|
BTA
|
|
Best technology available
|
|
CAA
|
Clean Air Act
|
|
|
CAIR
|
|
Clean Air Interstate Rule
|
|
CAISO
|
|
The California Independent System Operator
|
|
CAMR
|
Clean Air Mercury Rule
|
|
|
CARB
|
California Air Resources Board
|
|
|
CAVR
|
The Clean Air Visibility Rule
|
|
|
CCR
|
|
Coal Combustion Residuals
|
|
CEQA
|
|
California Environmental Quality Act
|
|
CERCLA
|
|
The Comprehensive Environmental Response, Compensation and Liability Act of 1980, as amended
|
|
CEO
|
Chief Executive Officer
|
|
|
CFO
|
Chief Financial Officer
|
|
|
CFTC
|
U.S. Commodity Futures Trading Commission
|
|
|
CO
2
|
|
Carbon dioxide
|
|
CO
2e
|
The climate change potential of other GHGs relative to the global warming potential of CO
2
|
|
|
CPUC
|
California Public Utility Commission
|
|
|
CRCG
|
Commodity Risk Control Group
|
|
|
CSAPR
|
|
Cross-State Air Pollution Rule
|
|
CWA
|
|
Clean Water Act
|
|
DB
|
DB Energy Trading, LLC
|
|
|
DCIH
|
Dynegy Coal Investments Holdings, LLC
|
|
|
DGIN
|
Dynegy Gas Investments, LLC
|
|
|
DH
|
|
Dynegy Holdings, LLC (formerly known as Dynegy Holdings Inc.)
|
|
DMG
|
Dynegy Midwest Generation, LLC
|
|
|
DMSLP
|
|
Dynegy Midstream Services L.P.
|
|
DMT
|
Dynegy Marketing and Trade, LLC
|
|
|
DPC
|
Dynegy Power, LLC
|
|
|
DYPM
|
Dynegy Power Marketing Inc.
|
|
|
EBITDA
|
|
Earnings before interest, taxes, depreciation and amortization
|
|
EGUs
|
Electric generating units
|
|
1
|
EMA
|
|
Energy Management Agency Services Agreement
|
|
EMT
|
Executive Management Team
|
|
|
EPA
|
|
Environmental Protection Agency
|
|
EWG
|
Exempt Wholesale Generator
|
|
|
FASB
|
|
Financial Accounting Standards Board
|
|
FCM
|
Forward Capacity Market
|
|
|
FERC
|
|
Federal Energy Regulatory Commission
|
|
FTR
|
Financial Transmission Rights
|
|
|
GAAP
|
|
Generally Accepted Accounting Principles of the United States of America
|
|
GHG
|
|
Greenhouse Gas
|
|
HAPs
|
Hazardous air pollutants, as defined by the Clean Air Act
|
|
|
ICAP
|
Installed capacity
|
|
|
ICC
|
|
Illinois Commerce Commission
|
|
IFRS
|
International Financial Reporting Standards
|
|
|
IMA
|
|
In-market asset availability
|
|
IRS
|
Internal Revenue Service
|
|
|
ISO
|
|
Independent System Operator
|
|
ISO-NE
|
|
Independent System Operator New England
|
|
kW
|
Kilowatt
|
|
|
LC
|
Letter of Credit
|
|
|
LIBOR
|
London Interbank Offered Rate
|
|
|
LMP
|
Locational Marginal Pricing
|
|
|
LSTC
|
Liabilities Subject to Compromise
|
|
|
MGGA
|
Midwest Greenhouse Gas Accord
|
|
|
MGGRP
|
Midwestern Greenhouse Gas Reduction Program
|
|
|
MISO
|
|
Midwest Independent Transmission System Operator, Inc.
|
|
MMBtu
|
|
One million British thermal units
|
|
MRTU
|
Market Redesign and Technology Update
|
|
|
MW
|
|
Megawatts
|
|
MWh
|
|
Megawatt hour
|
|
NAAQS
|
National Ambient Air Quality Standards
|
|
|
NERC
|
North American Electric Reliability Corporation
|
|
|
NGX
|
Natural Gas Exchange Inc.
|
|
|
NM
|
Not Meaningful
|
|
|
NODA
|
Notice of Data Availability
|
|
|
NOL
|
|
Net operating loss
|
|
NO
x
|
|
Nitrogen oxide
|
|
NPDES
|
|
National Pollutant Discharge Elimination System
|
|
NRG
|
|
NRG Energy, Inc.
|
|
NSPS
|
New Source Performance Standard
|
|
|
NYISO
|
|
New York Independent System Operator
|
|
NYSDEC
|
|
New York State Department of Environmental Conservation
|
|
NYSE
|
New York Stock Exchange
|
|
|
OTC
|
|
Over-the-counter
|
|
PJM
|
|
PJM Interconnection, LLC
|
|
PRB
|
Powder River Basin
|
|
|
PRIDE
|
Producing Results through Innovation by Dynegy Employees
|
|
|
PSD
|
Prevention of Significant Deterioration
|
|
|
PURPA
|
The Public Utility Regulatory Policies Act of 1978
|
|
|
QF
|
Qualifying Facility
|
|
2
|
RACT
|
Reasonably Available Control Technology
|
|
|
RCRA
|
The Resource Conservation and Recovery Act of 1976, as amended
|
|
|
RFO
|
Request for offer
|
|
|
RGGI
|
|
Regional Greenhouse Gas Initiative
|
|
RMR
|
|
Reliability Must Run
|
|
RPM
|
Reliability Pricing Model
|
|
|
RTO
|
Regional Transmission Organization
|
|
|
SACCWIS
|
Statewide Advisory Committee on Cooling Water Intake Structures
|
|
|
SCE
|
Southern California Edison
|
|
|
SCR
|
Selective Catalytic Reduction
|
|
|
SEC
|
|
U.S. Securities and Exchange Commission
|
|
SIP
|
|
State Implementation Plan
|
|
SO
2
|
|
Sulfur dioxide
|
|
SPDES
|
|
State Pollutant Discharge Elimination System
|
|
VaR
|
|
Value at Risk
|
|
VIE
|
|
Variable Interest Entity
|
|
VLGC
|
|
Very Large Gas Carrier
|
|
WCI
|
Western Climate Initiative
|
|
|
WECC
|
Western Electricity Coordinating Council
|
|
3
Item 1.
Business
THE COMPANY
Dynegy began operations in 1984 and became incorporated in the State of Delaware in 2007. We are a holding company and conduct substantially all of our business operations through our subsidiaries. Our primary business is the production and sale of electric energy, capacity and ancillary services from our fleet of twelve operating power plants in six states totaling approximately 9,800 MW of generating capacity, which excludes the 1,700 MW of generating capacity of our DNE generation facilities that were deconsolidated effective October 1, 2012, and are under agreement to be sold.
We sell electric energy, capacity and ancillary services on a wholesale basis from our power generation facilities. Energy is the actual output of electricity and is measured in MWh. The capacity of a power generation facility is its electricity production capability, measured in MW. Wholesale electricity customers will, for reliability reasons and to meet regulatory requirements, contract for rights to capacity from generating units. Ancillary services are the products of a power generation facility that support the transmission grid operation, follow real-time changes in load and provide emergency reserves for major changes to the balance of generation and load. We sell these products individually or in combination to our customers under short-, medium- and long-term agreements.
Our customers include RTOs and ISOs, integrated utilities, municipalities, electric cooperatives, transmission and distribution utilities, industrial customers, power marketers, financial participants such as banks and hedge funds, other power generators and commercial end-users. All of our products are sold on a wholesale basis for various lengths of time from hourly to multi-year transactions. Some of our customers, such as municipalities or integrated utilities, purchase our products for resale in order to serve their retail, commercial and industrial customers. Other customers, such as some power marketers, may buy from us to serve their own wholesale or retail customers or as a hedge against power sales they have made.
Our principal executive office is located at 601 Travis Street, Suite 1400, Houston, Texas 77002, and our telephone number at that office is (713) 507-6400. We file annual, quarterly and current reports, and other information with the SEC. You may read and copy any document we file at the SEC’s Public Reference Room at 100 F Street N.E., Room 1580, Washington, D.C. 20549. Please call the SEC at 1-800-SEC-0330 for further information on the SEC’s Public Reference Room. Our SEC filings are also available to the public at the SEC’s website at
www.sec.gov
. No information from such website is incorporated by reference herein. Our SEC filings are also available free of charge on our website at
www.dynegy.com
, as soon as reasonably practicable after those reports are filed with or furnished to the SEC. The contents of our website are not intended to be, and should not be considered to be, incorporated by reference into this Form 10-K.
4
Our Power Generation Portfolio
Our operating generating facilities are as follows:
|
Facility
|
Total Net
Generating
Capacity
(MW)(1)
|
Primary
Fuel Type
|
Dispatch
Type
|
Location
|
Region
|
||||||
|
Baldwin
|
1,800
|
|
Coal
|
Baseload
|
Baldwin, IL
|
MISO
|
|||||
|
Havana (2)
|
441
|
|
Coal
|
Baseload
|
Havana, IL
|
MISO
|
|||||
|
Hennepin
|
293
|
|
Coal
|
Baseload
|
Hennepin, IL
|
MISO
|
|||||
|
Wood River (3)
|
446
|
|
Coal
|
Baseload
|
Alton, IL
|
MISO
|
|||||
|
Total Coal Segment
|
2,980
|
|
|||||||||
|
Moss Landing Units 1-2
|
1,020
|
|
Gas
|
Intermediate
|
Monterey County, CA
|
CAISO
|
|||||
|
Units 6-7
|
1,509
|
|
Gas
|
Peaking
|
Monterey County, CA
|
CAISO
|
|||||
|
Kendall
|
1,200
|
|
Gas
|
Intermediate
|
Minooka, IL
|
PJM
|
|||||
|
Ontelaunee
|
580
|
|
Gas
|
Intermediate
|
Ontelaunee Township, PA
|
PJM
|
|||||
|
Morro Bay (4)
|
650
|
|
Gas
|
Peaking
|
Morro Bay, CA
|
CAISO
|
|||||
|
Oakland
|
165
|
|
Oil
|
Peaking
|
Oakland, CA
|
CAISO
|
|||||
|
Casco Bay
|
540
|
|
Gas
|
Intermediate
|
Veazie, ME
|
ISO-NE
|
|||||
|
Independence
|
1,064
|
|
Gas
|
Intermediate
|
Scriba, NY
|
NYISO
|
|||||
|
Black Mountain (5)
|
43
|
|
Gas
|
Baseload
|
Las Vegas, NV
|
WECC
|
|||||
|
Total Gas Segment
|
6,771
|
|
|
|
|
|
|||||
|
Total Fleet Capacity
|
9,751
|
|
|
|
|
|
|||||
__________________________________________
|
(1)
|
Unit capabilities are based on winter capacity. We have not included the Stallings and Oglesby facilities, consisting of approximately 150 MW that have historically been included in our Coal segment, as these facilities were retired effective January 7, 2013. Additionally, we have also not included the DNE facilities, consisting of approximately 1,700 MW, as these facilities were deconsolidated effective October 1, 2012, and are under agreement to be sold. The sales are expected to close during 2013. Please read
Note 6—Dispositions and Discontinued Operations
for further discussion of the sale of the DNE facilities.
|
|
(2)
|
Represents Unit 6 generating capacity. Units 1-5, with a combined net generating capacity of 228 MW, are retired and out of operation.
|
|
(3)
|
Represents Units 4 and 5 generating capacity. Units 1-3, with a combined net generating capacity of 119 MW, are retired and out of operation.
|
|
(4)
|
Represents Units 3 and 4 generating capacity. Units 1 and 2, with a combined net generating capacity of 352 MW, are currently in mothball status and out of operation.
|
|
(5)
|
We indirectly own a 50 percent interest in this facility. Total output capacity of this facility is 85 MW.
|
Business Strategy
Our business strategy is to create value through the safe, reliable and cost-efficient operation of our power generation assets. We manage our generation assets by fuel type with two primary reportable segments: (i) the Coal segment (“Coal”) and (ii) the Gas segment (“Gas”).
There are four primary elements to our strategy:
|
•
|
Operational Excellence—Operating our power plants in a safe, reliable, and environmentally compliant manner with a particular focus on increasing cash flow and optimizing availability;
|
|
•
|
Commercial Execution—Optimizing the commercial results of the assets through proactive management of our power, fuel, capacity, and ancillary service positions with short-, medium-, and long-term agreements and hedging arrangements;
|
|
•
|
Corporate and Organizational Support—Maximizing organizational effectiveness and efficiency through continuous business process improvements, operational enhancements, and cost management; and
|
|
•
|
Capital Structure Management and Allocation—Creating a sustainable and flexible capital structure with diversified liquidity sources to efficiently support and allocate resources across our business activities.
|
5
Operational Excellence.
We operate a portfolio of generation assets that is diversified in terms of dispatch profile, fuel type and geography. Our Coal segment is a fleet of baseload coal facilities, located in Illinois, that dispatch around the clock throughout the year. Our Gas segment operates both intermediate and peaking natural gas plants, located in the Midwest, Northeast and California. The inherent cycling and dispatch characteristics of our intermediate combined cycle units allow us to take advantage of the volatility in market pricing in the day-ahead and hourly markets. This flexibility allows us to optimize our assets and provide incremental value. Peaking facilities are generally dispatched to serve load only during the highest periods of power demand, such as hot summer and cold winter days. In addition to generating power, intermediate and peaking facilities also generate capacity revenues through structured markets or bilateral tolling agreements, as local utilities and ISOs seek to ensure sufficient generation capacity is available to meet future market demands.
We have historically achieved strong plant operations and are committed to operating all of our facilities in a safe, reliable, cost-efficient and environmentally compliant manner. We have dedicated significant resources toward these priorities with approximately $1 billion invested over the past several years in our Coal segment for environmental compliance initiatives to meet contractual obligations and state and federal environmental standards. In addition, we continue to invest approximately $100 million annually across all segments to maintain and improve the safety, reliability, and efficiency of the fleet. The alignment of our segments by fuel type helps facilitate and realize best operating practices across the respective portfolios, leading to additional cost efficiencies and improved operating practices.
Commercial Execution.
Our commercial strategy seeks to optimize the value of our assets by locking in near-term cash flow while preserving the ability to capture higher values longer-term as power markets improve. We seek to capture both intrinsic as well as extrinsic value of the coal and gas portfolios. Intrinsic value is represented by cash flow generated from selling power at market prices; extrinsic value is represented by cash flow generated from selling power at varying price levels as a result of changes in market prices resulting from market price volatility. In order to execute our commercial strategy, we utilize a wide range of products and contracts such as tolling agreements, fuel supply contracts, capacity auctions, bilateral capacity contracts, power and natural gas swap agreements, power and natural gas options and other financial instruments.
Power prices have fallen significantly over the past few years primarily as a result of the decline in natural gas prices and a weakened national economy. Despite these near-term dynamics, we continue to expect that, over the longer-term, power pricing will improve as natural gas prices increase, marginal generating units retire, and more stringent environmental regulations force the retirement of power generation units that have not invested in environmental upgrades. As a result, we expect our coal-fired baseload fleet, with its environmental upgrades, is positioned to benefit from higher power and capacity prices in the Midwest. We also expect these same factors will benefit our combined cycle units through increased run-times and higher power prices as heat rates expand resulting in improved margins and cash flows.
We plan to hedge the expected output from our facilities over a one- to two-year time frame with the goal of stabilizing near-term earnings and cash flow while preserving upside potential should commodity prices or market factors improve. We manage our hedging program within the limits of our available liquidity sources. These sources include cash and letter of credit capacity, along with a first lien collateral structure.
Corporate and Organizational Support
.
During 2012, we continued to employ our cost and performance improvement initiative, known as PRIDE, which is designed to drive recurring cash flow benefits by optimizing our cost structure, implementing company-wide process and operating improvements, and improving balance sheet efficiency. For 2012, we recognized $44 million in operating margin and cost improvements and $148 million in incremental liquidity from balance sheet improvements due to PRIDE initiatives. In 2013, we are targeting additional margin and cost improvements of $42 million, and additional balance sheet improvements of $83 million. We will continue to use the PRIDE initiative to improve our operating performance, cost structure and balance sheet.
Capital Structure Management and Allocation.
The power industry is a cyclical commodity business with significant price volatility requiring ongoing considerable capital investment requirements. As such, it is imperative to build and maintain a balance sheet with manageable debt levels supported by a multi-faceted liquidity program. Our long-term debt and lease obligations were restructured during 2012 through the Chapter 11 process and we emerged from bankruptcy with a leverage profile designed to withstand protracted low commodity price environments and provide the necessary liquidity capacity to support daily operations. Our ongoing capital allocation priorities, first and foremost, are to support the daily business requirements, including making the necessary capital investments to comply with environmental rules and regulations. Additional capital allocation options that are evaluated include debt management, investments in our existing portfolio, potential acquisitions and returning capital to shareholders. Capital allocation decisions are based on the alternatives that provide the highest risk-adjusted rates of return. Capital allocations decisions made during 2012 included completing the capital spend required to comply with the Consent Decree and, during the fourth quarter of 2012, the repayment of $325 million on the DPC and DMG Credit Agreements.
6
We continue to focus on building a diverse liquidity program to support our ongoing operations and commercial activities. This includes utilizing existing cash balances, letter of credit facilities, expanding our first lien collateral program to include additional hedging counterparties, and the recently completed $150 million DPC Revolving Credit Agreement. We will continue to look at other measures to best manage our balance sheet as well as seek additional sources of liquidity. During 2013, we will seek opportunities to improve the efficiency of our capital structure, which may include refinancing our existing credit agreements.
Recent Developments
On
March 14, 2013
, we entered into an agreement to acquire Ameren Energy Resources Company, LLC (AER) and its subsidiaries Ameren Energy Generating Company (Genco), Ameren Energy Resources Generating Company (AERG) and Ameren Energy Marketing Company (AEM) from Ameren Corporation. The acquisition will add 4,119 MW of generation in Illinois and also includes AER's marketing and Homefield Energy retail businesses. We will acquire AER and its subsidiaries through a newly formed, wholly-owned subsidiary, Illinois Power Holdings, LLC, that will maintain corporate separateness from our current legal entities. There is no cash consideration or stock issuance as part of the purchase price. GenCo's debt will remain outstanding. The transaction is subject to certain closing conditions and the receipt of regulatory approvals. We expect to close the transaction in fourth quarter 2013.
Restructuring
As further described in
Note 3—Emergence from Bankruptcy and Fresh-Start Accounting
, on October 1, 2012, we consummated our reorganization under Chapter 11 pursuant to the Plan and Dynegy exited bankruptcy (the “Plan Effective Date”). Upon emergence, we applied fresh-start accounting to our consolidated financial statements because (i) the reorganization value of the assets of the emerging entity immediately before the date of confirmation was less than the total of all post-petition liabilities and allowed claims and (ii) the holders of the existing voting shares of the predecessor’s common stock immediately before confirmation received less than 50 percent of the voting shares of the emerging entity.
Dynegy Northeast Generation, Inc., Hudson Power, L.L.C., Dynegy Danskammer, L.L.C. and Dynegy Roseton, L.L.C. (the “DNE Debtor Entities”) remain in Chapter 11 bankruptcy and continue to operate their businesses as “debtors-in-possession.” As a result, we deconsolidated the DNE Debtor Entities, which include two facilities totaling approximately 1,700 MW, effective October 1, 2012. The bankruptcy court has approved agreements to sell the Danskammer and Roseton facilities (the “Danskammer APA” and the “Roseton APA,” respectively) for a combined cash purchase price of $23 million and the assumption of certain liabilities (the “Facilities Sale Transactions”). The Facilities Sale Transactions are expected to close upon the satisfaction of certain closing conditions and the receipt of any necessary regulatory approvals. Please read
Note 3—Emergence from Bankruptcy and Fresh-Start Accounting
and
Note 6—Dispositions and Discontinued Operations
for further discussion.
Effective September 1, 2011, we transferred our Coal segment, which included approximately 3,100 MW at the time, to Legacy Dynegy (the “DMG Transfer”). On June 5, 2012, the effective date of the Settlement Agreement (as defined and discussed below in Note 3 to our financial statements), we reacquired the Coal segment (the “DMG Acquisition”). Please read
Note 3—Emergence from Bankruptcy and Fresh-Start Accounting
for further discussion. Effective January 7, 2013, we retired the Stallings and Oglesby facilities, two natural gas peaking facilities aggregating approximately 150 MW, that have historically been included in our Coal segment.
MARKET DISCUSSION
Our business operations are focused primarily on the wholesale power generation sector of the energy industry. We manage and report the results of our power generation business based on fuel type with two segments on a consolidated basis: (i) Coal and (ii) Gas.
NERC Regions, RTOs and ISOs.
In discussing our business, we often refer to NERC regions. The NERC and its regional reliability entities were formed to ensure the reliability and security of the electricity system. The regional reliability entities set standards for reliable operation and maintenance of power generation facilities and transmission systems. For example, each NERC region establishes a minimum operating reserve requirement to ensure there is sufficient generating capacity to meet expected demand within its region. Each NERC region reports seasonally and annually on the status of generation and transmission in such region.
Separately, RTOs and ISOs administer the transmission infrastructure and markets across a regional footprint in most of the markets in which we operate. They are responsible for dispatching all generation facilities in their respective footprints and are responsible for both maximum utilization and reliable and efficient operation of the transmission system. RTOs and ISOs administer energy and ancillary service markets in the short term, usually day ahead and real-time markets. Several RTOs and ISOs also ensure long-term planning reserves through monthly, semi-annual, annual and multi-year capacity markets. The
7
RTOs and ISOs that oversee most of the wholesale power markets in which we operate currently impose, and will likely continue to impose, both bid and price limits. They may also enforce caps and other mechanisms to guard against the exercise of market dominance in these markets. NERC regions and RTOs/ISOs often have different geographic footprints, and while there may be geographic overlap between NERC regions and RTOs/ISOs, their respective roles and responsibilities do not generally overlap.
In RTO and ISO regions with centrally dispatched market structures, all generators selling into the centralized market receive the same price for energy sold based on the bid price associated with the production of the last MWh that is needed to balance supply with demand within a designated zone or at a given location (different zones or locations within the same RTO/ISO may produce different prices respective to other zones within the same RTO/ISO due to transmission losses and congestion). For example, a less efficient and/or less economical natural gas-fired unit may be needed in some hours to meet demand. If this unit’s production is required to meet demand on the margin, its bid price will set the market clearing price that will be paid for all dispatched generation in the same zone or location (although the price paid at other zones or locations may vary because of transmission losses and congestion), regardless of the price that any other unit may have offered into the market. In RTO and ISO regions with centrally dispatched market structures and location-based marginal price clearing structures (e.g. PJM, NYISO, MISO, CAISO and ISO-NE), generators will receive the location-based marginal price for their output. The location-based marginal price, absent congestion, would be the marginal price of the most expensive unit needed to meet demand. In regions that are outside the footprint of RTOs/ISOs, prices are determined on a bilateral basis between buyers and sellers.
Reserve Margins.
RTOs and ISOs are required to meet NERC planning and resource adequacy standards. The reserve margin, which is the amount of generation resources in excess of peak load, is a measure of resource adequacy and is also used to assess the supply-demand balance of a region. RTOs and ISOs use various mechanisms to help market participants meet their planning reserve margin requirements. Mechanisms range from centralized capacity markets administered by the ISO to unstructured markets where entities fulfill their requirements through a combination of long and short-term bilateral contracts between individual counterparties and self-generation.
Coal Segment
Our Coal segment is comprised of four operating coal-fired power generation facilities in Illinois with a total generating capacity of
2,980
MW.
RTO/ISO Discussion
MISO.
The MISO market includes all of Wisconsin and portions of Michigan, Kentucky, Indiana, Illinois, Nebraska, Kansas, Missouri, Iowa, Minnesota, North Dakota, Montana and Manitoba, Canada.
The MISO energy market is designed to ensure that all market participants have open-access to the transmission system on a non-discriminatory basis. MISO, as an independent RTO, maintains functional control over the use of the transmission system to ensure transmission circuits do not exceed their secure operating limits and become overloaded. MISO operates day-ahead and real-time energy markets using a LMP system which calculates a price for every generator and load point within MISO. This market is transparent, allowing generators and load serving entities to see real-time price effects of transmission constraints and the impacts of congestion at each pricing point.
The MISO filed proposed Resource Adequacy Enhancements with FERC on July 20, 2011. FERC conditionally approved MISO’s proposal on June 11, 2012, leaving much of MISO’s proposal in place. The proposed tariff revisions require capacity to be procured on a zonal basis for a full planning year (June 1 - May 31) versus the current monthly requirement, with procurement occurring two months ahead of the planning year. The new construct will be in place for the 2013-2014 planning year. While the new construct is an incremental improvement over the status quo, the impact on capacity prices in the near future due to excess capacity in the MISO market is uncertain. In addition, increased market participation by demand response resources and potential retirement of marginal MISO facilities could also affect MISO capacity and energy market prices in the future.
MISO also administers an FTR market holding monthly and annual auctions. FTRs allow users to manage the cost of transmission congestion (as measured by LMP differentials, between source and sink points on the transmission grid) and corresponding price differentials across the market area.
MISO implemented the Ancillary Services Market (Regulation and Operating Reserves) on January 6, 2009 and implemented an enforceable Planning Reserve Margin for each planning year effective June 1, 2009. A feature of the Ancillary Services Market is the addition of scarcity pricing that, during supply shortages, can raise the combined price of energy and ancillary services significantly higher than the previous cap of $1,000/MWh.
8
An independent market monitor is responsible for ensuring that MISO markets are operating competitively and without exercise of market power.
Contracted Capacity and Energy
We commercialize our Coal segment assets through a combination of physical participation in the MISO markets (as described above), bilateral physical and financial power sales, and fuel and capacity contracts.
Reserve Margins
The MISO Summer 2012 projected Planning Reserve Margin was 27 percent with a 17 percent Planning Reserve Margin requirement based on a projected summer peak of 89,867 MW. A heat wave and plant outages saw the actual peak load come in much higher at 98,576 MW. This would mean the actual reserve margin would have been closer to the Planning Reserve Margin requirement of 17 percent, which suggests, given the heat wave, MISO is still oversupplied. In 2011, the projected Planning Reserve Margin was 24 percent while the Planning Reserve Margin requirement was 17 percent
.
Gas Segment
Our Gas segment is comprised of seven operating natural gas-fired power generation facilities located in California (2), Nevada (1), Illinois (1), Pennsylvania (1), New York (1), and Maine (1), and one fuel-oil fired power generation facility located in California, totaling
6,771
MW of electric generating capacity. Our 309 MW South Bay facility was permanently retired in 2010 and is currently in the process of being demolished.
RTO/ISO Discussion
PJM.
The PJM market includes all or parts of Delaware, Illinois, Indiana, Kentucky, Maryland, Michigan, New Jersey, North Carolina, Ohio, Pennsylvania, Tennessee, Virginia, West Virginia and the District of Columbia. Our Kendall and Ontelaunee facilities, located in Illinois and Pennsylvania, respectively, operate in PJM with an aggregate net generating capacity of
1,780
MW.
PJM administers markets for wholesale electricity and provides transmission planning for the region, utilizing the LMP system described above. PJM operates day-ahead and real-time markets into which generators can bid to provide energy and ancillary services. PJM also administers markets for capacity. An independent market monitor continually monitors PJM markets for any exercise of market power or improper behavior by any entity. PJM implemented a forward capacity auction in 2007, the RPM, which established long-term markets for capacity. In addition to entering into bilateral capacity transactions, we have participated in RPM base residual auctions for years up to and including PJM’s planning year 2015-2016, which ends May 31, 2016, as well as ongoing incremental auctions to balance positions and offer residual capacity that may become available.
PJM, like MISO, dispatches power plants to meet system energy and reliability needs, and settles physical power deliveries at LMPs. This value is determined by an ISO-administered auction process, which evaluates and selects the least cost supplier offers to create reliable and least-cost dispatch. The ISO-administered LMP energy markets consist of two separate and characteristically distinct settlement time frames. The first is a security-constrained, financially firm, day-ahead unit commitment market. The second is a security-constrained, financially-settled, real-time dispatch and balancing market. Prices paid in these LMP energy markets, however, are affected by, among other things, (i) market mitigation measures, which can result in lower prices associated with certain generating units that are mitigated because they are deemed to have the potential to exercise locational market power, and (ii) the existing $1,000/MWh energy market price caps that are in place.
NYISO.
The NYISO market includes the entire state of New York. Capacity pricing is calculated as a function of NYISO’s annual required reserve margin, the estimated net cost of “new entrant” generation, estimated peak demand and the actual amount of capacity bid into the market at or below the demand curve. The demand curve mechanism provides for incrementally higher capacity pricing at lower reserve margins, such that “new entrant” economics become attractive as the reserve margin approaches required minimum levels. The intent of the demand curve mechanism is to ensure that existing generation facilities have enough revenue to recover their investment when capacity revenues are coupled with energy and ancillary service revenues. Additionally, the demand curve mechanism is intended to attract new investment in generation when and where that new capacity is needed most. To calculate the price and quantity of installed capacity, three ICAP demand curves are utilized: one for Long Island, one for New York City and one for Statewide (commonly referred to as Rest of State). Our Independence facility operates in the Rest of State market with an aggregate net generating capacity of
1,064
MW.
Due to transmission constraints, energy prices vary across New York and are generally higher in the Southeastern part of New York, New York City and Long Island. Our Independence facility is located in the Northwestern part of the state.
9
ISO-NE.
The ISO-NE market includes the six New England states of Vermont, New Hampshire, Massachusetts, Connecticut, Rhode Island and Maine. Much like regional zones in the NYISO, energy prices also vary among the participating states in ISO-NE, and are largely influenced by transmission constraints and fuel supply. ISO-NE implemented a FCM in June 2010, where capacity prices are determined through auctions. Our Casco Bay facility, located in Maine, operates in ISO-NE with an aggregate net generating capacity of
540
MW.
CAISO.
CAISO covers approximately 90 percent of the State of California and operates a centrally cleared market for energy and ancillary services. Energy is priced at each location utilizing the LMP system described above. This market structure was implemented in April of 2009 as part of the MRTU. Currently the CAISO has a mandatory resource adequacy requirement but no centrally-administered capacity market. The Oakland facility has been designated as an RMR unit by the CAISO for 2013. Our Moss Landing, Morro Bay and Oakland facilities operate in CAISO with an aggregate net generating capacity of
3,344
MW.
Contracted Capacity and Energy
PJM.
Our generation assets in PJM are natural gas-fired, combined-cycle, intermediate-dispatch facilities. We commercialize these assets through a combination of bilateral power, fuel and capacity contracts. We commercialize our capacity through either the RPM auction or on a bilateral basis. Our Kendall facility has one tolling agreement for 85 MW that expires in 2017.
NYISO.
At our Independence facility, 740 MW of capacity is contracted under a capacity sales agreement that runs through 2014. Revenue from this capacity obligation is largely fixed with a variable discount that varies each month based on the applicable LMP. Additionally, we supply steam and up to 44 MW of electric energy from our Independence facility to a third party at a fixed price.
Due to the standard capacity market operated by NYISO and liquid over-the-counter market for NYISO capacity products, we are able to sell substantially all of the Independence facility’s remaining uncommitted capacity into the market.
ISO-NE.
Our Casco Bay facility sells capacity through the forward capacity auctions administered by the ISO-NE. Seven forward capacity auctions have been held to date with capacity clearing prices ranging from a high of $4.50 kW/month for the 2010/2011 market period to a low of $2.95 kW/month for the 2013/2014 market period. All auctions to date have cleared at the floor price due to oversupply of capacity in the region. Since there is an oversupply of capacity in excess of the installed reserve requirement, each participant can elect to either prorate down the number of its megawatts cleared at the floor price or accept the prorated price for its full obligation.
CAISO.
In CAISO, where our assets include intermediate dispatch and peaking facilities, we seek to mitigate spark spread variability through RMR, tolling arrangements and physical and financial bilateral power and fuel contracts. All of the capacity of our Moss Landing Units 6 and 7 is contracted under tolling arrangements through 2013. As previously noted, our Oakland facility operates under an RMR contract with the CAISO.
Black Mountain.
We have a 50 percent indirect ownership interest in the Black Mountain facility, which is a PURPA QF located near Las Vegas, Nevada, in the WECC. Capacity and energy from this facility are sold to Nevada Power Company under a long-term PURPA QF contract that expires in 2023.
Reserve Margins
PJM.
Installed reserve margin requirement is reviewed by PJM on an annual basis and has been in the 15.5 percent to 15.9 percent range for the Planning Years 2011/12 to 2013/14. The actual reserve margin based on deliverable capacity was 27 percent for Planning Year 2011/12, which is 11.5 percentage points above the required installed reserve margin.
NYISO.
A reserve margin of 16 percent has been accepted by FERC for the New York Control Area for the period beginning May 1, 2012 and ending April 30, 2013, up from the current requirement of 15.5 percent. An increase to the reserve margin to 17 percent for the period beginning May 1, 2013 and ending April 30, 2014 is being reviewed at FERC. The actual amount of installed capacity is approximately 14 percentage points above NYISO’s current required reserve margin.
ISO-NE.
Similar to PJM, ISO-NE will publish on an annual basis the required reserve margin which is called Installed Capacity Requirement (ICR). For the 2012/13 planning period, it is 13.2 percent, including capacity imported from Hydro Quebec (HQICC). Actual installed reserve margin is approximately 30 percent, which is 16.8 percentage points above the ICR.
Recommended improvements and modifications to the forward capacity market design are currently in litigation at FERC, and discussions to address improvements to the forward capacity market design are currently underway by the ISO and its stakeholders. Beginning with the 2017-2018 commitment year, the floor price in the capacity market will be removed. This
10
could result in lower capacity prices paid to suppliers, however significant retirements of coal and oil units as well as the reduction in demand response would help offset the lower prices.
CPUC/CAISO.
The CPUC requires a resources adequacy margin of 15 to 17 percent. As of the latest summer assessment for the region in March 2012, the reserve margin was approximately 22.5 percent. Unlike other centrally cleared capacity markets, the CAISO resource adequacy market is a bi-laterally traded market which typically transacts as monthly products as opposed to annual capacity products in other regions. On the state level, there are numerous ongoing market initiatives that impact wholesale generation, principally the development of resource adequacy rules and capacity markets to include the necessary flexibility to integrate the state-mandated 33 percent renewable resources and maintain reliability of the grid.
Other
Market-Based Rates.
Our ability to charge market-based rates for wholesale sales of electricity, as opposed to cost-based rates, is governed by FERC. We have been granted market-based rate authority for wholesale power sales from our EWG facilities, as well as wholesale power sales by our power marketing entities, DYPM and DMT. The Dynegy EWG facilities include all of our facilities except our investment in the Nevada Cogeneration Associates #2 (“Black Mountain”) facility. This facility is known as a QF, and has various exemptions from federal regulation and sells electricity directly to purchasers under negotiated and previously approved power purchase agreements.
Every three years, FERC conducts a review of our market-based rates and potential market power on a regional basis (known as the triennial market power review). In 2012, we filed a market power update with FERC for our MISO assets. On February 26, 2013, FERC issued an order accepting this market power update.
The Dodd-Frank Act.
The CFTC has regulatory oversight authority over the trading of electricity and gas commodities, including financial products and derivatives, under the Commodity Exchange Act. On July 21, 2010, President Obama signed the Dodd-Frank Wall Street Reform and Consumer Protection Act (the “Dodd-Frank Act”), which, among other things, aims to improve transparency and accountability in derivative markets. Several key rulemakings, no-action letters and other regulatory guidance were finalized and issued by the CFTC in the second half of 2012 regarding specific entity designations and swap definition rules within the Dodd-Frank Act. Based on our evaluation of our historical and anticipated future trading practices, we have determined that we are not a “swap dealer” or a “major swap participant” as defined by the CFTC and, therefore, have not registered as a swap dealer with the CFTC. We will continue to monitor current trading practices as a non-swap dealer and are in the process of putting systems in place in order to begin reporting derivatives activity, as will be required of entities that are end-users of swaps, beginning in April 2013.
ENVIRONMENTAL MATTERS
Our business is subject to extensive federal, state and local laws and regulations governing discharge of materials into the environment. We are committed to operating within these regulations and to conducting our business in an environmentally responsible manner. The environmental, legal and regulatory landscape is subject to change and has become more stringent over time. The process for acquiring or maintaining permits or otherwise complying with applicable rules and regulations may create unprofitable or unfavorable operating conditions or require significant capital and operating expenditures. Any failure to acquire or maintain permits or to otherwise comply with applicable rules and regulations may result in fines and penalties or negatively impact our ability to advance projects in a timely manner, if at all. Further, changing interpretations of existing regulations may subject historical maintenance, repair and replacement activities at our facilities to claims of noncompliance.
Our aggregate expenditures (both capitalized and those included in operating expense) for compliance with laws and regulations related to the protection of the environment were approximately $85 million in 2012 compared to approximately $180 million in 2011 and approximately $225 million in 2010. The 2012 expenditures included approximately $60 million for projects related to our Consent Decree (which is defined and discussed below) compared to approximately $150 million for Consent Decree projects in 2011. We estimate that total expenditures for environmental compliance in 2013 will be approximately $45 million, including approximately $10 million in capital expenditures and $35 million in operating expenses. Changes in environmental regulations or outcomes of litigation and administrative proceedings could result in additional requirements that would necessitate increased future spending and could create adverse operating conditions. Please read
Note 22—Commitments and Contingencies
for further discussion of this matter.
The Clean Air Act
The CAA and comparable state laws and regulations relating to air emissions impose responsibilities on owners and operators of sources of air emissions, including requirements to obtain construction and operating permits as well as compliance certifications and reporting obligations. The CAA requires that fossil-fueled electric generating plants have sufficient emission allowances to cover actual SO
2
emissions and in some regions NO
x
emissions, and that they meet certain
11
pollutant emission standards as well. Our power generation facilities, some of which have changed their operations to accommodate new control equipment or changes in fuel mix, are currently in compliance with these requirements.
In order to ensure continued compliance with the CAA and related rules and regulations, including ozone-related requirements, we have installed emission reduction technology at our Coal segment facilities. Our Baldwin and Havana facilities have installed and are operating dry flue gas desulfurization systems for the control of SO
2
emissions, and electrostatic precipitators and baghouses for the control of particulate emissions. Our Hennepin facility has electrostatic precipitators and baghouses for the control of particulate matter. The baghouses at our Coal segment facilities also control hazardous air pollutants in particulate form, such as most metals. Activated carbon injection or mercury oxidation systems for the control of mercury emissions have been installed and are operating on all of our Coal segment’s coal-fired capacity. SCR technology to control NO
x
emissions has been installed and has been operating at Havana and two units at Baldwin for several years; the remaining Coal segment units use low-NO
x
burners and overfire air to lower NO
x
emissions. All of our Coal segment facilities also use low sulfur coal.
Multi-Pollutant Air Emission Initiatives
In recent years, various federal and state legislative and regulatory multi-pollutant initiatives have been introduced. In 2005, the EPA finalized the CAIR, which would require reductions of approximately 70 percent each in emissions of SO
2
and NO
x
by 2015 from coal-fired power generation units across the eastern United States. The CAIR was challenged by several parties and ultimately remanded to the EPA by the U.S. Court of Appeals for the District of Columbia Circuit. The CAIR remained in effect in 2012 and, as a result of a court order staying the CAIR’s intended replacement rule (i.e. the CSAPR), the CAIR will continue in effect at least until the judicial challenges to the CSAPR are resolved. Our facilities in Illinois
and New York are subject to state SO
2
and NO
x
limitations more stringent than those imposed by the CAIR.
Cross-State Air Pollution Rule.
On July 6, 2011, the EPA issued its final rule on Federal Implementation Plans to Reduce Interstate Transport of Fine Particulate Matter and Ozone (the “Cross-State Air Pollution Rule,” formerly known as the Transport Rule). Numerous petitions for judicial review of the CSAPR were filed and, on December 30, 2011, the U.S. Court of Appeals for the District of Columbia Circuit issued an order staying implementation of the CSAPR. In response, the EPA reinstated the CAIR pending judicial review. On August 21, 2012, the court vacated the CSAPR and ordered the EPA to continue administering the CAIR pending the promulgation of a valid replacement rule. On January 24, 2013, the court denied petitions for rehearing that had been filed by the EPA and others. The EPA has not yet indicated if it will seek Supreme Court review of the appellate court's decision.
The CSAPR is intended to reduce emissions of SO
2
and NO
x
from large EGUs in the eastern half of the United States. If the CSAPR is eventually upheld by the courts, the rule would impose cap-and-trade programs within each affected state that cap emissions of SO
2
and NO
x
at levels predicted to eliminate that state’s contribution to nonattainment in, or interference with maintenance of attainment status by, down-wind areas with respect to the NAAQS for particulate matter (PM
2.5
) and ozone. Under the CSAPR, our generating facilities in Illinois, New York and Pennsylvania would be subject to new cap-and-trade programs capping emissions of NO
x
from May 1 through September 30 and capping emissions of SO
2
and NO
x
on an annual basis. The requirements applicable to SO
2
emissions from electric generating units in Illinois, New York and Pennsylvania would have been implemented in two stages with existing EGUs in these states allocated fewer SO
2
emission allowances beginning in 2014.
Based on the allowance allocations in the final CSAPR and our current projections of emissions in 2013, we anticipate that our Coal segment facilities would have an adequate number of allowances in 2013 under each of the three applicable CSAPR cap-and-trade programs (SO
2
, NO
x
annual, and NO
x
ozone season) in the event CSAPR were reinstated.
We will continue to monitor rulemaking, judicial and legislative developments regarding the CASPR and a possible replacement rule, and evaluate any potential impacts on our operations.
Mercury/HAPs.
In March 2005, the EPA issued the CAMR for control of mercury emissions from coal-fired power plants and established a cap-and-trade program requiring states to promulgate rules at least as stringent as the CAMR. In December 2006, the Illinois Pollution Control Board approved a state rule for the control of mercury emissions from coal-fired power plants that required additional capital and operating expenditures at our Illinois coal-fired plants beginning in 2007.
In February 2008, the U.S. Court of Appeals for the District of Columbia Circuit vacated the CAMR; however, the Illinois mercury regulations remain in effect. In March 2011, the EPA released a proposed rule to establish MACT emission standards for HAPs at coal- and oil-fired EGUs. On December 21, 2011, the EPA issued its EGU MACT final rule, the Mercury and Air Toxics Standards (“MATS”) rule, which establishes numeric emission limits for mercury, non-mercury metals (filterable particulate may be used as a surrogate), and acid gases (hydrogen chloride used as a surrogate, with SO
2
as an optional surrogate for coal-fired units using flue gas desulfurization; oil-fired units also would be subject to a hydrogen fluoride limit), and work practice standards for organic HAPs. Compliance would be required by April 16, 2015 (i.e. three years after
12
the effective date of the final rule), unless an extension is granted in accordance with the CAA. Various parties have filed judicial appeals of the MATS rule.
Given the air emission controls already employed on our Coal segment facilities, we expect that our coal units in Illinois will be in compliance with the MATS rule emission limits without the need for significant additional investment. We continue to evaluate the final MATS rule, as well as related judicial and legislative developments, for potential impacts on our operations.
Other Air Emission Initiatives
NAAQS
. On April 30, 2012, the EPA designated as nonattainment with the 2008 ozone NAAQS the St. Louis-St. Charles-Farmington, Missouri-Illinois area, which includes Madison County, Illinois, the location of our Wood River station. The EPA classified the affected multi-state area as marginal nonattainment with an attainment deadline in 2015. On June 12, 2012, the EPA designated the multi-state area as attainment with the 1997 8-hour ozone NAAQS. The EPA is expected to complete its review of the ozone NAAQS in 2013. While the nature and scope of potential future requirements concerning the 2008 ozone NAAQS or a potentially more stringent future ozone NAAQS cannot be predicted with confidence at this time, a requirement for additional NO
x
emission reductions at our Wood River facility, or any of our other facilities, for purposes of the ozone NAAQS, may result in significantly increased compliance costs and could have a material adverse effect on our financial condition, results of operations and cash flows.
In June 2010, the EPA adopted a new SO
2
NAAQS, replacing the previous 24-hour and annual standards with a new short-term 1-hour standard. Areas initially designated nonattainment must achieve attainment no later than five years after initial designation. In February 2013, the EPA identified areas it intended to designate as nonattainment with the 1-hour SO
2
NAAQS based on ambient monitoring data. The EPA also released a strategy for completing initial area designations by late December 2017 for areas that currently lack sufficient monitoring data. While none of our generating facilities are located in areas that the EPA has currently identified for designation as nonattainment, the nature and scope of potential future requirements concerning the 1-hour SO
2
NAAQS, cannot be predicted with confidence at this time. A future requirement for additional SO
2
emission reductions at any of our generating facilities for purposes of the 1-hour SO
2
NAAQS may result in significantly increased compliance costs and could have a material adverse effect on our financial condition, results of operations and cash flows.
On December 14, 2012, the EPA issued a final rule lowering the NAAQS for PM2.5. The EPA intends to make initial nonattainment designations by December 2014. The earliest attainment deadlines would be in approximately 2020. The nature and scope of potential future requirements resulting from the more stringent PM2.5 NAAQS cannot be predicted with confidence at this time, but a requirement for additional emission reductions at any of our facilities for purposes of the more stringent PM2.5 NAAQS may result in significantly increased compliance costs and could have a material adverse effect on our financial condition, results of operations and cash flows.
New York NO
x
RACT Rule.
In June 2010, New York State issued a final rule establishing revised RACT limits for emissions of NO
x
from stationary combustion sources. Compliance with the revised NO
x
RACT limits is required by July 1, 2014, and compliance plans were due to NYSDEC by January 1, 2012. In December 2011, we submitted a RACT proposal for our Gas segment’s Independence facility, which proposed to meet the presumptive RACT limits using the facility’s existing SCR technology and currently applicable NO
x
BACT emission limits.
Consent Decree
. In 2005, we settled a lawsuit filed by the EPA and the United States Department of Justice in the U.S. District Court for the Southern District of Illinois that alleged violations of the Clean Air Act and related federal and Illinois regulations concerning certain maintenance, repair and replacement activities at our Baldwin generating station. A consent decree (the “Consent Decree”) was finalized in July 2005. Among other provisions of the Consent Decree, we are required to not operate certain of our power generating facilities after specified dates unless certain emission control equipment is installed. On November 3, 2012, Dynegy completed the Baldwin Unit 2 outage marking the completion of the material Consent Decree environmental compliance capital requirements. We have spent approximately $921 million related to these Consent Decree projects as of December 31, 2012.
Please read Item 7—Management’s Discussion and Analysis of Financial Condition and Results of Operations—Cash Flow Investing Activities for further discussion.
The Clean Water Act
Our water withdrawals and wastewater discharges are permitted under the CWA and analogous state laws. The cooling water intake structures at several of our facilities are regulated under Section 316(b) of the CWA. This provision generally directs that standards set for facilities require that the location, design, construction and capacity of cooling water intake structures reflect BTA for minimizing adverse environmental impact. These standards are developed and implemented
13
for power generating facilities through NPDES permits or SPDES permits. Historically, standards for minimizing adverse environmental impacts of cooling water intakes have been made by permitting agencies on a case-by-case basis considering the best professional judgment of the permitting agency.
In 2004, the EPA issued the Cooling Water Intake Structures Phase II Rules (the “Phase II Rules”), which set forth standards to implement the BTA requirements for cooling water intakes at existing facilities. The rules were challenged by several environmental groups and in 2007 were struck down by the U.S. Court of Appeals for the Second Circuit in
Riverkeeper, Inc. v. EPA
. The court’s decision remanded several provisions of the rules to the EPA for further rulemaking. Several parties sought review of the decision before the U.S. Supreme Court. In April 2009, the U.S. Supreme Court ruled that the EPA permissibly relied on cost-benefit analysis in setting the national BTA performance standard and in providing for cost-benefit variances from those standards as part of the Phase II Rules.
In July 2007, following remand of the rules by the U.S. Court of Appeals, the EPA suspended its Phase II Rules and advised that permit requirements for cooling water intake structures at existing facilities should once more be established on a case-by-case best professional judgment basis until replacement rules are issued. On March 28, 2011, the EPA released a proposed rule for cooling water intake structures at existing facilities. The proposed rule would (i) establish impingement mortality standards and (ii) require the permitting authority to establish case-by-case entrainment mortality standards. In June 2012, the EPA released a NODA requesting comment on new impingement data in the rulemaking record and possible alternative approaches for impingement standards, which generally would provide more compliance flexibility to affected facilities. The EPA has reached an agreement to extend the deadline for issuing its final rule on cooling water intake structures until June 27, 2013. We continue to analyze the proposed rule and its potential impacts at our affected power generation facilities. The scope of requirements, timing for compliance and the compliance methodologies that will ultimately be allowed under the final rule potentially may result in significantly increased compliance costs and could have a material adverse effect on our financial condition, results of operations and cash flows.
The environmental groups that participate in our NPDES (and SPDES) permit proceedings generally argue that only closed cycle cooling meets the BTA requirement. The issuance and renewal of the NPDES permit for Moss Landing was challenged on this basis. The Moss Landing NPDES permit, which was issued in 2000, does not require closed cycle cooling and was challenged by a local environmental group. In August 2011, the Supreme Court of California affirmed the appellate court’s decision upholding the permit.
Other future NPDES proceedings could have a material adverse effect on our financial condition, results of operations and cash flows; however, given the numerous variables and factors involved in calculating the potential costs associated with installing a closed cycle cooling system, any decision to install such a system at any of our facilities would be made on a case-by-case basis considering all relevant factors at such time. If capital expenditures related to cooling water systems are great enough to render the operation of the plant uneconomical, we could, at our option, and subject to any applicable financing agreements or other obligations, reduce operations or cease to operate that facility and forego the capital expenditures.
Havana NPDES Permit
. In September 2012, the Illinois EPA issued a renewal NPDES permit for the Havana Power Station. In October 2012, environmental interest groups filed a petition for review with the Illinois Pollution Control Board challenging the permit. The petitioners allege that the permit does not adequately address the discharge of wastewaters associated with newly installed air pollution control equipment (i.e. a spray dryer absorber and activated carbon injection system to reduce SO
2
and mercury air emissions) at Havana. We dispute the allegations and will defend the permit vigorously. The permit remains in effect during the appeal. The outcome of the appeal is uncertain at this time.
California Water Intake Policy.
The California State Water Board adopted its Statewide Water Quality Control Policy on the Use of Coastal and Estuarine Waters for Power Plant Cooling (the “Policy”) in May 2010. The Policy requires that existing power plants: (i) reduce their water intake flow rate to a level commensurate with that which can be achieved by a closed cycle cooling system or (ii) if it is not feasible to reduce the water intake flow rate to this level, reduce impingement mortality and entrainment to a level comparable to that achieved by such a reduced water intake flow rate using operational or structural controls, or both. Compliance with the Policy would be required at our Morro Bay power generation facility by December 31, 2015 and at our Moss Landing power generation facility by December 31, 2017. In October 2010, Dynegy Morro Bay, LLC and Dynegy Moss Landing, LLC joined with other California power plant owners in filing a lawsuit in the Sacramento County Superior Court challenging the Policy. We cannot predict with confidence the outcome of the litigation at this time.
In September 2010, the State Water Board proposed to amend the Policy to allow an owner or operator of a power plant with previously installed combined-cycle power generating units to continue to use once-through cooling at combined-cycle units until the unit reaches the end of its useful life under certain circumstances. At its December 14, 2010 hearing on the proposed amendment, the State Water Board declined to approve the amendment and instead tabled it for consideration until after the SACCWIS has reviewed facility compliance plans and made recommendations to the Board. In March 2012,
14
SACCWIS reported its recommendations to the Board on the Policy’s compliance deadlines, recommending that the Board recognize it may be necessary to modify final compliance dates for generating units due to projected capacity needs in the ISO balancing authority area. SACCWIS concluded that, based on the state’s electric system needs, it is possible that additional reliability studies may justify revisions to the final compliance date for some or all of Moss Landing’s capacity, but that it did not believe an extension of the final compliance date for Morro Bay is necessary at this time.
In accordance with the Policy, on April 1, 2011, we submitted proposed compliance plans for our Morro Bay and Moss Landing facilities. For Morro Bay and Moss Landing Units 6 and 7, we proposed to continue our ongoing review of potential compliance options taking into account each facility’s applicable final compliance deadline. For Moss Landing Units 1 and 2, we proposed to continue current once-through cooling operations through the end of 2032, at which time we would evaluate repowering or installation of feasible control measures.
It may not be possible to meet the requirements of the Policy without installing closed cycle cooling systems. Given the numerous variables and factors involved in calculating the potential costs of closed cycle cooling systems, any decision to install such a system would be made on a case-by-case basis considering all relevant factors at the time. In addition, while the Policy is generally at least as stringent as the EPA’s proposed rule for cooling water intake structures, compliance with the Policy may not meet all requirements of the forthcoming EPA final rule. If capital expenditure requirements related to cooling water systems are great enough to render the continued operation of a particular plant uneconomical, we could at our option, and subject to any applicable financing agreements and other obligations, reduce operations or cease to operate the plant and forego such capital expenditures.
Other CWA Initiatives.
The requirements applicable to water quality are expected to increase in the future. A number of efforts are under way within the EPA to evaluate water quality criteria for parameters associated with the by-products of fossil fuel combustion. These parameters relate primarily to arsenic, mercury and selenium. Under a consent decree, as modified, the EPA is required to propose revisions to the Effluent Limitation Guidelines for steam electric units by April 19, 2013 and to take final action on the proposal by May 22, 2014. Significant changes in these requirements could require installation of additional water treatment equipment at our facilities or require dry handling of coal ash. The nature and scope of potential future water quality requirements concerning the by-products of fossil fuel combustion cannot be predicted with confidence at this time, but could have a material adverse effect on our financial condition, results of operations and cash flows.
Coal Combustion Residuals
The combustion of coal to generate electric power creates large quantities of ash that are managed at power generation facilities in dry form in landfills and in liquid or slurry form in surface impoundments. Each of our coal-fired plants has at least one CCR management unit. At present, CCR is regulated by the states as solid waste. The EPA has considered whether CCR should be regulated as a hazardous waste on two separate occasions, including most recently in 2000, and both times has declined to do so. The December 2008 failure of a CCR surface impoundment dike at the Tennessee Valley Authority’s Kingston Plant in Tennessee accompanied by a very large release of ash slurry has resulted in renewed scrutiny of CCR management.
In response to the Kingston ash slurry release, the EPA initiated an investigation of the structural integrity of certain CCR surface impoundment dams including those at our Coal segment facilities. We responded to EPA requests for information and our surface impoundment dams that the EPA has assessed were found to be in satisfactory condition with no recommendations. In May 2012, we received from the EPA draft dam safety assessment reports of the surface impoundments at our Baldwin and Hennepin facilities. The draft reports would rate the impoundments at each facility as “poor”, meaning that a deficiency is recognized for a required loading condition in accordance with applicable dam safety criteria. A poor rating also applies when further critical studies are needed to identify any potential dam safety deficiencies. The draft reports include recommendations for further studies, repairs, and changes in operational and maintenance practices. We provided comments to the EPA on the draft reports and continue to review the draft reports’ recommendations. We anticipate performing the recommended further studies and other actions once the reports are final and any necessary permits are obtained. The nature and scope of potential repairs that ultimately may be needed, if any, cannot be predicted with confidence at this time, but may result in significantly increased compliance costs and could have a material adverse effect on our financial condition, results of operations and cash flows.
In addition, on June 21, 2010, the EPA proposed two alternative rules under RCRA for federal regulation of the management and disposal of CCR from electric utilities and independent power producers. One proposal would regulate CCR as a special waste under RCRA subtitle C rules when those wastes are destined for disposal in a landfill or surface impoundment. The subtitle C proposal would subject persons who generate, transport, treat, store or dispose of such CCR to many of the existing RCRA regulations applicable to hazardous waste. While certain types of beneficial use of CCR would be exempt from regulation under the subtitle C proposal, the impact of subtitle C regulation on the continued viability of beneficial use is debated. Regulation under subtitle C would effectively phase out the use of ash ponds for disposal of CCR.
15
The alternative proposal would regulate CCR disposed in landfills or surface impoundments as a solid waste under subtitle D of RCRA. The subtitle D proposal would establish national criteria for disposal of CCR in landfills and surface impoundments, requiring new units to install composite liners. The subtitle D proposal might also require existing surface impoundments without liners to close or be retrofitted with composite liners within five years.
Certain environmental organizations have advocated designation of CCR as a hazardous waste; however, many state environmental agencies have expressed strong opposition to such designation. On September 30, 2011, the EPA released a NODA regarding its CCR proposed rule for the limited purpose of soliciting comment on additional information regarding the CCR proposal as identified in the NODA. The EPA has indicated plans to release a second NODA to gather additional data for the rulemaking record. The EPA is not expected to issue final regulations governing CCR management until late 2013 or thereafter. In April 2012, CCR marketers and environmental groups separately filed lawsuits seeking to force the EPA to complete its CCR rulemaking as soon as possible. The court is expected to issue a decision in spring 2013, which may expedite EPA’s final rule action. Federal legislation to address CCR as non-hazardous waste also has been introduced in Congress.
We have implemented hydrogeologic investigations for the CCR surface impoundment at our Baldwin facility and for two CCR surface impoundments at our Vermilion facility in response to requests by the Illinois EPA. Groundwater monitoring results indicate that the CCR surface impoundments at each site impact onsite groundwater.
At the request of the Illinois EPA, in late 2011 we initiated an investigation at the Baldwin facility to determine if the facility’s CCR surface impoundment impacts offsite groundwater. Results of the offsite groundwater quality investigation at Baldwin, as submitted to the Illinois EPA in April 2012, indicate two localized areas where Class I groundwater standards were exceeded, however the Illinois EPA has not required further investigation. If these offsite groundwater results are ultimately attributed to the Baldwin CCR surface impoundment and remediation measures are necessary in the future, we may incur significant costs that could have a material adverse effect on our financial condition, results of operations and cash flows. At this time we cannot reasonably estimate the costs of corrective action that ultimately may be required at Baldwin.
In April 2012, we submitted to the Illinois EPA proposed corrective action plans for two of the CCR surface impoundments at the Vermilion facility. The proposed corrective action plans reflect the results of a hydrogeologic investigation, which indicate that the facility’s old east and north CCR impoundments impact groundwater quality onsite and that such groundwater migrates offsite to the north of the property and to the adjacent Middle Fork of the Vermilion River. The proposed corrective action plans include groundwater monitoring and recommend closure of both CCR impoundments, including installation of a geosynthetic cover. In addition, we submitted an application to the Illinois EPA to establish a groundwater management zone while impacts from the facility are mitigated. The preliminary estimated cost of the recommended closure alternative for both impoundments, including post-closure care, is approximately $14 million. The Vermilion facility also has a third CCR surface impoundment, the new east impoundment that is lined and is not known to impact groundwater. Although not part of the proposed corrective action plans, if we decide to close the new east impoundment by removing its CCR contents concurrent with the recommended closure alternative for the old east and north impoundments, the associated estimated closure cost would add an additional $2 million to the above estimate. The Illinois EPA has requested additional details regarding the closure activities associated with our proposed corrective action plans.
In July 2012, the Illinois EPA issued violation notices alleging violations of groundwater standards onsite at the Baldwin and Vermilion facilities. In response, we submitted to the Illinois EPA a proposed compliance commitment agreement for each facility. For Vermilion, we proposed to implement the previously submitted corrective action plans and, for Baldwin, we proposed to perform additional studies of hydrogeologic conditions and apply for a groundwater management zone in preparation for submittal, as necessary, of a corrective action plan. In October 2012, the Illinois EPA notified us that it would not issue proposed compliance commitment agreements for Vermilion and Baldwin. In December 2012, the Illinois EPA provided written notice that it may pursue legal action with respect to each matter through referral to the Illinois Office of the Attorney General. At this time we cannot reasonably estimate the costs of resolving these matters, but resolution of these matters may cause us to incur significant costs that could have a material adverse effect on our financial condition, results of operations and cash flows.
Climate Change
For the last several years, there has been a robust public debate about climate change and the potential for regulations requiring lower emissions of GHG, primarily CO
2
and methane. We believe that the focus of any federal program attempting to address climate change should include three critical, interrelated elements: (i) the environment, (ii) the economy and (iii) energy security.
We cannot confidently predict the final outcome of the current debate on climate change nor can we predict with confidence the ultimate requirements of proposed or anticipated federal and state legislation and regulations intended to address climate change. These activities, and the highly politicized nature of climate change, suggest a trend toward increased
16
regulation of GHG that could result in a material adverse effect on our financial condition, results of operations and cash flows. Existing and anticipated federal and state regulations intended to address climate change may significantly increase the cost of providing electric power, resulting in far-reaching and significant impacts on us and others in the power generation industry over time. It is possible that federal and state actions intended to address climate change could result in costs assigned to GHG emissions that we would not be able to fully recover through market pricing or otherwise. If capital and/or operating costs related to compliance with regulations intended to address climate change become great enough to render the operations of certain plants uneconomical, we could, at our option and subject to any applicable financing agreements or other obligations, reduce operations or cease to operate such plants and forego such capital and/or operating costs.
Power generating facilities are a major source of GHG emissions. In 2012, our Gas and Coal facilities emitted approximately 9 million and 23 million tons of CO
2e
, respectively. The amounts of CO
2e
emitted from our facilities during any time period will depend upon their dispatch rates during the period.
Though we consider our largest risk related to climate change to be legislative and regulatory changes intended to slow or prevent it, we are subject to physical risks inherent in industrial operations including severe weather events such as hurricanes and tornadoes. To the extent that changes in climate effect changes in weather patterns (such as more severe weather events) or changes in sea level where we have generating facilities, we could be adversely affected. To the extent that climate change results in changes in sea level, we would expect such effects to be gradual and amenable to structural mitigation during the useful life of the facilities. However, if this is not the case it is possible that we would be impacted in an adverse way, potentially materially so. We could experience both risks and opportunities as a result of related physical impacts. For example, more extreme weather patterns—namely, a warmer summer or a cooler winter—could increase demand for our products. However, we also could experience more difficult operating conditions in that type of environment. We maintain various types of insurance in amounts we consider appropriate for risks associated with weather events.
Federal Legislation Regarding Greenhouse Gases.
Several bills have been introduced in Congress since 2003 that if passed would compel reductions in CO
2
emissions from power plants. Many of these bills have included cap-and-trade programs. However, with the political shift in the makeup of the 112th Congress (2011-2012), recently introduced legislation would instead have either delayed or prevented the EPA from regulating GHGs under the CAA. While GHG legislation is expected to be introduced again in the 113th Congress (2013-2014), the passage of comprehensive GHG legislation in the next year is considered unlikely.
Federal Regulation of Greenhouse Gases.
In April 2007, the U.S. Supreme Court issued its decision in
Massachusetts v. EPA
, holding that GHGs meet the definition of a pollutant under the CAA and that regulation of GHG emissions is authorized by the CAA.
In response to that decision, the EPA issued a finding in December 2009 that GHG emissions from motor vehicles cause or contribute to air pollution that endangers the public health and welfare. The EPA has since also finalized several rules concerning GHGs as directly relevant to our facilities. In January 2010, the EPA rule on mandatory reporting of GHG emissions from all sectors of the economy went into effect and requires the annual reporting of GHG emissions. We have implemented processes and procedures to report these emissions. In November 2010, the EPA issued PSD and Title V Permitting Guidance for Greenhouse Gases, which focuses on steam turbine and boiler efficiency improvements as a reasonable BACT requirement for coal-fired electric generating units. The EPA Tailoring Rule, which became effective in January 2011, phases in new GHG emissions applicability thresholds for the PSD permit program and for the operating permit program under Title V of the CAA. In general, the Tailoring Rule establishes a GHG emissions PSD applicability threshold of CO
2e
for new and modified major sources. Application of the PSD program to GHG emissions will require implementation of BACT for new and modified major sources of GHG. In February 2012, the EPA proposed not to change its Tailoring Rule GHG permitting thresholds for the PSD and Title V operating permit programs, such that existing sources that emit 100,000 tons per year (tpy) of CO
2e
and make changes increasing GHG emissions by at least 75,000 tpy of CO
2e
would continue to require PSD permits. Facilities that must obtain a PSD permit for other pollutants must also address GHG emission increases of 75,000 tpy or more of CO
2e
. The EPA’s proposal notes that a subsequent rulemaking will be completed by April 30, 2016, to determine whether it would be appropriate to lower the thresholds at that time.
On June 26, 2012, U.S. Court of Appeals for the District of Columbia Circuit upheld the EPA’s endangerment finding and several EPA GHG-related rules in
Coalition For Responsible Regulation, Inc., et al. v. EPA
. The court held that the EPA’s endangerment finding was not arbitrary and capricious notwithstanding scientific uncertainty and that the Agency had adequate evidence on which to base its finding. The court also held that the Tailpipe Rule was adequately justified and that, upon making the Endangerment Finding, the Agency was required by Clean Air Act Section 202 to regulate tailpipe GHG emissions. The court did not reach the merits of the arguments challenging the EPA’s Timing Rule and Tailoring Rule, instead deciding that the petitioners lacked standing to challenge those rules.
17
In March 2011, the EPA entered a settlement agreement of a CAA citizen suit under which the agency would propose NSPS under the CAA for control of GHG emissions from new and modified EGUs, as well as emission guidelines for control of GHG emissions from existing EGUs. The lawsuit,
New York, et al. v. EPA,
involves a challenge to the NSPS for EGUs, issued in 2006, because the rule did not establish standards for GHG emissions. The settlement, as amended, required the EPA to issue proposed GHG emissions standards for EGUs by September 30, 2011 and to finalize the standards by May 26, 2012. On March 27, 2012, the EPA released a proposed NSPS carbon pollution standard for new EGUs. The proposed NSPS would apply only to new fossil fuel-fired EGUs that start construction later than 12 months after the proposal. The proposal would not apply to modifications or reconstructions of existing EGUs. The proposed standard would allow new EGUs to burn any fossil fuel but would establish an output-based standard of 1,000 lbs of CO
2
per megawatt-hour, which the EPA believes is achievable by natural gas combined cycle units without add-on controls. New EGUs that burn other fuels, such as coal, would have to incorporate technology to reduce CO
2
emissions, such as carbon capture and storage. New coal plants using carbon capture and storage would be allowed to average their CO
2
emissions over 30 years to meet the standard, provided that CO
2
emissions were limited to 1,800 lb/MWh on an annual basis, which the EPA believes could be met by using super-critical boiler technology. In December 2012, the U.S. Court of Appeals for the District of Columbia Circuit rejected a challenge to the proposed NSPS as premature. The EPA is expected to issue the final NSPS carbon pollution standard in 2013. The EPA has not indicated its plans concerning a proposed GHG emission standard for existing EGUs.
State Regulation of Greenhouse Gases.
Many states where we operate generation facilities have, are considering, or are in some stage of implementing, state-only regulatory programs intended to reduce emissions of GHGs from stationary sources as a means of addressing climate change.
Our assets in Illinois may become subject to a regional GHG cap-and-trade program under the MGGA. The MGGA is an agreement among six states and one Canadian province to create the MGGRP to establish GHG reduction targets and timeframes consistent with member states’ targets and to develop a market-based and multi-sector cap-and-trade mechanism to achieve the GHG reduction targets. Illinois has set a goal of reducing GHG emissions to 1990 levels by the year 2020, and to 60 percent below 1990 levels by 2050. The MGGA advisory group released a model rule in 2010, but implementation by the MGGA participants has not moved forward.
Our assets in California are subject to the California Global Warming Solutions Act (“AB 32”), which became effective in January 2007. AB 32 requires the CARB to develop a GHG emission control program that will reduce emissions of GHG in the state to their 1990 levels by 2020. In October 2011, the CARB adopted its final GHG cap-and-trade regulation, which became effective on January 1, 2012, but cap-and-trade compliance obligations did not begin until January 1, 2013 due to litigation. The emissions cap set by the CARB for 2013 is about two percent below the emissions level forecast for 2012, declines in 2014 by about two percent, and by about three percent annually from 2015 to 2020. The CARB’s first allowance auction was held in November 2012 with allowances selling at a clearing price of $10.09 per ton. The second allowance auction, held in February 2013, cleared at $13.62 per ton which was $2.91 higher than the price floor of $10.71 per ton. The next quarterly auction is scheduled for May 2013. The CARB expects allowance prices to be in the $15 to $30 range by 2020.
Our generating facilities in California emitted approximately 2 million tons of GHGs during 2012. As a result of tolling agreements for certain of our California units under which GHG allowance costs will be passed through to the tolling counterparty, in 2013 we will be required to acquire allowances covering the GHG emissions of only Moss Landing Units 1 and 2 and Morro Bay. Based on the auction price floor for 2013 and our projected emissions, we estimate the cost of GHG allowances required to operate these units during 2013 would be approximately $17 million; however, we expect that the cost of compliance would be reflected in the power market, and the actual impact to gross margin would be largely offset by an increase in revenue.
In March 2012, several environmental groups filed a lawsuit in California state court challenging the cap-and-trade rule’s offset provisions, which allow covered sources to comply by purchasing emissions reductions made by entities not otherwise participating in the cap-and trade program. In January 2013, the court rejected the challenge. In November 2012, the California Chamber of Commerce filed a lawsuit in state court challenging the legality of the CARB’s cap and trade auction. That case remains pending. The CARB also issued GHG program revisions in 2012 that addressed issues such as auction administration and revisions to the mandatory reporting rule.
The State of California is also a party to a regional GHG cap-and-trade program being developed under the WCI to reduce GHG emissions in the participating jurisdictions. The WCI started as a collaborative effort among seven states and four Canadian provinces, but California currently is the sole remaining state participant. California’s implementation of AB 32 is expected to constitute the state’s contribution to the WCI. In 2012, the CARB proposed regulatory revisions that would link its cap-and-trade rule to WCI partner Quebec’s GHG program, which would allow California entities to comply with the CARB cap-and-trade rule using Quebec-issued compliance instruments.
18
We will continue to monitor developments regarding the California cap-and-trade program and evaluate any potential impacts on our operations.
On January 1, 2009, our assets in New York and Maine became subject to a state-driven GHG emission control program known as RGGI. RGGI was developed and initially implemented by ten New England and Mid-Atlantic states to reduce CO
2
emissions from power plants. The participating RGGI states implemented rules regulating GHG emissions using a cap-and-trade program to reduce CO
2
emissions by at least 10 percent of 2009 emission levels by the year 2018. Compliance with the allowance requirement under the RGGI cap-and-trade program can be achieved by reducing emissions, purchasing or trading allowances, or securing offset allowances from an approved offset project. While allowances are sold by year, actual compliance is measured across a three-year control period. The current control period covers 2012-2014.
RGGI quarterly auctions continued in 2012, with only 2012 allocation year allowances offered in those auctions. On December 5, 2012, RGGI held its eighteenth auction, in which approximately 19.7 million allowances for the second control period were sold at a clearing price of $1.93 per allowance. RGGI’s next quarterly auction is scheduled for March 2013. We have participated in each of the quarterly RGGI auctions (or in secondary markets, as appropriate) to secure allowances for our affected assets.
Our generating facilities in New York and Maine emitted approximately 3 million tons of CO
2
during 2012. We estimate the cost of allowances required to operate these facilities during 2012 was approximately $6 million. Based on projected emissions and the $1.93 per allowance clearing price in RGGI’s most recent auction, we estimate our cost of allowances required to operate these facilities during 2013 will be approximately $4 million.
On February 7, 2013, RGGI released an updated model rule that would reduce the program’s 2014 CO
2
emissions cap from 165 million tons to 91 million tons. The cap would decline further by 2.5 percent each year from 2015 to 2020 and be adjusted to account for allowances held by market participants before the new cap is implemented. RGGI also intends to review the program by 2016 to consider potential additional reductions to the cap after 2020. Under the new cap, RGGI expects allowances to be priced at approximately $4.00 per ton in 2014 and to rise to approximately $10.00 per ton in 2020. RGGI will set the allowance auction minimum reserve price at $2.00 per ton and increase it by 2.5 percent per year. The updated model rule would also require covered sources to hold allowances equal to at least 50 percent of their emissions in each of the first two years of the three-year control period. To implement the new requirements, each of the nine remaining RGGI participating states must complete its own state-specific rulemaking processes to update its CO
2
cap-and-trade rules. While adoption of the updated RGGI rules would be expected to increase the cost of allowances required to operate our New York and Maine facilities in future years, we expect that the cost of compliance would be reflected in the power market, and the actual impact to gross margin would be largely offset by an increase in revenue.
In June 2012, NYSDEC adopted CO
2
emission standards for new major electric generating facilities and for increases in capacity of at least 25 MW at existing major electric generating facilities. The rule does not affect existing electric generating facilities that do not expand electrical output capacity.
Climate Change Litigation.
There is a risk of litigation from those seeking injunctive relief from power generators or to impose liability on sources of GHG emissions, including power generators, for claims of adverse effects due to climate change. Recent court decisions disagree on whether the claims are subject to resolution by the courts and whether the plaintiffs have standing to sue.
In June 2011, the U.S. Supreme Court issued its decision in
AEP v. Connecticut
, which reviewed the appellate court decision in
Connecticut v. AEP
. In September 2009, the U.S. Court of Appeals for the Second Circuit had held in
Connecticut v. AEP
that the U.S. District Court is an appropriate forum for resolving claims by eight states and New York City against six electric power generators related to climate change. The Supreme Court was equally divided by a vote of 4-4 on the question of whether the plaintiffs had standing to bring the suit and, therefore, affirmed the court’s exercise of jurisdiction. On the merits the Court ruled by a vote of 8-0 that the CAA and EPA action authorized by the CAA displace any federal common law right to seek abatement of CO
2
emissions from fossil fuel-fired power plants. The Court did not reach the issue of whether the CAA preempts similar claims under state nuisance law.
On September 21, 2012, the U.S. Court of Appeals for the Ninth Circuit issued its decision in
Native Village of Kivalina v. ExxonMobil Corp
., (following the filing of the DH Chapter 11 Cases, the Kivalina plaintiffs voluntarily dismissed DH with prejudice on February 2, 2012), ruling that the Clean Air Act and EPA actions authorized by the Act have displaced federal common law public nuisance claims concerning domestic GHGs. The court, relying heavily on the Supreme Court’s 2011 ruling in
AEP v. Connecticut,
decided that the displacement of federal common law public nuisance claims regarding GHGs applies equally to actions seeking damages or injunctive relief. The Ninth Circuit declined to address whether the plaintiffs had standing or whether plaintiffs’ claims were political questions not subject to judicial review. In November 2012 the court denied the Kivalina plaintiffs’ petition for rehearing.
19
In October 2009, the U.S. Court of Appeals for the Fifth Circuit considered the appeal of
Comer v. Murphy Oil
and held that claims related to climate change by property owners along the Mississippi Gulf Coast against energy companies could be resolved by the courts. However, the
Comer v. Murphy
decision was subsequently vacated. In May 2011, the plaintiffs re-filed a substantially similar complaint in the U.S. District Court for the Southern District of Mississippi. In March 2012, the court dismissed the complaint on multiple alternative grounds, concluding, among other things, that the plaintiffs lacked standing. The plaintiffs have appealed to the U.S. Court of Appeals for the Fifth Circuit.
The conflict in recent court decisions illustrates the unsettled law related to claims based on the effects of climate change. The decisions affirming the jurisdiction of the courts and the standing of the plaintiffs to bring these claims could result in an increase in similar lawsuits and associated expenditures by companies like ours.
Carbon Initiatives.
We participate in several programs that partially offset or mitigate our GHG emissions. In the lower Mississippi River Valley, we have partnered with the U.S. Fish & Wildlife Service to restore more than 45,000 acres of hardwood forests by planting more than 8 million bottomland hardwood seedlings. In 2012 a portion of the Lower Mississippi River Valley reforestation project was registered under the Verified Carbon Standard, the first U.S. forest carbon offset project to receive this certification. In Illinois, we are funding prairie, bottomland hardwood and savannah restoration projects in partnership with the Illinois Conservation Foundation. We also have programs to reuse CCR produced at our coal-fired generation units through agreements with cement manufacturers that incorporate the material into cement products, helping to reduce CO
2
emissions from the cement manufacturing process.
Remedial Laws
We are subject to environmental requirements relating to handling and disposal of toxic and hazardous materials, including provisions of CERCLA and RCRA and similar state laws. CERCLA imposes strict liability for contributions to contaminated sites resulting from the release of “hazardous substances” into the environment. Those with potential liabilities include the current or previous owner and operator of a facility and companies that disposed, or arranged for disposal, of hazardous substances found at a contaminated facility. CERCLA also authorizes the EPA and, in some cases, private parties to take actions in response to threats to public health or the environment and to seek recovery for costs of cleaning up hazardous substances that have been released and for damages to natural resources from responsible parties. Further, it is not uncommon for neighboring landowners and other affected parties to file claims for personal injury and property damage allegedly caused by hazardous substances released into the environment. CERCLA or RCRA could impose remedial obligations with respect to a variety of our facilities and operations.
As a result of their age, a number of our facilities contain quantities of asbestos-containing materials, lead-based paint and/or other regulated materials. Existing state and federal rules require the proper management and disposal of these materials. We have developed a management plan that includes proper maintenance of existing non-friable asbestos installations and removal and abatement of asbestos-containing materials where necessary because of maintenance, repairs, replacement or damage to the asbestos itself.
COMPETITION
Demand for power may be met by generation capacity based on several competing generation technologies, such as natural gas-fired, coal-fired or nuclear generation, as well as power generating facilities fueled by alternative energy sources, including hydro power, synthetic fuels, solar, wind, wood, geothermal, waste heat and solid waste sources. The power generation business is a regional business that is diverse in terms of industry structure. Our Coal and Gas power generation businesses compete with other non-utility generators, regulated utilities, unregulated subsidiaries of regulated utilities, other energy service companies and financial institutions in the regions in which we operate. We believe that our ability to compete effectively in the power generation business will be driven in large part by our ability to achieve and maintain a low cost of production, primarily by managing fuel costs and to provide reliable service to our customers. Our ability to compete effectively will also be impacted by various governmental and regulatory activities designed to reduce GHG emissions. For example, regulatory requirements for load-serving entities to acquire a percentage of their energy from renewable-fueled facilities will potentially reduce the demand for energy from coal- and gas-fired facilities such as those we own and operate.
SIGNIFICANT CUSTOMERS
Successor
For the Successor Period (as defined below), approximately
34 percent
,
13 percent
,
15 percent
,
16 percent
and
14 percent
of our consolidated revenues were derived from transactions with MISO, NYISO, PJM, CAISO and NGX, respectively. No other customer accounted for more than 10 percent of our consolidated revenues during the Successor Period.
20
Predecessor
For the 2012 Predecessor Period (as defined below), approximately
30 percent
,
16 percent
,
15 percent
and
10 percent
of our consolidated revenues were derived from transactions with MISO, NYISO, PJM and DB, respectively. For the year ended
December 31, 2011
, approximately
38 percent
,
11 percent
,
23 percent
and
12 percent
of our consolidated revenues were derived from transactions with MISO, NYISO, PJM and NGX, respectively. For the year ended
December 31, 2010
, approximately
34 percent
and
14 percent
of our consolidated revenues were derived from transactions with MISO and PJM, respectively. No other customer accounted for more than 10 percent of our consolidated revenues during the 2012 Predecessor Period or years ended 2011 and 2010.
EMPLOYEES
At
December 31, 2012
, we had approximately 281 employees at our corporate headquarters and approximately 796 employees at our facilities, including field-based administrative employees. Approximately 478 employees at our operating facilities are subject to collective bargaining agreements with various unions. Additionally, we have approximately 133 employees at the DNE facilities, of which 100 are subject to collective bargaining agreements. We are currently a party to three different collective bargaining agreements, one of which is expected to be renegotiated in 2013. During the DNE sale process, we experienced a labor strike at the DNE facilities for approximately six weeks. Prior to this occurrence, we had never experienced a work stoppage or strike at any of our facilities.
21
Item 1A.
Risk Factors
FORWARD-LOOKING STATEMENTS
This Form 10-K includes statements reflecting assumptions, expectations, projections, intentions or beliefs about future events that are intended as “forward-looking statements.” All statements included or incorporated by reference in this annual report, other than statements of historical fact, that address activities, events or developments that we or our management expect, believe or anticipate will or may occur in the future are forward-looking statements. These statements represent our reasonable judgment on the future based on various factors and using numerous assumptions and are subject to known and unknown risks, uncertainties and other factors that could cause our actual results and financial position to differ materially from those contemplated by the statements. You can identify these statements by the fact that they do not relate strictly to historical or current facts. They use words such as “anticipate,” “estimate,” “project,” “forecast,” “plan,” “may,” “will,” “should,” “expect” and other words of similar meaning. In particular, these include, but are not limited to, statements relating to the following:
|
•
|
our ability to consummate the acquisition of certain power generation facilities from Ameren Corporation;
|
|
•
|
our ability to consummate the Facilities Sale Transactions in accordance with the Settlement Agreement, the Chapter 11 Joint Plan of Liquidation and the Danskammer and Roseton APAs (each as defined herein);
|
|
•
|
lack of comparable financial data due to the application of fresh-start accounting;
|
|
•
|
beliefs and assumptions relating to our liquidity, available borrowing capacity and capital resources generally, including the extent to which such liquidity could be affected by poor economic and financial market conditions or new regulations and any resulting impacts on financial institutions and other current and potential counterparties;
|
|
•
|
limitations on our ability to utilize previously incurred federal net operating losses or alternative minimum tax credits;
|
|
•
|
expectations regarding our compliance with the DMG and DPC Credit Agreements and DPC’s Revolving Credit Agreement, including collateral demands, interest expense, financial ratios and other payments;
|
|
•
|
the timing and anticipated benefits of any refinancing of the DMG and DPC Credit Agreements;
|
|
•
|
efforts to secure retail sales and the timing of such sales;
|
|
•
|
the timing and anticipated benefits to be achieved through our company-wide cost savings programs, including our PRIDE initiative;
|
|
•
|
efforts to identify opportunities to reduce congestion and improve busbar power prices;
|
|
•
|
expectations regarding environmental matters, including costs of compliance, availability and adequacy of emission credits, and the impact of ongoing proceedings and potential regulations or changes to current regulations, including those relating to climate change, air emissions, cooling water intake structures, coal combustion byproducts, and other laws and regulations to which we are, or could become, subject;
|
|
•
|
beliefs, assumptions and projections regarding the demand for power, generation volumes and commodity pricing, including natural gas prices and the impact on such prices from shale gas proliferation and the timing of a recovery in natural gas prices, if any;
|
|
•
|
sufficiency of, access to and costs associated with coal, fuel oil and natural gas inventories and transportation thereof;
|
|
•
|
beliefs and assumptions about market competition, generation capacity and regional supply and demand characteristics of the wholesale power generation market, including the anticipation of higher market pricing over the longer term;
|
|
•
|
the effectiveness of our strategies to capture opportunities presented by changes in commodity prices and to manage our exposure to energy price volatility;
|
|
•
|
beliefs and assumptions about weather and general economic conditions;
|
|
•
|
projected operating or financial results, including anticipated cash flows from operations, revenues and profitability;
|
|
•
|
our focus on safety and our ability to efficiently operate our assets so as to capture revenue generating opportunities and operating margins;
|
|
•
|
beliefs about the costs and scope of the ongoing demolition and site remediation efforts at the South Bay and Vermilion facilities;
|
|
•
|
beliefs and assumptions regarding the outcome of the SCE contract terminations dispute and the impact of such terminations on the timing and amount of future cash flows;
|
|
•
|
ability to mitigate impacts associated with expiring RMR and/or capacity contracts;
|
|
•
|
beliefs about the outcome of legal, administrative, legislative and regulatory matters, including the impact of final rules regarding derivatives issued by the CFTC under the Dodd-Frank Act; and
|
22
|
•
|
expectations and estimates regarding capital and maintenance expenditures.
|
Any or all of our forward-looking statements may turn out to be wrong. They can be affected by inaccurate assumptions or by known or unknown risks, uncertainties and other factors, many of which are beyond our control, including those set forth below.
FACTORS THAT MAY AFFECT FUTURE RESULTS
Risks Related to the Operation of Our Business
Because wholesale power prices are subject to significant volatility and because many of our power generation facilities operate without long-term power sales agreements, our revenues and profitability are subject to wide fluctuations.
Because we largely sell electric energy, capacity and ancillary services into the wholesale energy spot market or into other power markets on a term basis, we are not guaranteed any rate of return on our capital investments. Rather, our financial condition, results of operations and cash flows will depend, in large part, upon prevailing market prices for power and the fuel to generate such power. Wholesale power markets are subject to significant price fluctuations over relatively short periods of time and can be unpredictable. Such factors that may materially impact the power markets and our financial results include:
|
•
|
economic conditions;
|
|
•
|
the existence and effectiveness of demand-side management;
|
|
•
|
conservation efforts and the extent to which they impact electricity demand;
|
|
•
|
addition of new supplies of power from existing competitors or new market entrants as a result of the development of new generation plants, expansion of existing plants or additional transmission capacity;
|
|
•
|
regulatory constraints on pricing (current or future) or the functioning of the energy trading markets and energy trading generally;
|
|
•
|
environmental regulations and legislation;
|
|
•
|
weather conditions;
|
|
•
|
basis risk from transmission losses and congestion;
|
|
•
|
the proliferation of advanced shale gas drilling increasing domestic natural gas supplies;
|
|
•
|
fuel price volatility; and
|
|
•
|
increased competition or price pressure driven by generation from renewable sources.
|
Many of our facilities operate as “merchant” facilities without long-term power sales agreements. Consequently, there can be no assurance that we will be able to sell any or all of the electric energy, capacity or ancillary services from those facilities at commercially attractive rates or that our facilities will be able to operate profitably. This could lead to less favorable financial results as well as future impairments of our property, plant and equipment or to the retirement of certain of our facilities resulting in economic losses and liabilities.
Given the volatility of commodity power prices, to the extent we do not secure long-term power sales agreements for the output of our power generation facilities, our revenues and profitability will be subject to increased volatility, and our financial condition, results of operations and cash flows could be materially adversely affected. Further, market prices of natural gas and wholesale electricity have reduced the outlook for cash flow that can be expected to be generated by us in the next several years.
Our commercial strategy may not be executed as planned or may result in lost opportunities.
We seek to commercialize our assets through sales arrangements of various types. In doing so, we attempt to balance a desire for greater predictability of earnings and cash flows in the short- and medium-terms with our expectation that commodity prices will rise over the longer term, creating upside opportunities for those with unhedged generation volumes. Our ability to successfully execute this strategy is dependent on a number of factors, many of which are outside our control, including market liquidity and design, commodity cycles, the availability of counterparties willing to transact with us or to transact with us at prices we think are commercially acceptable, the availability of liquidity to post collateral in support of our derivative instruments, and the reliability of the systems comprising our commercial operations function. The availability of market liquidity and willing counterparties could be negatively impacted by poor economic and financial market conditions, including impacts on financial institutions and other current and potential counterparties as well as counterparties’ views of our creditworthiness. If we are unable to transact in the short- and medium-terms, our financial condition, results of operations and cash flows will be subject to significant uncertainty and volatility. Alternatively, significant contract execution for any such period may precede a run-up in commodity prices, resulting in lost upside opportunities.
23
Our ability to manage our counterparty credit risk could adversely affect us.
Our supplier counterparties may experience deteriorating credit. These conditions could cause counterparties in the natural gas and power markets, particularly in the energy commodity derivative markets that we rely on for our hedging activities, to withdraw from participation in those markets. If multiple parties withdraw from those markets, market liquidity may be threatened, which in turn could adversely impact our business. Additionally, these conditions may cause our counterparties to seek bankruptcy protection under Chapter 11 or liquidation under Chapter 7 of the Bankruptcy Code. Our credit risk may be exacerbated to the extent collateral held by us cannot be realized or is liquidated at prices not sufficient to recover the full amount of the exposure due to us. There can be no assurance that any such losses or impairments to the carrying value of our financial assets would not materially and adversely affect our financial condition, results of operations and cash flows.
We are exposed to the risk of fuel and fuel transportation cost increases and interruptions in fuel supplies.
We purchase the fuel requirements for many of our power generation facilities, primarily those that are natural gas-fired, under short-term contracts or on the spot market. As a result, we face the risks of supply interruptions and fuel price volatility, as fuel deliveries may not exactly match those required for energy sales, due in part to our need to pre-purchase fuel inventories for reliability and dispatch requirements.
Moreover, profitable operation of many of our coal-fired generation facilities is highly dependent on coal prices and coal transportation rates. Power generators in the Midwest and the Northeast have experienced significant pressures on available coal supplies that are either transportation or supply related. We have entered into term contracts for PRB coal, which we use for our coal facilities in the Midwest. Our forecast coal requirements for 2013 are 93 percent contracted and priced. Our forecasted coal requirements for 2014 are 49 percent contracted and will be priced subject to a price collar structure. Our coal transportation requirements are 100 percent contracted and priced through 2013 when our current contracts expire. In August 2012, we executed new coal transportation contracts which take effect when our current contracts expire. These new long-term contracts also cover 100 percent of our coal transportation requirements. We continue to explore various alternative contractual commitments and financial options, as well as facility modifications, to ensure stable and competitive fuel supplies and to mitigate further supply risks for near- and long-term coal supplies.
Further, any changes in the costs of coal, fuel oil, natural gas or transportation rates and changes in the relationship between such costs and the market prices of power will affect our financial results. If we are unable to procure fuel for physical delivery at prices we consider favorable, our financial condition, results of operations and cash flows could be materially adversely affected.
The concentration of our business in Illinois may increase the effects of adverse trends in that market and any disruption of production at our Baldwin facility could have a material adverse effect on our financial condition, results of operations and cash flows.
A substantial portion of our business is located in Illinois. Natural disasters and changes in economic conditions in this market, including changing demographics, congestion, or oversupply of or reduced demand for power, could have a material adverse effect on our financial condition, results of operations and cash flows. Further, a substantial portion of our gross margin is derived from our Baldwin facility. Any disruption of production at that facility could have a material adverse effect on our financial condition, results of operations and cash flows.
Our costs of compliance with existing environmental requirements are significant, and costs of compliance with new environmental requirements or factors could materially adversely affect our financial condition, results of operations and cash flows.
Our business is subject to extensive and frequently changing environmental regulation by federal, state and local authorities. Such environmental regulation imposes, among other things, restrictions, liabilities and obligations in connection with the generation, handling, use, transportation, treatment, storage and disposal of hazardous substances and waste and in connection with spills, releases and emissions of various substances (including GHG) into the environment, and in connection with environmental impacts associated with cooling water intake structures. Existing environmental laws and regulations may be revised or reinterpreted, new laws and regulations may be adopted or may become applicable to us or our facilities, and litigation or enforcement proceedings could be commenced against us. Proposals being considered by federal and state authorities (including proposals regarding regulation of coal combustion byproducts, cooling water intake structures and GHGs) could, if and when adopted or enacted, require us to make substantial capital and operating expenditures or consider retiring certain of our facilities. If any of these events occur, our financial condition, results of operations and cash flows could be materially adversely affected.
24
Many environmental laws require approvals or permits from governmental authorities before construction, modification or operation of a power generation facility may commence. Certain environmental permits must be renewed periodically in order for us to continue operating our facilities. The process of obtaining and renewing necessary permits can be lengthy and complex and can sometimes result in the establishment of permit conditions that make the project or activity for which the permit was sought unprofitable or otherwise unattractive. Even where permits are not required, compliance with environmental laws and regulations can require significant capital and operating expenditures. We are required to comply with numerous environmental laws and regulations, and to obtain numerous governmental permits when we modify and operate our facilities. If there is a delay in obtaining any required environmental regulatory approvals or permits, if we fail to obtain any required approval or permit, or if we are unable to comply with the terms of such approvals or permits, the operation of our facilities may be interrupted or become subject to additional costs and/or legal challenges. Further, changed interpretations of existing regulations may subject historical maintenance, repair and replacement activities at our facilities to claims of noncompliance. As a result, our financial condition, results of operations and cash flows could be materially adversely affected. With the continuing trend toward stricter environmental standards and more extensive regulatory and permitting requirements, our capital and operating environmental expenditures are likely to be substantial and may significantly increase in the future.
Our business is subject to complex government regulation. Changes in these regulations or in their implementation may affect costs of operating our facilities or our ability to operate our facilities, or increase competition, any of which would negatively impact our results of operations.
We are subject to extensive federal, state and local laws and regulations governing the generation and sale of energy commodities in each of the jurisdictions in which we have operations. Compliance with these ever-changing laws and regulations requires expenses (including legal representation) and monitoring, capital and operating expenditures. Potential changes in laws and regulations that could have a material impact on our business include:
the introduction, or reintroduction, of rate caps or pricing constraints; increased credit standards, collateral costs or margin requirements, as well as reduced market liquidity, as a result of potential OTC market regulation; or a variation of these. Furthermore, these and other market-based rules and regulations are subject to change at any time, and we cannot predict what ch
anges may occur in the future or how such changes might affect any facet of our business.
The costs and burdens associated with complying with the increased number of regulations may have a material adverse effect on us if we fail to comply with the laws and regulations governing our business or if we fail to maintain or obtain advantageous regulatory authorizations and exemptions. Moreover, increased competition within the sector resulting from potential legislative changes, regulatory changes or other factors may create greater risks to the stability of our power generation earnings and cash flows generally.
The adoption and implementation of new statutory and regulatory requirements for derivative transactions could have an adverse impact on our ability to hedge risks associated with our business and increase the working capital requirements to conduct these activities.
As described above, the Dodd-Frank Act provides for new statutory and regulatory requirements for derivative transactions. Because we use derivative transactions as part of our hedging strategy for commercializing our generation assets, these new rules and regulations could increase the cost of derivative contracts or reduce the availability of derivatives. In addition, clearing organizations and banking institutions will be subject to new margining procedures, which could require the posting of additional collateral by parties entering into derivatives with clearing exchanges and banks, thereby impacting liquidity and reducing our cash available for capital expenditures or other corporate purposes. Because the majority of our derivative transactions used for hedging purposes are currently executed with clearing organizations or counterparties that already require the posting of margin based on initial and variation requirements, we believe that the cost and availability of future derivative contracts that we enter into should not be impacted substantially by these new requirements. However, the actual impact upon our businesses will depend on the final rules and regulations ultimately adopted by the CFTC, as implemented by the organizations with which we transact derivatives.
Availability and cost of emission allowances could materially impact our costs of operations.
We are required to maintain, either through allocation or purchase, sufficient emission allowances to support our operations in the ordinary course of operating our power generation facilities. These allowances are used to meet our obligations imposed by various applicable environmental laws, and the trend toward more stringent regulations (including regulations regarding GHG emissions) will likely require us to obtain new or additional emission allowances. If our operational needs require more than our allocated quantity of emission allowances, we may be forced to purchase such allowances on the open market, which could be costly. If we are unable to maintain sufficient emission allowances to match our operational needs, we may have to curtail our operations so as not to exceed our available emission allowances, or install costly new emissions controls. As we use the emissions allowances that we have purchased on the open market, costs
25
associated with such purchases will be recognized as an operating expense. If such allowances are available for purchase, but only at significantly higher prices, their purchase could materially increase our costs of operations in the affected markets and materially adversely affect our financial condition, results of operations and cash flows.
Competition in wholesale power markets, together with the age of certain of our generation facilities and an oversupply of power generation capacity in certain regional markets, may have a material adverse effect on our financial condition, results of operations and cash flows.
Our power generation business competes with other non-utility generators, regulated utilities, unregulated subsidiaries of regulated utilities, other energy service companies and financial institutions in the sale of electric energy, capacity and ancillary services, as well as in the procurement of fuel, transmission and transportation services. Moreover, aggregate demand for power may be met by generation capacity based on several competing technologies, as well as power generating facilities fueled by alternative or renewable energy sources, including hydroelectric power, synthetic fuels, solar, wind, wood, geothermal, waste heat and solid waste sources. Regulatory initiatives designed to enhance renewable generation could increase competition from these types of facilities. In addition, a buildup of new electric generation facilities in recent years has resulted in an oversupply of power generation capacity in certain regional markets we serve.
We also compete against other energy merchants on the basis of our relative operating skills, financial position and access to credit sources. Electric energy customers, wholesale energy suppliers and transporters often seek financial guarantees, credit support such as letters of credit, and other assurances that their energy contracts will be satisfied. Companies with which we compete may have greater resources in these areas. In addition, certain of our current facilities are relatively old. Newer plants owned by competitors will often be more efficient than some of our plants, which may put these plants at a competitive disadvantage. Over time, some of our plants may become unable to compete because of the construction of new plants, and such new plants could have a number of advantages including: more efficient equipment, newer technology that could result in fewer emissions, or more advantageous locations on the electric transmission system. Additionally, these competitors may be able to respond more quickly to new laws and regulations because of the newer technology utilized in their facilities or the additional resources derived from owning more efficient facilities. Taken as a whole, the potential disadvantages of our aging fleet could result in lower run-times or even early asset retirement.
Other factors may contribute to increased competition in wholesale power markets. New forms of capital and competitors have entered the industry in the last several years, including financial investors who perceive that asset values are at levels below their true replacement value. As a result, a number of generation facilities in the United States are now owned by lenders and investment companies. Furthermore, mergers and asset reallocations in the industry could create powerful new competitors. Under any scenario, we anticipate that we will face competition from numerous companies in the industry.
Moreover, many companies in the regulated utility industry, with which the wholesale power industry is closely linked, are also restructuring or reviewing their strategies. Several of those companies have discontinued or are discontinuing their unregulated activities and seeking to divest or spin-off their unregulated subsidiaries. Some of those companies have had, or are attempting to have, their regulated subsidiaries acquire assets out of their or other companies’ unregulated subsidiaries. This may lead to increased competition between the regulated utilities and the unregulated power producers within certain markets. To the extent that competition increases, our financial condition, results of operations and cash flows may be materially adversely affected.
We do not own or control transmission facilities required to sell the wholesale power from our generation facilities. If the transmission service is inadequate, our ability to sell and deliver wholesale power may be materially adversely affected. Furthermore, these transmission facilities are operated by RTOs and ISOs, which are subject to changes in structure and operation and impose various pricing limitations. These changes and pricing limitations may affect our ability to deliver power to the market that would, in turn, adversely affect the profitability of our generation facilities.
We do not own or control the transmission facilities required to sell the wholesale power from our generation facilities. If the transmission service from these facilities is unavailable or disrupted, or if the transmission capacity infrastructure is inadequate, our ability to sell and deliver wholesale power may be materially adversely affected. RTOs and ISOs provide transmission services, administer transparent and competitive power markets and maintain system reliability. Many of these RTOs and ISOs operate in the real-time and day-ahead markets in which we sell energy. The RTOs and ISOs that oversee most of the wholesale power markets impose, and in the future may continue to impose, offer caps and other mechanisms to guard against the potential exercise of market power in these markets as well as price limitations. These types of price limitations and other regulatory mechanisms may adversely affect the profitability of our generation facilities that sell energy and capacity into the wholesale power markets. Problems or delays that may arise in the formation and operation of maturing RTOs and similar market structures, or changes in geographic scope, rules or market operations of existing RTOs, may also affect our ability to sell, the prices we receive or the cost to transmit power produced by our generating facilities. Rules governing the various regional power markets may also change from time to time, which could affect our costs or
26
revenues. Additionally, if the transmission service from these facilities is unavailable or disrupted, or if the transmission capacity infrastructure is inadequate, our ability to sell and deliver wholesale power may be materially adversely affected. Furthermore, the rates for transmission capacity from these facilities are set by others and thus are subject to changes, some of which could be significant. As a result, our financial condition, results of operations and cash flows may be materially adversely affected.
Unauthorized hedging and related activities by our employees could result in significant losses.
We intend to continue our commercial strategy, which emphasizes forward power sales opportunities intended to reduce the market price exposure of the Company to power price declines. We have various internal policies and procedures designed to monitor hedging activities and positions. These policies and procedures are designed, in part, to prevent unauthorized purchases or sales of products by our employees. We cannot assure, however, that these steps will detect and prevent all violations of our risk management policies and procedures, particularly if deception or other intentional misconduct is involved. A significant policy violation that is not detected could result in a substantial financial loss for us.
Our financial condition, results of operations and cash flows would be adversely impacted by strikes or work stoppages by our unionized employees.
A majority of the employees at our facilities are subject to collective bargaining agreements with various unions. Additionally, unionization activities, including votes for union certification, could occur at our non-union generating facilities in our fleet. If union employees strike, participate in a work stoppage or slowdown or engage in other forms of labor strife or disruption, we could experience reduced power generation or outages if replacement labor is not procured. The ability to procure such replacement labor is uncertain. Strikes, work stoppages or an inability to negotiate future collective bargaining agreements on commercially reasonable terms could have a material adverse effect on our financial condition, results of operations and cash flows.
Risks Related to Our Financial Structure, Level of Indebtedness and Access to Capital Markets
Restrictive covenants may adversely affect operation
s.
The DPC and DMG Credit Agreements and DPC’s Revolving Credit Agreement contain various covenants that limit DMG’s or DPC’s ability to, among other things:
|
•
|
incur additional indebtedness;
|
|
•
|
pay dividends, repurchase or redeem stock or make investments in certain entities;
|
|
•
|
enter into related party transactions;
|
|
•
|
create certain liens;
|
|
•
|
enter into sale and leaseback transactions;
|
|
•
|
enter into any agreements which limit the ability of such subsidiaries to make dividends or otherwise transfer cash or assets to us or certain other subsidiaries;
|
|
•
|
create unrestricted subsidiaries;
|
|
•
|
impair the security interests;
|
|
•
|
issue certain capital stock;
|
|
•
|
consolidate, merge, sell or otherwise dispose of all or substantially all of its assets; and
|
|
•
|
sell and acquire assets.
|
In addition, DPC’s Revolving Credit Agreement contains certain financial covenants specifying minimum thresholds for DPC’s interest coverage ratios and maximum thresholds for DPC’s total leverage ratio. All of these restrictions may affect the ability of DMG, DPC, or us to operate our respective businesses, may limit our ability to take advantage of potential business opportunities as they arise and may adversely affect the conduct of our current businesses, including restricting our ability to finance future operations and capital needs and limiting our ability to engage in other business activities.
Our access to the capital markets may be limited.
Because of our non-investment grade credit rating, and/or general conditions in the financial and credit markets, our access to the capital markets may be limited. Moreover, the urgency of a capital-raising transaction may require us to pursue additional capital at an inopportune time. Our ability to obtain capital and the costs of such capital are dependent on numerous factors, including:
|
•
|
covenants in our existing credit agreements;
|
27
|
•
|
investor confidence in us and the regional wholesale power markets;
|
|
•
|
our financial performance and the financial performance of our subsidiaries;
|
|
•
|
our levels of debt;
|
|
•
|
our requirements for posting collateral under various commercial agreements;
|
|
•
|
our credit ratings;
|
|
•
|
our cash flow;
|
|
•
|
our long-term business prospects; and
|
|
•
|
general economic and capital market conditions, including the timing and magnitude of any market recovery.
|
We may not be successful in obtaining additional capital for these or other reasons. An inability to access capital may limit our ability to meet our operating needs and, as a result, may have a material adverse effect on our financial condition, results of operations and cash flows.
Our non-investment grade status may adversely impact our commercial operations, increase our liquidity requirements and increase the cost of refinancing opportunities. We may not have adequate liquidity to post required amounts of additional collateral.
Our corporate family credit rating is currently below investment grade and we cannot assure you that our credit ratings will improve, or that they will not decline, in the future. Our credit ratings may affect the evaluation of our creditworthiness by trading counterparties and lenders, which could put us at a disadvantage to competitors with higher or investment grade ratings.
In carrying out our commercial business strategy, our current non-investment grade credit ratings have resulted and will likely continue to result in requirements that we either prepay obligations or post significant amounts of collateral to support our business. Although the implementation of our commercial business strategy was modified in connection with our internal reorganization to leverage the benefits of the Credit Agreements at our separately financed, bankruptcy-remote portfolios, various commodity trading counterparties may nevertheless be unwilling to transact with us or may make collateral demands that reflect our non-investment grade credit ratings, the counterparties’ views of our creditworthiness, as well as changes in commodity prices. We use a portion of our capital resources, in the form of cash, short-term investments, lien capacity, and letters of credit, to satisfy these counterparty collateral demands. Our commodity agreements are tied to market pricing and may require us to post additional collateral under certain circumstances. If we are unable to reliably forecast or anticipate collateral calls or if market conditions change such that counterparties are entitled to additional collateral, our liquidity could be strained and may have a material adverse effect on our financial condition, results of operations and cash flows. Factors that could trigger increased demands for collateral include changes in our credit rating or liquidity and changes in commodity prices for power and fuel, among others. Additionally, our non-investment grade credit ratings may limit our ability to obtain additional sources of liquidity, refinance our debt obligations or access the capital markets at the lower borrowing costs that would presumably be available to competitors with higher or investment grade ratings. Should our ratings continue at their current levels, or should our ratings be further downgraded, we would expect these negative effects to continue and, in the case of a downgrade, become more pronounced.
Risks Related to Emergence from Bankruptcy and Investing
Information contained in our historical financial statements prior to the Plan Effective Date is not comparable to the information contained in our financial statements following the Plan Effective Date due to the application of fresh-start accounting.
Following the consummation of the Plan, our financial condition and results of operations from and after the Plan Effective Date will not be comparable to the financial condition or results of operations reflected in our historical financial statements due to the application of fresh-start accounting. Fresh-start accounting requires us to adjust our assets and liabilities to their estimated fair values using the acquisition method. Adjustments to the carrying amounts were material and will affect prospective results of operations as balance sheet items are settled, depreciated, amortized or impaired. As a result, this will make it difficult to assess our performance in relation to prior periods.
Our actual financial results and our projected earnings estimates may vary significantly from the projections filed with the Bankruptcy Court, and investors should not rely on such previous bankruptcy projections.
In connection with the Plan, we were required to file with the Bankruptcy Court projected financial information to demonstrate to the Bankruptcy Court the feasibility of the Plan and our ability to continue operations upon emergence from bankruptcy (the “Projections”). The Projections reflect numerous assumptions concerning anticipated future performance and prevailing and anticipated market and economic conditions that were and continue to be beyond our control and that may not materialize. Projections are inherently subject to uncertainties and to a wide variety of significant business, economic and
28
competitive risks. Our actual results and our projected earnings estimates will vary from those contemplated by the Projections for a variety of reasons, including, but not limited to, our application of fresh-start accounting. Further, the Projections were limited by the information available to us as of the date of the preparation of the Projections. Therefore, variations in our results and projected earnings estimates from the Projections may be material, and investors should not rely on such Projections.
Limitations currently apply to our use of certain tax attributes and further limitations could apply as a result of future direct or indirect sales of our common stock by the selling stockholders or other large stockholders; Certain tax attributes will be eliminated at the end of the taxable year.
The use of our net operating losses (“NOLs”) and alternative minimum tax (“AMT”) credits has been limited by two “ownership changes” under Section 382 of the Internal Revenue Code (the “Code”); the first occurring in the second quarter 2012 (the “Initial Ownership Change”) and the second on the Plan Effective Date (“Emergence Ownership Change”). The limitation resulting from the Initial Ownership Change applies to all NOLs and AMT credits existing at the time of the Initial Ownership Change. The limitation resulting from the Emergence Ownership Change will impact the timing of the utilization of the NOLs generated after the Initial Ownership Change. Although the limitation applies to all NOLs and AMT credits at the time of the Emergence Ownership Change, the NOLs and AMT credits existing at the time of the Initial Ownership Change already were subject to greater limitations imposed by the Initial Ownership Change. NOLs and AMT credits generated after the Plan Effective Date are not subject to the limitations from either of the prior ownership changes. If, however, there is another “ownership change,” (the “Post-Emergence Ownership Change”) the utilization of all NOLs and AMT credits existing at the time of the Post-Emergence Ownership Change would be subject to an additional annual limitation based upon a formula provided under Section 382 of the Code that is based on the fair market value of the Company and prevailing interest rates at the time of the Post-Emergence Ownership Change. An “ownership change” generally is a 50% increase in ownership over a three-year period by stockholders who directly or indirectly own at least 5 percent of the Company’s stock. Thus, if the selling stockholder sells or otherwise disposes of a significant amount of its stock, such sales, along with various other dispositions or sales of our common stock by other stockholders or by us (and other indirect transfers of our common stock resulting from changes in ownership of our stockholders) could trigger a Post-Emergence Ownership Change.
I
n addition, as a result of the cancellation of indebtedness income of approximately $1.9 billion recognized for tax purposes related to our emergence from Chapter 11, we and our subsidiaries will be required to reduce the amount of our NOLs at the end of our taxable year. All NOLs and AMT credits are available to be reduced, regardless of whether the NOLs and AMT credits are subject to limitations from the ownership changes. All of these reductions in, and limitation on the use of NOLs and AMT credits could affect our ability to offset future taxable income.
We may pursue acquisitions or combinations that could be unsuccessful or present unanticipated problems for our business in the future, which would adversely affect our ability to realize the anticipated benefits of those transactions.
We may enter into transactions that may include acquiring or combining with other busine
sses, such as the power generation facilities acquisitions we propose to make with Ameren Corporation. We may not be a
ble to identify suitable acquisition or combination opportunities or finance and complete any particular acquisition or combination successfully. Furthermore, acquisitions and combinations involve a number of risks and challenges, including:
|
•
|
the ability to obtain required regulatory and other approvals;
|
|
•
|
the need to integrate acquired or combined operations with our operations;
|
|
•
|
potential loss of key employees;
|
|
•
|
difficulty in evaluating the power assets, operating costs, infrastructure requirements, environmental and other liabilities and other factors beyond our control;
|
|
•
|
potential lack of operating experience in new geographic/power markets or with different fuel sources;
|
|
•
|
an increase in our expenses and working capital requirements;
|
|
•
|
management’s attention may be temporarily diverted; and
|
|
•
|
the possibility that we may be required to issue a substantial amount of additional equity and/or debt securities or assume additional debt in connection with any such transactions.
|
Any of these factors could adversely affect our ability to achieve anticipated levels of cash flows or realize synergies or other anticipated benefits from a strategic transaction. Furthermore, the market for transactions is highly competitive, which may adversely affect our ability to find transactions that fit our strategic objectives or increase the price we would be required to pay (which could decrease the benefit of the transaction or hinder our desire or ability to consummate the transaction). Consistent with industry practice, we routinely engage in discussions with industry participants regarding potential transactions, large and small. We intend to continue to engage in strategic discussions and will need to respond to potential
29
opportunities quickly and decisively. As a result, strategic transactions may occur at any time and may be significant in size relative to our assets and operations.
Item 1B.
Unresolved Staff Comments
Not applicable.
Item 2.
Properties
We have included descriptions of the location and general character of our principal physical operating properties by segment in “Item 1. Business,” which is incorporated herein by reference. Substantially all of the assets of the Coal segment, including the power generation facilities owned by DMG, are pledged as collateral to secure the repayment of, and our other obligations under, the DMG Credit Agreement. Substantially all of the assets of the Gas segment, including the power generation facilities owned by DPC, one of our indirect wholly-owned subsidiaries, are pledged as collateral to secure the repayment of, and other obligations under, the DPC Credit Agreement. Please read
Note 18—Debt
for further discussion.
Our principal executive office located in Houston, Texas, is held under a lease that expires in 2022. We also lease additional offices in Illinois.
Item 3.
Legal Proceedings
Please read
Note 22—Commitments and Contingencies
—Legal Proceedings for a description of our material legal proceedings, which is incorporated herein by reference.
Item 4.
Mine Safety Disclosures
Not applicable.
On the Plan Effective Date, all shares of our old common stock were canceled and 100 million shares of new common stock of Dynegy were distributed to the holders of certain classes of claims. Our authorized capital stock consists of 420 million shares of common stock and 20 million shares of preferred stock. Further, on the Plan Effective Date, a total of approximately 6.1 million shares of our new common stock were available for issuance under our 2012 Long Term Incentive Plan. The former holders of our old common stock, as the beneficiaries of Legacy Dynegy’s administrative claim against DH under the Plan, also received distributions of our new common stock and five-year warrants to purchase shares of our new common stock (the “Warrants”), The Warrants entitle the holders to purchase up to 15.6 million shares of our new common stock. The maximum number of shares of our new common stock issuable pursuant to each Warrant is one. The exercise price of each Warrant to receive one share of our new common stock was set at $40 per share.
Our new common stock is listed on the NYSE under the symbol “DYN” and has been trading since October 3, 2012. No prior established public trading market existed for our new common stock prior to this date. The number of stockholders of record of our common stock as of
March 8, 2013
, based on information provided by our transfer agent, was
2,819
. The following table sets forth the per share high and low closing prices for our common stock as reported on the NYSE for the periods presented:
|
High
|
Low
|
|||||||
|
2013:
|
||||||||
|
First Quarter (through March 8, 2013)
|
$
|
20.43
|
|
$
|
19.39
|
|
||
|
2012:
|
||||||||
|
Fourth Quarter
|
$
|
19.35
|
|
$
|
17.35
|
|
||
We have paid no cash dividends on our common stock and have no current intention of doing so. Any future determinations to pay cash dividends will be at the discretion of our Board of Directors, subject to applicable limitations under Delaware law, and will be dependent upon our results of operations, financial condition, contractual restrictions and other factors deemed relevant by our Board of Directors.
Registration Rights Agreement
. As part of the Plan, we entered into a registration rights agreement (the “Registration Rights Agreement”) with Franklin Advisers, Inc. (“FAV”), which owns approximately 32 percent of our outstanding common stock. Pursuant to the Registration Rights Agreement, among other things, we were required to use reasonable best efforts to
30
file within 90 days after the Plan Effective Date a registration statement on any permitted form that qualifies (the “Shelf”), and is available, for the resale of “Registrable Securities”, as defined below, with the SEC. Such Shelf was filed on December 10, 2012, as amended on January 18, 2013, February 5, 2013 and February 12, 2013, and became effective on February 13, 2013. Registrable Securities are shares of our common stock, par value $0.01 per share issued or issuable on or after the Plan Effective Date to any of the original parties to the Registration Rights Agreement, including, without limitation, upon the conversion of our outstanding Warrants, and any securities paid, issued or distributed in respect of any such new common stock, but excluding shares of common stock acquired in the open market after the Plan Effective Date.
At any time prior to the five year anniversary of the Plan Effective Date and from time to time after the later of (i) when the Shelf has been declared effective by the SEC and (ii) 210 days after the Plan Effective Date, any one or more holders of Registrable Securities may request to sell all or any portion of their Registrable Securities in an underwritten offering, provided that such holder or holders will be entitled to make such demand only if the total offering price of the Registrable Securities to be sold in such offering is reasonably expected to exceed 5% of the market value of our then issued and outstanding common stock or the total offering price is reasonably expected to exceed $250 million. We are not obligated to effect more than two such underwritten offerings during any period of twelve consecutive months after the Plan Effective Date and are not obligated to effect such an underwritten offering within 120 days after the pricing of a previous underwritten offering. In addition, holders of Registrable Securities may request to sell all or any portion of their Registrable Securities in a non-underwritten offering by providing notice to us no later than two business days (or in certain circumstances five business days) prior to the expected date of such an offering, subject to certain exceptions provided for in the Registration Rights Agreement.
When we propose to offer shares in an underwritten offering whether for our own account or the account of others, holders of Registrable Securities will be entitled to request that their Registrable Securities be included in such offering, subject to specific exceptions.
Upon Dynegy becoming a well-known seasoned issuer, we are required to promptly register the sale of all of the Registrable Securities under an automatic shelf registration statement, and to cause such registration statement to remain effective thereafter until there are no longer Registrable Securities.
The registration rights granted in the Registration Rights Agreement are subject to customary indemnification and contribution provisions, as well as customary restrictions such as minimums, blackout periods and, if a registration is for an underwritten offering, limitations on the number of shares to be included in the underwritten offering may be imposed by the managing underwriter. Registrable Securities shall cease to constitute Registrable Securities upon the earliest to occur of: (i) the date on which such securities are disposed of pursuant to an effective registration statement under the Securities Act; (ii) the date on which such securities are disposed of pursuant to Rule 144 (or any successor provision) promulgated under the Securities Act; (iii) with respect to the Registrable Securities held by any Holder (as defined in the Registration Rights Agreement), any time that such Holder Beneficially Owns (as defined in Rule 13d-3 under the Exchange Act) Registrable Securities representing less than 1% of the then outstanding new common stock and is permitted to sell such Registrable Securities under Rule 144(b)(1); and (iv) the date on which such securities cease to be outstanding.
Stockholder Return Performance Presentation.
The following graph compares the cumulative total stockholder return from October 3, 2012, the date our common stock began trading following the Plan Effective Date, through December 31, 2012, for our current existing common stock, the S&P Midcap 400 index and a customized peer group. Because the value of Legacy Dynegy’s old common stock bears no relation to the value of our existing common stock, the graph below reflects only our current existing common stock. The peer group consists of Calpine Corp., NRG Energy Inc. and GenOn Energy. In December 2012, GenOn Energy and NRG Energy Inc. merged. The graph tracks the performance of a $100 investment in our current existing common stock, in the peer group, and the index (with the reinvestment of all dividends) from October 3, 2012 through December 31, 2012.
31
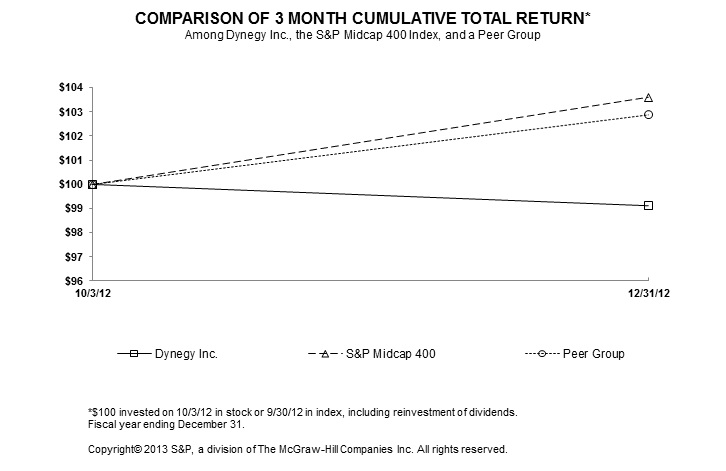
|
|
|
October 3, 2012
|
|
December 31, 2012
|
||||
|
Dynegy Inc.
|
$
|
100.00
|
|
$
|
99.12
|
|
||
|
S&P Midcap 400
|
$
|
100.00
|
|
$
|
103.61
|
|
||
|
Peer Group
|
$
|
100.00
|
|
$
|
102.88
|
|
||
The stock price performance included in this graph is not necessarily indicative of future stock price performance. The above stock price performance comparison and related discussion is not deemed to be incorporated by reference by any general statement incorporating by reference this Form 10-K into any filing under the Securities Act of 1933, as amended (the “Securities Act”) or under the Securities Exchange Act of 1934, as amended (the “Exchange Act”) or otherwise, except to the extent that we specifically incorporate this stock price performance comparison and related discussion by reference, and is not otherwise deemed “filed” under the Securities Act or Exchange Act.
Unregistered Sales of Equity Securities and Use of Proceeds.
When restricted stock awarded by Dynegy becomes taxable compensation to employees, shares may be withheld to cover the employees’ withholding taxes. We did not have any purchases of equity securities by means of such share withholdings during the quarter ended December 31, 2012. We do not have a stock repurchase program.
Securities Authorized for Issuance Under Equity Compensation Plans.
Please read Item 12. Security Ownership of Certain Beneficial Owners and Management and Related Stockholder Matters for information regarding securities authorized for issuance under our equity compensation plans.
32
Item 6.
Selected Financial Data
The selected financial information presented below for the period from October 2 through December 31, 2012, the period from January 1 through October 1, 2012 and the years ended December 31, 2011 and 2010 was derived from, and is qualified by, reference to our Consolidated Financial Statements, including the notes thereto, contained elsewhere herein. The selected financial information should be read in conjunction with the Consolidated Financial Statements and related notes and “Item 7. Management’s Discussion and Analysis of Financial Condition and Results of Operations.” As described in
Note 1—Organization and Operations
, Legacy Dynegy merged with DH on September 30, 2012. The accounting treatment of the Merger is reflected as a recapitalization of DH and, similar to a reverse merger, DH is the surviving accounting entity for financial reporting purposes. Therefore, our historical results for periods prior to the Merger are the same as DH’s historical results.
As a result of the application of fresh-start accounting as of the Plan Effective Date, the financial statements on or prior to October 1, 2012 are not comparable with the financial statements after October 1, 2012. References to “Successor” refer to the Company after October 1, 2012, after giving effect to the application of fresh-start accounting. References to “Predecessor” refer to the Company on or prior to October 1, 2012. Additionally, on the Plan Effective Date, the DNE Debtor Entities did not emerge from bankruptcy; therefore, we deconsolidated our investment in these entities as of October 1, 2012. Accordingly, the results of operations of the DNE Debtor Entities are presented in discontinued operations for all periods presented.
|
Successor
|
Predecessor
|
||||||||||||||||||||||||
|
|
October 2 Through December 31, 2012
|
January 1 Through October 1, 2012 (1)
|
Year Ended December 31,
|
||||||||||||||||||||||
|
(in millions, except per share data)
|
2011(2)
|
2010
|
2009
|
2008
|
|||||||||||||||||||||
|
Statement of Operations Data:
|
|
|
|
|
|
||||||||||||||||||||
|
Revenues
|
$
|
312
|
|
$
|
981
|
|
$
|
1,333
|
|
$
|
2,059
|
|
$
|
2,195
|
|
$
|
3,016
|
|
|||||||
|
Depreciation and amortization expense
|
(45
|
)
|
(110
|
)
|
(295
|
)
|
(397
|
)
|
(327
|
)
|
(332
|
)
|
|||||||||||||
|
Goodwill impairment
|
—
|
|
—
|
|
—
|
|
—
|
|
(433
|
)
|
—
|
|
|||||||||||||
|
Impairment and other charges, exclusive of goodwill impairment shown separately above
|
—
|
|
—
|
|
(5
|
)
|
(146
|
)
|
(326
|
)
|
—
|
|
|||||||||||||
|
General and administrative expense
|
(22
|
)
|
(56
|
)
|
(102
|
)
|
(158
|
)
|
(159
|
)
|
(157
|
)
|
|||||||||||||
|
Operating income (loss)
|
(104
|
)
|
5
|
|
(189
|
)
|
(32
|
)
|
(632
|
)
|
717
|
|
|||||||||||||
|
Bankruptcy reorganization items, net
|
(3
|
)
|
1,037
|
|
(52
|
)
|
—
|
|
—
|
|
—
|
|
|||||||||||||
|
Interest expense and debt extinguishment costs (3)
|
(16
|
)
|
(120
|
)
|
(369
|
)
|
(363
|
)
|
(461
|
)
|
(427
|
)
|
|||||||||||||
|
Income tax (expense) benefit
|
—
|
|
9
|
|
144
|
|
194
|
|
235
|
|
(124
|
)
|
|||||||||||||
|
Income (loss) from continuing operations
|
(113
|
)
|
130
|
|
(431
|
)
|
(259
|
)
|
(920
|
)
|
203
|
|
|||||||||||||
|
Income (loss) from discontinued operations, net of taxes (4)
|
6
|
|
(162
|
)
|
(509
|
)
|
17
|
|
(348
|
)
|
2
|
|
|||||||||||||
|
Net income (loss)
|
$
|
(107
|
)
|
$
|
(32
|
)
|
$
|
(940
|
)
|
$
|
(242
|
)
|
$
|
(1,268
|
)
|
$
|
205
|
|
|||||||
|
Net income (loss) attributable to Dynegy
|
$
|
(107
|
)
|
$
|
(32
|
)
|
$
|
(940
|
)
|
$
|
(242
|
)
|
$
|
(1,253
|
)
|
$
|
208
|
|
|||||||
|
Basic loss per share from continuing operations (5)
|
$
|
(1.13
|
)
|
N/A
|
|
N/A
|
|
N/A
|
|
N/A
|
|
N/A
|
|
||||||||||||
|
Basic income per share from discontinued operations (5)
|
$
|
0.06
|
|
N/A
|
|
N/A
|
|
N/A
|
|
N/A
|
|
N/A
|
|
||||||||||||
|
Basic loss per share (5)
|
$
|
(1.07
|
)
|
N/A
|
|
N/A
|
|
N/A
|
|
N/A
|
|
N/A
|
|
||||||||||||
|
Cash Flow Data:
|
|
|
|
|
|
||||||||||||||||||||
|
Net cash provided by (used in) operating activities
|
$
|
(44
|
)
|
$
|
(37
|
)
|
$
|
(1
|
)
|
$
|
423
|
|
$
|
152
|
|
$
|
319
|
|
|||||||
|
Net cash provided by (used in) investing activities
|
265
|
|
278
|
|
(229
|
)
|
(520
|
)
|
790
|
|
(87
|
)
|
|||||||||||||
|
Net cash provided by (used in) financing activities
|
(328
|
)
|
(184
|
)
|
375
|
|
(69
|
)
|
(1,193
|
)
|
146
|
|
|||||||||||||
|
Capital expenditures, acquisitions and investments
|
(46
|
)
|
193
|
|
(21
|
)
|
(517
|
)
|
(596
|
)
|
(626
|
)
|
|||||||||||||
33
|
|
Successor
|
Predecessor
|
|||||||||||||||||||
|
December 31, 2012
|
December 31,
|
||||||||||||||||||||
|
(amounts in millions)
|
2011 (2)
|
2010
|
2009
|
2008
|
|||||||||||||||||
|
Balance Sheet Data:
|
|
|
|
|
|||||||||||||||||
|
Current assets
|
$
|
1,043
|
|
$
|
3,569
|
|
$
|
2,180
|
|
$
|
1,988
|
|
$
|
2,780
|
|
||||||
|
Current liabilities
|
347
|
|
3,051
|
|
1,562
|
|
1,848
|
|
1,681
|
|
|||||||||||
|
Property, plant and equipment, net
|
3,022
|
|
2,821
|
|
6,273
|
|
7,117
|
|
8,934
|
|
|||||||||||
|
Total assets
|
4,535
|
|
8,311
|
|
9,949
|
|
10,903
|
|
14,174
|
|
|||||||||||
|
Notes payable and current portion of long-term debt
|
29
|
|
7
|
|
148
|
|
807
|
|
64
|
|
|||||||||||
|
Long-term debt (excluding current portion) (6)
|
1,386
|
|
1,069
|
|
4,626
|
|
4,775
|
|
6,072
|
|
|||||||||||
|
Capital leases not already included in long-term debt
|
—
|
|
—
|
|
—
|
|
4
|
|
4
|
|
|||||||||||
|
Total stockholders’/member’s equity
|
2,503
|
|
32
|
|
2,719
|
|
3,003
|
|
4,583
|
|
|||||||||||
__________________________________________
|
(1)
|
We completed the DMG Acquisition effective June 5, 2012; therefore, the results of our Coal segment are only included subsequent to June 5, 2012. Please read
Note 4—Merger and Acquisition
for further discussion.
|
|
(2)
|
We completed the DMG Transfer effective September 1, 2011; therefore, the results of our Coal segment are only included prior to September 1, 2011. Please read
Note 6—Dispositions and Discontinued Operations
for further discussion.
|
|
(3)
|
Includes $21 million and $46 million of debt extinguishment costs for the year ended December 31, 2011 and 2009, respectively.
|
|
(4)
|
Discontinued operations include the results of operations from the following businesses:
|
|
•
|
The DNE Debtor Entities (please read
Note 6—Dispositions and Discontinued Operations
for further discussion of the sale of the DNE facilities);
|
|
•
|
The Arlington Valley and Griffith power generation facilities (collectively, the “Arizona power generation facilities”) (sold fourth quarter 2009);
|
|
•
|
Bluegrass power generating facility (sold fourth quarter 2009);
|
|
•
|
Heard County power generating facility (sold second quarter 2009);
|
|
•
|
Calcasieu power generating facility (sold first quarter 2008); and
|
|
•
|
DMSLP, our former midstream business (sold fourth quarter 2005).
|
|
(5)
|
Although Legacy Dynegy's shares were publicly traded, DH did not have any publicly traded shares prior to the merger; therefore, no earnings (loss) per share is presented for the Predecessor.
|
|
(6)
|
As a result of the DH Chapter 11 Cases, we reclassified approximately $3.6 billion in long-term debt to LSTC as of December 31, 2011. These liabilities were settled upon our emergence from bankruptcy on the Plan Effective Date. Please read
Note 3—Emergence from Bankruptcy and Fresh-Start Accounting
and
Note 17—Liabilities Subject to Compromise
for further discussion.
|
34
Item 7.
Management’s Discussion and Analysis of Financial Condition and Results of Operations
The following discussion should be read together with the consolidated financial statements and the notes thereto included in this report.
OVERVIEW
We are a holding company and conduct substantially all of our business operations through our subsidiaries. Our current business operations are focused primarily on the power generation sector of the energy industry. We report the results of our power generation business as two separate segments in our consolidated financial statements: (i) Coal and (ii) Gas. In connection with our emergence from bankruptcy on the Plan Effective Date, we deconsolidated the DNE Debtor Entities, which constituted our previously reported DNE segment, and began accounting for our investment in the DNE Debtor Entities using the cost method. Accordingly, we have reclassified the results of the previously reported DNE segment as discontinued operations in the consolidated financial statements for all periods presented.
Merger.
On September 30, 2012, pursuant to the terms of the Plan, DH merged with and into Legacy Dynegy with Legacy Dynegy continuing as the surviving legal entity in the Merger. Immediately prior to the Merger, Legacy Dynegy had no substantive operations, and our Coal, Gas and DNE operations were primarily conducted through subsidiaries of DH. Further, as a result of the DH Chapter 11 Cases (as defined below) in 2011, under applicable accounting standards, Dynegy was no longer deemed to have a controlling financial interest in DH and its wholly-owned subsidiaries; therefore, DH and its consolidated subsidiaries were no longer consolidated in Dynegy’s consolidated financial statements as of November 7, 2011. As a result of these factors, the Merger was accounted for in a manner similar to a reverse merger, whereby DH was the surviving accounting entity for financial reporting purposes. Further, the net assets contributed by Legacy Dynegy, which amounted to
$32 million
, did not constitute a business and were therefore treated in a manner similar to a recapitalization and were credited to stockholder’s equity.
DMG Transfer/Acquisition.
On September 1, 2011, we completed the DMG Transfer; therefore, the results of our Coal segment are only included in our 2011 consolidated results for the period from January 1, 2011 through August 31, 2011. Additionally, on June 5, 2012, we reacquired the Coal segment through the DMG Acquisition; therefore, the results of our Coal segment are only included in our 2012 consolidated results for the period from June 6, 2012 through December 31, 2012.
Chapter 11 Cases.
On November 7, 2011, DH and the DNE Debtor Entities filed voluntary petitions (the “DH Chapter 11 Cases”) for relief under Chapter 11 of Title 11 of the United States Code (the “Bankruptcy Code”) in the United States Bankruptcy Court for the Southern District of New York, Poughkeepsie Division (the “Bankruptcy Court”). On July 6, 2012, Legacy Dynegy filed a voluntary petition for relief under Chapter 11 of the Bankruptcy Code in the Bankruptcy Court (the “Dynegy Chapter 11 Case,” and together with the DH Chapter 11 Cases, the “Chapter 11 Cases”). On July 12, 2012, Legacy Dynegy and DH, as co-plan proponents, filed the Plan for Legacy Dynegy and DH and the related disclosure statement with the Bankruptcy Court. On September 10, 2012, the Bankruptcy Court entered an order confirming the Plan. As discussed above, on September 30, 2012, pursuant to the terms of the Plan, DH and Legacy Dynegy consummated the Merger, with Dynegy continuing as the surviving legal entity. On the Plan Effective Date, we consummated our reorganization under Chapter 11 pursuant to the Plan and Dynegy exited bankruptcy. At such time, Dynegy’s newly issued common stock and Warrants were listed on the NYSE and director nominees selected by certain creditor parties, as determined by the Plan and confirmed by the Bankruptcy Court, were appointed as the new Board of Directors.
For financial reporting purposes, close of business on October 1, 2012, represents the date of our emergence from bankruptcy. As used herein, the following terms refer to the Company and its operations:
|
“Predecessor”
|
The Company, pre-emergence from bankruptcy
|
|
|
“2012 Predecessor Period”
|
The Company’s operations, January 1, 2012 — October 1, 2012
|
|
|
“Successor”
|
The Company, post-emergence from bankruptcy
|
|
|
“Successor Period”
|
The Company’s operations, October 2, 2012 — December 31, 2012
|
|
The DNE Debtor Entities remain in Chapter 11 bankruptcy and continue to operate their businesses as “debtors-in-possession.” The bankruptcy court has approved the Facilities Sale Transactions for a combined cash purchase price of $23 million and the assumption of certain liabilities. The Facilities Sale Transactions are expected to close upon the satisfaction of certain closing conditions and the receipt of any necessary regulatory approvals. Please read
Note 3—Emergence from Bankruptcy and Fresh-Start Accounting
and
Note 6—Dispositions and Discontinued Operations
for further discussion.
35
Business Discussion
The following is a brief discussion of each of our segments, including a list of key factors that have affected, and are expected to continue to affect, their respective earnings and cash flows. We also present a brief discussion of our corporate-level expenses.
Power Generation Business
We generate earnings and cash flows in the two segments within our power generation business through sales of electric energy, capacity and ancillary services. Primary factors affecting our earnings and cash flows in the power generation business include:
|
•
|
Prices for power, natural gas, coal and fuel oil, which in turn are largely driven by supply and demand. Demand for power can vary due to weather and general economic conditions, among other things. Power supplies similarly vary by region and are impacted significantly by available generating capacity, transmission capacity and federal and state regulation. The proliferation of advanced shale gas drilling has increased domestic natural gas supplies which has caused a decline in power prices;
|
|
•
|
The relationship between electricity prices and prices for natural gas and coal, commonly referred to as the “spark spread” and “dark spread,” respectively, which impacts the margin we earn on the electricity we generate; and
|
|
•
|
Our ability to enter into commercial transactions to mitigate short- and medium- term earnings volatility and our ability to manage our liquidity requirements resulting from potential changes in collateral requirements as prices move.
|
Other factors that have affected, and are expected to continue to affect, earnings and cash flows for this business include:
|
•
|
Transmission constraints, congestion, and other factors that can affect the price differential between the locations where we deliver generated power and the liquid market hub;
|
|
•
|
Our ability to control capital expenditures, which primarily include maintenance, safety, environmental and reliability projects, and to control operating expenses through disciplined management;
|
|
•
|
Our ability to optimize our assets by maintaining a high in-market availability, reliable run-time and safe, low-cost operations;
|
|
•
|
Our ability to operate and market production from our facilities during periods of planned/unplanned electric transmission outages;
|
|
•
|
Our ability to post the collateral necessary to execute our commercial strategy;
|
|
•
|
The cost of compliance with existing and future environmental requirements that are likely to be more stringent and more comprehensive (please read Item 1. Business—Environmental Matters for further discussion);
|
|
•
|
Market supply conditions resulting from federal and regional renewable power mandates and initiatives;
|
|
•
|
Our ability to maintain sufficient coal inventories, which is dependent upon the continued performance of the mines and railroads for deliveries of coal in a consistent and timely manner, and its impact on our ability to serve the critical winter and summer on-peak loads;
|
|
•
|
Costs of transportation related to coal deliveries;
|
|
•
|
Regional renewable energy mandates and initiatives that may alter supply conditions within the ISO and our generating units’ positions in the aggregate supply stack;
|
|
•
|
Changes in MISO market design or associated rules;
|
|
•
|
Changes in the existing bilateral MISO capacity markets and any resulting effect on future capacity revenues;
|
|
•
|
Our ability to maintain and operate our plants in a manner that ensures we receive full capacity payments under our various tolling agreements;
|
|
•
|
Our ability to mitigate impacts associated with expiring RMR and/or capacity contracts;
|
|
•
|
Our ability to maintain the necessary permits to continue to operate our Moss Landing and Morro Bay facilities with once-through, seawater cooling systems;
|
|
•
|
The costs incurred to demolish and/or remediate the South Bay and Vermilion facilities;
|
|
•
|
Changes in the existing bilateral CAISO resource adequacy markets and any resulting effect on future capacity revenues;
|
|
•
|
Access to capital markets on reasonable terms, interest rates and other costs of liquidity;
|
|
•
|
Interest expense; and
|
36
|
•
|
Income taxes, which will be impacted by our ability to realize value from our NOLs and AMT credits.
|
Please read “Item 1A. Risk Factors” for additional factors that could affect our future operating results, financial condition and cash flows.
LIQUIDITY AND CAPITAL RESOURCES
Overview
In this section, we describe our liquidity and capital requirements including our sources and uses of liquidity and capital resources. Our liquidity and capital requirements are primarily a function of our debt maturities and debt service requirements, fixed capacity payments, contractual obligations, capital expenditures (including required environmental expenditures) and working capital needs. Examples of working capital needs include purchases and sales of commodities and associated margin and collateral requirements, facility maintenance costs and other costs such as payroll.
Certain of our entities in the Coal and Gas segments are “bankruptcy remote.” These bankruptcy remote entities have an independent manager whose consent is required for certain corporate actions and such entities are required to present themselves to the public as separate entities. They maintain separate books, records and bank accounts and separately appoint officers. Furthermore, they pay liabilities from their own funds, they conduct business in their own names, they observe a higher level of formalities, and they have restrictions on pledging their assets for the benefit of certain other persons. In addition, some companies within our portfolio were reorganized into “ring-fenced” groups. The upper-level companies in such ring-fenced groups are bankruptcy-remote entities governed by limited liability company operating agreements which, in addition to the bankruptcy remoteness provisions described above, contain certain additional restrictions prohibiting any material transactions with affiliates other than the direct and indirect subsidiaries within the ring-fenced group without independent manager approval. These provisions restrict our ability to move cash out of these portfolios without meeting certain requirements as set forth in the DPC and DMG Credit Agreements (as defined below). Please read
Note 18—Debt
for further discussion.
Our primary sources of liquidity are cash flows from operations and cash on hand. Cash on hand includes cash at DPC and DMG, which is limited in use and distribution in accordance with the terms of their respective credit agreements. Additionally, on January 16, 2013, DPC entered into a revolving credit agreement (the “DPC Revolving Credit Agreement”) with commitments of
$150 million
for the ongoing working capital requirements and general corporate purposes of our Gas segment. Please read
Note 27—Subsequent Events
for further discussion.
Other sources of liquidity include proceeds from capital market transactions to the extent we engage in such transactions.
Current Liquidity.
The following tables summarize our liquidity position at
March 8, 2013
and
December 31, 2012
.
|
Successor
|
||||||||||||||||
|
|
March 8, 2013
|
|||||||||||||||
|
(amounts in millions)
|
DPC
|
DMG
|
Other (1)
|
Total
|
||||||||||||
|
LC capacity, inclusive of required reserves (2)
|
$
|
210
|
|
$
|
11
|
|
$
|
28
|
|
$
|
249
|
|
||||
|
Less: Required reserves (2)
|
(6
|
)
|
—
|
|
(1
|
)
|
(7
|
)
|
||||||||
|
Less: Outstanding letters of credit
|
(201
|
)
|
(11
|
)
|
(27
|
)
|
(239
|
)
|
||||||||
|
LC availability
|
3
|
|
—
|
|
—
|
|
3
|
|
||||||||
|
DPC Revolving Credit Agreement availability
|
150
|
|
—
|
|
—
|
|
150
|
|
||||||||
|
Cash and cash equivalents
|
56
|
|
13
|
|
301
|
|
370
|
|
||||||||
|
Collateral posting account (3)
|
58
|
|
11
|
|
—
|
|
69
|
|
||||||||
|
Total available liquidity (4)
|
$
|
267
|
|
$
|
24
|
|
$
|
301
|
|
$
|
592
|
|
||||
37
|
Successor
|
||||||||||||||||
|
|
December 31, 2012
|
|||||||||||||||
|
(amounts in millions)
|
DPC
|
DMG
|
Other (1)
|
Total
|
||||||||||||
|
LC capacity, inclusive of required reserves (2)
|
$
|
220
|
|
$
|
14
|
|
$
|
28
|
|
$
|
262
|
|
||||
|
Less: Required reserves (2)
|
(7
|
)
|
(1
|
)
|
—
|
|
(8
|
)
|
||||||||
|
Less: Outstanding letters of credit
|
(212
|
)
|
(13
|
)
|
(27
|
)
|
(252
|
)
|
||||||||
|
LC availability
|
1
|
|
—
|
|
1
|
|
2
|
|
||||||||
|
Cash and cash equivalents
|
21
|
|
10
|
|
317
|
|
348
|
|
||||||||
|
Collateral Posting Account (3)
|
63
|
|
8
|
|
—
|
|
71
|
|
||||||||
|
Total available liquidity (4)
|
$
|
85
|
|
$
|
18
|
|
$
|
318
|
|
$
|
421
|
|
||||
__________________________________________
|
(1)
|
Other cash consists of
zero
and
zero
at Coal Holdco;
$1 million
and
$1 million
at Dynegy Gas Holdco, LLC;
$5 million
and
$10 million
at Dynegy Administrative Services Company; and
$295 million
and
$306 million
at Dynegy Inc. as of
March 8, 2013
and
December 31, 2012
, respectively.
|
|
(2)
|
The LC facilities were collateralized with cash proceeds received under our existing credit agreements. The amount of the LC availability plus any unused required reserves of 3 percent of the unused capacity, may be withdrawn from the LC facilities with three days written notice for unrestricted use in the operations of the applicable entity. LC capacity as of
March 8, 2013
and
December 31, 2012
reflects a reduction in capacity for DMG and DPC following the requested release of unused cash collateral from restricted cash. Actual commitment amounts under each credit agreement have not been reduced, and DMG and DPC can increase the LC capacity up to the original commitment amount in the future by posting additional cash collateral.
|
|
(3)
|
The collateral posting account included in the above liquidity tables is restricted per the DMG Credit Agreement and the DPC Credit Agreement and may be used for future collateral posting requirements or released per the terms of the applicable credit agreement.
|
|
(4)
|
Does not reflect our ability to use the first lien structure as described in Operating Activities—“Collateral Postings”.
|
Both the DPC and DMG Credit Agreements contain provisions that permit pre-payment of up to
$250
million and
$100
million, respectively, at par. In November 2012, we repaid
$250
million and
$75
million of the DPC and DMG Credit Agreements, respectively.
DPC and DMG Restricted Payments.
The DPC Credit Agreement and the DMG Credit Agreement allow distributions by DPC and DMG to their parents of up to
$135
million and
$90
million per year, respectively, provided the borrower and its subsidiaries possess at least
$50
million of unrestricted cash and short-term investments as of the date of the proposed distribution. There were no distributions by DPC or DMG during 2012.
Operating Activities
Historical Operating Cash Flows
. Our cash flow used by operations totaled
$44 million
for the Successor Period. During the period, our power generation business used cash of $55 million primarily due to losses incurred during the period. Corporate and other operations used cash of approximately $23 million primarily due to payments to advisors, employee related payments and other general and administrative expense. These uses of cash were partially offset by $34 million in positive changes in working capital, which includes $30 million for the return of collateral.
Our cash flow used by operations totaled
$37 million
for the 2012 Predecessor Period. During the period, our power generation business used cash of $56 million primarily due to increased collateral postings to satisfy our counterparty collateral demands and other negative working capital. Corporate and other operations provided cash of approximately $19 million primarily due to interest payments received from Legacy Dynegy on the Undertaking, partially offset by payments to advisors and other general and administrative expense.
Our cash flow used in operations totaled
$1 million
for the
year ended
December 31, 2011
. During the period, our power generation business provided positive cash flow from operations of $348 million from the operation of our power generation facilities offset by a use of cash of $349 million from corporate and other operations primarily due to interest payments to service debt, employee related payments and restructuring costs.
Our cash flow provided by operations totaled
$423 million
for the
year ended
December 31, 2010
. During the period, our power generation business provided positive cash flow from operations of $938 million from the operation of our power generation facilities, primarily reflecting positive earnings for the period and approximately $290 million of cash received from our futures clearing manager. The receipt of this cash was partly due to lower commodity prices and a reduction of margin
38
requirements; the remaining cash was returned as a result of the posting of $85 million of short-term investments as collateral in lieu of cash. Corporate and other operations included a use of cash of approximately $515 million, primarily due to interest payments to service debt and general and administrative expense.
Future Operating Cash Flows
. Our future operating cash flows will vary based on a number of factors, many of which are beyond our control, including the price of power, the prices of natural gas, coal, and fuel oil and their correlation to power prices, collateral requirements, the value of capacity and ancillary services, the run time of our generating facilities, the effectiveness of our commercial strategy, legal, environmental and regulatory requirements, our ability to achieve the cost savings contemplated in our cost reduction programs and our ability to capture value associated with commodity price volatility.
Collateral Postings.
We use a significant portion of our capital resources in the form of cash and letters of credit to satisfy counterparty collateral demands. These counterparty collateral demands reflect our non-investment grade credit ratings and counterparties’ views of our financial condition and ability to satisfy our performance obligations, as well as commodity prices and other factors. The following table summarizes our collateral postings to third parties by legal entity at
March 8, 2013
,
December 31, 2012
and
December 31, 2011
:
|
Successor
|
Predecessor
|
||||||||||||
|
(amounts in millions)
|
March 8, 2013
|
December 31, 2012
|
December 31, 2011
|
||||||||||
|
Dynegy Power, LLC:
|
|
|
|
|
|
|
|||||||
|
Cash (1)
|
$
|
58
|
|
$
|
41
|
|
$
|
44
|
|
||||
|
Letters of credit
|
201
|
|
212
|
|
386
|
|
|||||||
|
Total DPC
|
$
|
259
|
|
$
|
253
|
|
$
|
430
|
|
||||
|
Dynegy Midwest Generation, LLC (2):
|
|
|
|
|
|
|
|||||||
|
Cash (1)
|
$
|
21
|
|
$
|
22
|
|
$
|
—
|
|
||||
|
Letters of credit
|
11
|
|
13
|
|
—
|
|
|||||||
|
Total DMG
|
$
|
32
|
|
$
|
35
|
|
$
|
—
|
|
||||
|
Other:
|
|
|
|
|
|
|
|||||||
|
Cash
|
$
|
1
|
|
$
|
1
|
|
$
|
—
|
|
||||
|
Letters of credit
|
27
|
|
27
|
|
26
|
|
|||||||
|
Total Other
|
$
|
28
|
|
$
|
28
|
|
$
|
26
|
|
||||
|
Total
|
$
|
319
|
|
$
|
316
|
|
$
|
456
|
|
||||
__________________________________________
|
(1)
|
Includes Broker margin account on our consolidated balance sheets as well as other collateral postings included in Prepayments and other current assets on our consolidated balance sheets. As of December 31, 2012, $4 million of cash posted as collateral was included in Liabilities from risk management activities on our consolidated balance sheets.
|
|
(2)
|
As a result of the DMG Transfer on September 1, 2011, DMG was owned by Legacy Dynegy and was not included in our consolidated financial statements as of December 31, 2011. As of December 31, 2011, DMG had $11 million and $38 million in cash and letters of credit posted as collateral, respectively.
|
The change in letters of credit postings from December 31, 2011 to
December 31, 2012
is due to a decision to post cash as collateral from the Collateral Posting Accounts instead of letters of credit, reductions due to ordinary course settlements and market conditions, use of first liens, and the cancellation of certain contracts. Collateral postings were relatively flat from
December 31, 2012
to
March 8, 2013
.
In addition to cash and letters of credit posted as collateral, we have granted additional permitted first priority liens on the assets already subject to first priority liens under the DMG Credit Agreement and the DPC Credit Agreement. The additional liens were granted as collateral under certain of our derivative agreements in order to reduce the cash collateral and letters of credit that we would otherwise be required to provide to the counterparties under such agreements. The counterparties under such agreements would share the benefits of the collateral subject to such first priority liens ratably with the lenders under the DMG Credit Agreement and the DPC Credit Agreement.
39
The fair value of DMG’s derivatives collateralized by first priority liens included liabilities of
$21 million
,
$18 million
and
zero
at
March 8, 2013
,
December 31, 2012
and
December 31, 2011
, respectively. The fair value of DPC’s derivatives collateralized by first priority liens included liabilities of
$91 million
,
$80 million
and
$92 million
at
March 8, 2013
,
December 31, 2012
and
December 31, 2011
, respectively.
We expect counterparties’ future collateral demands to continue to reflect changes in commodity prices, including seasonal changes in weather-related demand, as well as their views of our creditworthiness. Our ability to use forward economic hedging instruments could be limited due to the potential collateral requirements of such instruments.
Investing Activities
Capital Expenditures.
We continue to tightly manage our operating costs and capital expenditures. We had capital expenditures of approximately
$46 million
during the Successor Period and
$63 million
,
$196 million
and
$333 million
during the 2012 Predecessor Period and the
years ended
December 31, 2011 and 2010, respectively. Our capital spending by reportable segment was as follows:
|
Successor
|
Predecessor
|
||||||||||||||||
|
|
October 2 Through December 31, 2012
|
January 1 Through October 1, 2012
|
Year Ended December 31,
|
||||||||||||||
|
(amounts in millions)
|
2011
|
2010
|
|||||||||||||||
|
Coal (1)
|
$
|
26
|
|
$
|
33
|
|
$
|
115
|
|
$
|
274
|
|
|||||
|
Gas
|
19
|
|
23
|
|
79
|
|
50
|
|
|||||||||
|
DNE
|
—
|
|
—
|
|
2
|
|
3
|
|
|||||||||
|
Other and eliminations
|
1
|
|
7
|
|
—
|
|
6
|
|
|||||||||
|
Total
|
$
|
46
|
|
$
|
63
|
|
$
|
196
|
|
$
|
333
|
|
|||||
__________________________________________
|
(1)
|
On September 1, 2011, we completed the DMG Transfer. On June 5, 2012, we completed the DMG Acquisition. Therefore, capital expenditures are included only from June 6, 2012 to October 1, 2012 for the 2012 Predecessor Period and from January 1, 2011 through August 31, 2011 for the
year ended
December 31, 2011
. For the 2012 Predecessor Period and the
year ended
December 31, 2011, including the periods that Coal was not included in our consolidated financial statements, Coal capital expenditures were $75 million and $184 million, respectively.
|
Capital spending in our Coal segment primarily consisted of environmental and maintenance capital projects. Capital spending in our Gas segment primarily consisted of maintenance projects.
We expect capital expenditures for 2013 to be approximately $110 million, which is comprised of $44 million, $62 million and $4 million in Coal, Gas and Other, respectively. The capital budget is subject to revision as opportunities arise or circumstances change.
On November 3, 2012, we completed the Baldwin Unit 2 outage marking the completion of the material Consent Decree environmental compliance capital requirements. We have spent approximately $921 million through December 31, 2012 related to these Consent Decree projects and we expect our remaining costs to be approximately $2 million for 2013.
Other Investing Activities.
During the Successor Period, there was a
$311 million
cash inflow related to restricted cash balances due to a reduction in the Collateral Posting account. These proceeds were used to fund a portion of the repayment of the DMG and DPC Credit Agreement as further discussed below.
During the 2012 Predecessor Period, in connection with the DMG Acquisition on June 5, 2012, we acquired
$256 million
in cash. We received $16 million in principal payments related to the Undertaking and there was
$88 million
of cash inflows related to restricted cash balances during the 2012 Predecessor Period, offset by a reduction of $22 million in cash as a result of the deconsolidation of the DNE Debtor Entities.
There was a
$441 million
cash outflow related to the DMG Transfer on September 1, 2011. There was a $
222 million
net cash inflow related to restricted cash balances during the
year ended
December 31, 2011
primarily due to increases of approximately $1 billion related to the repayment of our former Fifth Amended and Restated Credit Agreement, the Sithe Tender Offer and the return of collateral, partially offset by decreases of $792 million related to the DPC Credit Agreement, the DMG Credit Agreement and a Letter of Credit Reimbursement and Collateral Agreement. Cash outflows for purchases of short-term investments during the
year ended
December 31, 2011
totaled $
244 million
. Cash inflows related to maturities of short-term investments for the year ended
December 31, 2011
totaled $
419 million
.
40
Cash inflows related to short-term investments during the year ended
December 31, 2010
totaled
$302 million
, reflecting maturities and early redemptions of short-term investments. Cash outflows related to purchases of short-term investments during the
year ended
December 31, 2010
totaled
$477 million
.
There was a
$15 million
cash outflow related to our funding commitment obligation under the PPEA Sponsor Support Agreement and a
$3 million
cash outflow due to changes in restricted cash balances during the
year ended
December 31, 2010
.
Other included $
10 million
of property insurance claim proceeds during the
year ended
December 31, 2011
.
Financing Activities
Historical Cash Flow from Financing Activities.
Cash flow used in financing activities totaled
$328 million
during the Successor Period due to repayments of borrowings on the DMG and the DPC Credit Agreements.
Cash flow used in financing activities totaled
$184 million
for the 2012 Predecessor Period due to
$200 million
paid to unsecured creditors upon our emergence from bankruptcy on the Plan Effective Date and $11 million in repayments of borrowings on the DMG and the DPC Credit Agreements, offset by an increase of $27 million in connection with the recapitalization of Legacy Dynegy.
Cash flow provided by financing activities totaled
$375 million
for the
year ended
December 31, 2011
. Proceeds from long-term borrowings of
$2 billion
, net of $44 million of debt issuance costs, consisted of borrowing under the DPC Credit Agreement, DMG Credit Agreement and our former Fifth Amended and Restated Credit Agreement. These borrowings were partially offset by repayments of borrowings of $1.6 billion on our former Fifth Amended and Restated Credit Agreement, Sithe senior debt and our 6.875 percent senior notes.
Net cash used in financing activities during the
year ended
December 31, 2010
totaled
$69 million
due to the payments of $62 million in aggregate principal amount on our Sithe 9.00 percent secured bonds due 2013 and
$6 million
of financing fees.
Summarized Debt and Other Obligations.
The following table depicts our third party debt obligations, and the extent to which they are secured as of
December 31, 2012 and 2011
:
|
Successor
|
Predecessor
|
||||||||
|
(amounts in millions)
|
December 31, 2012
|
December 31, 2011
|
|||||||
|
First secured obligations
|
$
|
1,354
|
|
$
|
1,097
|
|
|||
|
Unsecured obligations (1)
|
—
|
|
3,570
|
|
|||||
|
Total obligations
|
1,354
|
|
4,667
|
|
|||||
|
Premium (discount)
|
61
|
|
(21
|
)
|
|||||
|
Total notes payable and long-term debt
|
$
|
1,415
|
|
$
|
4,646
|
|
|||
__________________________________________
|
(1)
|
Our unsecured obligations as of
December 31, 2011
were subject to compromise as a result of our bankruptcy filing on November 7, 2011 and were settled in connection with our emergence from bankruptcy on the Plan Effective Date. Please read
Note 3—Emergence from Bankruptcy and Fresh-Start Accounting
for further discussion.
|
Financing Trigger Events.
The debt instruments and other financial obligations related to our subsidiaries include provisions which, if not met, could require early payment, additional collateral support or similar actions. The trigger events connected to the financing of our subsidiaries include the violation of covenants, defaults on scheduled principal or interest payments, including any indebtedness to the extent linked to it by reason of cross-default or cross-acceleration provisions, insolvency events, acceleration of other financial obligations and change of control provisions. Our subsidiaries do not have any trigger events tied to specified credit ratings or stock price in our debt instruments and are not party to any contracts that require us to issue equity based on credit ratings or other trigger events.
Financial Covenants.
During 2012, we were not subject to any financial covenants. On January 16, 2013, our Gas segment entered into a Revolving Credit Agreement. The Revolving Credit Agreement contains customary events of default and affirmative and negative covenants including, subject to certain specified exceptions, financial covenants specifying minimum thresholds for DPC’s interest coverage ratios and maximum thresholds for DPC’s total leverage ratio. Under the Revolving Credit Agreement, DPC must be in compliance with the following ratios for the following periods:
41
|
Period Ending
|
Consolidated Total Debt to Consolidated Adjusted EBITDA Requirement (1)
|
Consolidated Adjusted EBITDA to Consolidated Cash Interest Expense Requirement (1)
|
||
|
June 30, 2013
|
7.00: 1.00
|
1.25: 1.00
|
||
|
September 30, 2013
|
5.50: 1.00
|
1.75: 1.00
|
||
|
December 31, 2013
|
4.50: 1.00
|
2.25: 1.00
|
||
__________________________________________
(1) Consolidated Total Debt, Consolidated Adjusted EBITDA and Consolidated Interest Expense are defined terms in the Revolving Credit Agreement and relate to amounts included in DPC and its direct and indirect subsidiaries only.
Please read
Note 27—Subsequent Events
for further discussion.
Dividends on Common Stock
. We have paid no cash dividends on our common stock and have no current intention of doing so. Any future determinations to pay cash dividends will be at the discretion of our Board of Directors, subject to applicable limitations under Delaware law, and will be dependent upon our results of operations, financial condition, contractual restrictions and other factors deemed relevant by our Board of Directors.
Credit Ratings
Our credit rating status is currently “non-investment grade” and our current ratings are as follows:
|
|
|
Standard &
Poor (1)
|
|
Moody’s
|
|
Fitch
|
|
Dynegy Inc.
|
|
|
|
|
|
|
|
Corporate Family Rating
|
NR
|
B2
|
NR
|
|||
|
DPC
|
|
|
|
|
|
|
|
Senior Secured
|
|
NR
|
|
B2
|
|
B
|
__________________________________________
(1) The last update on Dynegy from Standard & Poor was on July 6, 2012. There has not been an update since Dynegy’s emergence from Chapter 11 on October 1, 2012.
Disclosure of Contractual Obligations
We have incurred various contractual obligations and financial commitments in the normal course of our operations and financing activities. Contractual obligations include future cash payments required under existing contractual arrangements, such as debt and lease agreements. These obligations may result from both general financing activities and from commercial arrangements that are directly supported by related revenue-producing activities.
The following table summarizes the contractual obligations of the Company and its consolidated subsidiaries as of
December 31, 2012
. Cash obligations reflected are not discounted and do not include accretion or dividends.
|
|
Expiration by Period
|
|||||||||||||||||||
|
(amounts in millions)
|
Total
|
Less than
1 Year
|
1 - 3 Years
|
3 - 5 Years
|
More than
5 Years
|
|||||||||||||||
|
Long-term debt (including current portion)
|
$
|
1,354
|
|
$
|
14
|
|
$
|
28
|
|
$
|
1,312
|
|
$
|
—
|
|
|||||
|
Interest payments on debt
|
448
|
|
126
|
|
249
|
|
73
|
|
—
|
|
||||||||||
|
Coal commitments (1)
|
316
|
|
146
|
|
170
|
|
—
|
|
—
|
|
||||||||||
|
Coal transportation
|
190
|
|
3
|
|
41
|
|
38
|
|
108
|
|
||||||||||
|
Operating leases
|
40
|
|
16
|
|
10
|
|
5
|
|
9
|
|
||||||||||
|
Capacity payments
|
183
|
|
37
|
|
66
|
|
32
|
|
48
|
|
||||||||||
|
Interconnection obligations
|
15
|
|
1
|
|
2
|
|
2
|
|
10
|
|
||||||||||
|
Construction service agreements
|
171
|
|
26
|
|
82
|
|
63
|
|
—
|
|
||||||||||
|
Pension funding obligations
|
148
|
|
—
|
|
20
|
|
40
|
|
88
|
|
||||||||||
|
Other obligations
|
36
|
|
7
|
|
21
|
|
3
|
|
5
|
|
||||||||||
|
Total contractual obligations
|
$
|
2,901
|
|
$
|
376
|
|
$
|
689
|
|
$
|
1,568
|
|
$
|
268
|
|
|||||
__________________________________________
|
(1)
|
Included based on nature of purchase obligations under associated contracts.
|
42
Interest Payments on Debt.
Interest payments on debt represent estimated periodic interest payment obligations associated with the DPC and DMG Credit Agreements. Amounts do not include the impact of interest rate hedging agreements. Please read
Note 18—Debt
—DPC Credit Agreement and DMG Credit Agreement for further discussion.
Coal Commitments.
At
December 31, 2012
, our subsidiaries had contracts in place to purchase coal for various generation facilities. The amounts in the table reflect our minimum purchase obligations. To the extent forecasted volumes have not been priced but are subject to a price collar structure, the obligations have been calculated using the minimum purchase price of the collar.
Coal Transportation.
In August 2012, we executed new coal transportation contracts which take effect when our current contracts expire. The amounts included in Coal transportation reflect our minimum purchase obligations based on the terms of the contracts.
Operating Leases.
Operating leases include minimum lease payment obligations associated with office and office equipment leases.
In addition, a subsidiary of the Company is party to two charter party agreements relating to two VLGCs previously utilized in our former global liquids business. The aggregate minimum base commitments of the charter party agreements are approximately $12 million for 2013 and approximately $5 million in aggregate for the period from 2014 through lease expiration. The charter party rates payable under the two charter party agreements vary in accordance with market-based rates for similar shipping services. The $12 million and $5 million amounts set forth above are based on the minimum obligations set forth in the two charter party agreements. The primary terms of the charter party agreements expire September 2013 and September 2014, respectively. Both VLGCs have been sub-chartered to a wholly-owned subsidiary of Transammonia Inc. The terms of the sub-charters are identical to the terms of the original charter agreements. The subsidiary of the Company relies on the sub-charters with a subsidiary of Transammonia to satisfy the obligations of the two charter party agreements. To date, the subsidiary of Transammonia has complied with the terms of the sub-charter agreements.
Capacity Payments.
Capacity payments include fixed obligations associated with transportation totaling approximately
$183 million
.
Interconnection Obligations.
Interconnection obligations represent an obligation with respect to interconnection services for the Ontelaunee facility. This agreement expires in 2027. The obligation under this agreement is approximately $1 million per year through the term of the contract.
Construction Service Agreements.
Construction service agreements represent obligations with respect to long-term plant maintenance agreements. The obligation under these agreements is approximately $171 million.
Pension Funding Obligations.
Amounts include our minimum required contributions to our defined benefit pension plans through 2022 as determined by our actuary and are subject to change based on actual results of the plan. We may elect to make voluntary contributions in 2013 which would decrease future funding obligations. Please read
Note 24—Employee Compensation, Savings and Pension Plans
—Pension and Other Post-Retirement Benefits—Obligations and Funded Status for further discussion.
Other Obligations.
Other obligations primarily include the following items:
|
•
|
Demolition and restoration obligations related to our retired power generation facilities and related assets of $20 million;
|
|
•
|
Obligations of $4 million primarily for Morro Bay city improvements in connection with our Morro Bay facility;
|
|
•
|
Obligations of $4 million for harbor support and utility work in connection with Moss Landing;
|
|
•
|
Reserves of $1 million recorded in connection with uncertain tax positions. Please read
Note 20—Income Taxes
—Unrecognized Tax Benefits for further discussion;
|
|
•
|
Obligations of $3 million primarily for a water supply agreement and other contracts for our Ontelaunee facility;
|
|
•
|
Obligations of $1 million related to information technology related contracts; and
|
|
•
|
Severance and retention obligations of $3 million as of
December 31, 2012
in connection with a reduction in workforce and the closure of certain power generation facilities. Please read
Note 7—Impairment and Restructuring Charges
—Restructuring Charges for further discussion.
|
43
Commitments and Contingencies
Please read
Note 22—Commitments and Contingencies
, which is incorporated herein by reference, for further discussion of our material commitments and contingencies.
44
RESULTS OF OPERATIONS
Overview and Discussion of Comparability of Results.
In this section, we discuss our results of operations, both on a consolidated basis and, where appropriate, by segment, for the years ended
December 31, 2012, 2011 and 2010
. At the end of this section, we have included our business outlook for each segment.
We report the results of our power generation business primarily as two separate segments in our consolidated financial statements: (i) Coal and (ii) Gas. In connection with our emergence from bankruptcy, we deconsolidated the DNE Debtor Entities, which constituted our previously reported DNE segment, and began accounting for our investment in the DNE Debtor Entities using the cost method. Accordingly, we have reclassified the results of the previously reported DNE segment as discontinued operations in the consolidated financial statements for all periods presented. Subsequent to our emergence from bankruptcy, management does not consider general and administrative expense when evaluating the performance of our Coal and Gas segments, but instead evaluates general and administrative expense on an enterprise-wide basis. Accordingly, we have recast our segments to present general and administrative expense in Other and Eliminations for all periods presented.
We applied “fresh-start” accounting as of the Plan Effective Date. Fresh-start accounting requires us to allocate the reorganization value to our assets and liabilities in a manner similar to the acquisition method of accounting for business combinations. Under the provisions of fresh-start accounting, a new entity has been created for financial reporting purposes. As such, our financial information for the Successor is presented on a basis different from, and is therefore not comparable to, our financial information for the Predecessor for the period ended and as of October 1, 2012 or for prior periods. Please read
Note 3—Emergence from Bankruptcy and Fresh-Start Accounting
for further discussion.
References to financial information for the year ended December 31, 2012 throughout this discussion combine the Successor Period and the 2012 Predecessor Period. A reconciliation is provided to that effect. While this combined presentation is a non-GAAP presentation for which there is no comparable GAAP measure, management believes that providing this financial information is the most relevant and useful method for making comparisons to the
year ended
December 31, 2011.
On September 1, 2011, we completed the DMG Transfer. Therefore, the results of our Coal segment (including DMG) were included in our 2011 consolidated results for the period of January 1, 2011 through August 31, 2011. Additionally, on June 5, 2012, we reacquired DMG through the DMG Acquisition. Therefore, the results of our Coal segment (including DMG) are included in our 2012 consolidated results for the period of June 6, 2012 through December 31, 2012.
Non-GAAP Performance Measures.
In analyzing and planning for our business, we supplement our use of GAAP financial measures with non-GAAP financial measures, including EBITDA and Adjusted EBITDA. These non-GAAP financial measures reflect an additional way of viewing aspects of our business that, when viewed with our GAAP results and the accompanying reconciliations to corresponding GAAP financial measures included in the tables below, may provide a more complete understanding of factors and trends affecting our business. These non-GAAP financial measures should not be relied upon to the exclusion of GAAP financial measures and are by definition an incomplete understanding of Dynegy, and must be considered in conjunction with GAAP measures.
We believe that the historical non-GAAP measures disclosed in our filings are only useful as an additional tool to help management and investors make informed decisions about our financial and operating performance. By definition, non-GAAP measures do not give a full understanding of Dynegy; therefore, to be truly valuable, they must be used in conjunction with the comparable GAAP measures. In addition, non-GAAP financial measures are not standardized; therefore, it may not be possible to compare these financial measures with other companies’ non-GAAP financial measures having the same or similar names. We strongly encourage investors to review our consolidated financial statements and publicly filed reports in their entirety and not rely on any single financial measure.
EBITDA and Adjusted EBITDA.
We define EBITDA as earnings (loss) before interest expense, income tax expense (benefit), and depreciation and amortization expense. We define Adjusted EBITDA as EBITDA adjusted to exclude (i) gains or losses on the sale of assets, (ii) the impacts of mark-to-market changes on economic hedges related to our generation portfolio, (iii) the impact of impairment charges and certain other costs such as those associated with the internal reorganization and bankruptcy proceedings, (iv) amortization of intangible assets and liabilities, (v) income or loss associated with discontinued operations, and (vi) income or expense on up front premiums received or paid for financial options in periods other than the strike periods. Our Adjusted EBITDA for the year ended December 31, 2011, is based on our prior methodology which did not include (i) adjustments for up front premiums, (ii) amortization of intangible assets related to the Sithe acquisition, (iii) mark-to-market adjustments for financial activity not related to our generation portfolio or (iv) the elimination of income or loss associated with discontinued operations. Enterprise-wide Adjusted EBITDA includes the Adjusted EBITDA of our parent, Legacy Dynegy, for the periods prior to the Merger.
45
We believe EBITDA and Adjusted EBITDA provide meaningful representations of our operating performance. We consider EBITDA as another way to measure financial performance on an ongoing basis. Enterprise-wide Adjusted EBITDA is meant to reflect the operating performance of our entire power generation fleet for the period presented; consequently, it excludes the impact of mark-to-market accounting, impairment charges, gains and losses on sales of assets, and other items that could be considered “non-operating” or “non-core” in nature. Because EBITDA and Adjusted EBITDA are financial measures that management uses to allocate resources, determine our ability to fund capital expenditures, assess performance against our peers, and evaluate overall financial performance, we believe they provide useful information for our investors. In addition, many analysts, fund managers, and other stakeholders that communicate with us typically request our financial results in an EBITDA and Adjusted EBITDA format presented on an enterprise-wide basis.
As prescribed by the SEC, when Adjusted EBITDA is discussed in reference to performance on a consolidated basis, the most directly comparable GAAP financial measure to EBITDA and Adjusted EBITDA is Net income (loss). Management does not analyze interest expense and income taxes on a segment level; therefore, the most directly comparable GAAP financial measure to Adjusted EBITDA when performance is discussed on a segment level is Operating income (loss).
46
Consolidated Summary Financial Information—Year Ended December 31, 2012 Compared to Year Ended December 31, 2011
The following table provides summary financial data regarding our consolidated results of operations for the Successor Period, the 2012 Predecessor Period and the
year ended
December 31, 2011
, respectively:
|
Successor
|
Predecessor
|
Combined
|
Predecessor
|
|||||||||||||||||||||
|
(amounts in millions)
|
October 2 Through December 31, 2012
|
January 1 Through October 1, 2012
|
Year Ended December 31, 2012
|
Year Ended December 31, 2011
|
Change
|
% Change
|
||||||||||||||||||
|
Revenues
|
$
|
312
|
|
$
|
981
|
|
$
|
1,293
|
|
$
|
1,333
|
|
$
|
(40
|
)
|
(3
|
)%
|
|||||||
|
Cost of sales
|
(268
|
)
|
(662
|
)
|
(930
|
)
|
(866
|
)
|
(64
|
)
|
(7
|
)%
|
||||||||||||
|
Gross margin, exclusive of depreciation shown separately below
|
44
|
|
319
|
|
363
|
|
467
|
|
(104
|
)
|
(22
|
)%
|
||||||||||||
|
Operating and maintenance expense, exclusive of depreciation shown separately below
|
(81
|
)
|
(148
|
)
|
(229
|
)
|
|
(254
|
)
|
25
|
|
10
|
%
|
|||||||||||
|
Depreciation and amortization expense
|
(45
|
)
|
(110
|
)
|
(155
|
)
|
(295
|
)
|
140
|
|
47
|
%
|
||||||||||||
|
Impairment and other charges
|
—
|
|
—
|
|
—
|
|
(5
|
)
|
5
|
|
100
|
%
|
||||||||||||
|
General and administrative expense
|
(22
|
)
|
(56
|
)
|
(78
|
)
|
(102
|
)
|
24
|
|
24
|
%
|
||||||||||||
|
Operating income (loss)
|
(104
|
)
|
5
|
|
(99
|
)
|
(189
|
)
|
90
|
|
48
|
%
|
||||||||||||
|
Bankruptcy reorganization items, net
|
(3
|
)
|
1,037
|
|
1,034
|
|
(52
|
)
|
1,086
|
|
2,088
|
%
|
||||||||||||
|
Earnings from unconsolidated investments
|
2
|
|
—
|
|
2
|
|
—
|
|
2
|
|
NM
|
|
||||||||||||
|
Interest expense
|
(16
|
)
|
(120
|
)
|
(136
|
)
|
(348
|
)
|
212
|
|
61
|
%
|
||||||||||||
|
Debt extinguishment costs
|
—
|
|
—
|
|
—
|
|
(21
|
)
|
21
|
|
100
|
%
|
||||||||||||
|
Impairment of Undertaking receivable, affiliate
|
—
|
|
(832
|
)
|
(832
|
)
|
—
|
|
(832
|
)
|
(100
|
)%
|
||||||||||||
|
Other income and expense, net
|
8
|
|
31
|
|
39
|
|
35
|
|
4
|
|
11
|
%
|
||||||||||||
|
Income (loss) from continuing operations before income taxes
|
(113
|
)
|
121
|
|
8
|
|
(575
|
)
|
583
|
|
101
|
%
|
||||||||||||
|
Income tax benefit (Note 20)
|
—
|
|
9
|
|
9
|
|
144
|
|
(135
|
)
|
(94
|
)%
|
||||||||||||
|
Income (loss) from continuing operations
|
(113
|
)
|
130
|
|
17
|
|
(431
|
)
|
448
|
|
104
|
%
|
||||||||||||
|
Income (loss) from discontinued operations, net of taxes
|
6
|
|
(162
|
)
|
(156
|
)
|
(509
|
)
|
353
|
|
69
|
%
|
||||||||||||
|
Net loss
|
$
|
(107
|
)
|
$
|
(32
|
)
|
$
|
(139
|
)
|
$
|
(940
|
)
|
$
|
801
|
|
85
|
%
|
|||||||
The DNE Debtor Entities did not emerge from Chapter 11 protection on October 1, 2012 and continue to operate their businesses as “debtors-in-possession.” Therefore, the DNE Debtor Entities were deconsolidated as of October 1, 2012 and we began accounting for our investment using the cost method. Accordingly, we have reclassified DNE’s operating results as discontinued operations in the consolidated financial statements for all periods presented.
47
The following tables provide summary financial data regarding our operating income (loss) by segment for the Successor Period, the 2012 Predecessor Period and the
year ended
December 31, 2011
, respectively:
|
Successor
|
||||||||||||||||
|
|
October 2 Through December 31, 2012
|
|||||||||||||||
|
(amounts in millions)
|
Coal
|
Gas
|
Other
|
Total
|
||||||||||||
|
Revenues
|
$
|
107
|
|
$
|
205
|
|
$
|
—
|
|
$
|
312
|
|
||||
|
Cost of sales
|
(110
|
)
|
(158
|
)
|
—
|
|
(268
|
)
|
||||||||
|
Gross margin, exclusive of depreciation shown separately below
|
(3
|
)
|
47
|
|
—
|
|
44
|
|
||||||||
|
Operating and maintenance expense, exclusive of depreciation and amortization expense shown separately below
|
(38
|
)
|
(42
|
)
|
(1
|
)
|
(81
|
)
|
||||||||
|
Depreciation and amortization expense
|
(8
|
)
|
(36
|
)
|
(1
|
)
|
(45
|
)
|
||||||||
|
General and administrative expense
|
—
|
|
—
|
|
(22
|
)
|
(22
|
)
|
||||||||
|
Operating loss
|
$
|
(49
|
)
|
$
|
(31
|
)
|
$
|
(24
|
)
|
$
|
(104
|
)
|
||||
|
Predecessor
|
||||||||||||||||
|
|
January 1 Through October 1, 2012
|
|||||||||||||||
|
(amounts in millions)
|
Coal
|
Gas
|
Other
|
Total
|
||||||||||||
|
Revenues
|
$
|
166
|
|
$
|
815
|
|
$
|
—
|
|
$
|
981
|
|
||||
|
Cost of sales
|
(161
|
)
|
(501
|
)
|
—
|
|
(662
|
)
|
||||||||
|
Gross margin, exclusive of depreciation shown separately below
|
5
|
|
314
|
|
—
|
|
319
|
|
||||||||
|
Operating and maintenance expense, exclusive of depreciation and amortization expense shown separately below
|
(55
|
)
|
(95
|
)
|
2
|
|
(148
|
)
|
||||||||
|
Depreciation and amortization expense
|
(13
|
)
|
(91
|
)
|
(6
|
)
|
(110
|
)
|
||||||||
|
General and administrative expense
|
—
|
|
—
|
|
(56
|
)
|
(56
|
)
|
||||||||
|
Operating income (loss)
|
$
|
(63
|
)
|
$
|
128
|
|
$
|
(60
|
)
|
$
|
5
|
|
||||
|
Combined
|
||||||||||||||||
|
|
Year Ended December 31, 2012
|
|||||||||||||||
|
(amounts in millions)
|
Coal
|
Gas
|
Other
|
Total
|
||||||||||||
|
Revenues
|
$
|
273
|
|
$
|
1,020
|
|
$
|
—
|
|
$
|
1,293
|
|
||||
|
Cost of sales
|
(271
|
)
|
(659
|
)
|
—
|
|
(930
|
)
|
||||||||
|
Gross margin, exclusive of depreciation shown separately below
|
2
|
|
361
|
|
—
|
|
363
|
|
||||||||
|
Operating and maintenance expense, exclusive of depreciation and amortization expense shown separately below
|
(93
|
)
|
(137
|
)
|
1
|
|
(229
|
)
|
||||||||
|
Depreciation and amortization expense
|
(21
|
)
|
(127
|
)
|
(7
|
)
|
(155
|
)
|
||||||||
|
General and administrative expense
|
—
|
|
—
|
|
(78
|
)
|
(78
|
)
|
||||||||
|
Operating income (loss)
|
$
|
(112
|
)
|
$
|
97
|
|
$
|
(84
|
)
|
$
|
(99
|
)
|
||||
48
|
Predecessor
|
||||||||||||||||
|
|
Year Ended December 31, 2011
|
|||||||||||||||
|
(amounts in millions)
|
Coal
|
Gas
|
Other
|
Total
|
||||||||||||
|
Revenues
|
$
|
460
|
|
$
|
872
|
|
$
|
1
|
|
$
|
1,333
|
|
||||
|
Cost of sales
|
(237
|
)
|
(629
|
)
|
—
|
|
(866
|
)
|
||||||||
|
Gross margin, exclusive of depreciation shown separately below
|
223
|
|
243
|
|
1
|
|
467
|
|
||||||||
|
Operating and maintenance expense, exclusive of depreciation and amortization expense shown separately below
|
(105
|
)
|
(148
|
)
|
(1
|
)
|
(254
|
)
|
||||||||
|
Depreciation and amortization expense
|
(156
|
)
|
(132
|
)
|
(7
|
)
|
(295
|
)
|
||||||||
|
Impairment and other charges
|
—
|
|
—
|
|
(5
|
)
|
(5
|
)
|
||||||||
|
General and administrative expense
|
—
|
|
—
|
|
(102
|
)
|
(102
|
)
|
||||||||
|
Operating loss
|
$
|
(38
|
)
|
$
|
(37
|
)
|
$
|
(114
|
)
|
$
|
(189
|
)
|
||||
49
The following table provides summary financial data regarding our Adjusted EBITDA by segment for the
year ended
December 31, 2012
:
|
Combined
|
||||||||||||||||
|
Year Ended December 31, 2012
|
||||||||||||||||
|
(amounts in millions)
|
Coal
|
Gas
|
Other
|
Total
|
||||||||||||
|
Net loss
|
$
|
(139
|
)
|
|||||||||||||
|
Loss from discontinued operations, net of tax
|
156
|
|
||||||||||||||
|
Income tax benefit
|
(9
|
)
|
||||||||||||||
|
Impairment of Undertaking receivable, affiliate
|
832
|
|
||||||||||||||
|
Bankruptcy reorganization items, net
|
(1,034
|
)
|
||||||||||||||
|
Interest expense
|
136
|
|
||||||||||||||
|
Earnings from unconsolidated investment
|
(2
|
)
|
||||||||||||||
|
Other items, net
|
(39
|
)
|
||||||||||||||
|
Operating income (loss)
|
$
|
(112
|
)
|
$
|
97
|
|
$
|
(84
|
)
|
$
|
(99
|
)
|
||||
|
Impairment of Undertaking receivable, affiliate
|
—
|
|
—
|
|
(832
|
)
|
(832
|
)
|
||||||||
|
Bankruptcy reorganization items, net
|
—
|
|
—
|
|
1,034
|
|
1,034
|
|
||||||||
|
Depreciation and amortization expense
|
21
|
|
127
|
|
7
|
|
155
|
|
||||||||
|
Earnings from unconsolidated investment
|
—
|
|
2
|
|
—
|
|
2
|
|
||||||||
|
Other items, net
|
5
|
|
2
|
|
32
|
|
39
|
|
||||||||
|
EBITDA from continuing operations
|
(86
|
)
|
228
|
|
157
|
|
299
|
|
||||||||
|
Impairment of Undertaking receivable, affiliate
|
—
|
|
—
|
|
832
|
|
832
|
|
||||||||
|
Bankruptcy reorganization items, net
|
—
|
|
—
|
|
(1,034
|
)
|
(1,034
|
)
|
||||||||
|
Interest income on Undertaking receivable
|
—
|
|
—
|
|
(24
|
)
|
(24
|
)
|
||||||||
|
Restructuring costs and other expense
|
—
|
|
—
|
|
3
|
|
3
|
|
||||||||
|
Mark-to-market (income) loss, net
|
7
|
|
(166
|
)
|
—
|
|
(159
|
)
|
||||||||
|
Amortization of intangible assets and liabilities (1)
|
78
|
|
61
|
|
—
|
|
139
|
|
||||||||
|
Premium adjustment
|
1
|
|
(1
|
)
|
—
|
|
—
|
|
||||||||
|
Changes in fair value of warrants
|
—
|
|
—
|
|
(8
|
)
|
(8
|
)
|
||||||||
|
Adjusted EBITDA
|
$
|
—
|
|
$
|
122
|
|
$
|
(74
|
)
|
$
|
48
|
|
||||
|
Adjusted EBITDA from Legacy Dynegy (2)
|
20
|
|
—
|
|
(11
|
)
|
9
|
|
||||||||
|
Enterprise-wide Adjusted EBITDA
|
$
|
20
|
|
$
|
122
|
|
$
|
(85
|
)
|
$
|
57
|
|
||||
__________________________________________
|
(1)
|
The amount in the Coal segment in the 2012 Predecessor Period relates to intangible assets and liabilities related to rail transportation and coal contracts, respectively, recorded in connection with the DMG Acquisition. The amount in the Gas segment in the 2012 Predecessor Period is related to the intangible assets related to the 2005 Sithe acquisition. The amounts in the Successor Period related to intangible assets and liabilities related to rail transportation, coal contracts, gas revenue contracts and gas transportation contracts recorded in connection with the application of fresh-start accounting. Please read
Note 16—Intangible Assets and Liabilities
for further discussion.
|
|
(2)
|
Our 2012 consolidated results reflect the results of our accounting predecessor, DH, which was our wholly-owned subsidiary until the Merger on September 30, 2012. Therefore, certain results related to Legacy Dynegy are not included in our consolidated results for the 2012 Predecessor Period. Additionally, effective June 5, 2012, we completed the DMG Acquisition. As a result, the results of our Coal segment, as well as certain items in the Other segment, are not included in our consolidated results for the period from January 1, 2012 through June 5, 2012. However, we have included the Adjusted EBITDA related to Legacy Dynegy for the 2012 Predecessor Period and the Coal segment for the period from January 1, 2012 through June 5, 2012 in this adjustment because management uses enterprise-wide Adjusted EBITDA to evaluate the operating performance of our entire power generation fleet.
|
The following table presents a reconciliation of Legacy Dynegy Adjusted EBITDA to Operating income (loss):
50
|
Predecessor
|
||||||||||||||||
|
January 1 Through October 1, 2012
|
||||||||||||||||
|
(amounts in millions)
|
Coal
|
Gas
|
Other
|
Total
|
||||||||||||
|
Operating income (loss)
|
$
|
(2,702
|
)
|
$
|
—
|
|
$
|
1,670
|
|
$
|
(1,032
|
)
|
||||
|
Depreciation and amortization expense
|
78
|
|
—
|
|
—
|
|
78
|
|
||||||||
|
Bankruptcy reorganization items, net
|
—
|
|
—
|
|
(8
|
)
|
(8
|
)
|
||||||||
|
Loss from unconsolidated investment
|
—
|
|
—
|
|
(1
|
)
|
(1
|
)
|
||||||||
|
EBITDA
|
(2,624
|
)
|
—
|
|
1,661
|
|
(963
|
)
|
||||||||
|
Loss (gain) on Coal Holdco Transfer
|
2,652
|
|
—
|
|
(1,711
|
)
|
941
|
|
||||||||
|
Bankruptcy reorganization items, net
|
—
|
|
—
|
|
8
|
|
8
|
|
||||||||
|
Restructuring costs and other expense
|
—
|
|
—
|
|
30
|
|
30
|
|
||||||||
|
Mark-to-market income, net
|
(8
|
)
|
—
|
|
—
|
|
(8
|
)
|
||||||||
|
Loss from unconsolidated investment
|
—
|
|
—
|
|
1
|
|
1
|
|
||||||||
|
Adjusted EBITDA from Legacy Dynegy
|
$
|
20
|
|
$
|
—
|
|
$
|
(11
|
)
|
$
|
9
|
|
||||
51
The following table provides summary financial data regarding our Adjusted EBITDA by segment for the
year ended
December 31, 2011:
|
Predecessor
|
||||||||||||||||
|
Year Ended December 31, 2011
|
||||||||||||||||
|
(amounts in millions)
|
Coal
|
Gas
|
Other
|
Total
|
||||||||||||
|
Net loss
|
$
|
(940
|
)
|
|||||||||||||
|
Loss from discontinued operations, net of tax
|
509
|
|
||||||||||||||
|
Income tax benefit
|
(144
|
)
|
||||||||||||||
|
Interest expense and debt extinguishment costs
|
369
|
|
||||||||||||||
|
Bankruptcy reorganization items, net
|
52
|
|
||||||||||||||
|
Other items, net
|
(35
|
)
|
||||||||||||||
|
Operating loss
|
$
|
(38
|
)
|
$
|
(37
|
)
|
$
|
(114
|
)
|
$
|
(189
|
)
|
||||
|
Bankruptcy reorganization items, net
|
—
|
|
—
|
|
(52
|
)
|
(52
|
)
|
||||||||
|
Other items, net
|
2
|
|
2
|
|
31
|
|
35
|
|
||||||||
|
Depreciation and amortization expense
|
156
|
|
132
|
|
7
|
|
295
|
|
||||||||
|
EBITDA from continuing operations
|
120
|
|
97
|
|
(128
|
)
|
89
|
|
||||||||
|
Merger termination fee, restructuring costs and other expenses
|
(1
|
)
|
7
|
|
25
|
|
31
|
|
||||||||
|
Bankruptcy reorganization items, net
|
—
|
|
—
|
|
52
|
|
52
|
|
||||||||
|
Mark-to-market loss, net
|
76
|
|
51
|
|
4
|
|
131
|
|
||||||||
|
Adjusted EBITDA from continuing operations
|
$
|
195
|
|
$
|
155
|
|
$
|
(47
|
)
|
$
|
303
|
|
||||
|
Adjusted EBITDA from Legacy Dynegy (1)
|
48
|
|
—
|
|
(51
|
)
|
(3
|
)
|
||||||||
|
Adjusted EBITDA
|
$
|
243
|
|
$
|
155
|
|
$
|
(98
|
)
|
$
|
300
|
|
||||
|
Adjusted EBITDA from discontinued operations
|
(19
|
)
|
||||||||||||||
|
Enterprise-wide Adjusted EBITDA
|
$
|
281
|
|
|||||||||||||
__________________________________________
|
(1)
|
Our 2011 consolidated results reflect the results of our accounting predecessor, DH, which was our wholly-owned subsidiary until the Merger on September 30, 2012. Therefore, certain results related to Legacy Dynegy are not included in our consolidated results for the year ended December 31, 2011. Additionally, effective September 1, 2011, we completed the DMG Transfer. As a result, the results of our Coal segment, as well as certain items in the Other segment, are not included in our consolidated results for the period from September 1, 2011 through December 31, 2011. However, we have included the Adjusted EBITDA related to Legacy Dynegy for the year ended December 31, 2011 and the Coal segment for the period from September 1, 2011 through December 31, 2011 in this adjustment because management uses enterprise-wide Adjusted EBITDA to evaluate the operating performance of our entire power generation fleet.
|
The following table presents a reconciliation of Legacy Dynegy Adjusted EBITDA to Operating loss:
|
Year Ended December 31, 2011
|
||||||||||||||||
|
(amounts in millions)
|
Coal
|
Gas
|
Other
|
Total
|
||||||||||||
|
Operating loss
|
$
|
(18
|
)
|
$
|
—
|
|
$
|
(40
|
)
|
$
|
(58
|
)
|
||||
|
Depreciation and amortization expense
|
50
|
|
—
|
|
(1
|
)
|
49
|
|
||||||||
|
Other items, net
|
(1
|
)
|
—
|
|
(39
|
)
|
(40
|
)
|
||||||||
|
EBITDA
|
31
|
|
—
|
|
(80
|
)
|
(49
|
)
|
||||||||
|
Restructuring costs and other expenses
|
2
|
|
—
|
|
19
|
|
21
|
|
||||||||
|
Impairment and other charges
|
—
|
|
—
|
|
10
|
|
10
|
|
||||||||
|
Mark-to-market income, net
|
15
|
|
—
|
|
—
|
|
15
|
|
||||||||
|
Adjusted EBITDA from Legacy Dynegy
|
$
|
48
|
|
$
|
—
|
|
$
|
(51
|
)
|
$
|
(3
|
)
|
||||
52
Overview
Our results of operations are impacted by several significant transactions that occurred in 2012 and 2011. In the discussion below, we have included the variances associated with these significant transactions in tables with the following descriptions:
|
•
|
DMG Transfer—
The amounts in the tables add back the results of our Coal segment for the period of time that our Coal segment was not included in the consolidated results due to the DMG Transfer. For 2012, this amount includes the results of operations related to the Coal segment for the period from January 1, 2012 through June 5, 2012. For 2011, this amount includes the results of operations related to the Coal segment for the period from September 1, 2011 through December 31, 2011.
|
|
•
|
DMG Acquisition—
The DMG Acquisition was accounted for as a business combination. Therefore, the acquired assets and liabilities were recorded at their estimated fair values as of the acquisition date. As a result, 2012 results include the amortization of intangible assets and liabilities that did not exist in 2011. In addition, the property, plant and equipment associated with the Coal segment had a significantly lower basis in 2012 as a result of the purchase price allocation. The amounts in the tables below remove the impact of purchase price adjustments included in 2012 results that have no corresponding amounts in 2011 results.
|
|
•
|
Fresh-Start Adjustments—
Upon emergence from bankruptcy on the Plan Effective Date, we applied fresh-start accounting which resulted in adjusting our assets and liabilities to their estimated fair values. As a result, 2012 results include the amortization of intangible assets and liabilities that did not exist in 2011. In addition, our property, plant and equipment had a significantly lower basis in 2012 as a result of the fresh-start adjustments. The amounts in the tables below remove the impact of the fresh-start adjustments included in 2012 results that have no corresponding amounts in 2011 results.
|
We believe providing a reconciliation of the impact of these significant transactions provides the basis for a more meaningful comparison of 2012 results to 2011 results.
Discussion of Consolidated Results of Operations
Revenues.
Revenues
decreased
by
$40 million
from
$1,333 million
for the
year ended
December 31, 2011
to
$1,293 million
for the
year ended
December 31, 2012
. The following table summarizes the impact of significant transactions that contributed to the variance:
|
Combined
|
Predecessor
|
||||||||||||
|
(amounts in millions)
|
2012
|
2011
|
Change
|
||||||||||
|
As reported
|
$
|
1,293
|
|
$
|
1,333
|
|
$
|
(40
|
)
|
||||
|
Plus:
|
|||||||||||||
|
DMG Transfer
|
230
|
|
198
|
|
32
|
|
|||||||
|
Less:
|
|||||||||||||
|
Fresh-start adjustments
|
(23
|
)
|
—
|
|
(23
|
)
|
|||||||
|
Total as adjusted
|
$
|
1,546
|
|
$
|
1,531
|
|
$
|
15
|
|
||||
The
$23 million
included in Fresh-start adjustments relates to the amortization of intangible assets and liabilities associated with certain tolling, energy and capacity agreements related to our power generation facilities. After considering the impact of significant transactions, the increase in revenues was
$15 million
. This increase is primarily due to a change in mark-to-market revenues as a result of net mark-to-market losses in the
year ended
December 31, 2011
compared to mark-to-market gains in the
year ended
December 31, 2012
, as further described in our Discussion of Segment Results of Operations below. Our Gas segment experienced an increase in revenues due to higher volumes generated as most of these plants were more economical to run in 2012 compared to 2011 due to an increase in spark spreads; however this increase was offset by a decrease in revenues related to our Coal segment as a result of lower pricing and lower volumes as further described in our Discussion of Segment Results of Operations below.
53
Cost of Sales.
Cost of sales
increased
by
$64 million
from
$866 million
for the
year ended
December 31, 2011
to
$930 million
for the
year ended
December 31, 2012
. The following table summarizes the impact of significant transactions that contributed to the variance:
|
Combined
|
Predecessor
|
||||||||||||
|
(amounts in millions)
|
2012
|
2011
|
Change
|
||||||||||
|
As reported
|
$
|
(930
|
)
|
$
|
(866
|
)
|
$
|
(64
|
)
|
||||
|
Plus:
|
|||||||||||||
|
DMG Transfer
|
(132
|
)
|
(101
|
)
|
(31
|
)
|
|||||||
|
Less:
|
|||||||||||||
|
DMG Acquisition
|
(49
|
)
|
—
|
|
(49
|
)
|
|||||||
|
Fresh-start adjustments
|
(27
|
)
|
—
|
|
(27
|
)
|
|||||||
|
Total as adjusted
|
$
|
(986
|
)
|
$
|
(967
|
)
|
$
|
(19
|
)
|
||||
The
$49 million
included in DMG Acquisition relates to the amortization of intangible assets and liabilities associated with our rail transportation and coal purchase contracts. The
$27 million
included in Fresh-start adjustments relates to the amortization of intangible assets and liabilities associated with rail transportation, coal purchase, and gas transportation contracts. After considering the impact of significant transactions, the increase in cost of sales was
$19 million
. This increase is primarily due to an increase in natural gas expense due to higher generation volumes in the Gas segment, as further described below.
Operating and Maintenance Expense, Exclusive of Depreciation Shown Separately Below.
Operating and maintenance expense
decreased
by
$25 million
from
$254 million
for the
year ended
December 31, 2011
to
$229 million
for the
year ended
December 31, 2012
. The following table summarizes the impact of significant transactions that contributed to the variance:
|
Combined
|
Predecessor
|
||||||||||||
|
(amounts in millions)
|
2012
|
2011
|
Change
|
||||||||||
|
As reported
|
$
|
(229
|
)
|
|
$
|
(254
|
)
|
$
|
25
|
|
|||
|
Plus:
|
|||||||||||||
|
DMG Transfer
|
(69
|
)
|
(65
|
)
|
(4
|
)
|
|||||||
|
Total as adjusted
|
$
|
(298
|
)
|
$
|
(319
|
)
|
$
|
21
|
|
||||
After considering the impact of significant transactions, the decrease in operating and maintenance expense was
$21 million
, which is primarily due to lower outage costs in 2012 compared to 2011.
Depreciation and Amortization Expense.
Depreciation expense
decreased
by
$140 million
from
$295 million
for the
year ended
December 31, 2011
to
$155 million
for the
year ended
December 31, 2012
. The following table summarizes the impact of significant transactions that contributed to the variance:
|
Combined
|
Predecessor
|
||||||||||||
|
(amounts in millions)
|
2012
|
2011
|
Change
|
||||||||||
|
As reported
|
$
|
(155
|
)
|
$
|
(295
|
)
|
$
|
140
|
|
||||
|
Plus:
|
|||||||||||||
|
DMG Transfer
|
(78
|
)
|
(50
|
)
|
(28
|
)
|
|||||||
|
Less:
|
|||||||||||||
|
DMG Acquisition
|
52
|
|
—
|
|
52
|
|
|||||||
|
Fresh-start adjustments
|
45
|
|
—
|
|
45
|
|
|||||||
|
Total as adjusted
|
$
|
(330
|
)
|
$
|
(345
|
)
|
$
|
15
|
|
||||
The
$52 million
included in DMG Acquisition relates to a lower basis in our power generation facilities as a result of applying purchase accounting. The
$45 million
included in Fresh-start adjustments relates to a lower basis in our power generation facilities as a result of applying fresh-start accounting. After considering the impact of significant transactions, the decrease in depreciation and amortization expense was
$15 million
, which is primarily due to a $16 million reduction in our asset retirement obligations associated with the South Bay facility because South Bay is fully depreciated. The remaining increase related to the timing of various projects being placed into service.
54
General and Administrative Expense.
General and administrative expense
decreased
by
$24 million
from
$102 million
for the
year ended
December 31, 2011
to
$78 million
for the
year ended
December 31, 2012
. The following table summarizes the impact of significant transactions that contributed to the variance:
|
Combined
|
Predecessor
|
||||||||||||
|
(amounts in millions)
|
2012
|
2011
|
Change
|
||||||||||
|
As reported
|
$
|
(78
|
)
|
$
|
(102
|
)
|
$
|
24
|
|
||||
|
Plus:
|
|||||||||||||
|
DMG Transfer
|
(14
|
)
|
(18
|
)
|
4
|
|
|||||||
|
Total as adjusted
|
$
|
(92
|
)
|
$
|
(120
|
)
|
$
|
28
|
|
||||
After considering the impact of significant transactions, the decrease in general and administrative expense was
$28 million
. This decrease is primarily the result of (i) approximately $16 million in lower legal and professional services as a result of restructuring costs being classified within bankruptcy reorganization costs subsequent to our Chapter 11 filing on November 7, 2011, (ii) approximately $6 million lower salaries and benefits due to reduced headcount and (iii) approximately $5 million lower lease expense as a result of relocating our corporate offices.
Bankruptcy Reorganization Items, net.
Bankruptcy reorganization items, net
decreased
by
$1,086 million
from a loss of
$52 million
for the
year ended
December 31, 2011
to a gain of
$1,034 million
for the
year ended
December 31, 2012
. The following table summarizes the impact of significant transactions that contributed to the variance:
|
Combined
|
Predecessor
|
||||||||||||
|
(amounts in millions)
|
2012
|
2011
|
Change
|
||||||||||
|
As reported
|
$
|
1,034
|
|
$
|
(52
|
)
|
$
|
1,086
|
|
||||
|
Less:
|
|||||||||||||
|
Effects of Plan
|
1,197
|
|
—
|
|
1,197
|
|
|||||||
|
Fresh-start adjustments
|
(299
|
)
|
—
|
|
(299
|
)
|
|||||||
|
Total as adjusted
|
$
|
136
|
|
$
|
(52
|
)
|
$
|
188
|
|
||||
The
$1,197 million
included in Effects of Plan is primarily due to the pre-tax gain related to the settlement of liabilities subject to compromise as a result of the implementation of the Plan on the Plan Effective Date. The
$299 million
included in Fresh-start adjustments is primarily due to adjustment of assets and liabilities to fair value as a result of the application of fresh-start accounting. Please read
Note 3—Emergence from Bankruptcy and Fresh-Start Accounting
and
Note 5—Condensed Combined Financial Statements of the Debtor Entities
for further discussion. After considering the impact of significant transactions, the decrease in Bankruptcy reorganization items, net was
$188 million
. The 2012 Bankruptcy reorganization items, net primarily consist of reductions of approximately
$161 million
and
$10 million
in the estimated allowable claims related to the subordinated debt and other items, respectively, in 2012. The change in the estimated allowable claims related to the subordinated debt is a result of the Settlement Agreement. Additionally, we had approximately $52 million in expenses incurred related to our advisors, offset by
$17 million
related to the change in the value of the Administrative Claim. The 2011 Bankruptcy reorganization items, net include $49 million related to the write-off of deferred financing costs and debt discount related to our long-term debt and $3 million related to expenses incurred related to our advisors. Please read
Note 3—Emergence from Bankruptcy and Fresh-Start Accounting
for further discussion.
Interest Expense.
Interest expense
decreased
by
$212 million
from
$348 million
for the
year ended
December 31, 2011
to
$136 million
for the
year ended
December 31, 2012
. The following table summarizes the impact of significant transactions that contributed to the variance:
|
Combined
|
Predecessor
|
||||||||||||
|
(amounts in millions)
|
2012
|
2011
|
Change
|
||||||||||
|
As reported
|
$
|
(136
|
)
|
$
|
(348
|
)
|
$
|
212
|
|
||||
|
Plus:
|
|||||||||||||
|
DMG Transfer
|
(24
|
)
|
(28
|
)
|
4
|
|
|||||||
|
Less:
|
|||||||||||||
|
Fresh-start adjustments
|
43
|
|
—
|
|
43
|
|
|||||||
|
Total
|
$
|
(203
|
)
|
$
|
(376
|
)
|
$
|
173
|
|
||||
55
The
$43 million
included in Fresh-start adjustments relates to amortization of the premium recorded in connection with adjusting our outstanding debt to its fair value on the Plan Effective Date. This amount also includes approximately $16 million related to the accelerated amortization of the premium related to the early repayment of $325 million, in aggregate, of the DPC and DMG credit agreements. Please read
Note 18—Debt
for further discussion. After considering the impact of significant transactions, the decrease in interest expense was
$173 million
, which primarily relates to no longer recording interest on our notes and debentures subsequent to the bankruptcy filing on November 7, 2011, partially offset by a full year of interest on the DPC and DMG Credit Agreements during the year ended December 31, 2012 compared to only five months during the year ended December 31, 2011.
Debt Extinguishment Costs.
Debt extinguishment costs totaled
$21 million
for the
year ended
December 31, 2011
and were incurred in connection with the termination of the Sithe senior debt. There were no such costs incurred during 2012.
Impairment of Undertaking Receivable.
As a result of entering into the Settlement Agreement, the Undertaking receivable was impaired to $418 million as of March 31, 2012, resulting in a charge of approximately
$832 million
. The carrying value of the Undertaking was adjusted to the value received in the DMG Acquisition plus interest payments received subsequent to March 31, 2012. There were no such charges during the
year ended
December 31, 2011
.
Other Income and Expense, net.
Other income and expense, net
increased
by
$4 million
from
$35 million
for the year ended
December 31, 2011
to $
39 million
for the
year ended
December 31, 2012
. The following table summarizes the impact of significant transactions that contributed to the variance:
|
Combined
|
Predecessor
|
||||||||||||
|
(amounts in millions)
|
2012
|
2011
|
Change
|
||||||||||
|
As reported
|
$
|
39
|
|
$
|
35
|
|
$
|
4
|
|
||||
|
Plus:
|
|||||||||||||
|
DMG Transfer
|
—
|
|
(2
|
)
|
2
|
|
|||||||
|
Total as adjusted
|
$
|
39
|
|
$
|
33
|
|
$
|
6
|
|
||||
After considering the impact of significant transactions, the increase in other income and expense, net was
$6 million
. The increase is primarily due to a fair value adjustment of approximately $8 million related to our Warrants. Please read
Note 23—Capital Stock
for further discussion. This increase was partially offset by a decrease in interest income on the Undertaking receivable, affiliate during 2012. The Undertaking was executed on September 1, 2011, impaired as of March 31, 2012 and settled on June 5, 2012; therefore, there is four months of interest income related to the Undertaking during the
year ended
December 31, 2011
compared to three months of interest income related to the Undertaking during the
year ended
December 31, 2012
. The remaining increase is primarily due to a $5 million distribution received related to our retained profits interest in Plum Point.
Income Tax Benefit.
We reported an income tax benefit of
$9 million
for the
year ended
December 31, 2012
, compared to an income tax benefit of
$144 million
for the
year ended
December 31, 2011
. The effective tax rate in 2012 was
113 percent
, compared to
25 percent
in 2011.
For the
year ended
December 31, 2012
, the difference between the effective rate of
113 percent
and the statutory rate of 35 percent resulted primarily from a valuation allowance to eliminate our net deferred tax assets partially offset by the impact of state taxes. As of
December 31, 2012
, we do not believe we will produce sufficient future taxable income, nor are there tax strategies available, to realize our net deferred tax assets not otherwise realized by reversing temporary differences.
For the
year ended
December 31, 2011
, the difference between the effective rates of
25 percent
and the statutory rate of 35 percent is primarily due to the impact of state taxes partially offset by a change in our valuation allowance.
In connection with the DMG Transfer, we recognized a deferred tax asset of approximately $466 million and subsequently recorded a valuation allowance for the full amount. We do not believe we will produce sufficient taxable income, nor are there tax planning strategies available to realize the tax benefit.
Discontinued Operations.
For the
years ended
December 31, 2012 and 2011, our losses from discontinued operations, net of taxes were
$156 million
and
$509 million
, respectively, primarily related to the DNE operations. The decrease in discontinued operations is primarily due to $474 million in lower Bankruptcy reorganization items, net in 2012 compared to 2011. Bankruptcy reorganization items, net in 2012 were
$140 million
and included a
$395 million
charge related to the estimated claim for the rejection of the DNE Facilities Lease and $5 million in other charges, partially offset by a gain of
$217 million
on the settlement of the DNE lease guaranty claim and a
$43 million
gain on the deconsolidation of the DNE Entities. Bankruptcy reorganization items, net in 2011 were
$614 million
and included a charge of
$611 million
related to the
56
estimated claim for the rejection of the DNE Facilities Lease and $3 million in other charges. The remaining decrease in discontinued operations is primarily due to a decrease in the tax benefit of $165 million. We had a tax benefit of $171 million in 2011, however, all our deferred tax assets were fully valued in 2011; therefore, there is no tax benefit in 2012 related to the DNE operations. These decreases were partially offset by $44 million in lower operating losses in 2012 compared to 2011. The lower operating losses in 2012 compared to 2011 are primarily due to no longer accruing lease expense subsequent to rejection of the DNE Facilities Lease.
Enterprise-wide Adjusted EBITDA.
Enterprise-wide Adjusted EBITDA
decreased
by
$224 million
from
$281 million
for the
year ended
December 31, 2011 to
$57 million
for the
year ended
December 31, 2012. The decrease is primarily due to lower overall market prices and an increase in basis differentials in our Coal segment and lower capacity prices in our Gas segment in 2012 compared to 2011; lower revenue in 2012 due to the cancellation of the Morro Bay toll and Moss Landing resource adequacy contract; settlement of legacy option positions; lower generation volumes in the Coal segment due to an increase in planned outages; and lower premiums received in 2012. Offsetting these decreases is an increase in energy margin in our Gas segment due to improved spark spreads, fewer outages in the Gas segment and changes in methodology associated with amortization expense and no longer including DNE in Adjusted EBITDA in 2012 as a result of DNE being classified in discontinued operations. Enterprise-wide Adjusted EBITDA for 2011 includes amortization expense related to the Sithe acquisition and negative Adjusted EBITDA for DNE. These amounts were excluded in 2012.
57
Discussion of Segment Results of Operations
Coal Segment.
Both on-peak and off-peak power prices were lower in the year ended December 31, 2012 compared to the year ended December 31, 2011. The decrease in year over year power pricing was driven by both lower market hub pricing and greater basis differentials. Generation volumes also decreased year over year due to lower volumes generated in the off-peak period and more planned outages.
As discussed above, as a result of the DMG Acquisition, 2012 results only include the results of the Coal segment for the period of June 6, 2012 through December 31, 2012. Additionally, as a result of the DMG Transfer, 2011 results only include the results of the Coal segment for the period from January 1, 2011 through August 31, 2011. The following table provides summary financial data regarding our Coal segment results of operations for the years ended December 31, 2012 and 2011 for the periods that the Coal segment was included in our consolidated financial statements:
|
Successor
|
Predecessor
|
Combined
|
Predecessor
|
|||||||||||||||||||||
|
(dollars in millions)
|
October 2 Through December 31, 2012
|
January 1 Through October 1, 2012
|
Year Ended December 31, 2012
|
Year Ended December 31, 2011
|
Change
|
% Change
|
||||||||||||||||||
|
Revenues:
|
|
|
|
|
|
|
|
|
||||||||||||||||
|
Energy
|
$
|
105
|
|
$
|
184
|
|
$
|
289
|
|
$
|
512
|
|
$
|
(223
|
)
|
(44
|
)%
|
|||||||
|
Capacity
|
—
|
|
4
|
|
4
|
|
8
|
|
(4
|
)
|
(50
|
)%
|
||||||||||||
|
Financial transactions:
|
|
|
||||||||||||||||||||||
|
Mark-to-market loss
|
7
|
|
(14
|
)
|
(7
|
)
|
(76
|
)
|
69
|
|
91
|
%
|
||||||||||||
|
Financial settlements
|
(7
|
)
|
(10
|
)
|
(17
|
)
|
6
|
|
(23
|
)
|
(383
|
)%
|
||||||||||||
|
Option premiums
|
3
|
|
3
|
|
6
|
|
14
|
|
(8
|
)
|
(57
|
)%
|
||||||||||||
|
Total Financial transactions
|
3
|
|
(21
|
)
|
(18
|
)
|
(56
|
)
|
38
|
|
68
|
%
|
||||||||||||
|
Other (1)
|
(1
|
)
|
(1
|
)
|
(2
|
)
|
(4
|
)
|
2
|
|
50
|
%
|
||||||||||||
|
Total revenues
|
107
|
|
166
|
|
273
|
|
460
|
|
(187
|
)
|
(41
|
)%
|
||||||||||||
|
Cost of sales
|
(110
|
)
|
(161
|
)
|
(271
|
)
|
(237
|
)
|
(34
|
)
|
(14
|
)%
|
||||||||||||
|
Gross margin
|
$
|
(3
|
)
|
$
|
5
|
|
$
|
2
|
|
$
|
223
|
|
$
|
(221
|
)
|
(99
|
)%
|
|||||||
|
Million Megawatt Hours Generated (2)
|
4.7
|
|
6.6
|
|
11.3
|
|
15.6
|
|
(4.3
|
)
|
(28
|
)%
|
||||||||||||
|
In Market Availability for Coal Fired Facilities (3)
|
86
|
%
|
93
|
%
|
91
|
%
|
92
|
%
|
|
|
|
|
||||||||||||
|
Average Quoted On-Peak Market Power Prices ($/MWh) (4):
|
|
|
|
|
||||||||||||||||||||
|
Indiana (Indy Hub) (5)
|
$
|
35
|
|
$
|
40
|
|
$
|
38
|
|
$
|
45
|
|
$
|
(7
|
)
|
(16
|
)%
|
|||||||
________________________________________
(1)
Other includes ancillary services and other miscellaneous items.
|
(2)
|
Reflects production volumes in million MWh generated during the periods Coal was included in our consolidated results. Generation volumes were 19.9 million MWh and 22.2 million MWh for the full twelve months ended December 31, 2012 and 2011, respectively.
|
(3)
Reflects the percentage of generation available during periods when market prices are such that these units could be profitably dispatched during the periods Coal was included in our consolidated results. In Market Availability for Coal Fired Facilities was 92 percent for the full twelve months ended December 31, 2012 and 2011.
(4)
Reflects the average of day-ahead quoted prices for the periods Coal was included in our consolidated results and does not necessarily reflect prices we realized. The average of day-ahead quoted prices was $35 and $41 for the full twelve months ended December 31, 2012 and 2011, respectively.
(5) The market reference for 2011 was Cinergy (Cin Hub). At the end of 2011, the Cin Hub pricing point in MISO ceased to exist when the Ohio portion of the market point became part of PJM. Beginning in 2012, Indy Hub became MISO’s major market point and is considered a direct correlation to the old Cin Hub and has been accepted as a replacement for Cin Hub in commercial contracts.
58
Gross margin for Coal
decreased
by
$221 million
from
$223 million
for the year ended
December 31, 2011
, to
$2 million
for the year ended
December 31, 2012
. The following table summarizes the impact of significant transactions that contributed to the variance:
|
Combined
|
Predecessor
|
||||||||||||
|
(amounts in millions)
|
2012
|
2011
|
Change
|
||||||||||
|
As reported
|
$
|
2
|
|
$
|
223
|
|
$
|
(221
|
)
|
||||
|
Plus:
|
|||||||||||||
|
DMG Transfer
|
98
|
|
97
|
|
1
|
|
|||||||
|
Less:
|
|||||||||||||
|
DMG Acquisition
|
(49
|
)
|
—
|
|
(49
|
)
|
|||||||
|
Fresh-start adjustments
|
(28
|
)
|
—
|
|
(28
|
)
|
|||||||
|
Total as adjusted
|
$
|
177
|
|
$
|
320
|
|
$
|
(143
|
)
|
||||
The
$49 million
included in DMG Acquisition relates to the amortization of intangible assets and liabilities associated with our rail transportation and coal purchase contracts during June 5, 2012 through the Plan Effective Date. The
$28 million
included in Fresh-start adjustments relates to the amortization of intangible assets and liabilities associated with rail transportation and coal purchase contracts subsequent to the Plan Effective Date. After considering the impact of significant transactions, the decrease in coal segment gross margin was
$143 million
and is primarily attributable to the following:
|
•
|
Energy revenue decreased by $197 million and the corresponding cost of sales decreased by $14 million, for a total decrease in energy margin of $183 million. The decrease in energy revenue is due to lower market prices, an increase in basis differentials and more planned outages, which led to lower volumes produced. The decrease in cost of sales is due to lower generation volumes caused by higher planned outages and less generation in off peak periods.
|
|
•
|
Settlement revenue decreased by $49 million primarily due to a decrease in settlement revenue associated with power swaps.
|
The above decreases were partially offset by the following:
|
•
|
Mark-to-market revenue increased by $92 million due to a net change in mark-to-market losses of $91 million in the year ended December 31, 2011 to mark-to-market revenues of $1 million in the year ended December 31, 2012.
|
Gas Segment.
Spark-spreads were higher in the year ended December 31, 2012 compared to the year ended December 31, 2011 resulting in higher generation volumes period over period.
The following table provides summary financial data regarding our Gas segment results of operations for the Successor Period, the 2012 Predecessor Period and year ended
December 31, 2011
, respectively:
59
|
Successor
|
Predecessor
|
Combined
|
Predecessor
|
|||||||||||||||||||||
|
|
October 2 Through December 31,
|
January 1 Through October 1,
|
January 1 Through December 31,
|
Year Ended December 31,
|
|
|
||||||||||||||||||
|
(dollars in millions)
|
2012
|
2012
|
2012
|
2011
|
Change
|
% Change
|
||||||||||||||||||
|
Revenues:
|
|
|
|
|
|
|
|
|
|
|
||||||||||||||
|
Energy
|
$
|
118
|
|
$
|
492
|
|
$
|
610
|
|
$
|
489
|
|
$
|
121
|
|
25
|
%
|
|||||||
|
Capacity
|
30
|
|
162
|
|
192
|
|
213
|
|
(21
|
)
|
(10
|
)%
|
||||||||||||
|
RMR
|
2
|
|
5
|
|
7
|
|
6
|
|
1
|
|
17
|
%
|
||||||||||||
|
Tolls
|
11
|
|
79
|
|
90
|
|
131
|
|
(41
|
)
|
(31
|
)%
|
||||||||||||
|
Natural gas
|
48
|
|
100
|
|
148
|
|
193
|
|
(45
|
)
|
(23
|
)%
|
||||||||||||
|
Financial transactions:
|
|
|
|
|
||||||||||||||||||||
|
Mark-to-market income (loss)
|
39
|
|
117
|
|
156
|
|
(61
|
)
|
217
|
|
356
|
%
|
||||||||||||
|
Financial settlements
|
(51
|
)
|
(171
|
)
|
(222
|
)
|
(159
|
)
|
(63
|
)
|
(40
|
)%
|
||||||||||||
|
Option premiums
|
—
|
|
3
|
|
3
|
|
19
|
|
(16
|
)
|
(84
|
)%
|
||||||||||||
|
Total financial transactions
|
(12
|
)
|
(51
|
)
|
(63
|
)
|
(201
|
)
|
138
|
|
69
|
%
|
||||||||||||
|
Other (1)
|
8
|
|
28
|
|
36
|
|
41
|
|
(5
|
)
|
(12
|
)%
|
||||||||||||
|
Total revenues
|
205
|
|
815
|
|
1,020
|
|
872
|
|
148
|
|
17
|
%
|
||||||||||||
|
Cost of sales
|
(158
|
)
|
(501
|
)
|
(659
|
)
|
(629
|
)
|
(30
|
)
|
(5
|
)%
|
||||||||||||
|
Gross margin
|
$
|
47
|
|
$
|
314
|
|
$
|
361
|
|
$
|
243
|
|
$
|
118
|
|
49
|
%
|
|||||||
|
Million Megawatt Hours Generated (2)
|
3.5
|
|
16.9
|
|
20.4
|
|
12.3
|
|
8.1
|
|
66
|
%
|
||||||||||||
|
Average Capacity Factor for Combined Cycle Facilities (3)
|
36
|
%
|
57
|
%
|
52
|
%
|
21
|
%
|
|
|
|
|
||||||||||||
|
Average Market On-Peak Spark Spreads ($/MWh) (4):
|
|
|
|
|
||||||||||||||||||||
|
Commonwealth Edison (NI Hub)
|
$
|
9
|
|
$
|
16
|
|
$
|
14
|
|
$
|
12
|
|
$
|
2
|
|
17
|
%
|
|||||||
|
PJM West
|
$
|
15
|
|
$
|
20
|
|
$
|
19
|
|
$
|
19
|
|
$
|
—
|
|
—
|
%
|
|||||||
|
North of Path 15 (NP 15)
|
$
|
9
|
|
$
|
8
|
|
$
|
8
|
|
$
|
4
|
|
$
|
4
|
|
100
|
%
|
|||||||
|
New York—Zone A
|
$
|
10
|
|
$
|
13
|
|
$
|
13
|
|
$
|
9
|
|
$
|
4
|
|
44
|
%
|
|||||||
|
Mass Hub
|
$
|
23
|
|
$
|
18
|
|
$
|
19
|
|
$
|
18
|
|
$
|
1
|
|
6
|
%
|
|||||||
|
Average Market Off-Peak Spark Spreads ($/MWh) (4):
|
||||||||||||||||||||||||
|
Commonwealth Edison (NI Hub)
|
$
|
(1
|
)
|
$
|
5
|
|
$
|
4
|
|
$
|
(3
|
)
|
$
|
7
|
|
233
|
%
|
|||||||
|
PJM West
|
$
|
6
|
|
$
|
8
|
|
$
|
8
|
|
$
|
5
|
|
$
|
3
|
|
60
|
%
|
|||||||
|
North of Path 15 (NP 15)
|
$
|
1
|
|
$
|
(1
|
)
|
$
|
(1
|
)
|
$
|
(10
|
)
|
$
|
9
|
|
90
|
%
|
|||||||
|
New York—Zone A
|
$
|
2
|
|
$
|
4
|
|
$
|
4
|
|
$
|
2
|
|
$
|
2
|
|
100
|
%
|
|||||||
|
Mass Hub
|
$
|
(3
|
)
|
$
|
7
|
|
$
|
4
|
|
$
|
6
|
|
$
|
(2
|
)
|
(33
|
)%
|
|||||||
|
Average natural gas price—Henry Hub ($/MMBtu) (5)
|
$
|
3.39
|
|
$
|
2.53
|
|
$
|
2.75
|
|
$
|
3.99
|
|
$
|
(1.24
|
)
|
(31
|
)%
|
|||||||
__________________________________________
|
(1)
|
Other includes ancillary services and other miscellaneous items.
|
|
(2)
|
Includes our ownership percentage in the MWh generated by our investment in the Black Mountain power generation facility for the year ended
December 31, 2012 and 2011
, respectively.
|
|
(3)
|
Reflects actual production as a percentage of available capacity.
|
|
(4)
|
Reflects the simple average of the spark spread available to a 7.0 MMBtu/MWh heat rate generator selling power at day-ahead prices and buying delivered natural gas at a daily cash market price and does not reflect spark spreads available to us.
|
|
(5)
|
Reflects the average of daily quoted prices for the periods presented and does not reflect costs incurred by us.
|
60
Gross margin for Gas
increased
by
$118 million
from
$243 million
for the year ended
December 31, 2011
, to
$361 million
for the year ended
December 31, 2012
. The following table summarizes the impact of significant transactions that contributed to the variance:
|
Combined
|
Predecessor
|
||||||||||||
|
(amounts in millions)
|
2012
|
2011
|
Change
|
||||||||||
|
As reported
|
$
|
361
|
|
$
|
243
|
|
$
|
118
|
|
||||
|
Less:
|
|||||||||||||
|
Fresh-start adjustments
|
(22
|
)
|
—
|
|
(22
|
)
|
|||||||
|
Total
|
$
|
383
|
|
$
|
243
|
|
$
|
140
|
|
||||
The
$22 million
included in Fresh-start adjustments relates to the amortization of intangible assets and liabilities associated with certain tolling, energy and capacity agreements and gas transportation contracts related to our power generation facilities. After considering the impact of significant transactions, the increase in gross margin was
$140 million
and is primarily attributable to the following:
|
•
|
Energy revenue and the corresponding cost of sales increased by
$121 million
and
$30 million
, respectively, for a net increase in energy margin of $91 million. Energy revenue and cost of sales increased due to higher volumes generated. Volumes were up due to higher spark spreads at Moss Landing, Independence and Kendall during the year ended December 31, 2012 compared to the year ended December 31, 2011. Volumes were also up due to fewer outage hours at Moss Landing and Casco Bay in 2012 compared to 2011. Both plants experienced significant planned and unplanned outages in 2011 due to required turbine blade repairs. There were no such outages in 2012. Additionally, the increases to both energy revenue and cost of sales caused by higher generation volumes were partially offset by lower power and gas pricing across our fleet.
|
|
•
|
Mark-to-market revenue
increased
by
$217 million
due to a net change in mark-to-market losses of
$61 million
during the year ended December 31, 2011 compared to mark-to-market revenues of
$156 million
during the year ended December 31, 2012. The increase in mark-to-market revenue was primarily driven by the roll off of liability positions.
|
The above increases were partially offset by the following:
|
•
|
Capacity revenue
decreased
by $13 million primarily due to a decrease in capacity pricing in the PJM market, partially offset by the timing of the termination of certain contractual arrangements related to our Gas assets in the West.
|
|
•
|
Tolling revenue
decreased
by $27 million primarily due to the cancellation of the Morro Bay tolling agreement.
|
|
•
|
Gas revenue
decreased
by
$45 million
due to lower volumes sold and lower gas pricing for the year ended December 31, 2012 compared to the year ended December 31, 2011. As we lack gas storage capabilities, all gas purchased must be used in generation or sold back to the market. Higher generation across the gas fleet in 2012 led to less gas available for resale and therefore less gas revenue. The cost of the gas is included in cost of sales.
|
|
•
|
Settlement revenue
decreased
by
$63 million
primarily due to an increase in settlement expense associated with the settlement of gas positions executed in prior periods.
|
•
Premium revenue
decreased
by
$16 million
due to a reduction in the number of options sold.
61
Consolidated Summary Financial Information—Year Ended
December 31, 2011
Compared to Year Ended
December 31, 2010
The following tables provide summary financial data regarding our consolidated and segmented results of operations for the years ended
December 31, 2011 and 2010
, respectively:
|
Predecessor
|
|||||||||||||||
|
|
Years Ended December 31,
|
||||||||||||||
|
(amounts in millions)
|
2011
|
2010
|
Change
|
% Change
|
|||||||||||
|
Revenues
|
$
|
1,333
|
|
$
|
2,059
|
|
$
|
(726
|
)
|
(35
|
)%
|
||||
|
Cost of sales
|
(866
|
)
|
(1,060
|
)
|
194
|
|
18
|
%
|
|||||||
|
Gross margin, exclusive of depreciation shown separately below
|
467
|
|
999
|
|
(532
|
)
|
(53
|
)%
|
|||||||
|
Operating and maintenance expense, exclusive of depreciation shown separately below
|
(254
|
)
|
(330
|
)
|
76
|
|
23
|
%
|
|||||||
|
Depreciation and amortization expense
|
(295
|
)
|
(397
|
)
|
102
|
|
26
|
%
|
|||||||
|
Impairment and other charges
|
(5
|
)
|
(146
|
)
|
141
|
|
97
|
%
|
|||||||
|
General and administrative expense
|
(102
|
)
|
(158
|
)
|
56
|
|
35
|
%
|
|||||||
|
Operating loss
|
(189
|
)
|
(32
|
)
|
(157
|
)
|
(491
|
)%
|
|||||||
|
Bankruptcy reorganization items, net
|
(52
|
)
|
—
|
|
(52
|
)
|
(100
|
)%
|
|||||||
|
Losses from unconsolidated investments
|
—
|
|
(62
|
)
|
62
|
|
100
|
%
|
|||||||
|
Interest expense
|
(348
|
)
|
(363
|
)
|
15
|
|
4
|
%
|
|||||||
|
Debt extinguishment costs
|
(21
|
)
|
—
|
|
(21
|
)
|
(100
|
)%
|
|||||||
|
Other income and expense, net
|
35
|
|
4
|
|
31
|
|
775
|
%
|
|||||||
|
Loss from continuing operations before income taxes
|
(575
|
)
|
(453
|
)
|
(122
|
)
|
(27
|
)%
|
|||||||
|
Income tax benefit
|
144
|
|
194
|
|
(50
|
)
|
(26
|
)%
|
|||||||
|
Loss from continuing operations
|
(431
|
)
|
(259
|
)
|
(172
|
)
|
(66
|
)%
|
|||||||
|
Income (loss) from discontinued operations, net of taxes
|
(509
|
)
|
17
|
|
(526
|
)
|
(3,094
|
)%
|
|||||||
|
Net loss
|
$
|
(940
|
)
|
$
|
(242
|
)
|
$
|
(698
|
)
|
(288
|
)%
|
||||
The following tables provide summary financial data regarding our operating income (loss) by segment for the years ended
December 31, 2011 and 2010
, respectively:
|
Predecessor
|
||||||||||||||||
|
|
Year Ended December 31, 2011
|
|||||||||||||||
|
(amounts in millions)
|
Coal
|
Gas
|
Other
|
Total
|
||||||||||||
|
Revenues
|
$
|
460
|
|
$
|
872
|
|
$
|
1
|
|
$
|
1,333
|
|
||||
|
Cost of sales
|
(237
|
)
|
(629
|
)
|
—
|
|
(866
|
)
|
||||||||
|
Gross margin, exclusive of depreciation shown separately below
|
223
|
|
243
|
|
1
|
|
467
|
|
||||||||
|
Operating and maintenance expense, exclusive of depreciation shown separately below
|
(105
|
)
|
(148
|
)
|
(1
|
)
|
(254
|
)
|
||||||||
|
Depreciation and amortization expense
|
(156
|
)
|
(132
|
)
|
(7
|
)
|
(295
|
)
|
||||||||
|
Impairment and other charges
|
—
|
|
—
|
|
(5
|
)
|
(5
|
)
|
||||||||
|
General and administrative expense
|
—
|
|
—
|
|
(102
|
)
|
(102
|
)
|
||||||||
|
Operating loss
|
$
|
(38
|
)
|
$
|
(37
|
)
|
$
|
(114
|
)
|
$
|
(189
|
)
|
||||
62
|
Predecessor
|
||||||||||||||||
|
|
Year Ended December 31, 2010
|
|||||||||||||||
|
(amounts in millions)
|
Coal
|
Gas
|
Other
|
Total
|
||||||||||||
|
Revenues
|
$
|
837
|
|
$
|
1,223
|
|
$
|
(1
|
)
|
$
|
2,059
|
|
||||
|
Cost of sales
|
(355
|
)
|
(707
|
)
|
2
|
|
(1,060
|
)
|
||||||||
|
Gross margin, exclusive of depreciation shown separately below
|
482
|
|
516
|
|
1
|
|
999
|
|
||||||||
|
Operating and maintenance expense, exclusive of depreciation shown separately below
|
(175
|
)
|
(153
|
)
|
(2
|
)
|
(330
|
)
|
||||||||
|
Depreciation and amortization expense
|
(256
|
)
|
(135
|
)
|
(6
|
)
|
(397
|
)
|
||||||||
|
Impairment and other charges
|
(4
|
)
|
(136
|
)
|
(6
|
)
|
(146
|
)
|
||||||||
|
General and administrative expense
|
—
|
|
—
|
|
(158
|
)
|
(158
|
)
|
||||||||
|
Operating income (loss)
|
$
|
47
|
|
$
|
92
|
|
$
|
(171
|
)
|
$
|
(32
|
)
|
||||
Discussion of Consolidated Results of Operations
Revenues.
Revenues
decreased
by $
726 million
from $
2,059 million
for the year ended
December 31, 2010
to $
1,333 million
for the year ended December 31, 2011. Of this
decrease
, approximately $185 million is due to the DMG Transfer. The remaining
decrease
of $541 million is primarily due to:
|
•
|
Approximately $224 million related to the difference between mark-to-market losses on forward sales of power and other derivatives in 2011, compared to mark-to-market gains in 2010. Such losses totaled $142 million for the year ended
December 31, 2011
, compared to $82 million of mark-to-market gains for the year ended
December 31, 2010
. The mark-to-market losses for the year ended
December 31, 2011
included novation fees of approximately $8 million paid related to changing brokers in connection with the internal reorganization.
|
|
•
|
Approximately $317 million related to lower generated volumes and market prices as well as less revenue from capacity sales, RMR agreements, option premiums and the financial settlement of derivative instruments, as further described in our Discussion of Segment Results of Operations below.
|
Cost of Sales.
Cost of sales
decreased
by $
194 million
from $
1,060 million
for the year ended
December 31, 2010
to $
866 million
for the year ended
December 31, 2011
. Of this
decrease
, approximately $123 million is due to the DMG Transfer. The remaining
decrease
of approximately $71 million is due to lower generated volumes and lower gas and coal prices, as further described in our Discussion of Segment Results of Operations below.
Operating and Maintenance Expense, Exclusive of Depreciation Shown Separately Below.
Operating and maintenance expense
decreased
by $
76 million
from $
330 million
for the year ended
December 31, 2010
to $
254 million
for the year ended
December 31, 2011
. Of this
decrease
, approximately $57 million is due to the DMG Transfer. The remaining
decrease
of approximately $19 million is due to the mothballing and subsequent retirement of the Vermilion facility in 2011, the retirement of the South Bay facility in late 2010 and a curtailment gain due to a change in Dynegy’s post retirement benefit plan in 2011.
Depreciation and Amortization Expense.
Depreciation expense
decreased
by $
102 million
from $
397 million
for the year ended
December 31, 2010
to $
295 million
for the year ended
December 31, 2011
. Of this
decrease
, approximately $117 million is due to the DMG Transfer.
Impairment and Other Charges.
Impairment and other charges for the year ended
December 31, 2011
includes $5 million in restructuring costs. Impairment and other charges for the year ended
December 31, 2010
included a pre-tax asset impairment of $134 million related to our Casco Bay power generation facility and related assets and $12 million related to severance charges for a reduction in workforce and the closure of our Vermilion and South Bay facilities. Please read
Note 7—Impairment and Restructuring Charges
for further discussion.
General and Administrative Expense.
General and administrative expense
decreased
$
56 million
from $
158 million
for the year ended
December 31, 2010
to $
102 million
for the year ended
December 31, 2011
. Of this
decrease
, approximately $18 million is due to the DMG Transfer. The remaining
decrease
of approximately $38 million was primarily driven by lower salary and benefits costs as a result of ongoing cost savings initiatives, and a reduction in the value of cash-settled stock-based compensation instruments partially offset by $5 million of severance costs and $10 million of restructuring costs in 2011.
Bankruptcy reorganization items, net.
Bankruptcy reorganization items, net for the year ended
December 31, 2011
were $
52 million
. These charges primarily consisted of the write-off of deferred financing costs related to our unsecured notes
63
and debentures and costs related to bankruptcy advisors. We did not have any similar charges during the year ended December 31, 2010 as the Chapter 11 Cases commenced on November 7, 2011.
Losses from Unconsolidated Investments.
Losses from unconsolidated investments for the year ended
December 31, 2010
were $
62 million
related to our former investment in PPEA Holding. The losses consisted of $28 million related to the loss on sale of PPEA Holding, sold in the fourth quarter of 2010, and an impairment charge of approximately $37 million partially offset by $3 million in equity earnings primarily related to mark-to-market gains on interest rate swaps offset by financing expenses. Our investment in PPEA Holding was fully impaired at March 31, 2010 due to the uncertainty regarding PPEA’s financing structure. Please read
Note 15—Variable Interest Entities
—PPEA Holding Company LLC for further discussion.
Interest Expense.
Interest expense totaled $
348 million
and $
363 million
for the years ended
December 31, 2011 and 2010
, respectively. Interest expense decreased because we ceased accruing interest on our unsecured notes and debentures as a result of the commencement of the Chapter 11 Cases on November 7, 2011. This decrease was partially offset by an increase in interest expense due to higher borrowings and rates under the DMG Credit Agreement (through September 1, 2011) and the DPC Credit Agreement compared to our prior Fifth Amended and Restated Credit Agreement.
Debt Extinguishment Costs.
Debt extinguishment costs totaled $
21 million
for the year ended
December 31, 2011
and were incurred in connection with the termination of the Sithe senior debt. Please read
Note 18—Debt
—Sithe Senior Notes for further discussion.
Other income and expense, net.
Other income and expense, net increased to $
35 million
of income for the year ended
December 31, 2011
from income of $
4 million
for the year ended
December 31, 2010
. The increase is due to interest income on the Undertaking receivable, affiliate. Please read
Note 19—Related Party Transactions
—DMG Transfer and Undertaking Agreement for further discussion.
Income Tax Benefit.
We reported an income tax benefit from continuing operations of $
144 million
for the year ended
December 31, 2011
, compared to an income tax benefit from continuing operations of $
194 million
for the year ended
December 31, 2010
. The effective tax rate in 2011 was
25 percent
, compared to
43 percent
in 2010.
For the year ended
December 31, 2011
, the difference between the effective rate of
25 percent
and the statutory rate of 35 percent is primarily due to the impact of state taxes partially offset by a change in our valuation allowance. For the year ended
December 31, 2010
, the difference between the effective rate of
43 percent
and the statutory rate of 35 percent resulted primarily from a benefit of $18 million related to the release of reserves for uncertain tax positions, partially offset by the impact of state taxes.
In connection with the DMG Transfer, we recognized a deferred tax asset of approximately $466 million and subsequently recorded a valuation allowance for the full amount. We do not believe we will produce sufficient taxable income, nor are there tax planning strategies available to realize the tax benefit.
Discontinued Operations.
For the years ended December 31, 2011 and 2010, our losses from discontinued operations, net of taxes were
$509 million
and
$17 million
, respectively, primarily related to the DNE operations. The increase in the loss was primarily due to $614 million of Bankruptcy reorganization items, net and a $65 million operating loss for the year ended December 31, 2011 compared to no Bankruptcy reorganization items, net and operating income of $26 million for the year ended December 31, 2010. The Bankruptcy reorganization items, net of $614 million during the
year ended
December 31, 2011 included approximately $611 million related to the estimated claim for the rejection of the DNE Facilities Lease. The remaining Bankruptcy reorganization items, net primarily relate to payments to service providers. The decrease in operating income was primarily due to lower gross margin due to mark-to-market losses and lower pricing and volumes. These decreases were partially offset by a $181 million increase in the tax benefit.
64
Discussion of Segment Results of Operations
Coal Segment.
Effective September 1, 2011, we completed the DMG Transfer. Therefore, the results of the Coal segment (including DMG) were only included in our consolidated results of operations through August 31, 2011. Power prices were slightly lower in 2011 compared to 2010. On-peak prices were lower in 2011 compared to 2010, which was partially offset by higher off-peak prices in 2011 compared to 2010.
The following table provides summary financial data regarding our Coal segment results of operations for the years ended
December 31, 2011 and 2010
, respectively:
|
Predecessor
|
|||||||||||||||
|
|
Year Ended December 31,
|
||||||||||||||
|
(dollars in millions)
|
2011
|
2010
|
Change
|
% Change
|
|||||||||||
|
Revenues:
|
|
|
|
|
|||||||||||
|
Energy
|
$
|
512
|
|
$
|
699
|
|
$
|
(187
|
)
|
(27
|
)%
|
||||
|
Capacity
|
8
|
|
17
|
|
(9
|
)
|
(53
|
)%
|
|||||||
|
Financial transactions:
|
|
|
|||||||||||||
|
Mark-to-market income (loss)
|
(76
|
)
|
21
|
|
(97
|
)
|
(462
|
)%
|
|||||||
|
Financial settlements
|
6
|
|
97
|
|
(91
|
)
|
(94
|
)%
|
|||||||
|
Option premiums
|
14
|
|
7
|
|
7
|
|
100
|
%
|
|||||||
|
Total financial transactions
|
(56
|
)
|
125
|
|
(181
|
)
|
(145
|
)%
|
|||||||
|
Other (1)
|
(4
|
)
|
(4
|
)
|
—
|
|
—
|
%
|
|||||||
|
Total revenues
|
460
|
|
837
|
|
(377
|
)
|
(45
|
)%
|
|||||||
|
Cost of sales
|
(237
|
)
|
(355
|
)
|
118
|
|
33
|
%
|
|||||||
|
Gross margin
|
$
|
223
|
|
$
|
482
|
|
$
|
(259
|
)
|
(54
|
)%
|
||||
|
Million Megawatt Hours Generated (2)
|
15.6
|
|
22.3
|
|
(6.7
|
)
|
(30
|
)%
|
|||||||
|
In Market Availability for Coal Fired Facilities (3)
|
92
|
%
|
91
|
%
|
|
|
|
|
|||||||
|
Average Quoted On-Peak Market Power Prices ($/MWh) (4):
|
|
|
|
||||||||||||
|
Cinergy (Cin Hub)
|
$
|
45
|
|
$
|
42
|
|
$
|
3
|
|
7
|
%
|
||||
__________________________________________
(1)
Other includes ancillary services and other miscellaneous items.
|
(2)
|
Reflects production volumes in million MWh generated during the periods Coal was included in our consolidated results. Generation volumes were 22.2 million MWh for the full twelve months ended December 31, 2011.
|
(3)
Reflects the percentage of generation available during periods when market prices are such that these units could be profitably dispatched during the periods Coal was included in our consolidated results. In Market Availability for Coal Fired Facilities was 92 percent for the full twelve months ended December 31, 2011.
(4)
Reflects the average of day-ahead quoted prices for the periods Coal was included in our consolidated results and does not necessarily reflect prices we realized. The average of day-ahead quoted prices were $41 for the full twelve months ended December 31, 2011.
Gross margin from the Coal segment
decreased
by $
259 million
from $
482 million
for the year ended
December 31, 2010
, to $
223 million
for the year ended
December 31, 2011
. Approximately $62 million of this decrease is the result of the DMG Transfer. The remaining decrease of $197 million was driven by the following:
|
•
|
Capacity revenue decreased by $7 million due to lower capacity prices in the MISO capacity market in 2011 compared to 2010.
|
|
•
|
Mark-to-market revenue decreased by $181 million due to a net change from mark-to-market revenue from $105 million in 2010 to a mark-to-market loss of $76 million in 2011.
|
|
•
|
Settlements revenue decreased by $26 million due to fewer volumes hedged in 2011 compared to 2010. Settlements revenue also decreased due to the average value of our hedging positions being lower in 2011 compared to 2010.
|
The above decreases were partially offset by an increase in energy revenue and the corresponding cost of sales by $14 million and $4 million, respectively, for a net increase in energy margin of $10 million. These increases were due to higher
65
generation volumes. Generation volumes increased at Baldwin due to fewer outages in 2011 compared to 2010. In early 2010, Baldwin experienced a three month outage that reduced burns for 2010. While Baldwin did experience outages in 2011, they were not as significant as those in 2010.
Gas Segment.
Spark-spreads in the Northeast were somewhat mixed in 2011 with improved spark-spreads in the first quarter offset by lower spark-spreads in the third quarter. Additionally, net generated volumes were lower at Casco Bay in 2011 compared to 2010 due to planned and unplanned outages. In PJM, net generated volumes were higher driven primarily by positive off-peak spark-spreads at Ontelaunee.
For the California facilities, spark-spreads were down in 2011 as compared to 2010. Robust snowpack in the Northwest United States and California led to strong hydro production; the Northwest United States recorded the second greatest hydro production since 1993. This coupled with a very mild summer, led to historical low spark-spreads. Generated volumes were down significantly due to competition with hydro generation as well as an unplanned outage.
The following table provides summary financial data regarding our Gas segment results of operations for the years ended
December 31, 2011 and 2010
, respectively:
|
Predecessor
|
|||||||||||||||
|
|
Year Ended December 31,
|
||||||||||||||
|
(dollars in millions)
|
2011
|
2010
|
Change
|
% Change
|
|||||||||||
|
Revenues:
|
|
|
|
|
|||||||||||
|
Energy
|
$
|
489
|
|
$
|
619
|
|
$
|
(130
|
)
|
(21
|
)%
|
||||
|
Capacity
|
213
|
|
231
|
|
(18
|
)
|
(8
|
)%
|
|||||||
|
RMR
|
6
|
|
45
|
|
(39
|
)
|
(87
|
)%
|
|||||||
|
Tolls
|
131
|
|
137
|
|
(6
|
)
|
(4
|
)%
|
|||||||
|
Natural gas
|
193
|
|
169
|
|
24
|
|
14
|
%
|
|||||||
|
Financial transactions:
|
|
|
|||||||||||||
|
Mark-to-market losses
|
(61
|
)
|
(11
|
)
|
(50
|
)
|
(455
|
)%
|
|||||||
|
Financial settlements
|
(159
|
)
|
(117
|
)
|
(42
|
)
|
(36
|
)%
|
|||||||
|
Option premiums
|
19
|
|
127
|
|
(108
|
)
|
(85
|
)%
|
|||||||
|
Total financial transactions
|
(201
|
)
|
(1
|
)
|
(200
|
)
|
(20,000
|
)%
|
|||||||
|
Other (1)
|
41
|
|
23
|
|
18
|
|
78
|
%
|
|||||||
|
Total revenues
|
872
|
|
1,223
|
|
(351
|
)
|
(29
|
)%
|
|||||||
|
Cost of sales
|
(629
|
)
|
(707
|
)
|
78
|
|
11
|
%
|
|||||||
|
Gross margin
|
$
|
243
|
|
$
|
516
|
|
$
|
(273
|
)
|
(53
|
)%
|
||||
|
Million Megawatt Hours Generated (2)
|
12.3
|
|
14.2
|
|
(1.9
|
)
|
(13
|
)%
|
|||||||
|
Average Capacity Factor for Combined Cycle Facilities (3)
|
21
|
%
|
31
|
%
|
|
|
|
|
|||||||
|
Average Market Spark Spreads ($/MWh) (4):
|
|
|
|
|
|||||||||||
|
Commonwealth Edison (NI Hub)
|
$
|
12
|
|
$
|
10
|
|
$
|
2
|
|
20
|
%
|
||||
|
PJM West
|
$
|
19
|
|
$
|
19
|
|
$
|
—
|
|
—
|
%
|
||||
|
North of Path 15 (NP 15)
|
$
|
4
|
|
$
|
6
|
|
$
|
(2
|
)
|
(33
|
)%
|
||||
|
New York—Zone A
|
$
|
9
|
|
$
|
9
|
|
$
|
—
|
|
—
|
%
|
||||
|
Mass Hub
|
$
|
18
|
|
$
|
18
|
|
$
|
—
|
|
—
|
%
|
||||
|
Average Market Off-Peak Spark Spreads ($/MWh) (4):
|
|||||||||||||||
|
Commonwealth Edison (NI Hub)
|
$
|
(3
|
)
|
$
|
(5
|
)
|
$
|
2
|
|
40
|
%
|
||||
|
PJM West
|
$
|
5
|
|
$
|
4
|
|
$
|
1
|
|
25
|
%
|
||||
|
North of Path 15 (NP 15)
|
$
|
(10
|
)
|
$
|
(1
|
)
|
$
|
(9
|
)
|
(900
|
)%
|
||||
|
New York—Zone A
|
$
|
2
|
|
$
|
2
|
|
$
|
—
|
|
—
|
%
|
||||
|
Mass Hub
|
$
|
6
|
|
$
|
4
|
|
$
|
2
|
|
50
|
%
|
||||
|
Average natural gas price—Henry Hub ($/MMBtu) (5)
|
$
|
3.99
|
|
$
|
4.38
|
|
$
|
(0.39
|
)
|
(9
|
)%
|
||||
66
__________________________________________
|
(1)
|
Other includes ancillary services and other miscellaneous items.
|
|
(2)
|
Includes hours generated for the full year 2011 and 2010 and also includes our ownership percentage in the MWh generated by our investment in the Black Mountain power generation facility.
|
|
(3)
|
Reflects actual production as a percentage of available capacity.
|
|
(4)
|
Reflects the simple average of the spark spread available to a 7.0 MMBtu/MWh heat rate generator or an 11.0 MMBtu/MWh heat rate fuel oil-fired generator selling power at day-ahead prices and buying delivered natural gas or fuel oil at a daily cash market price and does not reflect spark spreads available to us.
|
|
(5)
|
Reflects the average of daily quoted prices for the periods presented and does not reflect costs incurred by us.
|
Gross margin for the Gas segment
decreased
by $
273 million
from $
516 million
for the year ended
December 31, 2010
, to $
243 million
for the year ended
December 31, 2011
. This decrease was driven by the following:
|
•
|
Energy revenue and the corresponding cost of sales
decreased
by $
130 million
and $
78 million
, respectively, for a net
decrease
in energy margin of $
52 million
. Energy revenue and cost of sales
decreased
due to lower market pricing across the region and lower volumes generated. Volumes were down due to lower spark spreads at Moss Landing and Casco Bay in 2011 compared to 2010. Volumes were also down due to more outages at Moss Landing and Casco Bay in 2011 compared to 2010. Both plants experienced significant outages in 2011 due to required turbine blade repairs. These decreases were partially offset by increases in volumes at Kendall and Ontelaunee which both saw an increase in generation volumes due to fewer outages and derates in 2011 compared to 2010 as well as improved spark spreads in 2011.
|
|
•
|
Capacity revenue
decreased
by $
18 million
due to lower capacity prices in the NYISO, PJM and Mass Hub markets in 2011 compared to 2010. Capacity prices have decreased significantly year over year due to excess capacity in the market.
|
|
•
|
RMR revenue
decreased
by $
39 million
due to the expiration of the South Bay RMR agreement. The CAISO elected not to renew the agreement for 2011 and the facility was permanently retired on
December 31, 2010
.
|
|
•
|
Tolling revenue
decreased
by $
6 million
due to the termination of the Kendall Constellation toll in 2010. In connection with the termination of the Kendall toll in 2010, we received a termination payment which was not repeated in 2011. The decrease from the 2010 cancellation payment was partially offset by higher revenues from the Moss Landing toll which was renewed with higher rates for 2011.
|
|
•
|
Mark-to-market revenue
decreased
by $
50 million
due to a net change in mark-to-market losses from $
11 million
in 2010 compared to $
61 million
in 2011.
|
|
•
|
Premium revenue
decreased
by $
108 million
due to fewer options sold and fewer premiums collected in 2011 compared to 2010 due to a decline in price volatilities. Market volatilities have been in decline for the past two years, reducing the value of options on a unit basis and diminishing the revenue opportunities from their sale. Additionally, fewer option sales have resulted from our strategy of leaving more of our portfolio open to a market recovery expected over the next few years while we opportunistically hedge short-term cash flows.
|
The above decreases were partially offset by the following increases:
|
•
|
Natural gas revenue
increased
by $
24 million
due to an increase in volumes sold in 2011 compared to 2010. The increase in volumes sold is due to lower 2011 power generation primarily at Independence. The decrease in power generation made more gas available to be sold back to the market as it was not required for production.
|
|
•
|
Other revenue
increased
by $
18 million
primarily due to an increase in ancillary pricing in the PJM market and increased 2011 off-peak generation at Ontelaunee which provided the opportunity to supply more ancillary services.
|
Outlook
We expect that our future financial results will continue to change based upon fuel and commodity prices, especially gas prices and the impact of shale gas production on such prices. Other factors to which our future financial results will remain sensitive include market structure and prices for electric energy, capacity and ancillary services, including pricing at our plant locations relative to pricing at their respective trading hubs, the volatility of fuel and electricity prices, transportation and transmission logistics, weather conditions, the outcome of certain contractual disputes and IMA. Further, there is a trend toward greater environmental regulation of all aspects of our business. As this trend continues, it is possible that we will experience additional costs associated with the handling and disposal of coal ash, how water used by our power generation facilities is withdrawn and treated before being discharged or more stringent air emission standards.
67
Our future financial results will also be impacted by changes to our capital structure. During 2013, we will seek opportunities to improve the efficiency of our capital structure, which may include refinancing our existing credit agreements.
Coal.
The Coal segment consists of four plants, all located in the MISO region, and totaling
2,980
MW.
Our expected coal requirements are 93 percent contracted and priced in 2013. Our forecasted coal requirements for 2014 are 49 percent contracted and will be priced subject to a price collar structure. Our coal transportation requirements are 100 percent contracted and priced through 2013 when our current contracts expire. In August 2012, we executed new coal transportation contracts which take effect when our current contracts expire. These new long-term contracts also cover 100 percent of our coal transportation requirements. We continue to explore various alternative contractual commitments and financial options, as well as facility modifications, to ensure stable and competitive fuel supplies and to mitigate further supply risks for near- and long-term coal supplies.
We have initiated various studies of the MISO transmission grid to identify opportunities to reduce congestion and improve the busbar power prices at our coal fired facilities. During 2013, we will seek opportunities to invest in upgrades to the MISO grid infrastructure to improve our realized energy prices.
Our Coal expected generation volumes are 72 percent hedged volumetrically for 2013 and approximately 16 percent hedged volumetrically for 2014.
We plan to continue our hedging program for Coal over a one- to two-year period using various instruments. Beyond 2013, the portfolio is largely open, positioning Coal to benefit from possible future power market pricing improvements.
The MISO filed proposed Resource Adequacy Enhancements with FERC on July 20, 2011. FERC conditionally approved MISO’s proposal on June 11, 2012, leaving much of MISO’s proposal in place. The proposed tariff revisions require capacity to be procured on a zonal basis for a full planning year (June 1 - May 31) versus the current monthly requirement, with procurement occurring two months ahead of the planning year. The new construct will be in place for the 2013-2014 planning year. While the new construct is an incremental improvement over the status quo, it is unlikely to have an influence on capacity prices in the near future due to excess capacity in the MISO market. In addition, increased market participation by demand response resources offset by potential retirement of marginal MISO coal capacity due to poor economics or expected environmental mandates could also affect MISO capacity and energy market prices in the future.
Further, in the coming months we will be in negotiations with the union regarding its collective bargaining agreement, which is set to expire on June 30, 2013.
In the second quarter of 2013, we plan to file an application with the Illinois Commerce Commission to become a retail energy supplier for non-residential customers with maximum demands of one megawatt or more. It is our intention to pursue sales to large commercial and industrial customers located in the Ameren Illinois load zone in MISO. The effort to secure retail sales will begin in the third quarter 2013.
Gas.
The Gas segment consists of eight plants, geographically diverse in five markets, totaling
6,771
MW. Approximately 50 percent of our power plant capacity in the CAISO market is contracted through 2013 under tolling agreements with load-serving entities and an RMR agreement. A significant portion of the remaining capacity is sold as a resource adequacy product in the CAISO market.
The CAISO capacity market is bilateral in nature. The load-serving entities are required to procure sufficient resources for their peak load plus a fifteen percent reserve margin. The CAISO footprint currently has a capacity surplus due to a weak economy and increased participation from renewable resources. The CAISO faces challenges to ensure system reliability as well as adequate ancillary services in the future with the mandate to have 33 percent renewable resources by 2020. The combination of bilateral markets, one-off utility procurements, and short-term requirements make this a larger concern than in other markets where multi-year forward requirements and more transparent markets are in place.
In May 2012, SCE notified Morro Bay and Moss Landing that it was terminating certain energy and capacity contracts with those entities. We are disputing the validity of the purported terminations and subsequent actions by SCE. Such terminations will likely impact the timing and amount of cash flows going forward. We are actively seeking other commercial arrangements for the facilities and have been offering output in the day-ahead market administered by the CAISO since May 19, 2012. We will continue to respond to the RFO process of California utilities seeking to procure electric capacity needed to serve their customers. While we have been successful in winning contracts through this RFO process in the past, we believe that a more forward-looking, transparent, market-based solution to securing electric supply would benefit consumers, utilities and independent generators within the CAISO footprint.
The South Bay power generation facility has been permanently retired and is currently in the process of being demolished. We have a contractual obligation to demolish the facility and potentially remediate specific parcels of the
68
property. Our estimates for the demolition and any potential remediation costs will likely change as the project advances through the next phase of the demolition process. We currently expect the escrow funds to cover costs through at least 2013.
The estimated useful lives of our generation facilities consider environmental regulations currently in place. With respect to Units 6 and 7 at our Moss Landing facility, we are continuing to review the potential impact of the California Water Intake Policy. We are currently depreciating these units through 2024; however, depending on the ultimate impact of the California Water Intake Policy, we may determine that we would be required to install cooling systems that could render operation of the units uneconomical. If such a determination were to be made, we could decide to reduce operations or cease to operate the units as early as December 31, 2017.
In New England, seven forward capacity auctions have been held since the ISO-NE transitioned to a forward capacity market in June 2010. Capacity clearing prices have ranged from a high of $4.50 per kW-month for the 2010-2011 market period to a low of $2.95 per kW-month for the 2013-2014 market period. The most recent capacity auction, for 2016-2017, cleared at the floor price of $3.15 per kW-month. The annual auctions continue to clear at the designated floor due to oversupply conditions. Efforts to implement prospective improvements in the forward capacity market design are currently underway, which include migration to a demand curve and/or removal of the auction floor for Forward Capacity Auction #8 and beyond. We anticipate changes will impact the Forward Capacity Auction #8, which is the auction period from June 2017 to May 2018.
In PJM, where the Kendall and Ontelaunee combined-cycle plants are located, nine forward capacity auctions (known as RPM or Reliability Pricing Model) have been held since the transition from a daily capacity market in June 2007. RPM clearing prices have ranged from $0.50 per kW-month (Kendall, 2012-13 Planning Year) and $1.24 per kW-month (Ontelaunee, 2007-8 Planning Year) to $5.30 per kW-month (Kendall, 2010-11 Planning Year) and $6.88 per kW-month (Ontelaunee, 2013-14 Planning Year). The latest RPM auction was for the 2015-16 Planning Year, which cleared at $4.14 per kW-month (Kendall) and $5.09 per kW-month (Ontelaunee).
Capacity pricing for the NYISO seems to be recovering from the low point in 2011. The most recent summer and winter auctions have cleared higher than the previous auctions with summer 2012 at $1.25 per kW-month and winter 2012-2013 at $0.82 per kW-month. The next auction for summer 2013 is trading in the bi-lateral market at approximately $4.25 per kW-month. We attribute the rebound in part due to the recent favorable FERC Order ruling on buyer-side mitigation and retirements impacting 2013. Approximately 70 percent of the capacity revenue for our Independence facility has been contracted at a favorable premium compared to current market prices through October 31, 2014.
Excluding volumes subject to tolling agreements, our Gas portfolio is currently 78 percent hedged volumetrically through 2013 and approximately 15 percent hedged volumetrically for 2014.
We plan to continue our hedging program for Gas over a one- to two-year period using various forward sale instruments. Beyond 2013, the portfolio is largely open, positioning Gas to benefit from possible future power market pricing improvements.
SEASONALITY
Our revenues and operating income are subject to fluctuations during the year, primarily due to the impact seasonal factors have on sales volumes and the prices of power and natural gas. Power marketing operations and generating facilities have higher volatility and demand, respectively, in the summer cooling months. This trend may change over time as demand for natural gas increases in the summer months as a result of increased natural gas-fired electricity generation. Further, to the extent that climate change may affect weather patterns, this could result in more extreme weather patterns which could impact demand for our products.
CRITICAL ACCOUNTING POLICIES
Our Accounting Department is responsible for the development and application of accounting policy and control procedures. This department conducts these activities independent of any active management of our risk exposures, is independent of our business segments and reports to the Chief Financial Officer.
The process of preparing financial statements in accordance with GAAP requires our management to make estimates and judgments. It is possible that materially different amounts could be recorded if these estimates and judgments change or if actual results differ from these estimates and judgments. We have identified the following critical accounting policies that require a significant amount of estimation and judgment and are considered important to the portrayal of our financial position and results of operations:
69
|
•
|
Fresh-Start Accounting;
|
|
•
|
Revenue Recognition and Derivative Instruments;
|
|
•
|
Fair Value Measurements;
|
|
•
|
Estimated Useful Lives;
|
|
•
|
Impairment of Long-Lived Assets and Unconsolidated Investments;
|
|
•
|
Accounting for Contingencies, Guarantees and Indemnifications;
|
|
•
|
Accounting for Variable Interest Entities;
|
|
•
|
Accounting for Income Taxes; and
|
|
•
|
Valuation of Pension and Other Post-Retirement Plans Assets and Liabilities.
|
Fresh-Start Accounting
On the Plan Effective Date, we applied fresh-start accounting in accordance with guidance under the applicable reorganization accounting rules. These rules require that we allocate the reorganization value of the Successor to its assets and liabilities based upon their estimated fair values determined in conformity with the guidance for the acquisition method of accounting for business combinations.
When allocating the reorganization equity value to our property, plant and equipment, we used a DCF analysis based upon a debt-free, free cash flow model. This DCF model was created for each power generation facility based on its remaining useful life. The DCF included gross margin forecasts for each power generation facility determined using forward commodity market prices for the prompt three to five years, management’s forecast of operating and maintenance expenses and capital expenditures. For periods beyond the forecast period, we assumed a 2.5 percent growth rate. The resulting cash flows were then discounted using a range of discount rates of 10 percent to 11 percent based on the characteristics of the power generation facility.
Contracts with terms that are not at current market value were also valued using a DCF analysis. The cash flows generated by the contracts were compared with current market prices with the resulting difference recorded as an intangible asset or liability.
We recorded the fair value of some assets and liabilities at cost, which was an appropriate measure of fair value (i.e. cash, restricted cash, accounts payable). Other assets and liabilities were adjusted to fair value based on then-current market prices (i.e. inventory). The fair value of our outstanding long-term debt was fair valued based upon the trading price of the debt on the Plan Effective Date.
There is a significant amount of judgment in determining the reorganization value and in allocating value to individual assets and liabilities. Had different assumptions been used, our reorganization value could have been significantly higher or lower, which could have resulted in goodwill or a reduction in our asset values.
Revenue Recognition and Derivative Instruments
We earn revenue from our facilities in three primary ways: (i) the sale of energy, including fuel, through both physical and financial transactions; (ii) sale of capacity; and (iii) sale of ancillary services, which are the products of a generation facility that support the transmission grid operation, allow generation to follow real-time changes in load, and provide emergency reserves for major changes to the balance of generation and load. We recognize revenue from these transactions when the product or service is delivered to a customer, unless they meet the definition of a derivative. Please read “Derivative Instruments—Generation” below for further discussion of the accounting for these types of transactions.
Derivative Instruments—Generation.
We enter into commodity contracts that meet the definition of a derivative. These contracts are often entered into to mitigate or eliminate market and financial risks associated with our generation business. These contracts include power sales contracts, fuel purchase contracts, options, swaps, and other instruments used to mitigate variability in earnings due to fluctuations in market prices. There are three different ways to account for these types of contracts: (i) as an accrual contract, if the criteria for the “normal purchase, normal sale” exception are met and documented; (ii) as a cash flow or fair value hedge, if the criteria are met and documented; or (iii) as a mark-to-market contract with changes in fair value recognized in current period earnings. All derivative commodity contracts that do not qualify for the “normal purchase, normal sale” exception are recorded at fair value in risk management assets and liabilities on the consolidated balance sheets with the associated changes in fair value recorded currently in earnings. Dynegy does not elect hedge accounting for any of its derivative instruments.
Entities may choose whether or not to offset related assets and liabilities and report the net amounts on their consolidated balance sheet if the right of offset exists. We execute a significant volume of transactions through futures clearing
70
managers. Our daily cash payments to or receipts from our futures clearing managers consist of three parts: (i) fair value of open positions (exclusive of options) (“Daily Cash Settlements”); (ii) initial margin requirements related to open positions (exclusive of options) (“Initial Margin”); and (iii) fair value of options (“Options,” and collectively with Daily Cash Settlements and Initial Margin, “Collateral”). Prior to the application of fresh-start accounting, we elected not to offset fair value amounts recognized for derivative instruments executed with the same counterparty under a master netting agreement and we elected not to offset the fair value of amounts recognized for the Daily Cash Settlements paid or received against the fair value of amounts recognized for derivative instruments executed with the same counterparty under a master netting agreement. As a result, our consolidated balance sheets for periods prior to October 1, 2012 present derivative assets and liabilities, as well as the related cash collateral paid or received, on a gross basis. In connection with the application of fresh-start accounting, we elected to offset fair value amounts recognized for derivative instruments executed with the same counterparty under a master netting agreement and we elected to offset the fair value of amounts recognized for the Daily Cash Settlements paid or received against the fair value of amounts recognized for derivative instruments executed with the same counterparty under a master netting agreement. As a result, our consolidated balance sheets subsequent to October 1, 2012, present derivative assets and liabilities, as well as the related cash collateral paid or received, on a net basis.
Derivative Instruments—Financing Activities.
We are exposed to changes in interest rate risk through our variable rate debt. In order to manage our interest rate risk, we enter into interest rate swap and cap agreements that meet the definition of a derivative. All derivative instruments are recorded at their fair value on the consolidated balance sheet with the changes in fair value recorded to interest expense. Our interest-based derivative instruments are not designated as hedges of our variable debt.
Fair Value Measurements
Fair Value Measurements—General.
Accounting standards define fair value as the price that would be received to sell an asset or paid to transfer a liability in an orderly transaction between market participants. In estimating fair value, we use discounted cash-flow projections, recent comparable market transactions, if available, or quoted prices. We consider assumptions that third parties would make in estimating fair value, including the highest and best use of the asset. There is a significant amount of judgment involved in cash-flow estimates, including assumptions regarding market convergence, discount rates and capacity prices. The assumptions used by another party could differ significantly from our assumptions.
We utilize a mid-market pricing convention (the mid-point price between bid and ask prices) as a practical expedient for valuing the majority of our assets and liabilities measured and reported at fair value on a recurring basis. Where appropriate, valuation adjustments are made to account for various factors, including the impact of our credit risk, our counterparties’ credit risk and bid-ask spreads. We utilize market data or assumptions that market participants would use in pricing the asset or liability, including assumptions about risk and the risks inherent in the inputs to the valuation technique. These inputs are classified as readily observable, market corroborated, or generally unobservable. We primarily apply the market approach for recurring fair value measurements and endeavor to utilize the best available information. Accordingly, we utilize valuation techniques that maximize the use of observable inputs and minimize the use of unobservable inputs. We classify fair value balances based on the classification of the inputs used to calculate the fair value of a transaction. The inputs used to measure fair value have been placed in a hierarchy based on priority. The hierarchy gives the highest priority to unadjusted, readily observable quoted prices in active markets for identical assets or liabilities (Level 1 measurement) and the lowest priority to unobservable inputs (Level 3 measurement). The three levels of the fair value hierarchy are classified as follows:
|
•
|
Level 1—Quoted prices are available in active markets for identical assets or liabilities as of the reporting date. Active markets are those in which transactions for the asset or liability occur in sufficient frequency and volume to provide pricing information on an ongoing basis. Level 1 primarily consists of financial instruments such as listed equities.
|
|
•
|
Level 2—Pricing inputs are other than quoted prices in active markets included in Level 1, which are either directly or indirectly observable as of the reporting date. Level 2 includes those financial instruments that are valued using industry-standard models or other valuation methodologies, in which substantially all assumptions are observable in the marketplace throughout the full term of the instrument, can be derived from observable data or are supported by observable levels at which transactions are executed in the marketplace. Instruments in this category include non-exchange-traded derivatives such as over the counter forwards, options, and swaps.
|
|
•
|
Level 3—Pricing inputs include significant inputs that are generally less observable from objective sources. These inputs may be used with internally developed methodologies that result in management’s best estimate of fair value. Level 3 instruments include those that may be more structured or otherwise tailored to our needs. At each balance sheet date, we perform an analysis of all instruments and include in Level 3 all of those whose fair value is based on significant unobservable inputs.
|
71
Fair Value Measurements—Risk Management Activities.
The determination of the fair value for each derivative contract incorporates various factors. These factors include not only the credit standing of the counterparties involved and the impact of credit enhancements (such as cash deposits, letters of credit and priority interests), but also the impact of our nonperformance risk on our liabilities. Valuation adjustments are generally based on capital market implied ratings evidence when assessing the credit standing of our counterparties and when applicable, adjusted based on management’s estimates of assumptions market participants would use in determining fair value.
Assets and liabilities from risk management activities may include exchange-traded derivative contracts and OTC derivative contracts. Exchange traded derivatives, as discussed above, are generally classified as Level 1, however, some exchange-traded derivatives are valued using broker or dealer quotations, or market transactions in either the listed or OTC markets. In such cases, these exchange-traded derivatives are classified within Level 2. OTC derivative trading instruments include swaps, forwards, and options. In certain instances, these instruments may utilize models to measure fair value. Generally, we use a similar model to value similar instruments. Valuation models utilize various inputs that include quoted prices for similar assets or liabilities in active markets, quoted prices for identical or similar assets or liabilities in markets that are not active, other observable inputs for the asset or liability, and market-corroborated inputs. Where observable inputs are available for substantially the full term of the asset or liability, the instrument is categorized in Level 2. Other OTC derivatives trade in less active markets with a lower availability of pricing information. In addition, complex or structured transactions, such as heat-rate call options, can introduce the need for internally-developed model inputs that might not be observable in or corroborated by the market. When such inputs have a significant impact on the measurement of fair value, the instrument is categorized in Level 3.
Estimated Useful Lives
The estimated useful lives of our long-lived assets are used to compute depreciation expense and future AROs and are used in impairment testing. Estimated useful lives are based on, among other things, the assumption that we provide an appropriate level of capital expenditures while the assets are still in operation. Estimated lives could be impacted by such factors as future energy prices, environmental regulations, various legal factors and competition. If the useful lives of these assets were found to be shorter than originally estimated, depreciation expense may increase and impairments of carrying values of tangible and intangible assets may result.
The estimated useful lives of our generation facilities consider environmental regulations currently in place. Environmental regulations could be introduced or enacted at any time, requiring us to adjust the estimated useful lives of our other generation facilities, and potentially resulting in a significant acceleration of depreciation expense.
Impairments of Long-Lived Assets and Unconsolidated Investments
We evaluate long-lived assets, such as property, plant and equipment, intangible assets subject to amortization, and unconsolidated investments for impairment when events or changes in circumstances indicate that the carrying value of such assets may not be recoverable. Factors we consider important, which could trigger an impairment analysis, include, among others:
|
•
|
significant underperformance relative to historical or projected future operating results;
|
|
•
|
significant changes in the manner of our use of the assets or the strategy for our overall business, including an expectation that the asset will be sold or retired before the end of its estimated useful life;
|
|
•
|
significant negative industry or economic trends; and
|
|
•
|
significant declines in stock value for a sustained period.
|
We assess the carrying value of our property, plant and equipment and intangible assets subject to amortization upon the occurrence of a triggering event. If an impairment is indicated, the amount of the impairment loss recognized is determined by the amount the carrying value exceeds the estimated fair value of the assets. For assets identified as held for sale, the carrying value is compared to the estimated sales price less costs to sell. Please read
Note 7—Impairment and Restructuring Charges
for discussion of impairment charges we recognized in 2012, 2011 and 2010.
We review our equity investments by comparing the book value of the investment to the estimated fair value to determine if an impairment is required. We record a loss when the decline in value is considered other than temporary. Please read
Note 14—Unconsolidated Investments
for further discussion.
Accounting for Contingencies, Guarantees and Indemnifications
We are involved in numerous lawsuits, claims, proceedings, and tax-related audits in the normal course of our operations. We record a loss contingency reserve for these matters when it is probable that a liability has been incurred and the amount of the loss can be reasonably estimated. We review our loss contingency reserves on an ongoing basis to ensure that we
72
have appropriate reserves recorded on our consolidated balance sheets. These reserves are based on estimates and judgments made by management with respect to the likely outcome of these matters, including any applicable insurance coverage for litigation matters, and are adjusted as circumstances warrant. Our estimates and judgments could change based on new information, changes in laws or regulations, changes in management’s plans or intentions, the outcome of legal proceedings, settlements or other factors. If different estimates and judgments were applied with respect to these matters, it is likely that reserves would be recorded for different amounts. Actual results could vary materially from these reserves.
Environmental liabilities are recorded when an environmental assessment indicates that remedial efforts are probable and the costs can be reasonably estimated. Measurement of liabilities is based, in part, on relevant past experience, currently enacted laws and regulations, existing technology, site-specific costs and cost-sharing arrangements. Recognition of any joint and several liability is based upon our best estimate of our final pro-rata share of such liability. These assumptions involve the judgments and estimates of management and any changes in assumptions could lead to increases or decreases in our ultimate liability, with any such changes recognized immediately in earnings.
We disclose and account for various guarantees and indemnifications entered into during the course of business. When a guarantee or indemnification is entered into, an estimated fair value of the underlying guarantee or indemnification is recorded. Some guarantees and indemnifications could have significant financial impact under certain circumstances and management also considers the probability of such circumstances occurring when estimating the fair value. Actual results may materially differ from the estimated fair value of such guarantees and indemnifications.
Please read
Note 22—Commitments and Contingencies
for further discussion of our commitments and contingencies.
Accounting for Variable Interest Entities
We evaluate certain entities to determine if we are considered the primary beneficiary of the entity and thus required to consolidate it in our financial statements. On October 1, 2012, we emerged from bankruptcy; however, the DNE Debtor Entities did not emerge and continue to remain in Chapter 11. As a result, we evaluated our investment in the DNE Debtor Entities to determine if we have a controlling financial interest in the DNE Debtor Entities subsequent to our emergence from bankruptcy.
The DNE Debtor Entities are considered VIEs. There is a significant amount of judgment involved in the analysis used to determine the primary beneficiary of a VIE. The analysis includes determining the activities that most significantly impact the performance of the VIE, who has the power to direct those activities and who has the obligation to absorb losses or the right to receive benefits that could potentially be significant to the VIE.
Under applicable accounting standards, we determined that we do not have a controlling financial interest in the DNE Debtor Entities because, subsequent to our emergence from bankruptcy and in accordance with the terms of the Plan, we do not have the sole authority to make decisions that most significantly impact the economic performance of the DNE Debtor Entities given the powers of the Bankruptcy Court. Accordingly, the DNE Debtor Entities were deconsolidated upon our emergence and are not consolidated in our financial statements subsequent to October 1, 2012.
Please read
Note 15—Variable Interest Entities
for further discussion of our accounting for our variable interest entities.
Accounting for Income Taxes
We, and Legacy Dynegy, the parent of our Predecessor, file a consolidated U.S. federal income tax return. We use the asset and liability method of accounting for deferred income taxes and provide deferred income taxes for all significant differences.
As part of the process of preparing our consolidated financial statements, we are required to estimate our income taxes in each of the jurisdictions in which we operate. This process involves estimating our actual current tax payable and related tax expense together with assessing temporary differences resulting from differing tax and accounting treatment of certain items, such as depreciation, for tax and accounting purposes. These differences can result in deferred tax assets and liabilities, which are included within our consolidated balance sheet.
Because we operate and sell power in many different states, our effective annual state income tax rate will vary from period to period because of changes in our sales profile by state, as well as jurisdictional and legislative changes by state. As a result, changes in our estimated effective annual state income tax rate can have a significant impact on our measurement of temporary differences. We project the rates at which state tax temporary differences will reverse based upon estimates of revenues and operations in the respective jurisdictions in which we conduct business. A change of 1 percent in the estimated effective annual state income tax rate at December 31, 2012 could impact deferred tax expense by approximately $9
million;
73
however, any resulting deferred tax liability will be offset by a corresponding decrease in our net deferred tax asset valuation allowance.
We must then assess the likelihood that our deferred tax assets will be recovered from future taxable income and, to the extent we believe that it is more likely than not (a likelihood of more than 50 percent) that some portion or all of the deferred tax assets will not be realized, we must establish a valuation allowance. We consider all available evidence, both positive and negative, to determine whether, based on the weight of the evidence, a valuation allowance is needed. Evidence used includes information about our current financial position and our results of operations for the current period, as well as all currently available information about future periods, anticipated future performance, the reversal of deferred tax liabilities and tax planning strategies.
We do not believe we will produce sufficient future taxable income, nor are there tax planning strategies available to realize the tax benefits from, net deferred tax assets not otherwise realized by reversing temporary differences. Therefore, a valuation allowance was placed against our net deferred tax assets as of December 31, 2012 and 2011. Any change in the valuation allowance would impact our income tax benefit (expense) and net income (loss) in the period in which the change occurs.
Accounting for uncertainty in income taxes requires that we determine whether it is more likely than not that a tax position we have taken will be sustained upon examination. If we determine that it is more likely than not that the position will be sustained, we recognize the largest amount of the benefit that is greater than 50 percent likely of being realized upon settlement. There is a significant amount of judgment involved in assessing the likelihood that a tax position will be sustained upon examination and in determining the amount of the benefit that will ultimately be realized. If different judgments were applied, it is likely that reserves would be recorded for different amounts. Actual amounts could vary materially from these reserves.
We were included in the consolidated federal and state income tax returns filed by Legacy Dynegy for periods prior to the Merger on September 30, 2012. Pursuant to provisions of the Internal Revenue Code Section 1502, pertaining to tax allocation arrangements, we recorded either a receivable or payable to Legacy Dynegy.
We recognize accrued interest expense and penalties related to unrecognized tax benefits as income tax expense.
Please read
Note 20—Income Taxes
for further discussion of our accounting for income taxes, uncertain tax positions and changes in our valuation allowance and
Note 19—Related Party Transactions
for discussion of our Tax Sharing Agreement and the Accounts receivable, affiliate.
Valuation of Pension and Other Post-Retirement Plans Assets and Liabilities
Our pension and other post-retirement benefit costs are developed from actuarial valuations. Inherent in these valuations are key assumptions including the discount rate and expected long-term rate of return on plan assets. Material changes in our pension and other post-retirement benefit costs may occur in the future due to changes in these assumptions, changes in the number of plan participants, changes in the value of plan assets and changes in the level of benefits provided.
We used a yield curve approach for determining the discount rate as of December 31, 2012. The discount rate is subject to change each year, consistent with changes in applicable high-quality, long-term corporate bond indices. Projected benefit payments for the plans were matched against the discount rates in the yield curve to produce a weighted-average equivalent discount rate. Long-term interest rates decreased during 2012. Accordingly, at December 31, 2012, we used a discount rate of 3.98 percent for pension plans and 4.08 percent for other retirement plans.
The expected long-term rate of return on pension plan assets is selected by taking into account the asset mix of the plans and the expected returns for each asset category. Based on these factors, our expected long-term rate of return as of January 1, 2013 was 7 percent.
A relatively small difference between actual results and assumptions used by management may have a significant effect on our financial statements. Assumptions used by another party could be different than our assumptions. The following table summarizes the sensitivity of pension expense and our projected benefit obligation, or PBO, to changes in the discount rate and the expected long-term rate of return on pension assets:
74
|
(amounts in millions)
|
Impact on PBO, December 31, 2012
|
Impact on 2013 Expense
|
|||||
|
Increase in Discount Rate-50 basis points
|
$
|
(21
|
)
|
$
|
—
|
|
|
|
Decrease in Discount Rate-50 basis points
|
23
|
|
—
|
|
|||
|
Increase in Expected Long-term Rate of Return-50 basis points
|
—
|
|
(1
|
)
|
|||
|
Decrease in Expected Long-term Rate of Return-50 basis points
|
—
|
|
1
|
|
|||
We are not required to make any cash contributions to our pension plans in 2013; however, we may elect to make voluntary contributions which would decrease future funding obligations. Please read Item 7. Management's Discussion and Analysis of Financial Condition and Results of Operations—Liquidity and Capital Resources—Disclosure of Contractual Obligations for further discussion. In addition, please read
Note 24—Employee Compensation, Savings and Pension Plans
for further discussion of our pension-related assets and liabilities.
RECENT ACCOUNTING PRONOUNCEMENTS
Please read
Note 2—Summary of Significant Accounting Policies
for further discussion of accounting principles adopted and accounting principles not yet adopted.
RISK-MANAGEMENT DISCLOSURES
The following table provides a reconciliation of the risk-management data on the consolidated balance sheets on a net basis:
|
(amounts in millions)
|
As of and for the
Year Ended December 31, 2012 |
||
|
Balance Sheet Risk-Management Accounts
|
|
|
|
|
Fair value of portfolio at December 31, 2011, Predecessor
|
$
|
(182
|
)
|
|
Risk-management losses recognized through the income statement in the period, net
|
(99
|
)
|
|
|
Cash paid related to risk-management contracts settled in the period, net
|
178
|
|
|
|
DMG Acquisition (1)
|
9
|
|
|
|
Deconsolidation of DNE
|
(1
|
)
|
|
|
Fresh-start adjustments (2)
|
(9
|
)
|
|
|
Margin and collateral paid (2)
|
39
|
|
|
|
Fair value of portfolio at October 1, 2012, Predecessor
|
$
|
(65
|
)
|
|
Risk-management losses recognized through the income statement in the period, net
|
(3
|
)
|
|
|
Cash paid related to risk-management contracts settled in the period, net
|
49
|
|
|
|
Change in margin and collateral paid
|
(31
|
)
|
|
|
Fair value of portfolio at December 31, 2012, Successor
|
$
|
(50
|
)
|
________________________________________
(1) On June 5, 2012, we completed the DMG Acquisition.
(2) Fresh-start adjustments include a $9 million change in the implied credit fee associated with our interest rate contracts to reflect our improved credit standing as a result of our emergence from bankruptcy. Margin and collateral paid includes $39 million related to netting margin and collateral paid with our risk management liabilities. Please read
Note 3—Emergence from Bankruptcy and Fresh-Start Accounting
for further discussion.
The net risk management liability of
$50 million
is the aggregate of the following line items on our consolidated balance sheets: Current Assets—Assets from risk-management activities, Other Assets—Assets from risk-management activities, Current Liabilities—Liabilities from risk-management activities and Other Liabilities—Liabilities from risk-management activities.
Risk-Management Asset and Liability Disclosures.
The following table provides an assessment of net contract values by year as of
December 31, 2012
, based on our valuation methodology:
75
Net Fair Value of Risk-Management Portfolio
|
(amounts in millions)
|
Total
|
2013
|
2014
|
2015
|
2016
|
2017
|
Thereafter
|
|||||||||||||||||||||
|
Market quotations (1) (2)
|
$
|
(65
|
)
|
$
|
(23
|
)
|
$
|
(19
|
)
|
$
|
(17
|
)
|
$
|
(6
|
)
|
$
|
—
|
|
$
|
—
|
|
|||||||
|
Prices based on models (2)
|
7
|
|
7
|
|
—
|
|
—
|
|
—
|
|
—
|
|
—
|
|
||||||||||||||
|
Total (3)
|
$
|
(58
|
)
|
$
|
(16
|
)
|
$
|
(19
|
)
|
$
|
(17
|
)
|
$
|
(6
|
)
|
$
|
—
|
|
$
|
—
|
|
|||||||
_________________________________________
|
(1)
|
Prices obtained from actively traded, liquid markets for commodities.
|
|
(2)
|
The market quotations and prices based on models categorization differ from the categories of Level 1, Level 2 and Level 3 used in our fair value disclosures due to the application of the different methodologies. Please read
Note 8—Risk Management Activities, Derivatives and Financial Instruments
for further discussion.
|
|
(3)
|
Excludes
$4 million
of margin and $4 million of collateral that has been netted against Risk management liabilities on our consolidated balance sheet. Please read
Note 8—Risk Management Activities, Derivatives and Financial Instruments
for further discussion.
|
76
Item 7A.
Quantitative and Qualitative Disclosures About Market Risk
We are exposed to commodity price variability related to our power generation business. In order to manage these commodity price risks, we routinely utilize various fixed-price forward purchase and sales contracts, futures and option contracts traded on the New York Mercantile Exchange or the Intercontinental Exchange and swaps and options traded in the OTC financial markets to:
|
•
|
manage and hedge our fixed-price purchase and sales commitments;
|
|
•
|
reduce our exposure to the volatility of cash market prices; and
|
|
•
|
hedge our fuel requirements for our generating facilities.
|
The potential for changes in the market value of our commodity and interest rate portfolios is referred to as “market risk.” A description of each market risk category is set forth below:
|
•
|
commodity price risks result from exposures to changes in spot prices, forward prices and volatilities in commodities, such as electricity, natural gas, coal, fuel oil, emissions and other similar products; and
|
|
•
|
interest rate risks primarily result from exposures to changes in the level, slope and curvature of the yield curve and the volatility of interest rates.
|
In the past, we have attempted to manage these market risks through diversification, controlling position sizes and executing hedging strategies. The ability to manage an exposure may, however, be limited by adverse changes in market liquidity, our credit capacity or other factors.
VaR.
The modeling of the risk characteristics of our mark-to-market portfolio involves a number of assumptions and approximations. We estimate VaR using a Monte Carlo simulation-based methodology. Inputs for the VaR calculation are prices, positions, instrument valuations and the variance-covariance matrix. VaR does not account for liquidity risk or the potential that adverse market conditions may prevent liquidation of existing market positions in a timely fashion. While management believes that these assumptions and approximations are reasonable, there is no uniform industry methodology for estimating VaR, and different assumptions and/or approximations could produce materially different VaR estimates.
We use historical data to estimate our VaR and, to reflect current asset and liability volatilities better, this historical data is weighted to give greater importance to more recent observations. Given our reliance on historical data, VaR is effective in estimating risk exposures in markets in which there are not sudden fundamental changes or abnormal shifts in market conditions. An inherent limitation of VaR is that past changes in market risk factors, even when weighted toward more recent observations, may not produce accurate predictions of future market risk. VaR should be evaluated in light of this and the methodology’s other limitations.
VaR represents the potential loss in value of our mark-to-market portfolio due to adverse market movements over a defined time horizon within a specified confidence level. For the VaR numbers reported below, a one-day time horizon and a 95 percent confidence level were used. This means that there is a one in 20 chance that the daily portfolio value will drop in value by an amount larger than the reported VaR. Thus, an adverse change in portfolio value greater than the expected change in portfolio value on a single trading day would be anticipated to occur, on average, about once a month. Gains or losses on a single day can exceed reported VaR by significant amounts. Gains or losses can also accumulate over a longer time horizon such as a number of consecutive trading days.
In addition, we have provided our VaR using a one-day time horizon with a 99 percent confidence level. The purpose of this disclosure is to provide an indication of earnings volatility using a higher confidence level. Under this presentation, there is a one in 100 statistical chance that the daily portfolio value will fall below the expected maximum potential reduction in portfolio value at least as large as the reported VaR. We have also disclosed a two-year comparison of daily VaR in order to provide context for the one-day amounts.
The following table sets forth the aggregate daily VaR of the mark-to-market portion of our risk-management portfolio primarily associated with Coal and Gas. The VaR calculation does not include market risks associated with the accrual portion of the risk-management portfolio that is designated as “normal purchase, normal sale”, nor does it include expected future production from our generating assets.
The decrease in the
December 31, 2012
VaR was primarily due to decreased forward sales as compared to
December 31, 2011
.
77
Daily and Average VaR for Risk-Management Portfolios
|
Successor
|
Predecessor
|
||||||||
|
(amounts in millions)
|
December 31,
2012
|
December 31,
2011
|
|||||||
|
One day VaR—95 percent confidence level
|
$
|
2
|
|
$
|
8
|
|
|||
|
One day VaR—99 percent confidence level
|
$
|
3
|
|
$
|
12
|
|
|||
|
Average VaR for the year-to-date period—95 percent confidence level
|
$
|
4
|
|
$
|
5
|
|
|||
Credit Risk.
Credit risk represents the loss that we would incur if a counterparty fails to perform pursuant to the terms of its contractual obligations. To reduce our credit exposure, we execute agreements that permit us to offset receivables, payables and mark-to-market exposure. We attempt to reduce credit risk further with certain counterparties by obtaining third party guarantees or collateral as well as the right of termination in the event of default.
Our Credit Department, based on guidelines approved by the Board of Directors, establishes our counterparty credit limits. Our industry typically operates under negotiated credit lines for physical delivery and financial contracts. Our credit risk system provides current credit exposure of counterparties on a daily basis.
The following table represents our credit exposure at
December 31, 2012
associated with the mark-to-market portion of our risk-management portfolio, on a net basis.
Credit Exposure Summary
|
(amounts in millions)
|
Investment
Grade Quality
|
Non-Investment
Grade Quality
|
Total
|
|||||||||
|
Type of Business:
|
|
|
|
|
|
|
||||||
|
Financial institutions
|
$
|
4
|
|
$
|
—
|
|
$
|
4
|
|
|||
|
Utility and power generators
|
7
|
|
—
|
|
7
|
|
||||||
|
Commercial / industrial / end users
|
—
|
|
2
|
|
2
|
|
||||||
|
Total
|
$
|
11
|
|
$
|
2
|
|
$
|
13
|
|
|||
Interest Rate Risk
We are exposed to fluctuating interest rates related to variable rate financial obligations. As of
December 31, 2012
, all of our third party debt was considered variable rate debt. We use a variety of instruments, including interest rate swaps and caps, to mitigate this interest rate exposure. Our interest rate hedging instruments are recorded at their fair value. The related debt is not recorded at its fair value. Based on a sensitivity analysis of the variable rate financial obligations in our debt portfolio as of
December 31, 2012
, to the extent LIBOR remains below 1.5 percent, which represents the interest rate floor in the DPC and DMG Credit Agreements, each 50 basis point decrease in LIBOR rates will increase interest expense by approximately $1 million over the twelve months ended December 31, 2013. We estimate that increases in LIBOR to ranges between 1.5 percent and 2.5 percent will result in up to $9 million in increased interest expense over the twelve months ended December 31, 2013 as the higher interest expense on the debt would be partially increased by the change in interest expense on the swaps.
For these same twelve months, each additional 50 basis point increase in LIBOR above 2.5 percent would decrease the interest expense recognized over the period by less than $100 thousand, as the change in value of the interest rate hedging
instruments would more than offset the increase in debt expense for the variable rate debt over the period.
The absolute notional financial contract amounts associated with our interest rate contracts were as follows at
December 31, 2012
and
December 31, 2011
, respectively:
78
|
Successor
|
Predecessor
|
||||||||
|
|
December 31, 2012
|
December 31, 2011
|
|||||||
|
Interest rate swaps (in millions of U.S. dollars) (1)
|
$
|
1,100
|
|
$
|
788
|
|
|||
|
Fixed interest rate paid (percent)
|
2.22
|
|
2.21
|
|
|||||
|
Interest rate caps (in millions of U.S. dollars) (1)
|
$
|
1,400
|
|
$
|
900
|
|
|||
|
Interest rate threshold (percent)
|
2.00
|
|
2.00
|
|
|||||
__________________________________________
(1) The $1,100 million interest rate swaps are not effective until the fourth quarter 2013. The $1,400 million interest rate caps expire October 31, 2013.
Item 8.
Financial Statements and Supplementary Data
Our consolidated financial statements and financial statement schedules are set forth at pages F-1 through F-76 inclusive, found at the end of this annual report, and are incorporated herein by reference.
Item 9.
Changes in and Disagreements with Accountants on Accounting and Financial Disclosure
Not applicable.
Item 9A.
Controls and Procedures
Evaluation of Disclosure Controls and Procedures
As of the end of the period covered by this report, an evaluation was carried out under the supervision and with the participation of management, including our Chief Executive Officer and our Chief Financial Officer, of the effectiveness of the design and operation of our disclosure controls and procedures (as defined in Rules 13a-15(e) and 15d-15(e) under the Securities Exchange Act of 1934, as amended (the “Exchange Act”)). This evaluation included consideration of the various processes carried out under the direction of our disclosure committee. This evaluation also considered the work completed relating to our compliance with Section 404 of the Sarbanes-Oxley Act of 2002. Based on this evaluation, our CEO and CFO concluded that our disclosure controls and procedures were effective as of
December 31, 2012
.
Management’s Report on Internal Control over Financial Reporting
Our management is responsible for establishing and maintaining adequate internal control over financial reporting (as defined in Rules 13a-15(f) and 15d-15(f) under the Exchange Act). Our internal control over financial reporting is a process designed to provide reasonable assurance regarding the reliability of financial reporting and the preparation of financial statements for external purposes in accordance with GAAP. Our internal control over financial reporting includes those policies and procedures that:
|
(i)
|
pertain to the maintenance of records that, in reasonable detail, accurately and fairly reflect the transactions and dispositions of our assets;
|
|
(ii)
|
provide reasonable assurance that transactions are recorded as necessary to permit preparation of financial statements in accordance with GAAP, and that receipts and expenditures of our company are being made only in accordance with authorizations of our management and directors; and
|
|
(iii)
|
provide reasonable assurance regarding prevention or timely detection of unauthorized acquisition, use or disposition of our assets that could have a material effect on the financial statements.
|
Because of its inherent limitations, internal control over financial reporting may not prevent or detect misstatements. Also, projections of any evaluation of effectiveness to future periods are subject to the risk that controls may become inadequate because of changes in conditions, or that the degree of compliance with the policies or procedures may deteriorate. Under the supervision and with the participation of our management, including the Chief Executive Officer and Chief Financial Officer, we assessed the effectiveness of our internal control over financial reporting as of
December 31, 2012
. In making this assessment, we used the criteria set forth in
Internal Control—Integrated Framework
issued by the Committee of Sponsoring Organizations of the Treadway Commission. Based on the results of this assessment and on those criteria, we concluded that our internal control over financial reporting was effective as of
December 31, 2012
.
The effectiveness of our internal control over financial reporting as of December 31, 2012 has been audited by Ernst & Young LLP, an independent registered public accounting firm, as stated in their report, which is included herein.
79
Changes in Internal Controls Over Financial Reporting
There were no changes in our internal controls over financial reporting that materially affected or are reasonably likely to materially affect our internal controls over financial reporting during the quarter ended
December 31, 2012
.
80
Item 9B.
Other Information
Not applicable.
Item 10.
Directors, Executive Officers and Corporate Governance
Executive Officers.
We intend to include the information with respect to our executive officers required by this Item 10 in our definitive proxy statement for our 2013 annual meeting of stockholders under the heading “Executive Officers,” which information will be incorporated herein by reference; such proxy statement will be filed with the SEC not later than 120 days after December 31, 2012. However, if such proxy statement is not filed within such 120-day period, information with respect to Executive Officers will be filed as part of an amendment to this Form 10-K not later than the end of the 120-day period.
Code of Ethics.
We have adopted a Code of Ethics within the meaning of Item 406(b) of Regulation S-K. This Code of Ethics applies to our Chief Executive Officer, Chief Financial Officer, Controller and other persons performing similar functions designated by the Chief Financial Officer, and is filed as an exhibit to this Form 10-K.
Other Information.
We intend to include the other information required by this Item 10 in our definitive proxy statement for our 2013 annual meeting of stockholders under the headings “Proposal 1—Election of Directors” and “Compliance with Section 16(a) of the Exchange Act,” which information will be incorporated herein by reference; such proxy statement will be filed with the SEC not later than 120 days after December 31, 2012. However, if such proxy statement is not filed within such 120-day period, information with respect to Other Information will be filed as part of an amendment to this Form 10-K not later than the end of the 120-day period.
Item 11.
Executive Compensation
We intend to include information with respect to executive compensation in our definitive proxy statement for our 2013 annual meeting of stockholders under the heading “Executive Compensation,” which information will be incorporated herein by reference; such proxy statement will be filed with the SEC not later than 120 days after December 31, 2012. However, if such proxy statement is not filed within such 120-day period, information with respect to executive compensation will be filed as part of an amendment to this Form 10-K not later than the end of the 120-day period.
Item 12.
Security Ownership of Certain Beneficial Owners and Management and Related Stockholder Matters
We intend to include information regarding ownership of our outstanding securities in our definitive proxy statement for our 2013 annual meeting of stockholders under the heading “Security Ownership of Certain Beneficial Owners and Management” and “Securities Authorized for Issuance Under Equity Compensation Plan,” respectively, which information will be incorporated herein by reference; such proxy statement will be filed with the SEC not later than 120 days after December 31, 2012. However, if such proxy statement is not filed within such 120-day period, information with respect to beneficial ownership will be filed as part of an amendment to this Form 10-K not later than the end of the 120-day period.
81
SECURITIES AUTHORIZED FOR ISSUANCE UNDER EQUITY COMPENSATION PLANS
The following table sets forth certain information as of December 31, 2012 as it relates to our equity compensation plans for our common stock.
|
Plan Category
|
Number of securities
to be issued upon
exercise of
outstanding options (a)
|
Weighted-average
exercise price of
outstanding options (b)
|
Number of securities
remaining available for
future issuance under
equity compensation
plans (excluding
securities reflected in
column (a)) (c)
|
|||||||
|
Equity compensation plans approved by security holders (1)
|
687,813
|
|
$
|
18.70
|
|
5,108,500
|
|
|||
|
Equity compensation plans not approved by security holders
|
—
|
|
—
|
|
—
|
|
||||
|
Total
|
687,813
|
|
$
|
18.70
|
|
5,108,500
|
|
|||
__________________________________________
|
(1)
|
The plan that is approved by our security holders is as follows: 2012 Long Term Incentive Plan. Please read
Note 23—Capital Stock
—Stock Award Plans of the Notes to Consolidated Financial Statements in our Annual Report on Form 10-K for the year ended December 31, 2012 for a brief description of our equity compensation plan, including this plan.
|
Item 13.
Certain Relationships and Related Transactions, and Director Independence
We intend to include the information regarding related party transactions and Director independence in our definitive proxy statement for our 2013 annual meeting of stockholders under the headings “Transactions with Related Persons, Promoters and Certain Control Persons,” and “Corporate Governance,” respectively, which information will be incorporated herein by reference; such proxy statement will be filed with the SEC not later than 120 days after December 31, 2012. However, if such proxy statement is not filed within such 120-day period, information with respect to certain relationships will be filed as part of an amendment to this Form 10-K not later than the end of the 120-day period.
Item 14.
Principal Accountant Fees and Services
We intend to include information regarding principal accountant fees and services in our definitive proxy statement for our 2013 annual meeting of stockholders under the heading “Independent Registered Public Auditors—Principal Accountant Fees and Services,” which information will be incorporated herein by reference; such proxy statement will be filed with the SEC not later than 120 days after December 31, 2012. However, if such proxy statement is not filed within such 120-day period, information with respect to the principal accountant fees and services will be filed as part of an amendment to this Form 10-K not later than the end of the 120-day period.
82
Item 15.
Exhibits and Financial Statement Schedules
(a) The following documents, which we have filed with the SEC pursuant to the Securities Exchange Act of 1934, as amended, are by this reference incorporated in and made a part of this report:
1. Financial Statements—Our consolidated financial statements are incorporated under Item 8. of this report.
2. Financial Statement Schedules—Financial Statement Schedules are incorporated under Item 8. of this report.
3. Exhibits—The following instruments and documents are included as exhibits to this report.
|
Exhibit
Number
|
|
Description
|
|
|
2.1
|
|
Confirmation Order for Dynegy Inc. and Dynegy Holdings, LLC, as entered by the Bankruptcy Court on September 10, 2012 (incorporated by reference to Exhibit 2.1 to the Current Report on Form 8-K of Dynegy Inc. and Dynegy Holdings, LLC filed on September 13, 2012, File No. 001-33443).
|
|
|
2.2
|
|
Agreement and Plan of Merger between Dynegy Inc. and Dynegy Holdings, LLC, dated September 28, 2012 (incorporated by reference to Exhibit 10.2 to the Current Report on Form 8-K of Dynegy Inc. filed on October 2, 2012, File No. 001-33443).
|
|
|
2.3
|
|
Asset Purchase Agreement dated as of December 10, 2012, among Dynegy Danskammer, L.L.C. and ICS NY Holdings, LLC (incorporated by reference to Exhibit 2.1 to the Current Report on Form 8-K of Dynegy Inc. filed on December 10, 2012, File No. 001-33443).
|
|
|
2.4
|
|
Asset Purchase Agreement dated as of December 19, 2012, among LDH U.S. Asset Holdings LLC and Dynegy Roseton, L.L.C. (incorporated by reference to Exhibit 2.1 to the Current Report on Form 8-K of Dynegy Inc. filed on December 18, 2012, File No. 001-33443).
|
|
|
3.1
|
|
Dynegy Inc. Third Amended and Restated Certificate of Incorporation (incorporated by reference to Exhibit 3.1 to the Current Report on Form 8-K of Dynegy Inc. filed on October 4, 2012, File No. 001-33443).
|
|
|
3.2
|
|
Dynegy Inc. Fourth Amended and Restated Bylaws (incorporated by reference to Exhibit 3.2 to the Current Report on Form 8-K of Dynegy Inc. filed on October 4, 2012, File No. 001-33443).
|
|
|
4.1
|
|
Registration Rights Agreement, dated October 1, 2012, by and among the Company and the investors party thereto (incorporated by reference to Exhibit 4.1 to the Current Report on Form 8-K of Dynegy Inc. filed on October 4, 2012, File No. 001-33443).
|
|
|
10.1
|
|
Dynegy Inc. Executive Severance Pay Plan, as amended and restated effective as of January 1, 2008 (incorporated by reference to Exhibit 10.1 to the Current Report on Form 8-K of Dynegy Inc. filed on January 4, 2008, File No. 001-33443).††
|
|
|
10.2
|
|
First Amendment to the Dynegy Inc. Executive Severance Pay Plan effective as of January 1, 2010 (incorporated by reference to Exhibit 10.15 to the Annual Report on Form 10-K for the Fiscal Year Ended December 31, 2009 of Dynegy Inc, File No. 1-15659).††
|
|
|
10.3
|
|
Second Amendment to the Dynegy Inc. Executive Severance Pay Plan, dated as of September 20, 2010. (incorporated by reference to Exhibit 10.4 to the Quarterly Report on Form 10-Q for the Quarter Ended September 30, 2010 of Dynegy Inc, File No. 1-15659).††
|
|
|
10.4
|
|
Third Amendment to the Dynegy Inc. Executive Severance Pay Plan (incorporated by reference to Exhibit 10.1 to the Current Report on Form 8-K of Dynegy Inc. filed on March 22, 2011, File No. 1-33443).††
|
|
|
10.5
|
|
Fourth Amendment to the Dynegy Inc. Executive Severance Pay Plan, dated as of August 8, 2011(incorporated by reference to Exhibit 10. 1 to the Quarterly Report on Form 10-Q for the Quarter Ended September 30, 2011 of Dynegy Inc., File No. 1- 33443).††
|
|
|
10.6
|
|
Dynegy Inc. Executive Change in Control Severance Pay Plan effective April 3, 2008 (incorporated by reference to Exhibit 10.1 to the Current Report on Form 8-K of Dynegy Inc. filed on April 8, 1008, File No. 001-33443).††
|
|
|
10.7
|
|
First Amendment to the Dynegy Inc. Executive Change In Control Severance Pay Plan, dated as of September 22, 2010 (incorporated by reference to Exhibit 10.2 to the Quarterly Report on Form 10-Q for the Quarter Ended September 30, 2010 of Dynegy Inc, File No. 1-15659).††
|
|
|
10.8
|
|
Dynegy Inc. Excise Tax Reimbursement Policy, effective January 1, 2008 (incorporated by reference to Exhibit 10.2 to the Current Report on Form 8-K of Dynegy Inc. filed on January 4, 2008, File No. 001-33443).††
|
|
83
|
10.9
|
|
Dynegy Inc. Restoration 401(k) Savings Plan, effective June 1, 2008 (incorporated by reference to Exhibit 10.2 to the Quarterly Report on Form 10-Q of Dynegy Inc. filed on August 7, 2008, File No. 001-33443).††
|
|
|
10.10
|
|
First Amendment to the Dynegy Inc. Restoration 401(k) Savings Plan, effective June 1, 2008 (incorporated by reference to Exhibit 10.3 to the Quarterly Report on Form 10-Q of Dynegy Inc. filed on August 7, 2008, File No. 001-33443).††
|
|
|
10.11
|
|
Second Amendment to Dynegy Inc. Restoration 401(k) Savings Plan, effective January 1, 2012 (incorporated by reference to Exhibit 10.23 to the Annual Report on Form 10-K of Dynegy Inc. for the year ended December 31, 2011, File No. 1-33443).††
|
|
|
10.12
|
|
Dynegy Inc. Restoration Pension Plan, effective June 1, 2008 (incorporated by reference to Exhibit 10.4 to the Quarterly Report on Form 10-Q of Dynegy Inc. filed on August 7, 2008, File No. 001-33443).††
|
|
|
10.13
|
|
First Amendment to the Dynegy Inc. Restoration Pension Plan, effective June 1, 2008 (incorporated by reference to Exhibit 10.5 to the Quarterly Report on Form 10-Q of Dynegy Inc. filed on August 7, 2008, File No. 001-33443).††
|
|
|
10.14
|
|
Second Amendment to the Dynegy Inc. Restoration Pension Plan, executed on July 2, 2010 (incorporated by reference to Exhibit 10.4 to the Quarterly Report on Form 10-Q of Dynegy Inc. and Dynegy Holdings Inc. filed on August 6, 2010, File No. 000-29311).††
|
|
|
10.15
|
|
Third Amendment to Dynegy Inc. Restoration Pension Plan, effective January 1, 2012 (incorporated by reference to Exhibit 10.27 to the Annual Report on Form 10-K of Dynegy Inc. for the year ended December 31, 2011, File No. 1-33443).††
|
|
|
10.16
|
|
Dynegy Inc. 2009 Phantom Stock Plan (incorporated by reference to Exhibit 10.3 to the Current Report on Form 8-K of Dynegy Inc. filed on March 10, 2009, File No. 001-33443).††
|
|
|
10.17
|
|
First Amendment to the Dynegy Inc. 2009 Phantom Stock Plan, dated as of July 8, 2011(incorporated by reference to Exhibit 10.2 to the Quarterly Report on Form 10-Q for the Quarter Ended June 30, 2011 of Dynegy Inc., File No. 1- 33443).††
|
|
|
10.18
|
|
Dynegy Inc. Deferred Compensation Plan for Certain Directors, as amended and restated, effective January 1, 2008 (incorporated by reference to Exhibit 10.55 to the Annual Report on Form 10-K for the Fiscal Year ended December 31, 2009, filed on February 26, 2009, File No. 001-33443).††
|
|
|
10.19
|
|
Trust under Dynegy Inc. Deferred Compensation Plan for Certain Directors, effective January 1, 2009 (incorporated by reference to Exhibit 10.56 to the Annual Report on Form 10-K for the Fiscal Year ended December 31, 2009, filed on February 26, 2009, File No. 001-33443).††
|
|
|
10.20
|
|
Dynegy Inc. Incentive Compensation Plan, as amended and restated effective May 21, 2010 (incorporated by reference to Exhibit 10.34 to the Annual Report on Form 10-K for the Fiscal Year ended December 31, 2010, File No. 001-33443)††
|
|
|
10.21
|
|
2012 Long Term Incentive Plan (incorporated by reference to Exhibit 10.3 to the Current Report on Form 8-K of Dynegy Inc. filed on October 4, 2012, File No. 001-33443).
|
|
|
10.22
|
|
Assignment Agreement by and between Dynegy Inc. and Dynegy Operating Company, dated July 5, 2012 (incorporated by reference to Exhibit 10.1 to the Current Report on Form 8-K of Dynegy Inc. on July 10, 2012, File No. 001-33443).
|
|
|
10.23
|
|
Employment Agreement between Dynegy Inc. and Robert Flexon dated June 22, 2011(incorporated by reference to Exhibit 10.3 to the Quarterly Report on Form 10-Q for the Quarter Ended June 30, 2011 of Dynegy Inc., File No. 1- 33443).††
|
|
|
10.24
|
|
Employment Agreement between Dynegy Inc. and Kevin Howell dated June 22, 2011(incorporated by reference to Exhibit 10.4 to the Quarterly Report on Form 10-Q for the Quarter Ended June 30, 2011 of Dynegy Inc., File No. 1- 33443).††
|
|
|
10.25
|
|
Employment Agreement between Dynegy Inc. and Clint C. Freeland dated June 23, 2011(incorporated by reference to Exhibit 10.5 to the Quarterly Report on Form 10-Q for the Quarter Ended June 30, 2011 of Dynegy Inc., File No. 1- 33443).††
|
|
|
10.26
|
|
Employment Agreement between Dynegy Inc. and Carolyn J. Burke dated July 5, 2011(incorporated by reference to Exhibit 10.6 to the Quarterly Report on Form 10-Q for the Quarter Ended June 30, 2011 of Dynegy Inc., File No. 1- 33443).††
|
|
|
10.27
|
|
Employment Agreement between Dynegy Inc. and Catherine Callaway dated September 16, 2011 (incorporated by reference to Exhibit 10. 2 to the Quarterly Report on Form 10-Q for the Quarter Ended September 30, 2011 of Dynegy Inc., File No. 1- 33443).††
|
|
|
10.28
|
|
Form Award Agreement for 2012 Long Term Incentive Program Award-Cash (CEO) (incorporated by reference to Exhibit 10.1 to the Current Report on Form 8-K of Dynegy Inc. filed on January 9, 2012 File No. 001-33443).††
|
|
84
|
10.29
|
|
Form Award Agreement for 2012 Long Term Incentive Program Award-Cash (EVP) (incorporated by reference to Exhibit 10.2 to the Current Report on Form 8-K of Dynegy Inc. filed on January 9, 2012 File No. 001-33443).††
|
|
|
10.30
|
|
Form of Non-Qualified Stock Option Award Agreement (incorporated by reference to Exhibit 10.1 to the Current Report on Form 8-K of Dynegy Inc. on November 2, 2012, File No. 001-33443).
††
|
|
|
10.31
|
|
Form of Stock Unit Award Agreement - Officers (incorporated by reference to Exhibit 10.2 to the Current Report on Form 8-K of Dynegy Inc. on November 2, 2012, File No. 001-33443).
††
|
|
|
10.32
|
|
Form of Stock Unit Award Agreement - Directors (incorporated by reference to Exhibit 10.3 to the Current Report on Form 8-K of Dynegy Inc. on November 2, 2012, File No. 001-33443).
††
|
|
|
10.33
|
|
Form of Phantom Stock Unit Award Agreement - MD & Above Version (2012 LTIP Awards) (incorporated by reference to Exhibit 10.11 to the Quarterly Report on Form 10-Q for the Quarter Ended September 30, 2012 of Dynegy Inc., File No. 1- 33443).
††
|
|
|
10.34
|
|
Form of Phantom Stock Unit Award Agreement - MD & Above Version (2012 Replacement Shares) (incorporated by reference to Exhibit 10.12 to the Quarterly Report on Form 10-Q for the Quarter Ended September 30, 2012 of Dynegy Inc., File No. 1- 33443).
††
|
|
|
10.35
|
|
Credit Agreement, dated as of August 5, 2011, among Dynegy Midwest Generation, LLC, as borrower and the guarantors, lenders and other parties thereto (incorporated by reference to Exhibit 10.1 to the Current Report on Form 8-K of Dynegy Inc and Dynegy Holdings Inc. filed on August 8, 2011, File No. 001-33443).
|
|
|
10.36
|
|
Credit Agreement dated as of August 5, 2011 among Dynegy Power, LLC and the guarantors, lenders and other parties thereto (incorporated by reference to Exhibit 10.2 to the Current Report on Form 8-K of Dynegy Inc and Dynegy Holdings Inc. filed on August 8, 2011, File No. 001-33443).
|
|
|
10.37
|
|
Guarantee and Collateral Agreement, dated as of August 5, 2011 among Dynegy Midwest Generation, LLC, the subsidiaries of the borrower from time to time party thereto and other parties thereto (incorporated by reference to Exhibit 10.3 to the Current Report on Form 8-K of Dynegy Inc and Dynegy Holdings Inc. filed on August 8, 2011, File No. 001-33443).
|
|
|
10.38
|
|
Guarantee and Collateral Agreement, dated as of August 5, 2011 among Dynegy Power, LLC, the subsidiaries of the borrower from time to time party thereto and other parties thereto (incorporated by reference to Exhibit 10.4 to the Current Report on Form 8-K of Dynegy Inc and Dynegy Holdings Inc. filed on August 8, 2011, File No. 001-33443).
|
|
|
10.39
|
|
Collateral Trust and Intercreditor Agreement, dated as of August 5, 2011 among Dynegy Coal Investments Holdings, LLC, Dynegy Midwest Generation, LLC, the guarantors and the other parties thereto (incorporated by reference to Exhibit 10.6 to the Current Report on Form 8-K of Dynegy Inc and Dynegy Holdings Inc. filed on August 8, 2011, File No. 001-33443).
|
|
|
10.40
|
|
Collateral Trust and Intercreditor Agreement, dated as of August 5, 2011 among Dynegy Gas Investment Holdings, LLC, Dynegy Power LLC, the guarantors and the other parties thereto (incorporated by reference to Exhibit 10.7 to the Current Report on Form 8-K of Dynegy Inc and Dynegy Holdings Inc. filed on August 8, 2011, File No. 001-33443).
|
|
|
***10.41
|
|
Letter of Credit Reimbursement and Collateral Agreement, dated as of August 5, 2011 among Dynegy Midwest Generation, LLC and Credit Suisse AG, Cayman Islands Branch (incorporated by reference to Exhibit 10.5 to the Current Report on Form 8-K of Dynegy Inc and Dynegy Holdings Inc. filed on August 8, 2011, File No. 001-33443).
|
|
|
***10.42
|
|
Letter of Credit Reimbursement and Collateral Agreement, dated as of August 5, 2011 between Dynegy Power LLC and Credit Suisse AG, Cayman Islands Branch (incorporated by reference to Exhibit 10.8 to the Current Report on Form 8-K of Dynegy Inc and Dynegy Holdings Inc. filed on August 8, 2011, File No. 001-33443).
|
|
|
***10.43
|
|
Letter of Credit Reimbursement and Collateral Agreement, dated as of August 5, 2011 between Dynegy Holdings Inc. and Credit Suisse AG, Cayman Islands Branch (incorporated by reference to Exhibit 10.9 to the Current Report on Form 8-K of Dynegy Inc and Dynegy Holdings Inc. filed on August 8, 2011, File No. 001-33443).
|
|
85
|
***10.44
|
|
Letter of Credit Reimbursement and Collateral Agreement, dated as of August 5, 2011 among Dynegy Power LLC and Barclays Bank PLC (incorporated by reference to Exhibit 10.21 to the Quarterly Report on Form 10-Q for the Quarter Ended June 30, 2011 of Dynegy Inc., File No. 1- 33443).
|
|
|
***10.45
|
|
Revolver Credit Agreement, dated as of January 16, 2013, among Dynegy Power, LLC, Dynegy Gas Investment Holdings, LLC, and the lenders and other parties thereto (incorporated by reference to Exhibit 10.1 to the Current Report on Form 8-K of Dynegy Inc filed on January 16, 2013, File No. 001-33443).
|
|
|
10.46
|
|
Baldwin Consent Decree, approved May 27, 2005 (incorporated by reference to Exhibit 99.1 to the Current Report on Form 8-K of Dynegy Inc. filed on May 31, 2005, File No. 1-15659).
|
|
|
10.47
|
|
Amended and Restated Settlement Agreement, dated May 30, 2012, among Dynegy Inc., Dynegy Holdings, LLC and certain of its subsidiaries and certain beneficial owners of a portion of Dynegy Holdings, LLC's outstanding senior notes (incorporated by reference to Exhibit 10.1 to the Current Report on Form 8-K of Dynegy Inc. and Dynegy Holdings, LLC filed on May 31, 2012, File No. 001-33443).
|
|
|
10.48
|
|
First Amendment to the Amended Plan Support Agreement, dated July 31, 2012, among Dynegy Inc., Dynegy Holdings, LLC and certain of its subsidiaries and certain beneficial owners of a portion of Dynegy Holdings, LLC's outstanding senior notes (incorporated by reference to Exhibit 10.1 to the Current Report on Form 8-K for Dynegy Inc. and Dynegy Holdings, LLC filed on August 1, 2012, File No. 001-33443).
|
|
|
10.49
|
|
Joint Chapter 11 Plan of Reorganization for Dynegy Holdings, LLC and Dynegy Inc. proposed by Dynegy Holdings, LLC and Dynegy Inc., dated July 12, 2012 (incorporated by reference to Exhibit 99.1 to the Current Report on Form 8-K of Dynegy Inc. and Dynegy Holdings, LLC filed on July 13, 2012, File No. 001-33443).
|
|
|
10.50
|
|
Disclosure Statement related to the Joint Chapter 11 Plan of Reorganization for Dynegy Holdings, LLC and Dynegy Inc. proposed by Dynegy Holdings, LLC and Dynegy Inc., dated July 12, 2012 (incorporated by reference to Exhibit 99.2 to the Current Report on Form 8-K of Dynegy Inc. and Dynegy Holdings, LLC filed on July 13, 2012, File No. 001-33443).
|
|
|
10.51
|
|
Dynegy Shareholders Trust Declaration between Dynegy Inc. and Wilmington Trust, National Association, as trustee, dated September 28, 2012 (incorporated by reference to Exhibit 10.1 to the Current Report on Form 8-K of Dynegy Inc. filed on October 2, 2012, File No. 001-33443).
|
|
|
**** 10.52
|
|
Warrant Agreement, dated October 1, 2012, by and among Dynegy Inc., Computershare Inc. and Computershare Trust Company, N.A., as warrant agent (incorporated by reference to Exhibit 10.2 to the Current Report on Form 8-K of Dynegy Inc. filed on October 4, 2012, File No. 001-33443).
|
|
|
10.53
|
|
Contribution and Assignment Agreement by and between Dynegy Inc. and Dynegy Holdings, LLC, dated June 5, 2012 (incorporated by reference to Exhibit 10.1 to the Current Report on Form 8-K of Dynegy Inc. and Dynegy Holdings, LLC filed on June 11, 202, File No. 001-33443)
|
|
|
10.54
|
|
Chapter 11 Joint Plan of Liquidation for Dynegy Northeast Generation, Inc., Hudson Power, L.L.C., Dynegy Danskammer, L.L.C. and Dynegy Roseton, L.L.C. filed December 14, 2012 (incorporated by reference to Exhibit 99.1 to the Current Report on Form 8-K of Dynegy Inc. filed on December 17, 2012, File No. 001-33443).
|
|
|
10.55
|
|
Disclosure Statement related to the Chapter 11 Joint Plan of Liquidation for Dynegy Northeast Generation, Inc., Hudson Power, L.L.C., Dynegy Danskammer, L.L.C. and Dynegy Roseton, L.L.C. filed December 14, 2012 (incorporated by reference to Exhibit 99.2 to the Current Report on Form 8-K of Dynegy Inc. filed on December 17, 2012, File No. 001-33443).
|
|
|
10.56
|
|
Amended Chapter 11 Joint Plan of Liquidation for Dynegy Northeast Generation, Inc., Hudson Power, L.L.C., Dynegy Danskammer, L.L.C. and Dynegy Roseton, L.L.C. filed January 21, 2013 (incorporated by reference to Exhibit 99.1 to the Current Report on Form 8-K of Dynegy Inc. filed on January 22, 2013, File No. 001-33443).
|
|
|
10.57
|
|
Amended Disclosure Statement related to the Chapter 11 Joint Plan of Liquidation for Dynegy Northeast Generation, Inc., Hudson Power, L.L.C., Dynegy Danskammer, L.L.C. and Dynegy Roseton, L.L.C. filed January 21, 2013 (incorporated by reference to Exhibit 99.2 to the Current Report on Form 8-K of Dynegy Inc. filed on January 22, 2013, File No. 001-33443).
|
|
|
10.58
|
|
Employment Agreement by and among Dynegy Operating Company, Dynegy Inc. and Henry D. Jones(incorporated by reference to Exhibit 10.1 to the Current Report on Form 8-K of Dynegy Inc. filed on February 12, 2013, File No. 001-33443).
|
|
|
14.1
|
|
Dynegy Inc. Code of Ethics for Senior Financial Professionals, as amended on November 16, 2011 (incorporated by reference to Exhibit 14.1 to the Current Report on Form 8-K filed on November 17, 2011 File No. 001-33443).
|
|
|
**21.1
|
|
Significant subsidiaries of the Registrant
|
|
|
**23.1
|
|
Consent of Ernst & Young LLP
|
|
86
|
**31.1
|
|
|
Chief Executive Officer Certification Pursuant to Rule 13a-14(a) and 15d-14(a), As Adopted Pursuant to Section 302 of the Sarbanes-Oxley Act of 2002.
|
|
**31.2
|
|
|
Chief Financial Officer Certification Pursuant to Rule 13a-14(a) and 15d-14(a), As Adopted Pursuant to Section 302 of the Sarbanes-Oxley Act of 2002.
|
|
†32.1
|
|
|
Chief Executive Officer Certification Pursuant to 18 United States Code Section 1350, As Adopted Pursuant to Section 906 of the Sarbanes-Oxley Act of 2002.
|
|
†32.2
|
|
|
Chief Financial Officer Certification Pursuant to 18 United States Code Section 1350, As Adopted Pursuant to Section 906 of the Sarbanes-Oxley Act of 2002.
|
|
*101.INS
|
|
|
XBRL Instance Document
|
|
*101.SCH
|
|
|
XBRL Taxonomy Extension Schema Document
|
|
*101.CAL
|
|
|
XBRL Taxonomy Extension Calculation Linkbase Document
|
|
*101.DEF
|
|
|
XBRL Taxonomy Extension Definition Linkbase Document
|
|
*101.LAB
|
|
|
XBRL Taxonomy Extension Label Linkbase Document
|
|
*101.PRE
|
|
|
XBRL Taxonomy Extension Presentation Linkbase Document
|
__________________________________________
|
*
|
XBRL information is furnished and not filed for purposes of Section 11 and 12 of the Securities Act of 1933 and Section 18 of the Securities Exchange Act of 1934, and is not subject to liability under those sections, is not part of any registration statement or prospectus to which it relates and is not incorporated or deemed to be incorporated by reference into any registration statement, prospectus or other document.
|
** Filed herewith.
|
***
|
Certain exhibits, attachments or schedules to the exhibits filed herewith were never prepared or used by the parties in connection with the transactions that are the subject of the filed exhibit and therefore no actual exhibit, attachment or schedule exists.
|
|
****
|
Pursuant to a request for confidential treatment, portions of this Exhibit have been redacted and filed separately with the SEC as required by Rule 24b-2 under the Securities Exchange Act of 1934, as amended.
|
†
Pursuant to Securities and Exchange Commission Release No. 33-8238, this certification will be treated as “accompanying” this report and not “filed” as part of such report for purposes of Section 18 of the Securities Exchange Act of 1934, as amended, or the Exchange Act, or otherwise subject to the liability of Section 18 of the Exchange Act, and this certification will not be deemed to be incorporated by reference into any filing under the Securities Act of 1933, as amended, or the Exchange Act.
|
††
|
Management contract or compensation plan.
|
87
SIGNATURES
Pursuant to the requirements of Section 13 or 15(d) of the Securities Exchange Act of 1934, the registrant has duly caused this report to be signed on its behalf by the undersigned, the thereunto duly authorized.
|
|
|
DYNEGY INC.
|
||
|
Date:
|
March 14, 2013
|
By:
|
|
/s/ ROBERT C. FLEXON
Robert C. Flexon
President and Chief Executive Officer
|
________________________________________________________________________________________________________________________
Pursuant to the requirements of the Securities Exchange Act of 1934, this report has been signed below by the following persons in the capacities and on the dates indicated.
|
/s/ ROBERT C. FLEXON
Robert C. Flexon
|
|
President and Chief Executive Officer & Director (Principal Executive Officer)
|
|
March 14, 2013
|
|
/s/ CLINT C. FREELAND
Clint C. Freeland
|
|
Executive Vice President and Chief Financial Officer (Principal Financial Officer)
|
|
March 14, 2013
|
|
/s/ J. CLINTON WALDEN
J. Clinton Walden |
|
Vice President and Chief Accounting Officer (Principal Accounting Officer)
|
|
March 14, 2013
|
|
/s/ PAT WOOD III
Pat Wood III
|
|
Chairman of the Board
|
|
March 14, 2013
|
|
/s/ HILARY E. ACKERMANN
Hilary E. Ackermann
|
|
Director
|
|
March 14, 2013
|
|
/s/ PAUL M. BARBAS
Paul M. Barbas
|
|
Director
|
|
March 14, 2013
|
|
/s/ RICHARD LEE KUERSTEINER
Richard Lee Kuersteiner
|
|
Director
|
|
March 14, 2013
|
|
/s/ JEFFREY S. STEIN
Jeffrey S. Stein
|
Director
|
March 14, 2013
|
||
|
/s/ JOHN R. SULT
John R. Sult
|
Director
|
March 14, 2013
|
||
88
DYNEGY INC.
INDEX TO CONSOLIDATED FINANCIAL STATEMENTS
|
|
|
Page
|
|
|
|
Consolidated Financial Statements
|
|
|
|
|
|
Reports of Independent Registered Public Accounting Firm
|
|
|
|
|
|
Consolidated Balance Sheets:
|
|
|
|
|
|
December 31, 2012 (Successor) and 2011 (Predecessor)
|
||||
|
Consolidated Statements of Operations:
|
|
|
|
|
|
For the period October 2, 2012 through December 31, 2012 (Successor), January 1, 2012 through October 1, 2012 and for the years ended December 31, 2011 and 2010 (Predecessor)
|
||||
|
Consolidated Statements of Comprehensive Loss:
|
|
|
|
|
|
For the period October 2, 2012 through December 31, 2012 (Successor), January 1, 2012 through October 1, 2012 and for the years ended December 31, 2011 and 2010 (Predecessor)
|
||||
|
Consolidated Statements of Cash Flows:
|
|
|
|
|
|
For the period October 2, 2012 through December 31, 2012 (Successor), January 1, 2012 through October 1, 2012 and for the years ended December 31, 2011 and 2010 (Predecessor)
|
||||
|
Consolidated Statements of Changes in Stockholders’/Member’s Equity:
|
|
|
|
|
|
For the period October 2, 2012 through December 31, 2012 (Successor), January 1, 2012 through October 1, 2012 and for the years ended December 31, 2011 and 2010 (Predecessor)
|
||||
|
Notes to Consolidated Financial Statements
|
|
|
|
|
|
Financial Statement Schedules
|
|
|
|
|
|
Schedule I—Parent Company Financial Statements
|
|
|
|
|
|
Schedule II—Valuation and Qualifying Accounts
|
|
|
|
|
F-1
Report of Independent Registered Public Accounting Firm
The Board of Directors and Stockholders
Dynegy Inc.:
We have audited Dynegy Inc.’s internal control over financial reporting as of December 31, 2012, based on criteria established in Internal Control—Integrated Framework issued by the Committee of Sponsoring Organizations of the Treadway Commission (the COSO criteria). Dynegy Inc.’s management is responsible for maintaining effective internal control over financial reporting, and for its assessment of the effectiveness of internal control over financial reporting included in the accompanying Management’s Report on Internal Control over Financial Reporting. Our responsibility is to express an opinion on the Company's internal control over financial reporting based on our audit.
We conducted our audit in accordance with the standards of the Public Company Accounting Oversight Board (United States). Those standards require that we plan and perform the audit to obtain reasonable assurance about whether effective internal control over financial reporting was maintained in all material respects. Our audit included obtaining an understanding of internal control over financial reporting, assessing the risk that a material weakness exists, testing and evaluating the design and operating effectiveness of internal control based on the assessed risk, and performing such other procedures as we considered necessary in the circumstances. We believe that our audit provides a reasonable basis for our opinion.
A company's internal control over financial reporting is a process designed to provide reasonable assurance regarding the reliability of financial reporting and the preparation of financial statements for external purposes in accordance with generally accepted accounting principles. A company's internal control over financial reporting includes those policies and procedures that (1) pertain to the maintenance of records that, in reasonable detail, accurately and fairly reflect the transactions and dispositions of the assets of the company; (2) provide reasonable assurance that transactions are recorded as necessary to permit preparation of financial statements in accordance with generally accepted accounting principles, and that receipts and expenditures of the company are being made only in accordance with authorizations of management and directors of the company; and (3) provide reasonable assurance regarding prevention or timely detection of unauthorized acquisition, use, or disposition of the company's assets that could have a material effect on the financial statements.
Because of its inherent limitations, internal control over financial reporting may not prevent or detect misstatements. Also, projections of any evaluation of effectiveness to future periods are subject to the risk that controls may become inadequate because of changes in conditions, or that the degree of compliance with the policies or procedures may deteriorate.
In our opinion, Dynegy Inc. maintained, in all material respects, effective internal control over financial reporting as of December 31, 2012, based on the COSO criteria.
We also have audited, in accordance with the standards of the Public Company Accounting Oversight Board (United States), the 2012 consolidated financial statements of Dynegy Inc. and our report dated
March 14, 2013
expressed an unqualified opinion thereon.
/s/ Ernst & Young LLP
Houston, Texas
March 14, 2013
F-2
Report of Independent Registered Public Accounting Firm
The Board of Directors and Stockholders
Dynegy Inc.:
We have audited the accompanying consolidated balance sheets of Dynegy Inc. (the Company) as of December 31, 2012 (Successor) and 2011 (Predecessor), and the related consolidated statements of operations, comprehensive loss, changes in stockholders’/member’s equity and cash flows for the period from October 2, 2012 through December 31, 2012 (Successor), the period from January 1, 2012 through October 1, 2012 (Predecessor), and for each of the two years in the period ended December 31, 2011 (Predecessor). Our audits also included the financial statement schedules listed in the Index at Item 15(a). These financial statements and schedules are the responsibility of the Company's management. Our responsibility is to express an opinion on these financial statements and schedules based on our audits.
We conducted our audits in accordance with the standards of the Public Company Accounting Oversight Board (United States). Those standards require that we plan and perform the audit to obtain reasonable assurance about whether the financial statements are free of material misstatement. An audit includes examining, on a test basis, evidence supporting the amounts and disclosures in the financial statements, assessing the accounting principles used and significant estimates made by management, as well as evaluating the overall financial statement presentation. We believe that our audits provide a reasonable basis for our opinion.
In our opinion, the financial statements referred to above present fairly, in all material respects, the consolidated financial position of Dynegy Inc. at December 31, 2012 (Successor) and 2011 (Predecessor), and the consolidated results of its operations and its cash flows for the period from October 2, 2012 through December 31, 2012 (Successor), the period from January 1, 2012 through October 1, 2012 (Predecessor), and for each of the two years in the period ended December 31, 2011 (Predecessor), in conformity with U.S. generally accepted accounting principles. Also, in our opinion, the related financial statement schedules, when considered in relation to the basic financial statements taken as a whole, present fairly in all material respects the information set forth therein.
As discussed in Note 1 to the consolidated financial statements, on September 10, 2012, the Bankruptcy Court entered an order confirming the Joint Chapter 11 Plan of Reorganization, which became effective on October, 1, 2012. Accordingly, the accompanying consolidated financial statements as of and for the period from October 2, 2012 through December 31, 2012 have been prepared in conformity with Accounting Standards Codification 852-10,
Reorganizations
, applying fresh-start accounting and thus assets, liabilities and a capital structure having carrying amounts not comparable with prior periods as described in Notes 1 and 3.
We also have audited, in accordance with the standards of the Public Company Accounting Oversight Board (United States), Dynegy Inc.’s internal control over financial reporting as of December 31, 2012, based on criteria established in Internal Control—Integrated Framework issued by the Committee of Sponsoring Organizations of the Treadway Commission and our report dated
March 14, 2013
expressed an unqualified opinion thereon.
/s/ Ernst & Young LLP
Houston, Texas
March 14, 2013
F-3
DYNEGY INC.
(in millions, except share data)
|
Successor
|
Predecessor
|
||||||||
|
|
December 31, 2012
|
December 31, 2011
|
|||||||
|
ASSETS
|
|
|
|
|
|||||
|
Current Assets
|
|
|
|
|
|||||
|
Cash and cash equivalents
|
$
|
348
|
|
$
|
398
|
|
|||
|
Restricted cash
|
98
|
|
159
|
|
|||||
|
Accounts receivable, net of allowance for doubtful accounts of zero and $12, respectively
|
108
|
|
147
|
|
|||||
|
Accounts receivable, affiliates
|
1
|
|
26
|
|
|||||
|
Interest receivable, affiliates
|
—
|
|
8
|
|
|||||
|
Inventory
|
101
|
|
65
|
|
|||||
|
Assets from risk-management activities
|
13
|
|
2,615
|
|
|||||
|
Assets from risk-management activities, affiliates
|
4
|
|
2
|
|
|||||
|
Broker margin account
|
40
|
|
23
|
|
|||||
|
Intangible assets
|
271
|
|
49
|
|
|||||
|
Prepayments and other current assets
|
59
|
|
77
|
|
|||||
|
Total Current Assets
|
1,043
|
|
3,569
|
|
|||||
|
Property, Plant and Equipment
|
3,064
|
|
3,911
|
|
|||||
|
Accumulated depreciation
|
(42
|
)
|
(1,090
|
)
|
|||||
|
Property, Plant and Equipment, Net
|
3,022
|
|
2,821
|
|
|||||
|
Other Assets
|
|
|
|
|
|||||
|
Restricted cash
|
237
|
|
455
|
|
|||||
|
Assets from risk-management activities
|
—
|
|
26
|
|
|||||
|
Intangible assets
|
71
|
|
92
|
|
|||||
|
Undertaking receivable, affiliate
|
—
|
|
1,250
|
|
|||||
|
Deferred income taxes
|
95
|
|
44
|
|
|||||
|
Other long-term assets
|
67
|
|
54
|
|
|||||
|
Total Assets
|
$
|
4,535
|
|
$
|
8,311
|
|
|||
See the notes to the consolidated financial statements.
F-4
DYNEGY INC.
CONSOLIDATED BALANCE SHEETS
(in millions, except share data)
|
Successor
|
Predecessor
|
||||||||
|
|
December 31, 2012
|
December 31, 2011
|
|||||||
|
LIABILITIES AND STOCKHOLDERS’ AND MEMBER’S EQUITY
|
|
|
|
|
|||||
|
Current Liabilities
|
|
|
|
|
|||||
|
Accounts payable
|
$
|
112
|
|
$
|
80
|
|
|||
|
Accounts payable, affiliates
|
1
|
|
47
|
|
|||||
|
Accrued interest
|
—
|
|
1
|
|
|||||
|
Deferred income taxes
|
95
|
|
50
|
|
|||||
|
Accrued liabilities and other current liabilities
|
85
|
|
64
|
|
|||||
|
Liabilities from risk-management activities
|
25
|
|
2,798
|
|
|||||
|
Liabilities from risk-management activities, affiliates
|
—
|
|
4
|
|
|||||
|
Current portion of long-term debt
|
29
|
|
7
|
|
|||||
|
Total Current Liabilities
|
347
|
|
3,051
|
|
|||||
|
Liabilities subject to compromise
|
—
|
|
4,012
|
|
|||||
|
Long-term debt
|
1,386
|
|
1,069
|
|
|||||
|
Other Liabilities
|
|
|
|
|
|||||
|
Liabilities from risk-management activities
|
42
|
|
20
|
|
|||||
|
Liabilities from risk-management activities, affiliates
|
—
|
|
3
|
|
|||||
|
Other long-term liabilities
|
257
|
|
124
|
|
|||||
|
Total Liabilities
|
2,032
|
|
8,279
|
|
|||||
|
Commitments and Contingencies (Note 22)
|
|
|
|
|
|||||
|
Stockholders’/Member’s Equity
|
|||||||||
|
Common Stock, $0.01 par value, 420,000,000 shares authorized at December 31, 2012; 99,999,196 shares issued and outstanding at December 31, 2012
|
1
|
|
—
|
|
|||||
|
Member's Contribution
|
—
|
|
5,135
|
|
|||||
|
Affiliate Receivable
|
—
|
|
(846
|
)
|
|||||
|
Additional paid-in capital
|
2,598
|
|
—
|
|
|||||
|
Accumulated other comprehensive income, net of tax
|
11
|
|
1
|
|
|||||
|
Accumulated deficit
|
(107
|
)
|
(4,258
|
)
|
|||||
|
Total Stockholders’/Member’s Equity
|
2,503
|
|
32
|
|
|||||
|
Total Liabilities and Stockholders’/Member’s Equity
|
$
|
4,535
|
|
$
|
8,311
|
|
|||
See the notes to consolidated financial statements.
F-5
DYNEGY INC.
(in millions, except per share data)
|
|
Successor
|
Predecessor
|
|||||||||||||||
|
|
October 2 Through December 31, 2012
|
January 1 Through October 1, 2012
|
Year Ended December 31, 2011
|
Year Ended December 31, 2010
|
|||||||||||||
|
Revenues
|
$
|
312
|
|
$
|
981
|
|
$
|
1,333
|
|
$
|
2,059
|
|
|||||
|
Cost of sales
|
(268
|
)
|
(662
|
)
|
(866
|
)
|
(1,060
|
)
|
|||||||||
|
Gross margin, exclusive of depreciation shown separately below
|
44
|
|
319
|
|
467
|
|
999
|
|
|||||||||
|
Operating and maintenance expense, exclusive of depreciation shown separately below
|
(81
|
)
|
(148
|
)
|
|
(254
|
)
|
(330
|
)
|
||||||||
|
Depreciation and amortization expense
|
(45
|
)
|
(110
|
)
|
(295
|
)
|
(397
|
)
|
|||||||||
|
Impairment and other charges
|
—
|
|
—
|
|
(5
|
)
|
(146
|
)
|
|||||||||
|
General and administrative expense
|
(22
|
)
|
(56
|
)
|
(102
|
)
|
(158
|
)
|
|||||||||
|
Operating income (loss)
|
(104
|
)
|
5
|
|
(189
|
)
|
(32
|
)
|
|||||||||
|
Bankruptcy reorganization items, net
|
(3
|
)
|
1,037
|
|
(52
|
)
|
—
|
|
|||||||||
|
Earnings (losses) from unconsolidated investments
|
2
|
|
—
|
|
—
|
|
(62
|
)
|
|||||||||
|
Interest expense
|
(16
|
)
|
(120
|
)
|
(348
|
)
|
(363
|
)
|
|||||||||
|
Debt extinguishment costs
|
—
|
|
—
|
|
(21
|
)
|
—
|
|
|||||||||
|
Impairment of Undertaking receivable, affiliate
|
—
|
|
(832
|
)
|
—
|
|
—
|
|
|||||||||
|
Other income and expense, net
|
8
|
|
31
|
|
35
|
|
4
|
|
|||||||||
|
Income (loss) from continuing operations before income taxes
|
(113
|
)
|
121
|
|
(575
|
)
|
(453
|
)
|
|||||||||
|
Income tax benefit (Note 20)
|
—
|
|
9
|
|
144
|
|
194
|
|
|||||||||
|
Income (loss) from continuing operations
|
(113
|
)
|
130
|
|
(431
|
)
|
(259
|
)
|
|||||||||
|
Income (loss) from discontinued operations, net of tax expense (benefit) of zero, zero, $171 million and ($10) million, respectively
|
6
|
|
(162
|
)
|
(509
|
)
|
17
|
|
|||||||||
|
Net loss
|
$
|
(107
|
)
|
$
|
(32
|
)
|
$
|
(940
|
)
|
$
|
(242
|
)
|
|||||
|
Loss Per Share (Note 21):
|
|||||||||||||||||
|
Basic loss per share:
|
|||||||||||||||||
|
Loss from continuing operations
|
$
|
(1.13
|
)
|
N/A
|
|
N/A
|
|
N/A
|
|
||||||||
|
Income from discontinued operations
|
0.06
|
|
N/A
|
|
N/A
|
|
N/A
|
|
|||||||||
|
Basic loss per share
|
$
|
(1.07
|
)
|
N/A
|
|
N/A
|
|
N/A
|
|
||||||||
|
Diluted loss per share:
|
|||||||||||||||||
|
Loss from continuing operations
|
$
|
(1.13
|
)
|
N/A
|
|
N/A
|
|
N/A
|
|
||||||||
|
Income from discontinued operations
|
0.06
|
|
N/A
|
|
N/A
|
|
N/A
|
|
|||||||||
|
Diluted loss per share
|
$
|
(1.07
|
)
|
N/A
|
|
N/A
|
|
N/A
|
|
||||||||
|
Basic shares outstanding
|
100
|
|
N/A
|
|
N/A
|
|
N/A
|
|
|||||||||
|
Diluted shares outstanding
|
100
|
|
N/A
|
|
N/A
|
|
N/A
|
|
|||||||||
See the notes to consolidated financial statements.
F-6
DYNEGY INC.
CONSOLIDATED STATEMENTS OF COMPREHENSIVE LOSS
(in millions)
|
Successor
|
Predecessor
|
|||||||||||||||
|
|
October 2 Through December 31, 2012
|
January 1 Through October 1, 2012
|
Year Ended December 31, 2011
|
Year Ended December 31, 2010
|
||||||||||||
|
Net income (loss)
|
$
|
(107
|
)
|
$
|
(32
|
)
|
$
|
(940
|
)
|
$
|
(242
|
)
|
||||
|
Cash flow hedging activities, net:
|
||||||||||||||||
|
Reclassification of mark-to-market gains to earnings, net
|
—
|
|
—
|
|
(2
|
)
|
—
|
|
||||||||
|
Changes in cash flow hedging activities, net (net of tax benefit of zero, zero, $3, and zero, respectively)
|
—
|
|
—
|
|
(2
|
)
|
|
—
|
|
|||||||
|
Actuarial gain and amortization of unrecognized prior service cost and actuarial loss (net of tax expense of zero, zero, $(2) and $(1), respectively)
|
11
|
|
(1
|
)
|
4
|
|
3
|
|
||||||||
|
Unconsolidated investment other comprehensive loss, net (net of tax expense of zero, zero, zero and $(11), respectively)
|
—
|
|
—
|
|
—
|
|
17
|
|
||||||||
|
Other comprehensive income (loss), net of tax
|
11
|
|
(1
|
)
|
2
|
|
20
|
|
||||||||
|
Total comprehensive loss
|
$
|
(96
|
)
|
$
|
(33
|
)
|
$
|
(938
|
)
|
$
|
(222
|
)
|
||||
See the notes to consolidated financial statements.
F-7
DYNEGY INC.
(in millions)
|
Successor
|
Predecessor
|
||||||||||||||||
|
|
October 2 Through December 31, 2012
|
January 1 Through October 1, 2012
|
Year Ended December 31, 2011
|
Year Ended December 31, 2010
|
|||||||||||||
|
CASH FLOWS FROM OPERATING ACTIVITIES:
|
|
|
|
|
|||||||||||||
|
Net loss
|
$
|
(107
|
)
|
$
|
(32
|
)
|
$
|
(940
|
)
|
$
|
(242
|
)
|
|||||
|
Adjustments to reconcile net income (loss) to net cash flows from operating activities:
|
|||||||||||||||||
|
Depreciation and amortization
|
26
|
|
118
|
|
308
|
|
408
|
|
|||||||||
|
Amortization of intangibles
|
60
|
|
79
|
|
39
|
|
49
|
|
|||||||||
|
Bankruptcy reorganization items, net
|
—
|
|
(947
|
)
|
663
|
|
—
|
|
|||||||||
|
Impairment and other charges
|
—
|
|
832
|
|
2
|
|
136
|
|
|||||||||
|
Losses from unconsolidated investments, net of cash distributions
|
—
|
|
—
|
|
—
|
|
62
|
|
|||||||||
|
Risk-management activities
|
(46
|
)
|
(82
|
)
|
199
|
|
(19
|
)
|
|||||||||
|
Gain on sale of assets, net
|
—
|
|
—
|
|
(1
|
)
|
—
|
|
|||||||||
|
Deferred income taxes
|
—
|
|
(9
|
)
|
(315
|
)
|
(182
|
)
|
|||||||||
|
Debt extinguishment costs
|
—
|
|
—
|
|
21
|
|
—
|
|
|||||||||
|
Other
|
(11
|
)
|
(10
|
)
|
7
|
|
19
|
|
|||||||||
|
Changes in working capital:
|
|||||||||||||||||
|
Accounts receivable
|
—
|
|
9
|
|
81
|
|
(14
|
)
|
|||||||||
|
Inventory
|
1
|
|
7
|
|
12
|
|
16
|
|
|||||||||
|
Broker margin account
|
(1
|
)
|
(12
|
)
|
(59
|
)
|
290
|
|
|||||||||
|
Prepayments and other current assets
|
50
|
|
(31
|
)
|
11
|
|
(8
|
)
|
|||||||||
|
Accounts payable and accrued liabilities
|
(3
|
)
|
38
|
|
130
|
|
(20
|
)
|
|||||||||
|
Affiliate transactions
|
—
|
|
19
|
|
(73
|
)
|
—
|
|
|||||||||
|
Changes in non-current assets
|
(10
|
)
|
(16
|
)
|
(87
|
)
|
(67
|
)
|
|||||||||
|
Changes in non-current liabilities
|
(3
|
)
|
—
|
|
1
|
|
(5
|
)
|
|||||||||
|
Net cash provided by (used in) operating activities
|
$
|
(44
|
)
|
$
|
(37
|
)
|
$
|
(1
|
)
|
$
|
423
|
|
|||||
|
CASH FLOWS FROM INVESTING ACTIVITIES:
|
|
|
|
|
|||||||||||||
|
Capital expenditures
|
(46
|
)
|
(63
|
)
|
(196
|
)
|
(333
|
)
|
|||||||||
|
Unconsolidated investments
|
—
|
|
—
|
|
—
|
|
(15
|
)
|
|||||||||
|
Maturities of short-term investments
|
—
|
|
—
|
|
419
|
|
302
|
|
|||||||||
|
Purchases of short-term investments
|
—
|
|
—
|
|
(244
|
)
|
(477
|
)
|
|||||||||
|
Decrease (increase) in restricted cash and investments
|
311
|
|
88
|
|
222
|
|
(3
|
)
|
|||||||||
|
Acquisitions/divestitures
|
—
|
|
256
|
|
(441
|
)
|
—
|
|
|||||||||
|
Deconsolidation of DNE Debtor Entities
|
—
|
|
(22
|
)
|
—
|
|
—
|
|
|||||||||
|
Other investing
|
—
|
|
19
|
|
11
|
|
6
|
|
|||||||||
|
Net cash provided by (used in) investing activities
|
$
|
265
|
|
$
|
278
|
|
$
|
(229
|
)
|
$
|
(520
|
)
|
|||||
|
CASH FLOWS FROM FINANCING ACTIVITIES:
|
|||||||||||||||||
|
Payment to unsecured creditors
|
—
|
|
(200
|
)
|
—
|
|
—
|
|
|||||||||
|
Proceeds from long-term borrowings, net of financing costs
|
—
|
|
—
|
|
2,022
|
|
(6
|
)
|
|||||||||
|
Repayments of borrowings, including debt extinguishment costs
|
(328
|
)
|
(11
|
)
|
(1,647
|
)
|
(63
|
)
|
|||||||||
|
Recapitalization of Legacy Dynegy
|
—
|
|
27
|
|
—
|
|
—
|
|
|||||||||
|
Net cash provided by (used in) financing activities
|
$
|
(328
|
)
|
$
|
(184
|
)
|
$
|
375
|
|
$
|
(69
|
)
|
|||||
|
Net increase (decrease) in cash and cash equivalents
|
(107
|
)
|
57
|
|
145
|
|
(166
|
)
|
|||||||||
|
Cash and cash equivalents, beginning of period
|
455
|
|
398
|
|
253
|
|
419
|
|
|||||||||
|
Cash and cash equivalents, end of period
|
$
|
348
|
|
$
|
455
|
|
$
|
398
|
|
$
|
253
|
|
|||||
See the notes to consolidated financial statements.
F-8
DYNEGY INC.
CONSOLIDATED STATEMENTS OF CHANGES IN STOCKHOLDERS’/MEMBER’S EQUITY
(in millions)
|
Common Stock
|
Additional Paid-In Capital
|
Member's Contribution
|
Affiliate Receivable
|
AOCI (Loss)
|
Accumulated Deficit
|
Total Controlling Interests
|
Non- Controlling Interests
|
Total Stockholders’/Member's Equity
|
|||||||||||||||||||||||||||
|
December 31, 2009 (Predecessor)
|
$
|
—
|
|
$
|
—
|
|
$
|
5,135
|
|
$
|
(777
|
)
|
$
|
(150
|
)
|
$
|
(1,282
|
)
|
$
|
2,926
|
|
$
|
77
|
|
$
|
3,003
|
|
||||||||
|
Deconsolidation of Plum Point
|
—
|
|
—
|
|
—
|
|
—
|
|
77
|
|
(25
|
)
|
52
|
|
(77
|
)
|
(25
|
)
|
|||||||||||||||||
|
Net loss
|
—
|
|
—
|
|
—
|
|
—
|
|
—
|
|
(242
|
)
|
(242
|
)
|
—
|
|
(242
|
)
|
|||||||||||||||||
|
Other comprehensive income, net of tax
|
—
|
|
—
|
|
—
|
|
—
|
|
20
|
|
—
|
|
20
|
|
—
|
|
20
|
|
|||||||||||||||||
|
Affiliate activity (Note 19)
|
—
|
|
—
|
|
—
|
|
(37
|
)
|
—
|
|
—
|
|
(37
|
)
|
—
|
|
(37
|
)
|
|||||||||||||||||
|
December 31, 2010 (Predecessor)
|
$
|
—
|
|
$
|
—
|
|
$
|
5,135
|
|
$
|
(814
|
)
|
$
|
(53
|
)
|
$
|
(1,549
|
)
|
$
|
2,719
|
|
$
|
—
|
|
$
|
2,719
|
|
||||||||
|
Net loss
|
—
|
|
—
|
|
—
|
|
—
|
|
—
|
|
(940
|
)
|
(940
|
)
|
—
|
|
(940
|
)
|
|||||||||||||||||
|
Other comprehensive income, net of tax
|
—
|
|
—
|
|
—
|
|
—
|
|
2
|
|
—
|
|
2
|
|
—
|
|
2
|
|
|||||||||||||||||
|
Affiliate activity (Note 19)
|
—
|
|
—
|
|
—
|
|
20
|
|
—
|
|
—
|
|
20
|
|
—
|
|
20
|
|
|||||||||||||||||
|
DMG Transfer
|
—
|
|
—
|
|
—
|
|
(52
|
)
|
52
|
|
(1,769
|
)
|
(1,769
|
)
|
—
|
|
(1,769
|
)
|
|||||||||||||||||
|
December 31, 2011 (Predecessor)
|
$
|
—
|
|
$
|
—
|
|
$
|
5,135
|
|
$
|
(846
|
)
|
$
|
1
|
|
$
|
(4,258
|
)
|
$
|
32
|
|
$
|
—
|
|
$
|
32
|
|
||||||||
|
Net loss
|
—
|
|
—
|
|
—
|
|
—
|
|
—
|
|
(32
|
)
|
(32
|
)
|
—
|
|
(32
|
)
|
|||||||||||||||||
|
Other comprehensive income, net of tax
|
—
|
|
—
|
|
—
|
|
—
|
|
(1
|
)
|
—
|
|
(1
|
)
|
—
|
|
(1
|
)
|
|||||||||||||||||
|
Affiliate activity (Note 19)
|
—
|
|
—
|
|
—
|
|
846
|
|
—
|
|
(846
|
)
|
—
|
|
—
|
|
—
|
|
|||||||||||||||||
|
DMG Acquisition
|
—
|
|
—
|
|
—
|
|
—
|
|
(24
|
)
|
—
|
|
(24
|
)
|
—
|
|
(24
|
)
|
|||||||||||||||||
|
Merger
|
1
|
|
5,166
|
|
(5,135
|
)
|
—
|
|
—
|
|
—
|
|
32
|
|
—
|
|
32
|
|
|||||||||||||||||
|
October 1, 2012 (Predecessor)
|
$
|
1
|
|
$
|
5,166
|
|
$
|
—
|
|
$
|
—
|
|
$
|
(24
|
)
|
$
|
(5,136
|
)
|
$
|
7
|
|
$
|
—
|
|
$
|
7
|
|
||||||||
|
Fresh-start adjustments:
|
|||||||||||||||||||||||||||||||||||
|
Elimination of Predecessor equity
|
(1
|
)
|
(5,166
|
)
|
—
|
|
—
|
|
24
|
|
5,136
|
|
|
(7
|
)
|
—
|
|
(7
|
)
|
||||||||||||||||
|
Issuance of new equity interests
|
1
|
|
2,597
|
|
—
|
|
—
|
|
—
|
|
—
|
|
|
2,598
|
|
—
|
|
2,598
|
|
||||||||||||||||
|
October 2, 2012 (Successor)
|
$
|
1
|
|
$
|
2,597
|
|
$
|
—
|
|
$
|
—
|
|
$
|
—
|
|
$
|
—
|
|
$
|
2,598
|
|
$
|
—
|
|
$
|
2,598
|
|
||||||||
|
Net loss
|
—
|
|
—
|
|
—
|
|
—
|
|
—
|
|
(107
|
)
|
(107
|
)
|
—
|
|
(107
|
)
|
|||||||||||||||||
|
Share-based compensation expense
|
—
|
|
1
|
|
—
|
|
—
|
|
—
|
|
—
|
|
1
|
|
—
|
|
1
|
|
|||||||||||||||||
|
Other comprehensive income, net of tax
|
—
|
|
—
|
|
—
|
|
—
|
|
11
|
|
—
|
|
11
|
|
—
|
|
11
|
|
|||||||||||||||||
|
December 31, 2012 (Successor)
|
$
|
1
|
|
$
|
2,598
|
|
$
|
—
|
|
$
|
—
|
|
$
|
11
|
|
$
|
(107
|
)
|
$
|
2,503
|
|
$
|
—
|
|
$
|
2,503
|
|
||||||||
See the notes to consolidated financial statements.
F-9
DYNEGY INC.
NOTES TO CONSOLIDATED FINANCIAL STATEMENTS
Note 1—Organization and Operations
We are a holding company and conduct substantially all of our business operations through our subsidiaries. Our current business operations are focused primarily on the power generation sector of the energy industry. Unless the context indicates otherwise, throughout this report, the terms “Dynegy,” “the Company,” “we,” “us,” “our,” and “ours” are used to refer to Dynegy Inc. and its direct and indirect subsidiaries. Discussions or areas of this report that apply only to Dynegy, Legacy Dynegy (as defined below) or DH (as defined below) are clearly noted in such sections or areas and specific defined terms may be introduced for use only in those sections or areas. We report the results of our power generation business as
two
segments in our consolidated financial statements: (i) the Coal segment (“Coal”) and (ii) the Gas segment (“Gas”). Our consolidated financial results also reflect corporate-level expenses such as general and administrative expense, interest expense and depreciation and amortization expense.
The Gas segment includes Dynegy Power, LLC (“DPC”), which owns, directly and indirectly, substantially all of our wholly-owned natural gas-fired power generation facilities. DPC, a bankruptcy remote entity, and its direct and indirect subsidiaries are organized into a ring-fenced group for the benefit of the creditors of DPC.
The Coal segment includes Dynegy Midwest Generation, LLC (“DMG”), which owns, directly and indirectly, substantially all of our coal-fired power generation facilities. DMG, also a bankruptcy remote entity, and its direct and indirect subsidiaries are organized into a ring-fenced group for the benefit of the creditors of DMG.
Merger.
On September 30, 2012, pursuant to the terms of the Joint Chapter 11 Plan of Reorganization (the “Plan”) for Dynegy Holdings, LLC (“DH”) and Dynegy Inc. (“Dynegy”), DH merged with and into Dynegy, with Dynegy continuing as the surviving legal entity (the “Merger”). Immediately prior to the Merger, Legacy Dynegy had no substantive operations as our power generation facilities were operated through subsidiaries of DH. Further, as a result of the DH Chapter 11 Cases (as defined below) in 2011, under applicable accounting standards, Dynegy was no longer deemed to have a controlling financial interest in DH and its wholly-owned subsidiaries; therefore, DH and its consolidated subsidiaries were no longer consolidated in Dynegy's consolidated financial statements as of
November 7, 2011
. As a result of these factors, the Merger was accounted for in a manner similar to a reverse merger, whereby DH is the surviving accounting entity for financial reporting purposes. Therefore, our historical results for periods prior to the Merger are the same as DH's historical results; accordingly, we refer to Dynegy as “Legacy Dynegy” for periods prior to the Merger.
Further, the net assets contributed by Legacy Dynegy, which amounted to
$32 million
, did not constitute a business and were therefore treated in a manner similar to a recapitalization and were credited to stockholders’ equity. Prior to the Merger, DH was organized as a limited liability company and the capital structure of DH did not change until September 30, 2012. Although Legacy Dynegy’s shares were publicly traded, DH did not have any publicly traded shares prior to the merger; therefore, no earnings (loss) per share is presented for our predecessor.
DMG Transfer and DMG Acquisition.
On September 1, 2011, Legacy Dynegy and Dynegy Gas Investments, LLC (“DGIN”), a subsidiary of DH, entered into a Membership Interest Purchase Agreement pursuant to which DGIN transferred
100 percent
of its outstanding membership interests in Coal Holdco, a wholly owned subsidiary of DGIN, to Legacy Dynegy (the “DMG Transfer”). Legacy Dynegy’s management and Board of Directors, as well as DGIN’s board of managers, concluded that the fair value of the acquired equity stake in Coal Holdco at the time of the transaction was approximately
$1.25 billion
, after taking into account all debt obligations of DMG, including in particular the DMG Credit Agreement. Legacy Dynegy provided this value to DGIN in exchange for Coal Holdco through its obligation, pursuant to an unsecured Undertaking Agreement (the “Undertaking Agreement”), to make certain specified payments over time which coincided in timing and amount with the payments of principal and interest that we were obligated to make under a portion of our then existing
$1.1 billion
of
7.75 percent
senior unsecured notes due 2019 and our
$175 million
of
7.625 percent
senior debentures due 2026. The Undertaking Agreement did not provide any rights or obligations with respect to any of our outstanding notes or debentures, including the notes and debentures due in 2019 and 2026.
Immediately after closing the DMG Transfer, DGIN assigned its right to receive payments under the Undertaking
Agreement to us in exchange for a promissory note (the “Promissory Note”) in the amount of
$1.25 billion
that matured in
2027 (the “Assignment”). Legacy Dynegy’s obligations under the Undertaking Agreement would have been reduced if the outstanding principal amount of any of our
$3.5 billion
of outstanding notes and debentures decreased as a result of any exchange offer, tender offer or other purchase or repayment by Legacy Dynegy or its subsidiaries (other than DH and its subsidiaries, unless Legacy Dynegy guaranteed the debt securities of us or such subsidiary in connection with such exchange offer, tender offer or other purchase or repayment); provided that such principal amount was retired, cancelled or otherwise forgiven. On June 5, 2012, the effective date of the Settlement Agreement, DH reacquired Coal Holdco from Legacy Dynegy
F-10
DYNEGY INC.
NOTES TO CONSOLIDATED FINANCIAL STATEMENTS (Continued)
(the “DMG Acquisition”). At such time, the Undertaking Agreement and Promissory Note were terminated with no further obligations thereunder. Please read
Note 3—Emergence from Bankruptcy and Fresh-Start Accounting
for further discussion.
As a result of the above transactions, the results of our Coal segment are only included in our 2011 consolidated results through August 31, 2011 and are only included in our 2012 consolidated results subsequent to June 5, 2012. Please read
Note 4—Merger and Acquisition
—DMG Acquisition for further discussion.
Chapter 11 Filing and Emergence from Bankruptcy.
On November 7, 2011, DH and
four
of its wholly-owned subsidiaries, Dynegy Northeast Generation, Inc. (“Dynegy Northeast Generation”), Hudson Power, L.L.C. (“Hudson”), Dynegy Danskammer, L.L.C. (“Danskammer”) and Dynegy Roseton, L.L.C. (“Roseton”, and together with DH, DNE, Hudson and Danskammer, the “DH Debtor Entities”) filed voluntary petitions (the “DH Chapter 11 Cases”) for relief under Chapter 11 of Title 11 of the United States Code (the “Bankruptcy Code”) in the United States Bankruptcy Court for the Southern District of New York, Poughkeepsie Division (the “Bankruptcy Court”). The DH Chapter 11 Cases were assigned to the Honorable Cecelia G. Morris and were being jointly administered for procedural purposes only. On July 6, 2012, Legacy Dynegy filed a voluntary petition for relief under Chapter 11 of the Bankruptcy Code in the Bankruptcy Court (the “Dynegy Chapter 11 Case,” and together with the DH Chapter 11 Cases, the “Chapter 11 Cases”). Only Legacy Dynegy and the DH Debtor Entities filed voluntary petitions for relief under the Bankruptcy Code, and none of our other direct or indirect subsidiaries are or were debtors thereunder. Consequently, our other direct or indirect subsidiaries continued to operate their business in the ordinary course. Legacy Dynegy and the DH Debtor Entities (together, the “Debtor Entities”) remained in possession of their property and continued to operate their business as “debtors in possession” under the jurisdiction of the Bankruptcy Court and in accordance with the applicable provisions of the Bankruptcy Code and orders of the Bankruptcy Court. The Dynegy Chapter 11 Case was a necessary step to facilitate the restructuring contemplated by the Plan, the Settlement Agreement and the Plan Support Agreement (each as defined and described in
Note 3—Emergence from Bankruptcy and Fresh-Start Accounting
), including the Merger.
On September 10, 2012, the Bankruptcy Court entered an order confirming the Plan and on October 1, 2012, (the “Plan Effective Date”), we consummated our reorganization under Chapter 11 pursuant to the Plan and Dynegy exited bankruptcy. Dynegy Northeast Generation, Hudson, Danskammer and Roseton (the “DNE Debtor Entities”) remain in Chapter 11 bankruptcy and continue to operate their businesses as “debtors-in-possession” (the “DNE Bankruptcy Cases”). As a result, we deconsolidated the DNE Debtor Entities on the Plan Effective Date. Please read
Note 3—Emergence from Bankruptcy and Fresh-Start Accounting
and
Note 15—Variable Interest Entities
for further discussion.
On the Plan Effective Date, we applied “fresh-start accounting.” Fresh-start accounting requires us to allocate the reorganization value to our assets and liabilities in a manner similar to that which is required using the acquisition method of accounting for a business combination. Under the provisions of fresh-start accounting, a new entity has been created for financial reporting purposes. References to “Successor” in the financial statements are in reference to reporting dates on or after October 2, 2012. References to “Predecessor” in the financial statements are in reference to reporting dates through October 1, 2012, including the impact of the Plan provisions and the application of fresh-start accounting. As such, our financial information for the Successor is presented on a basis different from, and is therefore not comparable to, our financial information for the Predecessor for the period ended and as of October 1, 2012 or for prior periods. For further information on fresh-start accounting, please read
Note 3—Emergence from Bankruptcy and Fresh-Start Accounting
.
Note 2—Summary of Significant Accounting Policies
Principles of Consolidation and Basis of Presentation.
Between November 7, 2011 and September 30, 2012, we operated as a debtor-in-possession under the supervision of the Bankruptcy Court. For financial reporting purposes, close of business on October 1, 2012, represents the date of our emergence from bankruptcy. As used herein, the following terms refer to the Company and its operations:
|
“Predecessor”
|
The Company, pre-emergence from bankruptcy
|
|
|
“2012 Predecessor Period”
|
The Company’s operations, January 1, 2012 — October 1, 2012
|
|
|
“Successor”
|
The Company, post-emergence from bankruptcy
|
|
|
“Successor Period” (1)
|
The Company’s operations, October 2, 2012 — December 31, 2012
|
|
__________________________________________
|
(1)
|
For convenience purposes, we have included the results of operations, excluding the Effects of the Plan, for October 1, 2012 in the Successor Period.
|
F-11
DYNEGY INC.
NOTES TO CONSOLIDATED FINANCIAL STATEMENTS (Continued)
The accompanying consolidated financial statements include our accounts and the accounts of our majority-owned or controlled subsidiaries and VIEs for which we are the primary beneficiary. Intercompany accounts and transactions have been eliminated. Accounting policies for all of our operations are in accordance with accounting principles generally accepted in the United States of America.
Fresh-Start Accounting.
Certain companies qualify for fresh-start accounting in connection with their emergence from bankruptcy. Fresh-start accounting is appropriate on the emergence from bankruptcy if the reorganization value of the assets of the emerging entity immediately before the date of confirmation is less than the total of all post-petition liabilities and allowed claims, and if the holders of existing voting shares immediately before confirmation receive less than
50
percent of the voting shares of the emerging entity. We met these requirements on the Plan Effective Date and adopted fresh-start accounting resulting in the creation of a new reporting entity designated as the Successor.
The bankruptcy court issued a confirmation order approving our Plan of reorganization on September 10, 2012 and we met the requirements of the Plan on October 1, 2012. Under the requirements of fresh-start accounting, we have adjusted our assets and liabilities to their estimated fair values as of October 1, 2012 in conformity with the guidance for the acquisition method of accounting for business combinations. The net effect of all fresh-start adjustments, including the effects of implementing the plan, resulted in a gain of approximately
$1.2 billion
, which is reflected in the 2012 Predecessor Period. The application of the fresh-start provisions created a new reporting entity having no retained earnings nor accumulated deficit.
Our fresh-start adjustments consist primarily of (i) estimates of the fair value of our existing fixed assets and liabilities and (ii) recognition of the fair value of certain sales, coal purchase and transportation contracts, with terms that were not at current market value, as either intangible assets or liabilities. These intangible assets and liabilities will be amortized into income over the respective terms of each contract. A description of the adjustments and amounts is provided in
Note 3—Emergence from Bankruptcy and Fresh-Start Accounting
.
Due to the application of the fresh-start accounting upon our emergence from bankruptcy, the Successor's consolidated financial statements have not been prepared on a consistent basis with the Predecessor’s financial statements and are therefore not comparable.
Use of Estimates.
The preparation of consolidated financial statements in conformity with GAAP requires management to make informed estimates and judgments that affect our reported financial position and results of operations based on currently available information. We review significant estimates and judgments affecting our consolidated financial statements on a recurring basis and record the effect of any necessary adjustments. Uncertainties with respect to such estimates and judgments are inherent in the preparation of financial statements. Estimates and judgments are used in, among other things, (i) developing fair value assumptions, including estimates of future cash flows and discount rates, (ii) analyzing tangible and intangible assets for possible impairment, (iii) estimating the useful lives of our assets and AROs, (iv) assessing future tax exposure and the realization of deferred tax assets, (v) determining amounts to accrue for contingencies, guarantees, indemnifications and estimated allowed claims for pre-petition liabilities, and (vi) estimating various factors used to value our pension assets and liabilities. Actual results could differ materially from our estimates. In the opinion of management, all adjustments considered necessary for a fair presentation have been included.
Cash and Cash Equivalents.
Cash and cash equivalents consist of all demand deposits and funds invested in highly liquid short-term investments with original maturities of three months or less.
Restricted Cash.
Restricted cash represent cash that is not readily available for general purpose cash needs. Restricted cash is classified as a current or long-term asset based on the timing and nature of when or how the cash is expected to be used or when the restrictions are expected to lapse. We include all changes in restricted cash in investing cash flows on the consolidated statement of cash flows. Please read
Note 18—Debt
—Restricted Cash for further discussion.
Accounts Receivable and Allowance for Doubtful Accounts.
We record accounts receivable at the net realizable value when the product or service is delivered to the customer. We establish provisions for losses on accounts receivable if it becomes probable we will not collect all or part of outstanding balances. We review collectability and establish or adjust our allowance as necessary using the specific identification method.
Unconsolidated Investments.
We use the equity method of accounting for investments in affiliates over which we exercise significant influence. We use the cost method of accounting for VIEs where we are not the primary beneficiary and do not exercise significant influence.
Our share of net income (loss) from these affiliates is reflected in the consolidated statements of operations as earnings (losses) from unconsolidated investments. Any excess of our investment in affiliates, as compared to our share of the underlying equity that is not recognized as goodwill, that represents identifiable other intangible assets, is amortized over the estimated economic service lives of the underlying assets, or, in the instances where the useful lives cannot be determined, the
F-12
DYNEGY INC.
NOTES TO CONSOLIDATED FINANCIAL STATEMENTS (Continued)
excess is assessed each reporting period for impairment or to determine if the useful life can be estimated. All investments in unconsolidated affiliates are periodically assessed for other-than-temporary declines in value, with write-downs recognized in earnings from unconsolidated investments in the consolidated statements of operations.
Please read
Note 7—Impairment and Restructuring Charges
for a discussion of impairment charges we recognized in 2010 related to our investment in Plum Point and
Note 6—Dispositions and Discontinued Operations
for a discussion of discontinued operations related to the deconsolidation of DNE.
Inventory.
Our natural gas, coal, emissions allowances and fuel oil inventories are carried at the lower of weighted average cost or market. Our materials and supplies inventories are carried at the lower of cost or market using the specific identification method. We use the average cost method to determine cost.
In connection with the application of fresh-start accounting, all inventories were adjusted to their estimated fair value on the Plan Effective Date.
Our Predecessor sold emission allowances that related to future periods and, to the extent the proceeds received from the sale of such allowances exceeded our cost, we deferred the associated gain until the period to which the allowance related. As of
December 31, 2012 and 2011
, we had no deferred gains. We recognized
$8 million
and
$3 million
in revenue for years ended
December 31, 2011 and 2010
, respectively, related to sales of emissions credits.
Property, Plant and Equipment.
Property, plant and equipment, which consists principally of power generating facilities, including capitalized interest, is generally recorded at historical cost; however, all of our property, plant and equipment was adjusted to its estimated fair value on the Plan Effective Date in connection with the application of fresh-start accounting. Expenditures for major installations, replacements, and improvements or betterments are capitalized and depreciated over the expected life cycle. Expenditures for maintenance, repairs and minor renewals to maintain the operating condition of our assets are expensed. Depreciation is provided using the straight-line method over the estimated economic service lives of the assets, ranging from
one
to
36
years.
The estimated economic service lives of our asset groups are as follows:
|
Asset Group
|
|
Range of
Years
|
|
|
Power generation facilities
|
|
|
1 to 30
|
|
Environmental upgrades
|
10 to 30
|
||
|
Buildings and improvements
|
|
|
7 to 36
|
|
Office and miscellaneous equipment
|
|
|
2 to 15
|
Gains and losses on sales of individual assets or asset groups are reflected in Loss on sale of assets in the consolidated statements of operations. We assess the carrying value of our property, plant and equipment to determine if an impairment is indicated when a triggering event occurs. If an impairment is indicated, the amount of the impairment loss recognized would be determined by the amount by which the carrying value exceeds the estimated fair value of the assets. The estimated fair value may include estimates based upon discounted cash-flow projections, recent comparable market transactions or quoted prices to determine if an impairment loss is required. For assets classified as held for sale, the book value is compared to the estimated sales price less costs to sell to determine if an impairment is required.
Please read
Note 7—Impairment and Restructuring Charges
for a discussion of impairment charges we recognized in 2012, 2011 and 2010.
Intangible Assets.
Intangible assets represent the fair value of assets, apart from goodwill, that arise from contractual rights or other legal rights. We record intangible assets that are distinctly separable from goodwill and can be sold, transferred, licensed, rented, or otherwise exchanged in the open market.
Additionally, we recognize as intangible assets those assets that can be exchanged in combination with other rights, contracts, assets or liabilities.
We initially record and measure intangible assets based on the fair value of those rights transferred in the transaction in which the asset was acquired. Additionally, we recorded intangible assets in connection with the application of fresh-start accounting. The intangible assets are based on quoted market prices for the asset, if available, or measurement techniques based on the best information available such as a present value of future cash flows. Present value measurement techniques involve judgments and estimates made by management about prices, cash flows, discount factors and other variables, and the actual value realized from those assets could vary materially from these judgments and estimates. We amortize our definite-
F-13
DYNEGY INC.
NOTES TO CONSOLIDATED FINANCIAL STATEMENTS (Continued)
lived intangible assets based on the useful life of the respective asset as measured by the life of the underlying contract or contracts. Intangible assets that are not subject to amortization are subjected to impairment testing on an annual basis or when a triggering event occurs, and an impairment loss is recognized if the carrying amount of an intangible asset exceeds its fair value. We do not currently have any intangible assets that are not subject to amortization.
Asset Retirement Obligations.
We record the present value of our legal obligations to retire tangible, long-lived assets on our balance sheets as liabilities when the liability is incurred. Significant judgment is involved in estimating future cash flows associated with such obligations, as well as the ultimate timing of the cash flows. Our AROs relate to activities such as ash pond and landfill capping, dismantlement of power generation facilities, future removal of asbestos containing material from certain power generation facilities, closure and post-closure costs, environmental testing, remediation, monitoring and land and equipment lease obligations. Accretion expense is included in Operating and maintenance expense on our consolidated statements of operations. A summary of changes in our AROs is as follows:
|
Successor
|
Predecessor
|
||||||||||||||||
|
|
October 2 Through December 31,
|
January 1 Through October 1,
|
Year Ended December 31,
|
||||||||||||||
|
(amounts in millions)
|
2012
|
2012
|
2011
|
2010
|
|||||||||||||
|
Beginning of period
|
$
|
83
|
|
$
|
50
|
|
$
|
120
|
|
$
|
120
|
|
|||||
|
Accretion expense
|
1
|
|
3
|
|
6
|
|
10
|
|
|||||||||
|
Divestiture of assets
|
—
|
|
—
|
|
1
|
|
—
|
|
|||||||||
|
Revision of previous estimate (1)
|
—
|
|
(16
|
)
|
(24
|
)
|
(10
|
)
|
|||||||||
|
DMG Transfer (2)
|
—
|
|
—
|
|
(53
|
)
|
—
|
|
|||||||||
|
DMG Acquisition (2)
|
—
|
|
53
|
|
—
|
|
—
|
|
|||||||||
|
Fresh-start adjustments
|
—
|
|
5
|
|
—
|
|
—
|
|
|||||||||
|
Deconsolidation of DNE (3)
|
—
|
|
(11
|
)
|
—
|
|
—
|
|
|||||||||
|
Expenditures
|
(1
|
)
|
(1
|
)
|
—
|
|
—
|
|
|||||||||
|
End of year
|
$
|
83
|
|
$
|
83
|
|
$
|
50
|
|
$
|
120
|
|
|||||
__________________________________________
|
(1)
|
During the 2012 Predecessor Period, we revised the South Bay ARO obligation downward by
$16 million
based on revised cost estimates related to the plant demolition. During 2011, we revised our ARO obligation downward by
$24 million
based on revised cost estimates related to remediation of asbestos, plant demolition and ash ponds. During 2010, we revised our ARO obligation downward by
$5 million
based on revisions to the timing of the remediation obligations within our Coal fleet and by
$5 million
at the Danskammer facility based on revised cost estimates.
|
|
(2)
|
As a result of the DMG Transfer on September 1, 2011, the AROs associated with the Coal segment (including DMG) were transferred from DH to Legacy Dynegy and subsequently, as a result of the DMG Acquisition, the AROs were reacquired on June 5, 2012.
|
|
(3)
|
As a result of the deconsolidation of the DNE Debtor Entities, the related ARO obligations are no longer reflected as liabilities on our consolidated balance sheet.
|
We may have additional potential retirement obligations for dismantlement of our power generation facilities. Our current intent is to maintain these facilities in a manner such that they will be operated indefinitely. As a result, we cannot estimate any potential retirement obligations associated with these assets. Liabilities will be recorded at the time we are able to estimate these AROs.
Contingencies, Commitments, Guarantees and Indemnifications.
We are involved in numerous lawsuits, claims, proceedings and tax-related audits in the normal course of our operations. We record a loss contingency for these matters when it is probable that a liability has been incurred and the amount of the loss can be reasonably estimated. We review our loss contingencies on an ongoing basis to ensure that we have appropriate reserves recorded on our consolidated balance sheets. These reserves are based on estimates and judgments made by management with respect to the likely outcome of these matters, including any applicable insurance coverage for litigation matters, and are adjusted as circumstances warrant. Our estimates and judgment could change based on new information, changes in laws or regulations, changes in management’s plans or intentions, the outcome of legal proceedings, settlements or other factors. If different estimates and judgments were applied with respect to these matters, it is likely that reserves would be recorded for different amounts. Actual results could vary materially from these estimates and judgments.
F-14
DYNEGY INC.
NOTES TO CONSOLIDATED FINANCIAL STATEMENTS (Continued)
Liabilities for environmental contingencies are recorded when an environmental assessment indicates that remedial efforts are probable and the costs can be reasonably estimated. Measurement of liabilities is based, in part, on relevant past experience, currently enacted laws and regulations, existing technology, site-specific costs and cost-sharing arrangements. Recognition of any joint and several liability is based upon our best estimate of our final pro-rata share of such liability.
These assumptions involve the judgments and estimates of management, and any changes in assumptions could lead to increases or decreases in our ultimate liability, with any such changes recognized immediately in earnings.
We disclose and account for various guarantees and indemnifications entered into during the course of business. When a guarantee or indemnification is entered into, an estimated fair value of the underlying guarantee or indemnification is recorded. Some guarantees and indemnifications could have significant financial impact under certain circumstances; however, management also considers the probability of such circumstances occurring when estimating the fair value. Actual results may materially differ from the estimated fair value of such guarantees and indemnifications.
Revenue Recognition.
We earn revenue from our facilities in three primary ways: (i) the sale of both fuel and energy through both physical and financial transactions to optimize the financial performance of our generating facilities; (ii) the sale of capacity; and (iii) the sale of ancillary services, which are the products of a generation facility that support the transmission grid operation, allow generation to follow real-time changes in load, and provide emergency reserves for major changes to the balance of generation and load. We recognize revenue from these transactions when the product or service is delivered to a customer, unless they meet the definition of a derivative. Please read directly below “—Derivative Instruments—Generation” for further discussion of the accounting for these types of transactions.
Derivative Instruments—Generation.
We enter into commodity contracts that meet the definition of a derivative. These contracts are often entered into to mitigate or eliminate market and financial risks associated with our generation business. These contracts include forward contracts, which commit us to sell commodities in the future; futures contracts, which are generally exchange-traded standard commitments to purchase or sell a commodity; option contracts, which convey the right to buy or sell a commodity; and swap agreements, which require payments to or from counterparties based upon the differential between two prices for a predetermined quantity. There are three different ways to account for these types of contracts: (i) as an accrual contract, if the criteria for the “normal purchase, normal sale” exception are met and documented; (ii) as a cash flow or fair value hedge, if the specified criteria are met and documented; or (iii) as a mark-to-market contract with changes in fair value recognized in current period earnings. All derivative commodity contracts that do not qualify for the normal purchase, normal sale exception are recorded at fair value in risk management assets and liabilities on the consolidated balance sheets. We elect not to apply hedge accounting to our derivative commodity contracts; therefore, changes in fair value are recorded currently in earnings.
We execute a significant volume of transactions through futures clearing managers. Our daily cash payments (receipts) to (from) our futures clearing managers consist of three parts: (i) fair value of open positions (exclusive of options) (“Daily Cash Settlements”); (ii) initial margin requirements of open positions (“Initial Margin”); and (iii) fair value related to options (“Options,” and collectively with Daily Cash Settlements and Initial Margin, “Collateral”). Prior to the application of fresh-start accounting, we elected not to offset fair value amounts recognized for derivative instruments executed with the same counterparty under a master netting agreement and we elected not to offset the fair value of amounts recognized for the Daily Cash Settlements paid or received against the fair value of amounts recognized for derivative instruments executed with the same counterparty under a master netting agreement. As a result, the consolidated balance sheets of our Predecessor presents derivative assets and liabilities, as well as the related cash collateral paid or received, on a gross basis.
Upon the application of fresh-start accounting, we elected to offset fair value amounts recognized for derivative instruments executed with the same counterparty under a master netting agreement and we elected to offset the fair value of amounts recognized for the Daily Cash Settlements paid or received against the fair value of amounts recognized for derivative instruments executed with the same counterparty under a master netting agreement. As a result, the consolidated balance sheet of the Successor presents derivative assets and liabilities, as well as the related cash collateral paid or received, on a net basis.
Cash inflows and cash outflows associated with the settlement of risk management activities are recognized in net cash provided by (used in) operating activities on the consolidated statements of cash flows.
Derivative Instruments—Financing Activities.
We are exposed to changes in interest rates through our variable rate debt. In order to manage our interest rate risk, we enter into interest rate swap and cap agreements. We elect not to apply hedge accounting to our interest rate derivative contracts; therefore, changes in fair value are recorded currently in earnings through interest expense.
Fair Value Measurements.
Fair value is the price that would be received to sell an asset or paid to transfer a liability in an orderly transaction between market participants at the measurement date (exit price). However, we utilize a mid-market
F-15
DYNEGY INC.
NOTES TO CONSOLIDATED FINANCIAL STATEMENTS (Continued)
pricing convention (the mid-point price between bid and ask prices) as a practical expedient for valuing the majority of our financial assets and liabilities measured and reported at fair value. Where appropriate, our estimate of fair value reflects the impact of our credit risk, our counterparties’ credit risk and bid-ask spreads. We utilize market data or assumptions that market participants would use in pricing the asset or liability, including assumptions about risk and the risks inherent in the inputs to the valuation technique. These inputs are classified as readily observable, market corroborated, or generally unobservable. We primarily apply the market approach for recurring fair value measurements and endeavor to utilize the best available information. Accordingly, we utilize valuation techniques that maximize the use of observable inputs and minimize the use of unobservable inputs. We classify fair value balances based on the classification of the inputs used to calculate the fair value of a transaction. The inputs used to measure fair value have been placed in a hierarchy based on priority.
The hierarchy gives the highest priority to unadjusted quoted prices in active markets for identical assets or liabilities (Level 1 measurement) and the lowest priority to unobservable inputs (Level 3 measurement). The three levels of the fair value hierarchy are as follows:
|
•
|
Level 1—Quoted prices are available in active markets for identical assets or liabilities as of the reporting date. Active markets are those in which transactions for the asset or liability occur in sufficient frequency and volume to provide pricing information on an ongoing basis. Level 1 primarily consists of financial instruments such as exchange-traded derivatives, listed equities and U.S. government treasury securities.
|
|
•
|
Level 2—Pricing inputs are other than quoted prices in active markets included in Level 1, which are either directly or indirectly observable as of the reporting date. Level 2 includes those financial instruments that are valued using industry-standards models or other valuation methodologies, in which substantially all assumptions are observable in the marketplace throughout the full term of the instrument, can be derived from observable data or are supported by observable levels at which transactions are executed in the marketplace. Instruments in this category include non-exchange-traded derivatives such as over the counter forwards, options and swaps.
|
|
•
|
Level 3—Pricing inputs include significant inputs that are generally less observable from objective sources. These inputs may be used with internally developed methodologies that result in management’s best estimate of fair value. Level 3 instruments include those that may be more structured or otherwise tailored to our needs. At each balance sheet date, we perform an analysis of all instruments and include in Level 3 all of those whose fair value is based on significant unobservable inputs.
|
The determination of the fair values incorporates various factors. These factors include not only the credit standing of the counterparties involved and the impact of credit enhancements (such as cash deposits, letters of credit and priority interests), but also the impact of our nonperformance risk on our liabilities. Valuation adjustments are generally based on capital market implied ratings evidence when assessing the credit standing of our counterparties and when applicable, adjusted based on management’s estimates of assumptions market participants would use in determining fair value.
Income Taxes.
We, and Legacy Dynegy, the parent of our Predecessor, file a consolidated U.S. federal income tax return. We use the asset and liability method of accounting for deferred income taxes and provide deferred income taxes for all significant differences.
As part of the process of preparing our consolidated financial statements, we are required to estimate our income taxes in each of the jurisdictions in which we operate. This process involves estimating our actual current tax payable and related tax
expense together with assessing temporary differences resulting from differing tax and accounting treatment of certain items,
such as depreciation for tax and accounting purposes. These differences can result in deferred tax assets and liabilities which
are included within our consolidated balance sheets.
Because we operate and sell power in many different states, our effective annual state income tax rate will vary from period to period because of changes in our sales profile by state, as well as jurisdictional and legislative changes by state. As a result, changes in our estimated effective annual state income tax rate can have a significant impact on our measurement of temporary differences. We project the rates at which state tax temporary differences will reverse based upon estimates of revenues and operations in the respective jurisdictions in which we conduct business. We must then assess the likelihood that our deferred tax assets will be recovered from future taxable income and, to the extent we believe that it is more likely than not (a likelihood of more than 50 percent) that some portion or all of the deferred tax assets will not be realized, we must establish a valuation allowance. We consider all available evidence, both positive and negative, to determine whether, based on the weight of the evidence, a valuation allowance is needed. Evidence used includes information about our current financial position and our results of operations for the current period, as well as all currently available information about future periods, anticipated future performance, the reversal of deferred tax liabilities and tax planning strategies.
We do not believe we will produce sufficient future taxable income, nor are there tax planning strategies available to
realize the tax benefits from, net deferred tax assets not otherwise realized by reversing temporary differences. Therefore, a
F-16
DYNEGY INC.
NOTES TO CONSOLIDATED FINANCIAL STATEMENTS (Continued)
valuation allowance was recorded as of December 31, 2012. Any change in the valuation allowance would impact our income
tax benefit (expense) and net income (loss) in the period in which the change occurs.
Accounting for uncertainty in income taxes requires that we determine whether it is more likely than not that a tax position we have taken will be sustained upon examination. If we determine that it is more likely than not that the position will be sustained, we recognize the largest amount of the benefit that is greater than 50 percent likely of being realized upon settlement. There is a significant amount of judgment involved in assessing the likelihood that a tax position will be sustained upon examination and in determining the amount of the benefit that will ultimately be realized. If different judgments were applied, it is likely that reserves would be recorded for different amounts. Actual amounts could vary materially from these reserves.
We recognize accrued interest expense and penalties related to unrecognized tax benefits as income tax expense.
Please read
Note 20—Income Taxes
for further discussion of our accounting for income taxes, uncertain tax positions and changes in our valuation allowance and
Note 19—Related Party Transactions
for discussion of our Tax Sharing Agreement.
Earnings (Loss) Per Share.
Basic earnings per share represents the amount of earnings for the period available to each share of common stock outstanding during the period. Diluted earnings per share amounts include the effect of issuing shares of common stock for outstanding stock options, restricted stock units and performance based stock awards under the treasury stock method if including such potential common shares is dilutive.
Stock-Based Compensation.
We use the fair-value based method of accounting for stock-based employee compensation and our Predecessor used the prospective method of transition for stock options granted prior to January 1, 2003. Under the prospective method of transition, all stock options granted after January 1, 2003 were accounted for on a fair value basis. Options granted prior to January 1, 2003 were accounted for using the intrinsic value method.
We used the short-cut method to calculate the beginning balance of the APIC pool of the excess tax benefit, and to determine the subsequent impact on the APIC pool and consolidated statements of cash flows of the tax effects of employee stock-based compensation awards that were outstanding upon our application of authoritative guidance for the accounting for tax effects of share-based payment awards.
Please read
Note 24—Employee Compensation, Savings and Pension Plans
for further discussion of our share-based compensation and expense recognized for the years ended
December 31, 2012, 2011 and 2010
.
Variable Interest Entities.
We evaluate certain entities to determine if we are considered the primary beneficiary of the entity and thus required to consolidate it in our financial statements. There is a significant amount of judgment involved in the analysis used to determine the primary beneficiary of a VIE. The analysis includes determining the activities that most significantly impact the performance of the VIE, who has the power to direct those activities and who has the obligation to absorb losses or the right to receive benefits that could potentially be significant to the VIE.
The DNE Debtor Entities are considered VIEs. On the Plan Effective Date, we emerged from bankruptcy; however, the DNE Debtor Entities did not emerge and continue to remain in Chapter 11. As a result, we evaluated our investment in the DNE Debtor Entities to determine if we have a controlling financial interest in the DNE Debtor Entities subsequent to our emergence from bankruptcy.
Under applicable accounting standards, we determined that we do not have a controlling financial interest in the DNE Debtor Entities because, subsequent to our emergence from bankruptcy and in accordance with the terms of the Plan, we do not have the sole authority to make decisions that most significantly impact the economic performance of the DNE Debtor Entities given the powers of the Bankruptcy Court; therefore the DNE Debtor Entities are not consolidated in our financial statements subsequent to the Plan Effective Date. Please read
Note 6—Dispositions and Discontinued Operations
for further discussion.
Accounting Principles Adopted
Fair Value Measurement Disclosures.
In May 2011, the FASB issued Accounting Standards Update (“ASU”) No. 2011-04—Fair Value Measurement (Topic 820): Amendments to Achieve Common Fair Value Measurement and Disclosure Requirements in U.S. GAAP and IFRS (“ASU No. 2011-04”). This authoritative guidance changes the wording used to describe the requirements in GAAP for measuring fair value and requires additional disclosure about fair value measurements. ASU No. 2011-04 is effective for interim and annual periods beginning after December 15, 2011. The implementation of this guidance has been reflected in our fair value disclosures.
Presentation of Comprehensive Income.
In June 2011, the FASB issued ASU 2011-05—Comprehensive Income (Topic 220): Presentation of Comprehensive Income (“ASU No. 2011-05”). The FASB’s objective in issuing this guidance is to improve the comparability, consistency, and transparency of financial reporting and to increase the prominence of items
F-17
DYNEGY INC.
NOTES TO CONSOLIDATED FINANCIAL STATEMENTS (Continued)
reported in other comprehensive income. ASU No. 2011-05 eliminates the option of presenting components of other comprehensive income as part of the statement of changes in stockholders’ equity. The standard requires that all non-owner changes in stockholders’ equity be presented either in a single continuous statement of comprehensive income or in two separate but consecutive statements. ASU 2011-05 is effective for fiscal years, and interim periods within those years, beginning after December 15, 2011. We have elected to present comprehensive income as two separate consecutive statements.
Accounting Principles Not Yet Adopted
Disclosures about Offsetting Assets and Liabilities.
In December 2011, the FASB issued ASU 2011-11—Balance Sheet (Topic 210): Disclosures about Offsetting Assets and Liabilities. This statement requires entities to disclose both gross and net information about instruments and transactions eligible for offsetting in the statement of financial position, as well as instruments and transactions subject to an agreement similar to a master netting arrangement. Implementation of this guidance would affect disclosures around financial derivative contracts, however would have no impact on our consolidated balance sheet, statement of operations or cash flows. This guidance is effective for fiscal year beginning after December 15, 2012.
Disclosures about Reclassification Adjustments Out of AOCI.
In February 2013, the FASB issued ASU 2013-02 - Comprehensive Income (Topic 220): Reporting of Amounts Reclassified Out of Accumulated Other Comprehensive Income. This statement requires entities to disclose the amounts reclassified out of AOCI by component. In addition, an entity is required to present, either on the face of the statement where net income is presented or in the notes, significant amounts reclassified out of AOCI by the respective line items of net income, but only if the amount reclassified is required under U.S. GAAP to be reclassified to net income in its entirety in the same reporting period. For other amounts that are not required under U.S. GAAP to be reclassified in their entirety to net income, an entity is required to cross-reference to other disclosures required under U.S. GAAP that provide additional detail about those amounts. This guidance is effective for periods beginning after December 15, 2012.
Note 3—Emergence from Bankruptcy and Fresh-Start Accounting
On November 7, 2011, the DH Debtor Entities commenced the DH Chapter 11 Cases. On July 6, 2012, Legacy Dynegy commenced the Dynegy Chapter 11 Case. Throughout the pendency of the Chapter 11 Cases, the Debtor Entities remained in possession of their property and continued to operate their businesses as “debtors-in-possession” under the jurisdiction of and in accordance with the orders of the Bankruptcy Court and the Bankruptcy Code.
Only the Debtor Entities sought relief under the Bankruptcy Code, and none of our other direct or indirect subsidiaries were or are debtors thereunder. Coal Holdco and Dynegy GasCo Holdings, LLC and their indirect, wholly-owned subsidiaries (including DMG and DPC) were not included in the Chapter 11 Cases. The normal day-to-day operations of the coal-fired power generation facilities held by DMG and the gas-fired power generation facilities held by DPC continued without interruption during the Chapter 11 Cases (and continue, notwithstanding the ongoing DNE Bankruptcy Cases). The commencement of the Chapter 11 Cases did not constitute an event of default under either the DMG Credit Agreement or the DPC Credit Agreement.
Settlement Agreement and Plan Support Agreement.
On May 1, 2012, Legacy Dynegy and certain of its subsidiaries, including the DH Debtor Entities, entered into a settlement agreement with certain of DH’s creditors, including certain beneficial holders of DH’s then-outstanding senior notes, the owners and lessors of the Roseton and part of the Danskammer facilities, and U.S. Bank, in its capacity as trustee under an indenture governing certain lease certificates guaranteed by DH (the “Original Settlement Parties”). On May 30, 2012, the Original Settlement Parties, holders of a majority of DH’s then-outstanding subordinated notes, and, solely with respect to certain sections of the Settlement Agreement, Wells Fargo N.A., as successor trustee under the indenture governing DH’s subordinated notes, entered into an amended and restated settlement agreement (the “Settlement Agreement”).
The Bankruptcy Court entered an order approving the Settlement Agreement on June 1, 2012 (the “Approval Order”) and the Settlement Agreement became effective on June 5, 2012. Pursuant to the Settlement Agreement and the Approval Order, Legacy Dynegy and DH took certain steps towards their emergence from Chapter 11 bankruptcy, including the DMG Acquisition and the filing of the Plan. In addition, parties to certain prepetition litigations and adversary proceedings (relating to the Roseton and Danskammer facilities) filed stipulations of dismissals in their respective litigations or proceedings.
F-18
DYNEGY INC.
NOTES TO CONSOLIDATED FINANCIAL STATEMENTS (Continued)
Furthermore, certain intercompany receivables pursuant to an agreement by Legacy Dynegy to make specified payments to Dynegy Gas Investments, LLC (“DGIN”) (the “Undertaking Agreement”) and a related DH promissory note were cancelled.
On September 10, 2012, the Bankruptcy Court entered an order confirming the Plan (the “Confirmation Order”). On September 30, 2012, pursuant to the terms of the Plan, DH merged with and into Dynegy, thereby consummating the Merger. On the Plan Effective Date, we consummated our reorganization under Chapter 11 pursuant to the Plan and exited bankruptcy. The DNE Debtor Entities remain in Chapter 11 bankruptcy and continue to operate their businesses as “debtors-in-possession.” As a result, Dynegy deconsolidated the DNE Debtor Entities, which include two facilities totaling approximately
1,700
MW, effective October 1, 2012. The bankruptcy court has approved agreements to sell the Danskammer and Roseton facilities (the “Danskammer APA” and the “Roseton APA,” respectively) for a combined cash purchase price of
$23 million
and the assumption of certain liabilities (the “Facilities Sale Transactions”). The Facilities Sale Transactions are expected to close upon the satisfaction of certain closing conditions and the receipt of any necessary regulatory approvals and the proceeds from the sale will be distributed as provided in the Plan. We do not expect to receive a significant amount, if any, of the proceeds from the sales. On March 12, 2013, the Bankruptcy Court approved the Plan of Liquidation for the DNE Debtor Entities.
In addition to the Merger, the Plan included the following key elements (Capitalized terms used, but not defined, in this section only shall have the meanings ascribed to them in the Plan):
|
•
|
On the Plan Effective Date, all of Dynegy’s equity interests, including Dynegy’s old common stock, were cancelled.
|
|
•
|
Each holder of Allowed General Unsecured Claims received its Pro Rata Share of (a)
99 million
shares of Dynegy Common Stock and (b) a
$200 million
cash payment (the “Plan Cash Payment”).
|
|
•
|
In full satisfaction of the Dynegy Administrative Claim (otherwise referred to herein as the “Administrative Claim”), the beneficial holders thereof (which were the holders of Dynegy’s old common stock) received their Pro Rata Share of (a)
one million
shares of Dynegy Common Stock and (b) warrants to purchase approximately
15.6 million
shares of Dynegy Common Stock for an exercise price of
$40
per share (subject to adjustment) expiring on October 2, 2017 (the “Warrants”).
|
|
•
|
In addition, each holder of an Allowed General Unsecured Claim will receive, as applicable, their Pro Rata Share of the proceeds of the sale of the Roseton and Danskammer generation facilities (the “Facilities”) allocated to Dynegy (the “Facilities Sale”) according to the Settlement Agreement ; provided that, the Lease Trustee (on behalf of itself and the Lease Certificate Holders) will not receive a distribution of any amounts paid pursuant to the Facilities Sale in its capacity as holder of the Lease Guaranty Claim.
|
On the Plan Effective Date, and pursuant to the Plan, outstanding obligations of approximately
$4 billion
in aggregate principal amount, were cancelled. These obligations included the following series of our notes and related indentures and guaranties, as applicable:
|
•
|
8.75 percent
senior notes due 2012;
|
|
•
|
7.5 percent
senior unsecured notes due 2015;
|
|
•
|
8.375 percent
senior unsecured notes due 2016;
|
|
•
|
7.125 percent
senior debentures due 2018;
|
|
•
|
7.75 percent
senior unsecured notes due 2019;
|
|
•
|
7.625 percent
senior notes due 2026; and
|
|
•
|
Series B
8.316 percent
subordinated debentures due 2027 (the “2027 Notes”).
|
In addition, on the Plan Effective Date, in connection with the cancellation of the 2027 Notes, the Series B
8.316 percent
subordinated capital income securities due 2027 (the “NGC Notes”) issued by NGC Corporation Capital Trust I were cancelled, our guarantee of the NGC Notes was terminated and the indenture governing the NGC Notes was cancelled.
Finally, on the Plan Effective Date, our obligations as a guarantor of the leases of the Facilities under the guaranty dated as of May 1, 2001, made by us with respect to Roseton Units 1 and 2 and the guaranty, dated as of May 1, 2001, made by us with respect to Danskammer Units 3 and 4 (the “Guaranties”) and all obligations thereunder were cancelled. In connection with the cancellation of the Guaranties, our obligations as a lessee guarantor under the Pass Through Trust Agreement, dated as of May 1, 2001 (the “Pass Through Trust Agreement”), among Roseton, Danskammer, and The Chase Manhattan Bank, as pass through trustee were terminated.
We continue to be obligated to the terms of our
$26 million
cash collateralized letter of credit facility, which is collateralized by
$27 million
in restricted cash, as well as our approximately
$1 million
cash collateralized letter of credit facility.
F-19
DYNEGY INC.
NOTES TO CONSOLIDATED FINANCIAL STATEMENTS (Continued)
Accounting Impact of Emergence.
Upon emergence on the Plan Effective Date, we applied the provisions of fresh-start accounting to our consolidated financial statements.
Reorganization Value
As part of the bankruptcy process we engaged an independent financial advisor to assist in the determination of our reorganized enterprise value. The reorganization value represents the fair value of an entity before liabilities and approximates the amount a willing buyer would pay for the assets of the entity immediately after restructuring. The independent financial advisor estimated a range for our reorganization enterprise value of
$3.2 billion
to
$4.5 billion
. Our net debt was then subtracted to estimate a range of the Successor equity value of between
$2.3 billion
and
$3.6 billion
. These ranges were approved by the Bankruptcy Court. In the application of fresh-start accounting, our reorganization equity value was determined to be approximately
$2.6 billion
, which is within the range approved by the Bankruptcy Court.
Allocation of Reorganization Value
When allocating the reorganization equity value to our property, plant and equipment, we used a DCF analysis based upon a debt-free, free cash flow model. This DCF model was created for each power generation facility based on its remaining useful life. The DCF included gross margin forecasts for each power generation facility determined using forward commodity market prices obtained from third party quotations for 2013 and 2014, management’s forecast of operating and maintenance expenses and capital expenditures. For 2015 through 2020, we used price curves developed using forward NYMEX gas prices and incorporated assumptions about reserve margins, basis differentials and capacity. For periods beyond 2020, we assumed a
2.5 percent
growth rate. The resulting cash flows were then discounted using a range of discount rates of
10 percent
to
11 percent
based on the characteristics of the power generation facility.
Contracts with terms that are not at current market value were also valued using a DCF analysis. The cash flows generated by the contracts were compared with current market prices with the resulting difference recorded as an intangible asset or liability.
We recorded the fair value of some assets and liabilities at historical cost, which was an appropriate measure of fair value (i.e. cash, restricted cash, accounts receivable, accounts payable). Other assets and liabilities were adjusted to fair value based on then-current market prices (i.e. inventory). Our outstanding long-term debt was fair valued based upon the trading price of the debt on the Plan Effective Date. The Warrants were initially valued using a Black-Scholes calculation.
The following balance sheet illustrates the impact of (i) the implementation of the Plan, (ii) the application of fresh-start accounting, and (iii) the deconsolidation of the DNE Debtor Entities as of the Plan Effective Date, resulting in the opening balance sheet of the Successor:
F-20
DYNEGY INC.
NOTES TO CONSOLIDATED FINANCIAL STATEMENTS (Continued)
|
As of October 1, 2012
|
||||||||||||||||||||
|
(amounts in millions)
|
Predecessor (a)
|
Deconsolidation of DNE (b)
|
Effects of Plan (c)
|
Fresh-start Adjustments (d)
|
Successor
|
|||||||||||||||
|
Current Assets
|
||||||||||||||||||||
|
Cash and cash equivalents
|
$
|
677
|
|
$
|
(22
|
)
|
$
|
(200
|
)
|
$
|
—
|
|
$
|
455
|
|
|||||
|
Restricted cash and investments
|
357
|
|
—
|
|
—
|
|
—
|
|
357
|
|
||||||||||
|
Accounts receivable, net
|
131
|
|
—
|
|
—
|
|
(22
|
)
|
(i)
|
109
|
|
|||||||||
|
Inventory
|
124
|
|
(23
|
)
|
—
|
|
1
|
|
(j)
|
102
|
|
|||||||||
|
Assets from risk-management activities
|
563
|
|
—
|
|
—
|
|
(522
|
)
|
(k)
|
41
|
|
|||||||||
|
Broker margin account
|
43
|
|
—
|
|
—
|
|
(13
|
)
|
(k)
|
30
|
|
|||||||||
|
Intangible assets
|
211
|
|
—
|
|
—
|
|
60
|
|
(l)
|
271
|
|
|||||||||
|
Prepayments and other current assets
|
124
|
|
(19
|
)
|
(2
|
)
|
(e)
|
(32
|
)
|
(m)
|
71
|
|
||||||||
|
Total current assets
|
2,230
|
|
(64
|
)
|
(202
|
)
|
(528
|
)
|
1,436
|
|
||||||||||
|
Property, plant and equipment, net
|
3,270
|
|
—
|
|
—
|
|
(251
|
)
|
(n)
|
3,019
|
|
|||||||||
|
Restricted cash and investments
|
289
|
|
—
|
|
—
|
|
—
|
|
289
|
|
||||||||||
|
Assets from risk-management activities
|
16
|
|
—
|
|
—
|
|
(9
|
)
|
(k)
|
7
|
|
|||||||||
|
Intangible assets
|
96
|
|
—
|
|
—
|
|
42
|
|
(l)
|
138
|
|
|||||||||
|
Deferred income taxes
|
—
|
|
—
|
|
—
|
|
96
|
|
(o)
|
96
|
|
|||||||||
|
Other long-term assets
|
69
|
|
—
|
|
—
|
|
5
|
|
(p)
|
74
|
|
|||||||||
|
Total assets
|
$
|
5,970
|
|
$
|
(64
|
)
|
$
|
(202
|
)
|
$
|
(645
|
)
|
$
|
5,059
|
|
|||||
|
Current Liabilities
|
||||||||||||||||||||
|
Accounts payable
|
$
|
92
|
|
$
|
1
|
|
$
|
—
|
|
$
|
—
|
|
$
|
93
|
|
|||||
|
Accounts payable, affiliate
|
—
|
|
—
|
|
—
|
|
—
|
|
—
|
|
||||||||||
|
Accrued interest
|
1
|
|
—
|
|
—
|
|
—
|
|
1
|
|
||||||||||
|
Accrued liabilities and other current liabilities
|
133
|
|
(29
|
)
|
(18
|
)
|
(f)
|
(4
|
)
|
(q)
|
82
|
|
||||||||
|
Claims Reserve
|
—
|
|
—
|
|
23
|
|
(f)
|
—
|
|
23
|
|
|||||||||
|
Liabilities from risk-management activities
|
625
|
|
—
|
|
—
|
|
(561
|
)
|
(k)
|
64
|
|
|||||||||
|
Liabilities from risk-management activities, affiliate
|
—
|
|
1
|
|
—
|
|
—
|
|
1
|
|
||||||||||
|
Deferred income taxes
|
—
|
|
—
|
|
—
|
|
96
|
|
(o)
|
96
|
|
|||||||||
|
Current portion of long-term debt
|
16
|
|
—
|
|
—
|
|
20
|
|
(r)
|
36
|
|
|||||||||
|
Total current liabilities
|
867
|
|
(27
|
)
|
5
|
|
(449
|
)
|
396
|
|
||||||||||
|
Liabilities subject to compromise
|
4,290
|
|
(50
|
)
|
(4,240
|
)
|
—
|
|
—
|
|
||||||||||
|
Long-term debt
|
1,661
|
|
—
|
|
—
|
|
66
|
|
(r)
|
1,727
|
|
|||||||||
|
Liabilities from risk-management activities
|
48
|
|
—
|
|
—
|
|
—
|
|
(s)
|
48
|
|
|||||||||
|
Other long-term liabilities
|
255
|
|
(30
|
)
|
28
|
|
(g)
|
37
|
|
(t)
|
290
|
|
||||||||
|
Total liabilities
|
7,121
|
|
(107
|
)
|
(4,207
|
)
|
(346
|
)
|
2,461
|
|
||||||||||
|
Stockholders’ Equity (Deficit)
|
||||||||||||||||||||
|
Common stock, predecessor
|
1
|
|
—
|
|
(1
|
)
|
—
|
|
—
|
|
||||||||||
|
Common stock, successor
|
—
|
|
—
|
|
1
|
|
—
|
|
1
|
|
||||||||||
|
Additional paid-in-capital, predecessor
|
5,149
|
|
—
|
|
(5,149
|
)
|
—
|
|
—
|
|
||||||||||
|
Additional paid-in-capital, successor
|
—
|
|
—
|
|
2,597
|
|
—
|
|
2,597
|
|
||||||||||
|
Accumulated other comprehensive loss, net of tax
|
(24
|
)
|
—
|
|
—
|
|
24
|
|
—
|
|
||||||||||
|
Accumulated equity (deficit)
|
(6,277
|
)
|
43
|
|
6,557
|
|
(h)
|
(323
|
)
|
—
|
|
|||||||||
|
Total stockholders’ equity (deficit)
|
(1,151
|
)
|
43
|
|
4,005
|
|
(299
|
)
|
2,598
|
|
||||||||||
|
Total liabilities and stockholders’ equity (deficit)
|
$
|
5,970
|
|
$
|
(64
|
)
|
$
|
(202
|
)
|
$
|
(645
|
)
|
$
|
5,059
|
|
|||||
________________________________________
|
(a)
|
Represents the consolidated balance sheet of our Predecessor as of October 1, 2012.
|
|
(b)
|
Reflects the deconsolidation of the DNE Debtor Entities as of October 1, 2012. The DNE Debtor Entities did not emerge from protection under Chapter 11 of the Bankruptcy Code; therefore, the DNE Debtor Entities were deconsolidated as of October 1, 2012. These adjustments (i) remove the balances associated with the DNE Debtor
|
F-21
DYNEGY INC.
NOTES TO CONSOLIDATED FINANCIAL STATEMENTS (Continued)
Entities from our October 1, 2012 balance sheet; (ii) impair the
$13 million
note receivable, which was included in Prepayments and other current assets, related to the debtor-in-possession financing provided by us to the DNE Debtor Entities; and (iii) moves balances related to service agreements and risk management activities to affiliate accounts.
|
(c)
|
Represents amounts recorded for the implementation of the Plan on the Plan Effective Date. This includes the settlement of liabilities subject to compromise through a cash payment of approximately
$200 million
, the authorization and distribution of New Common Stock and Warrants, and the cancellation of the Old Common Stock. Additionally, these adjustments remove the historical accumulated deficit of the predecessor. The following reflects the calculation of the total pre-tax gain (amounts in millions):
|
|
Value of claims
|
$
|
4,240
|
|
|
Less amounts issued to settle claims:
|
|||
|
Common stock (at par) (Successor)
|
(1
|
)
|
|
|
Additional paid-in-capital (Successor)
|
(2,597
|
)
|
|
|
Warrants (Successor)
|
(28
|
)
|
|
|
Cash payment
|
(200
|
)
|
|
|
Total pre-tax gain on settlement of claims
|
$
|
1,414
|
|
|
(d)
|
Represents the adjustments of assets and liabilities to fair value in conjunction with the application of fresh-start
accounting.
|
|
(e)
|
Reflects an adjustment to prepayments related to professional fees.
|
|
(f)
|
Reflects adjustments to the Claims reserve. The Claims reserve is included in Accrued liabilities and other current liabilities on our consolidated balance sheet and primarily consists of accruals for professional fees. The following reflects the components of the Claims reserve as of the Plan Effective Date (amounts in millions):
|
|
Professional fees accrued at Emergence
|
$
|
5
|
|
|
Professional fees reclassified from accrued liabilities
|
18
|
|
|
|
Claims reserve at emergence
|
$
|
23
|
|
|
(g)
|
Reflects the issuance of Warrants pursuant to our Plan of Reorganization. Please read
Note 23—Capital Stock
for further discussion.
|
|
(h)
|
Reflects the impact of the reorganization adjustments (amounts in millions):
|
|
Total pre-tax gain
|
$
|
1,414
|
|
|
Additional professional fees
|
(7
|
)
|
|
|
Total impact on statement of operations
|
1,407
|
|
|
|
Cancellation of Predecessor common stock
|
1
|
|
|
|
Cancellation of Predecessor additional paid-in capital
|
5,149
|
|
|
|
Total reorganization adjustments
|
$
|
6,557
|
|
|
(i)
|
Reflects a reclassification of receivables to Other long-term assets.
|
|
(j)
|
Reflects the fair value adjustment related to inventory.
|
|
(k)
|
In the application of fresh-start accounting, the Successor changed its accounting policy related to the presentation of certain derivative contracts. We have elected to present these contracts on a net basis where the right of offset exists. As a result, we recorded reductions to Assets from risk-management activities (current), Broker margin account, and Assets from risk management activities (long-term) of
$522 million
,
$13 million
, and
$9 million
, respectively. In addition, we recorded reductions to Liabilities from risk management activities (current) and Liabilities from risk management activities (long-term) of
$561 million
and
$9 million
, respectively.
|
|
(l)
|
Reflects the fair value adjustment for short-term and long-term identifiable intangible assets of
$60 million
and
$42 million
, respectively. These contracts consist of favorable capacity contracts, tolling agreements and rail transportation contracts, which were valued based on comparing contract terms to market prices.
|
(m) Reflects the adjustments to eliminate historical short-term deferred financing costs of
$5 million
and
$26 million
of collateral netted against liabilities from risk management activities as discussed in (k) above.
|
(n)
|
Represents the adjustment required to present Property, plant and equipment at its estimated fair value of approximately
$3 billion
as of October 1, 2012.
|
F-22
DYNEGY INC.
NOTES TO CONSOLIDATED FINANCIAL STATEMENTS (Continued)
|
(o)
|
Reflects the re-measurement of the Company’s deferred tax assets and liabilities, unrecognized tax benefits and other tax related accounts as a result of implementing the Plan and the application of fresh-start accounting.
|
|
(p)
|
Reflects a
$22 million
reclassification of receivables as discussed in (i) above offset by the $
17 million
adjustment to eliminate historical long-term deferred financing costs.
|
(q) Reflects the fair value adjustment needed to record transportation and coal contracts included in accrued liabilities and other current liabilities at fair value, which were valued based on comparing contract terms to market prices.
(r) Reflects the amounts required to present debt at its estimated fair value. The amount has been allocated between Current portion of long-term debt and Long-term debt based on scheduled principal amounts and amortization of the premium over the next twelve months.
|
(s)
|
Reflects a
$9 million
increase in the liability related to our interest rate swaps as a result of a change in the calculation of the credit reserve offset by a reduction of
$9 million
due to the net presentation of our risk management positions as discussed in (k) above.
|
|
(t)
|
Reflects the fair value adjustment to other long-term liabilities which is comprised of a
$42 million
increase in our pension and other post-retirement benefit liabilities and a
$5 million
increase in our AROs, partially offset by a
$7 million
decrease in liabilities related to the long-term portion of unfavorable contracts as discussed in (q) above.
|
Note 4—Merger and Acquisition
Merger.
On September 30, 2012, pursuant to the terms of the Plan, DH merged with and into Legacy Dynegy with Dynegy continuing as the surviving legal entity of the Merger. Immediately prior to the Merger, Legacy Dynegy had no substantive operations, and our Coal, Gas and DNE operations were primarily conducted through subsidiaries formerly held by DH. There was no cash consideration exchanged in the transaction and Legacy Dynegy, as the accounting acquiree, did not meet the definition of a business; therefore, we accounted for DH’s acquisition of Legacy Dynegy as a “recapitalization.” Under this method of accounting, the net assets of
$32 million
contributed by Legacy Dynegy were credited directly to stockholder’s equity. Furthermore, the surviving legal entity’s historical results for periods prior to the Merger are the same as DH’s historical results.
DMG Acquisition.
On June 5, 2012, pursuant to the Settlement Agreement, Legacy Dynegy and DH consummated the DMG Acquisition. The DMG Acquisition was accounted for as a business combination in DH’s financial statements as Legacy Dynegy deconsolidated DH, effective November 7, 2011, as a result of the DH Chapter 11 Cases. Accordingly, the assets acquired and liabilities assumed were recognized at their fair value as of the acquisition date.
The purchase price was approximately
$466 million
. Consideration given by DH consisted of (i) approximately
$402 million
for the fair value of the Undertaking receivable, affiliate that was extinguished in connection with the transaction and (ii) approximately
$64 million
for the fair value of the Administrative Claim issued to Legacy Dynegy in the DH Chapter 11 Cases.
F-23
DYNEGY INC.
NOTES TO CONSOLIDATED FINANCIAL STATEMENTS (Continued)
The following table summarizes the fair values of the assets acquired and liabilities assumed at the date of acquisition (amounts in millions):
|
Cash
|
$
|
256
|
|
|
Restricted cash (including $75 million current)
|
117
|
|
|
|
Accounts receivable
|
3
|
|
|
|
Inventory
|
69
|
|
|
|
Assets from risk management activities (including $84 million current)
|
85
|
|
|
|
Prepaids and other current assets
|
46
|
|
|
|
Property, plant and equipment
|
514
|
|
|
|
Intangible assets (including $162 million current)
|
257
|
|
|
|
Total assets acquired
|
1,347
|
|
|
|
Current liabilities and accrued liabilities
|
(60
|
)
|
|
|
Liabilities from risk management activities (including $66 million current)
|
(76
|
)
|
|
|
Long-term debt (including $9 million current)
|
(610
|
)
|
|
|
Asset retirement obligations
|
(53
|
)
|
|
|
Unfavorable coal contract (including $15 million current)
|
(38
|
)
|
|
|
Pension liabilities
|
(44
|
)
|
|
|
Total liabilities assumed
|
(881
|
)
|
|
|
Net assets acquired
|
$
|
466
|
|
Pro Forma Results.
Revenue and net loss attributable to the DMG Acquisition is included in our consolidated statements of operations since the date of the acquisition of June 5, 2012. During the 2012 Predecessor Period, the DMG Acquisition contributed approximately
$166 million
to our revenue and increased our net loss by approximately
$87 million
.
The unaudited pro forma financial results for the 2012 Predecessor Period show the effect of the DMG Acquisition as if the acquisition had occurred as of January 1, 2012. The unaudited pro forma financial results for the year ended December 31, 2011 disregard the DMG Transfer that occurred on September 1, 2011. This is presented for informational purposes only and is not indicative of future operations or results that would have been achieved had the acquisition been completed as of January 1, 2011.
|
|
January 1 Through October 1,
|
Year Ended
December 31,
|
|||||||
|
(amounts in millions)
|
2012
|
2011
|
|||||||
|
Revenue
|
$
|
1,211
|
|
|
$
|
1,531
|
|
||
|
Income (loss) from continuing operations
|
$
|
876
|
|
|
$
|
(472
|
)
|
||
|
Net income (loss)
|
$
|
714
|
|
$
|
(981
|
)
|
|||
Note 5—Condensed Combined Financial Statements of the Debtor Entities
As of December 31, 2012, we did not have any subsidiaries under Chapter 11 protection included in our consolidated financial statements. The Condensed combined financial statements of the Debtor Entities as of December 31, 2011 are set forth below (amounts in millions):
F-24
DYNEGY INC.
NOTES TO CONSOLIDATED FINANCIAL STATEMENTS (Continued)
Condensed Combined Balance Sheet
|
December 31, 2011 (1)
|
|||||||
|
Cash
|
$
|
33
|
|||||
|
Restricted cash and investments (including $27 million current)
|
27
|
||||||
|
Accounts receivable
|
8
|
||||||
|
Inventory
|
34
|
||||||
|
Investment in consolidated subsidiaries
|
5,568
|
||||||
|
Accrued interest from affiliate
|
8
|
||||||
|
Undertaking receivable from affiliate
|
1,250
|
||||||
|
Deferred income taxes
|
44
|
||||||
|
Other
|
14
|
||||||
|
Total assets
|
$
|
6,986
|
|||||
|
|
|
||||||
|
Current liabilities and accrued liabilities
|
$
|
10
|
|||||
|
Liabilities subject to compromise (2)
|
4,012
|
||||||
|
Intercompany payable
|
1,587
|
||||||
|
Long-term debt to affiliates
|
1,262
|
||||||
|
Deferred income taxes
|
50
|
||||||
|
Other
|
33
|
||||||
|
Total liabilities
|
$
|
6,954
|
|||||
|
Total member’s equity
|
32
|
||||||
|
Total liabilities and member's equity
|
$
|
6,986
|
|||||
__________________________________________
(1) Includes only DH Debtor Entities at December 31, 2011.
(2) See
Note 17—Liabilities Subject to Compromise
for additional discussion of liabilities subject to compromise.
Condensed Combined Statement of Operations
|
Predecessor
|
||||||||
|
January 1 Through October 1, 2012
|
November 8 Through December 31, 2011
|
|||||||
|
Revenues
|
$
|
—
|
|
$
|
—
|
|
||
|
Cost of sales
|
—
|
|
—
|
|
||||
|
Operating expenses
|
2
|
|
—
|
|
||||
|
General and administrative expense
|
2
|
|
(5
|
)
|
||||
|
Operating income (loss)
|
4
|
|
(5
|
)
|
||||
|
Bankruptcy reorganization items, net
|
1,037
|
|
(52
|
)
|
||||
|
Equity losses
|
(1,373
|
)
|
(82
|
)
|
||||
|
Interest income (expense), affiliate
|
1
|
|
(6
|
)
|
||||
|
Other income and expense, net
|
452
|
|
18
|
|
||||
|
Income (loss) from continuing operations, before income taxes
|
121
|
|
(127
|
)
|
||||
|
Income tax benefit (expense)
|
9
|
|
32
|
|
||||
|
Income (loss) from continuing operations
|
130
|
|
(95
|
)
|
||||
|
Discontinued operations, net of tax
|
(162
|
)
|
(468
|
)
|
||||
|
Net loss
|
$
|
(32
|
)
|
|
$
|
(563
|
)
|
|
F-25
DYNEGY INC.
NOTES TO CONSOLIDATED FINANCIAL STATEMENTS (Continued)
Condensed Combined Statement of Cash Flows
|
Predecessor
|
||||||||
|
(amounts in millions)
|
January 1 Through October 1, 2012
|
November 8 Through December 31, 2011
|
||||||
|
Net cash provided by:
|
||||||||
|
Operating activities
|
$
|
32
|
$
|
22
|
|
|||
|
Investing activities
|
5
|
(1
|
)
|
|||||
|
Financing activities
|
—
|
—
|
|
|||||
|
Net increase in cash and cash equivalents
|
37
|
21
|
|
|||||
|
Cash and cash equivalents, beginning of period
|
33
|
12
|
|
|||||
|
Cash and cash equivalents, end of period
|
$
|
70
|
$
|
33
|
|
|||
Basis of Presentation.
The condensed combined financial statements only include the financial statements of the DH Debtor Entities. Transactions and balances of receivables and payables among the DH Debtor Entities are eliminated in consolidation. However, the condensed combined balance sheets include receivables from related parties and payables to related parties that are not DH Debtor Entities. Actual settlement of these related party receivables and payables is, by historical practice, made on a net basis.
Interest Expense.
The Debtor Entities discontinued recording interest on unsecured liabilities subject to compromise (“LSTC”) effective November 8, 2011. Contractual interest on LSTC not reflected in the condensed combined financial statements was approximately
$216 million
and
$44 million
for the 2012 Predecessor Period and the period from November 8 through December 31, 2011, respectively.
Bankruptcy Reorganization Items, net.
Bankruptcy reorganization items, net represent the direct and incremental costs of bankruptcy, such as professional fees, pre-petition liability claim adjustments and losses related to terminated contracts that are probable and can be estimated. Bankruptcy reorganization items, net, as shown in the condensed combined statement of operations above, consist of expense incurred or income earned as a direct and incremental result of the bankruptcy filings. The table below lists the significant items within this category:
|
Predecessor
|
||||||||
|
(amounts in millions)
|
January 1 Through October 1, 2012
|
November 8 Through December 31, 2011 (1)
|
||||||
|
Adjustments of estimated allowable claims:
|
||||||||
|
DNE Leases (1)
|
$
|
(395
|
)
|
$
|
(611
|
)
|
||
|
Subordinated notes (2)
|
161
|
|
—
|
|
||||
|
Write-off of note payable, affiliate (3)
|
10
|
|
—
|
|
||||
|
Write-off of unamortized deferred financing costs and debt discounts
|
—
|
|
(52
|
)
|
||||
|
Other
|
(4
|
)
|
—
|
|
||||
|
Total adjustments for estimated allowable claims
|
(228
|
)
|
|
(663
|
)
|
|||
|
Gain on settlement of claims (4)
|
1,414
|
|
—
|
|
||||
|
Change in value of Administrative Claim (5)
|
17
|
|
—
|
|
||||
|
Fresh-start adjustments
|
(299
|
)
|
—
|
|
||||
|
Gain on deconsolidation of DNE
|
43
|
|
—
|
|
||||
|
Professional fees (6)
|
(50
|
)
|
(3
|
)
|
||||
|
Total Bankruptcy reorganization items, net
|
897
|
|
|
(666
|
)
|
|||
|
Bankruptcy reorganization items, net included in discontinued operations, net of taxes
|
140
|
|
614
|
|
||||
|
Total Bankruptcy reorganization items, net in continuing operations
|
$
|
1,037
|
|
|
$
|
(52
|
)
|
|
__________________________________________
F-26
DYNEGY INC.
NOTES TO CONSOLIDATED FINANCIAL STATEMENTS (Continued)
|
(1)
|
Amount represents adjustments to our estimate of the probable allowed claim associated with the DNE leases. Amount in 2011 also includes the write-off of deferred rent that had accumulated over time as the historical lease payments exceeded the annual rent expense.
|
|
(2)
|
The estimated allowable claims related to the Subordinated Capital Income Securities were adjusted in 2012 based on the terms of the Settlement Agreement. Please read
Note 3—Emergence from Bankruptcy and Fresh-Start Accounting
for further discussion.
|
|
(3)
|
During 2012, it was determined that no claim related to the Note payable, affiliate would be made. Therefore, the estimated amount was reduced to
zero
.
|
|
(4)
|
Approximately
$217 million
of the gain on settlement of claims is included in Income (loss) from discontinued operations on our consolidated statement of operations in the 2012 Predecessor Period.
|
|
(5)
|
The Administrative Claim was issued on the effective date of the Settlement Agreement. Please read
Note 8—Risk Management Activities, Derivatives and Financial Instruments
and
Note 3—Emergence from Bankruptcy and Fresh-Start Accounting
for further discussion.
|
|
(6)
|
Professional fees relate primarily to the fees of attorneys and consultants working directly on the Chapter 11 Cases.
|
Dispositions
DMG Transfer and Undertaking Agreement.
On September 1, 2011, we completed the DMG Transfer which resulted in the transfer of our Coal segment to Dynegy in exchange for the Undertaking Agreement. In connection with the DMG Transfer, we recognized a loss of
$1.77 billion
, which was recorded as a reduction of member’s equity because the transaction was between entities under common control at that time.
We reacquired the assets disposed of in the DMG Transfer on June 5, 2012. Please read
Note 4—Merger and Acquisition
for further discussion. As a result, the Coal segment did not meet the requirements for discontinued operations presentation in our consolidated statement of operations.
PPEA Holding Company LLC.
On November 10, 2010, we completed the sale of our interest in PPEA Holding to one of the other investors in PPEA Holding. We recognized a loss of approximately
$28 million
on the sale, which is included in Losses from unconsolidated investments in our consolidated statements of operations. This loss represents
$28 million
of losses reclassified from AOCI loss. Please read
Note 15—Variable Interest Entities
—PPEA Holding Company LLC for further discussion.
Discontinued Operations
The DNE Debtor Entities remain in Chapter 11 bankruptcy and continue to operate their businesses as “debtors-in-possession.” As a result, Dynegy deconsolidated the DNE Debtor Entities, effective October 1, 2012. Upon deconsolidation, we estimated the fair value of our investment to be
zero
and recognized a gain of approximately
$43 million
in connection with the deconsolidation of the DNE Debtor Entities, which is included in Income (loss) from discontinued operations, net of taxes on our consolidated statement of operations.
Pursuant to the Settlement Agreement, certain proceeds of the Facilities Sale Transactions may be distributed to certain of our former creditors. In November 2012, the DNE Debtor Entities commenced an auction for the Facilities and notice of the winning bids was provided on December 10, 2012. On December 10, 2012, Danskammer entered into the Danskammer APA with ICS NY Holdings, LLC (“ICS”) pursuant to which Danskammer will sell to ICS the Danskammer power generation facility and associated real property. At closing, Danskammer expects to receive
$3.5 million
in cash, which will be distributed pursuant to the applicable provisions in the DNE Debtor Entities Joint Plan of Liquidation (as defined below), and ICS will assume certain of Danskammer’s liabilities as set forth in the Danskammer APA. On December 14, 2012, the DNE Debtor Entities filed the DNE Entities Joint Plan of Liquidation and a related disclosure statement (the “DNE Disclosure Statement”) with the Bankruptcy Court. On December 17, 2012, Roseton filed with the Bankruptcy Court the Roseton APA with LDH U.S. Asset Holdings LLC (“LDH Holdings”) pursuant to which Roseton will sell to LDH Holdings Roseton power generation facility and associated real property. At closing, Roseton expects to receive
$19.5 million
in
cash (subject to certain purchase price adjustments), which will be distributed pursuant to the applicable provisions in the DNE Debtor Entities Joint Plan of Liquidation, and LDH Holdings will assume certain of Roseton’s liabilities set forth in the Roseton APA. On December 26, 2012, the Bankruptcy Court entered an order approving the Facilities Sale Transactions. The consummation of the Facilities Sale Transactions remains subject to, among other things, required regulatory approval and closing conditions set forth in the APAs. The Bankruptcy Court approved the DNE Disclosure Statement on January 23, 2013. If the Facilities Sale Transactions are not successful, the DNE Debtor Entities may be required to liquidate their remaining
F-27
DYNEGY INC.
NOTES TO CONSOLIDATED FINANCIAL STATEMENTS (Continued)
assets or convert the DNE Chapter 11 Cases to Chapter 7 liquidation under the Bankruptcy Code. On March 12, 2013, the Bankruptcy Court approved the Plan of Liquidation for the DNE Debtor Entities.
The results of operations of DNE are reported as discontinued operations for all periods presented. Effective October 2, 2012, we began accounting for our investment in the DNE Debtor Entities using the cost method of accounting. In connection with the application of fresh-start accounting, we estimated the fair value of our investment in DNE to be
zero
given the uncertainty of the sales process as of the Plan Effective Date.
During the Successor Period, we recognized income of
$6 million
related to the release of a franchise tax liability related to our former midstream business. This gain is reflected in Income (loss) from discontinued operations, net of taxes in our consolidated statements of operations for the Successor Period.
Summary.
The amounts in the table below reflect the operating results of the businesses reported as discontinued operations:
|
Successor
|
Predecessor
|
||||||||||||||||
|
October 2 Through December 31,
|
January 1 Through October 1,
|
Year Ended December 31,
|
|||||||||||||||
|
(amounts in millions)
|
2012
|
2012
|
2011
|
2010
|
|||||||||||||
|
Revenues
|
$
|
—
|
|
$
|
61
|
|
$
|
104
|
|
$
|
264
|
|
|||||
|
Income (loss) from operations before taxes
|
6
|
|
(162
|
)
|
(680
|
)
|
27
|
|
|||||||||
|
Income (loss) from operations after taxes
|
6
|
|
(162
|
)
|
(509
|
)
|
17
|
|
|||||||||
Note 7—Impairment and Restructuring Charges
2010 Impairment Charges
Casco Bay Impairment.
On August 13, 2010, Legacy Dynegy entered into a merger agreement with an affiliate of The Blackstone Group L.P. ( “Blackstone”), pursuant to which Legacy Dynegy would be acquired. The merger agreement was not approved by Legacy Dynegy stockholders at the special stockholders’ meeting on November 23, 2010 and was subsequently terminated by the parties in accordance with the terms of the merger agreement.
In connection with the Blackstone Merger Agreement, we determined it was more likely than not that our Moss Landing, Morro Bay, Oakland and Casco Bay facilities would be disposed of before the end of their previously estimated useful lives as Blackstone had entered into a separate agreement to sell these facilities to a third party upon the closing of the Blackstone merger agreement. Based on the terms of the Blackstone merger agreement and our impairment analysis of the impact of such agreement on the recoverability of the carrying value of our long-lived assets, we recorded a pre-tax impairment charge of
$134 million
(
$81 million
after-tax) during the three months ended September 30, 2010 to reduce the carrying value of our Casco Bay facility and related assets to its fair value. This charge is included in Impairment and other charges in our consolidated statements of operations in the Gas segment.
In performing the impairment analysis, we concluded that the assets Blackstone planned to sell to a third party did not meet the criteria of “held for sale,” as the agreement to sell these assets was a contractual arrangement between Blackstone and a third party. Our management had not committed to any plan to dispose of these assets prior to the end of their previously estimated useful lives. As such, we assessed the recoverability of the carrying value of these assets using expected cash flows from the proceeds from the potential sale of these assets, probability weighted with the expected cash flow from continuing to hold and use the assets. We performed this analysis considering a range of likelihoods that management considered reasonable regarding whether the sale of these assets would be completed. In any of the scenarios within this range of the probabilities we considered reasonable, the expected undiscounted cash flows from the Moss Landing, Morro Bay and Oakland facilities were sufficient to recover their carrying values, while the expected undiscounted cash flows from the Casco Bay facility were not. Therefore, we recorded an impairment charge to reduce the carrying value of the Casco Bay facility and related assets to its estimated fair value. We determined the fair value of the facility based on assumptions that reflect our best estimate of third party market participants’ considerations, and corroborated these assumptions based upon the terms of the proposed sale of the facilities. The Blackstone merger agreement ultimately did not receive stockholder approval, and at
December 31, 2010
, we no longer considered it more likely than not that these facilities would be disposed of before the end of their estimated useful lives.
Other.
In the first quarter of 2010, as a result of uncertainty and risk surrounding PPEA’s financing structure, we recorded a pre-tax impairment charge of approximately
$37 million
, which is included in Earnings (losses) from unconsolidated investments on our consolidated statement of operations, to reduce the carrying value of our investment in
F-28
DYNEGY INC.
NOTES TO CONSOLIDATED FINANCIAL STATEMENTS (Continued)
PPEA Holding to
zero
. In the fourth quarter 2010, we sold our interest in this investment. Please read
Note 14—Unconsolidated Investments
for additional information.
Restructuring Charges
In the fourth quarter 2010, we established a plan to align our corporate cost structure with the challenging commodity price environment. As a result of this plan, we eliminated approximately
135
positions and we paid approximately
$8 million
of severance benefits to affected employees in 2011. We eliminated an additional
40
positions in connection with the closure of our Vermilion facility in 2011 and paid
$1 million
of severance benefits in connection with the facility’s closure. We recognized pre-tax charges of
$12 million
in 2010 in connection with these restructuring activities and with the closure of our South Bay facility. These charges are included in Impairment and other charges in our consolidated statements of operations and were based on contractual obligations under our existing benefit plans.
During 2011, we continued to align our corporate structure and recognized pre-tax charges of approximately
$5 million
in connection with the additional restructuring activities. Approximately
55
positions were eliminated and we paid less than
$1 million
in severance benefits to affected employees in the 2012 Predecessor Period.
During the 2012 Predecessor Period, we recognized pre-tax charges of approximately
$2 million
in connection with additional restructuring activities. Approximately
15
positions were eliminated and we paid approximately
$2 million
and less than
$1 million
of severance benefits to affected employees during the 2012 Predecessor Period and the Successor Period, respectively. In 2013, we expect to payout approximately
$1 million
of severance benefits to affected employees.
The following table summarizes activity related to liabilities associated with costs related to severance and retention benefits:
|
Successor
|
Predecessor
|
||||||||||||||||
|
October 2 Through December 31,
|
January 1 Through October 1,
|
Year Ended December 31,
|
|||||||||||||||
|
(amounts in millions)
|
2012
|
2012
|
2011
|
2010
|
|||||||||||||
|
Beginning of period
|
$
|
2
|
|
$
|
2
|
|
$
|
15
|
|
$
|
12
|
|
|||||
|
Expense (1)
|
1
|
|
5
|
|
8
|
|
12
|
|
|||||||||
|
Payments
|
(1
|
)
|
(5
|
)
|
(20
|
)
|
(9
|
)
|
|||||||||
|
DMG Transfer (2)
|
—
|
|
—
|
|
(1
|
)
|
—
|
|
|||||||||
|
End of period
|
$
|
2
|
|
$
|
2
|
|
$
|
2
|
|
$
|
15
|
|
|||||
__________________________________________
|
(1)
|
Expense during the Successor Period, the 2012 Predecessor Period and the year ended December 31, 2011 includes less than
$1 million
,
$4 million
and
$2 million
in retention benefits, respectively.
|
|
(2)
|
On September 1, 2011, we completed the DMG Transfer. Please read
Note 1—Organization and Operations
—DMG Transfer and DMG Acquisition for further discussion.
|
Note 8—Risk Management Activities, Derivatives and Financial Instruments
The nature of our business necessarily involves market and financial risks. Specifically, we are exposed to commodity price variability related to our power generation business. Our commercial team manages these commodity price risks with financially settled and other types of contracts consistent with our commodity risk management policy. Our commercial team also uses financial instruments in an attempt to capture the benefit of fluctuations in market prices in the geographic regions where our assets operate. Our treasury team manages our financial risks and exposures associated with interest expense variability.
Our commodity risk management strategy gives us the flexibility to sell energy and capacity through a combination of spot market sales and near-term contractual arrangements (generally over a
one
to
two
year time frame). Our commodity risk management goal is to protect cash flow in the near-term while keeping the ability to capture value longer-term.
Many of our contractual arrangements are derivative instruments and are accounted for at fair value as part of revenues in our consolidated statements of operations. We enter into capacity forward sales arrangements, tolling arrangements, RMR contracts, fixed price coal purchases and other arrangements that do not receive recurring fair value accounting treatment because these arrangements do not meet the definition of a derivative or are designated as “normal purchase, normal sale.” As a result, the gains and losses with respect to these arrangements are not reflected in the consolidated statements of operations until the delivery occurs.
F-29
DYNEGY INC.
NOTES TO CONSOLIDATED FINANCIAL STATEMENTS (Continued)
Quantitative Disclosures Related to Financial Instruments and Derivatives
The following disclosures and tables present information concerning the impact of derivative instruments on our consolidated balance sheets and statements of operations. In the table below, commodity contracts primarily consist of derivative contracts related to our power generation business that we have not designated as accounting hedges that are entered into for purposes of economically hedging future fuel requirements and sales commitments and securing commodity prices. We elect not to designate any of our derivatives as accounting hedges. As of
December 31, 2012
, our commodity derivatives were comprised of both purchases and sales of commodities. As of
December 31, 2012
, we had net purchases and sales of derivative contracts outstanding in the following quantities:
|
Contract Type
|
Hedge Designation
|
Quantity
|
Unit of Measure
|
Net Fair Value
|
|||||||
|
(amounts in millions)
|
|
|
|||||||||
|
Commodity contracts:
|
|
|
|
|
|
|
|||||
|
Electric energy (1)
|
Not designated
|
(25
|
)
|
MWh
|
$
|
(8
|
)
|
||||
|
Natural gas (1)
|
Not designated
|
128
|
|
MMBtu
|
$
|
(6
|
)
|
||||
|
Heat rate derivatives
|
Not designated
|
(2)/14
|
|
MWh/MMBtu
|
$
|
2
|
|
||||
|
Warrants
|
Not designated
|
16
|
|
Warrant
|
$
|
(20
|
)
|
||||
|
Interest rate contracts:
|
|
||||||||||
|
Interest rate swaps
|
Not designated
|
1,100
|
|
Dollars
|
$
|
(46
|
)
|
||||
|
Interest rate caps
|
Not designated
|
1,400
|
|
Dollars
|
$
|
—
|
|
||||
__________________________________________
|
(1)
|
Mainly comprised of swaps, options and physical forwards.
|
Derivatives on the Balance Sheet.
We execute a significant volume of transactions through futures clearing managers. Our daily cash payments (receipts) with our futures clearing managers consist of three parts: (i) fair value of open positions (exclusive of options) (“Daily Cash Settlements”); (ii) initial margin requirements of open positions (“Initial Margin”); and (iii) fair value related to options (“Options”, and collectively with Daily Cash Settlements and Initial Margin, “Collateral”). In addition to the transactions we execute through the futures clearing managers, we also execute transactions through multiple bilateral counterparties. Our transactions with these counterparties are collateralized using cash collateral and first liens. The Predecessor elected not to offset fair value amounts recognized for derivative instruments executed with the same counterparty under a master netting agreement and also elected not to offset the cash paid as collateral to or received from all counterparties against the fair value amounts recognized for derivative instruments executed with the same counterparty under a master netting agreement. As a result, the Predecessor's consolidated balance sheet presents derivative assets and liabilities, as well as cash paid to collateral to all counterparties, on a gross basis.
The Successor elects to offset fair value amounts recognized for derivative instruments executed with the same counterparty under a master netting agreement, where the right of offset exists. The Successor also offsets the cash paid as collateral to or received from all counterparties against the fair value amounts recognized for derivative instruments executed with the same counterparty under a master netting agreement. As a result, the Successor's consolidated balance sheet presents derivative assets and liabilities, as well as cash paid to or received from all counterparties against those positions, on a net basis. As of
December 31, 2012
, we had posted
$44 million
classified as Broker margin on the balance sheet. Of this amount, approximately
$4 million
was applied against our short-term risk management liability position. Additionally, we posted
$17 million
of cash collateral which is classified as Prepayments and other current assets, of which approximately
$4 million
was posted against short-term risk management liabilities.
The following table presents the fair value and balance sheet classification of derivatives in the consolidated balance sheets as of
December 31, 2012 and 2011
segregated by type of contract segregated by assets and liabilities:
F-30
DYNEGY INC.
NOTES TO CONSOLIDATED FINANCIAL STATEMENTS (Continued)
|
Successor
|
Predecessor
|
||||||||||
|
Contract Type
|
Balance Sheet Location
|
December 31, 2012
|
December 31, 2011
|
||||||||
|
(amounts in millions)
|
|
||||||||||
|
Derivative Assets:
|
|
|
|
|
|
||||||
|
Commodity contracts
|
Assets from risk management activities
|
$
|
60
|
|
$
|
2,639
|
|
||||
|
Commodity contracts, affiliates
|
Assets from risk management activities, affiliates
|
4
|
|
2
|
|
||||||
|
Interest rate contracts
|
Assets from risk management activities
|
—
|
|
2
|
|
||||||
|
Adjustment for net presentation
|
Assets from risk management activities
|
(47
|
)
|
—
|
|
||||||
|
Net derivative assets
|
17
|
|
2,643
|
|
|||||||
|
Derivative Liabilities:
|
|
|
|
|
|
||||||
|
Commodity contracts
|
Liabilities from risk management activities
|
(75
|
)
|
(2,810
|
)
|
||||||
|
Commodity contracts, affiliates
|
Liabilities from risk management activities, affiliates
|
—
|
|
(7
|
)
|
||||||
|
Interest rate contracts
|
Liabilities from risk management activities
|
(46
|
)
|
(8
|
)
|
||||||
|
Warrants
|
Other long-term liabilities
|
(20
|
)
|
—
|
|
||||||
|
Adjustment for net presentation
|
Liabilities from risk management activities
|
54
|
|
—
|
|
||||||
|
Net derivative liabilities
|
(87
|
)
|
(2,825
|
)
|
|||||||
|
Total derivatives
|
|
$
|
(70
|
)
|
$
|
(182
|
)
|
||||
__________________________________________
|
(1)
|
In connection with the application of fresh-start accounting, we elected to present our derivative positions on a net basis, which includes offsetting broker margin and collateral against risk management liabilities. Approximately
$8 million
of broker margin and collateral were offset against risk management liabilities as of December 31, 2012. Risk management positions were presented on a gross basis as of December 31, 2011. Please read
|
Impact of Derivatives on the Consolidated Statements of Operations
The following discussion and table presents the location and amount of gains and losses on derivative instruments in our consolidated statements of operations.
Financial Instruments Not Designated as Hedges.
We elect not to designate derivatives related to our power generation business and interest rate instruments as cash flow or fair value hedges. Thus, we account for changes in the fair value of these derivatives within the consolidated statements of operations (herein referred to as “mark-to-market accounting treatment”). As a result, these mark-to-market gains and losses are not reflected in the consolidated statements of operations in the same period as the underlying activity for which the derivative instruments serve as economic hedges.
For the Successor Period and the 2012 Predecessor Period, our revenues included approximately
$45 million
of unrealized mark-to-market gains and
$103 million
of unrealized mark-to-market gains, respectively, related to commodity derivative activity compared to
$193 million
of unrealized mark-to-market losses and
$21 million
of unrealized mark-to-market gains in the years ended December 31, 2011 and 2010, respectively.
The impact of derivative financial instruments, including realized and unrealized gains and losses, that have not been designated as hedges on our consolidated statements of operations for the Successor Period, the 2012 Predecessor Period and the years ended December 31, 2011 and 2010 are presented below. Note that this presentation does not reflect the expected gains or losses arising from the underlying physical transactions associated with these financial instruments. Therefore, this presentation is not indicative of the economic gross margin we expect to realize when the underlying physical transactions settle and interest payments are made.
Fair Value Hedges.
We also enter into derivative instruments that qualify, and that we may elect to designate, as fair value hedges. As of December 31, 2012, we have not elected to designate any derivative instruments as fair value hedges. We previously used interest rate swaps to convert a portion of our non-prepayable fixed-rate debt into floating-rate debt. These derivatives and the corresponding hedged debt matured April 1, 2011. The impact of interest rate swap contracts designated as fair value hedges and the related hedged item on our consolidated statements of operations for the years ended
December 31, 2011 and 2010
was immaterial. During the twelve month periods ended December 31, 2011 and 2010, there was no ineffectiveness from changes in the fair value of hedge positions and no amounts were excluded from the assessment of hedge
F-31
DYNEGY INC.
NOTES TO CONSOLIDATED FINANCIAL STATEMENTS (Continued)
effectiveness. In addition, there were no gains or losses related to the recognition of firm commitments that no longer qualified as fair value hedges.
|
Successor
|
Predecessor
|
||||||||||||||||||
|
Derivatives Not Designated
as Hedges
|
Location of Gain (Loss)
Recognized in Income on
Derivatives
|
October 2 Through December 31,
|
January 1 Through October 1,
|
Year Ended December 31,
|
|||||||||||||||
|
2012
|
2012
|
2011
|
2010
|
||||||||||||||||
|
(amounts in millions)
|
|
||||||||||||||||||
|
Commodity contracts
|
Revenues
|
$
|
(13
|
)
|
$
|
(60
|
)
|
$
|
(224
|
)
|
$
|
185
|
|
||||||
|
Commodity contracts, affiliates
|
Revenues
|
4
|
|
(6
|
)
|
(18
|
)
|
—
|
|
||||||||||
|
Interest rate contracts
|
Interest Expense
|
—
|
|
(33
|
)
|
(7
|
)
|
—
|
|
||||||||||
|
Warrants
|
Other income (expense)
|
8
|
|
—
|
|
—
|
|
—
|
|
||||||||||
Note 9—Fair Value Measurements
We primarily apply the market approach for recurring fair value measurements and endeavor to utilize the best available information. Accordingly, we utilize valuation techniques that maximize the use of observable inputs and minimize the use of unobservable inputs. We have consistently used the same valuation techniques for all periods presented.
The finance organization monitors commodity risk through the CRCG. The EMT monitors interest rate risk. The EMT has delegated the responsibility for managing interest rate risk to the CFO. The CRCG is independent of our commercial operations and has direct access to the Audit Committee. The Finance and Risk Management Committee, comprised of members of management and chaired by the CFO, meets periodically and is responsible for reviewing our overall day-to-day energy commodity risk exposure, as measured against the limits established in our Commodity Risk Policy.
Each quarter, as part of its internal control processes, representatives from the CRCG review the methodology and assumptions behind the pricing of the forward curves. As part of this review, liquidity periods are established based on third party market information, the basis relationship between direct and derived curves is evaluated, and changes are made to the forward power model assumptions.
The CRCG reviews changes in value on a daily basis through the use of various reports. The pricing for power, natural gas and fuel oil curves is automatically entered into our commercial system nightly based on data received from our market data provider. The CRCG reviews the data provided by the market data provider by utilizing third party broker quotes for comparison purposes. In addition, our traders are required to review various reports to ensure accuracy on a daily basis.
The following tables set forth by level within the fair value hierarchy our financial assets and liabilities that were accounted for at fair value on a recurring basis as of
December 31, 2012 and 2011
and are presented on a gross basis before consideration of amounts netted under master netting agreements and the application of collateral and margin paid. These financial assets and liabilities are classified in their entirety based on the lowest level of input that is significant to the fair value measurement. Our assessment of the significance of a particular input to the fair value measurement requires judgment, and may affect the valuation of fair value assets and liabilities and their placement within the fair value hierarchy levels.
F-32
DYNEGY INC.
NOTES TO CONSOLIDATED FINANCIAL STATEMENTS (Continued)
|
Successor
|
||||||||||||||||
|
|
Fair Value as of December 31, 2012
|
|||||||||||||||
|
(amounts in millions)
|
Level 1
|
Level 2
|
Level 3
|
Total
|
||||||||||||
|
Assets:
|
|
|
|
|
|
|
|
|
||||||||
|
Assets from commodity risk management activities:
|
|
|
|
|
|
|
|
|
||||||||
|
Electricity derivatives
|
$
|
—
|
|
$
|
37
|
|
$
|
11
|
|
$
|
48
|
|
||||
|
Natural gas derivatives
|
—
|
|
14
|
|
—
|
|
14
|
|
||||||||
|
Heat rate derivatives
|
—
|
|
—
|
|
3
|
|
3
|
|
||||||||
|
Total assets from commodity risk management activities
|
$
|
—
|
|
$
|
51
|
|
$
|
14
|
|
$
|
65
|
|
||||
|
Assets from interest rate contracts
|
—
|
|
—
|
|
—
|
|
—
|
|
||||||||
|
Total
|
$
|
—
|
|
$
|
51
|
|
$
|
14
|
|
$
|
65
|
|
||||
|
Liabilities:
|
|
|
|
|
|
|
|
|
||||||||
|
Liabilities from commodity risk management activities:
|
|
|
|
|
|
|
|
|
||||||||
|
Electricity derivatives
|
$
|
—
|
|
$
|
(50
|
)
|
$
|
(6
|
)
|
$
|
(56
|
)
|
||||
|
Natural gas derivatives
|
—
|
|
(20
|
)
|
—
|
|
(20
|
)
|
||||||||
|
Heat rate derivatives
|
—
|
|
—
|
|
(1
|
)
|
(1
|
)
|
||||||||
|
Total liabilities from commodity risk management activities
|
$
|
—
|
|
$
|
(70
|
)
|
$
|
(7
|
)
|
$
|
(77
|
)
|
||||
|
Liabilities from interest rate contracts
|
—
|
|
(46
|
)
|
—
|
|
(46
|
)
|
||||||||
|
Liabilities from outstanding warrants
|
(20
|
)
|
—
|
|
—
|
|
(20
|
)
|
||||||||
|
Total
|
$
|
(20
|
)
|
$
|
(116
|
)
|
$
|
(7
|
)
|
$
|
(143
|
)
|
||||
|
Predecessor
|
||||||||||||||||
|
|
Fair Value as of December 31, 2011
|
|||||||||||||||
|
(amounts in millions)
|
Level 1
|
Level 2
|
Level 3
|
Total
|
||||||||||||
|
Assets:
|
|
|
|
|
|
|
|
|
||||||||
|
Assets from commodity risk management activities:
|
|
|
|
|
|
|
|
|
||||||||
|
Electricity derivatives
|
$
|
—
|
|
$
|
211
|
|
$
|
26
|
|
$
|
237
|
|
||||
|
Electricity derivatives, affiliates
|
—
|
|
1
|
|
1
|
|
2
|
|
||||||||
|
Natural gas derivatives
|
—
|
|
2,387
|
|
—
|
|
2,387
|
|
||||||||
|
Other derivatives
|
—
|
|
15
|
|
—
|
|
15
|
|
||||||||
|
Total assets from commodity risk management activities:
|
$
|
—
|
|
$
|
2,614
|
|
$
|
27
|
|
$
|
2,641
|
|
||||
|
Assets from interest rate contracts
|
—
|
|
—
|
|
2
|
|
2
|
|
||||||||
|
Total
|
$
|
—
|
|
$
|
2,614
|
|
$
|
29
|
|
$
|
2,643
|
|
||||
|
Liabilities:
|
|
|
|
|
|
|
|
|
||||||||
|
Liabilities from commodity risk management activities:
|
|
|
|
|
|
|
|
|
||||||||
|
Electricity derivatives
|
$
|
—
|
|
$
|
(169
|
)
|
$
|
(2
|
)
|
$
|
(171
|
)
|
||||
|
Electricity derivatives, affiliates
|
—
|
|
(2
|
)
|
(5
|
)
|
(7
|
)
|
||||||||
|
Natural gas derivatives
|
—
|
|
(2,607
|
)
|
—
|
|
(2,607
|
)
|
||||||||
|
Heat rate derivatives
|
—
|
|
—
|
|
(17
|
)
|
(17
|
)
|
||||||||
|
Other derivatives
|
—
|
|
(15
|
)
|
—
|
|
(15
|
)
|
||||||||
|
Total liabilities from commodity risk management activities
|
$
|
—
|
|
$
|
(2,793
|
)
|
$
|
(24
|
)
|
$
|
(2,817
|
)
|
||||
|
Liabilities from interest rate contracts
|
—
|
|
—
|
|
(8
|
)
|
(8
|
)
|
||||||||
|
Total
|
$
|
—
|
|
$
|
(2,793
|
)
|
$
|
(32
|
)
|
$
|
(2,825
|
)
|
||||
F-33
DYNEGY INC.
NOTES TO CONSOLIDATED FINANCIAL STATEMENTS (Continued)
Level 3 Valuation Methods.
The electricity contracts classified within Level 3 are primarily financial swaps executed in illiquid trading locations, capacity contracts, heat rate derivatives and FTRs. The curves used to generate the fair value of the financial swaps are based on basis adjustments applied to forward curves for liquid trading points, while the curves for the capacity deals are based upon auction results in the marketplace, which are infrequently executed. Additionally, FTRs are classified within the electricity contracts, which are also an illiquid product. The forward market price of FTRs is derived using historical congestion patterns within the marketplace. Heat rate derivative valuations are derived using a Black-Scholes spread model, which uses forward natural gas and power prices, market implied volatilities and modeled power/natural gas correlation values
.
The interest rate contracts classified within Level 3 in the predecessor period include an implied credit fee that impacted the day one value of the instruments. We revalued the credit fee each quarter in conjunction with revaluing the actual interest rate derivative. The interest rate derivatives were revalued using the forward LIBOR curve each period and the credit fee was revalued by determining the change in credit factors, such as credit default swaps, period over period. In connection with our emergence from bankruptcy, the implied credit fee for these instruments was adjusted to reflect our improved credit standing, thus resulting in the reclassification of the fair value of the interest rate derivatives to Level 2.
The Administrative Claim was contingent consideration issued in connection with the DMG Acquisition; therefore this claim is marked to its estimated fair value each period. The fair value of the Administrative Claim is classified within Level 3 of the fair value hierarchy. We initially recorded the Administrative Claim granted in the Settlement Agreement at its estimated fair value of
$64
million. We estimated the fair value of the Administrative Claim using the market capitalization of Legacy Dynegy as of the date of the DMG Acquisition. We concluded that the market capitalization of Legacy Dynegy represented a reasonable estimate of the fair value of the Administrative Claim because the previous holders of Legacy Dynegy’s common stock became the holders of beneficial interests in the Administrative Claim upon our emergence from bankruptcy. The Administrative Claim had the potential to be settled in cash under certain circumstances, as such we accounted for the Administrative Claim as a liability and adjusted the carrying amount of the claim to its estimated fair value each reporting period. Immediately prior to the Merger, the fair value of the Administrative Claim was a liability of approximately
$47 million
resulting in a credit of approximately
$17 million
in Bankruptcy reorganization items, net on our consolidated statement of operations for the 2012 Predecessor Period. On the Plan Effective Date, the Administrative Claim was settled. Please read
Note 3—Emergence from Bankruptcy and Fresh-Start Accounting
for further discussion.
Sensitivity to Changes in Significant Unobservable Inputs for Level 3 Valuations.
The significant unobservable inputs used in the fair value measure of our commodity instruments categorized within Level 3 of the fair value hierarchy are estimates of future price correlation, future market volatility, estimates of forward congestion power price spreads, assumptions of illiquid power location pricing basis to liquid locations, and estimates of counterparty credit risk and our own non-performance risk. These assumptions are generally independent of each other. Volatility curves and power prices spreads are generally based on observable markets where available, or derived from historical prices and forward market prices from similar observable markets when not available. Increases in the price or volatility of the spread on a long/short position in isolation would result in a higher/lower fair value measurement. A change in the assumption used for the probability of default is accompanied by a directionally similar change in the adjustment to reflect the estimated default risk of counterparties on their contractual obligations, or the estimated risk of default on our own contractual obligations to counterparties. A
10 percent
change in pricing inputs and changes in volatilities and correlation factors would result in less than a
$1 million
change in our Level 3 fair value.
F-34
DYNEGY INC.
NOTES TO CONSOLIDATED FINANCIAL STATEMENTS (Continued)
The following tables set forth a reconciliation of changes in the fair value of financial instruments classified as Level 3 in the fair value hierarchy:
|
For the Year Ended December 31, 2012
|
||||||||||||||||||||
|
(amounts in millions)
|
Electricity Derivatives
|
Heat Rate Derivatives
|
Administrative Claim
|
Interest Rate Swaps
|
Total
|
|||||||||||||||
|
Balance at December 31, 2011 (Predecessor)
|
$
|
20
|
|
$
|
(17
|
)
|
$
|
—
|
|
$
|
(6
|
)
|
$
|
(3
|
)
|
|||||
|
Total gains (losses) included in earnings
|
(33
|
)
|
1
|
|
17
|
|
(24
|
)
|
(39
|
)
|
||||||||||
|
Settlements
|
14
|
|
14
|
|
—
|
|
—
|
|
28
|
|
||||||||||
|
DMG Acquisition
|
4
|
|
—
|
|
—
|
|
(7
|
)
|
(3
|
)
|
||||||||||
|
Issuance of Administrative Claim
|
—
|
|
—
|
|
(64
|
)
|
—
|
|
(64
|
)
|
||||||||||
|
Transfer out of level 3
|
—
|
|
—
|
|
—
|
|
37
|
|
37
|
|
||||||||||
|
Balance at October 1, 2012 (Predecessor)
|
$
|
5
|
|
$
|
(2
|
)
|
$
|
(47
|
)
|
$
|
—
|
|
$
|
(44
|
)
|
|||||
|
Total losses included in earnings
|
—
|
|
(1
|
)
|
—
|
|
—
|
|
(1
|
)
|
||||||||||
|
Settlements
|
—
|
|
5
|
|
47
|
|
—
|
|
52
|
|
||||||||||
|
Balance at December 31, 2012 (Successor)
|
$
|
5
|
|
$
|
2
|
|
$
|
—
|
|
$
|
—
|
|
$
|
7
|
|
|||||
|
Unrealized gains (losses) relating to instruments held as of December 31, 2012
|
$
|
1
|
|
$
|
(1
|
)
|
$
|
—
|
|
$
|
—
|
|
$
|
—
|
|
|||||
|
Predecessor
|
||||||||||||||||||||
|
|
Year Ended December 31, 2011
|
|||||||||||||||||||
|
(amounts in millions)
|
Electricity
Derivatives
|
Natural Gas Derivatives
|
Heat Rate Derivatives
|
Interest Rate Swaps
|
Total
|
|||||||||||||||
|
Balance at December 31, 2010
|
$
|
49
|
|
$
|
5
|
|
$
|
(31
|
)
|
$
|
—
|
|
$
|
23
|
|
|||||
|
Total gains (losses) included in earnings
|
7
|
|
(4
|
)
|
(5
|
)
|
(6
|
)
|
(8
|
)
|
||||||||||
|
Settlements
|
(36
|
)
|
(1
|
)
|
19
|
|
—
|
|
(18
|
)
|
||||||||||
|
Balance at December 31, 2011
|
$
|
20
|
|
$
|
—
|
|
$
|
(17
|
)
|
$
|
(6
|
)
|
$
|
(3
|
)
|
|||||
|
Unrealized gains (losses) relating to instruments (net of affiliates) held as of December 31, 2011
|
$
|
9
|
|
$
|
(4
|
)
|
$
|
(7
|
)
|
$
|
(6
|
)
|
$
|
(8
|
)
|
|||||
|
Predecessor
|
||||||||||||||||||||
|
|
Year Ended December 31, 2010
|
|||||||||||||||||||
|
(amounts in millions)
|
Electricity
Derivatives
|
Natural Gas Derivatives
|
Heat Rate Derivatives
|
Interest Rate Swaps
|
Total
|
|||||||||||||||
|
Balance at December 31, 2009
|
$
|
6
|
|
$
|
5
|
|
$
|
17
|
|
$
|
(50
|
)
|
$
|
(22
|
)
|
|||||
|
Deconsolidation of Plum Point
|
—
|
|
—
|
|
—
|
|
50
|
|
50
|
|
||||||||||
|
Total gains (losses) included in earnings
|
77
|
|
—
|
|
7
|
|
—
|
|
84
|
|
||||||||||
|
Purchases
|
1
|
|
—
|
|
2
|
|
—
|
|
3
|
|
||||||||||
|
Issuances
|
(12
|
)
|
—
|
|
(22
|
)
|
—
|
|
(34
|
)
|
||||||||||
|
Settlements
|
(23
|
)
|
—
|
|
(35
|
)
|
—
|
|
(58
|
)
|
||||||||||
|
Balance at December 31, 2010
|
$
|
49
|
|
$
|
5
|
|
$
|
(31
|
)
|
$
|
—
|
|
$
|
23
|
|
|||||
|
Unrealized gains (losses) relating to instruments still held as of December 31, 2010
|
$
|
64
|
|
$
|
—
|
|
$
|
(9
|
)
|
$
|
—
|
|
$
|
55
|
|
|||||
Gains and losses (realized and unrealized) for Level 3 recurring items are included in Revenues, Interest expense and Bankruptcy reorganization items, net on the consolidated statements of operations for commodity derivatives, interest rate swaps and the Administrative Claim, respectively.
On January 1, 2010, we adopted ASU No. 2009-17-Consolidations (Topic 810): Improvements to Financial Reporting by Enterprises involved with Variable Interest Entities. The adoption of ASU No. 2009-17 resulted in a deconsolidation of our investment in PPEA Holding which was accounted for as an equity method investment until the sale of our interest on November 10, 2010. Please read
Note 15—Variable Interest Entities
—PPEA Holding Company LLC for further discussion.
F-35
DYNEGY INC.
NOTES TO CONSOLIDATED FINANCIAL STATEMENTS (Continued)
Nonfinancial Assets and Liabilities.
Nonfinancial assets and liabilities that are measured at fair value on a nonrecurring basis are classified in their entirety based on the lowest level of input that is significant to the fair value measurement. Our assessment of the significance of a particular input to the fair value measurement requires judgment, and may affect the valuation of fair value assets and liabilities and their placement within the fair value hierarchy levels.
In June 2012, we recorded the assets and liabilities acquired in the DMG Acquisition at their estimated fair values using the acquisition method of accounting for business combinations. Please read
Note 4—Merger and Acquisition
for further discussion. Additionally, in connection with the application of fresh-start accounting on the Plan Effective Date, we adjusted our assets and liabilities to their estimated fair values using the acquisition method of accounting for business combinations. Please read
Note 3—Emergence from Bankruptcy and Fresh-Start Accounting
for further discussion.
During the year ended ended
December 31, 2010
, long-lived assets held and used were written down to their fair value of
$275 million
, resulting in pre-tax impairment charges of
$136 million
, which is included in Impairment and other charges on our consolidated statements of operations. This fair value is considered a Level 3 measurement. Please read
Note 7—Impairment and Restructuring Charges
—2010 Impairment Charges for further discussion.
On January 1, 2010, we recorded an impairment of our investment in PPEA Holding as part of our cumulative effect of a change in accounting principle. We determined the fair value of our investment using assumptions that reflect our best estimate of third party market participants’ considerations based on the facts and circumstances related to our investment at that time. The fair value of our investment on January 1, 2010 is considered a Level 3 measurement as the fair value was determined based on probability weighted cash flows resulting from various alternative scenarios including no change in the financing structure, a restructuring of the project debt and insolvency. These scenarios and the related probability weighting are consistent with the scenarios used at
December 31, 2009
in our long-lived asset impairment analysis. At March 31, 2010, we fully impaired our investment in PPEA Holding due to the uncertainty and risk surrounding PPEA’s financing structure. During the period from April 1, 2010 through November 10, 2010, the date we sold our investment in PPEA Holding, we did not recognize our share of losses from our investment in PPEA Holding as we had no further obligation to provide support. Please read
Note 7—Impairment and Restructuring Charges
—2010 Impairment Charges—Other and
Note 15—Variable Interest Entities
—PPEA Holding Company LLC for further discussion.
Fair Value of Financial Instruments.
We have determined the estimated fair value amounts using available market information and selected valuation methodologies. Considerable judgment is required in interpreting market data to develop the estimates of fair value. The use of different market assumptions or valuation methodologies could have a material effect on the estimated fair-value amounts.
The carrying values of financial assets and liabilities (cash, accounts receivable, restricted cash and investments, short-term investments and accounts payable) not presented in the table below approximate fair values due to the short-term maturities of these instruments. The
$846 million
Accounts receivable, affiliate balance with Legacy Dynegy classified within member’s equity as of December 31, 2011 did not have a fair value as there were no defined payment terms, was not evidenced by any promissory note, and there was never an intent for payment to occur. The Accounts receivable, affiliate balance was settled on June 5, 2012. Please read
Note 19—Related Party Transactions
—Accounts receivable, affiliates for further discussion. Unless otherwise noted, the fair value of debt as reflected in the table has been calculated based on the average of certain available broker quotes or trading values for the years ending
December 31, 2012
and
December 31, 2011
, respectively.
|
Successor
|
Predecessor
|
||||||||||||||||
|
|
December 31, 2012
|
December 31, 2011
|
|||||||||||||||
|
(amounts in millions)
|
Carrying
Amount
|
Fair
Value
|
Carrying
Amount
|
Fair
Value
|
|||||||||||||
|
Undertaking receivable, affiliate (1)
|
$
|
—
|
|
$
|
—
|
|
$
|
1,250
|
|
$
|
728
|
|
|||||
|
Interest rate derivatives not designated as accounting hedges (2)
|
(46
|
)
|
(46
|
)
|
(6
|
)
|
(6
|
)
|
|||||||||
|
Commodity-based derivative contracts not designated as accounting hedges (2)
|
(12
|
)
|
(12
|
)
|
(176
|
)
|
(176
|
)
|
|||||||||
|
DPC Credit Agreement due 2016 (3)
|
(880
|
)
|
(874
|
)
|
(1,076
|
)
|
(1,118
|
)
|
|||||||||
|
DMG Credit Agreement due 2016 (4)
|
(535
|
)
|
(537
|
)
|
—
|
|
—
|
|
|||||||||
|
Warrants
|
(20
|
)
|
(20
|
)
|
—
|
|
—
|
|
|||||||||
__________________________________________
|
(1)
|
The fair value of the Undertaking receivable is classified within Level 3 of the fair value hierarchy. Our December 31, 2011 estimate of the fair value of the Undertaking receivable represents the
$750 million
fair value as of November 7, 2011, less the
$22 million
payment in December 2011. Pursuant to the Settlement Agreement on June 5, 2012, the
|
F-36
DYNEGY INC.
NOTES TO CONSOLIDATED FINANCIAL STATEMENTS (Continued)
Undertaking Agreement was terminated. Please read
Note 3—Emergence from Bankruptcy and Fresh-Start Accounting
for further discussion.
|
(2)
|
Included in both current and non-current assets and liabilities on the consolidated balance sheets.
|
|
(3)
|
Carrying amount includes unamortized premiums and discounts of
$43 million
and
$21 million
at
December 31, 2012 and 2011
, respectively. The fair value of the DPC Credit Agreement is classified within Level 2 of the fair value hierarchy.
|
|
(4)
|
Includes unamortized premiums of
$18 million
as of
December 31, 2012
. The fair value of the DMG Credit Agreement is classified within Level 2 of the fair value hierarchy.
|
Concentration of Credit Risk.
We sell our energy products and services to customers in the electric and natural gas distribution industries, financial institutions and to entities engaged in industrial businesses. These industry concentrations have the potential to impact our overall exposure to credit risk, either positively or negatively, because the customer base may be similarly affected by changes in economic, industry, weather or other conditions.
At
December 31, 2012
, our credit exposure as it relates to the mark-to-market portion of our risk management portfolio totaled
$13 million
. We seek to reduce our credit exposure by executing agreements that permit us to offset receivables, payables and mark-to-market exposure. We attempt to further reduce credit risk with certain counterparties by obtaining third party guarantees or collateral as well as the right of termination in the event of default.
Our Credit Department, based on guidelines approved by the Board of Directors, establishes our counterparty credit limits. Our industry typically operates under negotiated credit lines for physical delivery and financial contracts. Our credit risk system provides current credit exposure to counterparties on a daily basis.
We enter into master netting agreements in an attempt to both mitigate credit exposure and reduce collateral requirements. In general, the agreements include our risk management subsidiaries and allow the aggregation of credit exposure, margin and set-off. As a result, we decrease a potential credit loss arising from a counterparty default.
We include cash collateral deposited with brokers which has not been offset against risk management liabilities in Broker Margin on our consolidated balance sheets. As of
December 31, 2012
, we had
$40 million
recorded to Broker Margin. We include cash paid to non-broker counterparties in Prepayments and other current assets on our consolidated balance sheets. As of December 31, 2012, we had
$17 million
recorded to Prepayments and other current assets. We include cash collateral received from non-broker counterparties in Accrued liabilities and other current liabilities on our consolidated balance sheets. As of
December 31, 2012
, we were not holding any collateral received from counterparties.
Accumulated other comprehensive income, net of tax, is included in stockholders’ equity (deficit) and member’s equity on our consolidated balance sheets as follows:
|
Successor
|
Predecessor
|
||||||||
|
(amounts in millions)
|
December 31, 2012
|
December 31, 2011
|
|||||||
|
Cash flow hedging activities, net
|
$
|
—
|
|
$
|
1
|
|
|||
|
Unrecognized prior service cost and actuarial gain, net
|
11
|
|
—
|
|
|||||
|
Accumulated other comprehensive income, net of tax
|
$
|
11
|
|
$
|
1
|
|
|||
F-37
DYNEGY INC.
NOTES TO CONSOLIDATED FINANCIAL STATEMENTS (Continued)
Following are supplemental disclosures of cash flow and non-cash investing and financing information:
|
Successor
|
Predecessor
|
||||||||||||||||
|
|
October 2 Through December 31,
|
January 1 Through October 1,
|
Year Ended December 31,
|
||||||||||||||
|
(amounts in millions)
|
2012
|
2012
|
2011
|
2010
|
|||||||||||||
|
Interest paid (net of amount capitalized)
|
$
|
36
|
|
$
|
96
|
|
$
|
221
|
|
$
|
343
|
|
|||||
|
Taxes paid, net
|
$
|
—
|
|
$
|
(7
|
)
|
$
|
(2
|
)
|
$
|
4
|
|
|||||
|
Other non-cash investing and financing activity:
|
|
|
|||||||||||||||
|
Non-cash capital expenditures (1)
|
$
|
3
|
|
$
|
(3
|
)
|
$
|
3
|
|
$
|
1
|
|
|||||
|
Other affiliate activity with Legacy Dynegy (2)
|
—
|
|
—
|
|
(34
|
)
|
(37
|
)
|
|||||||||
|
Undertaking agreement, affiliate (3)
|
—
|
|
—
|
|
(1,250
|
)
|
—
|
|
|||||||||
|
DMG Acquisition (4)
|
—
|
|
466
|
|
—
|
|
—
|
|
|||||||||
|
Extinguishment of liabilities subject to compromise
|
—
|
|
4,240
|
|
—
|
|
—
|
|
|||||||||
|
Issuance of new common stock
|
2,596
|
|
—
|
|
—
|
|
—
|
|
|||||||||
|
Issuance of warrants
|
28
|
|
—
|
|
—
|
|
—
|
|
|||||||||
__________________________________________
|
(1)
|
These expenditures related primarily to changes in our accruals related to capital expenditures for all years presented. Please read
Note 22—Commitments and Contingencies
for further discussion.
|
|
(2)
|
Represents transactions with Legacy Dynegy in the normal course of business, primarily the reallocation of deferred taxes between legal entities in accordance with the applicable IRS regulations.
|
|
(3)
|
Represents a promissory note received in exchange for the DMG Transfer on September 1, 2011.
|
|
(4)
|
Represents the consideration given by us related to the DMG Acquisition. Please read
Note 4—Merger and Acquisition
for further discussion.
|
For the Successor Period, 2012 Predecessor Period and the year ended December 31, 2011, cash flow from operating activities included
$41 million
,
$30 million
and
$1 million
in payments to professional advisers related to reorganization costs. There was a
$22 million
investing cash outflow related to the deconsolidation of the DNE Debtor Entities and a
$200 million
financing cash outflow for the cash payment made to creditors upon our emergence during the 2012 Predecessor Period.
A summary of our inventories is as follows:
|
Successor
|
Predecessor
|
||||||||
|
(amounts in millions)
|
December 31, 2012
|
December 31, 2011
|
|||||||
|
Materials and supplies
|
$
|
46
|
|
$
|
40
|
|
|||
|
Coal
|
52
|
|
16
|
|
|||||
|
Fuel
|
3
|
|
8
|
|
|||||
|
Emissions allowances
|
—
|
|
1
|
|
|||||
|
Total
|
$
|
101
|
|
$
|
65
|
|
|||
During the Successor Period and the 2012 Predecessor Period there were no lower of cost or market adjustments. During the years ended
December 31, 2011 and 2010
, we recorded lower of cost or market adjustments of
$2 million
and
$3 million
, respectively. These charges are included in Cost of sales on our consolidated statements of operations.
F-38
DYNEGY INC.
NOTES TO CONSOLIDATED FINANCIAL STATEMENTS (Continued)
A summary of our property, plant and equipment is as follows:
|
Successor
|
Predecessor
|
||||||||
|
(amounts in millions)
|
December 31, 2012
|
December 31, 2011
|
|||||||
|
Buildings and improvements
|
$
|
404
|
|
$
|
167
|
|
|||
|
Environmental upgrades
|
620
|
|
—
|
|
|||||
|
Office and other equipment
|
59
|
|
194
|
|
|||||
|
Power generation
|
1,981
|
|
3,550
|
|
|||||
|
Property, plant and equipment
|
3,064
|
|
3,911
|
|
|||||
|
Accumulated depreciation
|
(42
|
)
|
(1,090
|
)
|
|||||
|
Property, plant and equipment, net
|
$
|
3,022
|
|
$
|
2,821
|
|
|||
The following table summarizes total interest costs incurred and interest capitalized related to costs of construction projects in process:
|
Successor
|
Predecessor
|
||||||||||||||||
|
October 2 Through December 31,
|
January 1 Through October 1,
|
Year Ended December 31,
|
|||||||||||||||
|
(amounts in millions)
|
2012
|
2012
|
2011
|
2010
|
|||||||||||||
|
Total interest costs incurred
|
$
|
35
|
|
$
|
97
|
|
$
|
326
|
|
$
|
348
|
|
|||||
|
Capitalized interest
|
$
|
—
|
|
$
|
5
|
|
$
|
12
|
|
$
|
15
|
|
|||||
Cost Method Investments
Cost method investments consist of investments in affiliates that we do not control and do not have the ability to exercise significant influence.
DNE.
Effective October 1, 2012, the DNE Debtor Entities were deconsolidated and we began accounting for our investment in the DNE Debtor Entities using the cost method of accounting. Please read
Note 3—Emergence from Bankruptcy and Fresh-Start Accounting
for further discussion.
Equity Method Investments
Equity method investments consist of investments in affiliates that we do not control, but where we have the ability to exercise significant influence.
Black Mountain.
We hold a
50 percent
ownership interest in Black Mountain, an
85
MW power generation facility in Las Vegas, Nevada. At
December 31, 2012 and 2011
, the value of this investment was
zero
. Under a third party power purchase agreement through 2023 for
100 percent
of the output of the facility, Black Mountain will receive payments that escalate at a fixed rate over time.
We recorded equity earnings of
$2 million
related to cash distributions received from Black Mountain during the Successor Period. We did not receive any cash distributions or record any equity earnings during the 2012 Predecessor Period or the years ended December 31, 2011 and 2010. We did not have any undistributed earnings from our equity investments included in accumulated deficit at
December 31, 2012 and 2011
.
PPEA Holding Company LLC.
Until the sale of our interest on November 10, 2010, we owned an approximate
37 percent
interest in PPEA Holding, which through PPEA, its wholly-owned subsidiary, owns an approximate
57 percent
undivided interest in the Plum Point Project. On January 1, 2010, we adopted ASU No. 2009-17. The adoption of ASU No. 2009-17 resulted in a deconsolidation of our investment in PPEA Holding which was accounted for as an equity method investment until we sold our interest on November 10, 2010. Please read
Note 15—Variable Interest Entities
—PPEA Holding Company LLC for further discussion.
F-39
DYNEGY INC.
NOTES TO CONSOLIDATED FINANCIAL STATEMENTS (Continued)
Note 15—Variable Interest Entities
DNE.
Effective October 1, 2012, the DNE Debtor Entities were deconsolidated. As of December 31, 2012, we had less than
one million
in net receivables from the DNE Debtor Entities related to the Service Agreements included in our consolidated balance sheet. Our maximum exposure to loss related to our investment in the DNE Debtor Entities is limited to our net receivables as we have no obligation to provide funding to the DNE Debtor Entities on an ongoing basis. Please read
Note 3—Emergence from Bankruptcy and Fresh-Start Accounting
for further discussion. Also, please read
Note 19—Related Party Transactions
for a discussion of the Service Agreements.
PPEA Holding Company LLC.
Until the sale of our interest on November 10, 2010, we owned an approximate
37 percent
interest in PPEA Holding, which through PPEA, its wholly-owned subsidiary, owns an approximate
57 percent
undivided interest in the Plum Point Project. On September 1, 2010, the Plum Point Power Station commenced commercial operation. PPEA financed its share of construction costs through debt financing. Our obligation to PPEA Holding was limited to our funding commitment of approximately
$15 million
, which was paid in May 2010. On November 10, 2010, we completed the sale of our interest in PPEA Holding to one of the other investors in PPEA Holding. We recognized a loss of
$28 million
on the sale, which is included in Losses from unconsolidated investments in our consolidated statements of operations. This loss represents
$28 million
of losses reclassified from AOCI (Loss).
Due to the uncertainty and risk surrounding PPEA’s financing structure as a result of events that occurred in early 2010, we concluded that there was an other-than-temporary impairment of our investment in PPEA Holding and fully impaired our equity investment at March 31, 2010. As a result, we recorded an impairment charge of approximately
$37 million
, which is included in Losses from unconsolidated investments in our consolidated statements of operations. The impairment was a Level 3 non-recurring fair value measurement and reflected our best estimate of third party market participants’ considerations including probabilities related to restructuring of the project debt and potential insolvency. Please read
Note 9—Fair Value Measurements
for further discussion.
On January 1, 2010, we adopted ASU No. 2009-17. As a result of applying this guidance, we determined that we were not the primary beneficiary of PPEA Holding because we lacked the power to direct the activities that most significantly impact PPEA Holding’s economic performance. The activities that most significantly impacted PPEA Holding’s economic performance were changes to the costs to construct and operate the facility, modifications to the off-take agreements, and/or changes in the financing structure. As PPEA Holding’s LLC Agreement required that those activities be approved by all members, the power to direct those activities was shared with the other owners of PPEA Holding and the participants in the
665
MW coal-fired power generation facility (the “Plum Point Project”). Prior to January 1, 2010, we consolidated PPEA Holding in our consolidated financial statements.
The adoption of ASU No. 2009-17 resulted in a deconsolidation of our investment in PPEA Holding, which resulted in the cumulative effect of a change in accounting principle of approximately
$41 million
(
$25 million
after tax). This was recorded as an increase in Accumulated deficit on our consolidated balance sheets as of January 1, 2010. This pre-tax charge reflected the difference in the assets, liabilities and equity (including Other comprehensive loss) that we historically included in our consolidated balance sheets and the carrying value of the equity investment and related accumulated other comprehensive loss that we would have recorded had we accounted for our investment in PPEA Holding as an equity method investment since April 2, 2007, the date we acquired an interest in PPEA Holding. On January 1, 2010, we recorded an equity investment of approximately
$19 million
and accumulated other comprehensive loss of approximately
$29 million
(
$17 million
after tax). The
$19 million
equity investment balance at January 1, 2010 reflected the fair value of our investment at that date, after an other-than-temporary pre-tax impairment charge of approximately
$32 million
that would have been recorded in 2009 had we accounted for our investment in PPEA Holding as an equity investment at that time. Our assessment of the fair value of our investment in PPEA Holding at January 1, 2010 reflected the risk associated with PPEA Holding’s financing arrangement at that date. Please read
Note 9—Fair Value Measurements
for further discussion about the assumptions used to determine the fair value of our investment as of January 1, 2010.
F-40
DYNEGY INC.
NOTES TO CONSOLIDATED FINANCIAL STATEMENTS (Continued)
A summary of changes in our intangible assets and liabilities is as follows:
|
(amounts in millions)
|
Plum Point
|
Gas Revenue Contracts
|
Coal Contracts
|
Gas Transport
|
Total
|
|||||||||||||||
|
December 31, 2009 (Predecessor)
|
$
|
193
|
|
$
|
177
|
|
$
|
—
|
|
$
|
(23
|
)
|
$
|
347
|
|
|||||
|
Plum Point Deconsolidation (1)
|
(193
|
)
|
—
|
|
—
|
|
—
|
|
(193
|
)
|
||||||||||
|
Amortization expense
|
—
|
|
(21
|
)
|
—
|
|
5
|
|
(16
|
)
|
||||||||||
|
December 31, 2010 (Predecessor)
|
—
|
|
156
|
|
—
|
|
(18
|
)
|
138
|
|
||||||||||
|
Amortization expense
|
—
|
|
(42
|
)
|
—
|
|
5
|
|
(37
|
)
|
||||||||||
|
December 31, 2011 (Predecessor)
|
—
|
|
114
|
|
—
|
|
(13
|
)
|
101
|
|
||||||||||
|
DMG Acquisition
|
—
|
|
—
|
|
219
|
|
—
|
|
219
|
|
||||||||||
|
Amortization expense
|
—
|
|
(33
|
)
|
(49
|
)
|
4
|
|
(78
|
)
|
||||||||||
|
Fresh-start adjustments
|
—
|
|
155
|
|
(27
|
)
|
(15
|
)
|
113
|
|
||||||||||
|
October 1, 2012 (Predecessor)
|
—
|
|
236
|
|
143
|
|
(24
|
)
|
355
|
|
||||||||||
|
Amortization expense
|
—
|
|
(34
|
)
|
(28
|
)
|
2
|
|
(60
|
)
|
||||||||||
|
December 31, 2012 (Successor) (2)
|
$
|
—
|
|
$
|
202
|
|
$
|
115
|
|
$
|
(22
|
)
|
$
|
295
|
|
|||||
__________________________________________
|
(1)
|
On January 1, 2010, we adopted ASU No. 2009-17 which resulted in a deconsolidation of our investment in PPEA Holding. Please read
|
|
(2)
|
The total amount of
$295 million
consists of
$271 million
in short-term Intangible assets,
$71 million
in long-term Intangible assets,
$17 million
in Accrued liabilities and other current liabilities, and
$30 million
in Other long-term liabilities on our consolidated balance sheet.
|
Amortization expense (revenue), net for the next five years as of December 31, 2012 is as follows: 2013—$
253 million
, 2014—$
52 million
, 2015—$
(11) million
, 2016—
zero
and 2017—$
1 million
.
Plum Point.
In April 2007, we recorded an intangible asset of approximately
$193 million
related to the value of PPEA’s interest in the Plum Point Project as a result of the construction contracts, debt agreements and related power purchase agreements. This balance was subsequently deconsolidated on January 1, 2010.
Gas Revenue Contracts.
In connection with our acquisition of Sithe Energies in February 2005, we recorded intangible assets of
$657 million
, of which approximately $
169 million
was immediately expensed as it represented the settlement of pre-existing contractual relationship with the Sithe entities. The remaining balance consisted primarily of a
$488 million
intangible asset related to a firm capacity sales agreement between Sithe Independence Power Partners and Con Edison, a subsidiary of Consolidated Edison, Inc. That contract provides Independence the right to sell
740
MW of capacity until 2014 at fixed prices that were currently above the prevailing market price of capacity for the New York Rest of State market. The asset was being amortized on a straight-line basis over the remaining life of the contract through October 2014.
In connection with application of fresh-start accounting, we recorded intangible assets and liabilities at their estimated fair values of $
242 million
and $
6 million
, respectively, related to certain tolling and capacity agreements related to our gas generation facilities, which included adjusting the unamortized position of previously recorded intangible assets and liabilities to their fair value as of the Plan Effective Date. These contracts are being amortized on a straight-line basis over their remaining life through 2013 and 2017.
The amortization expense of the gas revenue contracts is recognized in Revenue in our consolidated statements of operations where we record the revenues received from the contract.
Coal Contracts.
In connection with the DMG Acquisition, we recorded intangible assets and liabilities of $
257 million
and $
38 million
related to rail transportation agreements and coal purchase agreements, respectively. In connection with the application of fresh-start accounting on October 1, 2012, we adjusted the intangible assets and liabilities to their estimated fair values of $
166 million
and $
23 million
, respectively. These contracts are being amortized on a straight-line basis over their remaining life through 2013 and 2015. The amortization expense is being recognized in Cost of Sales in our consolidated statements of operations.
F-41
DYNEGY INC.
NOTES TO CONSOLIDATED FINANCIAL STATEMENTS (Continued)
Gas Transport.
In connection with the application of fresh-start accounting on October 1, 2012, we recorded intangible liabilities at their estimated fair values of $
24 million
related to gas transportation agreements. These contracts are being amortized on a straight-line basis over their remaining life through 2015. The amortization is being recognized in Cost of sales in our consolidated statements of operations.
As discussed in
Note 3—Emergence from Bankruptcy and Fresh-Start Accounting
, our LSTC were settled upon our emergence from bankruptcy on the Plan Effective Date; therefore, we have no LSTC as of December 31, 2012. A summary of our LSTC as of December 31, 2011 is as follows:
|
Predecessor
|
||||
|
(amounts in millions)
|
December 31,
2011
|
|||
|
DNE lease termination claim
|
$
|
300
|
|
|
|
Senior Notes:
|
||||
|
8.75 percent due 2012
|
88
|
|
||
|
7.5 percent due 2015
|
785
|
|
||
|
8.375 percent due 2016
|
1,047
|
|
||
|
7.125 percent due 2018
|
175
|
|
||
|
7.75 percent due 2019
|
1,100
|
|
||
|
7.625 percent due 2026
|
175
|
|
||
|
Subordinated Debentures payable to affiliates, 8.316 percent, due 2027
|
200
|
|
||
|
Interest accrued on Senior Notes and Subordinated Debentures as of November 7, 2011
|
132
|
|
||
|
Note payable, affiliate
|
10
|
|
||
|
Total Liabilities subject to compromise (1)
|
$
|
4,012
|
|
|
________________________________________
|
(1)
|
LSTC were approximately
$4,290 million
as of the Plan Effective Date. Please read
Note 3—Emergence from Bankruptcy and Fresh-Start Accounting
for further discussion.
|
DNE Lease Termination Claim.
As further described in
Note 3—Emergence from Bankruptcy and Fresh-Start Accounting
, in connection with the DH Chapter 11 Cases, on November 7, 2011, the DH Debtor Entities filed a motion with the Bankruptcy Court for authorization to reject the Roseton and Danskammer leases. On December 20, 2011, the Bankruptcy Court entered a stipulated order approving the rejection of such leases, as amended by a stipulated order entered by the Bankruptcy Court on December 28, 2011.
The applicable DH Debtor Entities had operated and planned to continue operating the leased facilities until such facilities could be sold in accordance with the terms of the Settlement Agreement and Plan Support Agreement and in compliance with applicable federal and state regulatory requirements. However, due to damage sustained from Superstorm Sandy in October 2012, the Danskammer facility is not currently operating. The bankruptcy court has approved agreements to sell the Danskammer and Roseton facilities for a combined cash purchase price of
$23 million
and the assumption of certain liabilities. The sale is expected to close upon the satisfaction of certain closing conditions and the receipt of any necessary regulatory approvals. The proceeds from the sale will be distributed as provided in the Plan. Please read
Note 3—Emergence from Bankruptcy and Fresh-Start Accounting
for further discussion.
As of December 31, 2011, we estimated the allowed claim arising from the lease rejection to be
$300 million
(or
$190 million
net of the claim of PSEG which has already been allowed by the Bankruptcy Court in the amount of
$110 million
).
During the first quarter 2012, the estimated amount of the allowed claim related to the Roseton and Danskammer leases was adjusted to
$695 million
as a result of the Settlement Agreement. As a result, we recorded a charge of
$395 million
which is included in Income (loss) from discontinued operations on our consolidated statement of operations.
Senior Notes.
The estimated amount of the allowed claim related to our Senior Notes was estimated at the face amount of the outstanding notes, plus the amount of accrued interest through November 7, 2011.
F-42
DYNEGY INC.
NOTES TO CONSOLIDATED FINANCIAL STATEMENTS (Continued)
Subordinated Debentures.
As of December 31, 2011, the redemption amount associated with these securities totaled
$200 million
. We may defer payment of interest on the Subordinated Debentures as described in the indenture, and we deferred our
$8 million
June 2011 payment of interest.
The estimated amount of the allowed claim related to the Subordinated debentures payable to affiliates, including accrued interest, was reduced to
$55 million
as a result of executing an amendment to the Settlement Agreement on May 30, 2012. As a result, we recorded a gain of approximately
$161 million
in Bankruptcy reorganization items, net on our consolidated statements of operations during the second quarter 2012.
Note payable, affiliate.
On August 5, 2011, Dynegy Coal Holdco, LLC made a loan to DH of
$10 million
with a maturity of
three years
and an interest rate of
9.25 percent
per annum. During 2012, the estimated amount of the allowed claim was reduced to
zero
as it was determined that no claim related to the note would be made.
Note 18—Debt
A summary of our long-term debt is as follows:
|
Successor
|
Predecessor
|
||||||||||||||||
|
|
December 31, 2012
|
December 31, 2011
|
|||||||||||||||
|
(amounts in millions)
|
Carrying
Amount
|
Fair
Value
|
Carrying
Amount
|
Fair
Value
|
|||||||||||||
|
DPC Credit Agreement, due 2016
|
$
|
837
|
|
$
|
874
|
|
$
|
1,097
|
|
$
|
1,118
|
|
|||||
|
DMG Credit Agreement, due 2016
|
517
|
|
537
|
|
—
|
|
—
|
|
|||||||||
|
1,354
|
|
1,097
|
|
||||||||||||||
|
Unamortized premiums (discounts) on debt, net
|
61
|
|
|
|
(21
|
)
|
|
|
|||||||||
|
1,415
|
|
1,076
|
|
||||||||||||||
|
Less: Amounts due within one year, including unamortized premiums (discounts) on debt, net of $15 million and ($4 million)
|
29
|
|
|
|
7
|
|
|
|
|||||||||
|
Total Long-term debt
|
$
|
1,386
|
|
$
|
1,069
|
|
|||||||||||
Aggregate maturities of the principal amounts of all long-term indebtedness, excluding unamortized premiums, as of December 31, 2012 are as follows: 2014—$
14 million
, 2015—$
14 million
and 2016—$
1,312 million
.
DPC and DMG Credit Agreements
The DPC and DMG Credit Agreements (the “Credit Agreements”) are senior secured term loan facilities with aggregate principal amounts of
$1,100 million
and
$600 million
, respectively, which were borrowed in a single drawing on the closing date. Amounts borrowed under the Credit Agreements that are repaid or prepaid may not be re-borrowed. On November 6, 2012, DPC and DMG gave notice of an election to reduce their respective Collateral Posting Amounts by
$250 million
and
$75 million
which resulted in Mandatory Prepayments of the Term Loans in like amounts on November 9, 2012. The Mandatory Prepayments were applied in direct order of maturity with respect to the next four scheduled installments of principal due and pro rata thereafter. The Credit Agreements will mature on August 5, 2016.
All obligations of DPC and DMG under (i) the respective credit agreement (the “Borrower Obligations”) and (ii) at the election of the borrower, (x) cash management arrangements and (y) interest rate protection, commodity trading or hedging or other permitted hedging or swap arrangements (the “Hedging/Cash Management Arrangements”) are unconditionally guaranteed jointly and severally on a senior secured basis (the “Guarantees”) by each existing and subsequently acquired or organized direct or indirect material domestic subsidiary of DPC or DMG, as applicable (the “Guarantors”), in each case, as otherwise permitted by applicable law, regulation and contractual provision and to the extent such guarantee would not result in adverse tax consequences as reasonably determined by DPC or DMG. None of DPC’s or DMG’s parent companies are obligated to repay the DPC or DMG Borrower Obligations.
The Borrower Obligations, the Guarantees and any Hedging/Cash Management Arrangements are secured by first priority liens on and security interests in
100 percent
of the capital stock of DPC or DMG, as applicable and substantially all of the present and after-acquired assets of DPC or DMG and each DPC or DMG Guarantor (collectively, the “Collateral”). Accordingly, such assets are only available for the creditors of DGIN and its subsidiaries or Dynegy Coal Investments Holdings (“DCIH”) and its subsidiaries. DPC and DMG have restricted consolidated net assets of approximately
$1,681 million
, and
$312 million
, respectively, as of
December 31, 2012
.
F-43
DYNEGY INC.
NOTES TO CONSOLIDATED FINANCIAL STATEMENTS (Continued)
Interest Costs.
The Credit Agreements bear interest, at DPC’s or DMG’s option, at either (a)
7.75 percent
per annum plus LIBOR, subject to a LIBOR floor of
1.5 percent
, with respect to any Eurodollar term loan or (b)
6.75 percent
per annum plus the alternate base rate with respect to any ABR term loan. DPC or DMG may elect from time to time to convert all or a portion of the term loan from an ABR Borrowing into a Eurodollar Borrowing or vice versa. With some exceptions, amounts outstanding under the Credit Agreements are non-callable for the first
two
years and is subject to a prepayment premium.
On October 19, 2011, DPC and DMG entered into a variety of transactions to hedge interest rate risks associated with the Credit Agreements. DPC entered into LIBOR interest rate caps at
2 percent
with a notional value of
$900 million
through October 31, 2013. DPC also entered into LIBOR interest rate swaps with a notional value of
$788 million
commencing on November 1, 2013 through August 5, 2016. The notional value of the swaps decrease over time, reaching
$744 million
at the end of the term. DMG entered into LIBOR interest rate caps at
2 percent
with a notional value of
$500 million
through October 31, 2013. DMG also entered into LIBOR interest rate swaps with a notional value of
$312 million
commencing on November 1, 2013 through August 5, 2016. These instruments, which meet the definition of a derivative, have not been designated as accounting hedges and are accounted for at fair value.
Prepayment Provisions.
The Credit Agreements contains mandatory prepayment provisions. The outstanding loans under the Credit Agreements are to be prepaid with (a)
100 percent
of the net cash proceeds of all asset sales by DPC and its subsidiaries or DMG and its subsidiaries, subject to the right of DPC or DMG to reinvest such proceeds if such proceeds are reinvested (or committed to be reinvested) within
12 months
and, if so committed to reinvestment, reinvested within
6 months
after such initial
12 months
period, (b)
50 percent
of the net cash proceeds of issuance of equity securities of DPC and its subsidiaries or DMG and its subsidiaries (except to the extent used for permitted capital expenditures), (c) commencing with the first full fiscal year of DPC or DMG to occur after the closing date,
100 percent
of excess cash flow; provided that (i) excess cash flow shall be determined after reduction for amounts used for capital expenditures and restricted payments and (ii) any voluntary prepayments of the term loans shall be credited against excess cash flow prepayment obligations, and (d)
100 percent
of the net cash proceeds of issuances, offerings or placements of debt obligations of DPC and its subsidiaries or DMG and its subsidiaries (other than all permitted debt). Notwithstanding the above, the proceeds of a sale of up to
20 percent
of the membership interests in DPC are not required to be used to prepay the outstanding loan under the DPC Credit Agreement.
On November 9, 2012, we repaid
$250 million
and
$75 million
of the outstanding balance of the DPC and DMG Credit Agreement, respectively, at par. In connection with the repayment, we recorded a gain of approximately
$16 million
related to the accelerated amortization of the premium on the debt which is included in Interest expense on our consolidated statements of operations.
Covenants and Events of Default.
The Credit Agreements contain customary events of default and affirmative and negative covenants including, subject to certain specified exceptions, limitations on amendments to constitutive documents, liens, capital expenditures, acquisitions, subsidiaries and joint ventures, investments, the incurrence of debt, fundamental changes, asset sales, sale-leaseback transactions, hedging arrangements, restricted payments, changes in nature of business, transactions with affiliates, burdensome agreements, amendments of debt and other material agreements, accounting changes and prepayment of indebtedness or repurchases of equity interests.
The Credit Agreements contain a requirement that DPC and DMG shall establish and maintain a segregated account (the “Collateral Posting Account”), into which a specified collateral posting amount shall be deposited. DPC or DMG may withdraw amounts from their respective Collateral Posting Account: (i) for the purpose of meeting collateral posting requirements of DPC or DMG and the DPC or DMG Guarantors; (ii) to prepay the term loan under the Credit Agreements; (iii) to repay certain other permitted indebtedness; and (iv) to the extent any excess amounts are determined to be in the DPC or DMG Collateral Posting Account.
The DPC and DMG Credit Agreements limit distributions to
$135 million
and
$90 million
, respectively, per year provided the borrower and its subsidiaries possess at least
$50 million
of unrestricted cash and short-term investments as of the date of the proposed distribution. There were no distributions in 2012.
Letter of Credit Facilities
In August 2011, DPC entered into
two
fully cash collateralized Letter of Credit Reimbursement and Collateral Agreements aggregating
$515 million
pursuant to which letters of credit will be issued at DPC’s request provided that DPC deposits in an account an amount of cash sufficient to cover the face value of such requested letter of credit plus an additional percentage thereof.
In August 2011, we entered into a
$26 million
fully cash collateralized Letter of Credit Reimbursement and Collateral Agreement pursuant to which letters of credit will be issued at our request provided that we deposit in an account an amount of cash sufficient to cover the face value of such requested letter of credit plus an additional percentage thereof.
F-44
DYNEGY INC.
NOTES TO CONSOLIDATED FINANCIAL STATEMENTS (Continued)
As a result of the DMG Acquisition, we also acquired DMG’s
$100 million
fully cash collateralized Letter of Credit Reimbursement and Collateral Agreement pursuant to which letters of credit will be issued at DMG’s request provided that DMG deposits in an account an amount of cash sufficient to cover the face value of such requested letter of credit plus an additional percentage thereof.
Sithe Senior Notes
In September 2011, we purchased the Sithe Senior Notes at a price of
108 percent
of the principal amount plus consent fees. Total cash paid to purchase the Sithe Senior Notes, including fees and accrued interest, was
$217 million
, which was funded from proceeds from the DPC Credit Agreement. We recorded a charge of approximately
$16 million
associated with this transaction, of which
$21 million
is included in Debt extinguishment costs which is partially offset by the write-off of
$5 million
of premiums included in Interest expense on our consolidated statements of operations. As a result of the successful cash tender offer and consent solicitation,
$43 million
in restricted cash previously held at Sithe was returned to DPC when the transaction closed.
We also made scheduled repayments of the Sithe Senior Notes totaling
$33 million
during the second quarter 2011.
Restricted Cash
The following table depicts our restricted cash:
|
Successor
|
Predecessor
|
||||||||
|
(amounts in millions)
|
December 31, 2012
|
December 31, 2011
|
|||||||
|
DPC LC facilities (1)
|
$
|
220
|
|
$
|
455
|
|
|||
|
DPC Collateral Posting Account (2)
|
63
|
|
132
|
|
|||||
|
DMG LC facilities (3)
|
14
|
|
—
|
|
|||||
|
DMG Collateral Posting Account (2)
|
8
|
|
—
|
|
|||||
|
Corporate LC facilities (1)
|
27
|
|
27
|
|
|||||
|
Other (4)
|
3
|
|
—
|
|
|||||
|
Total restricted cash
|
$
|
335
|
|
$
|
614
|
|
|||
__________________________________________
|
(1)
|
Includes cash posted to support the respective letter of credit reimbursement and collateral agreement.
|
|
(2)
|
Amounts are restricted and may be used for future collateral posting requirements or released per the terms of the applicable credit agreement. On November 9, 2012, we used the funds in the Collateral Posting Account to repay
$325 million
of the debt outstanding under the DPC and DMG Credit Agreements.
|
|
(3)
|
Includes cash posted to support the letter of credit reimbursement and collateral agreements under the DMG LC facility. Please read “Letter of Credit Facilities” above for further discussion.
|
|
(4)
|
Includes cash posted to support a letter of credit and collateral for the corporate card program.
|
Note 19—Related Party Transactions
The following table summarizes the cash received (paid) during the Successor Period, the 2012 Predecessor Period and the year ended December 31, 2011 related to various agreements with Dynegy Inc., as discussed below.
|
Successor
|
Predecessor
|
||||||||||||
|
October 2 Through December 31,
|
January 1 Through October 1,
|
Year ended December 31,
|
|||||||||||
|
(amounts in millions)
|
2012
|
2012
|
2011
|
||||||||||
|
Service Agreements
|
$
|
(1
|
)
|
$
|
13
|
|
$
|
(33
|
)
|
||||
|
EMA Agreements
|
—
|
|
1
|
|
2
|
|
|||||||
|
Total
|
$
|
(1
|
)
|
$
|
14
|
|
$
|
(31
|
)
|
||||
The following table summarizes the Accounts receivable, affiliates, and Accounts payable, affiliates, on our consolidated balance sheet as of
December 31, 2012
and 2011 related to various agreements with Dynegy Inc., as discussed below.
F-45
DYNEGY INC.
NOTES TO CONSOLIDATED FINANCIAL STATEMENTS (Continued)
|
Successor
|
Predecessor
|
||||||||||||||||
|
December 31, 2012
|
December 31, 2011
|
||||||||||||||||
|
(amounts in millions)
|
Accounts
Receivable,
Unconsolidated Affiliate
|
Accounts
Payable,
Unconsolidated Affiliate
|
Accounts
Receivable,
Affiliates
|
Accounts
Payable,
Affiliates
|
|||||||||||||
|
Service Agreements
|
$
|
1
|
|
$
|
1
|
|
$
|
4
|
|
$
|
6
|
|
|||||
|
EMA Agreements
|
—
|
|
—
|
|
22
|
|
41
|
|
|||||||||
|
Total
|
$
|
1
|
|
$
|
1
|
|
$
|
26
|
|
$
|
47
|
|
|||||
Service Agreements.
Legacy Dynegy, through certain of our subsidiaries (collectively, the “Providers”) provide certain administrative services (the “Services”) to DCIH and certain of its subsidiaries, and certain of our subsidiaries (collectively, the “Recipients”). Service Agreements between Legacy Dynegy and the Recipients, which were entered into 2011, govern the terms under which such Services are provided.
The Providers act as agents for the Recipients for the limited purpose of providing the Services set forth in the Service Agreements. The Providers may perform additional services at the request of the Recipients, and will be reimbursed for all costs and expenses related to such additional services. Prior to the beginning of each fiscal year in which Services are to be provided pursuant to the Service Agreements, the Providers and the Recipients must agree on a budget for the Services, outlining, among other items, the contemplated scope of the Services to be provided in the following fiscal year and the cost of providing each Service. The Recipients will pay the Providers an annual management fee as agreed in the budget, which shall include reimbursement of out-of pocket costs and expenses related to the provision of the Services and will provide reasonable assistance, such as information, services and materials, to the Providers.
As a result of the Merger, transactions executed under the Service Agreements subsequent to September 30, 2012, with the exception of transactions with the DNE Debtor Entities, are no longer considered related party transactions because they eliminate in consolidation.
On October 1, 2012, Dynegy deconsolidated the DNE Debtor Entities. Please read
Note 1—Organization and Operations
—Chapter 11 Filing and Emergence from Bankruptcy for further discussion. Our consolidated statement of operations includes
$3 million
of power sold to our unconsolidated affiliate, which is reflected in Revenues for the Successor Period.
Energy Management Agreements.
Certain of our subsidiaries have entered into an Energy Management Agency Services Agreement (an “EMA”) with DMG. Pursuant to the EMA, our subsidiaries will provide power management services to other subsidiaries, consisting of marketing power and capacity, capturing pricing arbitrage, scheduling dispatch of power, communicating with the applicable ISOs or RTOs, purchasing replacement power, and reconciling and settling ISO or RTO invoices. In addition, certain of our subsidiaries will provide fuel management services, consisting of procuring the requisite quantities of fuel and emissions credits, assisting with transportation, scheduling delivery of fuel, assisting with development and implementation of fuel procurement strategies, marketing and selling excess fuel and assisting with the evaluation of present and long-term fuel purchase and transportation options. Our subsidiaries will also assist other subsidiaries with risk management by entering into one or more risk management transactions, the purpose of which is to set the price or value of any commodity or to mitigate or offset any change in the price or value of any commodity. Our subsidiaries may from time to time provide other services as the parties may agree. Our consolidated statement of operations includes
$198 million
of power purchased from affiliates, which is reflected in Revenues and
$79 million
of coal sold to affiliates, which is reflected in Costs of sales on our consolidated statements of operations for the 2012 Predecessor Period. This affiliate activity is presented within Revenue and Cost of sales on our consolidated statements of operations. Also, please read
Note 8—Risk Management Activities, Derivatives and Financial Instruments
for derivative balances with affiliates. As a result of the DMG Acquisition, transactions executed with DMG under the EMAs are not considered related party transactions subsequent to June 5, 2012 because they eliminate in consolidation.
Tax Sharing Agreement.
Under U.S. federal income tax law, Dynegy is responsible for the tax liabilities of its subsidiaries, because Dynegy files consolidated income tax returns, which will necessarily include the income and business activities of the ring-fenced entities and Dynegy’s other affiliates. To properly allocate taxes among Dynegy and each of its entities, Dynegy and certain of its entities, have entered into a Tax Sharing Agreement under which Dynegy agrees to prepare consolidated returns on behalf of itself and its entities and make all required payments to relevant revenue collection authorities as required by law. Additionally, DPC agreed to make payments to Dynegy of the tax amounts for which DPC and its respective subsidiaries would have been liable if such subsidiaries began business on the restructuring date (August 5, 2011) and were eligible to, and elected to, file a consolidated return on a stand-alone basis beginning on the restructuring date.
F-46
DYNEGY INC.
NOTES TO CONSOLIDATED FINANCIAL STATEMENTS (Continued)
Further, each of Dynegy GasCo Holdings, LLC, Dynegy Gas Holdco, LLC, and Dynegy Gas Investments Holdings, LLC, agreed to make payments to Dynegy of amounts representing the tax that each such subsidiary would have paid if each began business on the restructuring date and filed a separate corporate income tax return (excluding from income any subsidiary distributions) on a stand-alone basis beginning on the restructuring date.
Cash Management.
The Prepetition Restructurings created new companies, some of which are “bankruptcy remote.” These bankruptcy remote entities have an independent manager whose consent is required for certain corporate actions and such entities are required to present themselves to the public as separate entities. They maintain separate books, records and bank accounts and separately appoint officers. Furthermore, they pay liabilities from their own funds, they conduct business in their own names (other than any business relating to the trading activities of us and our subsidiaries), they observe a higher level of formalities, and they have restrictions on pledging their assets for the benefit of certain other persons. In addition, as part of the Prepetition Restructurings, some companies within our portfolio were reorganized into “ring-fenced” groups. The upper-level companies in such ring-fenced groups are bankruptcy-remote entities governed by limited liability company operating agreements which, in addition to the bankruptcy remoteness provisions described above, contain certain additional restrictions prohibiting any material transactions with affiliates other than the direct and indirect subsidiaries within the ring-fenced group without independent manager approval.
Pursuant to our Cash Management Agreement, our ring-fenced entities maintain cash accounts separate from those of our non-ring-fenced entities. Cash collected by a ring-fenced entity is not swept into accounts held in the name of any non-ring-fenced entity and cash collected by a non-ring-fenced entity is not swept into accounts held in the name of any ring-fenced entity. The cash in deposit accounts owned by a ring-fenced entity is not used to pay the debts and/or operating expenses of any non-ring-fenced entity, and the cash in deposit accounts owned by a non-ring-fenced entity is not used to pay the debts and/or operating expenses of any ring-fenced entity.
DMG Transfer and Undertaking Agreement.
On September 1, 2011, we completed the DMG Transfer and received the Undertaking Agreement. Please read
Note 1—Organization and Operations
—DMG Transfer and DMG Acquisition for further discussion.
During the 2012 Predecessor Period, we recognized
$24 million
in interest income related to the Undertaking Agreement which is included in Other income and expense, net, in our consolidated statement of operations. We did not recognize any interest income subsequent to March 31, 2012 as we impaired the value of the Undertaking as of March 31, 2012. We received payments of
$48 million
from Legacy Dynegy prior to the termination of the Undertaking Agreement. We had approximately
$8 million
as of December 31, 2011 in interest receivable related to the undertaking, which is reflected in Interest receivable, affiliates on our consolidated balance sheet. The Undertaking Agreement was terminated on June 5, 2012 in connection with the Settlement Agreement. Please read
Note 3—Emergence from Bankruptcy and Fresh-Start Accounting
for further discussion.
Note payable, affiliates.
On August 5, 2011, Coal Holdco made a loan to DH of
$10 million
with a maturity of
three
years and an interest rate of
9.25 percent
per annum.
The Note payable, affiliate was written off during the first quarter 2012 as it was determined that no claim would be filed related to the note.
Accounts receivable, affiliates.
We have historically recorded intercompany transactions in the ordinary course of business, including the reallocation of deferred taxes between legal entities in accordance with applicable IRS regulations. As a result of such transactions, we had an affiliate receivable balance in the amount of
$846 million
at December 31, 2011. This receivable was classified within equity as there were no defined payment terms, it was not evidenced by any promissory note, and there was never an intent for payment to occur. The Accounts receivable, affiliate was settled on June 5, 2012. Please read
Note 3—Emergence from Bankruptcy and Fresh-Start Accounting
for further discussion.
Employee benefits.
Our employees have historically participated in the stock compensation, pension and other post-retirement benefit plans sponsored by Legacy Dynegy. These employee benefit plans were assumed by us in the Merger on September 30, 2012. Please read
Note 24—Employee Compensation, Savings and Pension Plans
for further discussion.
DMG Acquisition.
On June 5, 2012, pursuant to the Settlement Agreement, Legacy Dynegy and DH consummated the DMG Acquisition. Please read
Note 4—Merger and Acquisition
for further discussion.
Merger.
On September 30, 2012, pursuant to the terms of the Plan, DH merged with and into Legacy Dynegy with Dynegy continuing as the surviving legal entity of the Merger. Please read
Note 4—Merger and Acquisition
for further discussion.
F-47
DYNEGY INC.
NOTES TO CONSOLIDATED FINANCIAL STATEMENTS (Continued)
Income Tax Benefit.
We are subject to U.S. federal and state income taxes on our operations.
Our loss from continuing operations before income taxes was $
113 million
, $
575 million
and $
453 million
for the Successor Period, and years ended December 31, 2011 and 2010, respectively, which was solely from domestic sources. Our income from continuing operations before income taxes was
$121 million
for the 2012 Predecessor Period, which was solely from domestic sources.
Our components of income tax benefit related to income (loss) from continuing operations were as follows:
|
Successor
|
Predecessor
|
||||||||||||||||
|
(amounts in millions)
|
October 2 Through December 31, 2012
|
January 1 Through October 1, 2012
|
Year Ended December 31, 2011
|
Year Ended December 31, 2010
|
|||||||||||||
|
Current tax expense
|
$
|
—
|
|
$
|
—
|
|
$
|
—
|
|
$
|
(1
|
)
|
|||||
|
Deferred tax benefit
|
—
|
|
9
|
|
144
|
|
195
|
|
|||||||||
|
Income tax benefit
|
$
|
—
|
|
$
|
9
|
|
$
|
144
|
|
$
|
194
|
|
|||||
Our income tax benefit related to income (loss) from continuing operations for the Successor Period, the 2012 Predecessor Period, and the years ended December 31, 2011 and 2010, was equivalent to effective rates of
zero
,
7 percent
,
25 percent
and
43 percent
, respectively. Differences between taxes computed at the U.S. federal statutory rate and our reported income tax benefit were as follows:
|
|
Successor
|
Predecessor
|
|||||||||||||||
|
(amounts in millions)
|
October 2 Through December 31, 2012
|
January 1 Through October 1, 2012
|
Year Ended December 31, 2011
|
Year Ended December 31, 2010
|
|||||||||||||
|
Expected tax benefit at U.S. statutory rate (35%)
|
$
|
39
|
|
$
|
419
|
|
$
|
201
|
|
$
|
158
|
|
|||||
|
State taxes (1)
|
—
|
|
—
|
|
17
|
|
24
|
|
|||||||||
|
Permanent differences
|
2
|
|
—
|
|
(1
|
)
|
(1
|
)
|
|||||||||
|
Valuation allowance (2)
|
(41
|
)
|
(399
|
)
|
(79
|
)
|
(1
|
)
|
|||||||||
|
IRS and state audits and settlements
|
—
|
|
—
|
|
1
|
|
12
|
|
|||||||||
|
Other
|
—
|
|
(11
|
)
|
5
|
|
2
|
|
|||||||||
|
Income tax benefit
|
$
|
—
|
|
$
|
9
|
|
$
|
144
|
|
$
|
194
|
|
|||||
__________________________________________
|
(1)
|
We incurred a state tax benefit for the year ended
December 31, 2011
due to current year losses and a
$6 million
audit adjustment offset by a
$2 million
expense due to a change in Illinois tax law. We incurred a state tax benefit for the year ended
December 31, 2010
due to current year losses that will reduce future state cash taxes as well as changes in our state sales profile and a change in California tax law.
|
|
(2)
|
We recorded a valuation allowance of
$41 million
during the Successor Period to reserve our net deferred tax assets. In connection with the DMG Transfer, we recognized a deferred tax asset of approximately
$466 million
and subsequently recorded a valuation allowance for the full amount. We do not believe we will produce sufficient taxable income, nor are there tax planning strategies available to realize the tax benefit.
|
F-48
DYNEGY INC.
NOTES TO CONSOLIDATED FINANCIAL STATEMENTS (Continued)
Deferred Tax Liabilities and Assets.
Our significant components of deferred tax assets and liabilities were as follows:
|
Successor
|
Predecessor
|
||||||||
|
|
Year Ended December 31,
|
Year Ended December 31,
|
|||||||
|
(amounts in millions)
|
2012
|
2011
|
|||||||
|
Current:
|
|
|
|||||||
|
Deferred tax assets:
|
|
|
|||||||
|
Reserves (legal, environmental and other)
|
$
|
39
|
|
$
|
3
|
|
|||
|
Miscellaneous book/tax recognition differences
|
—
|
|
17
|
|
|||||
|
Subtotal
|
39
|
|
20
|
|
|||||
|
Less: valuation allowance
|
(21
|
)
|
(10
|
)
|
|||||
|
Total current deferred tax assets
|
18
|
|
10
|
|
|||||
|
Deferred tax liabilities:
|
|||||||||
|
Miscellaneous book/tax recognition differences
|
(113
|
)
|
(60
|
)
|
|||||
|
Total current deferred tax liabilities
|
(113
|
)
|
(60
|
)
|
|||||
|
Net current deferred tax liabilities
|
(95
|
)
|
(50
|
)
|
|||||
|
Non-current:
|
|
|
|||||||
|
Deferred tax assets:
|
|||||||||
|
NOL carryforwards
|
1,098
|
|
510
|
|
|||||
|
AMT credit carryforwards
|
271
|
|
—
|
|
|||||
|
Reserves (legal, environmental and other)
|
10
|
|
2
|
|
|||||
|
Other comprehensive income
|
(4
|
)
|
6
|
|
|||||
|
Deferred intercompany loss, power contracts and other
|
178
|
|
715
|
|
|||||
|
Subtotal
|
1,553
|
|
1,233
|
|
|||||
|
Less: valuation allowance
|
(1,100
|
)
|
(663
|
)
|
|||||
|
Total non-current deferred tax assets
|
453
|
|
570
|
|
|||||
|
Deferred tax liabilities:
|
|
|
|||||||
|
Depreciation and other property differences
|
(358
|
)
|
(526
|
)
|
|||||
|
Net non-current deferred tax assets
|
95
|
|
44
|
|
|||||
|
Net deferred tax liability
|
$
|
—
|
|
$
|
(6
|
)
|
|||
NOL Carryforwards.
During 2012, we had an increase in our regular and AMT NOL carryforwards of approximately
$1.4 billion
and
$912 million
, respectively. The increases resulted from losses incurred during the 2012 Predecessor Period, including deductions for the claim related to the rejection of the DNE Facilities Lease and a DH worthless stock loss, offset by cancellation of indebtedness income and limitations due to changes in control for tax purposes. As of December 31, 2012, we had approximately
$2.8 billion
of regular federal tax NOL carryforwards and
$3.2 billion
of AMT NOL carryforwards. Additionally, we are continuing to evaluate our tax strategies related to our emergence from bankruptcy, which could increase our NOLs. The NOLs are subject to limitations on their annual usage.
Under federal income tax law, our NOL carryforwards can be utilized to reduce future taxable income subject to certain limitations, including if we were to undergo an ownership change as defined by Section 382 of the Internal Revenue Code. We experienced an ownership change on May 9, 2012 and October 1, 2012. However, these ownership changes and resulting annual limitations are not expected to result in the expiration of our NOL carryforwards if we are able to generate sufficient future taxable income within the carryforward periods. Additionally, as of
December 31, 2012
, approximately
$758 million
of our
$3.2 billion
in NOLs are not limited under Section 382 of the Internal Revenue Code. However, if a subsequent ownership change were to occur as a result of future transactions in our stock, our ability to utilize the NOL carryforwards may be significantly limited, including the
$758 million
of NOLs that are not currently limited by Section 382 of the Internal Revenue Code.
At
December 31, 2012
, we had approximately
$2 billion
of state NOLs. Similar to the federal NOLs, state NOLs were materially impacted by the items discussed above.
F-49
DYNEGY INC.
NOTES TO CONSOLIDATED FINANCIAL STATEMENTS (Continued)
AMT Credit Carryforwards.
While our AMT credits do not expire, the change in control that occurred on May 9, 2012 materially impacted our ability to utilize the AMT credits which resulted in a full valuation allowance being applied to these assets.
Change in Valuation Allowance.
Realization of our deferred tax assets is dependent upon, among other things, our ability to generate taxable income of the appropriate character in the future. At
December 31, 2012
, valuation allowances related to federal and state NOL carryforwards and credits have been established. Additionally, at
December 31, 2012
, our temporary differences were in a net deferred tax asset position. We do not believe we will produce sufficient future taxable income, nor are there tax planning strategies available, to realize the tax benefits of our net deferred tax asset associated with temporary differences. Accordingly, we have recorded a full valuation allowance against the net asset temporary differences related to federal income tax and the net asset temporary differences related to state income tax.
The changes in the valuation allowance by attribute were as follows:
|
(amounts in millions)
|
Temporary
Differences
|
Federal NOL
Carryforwards
and Credits
|
State NOL
Carryforwards
and Credits
|
Equity Adjustment
|
Total
|
|||||||||||||||
|
Balance as of December 31, 2009 (Predecessor)
|
$
|
—
|
|
$
|
—
|
|
$
|
(34
|
)
|
$
|
—
|
|
$
|
(34
|
)
|
|||||
|
Changes in valuation allowance—continuing operations
|
—
|
|
—
|
|
13
|
|
—
|
|
13
|
|
||||||||||
|
Balance as of December 31, 2010 (Predecessor)
|
—
|
|
—
|
|
(21
|
)
|
—
|
|
(21
|
)
|
||||||||||
|
Changes in valuation allowance—continuing operations
|
(24
|
)
|
(150
|
)
|
(2
|
)
|
(476
|
)
|
(652
|
)
|
||||||||||
|
Balance as of December 31, 2011 (Predecessor)
|
(24
|
)
|
(150
|
)
|
(23
|
)
|
(476
|
)
|
(673
|
)
|
||||||||||
|
Changes in valuation allowance—continuing operations
|
237
|
|
(1,057
|
)
|
(55
|
)
|
476
|
|
(399
|
)
|
||||||||||
|
Balance as of October 1, 2012 (Predecessor)
|
213
|
|
(1,207
|
)
|
(78
|
)
|
—
|
|
(1,072
|
)
|
||||||||||
|
Changes in valuation allowance—continuing operations
|
13
|
|
(59
|
)
|
(8
|
)
|
5
|
|
(49
|
)
|
||||||||||
|
Balance as of December 31, 2012 (Successor)
|
$
|
226
|
|
$
|
(1,266
|
)
|
$
|
(86
|
)
|
$
|
5
|
|
$
|
(1,121
|
)
|
|||||
Unrecognized Tax Benefits.
We are no longer subject to U.S. federal income tax examinations for the years prior to 2007, and with few exceptions, we are no longer subject to state and local examinations prior to 2007. We are no longer subject to non-U.S. income tax examinations. Our federal income tax returns are routinely audited by the IRS, and provisions are routinely made in the financial statements in anticipation of the results of these audits. We finalized the IRS audit of 2008-2009 tax years in the third quarter 2011. As a result of the settlement of our 2008-2009 audit, adjustments to tax positions related to prior years, and various state settlements, we recorded, and included in our income tax expense, a benefit of
zero
, a benefit of
$3 million
, a benefit of
$1 million
and a benefit of
$12 million
for the Successor Period, the 2012 Predecessor Period, and the years ended December 31, 2011 and 2010, respectively. Reviews of the 2010 and 2011 tax years have been completed by the IRS and we are awaiting the closing letter.
F-50
DYNEGY INC.
NOTES TO CONSOLIDATED FINANCIAL STATEMENTS (Continued)
A reconciliation of our beginning and ending amounts of unrecognized tax benefits follows (amounts in millions):
|
Balance at December 31, 2009 (Predecessor)
|
$
|
17
|
|
|
Additions based on tax positions related to the prior year
|
—
|
|
|
|
Reductions based on tax positions related to the prior year
|
(1
|
)
|
|
|
Settlements
|
(11
|
)
|
|
|
Balance at December 31, 2010 (Predecessor)
|
$
|
5
|
|
|
Additions based on tax positions related to the prior year
|
—
|
|
|
|
Reductions based on tax positions related to the prior year
|
—
|
|
|
|
Settlements
|
(1
|
)
|
|
|
Balance at December 31, 2011 (Predecessor)
|
$
|
4
|
|
|
Additions based on tax positions related to the prior year
|
—
|
|
|
|
Reductions based on tax positions related to the prior year
|
—
|
|
|
|
Settlements
|
(3
|
)
|
|
|
Balance at October 1, 2012 (Predecessor)
|
$
|
1
|
|
|
Additions based on tax positions related to the prior year
|
—
|
|
|
|
Reductions based on tax positions related to the prior year
|
—
|
|
|
|
Settlements
|
—
|
|
|
|
Balance at December 31, 2012 (Successor)
|
$
|
1
|
|
As of
December 31, 2012, October 1, 2012, December 31, 2011 and December 31, 2010
, approximately
$1 million
,
$1 million
,
$4 million
and
$5 million
, respectively, of unrecognized tax benefits would impact our effective tax rate if recognized.
The changes to our unrecognized tax benefits during the year ended
December 31, 2012
primarily resulted from changes in various federal and state audits and positions. The adjustments to our reserves for uncertain tax positions as a result of these changes had an insignificant impact on our net income.
We expect that our unrecognized tax benefits could continue to change due to the settlement of audits and the expiration of statutes of limitation in the next twelve months; however, we do not anticipate any such change to have a significant impact on our results of operations, financial position or cash flows in the next twelve months.
The reconciliation of basic loss per share from continuing operations to diluted loss per share from continuing operations of our common stock outstanding during the period is shown in the following table. Diluted loss per share represents the amount of losses for the period available to each share of our common stock outstanding during the period plus each share that would have been outstanding assuming the issuance of common shares for all dilutive potential common shares outstanding during the period.
Prior to the Merger, DH was organized as a limited liability company and the capital structure of DH did not change until September 30, 2012. Although Legacy Dynegy’s shares were publicly traded, DH did not have any publicly traded shares during the Predecessor periods; therefore, no loss per share is presented for any period prior to the Plan Effective Date.
F-51
DYNEGY INC.
NOTES TO CONSOLIDATED FINANCIAL STATEMENTS (Continued)
|
Successor
|
||||
|
(in millions, except per share amounts)
|
October 2 Through December 31, 2012
|
|||
|
Loss from continuing operations for basic and diluted loss per share
|
$
|
(113
|
)
|
|
|
Basic weighted-average shares
|
100
|
|
||
|
Effect of dilutive securities—stock options and restricted stock
|
—
|
|
||
|
Diluted weighted-average shares
|
100
|
|
||
|
Loss per share from continuing operations:
|
||||
|
Basic
|
$
|
(1.13
|
)
|
|
|
Diluted (1)
|
$
|
(1.13
|
)
|
|
__________________________________________
|
(1)
|
Entities with a net loss from continuing operations are prohibited from including potential common shares in the computation of diluted per-share amounts. Accordingly, we have utilized the basic shares outstanding amount to calculate both basic and diluted loss per share for all periods presented.
|
Note 22—Commitments and Contingencies
Legal Proceedings
Set forth below is a summary of our material ongoing legal proceedings. We record accruals for estimated losses from contingencies when available information indicates that a loss is probable and the amount of the loss, or range of loss, can be reasonably estimated. In addition, we disclose matters for which management believes a material loss is reasonably possible. In all instances, management has assessed the matters below based on current information and made judgments concerning their potential outcome, giving consideration to the nature of the claim, the amount, if any, and nature of damages sought and the probability of success. Management regularly reviews all new information with respect to each such contingency and adjusts its assessment and estimates of such contingencies accordingly. Because litigation is subject to inherent uncertainties including unfavorable rulings or developments, it is possible that the ultimate resolution of our legal proceedings could involve amounts that are different from our currently recorded accruals and that such differences could be material.
In addition to the matters discussed below, we are party to other routine proceedings arising in the ordinary course of business or related to discontinued business operations. Any accruals or estimated losses related to these matters are not material. In management’s judgment, the ultimate resolution of these matters will not have a material effect on our financial condition, results of operations or cash flows.
Stockholder Litigation Relating to the Blackstone and Icahn Merger Agreements.
In connection with the 2010 and 2011 terminations of the merger agreement with an affiliate of The Blackstone Group L.P. (“Blackstone”) and the merger agreement with an affiliate of Icahn Enterprises L.P. (“Icahn”), respectively, numerous stockholder lawsuits and one alleged stockholder derivative lawsuit previously filed in the District Courts of Harris County, Texas, the Southern District of Texas, and the Court of Chancery of the State of Delaware were commenced. In July 2011, the Harris County District Court granted the motion of the plaintiff’s lead class counsel for an award of attorney’s fees and expenses in the amount of approximately
$2 million
. We have accrued approximately
$2 million
related to this matter and have appealed the decision.
Stockholder Litigation Relating to the 2011 Prepetition Restructuring
.
In connection with the prepetition restructuring and corporate reorganization of the DH Debtor Entities and their non-debtor affiliates in 2011 (the “2011 Prepetition Restructuring”), and specifically the DMG Transfer, a putative class action stockholder lawsuit captioned
Charles Silsby v. Carl C. Icahn, et al
., Case No. 12CIV2307 (the “Securities Litigation”), was filed in the United States District Court of the Southern District of New York. The lawsuit challenged certain disclosures made in connection with the DMG Transfer. We believe the plaintiff's complaint lacks merit and we will oppose the Securities Litigation vigorously. As a result of the filing of the voluntary petition for bankruptcy by Dynegy Inc., this lawsuit was stayed as against Dynegy Inc. and as a result of the confirmation of the Plan, the claims against Dynegy Inc. in the Securities Litigation are permanently enjoined.
On August 24, 2012, the Lead Plaintiff in the Securities Litigation filed an objection to the confirmation of the Plan asserting, among other things, that Lead Plaintiff should be permitted to opt-out of the non-debtor releases and injunctions (the “Non-Debtor Releases”) in the Plan on behalf of all putative class members. We opposed that relief. On October 1, 2012, the Bankruptcy Court ruled that Lead Plaintiff did not have standing to object to the Plan and did not have authority to opt-out of
F-52
DYNEGY INC.
NOTES TO CONSOLIDATED FINANCIAL STATEMENTS (Continued)
the Non-Debtor Releases on behalf of any other party-in-interest. Accordingly, the Securities Litigation may only proceed against the non-debtor defendants with respect to members of the putative class who individually opted out of the Non-Debtor Releases. The Lead Plaintiff filed a notice of appeal on October 10, 2012.
Gas Index Pricing Litigation.
We, several of our affiliates, our former joint venture affiliate and other energy companies were named as defendants in numerous lawsuits in state and federal court claiming damages resulting from alleged price manipulation and false reporting of natural gas prices to various index publications in the 2000-2002 timeframe. Many of the cases have been resolved. All of the remaining cases contain similar claims that individually, and in conjunction with other energy companies, we engaged in an illegal scheme to inflate natural gas prices in four states by providing false information to natural gas index publications. In July 2011, the court granted defendants’ motions for summary judgment, thereby dismissing all of plaintiffs’ claims. Plaintiffs have appealed the decision to the Ninth Circuit Court of Appeals which heard oral argument on October 19, 2012.
Illinova Generating Company Arbitration.
In May 2007, our subsidiary Illinova Generating Company (“IGC”) received an adverse award in an arbitration brought by Ponderosa Pine Energy, LLC (“PPE”). The award required IGC to pay PPE
$17 million
, which IGC paid in June 2007 under protest while simultaneously seeking to vacate the award in the District Court of Dallas County, Texas. In March 2010, the Dallas District Court vacated the award, finding that one of the arbitrators had exhibited evident partiality. PPE appealed that decision to the Fifth District Court of Appeals in Dallas, Texas. Coincident with the appeal, IGC filed a claim against PPE seeking recovery of the $
17 million
plus interest. In September 2010, the Dallas District Court ordered PPE to deposit the
$17 million
principal in an interest-bearing escrow account jointly owned by IGC and PPE. On August 20, 2012, the Dallas Court of Appeals reversed the Dallas District Court and reinstated the award. IGC and the other respondents filed a petition for review with the Texas Supreme Court on December 5, 2012. As a result of the uncertainty surrounding the outcome of PPE’s appeal, we did not assign any value to this potential receivable in fresh-start accounting.
Pacific Northwest Refund Proceedings.
Dynegy Power Marketing, LLC (“DYPM”), along with numerous other companies that sold power in the Pacific Northwest in 2000-2001, are parties to a complaint filed in 2001 with FERC challenging bilateral contract pricing by claiming manipulation of the electricity market in California produced unreasonable prices in the Pacific Northwest. DYPM previously settled all California refund claims, but did not settle with certain complainants seeking refunds in the Pacific Northwest. In December 2011, DYPM received a Notice of Settlement from The City of Seattle (“Seattle”) claiming that it paid approximately
$2 million
to DYPM above the mitigated market clearing price set for the California market in 2000-2001. In May 2012, Seattle made an initial settlement demand of
$744 thousand
plus interest. DYPM and Seattle reached a settlement whereby DYPM agreed to pay Seattle
$180 thousand
(inclusive of all interest) to settle all claims between Seattle and DYPM in these proceedings. On November 29, 2012, FERC issued a letter order approving the settlement agreement. There is the risk for “ripple claims” from other sellers, but the efficacy of these claims is currently being litigated and any potential impact to DYPM from ripple claims is impossible to predict at this stage.
Other Commitments and Contingencies
In conducting our operations, we have routinely entered into long-term commodity purchase and sale commitments, as well as agreements that commit future cash flow to the lease or acquisition of assets used in our businesses. These commitments have been typically associated with commodity supply arrangements, capital projects, reservation charges associated with firm transmission, transportation, storage and leases for office space, equipment, plant sites, power generation assets and LPG vessel charters. The following describes the more significant commitments outstanding at
December 31, 2012
.
Consent Decree
. In 2005, we settled a lawsuit filed by the EPA and the United States Department of Justice in the U.S. District Court for the Southern District of Illinois that alleged violations of the Clean Air Act and related federal and Illinois regulations concerning certain maintenance, repair and replacement activities at our Baldwin generating station. A consent decree (the “Consent Decree”) was finalized in July 2005. Among other provisions of the Consent Decree, we are required to not operate certain of our power generating facilities after specified dates unless certain emission control equipment is installed. On November 3, 2012, Dynegy completed the Baldwin Unit 2 outage marking the completion of the material Consent Decree environmental compliance capital requirements. We have spent approximately
$921 million
through
December 31, 2012
related to these Consent Decree projects.
Vermilion and Baldwin Groundwater
. We have implemented hydrogeologic investigations for the CCR surface impoundment at our Baldwin facility and for
two
CCR surface impoundments at our Vermilion facility in response to a request by the Illinois EPA. Groundwater monitoring results indicate that these CCR surface impoundments impact onsite groundwater at these sites.
At the request of the Illinois EPA, in late 2011 we initiated an investigation at the Baldwin facility to determine if the facility’s CCR surface impoundment impacts offsite groundwater. Results of the offsite groundwater quality investigation at
F-53
DYNEGY INC.
NOTES TO CONSOLIDATED FINANCIAL STATEMENTS (Continued)
Baldwin, as submitted to the Illinois EPA on April 24, 2012, indicate
two
localized areas where Class I groundwater standards were exceeded but the Illinois EPA has not required further investigation. If these offsite groundwater results are ultimately attributed to the Baldwin CCR surface impoundment and remediation measures are necessary in the future, we may incur significant costs that could have a material adverse effect on our financial condition, results of operations and cash flows. At this time we cannot reasonably estimate the costs of corrective action that ultimately may be required at Baldwin.
On April 2, 2012, we submitted to the Illinois EPA proposed corrective action plans for
two
of the CCR surface impoundments at the Vermilion facility. The proposed corrective action plans reflect the results of a hydrogeologic investigation, which indicate that the facility’s old east and north CCR impoundments impact groundwater quality onsite and that such groundwater migrates offsite to the north of the property and to the adjacent Middle Fork of the Vermilion River. The proposed corrective action plans include groundwater monitoring and recommend closure of both CCR impoundments, including installation of a geosynthetic cover. In addition, we submitted an application to the Illinois EPA to establish a groundwater management zone while impacts from the facility are mitigated. The preliminary estimated cost of the recommended closure alternative for both impoundments, including post-closure care, is approximately
$14 million
. The Vermilion facility also has a third CCR surface impoundment, the new east impoundment that is lined and is not known to impact groundwater. Although not part of the proposed corrective action plans, if we decide to close the new east impoundment by removing its CCR contents concurrent with the recommended closure alternative for the old east and north impoundments, the associated estimated closure cost would add an additional
$2 million
to the above estimate. The Illinois EPA has requested additional details regarding the closure activities associated with our proposed corrective action plans.
In July 2012, the Illinois EPA issued violation notices alleging violations of groundwater standards onsite at the Baldwin and Vermilion facilities. In response, we submitted to the Illinois EPA a proposed compliance commitment agreement for each facility. For Vermilion, we proposed to implement the previously submitted corrective action plans and, for Baldwin, we proposed to perform additional studies of hydrogeologic conditions and apply for a groundwater management zone in preparation for submittal, as necessary, of a corrective action plan. In October 2012, the Illinois EPA notified us that it would not issue proposed compliance commitment agreements for Vermilion and Baldwin. In December 2012, the Illinois EPA provided written notice that it may pursue legal action with respect to each matter through referral to the Illinois Office of the Attorney General. At this time we cannot reasonably estimate the costs of resolving these matters, but resolution of these matters may cause us to incur significant costs that could have a material adverse effect on our financial condition, results of operations and cash flows.
Cooling Water Intake Permits.
The cooling water intake structures at several of our power generation facilities are regulated under Section 316(b) of the Clean Water Act. This provision generally provides that standards set for power generation facilities require that the location, design, construction and capacity of cooling water intake structures reflect the BTA for minimizing adverse environmental impact. These standards are developed and implemented for power generating facilities through the individual NPDES (or SPDES) permits on a case-by-case basis.
The environmental groups that participate in our NPDES permit proceedings generally argue that only closed cycle cooling meets the BTA requirement. The issuance and renewal of the NPDES permit for
one
of our power generation facilities (Moss Landing) was challenged on this basis. The Moss Landing NPDES permit, which was issued in 2000, does not require closed cycle cooling and was challenged by a local environmental group. In August 2011, the Supreme Court of California affirmed the appellate court’s decision upholding the permit.
Other future NPDES proceedings could have a material effect on our financial condition, results of operations and cash flows; however, given the numerous variables and factors involved in calculating the potential costs associated with installing a closed cycle cooling system, any decision to install such a system at any of our facilities would be made on a case-by-case basis considering all relevant factors at such time. If capital expenditures related to cooling water systems become great enough to render the operation of the plant uneconomical, we could, at our option, and subject to any applicable financing agreements or other obligations, reduce operations or cease to operate that facility and forego the capital expenditures.
In September 2012, the Illinois EPA issued a renewal NPDES permit for the Havana Power Station. In October 2012, environmental interest groups filed a petition for review with the Illinois Pollution Control Board challenging the permit. The petitioners allege that the permit does not adequately address the discharge of wastewaters associated with newly installed air pollution control equipment (i.e., a spray dryer absorber and activated carbon injection system to reduce SO
2
and mercury air emissions) at Havana. We dispute the allegations and will defend the permit vigorously. The permit remains in effect during the appeal. The outcome of the appeal is uncertain at this time.
Station Power Proceedings.
On May 4, 2010, the U.S. Court of Appeals for the D.C. Circuit (the “D.C. Circuit”) vacated FERC’s acceptance of station power rules for the CAISO market, and remanded the case for further proceedings at FERC. On August 30, 2010, FERC issued an Order on Remand (“remand order”) effectively disclaiming jurisdiction over how the states impose retail station power charges. Due to reservation-of-rights language in the California utilities’ state-
F-54
DYNEGY INC.
NOTES TO CONSOLIDATED FINANCIAL STATEMENTS (Continued)
jurisdictional station power tariffs, the California utilities have argued that FERC’s ruling requires California generators to pay state-imposed retail charges back to the date of enrollment by the facilities in the CAISO’s station period program. The remand order could impact FERC’s station power policies in all of the organized markets throughout the nation. On February 28, 2011, the FERC issued an order denying rehearing of the remand order. Dynegy Moss Landing, LLC, together with other generators, filed an appeal of the remand order in the D.C. Circuit. On December 18, 2012, the D.C. Circuit issued an order denying the appeal of the generator group and affirming FERC’s orders on remand.
On November 18, 2011, PG&E filed with the CPUC, seeking authorization to begin charging generators station power charges, and to assess such charges retroactively, which the Company and other generators have challenged. Dynegy Morro Bay, LLC, Dynegy Moss Landing, LLC and Dynegy Oakland, LLC filed a protest with the CPUC objecting to PG&E’s filing. That protest is still pending. The CPUC Commissioners were scheduled to vote on a draft resolution that rejected the arguments in our protest and approved PG&E’s proposed station power charges, including retroactive implementation of such charges, on October 15, 2012. However, the draft resolution was withdrawn from the Commission’s calendar and has not yet been rescheduled for a vote. We believe we have established an appropriate accrual.
SCE Termination.
In May 2012, Southern California Edison (“SCE”) notified Dynegy Morro Bay, LLC and Dynegy Moss Landing, LLC that it was terminating certain energy and capacity contracts with those entities. The validity of the purported terminations and subsequent actions by SCE are being disputed by Dynegy. We are vigorously pursuing all remedies and amounts due to us under these contracts.
Purchase Obligations.
We have firm capacity payments related to transportation of natural gas. Such arrangements are routinely used in the physical movement and storage of energy. The total of such obligations was $
183 million
as of December 31, 2012.
Coal Commitments.
At December 31, 2012, we had contracts in place to supply coal to our generation facilities with minimum commitments of $
316 million
through 2015.
Indemnifications and Guarantees
In the ordinary course of business, we routinely enter into contractual agreements that contain various representations, warranties, indemnifications and guarantees. Examples of such agreements include, but are not limited to, service agreements, equipment purchase agreements, engineering and technical service agreements, asset sales agreements, procurement and construction contracts. Some agreements contain indemnities that cover the other party’s negligence or limit the other party’s liability with respect to third party claims, in which event we will effectively be indemnifying the other party. Virtually all such agreements contain representations or warranties that are covered by indemnifications against the losses incurred by the other parties in the event such representations and warranties are false. While there is always the possibility of a loss related to such representations, warranties, indemnifications and guarantees in our contractual agreements, and such loss could be significant, in most cases management considers the probability of loss to be remote.
Indemnities
The indemnifications discussed below were settled or discharged pursuant to the Plan and the Confirmation Order with respect to Dynegy. We have accrued approximately
$1 million
as of
December 31, 2012
related to such indemnities.
LS Power Indemnities.
In connection with the LS Power Transactions we agreed in the purchase and sale agreement to indemnify LS Power against claims regarding any breaches in our representations and warranties and certain other potential liabilities. Even though Dynegy was discharged from any claims pursuant to the Plan and Confirmation Order, Dynegy Power Generation Inc., DPC, DMG and DYPM remain jointly and severally liable for any indemnification claims (the “LS Indemnity Entities”). Claims for indemnification shall survive until
twelve months
subsequent to closing with exceptions for tax claims, which shall survive for the applicable statute of limitations plus
30 days
, and certain other representations and potential liabilities, which shall survive indefinitely. The indemnifications provided to LS Power are limited to
$1.3 billion
in total; however, several categories of indemnifications are not available to LS Power until the liabilities incurred in the aggregate are equal to or exceed
$15 million
and are capped at a maximum of
$100 million
. Further, the purchase and sale agreement provides in part that the LS Indemnity Entities may not reduce or avoid liability for a valid claim based on a claim of contribution. In addition to the above indemnities related to the LS Power Transactions, the LS Indemnity Entities may be required to indemnify LS Power against claims related to the Riverside/Foothills Project for certain aspects of the project. Namely, LS Power has been indemnified for any disputes that arise as to ownership, transfer of bonds related to the project, and any failure by us to obtain approval for the transfer of the payment in-lieu of taxes program already in place. The indemnities related solely to the Riverside/Foothills Project are capped at a maximum of
$180 million
and extend until the earlier of the expiration of the tax agreement or December 26, 2026. At this time, no significant expenses have been incurred under these indemnities.
F-55
DYNEGY INC.
NOTES TO CONSOLIDATED FINANCIAL STATEMENTS (Continued)
Illinois Power Indemnities.
We have indemnified third parties against losses resulting from possible adverse regulatory actions taken by the ICC that could prevent Illinois Power from recovering costs incurred in connection with purchased natural gas and investments in specified items. Even though Dynegy was discharged from any claims pursuant to the Plan and Confirmation Order, Illinova Corporation (“Illinova”) remains liable for any indemnification claims. Although there is no absolute limitation on Illinova’s liability under this indemnity, the amount of the indemnity is limited to
50 percent
of any such losses. We have in the past made certain payments in respect of these indemnities following regulatory action by the ICC, and have established reserves for further potential indemnity claims. Further events, which fall within the scope of the indemnity, may still occur. However, we are not currently required to accrue a liability in connection with these indemnifications, as management cannot reasonably estimate a range of outcomes or at this time considers the probability of an adverse outcome as only reasonably possible. We intend to contest any proposed regulatory actions.
Other Indemnities.
We entered into indemnifications regarding environmental, tax, employee and other representations when completing asset sales such as, but not limited, to Calcasieu and Heard County power generating facilities and the sale of our midstream business (“DMSLP”). DPC remains the sole entity liable for indemnification claims with respect to Calcasieu and Heard County. DYPM remains liable for indemnification claims with respect to DMSLP. As of
December 31, 2012
, no claims have been made against these indemnities.
Guarantees
Black Mountain Guarantee.
Through one of our subsidiaries, we hold a
50 percent
ownership interest in Black Mountain (Nevada Cogeneration) (“Black Mountain”), in which our partner is a Chevron subsidiary. Black Mountain owns the Black Mountain power generation facility and has a power purchase agreement with a third party that extends through April 2023. In connection with the power purchase agreement, pursuant to which Black Mountain receives payments which decrease in amount over time, we agreed to guarantee
50 percent
of certain payments that may be due to the power purchaser under a mechanism designed to protect it from early termination of the agreement. At
December 31, 2012
, if an event of default due to early termination had occurred under the terms of the mortgage on the facility entered into in connection with the power purchase agreement, we could have been required to pay the power purchaser approximately
$52 million
under the guarantee. No amount has been accrued related to this guarantee as we consider the likelihood of a default to be remote.
Other Minimum Commitments
We have an interconnection obligation with respect to interconnection services for our Ontelaunee facility, which expires in 2027. Our obligation under this agreement is approximately
$1 million
per year through the term of the contract.
Minimum commitments in connection with office space and equipment leases for the next five years are as follows:
|
For the Year Ended December 31,
|
Amount
|
|||
|
(in millions)
|
||||
|
2013
|
$
|
4
|
|
|
|
2014
|
3
|
|
||
|
2015
|
2
|
|
||
|
2016
|
2
|
|
||
|
2017
|
2
|
|
||
During the Successor Period, the 2012 Predecessor Period and the years ended December 31, 2011 and 2010, we recognized rental expense of approximately $
3 million
,
$5 million
,
$36 million
, and
$107 million
, respectively.
In addition, we are party to
two
charter agreements related to VLGCs previously utilized in our former global liquids business. The primary term of one charter is through September 2013 while the primary term of the second charter is through September 2014. Both of these VLGCs have been sub-chartered to a wholly-owned subsidiary of Transammonia Inc. on terms that are identical to the terms of the original charter agreements. The aggregate minimum base commitments of the charter party agreements are approximately
$12 million
, and
$5 million
for the years ended December 31, 2013 and 2014, respectively. To date, the subsidiary of Transammonia Inc. has complied with the terms of the sub-charter agreements.
Preferred Stock.
We have authorized preferred stock consisting of
20 million
shares,
$0.01
par value. Our preferred stock may be issued from time to time in one or more series, the shares of each series to have such designations and powers,
F-56
DYNEGY INC.
NOTES TO CONSOLIDATED FINANCIAL STATEMENTS (Continued)
preferences, rights, qualifications, limitations and restrictions thereof as specified by our Board of Directors. As of December 31, 2012, there were no shares of preferred stock issued or outstanding.
Common Stock.
At
December 31, 2012
, we had authorized capital stock consisting of
420 million
shares of common stock,
$0.01
par value per share. As of the Plan Effective Date and at
December 31, 2012
, there were approximately
100 million
shares of our common stock issued in the aggregate and no shares were held in treasury. There was no significant common stock activity during the Successor Period. During the Successor Period, no quarterly cash dividends were paid by us.
As of the Plan Effective Date, we issued to Legacy Dynegy stockholders Warrants to purchase up to
15.6 million
shares of common stock for an exercise price of
$40
per share. The Warrants have a
five
-year term expiring on
October 2, 2017
. The exercise price of the Warrants and the number of shares issuable upon exercise of the Warrants are subject to adjustment upon certain events including: stock subdivisions, combinations, splits, stock dividends, capital reorganizations, or capital reclassifications of common stock. Further, in connection with Subject Transactions (as defined in the Warrant Agreement) warrant holders are entitled to certain distributions. If the value of the warrants are underwater upon the determination date of a Subject Transaction, such distributions are equivalent to
$0.01
per warrant, or approximately
$150 thousand
for all Warrants outstanding. As a result of this potential distribution, the Warrants are classified as a liability in our consolidated financial statements and are adjusted to their estimated fair value each reporting period with the change in fair value recognized in Other income (expense) on our consolidated statement of operations.
Stock Award Plans.
We have one stock award plan, which provides for the issuance of authorized shares of our common stock. Restricted stock units and option grants were issued under this plan following the Plan Effective Date. Each option granted is exercisable at a strike price of
$18.70
per share for options currently outstanding. A brief description of the plan is provided below:
|
•
|
Dynegy
2012
Long Term Incentive Plan.
This plan is a broad-based plan and provides for the issuance of approximately
6.1 million
authorized shares through
October 2022
. The maximum number of shares of common stock that may be subject to options, restricted stock awards, stock unit awards, stock appreciation rights, phantom stock awards and performance awards, denominated in shares of common stock granted to any one individual during any calendar year may not exceed approximately
1.2 million
shares or the equivalent of approximately
1.2 million
shares of common stock (subject to adjustment in accordance with the provisions of the
2012
Long Term Incentive Plan). The maximum amount of compensation that may be paid under all performance awards denominated in cash (including the fair market value of any shares of common stock paid in satisfaction of such performance awards) granted to any one individual during any calendar year may not exceed a fair market value of
$10 million
. Any options granted under the plan will expire no later than
10
years from the date of the grant.
|
All options granted under our option plans cease vesting for employees who are terminated for cause. For severance eligible terminations, as defined under the applicable severance pay plan, disability, retirement or death, continued vesting and/or an extended period in which to exercise vested options may apply, dependent upon the terms of the grant agreement applying to a specific grant that was awarded. It has been our practice to issue shares of common stock upon exercise of stock options generally from previously unissued shares. Options awarded to our executive officers and others who participate in our Executive Change in Control Severance Pay Plan vest immediately upon a termination in conjunction with a change in control.
On the Plan Effective Date, the following incentive plans were terminated and all the outstanding awards issued under such plans were cancelled.
|
•
|
Dynegy
2000
Long Term Incentive Plan.
This annual compensation plan, created for all employees upon Illinova’s merger with us, provided for the issuance of
2 million
authorized shares through
June 2009
. Grants from this plan vested in equal annual installments over a
three
-year period, and options expired
10
years from the date of the grant. All outstanding awards were cancelled on the Plan Effective Date.
|
|
•
|
Dynegy
2001
Non-Executive Long Term Incentive Plan
. This plan was a broad-based plan and provided for the issuance of
2 million
authorized shares through
September 2011
. Grants from this plan vested in equal annual installments over a
three
-year period, and options expired no later than
10
years from the date of the grant. This plan was frozen as to issuance of new awards. All outstanding awards were cancelled on the Plan Effective Date.
|
|
•
|
Dynegy
2002
Long Term Incentive Plan.
This annual compensation plan provided for the issuance of
2 million
authorized shares through
May 2012
. Grants from this plan vested in equal annual installments over a
three
-year period, and options expired no later than
10
years from the date of the grant. Following the approval of the Dynegy
2010
Long Term Incentive Plan, this plan was frozen as to issuance of new awards. All outstanding awards were cancelled on the Plan Effective Date.
|
|
•
|
Dynegy
2010
Long Term Incentive Plan.
This plan was a broad-based plan and provided for the issuance of
3.7 million
authorized shares through
May 2020
. Any options granted under the plan were to expire no later than
10
years from the date of the grant. All outstanding awards were cancelled on the Plan Effective Date.
|
F-57
DYNEGY INC.
NOTES TO CONSOLIDATED FINANCIAL STATEMENTS (Continued)
Compensation expense related to options and restricted units granted and restricted stock awarded totaled
$1 million
,
$5 million
,
$6 million
and
$6 million
for the Successor Period, the 2012 Predecessor Period and the years ended
December 31, 2011 and 2010
, respectively. We recognize compensation expense ratably over the vesting period of the respective awards. Tax benefits for compensation expense related to options and restricted units granted and restricted stock awarded totaled
zero
,
$2 million
,
$2 million
and
$2 million
for the Successor Period, the 2012 Predecessor Period and the years ended
December 31, 2011 and 2010
, respectively. As of
December 31, 2012
,
$9 million
of total unrecognized compensation expense related to options and restricted units granted is expected to be recognized over a weighted-average period of
2.8
years. The total fair value of shares vested was
$1 million
for the Successor Period. We did not capitalize or use cash to settle any share-based compensation in the Successor Period, the 2012 Predecessor Period and the years ended
December 31, 2011 and 2010
.
Cash received from option exercises for the Successor Period, the 2012 Predecessor Period and the years ended
December 31, 2011 and 2010
was
zero
,
zero
,
$3 million
and
zero
, respectively, and the tax benefit realized for the additional tax deduction from share-based payment awards totaled
zero
for all periods presented. The total intrinsic value of options exercised and released for the Successor Period was
zero
.
In
2010 and 2009
, we granted stock-based compensation awards to certain of our employees that cliff vest after
three
years based partly on the achievement of certain targets for our stock price for
February 2012 and 2013
, respectively, and partly on the achievement of certain earnings targets. A net compensation expense (benefit) of
zero
,
zero
,
$(6) million
and
$5 million
was recorded during the Successor Period, the 2012 Predecessor Period and the years ended
December 31, 2011 and 2010
, respectively. The benefits in
2011
were due to the change in fair value of our outstanding awards reflecting market conditions. As of
December 31, 2011 and 2010
, the liability for these awards is accrued in Other long-term liabilities in our consolidated balance sheets.
Stock option activity for the Successor Period was as follows:
|
Successor
|
||||||||||||
|
October 2 through December 31, 2012
|
||||||||||||
|
Options
|
Weighted Average
Exercise Price
|
Weighted Average Remaining Contractual Life
(in years)
|
Aggregate Intrinsic Value
(amounts in millions) |
|||||||||
|
(options in thousands)
|
||||||||||||
|
Outstanding at beginning of period
|
—
|
|
$
|
—
|
|
|||||||
|
Granted
|
688
|
|
$
|
18.70
|
|
|||||||
|
Outstanding at end of period
|
688
|
|
$
|
18.70
|
|
9.83
|
$
|
—
|
|
|||
|
Vested and unvested expected to vest
|
629
|
|
$
|
18.70
|
|
9.83
|
$
|
—
|
|
|||
|
Exercisable at end of period
|
—
|
|
$
|
—
|
|
0
|
$
|
—
|
|
|||
During the Successor Period, we did not grant any options at an exercise price less than the market price on the date of grant.
For stock options, we determine the fair value of each stock option at the grant date using a Black-Scholes model, with the following weighted-average assumptions used for grants.
|
Successor
|
||
|
October 2 through December 31, 2012
|
||
|
Dividends
|
—
|
|
|
Expected volatility
|
41.19
|
%
|
|
Risk-free interest rate
|
0.85
|
%
|
|
Expected option life
|
5.5 years
|
|
The weighted average grant-date fair value of options granted during the Successor Period was
$7.21
. For the Successor Period, the expected volatility was calculated based on
five
-year historical volatilities of the stock of comparable companies whose shares are traded using daily stock price returns equivalent to the expected term of the options. The risk-free interest rate was calculated based upon observed interest rates appropriate for the term of our employee stock options. Currently, we calculate the expected option life using the simplified methodology suggested by authoritative guidance issued by the SEC. For restricted stock awards, we consider the fair value to be the closing price of the stock on the grant date. We
F-58
DYNEGY INC.
NOTES TO CONSOLIDATED FINANCIAL STATEMENTS (Continued)
recognize the fair value of our share-based payments over the vesting periods of the awards, which is typically a
three
-year service period.
Activity for restricted stock units for the Successor Period was as follows:
|
Successor
|
||||||||||||
|
October 2 through December 31, 2012
|
||||||||||||
|
Restricted Stock Units
|
Weighted Average Grant Date Fair Value
|
Weighted Average Remaining Contractual Life
(in years)
|
Aggregate Intrinsic Value
(amounts in millions) |
|||||||||
|
(restricted stock shares in thousands)
|
||||||||||||
|
Outstanding at beginning of period
|
—
|
|
$
|
—
|
|
|||||||
|
Granted
|
288
|
|
$
|
—
|
|
|||||||
|
Outstanding at end of period
|
288
|
|
$
|
—
|
|
1.41
|
$
|
6
|
|
|||
|
Vested and unvested expected to vest
|
269
|
|
$
|
—
|
|
1.40
|
$
|
5
|
|
|||
|
Exercisable at end of period
|
—
|
|
$
|
—
|
|
0
|
$
|
—
|
|
|||
All restricted stock units to employees vest immediately upon the occurrence of a change in control in accordance with the terms of the applicable Change in Control Severance Pay Plan.
We sponsor and administer defined benefit plans and defined contribution plans for the benefit of our employees and also provide other post retirement benefits to retirees who meet age and service requirements. During the Successor Period and the 2012 Predecessor Period our contributions related to these plans were approximately, $
5
million and $
26 million
, respectively.
The following summarizes these plans:
Short-Term Incentive Plan.
Dynegy maintains a discretionary incentive compensation plan to provide our employees with rewards for the achievement of corporate goals and individual, professional accomplishments. Specific awards are determined by Dynegy’s Compensation and Human Resources Committee of the Board of Directors and are based on predetermined goals and objectives established at the start of each performance year.
Phantom Stock Plan.
In the 2012 Predecessor Period, and for the years ended 2011 and 2010, Dynegy issued phantom stock units under its 2009 Phantom Stock Plan. Units awarded under this plan are long term incentive awards that grant the participant the right to receive a cash payment based on the fair market value of Dynegy’s stock on the vesting date of the award. Effective July 8, 2011, stock appreciation rights, which are awards that entitle the holder to a cash payment equal to the difference between the fair market value of a share of stock at the time of exercise and the award’s exercise price, also may be awarded under the plan. As these awards must be settled in cash, we account for them as liabilities, with changes in the fair value of the liability recognized as expense in our consolidated statements of operations. Expense recognized in connection with these awards was $
2 million
, $
3 million
and $
7 million
for the 2012 Predecessor Period and for the years ended December 2011 and 2010, respectively. On the Plan Effective Date, all phantom stock units issued under the 2009 Phantom Stock Plan were cancelled and replaced with new phantom stock units issued under the 2012 Phantom Stock Plan. We recognized expense of
$2 million
related to these awards in the Successor Period.
Dynegy Inc. 401(k) Savings Plans.
For the Successor Period, the 2012 Predecessor Period and for the years ended 2011 and 2010, our employees participated in four 401(k) savings plans, all of which meet the requirements of Section 401(k) of the Internal Revenue Code and are defined contribution plans subject to the provisions of ERISA. The following summarizes the plans:
|
•
|
Dynegy Inc. 401(k) Savings Plan.
This plan and the related trust fund are established and maintained for the exclusive benefit of participating employees in the United States. Generally, all employees of designated Dynegy subsidiaries are eligible to participate in the plan. Employee pre-tax and Roth contributions to the plan are matched by the company at
100 percent
, up to a maximum of
five percent
of base pay, subject to IRS limitations. Generally, vesting in company contributions is based on years of service with
50 percent
vesting per full year of service. The Plan also allows for a discretionary contribution to eligible employee accounts for each plan year, subject to the sole discretion of the Compensation and Human Resources Committee of the Board of Directors. Matching and discretionary contributions, if any, were previously allocated in the form of units in the Dynegy common stock fund. However, effective as of the first payroll period on or after January 1, 2012, the matching contributions to the plan are being made in cash rather than being invested as units in the Dynegy common stock fund. Matching contributions
|
F-59
DYNEGY INC.
NOTES TO CONSOLIDATED FINANCIAL STATEMENTS (Continued)
may be invested according to the employee’s investment discretion. During the years ended December 31, 2011 and 2010, Legacy Dynegy issued approximately
0.6 million
and
0.4 million
shares, respectively, of its common stock in the form of matching contributions to fund the plan. Effective March 13, 2012, however, the Dynegy common stock fund was eliminated from the plan and the plan sold all shares of Dynegy common stock held by the plan.
No
discretionary contributions were made for any of the years in the three-year period ended
December 31, 2012
. Effective April 14, 2012, this plan was merged with and into the Dynegy Midwest Generation, Inc. 401(k) Savings plan (which was subsequently renamed the Dynegy Inc. 401(k) Plan).
|
•
|
Dynegy 401(k) Plan, formerly known as the Dynegy Midwest Generation, LLC 401(K) Savings Plan (formerly the Illinois Power Company Incentive Savings Plan) and Dynegy Midwest Generation, LLC 401(K) Savings Plan for Employees Covered Under a Collective Bargaining Agreement (formerly the Illinois Power Company Incentive Savings Plan for Employees Covered Under A Collective Bargaining Agreement).
For union employees we match
50 percent
of employee pre-tax and Roth contributions to the plans, up to a maximum of
six percent
of base pay, subject to IRS limitations. However, for non-union employees participating in the Dynegy Midwest Generation, LLC 401(k) Savings Plan, benefits were frozen as of
December 31, 2011
, with all contributions stopping after that date. Effective January 1, 2012, such participants instead became eligible to participate in the Dynegy Inc. 401(k) Savings Plan (assuming all applicable eligibility criteria are met). Employees are immediately
100 percent
vested in all contributions. The Plan also provides for an annual discretionary contribution to eligible employee accounts for a plan year, subject to the sole discretion of the Compensation and Human Resources Committee of the Board of Directors. Matching contributions and discretionary contributions, if any, to the plans are initially allocated in the form of units in the Dynegy common stock fund. However, effective as of the first payroll period on or after January 1, 2012, the matching contributions to the plan are being made in cash rather than being invested as units in the Dynegy common stock fund. Matching contributions may be invested according to the employee’s investment discretion. During the years ended December 31, 2011 and 2010, we issued
0.2 million
and
0.2 million
shares, respectively, of our common stock in the form of matching contributions to the plans. Effective March 13, 2012, however, the Dynegy common stock fund was eliminated from the plan and the plan sold all shares of Dynegy common stock held by the plan.
No
discretionary contributions were made for any of the years in the three-year period ended
December 31, 2012
. Effective April 14, 2012, the Dynegy Midwest Generation, Inc. 401(k) Savings Plan for Employees Covered under a Collective Bargaining Agreement and the Dynegy Inc. 401(k) Savings Plan were merged with the Dynegy 401(k) Plan. In addition, effective April 14, 2012, the accounts for all non-union participants under the Dynegy Northeast Generation, Inc. Savings Incentive Plan were transferred to the plan. At that time the Dynegy 401(k) Plan was amended to add provisions necessary to preserve various non-forfeitable benefits, rights and features related to the Dynegy 401(k) Savings Plan and the Dynegy Northeast Generation, Inc. Savings Incentive Plan.
|
|
•
|
Dynegy Northeast Generation, Inc. Savings Incentive Plan.
Under this plan we match
50 percent
of employee pre-tax contributions up to
six percent
of base pay for union employees and
50 percent
of employee contributions up to
eight percent
of base pay for non-union employees, in each case subject to IRS limitations. However, for non-union employees participating in the Dynegy Northeast Generation, Inc. Savings Incentive Plan, benefits were frozen as of
December 31, 2011
, with all contributions stopping after that date. Effective January 1, 2012, such participants instead became eligible to participate in the Dynegy Inc. 401(k) Savings Plan (assuming all applicable eligibility criteria are met). Effective April 14, 2012, the accounts for all non-union employees were transferred to the Dynegy Midwest Generation, Inc. 401(k) Savings Plan (which was subsequently renamed the Dynegy 401(k) Plan). Employees are immediately
100 percent
vested in our contributions. Matching contributions to this plan are made in cash and invested according to the employee’s investment discretion. Effective March 13, 2012, however, the Dynegy common stock fund was eliminated from the plan and the plan sold all shares of Dynegy common stock held by the plan.
|
During the Successor Period, the 2012 Predecessor Period and for the years ended December 31, 2011 and 2010, we recognized aggregate costs related to these employee compensation plans of
$1 million
, $
3 million
, $
4 million
and $
5 million
, respectively.
Pension and Other Post-Retirement Benefits
We have various defined benefit pension plans and post-retirement benefit plans. Generally, all employees participate in the pension plans (subject to the plans eligibility requirements), but only some of our employees participate in the other post-retirement medical and life insurance benefit plans. The pension plans are in the form of cash balance plans and more traditional career average or final average pay formula plans.
Restoration Plans.
In 2008, we adopted the Dynegy Inc. Restoration 401(k) Savings Plan, or the Restoration 401(k) Plan, and the Dynegy Inc. Restoration Pension Plan, or the Restoration Pension Plan,
two
nonqualified plans that supplement or restore benefits lost by certain of our highly compensated employees under the qualified plans as a result of Internal
F-60
DYNEGY INC.
NOTES TO CONSOLIDATED FINANCIAL STATEMENTS (Continued)
Revenue Code limitations that apply to the qualified plans. The Restoration 401(k) Plan is intended to supplement benefits under certain of the 401(k) plans, and the Restoration Pension Plan is intended to supplement benefits under certain of the pension plans. Employees who are eligible employees under the related qualified plans and earn in excess of certain of the qualified plan limits are eligible to participate in the restoration plans. The definitions of plan pay under the restoration plans, as well as the vesting rules, mirror those under the related qualified plans. Benefits under the restoration plans are paid as a lump sum. However, effective for periods on and after January 1, 2012, participation in and benefit accruals under these plans were frozen.
Obligations and Funded Status.
The following tables contain information about obligations and funded status of plans in which we, or one of our subsidiaries, formerly sponsored or participated in on a combined basis. Through August 31, 2011, we and our subsidiaries were the primary participant in certain defined benefit pension and other post-employment benefit plans sponsored by our parent. As such, we accounted for our participation in these plans as a single employer plan. With the DMG Transfer on September 1, 2011, we and our subsidiaries were no longer the primary participant in these plans and therefore, we began accounting for our participation in these plans as multiemployer plans. The transfer of the plans was recorded as part of the DMG Transfer as a common control transaction. From September 1, 2011 through June 5, 2012, the date of the DMG Acquisition, we recorded our share of expenses in the plans based upon the amounts billed to us through the Service Agreements which was approximately
$7 million
and
$8 million
for the 2012 Predecessor Period and the year ended December 31, 2011, respectively. As a result of the DMG Acquisition, we were once again the primary participant in these plans, and as a result of the Merger on September 30, 2012 we became the sponsor of these plans. Please read
Note 19—Related Party Transactions
—Service Agreements for further discussion.
|
|
Pension Benefits
|
Other Benefits
|
||||||||||||||||||||||||
|
Successor
|
Predecessor
|
Successor
|
Predecessor
|
|||||||||||||||||||||||
|
October 2 through December 31,
|
January 1 through October 1,
|
Year Ended December 31,
|
October 2 through December 31,
|
January 1 through October 1,
|
Year Ended December 31,
|
|||||||||||||||||||||
|
(amounts in millions)
|
2012
|
2012
|
2011
|
2012
|
2012
|
2011
|
||||||||||||||||||||
|
Projected benefit obligation, beginning of the period
|
$
|
352
|
|
$
|
1
|
|
$
|
272
|
|
$
|
54
|
|
$
|
18
|
|
$
|
69
|
|
||||||||
|
Service cost
|
3
|
|
3
|
|
8
|
|
—
|
|
2
|
|
2
|
|
||||||||||||||
|
Interest cost
|
3
|
|
5
|
|
10
|
|
1
|
|
1
|
|
3
|
|
||||||||||||||
|
Actuarial (gain) loss
|
(4
|
)
|
—
|
|
—
|
|
—
|
|
—
|
|
—
|
|
||||||||||||||
|
Benefits paid
|
(9
|
)
|
(3
|
)
|
(8
|
)
|
—
|
|
(1
|
)
|
(1
|
)
|
||||||||||||||
|
Plan change
|
(7
|
)
|
—
|
|
—
|
|
—
|
|
—
|
|
—
|
|
||||||||||||||
|
Curtailment gain
|
(1
|
)
|
—
|
|
—
|
|
—
|
|
—
|
|
(7
|
)
|
||||||||||||||
|
DMG Acquisition
|
—
|
|
297
|
|
—
|
|
—
|
|
44
|
|
—
|
|
||||||||||||||
|
DMG Transfer
|
—
|
|
—
|
|
(281
|
)
|
—
|
|
—
|
|
(48
|
)
|
||||||||||||||
|
Fresh-start adjustments
|
—
|
|
49
|
|
—
|
|
—
|
|
(10
|
)
|
—
|
|
||||||||||||||
|
Projected benefit obligation, end of the period
|
$
|
337
|
|
$
|
352
|
|
$
|
1
|
|
$
|
55
|
|
$
|
54
|
|
$
|
18
|
|
||||||||
|
Fair value of plan assets, beginning of the period
|
$
|
278
|
|
$
|
1
|
|
$
|
221
|
|
$
|
—
|
|
$
|
—
|
|
$
|
—
|
|
||||||||
|
Actual return on plan assets
|
5
|
|
6
|
|
11
|
|
—
|
|
—
|
|
—
|
|
||||||||||||||
|
Asset (loss)/gain
|
(1
|
)
|
—
|
|
—
|
|
—
|
|
—
|
|
—
|
|
||||||||||||||
|
Employer contributions
|
4
|
|
10
|
|
7
|
|
—
|
|
1
|
|
1
|
|
||||||||||||||
|
Benefits paid
|
(9
|
)
|
(3
|
)
|
(8
|
)
|
—
|
|
(1
|
)
|
(1
|
)
|
||||||||||||||
|
DMG Acquisition
|
—
|
|
244
|
|
—
|
|
—
|
|
—
|
|
—
|
|
||||||||||||||
|
DMG Transfer
|
—
|
|
—
|
|
(230
|
)
|
—
|
|
—
|
|
—
|
|
||||||||||||||
|
Fresh-start adjustments
|
—
|
|
20
|
|
—
|
|
—
|
|
—
|
|
—
|
|
||||||||||||||
|
Fair value of plan assets, end of the period
|
$
|
277
|
|
$
|
278
|
|
$
|
1
|
|
$
|
—
|
|
$
|
—
|
|
$
|
—
|
|
||||||||
|
Funded status
|
$
|
(60
|
)
|
$
|
(74
|
)
|
$
|
—
|
|
$
|
(55
|
)
|
$
|
(54
|
)
|
$
|
(18
|
)
|
||||||||
F-61
DYNEGY INC.
NOTES TO CONSOLIDATED FINANCIAL STATEMENTS (Continued)
Our accumulated benefit obligation was
$323 million
,
$338 million
and
$1 million
as of December 31, 2012, October 1, 2012 and December 31, 2011, respectively.
Pre-tax amounts recognized in AOCI consist of:
|
Pension Benefits
|
Other Benefits
|
|||||||||||||||||||||||||
|
Successor
|
Predecessor
|
Successor
|
Predecessor
|
|||||||||||||||||||||||
|
|
October 2 through December 31,
|
January 1 through October 1,
|
Year Ended December 31,
|
October 2 through December 31,
|
January 1 through October 1,
|
Year Ended December 31,
|
||||||||||||||||||||
|
(amounts in millions)
|
2012
|
2012
|
2011
|
2012
|
2012
|
2011
|
||||||||||||||||||||
|
Prior service credit
|
$
|
(7
|
)
|
$
|
—
|
|
$
|
—
|
|
$
|
—
|
|
$
|
—
|
|
$
|
(1
|
)
|
||||||||
|
Actuarial gain
|
(4
|
)
|
—
|
|
—
|
|
—
|
|
—
|
|
—
|
|
||||||||||||||
|
Net gain recognized
|
$
|
(11
|
)
|
$
|
—
|
|
$
|
—
|
|
$
|
—
|
|
$
|
—
|
|
$
|
(1
|
)
|
||||||||
Amounts recognized in the consolidated balance sheets consist of:
|
Successor
|
Predecessor
|
||||||||||||||||
|
|
December 31, 2012
|
December 31, 2011
|
|||||||||||||||
|
(amounts in millions)
|
Pension
Benefits
|
Other
Benefits
|
Pension
Benefits
|
Other
Benefits
|
|||||||||||||
|
Current liabilities
|
$
|
—
|
|
$
|
(2
|
)
|
$
|
—
|
|
$
|
(1
|
)
|
|||||
|
Non-current liabilities
|
(60
|
)
|
(53
|
)
|
—
|
|
(18
|
)
|
|||||||||
|
Net amount recognized
|
$
|
(60
|
)
|
$
|
(55
|
)
|
$
|
—
|
|
$
|
(19
|
)
|
|||||
The estimated net actuarial loss and prior service cost that were amortized from AOCI into net periodic benefit cost during the year for the Successor Period and the 2012 Predecessor Period for the defined benefit pension plans are both
zero
. The estimated net actuarial loss and prior service cost that were amortized from AOCI into net periodic benefit cost during the year for the Successor Period and the 2012 Predecessor Period for other postretirement benefit plans are both
zero
. The amortization of prior service cost is determined using a straight line amortization of the cost over the average remaining service period of employees expected to receive benefits under the Plan.
Components of Net Periodic Benefit Cost.
The components of net periodic benefit cost were:
|
Pension Benefits
|
|||||||||||||||||
|
Successor
|
Predecessor
|
||||||||||||||||
|
October 2 Through December 31,
|
January 1 Through October 1,
|
Year Ended December 31,
|
|||||||||||||||
|
(amounts in millions)
|
2012
|
2012
|
2011
|
2010
|
|||||||||||||
|
Service cost benefits earned during period
|
$
|
3
|
|
$
|
3
|
|
$
|
8
|
|
$
|
11
|
|
|||||
|
Interest cost on projected benefit obligation
|
3
|
|
4
|
|
10
|
|
14
|
|
|||||||||
|
Expected return on plan assets
|
(5
|
)
|
(5
|
)
|
(11
|
)
|
(16
|
)
|
|||||||||
|
Amortization of prior service costs
|
—
|
|
—
|
|
—
|
|
—
|
|
|||||||||
|
Recognized net actuarial loss
|
—
|
|
2
|
|
4
|
|
5
|
|
|||||||||
|
Curtailment gain
|
—
|
|
—
|
|
—
|
|
—
|
|
|||||||||
|
Total net periodic benefit cost
|
$
|
1
|
|
$
|
4
|
|
$
|
11
|
|
$
|
14
|
|
|||||
F-62
DYNEGY INC.
NOTES TO CONSOLIDATED FINANCIAL STATEMENTS (Continued)
|
Other Benefits
|
|||||||||||||||||
|
Successor
|
Predecessor
|
||||||||||||||||
|
October 2 Through December 31,
|
January 1 Through October 1,
|
Year Ended December 31,
|
|||||||||||||||
|
(amounts in millions)
|
2012
|
2012
|
2011
|
2010
|
|||||||||||||
|
Service cost benefits earned during period
|
$
|
—
|
|
$
|
2
|
|
$
|
2
|
|
$
|
3
|
|
|||||
|
Interest cost on projected benefit obligation
|
1
|
|
1
|
|
3
|
|
4
|
|
|||||||||
|
Expected return on plan assets
|
—
|
|
—
|
|
—
|
|
—
|
|
|||||||||
|
Amortization of prior service costs
|
—
|
|
—
|
|
—
|
|
—
|
|
|||||||||
|
Recognized net actuarial loss
|
—
|
|
—
|
|
—
|
|
—
|
|
|||||||||
|
Curtailment gain
|
—
|
|
—
|
|
(5
|
)
|
—
|
|
|||||||||
|
Total net periodic benefit cost
|
$
|
1
|
|
$
|
3
|
|
$
|
—
|
|
$
|
7
|
|
|||||
Assumptions.
The following weighted average assumptions were used to determine benefit obligations:
|
|
Pension Benefits
|
Other Benefits
|
||||||||||||||||||
|
Successor
|
Predecessor
|
Successor
|
Predecessor
|
|||||||||||||||||
|
|
October 2 Through December 31,
|
January 1 Through October 1,
|
Year Ended December 31,
|
October 2 Through December 31,
|
January 1 Through October 1,
|
Year Ended December 31,
|
||||||||||||||
|
|
2012
|
2012
|
2011
|
2012
|
2012
|
2011
|
||||||||||||||
|
Discount rate (1)
|
3.98
|
%
|
4.80
|
%
|
4.80
|
%
|
4.08
|
%
|
4.93
|
%
|
4.93
|
%
|
||||||||
|
Rate of compensation increase
|
3.50
|
%
|
3.50
|
%
|
N/A
|
|
N/A
|
|
N/A
|
|
3.50
|
%
|
||||||||
________________________________________
|
(1)
|
We utilized a yield curve approach to determine the discount. Projected benefit payments for the plans were matched against the discount rates in the yield curve.
|
The following weighted average assumptions were used to determine net periodic benefit cost:
|
|
Pension Benefits
|
Other Benefits
|
||||||||||||||||||||||||
|
Successor
|
Predecessor
|
Successor
|
Predecessor
|
|||||||||||||||||||||||
|
|
October 2 Through December 31,
|
January 1 Through October 1,
|
Year Ended December 31,
|
October 2 Through December 31,
|
January 1 Through October 1,
|
Year Ended December 31,
|
||||||||||||||||||||
|
|
2012
|
2012
|
2011
|
2010
|
2012
|
2012
|
2011
|
2010
|
||||||||||||||||||
|
Discount rate
|
3.89
|
%
|
4.80
|
%
|
5.49
|
%
|
5.86
|
%
|
4.03
|
%
|
4.93
|
%
|
5.61
|
%
|
5.92
|
%
|
||||||||||
|
Expected return on plan assets
|
7.00
|
%
|
7.00
|
%
|
8.00
|
%
|
8.00
|
%
|
N/A
|
|
N/A
|
|
N/A
|
|
N/A
|
|
||||||||||
|
Rate of compensation increase
|
3.50
|
%
|
3.50
|
%
|
N/A
|
|
2.50% - 3.50%
|
|
N/A
|
|
N/A
|
|
4.50
|
%
|
4.50
|
%
|
||||||||||
Our expected long-term rate of return on plan assets for the year ended December 31, 2013 is
7 percent
. This figure begins with a blend of asset class-level returns developed under a theoretical global capital asset pricing model methodology conducted by an outside consultant. In development of this figure, the historical relationships between equities and fixed income are preserved consistent with the widely accepted capital market principle that assets with higher volatility generate a greater return over the long-term. Current market factors such as inflation and interest rates are also incorporated in the assumptions. This figure gives consideration towards the plan’s use of active management and favorable past experience. It is also net of plan expenses.
F-63
DYNEGY INC.
NOTES TO CONSOLIDATED FINANCIAL STATEMENTS (Continued)
The following summarizes our assumed health care cost trend rates:
|
|
Successor
|
Predecessor
|
||||||||
|
October 2 Through December 31,
|
January 1 Through October 1,
|
December 31,
|
||||||||
|
|
2012
|
2012
|
2011
|
|||||||
|
Health care cost trend rate assumed for next year
|
7.75
|
%
|
7.75
|
%
|
8.00
|
%
|
||||
|
Ultimate trend rate
|
4.50
|
%
|
4.50
|
%
|
4.50
|
%
|
||||
|
Year that the rate reaches the ultimate trend rate
|
2020
|
|
2019
|
|
2019
|
|
||||
Assumed health care cost trend rates have a significant effect on the amounts reported for the health care plans. The impact of a one percent increase/decrease in assumed health care cost trend rates is as follows:
|
(amounts in millions)
|
Increase
|
Decrease
|
||||||
|
Aggregate impact on service cost and interest cost
|
$
|
—
|
|
$
|
—
|
|
||
|
Impact on accumulated post-retirement benefit obligation
|
$
|
10
|
|
$
|
(8
|
)
|
||
Plan Assets.
We employ a total return investment approach whereby a mix of equities and fixed income investments are used to maximize the long-term return of plan assets for a prudent level of risk. The intent of this strategy is to minimize plan expenses by outperforming plan liabilities over the long run. Risk tolerance is established through careful consideration of plan liabilities, plan funded status, and corporate financial condition. The investment portfolio contains a diversified blend of equity and fixed income investments. Furthermore, equity investments are diversified across U.S. and non-U.S. stocks as well as growth, value, and small and large capitalizations. The Plan recently adopted a glide-path approach which will de-risk the portfolio as certain funding levels are met. Historically, the target allocations for plan assets were
65 percent
to equity and
35 percent
to fixed income; however, equity allocations will be reduced as higher funding levels are achieved.
Derivatives may be used to gain market exposure in an efficient and timely manner; however, derivatives may not be used to leverage the portfolio beyond the market value of the underlying investment. Investment risk is measured and monitored on an ongoing basis through quarterly investment portfolio reviews, periodic asset/liability studies, and annual liability measurements.
The following table sets forth by level within the fair value hierarchy assets that were accounted for at fair value related to our pension plans. These assets are classified in their entirety based on the lowest level of input that is significant to the fair value measurement. Our assessment of the significance of a particular input to the fair value measurement requires judgment, and may affect the valuation of fair value assets and liabilities and their placement within the fair value hierarchy levels.
|
|
Fair Value as of December 31, 2012
|
|||||||||||||||
|
(amounts in millions)
|
Level 1
|
Level 2
|
Level 3
|
Total
|
||||||||||||
|
Equity securities:
|
|
|
|
|
||||||||||||
|
U.S. companies (1)
|
$
|
—
|
|
$
|
113
|
|
$
|
—
|
|
$
|
113
|
|
||||
|
Non-U.S. companies (2)
|
—
|
|
15
|
|
—
|
|
15
|
|
||||||||
|
International (3)
|
—
|
|
55
|
|
—
|
|
55
|
|
||||||||
|
Fixed income securities (4)
|
47
|
|
47
|
|
—
|
|
94
|
|
||||||||
|
Total
|
$
|
47
|
|
$
|
230
|
|
$
|
—
|
|
$
|
277
|
|
||||
________________________________________
|
(1)
|
This category comprises a domestic common collective trust not actively managed that tracks the Dow Jones total U.S. stock market.
|
|
(2)
|
This category comprises a common collective trust not actively managed that tracks the MSCI All Country World Ex-U.S. Index.
|
|
(3)
|
This category comprises actively managed common collective trusts that hold U.S. and foreign equities. These trusts track the MSCI World Index.
|
F-64
DYNEGY INC.
NOTES TO CONSOLIDATED FINANCIAL STATEMENTS (Continued)
|
(4)
|
This category includes a mutual fund and a trust that invest primarily in investment grade corporate bonds.
|
Contributions and Payments.
During the Successor Period, we contributed
$4 million
to our pension plans and did not make any contributions to our other post-retirement benefit plans. During the 2012 Predecessor Period, we contributed
$16 million
to our pension plans and
$1 million
to our other post-retirement benefit plans. In 2013, we are not required to make contributions to our pension plans and other postretirement benefit plans.
Our expected benefit payments for future services for our pension and other postretirement benefits are as follows:
|
(amounts in millions)
|
Pension Benefits
|
Other Benefits
|
||||||
|
2013
|
$
|
31
|
|
$
|
2
|
|
||
|
2014
|
20
|
|
2
|
|
||||
|
2015
|
18
|
|
2
|
|
||||
|
2016
|
16
|
|
2
|
|
||||
|
2017
|
16
|
|
2
|
|
||||
|
2018 - 2022
|
$
|
94
|
|
$
|
13
|
|
||
We report the results of our operations in
two
segments: (i) Coal and (ii) Gas. In connection with our emergence from bankruptcy, we deconsolidated the DNE Debtor Entities and we began accounting for our investment in the DNE Debtor Entities using the cost method. Accordingly, we have reclassified DNE’s operating results as discontinued operations in the consolidated financial statements for all periods presented. Subsequent to our emergence from bankruptcy, management does not consider general and administrative expense when evaluating the performance of our Coal and Gas segments, but instead evaluates general and administrative expense on an enterprise wide basis. Accordingly, we have recast our segments to present general and administrative expense in Other and Eliminations for all periods presented.
On September 1, 2011, we completed the DMG Transfer; therefore, the results of our Coal segment were not included in our 2011 consolidated results from September 1 through December 31, 2011. On June 5, 2012, we completed the DMG Acquisition; therefore, the results of our Coal segment in our consolidated results were included for the period of June 6 through October 1, 2012 and in the Successor Period.
During the Successor Period,
one
customer in Coal and
four
customers in Gas accounted for approximately
34 percent
,
16 percent
,
15 percent
,
14 percent
and
13 percent
of our consolidated revenues, respectively. During the 2012 Predecessor Period,
one
customer in Coal,
two
customers in Gas and
one
customer in both Coal and Gas accounted for approximately
30 percent
,
16 percent
,
15 percent
and
10 percent
of our consolidated revenues, respectively. During 2011,
one
customer in Coal and
three
customers in Gas accounted for approximately
38 percent
,
23 percent
,
12 percent
and
11 percent
of our consolidated revenues, respectively. During 2010,
one
customer in Coal and
one
customer in Gas accounted for approximately
34 percent
and
14 percent
of our consolidated revenues, respectively.
Reportable segment information, including intercompany transactions accounted for at prevailing market rates, for the Successor Period, the 2012 Predecessor Period, and the years ended December 31, 2011 and 2010 is presented below:
F-65
DYNEGY INC.
NOTES TO CONSOLIDATED FINANCIAL STATEMENTS (Continued)
Segment Data as of and for the Period October 2 Through December 31, 2012
(amounts in millions)
|
Successor
|
||||||||||||||||
|
|
Coal
|
Gas
|
Other and
Eliminations
|
Total
|
||||||||||||
|
Unaffiliated revenues:
|
|
|
|
|
|
|
|
|
||||||||
|
Domestic
|
$
|
107
|
|
$
|
205
|
|
$
|
—
|
|
$
|
312
|
|
||||
|
Total revenues
|
$
|
107
|
|
$
|
205
|
|
$
|
—
|
|
$
|
312
|
|
||||
|
Depreciation and amortization
|
$
|
(8
|
)
|
$
|
(36
|
)
|
$
|
(1
|
)
|
$
|
(45
|
)
|
||||
|
General and administrative expense
|
—
|
|
—
|
|
(22
|
)
|
(22
|
)
|
||||||||
|
Operating loss
|
$
|
(49
|
)
|
$
|
(31
|
)
|
$
|
(24
|
)
|
$
|
(104
|
)
|
||||
|
Bankruptcy reorganization items, net
|
—
|
|
—
|
|
(3
|
)
|
(3
|
)
|
||||||||
|
Earnings from unconsolidated investments
|
—
|
|
2
|
|
—
|
|
2
|
|
||||||||
|
Interest expense
|
|
|
|
|
|
|
(16
|
)
|
||||||||
|
Other items, net
|
—
|
|
—
|
|
8
|
|
8
|
|
||||||||
|
Loss from continuing operations before income taxes
|
|
|
|
|
|
|
(113
|
)
|
||||||||
|
Income tax benefit
|
|
|
|
|
|
|
—
|
|
||||||||
|
Loss from continuing operations
|
|
|
|
|
|
|
(113
|
)
|
||||||||
|
Income from discontinued operations, net of tax
|
6
|
|
||||||||||||||
|
Net loss
|
$
|
(107
|
)
|
|||||||||||||
|
Identifiable assets (domestic)
|
$
|
1,310
|
|
$
|
2,750
|
|
$
|
475
|
|
$
|
4,535
|
|
||||
|
Capital expenditures
|
$
|
(26
|
)
|
$
|
(19
|
)
|
$
|
(1
|
)
|
$
|
(46
|
)
|
||||
F-66
DYNEGY INC.
NOTES TO CONSOLIDATED FINANCIAL STATEMENTS (Continued)
Segment Data as of and for the Period January 1 Through October 1, 2012
(amounts in millions)
|
Predecessor
|
||||||||||||||||
|
|
Coal
|
Gas
|
Other and
Eliminations
|
Total
|
||||||||||||
|
Unaffiliated revenues:
|
|
|
|
|
|
|
|
|
||||||||
|
Domestic
|
$
|
166
|
|
$
|
815
|
|
$
|
—
|
|
$
|
981
|
|
||||
|
Total revenues
|
$
|
166
|
|
$
|
815
|
|
$
|
—
|
|
$
|
981
|
|
||||
|
Depreciation and amortization expense
|
$
|
(13
|
)
|
$
|
(91
|
)
|
$
|
(6
|
)
|
$
|
(110
|
)
|
||||
|
General and administrative expense
|
—
|
|
—
|
|
(56
|
)
|
(56
|
)
|
||||||||
|
Operating income (loss)
|
$
|
(63
|
)
|
$
|
128
|
|
$
|
(60
|
)
|
$
|
5
|
|
||||
|
Bankruptcy reorganization items, net
|
—
|
|
—
|
|
1,037
|
|
1,037
|
|
||||||||
|
Interest expense
|
|
|
|
|
|
|
(120
|
)
|
||||||||
|
Impairment of Undertaking receivable, affiliate
|
—
|
|
—
|
|
(832
|
)
|
(832
|
)
|
||||||||
|
Other items, net
|
5
|
|
2
|
|
24
|
|
31
|
|
||||||||
|
Income from continuing operations before income taxes
|
|
|
|
|
|
|
121
|
|
||||||||
|
Income tax benefit
|
|
|
|
|
|
|
9
|
|
||||||||
|
Income from continuing operations
|
|
|
|
|
|
|
130
|
|
||||||||
|
Loss from discontinued operations, net of tax
|
(162
|
)
|
||||||||||||||
|
Net loss
|
$
|
(32
|
)
|
|||||||||||||
|
Capital expenditures
|
$
|
(33
|
)
|
$
|
(23
|
)
|
$
|
(7
|
)
|
$
|
(63
|
)
|
||||
F-67
DYNEGY INC.
NOTES TO CONSOLIDATED FINANCIAL STATEMENTS (Continued)
Segment Data as of and for the Year Ended
December 31, 2011
(amounts in millions)
|
Predecessor
|
||||||||||||||||
|
|
Coal
|
Gas
|
Other and
Eliminations
|
Total
|
||||||||||||
|
Unaffiliated revenues:
|
|
|
|
|
|
|
|
|
||||||||
|
Domestic
|
$
|
460
|
|
$
|
872
|
|
$
|
1
|
|
$
|
1,333
|
|
||||
|
Total revenues
|
$
|
460
|
|
$
|
872
|
|
$
|
1
|
|
$
|
1,333
|
|
||||
|
Depreciation and amortization expense
|
$
|
(156
|
)
|
$
|
(132
|
)
|
$
|
(7
|
)
|
$
|
(295
|
)
|
||||
|
General and administrative expense
|
—
|
|
—
|
|
(102
|
)
|
(102
|
)
|
||||||||
|
Operating loss
|
$
|
(38
|
)
|
$
|
(37
|
)
|
$
|
(114
|
)
|
$
|
(189
|
)
|
||||
|
Bankruptcy reorganization items, net
|
—
|
|
—
|
|
(52
|
)
|
(52
|
)
|
||||||||
|
Interest expense and debt extinguishment costs
|
|
|
|
|
|
|
(369
|
)
|
||||||||
|
Other items, net
|
2
|
|
2
|
|
31
|
|
35
|
|
||||||||
|
Loss from continuing operations before income taxes
|
|
|
|
|
|
|
(575
|
)
|
||||||||
|
Income tax benefit
|
|
|
|
|
|
|
144
|
|
||||||||
|
Loss from continuing operations
|
|
|
|
|
|
|
(431
|
)
|
||||||||
|
Loss from discontinued operations, net of tax
|
(509
|
)
|
||||||||||||||
|
Net loss
|
$
|
(940
|
)
|
|||||||||||||
|
Identifiable assets (domestic)
|
$
|
—
|
|
$
|
6,759
|
|
$
|
1,552
|
|
$
|
8,311
|
|
||||
|
Capital expenditures
|
$
|
(115
|
)
|
$
|
(79
|
)
|
$
|
(2
|
)
|
$
|
(196
|
)
|
||||
F-68
DYNEGY INC.
NOTES TO CONSOLIDATED FINANCIAL STATEMENTS (Continued)
Segment Data as of and for the Year Ended
December 31, 2010
(amounts in millions)
|
Predecessor
|
||||||||||||||||
|
|
Coal
|
Gas
|
Other and
Eliminations
|
Total
|
||||||||||||
|
Unaffiliated revenues:
|
|
|
|
|
|
|
|
|
||||||||
|
Domestic
|
$
|
837
|
|
$
|
1,223
|
|
$
|
(1
|
)
|
$
|
2,059
|
|
||||
|
Total revenues
|
$
|
837
|
|
$
|
1,223
|
|
$
|
(1
|
)
|
$
|
2,059
|
|
||||
|
Depreciation and amortization expense
|
$
|
(256
|
)
|
$
|
(135
|
)
|
$
|
(6
|
)
|
$
|
(397
|
)
|
||||
|
Impairment and other charges
|
(4
|
)
|
(136
|
)
|
(6
|
)
|
(146
|
)
|
||||||||
|
General and administrative expense
|
—
|
|
—
|
|
(158
|
)
|
(158
|
)
|
||||||||
|
Operating income (loss)
|
$
|
47
|
|
$
|
92
|
|
$
|
(171
|
)
|
$
|
(32
|
)
|
||||
|
Losses from unconsolidated investments
|
(62
|
)
|
—
|
|
—
|
|
(62
|
)
|
||||||||
|
Interest expense
|
|
|
|
|
|
|
(363
|
)
|
||||||||
|
Other items, net
|
—
|
|
2
|
|
2
|
|
4
|
|
||||||||
|
Loss from continuing operations before income taxes
|
|
|
|
|
|
|
(453
|
)
|
||||||||
|
Income tax benefit
|
|
|
|
|
|
|
194
|
|
||||||||
|
Loss from continuing operations
|
|
|
|
|
|
|
(259
|
)
|
||||||||
|
Income from discontinued operations, net of taxes
|
|
|
|
|
|
|
17
|
|
||||||||
|
Net loss
|
|
|
|
|
|
|
$
|
(242
|
)
|
|||||||
|
Identifiable assets (domestic)
|
$
|
3,655
|
|
$
|
4,375
|
|
$
|
1,919
|
|
$
|
9,949
|
|
||||
|
Capital expenditures and unconsolidated investments
|
$
|
(289
|
)
|
$
|
(50
|
)
|
$
|
(9
|
)
|
$
|
(348
|
)
|
||||
The following is a summary of our unaudited quarterly financial information for the years ended
December 31, 2012 and 2011
, respectively:
|
|
Predecessor
|
Successor
|
|||||||||||||||||||
|
(amounts in millions)
|
March 2012
|
June 2012
|
September 2012
|
October 1, 2012
|
December 2012
|
||||||||||||||||
|
Revenues
|
$
|
268
|
|
$
|
270
|
|
$
|
443
|
|
$
|
—
|
|
$
|
312
|
|
||||||
|
Operating income (loss)
|
12
|
|
(8
|
)
|
(11
|
)
|
12
|
|
(104
|
)
|
|||||||||||
|
Net income (loss)
|
(1,082
|
)
|
(1)
|
(69
|
)
|
(41
|
)
|
1,160
|
|
(2)
|
(107
|
)
|
|||||||||
|
Net loss per share
|
N/A
|
|
N/A
|
|
N/A
|
|
N/A
|
|
(1.07
|
)
|
|||||||||||
|
|
Predecessor
|
||||||||||||||||
|
(amounts in millions)
|
March 2011
|
June 2011
|
September 2011
|
December 2011
|
|||||||||||||
|
Revenues
|
$
|
467
|
|
|
$
|
306
|
|
$
|
430
|
|
|
$
|
130
|
|
|||
|
Operating income (loss)
|
(39
|
)
|
(83
|
)
|
38
|
|
(105
|
)
|
|||||||||
|
Net loss
|
(80
|
)
|
(115
|
)
|
(129
|
)
|
(3
|
)
|
(616
|
)
|
|||||||
__________________________________________
|
(1)
|
Includes a loss from Bankruptcy reorganization items, net and an Impairment of Undertaking receivable, affiliate of approximately
$247 million
and
$832 million
, respectively. Please read
|
F-69
DYNEGY INC.
NOTES TO CONSOLIDATED FINANCIAL STATEMENTS (Continued)
|
(2)
|
Includes a gain from Bankruptcy reorganization items, net of approximately
$1.1 billion
associated with our emergence from bankruptcy. Please read
Note 3—Emergence from Bankruptcy and Fresh-Start Accounting
for further discussion.
|
|
(3)
|
Includes debt extinguishment costs of
$21 million
incurred in connection with the termination of the Sithe Senior Notes. Please read
Note 18—Debt
—Sithe Senior Notes for further discussion.
|
DPC Revolving Credit Agreement
DPC, as Borrower, and certain of its subsidiaries entered into a revolving credit agreement (the “DPC Revolving Credit Agreement”), dated January 16, 2013 (the “Closing Date”). Borrowings under the DPC Revolving Credit Agreement will be used for the ongoing working capital requirements and general corporate purposes of DPC and its subsidiaries.
The DPC Revolving Credit Agreement creates a
364
-day senior secured revolving credit facility with commitments in principal amount of
$150 million
(the “DPC Revolving Credit Facility”), which was available on the Closing Date and which commitment amount may be adjusted pursuant to the terms thereof. Amounts borrowed under the DPC Revolving Credit Agreement that are repaid or prepaid may be re-borrowed. The DPC Revolving Credit Agreement will mature on January 15, 2014 (the “Maturity Date”) and the unpaid outstanding principal amount of each revolving loan thereunder will be repaid on or prior to the Maturity Date. DPC may reduce the aggregate commitments outstanding under the DPC Revolving Credit Facility without premium or penalty. DPC must pay a commitment fee at a rate of
0.50 percent
per year on the average daily unused amount of the commitment under the DPC Revolving Credit Facility.
The DPC Revolving Credit Agreement bears interest, at DPC’s option, at either (a)
3.25 percent
per annum plus the Adjusted LIBOR Rate, with respect to any Eurodollar Revolving Loan or (b)
2.25 percent
per annum plus the Alternate Base Rate, with respect to any ABR Revolving Loan. DPC may elect from time to time to convert all or a portion of the revolving loans from an ABR Borrowing into a Eurodollar Borrowing or vice versa. The DPC Revolving Credit Agreement requires a mandatory prepayment only in the event the aggregate revolving loans exceed the aggregate revolving credit commitments.
The DPC Revolving Credit Agreement contains customary events of default and affirmative and negative covenants including, subject to certain specified exceptions, financial covenants specifying minimum thresholds for DPC’s interest coverage ratios and maximum thresholds for DPC’s total leverage ratio. Under the DPC Revolving Credit Agreement, DPC must be in compliance with the following ratios for the following periods:
|
Period Ending
|
Consolidated Total Debt to Consolidated Adjusted EBITDA Requirement (1)
|
Consolidated Adjusted EBITDA to Consolidated Cash Interest Expense Requirement (1)
|
||
|
June 30, 2013
|
7.00: 1.00
|
1.25: 1.00
|
||
|
September 30, 2013
|
5.50: 1.00
|
1.75: 1.00
|
||
|
December 31, 2013
|
4.50: 1.00
|
2.25: 1.00
|
||
__________________________________________
(1) Consolidated Total Debt, Consolidated Adjusted EBITDA and Consolidated Interest Expense are defined terms in the DPC Revolving Credit Agreement and relate to amounts included in DPC and its direct and indirect subsidiaries only.
The DPC Revolving Credit Agreement limits distributions to
$135 million
per year, provided that as of the date of the proposed distribution, all unrestricted cash and unrestricted permitted investments of DPC and its subsidiaries equals at least
$50 million
and that proceeds of the revolving loans are not used to make such distributions.
The DPC Revolving Credit Agreement is secured by first priority liens granted by certain of our subsidiaries to secure the loans made under the DPC Revolving Credit Agreement on a pari passu basis with the DPC Credit Agreement.
Acquisition Agreement
On
March 14, 2013
, we entered into an agreement to acquire Ameren Energy Resources Company, LLC (AER) and its subsidiaries Ameren Energy Generating Company (Genco), Ameren Energy Resources Generating Company (AERG) and Ameren Energy Marketing Company (AEM) from Ameren Corporation. We will acquire AER and its subsidiaries through a newly formed, wholly-owned subsidiary, Illinois Power Holdings, LLC, that will maintain corporate separateness from our current legal entities. There is no cash consideration or stock issued as part of the purchase price. Genco's debt will remaining outstanding. The transaction is subject to certain closing conditions and the receipt of regulatory approvals.
F-70
Schedule I
DYNEGY INC.
BALANCE SHEETS OF THE REGISTRANT
(amounts in millions)
|
Successor
|
Predecessor
|
||||||||
|
December 31, 2012
|
December 31, 2011
|
||||||||
|
ASSETS
|
|||||||||
|
Current Assets
|
|||||||||
|
Cash and cash equivalents
|
$
|
306
|
|
$
|
29
|
|
|||
|
Accounts receivable
|
5
|
|
8
|
|
|||||
|
Restricted cash
|
27
|
|
27
|
|
|||||
|
Prepayments and other current assets
|
5
|
|
3
|
|
|||||
|
Total Current Assets
|
343
|
|
67
|
|
|||||
|
Other Assets
|
|||||||||
|
Undertaking receivable, affiliate
|
—
|
|
1,250
|
|
|||||
|
Investments in affiliates
|
6,189
|
|
5,307
|
|
|||||
|
Restricted cash
|
2
|
|
44
|
|
|||||
|
Deferred income taxes
|
95
|
|
—
|
|
|||||
|
Other long-term assets
|
3
|
|
—
|
|
|||||
|
Total Assets
|
$
|
6,632
|
|
$
|
6,668
|
|
|||
|
LIABILITIES AND STOCKHOLDERS’/MEMBER’S EQUITY
|
|||||||||
|
Current Liabilities
|
|||||||||
|
Accounts payable, affiliate
|
$
|
—
|
|
$
|
2
|
|
|||
|
Intercompany accounts payable
|
1,632
|
|
1,301
|
|
|||||
|
Accounts payable
|
1
|
|
—
|
|
|||||
|
Accrued intercompany interest
|
—
|
|
1
|
|
|||||
|
Deferred income taxes
|
95
|
|
50
|
|
|||||
|
Other current liabilities
|
12
|
|
4
|
|
|||||
|
Total Current Liabilities
|
1,740
|
|
1,358
|
|
|||||
|
Liabilities subject to compromise
|
—
|
|
4,012
|
|
|||||
|
Intercompany long-term debt
|
2,255
|
|
1,262
|
|
|||||
|
Other long-term liabilities
|
134
|
|
4
|
|
|||||
|
Total Liabilities
|
4,129
|
|
6,636
|
|
|||||
|
Commitments and Contingencies (Note 22)
|
|||||||||
|
Stockholders’/Member’s Equity
|
|||||||||
|
Common Stock, $0.01 par value, 420,000,000 shares authorized at December 31, 2012; 99,999,196 shares issued and outstanding at December 31, 2012
|
1
|
|
—
|
|
|||||
|
Member's Contribution
|
—
|
|
5,135
|
|
|||||
|
Affiliate Receivable
|
—
|
|
(846
|
)
|
|||||
|
Additional paid-in capital
|
2,598
|
|
—
|
|
|||||
|
Accumulated other comprehensive income, net of tax
|
11
|
|
1
|
|
|||||
|
Accumulated deficit
|
(107
|
)
|
(4,258
|
)
|
|||||
|
Total Stockholders’/Member’s Equity
|
2,503
|
|
32
|
|
|||||
|
Total Liabilities and Stockholders’/Member’s Equity
|
$
|
6,632
|
|
$
|
6,668
|
|
|||
See Notes to Registrant’s Financial Statements and Dynegy Inc.’s Consolidated Financial Statements.
F-71
Schedule I
DYNEGY INC.
STATEMENTS OF OPERATIONS OF THE REGISTRANT
(amounts in millions)
|
Successor
|
Predecessor
|
|||||||||||||||
|
|
October 2 Through December 31, 2012
|
January 1 Through October 1, 2012
|
Year Ended December 31, 2011
|
Year Ended December 31, 2010
|
||||||||||||
|
Operating income (loss)
|
$
|
(2
|
)
|
$
|
(2
|
)
|
$
|
(4
|
)
|
$
|
1
|
|
||||
|
Bankruptcy reorganization items, net
|
(3
|
)
|
688
|
|
(52
|
)
|
—
|
|
||||||||
|
Losses from unconsolidated investments
|
(116
|
)
|
(1,017
|
)
|
(225
|
)
|
(94
|
)
|
||||||||
|
Interest expense
|
—
|
|
—
|
|
(295
|
)
|
(363
|
)
|
||||||||
|
Other income and expense, net
|
8
|
|
452
|
|
1
|
|
4
|
|
||||||||
|
Income (loss) from continuing operations before income taxes
|
(113
|
)
|
121
|
|
(575
|
)
|
(452
|
)
|
||||||||
|
Income tax benefit
|
—
|
|
9
|
|
144
|
|
194
|
|
||||||||
|
Income (loss) from continuing operations
|
(113
|
)
|
130
|
|
(431
|
)
|
(258
|
)
|
||||||||
|
Income (loss) from discontinued operations, net of tax expense (benefit) of zero, zero, $171 million and ($10) million, respectively
|
6
|
|
(162
|
)
|
(509
|
)
|
16
|
|
||||||||
|
Net loss
|
$
|
(107
|
)
|
$
|
(32
|
)
|
$
|
(940
|
)
|
$
|
(242
|
)
|
||||
See Notes to Registrant’s Financial Statements and Dynegy Inc.’s Consolidated Financial Statements.
F-72
Schedule I
DYNEGY INC.
STATEMENTS OF CASH FLOWS OF THE REGISTRANT
(amounts in millions)
|
Successor
|
Predecessor
|
|||||||||||||||
|
|
October 2 Through December 31, 2012
|
January 1 Through October 1, 2012
|
December 31, 2011
|
December 31, 2010
|
||||||||||||
|
CASH FLOWS FROM OPERATING ACTIVITIES:
|
||||||||||||||||
|
Operating cash flow, exclusive of intercompany transactions
|
$
|
5
|
|
$
|
(222
|
)
|
$
|
(229
|
)
|
$
|
(181
|
)
|
||||
|
Intercompany transactions
|
(14
|
)
|
217
|
|
(73
|
)
|
78
|
|
||||||||
|
Net cash provided by (used in) operating activities
|
(9
|
)
|
(5
|
)
|
(302
|
)
|
(103
|
)
|
||||||||
|
CASH FLOWS FROM INVESTING ACTIVITIES:
|
||||||||||||||||
|
Short term investments
|
—
|
|
—
|
|
—
|
|
(15
|
)
|
||||||||
|
Restricted cash
|
1
|
|
(3
|
)
|
823
|
|
—
|
|
||||||||
|
Distributions from affiliates
|
274
|
|
255
|
|
15
|
|
150
|
|
||||||||
|
Other
|
—
|
|
—
|
|
—
|
|
—
|
|
||||||||
|
Net cash provided by investing activities
|
275
|
|
252
|
|
838
|
|
135
|
|
||||||||
|
CASH FLOWS FROM FINANCING ACTIVITIES:
|
||||||||||||||||
|
Payment to unsecured creditors
|
—
|
|
(200
|
)
|
—
|
|
—
|
|
||||||||
|
Proceeds from long-term borrowings
|
—
|
|
—
|
|
400
|
|
—
|
|
||||||||
|
Repayments of borrowings
|
—
|
|
—
|
|
(1,397
|
)
|
(1
|
)
|
||||||||
|
Borrowing from Gas Holdco and Coal Holdco
|
—
|
|
—
|
|
22
|
|
—
|
|
||||||||
|
Affiliate transactions
|
—
|
|
—
|
|
468
|
|
(26
|
)
|
||||||||
|
Dividends to affiliates
|
(30
|
)
|
(6
|
)
|
—
|
|
—
|
|
||||||||
|
Debt financing costs
|
—
|
|
—
|
|
—
|
|
(5
|
)
|
||||||||
|
Net cash used by financing activities
|
(30
|
)
|
(206
|
)
|
(507
|
)
|
(32
|
)
|
||||||||
|
Net increase in cash and cash equivalents
|
236
|
|
41
|
|
29
|
|
—
|
|
||||||||
|
Cash and cash equivalents, beginning of period
|
70
|
|
29
|
|
—
|
|
—
|
|
||||||||
|
Cash and cash equivalents, end of period
|
$
|
306
|
|
$
|
70
|
|
$
|
29
|
|
$
|
—
|
|
||||
|
SUPPLEMENTAL CASH FLOW INFORMATION
|
||||||||||||||||
|
Taxes paid (net of refunds)
|
$
|
—
|
|
$
|
(7
|
)
|
$
|
(2
|
)
|
$
|
4
|
|
||||
|
SUPPLEMENTAL NON-CASH FLOW INFORMATION
|
||||||||||||||||
|
Undertaking agreement, receivable affiliate
|
$
|
—
|
|
$
|
—
|
|
$
|
(1,250
|
)
|
$
|
—
|
|
||||
|
Other affiliate activity
|
—
|
|
—
|
|
(34
|
)
|
(37
|
)
|
||||||||
|
DMG Acquisition
|
—
|
|
466
|
|
—
|
|
—
|
|
||||||||
|
Extinguishment of liabilities subject to compromise
|
—
|
|
4,240
|
|
—
|
|
—
|
|
||||||||
|
Issuance of new common stock
|
2,596
|
|
—
|
|
—
|
|
—
|
|
||||||||
|
Issuance of warrants
|
28
|
|
—
|
|
—
|
|
—
|
|
||||||||
See Notes to Registrant’s Financial Statements and Dynegy Inc.’s Consolidated Financial Statements.
F-73
Schedule I
DYNEGY INC.
NOTES TO REGISTRANT’S FINANCIAL STATEMENTS
These parent company financial statements have been prepared in accordance with Rule 12-04, Schedule I of Regulation S-X, as the restricted net assets of Dynegy Inc.’s subsidiaries exceeds
25 percent
of the consolidated net assets of Dynegy Inc. These statements should be read in conjunction with the Consolidated Statements and notes thereto of Dynegy Inc. (“Dynegy”).
We are a holding company and conduct substantially all of our business operations through our subsidiaries. On September 30, 2012, Dynegy Holdings, LLC merged with and into Dynegy, with Dynegy being the surviving legal entity.
For additional information, please read
Note 1—Organization and Operations
of our consolidated financial statements and
Note 3—Emergence from Bankruptcy and Fresh-Start Accounting
of our consolidated financial statements.
For a discussion of our commitments and contingencies, please read
Note 22—Commitments and Contingencies
of our consolidated financial statements.
Please read
Note 18—Debt
of our consolidated financial statements and
Note 22—Commitments and Contingencies
— Indemnifications and Guarantees of our consolidated financial statements for a discussion of our guarantees.
For a discussion of our related party transactions, please read
Note 19—Related Party Transactions
of our consolidated financial statements.
F-74
Schedule II
DYNEGY INC.
VALUATION AND QUALIFYING ACCOUNTS
Years Ended
December 31, 2012, 2011 and 2010
|
(amounts in millions)
|
Balance at
Beginning of
Period
|
Charged to
Costs and
Expenses
|
Charged to
Other
Accounts
|
Additions/
(Deductions)
|
Balance at End
of Period
|
|||||||||||||||
|
October 2, 2012 through December 31, 2012 (Successor)
|
||||||||||||||||||||
|
Allowance for doubtful accounts
|
$
|
—
|
|
$
|
—
|
|
$
|
—
|
|
$
|
—
|
|
$
|
—
|
|
|||||
|
Deferred tax asset valuation allowance
|
1,072
|
|
49
|
|
—
|
|
—
|
|
1,121
|
|
||||||||||
|
January 1 through October 1, 2012 (Predecessor)
|
|
|
|
|
|
|||||||||||||||
|
Allowance for doubtful accounts (1)
|
$
|
12
|
|
$
|
—
|
|
$
|
—
|
|
$
|
(12
|
)
|
$
|
—
|
|
|||||
|
Deferred tax asset valuation allowance
|
673
|
|
399
|
|
—
|
|
—
|
|
1,072
|
|
||||||||||
|
2011
|
|
|
|
|
|
|||||||||||||||
|
Allowance for doubtful accounts
|
$
|
13
|
|
$
|
—
|
|
$
|
—
|
|
$
|
(1
|
)
|
$
|
12
|
|
|||||
|
Deferred tax asset valuation allowance
|
21
|
|
176
|
|
476
|
|
—
|
|
673
|
|
||||||||||
|
2010
|
|
|
|
|
|
|||||||||||||||
|
Allowance for doubtful accounts (2)
|
$
|
20
|
|
$
|
—
|
|
$
|
—
|
|
$
|
(7
|
)
|
$
|
13
|
|
|||||
|
Deferred tax asset valuation allowance
|
34
|
|
(1
|
)
|
(12
|
)
|
—
|
|
21
|
|
||||||||||
________________________________________
|
(1)
|
The allowance for doubtful accounts was decreased to
zero
in connection with the application of fresh-start accounting on the Plan effective date.
|
|
(2)
|
The allowance for doubtful accounts decreased by
$7 million
due to the sale of a receivable from a counterparty in bankruptcy and the settlement of a disputed balance in 2010.
|
F-75
TABLE OF CONTENTS
Part INote 1 Organization and OperationsItem 1. BusinessNote 6 Dispositions and Discontinued OperationsNote 3 Emergence From Bankruptcy and Fresh-start AccountingNote 22 Commitments and ContingenciesItem 1A. Risk FactorsItem 1B. Unresolved Staff CommentsItem 2. PropertiesNote 18 DebtItem 3. Legal ProceedingsItem 4. Mine Safety DisclosuresItem 5. Market For Registrant S Common Equity, Related Stockholder Matters and Issuer Purchases Of Equity SecuritiesItem 6. Selected Financial DataNote 4 Merger and AcquisitionNote 17 Liabilities Subject To CompromiseItem 7. Management S Discussion and Analysis Of Financial Condition and Results Of OperationsNote 27 Subsequent EventsNote 24 Employee Compensation, Savings and Pension PlansNote 20 Income TaxesNote 7 Impairment and Restructuring ChargesNote 16 Intangible Assets and LiabilitiesNote 5 Condensed Combined Financial Statements Of The Debtor EntitiesNote 23 Capital StockNote 15 Variable Interest EntitiesNote 19 Related Party TransactionsNote 14 Unconsolidated InvestmentsNote 2 Summary Of Significant Accounting PoliciesNote 8 Risk Management Activities, Derivatives and Financial InstrumentsItem 7A. Quantitative and Qualitative Disclosures About Market RiskItem 8. Financial Statements and Supplementary DataItem 9. Changes in and Disagreements with Accountants on Accounting and Financial DisclosureItem 9A. Controls and ProceduresItem 9B. Other InformationPart IIIItem 10. Directors, Executive Officers and Corporate GovernanceItem 11. Executive CompensationItem 12. Security Ownership Of Certain Beneficial Owners and Management and Related Stockholder MattersItem 13. Certain Relationships and Related Transactions, and Director IndependenceItem 14. Principal Accountant Fees and ServicesPart IVItem 15. Exhibits and Financial Statement SchedulesItem 1 Financial StatementsNote 9 Fair Value MeasurementsNote 10 Accumulated Other Comprehensive IncomeNote 11 Cash Flow InformationNote 12 InventoryNote 13 Property, Plant and EquipmentNote 21 Loss Per ShareNote 25 Segment InformationNote 26 Quarterly Financial Information (unaudited)Note 1 Background and Basis Of PresentationNote 2 Commitments and ContingenciesNote 3 Related Party Transactions