ELECTRONIC ARTS INC.
10-Ks and 10-Qs
|
|
|
|
|
|
|
|
|
|
|
|
|
|
|
|
|
|
|
|
|
|
|
|
|
|
|
|
|
|
|
|
|
|
|
|
|
|
|
|
|
|
|
|
|
|
|
|
|
|
|
|
|
|
|
|
|
|
|
|
|
|
UNITED STATES SECURITIES AND EXCHANGE COMMISSION
Washington, D.C. 20549
Form 10-K
|
|
þ
|
ANNUAL REPORT PURSUANT TO SECTION 13 OR 15(d) OF THE SECURITIES EXCHANGE ACT OF 1934
|
For the fiscal year ended March 31, 2015
OR
|
|
¨
|
TRANSITION REPORT PURSUANT TO SECTION 13 OR 15(d) OF THE SECURITIES EXCHANGE ACT OF 1934
|
For the transition period from
to
Commission File No. 000-17948
ELECTRONIC ARTS INC.
(Exact name of registrant as specified in its charter)
|
Delaware
|
|
94-2838567
|
|
(State or other jurisdiction of
incorporation or organization)
|
|
(I.R.S. Employer
Identification No.)
|
|
209 Redwood Shores Parkway
|
|
94065
|
|
Redwood City, California
|
|
(Zip Code)
|
|
(Address of principal executive offices)
|
|
|
Registrant’s telephone number, including area code:
(650) 628-1500
Securities registered pursuant to Section 12(b) of the Act:
|
Title of Each Class
|
|
Name of Each Exchange on Which Registered
|
|
Common Stock, $0.01 par value
|
|
NASDAQ Global Select Market
|
Securities registered pursuant to Section 12(g) of the Act:
None
Indicate by check mark if the registrant is a well-known seasoned issuer, as defined in Rule 405 of the Securities Act. Yes
þ
No
¨
Indicate by check mark if the registrant is not required to file reports pursuant to Section 13 or Section 15(d) of the Act. Yes
¨
No
þ
Indicate by check mark whether the registrant (1) has filed all reports required to be filed by Section 13 or 15(d) of the Securities Exchange Act of 1934 during the preceding 12 months (or for such shorter period that the registrant was required to file such reports), and (2) has been subject to such filing requirements for the past 90 days. Yes
þ
No
¨
Indicate by check mark whether the registrant has submitted electronically and posted on its corporate Web site, if any, every Interactive Data File required to be submitted and posted pursuant to Rule 405 of Regulation S-T (§ 232.405 of this chapter) during the preceding 12 months (or for such shorter period that the registrant was required to submit and post such files). Yes
þ
No
¨
Indicate by check mark if disclosure of delinquent filers pursuant to Item 405 of Regulation S-K (§ 229.405 of this chapter) is not contained herein, and will not be contained, to the best of registrant’s knowledge, in definitive proxy or information statements incorporated by reference in Part III of this Form 10-K or any amendment to this Form 10-K.
þ
Indicate by check mark whether the registrant is a large accelerated filer, an accelerated filer, a non-accelerated filer, or a smaller reporting company. See the definitions of “large accelerated filer,” “accelerated filer” and “smaller reporting company” in Rule 12b-2 of the Exchange Act.
|
Large accelerated filer
þ
|
Accelerated filer
¨
|
Non-accelerated filer
¨
|
Smaller reporting company
¨
|
|||
|
(Do not check if a smaller reporting company)
|
||||||
Indicate by check mark whether the registrant is a shell company (as defined in Rule 12b-2 of the Exchange Act). Yes
¨
No
þ
The aggregate market value of the registrant’s common stock, $0.01 par value, held by non-affiliates of the registrant as of September 26, 2014, the last business day of our second fiscal quarter, was
$10,798 million
.
As of
May 18, 2015
, there were
314,608,354
shares of the registrant’s common stock, $0.01 par value, outstanding.
Documents Incorporated by Reference
Portions of the registrant’s definitive proxy statement for its 2015 Annual Meeting of Stockholders are incorporated by reference into Part III hereof.
ELECTRONIC ARTS INC.
2015 FORM 10-K ANNUAL REPORT
Table of Contents
|
|
|
Page
|
|
PART I
|
||
|
Item 1
|
||
|
Item 1A
|
||
|
Item 1B
|
||
|
Item 2
|
||
|
Item 3
|
||
|
Item 4
|
||
|
PART II
|
||
|
Item 5
|
||
|
Item 6
|
||
|
Item 7
|
||
|
Item 7A
|
||
|
Item 8
|
||
|
Item 9
|
||
|
Item 9A
|
||
|
Item 9B
|
||
|
PART III
|
||
|
Item 10
|
||
|
Item 11
|
||
|
Item 12
|
||
|
Item 13
|
||
|
Item 14
|
||
|
PART IV
|
||
|
Item 15
|
||
2
CAUTIONARY NOTE ABOUT FORWARD-LOOKING STATEMENTS
This Report contains forward-looking statements within the meaning of the Private Securities Litigation Reform Act of 1995. All statements, other than statements of historical fact, made in this Report are forward looking. Examples of forward-looking statements include statements related to industry prospects, our future economic performance including anticipated revenues and expenditures, results of operations or financial position, and other financial items, our business plans and objectives, including our intended product releases, and may include certain assumptions that underlie the forward-looking statements. We use words such as “anticipate,” “believe,” “expect,” “intend,” “estimate” (and the negative of any of these terms), “future” and similar expressions to help identify forward-looking statements. These forward-looking statements are subject to business and economic risk and reflect management’s current expectations, and involve subjects that are inherently uncertain and difficult to predict. Our actual results could differ materially from those in the forward-looking statements. We will not necessarily update information if any forward-looking statement later turns out to be inaccurate. Risks and uncertainties that may affect our future results include, but are not limited to, those discussed under the heading “Risk Factors,” beginning on page 11.
Item 1:
Business
Overview
We develop, market, publish and distribute game software content and services that can be played by consumers on a variety of platforms, including game consoles (such as the PlayStation 3 and PlayStation 4 from Sony, and Xbox 360 and Xbox One from Microsoft), PCs, mobile phones and tablets.
Our Strategy
We have three core strategies:
•
Players First
•
Commitment to Digital
•
One EA
Players First
Players are the foundation of our success, and we are committed to thinking about players first in everything we do. Our goal is to build deep, on-going relationships with our players. We aim to build these relationships by creating amazing games and services that deliver long-lasting fun and enduring value.
Our games and services are based on a portfolio of intellectual property that includes established brands such as Madden NFL, FIFA, Battlefield, Dragon Age, Sims and Need for Speed. In calendar year 2014, we were the top publisher on both Xbox One and PlayStation 4. We achieved this result by delivering award-winning games to our players, including Dragon Age: Inquisition which was named “game of the year” by numerous media outlets, including IGN, Game Informer and the Associated Press. Meanwhile, during fiscal year 2015, we averaged over 165 million monthly active users (“MAUs”) on our mobile titles. Information regarding our MAUs is provided under Item 7: Management’s Discussion and Analysis of Financial Condition and Results of Operation.
Commitment to Digital
Players increasingly are buying and playing games digitally rather than purchasing disc-based games from retailers. In addition, players are engaging with those games for longer periods of time, as they purchase additional content and services that we provide digitally. This digital transformation is creating new opportunities in platforms, content models and modalities of play. For example, we offer digitally delivered expansion packs for our Battlefield and Sims franchises. Similarly, the Ultimate Team feature in our FIFA, Madden NFL, NHL and NBA games has extended the life of those games by engaging players over longer periods of time.
We are investing in a digital platform, a technology foundation to enable us to deliver content and services for franchises like FIFA and Battlefield while building player relationships that can last for years instead of for days or weeks. That same foundation also enables new player-centric ways to discover and try new experiences, such as EA Access and several offerings associated with our Origin service, including our Great Game Guarantee and On the House programs. We believe that our
3
digital revenue, which is generally higher-margin relative to packaged goods sales revenue, will continue to increase during fiscal year 2016 relative to packaged goods revenue and in absolute terms.
Our players can access our digitally-delivered games and services through several mechanisms. Console games, additional content and enhanced online services can be purchased directly through Sony’s PlayStation Network and Microsoft’s Xbox LIVE Marketplace. Our PC games and additional content can be downloaded directly through our Origin online platform, as well as through third-party online download stores. Our mobile, tablet and PC free-to-download games and additional content are available through wireless and online delivery, and our large scale, massively multi-player online service is available on a free-to-download and subscription basis.
One EA
The pursuit of our goals requires that we operate as one team that is faster, more focused and constantly evolving, and we are undertaking a cultural shift in our operations and development process in order to become a more flexible organization. We are changing how we develop our games, engaging players through alphas, betas and other programs to seek out more feedback earlier in the game development process. We are also changing the makeup and skill set of our workforce, and combining the art of game-making with the science of managing dynamic live services. These changes have enabled us to continue to increase our operational speed while improving our fiscal discipline.
Our Brands and Platforms
In our games, we utilize established brands that we either wholly own (such as Battlefield, Dragon Age, The Sims and Plants v. Zombies) or license from others (e.g., FIFA, Madden NFL and Star Wars). Leveraging these brands across a diverse range of genres (from casual to role-playing to sports simulation) enables us to build on-going relationships with a wide audience across a broad range of platforms.
We have the ability to deliver our products and services to our consumers across multiple platforms, including consoles, mobile phones, tablets and PCs (both through downloads via our Origin portal and through free-to-download games that can be played directly over the Internet). We believe this flexibility is critical to maintaining and growing our overall consumer base, which continues to evolve in response to the introduction of new platforms and platform business models. In particular, we are expanding the use of popular brands historically associated with console platforms, such as FIFA and Madden NFL, to mobile platforms.
New gaming platforms are expected to continue to emerge in the future. We intend to evaluate new platform publishing opportunities on a case-by-case basis as they emerge.
Global Operations
We were initially incorporated in California in 1982. In September 1991, we were reincorporated under the laws of Delaware. Our principal executive offices are located at 209 Redwood Shores Parkway, Redwood City, California 94065 and our telephone number is (650) 628-1500.
We operate development studios in North America, Europe, Asia and Australia. We also engage third parties to assist with the development of our games and services at their own development and production studios. Internationally, we conduct business through our international headquarters in Switzerland and have wholly-owned subsidiaries throughout the world, including offices in Europe, Australia, Asia and Latin America.
Our North America net revenue was $1,956 million in fiscal year 2015, as compared to $1,510 million in fiscal year 2014 and $1,701 million in fiscal year 2013. International net revenue (revenue derived from countries other than Canada and the United States) increased by 24 percent to $2,559 million, or 57 percent of total net revenue in fiscal year 2015, as compared to $2,065 million, or 58 percent of total net revenue in fiscal year 2014 and as compared to $2,096 million, or 55 percent of total net revenue in fiscal year 2013. We attribute net revenue from external customers to individual countries based on the location of the legal entity that sells the products and/or services. Note that revenue attributed to the legal entity that makes the sale is often not the country where the consumer resides. For example, revenue generated by our Swiss legal entities includes digital revenue from consumers who reside outside of Switzerland, including consumers who reside outside of Europe. Revenue generated by our Swiss legal entities during
fiscal years 2015, 2014, and 2013
represents
$1,462 million
,
$1,171 million
and
$885 million
or
32 percent
,
33 percent
and
23 percent
of our total net revenue, respectively. Revenue generated in the United States represents over
99 percent
of our total North America net revenue. There were no other countries with net revenue greater than
10 percent
of total net revenue. The amounts of net revenue and long-lived assets attributable to each of our
4
geographic regions for each of the last three fiscal years are set forth in Note 18 of the Notes to Consolidated Financial Statements included in Item 8 of this report.
In fiscal year 2015, revenue from sales of
FIFA 15
represented approximately 15 percent of our total net revenue. In fiscal year 2014, revenue from sales of
FIFA 14
represented approximately 15 percent of our total net revenue. In fiscal year 2013, revenue from sales of
FIFA 13
represented approximately 17 percent of our total net revenue.
For the fiscal years ended March 31, 2015, 2014 and 2013, research and development expenses were $1,094 million, $1,125 million and $1,153 million, respectively.
Information regarding financial data is set forth in Part II, Item 6 of this Form 10-K under the heading “Selected Financial Data,” and information regarding certain risks attendant to our foreign operations is set forth in Part II, Item 7 of this Form 10-K under the heading “Financial Results” and “Trends in Our Business”.
Our Operating Structure
Our studios and development teams are organized around three divisions: EA Studios, EA Mobile, and Maxis. Each division operates globally with support from our Global Publishing and Marketing organizations, as well as our Digital Platform team.
EA Studios
EA Studios is home to the largest number of our studios and development teams and is responsible for developing games and related content and services across an expansive range of game categories. Our franchises include FIFA, Madden NFL, Need for Speed, Battlefield, Mass Effect, Star Wars and Dragon Age. Our largest studios within the EA Studios organization are located in the United States, Canada and Sweden.
The diverse studios within the EA Studios organization have the goal of operating as one collaborative organization through the use of common technologies and shared development frameworks. We also contract with external game developers for development services or to establish publishing and distribution relationships, such as the one we have with Respawn Entertainment for Titanfall.
EA Mobile
Our EA Mobile organization develops and publishes interactive games for play on mobile phones and tablets, as well as certain casual games for the PC. The Mobile organization’s brand portfolio includes wholly owned properties such as Plants vs. Zombies, Real Racing and Bejeweled, as well licensed intellectual properties such as Tetris and The Simpsons. The EA Mobile organization also manages our Pogo online service, through which we offer casual games such as card, puzzle and word games on www.pogo.com, as well as on other platforms. Pogo generates revenue through paid subscriptions, Internet-based advertising and sales of digital content. The EA Mobile organization has studios located in the United States, Canada, China, Australia, Finland and India. Certain mobile games, such as those related to our EA SPORTS franchises, are developed primarily by the EA Studios organization.
Maxis
Our Maxis organization focuses on creating compelling games and related content and services that engage player creativity. The Maxis portfolio includes the wholly-owned franchises The Sims and SimCity. Maxis games are primarily developed at studios in the United States.
Global Publishing and Marketing
Our Global Publishing and Marketing organizations are responsible for the distribution, sales, and marketing of our products and services, including operations, and manufacturing functions, as well as our global media advertising sales business and customer support teams. Mobile game publishing is overseen by our EA Mobile organization.
Digital Platform
Our Digital Platform team is responsible for creating and maintaining a technology foundation that enhances EA’s ability to deliver gameplay services and facilitate transactions across platforms for all of our games.
5
Competition
We compete with other video game companies and with providers of different forms of entertainment, such as motion pictures, television, social networking, online casual entertainment and music, for the leisure time and discretionary spending of consumers. Our competitors vary in size from very small companies with limited resources to very large, diversified corporations with global operations and greater financial resources than ours. We also face competition from other video game companies and large media companies to obtain license agreements for the right to use some of the intellectual property included in our products. Primary competitive factors important to us include game quality and ease of use, compatibility of products with certain platforms, online capability, price, marketing, and quality of customer service.
Competition in Games for Console Devices and PCs
We compete directly with Sony and Microsoft, each of which develops and publishes software for its respective console platform. We also compete with numerous companies which, like us, develop and publish video games that operate on these consoles and on PCs. These competitors include Activision Blizzard, Take-Two Interactive, and Ubisoft. Diversified media companies such as Disney and Warner Bros. also are involved in software game development and publishing.
Competition in Games for Mobile Devices
The marketplace for mobile games, particularly free-to-download mobile games, is characterized by frequent product introductions, rapidly emerging new mobile platforms, new technologies, new mobile application storefronts and thousands of game offerings. As the penetration of mobile devices that feature fully-functional browsers and additional gaming capabilities continues to deepen, the demand for applications continues to increase and there are more mobile application storefronts through which developers can offer products. Mobile game applications currently are offered by a wide range of competitors, including Supercell, KING, GungHo Online and hundreds of smaller companies. We expect new competitors to enter the market and existing competitors to allocate more resources to develop and promote competing applications by, among other things, establishing a presence in geographic regions in which they did not operate previously. As a result, we expect competition in the mobile entertainment market to continue to intensify.
Competition in PC Free-to-Download Online Gaming Services
The PC free-to-download games market is characterized by frequent product introductions. We expect new competitors to enter the market and existing competitors to allocate more resources toward developing PC free-to-download online game services. As a result, we expect competition in this market to intensify. Our competitors in this market include major media companies, traditional video game publishing companies, and companies that specialize in online games, such as Riot, and companies that produce online games, in addition to operating online gaming platforms, such as Tencent, Nexon, Valve and Activision Blizzard.
Intellectual Property
Like other entertainment companies, our business is significantly based on the creation, acquisition, exploitation and protection of intellectual property. This intellectual property includes audiovisual and other content, software code, patented technology, and other technology and trade secrets.
We develop some of our products and services from wholly-owned intellectual properties that are created in our studios or obtained through acquisition. We also utilize intellectual property obtained through licenses from third-party rights owners, such as sports leagues and players’ associations, film and music companies, performing talent, and other content and technology companies. These agreements typically limit our use of the licensed rights in products for specific time periods. In addition, our products that play on game consoles, mobile devices, or other proprietary platforms may include technology that is owned by the device manufacturer or platform operator and is licensed non-exclusively to us for use. While we may have renewal rights for some licenses, the development of many of our products is dependent on our ability to continue to obtain the intellectual property rights from the owners of these rights on reasonable terms.
We actively engage in enforcement and other activities to protect our intellectual property. We typically own the copyright to our software code and content, as well as the brand or title name trademark under which our products are marketed. We register copyrights and trademarks in the United States and other countries as appropriate.
6
We typically distribute our products using copy protection technology or other technological protection measures to prevent unauthorized copying, access and exploitation of our products and services. In addition, console manufacturers typically incorporate technological protections and other security measures in their consoles in an effort to prevent the use of unlicensed products and other exploitation. We actively engage in enforcement and other activities to protect against unauthorized copying and piracy, including monitoring online channels for distribution of pirated copies, and participating in various industry-wide enforcement initiatives, education programs and legislative activity around the world. In addition, we actively engage in activities designed to limit the impact of abuse of our digital products and services, including monitoring our games for evidence of exploitation and re-balancing our game environments in the event that such abuse is discovered.
Significant Relationships
Channel Partners
Sony
. Under the terms of agreements we have entered into with Sony Computer Entertainment Inc. and its affiliates, we are authorized to develop and distribute disc-based and digitally-delivered software products and services compatible with PlayStation 3 and 4. As of the date of this filing, we have not entered into a licensed publisher agreement with Sony for PlayStation 4, and the parties currently operate under the terms of existing agreements subject to a new pricing structure with respect to PlayStation 4.
Microsoft
. Under the terms of agreements we have entered into with Microsoft Corporation and its affiliates, we are authorized to develop and distribute disc-based and digitally-delivered software products and services compatible with Xbox 360 and Xbox One.
Under the agreements with Sony and Microsoft, we are provided with the non-exclusive right to use, for a fixed term and in a designated territory, technology that is owned or licensed by the console manufacturer in order to publish our games on such platform. Our transactions for disc-based products are made pursuant to individual purchase orders, which are accepted on a case-by case basis by Sony or Microsoft (or their designated replicators), as the case may be. For packaged goods products, we pay the console manufacturers a per-unit royalty for each unit manufactured. With respect to digitally-delivered products, other online content and services sold by the console manufacturers, the console manufacturers pay us either a wholesale price or a percentage royalty on the revenue they derive from their sales. Many key commercial terms of our relationships with Sony and Microsoft - such as manufacturing terms, delivery times, platform policies and approval conditions - are determined unilaterally, and are subject to change by the console manufacturers.
The platform license agreements also require us to indemnify the console manufacturers with respect to all loss, liability and expense resulting from any claim against the console manufacturer regarding our games and services, including any claims for patent, copyright or trademark infringement brought against the console manufacturer. Each platform license may be terminated by the console manufacturer if a breach or default by us is not cured after we receive written notice from the console manufacturer, or if we become insolvent. The console manufacturers are not obligated to enter into platform license agreements with us for any future consoles, products or services.
Apple, Google and Other App Stores.
We have agreements to distribute our mobile applications through distribution partners worldwide, including Apple and Google. Consumers download our applications for their mobile devices from third party-application storefronts. The distributor charges the consumers a one-time fee if there is a cost to download the application. If the application is a “free-to-download” application, the distributor may still charge the consumer for additional content that is purchased by the consumer within the application. Our distribution agreements establish the fees to be retained by the distributor for distributing our applications and additional content. These arrangements are typically terminable on short notice. The agreements generally do not obligate the distributors to market or distribute any of our applications.
Publishing Partners in Asia.
We have entered into agreements whereby we partner with certain companies, including Tencent Holdings Limited and Nexon Co., Ltd. or their respective affiliates, pursuant to which these companies publish our mobile and PC free-to-download games in certain Asian territories, including China and Korea. Our players download games from the publishers’ platforms, and are charged for additional content purchased within our game environment. The agreements generally establish the amounts that are retained by the publishers, and the amounts that are passed through to us.
7
Retailers
In North America and Europe, our largest markets, we sell packaged goods products to retailers, including mass market retailers (such as Walmart), electronics specialty stores (such as Best Buy) or game software specialty stores (such as GameStop).
Our direct sales to GameStop Corp. represented approximately 11 percent, 13 percent and 13 percent of total net revenue in fiscal years 2015, 2014, and 2013, respectively. In fiscal year 2015, our direct sales to Microsoft represented approximately 10 percent of total net revenue. Our direct sales to Microsoft did not exceed 10 percent of net revenue in fiscal years 2014 and 2013. We sell our products to GameStop Corp. pursuant to numerous and frequent individual purchase orders, which contain delivery and pricing terms. There are no minimum sales or purchase commitments between us and GameStop.
As our business becomes increasingly digital, more of our products and services are purchased from a digital retailer and delivered via a network connection. Our digital retail outlets include Origin (our direct-to-consumer platform), mobile application storefronts, the digital marketplaces operated by Sony for PlayStation 3 and PlayStation 4 and Microsoft for Xbox 360 and Xbox One, and various third party retailers offering digital game downloads.
Seasonality
Our business is highly seasonal with the highest levels of consumer demand and a significant percentage of our sales occurring in the holiday season quarter ending in December and a seasonal low in sales volume in the quarter ending in June. While our sales generally follow this seasonal trend, there can be no assurance that this trend will continue. In addition, we defer the recognition of a significant amount of net revenue related to our online-enabled games over an extended period of time. As a result, the quarter in which we generate the highest sales volume may be different from the quarter in which we recognize the highest amount of net revenue. Our results also can vary based on a number of factors, including title release dates, cancellation or delay of a key event or sports season to which our product release schedule is tied, consumer demand for our products, shipment schedules, content offerings and our revenue recognition policies.
Government Regulation
We are subject to a number of foreign and domestic laws and regulations that affect companies conducting business on the Internet. In addition, laws and regulations relating to user privacy, data collection and retention, content, advertising and information security have been adopted or are being considered for adoption by many countries throughout the world.
Employees
As of March 31, 2015, we had approximately 8,400 regular, full-time employees, over 4,900 of whom were outside the United States. We believe that our ability to attract and retain qualified employees is a critical factor in the successful development of our products and that our future success will depend, in large measure, on our ability to continue to attract and retain qualified employees. Approximately 7 percent of our employees, all of whom work for DICE, our Swedish development studio, are represented by a union.
Investor Information
Our annual reports on Form 10-K, quarterly reports on Form 10-Q and current reports on Form 8-K, and any amendments to those reports filed pursuant to Section 13(a) or 15(d) of the Securities Exchange Act, as amended, are available free of charge on the Investor Relations section of our website at http://ir.ea.com as soon as reasonably practicable after they are electronically filed with or furnished to the Securities and Exchange Commission (“SEC”). Except as expressly set forth in this Form 10-K annual report, the contents of our website are not incorporated into, or otherwise to be regarded as part of this report.
8
Executive Officers
The following table sets forth information regarding our executive officers as of
May 21, 2015
:
|
Name
|
Age
|
Position
|
||
|
Andrew Wilson
|
40
|
Chief Executive Officer
|
||
|
Blake Jorgensen
|
55
|
Executive Vice President, Chief Financial Officer
|
||
|
Peter R. Moore
|
60
|
Chief Operating Officer
|
||
|
Patrick Söderlund
|
41
|
Executive Vice President, EA Studios
|
||
|
Kenneth Moss
|
49
|
Chief Technology Officer
|
||
|
Christopher Bruzzo
|
45
|
Chief Marketing Officer
|
||
|
Joel Linzner
|
63
|
Executive Vice President, Business and Legal Affairs
|
||
|
Gabrielle Toledano
|
48
|
Executive Vice President, Chief Talent Officer
|
||
|
Lucy Bradshaw
|
52
|
Senior Vice President, Maxis
|
||
|
Kenneth A. Barker
|
48
|
Senior Vice President, Chief Accounting Officer
|
||
|
Jacob J. Schatz
|
46
|
Senior Vice President, General Counsel and Corporate Secretary
|
||
Mr. Wilson
has served as EA’s Chief Executive Officer and as a director of EA since September 2013. Prior to his appointment as our Chief Executive Officer, Mr. Wilson held several positions within the Company since joining EA in May 2000, including Executive Vice President, EA SPORTS from August 2011 to September 2013, Senior Vice President, EA SPORTS from March 2010 to August 2011 and Senior Vice President Online from July 2009 to September 2010.
Mr. Jorgensen
has served as Executive Vice President, Chief Financial Officer since September 2012. Prior to joining EA, he served as Executive Vice President, Chief Financial Officer of Levi Strauss & Co. from July 2009 to August 2012. From June 2007 to June 2009, Mr. Jorgensen served as Executive Vice President, Chief Financial Officer of Yahoo! Inc. Mr. Jorgensen earned his M.B.A. from Harvard Business School and his Economics degree from Stanford University.
Mr. Moore
has served as Chief Operating Officer since August 2011. Prior to that time, he served as President, EA SPORTS, from September 2007. From January 2003 until he joined EA in 2007, Mr. Moore was with Microsoft where he served as head of Xbox marketing and was later named as Corporate Vice President, Interactive Entertainment Business, Entertainment and Devices Division, a position in which he led both the Xbox and Games for Windows businesses. Mr. Moore holds a bachelor's degree from Keele University, United Kingdom, and a Master's degree from California State University, Long Beach.
Mr. Söderlund
has served as Executive Vice President, EA Studios since September 2013. Prior to that time, he served as Executive Vice President, EA Games Label from August 2011. From December 2010 to July 2011, he served as Executive Vice President, Group General Manager - FPS/Driving. Prior to that, Mr. Söderlund held the position of Senior Vice President, EA Games Europe from September 2007 to December 2010. Mr. Söderlund joined EA in October 2006 when EA purchased DICE studios where he was the Chief Executive Officer.
Mr. Moss
has served as Chief Technology Officer since July 2014. Prior to joining EA, he served as Vice President of Market Places Technology, Science and Data at eBay Inc. since November 2011. Prior to joining eBay, he co-founded CrowdEye, Inc. in September 2008 and served as its Chief Executive Officer. Mr. Moss graduated from Princeton University with a B.A. in Molecular Biology.
Mr. Bruzzo
has served as Chief Marketing Officer since September 2014. Prior to joining EA, he served as Senior Vice President at Starbucks Corporation June 2011 to November 2013 and Vice President from June 2008 to June 2011. Mr. Bruzzo is currently a director of Blue Nile, Inc. Mr. Bruzzo graduated from Whitworth University with a B.A. in Political Studies.
Mr. Linzner
has served as Executive Vice President, Business and Legal Affairs since March 2005. Prior to joining EA in July 1999, Mr. Linzner served as outside litigation counsel to EA and several other companies in the video game industry. Mr. Linzner earned his J.D. from Boalt Hall at the University of California, Berkeley, after graduating from Brandeis University. He is a member of the Bar of the State of California and is admitted to practice in the United States Supreme Court, the Ninth Circuit Court of Appeals and several United States District Courts.
9
Ms. Toledano
,
our Chief Talent Officer, was hired as Senior Vice President, Human Resources and Facilities, in February 2006. Ms. Toledano was promoted to Executive Vice President in April 2007, continuing to lead the same functions. Ms. Toledano also serves on the Board of Directors of TalentSky Inc. and Visier, Inc., privately-held companies. Ms. Toledano earned both her undergraduate degree in Humanities and her graduate degree in Education from Stanford University.
Ms. Bradshaw
has served as Senior Vice President, EA Maxis since June 2013. Prior to that time, she held various titles within the Maxis Studio since 1997 including Senior Vice President from February 2011 to June 2013 and Vice President from January 2001 to February 2011. Ms. Bradshaw received her B.A. degree from the University of Michigan.
Mr. Barker
has served as Senior Vice President, Chief Accounting Officer since April 2006. From February 2012 to August 2012, he also served as Interim Chief Financial Officer. From June 2003 to April 2006, Mr. Barker held the position of Vice President, Chief Accounting Officer. Prior to joining EA, Mr. Barker was employed at Sun Microsystems, Inc., as Vice President and Corporate Controller from October 2002 to June 2003 and Assistant Corporate Controller from April 2000 to September 2002. Prior to that, he was an audit partner at Deloitte & Touche. Mr. Barker also serves on the Board of Directors of Corsair Components, Inc. Mr. Barker graduated from the University of Notre Dame with a B.A. degree in Accounting.
Mr. Schatz
has served as Senior Vice President, General Counsel and Corporate Secretary since June 2014. Mr. Schatz joined EA in 1999 and prior to his current role, he served as Deputy General Counsel and as Vice President since 2006. Mr. Schatz earned his J.D. from Georgetown University Law Center, and received his B.A. in Government from Pomona College. Mr. Schatz is a member of the Bar of the State of California and is admitted to practice in the United States Supreme Court, the Ninth Circuit Court of Appeals and several United States District Courts.
10
Our business is subject to many risks and uncertainties, which may affect our future financial performance. If any of the events or circumstances described below occurs, our business or financial performance could be harmed, our actual results could differ materially from our expectations and the market value of our stock could decline. The risks and uncertainties discussed below are not the only ones we face. There may be additional risks and uncertainties not currently known to us or that we currently do not believe could be material that may harm our business or financial performance.
Our business is intensely competitive and “hit” driven. If we do not deliver “hit” products and services, or if consumers prefer our competitors’ products or services over our own, our operating results could suffer.
Competition in our industry is intense. Many new products and services are regularly introduced in each major industry segment (console, mobile and PC free-to-download), but only a relatively small number of “hit” titles account for a significant portion of total revenue in each segment. Our competitors range from large established companies to emerging start-ups, and we expect new competitors to continue to emerge throughout the world. If our competitors develop and market more successful products or services, offer competitive products or services at lower price points or based on payment models perceived as offering a better value proposition, or if we do not continue to develop consistently high-quality and well-received products and services, our revenue, margins, and profitability will decline.
We maintain a relatively limited product portfolio in an effort to focus on developing high-quality products with the potential to become “hits”. High-quality titles, even if highly-reviewed, may not turn into “hit” products. Many “hit” products within our industry are iterations of prior hit products with large established consumer bases and significant brand recognition, which makes competing in certain product categories challenging. In addition, hit products or services of our competitors may take a larger share of consumer spending than we anticipate, which could cause our products and services to underperform relative to revenue expectations. Publishing a relatively small number of major titles each year also concentrates risk in those titles and means each major title has greater associated risk. A significant portion of our revenue has historically been derived from games and services based on a few popular franchises. For example, in fiscal year 2015, net revenue generated from the sale of products and services associated with our three largest franchises accounted for approximately
54 percent
of our net revenue. The underperformance of a single major title may have a large adverse impact on our financial results.
Our operating
results will be adversely affected
if we do not consistently meet our product development schedules or if key events or sports seasons that we tie our product release schedules to are delayed or cancelled.
Our business is highly seasonal with the highest levels of consumer demand and a significant percentage of our sales occurring in the quarter ending in December and a seasonal low in sales volume in the quarter ending in June. While our sales generally follow this seasonal trend, there can be no assurance that this trend will continue. If we miss key selling periods for products, for any reason, including product delays, product cancellations, or delayed introduction of a new platform for which we have developed products, our sales are likely to suffer significantly. Additionally, macroeconomic conditions or the occurrence of unforeseen events that negatively impact retailer or consumer buying patterns during the quarter ending in December are likely to affect us disproportionately. Our ability to meet product development schedules is affected by a number of factors both within and outside our control, including feedback from our players, the creative processes involved, the coordination of large and sometimes geographically dispersed development teams, the increasing complexity of our products and the platforms for which they are developed, and the need to fine-tune our products prior to their release. We have experienced development delays for our products in the past, which caused us to delay or cancel release dates. We also seek to release certain products in conjunction with key events, such as the beginning of a sports season or major sporting event, or the release of a related movie. If a key event or sports season to which our product release schedule is tied were to be delayed or cancelled, our sales would likely suffer disproportionately. Any failure to meet anticipated production or release schedules would likely result in a delay of revenue and/or possibly a significant shortfall in our revenue, increase our development and/or marketing expenses, harm our profitability, and cause our operating results to be materially different than anticipated.
The console segment of the entertainment software industry is cyclical, driven by the periodic introduction of new console systems. During the transition period to new console systems, our operating results may be more volatile.
New video game console systems have historically been developed and released every few years, which causes the video game software market to be cyclical as well. In periods of transition from legacy generation consoles to new generation consoles, sales of software for legacy generation console systems typically slow or decline in response to the anticipated and actual introduction of new consoles, and new generation console software sales typically stabilize after new consoles are widely-established with the consumer base.
11
Sony and Microsoft launched the PlayStation 4 and Xbox One, respectively, in November 2013. During fiscal 2015, we saw consumers purchase fewer software products for the Sony PlayStation 3 and Microsoft Xbox 360 legacy generation consoles. Consistent with other transition periods, we expect this trend to continue. This trend could also accelerate faster than anticipated and may put downward pressure on legacy generation video game software pricing, which could negatively affect our operating results. Our revenue from software sales for the PlayStation 4 and Xbox One may not offset the negative effects of this trend on our operating results. In addition, we do not control the unit volumes of consoles made available for sale or the rates at which consumers purchase these consoles. As a result, our operating results during this transitional period may be more volatile and difficult to predict.
Our business is dependent on the success and availability of video game hardware systems and devices manufactured by third parties, as well as our ability to develop commercially successful products and services for these systems and devices.
The success of our business is driven in part by the commercial success and adequate supply of video game console systems, PCs, mobile phones and tablets manufactured by third parties. Our success also depends on our ability to accurately predict which platforms will be successful in the marketplace and our ability to develop commercially successful products and services for these platforms. We must make product development decisions and commit significant resources well in advance of anticipated platform release dates and may incur significant expense to adjust our product portfolio and development efforts in response to changing consumer platform preferences. Additionally, we may enter into certain exclusive licensing arrangements that affect our ability to deliver or market products or services on certain platforms. A platform for which we are developing products and services may not succeed to the extent expected or new platforms may take market share and game software consumers away from platforms for which we have devoted significant resources. If consumer demand for the platforms for which we are developing products and services is lower than our expectations, we may be unable to fully recover the investments we have made in developing our products and services, and our financial performance will be harmed. Alternatively, a platform for which we have not devoted significant resources could be more successful than we had initially anticipated, causing us to not be able to take advantage of meaningful revenue opportunities.
Our adoption of new business models could fail to produce our desired financial returns.
We are actively seeking to monetize game properties through a variety of new business models, including from digital content delivery such as online distribution of full games and additional content, free-to-download games supported by advertising and/or micro-transactions and subscription services. Forecasting our revenues and profitability for these new business models is inherently uncertain and volatile. Our actual revenue and profit for these businesses may be significantly greater or less than our forecasts. Additionally, these new business models could fail for one or more of our titles, resulting in the loss of our investment in the development and infrastructure needed to support these new business models, as well as the opportunity cost of diverting management and financial resources away from more successful businesses.
Technology changes rapidly in our business and if we fail to anticipate or
successfully develop games for new platforms and services, adopt new distribution technologies or methods, or implement new technologies in our games, the quality, timeliness and
competitiveness of our products and services will suffer.
Rapid technology changes in our industry require us to anticipate, sometimes years in advance, which technologies we must implement and take advantage of in order to make our products and services competitive in the market. We have invested, and in the future may invest, in new business strategies, technologies, products, and services. Such endeavors may involve significant risks and uncertainties, and no assurance can be given that the technology we choose to adopt and the platforms, products and services that we pursue will be successful and will not materially adversely affect our reputation, financial condition, and operating results.
Our product development usually starts with particular platforms and distribution methods in mind, and a range of technical development goals that we hope to be able to achieve. We may not be able to achieve these goals, or our competition may be able to achieve them more quickly and effectively than we can. In either case, our products and services may be technologically inferior to our competitors’, less appealing to consumers, or both. If we cannot achieve our technology goals within the original development schedule for our products and services, then we may delay their release until these technology goals can be achieved, which may delay or reduce revenue and increase our development expenses. Alternatively, we may increase the resources employed in research and development in an attempt to accelerate our development of new technologies, either to preserve our product or service launch schedule or to keep up with our competition, which would increase our development expenses. We may also miss opportunities to adopt technology, or develop products and services for new platforms or services that become popular with consumers, which could adversely affect our revenues. It may take significant time and resources to shift our focus to such technologies or platforms, putting us at a competitive disadvantage.
12
If we are unable to maintain or acquire licenses to include intellectual property owned by others in our games, or to maintain or acquire the rights to publish or distribute games developed by others, our business may be harmed.
Many of our products and services are based on or incorporate intellectual property owned by others. For example, our EA SPORTS products include rights licensed from major sports leagues and players’ associations. We also publish and distribute products developed and owned by third-parties under license agreements with these parties. Competition for these licenses and rights is intense. If we are unable to maintain these licenses and rights or obtain additional licenses or rights with significant commercial value, our revenue, profitability and cash flows may decline significantly. Competition for these licenses may also increase the amounts that we must pay to licensors and developers, through higher minimum guarantees or royalty rates, which could significantly increase our costs and reduce our profitability.
Security breaches and cyber threats could harm our reputation and adversely affect our business.
As our digital business grows, we continue to face cyber risks and threats that seek to damage, disrupt or gain access to our networks, our products and services, and supporting infrastructure. Our business partners, including our channel partners, also are subject to these risks. Such cyber risks and threats may be difficult to detect. Any failure to prevent or mitigate security breaches or cyber risk could result in interruptions to the services we provide, degrade the user experience, cause our users to lose confidence in our products, as well as significant legal and financial exposure. This could harm our business and reputation, disrupt our relationships with partners and diminish our competitive position.
Successful exploitation of our systems can have other negative effects upon the products, services and user experience we offer. In particular, the virtual economies that we have established in many of our games are subject to abuse, exploitation and other forms of fraudulent activity that can negatively impact our business. Virtual economies involve the use of virtual currency and/or virtual assets that can be redeemed by a player within a particular game or game service. The abuse or exploitation of our virtual economies include the illegitimate generation and sale of virtual items in black markets. Our online services have been impacted by in-game exploits and the use of automated processes to generate virtual currency illegitimately in the past, which were traded in black markets. These kinds of activities and the steps that we take to address these issues may result in a loss of anticipated revenue, interfere with players’ enjoyment of a balanced game environment and cause reputational harm.
We may experience outages and disruptions of our online services that may harm our business.
We are investing and expect to continue to invest in technology, hardware and software to support our portfolio of online products and services. Launching and operating online games and services, developing related technologies and implementing online business initiatives is expensive and complex. Execution of these initiatives could result in operational failures and other issues impacting the technical stability of our products and services. In addition, having the necessary infrastructure to support our online products and services is vital to our growth and success. Our products and services could be adversely impacted by outages, disruptions and failures in our network and related infrastructure, as well as in the online platforms of key business partners who offer or support our online products and services.
Our business could be adversely affected if our consumer protection, data privacy and security practices are not adequate, or perceived as being inadequate, to prevent data breaches, or by the application of consumer protection and data privacy and security laws generally.
In the course of our business, we collect, process, store and use consumer information, including personal information, passwords and credit card information. Although we take measures to protect consumer information from unauthorized access, acquisition, disclosure and misuse, our security controls, policies and practices may not be able to prevent the improper or unauthorized access, acquisition or disclosure of such consumer information. In addition, third party vendors and business partners which in the course of our business receive access to consumer information that we collect also may not prevent data security breaches with respect to the consumer information we provide them or fully enforce our policies, contractual obligations and disclosures regarding the collection, use, storage, transfer and retention of personal data. The unauthorized access, acquisition or disclosure of consumer information could significantly harm our reputation, compel us to comply with disparate breach notification laws and otherwise subject us to proceedings by governmental entities or others and substantial legal liability. A perception that we do not adequately secure consumer information could result in a loss of current or potential consumers and business partners, as well as a loss of anticipated revenues. Our key business partners also face these same risks with respect to consumer information they collect and data security breaches with respect to such information could cause reputational harm to them and negatively impact our ability to offer our products and services through their platforms.
13
We are also subject to payment card association rules and obligations pursuant to contracts with payment card processors. Under these rules and obligations, if information is compromised, we could be liable to payment card issuers for the cost of associated expenses and penalties. In addition, if we fail to follow payment card industry security standards, even if no customer information is compromised, we could incur significant fines or experience a significant increase in payment card transaction costs.
In addition, the rate of data privacy, security and consumer-protection law-making is accelerating globally, and the interpretation and application of consumer protection and data privacy and security laws in the United States, Europe and elsewhere are often uncertain, contradictory and in flux. It is possible that these laws may be interpreted or applied in a manner that is adverse to us or otherwise inconsistent with our practices, which could result in litigation, regulatory investigations and potential legal liability or require us to change our practices in a manner adverse to our business. As a result, our reputation may be harmed, we could incur substantial costs, and we could lose both customers and revenue.
Any failure by EA, or our agents to comply with our privacy policy or with other federal, state or international privacy-related or data protection laws and regulations could result in proceedings against EA by governmental entities or others as well as resulting liability.
Negative player perceptions about our brands, products, services and/or business practices may damage our business and the costs incurred in addressing player concerns may increase our operating expenses.
Individual players form our ultimate customer base, and player expectations regarding the quality, performance and integrity of our products and services are high. Players may be critical of our brands, products, services and/or business practices for a wide variety of reasons. These negative player reactions may not be foreseeable or within our control to manage effectively, including perceptions about gameplay fairness, negative player reactions to game content, components and services, or objections to certain of our business practices. In the past, we have taken actions, including delaying the release of our games, after taking into consideration, among other things, feedback from the player community even if those decisions negatively impacted our operating results in the short term. We expect to continue to take actions to address concerns as appropriate, including actions that may result in additional expenditures and the loss of revenue. Negative player sentiment about our business practices also can lead to investigations from regulatory agencies and consumer groups, as well as litigation, which, regardless of their outcome, may be costly, damaging to our reputation and harm our business.
If we release defective products or services, our operating results could suffer.
Products and services such as ours are extremely complex software programs, and are difficult to develop and distribute. We have quality controls in place to detect defects in our products and services before they are released. Nonetheless, these quality controls are subject to human error, overriding, and reasonable resource constraints. Therefore, these quality controls and preventative measures may not be effective in detecting defects in our products and services before they have been released into the marketplace. In such an event, we could be required to or may find it necessary to voluntarily recall a product or suspend the availability of the product or service, which could significantly harm our business and operating results.
Our business is subject to increasing regulation and the adoption of proposed legislation we oppose could negatively impact our business.
Legislation is continually being introduced in the United States and other countries to mandate rating requirements or set other restrictions on the advertisement or distribution of entertainment software based on content. In the United States, most courts, including the United States Supreme Court, that have ruled on such legislation have generally ruled in a manner favorable to the interactive entertainment industry. Some foreign countries have adopted ratings regulations and certain countries allow government censorship of entertainment software products. Adoption of government ratings system or restrictions on distribution of entertainment software based on content could harm our business by limiting the products we are able to offer to our customers and compliance with new and possibly inconsistent regulations for different territories could be costly, delay or prevent the release of our products in those territories.
As we increase the online delivery of our products and services, we are subject to a number of foreign and domestic laws and regulations that affect companies conducting business on the Internet. In addition, laws and regulations relating to user privacy, data collection, retention, electronic commerce, consumer protection, content, advertising, localization, and information security have been adopted or are being considered for adoption by many countries throughout the world. The costs of compliance with these laws may increase in the future as a result of changes in interpretation. Furthermore, any failure on our part to comply with these laws or the application of these laws in an unanticipated manner may harm our business and result in penalties or significant legal liability.
14
If we do not continue to attract and retain key personnel, we will be unable to
effectively conduct our business.
The market for technical, creative, marketing and other personnel essential to the development and marketing of our products and services and management of our businesses is extremely competitive. Our leading position within the interactive entertainment industry makes us a prime target for recruiting our executives as well as key creative and technical talent. If we cannot successfully recruit and retain the employees we need, or replace key employees following their departure, our ability to develop and manage our business will be impaired.
If our marketing and advertising efforts fail to resonate with our customers, our business and operating results could be adversely affected.
Our products and services are marketed worldwide through a diverse spectrum of advertising and promotional programs such as online and mobile advertising, television advertising, retail merchandising, website development, event sponsorship and direct communications with our consumers including via email. Our ability to sell our products and services is dependent in part upon the success of these programs. If the marketing for our products and services fails to resonate with our customers, particularly during the critical holiday season or during other key selling periods, or as advertising rates or other media placement costs increase, these factors could have a material adverse impact on our business and operating results.
A significant portion of our sales are made to a relatively small number of key
customers. If these customers reduce their purchases of our products and services or become
unable to pay for them, our business could be harmed.
During the fiscal year ended March 31, 2015, approximately 58 percent of our net revenue was derived from our top ten customers. Though our products are available to consumers through a variety of retailers and directly through us, the concentration of our sales in one, or a few, large customers could lead to a short-term disruption in our sales if one or more of these customers significantly reduced their purchases or ceased to carry our products and services, and could make us more vulnerable to collection risk if one or more of these large customers became unable to pay for our products or declared bankruptcy. Additionally, our receivables from these large customers generally increase significantly in the December quarter as they make purchases in anticipation of the holiday selling season. Having such a large portion of our total net revenue concentrated in a few customers could reduce our negotiating leverage with these customers. If one or more of our key customers experience deterioration in their business, or become unable to obtain sufficient financing to maintain their operations, our business could be harmed.
Our channel partners have significant influence over the products and services that we offer on their platforms.
Our products and services are sold to customers, primarily through retailers and online through our channel partners, including Sony, Microsoft, Apple and Google. In many cases, our channel partners set the rates that we must pay to provide our games and services through their online channels. In certain cases, our channel partners retain flexibility to change their fee structures or adopt different fee structures for their online channels, which could adversely impact our costs, profitability and margins.
Outside of the financial arrangements, our agreements with our channel partners typically give them significant control over other aspects of the distribution of the products and services that we develop for their platform. For example, our agreements with Sony and Microsoft typically give significant control to them over the approval, manufacturing and distribution of our products and services, which could, in certain circumstances, leave us unable to get our products and services approved, manufactured and distributed to customers. For the fiscal year ended March 31, 2015, 66 percent of our net revenue was derived from products and services for Sony’s PlayStation 3 and 4 and Microsoft’s Xbox 360 and One consoles (combined across all four platforms). For our digital products and services delivered direct to consumers via digital channels such as Sony’s PlayStation Network, Microsoft’s Xbox LIVE Marketplace, Apple’s App Store and the Google Play store, the channel partner has policies and guidelines that control the promotion and distribution of these titles and the features and functionalities that we are permitted to offer through the channel.
In addition, while we have negotiated agreements in place with our channel partners - these agreements reserve the right by our channel partners to determine and change unilaterally certain key terms and conditions, including the ability to change their user and developer policies and guidelines, which can negatively impact our business. If our channel partners establish terms that restrict our offerings through their channels, or significantly impact the financial terms on which these products or services are offered to our customers, our business could be harmed.
15
Our business is subject to risks generally associated with the entertainment industry, any of which could significantly harm our operating results.
Our business is subject to risks that are generally associated with the entertainment industry, many of which are beyond our control. These risks could negatively impact our operating results and include: the popularity, price and timing of our games and the platforms on which they are played; economic conditions that adversely affect discretionary consumer spending; changes in consumer demographics; the availability and popularity of other forms of entertainment; and critical reviews and public tastes and preferences, which may change rapidly and cannot necessarily be predicted.
We rely on business partners in many areas of our business and our business may be harmed if they are unable to honor their obligations to us or their actions may put us at risk.
We rely on various business partners, including third-party service providers, vendors, licensing partners, development partners, and licensees, among others, in many areas of our business. The actions of our business partners may put our business and our reputation at risk. In many cases, these third parties are given access to sensitive and proprietary information in order to provide services and support to our teams. These third parties may misappropriate our information and engage in unauthorized use of it. The failure of these third parties to provide adequate services and technologies, or the failure of the third parties to adequately maintain or update their services and technologies, could result in a disruption to our business operations. Further, disruptions in the financial markets and economic downturns may adversely affect our business partners and they may not be able to continue honoring their obligations to us. Alternative arrangements and services may not be available to us on commercially reasonable terms or we may experience business interruptions upon a transition to an alternative partner or vendor. If we lose one or more significant business partners, our business could be harmed.
We may be subject to claims of infringement of third-party intellectual property rights, which could harm our business.
From time to time, third parties may assert claims against us based on allegations of violations of intellectual property rights. In addition, patent holding companies seek to monetize patents they have purchased or otherwise obtained. Although we take steps to avoid knowingly violating the intellectual property rights of others, it is possible that third parties still may claim infringement. In addition, our products often utilize complex, cutting-edge technology that may be subject to intellectual property claims, particularly since there are an increasing number of companies that focus their efforts exclusively on enforcing their patent rights.
Existing or future infringement claims against us, whether valid or not, may be time consuming and expensive to defend. Such claims or litigations could require us to pay damages and other costs, stop selling the affected products, redesign those products to avoid infringement, or obtain a license, all of which could be costly and harm our business. In addition, many patents have been issued that may apply to potential new modes of delivering, playing or monetizing game software products and services, such as those that we produce or would like to offer in the future. We may discover that future opportunities to provide new and innovative modes of game play and game delivery to consumers may be precluded by existing patents that we are unable to license on reasonable terms.
From time to time we may become involved in other legal proceedings, which could
adversely affect us.
We are currently, and from time to time in the future may become, subject to legal proceedings, claims, litigation and government investigations or inquiries, which could be expensive, lengthy, and disruptive to normal business operations. In addition, the outcome of any legal proceedings, claims, litigation, investigations or inquiries may be difficult to predict and could have a material adverse effect on our business, operating results, or financial condition.
Acquisitions, investments and other strategic transactions could result in
operating difficulties, dilution to our investors and other negative
consequences.
We expect to continue making acquisitions or entering into other strategic transactions including (1) acquisitions of companies, businesses, intellectual properties, and other assets, (2) minority investments in strategic partners, and (3) investments in new interactive entertainment businesses (e.g., online and mobile publishing platforms) as part of our long-term business strategy. These transactions involve significant challenges and risks including, in the end, that the transaction does not advance our business strategy, that we do not realize a satisfactory return on our investment, that we acquire unknown liabilities, or that we experience difficulty in the integration of business systems and technologies, the integration and retention of new employees, or in the maintenance of key business and customer relationships of the businesses we acquire, or diversion of management’s attention from our other businesses. These events could harm our operating results or financial condition.
16
Future acquisitions and investments also could involve the issuance of our equity and equity-linked securities (potentially diluting our existing stockholders), the incurrence of debt, contingent liabilities or amortization expenses, write-offs of goodwill, intangibles, or acquired in-process technology, or other increased cash and non-cash expenses, such as stock-based compensation. Any of the foregoing factors could harm our financial condition or prevent us from achieving improvements in our financial condition and operating performance that could have otherwise been achieved by us on a stand-alone basis. Our stockholders may not have the opportunity to review, vote on or evaluate future acquisitions or investments.
Our products and brands are subject to the threat of piracy, unauthorized copying and other forms of intellectual property infringement.
We regard our products and brands as proprietary and take measures to protect our products, brands and other confidential information from infringement. We are aware that some unauthorized copying of our products and brands occurs, and if a significantly greater amount were to occur, it could negatively impact our business.
Piracy and other forms of unauthorized copying and use of our content and brands are persistent problems for us, and policing is difficult. Further, the laws of some countries in which our products are or may be distributed either do not protect our products and intellectual property rights to the same extent as the laws of the United States, or are poorly enforced. Legal protection of our rights may be ineffective in such countries. In addition, although we take steps to enforce and police our rights, factors such as
the proliferation of technology designed to circumvent the protection measures used in our products, the availability of broadband access to the Internet, the refusal of Internet service providers or platform holders to remove infringing content in certain instances, and the proliferation of online channels through which infringing product is distributed have all have contributed to an expansion in unauthorized copying of our products and brands.
We may experience outages and disruptions of our infrastructure that may harm our business.
We may be subject to outrages or disruptions of our infrastructure, including information technology system failures and network disruptions. These may be caused by natural disasters, cyber-incidents, weather events, power disruptions, telecommunications failures, acts of terrorism or other events. System redundancy may be ineffective or inadequate, and the Company’s disaster recovery planning may not be sufficient for all eventualities. Such failures or disruptions could prevent access to our products, services or online stores selling our products and services. Our corporate headquarters in Redwood City, CA and our studio in Burnaby, British Columbia are located in seismically active regions, and certain of our game development activities and other essential business operations are conducted at these locations. An event that results in the disruption of any of our critical business or IT systems could harm our ability to conduct normal business operations.
Our business is subject to currency fluctuations.
International sales are a fundamental part of our business. For the fiscal year ended March 31, 2015, international net revenue comprised 57 percent of our total net revenue and we expect international sales to continue to account for a significant portion of our total net revenue. As a result of our international sales, and also the denomination of our foreign investments and our cash and cash equivalents in foreign currencies, we are exposed to the effects of fluctuations in foreign currency exchange rates. The significant strengthening of the U.S. dollar during the second half of fiscal year 2015, particularly relative to the Euro, British pound sterling, Swedish krona and Canadian dollar, had a negative impact on our reported international net revenue but a positive impact on our reported international operating expenses because these amounts were translated at lower rates in fiscal 2015 than fiscal 2014. Our fiscal year 2015 results of operations, including our net revenue and net income were adversely affected by these foreign currency fluctuations and these trends may continue in fiscal 2016. We use foreign currency hedging contracts to mitigate some foreign currency risk. However, these activities are limited in the protection they provide us from foreign currency fluctuations and can themselves result in losses.
We utilize debt financing and such indebtedness could adversely impact our business and financial condition.
We have outstanding $632.5 million of convertible senior notes due July 2016 (the “Notes”), which result in debt service obligations of approximately $5 million per year. In addition, in March 2015, we entered into an unsecured committed $500 million revolving credit facility. While the facility is currently undrawn, we may use the proceeds of any future borrowings for general corporate purposes. The credit facility contains affirmative, negative and financial covenants, including a maximum capitalization ratio and minimum liquidity requirements. We may enter into other financial instruments in the future.
Our indebtedness, particularly the July 2016 maturity of the Notes, could affect our financial condition and future financial results by, among other things:
17
|
•
|
requiring the dedication of a substantial portion of any cash flow from operations to the payment of principal of, and interest on, our indebtedness, thereby reducing the availability of such cash flow to fund our growth strategy, working capital, capital expenditures and other general corporate purposes; and
|
|
•
|
limiting our flexibility in planning for, or reacting to, changes in our business and our industry.
|
In connection with the offering of the Notes, we entered into certain privately-negotiated transactions to reduce the potential dilution with respect to our common stock upon conversion of the Notes. We also entered into separate, privately-negotiated warrant transactions whereby we sold warrants to independent third parties. The effect, if any, of these activities, including the direction or magnitude, on the market price of our common stock will depend on a variety of factors, including market conditions, and cannot be ascertained at this time. Any of these activities could, however, adversely affect the market price of our common stock and the trading price of the Notes. In addition, the counterparties to these agreements are financial institutions and we are subject to the risk that one or more of these counterparties might default on the transactions. Our exposure to the credit risk of these counterparties is not secured by any collateral and the amount of that exposure will depend on many factors but, generally, the increase in our exposure will be correlated to the increase in the market price and in the volatility of our common stock.
Changes in our tax rates or exposure to additional tax liabilities could adversely affect our earnings and financial condition.
We are subject to taxes in the United States and in various foreign jurisdictions. Significant judgment is required in determining our worldwide income tax provision and accruals for other taxes, and there are many transactions and calculations where the ultimate tax determination is uncertain. Our effective income tax rate could be adversely affected by our profit levels, by changes in our business, reorganization of our business and operating structure, changes in the mix of earnings in countries with differing statutory tax rates, changes in the elections we make, changes in applicable tax laws, or changes in the valuation allowance for deferred tax assets, as well as other factors. We are also required to pay taxes other than income taxes, such as payroll, sales, use, value-added, net worth, property and goods and services taxes, in both the United States and foreign jurisdictions. Furthermore, we are regularly subject to audit by tax authorities with respect to both income and such other non-income taxes. Adverse changes in our effective income tax rate, unfavorable audit results or tax rulings, or other changes resulting in significant additional tax liabilities could have material adverse effects upon our earnings, cash flows, and financial condition.
Our reported financial results could be adversely affected by changes in
financial accounting standards.
Our reported financial results are impacted by the accounting standards promulgated by the SEC and national accounting standards bodies and the methods, estimates, and judgments that we use in applying our accounting policies. For example, accounting standards affecting software revenue recognition have affected and could continue to significantly affect the way we account for revenue and costs related to our products and services. We recognize all of the revenue from bundled sales (i.e., online-enabled games that include updates on a when-and-if-available basis or a matchmaking service) on a deferred basis over an estimated offering period. The related costs of revenues are expensed as incurred instead of deferred and recognized ratably. In May 2014, the FASB issued ASU 2014-09,
Revenue from Contracts with Customers
, which will replace most existing revenue recognition guidance in U.S. GAAP when it becomes effective. While we have not yet determined the effect of the new standard on our Consolidated Financial Statements, we believe the new standard may require us to materially change the way we account for revenue by requiring us to recognize more revenue upon delivery of the primary product than we currently do under current accounting standards. The new standard may also require us to materially change the way we account for related costs by requiring us to capitalize and amortize certain costs over the period the related assets are transferred to the customer.
As we enhance, expand and diversify our business and product offerings, the application of existing or future financial accounting standards, particularly those relating to the way we account for revenue, costs and taxes, could have a significant adverse effect on our reported results although not necessarily on our cash flows.
Our stock price has been volatile and may continue to fluctuate significantly.
The market price of our common stock historically has been, and we expect will continue to be, subject to significant fluctuations. These fluctuations may be due to factors specific to us (including those discussed in the risk factors above, as well as others not currently known to us or that we currently do not believe are material), to changes in securities analysts’ earnings estimates or ratings, to our results or future financial guidance falling below our expectations and analysts’ and investors’ expectations, to factors affecting the entertainment, computer, software, Internet, media or electronics industries, to our ability to successfully integrate any acquisitions we may make, or to national or international economic conditions. In particular,
18
economic downturns may contribute to the public stock markets experiencing extreme price and trading volume volatility. These broad market fluctuations have and could continue to adversely affect the market price of our common stock.
19
Item 1B:
Unresolved Staff Comments
None.
Item 2:
Properties
We own our 660,000-square-foot Redwood Shores headquarters facilities located in Redwood City, California, which includes a product development studio and administrative and sales functions. We also own a 418,000-square-foot product development studio facility in Burnaby, Canada. In addition to the properties we own, we lease approximately 1.2 million square feet in North America and 1 million square feet in Europe and Asia at various research and development, sales and administration and distribution facilities, including leases for our development studios in Orlando, Florida and Stockholm, Sweden.
While we continually evaluate our facility requirements, we believe that suitable additional or substitute space will be available as needed to accommodate our future needs. For information regarding our lease commitments, see Note 13 of the Notes to Consolidated Financial Statements, included in Item 8 in this report. For information on long-lived assets by geography, see Note 18 of the Notes to Consolidated Financial Statements, included in Item 8 in this report.
Item 3:
Legal Proceedings
We are a defendant in several actions that allege we misappropriated the likenesses of various college athletes in certain of our college-themed sports games. In September 2013, we reached an agreement to settle all actions brought by college athletes against us. We recognized a
$30 million
accrual during the three months ended September 30, 2013 associated with the anticipated settlement. On September 3, 2014, the United States District Court for the Northern District of California granted preliminary approval of the settlement and set a hearing in July 2015, to determine whether to grant its final approval of the settlement.
On July 29, 2010, Michael Davis, a former NFL running back, filed a putative class action in the United States District Court for the Northern District of California against the Company, alleging that certain past versions of
Madden NFL
included the images of certain retired NFL players without their permission. In March 2012, the trial court denied the Company’s request to dismiss the complaint on First Amendment grounds. In January 2015, that trial court decision was affirmed by the Ninth Circuit Court of Appeals and the case was remanded back to the district court. The Company intends to seek further court review.
On December 17, 2013, a purported shareholder class action lawsuit was filed in the United States District Court for the Northern District of California against the Company and certain of its officers by an individual purporting to represent a class of purchasers of EA common stock. A second purported shareholder class action lawsuit alleging substantially similar claims was subsequently filed in the same court. These lawsuits have been consolidated into one action. The lawsuits, which assert claims under Section 10(b) and 20(a) of the Securities Exchange Act of 1934, allege, among other things, that the Company and certain of its officers issued materially false and misleading statements regarding the rollout of the Company’s
Battlefield 4
game. We filed a motion seeking dismissal of all claims on January 15, 2015 and on April 30, 2015, the court granted our motion to dismiss with prejudice.
We are also subject to claims and litigation arising in the ordinary course of business. We do not believe that any liability from any reasonably foreseeable disposition of such claims and litigation, individually or in the aggregate, would have a material adverse effect on our Consolidated Financial Statements.
Item 4:
Mine Safety Disclosures
Not applicable.
20
|
Item 5:
|
Market for Registrant’s Common Equity, Related Stockholder Matters and Issuer Purchases of Equity Securities
|
Market Information
Our common stock is traded on the NASDAQ Global Select Market under the symbol “EA”. The following table sets forth the quarterly high and low closing sales price per share of our common stock from April 1, 2013 through March 31, 2015.
|
|
Prices
|
||||||
|
|
High
|
Low
|
|||||
|
Fiscal Year Ended March 31, 2014:
|
|||||||
|
First Quarter
|
$
|
23.61
|
|
$
|
16.91
|
|
|
|
Second Quarter
|
27.99
|
|
23.18
|
|
|||
|
Third Quarter
|
26.44
|
|
20.97
|
|
|||
|
Fourth Quarter
|
30.25
|
|
21.54
|
|
|||
|
Fiscal Year Ended March 31, 2015:
|
|||||||
|
First Quarter
|
37.15
|
|
26.67
|
|
|||
|
Second Quarter
|
38.42
|
|
33.31
|
|
|||
|
Third Quarter
|
48.33
|
|
32.62
|
|
|||
|
Fourth Quarter
|
58.24
|
|
45.96
|
|
|||
Holders
There were approximately 1,324 holders of record of our common stock as of May 18, 2015, and the closing price of our common stock was $63.30 per share as reported by the NASDAQ Global Select Market. In addition, a significant number of beneficial owners of our common stock hold their shares in street name.
Dividends
We have not paid any cash dividends and do not anticipate paying cash dividends in the foreseeable future.
Issuer Purchases of Equity Securities
In May 2014, a special committee of our Board of Directors, on behalf of the full Board of Directors, authorized a two-year program to repurchase up to
$750 million
of our common stock. We repurchased approximately 8.3 million shares for approximately
$337 million
under this program during fiscal year 2015.
In May 2015, our Board of Directors authorized a new program to repurchase up to $1 billion of our common stock. This new stock repurchase program, which expires on May 31, 2017, supersedes and replaces the stock repurchase authorization approved in May 2014. Under this program, we may purchase stock in the open market or through privately-negotiated transactions in accordance with applicable securities laws, including pursuant to pre-arranged stock trading plans. The timing and actual amount of the stock repurchases will depend on several factors including price, capital availability, regulatory requirements, alternative investment opportunities and other market conditions. We are not obligated to repurchase any specific number of shares under this program and it may be modified, suspended or discontinued at any time. We continue to actively repurchase shares.
The following table summarizes the number of shares repurchased in the fourth quarter of the
fiscal year ended March 31, 2015
under the May 2014 program:
|
Fiscal Month
|
Total Number of Shares Purchased
|
Average Price Paid per Share
|
Total Number of Shares Purchased as part of Publicly Announced Program
|
Maximum Dollar Value that May Still Be Purchased Under the Program (in millions)
|
||||||||||
|
December 28, 2014 - January 24, 2015
|
485,400
|
|
$
|
47.28
|
|
485,400
|
|
$
|
485
|
|
||||
|
January 25 - February 21, 2015
|
400,817
|
|
$
|
53.75
|
|
400,817
|
|
$
|
463
|
|
||||
|
February 22 - March 28, 2015
|
891,422
|
|
$
|
56.66
|
|
891,422
|
|
$
|
413
|
|
||||
|
1,777,639
|
|
$
|
53.44
|
|
1,777,639
|
|
|
|||||||
21
Stock Performance Graph
The following information shall not be deemed to be “filed” with the SEC nor shall this information be incorporated by reference into any future filing under the Securities Act of 1933, as amended, or the Securities Exchange Act of 1934, as amended, except to the extent that we specifically incorporate it by reference into a filing.
The following graph shows a five-year comparison of cumulative total returns during the period from March 31, 2010 through March 31, 2015, for our common stock, the S&P 500 Index (to which EA was added in July 2002), the NASDAQ Composite Index, and the RDG Technology Composite Index, each of which assumes an initial value of $100. Each measurement point is as of the end of each fiscal year ended March 31. The performance of our stock depicted in the following graph is not necessarily indicative of the future performance of our stock.
COMPARISON OF 5 YEAR CUMULATIVE TOTAL RETURN*
Among Electronic Arts Inc., the S&P 500 Index, the NASDAQ Composite Index,
and the RDG Technology Composite Index
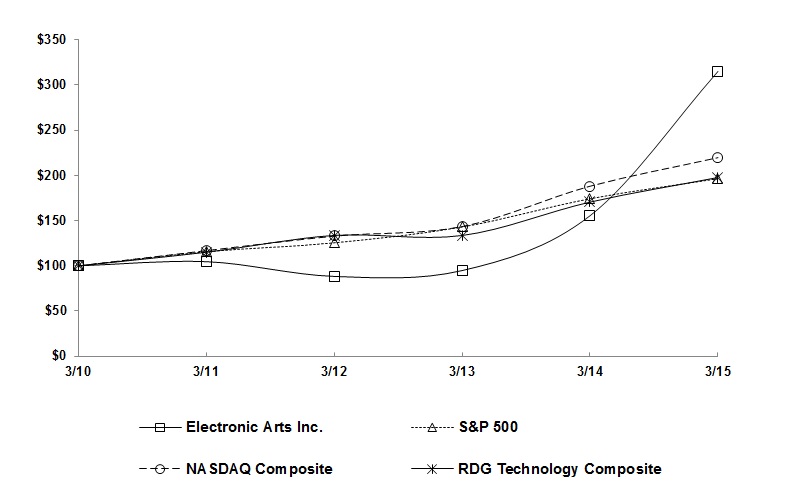
|
*
|
Based on $100 invested on March 31, 2010 in stock or index, including reinvestment of dividends.
|
|
|
March 31,
|
||||||||||||||||||||||
|
|
2010
|
2011
|
2012
|
2013
|
2014
|
2015
|
|||||||||||||||||
|
Electronic Arts Inc.
|
$
|
100
|
|
$
|
105
|
|
$
|
88
|
|
$
|
95
|
|
$
|
155
|
|
$
|
315
|
|
|||||
|
S&P 500 Index
|
100
|
|
116
|
|
126
|
|
143
|
|
174
|
|
197
|
|
|||||||||||
|
NASDAQ Composite Index
|
100
|
|
117
|
|
133
|
|
144
|
|
188
|
|
220
|
|
|||||||||||
|
RDG Technology Composite Index
|
100
|
|
115
|
|
134
|
|
134
|
|
171
|
|
198
|
|
|||||||||||
22
Item 6:
Selected Financial Data
ELECTRONIC ARTS INC. AND SUBSIDIARIES
SELECTED FIVE-YEAR CONSOLIDATED FINANCIAL DATA
(In millions, except per share data)
|
|
Year Ended March 31,
|
||||||||||||||||||
|
STATEMENTS OF OPERATIONS DATA
|
2015
|
2014
|
2013
|
2012
|
2011
|
||||||||||||||
|
Net revenue
|
$
|
4,515
|
|
$
|
3,575
|
|
$
|
3,797
|
|
$
|
4,143
|
|
$
|
3,589
|
|
||||
|
Cost of revenue
|
1,429
|
|
1,347
|
|
1,388
|
|
1,598
|
|
1,499
|
|
|||||||||
|
Gross profit
|
3,086
|
|
2,228
|
|
2,409
|
|
2,545
|
|
2,090
|
|
|||||||||
|
Total operating expenses
|
2,138
|
|
2,195
|
|
2,288
|
|
2,510
|
|
2,402
|
|
|||||||||
|
Operating income (loss)
|
948
|
|
33
|
|
121
|
|
35
|
|
(312
|
)
|
|||||||||
|
Gains on strategic investments, net
|
—
|
|
—
|
|
39
|
|
—
|
|
23
|
|
|||||||||
|
Interest and other income (expense), net
|
(23
|
)
|
(26
|
)
|
(21
|
)
|
(17
|
)
|
10
|
|
|||||||||
|
Income (loss) before provision for (benefit from) income taxes
|
925
|
|
7
|
|
139
|
|
18
|
|
(279
|
)
|
|||||||||
|
Provision for (benefit from) income taxes
|
50
|
|
(1
|
)
|
41
|
|
(58
|
)
|
(3
|
)
|
|||||||||
|
Net income (loss)
|
$
|
875
|
|
$
|
8
|
|
$
|
98
|
|
$
|
76
|
|
$
|
(276
|
)
|
||||
|
Net income (loss) per share:
|
|||||||||||||||||||
|
Basic
|
$
|
2.81
|
|
$
|
0.03
|
|
$
|
0.32
|
|
$
|
0.23
|
|
$
|
(0.84
|
)
|
||||
|
Diluted
|
$
|
2.69
|
|
$
|
0.03
|
|
$
|
0.31
|
|
$
|
0.23
|
|
$
|
(0.84
|
)
|
||||
|
Number of shares used in computation:
|
|||||||||||||||||||
|
Basic
|
311
|
|
308
|
|
310
|
|
331
|
|
330
|
|
|||||||||
|
Diluted
|
325
|
|
316
|
|
313
|
|
336
|
|
330
|
|
|||||||||
|
|
As of March 31,
|
||||||||||||||||||
|
BALANCE SHEETS DATA
|
2015
|
2014
|
2013
|
2012
|
2011
|
||||||||||||||
|
Cash and cash equivalents
|
$
|
2,068
|
|
$
|
1,782
|
|
$
|
1,292
|
|
$
|
1,293
|
|
$
|
1,579
|
|
||||
|
Short-term investments
|
953
|
|
583
|
|
388
|
|
437
|
|
497
|
|
|||||||||
|
Marketable equity securities
|
—
|
|
—
|
|
—
|
|
119
|
|
161
|
|
|||||||||
|
Working capital
|
973
|
|
(a)
|
748
|
|
408
|
|
489
|
|
1,031
|
|
||||||||
|
Total assets
|
6,147
|
|
5,716
|
|
5,070
|
|
5,491
|
|
4,928
|
|
|||||||||
|
0.75% convertible senior notes due 2016, net
|
633
|
|
(a)
|
580
|
|
559
|
|
539
|
|
—
|
|
||||||||
|
Other long-term liabilities
|
333
|
|
324
|
|
327
|
|
374
|
|
363
|
|
|||||||||
|
Total liabilities
|
3,080
|
|
3,294
|
|
2,803
|
|
3,033
|
|
2,364
|
|
|||||||||
|
Total stockholders’ equity
|
3,036
|
|
(a)
|
2,422
|
|
2,267
|
|
2,458
|
|
2,564
|
|
||||||||
|
(a)
|
During the quarter ended March 31, 2015, the market value of our common stock exceeded the conversion trigger price of $41.26 per share for at least 20 trading days of the 30 consecutive trading days preceding quarter end. As a result, the Notes are convertible at the option of the holder through July 4, 2015, and the $602 million carrying value of the Notes was reclassified as a current liability and the excess $31 million of the principal amount over the carrying value of the Notes was reclassified from permanent equity to temporary equity in the Consolidated Balance Sheets as of March 31, 2015. See Note 12 - Financing Arrangements to the Consolidated Financial Statements as it relates to the Notes, the convertibility of the Notes, and the Convertible Note Hedge and Warrants, which is incorporated by reference into this Item 6.
|
23
Item 7:
Management’s Discussion and Analysis of Financial Condition and Results of Operations
OVERVIEW
The following overview is a high-level discussion of our operating results, as well as some of the trends and drivers that affect our business. Management believes that an understanding of these trends and drivers provides important context for our results for the
fiscal year ended March 31, 2015
, as well as our future prospects. This summary is not intended to be exhaustive, nor is it intended to be a substitute for the detailed discussion and analysis provided elsewhere in this Form 10-K, including in the “Business” section and the “Risk Factors” above, the remainder of this “Management’s Discussion and Analysis of Financial Condition and Results of Operations (“MD&A”)”, and the Consolidated Financial Statements and related Notes.
About Electronic Arts
We develop, market, publish and distribute game software content and services that can be played by consumers on a variety of platforms, including video game consoles (such as the PlayStation 3 and 4 from Sony, and the Xbox 360 and Xbox One from Microsoft), PCs, mobile phones and tablets. We deliver our games and services to our players across multiple platforms, through multiple distribution channels, and directly (online and wirelessly). Some of our games are based on our wholly-owned intellectual property (
e.g.
, Battlefield, Mass Effect, Need for Speed, Dragon Age, The Sims, SimCity, Bejeweled, and Plants vs. Zombies), and some of our games leverage content that we license from others (
e.g.
, FIFA, Madden NFL and Star Wars). We also publish and distribute games developed by third parties (
e.g.
,
Titanfall
). Our goal is to develop our intellectual properties into year-round businesses available on a range of platforms. Our products and services may be purchased through physical and online retailers, platform providers such as console manufacturers, providers of free-to-download PC games played on the Internet, mobile carriers via streaming and digital downloads and directly through Origin, our own digital distribution platform.
Financial Results
Total net revenue for the
fiscal year ended March 31, 2015
was
$4,515 million
, an increase of
$940 million
, or
26 percent
, as compared to the
fiscal year ended March 31, 2014
. Net revenue for the
fiscal year ended March 31, 2015
was driven by
FIFA 14
,
FIFA 15
, and
Battlefield 4.
At
March 31, 2015
, deferred net revenue associated with sales of online-enabled games
decreased
by
$207 million
as compared to
March 31, 2014
, directly increasing the amount of reported net revenue during the
fiscal year ended March 31, 2015
. At
March 31, 2014
, deferred net revenue associated with sales of online-enabled games
increased
by
$446 million
as compared to
March 31, 2013
, directly decreasing the amount of reported net revenue during the
fiscal year ended March 31, 2014
. Disregarding the impact of the deferred net revenue of $287 million and $11 million of unrecognized cash flow hedging net gains, reported net revenue would have
increased
by approximately
$298 million
, or
7 percent
, during the
fiscal year ended March 31, 2015
as compared to the
fiscal year ended March 31, 2014
.
Net income for the
fiscal year ended March 31, 2015
was
$875 million
as compared to
$8 million
for the
fiscal year ended March 31, 2014
. Diluted earnings per share for the
fiscal year ended March 31, 2015
was
$2.69
as compared to a diluted earnings per share of
$0.03
for the
fiscal year ended March 31, 2014
. Net income increased for the
fiscal year ended March 31, 2015
as compared to the
fiscal year ended March 31, 2014
primarily as a result of a
$940 million
increase in net revenue and a
$57 million
decrease in operating expenses, partially offset by an
$82 million
increase in cost of revenue and a
$51 million
increase in income tax expenses.
International Operations and Foreign Currency Exchange Impact.
International net revenue was
$2,559 million
, or
57 percent
of total net revenue during the
fiscal year ended March 31, 2015
, compared to
$2,065 million
, or
58 percent
of total net revenue during the
fiscal year ended March 31, 2014
,
an increase
of
$494 million
, or
24 percent
. We estimate that the negative impact of foreign currency exchange rates due to translation during the second half of
fiscal year 2015
(primarily the U.S. Dollar strengthening against the Euro) and related cash flow hedging activities, decreased reported International net revenue by approximately
$30 million
, or
1 percent
, for the
fiscal year ended March 31, 2015
. Excluding the negative impact of foreign currency exchange rates from translation and related cash flow hedging activities, we estimate that International net revenue would have increased by approximately
$524 million
, or
25 percent
for the
fiscal year ended March 31, 2015
as compared to the
fiscal year ended March 31, 2014
. This increase is primarily due to our FIFA and
Plants vs. Zombies franchises, and
Titanfall
, partially offset by decreased revenue in our SimCity, Crysis, and Dead Space franchises. In addition, our international investments and our cash and cash equivalents denominated in foreign currencies are subject to fluctuations in foreign currency exchange rates and decline in value when the U.S. dollar strengthens against the currencies in which our international investments are denominated.
24
Trends in Our Business
Digital Transformation
. Our business continues to transform from a traditional packaged goods business model to one in which our games and services are sold and delivered via a network connection, with digitally-delivered content, features and services helping to extend the life of the respective game offering. For example, many of our products that traditionally have been sold only as packaged goods products can now also be purchased and downloaded via a network connection. We also include digitally-delivered content, features and services as part of the product offering, either made available for free or at additional cost. For example, the Ultimate Team mode incorporated into recent iterations of our FIFA, Madden NFL, NHL and NBA franchises and expansion packs available digitally for our Battlefield and Sims franchises have kept many of our players engaged with those games for longer periods of time. Additionally, our mobile and PC free-to-download games are available solely via digital delivery and are typically monetized through a business model through which we sell incremental content and/or features in discrete transactions. We also provide our EA Access service for the Xbox One which offers players access to a selection of EA games and other benefits for a monthly or annual fee.
We significantly increased our digital net revenue from $1,440 million in fiscal year 2013 to $1,833 million in fiscal year 2014 and $2,199 million during fiscal year 2015. We expect this portion of our business to continue to grow through fiscal year 2016 and beyond.
Console System Transition
. We have made and will continue to make significant investments in products and services for the PlayStation 4 from Sony and Xbox One from Microsoft, and we also expect to continue to develop and market products and services for the Microsoft Xbox 360 and the Sony PlayStation 3. Industry sales of major games for these legacy consoles declined significantly during our 2015 fiscal year. Although the decline in sales for legacy consoles was less than we anticipated during
fiscal year 2015
, we think that this sales decline trend will continue. The success of our products and services for the new-generation consoles depends in part on the commercial success and adequate supply of, as well as our ability to develop commercially successful products and services for, these consoles.
Foreign Currency Exchange Rates.
International sales are a fundamental part of our business, and the significant strengthening of the U.S. Dollar during the second half of fiscal year 2015 (particularly relative to the Euro, British pound sterling, Swedish krona and Canadian dollar) had a negative impact on our reported international net revenues, but a positive impact on our reported international operating expenses because these amounts were translated at lower rates in fiscal year 2015 than in fiscal year 2014. While we use foreign currency hedging contracts to mitigate some foreign currency exchange risk, these activities are limited in the protection that they provide us and can themselves result in losses. We currently anticipate foreign currency exchange rates to have a negative impact on our expected reported net revenue in fiscal year 2016 as compared to fiscal year 2015, but the strengthening of the U.S. dollar is expected to have a positive impact on our reported operating expenses as a significant portion of those expenses are incurred outside the United States.
Mobile and PC Free-to-Download Games
. The proliferation of mobile phones and tablets has significantly increased the consumer base for mobile games. The broad consumer acceptance of free-to-download business models, which allow consumers to try new games with no up-front cost and pay for additional content or in-game items, has led to growth in the mobile gaming industry. Likewise, the mass introduction and wide consumer acceptance of free-to-download, micro-transaction-based PC games played over the Internet has also broadened our consumer base. We expect revenue generated from mobile and PC free-to-download games to remain an important part of our business.
We track an estimate of monthly active users (“MAUs”) for our mobile business, which we believe is a useful indicator of player engagement trends for that business. For the
fiscal year ended March 31, 2015
, we had average MAUs of over 165 million. MAUs are the aggregate number of individuals who accessed a particular game on a particular device in the last 30 days as of the measurement date. For our calculation, an individual who either plays two of our games on a single device, or the same game on two devices in the relevant period, would be counted as two users. Average MAUs for a particular period is the average of the MAUs at each month-end during that period. MAUs are calculated using internal company data based on tracking the activity of user accounts. We also include in this calculation data provided by our third party publishing partners for certain games that we develop but we exclude information from third party titles that we publish. From time to time, we adjust the calculation for user activity that is inconsistent with our methodology. We believe that the numbers are reasonable estimates of our user base for the applicable period of measurement; however, factors relating to user activity may impact these numbers. Our methodology for calculating MAUs may differ from the methodology used by other companies to calculate this metric.
25
Concentration of Sales Among the Most Popular Games
. In all major segments of our industry, we see a large portion of games sales concentrated on the most popular titles, and many of those titles are sequels of prior games. A significant portion of our revenue has historically been derived from games and services based on a few popular franchises. For example, in fiscal year 2015, net revenue generated from the sale of products and services associated with our three largest franchises accounted for approximately 54% of our net revenue. We expect this trend to continue in fiscal year 2016.
Recent Developments
Stock Repurchase Program.
In May 2015, our Board of Directors authorized a new program to repurchase up to $1 billion of our common stock. This new stock repurchase program, which expires on May 31, 2017, supersedes and replaces the stock repurchase authorization approved in May 2014 under which we repurchased approximately
8.3 million
shares for approximately
$337 million
during fiscal year 2015. Under the new program, we may purchase stock in the open market or through privately-negotiated transactions in accordance with applicable securities laws, including pursuant to pre-arranged stock trading plans. The timing and actual amount of the stock repurchases will depend on several factors including price, capital availability, regulatory requirements, alternative investment opportunities and other market conditions. We are not obligated to repurchase any specific number of shares under this program and it may be modified, suspended or discontinued at any time. We continue to actively repurchase shares.
CRITICAL ACCOUNTING POLICIES AND ESTIMATES
Our Consolidated Financial Statements have been prepared in accordance with accounting principles generally accepted in the United States (“U.S. GAAP”). The preparation of these Consolidated Financial Statements requires management to make estimates and assumptions that affect the reported amounts of assets and liabilities, contingent assets and liabilities, and revenue and expenses during the reporting periods. The policies discussed below are considered by management to be critical because they are not only important to the portrayal of our financial condition and results of operations, but also because application and interpretation of these policies requires both management judgment and estimates of matters that are inherently uncertain and unknown. As a result, actual results may differ materially from our estimates.
Revenue Recognition, Sales Returns and Allowances, and Bad Debt Reserves
We derive revenue principally from sales of interactive software games, and related content (
e.g.,
micro-transactions) and services on (1) video game consoles (such as the PlayStation 3 and 4 from Sony, and the Xbox 360 and Xbox One from Microsoft) and PCs, and (2) mobile phones and tablets. We evaluate revenue recognition based on the criteria set forth in FASB Accounting Standards Codification (“ASC”) 605,
Revenue Recognition
and ASC 985-605,
Software: Revenue Recognition
. We classify our revenue as either product revenue or service and other revenue.
Product revenue.
Our product revenue includes revenue associated with the sale of software games or related content, whether delivered via a physical disc (
e
.
g
., packaged goods) or delivered digitally via the Internet (
e.g.,
full-game downloads, extra-content), and licensing of game software to third-parties. Product revenue also includes revenue from mobile full-game downloads that do not require our hosting support (
e.g.
, premium mobile games), and sales of tangible products such as hardware, peripherals, or collectors’ items.
Service and other revenue.
Our service revenue includes revenue recognized from time-based subscriptions and games or related content that requires our hosting support in order to utilize the game or related content (
i.e.
, can only be played with an Internet connection). This includes (1) entitlements to content that are accessed through hosting services (
e.g.,
micro-transactions for Internet-based, social network and free-to-download mobile games), (2) massively multi-player online (“MMO”) games (both software game and subscription sales), (3) subscriptions for our Battlefield Premium, EA Access and Pogo-branded online game services, and (4) allocated service revenue from sales of software games with an online service element (
i.e.,
“matchmaking” service). Our other revenue includes advertising and non-software licensing revenue.
With respect to the allocated service revenue from sales of software games with a matchmaking service mentioned above, our allocation of proceeds between product and service revenue for presentation purposes is based on management’s best estimate of the selling price of the matchmaking service with the residual value allocated to product revenue. Our estimate of the selling price of the matchmaking service is comprised of several factors including, but not limited to, prior selling prices for the matchmaking service, prices charged separately by other third-party vendors for similar service offerings, and a cost-plus-margin approach. We review the estimated selling price of the online matchmaking service on a regular basis and use this methodology consistently to allocate revenue between product and service for software game sales with a matchmaking service.
26
We evaluate and recognize revenue when all four of the following criteria are met:
|
•
|
Evidence of an arrangement
. Evidence of an agreement with the customer that reflects the terms and conditions to deliver the related products or services must be present.
|
|
•
|
Fixed or determinable fee
. If a portion of the arrangement fee is not fixed or determinable, we recognize revenue as the amount becomes fixed or determinable.
|
|
•
|
Collection is deemed probable
. Collection is deemed probable if we expect the customer to be able to pay amounts under the arrangement as those amounts become due. If we determine that collection is not probable as the amounts become due, we generally conclude that collection becomes probable upon cash collection.
|
|
•
|
Delivery
. For packaged goods, delivery is considered to occur when a product is shipped and the risk of loss and rewards of ownership have transferred to the customer. For digital downloads, delivery is considered to occur when the software is made available to the customer for download. For services and other, delivery is generally considered to occur as the service is delivered, which is determined based on the underlying service obligation. If there is significant uncertainty of acceptance, revenue is recognized once acceptance is reasonably assured.
|
Online-Enabled Games
The majority of our software games and related content can be connected to the Internet whereby a consumer may be able to download unspecified content or updates on a when-and-if-available basis (“unspecified updates”) for use with the original game software. In addition, we may also offer an online matchmaking service that permits consumers to play against each other via the Internet without a separate fee. U.S. GAAP requires us to account for the consumer’s right to receive unspecified updates or the matchmaking service for no additional fee as a “bundled” sale, or multiple-element arrangement.
We have an established historical pattern of providing unspecified updates (
e.g.,
player roster updates to
Madden NFL 15
) to online-enabled games and related content at no additional charge to the consumer. We do not have vendor-specific objective evidence of fair value (“VSOE”) for these unspecified updates, and thus, as required by U.S. GAAP, we recognize revenue from the sale of these online-enabled games and related content over the period we expect to offer the unspecified updates to the consumer (“estimated offering period”).
Estimated Offering Period
Because the offering period is not an explicitly defined period, we must make an estimate of the offering period. Determining the estimated offering period is inherently subjective and is subject to regular revision based on historical online usage. For example, in determining the estimated offering period for unspecified updates associated with our online-enabled games, we consider the period of time consumers are online as online connectivity is required. On an annual basis, we review consumers’ online gameplay of all online-enabled games that have been released 12 to 24 months prior to the evaluation date. For example, if our evaluation date is April 1, 2014, we evaluate all online-enabled games released between April 1, 2012 and March 31, 2013. Based on this population of games, for all players that register the game online within the first six months of release of the game to the general public, we compute the weighted-average number of days for each online-enabled game, based on when a player initially registers the game online to when that player last plays the game online. We then compute the weighted-average number of days for all online-enabled games by multiplying the weighted-average number of days for each online-enabled game by its relative percentage of total units sold from these online-enabled games (
i.e.,
a game with more units sold will have a higher weighting to the overall computation than a game with fewer units sold). Under a similar computation, we also consider the estimated period of time between the date a game unit is sold to a reseller and the date the reseller sells the game unit to an end consumer (
i.e.,
time in channel). Based on these two calculations we then consider the method of distribution. For example
,
physical software games sold at retail would have a composite offering period equal to the online gameplay plus time in channel as opposed to digitally distributed software games which are delivered immediately via digital download and thus have no concept of channel. Additionally, we consider results from prior analyses, known online gameplay trends, as well as disclosed service periods for competitors’ games in determining the estimated offering period for future sales.
While we consistently apply this methodology, inherent assumptions used in this methodology include which online-enabled games to sample, whether to use only units that have registered online, whether to weight the number of days for each game, whether to weight the days based on the units sold of each game, determining the period of time between the date of sale to reseller and the date of sale to the consumer and assessing online gameplay trends.
27
Prior to July 1, 2013, for most sales, we estimated the offering period to be six months and recognized revenue over this period in the month after delivery. During the three months ended September 30, 2013, we completed our fiscal 2014 annual evaluation of the estimated offering period and noted that generally, consumers were playing our games online over a longer period of time. Based on this, we concluded that for physical software sales made after June 30, 2013, the estimated offering period should be increased to nine months, resulting in revenue being recognized over a longer period of time. This change in estimate resulted in an estimated decrease to net revenue and net income of
$474 million
and a decrease of
$1.50
of diluted earnings per share for fiscal year 2014. During the fiscal year ended March 31, 2015, this change in estimate resulted in an estimated increase to net revenue and net income of
$474 million
and an increase of
$1.46
of diluted earnings per share. The estimated offering period for digitally distributed games did not change and is six months. We completed our fiscal 2015 annual evaluation during the second quarter and determined that the estimated offering period for physical software sales and digital sales continues to be nine months and six months, respectively.
Other Multiple-Element Arrangements
In some of our multiple-element arrangements, we sell tangible products with software and/or software-related offerings. These tangible products are generally either peripherals or ancillary collectors’ items, such as figurines and comic books. Revenue for these arrangements is allocated to each separate unit of accounting for each deliverable using the relative selling prices of each deliverable in the arrangement based on the selling price hierarchy described below. If the arrangement contains more than one software deliverable, the arrangement consideration is allocated to the software deliverables as a group and then allocated to each software deliverable in accordance with ASC 985-605.
We determine the selling price for a tangible product deliverable based on the following selling price hierarchy: VSOE (
i.e.
, the price we charge when the tangible product is sold separately) if available, third-party evidence (“TPE”) of fair value (
i.e.
, the price charged by others for similar tangible products) if VSOE is not available, or our best estimate of selling price (“BESP”) if neither VSOE nor TPE is available. Determining the BESP is a subjective process that is based on multiple factors including, but not limited to, recent selling prices and related discounts, market conditions, customer classes, sales channels and other factors. In accordance with ASC 605, provided the other three revenue recognition criteria other than delivery have been met, we recognize revenue upon delivery to the customer as we have no further obligations.
We must make assumptions and judgments in order to (1) determine whether and when each element is delivered, (2) determine whether VSOE exists for each undelivered element, and (3) allocate the total price among the various elements, as applicable. Changes to any of these assumptions and judgments, or changes to the elements in the arrangement, could cause a material increase or decrease in the amount of revenue that we report in a particular period.
Principal Agent Considerations
In accordance with ASC 605-45,
Revenue Recognition: Principal Agent Considerations
, we evaluate sales of our interactive software games via third party storefronts, including digital storefronts such as Xbox Live Marketplace, Sony PSN, Apple App Store, and Google Play, in order to determine whether or not we are acting as the principal or as an agent, which we consider in determining if revenue should be reported gross or net of fees retained by the storefront. Key indicators that we evaluate in determining gross versus net treatment include but are not limited to the following:
|
•
|
The party responsible for delivery/fulfillment of the product or service to the end consumer
|
|
•
|
The party responsible for the billing, collection of fees and refunds to the consumer
|
|
•
|
The storefront and Terms of Sale that govern the consumer’s purchase of the product or service
|
|
•
|
The party that sets the pricing with the consumer and has credit risk
|
Based on the evaluation of the above indicators, we have determined that we are generally acting as an agent and are not considered the primary obligor to consumers for our interactive software games distributed through third party digital storefronts. We therefore recognize revenue related to these arrangements on a net basis.
Sales Returns and Allowances and Bad Debt Reserves
We reduce revenue primarily for estimated future returns and price protection which may occur with our distributors and retailers (“channel partners”). Price protection represents our practice to provide our channel partners with a credit allowance to lower their wholesale price on a particular product in the channel. The amount of the price protection is generally the difference between the old wholesale price and the new reduced wholesale price. In certain countries for our PC and console packaged goods software products, we also have a practice of allowing channel partners to return older software products in the channel in exchange for a credit allowance. As a general practice, we do not give cash refunds.
28
When evaluating the adequacy of sales returns and price protection allowances, we analyze the following: historical credit allowances, current sell-through of our channel partners’ inventory of our software products, current trends in retail and the video game industry, changes in customer demand, acceptance of our software products, and other related factors. In addition, we monitor the volume of sales to our channel partners and their inventories, as substantial overstocking in the distribution channel could result in high returns or higher price protection in subsequent periods.
In the future, actual returns and price protections may materially exceed our estimates as unsold software products in the distribution channels are exposed to rapid changes in consumer preferences, market conditions or technological obsolescence due to new platforms, product updates or competing software products. While we believe we can make reliable estimates regarding these matters, these estimates are inherently subjective. Accordingly, if our estimates change, our returns and price protection allowances would change and would impact the total net revenue, accounts receivable and deferred net revenue that we report.
We determine our allowance for doubtful accounts by evaluating the following: customer creditworthiness, current economic trends, historical experience, age of current accounts receivable balances, and changes in financial condition or payment terms of our customers. Significant management judgment is required to estimate our allowance for doubtful accounts in any accounting period. The amount and timing of our bad debt expense and cash collection could change significantly as a result of a change in any of the evaluation factors mentioned above.
Fair Value Estimates
The preparation of financial statements in conformity with U.S. GAAP often requires us to determine the fair value of a particular item in order to fairly present our financial statements. Without an independent market or another representative transaction, determining the fair value of a particular item requires us to make several assumptions that are inherently difficult to predict and can have a material impact on the accounting.
There are various valuation techniques used to estimate fair value. These include (1) the market approach where market transactions for identical or comparable assets or liabilities are used to determine the fair value, (2) the income approach, which uses valuation techniques to convert future amounts (for example, future cash flows or future earnings) to a single present value amount, and (3) the cost approach, which is based on the amount that would be required to replace an asset. For many of our fair value estimates, including our estimates of the fair value of acquired intangible assets, we use the income approach. Using the income approach requires the use of financial models, which require us to make various estimates including, but not limited to (1) the potential future cash flows for the asset or liability being measured, (2) the timing of receipt or payment of those future cash flows, (3) the time value of money associated with the expected receipt or payment of such cash flows, and (4) the inherent risk associated with the cash flows (risk premium). Making these cash flow estimates is inherently difficult and subjective, and if any of the estimates used to determine the fair value using the income approach turns out to be inaccurate, our financial results may be negatively impacted. Furthermore, relatively small changes in many of these estimates can have a significant impact to the estimated fair value resulting from the financial models or the related accounting conclusion reached. For example, a relatively small change in the estimated fair value of an asset may change a conclusion as to whether an asset is impaired.
While we are required to make certain fair value assessments associated with the accounting for several types of transactions, the following areas are the most sensitive to these assessments:
Business Combinations
.
We must estimate the fair value of assets acquired, liabilities and contingencies assumed, acquired in-process technology, and contingent consideration issued in a business combination. Our assessment of the estimated fair value of each of these can have a material effect on our reported results as intangible assets are amortized over various estimated useful lives. Furthermore, the estimated fair value assigned to an acquired asset or liability has a direct impact on the amount we recognize as goodwill, which is an asset that is not amortized. Determining the fair value of assets acquired requires an assessment of the highest and best use or the expected price to sell the asset and the related expected future cash flows. Determining the fair value of acquired in-process technology also requires an assessment of our expectations related to the use of that technology. Determining the fair value of an assumed liability requires an assessment of the expected cost to transfer the liability. Determining the fair value of contingent consideration requires an assessment of the probability-weighted expected future cash flows over the period in which the obligation is expected to be settled, and applying a discount rate that appropriately captures the risk associated with the obligation. The significant unobservable inputs used in the fair value measurement of the contingent consideration payable are forecasted earnings. Significant changes in forecasted earnings would result in significantly higher or lower fair value measurement. This fair value assessment is also required in periods subsequent to a business combination. Such estimates are inherently difficult and subjective and can have a material impact on our Consolidated Financial Statements.
29
Assessment of Impairment of Goodwill, Intangibles, and Other Long-Lived Assets.
Current accounting standards require that we assess the recoverability of our finite lived acquisition-related intangible assets and other long-lived assets whenever events or changes in circumstances indicate the remaining value of the assets recorded on our Consolidated Balance Sheets is potentially impaired. In order to determine if a potential impairment has occurred, management must make various assumptions about the estimated fair value of the asset by evaluating future business prospects and estimated future cash flows. For some assets, our estimated fair value is dependent upon predicting which of our products will be successful. This success is dependent upon several factors, such as which operating platforms will be successful in the marketplace. Also, our revenue and earnings are dependent on our ability to meet our product release schedules. Judgments and assumptions about future cash flows and remaining useful lives are complex and often subjective. They can be affected by a variety of factors, including but not limited to, significant negative industry or economic trends, significant changes in the manner of our use of the assets or the strategy of our overall business and significant under-performance relative to projected future operating results. When we consider such assets to be impaired, the amount of impairment we recognize is measured by the amount by which the carrying amount of the asset exceeds its fair value.
In assessing impairment on our goodwill, we first analyze qualitative factors to determine whether it is more likely than not that the fair value of a reporting unit is less than its carrying amount as a basis for determining whether it is necessary to perform the two-step goodwill impairment test. The qualitative factors we assess include long-term prospects of our performance, share price trends and market capitalization, and Company specific events. If we conclude it is more likely than not that the fair value of a reporting unit exceeds its carrying amount, we do not need to perform the two-step impairment test. If based on that assessment, we believe it is more likely than not that the fair value of the reporting unit is less than its carrying value, a two-step goodwill impairment test will be performed. The first step measures for impairment by applying fair value-based tests at the reporting unit level. The second step (if necessary) measures the amount of impairment by applying fair value-based tests to the individual assets and liabilities within each reporting unit. Reporting units are determined by the components of operating segments that constitute a business for which (1) discrete financial information is available, (2) segment management regularly reviews the operating results of that component, and (3) whether the component has dissimilar economic characteristics to other components.
As of our last annual assessment of goodwill in the fourth quarter of fiscal year 2015, we determined that it was more likely than not that the fair value of our reporting unit exceeded its carrying amount and, as such, we did not need to perform the two-step impairment test. We have not identified any indicators of impairment since that assessment.
Our business consists of developing, marketing and distributing video game software content and services using both established and emerging intellectual properties and our forecasts for emerging intellectual properties are based upon internal estimates and external sources rather than historical information and have an inherently higher risk of inaccuracy. If future forecasts are revised, they may indicate or require future impairment charges. We base our fair value estimates on assumptions we believe to be reasonable, but that are unpredictable and inherently uncertain. Actual future results may differ from those estimates.
Royalties and Licenses
Our royalty expenses consist of payments to (1) content licensors, (2) independent software developers, and (3) co-publishing and distribution affiliates. License royalties consist of payments made to celebrities, professional sports organizations, movie studios and other organizations for our use of their trademarks, copyrights, personal publicity rights, content and/or other intellectual property. Royalty payments to independent software developers are payments for the development of intellectual property related to our games. Co-publishing and distribution royalties are payments made to third parties for the delivery of products.
Royalty-based obligations with content licensors and distribution affiliates are either paid in advance and capitalized as prepaid royalties or are accrued as incurred and subsequently paid. These royalty-based obligations are generally expensed to cost of revenue generally at the greater of the contractual rate or an effective royalty rate based on the total projected net revenue for contracts with guaranteed minimums. Significant judgment is required to estimate the effective royalty rate for a particular contract. Because the computation of effective royalty rates requires us to project future revenue, it is inherently subjective as our future revenue projections must anticipate a number of factors, including (1) the total number of titles subject to the contract, (2) the timing of the release of these titles, (3) the number of software units and amount of extra content that we expect to sell, which can be impacted by a number of variables, including product quality, number of platforms we release on, the timing of the title’s release and competition, and (4) future pricing. Determining the effective royalty rate for our titles is particularly challenging due to the inherent difficulty in predicting the popularity of entertainment products. Furthermore, if we
30
conclude that we are unable to make a reasonably reliable forecast of projected net revenue, we recognize royalty expense at the greater of contract rate or on a straight-line basis over the term of the contract. Accordingly, if our future revenue projections change, our effective royalty rates would change, which could impact the amount and timing of royalty expense we recognize.
Prepayments made to thinly capitalized independent software developers and co-publishing affiliates are generally made in connection with the development of a particular product, and therefore, we are generally subject to development risk prior to the release of the product. Accordingly, payments that are due prior to completion of a product are generally expensed to research and development over the development period as the services are incurred. Payments due after completion of the product (primarily royalty-based in nature) are generally expensed as cost of revenue.
Our contracts with some licensors include minimum guaranteed royalty payments, which are initially recorded as an asset and as a liability at the contractual amount when no performance remains with the licensor. When performance remains with the licensor, we record guarantee payments as an asset when actually paid and as a liability when incurred, rather than recording the asset and liability upon execution of the contract. Royalty liabilities are classified as current liabilities to the extent such royalty payments are contractually due within the next 12 months.
Each quarter, we also evaluate the expected future realization of our royalty-based assets, as well as any unrecognized minimum commitments not yet paid to determine amounts we deem unlikely to be realized through product and service sales. Any impairments or losses determined before the launch of a product are generally charged to research and development expense. Impairments or losses determined post-launch are charged to cost of revenue. We evaluate long-lived royalty-based assets for impairment using undiscounted cash flows when impairment indicators exist. If impairment exists, then the assets are written down to fair value. Unrecognized minimum royalty-based commitments are accounted for as executory contracts, and therefore, any losses on these commitments are recognized when the underlying intellectual property is abandoned (
i.e.
, cease use) or the contractual rights to use the intellectual property are terminated.
Income Taxes
We recognize deferred tax assets and liabilities for both the expected impact of differences between the financial statement amount and the tax basis of assets and liabilities and for the expected future tax benefit to be derived from tax losses and tax credit carryforwards. We record a valuation allowance against deferred tax assets when it is considered more likely than not that all or a portion of our deferred tax assets will not be realized. In making this determination, we are required to give significant weight to evidence that can be objectively verified. It is generally difficult to conclude that a valuation allowance is not needed when there is significant negative evidence, such as cumulative losses in recent years. Forecasts of future taxable income are considered to be less objective than past results. Therefore, cumulative losses weigh heavily in the overall assessment.
In addition to considering forecasts of future taxable income, we are also required to evaluate and quantify other possible sources of taxable income in order to assess the realization of our deferred tax assets, namely the reversal of existing deferred tax liabilities, the carry back of losses and credits as allowed under current tax law, and the implementation of tax planning strategies. Evaluating and quantifying these amounts involves significant judgments. Each source of income must be evaluated based on all positive and negative evidence; this evaluation involves assumptions about future activity. Certain taxable temporary differences that are not expected to reverse during the carry forward periods permitted by tax law cannot be considered as a source of future taxable income that may be available to realize the benefit of deferred tax assets.
In
fiscal year 2015
, we reported U.S. pre-tax income, compared to pre-tax losses in each of the last seven fiscal years. We have not yet been able to establish a sustained level of profitability in the U.S. or other sufficient significant positive evidence to conclude that our U.S. deferred tax assets are more likely than not to be realized. Therefore, we continue to maintain a valuation allowance against most of our U.S. deferred tax assets. It is reasonably possible that in fiscal year 2016 we will establish a sustained level of profitability in the U.S. As a result, it is possible that a significant portion of the $539 million valuation allowance recorded against our U.S. deferred tax assets at
March 31, 2015
could be reversed by the end of fiscal year 2016.
In the ordinary course of our business, there are many transactions and calculations where the tax law and ultimate tax determination is uncertain. As part of the process of preparing our Consolidated Financial Statements, we are required to estimate our income taxes in each of the jurisdictions in which we operate prior to the completion and filing of tax returns for such periods. This process requires estimating both our geographic mix of income and our uncertain tax positions in each jurisdiction where we operate. These estimates involve complex issues and require us to make judgments about the likely application of the tax law to our situation, as well as with respect to other matters, such as anticipating the positions that we will take on tax returns prior to our actually preparing the returns and the outcomes of disputes with tax authorities. The ultimate
31
resolution of these issues may take extended periods of time due to examinations by tax authorities and statutes of limitations. In addition, changes in our business, including acquisitions, changes in our international corporate structure, changes in the geographic location of business functions or assets, changes in the geographic mix and amount of income, as well as changes in our agreements with tax authorities, valuation allowances, applicable accounting rules, applicable tax laws and regulations, rulings and interpretations thereof, developments in tax audit and other matters, and variations in the estimated and actual level of annual pre-tax income can affect the overall effective income tax rate.
Impact of Recently Issued Accounting Standards
In April 2015, the FASB issued ASU 2015-03,
Interest - Imputation of Interest
(Topic 835-30), which requires that debt issuance costs related to a recognized debt liability be presented in the balance sheet as a direct deduction from the carrying amount of that debt liability, consistent with debt discounts. The recognition and measurement guidance for debt issuance costs are not affected by this ASU. The disclosure requirements will be effective for annual periods (and interim periods within those annual periods) beginning after December 15, 2015, and will require retrospective application. Early adoption is permitted. We do not expect the adoption to have a material impact on our Consolidated Financial Statements.
In May 2014, the FASB issued ASU No. 2014-09,
Revenue from Contracts with Customers
(Topic 606), which requires an entity to recognize the amount of revenue to which it expects to be entitled for the transfer of promised goods or services to customers. The ASU will replace most existing revenue recognition guidance in U.S. GAAP when it becomes effective. The standard permits the use of either the retrospective or cumulative effect transition method. The Company is evaluating the effect that ASU 2014-09 will have on its Consolidated Financial Statements and related disclosures. The Company has not yet selected a transition method nor has it determined the effect of the standard on its ongoing financial reporting. The new standard is effective for annual reporting periods beginning after December 15, 2016. Early application is not permitted. We are required to adopt this standard in the first quarter of fiscal year 2018; however, in April 2015, the FASB issued an exposure draft that would provide us with the option to adopt in either the first quarter of fiscal year 2018 or fiscal year 2019. We have not determined which of these two fiscal years we would adopt if the exposure draft is issued as final in its current form.
32
RESULTS OF OPERATIONS
Our fiscal year is reported on a 52- or 53-week period that ends on the Saturday nearest March 31. Our results of operations for the
fiscal years ended March 31, 2015, 2014 and 2013
each contained 52 weeks and ended on
March 28, 2015, March 29, 2014, and March 30, 2013
, respectively. For simplicity of disclosure, all fiscal periods are referred to as ending on a calendar month-end.
Net Revenue
Net revenue consists of sales generated from (1) video games sold as packaged goods or as digital downloads and designed for play on video game consoles (such as the PlayStation 3 and 4 from Sony, and the Xbox 360 and One from Microsoft) and PCs, (2) video games for mobile phones and tablets, (3) separate software products and content and online game services associated with these products, (4) licensing our game software to third parties, (5) allowing other companies to manufacture and sell our products in conjunction with other products, and (6) advertisements on our online web pages and in our games.
We provide two different measures of our Net Revenue. One of these measures is presented in accordance with U.S. GAAP - Net Revenue by Product revenue and Service and other revenue. The second measure is a non-GAAP financial measure - Net Revenue before Revenue Deferral by Revenue Composition, which is primarily based on method of distribution. We use this second non-GAAP financial measure internally to evaluate our operating performance, when planning, forecasting and analyzing future periods, and when assessing the performance of our management team.
Management places a greater emphasis and focus on assessing our business through a review of the Net Revenue before Revenue Deferral by Revenue Composition than by Net Revenue by Product revenue and Service and other revenue. These two measures differ as (1) Net Revenue by Product revenue and Service and other revenue reflects the deferral and recognition of revenue in periods subsequent to the date of sale due to U.S. GAAP while Net Revenue before Revenue Deferral by Revenue Composition does not, and (2) both measures contain a different aggregation of sales from one another. For instance, Service and other revenue does not include a portion of our full-game digital download and mobile sales that are fully included in our Digital revenue. Further, Service and other revenue includes all of our revenue associated with MMO games while software sales associated with our MMOs are included in either Digital revenue or Packaged goods and other revenue depending on whether the sale was a full-game digital download or a packaged goods sale.
Comparison of Fiscal Year 2015 to Fiscal Year 2014
Net Revenue
For
fiscal year 2015
, net revenue was
$4,515 million
and
increased
$940 million
, or
26 percent
, as compared to
fiscal year 2014
. This increase was driven by a $1,481 million increase in revenue primarily from the FIFA and Madden NFL franchises, and
Titanfall.
This increase was partially offset by a $541 million decrease in revenue primarily from the SimCity, Crysis, Dead Space, and NCAA Football franchises, and
Star Wars: The Old Republic.
Net Revenue by Product Revenue and Service and Other Revenue
Our net revenue by product revenue and service and other revenue for
fiscal years 2015 and 2014
was as follows (in millions):
|
Year Ended March 31,
|
||||||||||||||
|
2015
|
2014
|
$ Change
|
% Change
|
|||||||||||
|
Net revenue:
|
||||||||||||||
|
Product
|
$
|
2,568
|
|
$
|
2,134
|
|
$
|
434
|
|
20
|
%
|
|||
|
Service and other
|
$
|
1,947
|
|
$
|
1,441
|
|
$
|
506
|
|
35
|
%
|
|||
|
Total net revenue
|
$
|
4,515
|
|
$
|
3,575
|
|
$
|
940
|
|
26
|
%
|
|||
Product Revenue
For
fiscal year 2015
, product revenue was
$2,568 million
, primarily driven by
FIFA 15
,
FIFA 14
and
Battlefield 4
. Product revenue
increased
$434 million
, or
20 percent
, as compared to
fiscal year 2014
. This increase was driven by an $837 million increase primarily from the FIFA, Madden NFL and Dragon Age franchises. This increase was partially offset by a $403 million decrease primarily from the Crysis, Dead Space, NCAA Football, Tiger Woods PGA Tour and Army of Two franchises.
33
Service and Other Revenue
For
fiscal year 2015
, service and other revenue was
$1,947 million
, primarily driven by
FIFA Ultimate Team, Titanfall,
and
Battlefield 4 Premium
. Service and other revenue for
fiscal year 2015
increased
$506 million
, or
35 percent
, as compared to
fiscal year 2014
. This increase was driven by a $660 million increase primarily from
Titanfall
and the FIFA and Plants vs Zombies franchises. This increase was partially offset by a $154 million decrease primarily from SimCity franchise,
Star Wars: The Old Republic,
and Pogo-branded online games services
.
Supplemental Non-GAAP Net Revenue by Revenue Composition
As we continue to evolve our business and more of our products are delivered to consumers digitally via the Internet, we place a greater emphasis and focus on assessing our business through a review of net revenue by revenue composition.
Net Revenue before Revenue Deferral, a non-GAAP financial measure that excludes the impact of Revenue Deferral and the Recognition of Revenue Deferral on Net Revenue related to sales of online-enabled games and content, is provided in this section of MD&A, including a discussion of the components of this measure: (1) packaged goods and other and (2) the components that comprise our digital revenue. A reconciliation to the corresponding measure calculated in accordance with U.S. GAAP is provided in the discussion below.
“Revenue Deferral” in this “Net Revenue” section generally relates to sales of online-enabled games and content for which we do not have VSOE for unspecified updates to be delivered after the initial sale or for which we have a continuing service obligation. Fluctuations in the Revenue Deferral are largely dependent upon the amounts of products that we sell with the online features and services previously discussed, while the Recognition of Revenue Deferral for a period is also dependent upon (1) the amount deferred, (2) the period of time the software-related offerings and service obligations are to be provided, and (3) the timing of the sale.
Our sales are generally deferred and recognized over an estimated nine-month period beginning in the month after shipment for physical games sold through retail and an estimated six-month period for digitally delivered games and content, and therefore, the related revenue recognized during the fiscal quarter ended March 31 is primarily due to sales that occurred during the preceding six-month period for digitally delivered games and content, and the preceding nine-month period for physical games sold through retail. Consequently, most Revenue Deferrals incurred in the first quarter of a fiscal year are recognized within the same fiscal year; however, substantially all of the Revenue Deferrals incurred in the last month of a fiscal year will be recognized in the subsequent fiscal year.
We believe that excluding the impact of Revenue Deferral and the Recognition of Revenue Deferral related to online-enabled games and content from our operating results is important to facilitate comparisons between periods in understanding our underlying sales performance for the period, and understanding our operations because all related costs of revenues are expensed as incurred instead of deferred and recognized ratably. We use this non-GAAP financial measure internally to evaluate our operating performance, when planning, forecasting and analyzing future periods, and when assessing the performance of our management team. While we believe that this non-GAAP financial measure is useful in evaluating our business, this information should be considered as supplemental in nature and is not meant to be considered in isolation from or as a substitute for the related financial information prepared in accordance with GAAP. In addition, this non-GAAP financial measure may not be the same as non-GAAP financial measures presented by other companies.
34
Our non-GAAP net revenue by revenue composition and the reconciliation to net revenue for
fiscal years 2015 and 2014
was as follows (in millions):
|
Year Ended March 31,
|
||||||||||||||
|
2015
|
2014
|
$ Change
|
% Change
|
|||||||||||
|
Packaged goods and other
|
$
|
2,089
|
|
$
|
2,228
|
|
$
|
(139
|
)
|
(6
|
)%
|
|||
|
Full-game downloads
|
419
|
|
323
|
|
96
|
|
30
|
%
|
||||||
|
Extra content
|
925
|
|
760
|
|
165
|
|
22
|
%
|
||||||
|
Subscriptions, advertising, and other
|
362
|
|
258
|
|
104
|
|
40
|
%
|
||||||
|
Mobile
|
524
|
|
452
|
|
72
|
|
16
|
%
|
||||||
|
Total Digital
|
2,230
|
|
1,793
|
|
437
|
|
24
|
%
|
||||||
|
Net Revenue before Revenue Deferral (Non-GAAP Net Revenue)
|
$
|
4,319
|
|
$
|
4,021
|
|
$
|
298
|
|
7
|
%
|
|||
|
Revenue Deferral
|
(3,536
|
)
|
(3,350
|
)
|
(186
|
)
|
(6
|
)%
|
||||||
|
Recognition of Revenue Deferral
|
3,732
|
|
2,904
|
|
828
|
|
29
|
%
|
||||||
|
Change in deferred net revenue (online-enabled games)
|
196
|
|
(446
|
)
|
642
|
|
144
|
%
|
||||||
|
Total net revenue
|
$
|
4,515
|
|
$
|
3,575
|
|
$
|
940
|
|
26
|
%
|
|||
Net Revenue before Revenue Deferral
Packaged goods and other
Packaged goods revenue includes sales of software that is distributed physically. This includes (1) sales of our internally-developed and co-published game software distributed physically through traditional channels such as brick and mortar retailers, (2) our software licensing revenue from third parties (for example, makers of personal computers or computer accessories) who include certain of our products for sale with their products (“OEM bundles”), and (3) sales through our Switzerland distribution business. Other revenue includes our non-software licensing revenue.
For
fiscal year 2015
, packaged goods and other Net Revenue before Revenue Deferral was
$2,089 million
, primarily driven by
FIFA 15
,
Madden NFL 15
, and
Dragon Age: Inquisition
. Packaged goods and other Net Revenue before Revenue Deferral for
fiscal year 2015
decreased
$139 million
, or
6 percent
, as compared to
fiscal year 2014
. This decrease was driven by a $650 million decrease in sales primarily from the Battlefield, Need for Speed and NCAA Football franchises
.
This decrease was partially offset by a $511 million increase in sales primarily from the Dragon Age, FIFA, and FIFA World Cup franchises
.
Digital
Digital revenue includes sales of software distributed through direct download via the Internet. This includes full-game downloads, extra content, subscriptions, advertising and other, and mobile revenue. Digital revenue includes internally-developed and co-published game software distributed through our direct-to-consumer platform Origin, distributed wirelessly through mobile carriers, or licensed to our third-party publishing partners who distribute our games digitally. Full-game downloads are generally classified as product revenue with the exception of our MMO and full-game downloads related to games that require our hosting support in order to utilize the game or related content (e.g.
Titanfall
and
Plants vs. Zombies: Garden Warfare
), which are classified as service revenue. Subscriptions, advertising and other revenue and free-to-download mobile games are each generally classified as service and other revenue.
For
fiscal year 2015
, digital Net Revenue before Revenue Deferral was
$2,230 million
, an increase of
$437 million
, or
24%
, as compared to
fiscal year 2014
. This increase is due to (1) a $96 million or 30 percent increase in full-game download sales primarily driven by
Dragon Age: Inquisition
,
FIFA 15
and
The Sims 4,
(2) a $165 million or 22 percent increase in extra content and free-to-download sales primarily driven by
FIFA Ultimate Team
and
Madden Ultimate Team,
(3) a $104 million or 40 percent increase in subscription sales primarily driven by
Battlefield 4 Premium
, and (4) a $72 million or 16 percent increase in mobile revenue primarily driven by
Madden NFL Mobile
,
Simcity BuildIt
,
FIFA 15 Mobile
, and
FIFA Online 3.
35
Revenue Deferral
Revenue Deferral for
fiscal year 2015
increased
$186 million
, or
6 percent
, as compared to
fiscal year 2014
. This increase was primarily due to a $298 million increase in Net Revenue before Revenue Deferral related to our packaged goods and other and digital sales during
fiscal year 2015
as compared to
fiscal year 2014
.
Recognition of Revenue Deferral
The Recognition of Revenue Deferral for
fiscal year 2015
increased
$828 million
, or
29 percent
, as compared to
fiscal year 2014
. This increase was primarily due to (1) the increase in our estimated offering period from six to nine months, which was implemented during the second quarter of fiscal year 2014 for packaged goods sold through retail, and (2) an increase in digital and packaged goods sales during the preceding six and nine-month period. The change in estimated offering period resulted in an estimated increase to net revenue and net income of
$474 million
and an increase of
$1.46
of diluted earnings per share for the
fiscal year ended March 31, 2015
.
Cost of Revenue
Cost of revenue for
fiscal years 2015 and 2014
was as follows (in millions):
|
March 31,
2015 |
% of
Related
Net Revenue
|
March 31,
2014 |
% of
Related
Net Revenue
|
% Change
|
Change as a
% of Related
Net Revenue
|
||||||||||||||
|
Cost of revenue:
|
|||||||||||||||||||
|
Product
|
$
|
1,028
|
|
40.0
|
%
|
$
|
1,032
|
|
48.4
|
%
|
(0.4
|
)%
|
(8.4
|
)%
|
|||||
|
Service and other
|
401
|
|
20.6
|
%
|
315
|
|
21.9
|
%
|
27.3
|
%
|
(1.3
|
)%
|
|||||||
|
Total cost of revenue
|
$
|
1,429
|
|
31.7
|
%
|
$
|
1,347
|
|
37.7
|
%
|
6.1
|
%
|
(6.0
|
)%
|
|||||
Cost of Product Revenue
Cost of product revenue consists of (1) product costs, (2) certain royalty expenses for celebrities, professional sports and other organizations, and independent software developers, (3) manufacturing royalties, net of volume discounts and other vendor reimbursements, (4) expenses for defective products, (5) write-offs of post-launch prepaid royalty costs and losses on previously unrecognized licensed intellectual property commitments, (6) amortization of certain intangible assets, (7) personnel-related costs, and (8) warehousing and distribution costs. We generally recognize volume discounts when they are earned from the manufacturer (typically in connection with the achievement of unit-based milestones); whereas other vendor reimbursements are generally recognized as the related revenue is recognized.
Cost of product revenue
decreased
by
$4 million
, or
0.4 percent
in
fiscal year 2015
, as compared to
fiscal year 2014
. Cost of product revenue decreased primarily due to an increase in net revenue before revenue deferral from our digital product sales that generally have lower costs than our packaged goods and other product sales during
fiscal year 2015
, as compared to the
fiscal year 2014
, partially offset by a loss of $122 million on a previously unrecognized licensed intellectual property commitment recognized during the three months ended June 30, 2014.
Cost of Service and Other Revenue
Cost of service and other revenue consists primarily of (1) royalty costs, (2) data center, bandwidth and server costs associated with hosting our online games and websites, (3) platform processing fees from operating our website-based games on third party platforms, and (4) credit card fees associated with our service revenue.
Cost of service and other revenue
increased
by
$86 million
, or
27.3 percent
in
fiscal year 2015
, as compared to
fiscal year 2014
. The increase was primarily due to an increase in royalty-related costs due to
FIFA Ultimate Team
,
Madden Ultimate Team
, and
Titanfall
.
Total Cost of Revenue as a Percentage of Total Net Revenue
During the
fiscal year ended March 31, 2015
, total cost of revenue as a percentage of total net revenue decreased by
6.0 percent
as compared to the
fiscal year ended March 31, 2014
. Excluding the loss of $122 million on previously unrecognized license intellectual property recognized during three months ended June 30, 2014, total cost of revenue as a percentage of total net revenue decreased 8.8 percent as a result of an increase in our digital products and services that generally have a lower cost than our packaged goods and other products.
36
Research and Development
Research and development expenses consist of expenses incurred by our production studios for personnel-related costs, related overhead costs, contracted services, depreciation and any impairment of prepaid royalties for pre-launch products. Research and development expenses for our online products include expenses incurred by our studios consisting of direct development and related overhead costs in connection with the development and production of our online games. Research and development expenses also include expenses associated with our digital platform, software licenses and maintenance, and management overhead.
Research and development expenses for
fiscal years 2015 and 2014
were as follows (in millions):
|
March 31,
2015 |
% of Net
Revenue
|
March 31,
2014 |
% of Net
Revenue
|
$ Change
|
% Change
|
||||||||||||||
|
$
|
1,094
|
|
24
|
%
|
$
|
1,125
|
|
31
|
%
|
$
|
(31
|
)
|
(3
|
)%
|
|||||
Research and development expenses
decreased
by
$31 million
, or
3 percent
, in fiscal year 2015, as compared to fiscal year 2014. Excluding the $20 million positive impact of foreign currency exchange rates due to translation and related cash flow hedging activities, we estimate that research and development would have decreased by $11 million. This $11 million decrease was primarily due to a $15 million decrease in personnel-related costs resulting from a reduction in headcount and a $17 million decrease in contracted services as a result of higher development contracted services in fiscal year 2014 due to
Titanfall
,
Battlefield 4
, and
EA Sports
UFC
as compared to the current fiscal year. These decreases were partially offset by a $21 million increase in facility-related costs primarily due to $6 million in operating costs for new office expansions and $5 million in certain facility closures.
Marketing and Sales
Marketing and sales expenses consist of personnel-related costs, related overhead costs, advertising, marketing and promotional expenses, net of qualified advertising cost reimbursements from third parties.
Marketing and sales expenses for
fiscal years 2015 and 2014
were as follows (in millions):
|
March 31,
2015 |
% of Net
Revenue
|
March 31,
2014 |
% of Net
Revenue
|
$ Change
|
% Change
|
||||||||||||||
|
$
|
647
|
|
14
|
%
|
$
|
680
|
|
19
|
%
|
$
|
(33
|
)
|
(5
|
)%
|
|||||
Marketing and sales expenses
decreased
by
$33 million
, or
5 percent
, in fiscal year 2015, as compared to fiscal year 2014. The decrease was primarily due to (1) a $9 million decrease in personnel-related costs, (2) a $10 million decrease in facility-related costs, and (3) a $9 million decrease in contracted services due to fewer frontline title releases during fiscal year 2015 than during fiscal year 2014.
General and Administrative
General and administrative expenses consist of personnel and related expenses of executive and administrative staff, corporate functions such as finance, legal, human resources, and information technology (“IT”), related overhead costs, fees for professional services such as legal and accounting, and allowances for doubtful accounts.
General and administrative expenses for
fiscal years 2015 and 2014
were as follows (in millions):
|
March 31,
2015 |
% of Net
Revenue
|
March 31,
2014 |
% of Net
Revenue
|
$ Change
|
% Change
|
||||||||||||||
|
$
|
386
|
|
9
|
%
|
$
|
410
|
|
11
|
%
|
$
|
(24
|
)
|
(6
|
)%
|
|||||
General and administrative expenses
decreased
by
$24 million
, or
6 percent
, in fiscal year 2015, as compared to fiscal year 2014, primarily due to a $30 million expense related to the settlement of a litigation matter during the fiscal year ended March 31, 2014 and an $23 million decrease in costs incurred on a license, both related to our college football franchise. This was partially offset by an $11 million increase primarily related to other litigation matters and a $16 million increase in personnel-related costs during the
fiscal year ended March 31, 2015
.
37
Acquisition-Related Contingent Consideration
Acquisition-related contingent consideration for
fiscal years 2015 and 2014
were as follows (in millions):
|
March 31,
2015 |
% of Net
Revenue
|
March 31,
2014 |
% of Net
Revenue
|
$ Change
|
% Change
|
||||||||||||
|
(3
|
)
|
—
|
%
|
(35
|
)
|
(1
|
)%
|
$
|
32
|
|
91
|
%
|
|||||
During fiscal year 2015, acquisition-related contingent consideration credits decreased by
$32 million
, or
91 percent
, as compared to fiscal year 2014, primarily resulting from changes in the fair market value of the acquisition-related contingent consideration of our PopCap acquisition during fiscal year 2014. The PopCap earn-out expired on December 31, 2013. No payments were made under this earn-out.
Income Taxes
Provision for (benefit from) income taxes for fiscal years 2015 and 2014 was as follows (in millions):
|
March 31, 2015
|
Effective Tax Rate
|
March 31, 2014
|
Effective Tax Rate
|
|||||||||
|
$
|
50
|
|
5.4
|
%
|
$
|
(1
|
)
|
(14.3
|
)%
|
|||
Our effective tax rate for fiscal year 2015 was a tax expense of 5.4 percent. The
fiscal year 2015
effective tax rate differs from the statutory rate of 35.0 percent primarily due to the utilization of U.S. deferred tax assets, which were subject to a valuation allowance, excess tax benefits from stock-based compensation deductions allocated directly to contributed capital, and non-U.S. profits subject to a reduced or zero tax rates. The provision for income taxes for fiscal year 2015 differs from the benefit from income taxes for
fiscal year 2014
primarily due to benefits related to the expiration of statutes of limitations and the resolution of examinations by taxing authorities recorded in
fiscal year 2014
.
Our effective tax rate for the
fiscal year 2014
differs from the statutory rate of 35.0 percent as a result of the utilization of U.S. deferred tax assets subject to a valuation allowance and tax benefits related to the expiration of statutes of limitations and the resolution of examinations by taxing authorities.
Our effective income tax rates for fiscal year 2016 and future periods will depend on a variety of factors, including changes in the deferred tax valuation allowance, changes in our business such as acquisitions and intercompany transactions, changes in our international structure, changes in the geographic location of business functions or assets, changes in the geographic mix of income, changes in or termination of our agreements with tax authorities, applicable accounting rules, applicable tax laws and regulations, rulings and interpretations thereof, developments in tax audit and other matters, and variations in our annual pre-tax income or loss. We incur certain tax expenses that do not decline proportionately with declines in our pre-tax consolidated income or loss. As a result, in absolute dollar terms, our tax expense will have a greater influence on our effective tax rate at lower levels of pre-tax income or loss than at higher levels. In addition, at lower levels of pre-tax income or loss, our effective tax rate will be more volatile.
Certain taxable temporary differences that are not expected to reverse during the carry forward periods permitted by tax law have not been considered as a source of future taxable income that is available to realize the benefit of deferred tax assets.
Historically, we have considered undistributed earnings of our foreign subsidiaries to be indefinitely reinvested outside of the United States and, accordingly, no U.S. taxes have been provided thereon. We currently intend to continue to indefinitely reinvest the undistributed earnings of our foreign subsidiaries outside of the United States.
Comparison of Fiscal Year 2014 to Fiscal Year 2013
Net Revenue
For fiscal year 2014, Net Revenue was $3,575 million and decreased $222 million, or 6 percent, as compared to fiscal year 2013. This decrease was driven by a $745 million decrease in revenue primarily from the Mass Effect, Madden NFL, Medal of Honor, The Sims, and FIFA Street franchises. This decrease was partially offset by a $523 million increase in revenue primarily from the Battlefield, SimCity, Crysis franchises, and
The Simpsons: Tapped Out.
38
Net Revenue by Product Revenue and Service and Other Revenue
Our net revenue by product revenue and service and other revenue for fiscal years 2014 and 2013 was as follows (in millions):
|
Year Ended March 31,
|
||||||||||||||
|
2014
|
2013
|
$ Change
|
% Change
|
|||||||||||
|
Net revenue:
|
||||||||||||||
|
Product
|
$
|
2,134
|
|
$
|
2,738
|
|
$
|
(604
|
)
|
(22
|
)%
|
|||
|
Service and other
|
$
|
1,441
|
|
$
|
1,059
|
|
$
|
382
|
|
36
|
%
|
|||
|
Total net revenue
|
$
|
3,575
|
|
$
|
3,797
|
|
$
|
(222
|
)
|
(6
|
)%
|
|||
Product Revenue
For fiscal year 2014, product revenue was $2,134 million, primarily driven by
FIFA 14
,
Battlefield 4
, and
FIFA 13
. Product revenue decreased $604 million, or 22 percent, as compared to fiscal year 2013. This decrease was driven by an $842 million decrease primarily from the Mass Effect, Madden NFL, FIFA, Medal of Honor, and FIFA Street franchises. This decrease was partially offset by a $238 million increase primarily from the Battlefield, Dead Space, and Crysis franchises.
Service and Other Revenue
For fiscal year 2014, service and other revenue was $1,441 million, primarily driven by
FIFA Ultimate Team, Star Wars: The Old Republic,
and
SimCity
. Service and other revenue for fiscal year 2014 increased $382 million, or 36 percent, as compared to fiscal year 2013. This increase was driven by a $468 million increase primarily from the FIFA and SimCity franchises, and
The Simpsons: Tapped Out
. This increase was partially offset by an $86 million decrease primarily from lower revenue from
The Sims Social
, which shut down in June 2013,
Star Wars: The Old Republic,
as well as Pogo-branded online game services.
Supplemental Non-GAAP Net Revenue by Revenue Composition
Our non-GAAP net revenue by revenue composition and the reconciliation to net revenue for
fiscal years 2014 and 2013
was as follows (in millions):
|
Year Ended March 31,
|
||||||||||||||
|
2014
|
2013
|
$ Change
|
% Change
|
|||||||||||
|
Packaged goods and other
|
$
|
2,228
|
|
$
|
2,130
|
|
$
|
98
|
|
5
|
%
|
|||
|
Full-game downloads
|
323
|
|
221
|
|
102
|
|
46
|
%
|
||||||
|
Extra content
|
760
|
|
654
|
|
106
|
|
16
|
%
|
||||||
|
Subscriptions, advertising, and other
|
258
|
|
425
|
|
(167
|
)
|
(39
|
)%
|
||||||
|
Mobile
|
452
|
|
363
|
|
89
|
|
25
|
%
|
||||||
|
Total Digital
|
1,793
|
|
1,663
|
|
130
|
|
8
|
%
|
||||||
|
Net Revenue before Revenue Deferral (Non-GAAP Net Revenue)
|
$
|
4,021
|
|
$
|
3,793
|
|
$
|
228
|
|
6
|
%
|
|||
|
Revenue Deferral
|
(3,350
|
)
|
(3,022
|
)
|
(328
|
)
|
(11
|
)%
|
||||||
|
Recognition of Revenue Deferral
|
2,904
|
|
3,026
|
|
(122
|
)
|
(4
|
)%
|
||||||
|
Change in deferred net revenue (online-enabled games)
|
(446
|
)
|
4
|
|
(450
|
)
|
(11,250
|
)%
|
||||||
|
Total net revenue
|
$
|
3,575
|
|
$
|
3,797
|
|
$
|
(222
|
)
|
(6
|
)%
|
|||
39
Net Revenue before Revenue Deferral
Packaged goods and other Revenue
For fiscal year 2014, packaged goods and other Net Revenue before Revenue Deferral was $2,228 million, primarily driven by
FIFA 14
,
Battlefield 4, and Madden NFL 25
. Packaged goods and other Net Revenue before Revenue Deferral for fiscal year 2014 increased $98 million, or 5 percent, as compared to fiscal year 2013. This increase was driven by a $653 million increase in sales primarily from the Battlefield and FIFA franchises, and
Titanfall.
This increase was partially offset by a $555 million decrease in sales primarily from the Medal of Honor, The Sims, Crysis, and Dead Space franchises and decrease in sales from
The Secret World
and our Switzerland distribution business.
Digital Revenue
For fiscal year 2014, digital Net Revenue before Revenue Deferral was $1,793 million, an increase of $130 million, or 8%, as compared to fiscal year 2013. This increase is due to (1) a $297 million or 24 percent increase in full-game download, extra content and free-to-download sales primarily driven by
FIFA 14
,
Battlefield 4
, and
FIFA Online 3.
These increases were partially offset by a $167 million or 39 percent decrease in subscription sales primarily driven by
Battlefield 3
Premium
subscription,
Star Wars: The Old Republic
and
FIFA 13
.
In fiscal year 2013,
Star Wars: The Old Republic
was a subscription-only based MMO. In fiscal year 2014, some of the revenue from this title was recognized in the free-to-download category as we expanded this title to be both a subscription and free-to-download game.
Revenue Deferral
Revenue Deferral for fiscal year 2014 increased $328 million, or 11 percent, as compared to fiscal year 2013. Substantially all of this increase was due to a $251 million increase in Net Revenue before Revenue Deferral related to our packaged goods and other and digital sales during fiscal year 2014 as compared to fiscal year 2013, and a slightly higher percentage of both our packaged goods and other and digital sales being deferred and recognized over time.
Recognition of Revenue Deferral
The Recognition of Revenue Deferral for fiscal year 2014 decreased $122 million, or 4 percent, as compared to fiscal year 2013, primarily due to the increase in our estimated offering period, which commenced during the second quarter of fiscal 2014 for physical games sold through retail from six to nine months.
Cost of Revenue
Cost of revenue for fiscal years 2014 and 2013 was as follows (in millions):
|
March 31,
2014 |
% of
Related
Net Revenue
|
March 31,
2013 |
% of
Related
Net Revenue
|
% Change
|
Change as a
% of Related
Net Revenue
|
||||||||||||||
|
Cost of revenue:
|
|||||||||||||||||||
|
Product
|
$
|
1,032
|
|
48.4
|
%
|
$
|
1,085
|
|
39.6
|
%
|
(4.9
|
)%
|
8.8
|
%
|
|||||
|
Service and other
|
315
|
|
21.9
|
%
|
303
|
|
28.6
|
%
|
4.0
|
%
|
(6.7
|
)%
|
|||||||
|
Total cost of revenue
|
$
|
1,347
|
|
37.7
|
%
|
$
|
1,388
|
|
36.6
|
%
|
(3.0
|
)%
|
1.1
|
%
|
|||||
Cost of Product Revenue
Cost of product revenue decreased by $53 million, or 4.9 percent in fiscal year 2014, as compared to fiscal year 2013. The decrease was primarily due to intangible impairment charges incurred in fiscal year 2013 compared to an immaterial amount of such charges incurred during fiscal year 2014, and a decrease in royalty costs due to fewer royalty-bearing products released
during fiscal year 2014, as compared to fiscal year 2013.
Cost of Service and Other Revenue
Cost of service and other revenue increased by $12 million, or 4.0 percent in fiscal year 2014, as compared to fiscal year 2013. The increase was primarily due to an increase in product costs due to the release of
Titanfall
and an increase in royalty costs due to more royalty-bearing services released during fiscal year 2014, as compared to fiscal year 2013.
40
Total Cost of Revenue as a Percentage of Total Net Revenue
Total cost of revenue as a percentage of total net revenue remained relatively consistent during fiscal year 2014 as compared to fiscal year 2013.
Research and Development
Research and development expenses for fiscal years 2014 and 2013 were as follows (in millions):
Research and development expenses decreased by $28 million, or 2 percent, in fiscal year 2014, as compared to fiscal year 2013. This decrease was primarily due to a $49 million decrease in contracted services as a result of fewer titles released this fiscal year as compared to the prior fiscal year. This was partially offset by a $25 million increase in facility-related costs related to higher rent and depreciation expenses.
|
March 31,
2014
|
% of Net
Revenue
|
March 31,
2013
|
% of Net
Revenue
|
$ Change
|
% Change
|
||||||||||||||
|
$
|
1,125
|
|
31
|
%
|
$
|
1,153
|
|
30
|
%
|
$
|
(28
|
)
|
(2
|
)%
|
|||||
Marketing and Sales
Marketing and sales expenses for fiscal years 2014 and 2013 were as follows (in millions):
|
March 31,
2014 |
% of Net
Revenue
|
March 31,
2013 |
% of Net
Revenue
|
$ Change
|
% Change
|
||||||||||||||
|
$
|
680
|
|
19
|
%
|
$
|
788
|
|
21
|
%
|
$
|
(108
|
)
|
(14
|
)%
|
|||||
Marketing and sales expenses decreased by $108 million, or 14 percent, in fiscal year 2014, as compared to fiscal year 2013. The decrease was primarily due to (1) a $54 million decrease in personnel-related costs resulting from a decrease in headcount, (2) a $29 million decrease in advertising and promotional spending on our franchises as compared to the prior year, and (3) a $24 million decrease in contracted services.
General and Administrative
General and administrative expenses for fiscal years 2014 and 2013 were as follows (in millions):
|
March 31,
2014 |
% of Net
Revenue
|
March 31,
2013 |
% of Net
Revenue
|
$ Change
|
% Change
|
||||||||||||||
|
$
|
410
|
|
11
|
%
|
$
|
354
|
|
9
|
%
|
$
|
56
|
|
16
|
%
|
|||||
General and administrative expenses increased by $56 million, or 16 percent, in fiscal year 2014, as compared to fiscal year 2013. The increase was primarily due to (1) a $30 million accrual related to the anticipated settlement of a litigation matter related to our college football franchise, (2) an $18 million loss on a license related to our college football franchise, and (3) a $13 million increase in incentive-based compensation expense. This was partially offset by a $7 million decrease in facility-related costs.
Acquisition-Related Contingent Consideration
Acquisition-related contingent consideration for fiscal years 2014 and 2013 were as follows (in millions):
|
March 31,
2014 |
% of Net
Revenue
|
March 31,
2013 |
% of Net
Revenue
|
$ Change
|
% Change
|
||||||||||||||
|
$
|
(35
|
)
|
(1
|
)%
|
$
|
(64
|
)
|
(2
|
)%
|
$
|
29
|
|
45
|
%
|
|||||
During fiscal year 2014, acquisition-related contingent consideration credits decreased by $29 million, or 45 percent, as compared to fiscal year 2013, primarily resulting from changes in our earn-out estimates related to our PopCap acquisition. The PopCap earn-out expired on December 31, 2013. No payments were made under this earn-out.
41
Amortization of Intangibles
Amortization of intangibles for fiscal years 2014 and 2013 were as follows (in millions):
|
March 31,
2014 |
% of Net
Revenue
|
March 31,
2013 |
% of Net
Revenue
|
$ Change
|
% Change
|
||||||||||||||
|
$
|
16
|
|
—
|
%
|
$
|
30
|
|
1
|
%
|
$
|
(14
|
)
|
(47
|
)%
|
|||||
Amortization of intangibles decreased by $14 million, or 47 percent, in fiscal year 2014, as compared to fiscal year 2013, primarily due to certain intangible assets from our acquisitions being fully amortized and impairment charges incurred during fiscal year 2013.
Restructuring and Other Charges
Restructuring and other charges for fiscal years 2014 and 2013 were as follows (in millions):
|
March 31,
2014 |
% of Net
Revenue
|
March 31,
2013 |
% of Net
Revenue
|
$ Change
|
% Change
|
||||||||||||||
|
$
|
(1
|
)
|
—
|
%
|
$
|
27
|
|
1
|
%
|
$
|
(28
|
)
|
(104
|
)%
|
|||||
Restructuring and other charges decreased as compared to fiscal year 2013, as there were no new restructuring initiatives in fiscal year 2014.
Interest and Other Income (Expense), Net
Interest and other income (expense), net, for fiscal years 2014 and 2013 were as follows (in millions):
|
March 31,
2014 |
% of Net
Revenue
|
March 31,
2013 |
% of Net
Revenue
|
$ Change
|
% Change
|
||||||||||||||
|
$
|
(26
|
)
|
(1
|
)%
|
$
|
(21
|
)
|
(1
|
)%
|
$
|
(5
|
)
|
(24
|
)%
|
|||||
Interest and other income (expense), net, remained relatively consistent, as compared to fiscal year 2013.
Income Taxes
Provision for (benefit from) income taxes for fiscal years 2014 and 2013 was as follows (in millions):
|
March 31, 2014
|
Effective Tax Rate
|
March 31, 2013
|
Effective Tax Rate
|
|||||||||
|
$
|
(1
|
)
|
(14.3
|
)%
|
$
|
41
|
|
29.5
|
%
|
|||
Our effective tax rate for the fiscal year 2014 was a tax benefit of 14.3%. The fiscal year 2014 effective tax rate differs from the statutory rate of 35.0 percent as a result of the utilization of U.S. deferred tax assets subject to a valuation allowance and tax benefits related to the expiration of statutes of limitations and the resolution of examinations by taxing authorities.
Our effective tax rate for the fiscal year 2013 differs from the statutory rate of 35.0 percent primarily due to the U.S. losses for which no benefit is recognized and non-deductible stock-based compensation, offset by non-U.S. profits subject to reduced or zero tax rates and the nontaxable change in the estimated fair value of acquisition-related contingent consideration.
Certain taxable temporary differences that are not expected to reverse during the carry forward periods permitted by tax law have not been considered as a source of future taxable income that is available to realize the benefit of deferred tax assets.
The American Taxpayer Relief Act of 2012 (the “Act”) was signed into law on January 2, 2013. The Act contains a number of provisions including, most notably, an extension of the research tax credit through December 31, 2013. The Act did not have a material impact on our effective tax rate for fiscal 2013 due to the effect of the valuation allowance on our deferred tax assets.
Historically, we have considered undistributed earnings of our foreign subsidiaries to be indefinitely reinvested outside of the United States and, accordingly, no U.S. taxes have been provided thereon. In connection with a review of our cash position including potential future cash needs for stock repurchases and debt retirement, we made a one-time repatriation of $700 million from certain of our wholly-owned subsidiaries during the three months ended March 31, 2014. This repatriation did not have a material impact on our effective tax rate for fiscal 2014 due to the deferred tax valuation allowance.
42
LIQUIDITY AND CAPITAL RESOURCES
|
|
As of March 31,
|
Increase
|
|||||||||
|
(In millions)
|
2015
|
2014
|
|||||||||
|
Cash and cash equivalents
|
$
|
2,068
|
|
$
|
1,782
|
|
$
|
286
|
|
||
|
Short-term investments
|
953
|
|
583
|
|
370
|
|
|||||
|
Total
|
$
|
3,021
|
|
$
|
2,365
|
|
$
|
656
|
|
||
|
Percentage of total assets
|
49
|
%
|
41
|
%
|
|||||||
|
|
Year Ended March 31,
|
Change
|
|||||||||
|
(In millions)
|
2015
|
2014
|
|||||||||
|
Cash provided by operating activities
|
$
|
1,067
|
|
$
|
712
|
|
$
|
355
|
|
||
|
Cash used in investing activities
|
(470
|
)
|
(301
|
)
|
(169
|
)
|
|||||
|
Cash provided by (used in) financing activities
|
(255
|
)
|
89
|
|
(344
|
)
|
|||||
|
Effect of foreign exchange on cash and cash equivalents
|
(56
|
)
|
(10
|
)
|
(46
|
)
|
|||||
|
Net increase in cash and cash equivalents
|
$
|
286
|
|
$
|
490
|
|
$
|
(204
|
)
|
||
Changes in Cash Flow
Operating Activities.
Cash provided by operating activities increased
$355 million
during
fiscal year 2015
as compared to
fiscal year 2014
. The change is primarily due to a
$298 million
increase in Net Revenue before Revenue Deferral and an $88 million decrease in research and development, marketing and sales, and general and administrative expenses during the
fiscal year ended March 31, 2015
as compared to the
fiscal year ended March 31, 2014
.
Investing Activities.
Cash used in investing activities increased
$169 million
during
fiscal year 2015
as compared to
fiscal year 2014
primarily driven by a $502 million increase in purchases of short-term investments. This was partially offset by a $326 million increase in proceeds from the sales and maturities of short-term investments during the
fiscal year ended March 31, 2015
as compared to the
fiscal year ended March 31, 2014
.
Financing Activities.
Cash used in financing activities increased
$344 million
during
fiscal year 2015
as compared to
fiscal year 2014
primarily due to $337 million used to repurchase and retire common stock during the
fiscal year ended March 31, 2015
as compared to no stock repurchases during the
fiscal year ended March 31, 2014
.
Short-term Investments
Due to our mix of fixed and variable rate securities, our short-term investment portfolio is susceptible to changes in short-term interest rates. As of
March 31, 2015
, our short-term investments had gross unrealized gains of
$1 million
, or less than 1 percent of the total in short-term investments, and gross unrealized losses of less than
$1 million
, or less than 1 percent of the total in short-term investments. From time to time, we may liquidate some or all of our short-term investments to fund operational needs or other activities, such as capital expenditures, business acquisitions or stock repurchase programs. Depending on which short-term investments we liquidate to fund these activities, we could recognize a portion, or all, of the gross unrealized gains or losses.
Fiscal 2011 Restructuring
In connection with our fiscal 2011 restructuring plan, we expect to incur cash expenditures of approximately $11 million through December 2015.
Financing Arrangement
In
July 2011
, we issued
$632.5 million
aggregate principal amount of 0.75% Convertible Senior Notes due 2016 (the “Notes”). We used the net proceeds of the Notes to finance the cash consideration of our acquisition of PopCap, which closed in August 2011. The Notes will mature on July 15, 2016, unless purchased earlier or converted in accordance with their terms prior to such date.
During the fiscal quarter ended
March 31, 2015
, the market value of our common stock exceeded the conversion trigger price of $41.26 per share for at least 20 trading days of the 30 consecutive trading days preceding quarter end. As a result, the Notes are convertible at the option of the holder through July 4, 2015. See Note 12 - Financing Arrangements to the Consolidated Financial Statements as it relates to the Notes, the convertibility of the Notes, and the Convertible Note Hedge and Warrants, which is incorporated by reference into this Item 7.
43
Credit Facility
On
March 19, 2015
, we entered into a new
$500 million
senior unsecured revolving credit facility with a syndicate of banks.
As of March 31, 2015
, no amounts were outstanding under the credit facility. See Note 12 - Financing Arrangements to the Consolidated Financial Statements in this Form 10-K as it relates to our credit facility, which is incorporated by reference into this Item 7.
Financial Condition
We believe that our cash, cash equivalents, short-term investments, cash generated from operations and available financing facilities will be sufficient to meet our operating requirements for at least the next 12 months, including working capital requirements, capital expenditures, and potentially, future acquisitions, stock repurchases, or strategic investments. We may choose at any time to raise additional capital to strengthen our financial position, facilitate expansion, repurchase our stock, pursue strategic acquisitions and investments, and/or to take advantage of business opportunities as they arise. There can be no assurance, however, that such additional capital will be available to us on favorable terms, if at all, or that it will not result in substantial dilution to our existing stockholders.
As of March 31, 2015
, approximately $1,156 million of our cash, cash equivalents, and short-term investments were domiciled in foreign tax jurisdictions. While we have no plans to repatriate these funds to the United States in the short term, if we choose to do so, we may be required to accrue and pay additional taxes on any portion of the repatriation where no United States income tax had been previously provided.
In May 2014, a special committee of our Board of Directors, on behalf of the full Board of Directors, authorized a two-year program to repurchase up to $750 million of our common stock. We repurchased approximately
8 million
shares under this program during the
fiscal year ended March 31, 2015
for approximately $337 million.
In May 2015, our Board of Directors authorized a new program to repurchase up to $1 billion of our common stock. This new stock repurchase program, which expires on May 31, 2017, supersedes and replaces the stock repurchase authorization approved in May 2014. Under this program, we may purchase stock in the open market or through privately-negotiated transactions in accordance with applicable securities laws, including pursuant to pre-arranged stock trading plans. The timing and actual amount of the stock repurchases will depend on several factors including price, capital availability, regulatory requirements, alternative investment opportunities and other market conditions. We are not obligated to repurchase any specific number of shares under this program and it may be modified, suspended or discontinued at any time. We continue to actively repurchase shares.
We have a “shelf” registration statement on Form S-3 on file with the SEC. This shelf registration statement, which includes a base prospectus, allows us at any time to offer any combination of securities described in the prospectus in one or more offerings. Unless otherwise specified in a prospectus supplement accompanying the base prospectus, we would use the net proceeds from the sale of any securities offered pursuant to the shelf registration statement for general corporate purposes, including for working capital, financing capital expenditures, research and development, marketing and distribution efforts, and if opportunities arise, for acquisitions or strategic alliances. Pending such uses, we may invest the net proceeds in interest-bearing securities. In addition, we may conduct concurrent or other financings at any time.
Our ability to maintain sufficient liquidity could be affected by various risks and uncertainties including, but not limited to, those related to customer demand and acceptance of our products, our ability to collect our accounts receivable as they become due, successfully achieving our product release schedules and attaining our forecasted sales objectives, the impact of acquisitions and other strategic transactions in which we may engage, the impact of competition, economic conditions in the United States and abroad, the seasonal and cyclical nature of our business and operating results, risks of product returns and the other risks described in the “Risk Factors” section, included in Part I, Item 1A of this report.
Contractual Obligations and Commercial Commitments
Note 13 - Commitments and Contingencies to the Consolidated Financial Statements in this Form 10-K as it relates to our contractual obligations and commercial commitments is incorporated by reference into this Item 7.
44
OFF-BALANCE SHEET ARRANGEMENTS
As of March 31, 2015
, we did not have any off-balance sheet arrangements, as defined in Item 303(a)(4)(ii) of Regulation S-K promulgated by the SEC, that have or are reasonably likely to have a current or future effect on our financial condition, changes in financial condition, revenues and expenses, results of operations, liquidity, capital expenditures, or capital resources that is material to investors.
INFLATION
We believe the impact of inflation on our results of operations has not been significant in any of the past three fiscal years.
Item 7A:
Quantitative and Qualitative Disclosures About Market Risk
MARKET RISK
We are exposed to various market risks, including changes in foreign currency exchange rates, interest rates and market prices, which have experienced significant volatility. Market risk is the potential loss arising from changes in market rates and market prices. We employ established policies and practices to manage these risks. Foreign currency forward contracts are used to hedge anticipated exposures or mitigate some existing exposures subject to foreign exchange risk as discussed below. While we do not hedge our short-term investment portfolio, we protect our short-term investment portfolio against different market risks, including interest rate risk as discussed below. Our cash and cash equivalents portfolio consists of highly liquid investments with insignificant interest rate risk and original or remaining maturities of three months or less at the time of purchase. We do not enter into derivatives or other financial instruments for speculative trading purposes and do not hedge our market price risk relating to marketable equity securities, if any.
Foreign Currency Exchange Rate Risk
Foreign Currency Exchange Rates.
International sales are a fundamental part of our business, and the significant strengthening of the U.S. Dollar during the second half of fiscal year 2015 (particularly relative to the Euro, British pound sterling, Swedish krona and Canadian dollar) had a negative impact on our reported international net revenues, but a positive impact on our reported international operating expenses because these amounts were translated at lower rates in fiscal year 2015 than in fiscal year 2014. While we use foreign currency hedging contracts to mitigate some foreign currency exchange risk, these activities are limited in the protection that they provide us and can themselves result in losses. We currently anticipate foreign currency exchange rates to have a negative impact on our expected reported net revenue in fiscal year 2016 as compared to fiscal year 2015, but the strengthening of the U.S. dollar is expected to have a positive impact on our reported operating expenses as a significant portion of those expenses are incurred outside the United States.
Cash Flow Hedging Activities.
From time to time, we hedge a portion of our foreign currency risk related to forecasted foreign-currency-denominated sales and expense transactions by purchasing foreign currency forward contracts that generally have maturities of
15 months
or less. These transactions are designated and qualify as cash flow hedges. Our hedging programs are designed to reduce, but do not entirely eliminate, the impact of currency exchange rate movements in net revenue and research and development expenses.
Balance Sheet Hedging Activities
. We use foreign currency forward contracts to mitigate foreign currency risk associated with foreign-currency-denominated monetary assets and liabilities, primarily intercompany receivables and payables. The foreign currency forward contracts generally have a contractual term of three months or less and are transacted near month-end.
We believe the counterparties to our foreign currency forward contracts are creditworthy multinational commercial banks. While we believe the risk of counterparty nonperformance is not material, a sustained decline in the financial stability of financial institutions as a result of disruption in the financial markets could affect our ability to secure creditworthy counterparties for our foreign currency hedging programs.
45
Notwithstanding our efforts to mitigate some foreign currency exchange rate risks, there can be no assurance that our hedging activities will adequately protect us against the risks associated with foreign currency fluctuations. As of
March 31, 2015
, a hypothetical adverse foreign currency exchange rate movement of
10 percent
or
20 percent
would have resulted in potential declines in the fair value on our foreign currency forward contracts used in cash flow hedging of
$59 million
and
$118 million
, respectively. As of
March 31, 2015
, a hypothetical adverse foreign currency exchange rate movement of
10 percent
or
20 percent
would have resulted in potential losses on our foreign currency forward contracts used in balance sheet hedging of
$25 million
and
$50 million
, respectively. This sensitivity analysis assumes an adverse shift of all foreign currency exchange rates; however, all foreign currency exchange rates do not always move in such manner and actual results may differ materially. See Note 4 - Derivative Financial Instruments to the Consolidated Financial Statements in this Form 10-K as it relates to our derivative financial instruments, which is incorporated by reference into this Item 7A.
Interest Rate Risk
Our exposure to market risk for changes in interest rates relates primarily to our short-term investment portfolio. We manage our interest rate risk by maintaining an investment portfolio generally consisting of debt instruments of high credit quality and relatively short maturities. However, because short-term investments mature relatively quickly and are required to be reinvested at the then-current market rates, interest income on a portfolio consisting of short-term investments is more subject to market fluctuations than a portfolio of longer term investments. Additionally, the contractual terms of the investments do not permit the issuer to call, prepay or otherwise settle the investments at prices less than the stated par value. Our investments are held for purposes other than trading. Also, we do not use derivative financial instruments in our short-term investment portfolio.
As of
March 31, 2015
, our short-term investments were classified as available-for-sale securities and, consequently, were recorded at fair value with unrealized gains or losses resulting from changes in fair value reported as a separate component of accumulated other comprehensive income, net of tax, in stockholders’ equity.
Notwithstanding our efforts to manage interest rate risks, there can be no assurance that we will be adequately protected against risks associated with interest rate fluctuations. At any time, a sharp change in interest rates could have a significant impact on the fair value of our investment portfolio. The following table presents the hypothetical changes in the fair value of our short-term investment portfolio as of
March 31, 2015
, arising from potential changes in interest rates. The modeling technique estimates the change in fair value from immediate hypothetical parallel shifts in the yield curve of plus or minus 50 basis points (“BPS”), 100 BPS, and 150 BPS.
|
(In millions)
|
Valuation of Securities
Given an Interest Rate Decrease
of X Basis Points
|
Fair Value
as of
March 31,
2015
|
Valuation of Securities Given
an Interest Rate Increase of
X Basis Points
|
||||||||||||||||||||||||
|
(150 BPS)
|
(100 BPS)
|
(50 BPS)
|
50 BPS
|
100 BPS
|
150 BPS
|
||||||||||||||||||||||
|
Corporate bonds
|
$
|
475
|
|
$
|
473
|
|
$
|
470
|
|
$
|
467
|
|
$
|
463
|
|
$
|
462
|
|
$
|
458
|
|
||||||
|
U.S. Treasury securities
|
219
|
|
218
|
|
216
|
|
214
|
|
213
|
|
211
|
|
210
|
|
|||||||||||||
|
U.S. agency securities
|
166
|
|
164
|
|
163
|
|
162
|
|
161
|
|
159
|
|
158
|
|
|||||||||||||
|
Commercial paper
|
110
|
|
110
|
|
110
|
|
110
|
|
110
|
|
109
|
|
109
|
|
|||||||||||||
|
Total short-term investments
|
$
|
970
|
|
$
|
965
|
|
$
|
959
|
|
$
|
953
|
|
$
|
947
|
|
$
|
941
|
|
$
|
935
|
|
||||||
46
Item 8:
Financial Statements and Supplementary Data
Index to Consolidated Financial Statements
|
|
Page
|
|
Consolidated Financial Statements of Electronic Arts Inc. and Subsidiaries:
|
|
|
Financial Statement Schedule:
|
|
|
The following financial statement schedule of Electronic Arts Inc. and Subsidiaries for the years ended March 31, 2015, 2014 and 2013 is filed as part of this report and should be read in conjunction with the Consolidated Financial Statements of Electronic Arts Inc. and Subsidiaries:
|
|
Other financial statement schedules have been omitted because the information called for in them is not required or has already been included in either the Consolidated Financial Statements or the Notes thereto.
47
ELECTRONIC ARTS INC. AND SUBSIDIARIES
|
(In millions, except par value data)
|
March 31, 2015
|
March 31, 2014
|
|||||
|
ASSETS
|
|||||||
|
Current assets:
|
|||||||
|
Cash and cash equivalents
|
$
|
2,068
|
|
$
|
1,782
|
|
|
|
Short-term investments
|
953
|
|
583
|
|
|||
|
Receivables, net of allowances of $140 and $186, respectively
|
362
|
|
327
|
|
|||
|
Inventories
|
36
|
|
56
|
|
|||
|
Deferred income taxes, net
|
54
|
|
74
|
|
|||
|
Other current assets
|
247
|
|
316
|
|
|||
|
Total current assets
|
3,720
|
|
3,138
|
|
|||
|
Property and equipment, net
|
459
|
|
510
|
|
|||
|
Goodwill
|
1,713
|
|
1,723
|
|
|||
|
Acquisition-related intangibles, net
|
111
|
|
177
|
|
|||
|
Deferred income taxes, net
|
13
|
|
28
|
|
|||
|
Other assets
|
131
|
|
140
|
|
|||
|
TOTAL ASSETS
|
$
|
6,147
|
|
$
|
5,716
|
|
|
|
LIABILITIES AND STOCKHOLDERS’ EQUITY
|
|||||||
|
Current liabilities:
|
|||||||
|
Accounts payable
|
$
|
68
|
|
$
|
119
|
|
|
|
Accrued and other current liabilities
|
794
|
|
781
|
|
|||
|
Deferred net revenue (online-enabled games)
|
1,283
|
|
1,490
|
|
|||
|
0.75% convertible senior notes due 2016, net
|
602
|
|
—
|
|
|||
|
Total current liabilities
|
2,747
|
|
2,390
|
|
|||
|
0.75% convertible senior notes due 2016, net
|
—
|
|
580
|
|
|||
|
Income tax obligations
|
70
|
|
189
|
|
|||
|
Deferred income taxes, net
|
80
|
|
18
|
|
|||
|
Other liabilities
|
183
|
|
117
|
|
|||
|
Total liabilities
|
3,080
|
|
3,294
|
|
|||
|
Commitments and contingencies (See Note 13)
|
|
|
|||||
|
0.75% convertible senior notes due 2016 (See Note 12)
|
31
|
|
—
|
|
|||
|
Stockholders’ equity:
|
|||||||
|
Preferred stock, $0.01 par value. 10 shares authorized
|
—
|
|
—
|
|
|||
|
Common stock, $0.01 par value. 1,000 shares authorized; 310 and 311 shares issued and outstanding, respectively
|
3
|
|
3
|
|
|||
|
Additional paid-in capital
|
2,127
|
|
2,353
|
|
|||
|
Retained earnings
|
904
|
|
29
|
|
|||
|
Accumulated other comprehensive income
|
2
|
|
37
|
|
|||
|
Total stockholders’ equity
|
3,036
|
|
2,422
|
|
|||
|
TOTAL LIABILITIES AND STOCKHOLDERS’ EQUITY
|
$
|
6,147
|
|
$
|
5,716
|
|
|
See accompanying Notes to Consolidated Financial Statements.
48
ELECTRONIC ARTS INC. AND SUBSIDIARIES
|
|
Year Ended March 31,
|
||||||||||
|
(In millions, except per share data)
|
2015
|
2014
|
2013
|
||||||||
|
Net revenue:
|
|||||||||||
|
Product
|
$
|
2,568
|
|
$
|
2,134
|
|
$
|
2,738
|
|
||
|
Service and other
|
1,947
|
|
1,441
|
|
1,059
|
|
|||||
|
Total net revenue
|
4,515
|
|
3,575
|
|
3,797
|
|
|||||
|
Cost of revenue:
|
|||||||||||
|
Product
|
1,028
|
|
1,032
|
|
1,085
|
|
|||||
|
Service and other
|
401
|
|
315
|
|
303
|
|
|||||
|
Total cost of revenue
|
1,429
|
|
1,347
|
|
1,388
|
|
|||||
|
Gross profit
|
3,086
|
|
2,228
|
|
2,409
|
|
|||||
|
Operating expenses:
|
|||||||||||
|
Research and development
|
1,094
|
|
1,125
|
|
1,153
|
|
|||||
|
Marketing and sales
|
647
|
|
680
|
|
788
|
|
|||||
|
General and administrative
|
386
|
|
410
|
|
354
|
|
|||||
|
Acquisition-related contingent consideration
|
(3
|
)
|
(35
|
)
|
(64
|
)
|
|||||
|
Amortization of intangibles
|
14
|
|
16
|
|
30
|
|
|||||
|
Restructuring and other charges
|
—
|
|
(1
|
)
|
27
|
|
|||||
|
Total operating expenses
|
2,138
|
|
2,195
|
|
2,288
|
|
|||||
|
Operating income
|
948
|
|
33
|
|
121
|
|
|||||
|
Gains on strategic investments, net
|
—
|
|
—
|
|
39
|
|
|||||
|
Interest and other income (expense), net
|
(23
|
)
|
(26
|
)
|
(21
|
)
|
|||||
|
Income before provision for (benefit from) income taxes
|
925
|
|
7
|
|
139
|
|
|||||
|
Provision for (benefit from) income taxes
|
50
|
|
(1
|
)
|
41
|
|
|||||
|
Net income
|
$
|
875
|
|
$
|
8
|
|
$
|
98
|
|
||
|
Net income per share:
|
|||||||||||
|
Basic
|
$
|
2.81
|
|
$
|
0.03
|
|
$
|
0.32
|
|
||
|
Diluted
|
$
|
2.69
|
|
$
|
0.03
|
|
$
|
0.31
|
|
||
|
Number of shares used in computation:
|
|||||||||||
|
Basic
|
311
|
|
308
|
|
310
|
|
|||||
|
Diluted
|
325
|
|
316
|
|
313
|
|
|||||
See accompanying Notes to Consolidated Financial Statements.
49
ELECTRONIC ARTS INC. AND SUBSIDIARIES
CONSOLIDATED STATEMENTS OF COMPREHENSIVE INCOME (LOSS)
|
Year Ended March 31,
|
|||||||||||
|
(In millions)
|
2015
|
2014
|
2013
|
||||||||
|
Net income
|
$
|
875
|
|
$
|
8
|
|
$
|
98
|
|
||
|
Other comprehensive income (loss), net of tax:
|
|||||||||||
|
Change in unrealized net gains and losses on available-for-sale securities
|
1
|
|
—
|
|
(46
|
)
|
|||||
|
Reclassification adjustment for net realized gains on available-for-sale securities
|
—
|
|
—
|
|
(41
|
)
|
|||||
|
Change in unrealized net gains and losses on derivative instruments
|
20
|
|
(19
|
)
|
(2
|
)
|
|||||
|
Reclassification adjustment for net realized gains and losses on derivative instruments
|
11
|
|
9
|
|
4
|
|
|||||
|
Foreign currency translation adjustments
|
(67
|
)
|
(22
|
)
|
(19
|
)
|
|||||
|
Total other comprehensive loss, net of tax
|
(35
|
)
|
(32
|
)
|
(104
|
)
|
|||||
|
Total comprehensive income (loss)
|
$
|
840
|
|
$
|
(24
|
)
|
$
|
(6
|
)
|
||
See accompanying Notes to Consolidated Financial Statements.
50
ELECTRONIC ARTS INC. AND SUBSIDIARIES
CONSOLIDATED STATEMENTS OF STOCKHOLDERS’ EQUITY
(In millions, share data in thousands)
|
|
Common Stock
|
Additional Paid-in
Capital
|
Retained
Earnings
(Accumulated
Deficit)
|
Accumulated
Other
Comprehensive
Income
|
Total
Stockholders’
Equity
|
|||||||||||||||||
|
Shares
|
Amount
|
|||||||||||||||||||||
|
Balances as of March 31, 2012
|
320,223
|
|
$
|
3
|
|
$
|
2,359
|
|
$
|
(77
|
)
|
$
|
173
|
|
$
|
2,458
|
|
|||||
|
Total comprehensive loss
|
—
|
|
—
|
|
—
|
|
98
|
|
(104
|
)
|
(6
|
)
|
||||||||||
|
Issuance of common stock
|
7,801
|
|
—
|
|
1
|
|
—
|
|
—
|
|
1
|
|
||||||||||
|
Repurchase and retirement of common stock
|
(25,860
|
)
|
—
|
|
(349
|
)
|
—
|
|
—
|
|
(349
|
)
|
||||||||||
|
Stock-based compensation
|
—
|
|
—
|
|
164
|
|
—
|
|
—
|
|
164
|
|
||||||||||
|
Tax costs from stock-based compensation
|
—
|
|
—
|
|
(1
|
)
|
—
|
|
—
|
|
(1
|
)
|
||||||||||
|
Balances as of March 31, 2013
|
302,164
|
|
3
|
|
2,174
|
|
21
|
|
69
|
|
2,267
|
|
||||||||||
|
Total comprehensive loss
|
—
|
|
—
|
|
—
|
|
8
|
|
(32
|
)
|
(24
|
)
|
||||||||||
|
Issuance of common stock
|
9,278
|
|
—
|
|
16
|
|
—
|
|
—
|
|
16
|
|
||||||||||
|
Stock-based compensation
|
—
|
|
—
|
|
150
|
|
—
|
|
—
|
|
150
|
|
||||||||||
|
Tax benefit from stock-based compensation
|
—
|
|
—
|
|
13
|
|
—
|
|
—
|
|
13
|
|
||||||||||
|
Balances as of March 31, 2014
|
311,442
|
|
3
|
|
2,353
|
|
29
|
|
37
|
|
2,422
|
|
||||||||||
|
Total comprehensive income
|
—
|
|
—
|
|
—
|
|
875
|
|
(35
|
)
|
840
|
|
||||||||||
|
Issuance of common stock
|
6,508
|
|
—
|
|
(24
|
)
|
—
|
|
—
|
|
(24
|
)
|
||||||||||
|
Reclassification of equity component of convertible debt to temporary equity
|
—
|
|
—
|
|
(31
|
)
|
—
|
|
—
|
|
(31
|
)
|
||||||||||
|
Repurchase and retirement of common stock
|
(8,269
|
)
|
—
|
|
(337
|
)
|
—
|
|
—
|
|
(337
|
)
|
||||||||||
|
Stock-based compensation
|
—
|
|
—
|
|
144
|
|
—
|
|
—
|
|
144
|
|
||||||||||
|
Tax benefit from stock-based compensation
|
—
|
|
—
|
|
22
|
|
—
|
|
—
|
|
22
|
|
||||||||||
|
Balances as of March 31, 2015
|
309,681
|
|
$
|
3
|
|
$
|
2,127
|
|
$
|
904
|
|
$
|
2
|
|
$
|
3,036
|
|
|||||
See accompanying Notes to Consolidated Financial Statements.
51
ELECTRONIC ARTS INC. AND SUBSIDIARIES
|
Year Ended March 31,
|
|||||||||||
|
(In millions)
|
2015
|
2014
|
2013
|
||||||||
|
OPERATING ACTIVITIES
|
|||||||||||
|
Net income
|
$
|
875
|
|
$
|
8
|
|
$
|
98
|
|
||
|
Adjustments to reconcile net income to net cash provided by operating activities:
|
|||||||||||
|
Depreciation, amortization and accretion
|
220
|
|
227
|
|
264
|
|
|||||
|
Stock-based compensation
|
144
|
|
150
|
|
164
|
|
|||||
|
Acquisition-related contingent consideration
|
(3
|
)
|
(35
|
)
|
(64
|
)
|
|||||
|
Net losses (gains) on investments
|
—
|
|
2
|
|
(37
|
)
|
|||||
|
Non-cash restructuring charges
|
—
|
|
—
|
|
7
|
|
|||||
|
Change in assets and liabilities:
|
|||||||||||
|
Receivables, net
|
(54
|
)
|
(12
|
)
|
56
|
|
|||||
|
Inventories
|
19
|
|
(13
|
)
|
16
|
|
|||||
|
Other assets
|
87
|
|
(56
|
)
|
15
|
|
|||||
|
Accounts payable
|
(46
|
)
|
(18
|
)
|
(78
|
)
|
|||||
|
Accrued and other liabilities
|
31
|
|
(3
|
)
|
(106
|
)
|
|||||
|
Deferred income taxes, net
|
1
|
|
16
|
|
(7
|
)
|
|||||
|
Deferred net revenue (online-enabled games)
|
(207
|
)
|
446
|
|
(4
|
)
|
|||||
|
Net cash provided by operating activities
|
1,067
|
|
712
|
|
324
|
|
|||||
|
INVESTING ACTIVITIES
|
|||||||||||
|
Capital expenditures
|
(95
|
)
|
(97
|
)
|
(106
|
)
|
|||||
|
Proceeds from sale of marketable equity securities
|
—
|
|
—
|
|
72
|
|
|||||
|
Proceeds from maturities and sales of short-term investments
|
727
|
|
401
|
|
459
|
|
|||||
|
Purchase of short-term investments
|
(1,102
|
)
|
(600
|
)
|
(414
|
)
|
|||||
|
Acquisition-related restricted cash
|
—
|
|
—
|
|
31
|
|
|||||
|
Acquisition of subsidiaries, net of cash acquired
|
—
|
|
(5
|
)
|
(10
|
)
|
|||||
|
Net cash provided by (used in) investing activities
|
(470
|
)
|
(301
|
)
|
32
|
|
|||||
|
FINANCING ACTIVITIES
|
|||||||||||
|
Proceeds from issuance of common stock
|
60
|
|
77
|
|
34
|
|
|||||
|
Payment of debt issuance costs
|
—
|
|
—
|
|
(2
|
)
|
|||||
|
Excess tax benefit from stock-based compensation
|
22
|
|
13
|
|
—
|
|
|||||
|
Repurchase and retirement of common stock
|
(337
|
)
|
—
|
|
(349
|
)
|
|||||
|
Acquisition-related contingent consideration payment
|
—
|
|
(1
|
)
|
(28
|
)
|
|||||
|
Net cash provided by (used in) financing activities
|
(255
|
)
|
89
|
|
(345
|
)
|
|||||
|
Effect of foreign exchange on cash and cash equivalents
|
(56
|
)
|
(10
|
)
|
(12
|
)
|
|||||
|
Increase (decrease) in cash and cash equivalents
|
286
|
|
490
|
|
(1
|
)
|
|||||
|
Beginning cash and cash equivalents
|
1,782
|
|
1,292
|
|
1,293
|
|
|||||
|
Ending cash and cash equivalents
|
$
|
2,068
|
|
$
|
1,782
|
|
$
|
1,292
|
|
||
|
Supplemental cash flow information:
|
|||||||||||
|
Cash paid during the year for income taxes, net
|
$
|
2
|
|
$
|
29
|
|
$
|
26
|
|
||
|
Cash paid during the year for interest
|
$
|
6
|
|
$
|
6
|
|
$
|
5
|
|
||
|
Non-cash investing activities:
|
|||||||||||
|
Change in unrealized net gains and losses on available-for-sale securities
|
$
|
1
|
|
$
|
—
|
|
$
|
(46
|
)
|
||
See accompanying Notes to Consolidated Financial Statements.
52
ELECTRONIC ARTS INC. AND SUBSIDIARIES
NOTES TO CONSOLIDATED FINANCIAL STATEMENTS
(1) DESCRIPTION OF BUSINESS AND SUMMARY OF SIGNIFICANT ACCOUNTING POLICIES
We develop, market, publish and distribute game software content and services that can be played by consumers on a variety of platforms, including video game consoles (such as the PlayStation 3 and 4 from Sony, and the Xbox 360 and Xbox One from Microsoft), PCs, mobile phones and tablets. We deliver our games and services to our players across multiple platforms, through multiple distribution channels, and directly (online and wirelessly). Some of our games are based on our wholly-owned intellectual property (
e.g.
, Battlefield, Mass Effect, Need for Speed, Dragon Age, The Sims, SimCity, Bejeweled, and Plants vs. Zombies), and some of our games leverage content that we license from others (
e.g.
, FIFA, Madden NFL and Star Wars). We also publish and distribute games developed by third parties (
e.g.
,
Titanfall
). Our goal is to develop our intellectual properties into year-round businesses available on a range of platforms. Our products and services may be purchased through physical and online retailers, platform providers such as console manufacturers, providers of free-to-download PC games played on the Internet, mobile carriers via streaming and digital downloads, and directly through Origin, our own digital distribution platform.
A summary of our significant accounting policies applied in the preparation of our Consolidated Financial Statements follows:
Consolidation
The accompanying Consolidated Financial Statements include the accounts of Electronic Arts Inc. and its wholly-owned subsidiaries. Intercompany balances and transactions have been eliminated in consolidation.
Fiscal Year
Our fiscal year is reported on a
52
- or
53
-week period that ends on the Saturday nearest March 31. Our results of operations for the
fiscal years ended March 31, 2015, 2014 and 2013
each contained
52
weeks and ended on March 28, 2015, March 29, 2014, and March 30, 2013, respectively. For simplicity of disclosure, all fiscal periods are referred to as ending on a calendar month-end.
Use of Estimates
The preparation of consolidated financial statements in conformity with accounting principles generally accepted in the United States (“U.S. GAAP”) requires us to make estimates and assumptions that affect the amounts reported in our consolidated financial statements and the accompanying notes. Such estimates include sales returns and allowances, provisions for doubtful accounts, accrued liabilities, offering periods for deferred net revenue, multiple-element arrangements, income taxes, losses on royalty commitments, estimates regarding the recoverability of prepaid royalties, inventories, long-lived assets, assets acquired and liabilities assumed in business combinations, certain estimates related to the measurement and recognition of costs resulting from our stock-based payment awards, deferred income tax assets and associated valuation allowances, as well as estimates used in our goodwill, intangibles and short-term investment impairment tests. These estimates generally involve complex issues and require us to make judgments, involve analysis of historical and future trends, can require extended periods of time to resolve, and are subject to change from period to period. In all cases, actual results could differ materially from our estimates.
Cash, Cash Equivalents, and Short-Term Investments
Cash equivalents consist of highly liquid investments with insignificant interest rate risk and original or remaining maturities of three months or less at the time of purchase.
Short-term investments consist of securities with original or remaining maturities of greater than three months at the time of purchase, are accounted for as available-for-sale securities and are recorded at fair value. Cash, cash equivalents and short-term investments are available for use in current operations or other activities such as capital expenditures, business combinations and share repurchases.
53
Unrealized gains and losses on our short-term investments are recorded as a component of accumulated other comprehensive income in stockholders’ equity, net of tax, until either (1) the security is sold, (2) the security has matured, or (3) we determine that the fair value of the security has declined below its adjusted cost basis and the decline is other-than-temporary. Realized gains and losses on our short-term investments are calculated based on the specific identification method and are reclassified from accumulated other comprehensive income to interest and other income (expense), net, or gains on strategic investments, net. Determining whether a decline in fair value is other-than-temporary requires management judgment based on the specific facts and circumstances of each security. The ultimate value realized on these securities is subject to market price volatility until they are sold.
Our short-term investments are evaluated for impairment quarterly. We consider various factors in determining whether we should recognize an impairment charge, including the credit quality of the issuer, the duration that the fair value has been less than the adjusted cost basis, severity of the impairment, reason for the decline in value and potential recovery period, the financial condition and near-term prospects of the investees, our intent to sell and ability to hold the investment for a period of time sufficient to allow for any anticipated recovery in market value, and any contractual terms impacting the prepayment or settlement process. If we conclude that an investment is other-than-temporarily impaired, we recognize an impairment charge at that time in our Consolidated Statements of Operations.
Inventories
Inventories consist of materials (including manufacturing royalties paid to console manufacturers), labor and freight-in and are stated at the lower of cost (using the weighted average costing method) or market value. We regularly review inventory quantities on-hand. We write down inventory based on excess or obsolete inventories determined primarily by future anticipated demand for our products. Inventory write-downs are measured as the difference between the cost of the inventory and market value, based upon assumptions about future demand that are inherently difficult to assess. At the point of a loss recognition, a new, lower cost basis for that inventory is established, and subsequent changes in facts and circumstances do not result in the restoration or increase in that newly established basis.
Property and Equipment, Net
Property and equipment, net, are stated at cost. Depreciation is calculated using the straight-line method over the following useful lives:
|
Buildings
|
|
20 to 25 years
|
|
Computer, equipment and software
|
|
3 to 6 years
|
|
Office equipment, furniture and fixtures
|
|
3 to 5 years
|
|
Warehouse, equipment and other
|
5 years
|
|
|
Leasehold improvements
|
|
Lesser of the lease term or the estimated useful lives of the improvements, generally 1 to 10 years
|
We capitalize costs associated with internal-use software development once a project has reached the application development stage. Such capitalized costs include external direct costs utilized in developing or obtaining the software, and payroll and payroll-related expenses for employees who are directly associated with the development of the software. Capitalization of such costs begins when the preliminary project stage is complete and ceases at the point in which the project is substantially complete and is ready for its intended purpose. The net book value of capitalized costs associated with internal-use software was
$62 million
and
$74 million
as of
March 31, 2015 and 2014
, respectively. Once the internal-use software is ready for its intended use, the assets are depreciated on a straight-line basis over each asset’s estimated useful life, which is generally
three
years.
54
Acquisition-Related Intangibles and Other Long-Lived Assets
We record acquisition-related intangible assets, such as developed and core technology, in connection with business combinations. We amortize the cost of acquisition-related intangible assets that have finite useful lives on a straight-line basis over the lesser of their estimated useful lives or the agreement terms, typically from two to fourteen years. We evaluate acquisition-related intangibles and other long-lived assets for impairment whenever events or changes in circumstances indicate that the carrying amount of an asset may not be recoverable. Recoverability of assets is measured by a comparison of the carrying amount of an asset to future undiscounted net cash flows expected to be generated by the asset group. This includes assumptions about future prospects for the business that the asset relates to and typically involves computations of the estimated future cash flows to be generated by these businesses. Based on these judgments and assumptions, we determine whether we need to take an impairment charge to reduce the value of the asset stated on our Consolidated Balance Sheets to reflect its estimated fair value. When we consider such assets to be impaired, the amount of impairment we recognize is measured by the amount by which the carrying amount of the asset exceeds its fair value. There were no material impairments in
fiscal years 2015 and 2014
. We recognized
$39 million
in impairment charges in
fiscal year 2013
. The charges for
fiscal year 2013
consist of
$34 million
and
$5 million
that were recognized in cost of revenue and amortization of intangibles, respectively, on our Consolidated Statement of Operations.
Goodwill
In assessing impairment on our goodwill, we first analyze qualitative factors to determine whether it is more likely than not that the fair value of a reporting unit is less than its carrying amount as a basis for determining whether it is necessary to perform the two-step goodwill impairment test. The qualitative factors we assess include long-term prospects of our performance, share price trends and market capitalization, and Company specific events. If we conclude it is more likely than not that the fair value of a reporting unit exceeds its carrying amount, we do not need to perform the two-step impairment test. If based on that assessment, we believe it is more likely than not that the fair value of the reporting unit is less than its carrying value, a two-step goodwill impairment test will be performed. The first step measures for impairment by applying fair value-based tests at the reporting unit level. The second step (if necessary) measures the amount of impairment by applying fair value-based tests to the individual assets and liabilities within each reporting unit. Reporting units are determined by the components of operating segments that constitute a business for which (1) discrete financial information is available, (2) segment management regularly reviews the operating results of that component, and (3) whether the component has dissimilar economic characteristics to other components. We determined that it was more likely than not that the fair value of our reporting unit exceeded its carrying
amount and, as such, we did not need to perform the two-step impairment test.
During the
fiscal years ended March 31, 2015, 2014 and 2013
, we completed our annual goodwill impairment testing in the fourth quarter of each year and did not recognize any impairment charges.
Revenue Recognition, Sales Returns and Allowances, and Bad Debt Reserves
We derive revenue principally from sales of interactive software games, and related content (
e.g.,
micro-transactions) and services on (1) video game consoles (such as the PlayStation 3 and 4 from Sony, and the Xbox 360 and Xbox One from Microsoft) and PCs, and (2) mobile phones and tablets. We evaluate revenue recognition based on the criteria set forth in FASB Accounting Standards Codification (“ASC”) 605,
Revenue Recognition
and ASC 985-605,
Software: Revenue Recognition
. We classify our revenue as either product revenue or service and other revenue.
Product revenue.
Our product revenue includes revenue associated with the sale of software games or related content, whether delivered via a physical disc (
e
.
g
., packaged goods) or delivered digitally via the Internet (
e.g.,
full-game downloads, extra-content), and licensing of game software to third-parties. Product revenue also includes revenue from mobile full-game downloads that do not require our hosting support (
e.g.
, premium mobile games), and sales of tangible products such as hardware, peripherals, or collectors’ items.
Service and other revenue.
Our service revenue includes revenue recognized from time-based subscriptions and games or related content that requires our hosting support in order to utilize the game or related content (
i.e.
, can only be played with an Internet connection). This includes (1) entitlements to content that are accessed through hosting services (
e.g.,
micro-transactions for Internet-based, social network and free-to-download mobile games), (2) massively multi-player online (“MMO”) games (both software game and subscription sales), (3) subscriptions for our Battlefield Premium, EA Access and Pogo-branded online game services, and (4) allocated service revenue from sales of software games with an online service element (
i.e.,
“matchmaking” service). Our other revenue includes advertising and non-software licensing revenue.
55
With respect to the allocated service revenue from sales of software games with a matchmaking service mentioned above, our allocation of proceeds between product and service revenue for presentation purposes is based on management’s best estimate of the selling price of the matchmaking service with the residual value allocated to product revenue. Our estimate of the selling price of the matchmaking service is comprised of several factors including, but not limited to, prior selling prices for the matchmaking service, prices charged separately by other third-party vendors for similar service offerings, and a cost-plus-margin approach. We review the estimated selling price of the online matchmaking service on a regular basis and use this methodology consistently to allocate revenue between product and service for software game sales with a matchmaking service.
We evaluate and recognize revenue when all four of the following criteria are met:
|
•
|
Evidence of an arrangement
. Evidence of an agreement with the customer that reflects the terms and conditions to deliver the related products or services must be present.
|
|
•
|
Fixed or determinable fee
. If a portion of the arrangement fee is not fixed or determinable, we recognize revenue as the amount becomes fixed or determinable.
|
|
•
|
Collection is deemed probable
. Collection is deemed probable if we expect the customer to be able to pay amounts under the arrangement as those amounts become due. If we determine that collection is not probable as the amounts become due, we generally conclude that collection becomes probable upon cash collection.
|
|
•
|
Delivery
. For packaged goods, delivery is considered to occur when a product is shipped and the risk of loss and rewards of ownership have transferred to the customer. For digital downloads, delivery is considered to occur when the software is made available to the customer for download. For services and other, delivery is generally considered to occur as the service is delivered, which is determined based on the underlying service obligation. If there is significant uncertainty of acceptance, revenue is recognized once acceptance is reasonably assured.
|
Online-Enabled Games
The majority of our software games and related content can be connected to the Internet whereby a consumer may be able to download unspecified content or updates on a when-and-if-available basis (“unspecified updates”) for use with the original game software. In addition, we may also offer an online matchmaking service that permits consumers to play against each other via the Internet without a separate fee. U.S. GAAP requires us to account for the consumer’s right to receive unspecified updates or the matchmaking service for no additional fee as a “bundled” sale, or multiple-element arrangement.
We have an established historical pattern of providing unspecified updates (e.g., player roster updates to
Madden NFL 15
) to online-enabled games and related content at no additional charge to the consumer. We do not have vendor-specific objective evidence of fair value (“VSOE”) for these unspecified updates, and thus, as required by U.S. GAAP, we recognize revenue from the sale of these online-enabled games and related content over the period we expect to offer the unspecified updates to the consumer (“estimated offering period”).
Change in Estimated Offering Period
Prior to July 1, 2013, for most sales, we estimated the offering period to be six months and recognized revenue over this period in the month after delivery. During the three months ended September 30, 2013, we completed our fiscal 2014 annual evaluation of the estimated offering period and noted that generally, consumers were playing our games online over a longer period of time. Based on this, we concluded that for physical software sales made after June 30, 2013, the estimated offering period should be increased to nine months, resulting in revenue being recognized over a longer period of time. This change in estimate resulted in an estimated decrease to net revenue and net income of
$474 million
and a decrease of
$1.50
of diluted earnings per share for fiscal year 2014. During the fiscal year ended March 31, 2015, this change in estimate resulted in an estimated increase to net revenue and net income of
$474 million
and an increase of
$1.46
of diluted earnings per share. The estimated offering period for digitally distributed games did not change and is six months. We completed our fiscal 2015 annual evaluation during the second quarter and determined that the estimated offering period for physical software sales and digital sales continues to be nine months and six months, respectively.
56
Other Multiple-Element Arrangements
In some of our multiple-element arrangements, we sell tangible products with software and/or software-related offerings. These tangible products are generally either peripherals or ancillary collectors’ items, such as figurines and comic books. Revenue for these arrangements is allocated to each separate unit of accounting for each deliverable using the relative selling prices of each deliverable in the arrangement based on the selling price hierarchy described below. If the arrangement contains more than one software deliverable, the arrangement consideration is allocated to the software deliverables as a group and then allocated to each software deliverable in accordance with ASC 985-605.
We determine the selling price for a tangible product deliverable based on the following selling price hierarchy: VSOE (
i.e.
, the price we charge when the tangible product is sold separately) if available, third-party evidence (“TPE”) of fair value (
i.e.
, the price charged by others for similar tangible products) if VSOE is not available, or our best estimate of selling price (“BESP”) if neither VSOE nor TPE is available. In accordance with ASC 605, provided the other three revenue recognition criteria other than delivery have been met, we recognize revenue upon delivery to the customer as we have no further obligations.
Principal Agent Considerations
In accordance with ASC 605-45,
Revenue Recognition: Principal Agent Considerations
, we evaluate sales of our interactive software games via third party storefronts, including digital storefronts such as Xbox Live Marketplace, Sony PSN, Apple App Store, and Google Play, in order to determine whether or not we are acting as the principal or as an agent, which we consider in determining if revenue should be reported gross or net of fees retained by the storefront. Key indicators that we evaluate in determining gross versus net treatment include but are not limited to the following:
|
•
|
The party responsible for delivery/fulfillment of the product or service to the end consumer
|
|
•
|
The party responsible for the billing, collection of fees and refunds to the consumer
|
|
•
|
The storefront and Terms of Sale that govern the consumer’s purchase of the product or service
|
|
•
|
The party that sets the pricing with the consumer and has credit risk
|
Based on the evaluation of the above indicators, we have determined that we are generally acting as an agent and are not considered the primary obligor to consumers for our interactive software games distributed through third party digital storefronts. We therefore recognize revenue related to these arrangements on a net basis.
Sales Returns and Allowances and Bad Debt Reserves
We reduce revenue primarily for estimated future returns and price protection which may occur with our distributors and retailers (“channel partners”). Price protection represents our practice to provide our channel partners with a credit allowance to lower their wholesale price on a particular product in the channel. The amount of the price protection is generally the difference between the old wholesale price and the new reduced wholesale price. In certain countries for our PC and console packaged goods software products, we also have a practice of allowing channel partners to return older software products in the channel in exchange for a credit allowance. As a general practice, we do not give cash refunds.
Taxes Collected from Customers and Remitted to Governmental Authorities
Taxes assessed by a government authority that are both imposed on and concurrent with specific revenue transactions between us and our customers are presented on a net basis in our Consolidated Statements of Operations.
Concentration of Credit Risk, Significant Customers, Franchises and Channel Partners
We extend credit to various retailers and channel partners. Collection of trade receivables may be affected by changes in economic or other industry conditions and may, accordingly, impact our overall credit risk. Although we generally do not require collateral, we perform ongoing credit evaluations of our customers and maintain reserves for potential credit losses. Invoices are aged based on contractual terms with our customers. The provision for doubtful accounts is recorded as a charge to general and administrative expense when a potential loss is identified. Losses are written off against the allowance when the receivable is determined to be uncollectible. At March 31, 2015, we had two customers who accounted for approximately
26 percent
and
10 percent
of our consolidated gross receivables. At March 31, 2014, we had three customers who accounted for
17 percent
,
15 percent
, and
11 percent
of our consolidated gross receivables.
A majority of our sales are made to major retailers, distributors, and digital resellers. During the
fiscal year ended March 31, 2015
, approximately
58 percent
of our net revenue was derived from our top ten customers. Though our products and services are available to consumers through a variety of retailers and directly through us, the concentration of our sales in one, or a few,
57
large customers could lead to a short-term disruption in our sales if one or more of these customers significantly reduced their purchases or ceased to carry our products and services, and could make us more vulnerable to collection risk if one or more of these large customers became unable to pay for our products or declared bankruptcy.
A significant portion of our revenue has historically been derived from games and services based on a few popular franchises. For example, in fiscal year 2015, net revenue generated from the sale of products and services associated with our three largest franchises accounted for approximately
54 percent
of our net revenue.
Currently, a majority of our revenue is derived through sales of products and services on hardware consoles from Sony and Microsoft. For the
fiscal years ended March 31, 2015 and 2014
, our net revenue for products and services on Sony’s PlayStation 3 and 4, and Microsoft’s Xbox 360 and One consoles (combined across all four platforms) was
66 percent
and
55 percent
, respectively. In the
fiscal year ended March 31, 2013
, our net revenue for products and services on the PlayStation 3 and Xbox 360 combined was
60 percent
. These platform partners have significant influence over the products and services that we offer on their platform. Our agreements with Sony and Microsoft typically give significant control to them over the approval, manufacturing and distribution of our products and services, which could, in certain circumstances, leave us unable to get our products and services approved, manufactured and provided to customers.
Short-term investments are placed with high quality financial institutions or in short-duration, investment-grade securities. We limit the amount of credit exposure in any one financial institution or type of investment instrument.
Royalties and Licenses
Royalty-based obligations with content licensors and distribution affiliates are either paid in advance and capitalized as prepaid royalties or are accrued as incurred and subsequently paid. These royalty-based obligations are generally expensed to cost of revenue generally at the greater of the contractual rate or an effective royalty rate based on the total projected net revenue for contracts with guaranteed minimums.
Each quarter, we also evaluate the expected future realization of our royalty-based assets, as well as any unrecognized minimum commitments not yet paid to determine amounts we deem unlikely to be realized through product and service sales. Any impairments or losses determined before the launch of a product are generally charged to research and development expense. Impairments or losses determined post-launch are charged to cost of revenue. We evaluate long-lived royalty-based assets for impairment using undiscounted cash flows when impairment indicators exist. If impairment exists, then the assets are written down to fair value. Unrecognized minimum royalty-based commitments are accounted for as executory contracts, and therefore, any losses on these commitments are recognized when the underlying intellectual property is abandoned (
i.e.
, cease use) or the contractual rights to use the intellectual property are terminated.
Advertising Costs
We generally expense advertising costs as incurred, except for production costs associated with media campaigns, which are recognized as prepaid assets (to the extent paid in advance) and expensed at the first run of the advertisement. Cooperative advertising costs are recognized when incurred and are included in marketing and sales expense if there is a separate identifiable benefit for which we can reasonably estimate the fair value of the benefit identified. Otherwise, they are recognized as a reduction of revenue and are generally accrued when revenue is recognized. We then reimburse the channel partner when qualifying claims are submitted.
We are also reimbursed by our vendors for certain advertising costs incurred by us that benefit our vendors. Such amounts are recognized as a reduction of marketing and sales expense if the advertising (1) is specific to the vendor, (2) represents an identifiable benefit to us, and (3) represents an incremental cost to us. Otherwise, vendor reimbursements are recognized as a reduction of cost of revenue as the related revenue is recognized. Vendor reimbursements of advertising costs of
$43 million
,
$66 million
, and
$45 million
reduced marketing and sales expense for the
fiscal years ended March 31, 2015, 2014 and 2013
, respectively. For the
fiscal years ended March 31, 2015, 2014 and 2013
, advertising expense, net of vendor reimbursements, totaled approximately
$228 million
,
$217 million
, and
$240 million
, respectively.
Software Development Costs
Research and development costs, which consist primarily of software development costs, are expensed as incurred. We are required to capitalize software development costs incurred for computer software to be sold, leased or otherwise marketed after technological feasibility of the software is established or for development costs that have alternative future uses. Under our current practice of developing new games, the technological feasibility of the underlying software is not established until substantially all product development and testing is complete, which generally includes the development of a working model. The software development costs that have been capitalized to date have been insignificant.
58
Foreign Currency Translation
For each of our foreign operating subsidiaries, the functional currency is generally its local currency. Assets and liabilities of foreign operations are translated into U.S. dollars using month-end exchange rates, and revenue and expenses are translated into U.S. dollars using average exchange rates. The effects of foreign currency translation adjustments are included as a component of accumulated other comprehensive income in stockholders’ equity.
Foreign currency transaction gains and losses are a result of the effect of exchange rate changes on transactions denominated in currencies other than the functional currency. Net foreign currency transaction gains (losses) of
$(62) million
,
$4 million
, and
$2 million
for the
fiscal years ended March 31, 2015, 2014 and 2013
, respectively, are included in interest and other income (expense), net, in our Consolidated Statements of Operations. These net foreign currency transaction gains (losses) are partially offset by net gains (losses) on our foreign currency forward contracts of
$59 million
,
$(5) million
, and
$(2) million
for the
fiscal years ended March 31, 2015, 2014 and 2013
, respectively. See Note 4 for additional information on our foreign currency forward contracts.
Income Taxes
We recognize deferred tax assets and liabilities for both the expected impact of differences between the financial statement amount and the tax basis of assets and liabilities and for the expected future tax benefit to be derived from tax losses and tax credit carryforwards. We record a valuation allowance against deferred tax assets when it is considered more likely than not that all or a portion of our deferred tax assets will not be realized. In making this determination, we are required to give significant weight to evidence that can be objectively verified. It is generally difficult to conclude that a valuation allowance is not needed when there is significant negative evidence, such as cumulative losses in recent years. Forecasts of future taxable income are considered to be less objective than past results, therefore, cumulative losses weigh heavily in the overall assessment.
In addition to considering forecasts of future taxable income, we are also required to evaluate and quantify other possible sources of taxable income in order to assess the realization of our deferred tax assets, namely the reversal of existing deferred tax liabilities, the carry back of losses and credits as allowed under current tax law, and the implementation of tax planning strategies. Evaluating and quantifying these amounts involves significant judgments. Each source of income must be evaluated based on all positive and negative evidence; this evaluation involves assumptions about future activity. Certain taxable temporary differences that are not expected to reverse during the carry forward periods permitted by tax law cannot be considered as a source of future taxable income that may be available to realize the benefit of deferred tax assets.
In fiscal year 2015, we reported U.S. pre-tax income, compared to pre-tax losses in each of the last seven fiscal years. We have not yet been able to establish a sustained level of profitability in the U.S. or other sufficient significant positive evidence to conclude that our U.S. deferred tax assets are more likely than not to be realized. Therefore, we continue to maintain a valuation allowance against most of our U.S. deferred tax assets. However, it is reasonably possible that in fiscal year 2016 we will establish a sustained level of profitability in the U.S. As a result, it is possible that a significant portion of the valuation allowance recorded against our U.S. deferred tax assets at March 31, 2015 could be reversed by the end of fiscal year 2016.
Recently Adopted Accounting Standards
On April 1, 2014, we adopted ASU 2013-11,
Presentation of an Unrecognized Tax Benefit When a Net Operating Loss Carryforward, a Similar Tax Loss, or a Tax Credit Carryforward Exists
. Under the new accounting standard, an unrecognized tax benefit is required to be presented as a reduction to a deferred tax asset if the disallowance of the uncertain tax position would reduce an available tax loss or tax credit carryforward instead of resulting in a cash tax liability. The ASU applies prospectively to all unrecognized tax benefits that exist as of the adoption date. As a result of the adoption, we reduced: (a) noncurrent income tax obligations by
$96 million
; (b) current deferred income tax assets by
$18 million
; and (c) noncurrent deferred income tax assets by
$11 million
. We increased noncurrent deferred income tax liabilities by
$67 million
. As the new accounting standard only impacted presentation, it did not have an impact on the Company’s net financial position, results of operations, or cash flows.
Impact of Recently Issued Accounting Standards
In April 2015, the FASB issued ASU 2015-03,
Interest - Imputation of Interest
(Topic 835-30), which requires that debt issuance costs related to a recognized debt liability be presented in the balance sheet as a direct deduction from the carrying amount of that debt liability, consistent with debt discounts. The recognition and measurement guidance for debt issuance costs are not affected by this ASU. The disclosure requirements will be effective for annual periods (and interim periods within those annual periods) beginning after December 15, 2015, and will require retrospective application. Early adoption is permitted. We do not expect the adoption to have a material impact on our Consolidated Financial Statements.
59
In May 2014, the FASB issued ASU No. 2014-09,
Revenue from Contracts with Customers
(Topic 606), which requires an entity to recognize the amount of revenue to which it expects to be entitled for the transfer of promised goods or services to customers. The ASU will replace most existing revenue recognition guidance in U.S. GAAP when it becomes effective. The standard permits the use of either the retrospective or cumulative effect transition method. The Company is evaluating the effect that ASU 2014-09 will have on its Consolidated Financial Statements and related disclosures. The Company has not yet selected a transition method nor has it determined the effect of the standard on its ongoing financial reporting. The new standard is effective for annual reporting periods beginning after December 15, 2016. Early application is not permitted. We are required to adopt this standard in the first quarter of fiscal year 2018; however, in April 2015, the FASB issued an exposure draft that would provide us with the option to adopt in either the first quarter of fiscal year 2018 or fiscal year 2019. We have not determined which of these two fiscal years we would adopt if the exposure draft is issued as final in its current form.
(2) FAIR VALUE MEASUREMENTS
There are various valuation techniques used to estimate fair value, the primary one being the price that would be received from selling an asset or paid to transfer a liability in an orderly transaction between market participants at the measurement date. When determining fair value, we consider the principal or most advantageous market in which we would transact and consider assumptions that market participants would use when pricing the asset or liability. We measure certain financial and nonfinancial assets and liabilities at fair value on a recurring and nonrecurring basis.
Fair Value Hierarchy
The three levels of inputs that may be used to measure fair value are as follows:
|
•
|
Level 1
. Quoted prices in active markets for identical assets or liabilities.
|
|
•
|
Level 2
. Observable inputs other than quoted prices included within Level 1, such as quoted prices for similar assets or liabilities, quoted prices in markets with insufficient volume or infrequent transactions (less active markets), or model-derived valuations in which all significant inputs are observable or can be derived principally from or corroborated with observable market data for substantially the full term of the assets or liabilities.
|
|
•
|
Level 3
. Unobservable inputs to the valuation methodology that are significant to the measurement of the fair value of assets or liabilities.
|
60
Assets and Liabilities Measured at Fair Value on a Recurring Basis
As of
March 31, 2015 and 2014
, our assets and liabilities that were measured and recorded at fair value on a recurring basis were as follows (in millions):
|
|
|
Fair Value Measurements at Reporting Date Using
|
|
||||||||||||||
|
|
As of March 31, 2015
|
Quoted Prices in
Active Markets for Identical
Financial Instruments
|
Significant
Other
Observable
Inputs
|
Significant
Unobservable
Inputs
|
|
||||||||||||
|
|
(Level 1)
|
(Level 2)
|
(Level 3)
|
Balance Sheet Classification
|
|||||||||||||
|
Assets
|
|||||||||||||||||
|
Bank and time deposits
|
$
|
175
|
|
$
|
175
|
|
$
|
—
|
|
$
|
—
|
|
Cash equivalents
|
||||
|
Money market funds
|
7
|
|
7
|
|
—
|
|
—
|
|
Cash equivalents
|
||||||||
|
Available-for-sale securities:
|
|||||||||||||||||
|
Corporate bonds
|
468
|
|
—
|
|
468
|
|
—
|
|
Short-term investments and cash equivalents
|
||||||||
|
U.S. Treasury securities
|
214
|
|
214
|
|
—
|
|
—
|
|
Short-term investments
|
||||||||
|
U.S. agency securities
|
180
|
|
—
|
|
180
|
|
—
|
|
Short-term investments and cash equivalents
|
||||||||
|
Commercial paper
|
140
|
|
140
|
|
Short-term investments and cash equivalents
|
||||||||||||
|
Foreign currency derivatives
|
18
|
|
—
|
|
18
|
|
—
|
|
Other current assets
|
||||||||
|
Deferred compensation plan assets
(a)
|
9
|
|
9
|
|
—
|
|
—
|
|
Other assets
|
||||||||
|
Total assets at fair value
|
$
|
1,211
|
|
$
|
405
|
|
$
|
806
|
|
$
|
—
|
|
|||||
|
Liabilities
|
|||||||||||||||||
|
Contingent consideration
(b)
|
$
|
—
|
|
$
|
—
|
|
$
|
—
|
|
$
|
—
|
|
Accrued and other current
liabilities |
||||
|
Foreign currency derivatives
|
9
|
|
—
|
|
9
|
|
—
|
|
Accrued and other current liabilities
|
||||||||
|
Deferred compensation plan liabilities
(a)
|
9
|
|
9
|
|
—
|
|
—
|
|
Other liabilities
|
||||||||
|
Total liabilities at fair value
|
$
|
18
|
|
$
|
9
|
|
$
|
9
|
|
$
|
—
|
|
|||||
|
|
|
Fair Value Measurements Using Significant Unobservable Inputs (Level 3)
|
|
||||||||
|
|
|
|
|
Contingent
Consideration
|
|
||||||
|
Balance as of March 31, 2014
|
$
|
4
|
|
||||||||
|
Change in fair value
(c)
|
(3
|
)
|
|||||||||
|
Payments
(d)
|
(1
|
)
|
|||||||||
|
Balance as of March 31, 2015
(b)
|
$
|
—
|
|
||||||||
61
|
|
|
Fair Value Measurements at Reporting Date Using
|
|
||||||||||||||
|
|
As of
March 31, 2014 |
Quoted Prices in Active Markets for Identical
Financial
Instruments
|
Significant
Other
Observable
Inputs
|
Significant
Unobservable
Inputs
|
|
||||||||||||
|
|
(Level 1)
|
(Level 2)
|
(Level 3)
|
Balance Sheet Classification
|
|||||||||||||
|
Assets
|
|||||||||||||||||
|
Money market funds
|
$
|
588
|
|
$
|
588
|
|
$
|
—
|
|
$
|
—
|
|
Cash equivalents
|
||||
|
Available-for-sale securities:
|
|||||||||||||||||
|
Corporate bonds
|
279
|
|
—
|
|
279
|
|
—
|
|
Short-term investments
|
||||||||
|
Commercial paper
|
146
|
|
—
|
|
146
|
|
—
|
|
Short-term investments and cash equivalents
|
||||||||
|
U.S. Treasury securities
|
118
|
|
118
|
|
—
|
|
—
|
|
Short-term investments and cash equivalents
|
||||||||
|
U.S. agency securities
|
89
|
|
—
|
|
89
|
|
—
|
|
Short-term investments and cash equivalents
|
||||||||
|
Deferred compensation plan assets
(a)
|
9
|
|
9
|
|
—
|
|
—
|
|
Other assets
|
||||||||
|
Total assets at fair value
|
$
|
1,229
|
|
$
|
715
|
|
$
|
514
|
|
$
|
—
|
|
|||||
|
Liabilities
|
|||||||||||||||||
|
Contingent consideration
(b)
|
$
|
4
|
|
$
|
—
|
|
$
|
—
|
|
$
|
4
|
|
Accrued and other current
liabilities and other liabilities |
||||
|
Foreign currency derivatives
|
6
|
|
—
|
|
6
|
|
—
|
|
Accrued and other current liabilities
|
||||||||
|
Deferred compensation plan liabilities
(a)
|
9
|
|
9
|
|
—
|
|
—
|
|
Other liabilities
|
||||||||
|
Total liabilities at fair value
|
$
|
19
|
|
$
|
9
|
|
$
|
6
|
|
$
|
4
|
|
|||||
|
|
|
Fair Value Measurements Using Significant Unobservable Inputs (Level 3)
|
|
||||||||
|
|
|
|
|
Contingent
Consideration
|
|
||||||
|
Balance as of March 31, 2013
|
$
|
43
|
|
||||||||
|
Change in fair value
(c)
|
(35
|
)
|
|||||||||
|
Payments
(d)
|
(4
|
)
|
|||||||||
|
Balance as of March 31, 2014
(b)
|
$
|
4
|
|
||||||||
|
(a)
|
The Deferred Compensation Plan assets consist of various mutual funds. See Note 15 for additional information regarding our Deferred Compensation Plan.
|
|
(b)
|
The contingent consideration as of
March 31, 2014
represented the estimated fair value of the additional variable cash consideration payable in connection with our acquisitions of KlickNation Corporation (“KlickNation”) and Chillingo Limited (“Chillingo”) that were contingent upon the achievement of certain performance milestones. We estimated the fair value of the acquisition-related contingent consideration payable using probability-weighted discounted cash flow models, and applied a discount rate that appropriately captured the risk associated with the obligation. The weighted average of the discount rates used during the fiscal year 2015 was
17 percent
. The weighted average of the discount rates used during the fiscal year 2014 was
18 percent
. The significant unobservable input used in the fair value measurement of the contingent consideration payable was forecasted earnings. At
March 31, 2014
, the fair market value of acquisition-related contingent consideration totaled
$4 million
, compared to a maximum potential payout of
$10 million
. At March 31, 2015, the KlickNation earn-out expired.
|
|
(c)
|
The change in fair value is reported as acquisition-related contingent consideration in our Consolidated Statements of Operations.
|
|
(d)
|
During
fiscal year 2015
, we made payments totaling
$1 million
to settle certain performance milestones achieved in connection with one of our acquisitions. During
fiscal year 2014
, we made payments totaling
$4 million
to settle certain performance milestones achieved in connection with two of our acquisitions.
|
62
(3) FINANCIAL INSTRUMENTS
Cash and Cash Equivalents
As of
March 31, 2015 and 2014
, our cash and cash equivalents were
$2,068 million
and
$1,782 million
, respectively. Cash equivalents were valued at their carrying amounts as they approximate fair value due to the short maturities of these financial instruments.
Short-Term Investments
Short-term investments consisted of the following as of
March 31, 2015 and 2014
(in millions):
|
|
As of March 31, 2015
|
As of March 31, 2014
|
|||||||||||||||||||||||||||||
|
|
Cost or
Amortized
Cost
|
Gross Unrealized
|
Fair
Value
|
Cost or
Amortized
Cost
|
Gross Unrealized
|
Fair
Value
|
|||||||||||||||||||||||||
|
|
Gains
|
Losses
|
Gains
|
Losses
|
|||||||||||||||||||||||||||
|
Corporate bonds
|
$
|
467
|
|
$
|
—
|
|
$
|
—
|
|
$
|
467
|
|
$
|
279
|
|
$
|
—
|
|
$
|
—
|
|
$
|
279
|
|
|||||||
|
U.S. Treasury securities
|
214
|
|
—
|
|
—
|
|
214
|
|
114
|
|
—
|
|
—
|
|
114
|
|
|||||||||||||||
|
U.S. agency securities
|
161
|
|
1
|
|
—
|
|
162
|
|
80
|
|
—
|
|
—
|
|
80
|
|
|||||||||||||||
|
Commercial paper
|
110
|
|
—
|
|
—
|
|
110
|
|
110
|
|
—
|
|
—
|
|
110
|
|
|||||||||||||||
|
Short-term investments
|
$
|
952
|
|
$
|
1
|
|
$
|
—
|
|
$
|
953
|
|
$
|
583
|
|
$
|
—
|
|
$
|
—
|
|
$
|
583
|
|
|||||||
We evaluate our investments for impairment quarterly. Factors considered in the review of investments include the credit quality of the issuer, the duration that the fair value has been less than the adjusted cost basis, severity of the impairment, the reason for the decline in value and potential recovery period, the financial condition and near-term prospects of the investees, our intent to sell and ability to hold the investment for a period of time sufficient to allow for any anticipated recovery in market value, and any contractual terms impacting the prepayment or settlement process. Based on our review, we did not consider these investments to be other-than-temporarily impaired as of
March 31, 2015 and 2014
.
The following table summarizes the amortized cost and fair value of our short-term investments, classified by stated maturity as of
March 31, 2015 and 2014
(in millions):
|
|
As of March 31, 2015
|
As of March 31, 2014
|
|||||||||||||
|
|
Amortized
Cost
|
Fair
Value
|
Amortized
Cost
|
Fair
Value
|
|||||||||||
|
Short-term investments
|
|||||||||||||||
|
Due in 1 year or less
|
$
|
417
|
|
$
|
417
|
|
$
|
318
|
|
$
|
318
|
|
|||
|
Due in 1-2 years
|
281
|
|
281
|
|
156
|
|
156
|
|
|||||||
|
Due in 2-3 years
|
244
|
|
245
|
|
104
|
|
104
|
|
|||||||
|
Due in 3-4 years
|
10
|
|
10
|
|
5
|
|
5
|
|
|||||||
|
Short-term investments
|
$
|
952
|
|
$
|
953
|
|
$
|
583
|
|
$
|
583
|
|
|||
(4) DERIVATIVE FINANCIAL INSTRUMENTS
The assets or liabilities associated with our derivative instruments and hedging activities are recorded at fair value in other current assets or accrued and other current liabilities, respectively, on our Consolidated Balance Sheets. As discussed below, the accounting for gains and losses resulting from changes in fair value depends on the use of the derivative instrument and whether it is designated and qualifies for hedge accounting.
We transact business in various foreign currencies and have significant international sales and expenses denominated in foreign currencies, subjecting us to foreign currency risk. We purchase foreign currency forward contracts, generally with maturities of
15 months
or less, to reduce the volatility of cash flows primarily related to forecasted revenue and expenses denominated in certain foreign currencies. Our cash flow risks are primarily related to fluctuations in the Euro, British pound sterling, Canadian dollar, and Swedish krona. In addition, we utilize foreign currency forward contracts to mitigate foreign exchange rate risk associated with foreign-currency-denominated monetary assets and liabilities, primarily intercompany receivables and payables. The foreign currency forward contracts not designated as hedging instruments generally have a contractual term of approximately
3 months
or less and are transacted near month-end. We do not use foreign currency forward contracts for speculative trading purposes.
63
Cash Flow Hedging Activities
Certain of our forward contracts are designated and qualify as cash flow hedges. The effectiveness of the cash flow hedge contracts, including time value, is assessed monthly using regression analysis, as well as other timing and probability criteria. To qualify for hedge accounting treatment, all hedging relationships are formally documented at the inception of the hedges and must be highly effective in offsetting changes to future cash flows on hedged transactions. The derivative assets or liabilities associated with our hedging activities are recorded at fair value in other current assets or accrued and other current liabilities on our Consolidated Balance Sheets. The effective portion of gains or losses resulting from changes in the fair value of these hedges is initially reported, net of tax, as a component of accumulated other comprehensive income in stockholders’ equity. The gross amount of the effective portion of gains or losses resulting from changes in the fair value of these hedges is subsequently reclassified into net revenue or research and development expenses, as appropriate, in the period when the forecasted transaction is recognized in our Consolidated Statements of Operations. In the event that the gains or losses in accumulated other comprehensive income are deemed to be ineffective, the ineffective portion of gains or losses resulting from changes in fair value, if any, is reclassified to interest and other income (expense), net, in our Consolidated Statements of Operations. In the event that the underlying forecasted transactions do not occur, or it becomes remote that they will occur, within the defined hedge period, the gains or losses on the related cash flow hedges are reclassified from accumulated other comprehensive income to interest and other income (expense), net, in our Consolidated Statements of Operations.
Total gross notional amounts and fair values for currency derivatives with cash flow hedge accounting designation are as follows:
|
As of March 31, 2015
|
As of March 31, 2014
|
||||||||||||||||||||||
|
Notional Amount
|
Fair Value
|
Notional Amount
|
Fair Value
|
||||||||||||||||||||
|
Asset
|
Liability
|
Asset
|
Liability
|
||||||||||||||||||||
|
Forward contracts to purchase
|
$
|
108
|
|
$
|
—
|
|
$
|
8
|
|
$
|
179
|
|
$
|
—
|
|
$
|
3
|
|
|||||
|
Forward contracts to sell
|
$
|
508
|
|
$
|
18
|
|
$
|
1
|
|
$
|
363
|
|
$
|
—
|
|
$
|
2
|
|
|||||
The net impact of the effective portion of gains and losses from our cash flow hedging activities in our Consolidated Statements of Operations for the
fiscal years ended March 31, 2015, 2014 and 2013
was a loss of
$11 million
,
$9 million
, and
$4 million
, respectively.
During the
fiscal years ended March 31, 2015, 2014 and 2013
, we reclassified an immaterial amount of the ineffective portion of gains or losses resulting from changes in fair value into interest and other income (expense), net.
Balance Sheet Hedging Activities
Our foreign currency forward contracts that are not designated as hedging instruments are accounted for as derivatives whereby the fair value of the contracts are reported as other current assets or accrued and other current liabilities on our Consolidated Balance Sheets, and gains and losses resulting from changes in the fair value are reported in interest and other income (expense), net, in our Consolidated Statements of Operations. The gains and losses on these foreign currency forward contracts generally offset the gains and losses in the underlying foreign-currency-denominated monetary assets and liabilities, which are also reported in interest and other income (expense), net, in our Consolidated Statements of Operations. The fair value of our foreign currency forward contracts was measured using Level 2 inputs.
Total gross notional amounts and fair values for currency derivatives that are not designated as hedging instruments are accounted for as follows:
|
As of March 31, 2015
|
As of March 31, 2014
|
||||||||||||||||||||||
|
Notional Amount
|
Fair Value
|
Notional Amount
|
Fair Value
|
||||||||||||||||||||
|
Asset
|
Liability
|
Asset
|
Liability
|
||||||||||||||||||||
|
Forward contracts to purchase
|
$
|
99
|
|
$
|
—
|
|
$
|
—
|
|
$
|
140
|
|
$
|
—
|
|
$
|
1
|
|
|||||
|
Forward contracts to sell
|
$
|
173
|
|
$
|
—
|
|
$
|
—
|
|
$
|
232
|
|
$
|
—
|
|
$
|
—
|
|
|||||
64
The effect of foreign currency forward contracts not designated as hedging instruments in our Consolidated Statements of Operations for the
fiscal years ended March 31, 2015, 2014 and 2013
, was as follows (in millions):
|
|
Location of Gain (Loss) Recognized in Income on
Derivative Instruments
|
Amount of Gain (Loss) Recognized in Income on Derivative Instruments
|
|||||||||||
|
|
Year Ended March 31,
|
||||||||||||
|
|
2015
|
2014
|
2013
|
||||||||||
|
Foreign currency forward contracts not designated as hedging instruments
|
Interest and other
income (expense), net
|
$
|
58
|
|
$
|
(5
|
)
|
$
|
(2
|
)
|
|||
(5) ACCUMULATED OTHER COMPREHENSIVE INCOME (LOSS)
The changes in accumulated other comprehensive income (loss) by component, net of tax, for the
fiscal years ended March 31, 2015, 2014 and 2013
are as follows (in millions):
|
Unrealized Net Gains (Losses) on Available-for-Sale Securities
|
Unrealized Net Gains (Losses) on Derivative Instruments
|
Foreign Currency Translation Adjustments
|
Total
|
||||||||||||
|
Balances as of March 31, 2012
|
$
|
83
|
|
$
|
(2
|
)
|
$
|
92
|
|
$
|
173
|
|
|||
|
Other comprehensive loss before reclassifications
|
(46
|
)
|
(2
|
)
|
(19
|
)
|
(67
|
)
|
|||||||
|
Amounts reclassified from accumulated other comprehensive income
|
(41
|
)
|
4
|
|
—
|
|
(37
|
)
|
|||||||
|
Net current-period other comprehensive income (loss)
|
(87
|
)
|
2
|
|
(19
|
)
|
(104
|
)
|
|||||||
|
Balances as of March 31, 2013
|
$
|
(4
|
)
|
$
|
—
|
|
$
|
73
|
|
$
|
69
|
|
|||
|
Other comprehensive loss before reclassifications
|
$
|
—
|
|
$
|
(19
|
)
|
$
|
(22
|
)
|
$
|
(41
|
)
|
|||
|
Amounts reclassified from accumulated other comprehensive income
|
—
|
|
9
|
|
—
|
|
9
|
|
|||||||
|
Net current-period other comprehensive income (loss)
|
—
|
|
(10
|
)
|
(22
|
)
|
(32
|
)
|
|||||||
|
Balances as of March 31, 2014
|
(4
|
)
|
(10
|
)
|
51
|
|
37
|
|
|||||||
|
Other comprehensive income (loss) before reclassifications
|
$
|
1
|
|
$
|
20
|
|
$
|
(67
|
)
|
$
|
(46
|
)
|
|||
|
Amounts reclassified from accumulated other comprehensive income
|
—
|
|
11
|
|
—
|
|
11
|
|
|||||||
|
Net current-period other comprehensive income (loss)
|
1
|
|
31
|
|
(67
|
)
|
(35
|
)
|
|||||||
|
Balances as of March 31, 2015
|
(3
|
)
|
21
|
|
(16
|
)
|
2
|
|
|||||||
65
The effects on net income (loss) of amounts reclassified from accumulated other comprehensive income (loss) for the
fiscal years ended March 31, 2015, 2014 and 2013
were as follows (in millions):
|
Statement of Operations Classification
|
Amount Reclassified From Accumulated Other Comprehensive Income (loss)
|
|||||||||||
|
Year Ended March 31,
|
||||||||||||
|
2015
|
2014
|
2013
|
||||||||||
|
Gains and losses on available-for-sale securities
|
||||||||||||
|
Gains on strategic investments
|
$
|
—
|
|
$
|
—
|
|
$
|
(39
|
)
|
|||
|
Interest and other income (expense), net
|
—
|
|
—
|
|
(2
|
)
|
||||||
|
Net of tax
|
—
|
|
—
|
|
(41
|
)
|
||||||
|
Gains and losses on cash flow hedges from forward contracts
|
||||||||||||
|
Net revenue
|
(2
|
)
|
7
|
|
3
|
|
||||||
|
Research and development
|
13
|
|
2
|
|
1
|
|
||||||
|
Net of tax
|
11
|
|
9
|
|
4
|
|
||||||
|
Total amount reclassified, net of tax
|
$
|
11
|
|
$
|
9
|
|
$
|
(37
|
)
|
|||
(6) BUSINESS COMBINATIONS
During each of the fiscal years ended March 31, 2014 and 2013, we completed
one
acquisition that did not have a significant impact on our Consolidated Financial Statements. There were no acquisitions during the fiscal year ended March 31, 2015.
(7) GOODWILL AND ACQUISITION-RELATED INTANGIBLES, NET
The changes in the carrying amount of goodwill for the
fiscal year ended March 31, 2015
are as follows (in millions):
|
As of
March 31, 2014 |
Activity
|
Effects of Foreign Currency Translation
|
As of
March 31, 2015 |
||||||||||||
|
Goodwill
|
$
|
2,091
|
|
$
|
—
|
|
$
|
(10
|
)
|
$
|
2,081
|
|
|||
|
Accumulated impairment
|
(368
|
)
|
—
|
|
—
|
|
(368
|
)
|
|||||||
|
Total
|
$
|
1,723
|
|
$
|
—
|
|
$
|
(10
|
)
|
$
|
1,713
|
|
|||
The changes in the carrying amount of goodwill for the
fiscal year ended March 31, 2014
are as follows (in millions):
|
As of
March 31, 2013 |
Activity
|
Effects of Foreign Currency Translation
|
As of
March 31, 2014 |
||||||||||||
|
Goodwill
|
$
|
2,089
|
|
$
|
5
|
|
$
|
(3
|
)
|
$
|
2,091
|
|
|||
|
Accumulated impairment
|
(368
|
)
|
—
|
|
—
|
|
(368
|
)
|
|||||||
|
Total
|
$
|
1,721
|
|
$
|
5
|
|
$
|
(3
|
)
|
$
|
1,723
|
|
|||
Goodwill represents the excess of the purchase price over the fair value of the underlying acquired net tangible and intangible assets. Goodwill is not amortized, but rather subject to at least an annual assessment for impairment by applying a fair value-based test.
66
Acquisition-related intangibles, consisted of the following (in millions):
|
|
As of March 31, 2015
|
As of March 31, 2014
|
|||||||||||||||||||||
|
|
Gross
Carrying
Amount
|
Accumulated
Amortization
|
Acquisition-
Related
Intangibles, Net
|
Gross
Carrying
Amount
|
Accumulated
Amortization
|
Acquisition-
Related
Intangibles, Net
|
|||||||||||||||||
|
Developed and core technology
|
$
|
531
|
|
$
|
(439
|
)
|
$
|
92
|
|
$
|
531
|
|
$
|
(385
|
)
|
$
|
146
|
|
|||||
|
Trade names and trademarks
|
130
|
|
(111
|
)
|
19
|
|
130
|
|
(105
|
)
|
25
|
|
|||||||||||
|
Registered user base and other intangibles
|
87
|
|
(87
|
)
|
—
|
|
87
|
|
(87
|
)
|
—
|
|
|||||||||||
|
Carrier contracts and related
|
85
|
|
(85
|
)
|
—
|
|
85
|
|
(79
|
)
|
6
|
|
|||||||||||
|
Total
|
$
|
833
|
|
$
|
(722
|
)
|
$
|
111
|
|
$
|
833
|
|
$
|
(656
|
)
|
$
|
177
|
|
|||||
Amortization of intangibles for the
fiscal years ended March 31, 2015, 2014 and 2013
are classified in the Consolidated Statement of Operations as follows (in millions):
|
|
Year Ended March 31,
|
||||||||||
|
|
2015
|
2014
|
2013
|
||||||||
|
Cost of product
|
$
|
16
|
|
$
|
33
|
|
$
|
55
|
|
||
|
Cost of service and other
|
36
|
|
27
|
|
38
|
|
|||||
|
Operating expenses
|
14
|
|
16
|
|
30
|
|
|||||
|
Total
|
$
|
66
|
|
$
|
76
|
|
$
|
123
|
|
||
Acquisition-related intangible assets are amortized using the straight-line method over the lesser of their estimated useful lives or the agreement terms, typically from
2
to
14
years. As of
March 31, 2015 and 2014
, the weighted-average remaining useful life for acquisition-related intangible assets was approximately
2.8 years
and
3.4 years
for each period, respectively.
As of
March 31, 2015
, future amortization of acquisition-related intangibles that will be recorded in the Consolidated Statement of Operations is estimated as follows (in millions):
|
Fiscal Year Ending March 31,
|
|
||
|
2016
|
$
|
53
|
|
|
2017
|
32
|
|
|
|
2018
|
12
|
|
|
|
2019
|
8
|
|
|
|
2020
|
6
|
|
|
|
Thereafter
|
—
|
|
|
|
Total
|
$
|
111
|
|
(8) RESTRUCTURING AND OTHER CHARGES
Restructuring and other restructuring plan-related information as of
March 31, 2015
was as follows (in millions):
|
|
Fiscal 2011
Restructuring |
Other Restructurings and Reorganization
|
|||||||||||||||||
|
|
Other
|
Workforce
|
Facilities-
related
|
Other
|
Total
|
||||||||||||||
|
Balances as of March 31, 2012
|
$
|
75
|
|
$
|
—
|
|
$
|
3
|
|
$
|
—
|
|
$
|
78
|
|
||||
|
Charges to operations
|
6
|
|
10
|
|
2
|
|
9
|
|
$
|
27
|
|
||||||||
|
Charges settled in cash
|
(24
|
)
|
(10
|
)
|
(1
|
)
|
(1
|
)
|
$
|
(36
|
)
|
||||||||
|
Charges settled in non-cash
|
—
|
|
—
|
|
—
|
|
(7
|
)
|
$
|
(7
|
)
|
||||||||
|
Balances as of March 31, 2013
|
$
|
57
|
|
$
|
—
|
|
$
|
4
|
|
$
|
1
|
|
$
|
62
|
|
||||
|
Charges to operations
|
(2
|
)
|
—
|
|
1
|
|
—
|
|
$
|
(1
|
)
|
||||||||
|
Charges settled in cash
|
(8
|
)
|
—
|
|
(3
|
)
|
—
|
|
$
|
(11
|
)
|
||||||||
|
Balances as of March 31, 2014
|
47
|
|
—
|
|
2
|
|
1
|
|
50
|
|
|||||||||
|
Charges to operations
|
—
|
|
—
|
|
—
|
|
—
|
|
$
|
—
|
|
||||||||
|
Charges settled in cash
|
(36
|
)
|
—
|
|
(1
|
)
|
(1
|
)
|
$
|
(38
|
)
|
||||||||
|
Balances as of March 31, 2015
|
$
|
11
|
|
$
|
—
|
|
$
|
1
|
|
$
|
—
|
|
$
|
12
|
|
||||
67
Fiscal 2011 Restructuring
In fiscal year 2011, we announced a plan focused on the restructuring of certain licensing and developer agreements in an effort to improve the long-term profitability of our packaged goods business. Under this plan, we amended certain licensing and developer agreements. To a much lesser extent, as part of this restructuring we had workforce reductions and facilities closures through March 31, 2011. Substantially all of these exit activities were completed by March 31, 2011.
Since the inception of the fiscal 2011 restructuring plan through
March 31, 2015
, we have incurred charges of
$172 million
, consisting of (1)
$129 million
related to the amendment of certain licensing agreements and other intangible asset impairment costs, (2)
$31 million
related to the amendment of certain developer agreements, and (3)
$12 million
in employee-related expenses. The
$11 million
restructuring accrual as of
March 31, 2015
is expected to be settled by December 2015. We do not expect to incur any additional restructuring charges under this plan.
Other Restructurings and Reorganization
We also engaged in various other restructurings and a reorganization based on management decisions made in fiscal years 2013 and 2009. We do not expect to incur any additional restructuring charges under these plans. The
$1 million
restructuring accrual as of
March 31, 2015
related to our other restructuring plans is expected to be settled by April 2020.
(9) ROYALTIES AND LICENSES
Our royalty expenses consist of payments to (1) content licensors, (2) independent software developers, and (3) co-publishing and distribution affiliates. License royalties consist of payments made to celebrities, professional sports organizations, movie studios and other organizations for our use of their trademarks, copyrights, personal publicity rights, content and/or other intellectual property. Royalty payments to independent software developers are payments for the development of intellectual property related to our games. Co-publishing and distribution royalties are payments made to third parties for the delivery of products.
Royalty-based obligations with content licensors and distribution affiliates are either paid in advance and capitalized as prepaid royalties or are accrued as incurred and subsequently paid. These royalty-based obligations are generally expensed to cost of revenue at the greater of the contractual rate or an effective royalty rate based on the total projected net revenue for contracts with guaranteed minimums. Prepayments made to thinly capitalized independent software developers and co-publishing affiliates are generally made in connection with the development of a particular product, and therefore, we are generally subject to development risk prior to the release of the product. Accordingly, payments that are due prior to completion of a product are generally expensed to research and development over the development period as the services are incurred. Payments due after completion of the product (primarily royalty-based in nature) are generally expensed as cost of revenue.
Our contracts with some licensors include minimum guaranteed royalty payments, which are initially recorded as an asset and as a liability at the contractual amount when no performance remains with the licensor. When performance remains with the licensor, we record guarantee payments as an asset when actually paid and as a liability when incurred, rather than recording the asset and liability upon execution of the contract. Royalty liabilities are classified as current liabilities to the extent such royalty payments are contractually due within the next 12 months.
Each quarter, we also evaluate the expected future realization of our royalty-based assets, as well as any unrecognized minimum commitments not yet paid to determine amounts we deem unlikely to be realized through product and service sales. Any impairments or losses determined before the launch of a product are generally charged to research and development expense. Impairments or losses determined post-launch are charged to cost of revenue. We evaluate long-lived royalty-based assets for impairment using undiscounted cash flows when impairment indicators exist. If impairment exists, then the assets are written down to fair value. Unrecognized minimum royalty-based commitments are accounted for as executory contracts, and therefore, any losses on these commitments are recognized when the underlying intellectual property is abandoned (
i.e.
, cease use) or the contractual rights to use the intellectual property are terminated.
During
fiscal year 2015
, we recognized a loss of
$122 million
on a previously unrecognized licensed intellectual property commitment. The
$122 million
loss relates to the termination of certain rights we previously had to use a licensor’s intellectual property. In addition, because the loss will be paid in installments through March 2022, our accrued loss was computed using the effective interest method. We currently estimate recognizing in future periods through March 2022, approximately
$29 million
for the accretion of interest expense related to this obligation. This interest expense will be included in cost of revenue in our Consolidated Statement of Operations. During
fiscal year 2014
, we recognized losses of
$35 million
, inclusive of impairment charges of
$17 million
on royalty-based assets and
$18 million
of losses on previously unrecognized royalty-based commitments.
68
The current and long-term portions of prepaid royalties and minimum guaranteed royalty-related assets, included in other current assets and other assets, consisted of (in millions):
|
|
As of March 31,
|
||||||
|
|
2015
|
2014
|
|||||
|
Other current assets
|
$
|
70
|
|
$
|
97
|
|
|
|
Other assets
|
59
|
|
58
|
|
|||
|
Royalty-related assets
|
$
|
129
|
|
$
|
155
|
|
|
At any given time, depending on the timing of our payments to our co-publishing and/or distribution affiliates, content licensors, and/or independent software developers, we classify any recognized unpaid royalty amounts due to these parties as accrued liabilities. The current and long-term portions of accrued royalties, included in accrued and other current liabilities and other liabilities, consisted of (in millions):
|
|
As of March 31,
|
||||||
|
|
2015
|
2014
|
|||||
|
Accrued royalties
|
$
|
119
|
|
$
|
73
|
|
|
|
Other accrued expenses
|
—
|
|
7
|
|
|||
|
Other liabilities
|
131
|
|
53
|
|
|||
|
Royalty-related liabilities
|
$
|
250
|
|
$
|
133
|
|
|
As of March 31, 2015
, we were committed to pay approximately
$1,584 million
to content licensors, independent software developers, and co-publishing and/or distribution affiliates, but performance remained with the counterparty (
i.e.
, delivery of the product or content or other factors) and such commitments were therefore not recorded in our Consolidated Financial Statements. See Note 13 for further information on our developer and licensor commitments.
(10) BALANCE SHEET DETAILS
Inventories
Inventories as of
March 31, 2015 and 2014
consisted of (in millions):
|
|
As of March 31,
|
||||||
|
|
2015
|
2014
|
|||||
|
Finished goods
|
$
|
35
|
|
$
|
55
|
|
|
|
Raw materials and work in process
|
1
|
|
1
|
|
|||
|
Inventories
|
$
|
36
|
|
$
|
56
|
|
|
Property and Equipment, Net
Property and equipment, net, as of
March 31, 2015 and 2014
consisted of (in millions):
|
|
As of March 31,
|
||||||
|
|
2015
|
2014
|
|||||
|
Computer, equipment and software
|
$
|
655
|
|
$
|
718
|
|
|
|
Buildings
|
315
|
|
327
|
|
|||
|
Leasehold improvements
|
126
|
|
129
|
|
|||
|
Office equipment, furniture and fixtures
|
64
|
|
67
|
|
|||
|
Land
|
62
|
|
63
|
|
|||
|
Warehouse, equipment and other
|
9
|
|
10
|
|
|||
|
Construction in progress
|
7
|
|
5
|
|
|||
|
1,238
|
|
1,319
|
|
||||
|
Less: accumulated depreciation
|
(779
|
)
|
(809
|
)
|
|||
|
Property and equipment, net
|
$
|
459
|
|
$
|
510
|
|
|
Depreciation expense associated with property and equipment was
$126 million
,
$126 million
and
$118 million
for the
fiscal years ended March 31, 2015, 2014 and 2013
, respectively.
69
Accrued and Other Current Liabilities
Accrued and other current liabilities as of
March 31, 2015 and 2014
consisted of (in millions):
|
|
As of March 31,
|
||||||
|
|
2015
|
2014
|
|||||
|
Other accrued expenses
|
$
|
298
|
|
$
|
328
|
|
|
|
Accrued compensation and benefits
|
263
|
|
259
|
|
|||
|
Accrued royalties
|
119
|
|
73
|
|
|||
|
Deferred net revenue (other)
|
114
|
|
121
|
|
|||
|
Accrued and other current liabilities
|
$
|
794
|
|
$
|
781
|
|
|
Deferred net revenue (other) includes the deferral of subscription revenue, deferrals related to our Switzerland distribution business, advertising revenue, licensing arrangements, and other revenue for which revenue recognition criteria has not been met.
Deferred Net Revenue (Online-Enabled Games)
Deferred net revenue (online-enabled games) was
$1,283 million
and
$1,490 million
as of
March 31, 2015 and 2014
, respectively. Deferred net revenue (online-enabled games) generally includes the unrecognized revenue from bundled sales of online-enabled games for which we do not have vendor-specific objective evidence of fair value (“VSOE”) for the obligation to provide unspecified updates. We recognize revenue from the sale of online-enabled games for which we do not have VSOE for the unspecified updates on a straight-line basis, generally over an estimated nine-month period beginning in the month after shipment for physical games sold through retail and an estimated six-month period for digitally-distributed games. However, we expense the cost of revenue related to these transactions during the period in which the product is delivered (rather than on a deferred basis).
(11) INCOME TAXES
The components of our income before provision for (benefit from) income taxes for the
fiscal years ended March 31, 2015, 2014 and 2013
are as follows (in millions):
|
|
Year Ended March 31,
|
||||||||||
|
|
2015
|
2014
|
2013
|
||||||||
|
Domestic
|
$
|
232
|
|
$
|
(146
|
)
|
$
|
(15
|
)
|
||
|
Foreign
|
693
|
|
153
|
|
154
|
|
|||||
|
Income before provision for (benefit from) income taxes
|
$
|
925
|
|
$
|
7
|
|
$
|
139
|
|
||
70
Provision for (benefit from) income taxes for the
fiscal years ended March 31, 2015, 2014 and 2013
consisted of (in millions):
|
|
Current
|
Deferred
|
Total
|
||||||||
|
Year Ended March 31, 2015
|
|||||||||||
|
Federal
|
$
|
10
|
|
$
|
17
|
|
$
|
27
|
|
||
|
State
|
—
|
|
—
|
|
—
|
|
|||||
|
Foreign
|
21
|
|
2
|
|
23
|
|
|||||
|
$
|
31
|
|
$
|
19
|
|
$
|
50
|
|
|||
|
Year Ended March 31, 2014
|
|||||||||||
|
Federal
|
$
|
(2
|
)
|
$
|
(9
|
)
|
$
|
(11
|
)
|
||
|
State
|
1
|
|
(2
|
)
|
(1
|
)
|
|||||
|
Foreign
|
8
|
|
3
|
|
11
|
|
|||||
|
$
|
7
|
|
$
|
(8
|
)
|
$
|
(1
|
)
|
|||
|
Year Ended March 31, 2013
|
|||||||||||
|
Federal
|
$
|
—
|
|
$
|
5
|
|
$
|
5
|
|
||
|
State
|
—
|
|
1
|
|
1
|
|
|||||
|
Foreign
|
39
|
|
(4
|
)
|
35
|
|
|||||
|
$
|
39
|
|
$
|
2
|
|
$
|
41
|
|
|||
Excess tax benefits from stock-based compensation deductions are allocated to contributed capital before historical net operating losses are utilized to reduce tax expense. Deferred income tax provision includes tax benefits allocated directly to contributed capital of
$21 million
and
$12 million
for
fiscal years 2015 and 2014
, respectively, and none for fiscal year 2013.
The differences between the statutory tax expense rate and our effective tax expense (benefit) rate, expressed as a percentage of income before provision for (benefit from) income taxes, for the
fiscal years ended March 31, 2015, 2014 and 2013
were as follows:
|
|
Year Ended March 31,
|
|||||||
|
|
2015
|
2014
|
2013
|
|||||
|
Statutory federal tax expense rate
|
35.0
|
%
|
35.0
|
%
|
35.0
|
%
|
||
|
State taxes, net of federal benefit
|
0.1
|
%
|
(242.9
|
)%
|
(5.0
|
)%
|
||
|
Differences between statutory rate and foreign effective tax rate
|
(22.3
|
)%
|
(142.9
|
)%
|
(15.2
|
)%
|
||
|
Valuation allowance
|
(9.2
|
)%
|
936.5
|
%
|
35.0
|
%
|
||
|
Research and development credits
|
(1.1
|
)%
|
(128.6
|
)%
|
(8.6
|
)%
|
||
|
Differences between book and tax on sale of strategic investments
|
—
|
|
—
|
|
(15.2
|
)%
|
||
|
Resolution of tax matters with authorities
|
(0.5
|
)%
|
(657.1
|
)%
|
—
|
|
||
|
Non-deductible stock-based compensation
|
3.5
|
%
|
385.7
|
%
|
21.5
|
%
|
||
|
Acquisition-related contingent consideration
|
(0.2
|
)%
|
(185.7
|
)%
|
(16.5
|
)%
|
||
|
Other
|
0.1
|
%
|
(14.3
|
)%
|
(1.5
|
)%
|
||
|
Effective tax expense (benefit) rate
|
5.4
|
%
|
(14.3
|
)%
|
29.5
|
%
|
||
During the fiscal year 2014, we made a one-time repatriation of
$700 million
from certain of our wholly-owned subsidiaries. This repatriation did not have a material impact on our effective tax rate for fiscal year 2014 due to the deferred tax valuation allowance.
Undistributed earnings of our foreign subsidiaries amounted to approximately
$752 million
as of
March 31, 2015
. Those earnings are considered to be indefinitely reinvested and, accordingly, no U.S. income taxes have been provided thereon. Upon distribution of those earnings in the form of dividends or otherwise, we would be subject to both U.S. income taxes (subject to an adjustment for foreign tax credits) and withholding taxes payable to various foreign countries. It is not practicable to determine the income tax liability that might be incurred if these earnings were to be distributed.
71
The components of net deferred tax assets, as of
March 31, 2015 and 2014
consisted of (in millions):
|
|
As of March 31,
|
||||||
|
|
2015
|
2014
|
|||||
|
Deferred tax assets:
|
|||||||
|
Accruals, reserves and other expenses
|
$
|
193
|
|
$
|
163
|
|
|
|
Tax credit carryforwards
|
358
|
|
462
|
|
|||
|
Stock-based compensation
|
35
|
|
43
|
|
|||
|
Net operating loss & capital loss carryforwards
|
53
|
|
199
|
|
|||
|
Total
|
639
|
|
867
|
|
|||
|
Valuation allowance
|
(555
|
)
|
(675
|
)
|
|||
|
Deferred tax assets, net of valuation allowance
|
84
|
|
192
|
|
|||
|
Deferred tax liabilities:
|
|||||||
|
Depreciation
|
(9
|
)
|
(12
|
)
|
|||
|
State effect on federal taxes
|
(62
|
)
|
(63
|
)
|
|||
|
Amortization
|
(23
|
)
|
(28
|
)
|
|||
|
Prepaids and other liabilities
|
(8
|
)
|
(9
|
)
|
|||
|
Total
|
(102
|
)
|
(112
|
)
|
|||
|
Deferred tax assets, net of valuation allowance and deferred tax liabilities
|
$
|
(18
|
)
|
$
|
80
|
|
|
On April 1, 2014, we adopted ASU 2013-11,
Presentation of an Unrecognized Tax Benefit When a Net Operating Loss Carryforward, a Similar Tax Loss, or a Tax Credit Carryforward Exists.
Under the new accounting standard, an unrecognized tax benefit is required to be presented as a reduction to a deferred tax asset if the disallowance of the uncertain tax position would reduce an available tax loss or tax credit carryforward instead of resulting in a cash tax liability. The ASU applies prospectively to all unrecognized tax benefits that exist as of the adoption date. Prior to adoption, the deferred tax assets were presented without reduction for uncertain tax positions.
The valuation allowance decreased by
$120 million
in
fiscal year 2015
, primarily due to the current fiscal year utilization of U.S. deferred tax assets. We have not yet been able to establish a sustained level of profitability in the U.S. or other sufficient significant positive evidence to conclude that our U.S. deferred tax assets are more likely than not to be realized. Therefore, we continue to maintain a valuation allowance against most of our U.S. deferred tax assets. It is possible that a significant portion of the valuation allowance recorded against our U.S. deferred tax assets at March 31, 2015 could be reversed by the end of fiscal year 2016.
As of
March 31, 2015
, we have state net operating loss carry forwards of approximately
$785 million
of which approximately
$114 million
is attributable to various acquired companies. These carry forwards, if not fully realized, will begin to expire in
2016
. We also have U.S. federal, California and Canada tax credit carry forwards of
$320 million
,
$131 million
and
$7 million
, respectively. The U.S. federal tax credit carry forwards will begin to expire in
2024
. The California and Canada tax credit carry forwards can be carried forward indefinitely.
72
The total unrecognized tax benefits as of
March 31, 2015 and 2014
were
$254 million
and
$232 million
, respectively. A reconciliation of the beginning and ending balance of unrecognized tax benefits is summarized as follows (in millions):
|
Balance as of March 31, 2013
|
$
|
297
|
|
|
Increases in unrecognized tax benefits related to prior year tax positions
|
10
|
|
|
|
Decreases in unrecognized tax benefits related to prior year tax positions
|
(79
|
)
|
|
|
Increases in unrecognized tax benefits related to current year tax positions
|
44
|
|
|
|
Decreases in unrecognized tax benefits related to settlements with taxing authorities
|
(29
|
)
|
|
|
Reductions in unrecognized tax benefits due to lapse of applicable statute of limitations
|
(9
|
)
|
|
|
Changes in unrecognized tax benefits due to foreign currency translation
|
(2
|
)
|
|
|
Balance as of March 31, 2014
|
232
|
|
|
|
Increases in unrecognized tax benefits related to prior year tax positions
|
9
|
|
|
|
Decreases in unrecognized tax benefits related to prior year tax positions
|
(14
|
)
|
|
|
Increases in unrecognized tax benefits related to current year tax positions
|
50
|
|
|
|
Decreases in unrecognized tax benefits related to settlements with taxing authorities
|
(6
|
)
|
|
|
Reductions in unrecognized tax benefits due to lapse of applicable statute of limitations
|
(7
|
)
|
|
|
Changes in unrecognized tax benefits due to foreign currency translation
|
(10
|
)
|
|
|
Balance as of March 31, 2015
|
$
|
254
|
|
A portion of our unrecognized tax benefits will affect our effective tax rate if they are recognized upon favorable resolution of the uncertain tax positions. As of
March 31, 2015
, approximately
$58 million
of the unrecognized tax benefits would affect our effective tax rate and approximately
$195 million
would result in adjustments to deferred tax valuation allowance. As of
March 31, 2014
, approximately
$84 million
of the unrecognized tax benefits would affect our effective tax rate and approximately
$148 million
would result in corresponding adjustments to the deferred tax valuation allowance.
Interest and penalties related to estimated obligations for tax positions taken in our tax returns are recognized in income tax expense in our Consolidated Statements of Operations. The combined amount of accrued interest and penalties related to tax positions taken on our tax returns and included in non-current other liabilities was approximately
$16 million
as of
March 31, 2015 and 2014
. There is no material change in accrued interest and penalties during
fiscal year 2015
.
We file income tax returns in the United States, including various state and local jurisdictions. Our subsidiaries file tax returns in various foreign jurisdictions, including Canada, France, Germany, Switzerland and the United Kingdom. The IRS is currently examining our returns for fiscal years 2009 through 2011, and we remain subject to income tax examination by the IRS for fiscal years after 2011.
We are also currently under income tax examination in the United Kingdom for fiscal years 2010 through 2013, and in Germany for fiscal years 2008 through 2012. We remain subject to income tax examination for several other jurisdictions including in France for fiscal years after 2011, in Germany for fiscal years after 2012, in the United Kingdom for fiscal years after 2013, and in Canada and Switzerland for fiscal years after 2007.
The timing of the resolution of income tax examinations is highly uncertain, and the amounts ultimately paid, if any, upon resolution of the issues raised by the taxing authorities may differ materially from the amounts accrued for each year. Although potential resolution of uncertain tax positions involve multiple tax periods and jurisdictions, it is reasonably possible that a reduction of up to
$11 million
of unrecognized tax benefits may occur within the next 12 months, some of which, depending on the nature of the settlement or expiration of statutes of limitations, may affect the Company’s income tax provision and therefore benefit the resulting effective tax rate. The actual amount could vary significantly depending on the ultimate timing and nature of any settlements.
73
(12) FINANCING ARRANGEMENT
0.75% Convertible Senior Notes Due 2016
In
July 2011
, we issued
$632.5 million
aggregate principal amount of
0.75%
Convertible Senior Notes due
2016
(the “Notes”). The Notes are senior unsecured obligations which pay interest
semiannually
in arrears at a rate of
0.75%
per annum on
January 15
and
July 15
of each year, beginning on
January 15, 2012
and will mature on
July 15, 2016
, unless purchased earlier or converted in accordance with their terms prior to such date. The Notes are senior in right of payment to any unsecured indebtedness that is expressly subordinated in right of payment to the Notes.
The Notes are convertible into cash and shares of our common stock based on an initial conversion value of
31.5075
shares of our common stock per
$1,000
principal amount of Notes (equivalent to an initial conversion price of approximately
$31.74
per share). Upon conversion of the Notes, holders will receive cash up to the principal amount of each Note, and any excess conversion value will be delivered in shares of our common stock. Prior to
April 15, 2016
, the Notes are convertible only if (1) the last reported sale price of the common stock for at least
20
trading days (whether or not consecutive) during the period of
30
consecutive trading days ending on the last trading day of the immediately preceding fiscal quarter is greater than or equal to
130 percent
of the conversion price (
$41.26
per share) on each applicable trading day (the “Sales Price Condition”); (2) during the
five
business day period after any
ten
consecutive trading day period in which the trading price per
$1,000
principal amount of notes falls below
98 percent
of the last reported sale price of our common stock multiplied by the conversion rate on each trading day; or (3) specified corporate transactions, including a change in control, occur. On or after
April 15, 2016
, a holder may convert any of its Notes at any time prior to the close of business on the second scheduled trading day immediately preceding the maturity date. The conversion rate is subject to customary anti-dilution adjustments (for example, certain dividend distributions or tender or exchange offer of our common stock), but will not be adjusted for any accrued and unpaid interest. The Notes are not redeemable prior to maturity except for specified corporate transactions and events of default, and no sinking fund is provided for the Notes. The Notes do not contain any financial covenants.
Following certain corporate events described in the indenture governing the notes (the “Indenture”) that occur prior to the maturity date, the conversion rate will be increased for a holder who elects to convert its Notes in connection with such corporate event in certain circumstances. If we undergo a “fundamental change,” as defined in the Indenture, subject to certain conditions, holders may require us to purchase for cash all or any portion of their Notes. The fundamental change purchase price will be
100 percent
of the principal amount of the Notes to be purchased plus any accrued and unpaid interest up to but excluding the fundamental change purchase date.
The Indenture contains customary terms and covenants, including that upon certain events of default occurring and continuing, either the trustee or the holders of at least
25 percent
in principal amount of the outstanding Notes may declare
100 percent
of the principal and accrued and unpaid interest on all the Notes to be due and payable.
We separately account for the liability and equity components of the Notes. The initial carrying amount of the equity component representing the conversion option is equal to the fair value of the Convertible Note Hedge, as described below, which is a substantially identical instrument and was purchased on the same day as the Notes. The initial carrying amount of the liability component was determined by deducting the fair value of the equity component from the par value of the Notes as a whole, and represents the fair value of a similar liability that does not have an associated convertible feature. A liability of
$525 million
as of the initial date of issuance was recognized for the principal amount of the Notes representing the present value of the Notes’ cash flows using a discount rate of
4.54 percent
. The excess of the principal amount of the liability component over its carrying amount is amortized to interest expense over the term of the Notes using the effective interest method. The equity component on the date of issuance was
$107 million
.
In accounting for
$15 million
of issuance costs paid in July 2011 related to the Notes issuance, we allocated
$13 million
to the liability component and
$2 million
to the equity component. Debt issuance costs attributable to the liability component are being amortized to interest expense over the term of the Notes, and issuance costs attributable to the equity component were netted with the equity component in additional paid-in capital.
During the fiscal quarter ended
March 31, 2015
, the Sales Price Condition was met. As a result, the Notes are convertible at the option of the holder through July 4, 2015, and the carrying value of the Notes was reclassified as a current liability and the excess of the principal amount over the carrying value of the Notes was reclassified from permanent equity to temporary equity in the Consolidated Balance Sheets as of
March 31, 2015
. The determination of whether or not the Notes are convertible is performed on a quarterly basis. If this threshold is not met next quarter, the Notes will be reclassified back to long-term debt and the temporary equity will be reclassified back to permanent equity.
74
Upon conversion of any Notes, we will deliver cash up to the principal amount of the Notes and any excess conversion value will be delivered in shares of our common stock. As of
March 31, 2015
, there were no shares issued related to the Notes. Subsequent to
March 31, 2015
, shares issued upon conversion of the Notes were minimal. Based on the closing price of our common stock of
$58.24
at the end of the quarter ended
March 31, 2015
, the if-converted value of our Notes exceeded their principal amount by
$528 million
.
The carrying and fair values of the Notes are as follows (in millions):
|
|
As of
March 31, 2015 |
As of
March 31, 2014 |
|||||
|
Principal amount of Notes
|
633
|
|
633
|
|
|||
|
Unamortized debt discount of the liability component
|
(31
|
)
|
(53
|
)
|
|||
|
Net carrying value of Notes
|
602
|
|
580
|
|
|||
|
Fair value of Notes
|
$
|
1,158
|
|
$
|
731
|
|
|
The fair value of the Notes is classified as Level 2 within the fair value hierarchy. As of
March 31, 2015
, the remaining life of the Notes is approximately
1.3 years
.
Convertible Note Hedge and Warrants Issuance
In July 2011, we entered into privately negotiated convertible note hedge transactions (the “Convertible Note Hedge”) with certain counterparties to reduce the potential dilution with respect to our common stock upon conversion of the Notes. We paid
$107 million
for the Convertible Note Hedge, which was recorded as an equity transaction. The Convertible Note Hedge, subject to customary anti-dilution adjustments, provides us with the option to acquire, on a net settlement basis, approximately
19.9 million
shares of our common stock equal to the number of shares of our common stock that notionally underlie the Notes at a strike price of
$31.74
, which corresponds to the conversion price of the Notes. As of
March 31, 2015
, we have not acquired any shares under the Convertible Note Hedge. Subsequent to March 31, 2015, we received a minimal number of shares related to the Convertible Note Hedge.
Separately, in July 2011 we also entered into privately negotiated warrant transactions with certain counterparties whereby we sold to independent third parties warrants (the “Warrants”) to acquire, subject to customary anti-dilution adjustments that are substantially the same as the anti-dilution provisions contained in the Notes, up to
19.9 million
shares of our common stock (which is also equal to the number of shares of our common stock that notionally underlie the Notes), with a strike price of
$41.14
. The Warrants could have a dilutive effect with respect to our common stock to the extent that the market price per share of our common stock exceeds
$41.14
on or prior to the expiration date of the Warrants. We received proceeds of
$65 million
from the sale of the Warrants.
Effect of conversion on earning per share (“EPS”)
The Notes have no impact on diluted EPS for periods where the average quarterly price of our common stock is below the conversion price of
$31.74
per share. Prior to conversion, we will include the effect of the additional shares that may be issued if our common stock price exceeds
$31.74
per share using the treasury stock method. If the average price of our common stock exceeds
$41.14
per share for a quarterly period, we will also include the effect of the additional potential shares that may be issued related to the Warrants using the treasury stock method. Prior to conversion, the Convertible Note Hedge is not considered for purposes of the EPS calculation, as its effect would be anti-dilutive. Upon conversion, the Convertible Note Hedge is expected to offset the dilutive effect of the Notes when the stock price is above
$31.74
per share. See Note 17 for additional information related to our EPS.
Credit Facility
On
March 19, 2015
, we entered into a
$500 million
senior unsecured revolving credit facility (“Credit Facility”) with a syndicate of banks. The credit facility terminates on
March 19, 2020
and replaces the Company’s existing
$500 million
unsecured credit facility (the “Prior Credit Facility”), which was due to expire on
February 29, 2016
. No amounts were ever drawn under the Prior Credit Facility. The Credit Facility contains an option to arrange with existing lenders and/or new lenders for them to provide up to an aggregate of
$250 million
in additional commitments for revolving loans. Proceeds of loans made under the credit facility may be used for general corporate purposes.
75
The loans bear interest, at our option, at the base rate plus an applicable spread or an adjusted LIBOR rate plus an applicable spread, in each case with such spread being determined based on our consolidated leverage ratio for the preceding fiscal quarter. We are also obligated to pay other customary fees for a credit facility of this size and type. Interest is due and payable in arrears quarterly for loans bearing interest at the base rate and at the end of an interest period (or at each three month interval in the case of loans with interest periods greater than three months) in the case of loans bearing interest at the adjusted LIBOR rate. Principal, together with all accrued and unpaid interest, is due and payable on
March 19, 2020
.
The credit agreement contains customary affirmative and negative covenants, including covenants that limit or restrict our ability to, among other things, incur subsidiary indebtedness, grant liens, dispose of all or substantially all assets and pay dividends or make distributions, in each case subject to customary exceptions for a credit facility of this size and type. We are also required to maintain compliance with a capitalization ratio and maintain a minimum level of total liquidity.
The credit agreement contains customary events of default, including among others, non-payment defaults, covenant defaults, cross-defaults to material indebtedness, bankruptcy and insolvency defaults, material judgment of defaults and a change of control default, in each case, subject to customary exceptions for a credit facility of this size and type. The occurrence of an event of default could result in the acceleration of the obligations under the credit facility, an obligation by any guarantors to repay the obligations in full and an increase in the applicable interest rate.
As of March 31, 2015
, no amounts were outstanding under the Credit Facility.
$2 million
of debt issuance costs that were paid in connection with obtaining this credit facility are being amortized to interest expense over the
5
year term of the Credit Facility.
The following table summarizes our interest expense recognized for
fiscal years 2015, 2014, and 2013
that is included in interest and other income (expense), net on our Consolidated Statements of Operations (in millions):
|
Year Ended March 31,
|
|||||||||||
|
2015
|
2014
|
2013
|
|||||||||
|
Amortization of debt discount
|
$
|
(22
|
)
|
$
|
(21
|
)
|
$
|
(20
|
)
|
||
|
Amortization of debt issuance costs
|
(3
|
)
|
(3
|
)
|
(3
|
)
|
|||||
|
Coupon interest expense
|
(5
|
)
|
(5
|
)
|
(5
|
)
|
|||||
|
Other interest expense
|
(1
|
)
|
(1
|
)
|
(1
|
)
|
|||||
|
Total interest expense
|
$
|
(31
|
)
|
$
|
(30
|
)
|
$
|
(29
|
)
|
||
(13) COMMITMENTS AND CONTINGENCIES
Lease Commitments
As of
March 31, 2015
, we leased certain facilities, furniture and equipment under non-cancelable operating lease agreements. We were required to pay property taxes, insurance and normal maintenance costs for certain of these facilities and any increases over the base year of these expenses on the remainder of our facilities.
Development, Celebrity, League and Content Licenses: Payments and Commitments
The products we produce in our studios are designed and created by our employee designers, artists, software programmers and by non-employee software developers (“independent artists” or “third-party developers”). We typically advance development funds to the independent artists and third-party developers during development of our games, usually in installment payments made upon the completion of specified development milestones. Contractually, these payments are generally considered advances against subsequent royalties on the sales of the products. These terms are set forth in written agreements entered into with the independent artists and third-party developers.
In addition, we have certain celebrity, league and content license contracts that contain minimum guarantee payments and marketing commitments that may not be dependent on any deliverables. Celebrities and organizations with whom we have contracts include, but are not limited to: FIFA (Fédération Internationale de Football Association), FIFPRO Foundation, FAPL (Football Association Premier League Limited), and DFL Deutsche Fußball Liga GmbH (German Soccer League) (professional soccer); Dr. Ing. h.c. F. Porsche AG, Ferrari S.p.A. (Need For Speed and Real Racing games); National Basketball Association (professional basketball); PGA TOUR (professional golf); National Hockey League and NHL Players’ Association (professional hockey); National Football League Properties, PLAYERS Inc., and Red Bear Inc. (professional football); Zuffa, LLC (Ultimate Fighting Championship); ESPN (content in EA SPORTS games); Hasbro, Inc. (certain of Hasbro’s board game intellectual properties); Disney Interactive (Star Wars); Fox Digital Entertainment, Inc. (The Simpsons); and Universal Studios
76
Inc. (Minions). These developer and content license commitments represent the sum of (1) the cash payments due under non-royalty-bearing licenses and services agreements and (2) the minimum guaranteed payments and advances against royalties due under royalty-bearing licenses and services agreements, the majority of which are conditional upon performance by the counterparty. These minimum guarantee payments and any related marketing commitments are included in the table below.
The following table summarizes our minimum contractual obligations as of
March 31, 2015
(in millions):
|
Fiscal Year Ending March 31,
|
|||||||||||||||||||||||||||
|
Total
|
2016
|
2017
|
2018
|
2019
|
2020
|
Thereafter
|
|||||||||||||||||||||
|
Unrecognized commitments
|
|||||||||||||||||||||||||||
|
Developer/licensor commitments
|
$
|
1,584
|
|
$
|
192
|
|
$
|
256
|
|
$
|
271
|
|
$
|
231
|
|
$
|
209
|
|
$
|
425
|
|
||||||
|
Marketing commitments
|
347
|
|
41
|
|
64
|
|
49
|
|
48
|
|
48
|
|
97
|
|
|||||||||||||
|
Operating leases
|
181
|
|
41
|
|
32
|
|
23
|
|
19
|
|
17
|
|
49
|
|
|||||||||||||
|
0.75% Convertible Senior Notes due 2016 interest
(a)
|
7
|
|
5
|
|
2
|
|
—
|
|
—
|
|
—
|
|
—
|
|
|||||||||||||
|
Other purchase obligations
|
46
|
|
27
|
|
12
|
|
3
|
|
2
|
|
2
|
|
—
|
|
|||||||||||||
|
Total unrecognized commitments
|
2,165
|
|
306
|
|
366
|
|
346
|
|
300
|
|
276
|
|
571
|
|
|||||||||||||
|
Recognized commitments
|
|||||||||||||||||||||||||||
|
0.75% Convertible Senior Notes due 2016 principal
(a)
|
633
|
|
633
|
|
—
|
|
—
|
|
—
|
|
—
|
|
—
|
|
|||||||||||||
|
Licensing and lease obligations
(b)
|
162
|
|
15
|
|
22
|
|
23
|
|
24
|
|
25
|
|
53
|
|
|||||||||||||
|
Total recognized commitments
|
795
|
|
648
|
|
22
|
|
23
|
|
24
|
|
25
|
|
53
|
|
|||||||||||||
|
Total Commitments
|
$
|
2,960
|
|
$
|
954
|
|
$
|
388
|
|
$
|
369
|
|
$
|
324
|
|
$
|
301
|
|
$
|
624
|
|
||||||
|
(a)
|
Included in the
$7 million
coupon interest on the Notes is
$1 million
of accrued interest recognized as of
March 31, 2015
. We will be obligated to pay the
$632.5 million
principal amount of the Notes in cash and any excess conversion value in shares of our common stock upon redemption of the Notes at maturity on
July 15, 2016
, or upon earlier conversion. During the fiscal quarter ended
March 31, 2015
, the Sales Price Condition was met and as a result, the Notes are currently convertible at the option of the holder though July 4, 2015. See Note 12 for additional information regarding our Notes.
|
|
(b)
|
See Note 8 for additional information regarding recognized commitments resulting from our restructuring plans. Lease commitments have not been reduced for approximately
$3 million
due in the future from third parties under non-cancelable sub-leases. See Note 9 for additional information regarding recognized obligations from our licensing-related commitments.
|
The unrecognized amounts represented in the table above reflect our minimum cash obligations for the respective fiscal years, but do not necessarily represent the periods in which they will be recognized and expensed in our Consolidated Financial Statements. In addition, the amounts in the table above are presented based on the dates the amounts are contractually due as of
March 31, 2015
; however, certain payment obligations may be accelerated depending on the performance of our operating results. Up to $32 million of the unrecognized amounts in the table above may be payable, at the licensor’s election, in shares of our common stock, subject to a $10 million maximum during any fiscal year. The number of shares to be issued will be based on fair market value at the time of issuance.
In addition to what is included in the table above, as of
March 31, 2015
, we had a liability for unrecognized tax benefits and an accrual for the payment of related interest totaling
$68 million
, of which we are unable to make a reasonably reliable estimate of when cash settlement with a taxing authority will occur.
Total rent expense for our operating leases was
$97 million
,
$97 million
and
$94 million
for the fiscal years ended March 31, 2015, 2014 and 2013, respectively.
77
Legal Proceedings
We are a defendant in several actions that allege we misappropriated the likenesses of various college athletes in certain of our college-themed sports games. In September 2013, we reached an agreement to settle all actions brought by college athletes against us. We recognized a
$30 million
accrual during the three months ended September 30, 2013 associated with the anticipated settlement. On September 3, 2014, the United States District Court for the Northern District of California granted preliminary approval of the settlement and set a hearing in July 2015, to determine whether to grant its final approval of the settlement.
On July 29, 2010, Michael Davis, a former NFL running back, filed a putative class action in the United States District Court for the Northern District of California against the Company, alleging that certain past versions of
Madden NFL
included the images of certain retired NFL players without their permission. In March 2012, the trial court denied the Company’s request to dismiss the complaint on First Amendment grounds. In January 2015, that trial court decision was affirmed by the Ninth Circuit Court of Appeals and the case was remanded back to the district court. The Company intends to seek further court review.
On December 17, 2013, a purported shareholder class action lawsuit was filed in the United States District Court for the Northern District of California against the Company and certain of its officers by an individual purporting to represent a class of purchasers of EA common stock. A second purported shareholder class action lawsuit alleging substantially similar claims was subsequently filed in the same court. These lawsuits have been consolidated into one action. The lawsuits, which assert claims under Section 10(b) and 20(a) of the Securities Exchange Act of 1934, allege, among other things, that the Company and certain of its officers issued materially false and misleading statements regarding the rollout of the Company’s
Battlefield 4
game. We filed a motion seeking dismissal of all claims on January 15, 2015 and on April 30, 2015, the court granted our motion to dismiss with prejudice.
We are also subject to claims and litigation arising in the ordinary course of business. We do not believe that any liability from any reasonably foreseeable disposition of such claims and litigation, individually or in the aggregate, would have a material adverse effect on our Consolidated Financial Statements.
(14) PREFERRED STOCK
As of
March 31, 2015 and 2014
, we had
10,000,000
shares of preferred stock authorized but unissued. The rights, preferences, and restrictions of the preferred stock may be designated by our Board of Directors without further action by our stockholders.
(15) STOCK-BASED COMPENSATION AND EMPLOYEE BENEFIT PLANS
Valuation Assumptions
We estimate the fair value of stock-based payment awards on the date of grant. We recognize compensation costs for stock-based payment awards to employees based on the grant-date fair value using a straight-line approach over the service period for which such awards are expected to vest. For awards with only service conditions that have a graded vesting schedule, we recognize compensation costs on a straight-line basis over the requisite service period for the entire award.
The determination of the fair value of market-based restricted stock units, stock options and ESPP is affected by assumptions regarding subjective and complex variables. Generally, our assumptions are based on historical information and judgment is required to determine if historical trends may be indicators of future outcomes. We determine the fair value of our stock-based payment awards as follows:
|
•
|
Restricted Stock Units, Restricted Stock, and Performance-Based Restricted Stock Units
. The fair value of restricted stock units, restricted stock, and performance-based restricted stock units (other than market-based restricted stock units) is determined based on the quoted market price of our common stock on the date of grant. Performance-based restricted stock units include grants made in connection with certain acquisitions.
|
|
•
|
Market-Based Restricted Stock Units
. Market-based restricted stock units consist of grants of performance-based restricted stock units to certain members of executive management that vest contingent upon the achievement of pre-determined market and service conditions (referred to herein as “market-based restricted stock units”). The fair value of our market-based restricted stock units is determined using a Monte-Carlo simulation model. Key assumptions for the Monte-Carlo simulation model are the risk-free interest rate, expected volatility, expected dividends and correlation coefficient.
|
78
|
•
|
Stock Options and Employee Stock Purchase Plan
. The fair value of stock options and stock purchase rights granted pursuant to our equity incentive plans and our 2000 Employee Stock Purchase Plan (“ESPP”), respectively, is determined using the Black-Scholes valuation model based on the multiple-award valuation method. Key assumptions of the Black-Scholes valuation model are the risk-free interest rate, expected volatility, expected term and expected dividends. The risk-free interest rate is based on U.S. Treasury yields in effect at the time of grant for the expected term of the option. Expected volatility is based on a combination of historical stock price volatility and implied volatility of publicly-traded options on our common stock. Expected term is determined based on historical exercise behavior, post-vesting termination patterns, options outstanding and future expected exercise behavior.
|
The estimated assumptions used in the Black-Scholes valuation model to value our stock option grants and ESPP were as follows:
|
|
Stock Option Grants
|
ESPP
|
||||||||||||||||
|
|
Year Ended March 31,
|
Year Ended March 31,
|
||||||||||||||||
|
|
2015
|
2014
|
2013
|
2015
|
2014
|
2013
|
||||||||||||
|
Risk-free interest rate
|
1.1 - 1.9%
|
|
1.6
|
%
|
0.4 - 1.0%
|
|
.04 - 0.2%
|
|
0.1
|
%
|
0.1 - 0.2%
|
|
||||||
|
Expected volatility
|
36 - 40%
|
|
37 - 42%
|
|
40 - 46%
|
|
30 - 35%
|
|
36 - 38%
|
|
35 - 42%
|
|
||||||
|
Weighted-average volatility
|
38
|
%
|
37
|
%
|
43
|
%
|
34
|
%
|
38
|
%
|
38
|
%
|
||||||
|
Expected term
|
4.5 years
|
|
4.5 years
|
|
4.4 years
|
|
6 - 12 months
|
|
6 - 12 months
|
|
6 - 12 months
|
|
||||||
|
Expected dividends
|
None
|
|
None
|
|
None
|
|
None
|
|
None
|
|
None
|
|
||||||
The estimated assumptions used in the Monte-Carlo simulation model to value our market-based restricted stock units were as follows:
|
|
Year Ended
March 31, 2015 |
Year Ended
March 31, 2014 |
Year Ended
March 31, 2013 |
|||||
|
Risk-free interest rate
|
0.9
|
%
|
0.4
|
%
|
0.2 -0.4%
|
|
||
|
Expected volatility
|
16 - 79%
|
|
16 - 58%
|
|
17 - 116%
|
|
||
|
Weighted-average volatility
|
30
|
%
|
31
|
%
|
35
|
%
|
||
|
Expected dividends
|
None
|
|
None
|
|
None
|
|
||
Stock-Based Compensation Expense
Employee stock-based compensation expense recognized during the fiscal years ended
March 31, 2015, 2014 and 2013
was calculated based on awards ultimately expected to vest and has been reduced for estimated forfeitures. In subsequent periods, if actual forfeitures differ from those estimates, an adjustment to stock-based compensation expense will be recognized at that time.
The following table summarizes stock-based compensation expense resulting from stock options, restricted stock, restricted stock units, performance-based restricted stock units, market-based restricted stock units, and the ESPP included in our Consolidated Statements of Operations (in millions):
|
|
Year Ended March 31,
|
|||||||||||
|
|
2015
|
2014
|
2013
|
|||||||||
|
Cost of revenue
|
$
|
2
|
|
$
|
2
|
|
$
|
2
|
|
|||
|
Research and development
|
82
|
|
90
|
|
94
|
|
||||||
|
Marketing and sales
|
21
|
|
26
|
|
30
|
|
||||||
|
General and administrative
|
39
|
|
32
|
|
38
|
|
||||||
|
Stock-based compensation expense
|
$
|
144
|
|
$
|
150
|
|
$
|
164
|
|
|||
During the fiscal years ended
March 31, 2015, 2014 and 2013
, we did not recognize any benefit from income taxes related to our stock-based compensation expense.
As of
March 31, 2015
, our total unrecognized compensation cost related to stock options was
$16 million
and is expected to be recognized over a weighted-average service period of
2.2 years
. As of
March 31, 2015
, our total unrecognized compensation cost related to restricted stock and restricted stock units (collectively referred to as “restricted stock rights”) was
$222 million
and is expected to be recognized over a weighted-average service period of
1.3 years
. Of the
$222 million
of unrecognized compensation cost,
$12 million
relates to market-based restricted stock units.
79
For fiscal years ended
March 31, 2015 and 2014
, we recognized
$22 million
and
$13 million
, respectively, of excess tax benefit from stock-based compensation deductions; this amount is reported in the financing activities on our Consolidated Statement of Cash Flows. For the
fiscal year ended March 31, 2013
, we recognized
$1 million
of tax expense from stock-based compensation, net of
$1 million
of deferred tax write-offs. There was no excess tax benefit related to stock-based compensation deductions reported in the financing activities on our Consolidated Statements of Cash Flows during the fiscal year ended
March 31, 2013
.
Summary of Plans and Plan Activity
Equity Incentive Plans
Our 2000 Equity Incentive Plan (the “Equity Plan”) allows us to grant options to purchase our common stock and to grant restricted stock, restricted stock units and stock appreciation rights to our employees, officers and directors. Pursuant to the Equity Plan, incentive stock options may be granted to employees and officers and non-qualified options may be granted to employees, officers and directors, at not less than
100 percent
of the fair market value on the date of grant.
A total of
19.2 million
options or
13.4 million
restricted stock units were available for grant under our Equity Plan as of
March 31, 2015
.
Stock Options
Options granted under the Equity Plan generally expire
ten
years from the date of grant and generally vest according to one of the following schedules:
|
•
|
35 month vesting with
1
/
3
cliff vesting after 11, 23 and 35 months or;
|
|
•
|
50 month vesting with 24% of the shares cliff vesting after 12 months and the ratably over the following 38 months.
|
The following table summarizes our stock option activity for the fiscal year ended
March 31, 2015
:
|
Options
(in thousands)
|
Weighted-
Average
Exercise Prices
|
Weighted-
Average
Remaining
Contractual
Term (in years)
|
Aggregate
Intrinsic Value
(in millions)
|
||||||||||
|
Outstanding as of March 31, 2014
|
5,311
|
|
$
|
37.43
|
|
||||||||
|
Granted
|
1,248
|
|
35.79
|
|
|||||||||
|
Exercised
|
(1,021
|
)
|
23.76
|
|
|||||||||
|
Forfeited, cancelled or expired
|
(618
|
)
|
56.66
|
|
|||||||||
|
Outstanding as of March 31, 2015
|
4,920
|
|
$
|
37.44
|
|
5.41
|
$
|
102
|
|
||||
|
Vested and expected to vest
|
4,612
|
|
$
|
37.82
|
|
5.17
|
$
|
94
|
|
||||
|
Exercisable as of March 31, 2015
|
3,006
|
|
$
|
40.90
|
|
3.14
|
$
|
52
|
|
||||
The aggregate intrinsic value represents the total pre-tax intrinsic value based on our closing stock price as of
March 31, 2015
, which would have been received by the option holders had all the option holders exercised their options as of that date. The weighted-average grant date fair values of stock options granted during
fiscal years 2015, 2014, and 2013
were
$12.01
,
$8.61
and
$4.64
, respectively. The total intrinsic values of stock options exercised during fiscal years 2015 and 2014 were
$22 million
and
$16 million
, respectively, and immaterial for fiscal year 2013. We issue new common stock from our authorized shares upon the exercise of stock options.
80
The following table summarizes outstanding and exercisable stock options as of
March 31, 2015
:
|
|
Options Outstanding
|
Options Exercisable
|
||||||||||||||||||||
|
Range of
Exercise Prices
|
Number
of Shares
(in thousands)
|
Weighted-
Average
Remaining
Contractual
Term (in years)
|
Weighted-
Average
Exercise
Prices
|
Potential
Dilution
|
Number
of Shares
(in thousands)
|
Weighted-
Average
Exercise
Prices
|
Potential
Dilution
|
|||||||||||||||
|
$11.53 - $23.83
|
752
|
|
4.49
|
$
|
19.17
|
|
0.2
|
%
|
713
|
|
$
|
19.32
|
|
0.2
|
%
|
|||||||
|
26.25 - 26.25
|
1,000
|
|
8.59
|
26.25
|
|
0.3
|
%
|
320
|
|
26.25
|
|
0.1
|
%
|
|||||||||
|
27.49 - 35.70
|
998
|
|
9.18
|
35.43
|
|
0.3
|
%
|
9
|
|
27.49
|
|
—
|
%
|
|||||||||
|
36.00 - 49.90
|
1,242
|
|
3.31
|
47.18
|
|
0.4
|
%
|
1,036
|
|
49.19
|
|
0.3
|
%
|
|||||||||
|
49.96 - 60.59
|
928
|
|
1.48
|
53.41
|
|
0.3
|
%
|
928
|
|
53.41
|
|
0.3
|
%
|
|||||||||
|
$11.53 - $60.59
|
4,920
|
|
5.41
|
$
|
37.44
|
|
1.5
|
%
|
3,006
|
|
$
|
40.90
|
|
0.9
|
%
|
|||||||
Potential dilution is computed by dividing the options in the related range of exercise prices by
310 million
shares of common stock, which were issued and outstanding as of
March 31, 2015
.
Restricted Stock Rights
We grant restricted stock rights under our Equity Plan to employees worldwide. Restricted stock units entitle holders to receive shares of common stock at the end of a specified period of time. Upon vesting, the equivalent number of common shares is typically issued net of required tax withholdings, if any. Restricted stock is issued and outstanding upon grant; however, restricted stock award holders are restricted from selling the shares until they vest. Upon granting or vesting of restricted stock, as the case may be, we will typically withhold shares to satisfy tax withholding requirements. Restricted stock rights are subject to forfeiture and transfer restrictions. Vesting for restricted stock rights is based on the holders’ continued employment with us. If the vesting conditions are not met, unvested restricted stock rights will be forfeited.
Generally, our restricted stock rights vest according to one of the following vesting schedules:
|
•
|
One-year vesting with 100% cliff vesting at the end of one year;
|
|
•
|
35 month vesting with
1
/
3
cliff vesting after 11, 23 and 35 months;
|
|
•
|
Three-year vesting with
1
/
3
cliff vesting at the end of each year;
|
|
•
|
Three-year vesting with 100% cliff vesting at the end of year three;
|
|
•
|
Three-year vesting with
1
/
2
cliff vesting after 18 and 36 months;
|
|
•
|
Three-year vesting with
2
/
3
and
1
/
3
vesting cliff vesting after 24 and 36 months;
|
|
•
|
Three-year vesting with
1
/
4
,
7
/20,
1
/5
, and
1
/
5
of the shares cliff vesting respectively at the end of each of the first 6 months, 1
st
, 2
nd
, and 3
rd
years;
|
|
•
|
Four-year vesting with
1
/
4
cliff vesting at the end of each year or;
|
|
•
|
Five-year vesting with
1
/
9
,
2
/
9
,
3
/
9
,
2
/
9
and
1
/
9
of the shares cliff vesting respectively at the end of each of the 1
st
, 2
nd
, 3
rd
, 4
th
, and 5
th
years.
|
Each restricted stock right granted reduces the number of shares available for grant by
1.43
shares under our Equity Plan. The following table summarizes our restricted stock rights activity, excluding performance-based restricted stock unit activity which is discussed below, for the fiscal year ended
March 31, 2015
:
|
Restricted
Stock Rights
(in thousands)
|
Weighted-
Average Grant
Date Fair Values
|
||||||
|
Balance as of March 31, 2014
|
13,536
|
|
$
|
19.70
|
|
||
|
Granted
|
4,496
|
|
37.22
|
|
|||
|
Vested
|
(5,727
|
)
|
20.13
|
|
|||
|
Forfeited or cancelled
|
(1,450
|
)
|
23.64
|
|
|||
|
Balance as of March 31, 2015
|
10,855
|
|
$
|
26.20
|
|
||
The grant date fair value of restricted stock rights is based on the quoted market price of our common stock on the date of grant. The weighted-average grant date fair values of restricted stock rights granted during
fiscal years 2015, 2014, and 2013
were
$37.22
,
$23.01
and
$12.85
, respectively. The fair values of restricted stock rights that vested during
fiscal years 2015, 2014, and 2013
were
$209 million
,
$163 million
and
$102 million
, respectively.
81
Performance-Based Restricted Stock Units
Our performance-based restricted stock units vest contingent upon the achievement of pre-determined performance-based milestones. If these performance-based milestones are not met, the performance-based restricted stock units will not vest, in which case, any compensation expense we have recognized to date will be reversed.
The following table summarizes our performance-based restricted stock unit activity for the fiscal year ended
March 31, 2015
:
|
Performance-
Based Restricted
Stock Units
(in thousands)
|
Weighted-
Average Grant
Date Fair Values
|
||||||
|
Balance as of March 31, 2014
|
54
|
|
$
|
15.39
|
|
||
|
Vested
|
(49
|
)
|
15.39
|
|
|||
|
Forfeited or cancelled
|
(5
|
)
|
15.39
|
|
|||
|
Balance as of March 31, 2015
|
—
|
|
$
|
—
|
|
||
The grant date fair value of performance-based restricted stock units is based on the quoted market price of our common stock on the date of grant. There were no performance-based restricted stock units granted during
fiscal years 2015, 2014, and 2013
. The fair values of performance-based restricted stock units that vested during
fiscal years 2015, 2014, and 2013
was immaterial.
Market-Based Restricted Stock Units
Our market-based restricted stock units vest contingent upon the achievement of pre-determined market and service conditions. If these market conditions are not met but service conditions are met, the market-based restricted stock units will not vest; however, any compensation expense we have recognized to date will not be reversed. The number of shares of common stock to be received at vesting will range from
zero percent
to
200 percent
of the target number of market-based restricted stock units based on our total stockholder return (“TSR”) relative to the performance of companies in the NASDAQ-100 Index for each measurement period, generally over a one-year, two-year cumulative and three-year cumulative period. In the table below, we present shares granted at
100 percent
of target of the number of market-based restricted stock units that may potentially vest. The maximum number of common shares that could vest is approximately
0.4 million
for market-based restricted stock units granted during the
fiscal year 2015
.
As of March 31, 2015
, the maximum number of shares that could vest is approximately
1.3 million
for market-based restricted stock units outstanding.
The following table summarizes our market-based restricted stock unit activity for the year ended
March 31, 2015
:
|
Market-Based
Restricted Stock
Units
(in thousands)
|
Weighted-
Average Grant
Date Fair Value
|
||||||
|
Balance as of March 31, 2014
|
978
|
|
$
|
24.83
|
|
||
|
Granted
|
193
|
|
48.14
|
|
|||
|
Vested
|
(671
|
)
|
22.01
|
|
|||
|
Vested above target
|
192
|
|
17.20
|
|
|||
|
Forfeited or cancelled
|
(29
|
)
|
34.77
|
|
|||
|
Balance as of March 31, 2015
|
663
|
|
$
|
31.82
|
|
||
The weighted-average grant date fair values of market-based restricted stock units granted during
fiscal years 2015, 2014, and 2013
were
$48.14
,
$30.18
, and
$12.60
, respectively. The fair values of market-based restricted stock units that vested during
fiscal years 2015, 2014, and 2013
were
$23 million
,
$7 million
, and
$2 million
, respectively.
ESPP
Pursuant to our ESPP, eligible employees may authorize payroll deductions of between
2 percent
and
10 percent
of their compensation to purchase shares at
85 percent
of the lower of the market price of our common stock on the date of commencement of the offering or on the last day of each six-month purchase period.
During
fiscal year 2015
, we issued approximately
1.4 million
shares under the ESPP with exercise prices for purchase rights ranging from
$22.64
to
$32.16
. During
fiscal years 2015, 2014, and 2013
, the estimated weighted-average fair values of purchase rights were
$8.26
,
$4.67
and
$4.83
, respectively. The fair values were estimated on the date of grant using the Black-
82
Scholes valuation model. We issue new common stock out of the ESPP’s pool of authorized shares. As of March 31, 2015,
6.1 million
shares were available for grant under our ESPP.
Deferred Compensation Plan
We have a Deferred Compensation Plan (“DCP”) for the benefit of a select group of management or highly compensated employees and Directors, which is unfunded and intended to be a plan that is not qualified within the meaning of section 401(a) of the Internal Revenue Code. The DCP permits the deferral of the annual base salary and/or Director fees up to a maximum amount. The deferrals are held in a separate trust, which has been established by us to administer the DCP. The trust is a grantor trust and the specific terms of the trust agreement provide that the assets of the trust are available to satisfy the claims of general creditors in the event of our insolvency. The assets held by the trust are classified as trading securities and are held at fair value on our Consolidated Balance Sheets. The assets and liabilities of the DCP are presented in other assets and other liabilities on our Consolidated Balance Sheets, respectively, with changes in the fair value of the assets and in the deferred compensation liability recognized as compensation expense. The estimated fair value of the assets was
$9 million
as of
March 31, 2015 and 2014
. As of
March 31, 2015 and 2014
,
$9 million
was recorded to recognize undistributed deferred compensation due to employees.
401(k) Plan, Registered Retirement Savings Plan and ITP Plan
We have a 401(k) plan covering substantially all of our U.S. employees, a Registered Retirement Savings Plan covering substantially all of our Canadian employees, and an ITP pension plan covering substantially all our Swedish employees. These plans permit us to make discretionary contributions to employees’ accounts based on our financial performance. We contributed an aggregate of
$27 million
,
$16 million
and
$19 million
to these plans in
fiscal years 2015, 2014, and 2013
, respectively.
Stock Repurchase Program
In July 2012, our Board of Directors authorized a program to repurchase up to
$500 million
of our common stock. We repurchased approximately
22 million
shares in the open market under this program, including pursuant to pre-arranged stock trading plans.
In May 2014, a special committee of our Board of Directors, on behalf of the full Board of Directors, authorized a two-year program to repurchase up to
$750 million
of our common stock. This repurchase program superseded and replaced the stock repurchase authorization approved in July 2012. We repurchased approximately
8.3 million
shares under this program during fiscal year 2015.
In May 2015, our Board of Directors authorized a new program to repurchase up to
$1 billion
of our common stock. This new stock repurchase program, which expires on May 31, 2017, supersedes and replaces the stock repurchase authorization approved in May 2014. Under this program, we may purchase stock in the open market or through privately-negotiated transactions in accordance with applicable securities laws, including pursuant to pre-arranged stock trading plans. The timing and actual amount of the stock repurchases will depend on several factors including price, capital availability, regulatory requirements, alternative investment opportunities and other market conditions. We are not obligated to repurchase any specific number of shares under this program and it may be modified, suspended or discontinued at any time. We continue to actively repurchase shares.
The following table summarizes total shares repurchased and retired during
fiscal years 2015 and 2013
:
|
February 2011 Program
|
July 2012 Program
|
May 2014 Program
|
Total
|
||||||||||||||||||||||||
|
(In millions)
|
Shares
|
Amount
|
Shares
|
Amount
|
Shares
|
Amount
|
Shares
|
Amount
|
|||||||||||||||||||
|
Fiscal Year 2013
|
4
|
|
$
|
71
|
|
22
|
|
$
|
278
|
|
—
|
|
—
|
|
26
|
|
$
|
349
|
|
||||||||
|
Fiscal Year 2015
|
—
|
|
—
|
|
—
|
|
—
|
|
8
|
|
$
|
337
|
|
8
|
|
$
|
337
|
|
|||||||||
During
fiscal year 2014
, we did not repurchase any shares of our common stock.
83
(16) INTEREST AND OTHER INCOME (EXPENSE), NET
Interest and other income (expense), net, for the
fiscal years ended March 31, 2015, 2014 and 2013
consisted of (in millions):
|
|
Year Ended March 31,
|
||||||||||
|
|
2015
|
2014
|
2013
|
||||||||
|
Interest expense
|
$
|
(31
|
)
|
$
|
(30
|
)
|
$
|
(29
|
)
|
||
|
Interest income
|
10
|
|
5
|
|
6
|
|
|||||
|
Net gain (loss) on foreign currency transactions
|
(62
|
)
|
4
|
|
2
|
|
|||||
|
Net gain (loss) on foreign currency forward contracts
|
59
|
|
(5
|
)
|
(2
|
)
|
|||||
|
Other income, net
|
1
|
|
—
|
|
2
|
|
|||||
|
Interest and other income (expense), net
|
$
|
(23
|
)
|
$
|
(26
|
)
|
$
|
(21
|
)
|
||
(17) NET INCOME PER SHARE
The following table summarizes the computations of basic earnings per share (“Basic EPS”) and diluted earnings per share (“Diluted EPS”). Basic EPS is computed as net income divided by the weighted-average number of common shares outstanding for the period. Diluted EPS reflects the potential dilution that could occur from common shares issuable through stock-based compensation plans including stock options, restricted stock, restricted stock units, common stock through our ESPP, warrants, and other convertible securities using the treasury stock method.
|
|
Year Ended March 31,
|
||||||||||
|
(In millions, except per share amounts)
|
2015
|
2014
|
2013
|
||||||||
|
Net income
|
$
|
875
|
|
$
|
8
|
|
$
|
98
|
|
||
|
Shares used to compute net income per share:
|
|||||||||||
|
Weighted-average common stock outstanding — basic
|
311
|
|
308
|
|
310
|
|
|||||
|
Dilutive potential common shares related to stock award plans and from assumed exercise of stock options
|
9
|
|
8
|
|
3
|
|
|||||
|
Dilutive potential common shares related to the Notes
|
4
|
|
—
|
|
—
|
|
|||||
|
Dilutive potential common shares related to the Warrants
|
1
|
|
—
|
|
—
|
|
|||||
|
Weighted-average common stock outstanding — diluted
|
325
|
|
316
|
|
313
|
|
|||||
|
Net income per share:
|
|||||||||||
|
Basic
|
$
|
2.81
|
|
$
|
0.03
|
|
$
|
0.32
|
|
||
|
Diluted
|
$
|
2.69
|
|
$
|
0.03
|
|
$
|
0.31
|
|
||
For the
fiscal years ended March 31, 2015, 2014 and 2013
, stock options to purchase, restricted stock units and restricted stock to be released in the amount of
3 million
shares,
4 million
shares and
15 million
shares, respectively, were excluded from the treasury stock method computation of diluted shares as their inclusion would have had an antidilutive effect.
For the
fiscal years ended March 31, 2014 and 2013
, potentially dilutive shares of common stock related to our
0.75%
Convertible Senior Notes due
2016
issued during the fiscal year 2012, which have a conversion price of
$31.74
per share and the associated Warrants, which have a conversion price of
$41.14
per share, were excluded from the computation of Diluted EPS as their inclusion would have had an antidilutive effect resulting from the conversion price. The associated Convertible Note Hedge was excluded from the computation of diluted shares as the impact is always considered antidilutive. See Note 12 for additional information related to our
0.75%
Convertible Senior Notes due
2016
and related Convertible Note Hedge and Warrants.
(18) SEGMENT INFORMATION
Our reporting segment is based upon: our internal organizational structure; the manner in which our operations are managed; the criteria used by our Chief Executive Officer, our Chief Operating Decision Maker (“CODM”), to evaluate segment performance; the availability of separate financial information; and overall materiality considerations. Our CODM currently reviews total company operating results to assess overall performance and allocate resources.
84
The following table summarizes the financial performance of our current segment operating profit and a reconciliation to our consolidated operating income for the
fiscal years ended March 31, 2015, 2014 and 2013
(in millions):
|
|
Year Ended March 31,
|
||||||||||
|
|
2015
|
2014
|
2013
|
||||||||
|
Segment:
|
|||||||||||
|
Net revenue before revenue deferral
|
$
|
4,319
|
|
$
|
4,021
|
|
$
|
3,793
|
|
||
|
Depreciation
|
(126
|
)
|
(126
|
)
|
(118
|
)
|
|||||
|
Other expenses
|
(3,117
|
)
|
(3,178
|
)
|
(3,308
|
)
|
|||||
|
Segment operating profit
|
1,076
|
|
717
|
|
367
|
|
|||||
|
Reconciliation to consolidated operating income:
|
|||||||||||
|
Other:
|
|||||||||||
|
Revenue deferral
|
(3,536
|
)
|
(3,350
|
)
|
(3,022
|
)
|
|||||
|
Recognition of revenue deferral
|
3,732
|
|
2,904
|
|
3,026
|
|
|||||
|
Amortization of intangibles
|
(66
|
)
|
(76
|
)
|
(123
|
)
|
|||||
|
Acquisition-related contingent consideration
|
3
|
|
35
|
|
64
|
|
|||||
|
Restructuring and other charges
|
—
|
|
1
|
|
(27
|
)
|
|||||
|
Stock-based compensation
|
(144
|
)
|
(150
|
)
|
(164
|
)
|
|||||
|
Loss on licensed intellectual property commitment
|
(122
|
)
|
—
|
|
—
|
|
|||||
|
Other expenses
|
5
|
|
(48
|
)
|
—
|
|
|||||
|
Consolidated operating income
|
$
|
948
|
|
$
|
33
|
|
$
|
121
|
|
||
Our segment profit differs from consolidated operating income primarily due to the exclusion of (1) the deferral of net revenue related to online-enabled games (see Note 10 for additional information regarding deferred net revenue (online-enabled games)), (2) certain non-cash costs such as stock-based compensation, (3) acquisition-related expenses such as amortization of intangibles and acquisition-related contingent consideration, and (4) other significant non-recurring costs that may not be indicative of the company’s core business, operating results or future outlook. Our CODM reviews assets on a consolidated basis and not on a segment basis.
Information about our total net revenue by revenue composition and by platform for the
fiscal years ended March 31, 2015, 2014 and 2013
is presented below (in millions):
|
|
Year Ended March 31,
|
||||||||||
|
|
2015
|
2014
|
2013
|
||||||||
|
Packaged goods and other
|
$
|
2,316
|
|
$
|
1,742
|
|
$
|
2,357
|
|
||
|
Digital
|
2,199
|
|
1,833
|
|
1,440
|
|
|||||
|
Net revenue
|
$
|
4,515
|
|
$
|
3,575
|
|
$
|
3,797
|
|
||
|
Year Ended March 31,
|
|||||||||||
|
|
2015
|
2014
|
2013
|
||||||||
|
Platform net revenue
|
|||||||||||
|
Xbox One, PlayStation 4
|
$
|
1,505
|
|
$
|
196
|
|
$
|
—
|
|
||
|
Xbox 360, PlayStation 3
|
1,485
|
|
1,779
|
|
2,262
|
|
|||||
|
Other consoles
|
21
|
|
30
|
|
63
|
|
|||||
|
Total consoles
|
3,011
|
|
2,005
|
|
2,325
|
|
|||||
|
PC / Browser
|
878
|
|
1,020
|
|
928
|
|
|||||
|
Mobile
|
504
|
|
400
|
|
339
|
|
|||||
|
Other
|
122
|
|
150
|
|
205
|
|
|||||
|
Net revenue
|
$
|
4,515
|
|
$
|
3,575
|
|
$
|
3,797
|
|
||
85
Information about our operations in North America and internationally as of and for the
fiscal years ended March 31, 2015, 2014 and 2013
is presented below (in millions):
|
|
Year Ended March 31,
|
||||||||||
|
|
2015
|
2014
|
2013
|
||||||||
|
Net revenue from unaffiliated customers
|
|||||||||||
|
North America
|
$
|
1,956
|
|
$
|
1,510
|
|
$
|
1,701
|
|
||
|
International
|
2,559
|
|
2,065
|
|
2,096
|
|
|||||
|
Total
|
$
|
4,515
|
|
$
|
3,575
|
|
$
|
3,797
|
|
||
|
|
As of March 31,
|
||||||
|
|
2015
|
2014
|
|||||
|
Long-lived assets
|
|||||||
|
North America
|
$
|
1,809
|
|
$
|
1,940
|
|
|
|
International
|
474
|
|
470
|
|
|||
|
Total
|
$
|
2,283
|
|
$
|
2,410
|
|
|
We attribute net revenue from external customers to individual countries based on the location of the legal entity that sells the products and/or services. Note that revenue attributed to the legal entity that makes the sale is often not the country where the consumer resides. For example, revenue generated by our Swiss legal entities includes digital revenue from consumers who reside outside of Switzerland, including consumers who reside outside of Europe. Revenue generated by our Swiss legal entities during
fiscal years 2015, 2014, and 2013
represents
$1,462 million
,
$1,171 million
and
$885 million
or
32 percent
,
33 percent
and
23 percent
of our total net revenue, respectively. Revenue generated in the United States represents over
99 percent
of our total North America net revenue. There were no other countries with net revenue greater than
10 percent
.
Our direct sales to GameStop Corp. represented approximately
11 percent
,
13 percent
, and
13 percent
of total net revenue in
fiscal years 2015, 2014, and 2013
, respectively. In fiscal year 2015, our direct sales to Microsoft represented approximately
10 percent
of total net revenue. Our direct sales to Microsoft did not exceed 10 percent of net revenue in fiscal years 2014 and 2013.
86
(19) QUARTERLY FINANCIAL AND MARKET INFORMATION (UNAUDITED)
|
|
Quarter Ended
|
Year
Ended
|
|||||||||||||||||
|
(In millions, except per share data)
|
June 30
|
September 30
|
December 31
|
March 31
|
|||||||||||||||
|
Fiscal 2015 Consolidated
|
|||||||||||||||||||
|
Net revenue
|
$
|
1,214
|
|
$
|
990
|
|
$
|
1,126
|
|
$
|
1,185
|
|
$
|
4,515
|
|
||||
|
Gross profit
|
847
|
|
563
|
|
725
|
|
951
|
|
3,086
|
|
|||||||||
|
Operating income
|
362
|
|
24
|
|
162
|
|
400
|
|
948
|
|
|||||||||
|
Net income
|
335
|
|
(a)
|
3
|
|
(a)
|
142
|
|
|
395
|
|
(a)
|
875
|
|
|||||
|
Common Stock
|
|||||||||||||||||||
|
Net income per share — Basic
|
$
|
1.07
|
|
$
|
0.01
|
|
$
|
0.46
|
|
$
|
1.27
|
|
$
|
2.81
|
|
||||
|
Net income per share — Diluted
|
$
|
1.04
|
|
$
|
0.01
|
|
$
|
0.44
|
|
$
|
1.19
|
|
$
|
2.69
|
|
||||
|
Common stock price per share
|
|||||||||||||||||||
|
High
|
$
|
37.15
|
|
$
|
38.42
|
|
$
|
48.33
|
|
$
|
58.24
|
|
$
|
58.24
|
|
||||
|
Low
|
$
|
26.67
|
|
$
|
33.31
|
|
$
|
32.62
|
|
$
|
45.96
|
|
$
|
26.67
|
|
||||
|
Fiscal 2014 Consolidated
|
|||||||||||||||||||
|
Net revenue
|
$
|
949
|
|
$
|
695
|
|
$
|
808
|
|
$
|
1,123
|
|
$
|
3,575
|
|
||||
|
Gross profit
|
755
|
|
282
|
|
291
|
|
900
|
|
2,228
|
|
|||||||||
|
Operating income (loss)
|
233
|
|
(252
|
)
|
(292
|
)
|
344
|
|
33
|
|
|||||||||
|
Net income (loss)
|
222
|
|
(b)
|
(273
|
)
|
(c)
|
(308
|
)
|
(d)
|
367
|
|
(e)
|
8
|
|
|||||
|
Common Stock
|
|||||||||||||||||||
|
Net income (loss) per share — Basic
|
$
|
0.73
|
|
$
|
(0.89
|
)
|
$
|
(1.00
|
)
|
$
|
1.18
|
|
$
|
0.03
|
|
||||
|
Net income (loss) per share — Diluted
|
$
|
0.71
|
|
$
|
(0.89
|
)
|
$
|
(1.00
|
)
|
$
|
1.15
|
|
$
|
0.03
|
|
||||
|
Common stock price per share
|
|||||||||||||||||||
|
High
|
$
|
23.61
|
|
$
|
27.99
|
|
$
|
26.44
|
|
$
|
30.25
|
|
$
|
30.25
|
|
||||
|
Low
|
$
|
16.91
|
|
$
|
23.18
|
|
$
|
20.97
|
|
$
|
21.54
|
|
$
|
16.91
|
|
||||
|
(a)
|
Net income includes
$(1) million
of acquisition-related contingent consideration, of which is pre-tax amounts.
|
|
(b)
|
Net income includes restructuring charges of
$1 million
and
$7 million
of acquisition-related contingent consideration, both of which are pre-tax amounts.
|
|
(c)
|
Net loss includes restructuring charges of
$(2) million
and
$(44) million
of acquisition-related contingent consideration, both of which are pre-tax amounts.
|
|
(d)
|
Net loss includes pre-tax restructuring charges of
$(1) million
.
|
|
(e)
|
Net income includes restructuring charges of
$1 million
and
$2 million
of acquisition-related contingent consideration, both of which are pre-tax amounts.
|
Our common stock is traded on the NASDAQ Global Select Market under the symbol “EA”. The prices for the common stock in the table above represent the high and low closing sales prices as reported on the NASDAQ Global Select Market.
87
Report of Independent Registered Public Accounting Firm
The Board of Directors and Stockholders
Electronic Arts Inc.:
We have audited the accompanying consolidated balance sheets of Electronic Arts Inc. and subsidiaries (the Company) as of March 28, 2015 and March 29, 2014, and the related consolidated statements of operations, comprehensive income (loss), stockholders’ equity, and cash flows for each of the years in the three‑year period ended
March 28, 2015. In connection with our audits of the consolidated financial statements, we have also audited the accompanying financial statement schedule. These consolidated financial statements and financial statement schedule are the responsibility of the Company’s management. Our responsibility is to express an opinion on these consolidated financial statements and financial statement schedule based on our audits.
We conducted our audits in accordance with the standards of the Public Company Accounting Oversight Board (United States). Those standards require that we plan and perform the audit to obtain reasonable assurance about whether the financial statements are free of material misstatement. An audit includes examining, on a test basis, evidence supporting the amounts and disclosures in the financial statements. An audit also includes assessing the accounting principles used and significant estimates made by management, as well as evaluating the overall financial statement presentation. We believe that our audits provide a reasonable basis for our opinion.
In our opinion, the consolidated financial statements referred to above present fairly, in all material respects, the financial position of Electronic Arts Inc. and subsidiaries as of March 28, 2015 and March 29, 2014, and the results of their operations and their cash flows for each of the years in the three‑year period ended March 28, 2015, in conformity with U.S. generally accepted accounting principles. Also in our opinion, the related financial statement schedule, when considered in relation to the basic consolidated financial statements taken as a whole, presents fairly, in all material respects, the information set forth therein.
We also have audited, in accordance with the standards of the Public Company Accounting Oversight Board (United States), Electronic Arts Inc.’s internal control over financial reporting as of March 28, 2015, based on criteria established in
Internal Control - Integrated Framework (2013),
issued by the Committee of Sponsoring Organizations of the Treadway Commission (COSO), and our report dated
May 21, 2015
expressed an unqualified opinion on the effectiveness of the Company’s internal control over financial reporting.
/s/ KPMG LLP
Santa Clara, California
May 21, 2015
88
Report of Independent Registered Public Accounting Firm
The Board of Directors and Stockholders
Electronic Arts Inc.:
We have audited Electronic Arts Inc.’s (the Company) internal control over financial reporting as of March 28, 2015, based on criteria established in
Internal Control - Integrated Framework (2013)
issued by the Committee of Sponsoring Organizations of the Treadway Commission (COSO). The Company’s management is responsible for maintaining effective internal control over financial reporting and for its assessment of the effectiveness of internal control over financial reporting, included in the accompanying Management’s Report on Internal Control over Financial Reporting appearing under Item 9A. Our responsibility is to express an opinion on the Company’s internal control over financial reporting based on our audit.
We conducted our audit in accordance with the standards of the Public Company Accounting Oversight Board (United States). Those standards require that we plan and perform the audit to obtain reasonable assurance about whether effective internal control over financial reporting was maintained in all material respects. Our audit included obtaining an understanding of internal control over financial reporting, assessing the risk that a material weakness exists, and testing and evaluating the design and operating effectiveness of internal control based on the assessed risk. Our audit also included performing such other procedures as we considered necessary in the circumstances. We believe that our audit provides a reasonable basis for our opinion.
A company’s internal control over financial reporting is a process designed to provide reasonable assurance regarding the reliability of financial reporting and the preparation of financial statements for external purposes in accordance with generally accepted accounting principles. A company’s internal control over financial reporting includes those policies and procedures that (1) pertain to the maintenance of records that, in reasonable detail, accurately and fairly reflect the transactions and dispositions of the assets of the company; (2) provide reasonable assurance that transactions are recorded as necessary to permit preparation of financial statements in accordance with generally accepted accounting principles, and that receipts and expenditures of the company are being made only in accordance with authorizations of management and directors of the company; and (3) provide reasonable assurance regarding prevention or timely detection of unauthorized acquisition, use, or disposition of the company’s assets that could have a material effect on the financial statements.
Because of its inherent limitations, internal control over financial reporting may not prevent or detect misstatements. Also, projections of any evaluation of effectiveness to future periods are subject to the risk that controls may become inadequate because of changes in conditions, or that the degree of compliance with the policies or procedures may deteriorate.
In our opinion, Electronic Arts Inc. maintained, in all material respects, effective internal control over financial reporting as of March 28, 2015, based on criteria established in
Internal Control - Integrated Framework (2013)
issued by the Committee of Sponsoring Organizations of the Treadway Commission.
We also have audited, in accordance with the standards of the Public Company Accounting Oversight Board (United States), the consolidated balance sheets of Electronic Arts Inc. and subsidiaries as of March 28, 2015 and March 29, 2014, and the related consolidated statements of operations, comprehensive income (loss), stockholders’ equity, and cash flows for each of the years in the three-year period ended March 28, 2015. In connection with our audits of the consolidated financial statements, we have also audited the accompanying financial statement schedule. Our report dated
May 21, 2015
expressed an unqualified opinion on those consolidated financial statements.
/s/ KPMG LLP
Santa Clara, California
May 21, 2015
89
Item 9:
Changes in and Disagreements with Accountants on Accounting and Financial Disclosure
Not applicable.
Item 9A:
Controls and Procedures
Definition and Limitations of Disclosure Controls
Our disclosure controls and procedures (as defined in Rules 13a-15(e) and 15d-15(e) under the Securities Exchange Act of 1934, as amended (the “Exchange Act”)) are controls and other procedures that are designed to ensure that information required to be disclosed in our reports filed under the Exchange Act, such as this report, is recorded, processed, summarized and reported within the time periods specified in the SEC’s rules and forms. Disclosure controls and procedures are also designed to ensure that such information is accumulated and communicated to our management, including the Chief Executive Officer and Chief Financial Officer, as appropriate to allow timely decisions regarding required disclosure. Our management evaluates these controls and procedures on an ongoing basis.
There are inherent limitations to the effectiveness of any system of disclosure controls and procedures. These limitations include the possibility of human error, the circumvention or overriding of the controls and procedures and reasonable resource constraints. In addition, because we have designed our system of controls based on certain assumptions, which we believe are reasonable, about the likelihood of future events, our system of controls may not achieve its desired purpose under all possible future conditions. Accordingly, our disclosure controls and procedures provide reasonable assurance, but not absolute assurance, of achieving their objectives.
Evaluation of Disclosure Controls and Procedures
Our Chief Executive Officer and our Chief Financial Officer, after evaluating the effectiveness of our disclosure controls and procedures, believe that as of the end of the period covered by this report, our disclosure controls and procedures were effective in providing the requisite reasonable assurance that material information required to be disclosed in the reports that we file or submit under the Exchange Act is recorded, processed, summarized and reported within the time periods specified in the SEC’s rules and forms, and is accumulated and communicated to our management, including our Chief Executive Officer and Chief Financial Officer, as appropriate to allow timely decisions regarding the required disclosure.
Management’s Report on Internal Control over Financial Reporting
Our management is responsible for establishing and maintaining adequate internal control over financial reporting, as defined in Rules 13a-15(f) and 15d-15(f) under the Exchange Act.
Our internal control over financial reporting is designed to provide reasonable, but not absolute, assurance regarding the reliability of financial reporting and the preparation of financial statements in accordance with generally accepted accounting principles. There are inherent limitations to the effectiveness of any system of internal control over financial reporting. These limitations include the possibility of human error, the circumvention or overriding of the system and reasonable resource constraints. Because of its inherent limitations, our internal control over financial reporting may not prevent or detect misstatements. Projections of any evaluation of effectiveness to future periods are subject to the risks that controls may become inadequate because of changes in conditions, or that the degree of compliance with our policies or procedures may deteriorate.
Our management assessed the effectiveness of our internal control over financial reporting as of the end of our most recently completed fiscal year. In making its assessment, management used the criteria set forth in
Internal Control-Integrated Framework (2013),
issued by the Committee of Sponsoring Organizations of the Treadway Commission (COSO). Based on this assessment, our management believes that, as of the end of our most recently completed fiscal year, our internal control over financial reporting was effective.
KPMG LLP, our independent registered public accounting firm, has issued an auditors’ report on the effectiveness of our internal control over financial reporting. That report appears on page 89.
Changes in Internal Control over Financial Reporting
There has been no change in our internal control over financial reporting identified in connection with our evaluation that occurred during the fiscal quarter ended March 31, 2015 that has materially affected or is reasonably likely to materially affect our internal control over financial reporting. In May 2013, the Committee of Sponsoring Organizations of the Treadway Commission (COSO) published an updated Internal Control - Integrated Framework (2013) and related illustrative documents. The Company adopted the new framework during the fiscal year ended March 31, 2015.
Item 9B:
Other Information
None.
90
Item 10:
Directors, Executive Officers and Corporate Governance
The information required by Item 10, other than the information regarding executive officers, which is included in Item 1 of this report, is incorporated herein by reference to the information to be included in our Proxy Statement for our 2015 Annual Meeting of Stockholders (the “Proxy Statement”) under the headings “Board of Directors and Corporate Governance,” and “Report of the Audit Committee of the Board of Directors.” The information regarding Section 16 compliance is incorporated herein by reference to the information to be included in the Proxy Statement under the heading “Section 16(a) Beneficial Ownership Reporting Compliance.”
Item 11:
Executive Compensation
The information required by Item 11 is incorporated herein by reference to the information to be included in the Proxy Statement, under the headings “Compensation of Directors,” “Compensation Discussion and Analysis,” “Compensation Committee Report on Executive Compensation” and “Compensation Committee Interlocks and Insider Participation.”
Item 12:
Security Ownership of Certain Beneficial Owners and Management and Related Stockholder Matters
The information required by Item 12 is incorporated herein by reference to the information to be included in the Proxy Statement under the headings “Equity Compensation Plan Information” and “Security Ownership of Certain Beneficial Owners and Management.”
Item 13:
Certain Relationships and Related Transactions, and Director Independence
The information required by Item 13 is incorporated herein by reference to the information to be included in the Proxy Statement under the headings “Director Independence,” “Global Code of Conduct and Corporate Governance Guidelines” and “Certain Relationships and Related Person Transactions.”
Item 14:
Principal Accounting Fees and Services
The information required by Item 14 is incorporated herein by reference to the information to be included in the Proxy Statement under the heading “Proposal 3: Ratification of the Appointment of KPMG LLP, Independent Registered Public Accounting Firm.”
Item 15:
Exhibits, Financial Statement Schedules
|
(a)
|
Documents filed as part of this report
|
1. Financial Statements: See Index to Consolidated Financial Statements under Item 8 on Page 47 of this report.
2. Financial Statement Schedule: See Schedule II on Page 93 of this report.
3. Exhibits: The exhibits listed in the accompanying index to exhibits on Page 94 are filed or incorporated by reference as part of this report.
91
SIGNATURES
Pursuant to the requirements of Section 13 or 15(d) of the Securities Exchange Act of 1934, the Registrant has duly caused this report to be signed on its behalf by the undersigned, thereunto duly authorized.
|
ELECTRONIC ARTS INC.
|
||
|
By:
|
/s/ Andrew Wilson
|
|
|
Andrew Wilson
|
||
|
Chief Executive Officer
|
||
|
Date: May 21, 2015
|
||
Pursuant to the requirements of the Securities Exchange Act of 1934, this report has been signed below by the following persons on behalf of the Registrant and in the capacities indicated and on the 21
st
of May 2015.
|
Name
|
|
Title
|
|
/s/ Andrew Wilson
|
|
Chief Executive Officer
|
|
Andrew Wilson
|
|
|
|
/s/ Blake Jorgensen
|
|
Executive Vice President,
|
|
Blake Jorgensen
|
Chief Financial Officer
|
|
|
/s/ Kenneth A. Barker
|
Senior Vice President,
|
|
|
Kenneth A. Barker
|
Chief Accounting Officer
|
|
|
(Principal Accounting Officer)
|
||
|
Directors:
|
|
|
|
/s/ Lawrence F. Probst III
|
|
Chairman of the Board
|
|
Lawrence F. Probst III
|
|
|
|
/s/ Leonard S. Coleman
|
Director
|
|
|
Leonard S. Coleman
|
||
|
/s/ Jay C. Hoag
|
|
Director
|
|
Jay C. Hoag
|
|
|
|
/s/ Jeffrey T. Huber
|
|
Director
|
|
Jeffrey T. Huber
|
|
|
|
/s/ Vivek Paul
|
|
Director
|
|
Vivek Paul
|
|
|
|
/s/ Richard A. Simonson
|
|
Director
|
|
Richard A. Simonson
|
|
|
|
/s/ Luis A. Ubiñas
|
|
Director
|
|
Luis A. Ubiñas
|
|
|
|
/s/ Denise F. Warren
|
Director
|
|
|
Denise F. Warren
|
||
|
/s/ Andrew Wilson
|
|
Director
|
|
Andrew Wilson
|
|
|
92
ELECTRONIC ARTS INC. AND SUBSIDIARIES
SCHEDULE II
VALUATION AND QUALIFYING ACCOUNTS
Years Ended March 31, 2015, 2014 and 2013
(In millions)
|
Allowance for Doubtful Accounts,
Price Protection and Returns
|
Balance at
Beginning
of Period
|
Charged to
Revenue,
Costs and
Expenses
|
Charged
(Credited)
to Other
Accounts
(a)
|
Deductions
(b)
|
Balance at
End of
Period
|
|||||||||||
|
Year Ended March 31, 2015
|
$
|
186
|
|
361
|
|
(66
|
)
|
(341
|
)
|
$
|
140
|
|
||||
|
Year Ended March 31, 2014
|
$
|
200
|
|
321
|
|
37
|
|
(372
|
)
|
$
|
186
|
|
||||
|
Year Ended March 31, 2013
|
$
|
252
|
|
374
|
|
(7
|
)
|
(419
|
)
|
$
|
200
|
|
||||
|
(a)
|
Primarily other reclassification adjustments and the translation effect of using the average exchange rate for expense items and the year-end exchange rate for the balance sheet item (allowance account).
|
|
(b)
|
Primarily the utilization of returns allowance and price protection reserves.
|
93
ELECTRONIC ARTS INC.
2015 FORM 10-K ANNUAL REPORT
EXHIBIT INDEX
|
|
|
|
Incorporated by Reference
|
|
Filed
Herewith
|
|||||
|
Number
|
|
Exhibit Title
|
Form
|
|
File No.
|
|
Filing Date
|
|
||
|
3.01
|
Amended and Restated Certificate of Incorporation
|
10-Q
|
000-17948
|
11/3/2004
|
|
|||||
|
3.02
|
Amended and Restated Bylaws
|
8-K
|
000-17948
|
8/1/2013
|
|
|||||
|
4.01
|
Specimen Certificate of Registrant’s Common Stock
|
10-K
|
000-17948
|
5/22/2009
|
|
|||||
|
4.02
|
Indenture (including form of Notes) with respect to EA’s 0.75% Convertible Senior Notes due 2016 dated as of July 20, 2011 by and between EA and U.S. Bank
National Association
|
8-K
|
000-17948
|
7/20/2011
|
|
|||||
|
10.01*
|
Form of Indemnity Agreement with Directors
|
10-K
|
000-17948
|
6/4/2004
|
|
|||||
|
10.02*
|
Electronic Arts Inc. Executive Bonus Plan
|
8-K
|
000-17948
|
7/27/2012
|
|
|||||
|
10.03*
|
Electronic Arts Inc. Deferred Compensation Plan
|
10-Q
|
000-17948
|
8/6/2007
|
|
|||||
|
10.04*
|
Electronic Arts Inc. Key Employee Continuity Plan
|
10-Q
|
000-17948
|
2/5/2013
|
|
|||||
|
10.05*
|
First Amendment to the Electronic Arts Deferred Compensation Plan, as amended and restated
|
10-K
|
000-17948
|
5/22/2009
|
|
|||||
|
10.06*
|
EA Bonus Plan
|
10-Q
|
000-17948
|
11/8/2010
|
||||||
|
10.07*
|
Form of 2012 Performance-Based Restricted Stock Unit Agreement
|
8-K
|
000-17948
|
5/18/2012
|
||||||
|
10.08*
|
Form of 2013 Performance-Based Restricted Stock Unit Agreement
|
8-K
|
000-17948
|
5/16/2013
|
||||||
|
10.09*
|
Form of 2014 Performance-Based Restricted Stock Unit Agreement
|
10-K
|
000-17948
|
5/21/2014
|
||||||
|
10.10*
|
EA Bonus Plan Fiscal Year 2015 Addendum
|
8-K
|
000-17948
|
6/4/2014
|
||||||
|
10.11*
|
2000 Equity Incentive Plan, as amended, and related documents
|
8-K
|
000-17948
|
8/1/2013
|
||||||
|
10.12*
|
2000 Employee Stock Purchase Plan, as amended
|
8-K
|
000-17948
|
8/1/2013
|
||||||
|
10.13*
|
Offer Letter for Employment at Electronic Arts Inc. to Andrew Wilson, dated September 15, 2013
|
8-K
|
000-17948
|
9/17/2013
|
||||||
|
10.14*
|
Offer Letter for Employment at Electronic Arts Inc. to Blake Jorgensen, dated July 25, 2012
|
8-K
|
000-17948
|
7/31/2012
|
||||||
|
10.15*
|
Offer Letter for Employment at Electronic Arts Inc. to Ken Moss, dated June 6, 2014
|
10-Q
|
000-17948
|
8/5/2014
|
||||||
|
10.16*
|
Offer Letter for Employment at Electronic Arts Inc. to Chris Bruzzo, dated July 21, 2014
|
10-Q
|
000-17948
|
11/4/2014
|
||||||
|
10.17*
|
Employment Agreement for Patrick Söderlund, dated September 17, 2013
|
10-Q
|
000-17948
|
11/5/2013
|
|
|||||
94
|
|
|
|
Incorporated by Reference
|
|
Filed
Herewith
|
|||||
|
Number
|
|
Exhibit Title
|
Form
|
|
File No.
|
|
Filing Date
|
|
||
|
10.18
|
Lease agreement between ASP WT, L.L.C. and Tiburon Entertainment, Inc. for space at Summit Park I, dated June 15, 2004
|
10-Q
|
000-17948
|
8/3/2004
|
|
|||||
|
10.19
|
First amendment to lease, dated December 13, 2005, by and between Liberty Property Limited Partnership, a Pennsylvania limited partnership and Electronic Arts - Tiburon, a Florida corporation f/k/a Tiburon Entertainment, Inc.
|
10-Q
|
000-17948
|
2/8/2006
|
||||||
|
10.20
|
Second Amendment to Lease, dated May 8, 2009, by and between Liberty Property Limited Partnership, a Pennsylvania limited partnership and Electronic Arts - Tiburon, a Florida corporation f/k/a Tiburon Entertainment, Inc.
|
10-Q
|
000-17948
|
8/10/2009
|
|
|||||
|
10.21
|
Third amendment to lease, dated December 24, 2009, by and between Liberty Property Limited Partnership, a Pennsylvania limited partnership and Electronic Arts - Tiburon, a Florida corporation f/k/a Tiburon Entertainment, Inc.
|
10-Q
|
000-17948
|
2/9/2010
|
|
|||||
|
10.22
|
Fourth Amendment to lease, dated May 16, 2014, by and between Liberty Property Limited Partnership, a Pennsylvania limited partnership and Electronic Arts - Tiburon, a Florida corporation f/k/a Tiburon Entertainment, Inc.
|
10-K
|
000-17948
|
5/21/2014
|
|
|||||
|
10.23**
|
First Amended North American Territory Rider to the Global PlayStation
®
3 Format Licensed Publisher Agreement, dated September 11, 2008, by and between the Electronic Arts Inc. and Sony Computer Entertainment America Inc.
|
10-Q
|
000-17948
|
11/10/2009
|
||||||
|
10.24**
|
Sony Computer Entertainment Europe Limited Regional Rider to the Global PlayStation
®
3 Format Licensed Publisher Agreement, dated December 17, 2008, by and between EA International (Studio and Publishing) Limited and Sony Computer Entertainment Europe Limited
|
10-Q
|
000-17948
|
11/10/2009
|
|
|||||
|
10.25**
|
Global PlayStation
®
3 Format Licensed Publisher Agreement, dated September 11, 2008, by and between the Electronic Arts Inc. and Sony Computer Entertainment America Inc.
|
10-Q/A
|
000-17948
|
4/30/2010
|
|
|||||
|
10.26**
|
Global PlayStation
®
3 Format Licensed Publisher Agreement, dated December 17, 2008, by and between EA International (Studio and Publishing) Limited and Sony Computer Entertainment Europe Limited
|
10-Q/A
|
000-17948
|
4/30/2010
|
|
|||||
|
10.27**
|
Xbox2 Publisher License Agreement, dated May 15, 2005, by and among Electronic Arts Inc., Electronic Arts C.V. and Microsoft Licensing, GP
|
10-Q/A
|
000-17948
|
4/30/2010
|
|
|||||
|
10.28**
|
Durango Publisher License Agreement, dated June 29, 2012, by and among Electronic Arts Inc., EA International (Studio & Publishing) Ltd., Microsoft Licensing, GP and Microsoft Corporation
|
10-K
|
000-17948
|
5/21/2014
|
|
|||||
|
10.29
|
Form of Call Option Agreement dated as of July 14, 2011 between EA and each Option Counterparty
|
8-K
|
000-17948
|
7/20/2011
|
|
|||||
|
10.30
|
Form of Warrant Agreement dated July 14, 2011 between EA and each Option Counterparty
|
8-K
|
000-17948
|
7/20/2011
|
|
|||||
|
10.31
|
Form of Additional Call Option Agreement dated July 18, 2011 between EA and each Option Counterparty
|
8-K
|
000-17948
|
7/20/2011
|
|
|||||
95
|
|
|
|
Incorporated by Reference
|
|
Filed
Herewith
|
|||||
|
Number
|
|
Exhibit Title
|
Form
|
|
File No.
|
|
Filing Date
|
|
||
|
10.32
|
Form of Additional Warrant Agreement dated as of July 18, 2011 between EA and each Option Counterparty
|
8-K
|
000-17948
|
7/20/2011
|
|
|||||
|
10.33
|
Credit Agreement, dated March 19, 2015, by and among Electronic Arts Inc., the lenders from time to time party thereto, and JPMorgan Chase Bank, N.A., as Administrative Agent
|
8-K
|
000-17948
|
3/20/2015
|
||||||
|
21.01
|
Subsidiaries of the Registrant
|
X
|
||||||||
|
23.01
|
Consent of KPMG LLP, Independent Registered Public Accounting Firm
|
X
|
||||||||
|
31.01
|
Certification of Chief Executive Officer pursuant to Rule 13a-14(a) of the Exchange Act, as adopted pursuant to Section 302 of the Sarbanes-Oxley Act of 2002
|
X
|
||||||||
|
31.02
|
Certification of Chief Financial Officer pursuant to Rule 13a-14(a) of the Exchange Act, as adopted pursuant to Section 302 of the Sarbanes-Oxley Act of 2002
|
X
|
||||||||
|
Additional exhibits furnished with this report:
|
||||||||||
|
32.01
|
Certification of Chief Executive Officer pursuant to Section 906 of the Sarbanes-Oxley Act of 2002
|
X
|
||||||||
|
32.02
|
Certification of Chief Financial Officer pursuant to Section 906 of the Sarbanes-Oxley Act of 2002
|
X
|
||||||||
|
101.INS
†
|
XBRL Instance Document
|
X
|
||||||||
|
101.SCH
†
|
XBRL Taxonomy Extension Schema Document
|
X
|
||||||||
|
101.CAL
†
|
XBRL Taxonomy Extension Calculation Linkbase Document
|
X
|
||||||||
|
101.DEF
†
|
XBRL Taxonomy Extension Definition Linkbase Document
|
X
|
||||||||
|
101.LAB
†
|
XBRL Taxonomy Extension Label Linkbase Document
|
X
|
||||||||
|
101.PRE
†
|
XBRL Taxonomy Extension Presentation Linkbase Document
|
X
|
||||||||
|
*
|
Management contract or compensatory plan or arrangement.
|
|
**
|
Confidential portions of these documents have been omitted and filed separately with the Securities and Exchange Commission pursuant to a request for confidential treatment that was granted in accordance with Exchange Act Rule 24b-2.
|
|
†
|
Attached as Exhibit 101 to this Annual Report on Form 10-K for the year ended March 31, 2015 are the following formatted in eXtensible Business Reporting Language (“XBRL”): (1) Consolidated Balance Sheets, (2) Consolidated Statements of Operations, (3) Consolidated Statements of Comprehensive Income (Loss), (4) Consolidated Statements of Stockholders’ Equity, (5) Consolidated Statements of Cash Flows, and (6) Notes to Consolidated Financial Statements.
|
96
TABLE OF CONTENTS
Part IItem 1: BusinessItem 1A. Risk FactorsItem 1B: Unresolved Staff CommentsItem 2: PropertiesItem 3: Legal ProceedingsItem 4: Mine Safety DisclosuresPart IIItem 5: Market For Registrant S Common Equity, Related Stockholder Matters and Issuer Purchases Of Equity SecuritiesItem 6: Selected Financial DataItem 7: Management S Discussion and Analysis Of Financial Condition and Results Of OperationsItem 7A: Quantitative and Qualitative Disclosures About Market RiskItem 8: Financial Statements and Supplementary DataItem 9: Changes in and Disagreements with Accountants on Accounting and Financial DisclosureItem 9A: Controls and ProceduresItem 9B: Other InformationPart IIIItem 10: Directors, Executive Officers and Corporate GovernanceItem 11: Executive CompensationItem 12: Security Ownership Of Certain Beneficial Owners and Management and Related Stockholder MattersItem 13: Certain Relationships and Related Transactions, and Director IndependenceItem 14: Principal Accounting Fees and ServicesPart IVItem 15: Exhibits, Financial Statement Schedules