ELLINGTON RESIDENTIAL MORTGAGE REIT
10-Ks and 10-Qs
|
|
|
|
|
|
|
|
|
|
|
|
|
|
|
|
|
|
|
|
|
|
|
|
|
|
|
|
|
|
|
|
|
|
|
|
|
|
|
|
|
|
|
|
|
|
|
|
|
|
UNITED STATES
SECURITIES AND EXCHANGE COMMISSION
WASHINGTON, D.C. 20549
FORM 10-K
|
x
|
ANNUAL REPORT PURSUANT TO SECTION 13 OR 15(d) OF THE SECURITIES EXCHANGE ACT OF 1934
|
For the fiscal year ended December 31, 2013
OR
|
¨
|
TRANSITION REPORT PURSUANT TO SECTION 13 OR 15(d) OF THE SECURITIES EXCHANGE ACT OF 1934
|
For the transition period from to
Commission file number 001-35896
Ellington Residential Mortgage REIT
(Exact Name of Registrant as Specified in Its Charter)
|
Maryland
|
|
46-0687599
|
|
(State or Other Jurisdiction of Incorporation or Organization)
|
|
(I.R.S. Employer Identification No.)
|
|
53 Forest Avenue, Old Greenwich, Connecticut 06870
|
||
|
(Address of Principal Executive Office) (Zip Code)
|
||
(203) 698-1200
(Registrant's Telephone Number, Including Area Code)
Securities registered pursuant to Section 12(b) of the Act:
|
Title of each class
|
Name of each exchange on which registered
|
|
|
Common Shares of Beneficial Interest, $0.01 par value per share
|
New York Stock Exchange
|
|
Securities registered pursuant to Section 12(g) of the Act: None
Indicate by check mark if the registrant is a well-known seasoned issuer, as defined in Rule 405 of the Securities Act. Yes
¨
No
x
Indicate by check mark if the registrant is not required to file reports pursuant to Section 13 or Section 15(d) of the Exchange Act. Yes
¨
No
x
Indicate by check mark whether the registrant (1) has filed all reports required to be filed by Section 13 or 15(d) of the Securities Exchange Act of 1934 during the preceding 12 months (or for such shorter period that the registrant was required to file such reports), and (2) has been subject to such filing requirements for the past 90 days. Yes
x
No
¨
Indicate by check mark whether the registrant has submitted electronically and posted on its corporate Website, if any, every Interactive Data File required to be submitted and posted pursuant to Rule 405 of Regulation S-T (§ 232.405 of this chapter) during the preceding 12 months (or for such shorter period that the registrant was required to submit and post such files). Yes
x
No
¨
Indicate by check mark if disclosure of delinquent filers pursuant to Item 405 of Regulation S-K (§ 232.405 of this chapter) is not contained herein, and will not be contained to the best of the registrant's knowledge, in definitive proxy or information statements incorporated by reference in Part III of this Form 10-K or any amendment to this Form 10-K.
x
Indicate by check mark whether the registrant is a large accelerated filer, an accelerated filer, a non-accelerated filer, or a smaller reporting company. See definitions of "large accelerated filer," "accelerated filer" and "smaller reporting company" in Rule 12b-2 of the Exchange Act.
|
Large Accelerated Filer
|
¨
|
Accelerated Filer
|
¨
|
|
Non-Accelerated Filer
|
x
|
Smaller Reporting Company
|
¨
|
Indicate by check mark whether the registrant is a shell company (as defined in Rule 12b-2 of the Exchange Act). Yes
¨
No
x
As of June 28, 2013, the last business day of the Registrant's most recently completed second fiscal quarter, the aggregate market value of the registrant's common shares held by non-affiliates was $115,070,025 based on the closing price as reported by the New York Stock Exchange on that date.
Number of the registrant's common shares outstanding as of March 14, 2014: 9,139,842
DOCUMENTS INCORPORATED BY REFERENCE
Portions of the registrant's definitive Proxy Statement with respect to its 2014 Annual Meeting of Shareholders to be filed not later than 120 days after the end of the registrant's fiscal year are incorporated by reference into Part III hereof as noted therein.
ELLINGTON RESIDENTIAL MORTGAGE REIT
INDEX
|
Item No.
|
Form 10-K Report Page
|
|
|
PART I
|
||
|
1.
|
||
|
1A.
|
||
|
1B.
|
||
|
2.
|
||
|
3.
|
||
|
4.
|
||
|
Part II
|
||
|
5.
|
||
|
6.
|
||
|
7.
|
||
|
7A.
|
||
|
8.
|
||
|
9.
|
||
|
9A.
|
||
|
9B.
|
||
|
Part III
|
||
|
10.
|
||
|
11.
|
||
|
12.
|
||
|
13.
|
||
|
14.
|
||
|
Part IV
|
||
|
15.
|
||
Except where the context suggests otherwise, "EARN," "we," "us," and "our" refer to Ellington Residential Mortgage REIT and its subsidiaries, including Ellington Residential Mortgage LP, our operating partnership subsidiary, which we refer to as the "Operating Partnership." We hold all of our assets and conduct all of our operations through our Operating Partnership. "Manager" refers to Ellington Residential Mortgage Management LLC, our external manager, and "Ellington" refers to Ellington Management Group, L.L.C. and its affiliated investment advisory firms, including our Manager, and "Manager Group" refers collectively to Ellington and its principals (including family trusts established by its principals) and entities in which 100% of the interests are beneficially owned by the foregoing. In certain instances, references to our Manager and services to be provided to us by our Manager may also include services provided by Ellington and its other affiliates from time to time. In certain instances, references to our Manager and services to be provided to us by our Manager may also include services provided by Ellington and its other affiliates from time to time. References to "Blackstone" mean The Blackstone Group LP. The "Blackstone Funds" means the group of funds that are managed by an affiliate of Blackstone and that helped form, and have a substantial investment in, our company.
Special Note Regarding Forward-Looking Statements
When used in this Annual Report on Form 10-K, in future filings with the Securities and Exchange Commission ("SEC") or in press releases or other written or oral communications, statements which are not historical in nature, including those containing words such as "believe," "expect," "anticipate," "estimate," "project," "plan," "continue," "intend," "should," "would," "could," "goal," "objective," "will," "may," "seek" or similar expressions, are intended to identify "forward-looking statements" within the meaning of Section 27A of the Securities Act of 1933, as amended, and Section 21E of the Securities Exchange Act of 1934, as amended, and, as such, may involve known and unknown risks, uncertainties and assumptions.
Forward-looking statements are based on our beliefs, assumptions, and expectations of our future performance, taking into account all information currently available to us. These beliefs, assumptions, and expectations are subject to risks and uncertainties and can change as a result of many possible events or factors, not all of which are known to us. If a change occurs, our business, financial condition, liquidity, and results of operations may vary materially from those expressed in our forward-looking statements. The following factors are examples of those that could cause actual results to vary from our forward-looking statements: changes in interest rates and the market value of our securities; our use of and dependence on leverage; the impact of Fannie Mae and Freddie Mac being placed into conservatorship and related events, including the lack of certainty as to the future roles and structures of these entities and changes to legislation and regulations affecting these entities; market volatility; changes in the prepayment rates on the mortgage loans underlying the securities we own and intend to acquire; changes in rates of default and/or recovery rates on our non-Agency assets; our ability to borrow to finance our assets; changes in government regulations affecting our business; our ability to maintain our exemption from registration under the Investment Company Act of 1940, as amended (the "Investment Company Act"); and risks associated with investing in real estate assets, including changes in business conditions and the general economy. These and other risks, uncertainties and factors, including the risk factors described under Item 1A of this Annual Report on Form 10-K, could cause our actual results to differ materially from those projected in any forward-looking statements we make. All forward-looking statements speak only as of the date on which they are made. New risks and uncertainties arise over time and it is not possible to predict those events or how they may affect us. Except as required by law, we are not obligated to, and do not intend to, update or revise any forward-looking statements, whether as a result of new information, future events, or otherwise.
Our Company
Ellington Residential Mortgage REIT is a Maryland real estate investment trust formed in August 2012 that specializes in acquiring, investing in, and managing residential mortgage- and real estate-related assets. Our primary objective is to generate attractive current yields and risk-adjusted total returns for our shareholders by making investments that we believe compensate us appropriately for the risks associated with them. We seek to attain this objective by constructing and actively managing a portfolio comprised primarily of residential mortgage-backed securities, or "RMBS," for which the principal and interest payments are guaranteed by a U.S. Government agency or a U.S. Government-sponsored entity, or "Agency RMBS," and, to a lesser extent, RMBS backed by prime jumbo, Alternative A-paper, or "Alt-A," manufactured housing, and subprime residential mortgage loans, or "non-Agency RMBS." We also may opportunistically acquire other types of residential mortgage- and real estate-related asset classes, such as residential mortgage loans and mortgage servicing rights, or "MSRs." We believe that being able to combine Agency RMBS with non-Agency RMBS and other residential mortgage and real estate-related asset classes enables us to balance a range of mortgage-related risks.
3
We were formed through an initial strategic venture among affiliates of Ellington, an investment management firm and registered investment adviser with a 19-year history of investing in a broad spectrum of mortgage-backed securities, or "MBS," and related derivatives, and the Blackstone Funds. These initial investors made an aggregate investment of approximately $31.5 million in us on September 25, 2012. On May 6, 2013, we closed our initial public offering of our common shares of beneficial interest, $0.01 par value per share, or "common shares," pursuant to which we sold 6,450,000 of our common shares to the public at a price of $20.00 per share. Concurrent with the initial public offering, we completed a private placement with our initial investors which generated gross proceeds of $21.0 million. In connection with the private placement, we issued 1,050,000 common shares, also at a price of $20.00 per share. Total gross proceeds from the initial public offering and concurrent private placement were $150.0 million. Proceeds, net of offering costs, were approximately $148.5 million.
We will elect and intend to qualify to be taxed as a REIT for U.S. federal income tax purposes and to maintain our exclusion from regulation under the Investment Company Act.
Our Manager and Ellington
We are externally managed and advised by our Manager, an affiliate of Ellington, pursuant to a management agreement. Our Manager was formed solely to serve as our manager and does not have any other clients. In addition, our Manager does not have any employees of its own and instead relies on the employees of Ellington to perform its obligations to us.
The members of our management team are Michael Vranos, founder and Chief Executive Officer of Ellington, who serves as our Co-Chief Investment Officer and as a member of our Board of Trustees; Laurence Penn, Vice Chairman and Chief Operating Officer of Ellington, who serves as our President and Chief Executive Officer and as a member of our Board of Trustees; Mark Tecotzky, a Managing Director of Ellington, who serves as our Co-Chief Investment Officer; Lisa Mumford, who serves as our Chief Financial Officer and Treasurer; Daniel Margolis, General Counsel of Ellington, who serves as our General Counsel; and Jason Frank, Associate General Counsel of Ellington, who serves as our Secretary. Each of these individuals is an officer of our Manager. We currently do not have any employees.
Our Manager is responsible for administering our business activities and day-to-day operations and, pursuant to a services agreement between our Manager and Ellington, relies on the resources of Ellington to support our operations. Ellington has well-established portfolio management resources for each of our targeted asset classes and an established infrastructure supporting those resources. Through our relationship with our Manager, we benefit from Ellington's highly analytical investment processes, broad-based deal flow, extensive relationships in the financial community, financial and capital structuring skills, investment surveillance capabilities, and operational expertise. Ellington's analytic approach to the investment process involves collection of substantial amounts of data regarding historical performance of RMBS collateral and RMBS market transactions. Ellington analyzes this data to identify possible relationships and trends, and develops financial models used to support the investment and risk management process. In addition, throughout Ellington's 19-year history of investing in RMBS and related derivatives, it has developed strong relationships with a wide range of dealers and other market participants that provide Ellington access to a broad range of trading opportunities and market information. As a result, our Manager is able to provide us with access to a wide variety of asset acquisition and disposition opportunities and information that assist us in making asset management decisions across our targeted asset classes, which we believe provides us with a significant competitive advantage. We also benefit from Ellington's finance, accounting, operations, legal, compliance, and administrative functions.
As of December 31, 2013, Ellington employed over 130 employees and had assets under management of approximately $5.6 billion, of which (i) approximately $4.5 billion was comprised of our company, Ellington Financial LLC, a specialty finance company listed on the NYSE under the ticker "EFC," various hedge funds and other alternative investment vehicles, and (ii) approximately $1.1 billion was comprised of accounts with more traditional mandates.
Our Strategy
We intend to capitalize on the current market opportunity by utilizing an opportunistic strategy that we believe will enable us to generate attractive current yields and risk-adjusted total returns for our shareholders. In particular, our strategy consists of:
|
•
|
utilizing an investment model that focuses on security selection and allocates capital to assets that balance a range of mortgage-related risks;
|
|
•
|
constructing and actively managing a hybrid investment portfolio comprised primarily of Agency RMBS and, to a lesser extent, non-Agency RMBS, designed to:
|
|
•
|
take advantage of opportunities in the Agency RMBS market by acquiring Agency RMBS on a leveraged basis; and
|
4
|
•
|
take advantage of opportunities in the non-Agency residential mortgage market by purchasing investment grade and non-investment grade non-Agency RMBS, including senior and subordinated securities;
|
|
•
|
opportunistically acquiring and managing other mortgage- and real estate-related assets, such as MSRs and residential mortgage loans, that we would hold for appreciation and/or current income; and
|
|
•
|
opportunistically mitigating our interest rate and prepayment risk and, to a lesser extent, credit risk, by using a variety of hedging instruments.
|
Our strategy is adaptable to changing market environments, subject to compliance with the income and other tests that will allow us to qualify and maintain our qualification as a REIT for U.S. federal income tax purposes and to maintain our exclusion from regulation as an investment company under the Investment Company Act. As a result, although we intend to focus on the acquisition and management primarily of Agency RMBS, and to a lesser extent, non-Agency RMBS, residential mortgage loans, and MSRs, our acquisition and management decisions will depend on prevailing market conditions and our targeted asset classes may vary over time in response to market conditions. To the extent that we acquire MSRs, it may be necessary to hold such assets through a taxable REIT subsidiary, or "TRS." As a result, a portion of the income from such assets may be subject to U.S. federal corporate income tax. Our Manager is authorized to follow very broad investment guidelines and, as a result, we cannot predict our portfolio composition. We may change our strategy and policies without a vote of our shareholders. Moreover, although our independent trustees will periodically review our investment guidelines and our portfolio, they generally will not review our proposed asset acquisitions or asset management decisions.
Ellington's investment philosophy primarily revolves around the pursuit of value across various types of MBS and related assets. Ellington seeks investments across a wide range of MBS sectors without any restriction as to ratings, structure, or position in the capital structure. Over time and through market cycles, opportunities will present themselves in varying sectors and in varying forms. By rotating between and allocating among various sectors of the RMBS markets and adjusting the extent to which it hedges interest rate, prepayment, and credit risks, Ellington believes that it will be able to capitalize on the disparities between these RMBS sectors as well as on overall trends in the marketplace, and therefore provide better and more consistent returns. Disparities between RMBS sectors vary from time to time and are driven by a combination of factors. For example, as various RMBS sectors fall in and out of favor, the relative yields that the market demands for those sectors may vary. In addition, Ellington's performance projections for certain sectors may differ from those of other market participants and such disparities will naturally cause us, from time to time, to gravitate towards certain sectors and away from others. Disparities between RMBS sectors and individual securities within such sectors may also be driven by differences in collateral performance, in servicer behavior and in the structure of particular investments (for example, in the timing of cash flows), and our Manager may believe that other market participants are overestimating or underestimating the value of these differences. Furthermore, we believe that risk management, including opportunistic portfolio hedging and prudent financing and liquidity management, is essential for consistent generation of attractive current yields and risk-adjusted total returns.
Ellington's continued emphasis on and development of proprietary RMBS, interest rate, prepayment, and credit models, as well as other proprietary research and analytics, underscores the importance it places on a disciplined and analytical approach to fixed income investing, especially in RMBS. Our Manager uses Ellington's proprietary models to identify attractive assets, value these assets, monitor and forecast the performance of these assets, and (subject to qualifying and maintaining our qualification as a REIT) opportunistically hedge our interest rate risk, mitigate our prepayment risk, and hedge our credit risk. We leverage these skills and resources for purposes of attaining our objectives.
We believe that our Manager is uniquely qualified to implement our strategy. Our strategy is consistent with Ellington's investment approach, which is based on its distinctive strengths in sourcing, analyzing, trading and hedging complex MBS and other mortgage-related products. Furthermore, we believe that Ellington's extensive experience in buying, selling, analyzing,
and structuring fixed income securities, coupled with its broad access to market information and trading flows, provides us with
a steady flow of opportunities to acquire assets with favorable trade executions.
5
Our Targeted Assets
Our targeted asset classes currently include:
|
Asset Class
|
Principal Assets
|
||
|
Agency RMBS
|
ž
|
Agency RMBS collateralized by fixed rate mortgage loans, adjustable rate mortgage loans, or "ARMs," or hybrid mortgage loans, reverse mortgages, or derivatives thereof, including:
|
|
|
ž
|
whole and partial pool mortgage pass-through certificates;
|
||
|
ž
|
Agency collateralized mortgage obligations, or "CMOs," including interest only securities, or "IOs," principal only securities, or "POs," inverse interest only securities, or "IIOs," and inverse floaters; and
|
||
|
ž
|
To-Be-Announced mortgage pass-through certificates, or "TBAs."
|
||
|
Non-Agency RMBS
|
ž
|
RMBS backed by prime jumbo, Alt-A, manufactured housing, and subprime mortgages;
|
|
|
ž
|
RMBS backed by fixed rate mortgages, ARMs, Option-ARMs, and residential mortgage loans that have interest rates that are fixed for a specified period of time (typically three, five, seven, or ten years) and, thereafter, adjust to an increment over a specified interest rate index, or "hybrid ARMs";
|
||
|
ž
|
RMBS backed by first lien and second lien mortgages;
|
||
|
ž
|
Investment grade and non-investment grade securities;
|
||
|
ž
|
Senior and subordinated securities; and
|
||
|
ž
|
Non-Agency CMOs, including IOs, POs, IIOs, and inverse floaters.
|
||
|
Other
|
ž
|
Residential mortgage loans;
|
|
|
ž
|
MSRs; and
|
||
|
ž
|
Other mortgage- and real estate-related assets, including asset-backed securities and certain hedging transactions.
|
||
The following briefly discusses the principal types of assets we purchase.
Agency RMBS
Residential Mortgage Pass-Through Certificates—
Residential mortgage pass-through certificates represent interests in "pools" of mortgage loans secured by residential real property where payments of both interest and principal, plus prepayments, on the underlying residential mortgage loans are made monthly to holders of the certificates, in effect "passing through" monthly payments made by the individual borrowers on the mortgage loans that underlie the securities, net of fees paid to the issuer/guarantor and servicers of the securities.
Collateralized Mortgage Obligations—
CMOs are structured instruments representing interests in specified mortgage loan collateral. CMO securitizations consist of multiple classes, or "tranches," of securities, with each tranche having specified characteristics based on the rules described in the securitization documents governing the division of the monthly principal and interest distributions, including prepayments, from the underlying mortgage collateral among the various tranches. IOs are CMOs that only receive interest payments while POs receive only principal payments.
TBAs—
In addition to investing in specific pools of Agency RMBS, subject to our satisfying the requirements for qualification as a REIT, we utilize forward-settling purchases and sales of Agency RMBS where the underlying pools of mortgage loans are TBAs. Pursuant to these TBA transactions, we agree to purchase or sell, for future delivery, Agency RMBS with certain principal and interest terms and certain types of underlying collateral, but the particular Agency RMBS to be delivered is not identified until shortly before the TBA settlement date. TBAs are generally liquid and have quoted market prices and represent the most actively traded class of RMBS. We use TBAs primarily for hedging purposes. TBA trading is based on the assumption that mortgage pools that are eligible to be delivered at TBA settlement are fungible and thus the specific mortgage pools to be delivered do not need to be explicitly identified at the time a trade is initiated.
We primarily engage in TBA transactions for purposes of managing interest rate risk associated with our liabilities under repurchase agreements. We generally treat such TBA purchases and sales as hedging transactions that hedge indebtedness incurred to acquire or carry real estate assets, or "qualifying liability hedges," for REIT purposes. Alternatively, we may, from time to time, opportunistically engage in TBA transactions because we find them attractive in their own right, from a relative value perspective or otherwise. In accordance with U.S. GAAP, we treat TBAs as derivative transactions.
6
Non-Agency RMBS
We acquire non-Agency RMBS backed by prime jumbo, Alt-A, manufactured housing, and subprime residential mortgage loans. Our non-Agency RMBS holdings can include investment grade and non-investment grade classes, including non-rated classes.
Non-Agency RMBS are debt obligations issued by private originators of, or investors in, residential mortgage loans. Non-Agency RMBS generally are issued as CMOs and are backed by pools of whole mortgage loans or by mortgage pass-through certificates. Non-Agency RMBS generally are in the form of senior/subordinated structures, or in the form of excess spread/over-collateralization structures. In senior/subordinated structures, the subordinated tranches generally absorb all losses on the underlying mortgage loans before any losses are borne by the senior tranches. In excess spread/over-collateralization structures, losses are first absorbed by any existing over-collateralization, then are borne by subordinated tranches and excess spread, which represents the difference between the interest payments received on the mortgage loans backing the RMBS and the interest due on the RMBS debt tranches, and finally are borne by senior tranches and any remaining excess spread.
Other Assets
We also may from time to time opportunistically acquire other mortgage- and real estate-related assets that may include, among others, residential mortgage loans and MSRs.
Our Portfolio
The following tables summarize the Company's portfolio of real estate securities as of December 31, 2013 and 2012:
December 31, 2013:
|
($ in thousands)
|
Gross Unrealized
|
Weighted Average
|
|||||||||||||||||||||||||||
|
Current Principal
|
Unamortized Premium (Discount)
|
Amortized
Cost
|
Gains
|
Losses
|
Fair Value
|
Coupon
|
Yield
|
Weighted Average Life(Years)
(1)
|
|||||||||||||||||||||
|
Agency RMBS:
|
|||||||||||||||||||||||||||||
|
15-year fixed rate mortgages
|
$
|
179,906
|
|
$
|
7,153
|
|
$
|
187,059
|
|
$
|
65
|
|
$
|
(3,252
|
)
|
$
|
183,872
|
|
3.09%
|
2.52%
|
5.76
|
||||||||
|
30-year fixed rate mortgages
|
1,029,629
|
|
41,565
|
|
1,071,194
|
|
490
|
|
(28,111
|
)
|
1,043,573
|
|
3.79%
|
3.30%
|
9.80
|
||||||||||||||
|
ARMs
|
43,525
|
|
2,647
|
|
46,172
|
|
46
|
|
(103
|
)
|
46,115
|
|
4.72%
|
3.24%
|
3.79
|
||||||||||||||
|
Reverse mortgages
|
7,581
|
|
673
|
|
8,254
|
|
16
|
|
(2
|
)
|
8,268
|
|
4.85%
|
2.90%
|
3.41
|
||||||||||||||
|
IOs
|
n/a
|
n/a
|
10,718
|
|
2,841
|
|
(32
|
)
|
13,527
|
|
3.97%
|
11.79%
|
5.02
|
||||||||||||||||
|
Total Agency RMBS
|
1,260,641
|
|
52,038
|
|
1,323,397
|
|
3,458
|
|
(31,500
|
)
|
1,295,355
|
|
3.75%
|
3.26%
|
8.67
|
||||||||||||||
|
Non-Agency RMBS
|
50,006
|
|
(21,327
|
)
|
28,679
|
|
2,196
|
|
(194
|
)
|
30,681
|
|
2.84%
|
9.12%
|
5.54
|
||||||||||||||
|
Total Real Estate Securities
|
$
|
1,310,647
|
|
$
|
30,711
|
|
$
|
1,352,076
|
|
$
|
5,654
|
|
$
|
(31,694
|
)
|
$
|
1,326,036
|
|
3.72%
|
3.38%
|
8.56
|
||||||||
|
(1)
|
Average lives of RMBS are generally shorter than stated contractual maturities. Average lives are affected by the contractual maturities of the underlying mortgages, scheduled periodic payments of principal, and unscheduled prepayments of principal.
|
December 31, 2012:
|
($ in thousands)
|
Gross Unrealized
|
Weighted Average
|
|||||||||||||||||||||||||||
|
Current Principal
|
Unamortized Premium (Discount)
|
Amortized
Cost
|
Gains
|
Losses
|
Fair Value
|
Coupon
|
Yield
|
Weighted Average Life(Years)
(1)
|
|||||||||||||||||||||
|
Non-Agency RMBS
|
$
|
26,890
|
|
$
|
(13,400
|
)
|
$
|
13,490
|
|
$
|
117
|
|
$
|
(11
|
)
|
$
|
13,596
|
|
2.20%
|
8.50%
|
7.80
|
||||||||
|
(1)
|
Average lives of RMBS are generally shorter than stated contractual maturities. Average lives are affected by the contractual maturities of the underlying mortgages, scheduled periodic payments of principal, and unscheduled prepayments of principal.
|
7
The following table summarizes our portfolio of derivative holdings as of December 31, 2013:
|
(In thousands)
|
Fair Value
|
|||
|
Financial derivatives–assets, at fair value:
|
||||
|
TBA securities purchase contracts
|
$
|
1
|
|
|
|
TBA securities sale contracts
|
2,262
|
|
||
|
Fixed payer interest rate swaps
|
32,700
|
|
||
|
Total financial derivatives–assets, at fair value:
|
34,963
|
|
||
|
Financial derivatives–liabilities, at fair value:
|
||||
|
TBA securities sale contracts
|
(28
|
)
|
||
|
Fixed payer interest rate swaps
|
(956
|
)
|
||
|
Swaptions
|
(85
|
)
|
||
|
Total financial derivatives–liabilities, at fair value:
|
(1,069
|
)
|
||
|
Total
|
$
|
33,894
|
|
|
We did not hold any financial derivatives at December 31, 2012.
Investment Process
Our investment process benefits from the resources and professionals of our Manager and Ellington. The process is managed by an investment and risk management committee, which includes, among others, the following three officers of our Manager: Messrs. Vranos, Penn, and Tecotzky. These officers of our Manager also serve as our Co-Chief Investment Officer, President and Chief Executive Officer, and Co-Chief Investment Officer, respectively. The investment and risk management committee operates under investment guidelines and meets periodically to develop a set of preferences for the composition of our portfolio. The primary focus of the investment and risk management committee is to review and approve our investment policies and our portfolio composition and related compliance with our investment policies and guidelines. Under the management agreement between us and our Manager, our Manager has the authority to enter into transactions consistent with our investment guidelines, subject to the oversight of our Board of Trustees. Any transactions deviating in a material way from these guidelines must be approved by our Board of Trustees.
Ellington has a focused investment team for each of our targeted asset classes. Each team evaluates acquisition opportunities consistent with our investment guidelines. Our asset acquisition process includes sourcing and screening of asset acquisition opportunities, credit analysis, due diligence, structuring, financing, and hedging, each as appropriate, to seek attractive current yields and total returns commensurate with our risk tolerance. We also screen and monitor potential asset acquisitions to determine their impact on maintaining our exclusion from regulation as an investment company under the Investment Company Act and our qualification as a REIT.
Valuation of Assets
Our Manager's valuation process is subject to the oversight of our Manager's investment and risk management committees as well as the oversight of the independent members of our Board of Trustees. See "Management's Discussion and Analysis of Financial Condition and Results of Operations —Critical Accounting Policies—Valuation."
Risk Management
Risk management is a cornerstone of Ellington's portfolio management process. Ellington's risk management infrastructure system includes "ELLiN," a proprietary portfolio management system that Ellington uses for its accounts, which provides real-time and batch reporting to all departments at Ellington, including trading, research, risk management, finance, operations, accounting, and compliance. We benefit from Ellington's comprehensive risk management infrastructure and ongoing assessment of both portfolio and operational risks. In addition, we utilize derivatives and other hedging instruments to opportunistically manage our interest rate risk.
Interest Rate Hedging
We opportunistically manage our interest rate risk by using various hedging strategies to mitigate such risks, subject to qualifying and maintaining our qualification as a REIT and maintaining our exclusion from regulation as an investment company under the Investment Company Act. The interest rate hedging instruments that we use and may use in the future include, without limitation:
8
|
•
|
interest rate swaps (floating-to-fixed, fixed-to-floating, or more complex swaps such as floating-to-inverse floating, callable or non-callable);
|
|
•
|
TBAs;
|
|
•
|
CMOs;
|
|
•
|
U.S. Treasury securities;
|
|
•
|
futures and forward contracts; and
|
|
•
|
other derivatives on interest rates, including swaptions and other options on any of the foregoing.
|
Because fluctuations in short-term interest rates may expose us to fluctuations in the spread between the interest we earn on our investments and the interest we pay on our borrowings, we may seek to manage such exposure by entering into short positions in interest rate swaps. An interest rate swap is an agreement to exchange interest rate cash flows, calculated on a notional principal amount, at specified payment dates during the life of the agreement. Typically, one party pays a fixed interest rate and receives a floating interest rate and the other party pays a floating interest rate and receives a fixed interest rate. Each party's payment obligation is computed using a different interest rate. In an interest rate swap, the notional principal is generally not exchanged.
We also utilize TBAs. Pursuant to a TBA transaction, we agree to purchase or sell, for future delivery, Agency RMBS with certain principal and interest terms and certain types of underlying collateral, but the particular Agency RMBS to be delivered is not identified until shortly before the TBA settlement date. We primarily engage in TBA transactions for purposes of managing interest rate risk associated with our liabilities under repurchase agreements. Alternatively, we may, from time to time, opportunistically, engage in TBA transactions because we find them attractive on their own, from a relative value perspective or otherwise. Our ability to engage in TBA transactions may be limited by our intention to qualify and remain qualified as a REIT.
Credit Risk Hedging
Although we do not operate our non-Agency RMBS investment strategy on a credit-hedged basis in general, we may from time to time opportunistically enter into short positions using credit default swaps to protect against adverse credit events with respect to our non-Agency RMBS, subject to qualifying and maintaining our qualification as a REIT and maintaining our exclusion from regulation as an investment company under the Investment Company Act. We may use credit default swaps to hedge non-Agency RMBS credit risk by buying protection on a single non-Agency RMBS or by buying protection on a basket or index of non-Agency RMBS assets. We may also enter into credit default swaps on various MBS indices. We may also enter into other derivative contracts for credit hedging purposes, including contracts referencing the unsecured corporate credit, or the equity of, certain corporations, including indices on corporate debt and equity.
Liquidity Management
As part of the risk management and liquidity management functions that our Manager performs for us, our Manager computes a "cash buffer," which, at any given point in time, represents the amount of our free cash in excess of what our Manager estimates would conservatively be required, especially in times of market dislocation, to support our particular assets and liabilities at such time. Thus, rather than focusing solely on our leverage, our Manager typically seeks to maintain a positive cash buffer. However, our Manager is not required to maintain a positive cash buffer and may choose not to maintain a positive cash buffer at certain times, for example if it believes there are compelling market opportunities to pursue.
Our Financing Strategies and Use of Leverage
We finance our assets with what we believe to be a prudent amount of leverage, which will vary from time to time based upon the particular characteristics of our portfolio, availability of financing and market conditions. As of December 31, 2013, our borrowings consisted solely of repurchase agreements that were collateralized by our Agency RMBS. In a repurchase agreement, we will sell an asset to a counterparty at a discounted value, or the loan amount, and simultaneously agree to repurchase the same asset from such counterparty at a future date at a price equal to the loan amount plus an interest factor. Despite being legally structured as sales and subsequent repurchases, repurchase agreements are accounted for as collateralized borrowings. During the term of a repurchase agreement, we will generally receive the income and other payments distributed with respect to the underlying assets, and pay interest to the counterparty. While the proceeds of our repurchase agreements are often used to purchase the asset subject to the transaction, our financing arrangements do not restrict our ability to use proceeds from these arrangements to support our other liquidity needs. Our repurchase agreement arrangements will typically be documented under the standard form master repurchase agreement of the Securities Industry and Financial Markets Association, with the ability for both parties to request margin (i.e., to demand that the other party post additional collateral or
9
repay a portion of the funds advanced) should the value of the underlying assets and posted collateral change. Given daily market volatility, we and our repurchase agreement counterparties will be required to post additional margin collateral to each other from time to time as part of the normal course of our business. Our repurchase agreement financing counterparties will generally have the right, to varying degrees, to determine the value of the underlying collateral for margining purposes, subject to the terms and conditions of our agreement with the counterparty, including in certain cases our right to dispute the counterparty's valuation determination. As of December 31, 2013, we had approximately $1.3 billion outstanding under repurchase agreements with nine counterparties, and given that we had approximately $167.2 million of shareholders' equity as of December 31, 2013, our debt-to-equity ratio was 7.84 to 1. As of December 31, 2013, the entire amount of our liability under repurchase agreements was related to our Agency RMBS. Our debt-to-equity ratio does not account for liabilities other than debt financings.
We may utilize other types of borrowings in the future, including term facilities or other more complex financing structures. We also may raise capital by issuing unsecured debt, preferred or common shares, or trust preferred securities.
Our use of leverage, especially in order to increase the amount of assets supported by our capital base, may have the effect of increasing losses when these assets underperform. Our investment policies require no minimum or maximum leverage and our Manager's investment and risk management committee has the discretion, without the need for further approval by our Board of Trustees, to change both our overall leverage and the leverage used for individual asset classes. Because our strategy is flexible, dynamic and opportunistic, our overall leverage will vary over time. As a result, we do not have a targeted debt-to-equity ratio.
Management Agreement
Upon our inception in September 2012, we entered into a management agreement with our Manager pursuant to which our Manager provides for the day-to-day management of our operations. The management agreement, which was most recently amended and restated effective March 13, 2014, requires our Manager to manage our business affairs in conformity with policies and investment guidelines that are approved and monitored by our Board of Trustees. Our Manager is subject to the direction and oversight of our Board of Trustees. Our Manager is responsible for, among other things:
|
•
|
the selection, purchase, and sale of our portfolio investments;
|
|
•
|
our financing and risk management activities;
|
|
•
|
providing us with advisory services; and
|
|
•
|
providing us with a management team, inclusive of a dedicated or partially dedicated CFO and appropriate support personnel as necessary.
|
Our Manager is responsible for our day-to-day operations and performs (or causes to be performed) such services and activities relating to our management, operation, and administration of our assets and liabilities, and business as may be
appropriate.
Under the management agreement, we pay our Manager a management fee quarterly in arrears, and we reimburse certain expenses of our Manager.
Although we have not done so to date, if we invest in any other investment fund or other investment for which Ellington or one of its affiliates receives management, origination, or structuring fees, the management fees payable by us to our Manager will be reduced by (or our Manager will otherwise rebate to us) an amount equal to the applicable portion of any such related management, origination, or structuring fees.
Management Fees
Under the management agreement, we pay our Manager a management fee quarterly in arrears in an amount equal to 1.50% per annum of our shareholders' equity, with shareholders' equity being calculated, as of the end of any fiscal quarter, as (a) the sum of (1) the net proceeds from any issuances of common shares or other equity securities of our company or our Operating Partnership (without double counting) since inception, plus (2) our and our Operating Partnership's (without double counting) retained earnings or accumulated deficit calculated in accordance with U.S Generally Accepted Accounting Principles, or "U.S. GAAP," at the end of the most recently completed fiscal quarter (without taking into account any non-cash equity compensation expense incurred in current or prior periods), less (b) any amount that we or our Operating Partnership has paid to repurchase our common shares, limited partnership interests in our Operating Partnership, or other equity securities since inception. Shareholders' equity excludes (1) any unrealized gains or losses or non-cash equity compensation expenses that have impacted shareholders' equity as reported in our financial statements prepared in accordance with U.S. GAAP, regardless of whether such items are included in net income, and (2) one-time events pursuant to changes in U.S. GAAP and certain non-
10
cash items not otherwise described above in each case, after discussions between our Manager and our independent trustees and approval by a majority of our independent trustees. Our shareholders' equity, for purposes of calculating the management fee, could be greater or less than the amount of shareholders' equity shown on our financial statements.
Reimbursement of Expenses
We do not maintain an office or employ personnel. We rely on the facilities and resources of our Manager to conduct our operations. We pay all of our direct operating expenses, except those specifically required to be borne by our Manager under the management agreement. Our Manager is responsible for all costs incident to the performance of its duties under the management agreement, including compensation of our Manager's employees and other related expenses, other than our allocable portion of the costs incurred by our Manager for certain dedicated or partially dedicated employees including a Chief Financial Officer, one or more controllers, an in-house counsel, and certain internal audit staff in connection with Sarbanes-Oxley compliance initiatives, based on the portion of their working time and efforts spent on our matters and subject to approval of the reimbursed amounts by the Compensation Committee of our Board of Trustees. In addition, other than as expressly described in the management agreement, we are not required to pay any portion of rent, telephone, utilities, office furniture, equipment, machinery, and other office, internal and overhead expenses of our Manager and its affiliates. Expense reimbursements to our Manager are made within 60 days following delivery of the expense statement by our Manager.
Term and Termination
The initial term of the management agreement will expire in September 2017 and will be automatically renewed for a one-year term on such date and on each anniversary of such date thereafter unless terminated as described below.
Either we or our Manager may elect not to renew the management agreement upon expiration of its initial term or any renewal term by providing written notice of non-renewal at least 180 days, but not more than 270 days, before expiration. In the event we elect not to renew the term, we will be required to pay our Manager a termination fee equal to 5% of our shareholders' equity as of the end of the month preceding the date on which the term of the management agreement expires. No termination fee will be due to the Manager if the Manager decides not to renew the management agreement.
We have the right to terminate the management agreement for cause, as defined in the management agreement, at any time during the term upon 30 days' prior written notice, without payment of any termination fee.
Our Board of Trustees reviews our Manager's performance annually and, as a result of such review, upon the affirmative vote of at least two-thirds of the members of our Board of Trustees or of the holders of a majority of our outstanding common shares, we may terminate the management agreement based upon a determination by our independent trustees that our Manager's performance has been unsatisfactory and materially detrimental to us or a determination by our independent trustees that the management fees payable to our Manager are not fair, subject to the right of our Manager to prevent such a termination by agreeing to a reduction of the management fees payable to our Manager. Upon any termination of the management agreement based on unsatisfactory performance or unfair management fees, we are required to pay our Manager the termination fee described above.
Our Manager may terminate the management agreement, without payment of the termination fee, in the event we become regulated as an investment company under the Investment Company Act. Our Manager may also terminate the management agreement upon 60 days written notice if we default in the performance of any material term of the management agreement and the default continues for a period of 30 days after written notice to us, whereupon we would be required to pay our Manager the termination fee described above.
Our Manager may generally only assign the management agreement with the written approval of a majority of our independent trustees. However, our Manager may assign to one or more of its affiliates the performance of any of its responsibilities under the management agreement without the approval of our independent trustees so long as our Manager remains liable for any such affiliate's performance and such assignment does not require our approval under the Investment Advisers Act of 1940, as amended, or the "Advisers Act."
Conflicts of Interest; Equitable Allocation of Opportunities
Ellington manages various other clients that have strategies that are similar to, or overlap with, our strategy, including Ellington Financial LLC, a specialty finance company listed on the NYSE. As of December 31, 2013, Ellington managed various funds, accounts, and other vehicles that have strategies that are similar to, or that overlap with, our strategy, that had approximately $5.5 billion of total assets under management, excluding our assets but including $1.1 billion of accounts with more traditional mandates. Ellington makes available to our Manager all opportunities to acquire assets that it determines, in its reasonable and good faith judgment, based on our objectives, policies and strategies, and other relevant factors, to be
11
appropriate for us in accordance with Ellington's written investment allocation policy, subject to the exception that we might not participate in each such opportunity, but will on an overall basis equitably participate with Ellington's other accounts in all such opportunities. Ellington's investment and risk management committee and its compliance committee (headed by its Chief Compliance Officer) are responsible for monitoring the administration of, and facilitating compliance with, Ellington's investment allocation procedures and policies.
Because the Agency pass-through certificates, Agency and non-Agency CMOs, and certain other asset classes in which we invest are typically available only in specified quantities and are also targeted assets for certain other Ellington accounts, Ellington often is not able to buy as much of any given asset as required to satisfy the needs of all its accounts. In these cases, Ellington's investment allocation procedures and policies typically allocate such assets to multiple accounts in proportion to their needs and available capital. Ellington may at times allocate opportunities on a preferential basis to accounts that are in a "start-up" or "ramp-up" phase. The policies permit departure from such proportional allocation under certain other circumstances, for example when such allocation would result in an inefficiently small amount of the security being purchased for an account. In that case, the policies allow for a protocol of allocating assets so that, on an overall basis, each account is treated equitably. In addition, as part of these policies, we may be excluded from specified allocations of assets for tax, regulatory, risk management, or similar reasons.
Other policies of Ellington that our Manager applies to the management of our company include controls for:
|
•
|
Cross Transactions—
defined as transactions between us or one of our subsidiaries, on the one hand, and an account (other than us or one of our subsidiaries) managed by Ellington or our Manager, on the other hand. It is Ellington's policy to engage in a cross transaction only when the transaction is in the best interests of, and is consistent with the objectives and policies of, both accounts involved in the transaction. Pursuant to the terms of the management agreement, our Manager may enter into cross transactions where it acts on our behalf and where Ellington or our Manager acts on behalf of the other party to the transaction; provided, however, that our Manager will not enter into any cross transactions on our behalf unless the cross transaction involves a "level one" asset for GAAP accounting purposes which is being crossed at market prices, or the cross transaction has received approval of a majority of our independent trustees. Although we believe such restrictions on our Manager's ability to engage in cross transactions on our behalf mitigate many risks, cross transactions, even at market prices, may potentially create a conflict of interest between our Manager's and our officers' duties to and interests in us and their duties to and interests in the other party. Subject to our Board of Trustees authorizing such action and upon written notice to our Manager, we may at any time revoke our consent to our Manager's executing cross transactions. Additionally, unless approved in advance by a majority of our independent trustees or pursuant to and in accordance with a policy that has been approved by a majority of our independent trustees, all cross transactions must be effected at the then-prevailing market prices. Pursuant to our Manager's current policies and procedures, assets for which there are no readily observable market prices may be purchased or sold in cross transactions (i) at prices based upon third-party bids received through auction, (ii) at the average of the highest bid and lowest offer quoted by third-party dealers, or (iii) according to another pricing methodology approved by our Manager's Chief Compliance Officer.
|
|
•
|
Principal Transactions—
defined as transactions between Ellington or our Manager (or any related party of Ellington or our Manager, which includes employees of Ellington and our Manager and their families), on the one hand, and us or one of our subsidiaries, on the other hand. Certain cross transactions may also be considered principal transactions whenever our Manager or Ellington (or any related party of Ellington or our Manager, which includes employees of Ellington and our Manager and their families) have a substantial ownership interest in one of the transacting parties. Our Manager is only authorized to execute principal transactions with the prior approval of a majority of our independent trustees and in accordance with applicable law. Such prior approval includes approval of the pricing methodology to be used, including with respect to assets for which there are no readily observable market prices.
|
|
•
|
Investment in Other Ellington Accounts—
pursuant to our management agreement, if we invest in any other investment fund or other investment for which Ellington or one of its affiliates receives management, origination, or structuring fees, the management fee payable by us to our Manager will be reduced by an amount equal to the applicable portion (as described in the management agreement) of any such management, origination, or structuring fees.
|
|
•
|
Split Price Executions—
pursuant to our management agreement, our Manager is authorized to combine purchase or sale orders on our behalf together with orders for other accounts managed by Ellington, our Manager or their affiliates and allocate the securities or other assets so purchased or sold, on an average price basis or other fair and consistent basis, among such accounts.
|
To date, we have not entered into any cross transactions with other Ellington-managed accounts or principal transactions with Ellington, or invested in other Ellington accounts
12
Our Manager is authorized to follow very broad investment guidelines. Our independent trustees will periodically review our investment guidelines and our portfolio. However, our independent trustees generally will not review our proposed asset acquisitions, dispositions, or other management decisions. In addition, in conducting periodic reviews, our independent trustees will rely primarily on information provided to them by our Manager. Furthermore, our Manager may arrange for us to use complex strategies or to enter into complex transactions that may be difficult or impossible to unwind by the time they are reviewed by our independent trustees. Our Manager has great latitude within our broad investment guidelines to determine the types of assets it may decide are proper for purchase by us. The management agreement with our Manager does not restrict the ability of its officers and employees from engaging in other business ventures of any nature, whether or not such ventures are competitive with our business. We may acquire assets from entities affiliated with our Manager, even where the assets were originated by such entities. Affiliates of our Manager may also provide services to entities in which we have invested.
Our executive officers and the officers and employees of our Manager are also officers and employees of Ellington, and we compete with other Ellington accounts for access to these individuals. We have not adopted a policy that expressly prohibits our trustees, officers, security holders, or affiliates from having a direct or indirect pecuniary interest in any asset to be acquired or disposed of by us or any of our subsidiaries or in any transaction to which we or any of our subsidiaries is a party or has an interest, nor do we have a policy that expressly prohibits any such persons from engaging for their own account in business activities of the types conducted by us. However, our code of business conduct and ethics contains a conflicts of interest policy that prohibits our trustees, officers, and employees, as well as employees of our Manager who provide services to us, from engaging in any transaction that involves an actual or apparent conflict of interest with us, absent approval by the Board of Trustees or except as expressly set forth above or as provided in the management agreement between us and our Manager. In addition, nothing in the management agreement binds or restricts our Manager or any of its affiliates, officers, or employees from buying, selling, or trading any securities or commodities for their own accounts or for the accounts of others for whom our Manager or any of its affiliates, officers, or employees may be acting.
Competition
In acquiring our assets, we compete with other mortgage REITs, specialty finance companies, savings and loan associations, banks, mortgage bankers, insurance companies, mutual funds, institutional investors, investment banking firms, financial institutions, governmental bodies, and other entities. Many of our competitors are significantly larger than us, have greater access to capital and other resources, and may have other advantages over us. Our competitors may include other investment vehicles managed by Ellington or its affiliates, including Ellington Financial LLC (NYSE: EFC). In addition to existing companies, other companies may be organized for similar purposes, including companies focused on purchasing mortgage assets. A proliferation of such companies may increase the competition for equity capital and thereby adversely affect the market price of our common shares. An increase in the competition for sources of funding could adversely affect the availability and cost of financing, and thereby adversely affect the market price of our common shares. In addition, some of our competitors may have higher risk tolerances or different risk assessments, which could allow them to consider a wider variety of assets, or pay higher prices, than we can.
Additionally, we may have fewer opportunities to purchase assets meeting our objectives to the extent the U.S. Federal Reserve and the U.S. Treasury purchase such assets pursuant to their various purchase programs.
In the face of this competition, we believe that our access to our Manager's and Ellington's professionals and their industry expertise may provide us with a competitive advantage, including helping us to identify appropriate assets for acquisition and the appropriate prices to pay for such assets, and thereby to compete more effectively for attractive asset acquisition opportunities. However, we may not be able to achieve our business goals or expectations as a result of the competitive risks that we face.
Operating and Regulatory Structure
Tax Requirements
We will elect and intend to qualify to be taxed as a REIT under the Internal Revenue Code of 1986, as amended, or "the Code," commencing with our short taxable year from May 1, 2013 to December 31, 2013. Provided that we qualify and maintain our qualification as a REIT, we generally will not be subject to U.S. federal income tax on our REIT taxable income that is currently distributed to our shareholders. REITs are subject to a number of organizational and operational requirements, including a requirement that they currently distribute at least 90% of their annual REIT taxable income excluding net capital gains. We cannot assure you that we will be able to comply with such requirements in the future. Failure to qualify as a REIT in any taxable year would cause us to be subject to U.S. federal income tax on our taxable income at regular corporate rates (and any applicable state and local taxes). Even if we qualify for taxation as a REIT, we may be subject to certain federal, state, local, and non-U.S. taxes on our income. For example, if we form a TRS, the income generated by that subsidiary will be subject to U.S. federal, state, and local income tax.
13
Investment Company Act Exclusion
We believe that we conduct our operations so that neither we nor any of our subsidiaries are subject to regulation under the Investment Company Act. Both we and our Operating Partnership are organized as holding companies and conduct our businesses primarily through wholly-owned subsidiaries of our Operating Partnership. We believe that we conduct our operations so that neither we nor our Operating Partnership come within the definition of an investment company by ensuring that less than 40% of the value of our total assets on an unconsolidated basis consist of "investment securities" as defined by the Investment Company Act, or "the 40% Test."
Our Operating Partnership's direct and indirect subsidiaries, through which we operate our business, rely upon certain exclusions from the definition of investment company under the Investment Company Act including, in the case of our Operating Partnership's wholly-owned subsidiary, EARN Mortgage LLC, Section 3(c)(5)(C) of the Investment Company Act. Section 3(c)(5)(C), as interpreted by the staff of the SEC, requires an entity to invest at least 55% of its assets in "mortgages and other liens on and interests in real estate," which we refer to as "qualifying real estate interests," and at least 80% of its assets in qualifying real estate interests plus "real estate-related assets." In satisfying the 55% requirement, the entity may treat securities issued with respect to an underlying pool of mortgage loans in which it holds all of the certificates issued by the pool as qualifying real estate interests. We treat the whole-pool pass-through securities in which we invest as qualifying real estate interests for purposes of the 55% requirement. The CMOs we acquire will not be treated as qualifying real estate interests for purposes of the 55% requirement.
We also have formed, and may in the future form, certain other wholly-owned or majority-owned subsidiaries that will invest in CMOs and, subject to our investment guidelines, other real estate-related assets. These subsidiaries will rely upon the exclusion from the definition of investment company under the Investment Company Act pursuant to Section 3(c)(1) or 3(c)(7) of the Investment Company Act. The securities issued by any wholly-owned or majority-owned subsidiary that we may form in the future and that are excluded from the definition of "investment company" based on Section 3(c)(1) or 3(c)(7) of the Investment Company Act, together with any other investment securities we may own, may not have a value in excess of 40% of the value of our total assets on an unconsolidated basis.
We monitor our compliance with the 40% Test and the holdings of our subsidiaries to ensure that each of our subsidiaries is in compliance with an applicable exemption or exclusion from registration as an investment company under the Investment Company Act.
On August 31, 2011, the SEC published a concept release entitled "Companies Engaged in the Business of Acquiring Mortgages and Mortgage Related Instruments" (Investment Company Act Rel. No. 29778). This release notes that the SEC is reviewing the 3(c)(5)(C) exclusion relied upon by companies similar to us that invest in mortgage loans and mortgage-backed securities. There can be no assurance that the laws and regulations governing the Investment Company Act status of companies similar to ours, or the guidance from the Division of Investment Management of the SEC staff regarding the treatment of assets as qualifying real estate assets or real estate-related assets, will not change in a manner that adversely affects our operations as a result of this review. To the extent that the SEC staff provides more specific guidance regarding any of the matters bearing upon our exclusion from the need to register under the Investment Company Act, we may be required to adjust our strategy accordingly. Any additional guidance from the SEC staff could provide additional flexibility to us, or it could further inhibit our ability to pursue the strategies that we have chosen. Furthermore, although we monitor the assets of EARN Mortgage LLC regularly, there can be no assurance that EARN Mortgage LLC will be able to maintain this exclusion from registration. In that case, our investment in EARN Mortgage LLC would be classified as an investment security, and we might not be able to maintain our overall exclusion from registering as an investment company under the Investment Company Act.
The loss of our exemption from regulation pursuant to the Investment Company Act could require us to restructure our operations, sell certain of our assets, or abstain from the purchase of certain assets, which could have an adverse effect on our financial condition and results of operations. See "—Risk Factors—Maintenance of our exclusion from regulation as an investment company under the Investment Company Act imposes significant limitations on our operations."
Investment Advisers Act of 1940
Both Ellington and our Manager are registered as investment advisers under the Advisers Act and are subject to the regulatory oversight of the Investment Management Division of the SEC.
Staffing
We currently do not have any employees. All of our executive officers, and our partially dedicated personnel which include our Chief Financial Officer, controllers, in-house legal counsel and internal audit staff, are employees of Ellington or one or more of its affiliates. See "—Management Agreement" above.
14
Additional Information
A copy of this Annual Report on Form 10-K, as well as our Quarterly Reports on Form 10-Q, Current Reports on Form 8-K and any amendments to such reports filed or furnished pursuant to Section 13(a) or 15(d) of the Securities Exchange Act of 1934, as amended, are available, free of charge, on our internet website at
www.earnreit.com
. All of these reports are made available on our internet website as soon as reasonably practicable after they are electronically filed with or furnished to the SEC. Our Corporate Governance Guidelines and Code of Business Conduct and Ethics and the charters of the Audit, Compensation and Nominating and Corporate Governance Committees of our Board of Trustees are also available at
www.earnreit.com
and are available in print to any shareholder upon request in writing to Ellington Residential Mortgage REIT, c/o Investor Relations, 53 Forest Avenue, Old Greenwich, CT 06870. The information on our website is not, and shall not be deemed to be, a part of this report or incorporated into any other filing we make with the SEC.
All reports filed with the SEC may also be read and copied at the SEC's public reference room at 100 F Street, N.E., Washington, D.C. 20549. Further information regarding the operation of the public reference room may be obtained by calling 1-800-SEC-0330. In addition, all of our reports filed with or furnished to the SEC can be obtained at the SEC's website at
www.sec.gov
.
If
any of the following risks occurs, our business, financial condition or results of operations could be materially and adversely affected. The risks and uncertainties described below are not the only ones we face. Additional risks and uncertainties not presently known to us, or not presently deemed material by us, may also impair our operations and performance. In connection with the forward-looking statements that appear in our periodic reports on Form 10-Q and Form 10-K, our Current Reports on Form 8-K and our other disclosure documents, you should also carefully review the cautionary statements referred to in such reports and other disclosure documents referred to under "Special Note Regarding Forward-Looking Statements."
Risks Related To Our Business
We have a limited operating history and may not be able to operate our business successfully or generate sufficient revenue to make or sustain dividends to our shareholders.
We commenced operations beginning in September 2012 and completed our initial public offering in May 2013. As a result, we have a limited operating history. We cannot assure you that we will be able to operate our business successfully or implement our operating policies and strategies. The results of our operations depend on several factors, including the availability of opportunities for the acquisition of targeted assets, the level and volatility of interest rates, the availability of adequate short and long-term financing, conditions in the financial markets and general economic conditions.
The federal conservatorship of Fannie Mae and Freddie Mac and related efforts, along with any changes in laws and regulations affecting the relationship between Fannie Mae, Freddie Mac, and Ginnie Mae and the U.S. Government, may materially adversely affect our business, financial condition and results of operations, and our ability to pay dividends to our shareholders.
The payments we receive on our Agency RMBS depend upon a steady stream of payments on the underlying mortgages and such payments are guaranteed by Fannie Mae, Freddie Mac, or Ginnie Mae. Fannie Mae and Freddie Mac are government-sponsored enterprises, or "GSEs," but their guarantees are not backed by the full faith and credit of the United States. Ginnie Mae, which guarantees MBS backed by federally insured or guaranteed loans primarily consisting of loans insured by the Federal Housing Administration, or "FHA," or guaranteed by the Department of Veterans Affairs, or "VA," is part of a U.S. Government agency and its guarantees are backed by the full faith and credit of the United States.
During 2008, there were increased market concerns about Fannie Mae's and Freddie Mac's ability to withstand future credit losses associated with securities held in their investment portfolios, and on which they provide guarantees, without the direct support of the U.S. Government. In September 2008, Fannie Mae and Freddie Mac were placed into the conservatorship of the Federal Housing Finance Agency, or "FHFA," their federal regulator, pursuant to its powers under The Federal Housing Finance Regulatory Reform Act of 2008, a part of the Housing and Economic Recovery Act of 2008. Under this conservatorship, Fannie Mae and Freddie Mac are required to reduce the amount of mortgage loans they own or for which they provide guarantees on Agency RMBS.
Shortly after Fannie Mae and Freddie Mac were placed in federal conservatorship, the Secretary of the U.S. Treasury noted that the guarantee structure of Fannie Mae and Freddie Mac required examination and that changes in the structures of the entities were necessary to reduce risk to the financial system. The future roles of Fannie Mae and Freddie Mac could be significantly reduced and the nature of their guarantees could be considerably limited relative to historical measurements or
15
even eliminated. The U.S. Treasury could also stop providing financial support for Fannie Mae and Freddie Mac in the future. The substantial financial assistance provided by the U.S. Government to Fannie Mae and Freddie Mac, especially in the course of their being placed into conservatorship and thereafter, together with the substantial financial assistance provided by the U.S. Government to the mortgage-related operations of other GSEs and government agencies, such as the FHA, VA, and Ginnie Mae, has stirred debate among many federal policymakers over the continued role of the U.S. Government in providing such financial support for the mortgage-related GSEs in particular, and for the mortgage and housing markets in general. In fact, in February 2011, the U.S. Treasury released a white paper entitled "Reforming America's Housing Finance Market" in which the U.S. Treasury outlined three possible options for reforming the U.S. Government's role in housing finance. Under each option, the role of the U.S. Government in the mortgage market would be reduced. On February 21, 2012, the FHFA released its "Strategic Plan for Enterprise Conservatorships," which set forth three goals for the next phase of the Fannie Mae and Freddie Mac conservatorships. These three goals are to (i) build a new infrastructure for the secondary mortgage market, (ii) gradually reduce Fannie Mae and Freddie Mac's presence in the marketplace while simplifying and shrinking their operations, and (iii) maintain foreclosure prevention activities and credit availability for new and refinanced mortgages. In March 2013, the FHFA announced that it was creating a new entity as it reduces the roles of Fannie Mae and Freddie Mac that may serve as a foundational element of the mortgage market in the future. Since the FHFA first released its strategic plan, there have been a number of other proposals introduced, both from industry groups and by the U.S. Congress. The most recent bill in the U.S. Congress to receive serious consideration is the "Housing Finance Reform and Taxpayer Protection Act of 2013." This draft bill, among other things, would eliminate Freddie Mac and Fannie Mae and replace them with a new agency which would provide a financial guarantee that would only be tapped after private institutions and investors stepped in. It remains unclear whether this or any other proposals will become law or, should a proposal become law, if or how the enacted law will differ from the current draft of the bill.
As discussed above, Fannie Mae, Freddie Mac, and Ginnie Mae could each be dissolved and the U.S. Government could determine to stop providing liquidity support of any kind to the mortgage market. If Fannie Mae, Freddie Mac, or Ginnie Mae were eliminated, or their structures were to change radically or the U.S. Government significantly reduced its support for any or all of them, we may be unable or significantly limited in our ability to acquire Agency RMBS, which would drastically reduce the amount and type of Agency RMBS available for purchase which, in turn, could materially adversely affect our ability to maintain our exclusion from regulation as an investment company under the Investment Company Act. Moreover, any changes to the nature of the guarantees provided by, or laws affecting, Fannie Mae, Freddie Mac, and Ginnie Mae could materially adversely affect the credit quality of the guarantees, could increase the risk of loss on purchases of Agency RMBS issued by these GSEs and could have broad adverse market implications for the Agency RMBS they currently guarantee. Any action that affects the credit quality of the guarantees provided by Fannie Mae, Freddie Mac and Ginnie Mae could materially adversely affect the value of our Agency RMBS.
In addition, we rely on our Agency RMBS as collateral for our financings under the repos that we have enter into. Any decline in their value, or perceived market uncertainty about their value, would make it more difficult for us to obtain financing on our Agency RMBS on acceptable terms or at all, or to maintain compliance with the terms of any financing transactions.
Interest rate mismatches between our assets and our borrowings may reduce our income during periods of changing interest rates, and increases in interest rates could adversely affect the value of our assets.
Some of our assets are fixed rate securities or have a fixed rate component (such as RMBS backed by hybrid ARMs). This means that the interest we earn on these assets will not vary over time based upon changes in a short-term interest rate index. Although the interest we earn on our RMBS backed by ARMs generally will adjust for changing interest rates, such interest rate adjustments may not occur as quickly as the interest rate adjustments to any related borrowings, and such interest rate adjustments will generally be subject to interest rate caps, which potentially could cause such RMBS to acquire many of the characteristics of fixed rate securities if interest rates were to rise above the cap levels. We generally fund our fixed rate targeted assets with borrowings whose interest rates reset frequently, and as a result we generally have an interest rate mismatch between our assets and liabilities. While our interest rate hedges are intended to mitigate a portion of this mismatch, the use of interest rate hedges also introduces the risk of other interest rate mismatches and exposures, as will the use of other financing techniques. Additionally, to the extent cash flows from RMBS we hold are reinvested in new RMBS, the spread between the yields of the new RMBS and available borrowing rates may decline, which could reduce our net interest margin or result in losses.
Fixed income assets, including many RMBS, typically decline in value if interest rates increase. If long-term rates increased significantly, not only will the market value of these assets be expected to decline, but these assets could lengthen in duration because borrowers are less likely to prepay their mortgages.
Interest rates are highly sensitive to many factors, including governmental monetary and tax policies, domestic and international economic and political considerations, and other factors beyond our control.
16
Subject to qualifying and maintaining our qualification as a REIT, while we opportunistically hedge our exposure to changes in interest rates, there can be no assurances that our hedges will be successful, or that we will be able to enter into or maintain such hedges. As a result, interest rate fluctuations can cause significant losses, reductions in income, and can limit the cash available to pay dividends to our shareholders.
Certain actions by the U.S. Federal Reserve could materially adversely affect our business, financial condition and results of operations, and our ability to pay dividends to our shareholders.
On September 21, 2011, the U.S. Federal Reserve, or the "Federal Reserve," announced "Operation Twist," a program under which it purchased, by the end of December 2012, more than $650 billion of U.S. Treasury securities with remaining maturities between six and thirty years and sold an equal amount of U.S. Treasury securities with remaining maturities of three years or less. In addition, on September 13, 2012, the Federal Reserve announced a third round of quantitative easing, or "QE3," which is an open-ended program designed to expand the Federal Reserve's holdings of long-term securities by purchasing an additional $40 billion of Agency RMBS per month until key economic indicators show sufficient signs of improvement.
In December 2012, in an effort to keep long-term interest rates at low levels, the Federal Reserve announced an expansion of its asset buying program starting in January 2013, at which time it would commence outright purchases of longer-term U.S. Treasury securities at a pace of $45 billion per month. This new U.S. Treasury securities purchase program replaced "Operation Twist," which expired in December 2012. In December 2013, given indications that the U.S. economy had improved sufficiently, the Federal Reserve announced a $10 billion reduction in its monthly asset purchases beginning in January 2014, with the reduction split evenly between Agency RMBS and U.S. Treasury securities, and it added that it would likely reduce the pace of asset purchases in further measured steps to be announced at future meetings. Late in January 2014, the Federal Reserve announced an additional $10 billion reduction in its monthly asset purchases, beginning in February 2014, with the reduction again split evenly between Agency RMBS and U.S. Treasury securities. Although in the immediate aftermath of the purchase reduction announcements interest rates have actually declined, it remains possible that the precipitous termination of (or even just a phasing out of) Federal Reserve asset purchase programs could cause interest rates to rise substantially. See "—Increases in interest rates could adversely affect the value of our assets and cause our interest expense to increase, and increase the risk of default on our assets which could result in reduced earnings or losses and negatively affect our profitability as well as the cash available for distribution to shareholders." Should the U.S. economy begin to deteriorate, the Federal Reserve could decide to increase its asset purchase program or institute other measures designed to reduce interest rates. These measures could lead to a flattening in the yield curve, increased prepayment rates (resulting from lower long-term interest rates, including mortgage rates), and a narrowing of our net interest margin. The modification or termination by the Federal Reserve of any of its programs could materially adversely affect our business, financial condition and results of operations, and our ability to pay dividends to our shareholders.
Prepayment rates can change, adversely affecting the performance of our assets.
The frequency at which prepayments (including both voluntary prepayments by borrowers and liquidations due to defaults and foreclosures) occur on mortgage loans underlying RMBS is affected by a variety of factors, including the prevailing level of interest rates as well as economic, demographic, tax, social, legal, and other factors. Generally, borrowers tend to prepay their mortgages when prevailing mortgage rates fall below the interest rates on their mortgage loans. When borrowers prepay their mortgage loans at rates that are faster or slower than expected, it results in prepayments that are faster or slower than expected on the related RMBS. These faster or slower than expected payments may adversely affect our profitability.
We may purchase securities or loans that have a higher interest rate than the then-prevailing market interest rate. In exchange for this higher interest rate, we may pay a premium to par value to acquire the security or loan. In accordance with U.S. GAAP, we amortize this premium as an expense over the expected term of the security or loan based on our prepayment assumptions. If a security or loan is prepaid in whole or in part at a faster than expected rate, however, we must expense all or a part of the remaining unamortized portion of the premium that was paid at the time of the purchase, which will adversely affect our profitability.
We also may purchase securities or loans that have a lower interest rate than the then-prevailing market interest rate. In exchange for this lower interest rate, we may pay a discount to par value to acquire the security or loan. We accrete this discount as income over the expected term of the security or loan based on our prepayment assumptions. If a security or loan is prepaid at a slower than expected rate, however, we must accrete the remaining portion of the discount at a slower than expected rate. This will extend the expected life of investment portfolio and result in a lower than expected yield on securities and loans purchased at a discount to par.
17
Prepayment rates generally increase when interest rates fall and decrease when interest rates rise. Since many RMBS, especially fixed rate RMBS, will be discount securities when interest rates are high, and will be premium securities when interest rates are low, these RMBS may be adversely affected by changes in prepayments in any interest rate environment. Prepayment rates are also affected by factors not directly tied to interest rates, and are difficult to predict. Prepayments can also occur when borrowers sell their properties, or when borrowers default on their mortgages and the mortgages are prepaid from the proceeds of a foreclosure sale of the underlying property and/or from the proceeds of a mortgage insurance policy or other guarantee. Fannie Mae and Freddie Mac will generally, among other conditions, purchase mortgages that are 120 days or more delinquent from the Agency RMBS pools that they have issued when the cost of guaranteed payments to security holders, including advances of interest at the security coupon rate, exceeds the cost of holding the non-performing loans in their portfolios. Consequently, prepayment rates also may be affected by conditions in the housing and financial markets, which may
result in increased delinquencies on mortgage loans. Prepayment rates can also be affected by actions of the GSEs and their
cost of capital, general economic conditions, and the relative interest rates on fixed and adjustable rate loans. Additionally,
changes in the GSEs' decisions as to when to repurchase delinquent loans can materially impact prepayment rates on Agency
RMBS.
The adverse effects of prepayments may impact us in various ways. First, particular investments may experience outright losses, as in the case of IOs and IIOs in an environment of faster actual or anticipated prepayments. Second, particular investments may underperform relative to any hedges that our Manager may have constructed for these assets, resulting in a loss to us. In particular, prepayments (at par) may limit the potential upside of many RMBS to their principal or par amounts, whereas their corresponding hedges often have the potential for unlimited loss. Furthermore, to the extent that faster prepayment rates are due to lower interest rates, the principal payments received from prepayments will tend to be reinvested in lower-yielding assets, which may reduce our income in the long run. Therefore, if actual prepayment rates differ from anticipated prepayment rates our business, financial condition and results of operations and ability to pay dividends to our shareholders could be materially adversely affected.
Interest rate caps on the ARMs and hybrid ARMs that back our RMBS may reduce our net interest margin during periods of rising interest rates.
ARMs and hybrid ARMs are typically subject to periodic and lifetime interest rate caps. Periodic interest rate caps limit the amount an interest rate can increase during any given period. Lifetime interest rate caps limit the amount an interest rate can increase through the maturity of the loan. Our borrowings typically are not subject to similar restrictions. Accordingly, in a period of rapidly increasing interest rates, our financing costs could increase without limitation while caps could limit the interest we earn on our RMBS backed by ARMs and hybrid ARMs. This problem is magnified for ARMs and hybrid ARMs that are not fully indexed because such periodic interest rate caps prevent the coupon on the security from fully reaching the specified rate in one reset. Further, some ARMs and hybrid ARMs may be subject to periodic payment caps that result in a portion of the interest being deferred and added to the principal outstanding. As a result, we may receive less cash income on RMBS backed by ARMs and hybrid ARMs than necessary to pay interest on our related borrowings. Interest rate caps on RMBS backed by ARMs and hybrid ARMs could reduce our net interest margin if interest rates were to increase beyond the level of the caps, which could materially adversely affect our business, financial condition and results of operations and our ability to pay dividends to our shareholders.
Mortgage loan modification programs and future legislative action may adversely affect the value of, and the returns on, our targeted assets.
The U.S. Government, through the U.S. Treasury, FHA, and the Federal Deposit Insurance Corporation, or "FDIC," commenced implementation of programs designed to provide homeowners with assistance in avoiding mortgage loan foreclosures, including the Home Affordable Modification Program, or "HAMP," which provides homeowners with assistance in mortgage loan foreclosures, the Hope for Homeowners Program, which allows certain distressed borrowers to refinance their mortgages into FHA-insured loans in order to avoid mortgage loan foreclosures, and the Home Affordable Refinance Program, or "HARP," which allows borrowers who are current on their mortgage payments to refinance and reduce their monthly mortgage payments at loan-to-value ratios up to 125% without new mortgage insurance. The programs may involve, among other things, the modification of mortgage loans to reduce the principal amount of the loans or the rate of interest payable on the loans, or to extend the payment terms of the loans.
Loan modification and refinance programs may adversely affect the performance of Agency and non-Agency RMBS. In the case of non-Agency RMBS, a significant number of loan modifications with respect to a given security, including those related to principal forgiveness and coupon reduction, could negatively impact the realized yields and cash flows on such security. In addition, it is also likely that loan modifications would result in increased prepayments on some RMBS. See above "—Prepayment rates can change, adversely affecting the performance of our assets," for information relating to the impact of prepayments on our business.
18
The U.S. Congress and various state and local legislatures are considering, and in the future may consider, mortgage-related legislation that would affect our business, including legislation that would permit limited assignee liability for certain violations in the mortgage loan origination process, and legislation that would allow judicial modification of loan principal in the event of personal bankruptcy. We cannot predict whether or in what form Congress or the various state and local legislatures may enact legislation affecting our business or whether any such legislation will require us to change our practices or make changes in our portfolio in the future. These changes, if required, could materially adversely affect our business, results of operations and financial condition, and our ability to pay dividends to our shareholders, particularly if we make such changes in response to new or amended laws, regulations or ordinances in any state where we acquire a significant portion of our mortgage loans, or if such changes result in us being held responsible for any violations in the mortgage loan origination process.
The existing loan modification programs, together with future legislative or regulatory actions, including possible amendments to the bankruptcy laws, which result in the modification of outstanding residential mortgage loans and/or changes in the requirements necessary to qualify for refinancing mortgage loans with Fannie Mae, Freddie Mac, or Ginnie Mae, may adversely affect the value of, and the returns on, our assets, which could materially adversely affect our business, financial condition and results of operations, and our ability to pay dividends to our shareholders.
Difficult conditions in the mortgage and residential real estate markets as well as general market concerns may adversely affect the value of the assets in which we invest and such conditions may persist for the foreseeable future.
Our business is materially affected by conditions in the residential mortgage market, the residential real estate market, the financial markets, and the economy including inflation, energy costs, unemployment, geopolitical issues, concerns over the creditworthiness of governments worldwide and the stability of the global banking system. In particular, the residential mortgage market in the U.S. has experienced a variety of difficulties and changed economic conditions in the recent past, including defaults, credit losses, and liquidity concerns. Certain commercial banks, investment banks, and insurance companies incurred extensive losses from exposure to the residential mortgage market as a result of these difficulties and conditions. These factors have impacted investor perception of the risks associated with RMBS, other real estate-related securities and various other asset classes in which we may invest. As a result, values for RMBS, other real estate-related securities and various other asset classes in which we may invest have experienced, and may in the future experience, significant volatility.
In the aftermath of the financial crisis, homeowner access to residential mortgage loans has been substantially limited. Lending standards are significantly more stringent than in past periods, and access to many mortgage products has been severely curtailed or eliminated. This financing limitation has had an impact on new demand for homes, has lowered homeownership rates and impacted home price performance. There is a strong correlation between home price depreciation and mortgage loan delinquencies. Any deterioration of the mortgage market and investor perception of the risks associated with RMBS, residential mortgage loans, real estate-related securities, and various other assets that we acquire could materially adversely affect our business, financial condition and results of operations, and our ability to pay dividends to our shareholders.
Our non-Agency RMBS assets include subordinated and lower-rated securities that generally have greater risks of loss than senior and higher-rated securities.
Certain non-Agency RMBS securities that we acquire are deemed by rating agencies to have substantial vulnerability to default in payment of interest and/or principal. Other securities we acquire have the lowest quality ratings or are unrated. Many securities that we acquire are subordinated in cash flow priority to other more "senior" securities of the same securitization. The exposure to defaults on the underlying mortgages is severely magnified in subordinated securities. Certain subordinated securities ("first loss securities") absorb all losses from default before any other class of securities is at risk. Such securities therefore are considered to be highly speculative investments. Also, the risk of declining real estate values, in particular, is amplified in subordinated RMBS, as are the risks associated with possible changes in the market's perception of the entity issuing or guaranteeing them, or by changes in government regulations and tax policies. Accordingly, these securities may experience significant price and performance volatility relative to more senior securities and they are subject to greater risk of loss than more senior securities which, if realized, could materially adversely affect our business, financial condition and results of operations and our ability to pay dividends to our shareholders.
Less stringent underwriting guidelines and the resultant potential for delinquencies or defaults on certain mortgage loans could lead to losses on many of the non-Agency RMBS we hold.
Many, if not most, of the non-Agency RMBS in which we invest are collateralized by Alt-A and subprime mortgage loans, which are mortgage loans that were originated using less stringent underwriting guidelines than those used in underwriting prime mortgage loans (mortgage loans that generally conform to Fannie Mae or Freddie Mac underwriting guidelines). These underwriting guidelines were more permissive as to borrower credit history or credit score, borrower debt-to-income ratio, loan-to-value ratio, and/or as to documentation (such as whether and to what extent borrower income was required to be
19
disclosed or verified). In addition, even when specific underwriting guidelines were represented by loan originators as having been used in connection with the origination of mortgage loans, these guidelines were in many cases not followed as a result of aggressive lending practices, fraud (including borrower or appraisal fraud), or other factors. Mortgage loans that were underwritten pursuant to less stringent or looser underwriting guidelines, or that were poorly underwritten to their stated guidelines, have experienced, and should be expected to experience in the future, substantially higher rates of delinquencies, defaults, and foreclosures than those experienced by mortgage loans that were underwritten in a manner more consistent with Fannie Mae or Freddie Mac guidelines. Thus, because of the higher delinquency rates and losses associated with Alt-A and subprime mortgage loans, the performance of RMBS backed by Alt-A and subprime mortgage loans that we may acquire could be correspondingly adversely affected, which could adversely impact our business, financial condition and results of operations, and our ability to pay dividends to our shareholders.
Investments in second lien mortgage loans could subject us to increased risk of losses.
We may invest in second-lien mortgage loans or RMBS backed by such loans. If a borrower defaults on a second lien mortgage loan or on its senior debt (i.e., a first-lien loan, in the case of a residential mortgage loan), or in the event of a borrower bankruptcy, such loan will be satisfied only after all senior debt is paid in full. As a result, if we invest in second-lien mortgage loans and the borrower defaults, we may lose all or a significant part of our investment.
The principal and interest payments on our non-Agency RMBS are not guaranteed by any entity, including any government entity or GSE, and therefore are subject to increased risks, including credit risk.
Our portfolio includes non-Agency RMBS which are backed by residential mortgage loans that do not conform to the Fannie Mae or Freddie Mac underwriting guidelines, including subprime, manufactured housing, Alt-A, and prime jumbo mortgage loans. Consequently, the principal and interest on non-Agency RMBS, unlike those on Agency RMBS, are not guaranteed by GSEs such as Fannie Mae and Freddie Mac or, in the case of Ginnie Mae, the U.S. Government.
Non-Agency RMBS are subject to many of the risks of the respective underlying mortgage loans. A residential mortgage loan is typically secured by single-family residential property and is subject to risks of delinquency and foreclosure and risk of loss. The ability of a borrower to repay a loan secured by a residential property is dependent upon the income or assets of the borrower. A number of factors, including a general economic downturn, unemployment, acts of God, terrorism, social unrest, and civil disturbances, may impair borrowers' abilities to repay their mortgage loans. In periods following home price declines, "strategic defaults" (decisions by borrowers to default on their mortgage loans despite having the ability to pay) also may become more prevalent.
In the event of defaults under mortgage loans backing any of our non-Agency RMBS, we will bear a risk of loss of principal to the extent of any deficiency between the value of the collateral and the principal and accrued interest of the mortgage loan. Additionally, in the event of the bankruptcy of a mortgage loan borrower, the mortgage loan to such borrower will be deemed to be secured only to the extent of the value of the underlying collateral at the time of bankruptcy (as determined by the bankruptcy court), and the lien securing the mortgage loan will be subject to the avoidance powers of the bankruptcy trustee or debtor-in-possession to the extent the lien is unenforceable under state law. Foreclosure of a mortgage loan can be an expensive and lengthy process which could have a substantial negative effect on our anticipated return on the foreclosed mortgage loan. If borrowers default on the mortgage loans backing our non-Agency RMBS and we are unable to recover any resulting loss through the foreclosure process, our business, financial condition and results of operations and our ability to pay dividends to our shareholders could be materially adversely affected.
Residential mortgage loans, including subprime, non-performing, and sub-performing residential mortgage loans, are subject to increased risks.
We may acquire and manage residential mortgage loans. Residential mortgage loans, including subprime, non-performing, and sub-performing mortgage loans, are subject to increased risk of loss. Unlike Agency RMBS, residential mortgage loans generally are not guaranteed by the U.S. Government or any GSE, though in some cases they may benefit from private mortgage insurance. Additionally, by directly acquiring residential mortgage loans, we do not receive the structural credit enhancements that benefit senior tranches of RMBS. A residential mortgage loan is directly exposed to losses resulting from default. Therefore, the value of the underlying property, the creditworthiness and financial position of the borrower, and the priority and enforceability of the lien will significantly impact the value of such mortgage loan. In the event of a foreclosure, we may assume direct ownership of the underlying real estate. The liquidation proceeds upon sale of such real estate may not be sufficient to recover our cost basis in the loan, and any costs or delays involved in the foreclosure or liquidation process may increase losses.
Residential mortgage loans are also subject to property damage caused by hazards, such as earthquakes or environmental hazards, not covered by standard property insurance policies or "special hazard risk," and to reduction in a borrower's mortgage
20
debt by a bankruptcy court, or "bankruptcy risk." In addition, claims may be assessed against us on account of our position as a mortgage holder or property owner, including assignee liability, responsibility for tax payments, environmental hazards, and other liabilities. In some cases, these liabilities may be "recourse liabilities" or may otherwise lead to losses in excess of the purchase price of the related mortgage or property.
To the extent that due diligence is conducted on potential assets, such due diligence may not reveal all of the risks associated with such assets and may not reveal other weaknesses in such assets, which could lead to losses.
Before making an investment, our Manager may decide to conduct (either directly or using third parties) certain due diligence. There can be no assurance that our Manager will conduct any specific level of due diligence, or that, among other things, our Manager's due diligence processes will uncover all relevant facts or that any purchase will be successful, which could result in losses on these assets, which, in turn, could adversely affect our business, financial condition and results of operations, and our ability to pay dividends to our shareholders.
We rely on mortgage servicers for our loss mitigation efforts, and we also may engage in our own loss mitigation efforts with respect to whole mortgage loans we may purchase. Such loss mitigation efforts may be unsuccessful or not cost effective.
We depend on a variety of services provided by third-party service providers related to our non-Agency RMBS and whole mortgage loans we may acquire. We rely on the mortgage servicers who service the mortgage loans backing our non-Agency RMBS to, among other things, collect principal and interest payments on the underlying mortgages and perform loss mitigation services. Our mortgage servicers and other service providers to our non-Agency RMBS, such as trustees, bond insurance providers and custodians, may not perform in a manner that promotes our interests. In addition, legislation that has been enacted or that may be enacted in order to reduce or prevent foreclosures through, among other things, loan modifications, may reduce the value of mortgage loans backing our non-Agency RMBS or whole mortgage loans that we acquire. Mortgage servicers may be incentivized by the U.S. Government to pursue such loan modifications, as well as forbearance plans and other actions intended to prevent foreclosure, even if such loan modifications and other actions are not in the best interests of the beneficial owners of the mortgage loans. In addition to legislation that creates financial incentives for mortgage loan servicers to modify loans and take other actions that are intended to prevent foreclosures, legislation has also been adopted that creates a safe harbor from liability to creditors for servicers that undertake loan modifications and other actions that are intended to prevent foreclosures. Finally, recent laws delay the initiation or completion of foreclosure proceedings on specified types of residential mortgage loans or otherwise limit the ability of mortgage servicers to take actions that may be essential to preserve the value of the mortgage loans underlying the mortgage servicing rights. Any such limitations are likely to cause delayed or reduced collections from mortgagors and generally increase servicing costs. As a result of these legislative actions, the mortgage loan servicers on which we rely may not perform in our best interests or up to our expectations. If our third-party service providers including mortgage servicers do not perform as expected, our business, financial condition and results of operations and our ability to pay dividends to our shareholders may be materially adversely affected.
In addition, if we purchase pools of whole mortgage loans, we may engage in our own loss mitigation efforts over and above the efforts of the mortgage servicers, including more hands-on mortgage servicer oversight and management, borrower refinancing solicitations, as well as other efforts. Our loss mitigation efforts may be unsuccessful in limiting delinquencies, defaults and losses, or may not be cost effective, which may materially adversely affect our business, financial condition and results of operations and our ability to pay dividends to our shareholders.
We may be affected by deficiencies in foreclosure practices of third parties, as well as related delays in the foreclosure process.
One of the biggest risks overhanging the RMBS market has been uncertainty around the timing and ability of servicers to foreclose on defaulted loans, so that they can liquidate the underlying properties and ultimately pass the liquidation proceeds through to RMBS holders. Given the magnitude of the housing crisis, and in response to the well-publicized failures of many servicers to follow proper foreclosure procedures (such as involving "robo-signing"), mortgage servicers are being held to much higher foreclosure-related documentation standards than they previously were. However, because many mortgages have been transferred and assigned multiple times (and by means of varying assignment procedures) throughout the origination, warehouse, and securitization processes, mortgage servicers are generally having much more difficulty furnishing the requisite documentation to initiate or complete foreclosures. This leads to stalled or suspended foreclosure proceedings, and ultimately additional foreclosure-related costs. Foreclosure-related delays also tend to increase ultimate loan loss severities as a result of property deterioration, amplified legal and other costs, and other factors. Many factors delaying foreclosure, such as borrower lawsuits and judicial backlog and scrutiny, are outside of a servicer's control and have delayed, and will likely continue to delay, foreclosure processing in both judicial states (where foreclosures require court involvement) and non-judicial states. The extension of foreclosure timelines also increases the inventory backlog of distressed homes on the market and creates greater uncertainty about housing prices. The concerns about deficiencies in foreclosure practices of servicers and related delays in the
21
foreclosure process may impact our loss assumptions and affect the values of, and our returns on, our investments in RMBS and residential whole loans.
Sellers of the mortgage loans that underlie the non-Agency RMBS in which we invest may be unable to repurchase defective mortgage loans, which could have a material adverse effect on the value of the loans held by the trust that issued the RMBS and could cause shortfalls in the payments due on the RMBS.
Sellers of mortgage loans to the trusts that issued the non-Agency RMBS in which we invest made various representations and warranties related to the mortgage loans sold by them to the trusts that issued the RMBS. If a seller fails to cure a material breach of its representations and warranties with respect to any mortgage loan in a timely manner, then the trustee or the servicer of the loans may have the right to require that the seller repurchase the defective mortgage loan (or in some cases substitute a performing mortgage loan). It is possible, however, that for financial or other reasons, the seller either may not be capable of repurchasing defective mortgage loans, or may dispute the validity of or otherwise resist its obligation to repurchase defective mortgage loans. The inability or unwillingness of a seller to repurchase defective mortgage loans from a non-Agency RMBS trust in which we invest would likely cause higher rates of delinquencies, defaults and losses for the mortgage loans backing such non-Agency RMBS, and ultimately greater losses for our investment in such non-Agency RMBS.
If we acquire and subsequently resell any whole mortgage loans, we may be required to repurchase such loans or indemnify investors if we breach representations and warranties.
If we acquire and subsequently resell any whole mortgage loans, we would generally be required to make customary representations and warranties about such loans to the loan purchaser. Our residential mortgage loan sale agreements and terms of any securitizations into which we sell loans will generally require us to repurchase or substitute loans in the event we breach a representation or warranty given to the loan purchaser. In addition, we may be required to repurchase loans as a result of borrower fraud or in the event of early payment default on a mortgage loan. The remedies available to a purchaser of mortgage loans are generally broader than those available to us against an originating broker or correspondent. Repurchased loans are typically worth only a fraction of the original price. Significant repurchase activity could materially adversely affect our business, financial condition and results of operations, and our ability to pay dividends to our shareholders.
We could be subject to liability for potential violations of predatory lending laws, which could materially adversely affect our business, financial condition and results of operations, and our ability to pay dividends to our shareholders.
Residential mortgage loan originators and servicers are required to comply with various federal, state and local laws and regulations, including anti-predatory lending laws and laws and regulations imposing certain restrictions on requirements on high cost loans. Failure of residential mortgage loan originators or servicers to comply with these laws, to the extent any of their residential mortgage loans become part of our mortgage-related assets, could subject us, as an assignee or purchaser of the related residential mortgage loans, to monetary penalties and could result in the borrowers rescinding the affected residential mortgage loans. Lawsuits have been brought in various states making claims against assignees or purchasers of high cost loans for violations of state law. Named defendants in these cases have included numerous participants within the secondary mortgage market. If the loans are found to have been originated in violation of predatory or abusive lending laws, we could incur losses, which could materially adversely affect our business, financial condition and results of operations, and our ability to pay dividends to our shareholders.
Our real estate assets and our real estate-related assets (including mortgage loans and MBS) are subject to the risks associated with real property.
We own assets secured by real estate and may own real estate directly in the future, either through direct acquisitions or upon a default of mortgage loans. Real estate assets are subject to various risks, including:
|
•
|
continued declines in the value of real estate;
|
|
•
|
acts of God, including earthquakes, floods, and other natural disasters, which may result in uninsured losses;
|
|
•
|
acts of war or terrorism, including the consequences of terrorist attacks, such as those that occurred on September 11, 2001;
|
|
•
|
adverse changes in national and local economic and market conditions;
|
|
•
|
changes in governmental laws and regulations, fiscal policies and zoning ordinances and the related costs of compliance with laws and regulations, fiscal policies and zoning ordinances;
|
|
•
|
costs of remediation and liabilities associated with environmental conditions such as indoor mold;
|
|
•
|
potential liabilities for other legal actions related to property ownership including tort claims; and
|
22
|
•
|
the potential for uninsured or under-insured property losses.
|
The occurrence of any of the foregoing or similar events may reduce our return from an affected property or asset and, consequently, materially adversely affect our business, financial condition and results of operations, and our ability to pay dividends to our shareholders.
We may be exposed to environmental liabilities with respect to properties in which we have an interest.
In the course of our business, we may take title to real estate, and, if we do take title, we could be subject to environmental liabilities with respect to these properties. In such a circumstance, we may be held liable to a governmental entity or to third parties for property damage, personal injury, investigation, and clean-up costs incurred by these parties in connection with environmental contamination, or may be required to investigate or clean up hazardous or toxic substances, or chemical releases at a property. The costs associated with investigation or remediation activities could be substantial. In addition, the presence of hazardous substances may adversely affect an owner's ability to sell real estate or borrow using real estate as collateral. To the extent that an owner of an underlying property becomes liable for removal costs, the ability of the owner to make debt payments may be reduced, which in turn may materially adversely affect the value of the relevant mortgage-related assets held by us.
We rely on analytical models and other data to analyze potential asset acquisition and disposition opportunities and to manage our portfolio. Such models and other data may be incorrect, misleading or incomplete, which could cause us to purchase assets that do not meet our expectations or to make asset management decisions that are not in line with our strategy.
Our Manager relies on the analytical models (both proprietary and third-party models) of Ellington and information and data supplied by third parties. These models and data may be used to value assets or potential asset acquisitions and dispositions and also in connection with our asset management activities. If Ellington's models and data prove to be incorrect, misleading, or incomplete, any decisions made in reliance thereon could expose us to potential risks. Our Manager's reliance on Ellington's models and data may induce it to purchase certain assets at prices that are too high, to sell certain other assets at prices that are too low, or to miss favorable opportunities altogether. Similarly, any hedging activities that are based on faulty models and data may prove to be unsuccessful.
Some of the risks of relying on analytical models and third-party data include the following:
|
•
|
collateral cash flows and/or liability structures may be incorrectly modeled in all or only certain scenarios, or may be modeled based on simplifying assumptions that lead to errors;
|
|
•
|
information about collateral may be incorrect, incomplete, or misleading;
|
|
•
|
collateral or RMBS historical performance (such as historical prepayments, defaults, cash flows, etc.) may be incorrectly reported, or subject to interpretation (e.g. different RMBS issuers may report delinquency statistics based on different definitions of what constitutes a delinquent loan); and
|
|
•
|
collateral or RMBS information may be outdated, in which case the models may contain incorrect assumptions as to what has occurred since the date information was last updated.
|
Some models, such as prepayment models or mortgage default models, may be predictive in nature. The use of predictive models has inherent risks. For example, such models may incorrectly forecast future behavior, leading to potential losses. In addition, the predictive models used by our Manager may differ substantially from those models used by other market participants, with the result that valuations based on these predictive models may be substantially higher or lower for certain assets than actual market prices. Furthermore, because predictive models are usually constructed based on historical data supplied by third parties, the success of relying on such models may depend heavily on the accuracy and reliability of the supplied historical data, and, in the case of predicting performance in scenarios with little or no historical precedent (such as extreme broad-based declines in home prices, or deep economic recessions or depressions), such models must employ greater degrees of extrapolation and are therefore more speculative and of more limited reliability.
All valuation models rely on correct market data inputs. If incorrect market data is entered into even a well-founded valuation model, the resulting valuations will be incorrect. However, even if market data is input correctly, "model prices" will often differ substantially from market prices, especially for securities with complex characteristics or whose values are particularly sensitive to various factors. If our market data inputs are incorrect or our model prices differ substantially from market prices, our business, financial condition and results of operations, and our ability to pay dividends to our shareholders could be materially adversely affected.
23
Valuations of some of our assets are inherently uncertain, may be based on estimates, may fluctuate over short periods of time, and may differ from the values that would have been used if a ready market for these assets existed.
The values of some of the assets in our portfolio are not readily determinable. We value these assets quarterly at fair value, as determined in good faith by our Manager, subject to the oversight of our Manager's valuation committee. Because such valuations are inherently uncertain, may fluctuate over short periods of time and may be based on estimates, our Manager's determinations of fair value may differ from the values that would have been used if a ready market for these assets existed or from the prices at which trades occur. Furthermore, we may not obtain third party valuations for all of our assets. Changes in the fair value of our assets directly impact our net income through recording unrealized appreciation or depreciation of our investments and derivative instruments, and so our Manager's determination of fair value has a material impact on our net income.
While in many cases our Manager's determination of the fair value of our assets is based on valuations provided by third-party dealers and pricing services, our Manager can and does value assets based upon its judgment and such valuations may differ from those provided by third-party dealers and pricing services. Valuations of certain assets are often difficult to obtain or are unreliable. In general, dealers and pricing services heavily disclaim their valuations. Additionally, dealers may claim to furnish valuations only as an accommodation and without special compensation, and so they may disclaim any and all liability for any direct, incidental, or consequential damages arising out of any inaccuracy or incompleteness in valuations, including any act of negligence or breach of any warranty. Depending on the complexity and illiquidity of an asset, valuations of the same asset can vary substantially from one dealer or pricing service to another. Higher valuations of our assets have the effect of increasing the amount of management fees we pay to our Manager. Therefore, conflicts of interest exist because our Manager is involved in the determination of the fair value of our assets.
Our business, financial condition and results of operations, and our ability to pay dividends to our shareholders could be materially adversely affected if our Manager's fair value determinations of these assets were materially different from the values that would exist if a ready market existed for these assets.
The lack of liquidity in our assets may materially adversely affect our business, financial condition and results of operations, and our ability to pay dividends to our shareholders.
We acquire assets and other instruments that are not publicly traded, including privately placed RMBS. As such, these assets may be subject to legal and other restrictions on resale, transfer, pledge or other disposition, or will otherwise be less liquid than publicly-traded securities. Other assets that we acquire, while publicly traded, have limited liquidity on account of their complexity, turbulent market conditions, or other factors. In addition, mortgage-related assets from time to time have experienced extended periods of illiquidity, including during times of financial stress (such as the during the 2008 financial crisis), which is often the time that liquidity is most needed. Illiquid assets typically experience greater price volatility, because a ready market does not exist, and they can be more difficult to value or sell if the need arises. In addition, if we are required to liquidate all or a portion of our portfolio quickly, we may realize significantly less than the value at which we have previously recorded our assets. We may also face other restrictions on our ability to liquidate any assets for which we or our Manager has or could be attributed with material non-public information. Furthermore, assets that are illiquid are more difficult to finance, and to the extent that we finance assets that are or become illiquid, we may lose that financing or have it reduced. If we are unable to sell our assets at favorable prices or at all, it could materially adversely affect our business, financial condition and results of operations, and our ability to pay dividends to our shareholders.
We are highly dependent on information systems and system failures could significantly disrupt our business, which may, in turn, materially adversely affect our business, financial condition and results of operations, and our ability to pay dividends to our shareholders.
Our business is highly dependent on communications and information systems. Any failure or interruption of our systems could cause delays or other problems in our securities trading activities, which could materially adversely affect our business, financial condition and results of operations, and our ability to pay dividends to our shareholders.
Our access to financing sources, which may not be available on favorable terms, or at all, may be limited, and this may materially adversely affect our business, financial condition and results of operations, and our ability to pay dividends to our shareholders.
We depend upon the availability of adequate capital and financing sources to fund our operations. Our lenders are generally large global financial institutions, with exposures both to global financial markets and to more localized conditions. For example, several of our lenders are large European-based banks whose financial conditions have still not fully recovered from the 2008 financial crisis. Whether because of a subsequent global or local financial crisis or other circumstances, if one or more of our lenders experiences severe financial difficulties, they or other lenders could become unwilling or unable to provide
24
us with financing, could increase the costs of that financing, or could become insolvent, as was the case with Lehman Brothers. Moreover, we are currently party to short-term borrowings (in the form of repurchase agreements) and there can be no assurance that we will be able to replace these borrowings, or "roll" them, as they mature on a continuous basis and it may be more difficult for us to obtain debt financing on favorable terms, or at all. In addition, if regulatory capital requirements imposed on our lenders change, they may be required to limit, or increase the cost of, the financing they provide to us. In general, this could potentially increase our financing costs and reduce our liquidity or require us to sell assets at an inopportune time or price. Consequently, depending on market conditions at the relevant time, we may have to rely on additional equity issuances to meet our capital and financing needs, which may be dilutive to our shareholders, or we may have to rely on less efficient forms of debt financing that consume a larger portion of our cash flow from operations, thereby reducing funds available for our operations, future business opportunities, cash distributions to our shareholders, and other purposes. We cannot assure you that we will have access to such equity or debt capital on favorable terms (including, without limitation, cost and term) at the desired times, or at all, which may cause us to curtail our asset acquisition activities and/or dispose of assets, which could materially adversely affect our business, financial condition and results of operations, and our ability to pay dividends to our shareholders.
Increases in interest rates could adversely affect the value of our assets and cause our interest expense to increase, and increase the risk of default on our assets which could result in reduced earnings or losses and negatively affect our profitability as well as the cash available for distribution to shareholders.
Our operating results will depend in large part on the difference between the income from our assets, net of credit losses, and financing costs. We anticipate that, in many cases, the income from our assets will respond more slowly to interest rate fluctuations than the cost of our borrowings. Consequently, changes in interest rates, particularly short-term interest rates, to the extent not offset by our interest rate hedges, may significantly influence our financial results.
We use leverage in executing our business strategy, which may adversely affect the return on our assets and may reduce cash available for distribution to our shareholders, as well as increase losses when economic conditions are unfavorable.
We use leverage to finance our investment activities and to enhance our financial returns. Currently, all of our leverage is in the form of short-term repurchase agreement financings for our RMBS assets. Other forms of leverage we may use in the future include credit facilities, including term loans and revolving credit facilities.
Through the use of leverage, we may acquire positions with market exposure significantly greater than the amount of capital committed to the transaction. For example, by entering into repurchase agreements with advance rates, or haircut levels, of 3%, we could theoretically leverage capital allocated to Agency RMBS by a debt-to-equity ratio of as much as 33 to 1. There is no specific limit on the amount of leverage that we may use. Leverage can enhance our potential returns but can also exacerbate losses. Even if an asset increases in value, if the asset fails to earn a return that equals or exceeds our cost of borrowing, the leverage will diminish our returns.
Leverage also increases the risk of our being forced to precipitously liquidate our assets. See below—"Our lenders and derivative counterparties may require us to post additional collateral, which may force us to liquidate assets, and if we fail to post sufficient collateral our debts may be accelerated and/or our derivative contracts terminated on unfavorable terms."
Our lenders and derivative counterparties may require us to post additional collateral, which may force us to liquidate assets, and if we fail to post sufficient collateral our debts may be accelerated and/or our derivative contracts terminated on unfavorable terms.
Our repurchase agreements and our derivative contracts allow, to varying degrees, our lenders and derivative counterparties (including clearinghouses) to determine an updated market value of our collateral and derivative contracts to reflect current market conditions. If the market value of our collateral or our derivative contracts with a particular lender or derivative counterparty declines in value, we may be required by the lender or derivative counterparty to provide additional collateral or repay a portion of the funds advanced on minimal notice, which is known as a margin call. Posting additional collateral will reduce our liquidity and limit our ability to leverage our assets. Additionally, in order to satisfy a margin call, we may be required to liquidate assets at a disadvantageous time, which could cause us to incur further losses and adversely affect our results of operations, financial condition, and may impair our ability to pay dividends to our shareholders. We receive margin calls from our lenders and derivative counterparties from time to time in the ordinary course of business similar to other entities in the specialty finance business. In the event we default on our obligation to satisfy these margin calls, our lenders or derivative counterparties can accelerate our indebtedness, terminate our derivative contracts (potentially on unfavorable terms requiring additional payments, including additional fees and costs), increase our borrowing rates, liquidate our collateral and terminate our ability to borrow. In certain cases, a default on one repurchase agreement or derivative contract (whether caused by a failure to satisfy margin calls or another event of default) can trigger "cross defaults" on other such agreements. A
25
significant increase in margin calls could materially adversely affect our business, financial condition and results of operations, and our ability to pay dividends to our shareholders, and could increase our risk of insolvency.
To the extent we might be compelled to liquidate qualifying real estate assets to repay debts, our compliance with the REIT rules regarding our assets and our sources of income could be negatively affected, which could jeopardize our qualification as a REIT. Losing our REIT qualification would cause us to be subject to U.S. federal income tax (and any applicable state and local taxes) on all of our income and decrease profitability and cash available to pay dividends to our shareholders.
Our rights under repurchase agreements are subject to the effects of the bankruptcy laws in the event of the bankruptcy or insolvency of us or our lenders.
In the event of our insolvency or bankruptcy, certain repurchase agreements may qualify for special treatment under the U.S. Bankruptcy Code, the effect of which, among other things, would be to allow the lender to avoid the automatic stay provisions of the U.S. Bankruptcy Code and to foreclose on and/or liquidate the collateral pledged under such agreements without delay. In the event of the insolvency or bankruptcy of a lender during the term of a repurchase agreement, the lender may be permitted, under applicable insolvency laws, to repudiate the contract, and our claim against the lender for damages may be treated simply as an unsecured creditor. In addition, if the lender is a broker or dealer subject to the Securities Investor Protection Act of 1970, or an insured depository institution subject to the Federal Deposit Insurance Act, our ability to exercise our rights to recover our securities under a repurchase agreement or to be compensated for any damages resulting from the lenders' insolvency may be further limited by those statutes. These claims would be subject to significant delay and costs to us and, if and when received, may be substantially less than the damages we actually incur.
Hedging against interest rate changes and other risks may materially adversely affect our business, financial condition and results of operations and our ability to pay dividends to our shareholders.
Subject to qualifying and maintaining our qualification as a REIT and exemption from registration under the Investment Company Act, we may pursue various hedging strategies to seek to reduce our exposure to adverse changes in interest rates and, to a lesser extent, credit risk. Our hedging activity is expected to vary in scope based on the level and volatility of interest rates, the types of liabilities and assets held and other changing market conditions. Hedging may fail to protect or could adversely affect us because, among other things:
|
•
|
interest rate hedging can be expensive, particularly during periods of rising and volatile interest rates;
|
|
•
|
available interest rate hedges may not correspond directly with the interest rate risk for which protection is sought;
|
|
•
|
the duration of the hedge may not match the duration of the related assets or liabilities being hedged;
|
|
•
|
most hedges are structured as over-the-counter contracts with private counterparties, raising the possibility that the hedging counterparty may default on their obligations;
|
|
•
|
to the extent that the creditworthiness of a hedging counterparty deteriorates, it may be difficult or impossible to terminate or assign any hedging transactions with such counterparty to another counterparty;
|
|
•
|
to the extent hedging transactions do not satisfy certain provisions of the Code and are not made through a TRS, the amount of income that a REIT may earn from hedging transactions to offset interest rate losses is limited by U.S. federal tax provisions governing REITs;
|
|
•
|
the value of derivatives used for hedging may be adjusted from time to time in accordance with accounting rules to reflect changes in fair value. Downward adjustments, or "mark-to-market losses," would reduce our earnings and our shareholders' equity;
|
|
•
|
we may fail to correctly assess the degree of correlation between the performance of the instruments used in the hedging strategy and the performance of the assets in the portfolio being hedged;
|
|
•
|
our Manager may fail to recalculate, re-adjust, and execute hedges in an efficient and timely manner; and
|
|
•
|
the hedging transactions may actually result in poorer over-all performance for us than if we had not engaged in the hedging transactions.
|
Although we do not intend to operate our non-Agency RMBS investment strategy on a credit-hedged basis in general, we may from time to time opportunistically enter into short positions using credit default swaps to protect against adverse credit events with respect to our non-Agency RMBS, provided that our ability to do so may be limited in order to qualify and maintain our qualification as a REIT and maintain our exclusion from regulation as an investment company under the Investment Company Act.
26
Our hedging transactions, which would be intended to limit losses, may actually adversely affect our earnings, which could reduce our cash available for distribution to our shareholders.
Hedging instruments and other derivatives, including some credit default swaps, may not, in many cases, be traded on regulated exchanges, or may not be guaranteed or regulated by any U.S. or foreign governmental authority and involve risks and costs that could result in material losses.
Hedging instruments and other derivatives, including certain types of credit default swaps, involve risk because they may not, in many cases, be traded on regulated exchanges and may not be guaranteed or regulated by any U.S. or foreign governmental authorities. Consequently, for these instruments there may be less stringent requirements with respect to record keeping, financial responsibility or segregation of customer funds and compliance with applicable statutory and commodity and other regulatory requirements and, depending on the identity of the counterparty, applicable international requirements. Our Manager is not restricted from dealing with any particular counterparty or from concentrating any or all of its transactions with one counterparty. Furthermore, our Manager has only a limited internal credit function to evaluate the creditworthiness of its counterparties, mainly relying on its experience with such counterparties and their general reputation as participants in these markets. The business failure of a hedging counterparty with whom we enter into a hedging transaction will most likely result in a default under the hedging agreement. Default by a party with whom we enter into a hedging transaction may result in losses and may force us to re-initiate similar hedges with other counterparties at the then-prevailing market levels. Generally we will seek to reserve the right to terminate our hedging transactions upon a counterparty's insolvency, but absent an actual insolvency, we may not be able to terminate a hedging transaction without the consent of the hedging counterparty, and we may not be able to assign or otherwise dispose of a hedging transaction to another counterparty without the consent of both the original hedging counterparty and the potential assignee. If we terminate a hedging transaction, we may not be able to enter into a replacement contract in order to cover our risk. There can be no assurance that a liquid secondary market will exist for hedging instruments purchased or sold, and therefore we may be required to maintain any hedging position until exercise or expiration, which could adversely affect our business, financial condition and results of operations, and our ability to pay dividends to our shareholders.
The U.S. Commodity Futures Trading Commission, or "CFTC," and certain commodity exchanges have established limits referred to as speculative position limits or position limits on the maximum net long or net short position which any person or group of persons may hold or control in particular futures and options. Limits on trading in options contracts also have been established by the various options exchanges. It is possible that trading decisions may have to be modified and that positions held may have to be liquidated in order to avoid exceeding such limits. Such modification or liquidation, if required, could adversely affect our business, financial condition and results of operations and our ability to pay dividends to our shareholders.
Certain of our hedging instruments are regulated by the CFTC and such regulations may adversely impact our ability to enter into such hedging instruments and cause us to incur increased costs.
We enter into interest rate swaps and credit default swaps to hedge risks associated with our portfolio. Entities entering into such swaps are exposed to credit losses in the event of non-performance by counterparties to these transactions. Effective October 12, 2012, the CFTC issued new rules regarding such swaps under the authority granted to it pursuant to the Dodd-Frank Act.
The new rules primarily impact our trading of these instruments in two ways. First, beginning on June 10, 2013, certain swaps, including many interest rate and credit default swaps, became subject to mandatory clearing. Under this requirement, subsequent to the execution of the trade, the parties to the trade are required to submit the trade to a central counterparty clearinghouse, or "CCP," for clearing. It is the intent of the Dodd-Frank Act that, by mandating the clearing of swaps in this manner, swap counterparty risk would not become overly concentrated in any single entity, but rather would be spread and centralized among the CCP and its members. We are not a direct member of any CCP, so we must access the CCPs through a futures commission merchant, or "FCM," which acts as intermediary between us and the CCP with respect to all facets of the transaction, including the posting and receipt of required collateral. If we lost access to our FCMs or CCPs, we could potentially be unable to use interest rate swaps and credit default swaps to hedge our risks.
The second way that the new rules impact our trading of these instruments is the Swap Execution Facility, or "SEF," mandate. This mandate came into effect on October 2, 2013, and requires that we execute interest rate swaps or credit default swaps on an electronic platform, rather than over the phone or in some other manner. If we were to lose access to our selected SEFs or we were otherwise unable to communicate with them, this would prevent us from being able to trade these instruments. In addition, as the industry is in the early stages of SEF trading, the process may be slower, which could impact the quality of our execution. If we were unable to execute our hedging trades in a timely manner, particularly in a volatile market environment, we may not be able to execute our strategies in the most advantageous manner.
27
These reforms, in addition to subjecting our swap transactions to greater initial margin requirements and additional transaction fees charged by CCPs, FCMs, and SEFs, have also subjected our swap transactions to greater regulation by both the CFTC and the SEC. These additional fees, costs, margin requirements, documentation, and regulation could adversely affect our business, financial condition and results of operations, and our ability to pay dividends to our shareholders.
Additionally, for all swaps we entered into prior to June 10, 2013, we were not required to clear them through the central clearinghouse and as a result these swaps are still subject to the risks of nonperformance by any of the individual counterparties with whom we entered into these transactions described in "—Hedging instruments and other derivatives, including some credit default swaps, may not, in many cases, be traded on regulated exchanges, or may not be guaranteed or regulated by any U.S. or foreign governmental authority and involve risks and costs that could result in material losses" above.
Our use of derivatives may expose us to counterparty risk
We have entered into interest rate swaps and other derivatives that have not been cleared by a CCP. If a derivative counterparty cannot perform under the terms of the derivative contract, we would not receive payments due under that agreement, we may lose any unrealized gain associated with the derivative, and the hedged liability would cease to be hedged by such instrument. If a derivative counterparty becomes insolvent or files for bankruptcy, we may also be at risk for any collateral we have pledged to such counterparty to secure our obligations under derivative contracts, and we may incur significant costs in attempting to recover such collateral.
We engage in short selling transactions, which may subject us to additional risks.
Many of our hedging transactions, and occasionally our investment transactions, are short sales. Short selling may involve selling securities that are not owned and typically borrowing the same securities for delivery to the purchaser, with an obligation to repurchase the borrowed securities at a later date. Short selling allows the investor to profit from declines in market prices to the extent such declines exceed the transaction costs and the costs of borrowing the securities. A short sale may create the risk of an unlimited loss, in that the price of the underlying security might theoretically increase without limit, thus increasing the cost of repurchasing the securities. There can be no assurance that securities sold short will be available for repurchase or borrowing. Repurchasing securities to close out a short position can itself cause the price of the securities to rise further, thereby exacerbating the loss.
We, Ellington, or its affiliates may be subject to adverse legislative or regulatory changes.
At any time, laws or regulations that impact our business, or the administrative interpretations of those laws or regulations, may be enacted or amended. For example, on July 21, 2010, President Obama signed into law the Dodd-Frank Act, which requires significant revisions to the existing financial regulations. Certain portions of the Dodd-Frank Act were effective immediately, while other portions will be effective only following rulemaking and extended transition periods, but many of these changes could, in the future, materially impact the profitability of our business or the business of our Manager or Ellington, the value of the assets that we hold, expose us to additional costs, require changes to business practices, or adversely affect our ability to pay dividends. For example, the Dodd-Frank Act alters the regulation of commodity interests, imposes new regulation on the over-the-counter derivatives market, places restrictions on residential mortgage loan originations, and reforms the asset-backed securitization markets most notably by imposing credit requirements. While there continues to be uncertainty about the exact impact of all of these changes, we do know that the Company and the Manager are subject to a more complex regulatory framework, and are incurring and will in the future incur costs to comply with new requirements as well as to monitor compliance in the future.
We cannot predict when or if any new law, regulation, or administrative interpretation, including those related to the Dodd-Frank Act, or any amendment to any existing law, regulation, or administrative interpretation, will be adopted or promulgated or will become effective. Additionally, the adoption or implementation of any new law, regulation, or administrative interpretation, or any revisions in these laws, regulations, or administrative interpretations, including those related to the Dodd-Frank Act, could cause us to change our portfolio, could constrain our strategy, or increase our costs. We could be adversely affected by any change in or any promulgation of new law, regulation, or administrative interpretation.
We may change our investment strategy, investment guidelines, hedging strategy, and asset allocation, operational, and management policies without notice or shareholder consent, which may materially adversely affect our business, financial condition and results of operations, and our ability to pay dividends to our shareholders. In addition, our declaration of trust provides that our Board of Trustees may authorize us to revoke or otherwise terminate our REIT election, without the approval of our shareholders.
We may change our investment strategy, investment guidelines, hedging strategy, and asset allocation, operational, and management policies at any time without notice to or consent from our shareholders. As a result, the types or mix of assets,
28
liabilities, or hedging transactions in our portfolio may be different from, and possibly riskier than, the types or mix of assets, liabilities, and hedging transactions that we have historically held, or that are otherwise described in this report. A change in our strategy may increase our exposure to real estate values, interest rates, and other factors. Our Board of Trustees determines our investment guidelines and our operational policies, and may amend or revise our policies, including those with respect to our acquisitions, growth, operations, indebtedness, capitalization, and dividends or approve transactions that deviate from these policies without a vote of, or notice to, our shareholders.
In addition, our declaration of trust provides that our Board of Trustees may authorize us to revoke or otherwise terminate our REIT election, without the approval of our shareholders, if it determines that it is no longer in our best interests to qualify as a REIT. These changes could materially adversely affect our business, financial condition and results of operations and our ability to pay dividends to our shareholders.
We operate in a highly competitive market.
Our profitability depends, in large part, on our ability to acquire targeted assets at favorable prices. We compete with a number of entities when acquiring our targeted assets, including other mortgage REITs, financial companies, public and private funds, commercial and investment banks and residential and commercial finance companies. We may also compete with (i) the Federal Reserve and the U.S. Treasury to the extent they purchase assets in our targeted asset classes and (ii) companies that partner with and/or receive financing from the U.S. Government. Many of our competitors are substantially larger and have considerably greater access to capital and other resources than we do. Furthermore, new companies with significant amounts of capital have been formed or have raised additional capital, and may continue to be formed and raise additional capital in the future, and these companies may have objectives that overlap with ours, which may create competition for assets we wish to acquire. Some competitors may have a lower cost of funds and access to funding sources that are not available to us, such as funding from the U.S. Government. In addition, some of our competitors may have higher risk tolerances or different risk assessments, which could allow them to consider a wider variety of assets to acquire or pay higher prices than we can. We also may have different operating constraints from those of our competitors including, among others, (i) tax-driven constraints such as those arising from our qualification as a REIT, (ii) restraints imposed on us by our attempt to comply with certain exclusions from the definition of an "investment company" or other exemptions under the Investment Company Act and (iii) restraints and additional costs arising from our status as a public company. Furthermore, competition for assets in our targeted asset classes may lead to the price of such assets increasing, which may further limit our ability to generate desired returns. We cannot assure you that the competitive pressures we face will not have a material adverse effect on our business, financial condition and results of operations, and our ability to pay dividends to our shareholders.
An increase in interest rates may cause a decrease in the issuance volumes of certain of our targeted assets, which could adversely affect our ability to acquire targeted assets that satisfy our investment objectives and to generate income and pay dividends.
Rising interest rates generally reduce the demand for mortgage loans due to the higher cost of borrowing. A reduction in the volume of mortgage loans originated may affect the volume of targeted assets available to us, which could adversely affect our ability to acquire assets that satisfy our investment objectives. If rising interest rates cause us to be unable to acquire a sufficient volume of our targeted assets with a yield that is above our borrowing cost, our ability to satisfy our investment objectives and to generate income and pay dividends to our shareholders may be materially and adversely affected.
Lack of diversification in the number of assets we acquire would increase our dependence on relatively few individual assets.
Our management objectives and policies do not place a limit on the amount of capital used to support, or the exposure to (by any other measure), any individual asset or any group of assets with similar characteristics or risks. As a result, our portfolio may be concentrated in a small number of assets or may be otherwise undiversified, increasing the risk of loss and the magnitude of potential losses to us and our shareholders if one or more of these assets perform poorly.
For example, our portfolio of mortgage-related assets may at times be concentrated in certain property types that are subject to higher risk of foreclosure, or secured by properties concentrated in a limited number of geographic locations. To the extent that our portfolio is concentrated in any one region or type of security, downturns relating generally to such region or type of security may result in defaults on a number of our assets within a short time period, which may materially adversely affect our business, financial condition and results of operations, and our ability to pay dividends to our shareholders.
29
Our ability to pay dividends will depend on our operating results, our financial condition and other factors, and we may not be able to pay dividends at a fixed rate or at all under certain circumstances.
We intend to pay dividends to our shareholders in amounts such that we distribute all or substantially all of our taxable income in each year (subject to certain adjustments). This distribution policy will enable us to avoid being subject to U.S. federal income tax on our taxable income that we distribute to our shareholders. However, our ability to pay dividends will depend on our earnings, our financial condition and such other factors as our Board of Trustees may deem relevant from time to time. We will declare and pay dividends only to the extent approved by our Board of Trustees.
Failure to procure adequate funding and capital would adversely affect our results and may, in turn, negatively affect the value of our common shares and our ability to pay dividends to our shareholders.
We depend upon the availability of adequate funding and capital for our operations. To maintain our status as a REIT, we are required to distribute at least 90% of our REIT taxable income annually, determined without regard to the deduction for dividends paid and excluding net capital gain, to our shareholders and therefore are not able to retain our earnings for new investments. We cannot assure you that any, or sufficient, funding or capital will be available to us in the future on terms that are acceptable to us. In the event that we cannot obtain sufficient funding and capital on acceptable terms, there may be a negative impact on the value of our common shares and our ability to pay dividends to our shareholders, and you may lose part or all of your investment.
Risks Related to our Relationship with our Manager and Ellington
Our Manager has limited experience operating a REIT, and we cannot assure you that our Manager's past experience will be sufficient to successfully manage our business as a REIT.
Our Manager has limited experience operating a REIT. The REIT provisions of the Code are complex, and any failure to comply with those provisions in a timely manner could prevent us from qualifying as a REIT or force us to pay unexpected taxes and penalties. In such event, our net income would be reduced and we could incur a loss.
We are dependent on our Manager and certain key personnel of Ellington that are provided to us through our Manager and may not find a suitable replacement if our Manager terminates the management agreement or such key personnel are no longer available to us.
We do not have any employees of our own. Our officers are employees of Ellington or one or more of its affiliates. We have no separate facilities and are completely reliant on our Manager, which has significant discretion as to the implementation of our operating policies and execution of our business strategies and risk management practices. We also depend on our Manager's access to the professionals and principals of Ellington as well as information and deal flow generated by Ellington. The employees of Ellington identify, evaluate, negotiate, structure, close, and monitor our portfolio. The departure of any of the senior officers of our Manager, or of a significant number of investment professionals or principals of Ellington, could have a material adverse effect on our ability to achieve our objectives. We can offer no assurance that our Manager will remain our manager or that we will continue to have access to our Manager's senior management. We are subject to the risk that our Manager will terminate the management agreement or that we may deem it necessary to terminate the management agreement or prevent certain individuals from performing services for us and that no suitable replacement will be found to manage us.
The management fees payable to our Manager are payable regardless of the performance of our portfolio, which may reduce our Manager's incentive to devote the time and effort to seeking profitable opportunities for our portfolio.
We pay our Manager management fees, which may be substantial, based on our shareholders' equity (as defined in the management agreement) regardless of the performance of our portfolio. The management fee takes into account the net issuance proceeds of both common and preferred share offerings. Our Manager's entitlement to non-performance-based compensation might reduce its incentive to devote the time and effort of its professionals to seeking profitable opportunities for our portfolio, which could result in a lower performance of our portfolio and materially adversely affect our business, financial condition and results of operations, and our ability to pay dividends to our shareholders.
Our Board of Trustees has approved very broad investment guidelines for our Manager and will not approve each decision made by our Manager to acquire, dispose of, or otherwise manage an asset.
Our Manager is authorized to follow very broad guidelines in pursuing our strategy. While our Board of Trustees periodically reviews our guidelines and our portfolio and asset-management decisions, it generally does not review all of our proposed acquisitions, dispositions, and other management decisions. In addition, in conducting periodic reviews, our Board of Trustees relies primarily on information provided to them by our Manager. Furthermore, our Manager may arrange for us to use complex strategies or to enter into complex transactions that may be difficult or impossible to unwind by the time they are
30
reviewed by our Board of Trustees. Our Manager has great latitude within the broad guidelines in determining the types of assets it may decide are proper for us to acquire and other decisions with respect to the management of those assets subject to our qualifying and maintaining our qualification as a REIT. Poor decisions could have a material adverse effect on our business, financial condition and results of operations, and our ability to pay dividends to our shareholders.
We compete with Ellington's other accounts for access to Ellington.
Ellington has sponsored and/or currently manages accounts with a focus that overlaps with our investment focus, and expects to continue to do so in the future. Ellington is not restricted in any way from sponsoring or accepting capital from new accounts, even for investing in asset classes or strategies that are similar to, or overlapping with, our asset classes or strategies. Therefore, we compete for access to the benefits that our relationship with our Manager and Ellington provides us. For the same reasons, the personnel of Ellington and our Manager may be unable to dedicate a substantial portion of their time managing our assets.
We compete with other Ellington accounts for opportunities to acquire assets, which are allocated in accordance with Ellington's investment allocation policies.
Many, if not most, of our targeted assets are also targeted assets of other Ellington accounts and Ellington has no duty to allocate such opportunities in a manner that preferentially favors us. Ellington makes available to us all opportunities to acquire assets that it determines, in its reasonable and good faith judgment, based on our objectives, policies and strategies, and other relevant factors, are appropriate for us in accordance with Ellington's written investment allocation policy, it being understood that we might not participate in each such opportunity, but will on an overall basis equitably participate with Ellington's other accounts in all such opportunities.
Since many of our targeted assets are typically available only in specified quantities, Ellington often is not able to buy as much of any asset or group of assets as would be required to satisfy the needs of all of Ellington's accounts. In these cases, Ellington's investment allocation procedures and policies typically allocate such assets to multiple accounts in proportion to their needs and available capital. As part of these policies, accounts that are in a "start-up" or "ramp-up" phase may get allocations above their proportion of available capital, which could work to our disadvantage, particularly because there are no limitations surrounding Ellington's ability to create new accounts. In addition, the policies permit departure from proportional allocations under certain circumstances, for example when such allocation would result in an inefficiently small amount of the security being purchased for an account, which may also result in our not participating in certain allocations.
The Blackstone Funds have significant influence over us and may have conflicts of interest with us or you now or in the future.
The Blackstone Funds own a significant portion of our common shares, and one of our trustees is also an affiliate of Blackstone. As a result, Blackstone may have influence over our ability to enter into any corporate transaction that requires the approval of shareholders regardless of whether shareholders believe that any such transactions are in their best interests. Similarly, Blackstone may have influence over transactions that we engage in including transactions which require the approval of our trustees. Such items may include decisions related to future capital raises, investment strategy, dividend declarations, financing decisions and decisions regarding our Manager. Blackstone is also in the business of making investments in companies and may from time to time acquire and hold interests in businesses that compete directly or indirectly with us. Blackstone may also pursue acquisition opportunities that are complementary to our business, and, as a result, those acquisition opportunities may not be available to us. As long as funds controlled by or associated with Blackstone continue to own a significant amount of our outstanding common shares, or Blackstone affiliates continue to serve as our trustees, Blackstone may continue to be able to influence our decisions.
There are conflicts of interest in our relationships with our Manager and Ellington, which could result in decisions that are not in the best interests of our shareholders.
We are subject to conflicts of interest arising out of our relationship with Ellington and our Manager. Currently, all of our executive officers, and two of our trustees, are employees of Ellington or one or more of its affiliates. As a result, our Manager and our officers may have conflicts between their duties to us and their duties to, and interests in, Ellington or our Manager. For example, Mr. Penn, our President and Chief Executive Officer and one of our trustees, also serves as the President and Chief Executive Officer of, and as a Member of the Board of Directors of, Ellington Financial LLC. Ms. Mumford, our Chief Financial Officer, also serves as the Chief Financial Officer of Ellington Financial LLC, and Mr. Vranos, our Co-Chief Investment Officer and one of our trustees, also serves as the Co-Chief Investment Officer of, and as a Member of the Board of Directors of, Ellington Financial LLC.
31
We may acquire or sell assets in which Ellington or its affiliates have or may have an interest. Similarly, Ellington or its affiliates may acquire or sell assets in which we have or may have an interest. Although such acquisitions or dispositions may present conflicts of interest, we nonetheless may pursue and consummate such transactions. Additionally, we may engage in transactions directly with Ellington or its affiliates, including the purchase and sale of all or a portion of a portfolio asset.
Acquisitions made for entities with similar objectives may be different from those made on our behalf. Ellington may have economic interests in, or other relationships with, others in whose obligations or securities we may acquire. In particular, such persons may make and/or hold an investment in securities that we acquire that may be pari passu, senior, or junior in ranking to our interest in the securities or in which partners, security holders, officers, directors, agents, or employees of such persons serve on boards of directors or otherwise have ongoing relationships. Each of such ownership and other relationships may result in securities laws restrictions on transactions in such securities and otherwise create conflicts of interest. In such instances, Ellington may, in its sole discretion, make recommendations and decisions regarding such securities for other entities that may be the same as or different from those made with respect to such securities and may take actions (or omit to take actions) in the context of these other economic interests or relationships the consequences of which may be adverse to our interests.
In deciding whether to issue additional debt or equity securities, we will rely in part on recommendations made by our Manager. While such decisions are subject to the approval of our Board of Trustees, two of our trustees are also Ellington employees. Because our Manager earns management fees that are based on the total amount of our equity capital, our Manager may have an incentive to recommend that we issue additional equity securities. In addition, through its non-voting special membership interests in an affiliate of Ellington, the Blackstone Funds are entitled to receive distributions from such affiliate equal to a portion of the management fees that are paid to our Manager, and therefore our trustee affiliated with Blackstone may have a similar incentive for us to issue additional equity securities. See below for further discussion of the adverse impact future debt or equity offerings could have on our common shares. Future offerings of debt securities, which would rank senior to our common shares upon liquidation, and future offerings of equity securities which would dilute the common shares holdings of our existing shareholders and may be senior to our common shares for the purposes of dividend and liquidating distributions, may adversely affect the market price of our common shares.
The officers of our Manager and its affiliates devote as much time to us as our Manager deems appropriate, however, these officers may have conflicts in allocating their time and services among us and Ellington and its affiliates' accounts. During turbulent conditions in the mortgage industry, distress in the credit markets or other times when we will need focused support and assistance from our Manager and Ellington employees, other entities that Ellington advises or manages will likewise require greater focus and attention, placing our Manager and Ellington's resources in high demand. In such situations, we may not receive the necessary support and assistance we require or would otherwise receive if we were internally managed or if Ellington or its affiliates did not act as a manager for other entities.
We, directly or through Ellington, may obtain confidential information about the companies or securities in which we have invested or may invest. If we do possess confidential information about such companies or securities, there may be restrictions on our ability to dispose of, increase the amount of, or otherwise take action with respect to the securities of such companies. Our Manager's and Ellington's management of other accounts could create a conflict of interest to the extent our Manager or Ellington is aware of material non-public information concerning potential investment decisions. We have implemented compliance procedures and practices designed to ensure that investment decisions are not made while in possession of material non-public information. We cannot assure you, however, that these procedures and practices will be effective. In addition, this conflict and these procedures and practices may limit the freedom of our Manager to make potentially profitable investments, which could have an adverse effect on our operations. These limitations imposed by access to confidential information could therefore materially adversely affect our business, financial condition and results of operations, and our ability to pay dividends to our shareholders.
The management agreement with our Manager was not negotiated on an arm's-length basis and may not be as favorable to us as if it had been negotiated with an unaffiliated third party and may be costly and difficult to terminate.
Our management agreement with our Manager was negotiated between related parties, and its terms, including fees payable, may not be as favorable to us as if it had been negotiated with an unaffiliated third party. Various potential and actual conflicts of interest may arise from the activities of Ellington and its affiliates by virtue of the fact that our Manager is controlled by Ellington.
Termination of our management agreement without cause, including termination for poor performance or non-renewal, is subject to several conditions which may make such a termination difficult and costly.
T
he management agreement, which was most recently amended and restated effective March 13, 2014, has a current term that expires on September 24, 2017, and will be automatically renewed for successive one-year terms thereafter unless notice of non-renewal is delivered by either party to
32
the other party at least 180 days prior to the expiration of the then current term. The management agreement provides that it may be terminated by us based on performance upon the affirmative vote of at least two-thirds of our independent trustees, or by a vote of the holders of at least a majority of our outstanding common shares, based either upon unsatisfactory performance by our Manager that is materially detrimental to us or upon a determination by the Board of Trustees that the management fee payable to our Manager is not fair, subject to our Manager's right to prevent such a termination by accepting a mutually acceptable reduction of management fees. In the event we terminate the management agreement as discussed above or elect not to renew the management agreement, we will be required to pay our Manager a termination fee equal to 5% of our shareholders' equity as of the month-end preceding termination. These provisions will increase the effective cost to us of terminating the management agreement, thereby adversely affecting our ability to terminate our Manager without cause.
Pursuant to the management agreement, our Manager will not assume any responsibility other than to render the services called for thereunder and will not be responsible for any action of our Board of Trustees in following or declining to follow its advice or recommendations. Under the terms of the management agreement, our Manager, Ellington, and their affiliates and each of their officers, directors, trustees, members, shareholders, partners, managers, investment and risk management committee members, employees, agents, successors and assigns, will not be liable to us for acts or omissions performed in accordance with and pursuant to the management agreement, except because of acts constituting bad faith, willful misconduct, gross negligence, fraud or reckless disregard of their duties under the management agreement. In addition, we will indemnify our Manager, Ellington, and their affiliates and each of their officers, directors, trustees, members, shareholders, partners, managers, investment and risk management committee members, employees, agents, successors and assigns, with respect to all expenses, losses, damages, liabilities, demands, charges and claims arising from acts of our Manager not constituting bad faith, willful misconduct, gross negligence, fraud or material breach or reckless disregard of duties, performed in good faith in accordance with and pursuant to the management agreement.
Our Manager's failure to identify and acquire assets that meet our asset criteria or perform its responsibilities under the management agreement could materially adversely affect our business, financial condition and results of operations and our ability to pay dividends to our shareholders.
Our ability to achieve our objectives depends on our Manager's ability to identify and acquire assets that meet our asset criteria. Accomplishing our objectives is largely a function of our Manager's structuring of our investment process, our access to financing on acceptable terms, and general market conditions. Our shareholders do not have input into our investment decisions. All of these factors increase the uncertainty, and thus the risk, of investing in our common shares. The senior management team of our Manager has substantial responsibilities under the management agreement. In order to implement certain strategies, our Manager may need to hire, train, supervise, and manage new employees successfully. Any failure to manage our future growth effectively could have a material adverse effect on our business, financial condition and results of operations, our ability to qualify and maintain our qualification as a REIT and our ability to pay dividends to our shareholders.
If our Manager ceases to be our Manager pursuant to the management agreement or one or more of our Manager's key personnel ceases to provide services to us, our lenders and our derivative counterparties may cease doing business with us.
If our Manager ceases to be our Manager, or if one or more of our Manager's key personnel cease to provide services for us, it could constitute an event of default or early termination event under many of our repo financing and derivative hedging agreements, upon which our counterparties would have the right to terminate their agreements with us. If our Manager ceases to be our Manager for any reason, including upon the non-renewal of our management agreement and we are unable to obtain or renew financing or enter into or maintain derivative transactions, our business, financial condition and results of operations, and our ability to pay dividends to our shareholders may be materially adversely affected.
We do not own the Ellington brand or trademark, but may use the brand and trademark as well as our logo pursuant to the terms of a license granted by Ellington.
Ellington has licensed the "Ellington" brand, trademark, and logo to us for so long as our Manager or another affiliate of Ellington continues to act as our Manager. We do not own the brand, trademark, or logo that we will use in our business and may be unable to protect this intellectual property against infringement from third parties. Ellington retains the right to continue using the "Ellington" brand and trademark. We will further be unable to preclude Ellington from licensing or transferring the ownership of the "Ellington" brand and trademark to third parties, some of whom may compete against us. Consequently, we will be unable to prevent any damage to goodwill that may occur as a result of the activities of Ellington or others. Furthermore, in the event our Manager or another affiliate of Ellington ceases to act as our Manager, or in the event Ellington terminates the license, we will be required to change our name and trademark. Any of these events could disrupt our recognition in the marketplace, damage any goodwill we may have generated, and otherwise harm our business. Finally, the license is a domestic license in the United States only and does not give us any right to use the "Ellington" brand, trademark, and logo overseas even
33
though we expect to use the brand, trademark, and logo overseas. Our use of the "Ellington" brand, trademark and logo overseas will therefore be unlicensed and could expose us to a claim of infringement.
We, Ellington, or its affiliates may be subject to regulatory inquiries or proceedings.
At any time, industry-wide or company-specific regulatory inquiries or proceedings can be initiated and we cannot predict when or if any such regulatory inquiries or proceedings will be initiated that involve us, Ellington, or its affiliates, including our Manager. For example, over the years, Ellington and its affiliates have received, and we expect in the future that they may receive, inquiries and requests for documents and information from various federal, state, and foreign regulators.
We can give no assurances that regulatory inquiries will not result in investigations of Ellington or its affiliates or enforcement actions, fines or penalties, or the assertion of private litigation claims against Ellington or its affiliates. We believe that the heightened scrutiny of MBS market participants increases the risk of additional inquiries and requests from regulatory or enforcement agencies. In the event regulatory inquiries were to result in investigations, enforcement actions, fines, penalties, or the assertion of private litigation claims against Ellington or its affiliates, our Manager's ability to perform its obligations to us under the management agreement between us and our Manager, or Ellington's ability to perform its obligations to our Manager under the services agreement between Ellington and our Manager, could be adversely impacted, which could in turn have a material adverse effect on our business, financial condition and results of operations, and our ability to pay dividends to our shareholders.
Risks Related to Our Common Shares
The market for our common shares may be limited, which may adversely affect the price at which our common shares trade and make it difficult to sell our common shares.
While our common shares are listed on the New York Stock Exchange, such listing does not provide any assurance as to:
|
•
|
whether the market price of our shares will reflect our actual financial performance;
|
|
•
|
the liquidity of our common shares;
|
|
•
|
the ability of any holder to sell common shares; or
|
|
•
|
the prices that may be obtained for our common shares.
|
The market price and trading volume of our common shares may be volatile.
The market price of our common shares may be highly volatile and could be subject to wide fluctuations. In addition, the trading volume in our common shares may fluctuate and cause significant price variations to occur. We cannot assure you that the market price of our common shares will not fluctuate or decline significantly in the future. Some of the factors that could negatively affect our share price or result in fluctuations in the price or trading volume of our common shares include:
|
•
|
actual or anticipated variations in our quarterly operating results or dividends;
|
|
•
|
changes in our earnings estimates, failure to meet earnings or operating results expectations of public market analysts and investors, or publication of research reports about us or the real estate specialty finance industry;
|
|
•
|
increases in market interest rates that lead purchasers of our common shares to demand a higher yield;
|
|
•
|
passage of legislation, changes in applicable law, court rulings, enforcement actions or other regulatory developments that adversely affect us or our industry;
|
|
•
|
changes in government policies or changes in timing of implementation of government policies, including with respect Fannie Mae, Freddie Mac, and Ginnie Mae;
|
|
•
|
changes in market valuations of similar companies;
|
|
•
|
adverse market reaction to any increased indebtedness we incur in the future;
|
|
•
|
additions or departures of key management personnel;
|
|
•
|
actions by shareholders;
|
|
•
|
speculation in the press or investment community;
|
|
•
|
general market and economic conditions;
|
|
•
|
our operating performance and the performance of other similar companies; and
|
|
•
|
changes in accounting principles.
|
34
For as long as we are an emerging growth company, we will not be required to comply with certain reporting requirements, including those relating to accounting standards and disclosure about our executive compensation, that apply to other public companies.
We are an "emerging growth company," as defined in Section 2(a) of the Securities Act of 1933, as amended, or the Securities Act, as modified by the Jumpstart our Business Startups Act of 2012, or the "JOBS Act." As such, we are eligible to take advantage of certain exemptions from various reporting requirements that are applicable to other public companies that are not "emerging growth companies," including, but not limited to, not being required to comply with the auditor attestation requirements of Section 404(b) of the Sarbanes-Oxley Act, reduced disclosure obligations regarding executive compensation in our periodic reports and proxy statements and exemptions from the requirements of holding a non-binding advisory vote on executive compensation and of shareholder approval of any golden parachute payments not previously approved. If we do take advantage of these exemptions, we do not know if some investors will find our common shares less attractive as a result. The result may be a less active trading market for our common shares and our share price may be more volatile.
We could remain an "emerging growth company" for up to five years or until the earliest of (a) the last day of the first fiscal year in which our annual gross revenues exceed $1 billion, (b) the date that we become a "large accelerated filer" as defined in Rule 12b-2 under the Exchange Act, which would occur if the market value of our common shares that is held by non-affiliates exceeds $700 million as of the last business day of our most recently completed second fiscal quarter, or (c) the date on which we have issued more than $1 billion in non-convertible debt securities during the preceding three-year period.
We
qualify as an "emerging growth company" and plan to take advantage of an extended transition period to comply with new or revised accounting standards applicable to public companies.
We qualify as an emerging growth company as defined in the JOBS Act. Pursuant to Section 107 of the JOBS Act, as an "emerging growth company," we are permitted to take advantage of the extended transition period provided in Section 7(a)(2)(B) of the Securities Act for complying with new or revised accounting standards, which allows us to delay the adoption of certain accounting standards until those standards would otherwise apply to private companies. We have elected to take advantage of the benefits of this extended transition period. As a result of our election to utilize the extended transition period, our financial statements may not be comparable to those of other public companies that comply with such new or revised accounting standards. Please refer to "Management's Discussion and Analysis of Financial Condition and Results of Operations—Critical Accounting Policies" for further discussion of our election to utilize the extended transition period for complying with new or revised accounting standards.
Future
offerings of debt securities, which would rank senior to our common shares upon our bankruptcy liquidation, and future offerings of equity securities which would dilute the common shares holdings of our existing shareholders and may be senior to our common shares for the purposes of dividend and liquidating distributions, may adversely affect the market price of our common shares.
In the future, we may attempt to increase our capital resources by making offerings of debt securities or additional offerings of equity securities. Upon bankruptcy or liquidation, holders of our debt securities and preferred shares, if any, and lenders with respect to other borrowings will receive a distribution of our available assets prior to the holders of our common shares. Our preferred shares, if issued, could have a preference on liquidating distributions or a preference on dividend payments or both that could limit our ability to pay a dividend or other distribution to the holders of our common shares. Because our decision to issue securities in any future offering will depend on market conditions and other factors beyond our control, we cannot predict or estimate the amount, timing or nature of our future offerings. Thus, holders of our common shares bear the risk of our future offerings reducing the market price of our common shares and diluting their share holdings in our company.
Future sales of our common shares or other securities convertible into our common shares could cause the market value of our common shares to decline and could result in dilution of your shares.
Sales of substantial amounts of our common shares could cause the market price of our common shares to decrease significantly. We cannot predict the effect, if any, of future sales of our common shares, or the availability of our common shares for future sales, on the value of our common shares. Sales of substantial amounts of our common shares, or the perception that such sales could occur, may adversely affect prevailing market values for our common shares. In connection with our initial public offering, our shareholders that held shares prior to the initial public offering entered into lock-up agreements with the underwriters covering a period of twelve months after the completion of the offering with respect to our common shares they owned as of the closing of the offering. These lock-up provisions, at any time and without notice, may be released. If the restrictions under the lock-up agreements are waived or expire, our common shares will become available for resale into the market, subject to applicable law, which could reduce the market price for our common shares.
35
Our shareholders may not receive dividends or dividends may not grow over time.
We have not established a minimum dividend payment level and our ability to pay dividends may be adversely affected by a number of factors, including the risk factors described herein. All dividends will be declared at the discretion of our Board of Trustees and will depend on our earnings, our financial condition, and other factors as our Board of Trustees may deem relevant from time to time. Our Board of Trustees is under no obligation or requirement to declare a dividend. We cannot assure you that we will achieve results that will allow us to pay a specified level of dividends or year-to-year increases in dividends. Among the factors that could materially adversely affect our business, financial condition and results of operations, and our ability to pay dividends to our shareholders are:
|
•
|
our inability to realize positive or attractive returns on our portfolio, whether because of defaults in our portfolio, decreases in the value of our portfolio, or otherwise;
|
|
•
|
margin calls or other expenditures that reduce our cash flow and impact our liquidity; and
|
|
•
|
increases in actual or estimated operating expenses.
|
An increase in interest rates may have an adverse effect on the market price of our common shares and our ability to pay dividends to our shareholders.
One of the factors that investors may consider in deciding whether to buy or sell our common shares is our dividend rate (or expected future dividend rate) as a percentage of our common share price, relative to market interest rates. If market interest rates increase, prospective investors may demand a higher dividend rate on our common shares or seek alternative investments paying higher dividends or interest. As a result, interest rate fluctuations and capital market conditions can affect the market price of our common shares independent of the effects such conditions may have on our portfolio. For instance, if interest rates rise without an increase in our dividend rate, the market price of our common shares could decrease because potential investors may require a higher dividend yield on our common shares as market rates on interest-bearing instruments such as bonds rise. In addition, to the extent we have variable rate debt, such as our repurchase agreement financing, rising interest rates would result in increased interest expense on this variable rate debt, thereby adversely affecting our cash flow and our ability to service our indebtedness and pay dividends to our shareholders.
Investing in our common shares involves a high degree of risk.
The assets we purchase in accordance with our objectives may result in a higher amount of risk than other alternative asset acquisition options. The assets we acquire may be highly speculative and aggressive and may be subject to a variety of risks, including credit risk, prepayment risk, interest rate risk, and market risk. As a result, an investment in our common shares may not be suitable for investors with lower risk tolerance.
Risks Related to Our Organization and Structure
Maintenance of our exclusion from regulation as an investment company under the Investment Company Act imposes significant limitations on our operations.
We have conducted and intend to continue to conduct our operations so that neither we nor any of our subsidiaries are required to register as an investment company under the Investment Company Act. Both we and our Operating Partnership are organized as holding companies and conduct our business primarily through wholly-owned subsidiaries of our Operating Partnership. The securities issued by our Operating Partnership's subsidiaries that are excluded from the definition of "investment company" under Section 3(c)(7) of the Investment Company Act, together with other investment securities our Operating Partnership may own, cannot exceed 40% of the value of all our operating partnership's assets (excluding U.S. Government securities and cash) on an unconsolidated basis. This requirement limits the types of businesses in which we may engage and the assets we may hold. Certain of our operating partnership's subsidiaries may rely on the exclusion provided by Section 3(c)(5)(C) under the Investment Company Act. Section 3(c)(5)(C) of the Investment Company Act is designed for entities "primarily engaged in the business of purchasing or otherwise acquiring mortgages and other liens on and interests in real estate." This exclusion requires that at least 55% of the entity's assets on an unconsolidated basis consist of qualifying real estate assets and at least 80% of the entity's assets on an unconsolidated basis consist of qualifying real estate assets or real estate-related assets. These requirements limit the assets those subsidiaries can own and the timing of sales and purchases of those assets.
To classify the assets held by our subsidiaries as qualifying real estate assets or real estate-related assets, we rely on no-action letters and other guidance published by the SEC staff regarding those kinds of assets, as well as upon our analyses (in consultation with outside counsel) of guidance published with respect to other types of assets. There can be no assurance that the laws and regulations governing the Investment Company Act status of companies similar to ours, or the guidance from the SEC staff regarding the treatment of assets as qualifying real estate assets or real estate-related assets, will not change in a
36
manner that adversely affects our operations. In fact, in August 2011, the SEC published a concept release in which it asked for comments on this exclusion from regulation. To the extent that the SEC staff provides more specific guidance regarding any of the matters bearing upon our exclusion from the definition of an investment company under the Investment Company Act, we may be required to adjust our strategy accordingly. Any additional guidance from the SEC staff could further inhibit our ability to pursue the strategies that we have chosen. Furthermore, although we monitor the assets of our subsidiaries regularly, there can be no assurance that our subsidiaries will be able to maintain their exclusion or exemption from registration. Any of the foregoing could require us to adjust our strategy, which could limit our ability to make certain investments or require us to sell assets in a manner, at a price or at a time that we otherwise would not have chosen. This could negatively affect the value of our common shares, the sustainability of our business model, and our ability to pay dividends to our shareholders.
The ownership limits in our declaration of trust may discourage a takeover or business combination that may have benefited our shareholders.
To assist us in qualifying as a REIT, among other purposes, our declaration of trust restricts the beneficial or constructive ownership of our shares by any person to no more than 9.8% in value or the number of shares, whichever is more restrictive, of the outstanding shares of any class or series of our shares. This and other restrictions on ownership and transfer of our shares contained in our declaration of trust may discourage a change of control of us and may deter individuals or entities from making tender offers for our common shares on terms that might be financially attractive to you or which may cause a change in our management. In addition to deterring potential transactions that may be favorable to our shareholders, these provisions may also decrease your ability to sell our common shares.
Our shareholders' ability to control our operations is severely limited.
Our Board of Trustees has approval rights with respect to our major strategies, including our strategies regarding investments, financing, growth, debt capitalization, REIT qualification and distributions. Our Board of Trustees may amend or revise these and other strategies without a vote of our shareholders.
Certain provisions of Maryland law could inhibit a change in our control.
Certain provisions of the Maryland General Corporation Law, or the MGCL, applicable to a Maryland real estate investment trust may have the effect of inhibiting a third party from making a proposal to acquire us or of impeding a change in our control under circumstances that otherwise could provide the holders of our common shares with the opportunity to realize a premium over the then prevailing market price of such shares. We are subject to the "business combination" provisions of the MGCL that, subject to limitations, prohibit certain business combinations between us and an "interested shareholder" (defined generally as any person who beneficially owns 10% or more of our then outstanding voting shares or an affiliate or associate of ours who, at any time within the two-year period prior to the date in question, was the beneficial owner of 10% or more of our then outstanding voting shares) or an affiliate thereof for five years after the most recent date on which the shareholder becomes an interested shareholder and, thereafter, imposes minimum price or supermajority shareholder voting requirements on these combinations. These provisions of the MGCL do not apply, however, to business combinations that are approved or exempted by the board of trustees of a real estate investment trust prior to the time that the interested shareholder becomes an interested shareholder. Pursuant to the statute, our Board of Trustees has by resolution exempted business combinations between us and any other person, provided that the business combination is first approved by our Board of Trustees, including a majority of our trustees who are not affiliates or associates of such person. This resolution, however, may be altered or repealed in whole or in part at any time. If this resolution is repealed, or our Board of Trustees does not otherwise approve a business combination, this statute may discourage others from trying to acquire control of us and increase the difficulty of consummating any offer.
The "control share" provisions of the MGCL provide that holders of "control shares" of a Maryland real estate investment trust (defined as shares which, when aggregated with all other shares controlled by the shareholder, entitle the shareholder to exercise one of three increasing ranges of voting power in the election of trustees) acquired in a "control share acquisition" (defined as the acquisition of "control shares," subject to certain exceptions) have no voting rights with respect to the control shares except to the extent approved by the Maryland real estate investment trust's shareholders by the affirmative vote of at least two-thirds of all the votes entitled to be cast on the matter, excluding votes entitled to be cast by the acquirer of control shares, its officers and its trustees who are also employees of the Maryland real estate investment trust. Our bylaws contain a provision exempting from the control share acquisition statute any and all acquisitions by any person of our shares. There can be no assurance that this provision will not be amended or eliminated at any time in the future.
The "unsolicited takeover" provisions of the MGCL permit our Board of Trustees, without shareholder approval and regardless of what is currently provided in our declaration of trust or bylaws, to implement certain provisions. These provisions may have the effect of inhibiting a third party from making an acquisition proposal for us or of delaying, deferring or
37
preventing a change in our control under circumstances that otherwise could provide the holders of our common shares with the opportunity to realize a premium over the then current market price.
Our authorized but unissued common and preferred shares may prevent a change in our control.
Our declaration of trust authorizes us to issue additional authorized but unissued common shares and preferred shares. In addition, our Board of Trustees may, without shareholder approval, approve amendments to our declaration of trust to increase the aggregate number of our authorized shares or the number of shares of any class or series that we have authority to issue and may classify or reclassify any unissued common shares or preferred shares and may set the preferences, rights and other terms of the classified or reclassified shares. As a result, among other things, our Board may establish a class or series of common shares or preferred shares that could delay or prevent a transaction or a change in our control that might involve a premium price for our common shares or otherwise be in the best interests of our shareholders.
Our rights and the rights of our shareholders to take action against our trustees and officers or against our Manager or Ellington are limited, which could limit your recourse in the event actions are taken that are not in your best interests.
Our declaration of trust limits the liability of our present and former trustees and officers to us and our shareholders for money damages to the maximum extent permitted under Maryland law. Under current Maryland law, our present and former trustees and officers will not have any liability to us or our shareholders for money damages other than liability resulting from:
|
•
|
actual receipt of an improper benefit or profit in money, property or services;
|
|
•
|
or active and deliberate dishonesty by the trustee or officer that was established by a final judgment and is material to the cause of action.
|
Our declaration of trust authorizes us to indemnify our present and former trustees and officers for actions taken by them in those and other capacities to the maximum extent permitted by Maryland law. Our bylaws require us to indemnify each present and former trustee or officer, to the maximum extent permitted by Maryland law, in the defense of any proceeding to which he or she is made, or threatened to be made, a party by reason of his or her service to us as a trustee or officer or in certain other capacities. In addition, we may be obligated to pay or reimburse the expenses incurred by our present and former trustees and officers without requiring a preliminary determination of their ultimate entitlement to indemnification.
As a result, we and our shareholders may have more limited rights against our present and former trustees and officers than might otherwise exist absent the current provisions in our declaration of trust and bylaws or that might exist with other companies, which could limit your recourse in the event of actions not in your best interest.
Our declaration of trust contains provisions that make removal of our trustees difficult, which could make it difficult for our shareholders to effect changes to our management.
Our declaration of trust provides that, subject to the rights of holders of any series of preferred shares, a trustee may be removed only for "cause" (as defined in our declaration of trust), and then only by the affirmative vote of at least two-thirds of the votes entitled to be cast generally in the election of trustees. Vacancies generally may be filled only by a majority of the remaining trustees in office, even if less than a quorum, for the full term of the class of trustees in which the vacancy occurred. These requirements make it more difficult to change our management by removing and replacing trustees and may prevent a change in our control that is in the best interests of our shareholders.
Our declaration of trust generally does not permit ownership in excess of 9.8% of any class or series of our shares of beneficial interest, and attempts to acquire our shares in excess of the share ownership limits will be ineffective unless an exemption is granted by our Board of Trustees.
Our declaration of trust generally prohibits beneficial or constructive ownership by any person of more than 9.8% in value or by number of shares, whichever is more restrictive, of any class or series of our outstanding shares of beneficial interest and contains certain other limitations on the ownership and transfer of our shares. Our Board of Trustees, in its sole discretion, may grant an exemption to certain of these prohibitions, subject to certain conditions and receipt by our board of certain representations and undertakings. Our Board of Trustees may from time to time increase this ownership limit for one or more persons and may increase or decrease such limit for all other persons. Any decrease in the ownership limit generally applicable to all shareholders will not be effective for any person whose percentage ownership of our shares is in excess of such decreased ownership limit until such time as such person's percentage ownership of our shares equals or falls below such decreased ownership limit, but any further acquisition of our shares in excess of such decreased ownership limit will be in violation of the decreased ownership limit. Our Board of Trustees may not increase the ownership limit (whether for one person or all shareholders) if such increase would allow five or fewer individuals to beneficially own more than 49.9% in value of our outstanding shares.
38
Our declaration of trust's constructive ownership rules are complex and may cause the outstanding shares owned by a group of related individuals or entities to be deemed to be constructively owned by one individual or entity. As a result, the acquisition of less than 9.8% of the outstanding shares of any class or series by an individual or entity could cause that individual or entity to own constructively in excess of 9.8% of the outstanding shares of such class or series and thus violate the ownership limit or other restrictions on ownership and transfer of our shares. Any attempt to own or transfer our common shares or preferred shares (if and when issued) in excess of the ownership limit without the consent of our board of trustees or in a manner that would cause us to be "closely held" under Section 856(h) of the Code (without regard to whether the shares are held during the last half of a taxable year) or otherwise fail to qualify as a REIT will result in the shares being automatically transferred to a trustee for a charitable trust or, if the transfer to the charitable trust is not automatically effective to prevent a violation of the share ownership limits or the restrictions on ownership and transfer of our shares, any such transfer of our shares will be void ab initio. Further, any transfer of our shares that would result in our shares being beneficially owned by fewer than 100 persons will be void ab initio.
U.S. Federal Income Tax Risks
Your investment has various U.S. federal, state, and local income tax risks.
We strongly urge you to consult your own tax advisor concerning the effects of federal, state, and local income tax law on an investment in our common shares and on your individual tax situation.
Our failure to qualify as a REIT would subject us to U.S. federal, state and local income taxes, which could adversely affect the value of our common shares and would substantially reduce the cash available for distribution to our shareholders.
We believe that, commencing with our short taxable year ending December 31, 2013, we were organized in conformity with the requirements for qualification as a REIT under the Code and we operated and intend to operate in a manner that will enable us to meet the requirements for taxation as a REIT commencing with our short taxable year ending December 31, 2013. However, we cannot assure you that we will qualify and remain qualified as a REIT.
Accordingly, given the complex nature of the rules governing REITs, the ongoing importance of factual determinations, including the potential tax treatment of the investments we make, and the possibility of future changes in our circumstances, no assurance can be given that our actual results of operations for any particular taxable year will satisfy such requirements.
If we fail to qualify as a REIT in any calendar year, and do not qualify for certain statutory relief provisions, we would be required to pay U.S. federal income tax (and any applicable state and local taxes), including any applicable alternative minimum tax, on our taxable income at regular corporate rates, and dividends paid to our shareholders would not be deductible by us in computing our taxable income (although such dividends received by certain non-corporate U.S. taxpayers generally would be subject to a preferential rate of taxation). Further, if we fail to qualify as a REIT, we might need to borrow money or sell assets in order to pay any resulting tax. Our payment of income tax would decrease the amount of our income available for distribution to our shareholders. Furthermore, if we fail to maintain our qualification as a REIT, we no longer would be required under U.S. federal tax laws to distribute substantially all of our REIT taxable income to our shareholders. Unless our failure to qualify as a REIT was subject to relief under federal tax laws, we could not re-elect to qualify as a REIT until the fifth calendar year following the year in which we failed to qualify.
Complying with REIT requirements may cause us to forego or liquidate otherwise attractive investments.
To qualify as a REIT, we must continually satisfy various tests regarding the sources of our income, the nature and diversification of our assets, the amounts we distribute to our shareholders and the ownership of our shares of beneficial interest. In order to meet these tests, we may be required to forego investments we might otherwise make. We may be required to pay dividends to shareholders at disadvantageous times or when we do not have funds readily available for distribution, and may be unable to pursue investments that would be otherwise advantageous to us in order to satisfy the source of income or asset diversification requirements for qualifying as a REIT. Thus, compliance with the REIT requirements may hinder our investment performance.
In particular, we must ensure that at the end of each calendar quarter, at least 75% of the value of our total assets consists of cash, cash items, government securities and qualified REIT real estate assets, including RMBS. The remainder of our investment in securities (other than government securities and qualified real estate assets) generally cannot include more than 10% of the outstanding voting securities of any one issuer or more than 10% of the total value of the outstanding securities of any one issuer. In addition, in general, no more than 5% of the value of our total assets (other than government securities, TRS securities and qualified real estate assets) can consist of the securities of any one issuer, and no more than 25% of the value of our total assets can be represented by securities of one or more TRSs. Generally, if we fail to comply with these requirements at the end of any calendar quarter, we must correct the failure within 30 days after the end of the calendar quarter or qualify for
39
certain statutory relief provisions to avoid losing our REIT qualification and becoming subject to U.S. federal income tax (and any applicable state and local taxes) on all of our income. As a result, we may be required to liquidate from our portfolio otherwise attractive investments or contribute such investments to a TRS, in which event they will be subject to regular corporate federal, state and local taxes assuming that the TRS is organized in the United States. These actions could have the effect of reducing our income and amounts available for distribution to our shareholders.
Failure to make required distributions would subject us to tax, which would reduce the cash available for distribution to our shareholders.
To qualify as a REIT, we must distribute to our shareholders each calendar year at least 90% of our REIT taxable income (including certain items of non-cash income), determined without regard to the deduction for dividends paid and excluding net capital gain. To the extent that we satisfy the 90% distribution requirement, but distribute less than 100% of our taxable income, we will be subject to federal corporate income tax on our undistributed income. In addition, we will incur a 4% nondeductible excise tax on the amount, if any, by which our distributions in any calendar year are less than the sum of:
|
•
|
85% of our REIT ordinary income for that year;
|
|
•
|
95% of our REIT capital gain net income for that year; and
|
|
•
|
any undistributed taxable income from prior years.
|
We intend to distribute our taxable income to our shareholders in a manner intended to satisfy the 90% distribution requirement and to avoid both corporate income tax and the 4% nondeductible excise tax. However, there is no requirement that TRSs distribute their after-tax net income to their parent REIT or their shareholders.
Our taxable income may substantially exceed our net income as determined based on GAAP, because, for example, realized capital losses will be deducted in determining our GAAP net income, but may not be deductible in computing our taxable income. In addition, we may invest in assets that generate taxable income in excess of economic income or in advance of the corresponding cash flow from the assets. As a result of the foregoing, we may generate less cash flow than taxable income in a particular year. To the extent that we generate such non-cash taxable income in a taxable year, we may incur corporate income tax and the 4% nondeductible excise tax on that income if we do not distribute such income to shareholders in that year. In that event, we may be required to use cash reserves, incur debt, sell assets, make taxable distributions of our shares or debt securities or liquidate non-cash assets at rates or at times that we regard as unfavorable to satisfy the distribution requirement and to avoid corporate income tax and the 4% nondeductible excise tax in that year.
Determination of our REIT taxable income involves the application of highly technical and complex Code provisions for which only limited judicial and administrative authorities exist. If the IRS disagrees with our determination, it could affect our satisfaction of the distribution requirement. Under certain circumstances, we may be able to correct a failure to meet the distribution requirement for a year by paying "deficiency dividends" to our stockholders in a later year. We may include such deficiency dividends in our deduction for dividends paid for the earlier year. Although we may be able to avoid income tax on amounts distributed as deficiency dividends, we will be required to pay interest and a penalty to the IRS based upon the amount of any deduction we take for deficiency dividends.
Even if we qualify as a REIT, we may face other tax liabilities that reduce our cash flows.
Even if we qualify for taxation as a REIT, we may be subject to certain federal, state and local taxes on our income and assets, including taxes on any undistributed income, tax on income from some activities conducted as a result of a foreclosure, and state or local income, property and transfer taxes. In addition, any TRSs we form will be subject to regular corporate federal, state and local taxes. Any of these taxes would decrease cash available for distributions to shareholders.
The failure of RMBS subject to a repurchase agreement to qualify as real estate assets would adversely affect our ability to qualify as a REIT.
We intend to enter into repurchase agreements under which we will nominally sell certain of our RMBS to a counterparty and simultaneously enter into an agreement to repurchase the sold assets. We believe that, for U.S. federal income tax purposes, these transactions will be treated as secured debt and we will be treated as the tax owner of the RMBS that are the subject of any such repurchase agreement notwithstanding that such agreements may transfer record ownership of such assets to the counterparty during the term of the agreement. It is possible, however, that the IRS could successfully assert that we do not own the RMBS during the term of the repurchase agreement, in which case we could fail to qualify as a REIT.
40
Our ability to engage in TBA transactions could be limited by the requirements necessary to qualify as a REIT, and we could fail to qualify as a REIT as a result of these investments.
We intend to purchase or sell TBAs primarily for purposes of managing interest rate risk associated with our liabilities under repurchase agreements. We generally intend to treat such TBA purchases and sales as hedging transactions that hedge indebtedness incurred to acquire or carry real estate assets, or "qualifying liability hedges," for REIT purposes. We may, from time to time, opportunistically engage in TBA transactions because we find them attractive on their own. The law is unclear regarding whether income and gains from TBAs that are not qualifying liability hedges are qualifying income for the 75% gross income test and whether TBAs are qualifying assets for the 75% asset test.
To the extent that we engage in TBA transactions that are not qualifying liability hedges for REIT purposes, unless we receive a favorable private letter ruling from the IRS or we are advised by counsel that income and gains from such TBAs should be treated as qualifying income for purposes of the 75% gross income test, we will limit our income and gains from such TBAs and any non-qualifying income to no more than 25% of our gross income for each calendar year. Further, unless we receive a favorable private letter ruling from the IRS or we are advised by counsel that TBAs should be treated as qualifying assets for purposes of the 75% asset test, we will limit our investment in such TBAs and any non-qualifying assets to no more than 25% of our total assets at the end of any calendar quarter and will limit the TBAs held by us that are issued by any one issuer to no more than 5% of our total assets at the end of any calendar quarter. Accordingly, our ability to purchase and sell Agency RMBS through TBAs and to hold or dispose of TBAs, through roll transactions or otherwise, could be limited.
Moreover, even if we are advised by counsel that such TBAs should be treated as qualifying assets or that income and gains from such TBAs should be treated as qualifying income, it is possible that the IRS could successfully take the position that such assets are not qualifying assets and such income is not qualifying income. In that event, we could be subject to a penalty tax or we could fail to qualify as a REIT if (i) the value of our TBAs, together with our other non-qualifying assets for the 75% asset test, exceeded 25% of our total assets at the end of any calendar quarter, (ii) the value of our TBAs issued by any one issuer exceeds 5% of our total assets at the end of any calendar quarter, or (iii) our income and gains from our TBAs that are not qualifying liability hedges, together with our non-qualifying income for the 75% gross income test, exceeded 25% of our gross income for any taxable year.
Complying with REIT requirements may limit our ability to hedge effectively.
The REIT provisions of the Code substantially limit our ability to hedge. Our aggregate gross income from non-qualifying hedges, fees, and certain other non-qualifying sources cannot exceed 5% of our annual gross income. As a result, we might have to limit our use of advantageous hedging techniques or implement those hedges through a TRS. Any hedging income earned by a TRS would be subject to federal, state and local income tax at regular corporate rates. This could increase the cost of our hedging activities or expose us to greater risks associated with interest rate changes or other changes than we would otherwise want to bear.
Our ownership of and relationship with any TRSs that we form will be limited and a failure to comply with the limits would jeopardize our REIT status and may result in the application of a 100% excise tax.
A REIT may own up to 100% of the stock of one or more TRSs. A TRS may earn income that would not be qualifying income if earned directly by the parent REIT. Both the subsidiary and the REIT must jointly elect to treat the subsidiary as a TRS. A corporation (other than a REIT) of which a TRS directly or indirectly owns more than 35% of the voting power or value of the stock will automatically be treated as a TRS. Overall, no more than 25% of the value of a REIT's total assets may consist of stock or securities of one or more TRSs. A domestic TRS will pay federal, state and local income tax at regular corporate rates on any income that it earns. In addition, the TRS rules limit the deductibility of interest paid or accrued by a TRS to its parent REIT to assure that the TRS is subject to an appropriate level of corporate taxation. The rules also impose a 100% excise tax on certain transactions between a TRS and its parent REIT that are not conducted on an arm's-length basis. Any domestic TRS that we may form will pay federal, state and local income tax on its taxable income, and its after-tax net income will be available for distribution to us but is not required to be distributed to us unless necessary to maintain our REIT qualification.
Our ownership limitation may restrict change of control or business combination opportunities in which our shareholders might receive a premium for their common shares.
In order for us to qualify as a REIT for each taxable year after 2013, no more than 50% in value of our outstanding shares may be owned, directly or indirectly, by five or fewer individuals during the last half of any calendar year. "Individuals" for this purpose include natural persons, private foundations, some employee benefit plans and trusts, and some charitable trusts. In order to help us qualify as a REIT, among other purposes, our declaration of trust generally prohibits any person from beneficially or constructively owning more than 9.8% in value or in number of shares, whichever is more restrictive, of the outstanding shares of any class or series of our shares.
41
The ownership limitation and other restrictions could have the effect of discouraging a takeover or other transaction in which holders of our common shares might receive a premium for their common shares over the then-prevailing market price or which holders might believe to be otherwise in their best interests.
Dividends payable by REITs do not qualify for the reduced tax rates available for some dividends.
The maximum tax rate applicable to "qualified dividend income" payable to U.S. taxpayers taxed at individual rates is 20%. Dividends payable by REITs, however, generally are not eligible for the reduced rates on qualified dividend income. The more favorable rates applicable to regular corporate qualified dividends could cause investors who are taxed at individual rates to perceive investments in the stocks of REITs to be relatively less attractive than investments in the stocks of non-REIT corporations that pay dividends treated as qualified dividend income, which could adversely affect the value of the stock of REITs, including our common shares.
We may be subject to adverse legislative or regulatory tax changes that could reduce the market price of our common shares.
At any time, the U.S. federal income tax laws or regulations governing REITs or the administrative interpretations of those laws or regulations may be amended. We cannot predict when or if any new U.S. federal income tax law, regulation or administrative interpretation, or any amendment to any existing U.S. federal income tax law, regulation or administrative interpretation, will be adopted, promulgated or become effective and any such law, regulation or interpretation may take effect retroactively. We and our shareholders could be adversely affected by any such change in, or any new, U.S. federal income tax law, regulation or administrative interpretation.
Certain financing activities may subject us to U.S. federal income tax and could have negative tax consequences for our shareholders.
We currently do not intend to enter into any transactions that could result in our, or a portion of our assets, being treated as a taxable mortgage pool for U.S. federal income tax purposes. If we enter into such a transaction in the future we will be taxable at the highest corporate income tax rate on a portion of the income arising from a taxable mortgage pool, referred to as "excess inclusion income," that is allocable to the percentage of our shares held in record name by disqualified organizations (generally tax-exempt entities that are exempt from the tax on unrelated business taxable income, such as state pension plans and charitable remainder trusts and government entities). In that case, under our declaration of trust, we could reduce distributions to such shareholders by the amount of tax paid by us that is attributable to such shareholder's ownership.
If we were to realize excess inclusion income, IRS guidance indicates that the excess inclusion income would be allocated among our shareholders in proportion to our dividends paid. Excess inclusion income cannot be offset by losses of our shareholders. If the shareholder is a tax-exempt entity and not a disqualified organization, then this income would be fully taxable as unrelated business taxable income under Section 512 of the Code. If the shareholder is a foreign person, it would be subject to U.S. federal income tax at the maximum tax rate and withholding will be required on this income without reduction or exemption pursuant to any otherwise applicable income tax treaty.
Our recognition of "phantom" income may reduce a shareholder's after-tax return on an investment in our common shares.
We may recognize taxable income in excess of our economic income, known as phantom income, in the first years that we hold certain investments, and experience an offsetting excess of economic income over our taxable income in later years. As a result, shareholders at times may be required to pay U.S. federal income tax on distributions taxable as dividends that economically represent a return of capital rather than a dividend. These distributions would be offset in later years by distributions that would be treated as returns of capital for U.S. federal income tax purposes. Taking into account the time value of money, this acceleration of U.S. federal income tax liabilities may reduce a shareholder's after-tax return on his or her investment to an amount less than the after-tax return on an investment with an identical before-tax rate of return that did not generate phantom income.
Liquidation of our assets may jeopardize our REIT qualification.
To qualify and maintain our qualification as a REIT, we must comply with requirements regarding our assets and our sources of income. If we are compelled to liquidate our assets to repay obligations to our lenders or for other reasons, we may be unable to comply with these requirements, thereby jeopardizing our qualification as a REIT, or we may be subject to a 100% tax on any resultant gain if we sell assets that are treated as inventory or property held primarily for sale to customers in the ordinary course of business.
42
Our qualification as a REIT and exemption from U.S. federal income tax with respect to certain assets may be dependent on the accuracy of legal opinions or advice rendered or given or statements by the issuers of assets that we acquire, and the inaccuracy of any such opinions, advice or statements may adversely affect our REIT qualification and result in significant corporate-level tax.
When purchasing securities, we may rely on opinions or advice of counsel for the issuer of such securities, or statements made in related offering documents, for purposes of determining whether such securities represent debt or equity securities for U.S. federal income tax purposes, the value of such securities, and also to what extent those securities constitute qualified real estate assets for purposes of the REIT asset tests and produce income which qualifies under the 75% gross income test. The inaccuracy of any such opinions, advice or statements may adversely affect our REIT qualification and result in significant corporate-level tax.
None.
We do not own any properties. Our principal offices are located in leased space at 53 Forest Avenue, Old Greenwich, CT 06870. The offices of our Manager and Ellington are at the same location. As part of our management agreement, our Manager is responsible for providing offices necessary for all operations, and accordingly, all lease responsibilities belong to our Manager.
Neither we nor our Manager is currently subject to any legal proceedings that we or our Manager considers to be material. Nevertheless, at any time, industry-wide or company-specific regulatory inquiries or proceedings can be initiated and we cannot predict when or if any such regulatory inquiries or proceedings will be initiated that involve us, Ellington, or its affiliates, including our Manager. See "Risk Factors—We, Ellington, or its affiliates may be subject to regulatory inquiries or proceedings." Ellington and its affiliates have, over the years, received, and we expect in the future that they may receive, inquiries and requests for documents and information from various regulators.
We can give no assurances that regulatory inquiries will not result in investigations of Ellington or its affiliates or enforcement actions, fines or penalties or the assertion of private litigation claims against Ellington or its affiliates. In the event regulatory inquiries were to result in investigations, enforcement actions, fines, penalties, or the assertion of private litigation claims against Ellington or its affiliates, our Manager's ability to perform its obligations to us under the Management Agreement between us and our Manager, or Ellington's ability to perform its obligations to our Manager under the services agreement between Ellington and our Manager, could be adversely impacted, which could in turn have a material adverse effect on our business, financial condition and results of operations, and our ability to make distributions to our shareholders.
Not applicable.
43
Market Information
Our common shares have been listed on the New York Stock Exchange ("NYSE") under the symbol "EARN" since May 1, 2013. The following table sets forth, for the periods indicated, the high and low sales prices for the Company's common shares, as reported by the NYSE:
|
Common Stock Sales Price
|
||||||||
|
2013:
|
High
|
Low
|
||||||
|
For the period from May 1, 2013 to June 30, 2013
|
$
|
19.85
|
|
$
|
16.50
|
|
||
|
Third Quarter
|
$
|
17.98
|
|
$
|
13.94
|
|
||
|
Fourth Quarter
|
$
|
16.55
|
|
$
|
14.26
|
|
||
The closing price for our common shares, as reported by the NYSE on March 14, 2014, was $17.74.
Holders of Our Common Shares
Based upon a review of a securities position listing as of March 14, 2014, we had an aggregate of 87 holders of record and holders of our common shares who are nominees for an undetermined number of beneficial owners.
Dividends
To qualify as a REIT, we must distribute annually to our shareholders an amount at least equal to 90% of our REIT taxable income, determined without regard to the deduction for dividends paid and excluding any net capital gain. We currently expect to distribute substantially all of our REIT taxable income to our shareholders. We will be subject to income tax on our taxable income that is not distributed and to an excise tax to the extent that certain percentages of our taxable income are not distributed by specified dates.
We pay dividends only upon the authorization of our Board of Trustees. Our ability to pay dividends to our shareholders will depend upon the performance of our investment portfolio, and, in turn, upon our Manager's management of our business. Dividends will be paid in cash to the extent that cash is available for distribution. We may not be able to generate sufficient net interest income to pay dividends to our shareholders. In addition, our Board of Trustees may change our distribution policy in the future.
To the extent that our cash available for distribution is less than the amount required to be distributed under the REIT provisions of the Code, we may consider various funding sources to cover any shortfall, including selling certain of our assets, borrowing funds, or using a portion of the net proceeds we receive from offerings of our common shares (and thus all or a portion of such distributions may constitute a return of capital for U.S. federal income tax purposes). We also may elect to pay all or a portion of any dividend in the form of a taxable distribution of our shares or debt securities.
The following table sets forth the dividends per share we have paid to our shareholders with respect to the periods indicated.
|
Dividend Per Share
|
Record Date
|
Payment Date
|
||||||
|
For the year ended December 31, 2013:
|
||||||||
|
First Quarter
(1)
|
$
|
—
|
|
N/A
|
N/A
|
|||
|
Second Quarter
|
$
|
0.14
|
|
June 28, 2013
|
July 26, 2013
|
|||
|
Third Quarter
|
$
|
0.50
|
|
September 27, 2013
|
October 25, 2013
|
|||
|
Fourth Quarter
|
$
|
0.50
|
|
December 31, 2013
|
January 27, 2014
|
|||
|
(1)
|
On April 18, 2013, the Company's Board of Trustees declared a 3.7066% stock dividend (58,378 shares) distributable to shareholders of record as of March 31, 2013, using a price of $20.38 per share. The stock dividend was retrospectively applied to the periods reflected in the consolidated financial statements included in this Annual Report on Form 10-K.
|
We cannot assure you that we will pay any future dividends to our shareholders and the dividends set forth in the table above are not intended to be indicative of the amount and timing of future dividends, if any.
44
Purchases of Equity Securities
On August 13, 2013, the Company's Board of Trustees approved the adoption of a $10 million share repurchase program. The program, which is open-ended in duration, allows the Company to make repurchases from time to time on the open market or in negotiated transactions. Repurchases are at the Company's discretion, subject to applicable law, share availability, price, and the Company's financial performance, among other considerations. To date, the Company has not repurchased any shares under the plan.
Performance
This performance graph is furnished and shall not be deemed filed with the SEC or subject to Section 18 of the Securities Exchange Act of 1934, nor shall it be deemed incorporated by reference in any of our filings under the Securities Act of 1933, as amended.
The following graph provides a comparison of the cumulative total return on our common shares to the cumulative total return on the Standard & Poor's 500 Composite Stock Price Index (the "S&P 500") and the FTSE National Association of Real Estate Investment Trusts Mortgage REIT Index (the "FTSE NAREIT MREIT"). The comparison is for the period from May 1, 2013, the day our common shares commenced trading on the NYSE, to December 31, 2013, and assumes in each case, a $100 investment on May 1, 2013 and the reinvestment of dividends.
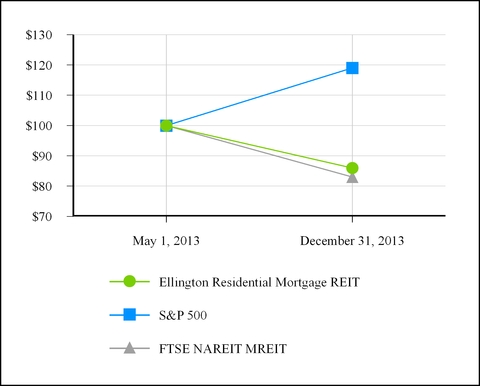
The actual cumulative total returns shown on the graph above are as follows:
|
May 1, 2013
|
December 31, 2013
|
||||||
|
Ellington Residential Mortgage REIT
|
$
|
100.00
|
|
$
|
85.95
|
|
|
|
S&P 500
|
$
|
100.00
|
|
$
|
118.52
|
|
|
|
FTSE NAREIT MREIT
|
$
|
100.00
|
|
$
|
83.44
|
|
|
45
The following table presents selected consolidated financial information as of December 31, 2013 and 2012, and for the year ended December 31, 2013 and the period from September 25, 2012 (commencement of operations) to December 31, 2012. The consolidated financial information presented below as of December 31, 2013 and 2012 and for the year ended December 31, 2013 and the period from September 25, 2012 (commencement of operations) to December 31, 2012, has been derived from our audited financial statements included elsewhere in this Annual Report.
Since the information presented below is only selected financial data and does not provide all of the information contained in our historical consolidated financial statements included elsewhere in this Annual Report, including the related notes, you should read it in conjunction with "Item 7. Management's Discussion and Analysis of Financial Condition and Results of Operations," and our historical consolidated financial statements, including the related notes to our consolidated financial statements, included in this Annual Report.
|
(In thousands except for per share amounts)
|
Year Ended
December 31, 2013
|
September 25, 2012 (commencement of operations) to
December 31, 2012
|
||||||
|
Net Interest Income
|
||||||||
|
Net interest income
|
$
|
24,810
|
|
$
|
239
|
|
||
|
Expenses
|
||||||||
|
Management fees
|
2,066
|
|
124
|
|
||||
|
Professional fees
|
624
|
|
125
|
|
||||
|
Organizational expenses
|
—
|
|
568
|
|
||||
|
Other operating expenses
|
1,636
|
|
45
|
|
||||
|
Total Expenses
|
4,326
|
|
862
|
|
||||
|
Other Income (Loss)
|
||||||||
|
Net realized and change in net unrealized gains (losses) on real estate securities
|
(63,602
|
)
|
87
|
|
||||
|
Net realized and change in net unrealized gains (losses) on financial derivatives
|
41,204
|
|
—
|
|
||||
|
Total Other Income (Loss)
|
(22,398
|
)
|
87
|
|
||||
|
Net Loss
|
$
|
(1,914
|
)
|
$
|
(536
|
)
|
||
|
Net Loss Per Common Share
|
$
|
(0.29
|
)
|
$
|
(0.33
|
)
|
||
46
|
(In thousands except share amounts)
|
December 31, 2013
|
December 31, 2012
|
||||||
|
Assets
|
Expressed in U.S. Dollars
|
|||||||
|
Cash and cash equivalents
|
$
|
50,112
|
|
$
|
18,161
|
|
||
|
Real estate securities, at fair value
|
1,326,036
|
|
13,596
|
|
||||
|
Due from brokers
|
18,347
|
|
—
|
|
||||
|
Financial derivatives–assets, at fair value
|
34,963
|
|
—
|
|
||||
|
Receivable for securities sold
|
76,692
|
|
—
|
|
||||
|
Interest receivable
|
4,766
|
|
39
|
|
||||
|
Other assets
|
174
|
|
360
|
|
||||
|
Total Assets
|
$
|
1,511,090
|
|
$
|
32,156
|
|
||
|
Liabilities and Shareholders' Equity
|
||||||||
|
Liabilities
|
||||||||
|
Repurchase agreements
|
$
|
1,310,347
|
|
$
|
—
|
|
||
|
Payable for securities purchased
|
2,776
|
|
—
|
|
||||
|
Due to brokers
|
22,788
|
|
—
|
|
||||
|
Financial derivatives–liabilities, at fair value
|
1,069
|
|
—
|
|
||||
|
Dividend payable
|
4,570
|
|
—
|
|
||||
|
Accrued expenses
|
996
|
|
1,076
|
|
||||
|
Management fee payable
|
600
|
|
116
|
|
||||
|
Interest payable
|
764
|
|
—
|
|
||||
|
Total Liabilities
|
1,343,910
|
|
1,192
|
|
||||
|
Shareholders' Equity
|
||||||||
|
Preferred shares, par value $0.01 per share, 100,000,000 shares authorized;
(0 shares issued and outstanding, respectively)
|
—
|
|
—
|
|
||||
|
Common shares, par value $0.01 per share, 500,000,000 shares authorized;
(9,139,842 and 1,633,378 shares issued and outstanding, respectively)
|
91
|
|
16
|
|
||||
|
Additional paid-in-capital
|
181,147
|
|
32,674
|
|
||||
|
Accumulated deficit
|
(14,058
|
)
|
(1,726
|
)
|
||||
|
Total Shareholders' Equity
|
167,180
|
|
30,964
|
|
||||
|
Total Liabilities and Shareholders' Equity
|
$
|
1,511,090
|
|
$
|
32,156
|
|
||
In this Annual Report on Form 10-K, except where the context suggests otherwise, "EARN," "we," "us," and "our" refer to Ellington Residential Mortgage REIT and its subsidiaries, our "Manager" refers to Ellington Residential Mortgage Management LLC, our external manager, and "Ellington" refers to Ellington Management Group, L.L.C. and its affiliated investment advisory firms.
The common shares outstanding and per share amounts discussed in this Management's Discussion and Analysis of Financial Condition and Results of Operations reflect the 3.7066% common share dividend declared by our Board of Trustees on April 18, 2013, resulting in the distribution of an additional 58,378 common shares which was retrospectively applied for financial statement reporting purposes.
Executive Summary
We are a Maryland real estate investment trust, or "REIT," formed in August 2012 that specializes in acquiring, investing in, and managing residential mortgage- and real estate-related assets. Our primary objective is to generate attractive current yields and risk-adjusted total returns for our shareholders by making investments that we believe compensate us appropriately for the risks associated with them. We seek to attain this objective by constructing and actively managing a portfolio comprised primarily of Agency residential mortgage-backed securities, or "RMBS," and, to a lesser extent, non-Agency RMBS. We also may opportunistically acquire and manage other types of residential mortgage-related and real estate-related asset classes, such
47
as residential mortgage loans, and mortgage servicing rights, or "MSRs." We believe that being able to combine Agency RMBS with non-Agency RMBS and other residential mortgage- and real estate-related asset classes enables us to balance a range of mortgage-related risks.
We were formed through an initial strategic venture among affiliates of Ellington, an investment management firm and registered investment adviser with a 19-year history of investing in a broad spectrum of mortgage-backed securities and related derivatives, with an emphasis on the RMBS market, and the Blackstone Tactical Opportunity Funds, or the "Blackstone Funds." These initial investors made an aggregate investment of approximately $31.5 million on September 25, 2012. On May 1, 2013, we priced an initial public offering of our common shares, pursuant to which we sold 6,450,000 shares to the public at a price of $20.00 per share. Concurrent with the initial public offering, we completed a private placement of 1,050,000 common shares to our initial investors at a purchase price of $20.00 per share which generated gross proceeds of $21.0 million. No further capital commitments from the initial investors remain as a result of this private placement. Total gross proceeds to us from the initial public offering and concurrent private placement were $150.0 million. Proceeds to us, net of offering costs, were approximately $148.5 million.
We are externally managed and advised by our Manager, an affiliate of Ellington.
We use leverage in our Agency RMBS strategy and, to a lesser extent, in our non-Agency RMBS strategy as well. As of December 31, 2012, we had no outstanding borrowings; however, in April 2013, we began purchasing Agency RMBS on a leveraged basis. We have financed our purchases of Agency RMBS exclusively through repurchase agreements, which we account for as collateralized borrowings. As of December 31, 2013, we had outstanding borrowings under repurchase agreements in the amount of $1.3 billion.
We made the election to be taxed as a corporation effective for the short taxable period May 1, 2013 through December 31, 2013. In addition, we intend to elect to be taxed as a REIT for U.S. federal income tax purposes for the short taxable period May 1, 2013 through December 31, 2013. Accordingly, we generally will not be subject to U.S. federal income taxes on our taxable income that we distribute currently to our shareholders as long as we maintain our intended qualification as a REIT. We intend to conduct our operations so that neither we nor any of our subsidiaries is required to register as an investment company under the Investment Company Act of 1940, as amended.
As of December 31, 2013, our book value per share was $18.29, as compared to $18.96 as of December 31, 2012.
Trends and Recent Market Developments
Key trends and recent market developments for the mortgage-backed security, or "MBS," market include the following:
|
•
|
Federal Reserve and Monetary Policy—
In December 2013, the U.S. Federal Reserve, or the "Federal Reserve," announced its intention to reduce, beginning in January 2014, the pace of its asset purchases under its accommodative monetary policies; the timing and degree of the Federal Reserve's reduction in asset purchases, or "taper," had been the subject of heightened market speculation since mid-2013;
|
|
•
|
Housing and Mortgage Market Statistics—
Data released by S&P Indices for its S&P/Case-Shiller Home Price Indices for December 2013 showed that, on average, home prices had increased from December 2012 by 13.6% for its 10-City Composite and by 13.4% for its 20-City Composite, resulting in its best calendar year return since 2005; meanwhile, the Freddie Mac survey 30-year mortgage rate ended the year at 4.48%, up 34% from its 3.35% level at the end of 2012;
|
|
•
|
Prepayment Rate Trends—
As mortgage rates have risen over the course of the last half of 2013, Agency prepayment rates have declined
;
|
|
•
|
Government Sponsored Enterprise, or "GSE," Developments—
On December 10, 2013, the U.S. Senate confirmed Mel Watt as the next head of the Federal Housing Finance Agency, or "FHFA,";
|
|
•
|
Bank Regulatory Capital—
Recent proposed changes, if finalized, will increase regulatory capital requirements for the largest, most systemically significant U.S. banks and their holdings companies; this could potentially alter these institutions' appetite for various risk-taking activities, and could ultimately affect the terms and availability of our repurchase agreement, or "repo," financing; and
|
|
•
|
Portfolio Overview, Liquidity, and Valuations—
During 2013, Agency RMBS experienced a heightened level of volatility as uncertainty and speculation around future actions of the Federal Reserve dominated the market, while non-Agency RMBS rallied for most of 2013 as underlying strength in housing market data continued to provide support to valuations.
|
48
Federal Reserve and Monetary Policy
In December 2013 and then again in January 2014, the Federal Reserve announced reductions in its purchases of Agency RMBS and U.S. Treasury securities under its monthly asset purchase program. Prior to these "taper" announcements, and since September 2012, the Federal Reserve had been purchasing long-dated U.S. Treasury securities and Agency RMBS assets at the pace of $85 billion per month-comprised of $45 billion of U.S. Treasury securities and $40 billion of Agency RMBS. Based on the December and January announcements, the combined monthly reduction in asset purchases amounts to $20 billion, split evenly between Agency RMBS and U.S. Treasury securities. The Federal Reserve continues to reinvest principal payments from these holdings into additional asset purchases. The decision to reduce the pace of monthly purchases to $65 billion was made by the Federal Reserve in light of its view that the broader economy has strengthened considerably. To the extent that labor market conditions continue to improve and inflation remains near desired levels, the Federal Reserve has noted that it will likely continue to reduce the pace of asset purchases in further measured steps at future meetings. Notwithstanding the improvements in the economy, the Federal Reserve continues to express concern that inflation persistently below its 2% objective could pose risks to economic performance.
In addition to announcing its intention to reduce its monthly asset purchases, the Federal Reserve reiterated its intention to maintain the target range for the federal funds rate at 0% to 0.25% as long as the unemployment rate remains above 6.5% and as long as the inflation rate over the next one to two years is projected to be no more than a half a percentage point above the Federal Open Market Committee's, or "FOMC," 2% longer-run goal. However, as the unemployment rate is actually approaching 6.5%, the Federal Reserve has noted that it would soon be appropriate for the FOMC to change its forward guidance in order to provide information about its decisions regarding the federal funds rate after that threshold is crossed. The asset purchase program and the maintenance of a low federal funds rate, among various other measures, were put into place by the Federal Reserve in response to the elevated level of U.S. unemployment and the slow pace of the economic recovery in the aftermath of the 2008 financial crisis. The stated goal of the Federal Reserve's actions, in implementing these policies, was to maintain downward pressure on longer-term interest rates, support mortgage markets, and help to make broader financial conditions more accommodative.
During the middle and second half of 2013, as the U.S. unemployment rate declined and the economy continued to show signs of improvement, market speculation about the timing of a decision by the Federal Reserve to taper its monthly asset purchases caused interest rates to rise and prices of long-dated U.S. Treasury securities and Agency RMBS to fall. In fact, all major fixed income sectors experienced substantial price declines during this period, including U.S. Treasury securities, Agency RMBS, and to a lesser extent credit-sensitive sectors such as high-yield corporate bonds and non-Agency MBS. Agency RMBS were especially hard-hit through the end of the year, as heavy selling by mutual bond funds, exchange-traded funds, and mortgage REITs exacerbated the price declines and overall volatility. By December 31, 2013, the benchmark 10-year U.S. Treasury yield had risen to 3.03%, up from 1.76% as of December 31, 2012.
Following the December 2013 and January 2014 taper announcements, interest rates declined significantly. By February 28, 2014, the 10-year U.S. Treasury yield had fallen back to 2.65%, and prices of Agency RMBS have rallied as a result. As an example the price of TBA 30-year Fannie Mae 3.5%, a widely traded Agency RMBS, rose to 101.42 as of February 28, 2014, up from 99.36 as of December 31, 2013. The decline in interest rates is likely due, at least in part, to a market perception of a lower level of uncertainty around future Federal Reserve actions.
Notwithstanding the recent decline in interest rates and the greater clarity around Federal Reserve asset purchasing activities, we believe that there remains substantial risk that interest rates could begin to rise again. This reinforces the importance of our ability to hedge interest rate risk using a variety of tools, including TBAs, interest rate swaps, and various other instruments.
Housing and Mortgage Market Statistics
The following table demonstrates the decline in residential mortgage delinquencies and foreclosure inventory on a national level, as reported by CoreLogic in its December 2013 National Foreclosure Report:
|
As of
|
||||||
|
Number of Units
(In thousands)
|
December 2013
|
December 2012
|
||||
|
Seriously Delinquent Mortgages
(1)
|
1,978
|
|
2,637
|
|
||
|
Foreclosure Inventory
|
837
|
|
1,217
|
|
||
|
(1)
|
Seriously Delinquent Mortgages are ninety days and over in delinquency and include foreclosures and REO property.
|
As the above table indicates, both the number of seriously delinquent mortgages and the number of homes in foreclosure have declined significantly over the past year. This decline supports the thesis that as homeowners have re-established equity in their homes through recovering real estate prices, they have become less likely to become delinquent and default on their
49
mortgages.
Another interesting development can be seen in monthly delinquency roll rate statistics, as shown in the following table:
|
As of
|
||||||
|
Roll Rates (3 Month Moving Average)
|
October 2013
|
July 2013
|
||||
|
Current to 90+
|
0.37
|
%
|
0.35
|
%
|
||
|
90+ to Foreclosure
|
5.06
|
%
|
4.51
|
%
|
||
|
Foreclosure to Current
|
1.80
|
%
|
1.07
|
%
|
||
Note: Current includes loans that are 30 and 60 days delinquent; 90+ excludes foreclosures and REO property.
Roll rates represent the rates at which mortgages move from one category to another toward foreclosure. As can be seen in the table above, between July 2013 and October 2013, the rate at which mortgages have been rolling from current to 90+ days delinquent has grown from 0.35% in July to 0.37% in October. We view these levels as generally indicative of a healthy mortgage environment. The rise in transition speeds from 90+ days delinquent to foreclosure is mainly attributable to the declining supply of delinquent mortgages, rather than the ability of courts and servicers to initiate a greater number of foreclosure proceedings. The large increase in cure rates (foreclosure to current) for mortgages in foreclosure is in large part the result of increased loan modification rates that have accompanied large-scale servicing transfers in recent months from less efficient to more efficient servicers.
Data released by S&P Indices for its S&P/Case-Shiller Home Price Indices for December 2013 showed that, on average, home prices had increased from December 31, 2012 by 13.6% for its 10-City Composite and by 13.4% for its 20-City Composite, resulting in its best calendar year return since 2005. Compared to November 2013, the 10-City Composite remained relatively unchanged, while the 20-City Composite declined 0.1%. According to the report, home prices remain below the peak levels of 2006, but, on average, are back to their late-2004 levels for both the 10- and 20-City Composites. As additional evidence of an improving housing market, single-family housing starts have increased 9.8% as compared to one year ago, up from 620,000 starts in December 2012 to 681,000 starts in December 2013. Finally, as indicated in the table above, as of December 2013 the national inventory of foreclosed homes fell to 837,000 units, a 31% decline when compared to December 2012; this represented the twenty-sixth consecutive month with a year-over-year decline and the lowest level in six years. As a result, there are much fewer unsold foreclosed homes overhanging the housing market than there were a year ago. While the recent increase in interest rates and the slow and uneven pace of the recovery of the U.S. economy continue to create potential risks to the recovering housing market, mortgage rates remain near all-time historical lows and, recent trends continue to indicate, on balance, that the recovery in the housing market continues on a strong footing. We believe that near-term home price trends are more likely to be driven by fundamental factors such as economic growth, mortgage rates, and affordability, rather than by technical factors such as shadow inventory.
The Freddie Mac survey 30-year mortgage rate ended 2013 at 4.48%, up 34% for the year. Not surprisingly, the Refinance Index published by the Mortgage Bankers Association, or "MBA," declined approximately 63% from the prior year end, and similarly the Market Composite Index, a measure of mortgage application volume, declined approximately 48% from the prior year end.
Higher interest rates reduce housing affordability. Even with the rise in interest rates last year, housing is still inexpensive relative to historical averages based purely on debt-service-to-income ratios; however, after factoring in other metrics such as home-price-to-income ratios, U.S. housing affordability actually appears to be nearing equilibrium levels, implying that the potential for future home price increases may be limited. In fact, if mortgage rates were to unexpectedly rise significantly from current levels, the recent upward trend in housing prices could potentially even reverse.
On March 7, 2014, the U.S. Department of Labor reported that the U.S. unemployment rate was 6.7% in February 2014. While the consensus for future job growth is generally mildly positive, the recent declines in the unemployment rate are also partially attributable to a reduction in the labor force participation rate. While it is difficult to quantify the relationship between the unemployment rate and the housing and mortgage markets, we believe that current levels of unemployment do not represent a significant impediment to a continuing housing recovery.
Prepayment Rate Trends
The relatively muted level of prepayment activity as interest rates broadly declined in recent years has in large part been the result of: (i) home price declines during the financial crisis, which has left many borrowers with minimal or negative home equity; (ii) more restrictive underwriting guidelines, even for refinancings; (iii) increased origination costs, especially related to underwriting and compliance; and (iv) increases in Agency guarantee fees. These factors have resulted in substantial variations
50
in prepayment rates between Agency pools as a function of loan-to-value ratio, loan balance, credit score, geography, property type, loan purpose, and other factors. In recognition of the importance of these underlying characteristics on prepayment behavior, the MBS market continues to promote the creation of "specified" Agency pools that emphasize or de-emphasize many of these characteristics (such as pools where the principal balance of every underlying mortgage loan is below $85,000). The Making Homes Affordable, or "MHA," refinancing program, which was initiated in response to the housing market crisis, has facilitated the origination of many of these kinds of specified Agency pools. The extension of the MHA refinancing program into 2015 should sustain creation of such pools in the coming years. We expect that the ongoing origination of Agency pools with a wide variety of loan characteristics will continue to create opportunities for us to exploit the resulting differences in prepayments.
The recent rise in mortgage rates has, as expected, caused a significant decline in Agency RMBS prepayment speeds, with higher coupon RMBS impacted the most. To the extent mortgage rates remain at current levels, it is likely that prepayments speeds will remain somewhat muted. With respect to existing Agency RMBS, this introduces significant extension risk to a market that had only recently been focused almost exclusively on the risk of accelerated prepayments.
GSE Developments
In late October, both Fannie Mae and Freddie Mac announced a slight relaxation of the May 2009 loan cut-off date for refinancing under the Home Affordability Refinance Program, or "HARP." The new terms now base eligibility on loan origination dates, as opposed to the dates that loans were originally delivered to the GSEs. There have been additional discussions regarding whether to extend the cut-off date even further, or relax other HARP requirements.
On December 10, 2013, the U.S. Senate confirmed Mel Watt's nomination as the next head of the FHFA and he took office on January 6, 2014. The first impact of his appointment came in late December, when it was announced that he intended to delay and re-evaluate the implementation of departing FHFA Director Ed DeMarco's initiative to raise guarantee fees, or "g-fees," on new Fannie Mae and Freddie Mac business. G-fees are the fees charged by the GSEs to include mortgage loans in Agency pools, and thereby insure the mortgage loan against loss. Since these fees are passed on to borrowers whose loans are originated for inclusion in Agency pools, increased g-fees have the effect of reducing housing affordability for GSE borrowers, but potentially makes it more attractive for private lenders to replace the GSEs. The g-fee announcement hurt performance of near-the-money Agency coupons, such as 4.5% and 5.0% pools, as muted expectations of g-fee increases are suggestive of potentially faster prepayment speeds. Director Watt's confirmation has created a number of additional policy concerns in the Agency RMBS market, as he is perceived as likely to pursue policy agendas that will make the expansion of housing affordability a priority, potentially at the expense of Agency RMBS investors. For example, Watt is expected to seriously consider establishing some principal forgiveness programs for GSE-guaranteed loans; his predecessor Ed DeMarco was unwaveringly against principal forgiveness. If implemented, such principal forgiveness programs would likely start out by targeting the most at-risk borrowers, reducing default risk on high loan-to-value pools and pools concentrated in the most distressed geographies. In another departure from his predecessor, Watt is less likely to implement the loan-limit reductions for the GSEs that were proposed for comment by DeMarco in late 2013. Watt is also more likely to reduce loan-level price adjustments, or "LLPAs," and loosen other underwriting standards. Currently the GSEs apply various LLPAs to justify the cost of guaranteeing riskier loans. Lower LLPAs would make it easier for less creditworthy borrowers to obtain loans, whether for home purchases or for refinancings, thus helping promote Watt's likely agenda of assisting less creditworthy borrowers. The combination of the potential for increased prepayment speeds resulting from these potential policy changes, and a lack of clarity on specifically how FHFA policies might change, has cast uncertainty over the Agency RMBS markets.
Bank Regulatory Capital Changes
Upcoming changes in banking regulations could impact MBS and ABS pricing, as well as the availability and cost of financing of MBS and ABS assets. The Federal Reserve's current implementation of the Basel III rules on bank Supplementary Leverage Ratios, or "SLRs," will significantly curtail the extent to which banks will be permitted to net certain repo and reverse repo agreements against each other when calculating their capital requirements. As a consequence, in an effort to maximize return on equity, banks may be incentivized to reduce their repo financing operations, especially for lower-cost financings such as those involving U.S. Treasury securities and Agency RMBS. Full implementation of Basel III regulations, in particular the carve-out rules related to accumulated other comprehensive income, or "AOCI," are likely to reduce bank demand for assets with higher duration, and as a result could hurt the liquidity of the tradable MBS market. Under AOCI carve-out rules, banks with more than $250 billion in assets will be required to include mark-to-market gains and losses on available-for-sale, or "AFS," securities when calculating their Tier 1 capital. This incentivizes banks to hold Agency RMBS in held-to-maturity, or "HTM," and other illiquid assets, effectively locking more bank-held Agency RMBS out of the tradable market, and thus reducing market liquidity. In addition, banks will likely want to reduce the risk of their AFS securities holdings, which will incentivize them to hold lower duration assets such as 15-year Agency RMBS. While our access to repo financing has not been adversely affected to date, it is still possible that certain of our lending institutions could, in the future, decide to curtail their
51
repo lending activities in response to these developments, particularly in connection with repo financing on Agency RMBS, which typically provides lower profit margins. However, it is also possible that these changes will create opportunities for smaller banks and/or non-bank lenders to enter the repo financing market, and in fact we continue to see smaller broker-dealers becoming more active in the Agency pool repo financing market.
Portfolio Overview, Liquidity and Valuations
Over the course of the late second quarter and the remaining months of 2013, the Agency RMBS market was among the most volatile and poorly performing fixed income sectors, as the market anticipated a tapering by the Federal Reserve of purchases under its asset purchase program. "Specified" Agency RMBS pools, or pools with prepayment protection characteristics were particularly hard hit. As interest rates have risen over the course of the year, prepayments have declined, thereby reducing the perceived value of the prepayment protection in many specified pools. These specified pools have generally underperformed TBAs, their generic counterparts. A big factor contributing to this underperformance is that the Federal Reserve, which is by far the largest purchaser of Agency pools, generally purchases TBAs, not specified pools. Specified pools have also suffered from reduced demand by Agency mortgage REITs, as these companies have lowered their leverage in response to increased interest rate volatility, and as they have been effectively unable to raise additional equity capital to increase their asset base. Finally, with interest rates higher, specified pools now have a longer duration (and therefore greater price fluctuation) than they have had in the recent past; as a result, they may become less attractive assets for large U.S. banks to hold in light of recent changes to regulatory capital rules, which will essentially force these banks to charge unrealized losses on AFS assets against their regulatory capital.
While the $10 billion taper announced by the Federal Reserve in December 2013 was considered modest, it removed some level of uncertainty from the market, and in response, Agency RMBS yield spreads re-tightened. Late in January, the Federal Reserve announced an additional $10 billion reduction in its monthly asset purchases, beginning in February 2014. Similar to the December 2013 reduction, this reduction will also be evenly split between Agency RMBS and U.S. Treasury securities. Notwithstanding the total $10 billion drop in the monthly pace of its Agency pool purchases-a 25% drop from its 2013 pace-the Federal Reserve continues to be the dominant force in the Agency pool market. In recent years, the majority of Agency pool issuance has been driven by loan refinancings, as opposed to mortgage loans for home purchases. However, with interest rates having risen so significantly since last May, refinancing activity has steadily declined over recent months, and in December the MBA Refinance Index hit a new multi-year low. Therefore, as refinancing activity has declined, so too has the production of new Agency pools. As a result, the Federal Reserve still provides overwhelming support to, and remains the dominant force in, the Agency pool market, given that the reduction in Federal Reserve purchases has been more than offset by the reduction in new supply. However, should the Federal Reserve continue, as is expected, to taper its monthly purchases, the Agency pool market may undergo a significant repricing over the course of 2014.
Over the course of 2013, we took advantage of depressed specified pool pay-ups (price premiums for specified pools relative to their generic pool counterparts) by buying higher coupon specified pools. Despite current low prepayment levels, we believe that certain sectors of the Agency pool market are still susceptible to prepayments, thereby making it attractive to buy pools with prepayment protection in those sectors, especially given the drop in pay-ups. We have also found attractive opportunities in seasoned specified pools, which have shorter remaining weighted average maturities relative to TBAs, and therefore can be hedged with a shorter, lower-cost basket of interest rate hedges. Given the current steepness of the yield curve, even relatively small amounts of seasoning can translate into significant value.
Also, over the course of the year and consistent with our strategy, we continued to hedge against the risk of rising interest rates, primarily with interest rate swaps and TBAs. As interest rates rose over the year, our interest rate hedges generated net gains, thereby reducing some of the impact of declining asset prices. Active trading of assets and management of hedges has, and continues to be, a key element of our Agency RMBS strategy. The last six months of 2013 provided an excellent opportunity to continue to upgrade our portfolio into higher coupon specified pools with stronger prepayment protection. We believe that specified pools remain attractive relative to historical metrics. We have also become active in purchasing Agency adjustable rate mortgages, or "Agency ARMs," which have also increased in supply, likely as a function of the deleveraging activities of many REITs in the two most recent fiscal quarters. As of December 31, 2013, Agency ARMs represented approximately 4% of our Agency RMBS portfolio.
Notwithstanding the late second quarter market pullback that impacted virtually all U.S. fixed income sectors, non-Agency MBS rallied for most of the year ended December 31, 2013. Continued strength in home price appreciation, which was fairly widely dispersed across the United States, provided a lift to prices of non-Agency RMBS over the course of the year. Improvements in borrower behavior, as measured by mortgage delinquency rates, together with a declining inventory of foreclosed homes, also provided support to non-Agency RMBS valuations. Finally, sales of non-Agency MBS by the GSEs, large European banks, and liquidating CDOs were generally well supported by the market over the course of the year, as healthy investor appetite from regional banks, insurance companies, and money managers helped to absorb the additional
52
supply. However, despite the strong 2013 performance of non-Agency RMBS assets, the securitization market for newly issued non-Agency mortgage loans remains far from fully recovered.
Notwithstanding the recent significant volatility in the fixed income markets and the pending changes to regulatory capital requirements for banks, discussed above in "—
Bank Regulatory Capital Changes
," repo financing has remained readily available and our borrowing costs and haircuts have also remained relatively stable. We have found increased interest from both larger and smaller dealers with competitive terms. Additionally, short-term rates (on which interest rates for our repo financings are based) have remained relatively stable over the course of the year. As of December 31, 2013, our outstanding repos were with 9 different counterparties and were entirely related to our Agency RMBS.
Outlook
We expect that continued volatility will continue to generate opportunities for us to acquire specified Agency pools at attractive prices. While the 2013 increase in rates has made prepayment protection less important in lower-coupon pools, higher-coupon pools with prepayment protection have become more attractive. We continue to target pools that, taking into account their particular composition and based on our prepayment projections: (1) should generate attractive yields relative to other Agency RMBS and U.S. Treasury securities, (2) should have less prepayment sensitivity to government policy shocks and/or (3) create opportunities for trading gains once the market recognizes their value, which for newer pools may come only after several months when actual prepayment experience can be observed. We believe that our research team, our proprietary prepayment models, and our extensive databases remain essential tools in our implementation of this strategy. Notwithstanding the opportunities that volatility may create to buy and sell assets, the presence of volatility also underscores the importance of our flexibility in hedging our risks using a variety of tools, including TBAs, as we adapt to changing market conditions. We also believe that our active trading style, coupled with our ability to dynamically alter the mix of TBAs and interest rate derivatives that we use to hedge interest rate risk, is of great benefit to our Agency RMBS strategy.
We believe that as the Federal Reserve gradually reduces its dominance of the Agency RMBS market, opportunities will be created for private capital to fill the resulting void. We expect that over time, this trend will enhance our opportunities within the Agency RMBS market.
We remain positive in our outlook for non-Agency MBS, both on fundamental and technical grounds. On the fundamental side, we expect that while the double-digit rate of home price appreciation that was experienced in 2013 will likely not be repeated in 2014, it should still remain positive in 2014. Since home prices continue to serve as one of the most important determinants of future cashflows in distressed non-Agency RMBS, we believe that future home price appreciation will continue to provide significant support for the prices and credit performance of non-Agency RMBS. On the technical side, while the GSEs and large banks continue to sell non-Agency MBS from their portfolios, market appetite for these assets remains quite strong, especially among insurance companies, regional banks, and money managers.
Critical Accounting Policies
Our consolidated financial statements have been prepared in conformity with generally accepted accounting principles in the United States of America, or "U.S. GAAP," Entities in which we have a controlling financial interest, through ownership of the majority of the entities' voting equity interests, or through other contractual right that give us control, are consolidated by us. All inter-company balances and transactions have been eliminated.
Certain of our critical accounting policies require management to make estimates and assumptions that affect the reported amounts of assets and liabilities at the date of the consolidated financial statements and the reported amounts of revenues and expenses during the reporting period. Actual results could differ from those estimates. We believe that all of the decisions and assessments upon which our consolidated financial statements are based were reasonable at the time made based upon information available to us at that time. We rely on our Manager and Ellington's experience and analysis of historical and current market data in order to arrive at what we believe to be reasonable estimates. See Note 2 to the consolidated financial statements included in this Annual Report on Form 10-K for a complete discussion of our significant accounting policies. We have identified our most critical accounting policies to be the following:
Valuation
: We apply Accounting Standards Codification ("ASC") ASC 820-10,
Fair Value Measurement and Disclosures
("ASC 820-10"), to our holdings of financial instruments. ASC 820-10 establishes a three-level valuation hierarchy for disclosure of fair value measurements. The valuation hierarchy is based upon the transparency of inputs to the valuation of an asset or liability as of the measurement date. Financial instruments include securities and derivatives. A financial instrument's categorization within the valuation hierarchy is based upon the lowest level of input that is significant to the fair value measurement. The inputs or methodology used for valuing securities are not necessarily an indication of the risk associated with investing in these securities.
53
The following is a description of the valuation methodologies used for our financial instruments:
Level 1 valuation methodologies include the observation of quoted prices (unadjusted) for identical assets or liabilities in active markets, often received from widely recognized data providers.
Level 2 valuation methodologies include the observation of (i) quoted prices for similar assets or liabilities in active markets, (ii) inputs other than quoted prices that are observable for the asset or liability (for example, interest rates and yield curves) in active markets and (iii) quoted prices for identical or similar assets or liabilities in markets that are not active.
Level 3 valuation methodologies include (i) the solicitation of valuations from third parties (typically, broker-dealers), (ii) the use of proprietary models that require the use of a significant amount of judgment and the application of various assumptions including, but not limited to, prepayment assumptions and default rate assumptions, and (iii) the assessment of observable or reported recent trading activity. We utilize such information to assign a good faith fair value (the estimated price that would be received to sell an asset or paid to transfer a liability in an orderly transaction at the valuation date) to each such financial instrument.
We seek to obtain at least one third-party indicative valuation for each instrument, and often obtain multiple indicative valuations when available. Third-party valuation providers often utilize proprietary models that are highly subjective and also require the use of a significant amount of judgment and the application of various assumptions including, but not limited to, prepayment assumptions and default rate assumptions. We have been able to obtain third-party valuations on the vast majority of our assets, and we expect to continue to solicit third-party valuations on substantially all of our assets in the future to the extent practical. Generally, we value each financial instrument at the average of all third-party valuations received and not rejected as described below. Third-party valuations are not binding on us, and while we generally do not adjust such valuations, we may challenge or reject a valuation when, based on our validation criteria, we determine that such valuation is unreasonable or erroneous. Furthermore, we may determine, based on our validation criteria, that for a given instrument the average of the third-party valuations received does not result in what we believe to be fair value, and in such circumstances we may override this average with our own good faith valuation. Our validation criteria include the use of our own models, recent trading activity in the same or similar instruments, and valuations received from third parties. Our valuation process, including the application of our validation criteria, is overseen by a valuation committee. Because of the inherent uncertainty of valuation, these estimated values may differ significantly from the values that would have been used had a ready market for the financial instruments existed, and the differences could be material to the consolidated financial statements.
See the notes to our consolidated financial statements for more information on valuation.
Accounting for Real Estate Securities
: Investments in real estate securities are recorded on trade date. We have chosen to make a fair value election pursuant to ASC 825-10,
Financial Instruments
, for our real estate securities portfolio. Electing the fair value option allows us to record changes in fair value in our Consolidated Statement of Operations, which, in our view, more appropriately reflects the results of our operations for a particular reporting period as all securities activities will be recorded in a similar manner. As such, the real estate securities are recorded at fair market value on our Consolidated Balance Sheet and the period change in fair value is recorded in current period earnings on our Consolidated Statement of Operations as a component of Change in net unrealized gains (losses) on real estate securities.
Realized gains or losses on sales of real estate securities are included in Net realized gains (losses) on real estate securities on the Consolidated Statement of Operations, and are recorded at the time of disposition. The cost of positions sold is calculated based on identified cost. Principal write-offs are generally treated as realized losses.
Interest Income
: We accrete market discounts and amortize market premiums on debt securities using the effective yield method. Accretion of market discount and amortization of market premiums requires the use of a significant amount of judgment and the application of several assumptions including, but not limited to, prepayment assumptions and default rate assumptions, which are re-evaluated not less than quarterly and require the use of a significant amount of judgment. Our accretion of discounts and amortization of premiums for U.S. federal and other tax purposes is likely to differ from the financial accounting treatment of these items.
Income Taxes
: Prior to May 1, 2013, we, as a business trust with more than one owner, were considered a partnership for U.S. federal income tax purposes. In general, partnerships are not subject to entity-level tax on their income, but the income of a partnership is taxable to its owners on a flow-through basis. Interest, dividend, and other income that we realize from non-U.S. sources and capital gains that we realize on the sale of securities of non-U.S. issuers may be subject to entity-level taxes, such as withholding and other taxes levied by the jurisdiction in which the income is sourced. We made the election to be taxed as a corporation effective for the short taxable period May 1, 2013 through December 31, 2013. We intend to elect and qualify to be taxed as a REIT commencing with our short taxable year May 1, 2013 through December 31, 2013. We follow the authoritative guidance on accounting for and disclosure of uncertainty on tax positions, which requires management to
54
determine whether our tax position is more likely than not to be sustained upon examination by the applicable taxing authority, including resolution of any related appeals of the litigation process, based on the technical merits of the position. For uncertain tax positions, the tax benefit to be recognized is measured as the largest amount of benefit that is greater than fifty percent likely of being realized upon ultimate settlement. We did not have any unrecognized tax benefits at December 31, 2012. We do not expect any change in unrecognized tax benefits within the next year. In the normal course of business, we may be subject to examination by federal, state, local, and foreign jurisdictions, where applicable, for the current period or 2012 (our open tax years). We may take positions with respect to certain tax issues which depend on legal interpretation of facts or applicable tax regulations. Should the relevant tax regulators successfully challenge any such positions; we might be found to have a tax liability that has not been recorded in the accompanying consolidated financial statements. Also, management's conclusions regarding the authoritative guidance may be subject to review and adjustment at a later date based on changing tax laws, regulations, and interpretations thereof. There were no amounts accrued for penalties or interest as of or during the periods presented in the consolidated financial statements included in this Annual Report on Form 10-K.
"Emerging Growth Company" Status
: On April 5, 2012, the Jumpstart Our Business Startups Act, or the "JOBS Act," was signed into law. The JOBS Act contains provisions that, among other things, reduce certain reporting requirements for qualifying public companies. Because we qualify as an "emerging growth company," we may, under Section 7(a)(2)(B) of the Securities Act of 1933, or "the Securities Act," delay adoption of new or revised accounting standards applicable to public companies until such standards would otherwise apply to private companies. We may take advantage of this extended transition period until the first to occur of the date that we (i) are no longer an "emerging growth company" or (ii) affirmatively and irrevocably opt out of this extended transition period. We have elected to take advantage of the benefits of this extended transition period. As a result, our financial statements may not be comparable to those of other public companies that comply with such new or revised accounting standards. Until the date that we are no longer an "emerging growth company" or affirmatively and irrevocably opt out of the exemption provided by Securities Act Section 7(a)(2)(B), upon issuance of a new or revised accounting standard that applies to our financial statements and that has a different effective date for public and private companies, we will disclose the date on which adoption is required for non-emerging growth companies and the date on which we will adopt the recently issued accounting standard.
Recent Accounting Pronouncements
Please refer to Note 2 "Significant Accounting Policies—Recent Accounting Pronouncements" included in Part II, Item 8 of this Annual Report on Form 10-K.
Financial Condition
Investment portfolio
The following tables summarize our investment portfolio as of December 31, 2013 and 2012:
December 31, 2013:
|
($ in thousands)
|
Gross Unrealized
|
Weighted Average
|
|||||||||||||||||||||||||||
|
Current Principal
|
Unamortized Premium (Discount)
|
Amortized
Cost
|
Gains
|
Losses
|
Fair Value
|
Coupon
|
Yield
|
Weighted Average Life(Years)
(1)
|
|||||||||||||||||||||
|
Agency RMBS:
|
|||||||||||||||||||||||||||||
|
15-year fixed rate mortgages
|
$
|
179,906
|
|
$
|
7,153
|
|
$
|
187,059
|
|
$
|
65
|
|
$
|
(3,252
|
)
|
$
|
183,872
|
|
3.09%
|
2.52%
|
5.76
|
||||||||
|
30-year fixed rate mortgages
|
1,029,629
|
|
41,565
|
|
1,071,194
|
|
490
|
|
(28,111
|
)
|
1,043,573
|
|
3.79%
|
3.30%
|
9.80
|
||||||||||||||
|
ARMs
|
43,525
|
|
2,647
|
|
46,172
|
|
46
|
|
(103
|
)
|
46,115
|
|
4.72%
|
3.24%
|
3.79
|
||||||||||||||
|
Reverse mortgages
|
7,581
|
|
673
|
|
8,254
|
|
16
|
|
(2
|
)
|
8,268
|
|
4.85%
|
2.90%
|
3.41
|
||||||||||||||
|
Interest only securities
|
n/a
|
n/a
|
10,718
|
|
2,841
|
|
(32
|
)
|
13,527
|
|
3.97%
|
11.79%
|
5.02
|
||||||||||||||||
|
Total Agency RMBS
|
1,260,641
|
|
52,038
|
|
1,323,397
|
|
3,458
|
|
(31,500
|
)
|
1,295,355
|
|
3.75%
|
3.26%
|
8.67
|
||||||||||||||
|
Non-Agency RMBS
|
50,006
|
|
(21,327
|
)
|
28,679
|
|
2,196
|
|
(194
|
)
|
30,681
|
|
2.84%
|
9.12%
|
5.54
|
||||||||||||||
|
Total Real Estate Securities
|
$
|
1,310,647
|
|
$
|
30,711
|
|
$
|
1,352,076
|
|
$
|
5,654
|
|
$
|
(31,694
|
)
|
$
|
1,326,036
|
|
3.72%
|
3.38%
|
8.56
|
||||||||
55
December 31, 2012:
|
($ in thousands)
|
Gross Unrealized
|
Weighted Average
|
|||||||||||||||||||||||||||
|
Current Principal
|
Unamortized Premium (Discount)
|
Amortized
Cost
|
Gains
|
Losses
|
Fair Value
|
Coupon
|
Yield
|
Weighted Average Life(Years)
(1)
|
|||||||||||||||||||||
|
Non-Agency RMBS
|
$
|
26,890
|
|
$
|
(13,400
|
)
|
$
|
13,490
|
|
$
|
117
|
|
$
|
(11
|
)
|
$
|
13,596
|
|
2.20%
|
8.50%
|
7.80
|
||||||||
|
(1)
|
Average lives of MBS are generally shorter than stated contractual maturities. Average lives are affected by the contractual lives of the underlying mortgages, scheduled periodic payments of principal, and unscheduled prepayments of principal.
|
The vast majority of our capital is allocated to our Agency RMBS strategy, which we began implementing in April 2013. Within this strategy, we generally target Agency RMBS pools that, taking into account their particular composition and based on our prepayment projections: (1) will generate attractive yields relative to other Agency RMBS and U.S. Treasury securities, (2) will have less prepayment sensitivity to government policy shocks and/or (3) create opportunities for trading gains once the market recognizes their value, which for newer pools may come only after several months when actual prepayment experience can be observed. As of December 31, 2013, investments in non-Agency RMBS constitute a relatively small portion of our total investments.
Financial Derivatives
The following table summarizes our portfolio of derivative holdings as of December 31, 2013:
|
(In thousands)
|
Fair Value
|
|||
|
Financial derivatives–assets, at fair value:
|
||||
|
TBA securities purchase contracts
|
$
|
1
|
|
|
|
TBA securities sale contracts
|
2,262
|
|
||
|
Fixed payer interest rate swaps
|
32,700
|
|
||
|
Total financial derivatives–assets, at fair value:
|
34,963
|
|
||
|
Financial derivatives–liabilities, at fair value:
|
||||
|
TBA securities sale contracts
|
(28
|
)
|
||
|
Fixed payer interest rate swaps
|
(956
|
)
|
||
|
Swaptions
|
(85
|
)
|
||
|
Total financial derivatives–liabilities, at fair value:
|
(1,069
|
)
|
||
|
Total
|
$
|
33,894
|
|
|
We did not hold any financial derivatives at December 31, 2012.
Our most prevalent method of financing RMBS is through short-term repurchase agreements, which generally have maturities of 180 days or less. The weighted average life of the RMBS we own is generally much longer. Consequently, the term of our repurchase agreement financing will almost always be substantially shorter than the expected average maturity of our RMBS. The mismatch in maturities, together with the uncertainty of RMBS prepayments, and other potential changes in timing and/or amount of cash flows on our RMBS assets, creates the risk that changes in interest rates will cause our financing costs with respect to our RMBS to increase relative to the income on our RMBS over the term of our investments.
Pursuant to our hedging program, we engage in a variety of interest rate hedging activities that are designed to reduce the interest rate risk with respect to the liabilities incurred to acquire or hold RMBS. These interest rate hedges generally seek to reduce the interest rate sensitivity of our liabilities or, in other words, reduce the volatility of our financing cost over time attributable to interest rate changes. Our interest rate hedging transactions may include:
•
Interest rate swaps (a contract exchanging a variable rate for a fixed rate, or vice versa);
•
Interest rate swaptions (options to enter into interest rate swaps at a future date);
•
TBA forward contracts on Agency pass-through certificates;
•
U.S. Treasury securities;
•
Eurodollar and U.S. Treasury futures; and
•
Other derivatives.
56
We generally enter into these transactions to offset the potential adverse effects of rising interest rates on short-term repurchase agreements. Our repurchase agreements generally have maturities of up to 180 days and carry interest rates that are determined by reference to LIBOR or correlated benchmark rates for those same periods. As each then-existing fixed rate repo borrowing matures, it will generally be replaced with a new fixed rate repo borrowing based on market interest rates established at that future date.
In the case of interest rate swaps, most of our agreements are structured such that we receive payments based on a variable interest rate and make payments based on a fixed interest rate. The variable interest rate on which payments are received is generally calculated based on various reset mechanisms for LIBOR. To the extent that our future repo borrowing costs continue to be highly correlated with LIBOR, our swap agreements help to reduce the variability of our overall borrowing costs, thus reducing risk to the extent we hold fixed rate assets that are financed with repo borrowings.
In the case of TBAs, most of our positions are short TBA positions with a negative duration, meaning that as interest rates rise, the value of the short position increases, so these positions serve as a hedge against increases in interest rates. In the event that interest rates rise, the increase in value of the short TBA position serves to offset corollary increases in our current and/or future borrowing costs under our repurchase agreements. While we primarily use TBAs to hedge interest rate risk, from time to time, we also hold net long positions in certain TBA securities as a means of acquiring exposure to Agency RMBS.
The composition and relative mix of our hedges may vary from period to period given the amount of our liabilities outstanding or anticipated to be entered into, the overall market environment and our view as to which instruments best enable us to execute our hedging goals.
Leverage
The following table summarizes our outstanding liabilities under repurchase agreements as of December 31, 2013. We had no other borrowings outstanding. We did not have any outstanding borrowings as of December 31, 2012:
|
Weighted Average
|
|||||||||
|
Remaining Days to Maturity
|
Borrowings Outstanding
|
Interest Rate
|
Remaining Days to Maturity
|
||||||
|
(In thousands)
|
|||||||||
|
30 days or less
|
$
|
338,700
|
|
0.35
|
%
|
14
|
|||
|
31-60 days
|
531,799
|
|
0.39
|
|
46
|
||||
|
61-90 days
|
326,386
|
|
0.38
|
|
72
|
||||
|
91-120 days
|
109,476
|
|
0.45
|
|
100
|
||||
|
121-150 days
|
3,986
|
|
0.56
|
|
136
|
||||
|
Total
|
$
|
1,310,347
|
|
0.38
|
%
|
49
|
|||
We finance our assets with what we believe to be a prudent amount of leverage, which will vary from time to time based upon the particular characteristics of our portfolio, availability of financing, and market conditions. As of December 31, 2013, our borrowings consisted entirely of repurchase agreements collateralized by our Agency RMBS. Because our strategy is flexible, dynamic, and opportunistic, our overall leverage will vary over time. As of December 31, 2013, our total debt-to-equity ratio was 7.84 to 1. Collateral pledged with respect to our outstanding repo borrowings as of December 31, 2013 had a fair value of $1.4 billion and was entirely comprised of Agency RMBS.
Shareholders' Equity
As of December 31, 2013, our shareholders' equity increased to $167.2 million from $31.0 million as of December 31, 2012. On May 1, 2013, we priced an initial public offering of our common shares, pursuant to which we sold 6,450,000 shares to the public at a price of $20.00 per share. Concurrent with the initial public offering, we completed a private placement with our initial shareholders which resulted in gross proceeds to us of $21.0 million and the issuance of 1,050,000 shares at a price of $20.00 per share. Total gross proceeds from the initial public offering and concurrent private placement were $150.0 million. Proceeds, net of offering costs, were approximately $148.5 million. In addition, for the year ended December 31, 2013, we recorded a net loss of $1.9 million. Our net loss was primarily the result of net realized and unrealized losses on our real estate securities, partially offset by net realized and unrealized gain on our financial derivatives and net interest income. Our Board of Trustees declared three dividends during the year ended December 31, 2013 totaling $1.14 per share. For the year ended December 31, 2013, total cash dividends paid or payable amounted to $10.4 million and we have also incurred $0.05 million of stock based compensation costs. As of December 31, 2013, our book value per share was $18.29 as compared to $18.96 as of December 31, 2012.
57
Results of Operations for the Year Ended December 31, 2013 and September 25, 2012 (commencement of operations) to December 31, 2012:
The following table summarizes our results of operations for the year ended December 31, 2013 and September 25, 2012 (commencement of operations) to December 31, 2012:
|
(In thousands except for per share amounts)
|
Year Ended
December 31, 2013
|
September 25, 2012 (commencement of operations) to December 31, 2012
|
||||||
|
Net Interest income
|
||||||||
|
Net interest income
|
$
|
24,810
|
|
$
|
239
|
|
||
|
Expenses
|
||||||||
|
Management fees
|
2,066
|
|
124
|
|
||||
|
Organizational expense
|
—
|
|
568
|
|
||||
|
Other operating expenses
|
2,260
|
|
170
|
|
||||
|
Total expenses
|
4,326
|
|
862
|
|
||||
|
Other Income (Loss)
|
||||||||
|
Net realized and change in net unrealized gains (losses) on real estate securities
|
(63,602
|
)
|
87
|
|
||||
|
Net realized and change in net unrealized gains (losses) on financial derivatives
|
41,204
|
|
—
|
|
||||
|
Total Other Income (Loss)
|
(22,398
|
)
|
87
|
|
||||
|
Net Loss
|
$
|
(1,914
|
)
|
$
|
(536
|
)
|
||
|
Net Loss Per Common Share
|
$
|
(0.29
|
)
|
$
|
(0.33
|
)
|
||
Core Earnings
Core Earnings consists of net income (loss), excluding realized and unrealized gains and losses on real estate securities and financial derivatives, and, if applicable, items of income or loss that are of a non-recurring nature. Core Earnings includes net realized and unrealized gains and losses associated with payments and accruals of periodic payments on interest rate swaps. Core Earnings is a supplemental non-GAAP financial measure that we present as an additional measure of our operating performance. We believe Core Earnings provides information useful to investors because it is a metric utilized by management to assess our performance and to evaluate the effective net yield provided by our portfolio. Moreover, one of our objectives is to generate income from the net interest margin on our portfolio and we use Core Earnings to help measure the extent to which we are achieving this objective. However, because Core Earnings is an incomplete measure of our financial results and differs from net income or net income (loss) computed in accordance with GAAP, it should be considered as supplementary to, and not as a substitute for, our net income (loss) computed in accordance with GAAP.
The table below details the components of Core Earnings and reconciles Core Earnings for the year ended December 31, 2013 to the line, Net Loss, on our Consolidated Statement of Operations, which we believe is the most directly comparable GAAP measure:
|
(In thousands except share amounts)
|
Year Ended
December 31, 2013
|
|||
|
Net Loss
|
$
|
(1,914
|
)
|
|
|
Less:
|
||||
|
Net realized losses on real estate securities
|
(37,456
|
)
|
||
|
Net realized gains on financial derivatives, excluding periodic payments
(1)
|
12,510
|
|
||
|
Change in net unrealized gains (losses) on real estate securities
|
(26,146
|
)
|
||
|
Change in net unrealized gains (losses) on financial derivatives, excluding accrued periodic payments
(2)
|
35,432
|
|
||
|
Subtotal
|
(15,660
|
)
|
||
|
Core Earnings
|
$
|
13,746
|
|
|
|
Weighted Average Shares Outstanding
|
6,566,656
|
|
||
|
Core Earnings Per Share
|
$
|
2.09
|
|
|
|
(1)
|
For the year ended December 31, 2013, represents Net realized gains on financial derivatives of $7,310 less Net realized gains (losses) on periodic settlements of interest rate swaps of $(5,200). See Note 5 in the notes to the consolidated financial statements.
|
58
|
(2)
|
For the year ended December 31, 2013, represents Net change in unrealized gains (losses) on financial derivatives of $33,894 less Change in net unrealized gains (losses) on accrued periodic settlements of interest rate swaps of $(1,538). See Note 5 in the notes to the consolidated financial statements.
|
We have not measured Core Earnings for periods prior to 2013, as we do not believe it is meaningful given the relatively small size of the Company and limited operations of the Company prior to that time.
Net Loss
We had a net loss for the year ended December 31, 2013 of
$(1.9) million
, or
$(0.29)
per share. We had Core Earnings of
$13.7 million
, or
$2.09
per share. For the period September 25, 2012 (commencement of operations) to December 31, 2012, we had a net loss of $(0.5) million, or $(0.33) per share. We had limited operating activities during the period September 25, 2012 to December 31, 2012 as we were in the process of ramping up our investment activities.
Interest Income
Our primary source of income is the interest earned on our real estate securities. We began purchasing Agency RMBS in April 2013. Our portfolio as of December 31, 2013 consisted primarily of Agency RMBS, and to a lesser extent, non-Agency RMBS, and we earned approximately
$27.9 million
in interest income on these securities for the year ended December 31, 2013. For the period September 25, 2012 to December 31, 2012 we had a small portfolio of non-Agency RMBS and we earned approximately $0.2 million in interest income. The increase in interest income year over year was due to our larger portfolio during the year ended December 31, 2013. In addition, interest income for the year ended December 31, 2013 included an additional $0.5 million from the effects of a downward adjustment to premium amortization (accompanied by a corresponding $0.5 million downward adjustment to realized and unrealized gains), as higher interest rates have caused a decline in prepayments in Agency RMBS. For the year ended December 31, 2013, the weighted average yield on our real estate securities was 3.34%
Interest Expense
For the year ended December 31, 2013, the vast majority of interest expense that we incurred was related to our repo borrowings, which we use to finance our assets. Our average outstanding borrowings for the year December 31, 2013 was
$792.8 million
, resulting in an average cost of funds of
0.38%
. The following table shows information related to our average cost of funds for the year ended December 31, 2013. We had no borrowings prior to the second quarter of 2013.
|
($ in thousands)
|
Average Borrowed Funds
|
Interest Expense
|
Average Cost of Funds
|
Average One-Month LIBOR
|
Average Six-Month LIBOR
|
||||||||||||
|
Year Ended December 31, 2013
|
$
|
792,797
|
|
$
|
3,035
|
|
0.38
|
%
|
0.19
|
%
|
0.41
|
%
|
|||||
As an alternative measure of our cost of funds, we add to our average interest cost the net periodic amounts paid or payable by us on our interest rate swaps as a percentage of our average outstanding borrowings. Our net periodic expense paid or payable under our interest rate swaps was $6.7 million for the year ended December 31, 2013, or 0.85% of our average outstanding borrowings, thereby resulting in average cost of funds including interest rate swaps of 1.23%. This metric does not take into account other instruments that we use to hedge interest rate risk, such as TBAs.
Management Fees
For the year ended December 31, 2013, our management fee expense was approximately
$2.1 million
, which is based on shareholders' equity at the end of each quarter, excluding any unrealized gains (losses) included in shareholders' equity. For the period September 25, 2012 to December 31, 2012 our management fee expense was approximately $0.1 million. The increase in management fees for the year ended December 31, 2013 was primarily due to our larger capital base.
Other Operating Expenses
Other operating expenses include professional fees and various other expenses necessary to operate our business. Other operating expenses for the year ended December 31, 2013 were approximately
$2.3 million
, while for the period September 25, 2012 (commencement of operations) to December 31, 2012, our other operating expenses were $0.2 million. The increase in operating expenses year over year is due to the increase our capital base following our May 2013 initial public offering as well as the commensurate ramp-up in our operations in support of the increased capital. Our expense ratio, which represents our management fees and other operating expenses as a percentage of our average shareholders' equity was 3.7% for the year ended December 31, 2013.
59
Other Income (Loss)
Other income (loss) consisted of net realized and net change in unrealized gain (losses) on real estate securities and financial derivatives. For the year ended December 31, 2013, other loss was $22.4 million, and consisted of net realized and unrealized losses of $63.6 million on our real estate securities, principally our Agency RMBS, partially offset by net realized and unrealized gains of approximately $41.2 million on our financial derivatives. Interest rates rose sharply beginning in the late second quarter of 2013 and generally continued to rise through the end of the year, and as a result asset values declined. Market uncertainty and speculation regarding future actions by the Federal Reserve related to its accommodative monetary policies caused a heightened level of volatility, especially with respect to Agency RMBS. Our interest rate hedges, which are principally in the form of interest rate swaps and TBAs, offset a meaningful amount of the declines in the values of our assets during this period. Other income (loss) for September 25, 2012 (commencement of operations) to December 31, 2012 was $0.09 million and consisted of net realized and unrealized gains on our non-agency real-estate holdings.
Liquidity and Capital Resources
Liquidity refers to our ability to meet our cash needs, including repaying our borrowings, funding and maintaining RMBS and other assets, paying dividends, and other general business needs. Our short-term (one year or less) and long-term liquidity requirements to include acquisition costs for assets we acquire, payment of our management fee, compliance with margin requirements under our repurchase agreements, TBA and other financial derivative contracts, repayment of repurchase agreement borrowings to the extent we are unable or unwilling to extend our repurchase agreements, the payment of dividends, and payment of our general operating expenses. Our capital resources primarily include cash on hand, cash flow from our investments (including monthly principal and interest payments received on our RMBS and proceeds from the sale of real estate securities), borrowings under repurchase agreements, and proceeds from equity offerings. We expect that these sources of funds will be sufficient to meet our short-term and long-term liquidity needs.
We borrow funds in the form of repurchase agreements. The terms of these borrowings under our Master Repurchase Agreements, or "MRAs," generally conform to the terms in the standard master repurchase agreement as published by the Securities Industry and Financial Markets Association as to repayment and margin requirements. In addition, each lender typically requires that we include supplemental terms and conditions to the standard MRA. Typical supplemental terms and conditions include the addition of or changes to provisions relating to margin calls, net asset value requirements, cross default provisions, certain key person events, changes in corporate structure, and requirements that all controversies related to the repurchase agreement be litigated in a particular jurisdiction. These provisions may differ for each of our lenders.
As of December 31, 2013, we had $1.3 billion outstanding under our repurchase agreements. As of December 31, 2012, we had no borrowings outstanding. As of December 31, 2013, we had MRAs in place with eleven counterparties and our outstanding repurchase agreements were with nine counterparties.
Amount at risk represents the aggregate excess, if any, for each counterparty of the fair value of collateral held by such counterparty over the amounts outstanding under repurchase agreements. The following table reflects counterparties for which the amounts at risk relating to the Company's repurchase agreements was greater than 5% of shareholders' equity as of December 31, 2013. The Company had no outstanding borrowings under repurchase agreements outstanding as of December 31, 2012.
|
Counterparty
|
Amount at Risk
(1)
|
Weighted Average Remaining Days to Maturity
|
Percentage of Shareholders' Equity
|
||||||
|
(In thousands)
|
|||||||||
|
Deutsche Bank Securities
|
$
|
20,180
|
|
29
|
12.1
|
%
|
|||
|
J.P. Morgan Securities Inc.
|
$
|
13,919
|
|
54
|
8.3
|
%
|
|||
|
Bank of America Securities
|
$
|
11,588
|
|
69
|
6.9
|
%
|
|||
|
(1)
|
Amounts at risk exclude aggregate accrued interest of $2.3 million of net accrued interest, defined as accrued interest on securities held as collateral less interest payable on cash borrowed.
|
Repurchase agreements involve the sale to a counterparty and a simultaneous agreement to repurchase the transferred assets or similar assets from such counterparty at a future date. The amount borrowed generally is equal to the fair value of the assets pledged less an agreed upon discount, referred to as a "haircut." The Company's repurchase agreements are subject to the application of haircuts. As of December 31, 2013, the weighted average contractual haircut applicable to the assets that serve as collateral for the Company's outstanding repo borrowings was 4.6%. As of December 31, 2013, all of the Company's repo borrowings were entirely related to its Agency RMBS.
60
We held cash and cash equivalents of approximately
$50.1 million
and $18.2 million as of December 31, 2013 and December 31, 2012, respectively.
We may declare dividends based on, among other things, our earnings, our financial condition, the REIT qualification requirements of the Internal Revenue Code, our working capital needs and new opportunities. The declaration of dividends to our shareholders and the amount of such dividends are at the discretion of our Board of Trustees. Subsequent to our initial public offering in May 2013, our Board of Trustees has declared three quarterly dividends totaling $10.4 million, or $1.14 per share for the year ended December 31, 2013.
For the year ended December 31, 2013, our operating activities provided net cash of $25.5 million and our investing activities used net cash of $1.447 billion. Our repo activity used to finance our Agency RMBS (including repayments, in conjunction with the sales of Agency RMBS, of amounts borrowed under our repurchase agreements) provided net cash of $1.310 billion for the year ended December 31, 2013. Our operating and investing activities, when combined with our net repo financing activities, used cash of $110.7 million for the year ended December 31, 2013. We received net proceeds from the issuance of common shares as a result of the completion of our initial public offering of $148.5 million, after offering costs. For the year ended December 31, 2013 we used $5.8 million to pay dividends (the fourth quarter dividend of $0.50 per share declared by our Board of Trustees was paid in January 2014). As a result of these activities, there was an increase in our cash holdings of $32.0 million from $18.2 million as of December 31, 2012 to $50.1 million as of December 31, 2013.
On August 13, 2013, our Board of Trustees approved the adoption of a $10 million share repurchase program. The program, which is open-ended in duration, allows the Company to make repurchases from time to time on the open market or in negotiated transactions. Repurchases are at the Company's discretion, subject to applicable law, share availability, price and the Company's financial performance, among other considerations. No purchases have been made under the program to date.
Based on our current portfolio, amount of free cash on hand, debt-to-equity ratio and current and anticipated availability of credit, we believe that our capital resources will be sufficient to enable us to meet anticipated short-term and long-term liquidity requirements.
We are not required by our investment guidelines to maintain any specific debt-to-equity ratio, and we believe that the appropriate leverage for the particular assets we hold depends on the credit quality and risk of those assets, as well as the general availability and terms of stable and reliable financing for those assets.
Contractual Obligations and Commitments
We are a party to a management agreement with our Manager. Pursuant to that agreement, our Manager is entitled to receive a management fee based on shareholders' equity, reimbursement of certain expenses and, in certain circumstances, a termination fee. Such fees and expenses do not have fixed and determinable payments. We enter into repurchase agreements with third-party broker-dealers whereby we sell securities to such broker-dealers at agreed-upon purchase prices at the initiation of the repurchase agreements and agree to repurchase such securities at predetermined repurchase prices and termination dates, thus providing the broker-dealers with an implied interest rate on the funds initially transferred to us by the broker-dealers. When we enter into a repurchase agreement, the lender establishes and maintains an account containing cash and securities having a value not less than the repurchase price, including accrued interest, of the repurchase agreement. We may enter into reverse repurchase agreements with third-party broker-dealers whereby we purchase securities under agreements to resell at an agreed-upon price and date. In general, we most often will enter into reverse repurchase agreement transactions in order to effectively borrow securities that we can then deliver to counterparties to whom we have made short sales of the same securities. The implied interest rates on the repurchase agreements and reverse repurchase agreements we enter into are based upon market rates at the time of initiation. Repurchase agreements and reverse repurchase agreements that are conducted with the same counterparty may be reported on a net basis if they meet the requirements of ASC 210-20,
Balance Sheet, Offsetting
. As of both December 31, 2013 and 2012, there were no repurchase agreements and reverse repurchase agreements reported on a net basis on the Consolidated Balance Sheet.
As of December 31, 2013, we had $1.3 billion of outstanding borrowings with nine counterparties. As of December 31, 2012, we had no outstanding borrowings. As of December 31, 2013, we had MRAs with eleven counterparties. We expect to continue to have discussions with various other financial institutions in order to expand our repurchase agreement capacity.
Off-Balance Sheet Arrangements
As of December 31, 2013, we did not have any relationships with unconsolidated entities or financial partnerships, such as entities often referred to as structured finance or special purpose entities, which would have been established for the purpose of facilitating off-balance sheet arrangements or other contractually narrow or limited purposes. Further, we have not guaranteed any obligations of unconsolidated entities nor do we have any commitment or intent to provide funding to any such
61
entities. As such, we are not materially exposed to any market, credit, liquidity, or financing risk that could arise if we had engaged in such relationships.
Inflation
Virtually all of our assets and liabilities are interest rate sensitive in nature. As a result, interest rates and other factors influence our performance far more so than does inflation. Changes in interest rates do not necessarily correlate with inflation rates or changes in inflation rates. Our activities and balance sheet are measured with reference to historical cost and/or fair market value without considering inflation.
The primary components of our market risk are related to interest rate risk, prepayment risk, and credit risk. We seek to actively manage these and other risks and to acquire and hold assets that we believe justify bearing those risks, and to maintain capital levels consistent with those risks.
Interest Rate Risk
Interest rates are highly sensitive to many factors, including governmental monetary and tax policies, domestic and international economic and political considerations, and other factors beyond our control. We are subject to interest rate risk in connection with most of our assets and liabilities. For some securities in our portfolio, the coupon interest rates on, and therefore also the values of, such securities are highly sensitive to interest rate movements, such as inverse floating rate RMBS, which benefit from falling interest rates, or certain deep discount floating rate RMBS, which benefit from rising interest rates. Subject to qualifying and maintaining our qualification as a REIT and our exemption from registration under the Investment Company Act, we intend to opportunistically hedge our interest rate risk by entering into interest rate swaps, TBAs, U.S. Treasury securities, Eurodollar and U.S. Treasury futures, and other instruments. In general, such hedging instruments are used to offset the large majority of the interest rate risk we estimate to arise from our repurchase agreement indebtedness associated with our Agency RMBS positions. Hedging instruments may also be used to offset a portion of the interest rate risk arising from our repurchase agreement liabilities associated with non-Agency RMBS positions, if any.
In addition to measuring and mitigating the risk related to changes in interest rates with respect to the generally shorter-term liabilities we incur to acquire and hold generally longer-lived RMBS, we also monitor the effect of changes in interest rates on the discounted present value of our portfolio of assets and liabilities. The following sensitivity analysis table shows the estimated impact on the fair value of our portfolio segregated by certain identified categories as of December 31, 2013, assuming a static portfolio and immediate and parallel shifts in interest rates from current levels as indicated below.
|
(In thousands)
|
Estimated Change in Value for a Decrease in Interest Rates by
|
Estimated Change in Value for an Increase in Interest Rates by
|
||||||||||||||
|
Category of Instruments
|
50 Basis Points
|
100 Basis Points
|
50 Basis Points
|
100 Basis Points
|
||||||||||||
|
Agency RMBS, excluding TBAs
|
$
|
35,198
|
|
$
|
65,779
|
|
$
|
(39,818
|
)
|
$
|
(84,255
|
)
|
||||
|
TBAs
|
(10,630
|
)
|
(19,779
|
)
|
12,116
|
|
25,715
|
|
||||||||
|
Non-Agency RMBS
|
447
|
|
921
|
|
(421
|
)
|
(816
|
)
|
||||||||
|
Interest Rate Swaps and Swaptions
|
(24,856
|
)
|
(50,636
|
)
|
23,932
|
|
46,940
|
|
||||||||
|
Repurchase Agreements
|
(702
|
)
|
(703
|
)
|
893
|
|
1,787
|
|
||||||||
|
Total
|
$
|
(543
|
)
|
$
|
(4,418
|
)
|
$
|
(3,298
|
)
|
$
|
(10,629
|
)
|
||||
Our analysis of interest rate risk is derived from Ellington's proprietary models as well as third-party information and analytics. Many assumptions have been made in connection with the calculations set forth in the table above and, as such, there can be no assurance that assumed events will occur or that other events will not occur that would affect the outcomes. For example, for each hypothetical immediate shift in interest rates, assumptions have been made as to the response of mortgage prepayment rates, the shape of the yield curve, and market volatilities of interest rates; each of the foregoing factors can significantly and adversely affect the fair value of our interest rate sensitive instruments.
The above analysis utilizes assumptions and estimates based on management's judgment and experience, and relies on financial models, which are inherently imperfect; in fact, different models can produce different results for the same securities. While the table above reflects the estimated impacts of immediate parallel interest rate increases and decreases on specific categories of instruments in our portfolio, we intend to actively trade many of the instruments in our portfolio and intend to diversify our portfolio to reflect a portfolio comprised primarily of Agency RMBS, and, to a lesser extent, non-Agency RMBS
62
and mortgage-related assets. Therefore, our current or future portfolios may have risks that differ significantly from those of our December 31, 2013 portfolio estimated above. Moreover, the impact of changing interest rates on fair value can change significantly when interest rates change by a greater amount than the hypothetical shifts assumed above. Furthermore, our portfolio is subject to many risks other than interest rate risks, and these additional risks may or may not be correlated with changes in interest rates. For all of the foregoing reasons and others, the table above is for illustrative purposes only and actual changes in interest rates would likely cause changes in the actual fair value of our portfolio that would differ from those presented above, and such differences might be significant and adverse. See "Special Note Regarding Forward-Looking Statements."
Prepayment Risk
Prepayment risk is the risk of change, whether an increase or a decrease, in the rate at which principal is returned in respect of mortgage loans underlying RMBS, including both through voluntary prepayments and through liquidations due to defaults and foreclosures. This rate of prepayment is affected by a variety of factors, including the prevailing level of interest rates as well as economic, demographic, tax, social, legal, and other factors. Changes in prepayment rates will have varying effects on the different types of securities in our portfolio. We attempt to take these effects into account in making asset management decisions with respect to our assets. Additionally, increases in prepayment rates may cause us to experience losses on our interest only securities, or "IOs," and inverse interest only securities, or "IIOs," as these securities are extremely sensitive to prepayment rates. Finally, prepayment rates, besides being subject to interest rates and borrower behavior, are also substantially affected by government policy and regulation.
Credit Risk
We are subject to credit risk in connection with our assets, especially our non-Agency RMBS. Credit losses on real estate loans underlying our non-Agency RMBS can occur for many reasons, including, but not limited to, poor origination practices, fraud, faulty appraisals, documentation errors, poor underwriting, legal errors, poor servicing practices, weak economic conditions, decline in the value of homes, special hazards, earthquakes and other natural events, over-leveraging of the borrower on the property, reduction in market rents and occupancies and poor property management services in the case of rented homes, changes in legal protections for lenders, reduction in personal income, job loss, and personal events such as divorce or health problems. Property values are subject to volatility and may be affected adversely by a number of factors, including, but not limited to, national, regional, and local economic conditions (which may be adversely affected by industry slowdowns and other factors), local real estate conditions (such as an oversupply of housing), changes or continued weakness in specific industry segments, construction quality, age and design, demographic factors, and retroactive changes to building or similar codes. For mortgage-related instruments, the two primary components of credit risk are default risk and severity risk.
Default Risk
Default risk is the risk that borrowers will fail to make principal and interest payments on their mortgage loans. Subject to qualifying and maintaining our qualification as a REIT and our exemption from registration under the Investment Company Act, we may selectively attempt to mitigate our default risk by, among other things, opportunistically entering into credit default swaps and total return swaps. These instruments can reference various RMBS indices, corporate bond indices, or corporate entities, such as publicly traded REITs. We also rely on third-party mortgage servicers to mitigate our default risk, but such third-party mortgage servicers may have little or no economic incentive to mitigate loan default rates.
Severity Risk
Severity risk is the risk of loss upon a borrower default on a mortgage loan underlying our RMBS. Severity risk includes the risk of loss of value of the property underlying the mortgage loan as well as the risk of loss associated with taking over the property, including foreclosure costs. We rely on third-party mortgage servicers to mitigate our severity risk, but such third-party mortgage servicers may have little or no economic incentive to mitigate loan loss severities. Such mitigation efforts may include loan modification programs and prompt foreclosure and property liquidation following a default.
63
INDEX TO CONSOLIDATED FINANCIAL STATEMENTS
|
Page
|
||
|
CONSOLIDATED FINANCIAL STATEMENTS AS OF DECEMBER 31, 2013 AND DECEMBER 31, 2012, AND FOR THE YEAR ENDED DECEMBER 31, 2013 AND THE PERIOD SEPTEMBER 25, 2012 (COMMENCEMENT OF OPERATIONS) TO DECEMBER 31, 2012:
|
||
64
Report of Independent Registered Public Accounting Firm
To the Board of Trustees and Shareholders of Ellington Residential Mortgage REIT:
In our opinion, the accompanying consolidated balance sheets and the related consolidated statement of operations, consolidated statement of shareholders’ equity, and consolidated statement of cash flows present fairly, in all material respects, the financial position of Ellington Residential Mortgage REIT ("the Company") at December 31, 2013 and December 31, 2012, and the results of its operations, changes in shareholders' equity, and its cash flows for the year ended December 31, 2013 and for the period September 25, 2012 (commencement of operations) to December 31, 2012 in conformity with accounting principles generally accepted in the United States of America. These financial statements are the responsibility of the Company’s management. Our responsibility is to express an opinion on these financial statements based on our audits. We conducted our audits of these statements in accordance with the standards of the Public Company Accounting Oversight Board (United States). Those standards require that we plan and perform the audit to obtain reasonable assurance about whether the financial statements are free of material misstatement. Our audit of the financial statements included examining, on a test basis, evidence supporting the amounts and disclosures in the financial statements, assessing the accounting principles used and significant estimates made by management, and evaluating the overall financial statement presentation. We believe that our audits provide a reasonable basis for our opinion.
/s/ PricewaterhouseCoopers LLP
New York, NY
March 21, 2014
65
ELLINGTON RESIDENTIAL MORTGAGE REIT
CONSOLIDATED BALANCE SHEET
|
December 31, 2013
|
December 31, 2012
|
||||||
|
(In thousands except share amounts)
|
Expressed in U.S. Dollars
|
||||||
|
ASSETS
|
|||||||
|
Cash and cash equivalents
|
$
|
50,112
|
|
$
|
18,161
|
|
|
|
Real estate securities, at fair value
|
1,326,036
|
|
13,596
|
|
|||
|
Due from brokers
|
18,347
|
|
—
|
|
|||
|
Financial derivatives–assets, at fair value
|
34,963
|
|
—
|
|
|||
|
Receivable for securities sold
|
76,692
|
|
—
|
|
|||
|
Interest receivable
|
4,766
|
|
39
|
|
|||
|
Other assets
|
174
|
|
360
|
|
|||
|
Total Assets
|
$
|
1,511,090
|
|
$
|
32,156
|
|
|
|
LIABILITIES AND SHAREHOLDERS' EQUITY
|
|||||||
|
LIABILITIES
|
|
||||||
|
Repurchase agreements
|
$
|
1,310,347
|
|
$
|
—
|
|
|
|
Payable for securities purchased
|
2,776
|
|
—
|
|
|||
|
Due to brokers
|
22,788
|
|
—
|
|
|||
|
Financial derivatives–liabilities, at fair value
|
1,069
|
|
—
|
|
|||
|
Dividend payable
|
4,570
|
|
—
|
|
|||
|
Accrued expenses
|
996
|
|
1,076
|
|
|||
|
Management fee payable
|
600
|
|
116
|
|
|||
|
Interest payable
|
764
|
|
—
|
|
|||
|
Total Liabilities
|
1,343,910
|
|
1,192
|
|
|||
|
SHAREHOLDERS' EQUITY
|
|||||||
|
Preferred shares, par value $0.01 per share, 100,000,000 shares authorized;
(0 shares issued and outstanding, respectively)
|
—
|
|
—
|
|
|||
|
Common shares, par value $0.01 per share, 500,000,000 shares authorized;
(9,139,842 and 1,633,378 shares issued and outstanding, respectively)
|
91
|
|
16
|
|
|||
|
Additional paid-in-capital
|
181,147
|
|
32,674
|
|
|||
|
Accumulated deficit
|
(14,058
|
)
|
(1,726
|
)
|
|||
|
Total Shareholders' Equity
|
167,180
|
|
30,964
|
|
|||
|
Total Liabilities and Shareholders' Equity
|
$
|
1,511,090
|
|
$
|
32,156
|
|
|
See Notes to Consolidated Financial Statements
66
ELLINGTON RESIDENTIAL MORTGAGE REIT
CONSOLIDATED STATEMENT OF OPERATIONS
CONSOLIDATED STATEMENT OF OPERATIONS
|
Year Ended
December 31, 2013 |
September 25, 2012 (commencement of operations) to
December 31, 2012 |
|||||||
|
(In thousands except per share amounts)
|
Expressed in U.S. Dollars
|
|||||||
|
INTEREST INCOME (EXPENSE)
|
||||||||
|
Interest income
|
$
|
27,866
|
|
$
|
239
|
|
||
|
Interest expense
|
(3,056
|
)
|
—
|
|
||||
|
Total net interest income
|
24,810
|
|
239
|
|
||||
|
EXPENSES
|
||||||||
|
Management fees
|
2,066
|
|
124
|
|
||||
|
Professional fees
|
624
|
|
125
|
|
||||
|
Organizational expense
|
—
|
|
568
|
|
||||
|
Other operating expenses
|
1,636
|
|
45
|
|
||||
|
Total expenses
|
4,326
|
|
862
|
|
||||
|
OTHER INCOME (LOSS)
|
||||||||
|
Net realized losses on real estate securities
|
(37,456
|
)
|
(19
|
)
|
||||
|
Net realized gains on financial derivatives
|
7,310
|
|
—
|
|
||||
|
Change in net unrealized gains (losses) on real estate securities
|
(26,146
|
)
|
106
|
|
||||
|
Change in net unrealized gains (losses) on financial derivatives
|
33,894
|
|
—
|
|
||||
|
Total other income (loss)
|
(22,398
|
)
|
87
|
|
||||
|
NET LOSS
|
$
|
(1,914
|
)
|
$
|
(536
|
)
|
||
|
NET LOSS PER COMMON SHARE:
|
||||||||
|
Basic
|
$
|
(0.29
|
)
|
$
|
(0.33
|
)
|
||
See Notes to Consolidated Financial Statements
67
ELLINGTON RESIDENTIAL MORTGAGE REIT
CONSOLIDATED STATEMENT OF SHAREHOLDERS' EQUITY
CONSOLIDATED STATEMENT OF SHAREHOLDERS' EQUITY
|
Common Shares
|
Common
Shares,
par value
|
Preferred Shares
|
Preferred Shares,
par value
|
Additional Paid-in-Capital
|
Receivable from Shareholders
|
Accumulated Deficit
|
Total
|
||||||||||||||||||||||
|
(In thousands except share amounts)
|
Expressed in U.S. Dollars
|
||||||||||||||||||||||||||||
|
BALANCE, September 25, 2012
|
100
|
|
$
|
—
|
|
—
|
|
$
|
—
|
|
$
|
1
|
|
$
|
(1
|
)
|
$
|
—
|
|
$
|
—
|
|
|||||||
|
Issuance of shares
|
1,575,000
|
|
16
|
|
—
|
|
—
|
|
31,484
|
|
31,500
|
|
|||||||||||||||||
|
Stock dividend
(1)
|
58,378
|
|
—
|
|
—
|
|
—
|
|
1,190
|
|
(1,190
|
)
|
—
|
|
|||||||||||||||
|
Repurchase of shares
|
(100
|
)
|
—
|
|
—
|
|
—
|
|
(1
|
)
|
1
|
|
—
|
|
|||||||||||||||
|
Net loss
|
(536
|
)
|
(536
|
)
|
|||||||||||||||||||||||||
|
BALANCE, December 31, 2012
|
1,633,378
|
|
$
|
16
|
|
—
|
|
$
|
—
|
|
$
|
32,674
|
|
$
|
—
|
|
$
|
(1,726
|
)
|
$
|
30,964
|
|
|||||||
|
Issuance of shares
|
7,500,000
|
|
75
|
|
—
|
|
—
|
|
149,925
|
|
150,000
|
|
|||||||||||||||||
|
Issuance of restricted shares
|
6,464
|
|
—
|
|
—
|
|
—
|
|
—
|
|
—
|
|
|||||||||||||||||
|
Share based compensation
|
46
|
|
46
|
|
|||||||||||||||||||||||||
|
Offering costs
|
(1,498
|
)
|
(1,498
|
)
|
|||||||||||||||||||||||||
|
Dividends declared
(2)
|
(10,418
|
)
|
(10,418
|
)
|
|||||||||||||||||||||||||
|
Net loss
|
(1,914
|
)
|
(1,914
|
)
|
|||||||||||||||||||||||||
|
BALANCE, December 31, 2013
|
9,139,842
|
|
$
|
91
|
|
—
|
|
$
|
—
|
|
$
|
181,147
|
|
$
|
—
|
|
$
|
(14,058
|
)
|
$
|
167,180
|
|
|||||||
|
(1)
|
Stock dividend was declared on April 18, 2013 and was retroactively applied.
|
|
(2)
|
For the year ended December 31, 2013 cash dividends totaling
$1.14
per share were declared by the Board of Trustees.
|
See Notes to Consolidated Financial Statements
68
ELLINGTON RESIDENTIAL MORTGAGE REIT
CONSOLIDATED STATEMENT OF CASH FLOWS
|
Year Ended
December 31, 2013 |
September 25, 2012 (commencement of operations) to
December 31, 2012
|
|||||||
|
(In thousands)
|
Expressed in U.S. Dollars
|
|||||||
|
Cash flows provided by (used in) operating activities:
|
||||||||
|
Net loss
|
$
|
(1,914
|
)
|
$
|
(536
|
)
|
||
|
Reconciliation of net loss to net cash provided by (used in) operating activities:
|
||||||||
|
Net realized losses on real estate securities
|
37,456
|
|
19
|
|
||||
|
Change in net unrealized (gains) losses on real estate securities
|
26,146
|
|
(106
|
)
|
||||
|
Net realized gains on financial derivatives
|
(7,310
|
)
|
—
|
|
||||
|
Change in net unrealized (gains) losses on financial derivatives
|
(33,894
|
)
|
—
|
|
||||
|
Amortization of premiums and accretion of discounts (net)
|
3,911
|
|
(114
|
)
|
||||
|
Share based compensation
|
46
|
|
—
|
|
||||
|
(Increase) decrease in assets:
|
||||||||
|
Due from brokers
|
(18,347
|
)
|
—
|
|
||||
|
Interest receivable
|
(4,727
|
)
|
(39
|
)
|
||||
|
Other assets
|
(174
|
)
|
—
|
|
||||
|
Increase (decrease) in liabilities:
|
||||||||
|
Due to brokers
|
22,788
|
|
—
|
|
||||
|
Accrued expenses
|
281
|
|
716
|
|
||||
|
Interest payable
|
764
|
|
—
|
|
||||
|
Management fees payable
|
484
|
|
116
|
|
||||
|
Net cash provided by operating activities
|
25,510
|
|
56
|
|
||||
|
Cash flows provided by (used in) investing activities:
|
||||||||
|
Purchases of real estate securities
|
(2,889,912
|
)
|
(13,643
|
)
|
||||
|
Proceeds from sale of real estate securities
|
1,388,043
|
|
248
|
|
||||
|
Principal repayments of real estate securities
|
47,994
|
|
—
|
|
||||
|
Proceeds from investments sold short
|
2,043
|
|
—
|
|
||||
|
Repurchase of investments sold short
|
(2,036
|
)
|
—
|
|
||||
|
Proceeds from disposition of financial derivatives
|
31,276
|
|
—
|
|
||||
|
Purchase of financial derivatives
|
(23,967
|
)
|
—
|
|
||||
|
Payments made on reverse repurchase agreements
|
(4,098
|
)
|
—
|
|
||||
|
Proceeds from reverse repurchase agreements
|
4,098
|
|
—
|
|
||||
|
Net cash used in investing activities
|
(1,446,559
|
)
|
(13,395
|
)
|
||||
|
Cash flows provided by (used in) financing activities:
|
||||||||
|
Offering costs paid
|
(1,498
|
)
|
—
|
|
||||
|
Proceeds from issuance of shares
|
150,000
|
|
31,500
|
|
||||
|
Dividends
|
(5,849
|
)
|
—
|
|
||||
|
Borrowings under repurchase agreements
|
6,516,450
|
|
—
|
|
||||
|
Repayments of repurchase agreements
|
(5,206,103
|
)
|
—
|
|
||||
|
Cash provided by financing activities
|
1,453,000
|
|
31,500
|
|
||||
|
NET INCREASE IN CASH AND CASH EQUIVALENTS
|
31,951
|
|
18,161
|
|
||||
|
CASH AND CASH EQUIVALENTS, BEGINNING OF PERIOD
|
18,161
|
|
—
|
|
||||
|
CASH AND CASH EQUIVALENTS, END OF PERIOD
|
$
|
50,112
|
|
$
|
18,161
|
|
||
|
Supplemental disclosure of cash flow information:
|
||||||||
|
Interest paid
|
$
|
2,292
|
|
$
|
—
|
|
||
See Notes to Consolidated Financial Statements
69
ELLINGTON RESIDENTIAL MORTGAGE REIT
NOTES TO CONSOLIDATED FINANCIAL STATEMENTS
December 31, 2013
1. Organization and Investment Objective
Ellington Residential Mortgage REIT, or "EARN," was formed as a Maryland real estate investment trust, or "REIT," on August 2, 2012, and commenced operations on September 25, 2012. EARN conducts its business through its wholly owned subsidiaries, EARN OP GP LLC, or the "General Partner," and Ellington Residential Mortgage LP, or the "Operating Partnership," which were formed as a Delaware limited liability company and a Delaware limited partnership, respectively, on July 31, 2012 and commenced operations on September 25, 2012. The Operating Partnership conducts its business of acquiring, investing in, and managing residential mortgage-related and real estate-related assets through its wholly owned subsidiaries.
EARN, the General Partner, the Operating Partnership, and their consolidated subsidiaries are hereafter defined as the "Company."
On May 1, 2013, the Company priced an initial public offering of its common shares, pursuant to which it sold
6,450,000
shares to the public at a price of
$20.00
per share. Concurrent with the initial public offering, the Company completed a private placement with its initial shareholders which resulted in gross proceeds to the Company of
$21.0 million
and the issuance of
1,050,000
shares at a price of
$20.00
per share.
No
further capital commitments from the initial shareholders remain as a result of this private placement. Total gross proceeds from the initial public offering and concurrent private placement were
$150.0 million
. Proceeds, net of offering costs, were approximately
$148.5 million
.
The Company acquires and manages Agency and non-Agency, both investment grade and non-investment grade, residential mortgage-backed securities, or "RMBS," including Agency pools and Agency and non-Agency collateralized mortgage obligations, or "CMOs." Collectively, all of these asset types are referred to as real estate securities. The Company may also acquire and manage mortgage servicing rights, residential mortgage loans, and other mortgage- and real estate-related assets. The Company may also invest in other instruments including, but not limited to, forward-settling To-Be-Announced Agency pass-through certificates, or "TBAs," interest rate swaps and swaptions, U.S. Treasury securities, Eurodollar and U.S. Treasury futures, other financial derivatives, and cash equivalents. The Company's targeted investments may range from unrated (first loss) securities to AAA senior securities.
Ellington Residential Mortgage Management LLC, or the "Manager," serves as the Manager of the Company pursuant to the terms of the Amended and Restated Management Agreement effective as of September 24, 2012, or the "Management Agreement." The Manager is an affiliate of Ellington Management Group, L.L.C., or "EMG," an investment management firm that is registered as an investment adviser. In accordance with the terms of the Management Agreement and the Services Agreement, as discussed in Note 10, the Manager is responsible for administering the Company's business activities and day-to-day operations, and performs certain services, subject to oversight by the Board of Trustees.
For the periods September 25, 2012 (commencement of operations) through December 31, 2012 and January 1, 2013 through April 30, 2013, the Company filed its tax returns as a partnership. On May 1, 2013, the Company made the election to be taxed as a corporation effective for the short taxable period beginning on that date through December 31, 2013. In addition, the Company intends to make the election to be taxed as a REIT under the Internal Revenue Code of 1986, as amended, or "the Code," when it files its tax return for the short taxable period May 1, 2013 through December 31, 2013.
As a REIT, the Company is required to distribute annually at least
90%
of its taxable income. As long as the Company continues to qualify as a REIT, it will not be subject to U.S. federal or state corporate taxes on its taxable income to the extent that it distributes all of its annual taxable income to its shareholders. It is the intention of the Company to distribute at least
100%
of its taxable income, after application of available tax attributes, within the limits prescribed by the Code, which may extend into the subsequent taxable year.
2. Significant Accounting Policies
(A) Basis of Presentation:
The Company's consolidated financial statements have been prepared in conformity with generally accepted accounting principles in the United States of America, or "U.S. GAAP," Entities in which the Company has a controlling financial interest, through ownership of the majority of the entities' voting equity interests, or through other contractual right that give the Company control, are consolidated by the Company. All inter-company balances and transactions have been eliminated. The preparation of consolidated financial statements in conformity with U.S. GAAP requires management to make estimates and assumptions that affect the reported amounts of assets and liabilities at the date of the consolidated financial statements and the reported amounts of revenues and expenses during the reporting period. Actual results could differ from those estimates and those differences could be material.
70
(B) Valuation:
The Company applies Accounting Standards Codification, or "ASC," ASC 820-10,
Fair Value Measurement and Disclosures
("ASC 820-10"), to its holdings of financial instruments. ASC 820-10 establishes a three-level valuation hierarchy for disclosure of fair value measurements. The valuation hierarchy is based upon the transparency of inputs to the valuation of an asset or liability as of the measurement date. The three levels are defined as follows:
|
•
|
Level 1—inputs to the valuation methodology are observable and reflect quoted prices (unadjusted) for identical assets or liabilities in active markets,
|
|
•
|
Level 2—inputs to the valuation methodology other than quoted prices included in Level 1 are observable for the asset or liability, either directly or indirectly, and
|
|
•
|
Level 3—inputs to the valuation methodology are unobservable and significant to the fair value measurement.
|
A financial instrument's categorization within the valuation hierarchy is based upon the lowest level of input that is significant to the fair value measurement. The inputs or methodology used for valuing securities are not necessarily an indication of the risk associated with investing in these securities.
(C) Accounting for Real Estate Securities:
Investments in real estate securities are recorded on trade date. The Company has chosen to make a fair value election pursuant to ASC 825-10,
Financial Instruments
, for its real estate securities portfolio. Electing the fair value option allows the Company to record changes in fair value in the Consolidated Statement of Operations, which, in management's view, more appropriately reflects the results of operations for a particular reporting period as all securities activities will be recorded in a similar manner. As such, the real estate securities are recorded at fair value on the Consolidated Balance Sheet and the period change in fair value is recorded in current period earnings on the Consolidated Statement of Operations as a component of Change in net unrealized gains (losses) on real estate securities.
Realized gains or losses on sales of real estate securities are included in Net realized gains (losses) on real estate securities on the Consolidated Statement of Operations, and are recorded at the time of disposition. The cost of positions sold is calculated based on identified cost. Principal write-offs are generally treated as realized losses.
(D) Interest Income:
The Company accretes market discounts and amortizes market premiums on debt securities using the effective yield method. Accretion of market discount and amortization of market premiums requires the use of a significant amount of judgment and the application of several assumptions including, but not limited to, prepayment assumptions and default rate assumptions, which are re-evaluated not less than quarterly and require the use of a significant amount of judgment. Principal write-offs are generally treated as realized losses. The Company's accretion of discounts and amortization of premiums for U.S. federal and other tax purposes is likely to differ from the financial accounting treatment of these items as described above.
(E) Cash and Cash Equivalents:
Cash and cash equivalents include cash and short term investments with original maturities of three months or less at the date of acquisition. Cash equivalents are recorded at cost plus accrued interest, which approximates fair value. Cash accounts are maintained with financial institutions and these balances generally exceed insured limits.
(F) Due from brokers/Due to brokers:
Due from brokers and Due to brokers accounts on the Consolidated Balance Sheet include collateral paid or received from counterparties, including clearinghouses, along with receivables and payables for open and or closed derivative positions.
(G) Financial Derivatives:
The Company may enter into various types of financial derivatives subject to its investment guidelines, which include restrictions associated with maintaining qualification as a REIT. The Company's derivatives are predominantly subject to bilateral collateral arrangements or clearing in accordance with the Dodd-Frank Wall Street Reform and Consumer Protection Act of 2010. The Company may be required to deliver or receive cash or securities as collateral upon entering into derivative transactions. In addition, changes in the relative value of derivative transactions may require the Company or the counterparty to post or receive additional collateral. In the case of cleared derivatives, the clearinghouse becomes the Company's counterparty and a futures commission merchant, or "FCM," acts as intermediary between the Company and the clearinghouse with respect to all facets of the related transaction, including the posting and receipt of required collateral. Collateral received by the Company is reflected on the Consolidated Balance Sheet as "Due to Brokers." Conversely, collateral posted by the Company is reflected as "Due from Brokers" on the Consolidated Balance Sheet. The types of derivatives that have been utilized by the Company to date are interest rate swaps, TBAs, and swaptions.
Swaps:
The Company has entered into interest rate swaps, which are contractual agreements whereby one party pays a floating rate of interest on a notional principal amount and receives a fixed rate on the same notional principal, or vice versa, for a fixed period of time.
71
While the Company does not intend to operate its non-Agency RMBS investment strategy on a credit hedged basis, the Company may opportunistically enter into various credit hedging transactions, such as involving credit default swaps, total return swaps, or other derivative contracts. The Company may use credit default swaps to hedge non-Agency RMBS credit risk by buying protection on a single non-Agency RMBS or by buying protection on a basket or index of non-Agency RMBS assets. For credit hedging purposes the Company may also enter into credit default swaps on various mortgage-backed securities, or "MBS," indices, and various other derivative contracts, including total return swaps, referencing the unsecured corporate credit, or the equity of, certain corporations. However, the Company's ability to use these instruments is subject to the Company's qualifying and maintaining its qualification as a REIT and maintaining its exclusion from regulation as an investment company under the Investment Company Act.
Swaps change in value with movements in interest rates or total return of the reference securities. During the term of swap contracts, changes in value are recognized as unrealized gains or losses on the Consolidated Statement of Operations. When a contract is terminated, the Company realizes a gain or loss equal to the difference between the proceeds from (or cost of) the closing transaction and the Company's basis in the contract, if any. Periodic payments or receipts required by swap agreements are recorded as unrealized gains or losses when accrued and realized gains or losses when received or paid. Upfront payments paid and/or received by the Company to open swap contracts are recorded as an asset and/or liability on the Consolidated Balance Sheet and are recorded as a realized gain or loss on the termination date.
TBA Securities:
The Company has transacted in the TBA RMBS market. A TBA position is a forward contract for the purchase ("long position") or sale ("short position") of Agency RMBS at a predetermined price, face amount, issuer, coupon, and maturity on an agreed-upon future delivery date. For each TBA contract and delivery month, a uniform settlement date for all market participants is determined by the Securities Industry and Financial Markets Association. The specific Agency RMBS to be delivered into the contract at the settlement date are not known at the time of the transaction. The Company typically does not take delivery of TBAs, but rather enters into offsetting transactions and settles the associated receivable and payable balances with its counterparties. The Company primarily uses TBAs to hedge interest rate risk, but from time to time it also holds net long positions in certain TBA securities as a means of acquiring exposure to Agency RMBS.
TBAs are accounted for as financial derivatives. The difference between the contract price and the fair value of the TBA position as of the reporting date is included in Change in net unrealized gains (losses) on financial derivatives, in the Consolidated Statement of Operations. The Company estimates the fair value of TBA positions based on similar methods used to value real estate securities. Upon settlement of the TBA contract, the realized gain (loss) on the TBA contract is equal to the net cash amount received (paid).
Options
: The Company has entered into swaption contracts. It may purchase or write put, call, straddle, or other similar options contracts. The Company enters into options primarily to help mitigate interest rate risk. When the Company purchases an option, the option asset is initially recorded at an amount equal to the premium paid, if any, and is subsequently marked-to-market. Premiums paid for purchasing options that expire unexercised are recognized on the expiration date as realized losses. If an option is exercised, the premium paid is subtracted from the proceeds of the sale or added to the cost of the purchase to determine whether the Company has realized a gain or loss on the related investment transaction. When the Company writes an option, the option liability is initially recorded at an amount equal to the premium received, if any, and is subsequently marked-to-market. Premiums received for writing options that expire unexercised are recognized on the expiration date as realized gains. If an option is exercised, the premium received is subtracted from the cost of the purchase or added to the proceeds of the sale to determine whether the Company has realized a gain or loss on the related investment transaction. When the Company enters into a closing transaction, the Company will realize a gain or loss depending upon whether the amount from the closing transaction is greater or less than the premiums paid or received. The Company may also enter into options that contain forward-settling premiums. In this case, no money is exchanged upfront. Instead the agreed-upon premium is paid by the buyer upon expiration of the option, regardless of whether or not the option is exercised.
Financial derivative assets are included in Financial derivatives–assets, at fair value on the Consolidated Balance Sheet while financial derivatives liabilities are included in Financial derivatives–liabilities, at fair value on the Consolidated Balance Sheet.
(H) Repurchase Agreements and Reverse Repurchase Agreements:
The Company has entered into repurchase agreements with third-party broker-dealers, whereby it sells securities under agreements to repurchase at an agreed upon price and date. The Company may also enter into reverse repurchase agreement transactions with third-party broker-dealers, whereby it purchases securities under agreements to resell at an agreed upon price and date. Interest on the value of repurchase and reverse repurchase agreements issued and outstanding is based upon market rates at the time of issuance. The Company accounts for repurchase agreements as collateralized borrowings. When the Company enters into a repurchase agreement, the lender establishes and maintains an account containing cash and securities having a value not less than the repurchase price, including accrued interest, of the repurchase agreement. Repurchase and reverse repurchase agreements that are conducted with the same
72
counterparty can be reported on a net basis if they meet the requirements under the authoritative guidance. Repurchase agreements and reverse repurchase agreements are carried at their contractual amounts, which approximate fair value.
(I) U.S. Treasury Securities:
The Company may purchase or sell short U.S. Treasury securities to help mitigate the potential impact of changes in interest rates on the performance of its portfolio. The Company may borrow securities under reverse repurchase agreements to cover short sales of U.S. Treasury securities.
(J)
Organizational Expenses:
Organizational expenses are expensed as incurred. Organizational expenses incurred by the Company consisted mainly of legal fees.
(K) Offering Costs/Deferred Offering Costs:
Offering costs are charged against shareholders' equity and typically include legal, accounting, printing, and other fees associated with the cost of raising equity capital. As of December 31, 2012, cumulative costs associated with the Company's public offering of common shares were deferred. At the closing of the common share offering in May 2013, offering costs, including those that had been deferred, were offset against the proceeds of the offering and charged against shareholders' equity.
(L) Share Based Compensation:
The Company applies the provisions of ASC 718,
Compensation—Shares Compensation
("ASC 718"), with regard to its equity incentive plans. ASC 718 covers a wide range of share-based compensation arrangements including share options, restricted share plans, performance-based awards, share appreciation rights, and employee share purchase plans. ASC 718 requires that compensation cost relating to share-based payment transactions be recognized in financial statements. The cost is measured based on the fair value of the equity or liability instruments issued.
(M) Dividends:
Dividends payable are recorded on the declaration date.
(N) Earnings Per Share:
In accordance with the provisions of ASC 260,
Earnings per Share
, the Company calculates basic income (loss) per share by dividing net income (loss) for the period by the weighted average of the Company's common shares outstanding for that period. Diluted income (loss) per share takes into account the effect of dilutive instruments, such as share options and warrants, and uses the average share price for the period in determining the number of incremental shares that are to be added to the weighted average number of shares outstanding.
(O) Share Repurchases:
Common shares that are repurchased by the Company subsequent to issuance decrease the total number of shares issued and outstanding.
(P) Income Taxes:
Prior to May 1, 2013, the Company, as a business trust with more than one owner, was considered a partnership for U.S. federal income tax purposes. In general, partnerships are not subject to entity-level tax on their income, but the income of a partnership is taxable to its owners on a flow-through basis. Interest, dividend, and other income realized by the Company from non-U.S. sources and capital gains realized on the sale of securities of non-U.S. issuers may be subject to entity level tax such as withholding and other taxes levied by the jurisdiction in which the income is sourced. For the periods September 25, 2012 (commencement of operations) through December 31, 2012 and January 1, 2013 through April 30, 2013, the Company filed its tax return as a partnership.
The Company follows the authoritative guidance on accounting for and disclosure of uncertainty on tax positions, which requires management to determine whether a tax position of the company is more likely than not to be sustained upon examination by the applicable taxing authority, including resolution of any related appeals of the litigation process, based on the technical merits of the position. For uncertain tax positions, the tax benefit to be recognized is measured as the largest amount of benefit that is greater than fifty percent likely of being realized upon ultimate settlement. The Company did not have any unrecognized tax benefits at December 31, 2013 or December 31, 2012. The Company does not expect any change in unrecognized tax benefits within the next year. In the normal course of business, the Company may be subject to examination by federal, state, local, and foreign jurisdictions, where applicable, for the current period and 2012 (its open tax years). The Company may take positions with respect to certain tax issues which depend on legal interpretation of facts or applicable tax regulations. Should the relevant tax regulators successfully challenge any of such positions, the Company might be found to have a tax liability that has not been recorded in the accompanying consolidated financial statements. Also, management's conclusions regarding the authoritative guidance may be subject to review and adjustment at a later date based on changing tax laws, regulations, and interpretations thereof. There were no amounts accrued for penalties or interest as of or during the periods presented in these consolidated financial statements.
The Company made the election to be taxed as a corporation effective for the short taxable period May 1, 2013 through December 31, 2013. The Company intends to elect to be taxed as a REIT under Sections 856 to 860 of the Code commencing with the short taxable period May 1, 2013 through December 31, 2013.
73
(Q) Recent Accounting Pronouncements:
Under the Jumpstart Our Business Startups Act, or the "JOBS Act," the Company meets the definition of an "emerging growth company." The Company has elected to follow the extended transition period for complying with new or revised U.S. accounting standards pursuant to Section 107(b) of the JOBS Act. As a result, the Company will comply with new or revised accounting standards on the relevant dates on which adoption of such standards is required for non-public entities.
In December 2011, the FASB issued ASU No. 2011-11,
Disclosures about Offsetting Assets and Liabilities
("ASU 2011-11"). This amends ASC 210-20,
Balance Sheet Offsetting
, to require new disclosures about balance sheet offsetting for derivative and financial instruments which are offset on the Consolidated Balance Sheet. The update requires disclosure of gross asset and liability amounts for financial instruments shown net on the Consolidated Balance Sheet. ASU 2011-11 is effective for interim and annual periods beginning on or after January 1, 2013 and is to be applied retrospectively. In January 2013, the FASB issued ASU No. 2013-01,
Clarifying the Scope of Disclosures about Offsetting Assets and Liabilities
("ASU 2013- 01"). The amendment clarifies that the scope of ASU 2011-11 applies to derivatives accounted for in accordance with ASU No. 815,
Derivatives and Hedging
, including bifurcated embedded derivatives, repurchase agreements, reverse repurchase agreements, and securities borrowing and securities lending transactions that are either offset in accordance with Section 210-20-45 or Section 815-10-45 or subject to an enforceable master netting agreement or similar agreement. The adoption of ASU 2011-11, as amended by ASU 2013-01, did not have a material impact on the Company's consolidated financial statements.
3. Real Estate Securities
The following tables present details of the Company's real estate securities portfolio at December 31, 2013 and December 31, 2012, respectively. The Company's Agency RMBS include mortgage pass-through certificates and CMOs representing interests in or obligations backed by pools of residential mortgage loans issued or guaranteed by a U.S. government agency or government-sponsored enterprises, or "GSEs." The non-Agency RMBS portfolio is not issued or guaranteed by Fannie Mae, Freddie Mac or any agency of the U.S. Government and is therefore subject to greater credit risk.
By RMBS Type –
December 31, 2013
:
|
($ in thousands)
|
Gross Unrealized
|
Weighted Average
|
|||||||||||||||||||||||||||
|
Current Principal
|
Unamortized Premium (Discount)
|
Amortized
Cost
|
Gains
|
Losses
|
Fair Value
|
Coupon
|
Yield
|
Weighted Average Life(Years)
(1)
|
|||||||||||||||||||||
|
Agency RMBS:
|
|||||||||||||||||||||||||||||
|
15-year fixed rate mortgages
|
$
|
179,906
|
|
$
|
7,153
|
|
$
|
187,059
|
|
$
|
65
|
|
$
|
(3,252
|
)
|
$
|
183,872
|
|
3.09%
|
2.52%
|
5.76
|
||||||||
|
30-year fixed rate mortgages
|
1,029,629
|
|
41,565
|
|
1,071,194
|
|
490
|
|
(28,111
|
)
|
1,043,573
|
|
3.79%
|
3.30%
|
9.80
|
||||||||||||||
|
Adjustable rate mortgages
|
43,525
|
|
2,647
|
|
46,172
|
|
46
|
|
(103
|
)
|
46,115
|
|
4.72%
|
3.24%
|
3.79
|
||||||||||||||
|
Reverse mortgages
|
7,581
|
|
673
|
|
8,254
|
|
16
|
|
(2
|
)
|
8,268
|
|
4.85%
|
2.90%
|
3.41
|
||||||||||||||
|
Interest only securities
|
n/a
|
n/a
|
10,718
|
|
2,841
|
|
(32
|
)
|
13,527
|
|
3.97%
|
11.79%
|
5.02
|
||||||||||||||||
|
Total Agency RMBS
|
1,260,641
|
|
52,038
|
|
1,323,397
|
|
3,458
|
|
(31,500
|
)
|
1,295,355
|
|
3.75%
|
3.26%
|
8.67
|
||||||||||||||
|
Non-Agency RMBS
|
50,006
|
|
(21,327
|
)
|
28,679
|
|
2,196
|
|
(194
|
)
|
30,681
|
|
2.84%
|
9.12%
|
5.54
|
||||||||||||||
|
Total Real Estate Securities
|
$
|
1,310,647
|
|
$
|
30,711
|
|
$
|
1,352,076
|
|
$
|
5,654
|
|
$
|
(31,694
|
)
|
$
|
1,326,036
|
|
3.72%
|
3.38%
|
8.56
|
||||||||
|
(1)
|
Average lives of RMBS are generally shorter than stated contractual maturities. Average lives are affected by the contractual maturities of the underlying mortgages, scheduled periodic payments of principal, and unscheduled prepayments of principal.
|
For the year ended December 31, 2013, the weighted average holdings of RMBS investments based on amortized cost was
$879.9 million
.
74
December 31, 2012
:
|
($ in thousands)
|
Gross Unrealized
|
Weighted Average
|
|||||||||||||||||||||||||||
|
Current Principal
|
Unamortized Premium (Discount)
|
Amortized
Cost
|
Gains
|
Losses
|
Fair Value
|
Coupon
|
Yield
|
Weighted Average Life(Years)
(1)
|
|||||||||||||||||||||
|
Non-Agency RMBS
|
$
|
26,890
|
|
$
|
(13,400
|
)
|
$
|
13,490
|
|
$
|
117
|
|
$
|
(11
|
)
|
$
|
13,596
|
|
2.20%
|
8.50%
|
7.80
|
||||||||
|
(1)
|
Average lives of RMBS are generally shorter than stated contractual maturities. Average lives are affected by the contractual maturities of the underlying mortgages, scheduled periodic payments of principal, and unscheduled prepayments of principal.
|
By Estimated Weighted Average Life –
As of December 31, 2013:
|
($ in thousands)
|
Agency RMBS
|
Agency Interest Only Securities
|
Non-Agency RMBS
|
||||||||||||||||||||||||||||||
|
Estimated Weighted Average Life
|
Fair
Value
|
Amortized Cost
|
Weighted Average Coupon
|
Fair Value
|
Amortized Cost
|
Weighted Average Coupon
|
Fair Value
|
Amortized Cost
|
Weighted Average Coupon
|
||||||||||||||||||||||||
|
Less than three years
|
$
|
5,554
|
|
$
|
5,518
|
|
5.68
|
%
|
$
|
955
|
|
$
|
762
|
|
6.48
|
%
|
$
|
1,715
|
|
$
|
1,216
|
|
2.38
|
%
|
|||||||||
|
Greater than three years and less than seven years
|
243,120
|
|
246,342
|
|
3.48
|
%
|
7,643
|
|
6,198
|
|
3.31
|
%
|
16,488
|
|
15,950
|
|
3.42
|
%
|
|||||||||||||||
|
Greater than seven years and less than eleven years
|
1,031,552
|
|
1,059,223
|
|
3.79
|
%
|
4,929
|
|
3,758
|
|
4.91
|
%
|
11,656
|
|
10,708
|
|
1.43
|
%
|
|||||||||||||||
|
Greater than eleven years
|
1,602
|
|
1,596
|
|
4.50
|
%
|
—
|
|
—
|
|
0.00
|
%
|
822
|
|
805
|
|
7.69
|
%
|
|||||||||||||||
|
Total
|
$
|
1,281,828
|
|
$
|
1,312,679
|
|
3.73
|
%
|
$
|
13,527
|
|
$
|
10,718
|
|
3.97
|
%
|
$
|
30,681
|
|
$
|
28,679
|
|
2.84
|
%
|
|||||||||
As of December 31, 2012:
|
($ in thousands)
|
Non-Agency RMBS
|
|||||||||||
|
Estimated Weighted Average Life
|
Fair Value
|
Amortized Cost
|
Weighted Average Coupon
|
|||||||||
|
Less than three years
|
$
|
3,036
|
|
$
|
3,001
|
|
5.57
|
%
|
||||
|
Greater than three years and less than seven years
|
3,994
|
|
3,978
|
|
0.61
|
%
|
||||||
|
Greater than seven years and less than eleven years
|
3,601
|
|
3,608
|
|
1.10
|
%
|
||||||
|
Greater than eleven years
|
2,965
|
|
2,903
|
|
2.49
|
%
|
||||||
|
Total
|
$
|
13,596
|
|
$
|
13,490
|
|
2.20
|
%
|
||||
The following table illustrates components of interest income on the Company's RMBS for the year ended December 31, 2013 and September 25, 2012 (commencement of operations) to December 31, 2012:
|
Year Ended
December 31, 2013
|
September 25, 2012
(commencement of operations) to
December 31, 2012 |
|||||||||||||||||||||||
|
($ in thousands)
|
Coupon Interest
|
Net Amortization
|
Interest
Income
|
Coupon Interest
|
Net Amortization
|
Interest
Income
|
||||||||||||||||||
|
Agency RMBS
|
$
|
30,504
|
|
$
|
(4,863
|
)
|
$
|
25,641
|
|
$
|
—
|
|
$
|
—
|
|
$
|
—
|
|
||||||
|
Non-Agency RMBS
|
1,185
|
|
952
|
|
2,137
|
|
125
|
|
114
|
|
239
|
|
||||||||||||
|
Total
|
$
|
31,689
|
|
$
|
(3,911
|
)
|
$
|
27,778
|
|
$
|
125
|
|
$
|
114
|
|
$
|
239
|
|
||||||
4. Valuation
The Company applies ASC 820-10,
Fair Value Measurement and Disclosures
("ASC 820-10"), to its holdings of financial instruments. ASC 820-10 establishes a three-level valuation hierarchy for disclosure of fair value measurements. The valuation hierarchy is based upon the transparency of inputs to the valuation of an asset or liability as of the measurement date. Financial instruments include securities and derivatives. A financial instrument's categorization within the valuation hierarchy is based upon the lowest level of input that is significant to the fair value measurement. The inputs or methodology used for valuing securities are not necessarily an indication of the risk associated with investing in these securities. The following is a description of the valuation methodologies used for financial instruments:
75
Level 1—valuation methodologies include the observation of quoted prices (unadjusted) for identical assets or liabilities in active markets, often received from widely recognized data providers.
Level 2—valuation methodologies include the observation of (i) quoted prices for similar assets or liabilities in active markets, (ii) inputs other than quoted prices that are observable for the asset or liability (for example, interest rates and yield curves) in active markets and (iii) quoted prices for identical or similar assets or liabilities in markets that are not active.
The Company's Agency RMBS, exclusive of Agency interest only securities, or "Agency IOs," are classified as Level 2 assets. Fair value for Agency RMBS, excluding Agency IOs is determined using inputs considered to be observable including multiple indicative quotes from broker-dealers and recent trading activity for similar securities.
Level 3—valuation methodologies include (i) the solicitation of valuations from third parties (typically, pricing services and broker-dealers), (ii) the use of proprietary models that require the use of a significant amount of judgment and the application of various assumptions including, but not limited to, prepayment assumptions and default rate assumptions, and (iii) the assessment of observable or reported recent trading activity. The Company utilizes such information to assign a good faith fair value (the estimated price that would be received to sell an asset or paid to transfer a liability in an orderly transaction at the valuation date) to each such financial instrument. The Company's non-Agency RMBS and Agency IOs are classified as Level 3 assets.
The Company seeks to obtain at least one third-party indicative valuation for each instrument, and often obtains multiple indicative valuations when available. Third-party valuation providers often utilize proprietary models that are highly subjective and also require the use of a significant amount of judgment and the application of various assumptions including, but not limited to, prepayment assumptions and default rate assumptions. The Company has been able to obtain third-party valuations on the vast majority of its assets, and the Company expects to continue to solicit third-party valuations on substantially all of its assets in the future to the extent practical. Beginning January 1, 2013, the Company generally values each financial instrument at the average of third-party valuations received and not rejected as described below. Third-party valuations are not binding on the Company and while the Company generally does not adjust valuations it receives, it may challenge or reject a valuation when, based on validation criteria, the Company determines that such valuation is unreasonable or erroneous. Furthermore, the Company may determine, based on validation criteria, that for a given instrument the average of the third-party valuations received does not result in what the Company believes to be fair value, and in such circumstances the Company may override this average with its own good faith valuation. The validation criteria include the use of the Company's own models, recent trading activity in the same or similar instruments, and valuations received from third parties. Prior to 2013, the valuation process relied more heavily on the use of models and the observation of reported recent trading activity, which was substantiated by third-party valuations. The Company's valuation process, including the application of validation criteria, is overseen by a valuation committee. Because of the inherent uncertainty of valuation, these estimated values may differ significantly from the values that would have been used had a ready market for the financial instruments existed, and the differences could be material to the consolidated financial statements.
76
The following tables present the Company's financial instruments measured at fair value on:
December 31, 2013
:
|
(In thousands)
|
||||||||||||||||
|
Description
|
Level 1
|
Level 2
|
Level 3
|
Total
|
||||||||||||
|
Assets:
|
||||||||||||||||
|
Real estate securities, at fair value:
|
||||||||||||||||
|
Agency RMBS:
|
||||||||||||||||
|
15-year fixed rate mortgages
|
$
|
—
|
|
$
|
183,872
|
|
$
|
—
|
|
$
|
183,872
|
|
||||
|
30-year fixed rate mortgages
|
—
|
|
1,043,573
|
|
—
|
|
1,043,573
|
|
||||||||
|
Adjustable rate mortgages
|
—
|
|
46,115
|
|
—
|
|
46,115
|
|
||||||||
|
Reverse mortgages
|
—
|
|
8,268
|
|
—
|
|
8,268
|
|
||||||||
|
Interest only securities
|
—
|
|
—
|
|
13,527
|
|
13,527
|
|
||||||||
|
Non-Agency RMBS
|
—
|
|
—
|
|
30,681
|
|
30,681
|
|
||||||||
|
Real estate securities, at fair value
|
—
|
|
1,281,828
|
|
44,208
|
|
1,326,036
|
|
||||||||
|
Financial derivatives–assets, at fair value:
|
||||||||||||||||
|
TBAs
|
—
|
|
2,263
|
|
—
|
|
2,263
|
|
||||||||
|
Fixed payer interest rate swaps
|
—
|
|
32,700
|
|
—
|
|
32,700
|
|
||||||||
|
Total financial derivatives–assets, at fair value
|
—
|
|
34,963
|
|
—
|
|
34,963
|
|
||||||||
|
Total real estate securities and financial derivatives–assets, at fair value
|
$
|
—
|
|
$
|
1,316,791
|
|
$
|
44,208
|
|
$
|
1,360,999
|
|
||||
|
Liabilities:
|
||||||||||||||||
|
Financial derivatives–liabilities, at fair value:
|
||||||||||||||||
|
TBAs
|
$
|
—
|
|
$
|
(28
|
)
|
$
|
—
|
|
$
|
(28
|
)
|
||||
|
Fixed payer interest rate swaps
|
—
|
|
(956
|
)
|
—
|
|
(956
|
)
|
||||||||
|
Fixed payer swaptions
|
—
|
|
(85
|
)
|
—
|
|
(85
|
)
|
||||||||
|
Total financial derivatives–liabilities, at fair value
|
$
|
—
|
|
$
|
(1,069
|
)
|
$
|
—
|
|
$
|
(1,069
|
)
|
||||
There were
no
transfers of financial instruments between Levels 1, 2, or 3 of the fair value hierarchy during the year ended December 31, 2013.
December 31, 2012
:
|
(In thousands)
|
||||||||||||||||
|
Description
|
Level 1
|
Level 2
|
Level 3
|
Total
|
||||||||||||
|
Assets:
|
||||||||||||||||
|
Real estate securities, at fair value:
|
||||||||||||||||
|
Non-Agency RMBS
|
$
|
—
|
|
$
|
—
|
|
$
|
13,596
|
|
$
|
13,596
|
|
||||
|
Total real estate securities, at fair value
|
$
|
—
|
|
$
|
—
|
|
$
|
13,596
|
|
$
|
13,596
|
|
||||
There were
no
transfers of financial instruments between Levels 1, 2, or 3 of the fair value hierarchy during the period September 25, 2012 (commencement of operations) through December 31, 2012.
77
The following tables present additional information about the Company's investments which are measured at fair value for which the Company has utilized Level 3 inputs to determine fair value:
Year ended December 31, 2013:
|
(In thousands)
|
Agency
RMBS
|
Non-Agency RMBS
|
|||||
|
Beginning balance as of December 31, 2012
|
$
|
—
|
|
$
|
13,596
|
|
|
|
Transfers:
|
|||||||
|
Transfers into level 3
|
—
|
|
—
|
|
|||
|
Transfers out of level 3
|
—
|
|
—
|
|
|||
|
Purchases
|
12,167
|
|
41,734
|
|
|||
|
Proceeds from sales
|
—
|
|
(23,007
|
)
|
|||
|
Principal repayments
|
—
|
|
(5,923
|
)
|
|||
|
(Amortization)/accretion, net
|
(1,449
|
)
|
952
|
|
|||
|
Net realized gains
|
—
|
|
1,433
|
|
|||
|
Change in net unrealized gains (losses)
|
2,809
|
|
1,896
|
|
|||
|
Ending balance as of December 31, 2013
|
$
|
13,527
|
|
$
|
30,681
|
|
|
|
Change in net unrealized gains (losses) for level 3 assets still held as of December 31, 2013
|
$
|
2,809
|
|
$
|
1,989
|
|
|
September 25, 2012 (commencement of operations) to December 31, 2012:
|
(In thousands)
|
Non-Agency RMBS
|
||
|
Beginning balance as of September 25, 2012
|
$
|
—
|
|
|
Transfers:
|
|||
|
Transfers into level 3
|
—
|
|
|
|
Transfers out of level 3
|
—
|
|
|
|
Purchases
|
13,643
|
|
|
|
Proceeds from sales
|
(248
|
)
|
|
|
Principal repayments
|
—
|
|
|
|
(Amortization)/accretion, net
|
114
|
|
|
|
Net realized gains
|
(19
|
)
|
|
|
Change in net unrealized gains (losses)
|
106
|
|
|
|
Ending balance as of December 31, 2012
|
$
|
13,596
|
|
|
Change in net unrealized gains (losses) for level 3 assets still held as of December 31, 2012
|
$
|
106
|
|
78
The following tables identify the significant unobservable inputs that affect the valuation of the Company's Level 3 assets and liabilities as of December 31, 2013 and December 31, 2012:
December 31, 2013:
|
Range
|
||||||||||||||||||||
|
Description
|
Fair Value
|
Valuation Technique
|
Significant
Unobservable Input
|
Min
|
Max
|
Weighted Average
(1)
|
||||||||||||||
|
(In thousands)
|
||||||||||||||||||||
|
Non-Agency RMBS
|
$
|
27,422
|
|
Market quotes
|
Non Binding Indicative Price
|
$
|
20.00
|
|
$
|
100.25
|
|
$
|
75.39
|
|
||||||
|
Non-Agency RMBS
|
3,259
|
|
Discounted Cash Flows
|
Yield
|
6.0
|
%
|
17.0
|
%
|
11.9
|
%
|
||||||||||
|
Projected Collateral Prepayments
|
12.2
|
%
|
58.1
|
%
|
33.9
|
%
|
||||||||||||||
|
Projected Collateral Losses
|
6.4
|
%
|
26.5
|
%
|
11.8
|
%
|
||||||||||||||
|
Projected Collateral Recoveries
|
4.6
|
%
|
12.8
|
%
|
8.8
|
%
|
||||||||||||||
|
Projected Collateral Scheduled Amortization
|
29.9
|
%
|
54.9
|
%
|
45.5
|
%
|
||||||||||||||
|
100.0
|
%
|
|||||||||||||||||||
|
Agency RMBS–Interest Only Securities
|
12,368
|
|
Market quotes
|
Non Binding Indicative Price
|
$
|
4.99
|
|
$
|
22.47
|
|
$
|
14.92
|
|
|||||||
|
Agency RMBS–Interest Only Securities
|
1,159
|
|
Option Adjusted Spread ("OAS")
|
LIBOR OAS
(2)
|
436
|
|
436
|
|
436
|
|
||||||||||
|
Projected Collateral Prepayments
|
57.8
|
%
|
57.8
|
%
|
57.8
|
%
|
||||||||||||||
|
Projected Collateral Scheduled Amortization
|
42.2
|
%
|
42.2
|
%
|
42.2
|
%
|
||||||||||||||
|
100.0
|
%
|
|||||||||||||||||||
|
(1)
|
Averages are weighted based on the fair value of the related instrument.
|
|
(2)
|
Shown in basis points.
|
December 31, 2012:
|
Range
|
|||||||||||||||||
|
Description
|
Fair Value
|
Valuation Technique
|
Significant
Unobservable Input
|
Min
|
Max
|
Weighted Average
(1)
|
|||||||||||
|
(In thousands)
|
|||||||||||||||||
|
Non-Agency RMBS
|
$
|
13,596
|
|
Discounted Cash Flows
|
Yield
|
6.2
|
%
|
20.4
|
%
|
8.5
|
%
|
||||||
|
Projected Collateral Prepayments
|
12.6
|
%
|
52.2
|
%
|
29.4
|
%
|
|||||||||||
|
Projected Collateral Losses
|
11.3
|
%
|
41.4
|
%
|
26.9
|
%
|
|||||||||||
|
Projected Collateral Recoveries
|
6.8
|
%
|
33.2
|
%
|
23.8
|
%
|
|||||||||||
|
Projected Collateral Scheduled Amortization
|
3.0
|
%
|
52.7
|
%
|
19.9
|
%
|
|||||||||||
|
100.0
|
%
|
||||||||||||||||
|
(1)
|
Averages are weighted based on the fair value of the related instrument.
|
Third-party non-binding indicative prices are validated by comparing such prices to internally generated prices based on the Company's models and to recent trading activity in the same or similar instruments. For those instruments valued using discounted cash flows, collateral prepayments, losses, recoveries, and scheduled amortization are projected over the remaining life of the collateral and expressed as a percentage of the collateral's current principal balance. For those assets valued using the LIBOR Option Adjusted Spread, or "OAS," valuation methodology, cash flows are projected using the Company's models over multiple interest rate scenarios, and these projected cash flows are then discounted using the LIBOR rates implied by each interest rate scenario. The LIBOR OAS of an asset is then computed as the unique constant yield spread that, when added to all LIBOR rates in each interest rate scenario generated by the model, will equate (a) the expected present value of the projected asset cash flows over all model scenarios to (b) the actual current market price of the asset. LIBOR OAS is therefore model-
79
dependent. Generally speaking, LIBOR OAS measures the additional yield spread over LIBOR that an asset provides at its current market price after taking into account any interest rate options embedded in the asset.
Material changes in any of the inputs above in isolation could result in a significant change to reported fair value measurements. Fair value measurements are impacted by the interrelationships of these inputs. For example, a higher expectation of collateral prepayments will generally result in a lower expectation of collateral losses. Conversely, higher losses will generally result in lower prepayments.
5. Financial Derivatives
The Company is exposed to certain risks arising from both its business operations and economic conditions. Specifically, the Company's primary source of debt financing is repurchase agreements and the Company enters into financial derivative and other instruments to manage exposure to variable cash flows on portions of its borrowings under those repurchase agreements. Since the interest rates on repurchase agreements typically change with market interest rates such as LIBOR, the Company is exposed to constantly changing interest rates, which accordingly affects cash flows associated with these rates on its borrowings. To mitigate the effect of changes in these interest rates and their related cash flows, the Company may enter into a variety of derivative contracts, including interest rate swaps, interest rate swaptions, and TBAs.
The following table details fair value of the Company's holdings of financial derivatives as of December 31, 2013:
|
Fair Value
|
||||
|
(In thousands)
|
||||
|
Financial derivatives–assets, at fair value:
|
||||
|
TBA securities purchase contracts
|
$
|
1
|
|
|
|
TBA securities sale contracts
|
2,262
|
|
||
|
Fixed payer interest rate swaps
|
32,700
|
|
||
|
Total financial derivatives–assets, at fair value:
|
$
|
34,963
|
|
|
|
Financial derivatives–liabilities, at fair value:
|
||||
|
TBA securities sale contracts
|
$
|
(28
|
)
|
|
|
Fixed payer interest rate swaps
|
(956
|
)
|
||
|
Swaptions
|
(85
|
)
|
||
|
Total financial derivatives–liabilities, at fair value:
|
$
|
(1,069
|
)
|
|
|
Total
|
$
|
33,894
|
|
|
The Company did not have any financial derivatives outstanding as of December 31, 2012.
Interest Rate Swaps
An interest rate swap involves the receipt of variable rate payments from a counterparty in exchange for the Company making fixed rate payments over the life of the interest rate swap without exchange of the underlying notional amount. The following table details the Company's interest rate swaps as of December 31, 2013:
|
Weighted Average
|
||||||||||||||||
|
Maturity
|
Notional Amount
|
Fair Value
|
Pay Rate
|
Receive Rate
|
Years to Maturity
|
|||||||||||
|
(In thousands)
|
||||||||||||||||
|
2016
|
$
|
48,000
|
|
$
|
(171
|
)
|
0.80
|
%
|
0.24
|
%
|
2.77
|
|||||
|
2017
|
124,000
|
|
(517
|
)
|
1.19
|
|
0.24
|
|
3.61
|
|||||||
|
2018
|
156,500
|
|
2,784
|
|
1.19
|
|
0.24
|
|
4.63
|
|||||||
|
2020
|
137,100
|
|
6,444
|
|
1.49
|
|
0.24
|
|
6.06
|
|||||||
|
2023
|
218,000
|
|
14,599
|
|
2.16
|
|
0.24
|
|
9.41
|
|||||||
|
2043
|
64,750
|
|
8,605
|
|
3.18
|
|
0.24
|
|
29.44
|
|||||||
|
Total
|
$
|
748,350
|
|
$
|
31,744
|
|
1.67
|
%
|
0.24
|
%
|
8.14
|
|||||
80
Interest Rate Swaptions
The following table provides additional information about the Company's swaptions as of December 31, 2013:
|
Option
|
Underlying Swap
|
|||||||||||||
|
Type
|
Fair Value
|
Months to Expiration
|
Notional
Amount
|
Term (Years)
|
Fixed Rate
|
|||||||||
|
($ in thousands)
|
||||||||||||||
|
Fixed Payer
|
$
|
(59
|
)
|
8.9
|
$
|
22,000
|
|
10
|
3.31%
|
|||||
|
Straddle
|
$
|
(26
|
)
|
9.9
|
$
|
8,000
|
|
10
|
3.08%
|
|||||
TBAs
As of December 31, 2013, the Company had outstanding contracts to purchase ("long positions") and sell ("short positions") TBA securities as follows:
|
TBA Securities
|
Notional Amount
(1)
|
Cost Basis
(2)
|
Market Value
(3)
|
Net Carrying Value
(4)
|
||||||||||||
|
(In thousands)
|
||||||||||||||||
|
Purchase contracts:
|
||||||||||||||||
|
Assets
|
$
|
1,600
|
|
$
|
1,725
|
|
$
|
1,726
|
|
$
|
1
|
|
||||
|
Sale contracts:
|
||||||||||||||||
|
Assets
|
(363,078
|
)
|
(375,524
|
)
|
(373,262
|
)
|
2,262
|
|
||||||||
|
Liabilities
|
(16,400
|
)
|
(17,518
|
)
|
(17,546
|
)
|
(28
|
)
|
||||||||
|
Total TBA securities, net
|
$
|
(377,878
|
)
|
$
|
(391,317
|
)
|
$
|
(389,082
|
)
|
$
|
2,235
|
|
||||
|
(1)
|
Notional amount represents the principal balance of the underlying Agency RMBS.
|
|
(2)
|
Cost basis represents the forward price to be paid for the underlying Agency RMBS.
|
|
(3)
|
Market value represents the current market value of the underlying Agency RMBS (on a forward delivery basis) as of December 31, 2013.
|
|
(4)
|
Net carrying value represents the difference between the market value of the TBA contract as of December 31, 2013 and the cost basis and is reported in Financial derivatives-assets at fair value and Financial derivatives-liabilities at fair value on the Consolidated Balance Sheet.
|
The Company primarily uses TBAs to hedge interest rate risk, but from time to time it also holds net long positions in certain TBA securities as a means of acquiring exposure to Agency RMBS.
Gains and losses on the Company's financial derivatives for the year ended December 31, 2013 are summarized in the tables below:
|
Year Ended December 31, 2013
|
||||||||||||||||||||||||
|
Derivative Type
|
Net Realized Gains (Losses) on Periodic Settlements of Interest Rate Swaps
|
Net Realized Gains (Losses) Other Than Periodic Settlements of Interest Rate Swaps
|
Net Realized Gains (Losses) on Financial Derivatives
|
Change in Net Unrealized Gains (Losses) on Accrued Periodic Settlements of Interest Rate Swaps
|
Change in Net Unrealized Gains (Losses) Other Than on Accrued Periodic Settlements of Interest Rate Swaps
|
Change in Net Unrealized Gains (Losses) on Financial Derivatives
|
||||||||||||||||||
|
(In thousands)
|
||||||||||||||||||||||||
|
Fixed payer interest rate swaps
|
$
|
(5,200
|
)
|
$
|
5,060
|
|
$
|
(140
|
)
|
$
|
(1,538
|
)
|
$
|
33,282
|
|
$
|
31,744
|
|
||||||
|
Swaptions
|
—
|
|
—
|
|
(85
|
)
|
(85
|
)
|
||||||||||||||||
|
TBAs
|
7,450
|
|
7,450
|
|
2,235
|
|
2,235
|
|
||||||||||||||||
|
Total
|
$
|
(5,200
|
)
|
$
|
12,510
|
|
$
|
7,310
|
|
$
|
(1,538
|
)
|
$
|
35,432
|
|
$
|
33,894
|
|
||||||
The Company did not have any derivatives outstanding during the period September 25, 2012 (commencement of operations) through December 31, 2012.
6. Borrowings under Repurchase Agreements
The Company pledges certain real estate securities as collateral under repurchase agreements with financial institutions, the terms and conditions of which are negotiated on a transaction-by-transaction basis. Repurchase agreements involve the sale to a counterparty and a simultaneous agreement to repurchase the transferred assets or similar assets from such counterparty at a
81
future date. Repurchase agreements entered into by the Company are accounted for as collateralized borrowings and require the repurchase of the transferred securities at the end of each agreement's term, which is typically
30
to
180
days. The carrying amount of the Company's repurchase agreements approximates fair value as the debt is short-term in nature. The Company maintains the beneficial interest in the specific securities pledged during the term of the repurchase agreement and receives the related principal and interest payments. Interest rates on these borrowings are generally fixed based on prevailing rates corresponding to the terms of the borrowings, and interest is paid at the termination of the repurchase agreement at which time the Company may enter into a new repurchase agreement at prevailing market rates with the same counterparty or repay that counterparty and possibly negotiate financing terms with a different counterparty. In response to declines in fair value of pledged securities due to changes in market conditions or the publishing of monthly security paydown factors, counterparties to repurchase agreements will typically make margin calls, whereby the Company will be required to post additional securities as collateral, pay down borrowings or establish cash margin accounts with the counterparties in order to re-establish the agreed-upon collateral requirements. Under the terms of the Company's master repurchase agreements, or "MRAs," the counterparties may, in certain cases, sell or re-hypothecate the pledged collateral.
The Company seeks to have several different counterparties to its repurchase agreements at any given time in order to reduce the exposure to any single counterparty. As of December 31, 2013, the Company had outstanding borrowings under repurchase agreements with
nine
counterparties.
The following table details the Company's outstanding borrowings under repurchase agreements as of December 31, 2013:
|
Weighted Average
|
|||||||||
|
Remaining Days to Maturity
|
Borrowings Outstanding
|
Interest Rate
|
Remaining Days to Maturity
|
||||||
|
(In thousands)
|
|||||||||
|
30 days or less
|
$
|
338,700
|
|
0.35
|
%
|
14
|
|||
|
31-60 days
|
531,799
|
|
0.39
|
|
46
|
||||
|
61-90 days
|
326,386
|
|
0.38
|
|
72
|
||||
|
91-120 days
|
109,476
|
|
0.45
|
|
100
|
||||
|
121-150 days
|
3,986
|
|
0.56
|
|
136
|
||||
|
Total
|
$
|
1,310,347
|
|
0.38
|
%
|
49
|
|||
Repurchase agreements involving underlying investments that we sold prior to December 31, 2013, for settlement following December 31, 2013, are shown using their original maturity dates even though such repurchase agreements may be expected to be terminated early upon settlement of the sale of the underlying investment. Not included are any repurchase agreements that we may have entered into prior to December 31, 2013 for which delivery of the borrowed funds is not scheduled until after December 31, 2013.
As of December 31, 2013, the fair value of Agency RMBS pledged as collateral under outstanding borrowings under repurchase agreements was
$1.4 billion
. In addition, as of December 31, 2013, the Company held investments with an aggregate value of approximately
$0.5 million
which was received to satisfy collateral requirements for various repurchase agreements. Collateral pledged under outstanding borrowings include Agency RMBS in the amount of
$76.1 million
that were sold prior to period end but for which such sale had not yet settled as of December 31, 2013.
7. Offsetting of Assets and Liabilities
The Company records financial instruments at fair value as described in Note 4. All financial instruments are recorded on a gross basis on the Consolidated Balance Sheet. In connection with its financial derivatives, repurchase agreements, and related trading agreements, the Company and its counterparties are required to pledge collateral. Cash or other collateral is exchanged as required with each of the Company's counterparties in connection with open derivative positions and repurchase agreements.
82
The following table presents information about certain assets and liabilities representing financial instruments as of December 31, 2013. The Company has not previously entered into master netting agreements with any of its counterparties. Certain of the Company’s repurchase and reverse repurchase agreements and financial derivative transactions are governed by underlying agreements that generally provide a right of offset in the event of default or in the event of a bankruptcy of either party to the transaction.
|
Description
|
Amount of Assets (Liabilities) Presented in the Consolidated Balance Sheet
(1)
|
Financial Instruments
Available for Offset
|
Financial Instruments Pledged as Collateral
(2)(3)
|
Cash Collateral (Received) Pledged
(2)(3)
|
Net Amount
|
|||||||||||||||
|
(In thousands)
|
||||||||||||||||||||
|
Assets:
|
||||||||||||||||||||
|
Financial derivatives–assets
|
$
|
34,963
|
|
$
|
(1,042
|
)
|
$
|
—
|
|
$
|
(22,360
|
)
|
$
|
11,561
|
|
|||||
|
Liabilities:
|
||||||||||||||||||||
|
Financial derivatives–liabilities
|
(1,069
|
)
|
1,042
|
|
—
|
|
26
|
|
(1
|
)
|
||||||||||
|
Repurchase Agreements
|
(1,310,347
|
)
|
—
|
|
1,295,567
|
|
14,780
|
|
—
|
|
||||||||||
|
(1)
|
In the Company's Consolidated Balance Sheet, all balances associated with the repurchase agreements and financial derivatives are presented on a gross basis.
|
|
(2)
|
Total financial instruments pledged and cash collateral (received) or pledged cannot exceed the gross amount of assets and (liabilities) as presented here. Therefore we have reduced the amount of financial instruments pledged as collateral related to our repurchase agreements and cash collateral pledged on our financial derivative assets and liabilities. Total financial instruments pledged as collateral on our repurchase agreements as of December 31, 2013 were
$1.36 billion
. As of December 31, 2013 total cash collateral on financial derivative assets and liabilities excludes
$0.3 million
and
$3.1 million
, respectively of net excess cash collateral.
|
|
(3)
|
As collateral is called or posted per counterparty it is generally called or posted across all positions with each respective counterparty.
|
8. Management Fees
The Manager receives an annual management fee in an amount equal to
1.50%
per annum of shareholders' equity (as defined in the Management Agreement) as of the end of each fiscal quarter (before deductions for management fee with respect to such fiscal period). The management fee is payable quarterly in arrears. For the year ended December 31, 2013, total management fee incurred was approximately
$2.1 million
. For the period September 25, 2012 (commencement of operations) to December 31, 2012, total management fee incurred was approximately
$0.1 million
.
Shareholders' equity is defined in the Management Agreement, as of the end of any fiscal quarter, as (a) the sum of (1) the net proceeds from any issuances of common shares or other equity securities of the Company or the Operating Partnership (without double counting) since inception, plus (2) the Company's and the Operating Partnership's (without double counting) retained earnings or accumulated deficit calculated in accordance with U.S. GAAP at the end of the most recently completed fiscal quarter (without taking into account any non-cash equity compensation expense incurred in current or prior periods), less (b) any amount that the Company or the Operating Partnership has paid to repurchase common shares, limited partnership interests in the Operating Partnership or other equity securities since inception. Shareholders' equity excludes (1) any unrealized gains, losses, or non-cash equity compensation expenses that have impacted shareholders' equity as reported in the financial statements prepared in accordance with U.S. GAAP, regardless of whether such items are included in net income, and (2) one-time events pursuant to changes in U.S. GAAP, and certain non-cash items not otherwise described above, in each case, after discussions between the Manager and the Company's independent trustees and approval by a majority of the Company's independent trustees.
9. Earnings Per Share
Basic earnings per share, or "EPS," is calculated by dividing net income (loss) for the period by the weighted average of the Company's common shares outstanding for the period. Diluted EPS takes into account the effect of dilutive instruments, such as share options and warrants, and uses the average share price for the period in determining the number of incremental shares that are to be added to the weighted average number of shares outstanding. As of December 31, 2013, the Company did not have any dilutive instruments outstanding. Common shares outstanding used in EPS have been adjusted to reflect the impact of the common share dividend discussed in Note 11.
83
The following table presents a reconciliation of the earnings/(losses) and shares used in calculating basic EPS for the year ended December 31, 2013 and September 25, 2012 (commencement of operations) to December 31, 2012:
|
(In thousands except share amounts)
|
Year Ended
December 31, 2013
|
September 25, 2012 (commencement
of operations)
December 31, 2012
|
||||||
|
Numerator:
|
||||||||
|
Net loss
|
$
|
(1,914
|
)
|
$
|
(536
|
)
|
||
|
Denominator:
|
||||||||
|
Basic weighted average shares outstanding
|
6,566,656
|
|
1,633,378
|
|
||||
|
Basic Earnings Per Share
|
$
|
(0.29
|
)
|
$
|
(0.33
|
)
|
||
10. Related Party Transactions
Management Agreement
The Company has entered into a management agreement with the Manager, which provides for an initial term through September 27, 2017, and which will be renewed automatically each year thereafter for an additional
one
-year period, subject to certain termination rights. The Company is externally managed and advised by the Manager. Pursuant to the terms of the Management Agreement, effective September 24, 2012, the Manager provides the Company with its management team, including its officers and appropriate support personnel. The Company does not have any employees. The Manager is responsible for the day-to-day operations of the Company.
Services Agreement
The Manager and EMG are parties to a services agreement, pursuant to which EMG is required to provide to the Manager sufficient personnel, services, and resources to enable the Manager to carry out its obligations and responsibilities under the Management Agreement. The Company is a named third-party beneficiary to the services agreement and, as a result, has, as a non-exclusive remedy, a direct right of action against EMG in the event of any breach by the Manager of any of its duties, obligations, or agreements under the Management Agreement that arise out of or result from any breach by EMG of its obligations under the services agreement. The services agreement will terminate upon the termination of the Management Agreement. Pursuant to the services agreement, the Manager makes certain payments to EMG in connection with the services provided. The Manager and EMG are under common ownership and control. As a result, all management fee compensation earned by the Manager and all service agreement fees earned by EMG accrue to the common benefit of the owners of the Manager and EMG, other than in respect of certain special non-voting membership interests in Ellington Residential Mortgage Management LLC held by certain shareholders of the Company.
Expense Reimbursement
Under the terms of the Management Agreement the Company is required to reimburse the Manager for operating expenses related to the Company that are incurred by the Manager, including expenses relating to legal, accounting, due diligence, other services, and all other costs and expenses. The Company's reimbursement obligation is not subject to any dollar limitation. Expenses will be reimbursed in cash within
60
days following delivery of the expense statement by the Manager; provided, however, that such reimbursement may be offset by the Manager against amounts due to the Company from the Manager. The Company will not reimburse the Manager for the salaries and other compensation of the Manager's personnel except that the Company will be responsible for expenses incurred by the Manager in employing certain dedicated or partially dedicated personnel as further described below.
The Company reimburses the Manager for the allocable share of the compensation, including, without limitation, wages, salaries, and employee benefits paid or reimbursed, as approved by the Compensation Committee of the Board of Trustees, to certain dedicated or partially dedicated personnel who spend all or a portion of their time managing the Company's affairs, based upon the percentage of time devoted by such personnel to the Company's affairs. In their capacities as officers or personnel of the Manager or its affiliates, such personnel will devote such portion of their time to the Company's affairs as is necessary to enable the Company to operate its business.
Termination Fee
The Management Agreement requires the Company to pay a termination fee to the Manager in the event of (1) the Company's termination or non-renewal of the Management Agreement without cause or (2) the Manager's termination of the Management Agreement upon a default by the Company in the performance of any material term of the Management
84
Agreement. Such termination fee will be equal to
5%
of Shareholders' Equity, as defined in the Management Agreement (see Note 8 above) as of the month-end preceding termination.
Registration Rights Agreement
The Company is a party to a registration rights agreement with an affiliate of EMG and with the Blackstone Tactical Opportunities Funds (the "Blackstone Funds") pursuant to which the Company has granted its initial investors and each of their permitted transferees and other holders of the Company's "registrable common shares" (as such term is defined in the registration rights agreement) who become a party to the registration rights agreement with certain demand and/or piggy-back registration and shelf takedown rights
.
In no event shall any holder of the Company's registrable common shares have any of the registration, offering, or sale rights set forth in the registration rights agreement prior to the one year anniversary of the closing of the initial public offering.
11. Capital
The Company has authorized
500,000,000
common shares,
$0.01
par value per share, and
100,000,000
preferred shares,
$0.01
par value per share. The Board of Trustees may authorize the issuance of additional shares of either class. As of December 31, 2013 and December 31, 2012, there were
9,139,842
and
1,633,378
common shares outstanding, respectively.
No
preferred shares have been issued.
The below table details cash dividends declared by the Board of Trustees during the year ended December 31, 2013:
|
Dividend
Per Share
|
Dividend Amount
|
Declaration Date
|
Record Date
|
Payment Date
|
|||||
|
(In thousands)
|
|||||||||
|
First Quarter
(1)
|
$—
|
$—
|
N/A
|
N/A
|
N/A
|
||||
|
Second Quarter
|
$0.14
|
$1,279
|
June 18, 2013
|
June 28, 2013
|
July 26, 2013
|
||||
|
Third Quarter
|
$0.50
|
$4,569
|
September 17, 2013
|
September 27, 2013
|
October 25, 2013
|
||||
|
Fourth Quarter
|
$0.50
|
$4,570
|
December 12, 2013
|
December 31, 2013
|
January 27, 2014
|
||||
|
(1)
|
On April 18, 2013, the Company's Board of Trustees declared a
3.7066%
stock dividend (
58,378
shares) distributable to shareholders of record as of March 31, 2013, using a price of
$20.38
per share. The stock dividend was retrospectively applied to the periods reflected in the consolidated financial statements included in this Annual Report on Form 10-K.
|
The Board of Trustees did not declare any cash dividends prior to the second quarter of 2013.
On September 23, 2013, the Company's Board of Trustees authorized the issuance of
6,464
shares to its independent trustees pursuant to director share award agreements. These shares will vest and become non-forfeitable on April 30, 2014.
On August 13, 2013, the Company's Board of Trustees approved the adoption of a
$10 million
share repurchase program. The program, which is open-ended in duration, allows the Company to make repurchases from time to time on the open market or in negotiated transactions. Repurchases are at the Company's discretion, subject to applicable law, share availability, price and the Company's financial performance, among other considerations.
No
purchases have been made under the program to date.
On May 1, 2013, the Company priced an initial public offering of its common shares, pursuant to which it sold
6,450,000
shares to the public at a price of
$20.00
per share. Concurrent with the initial public offering, the Company completed a private placement with its initial shareholders which resulted in gross proceeds to the Company of
$21.0 million
and the issuance of
1,050,000
shares at a price of
$20.00
per share.
No
further capital commitments from the initial shareholders remain as a result of this private placement. Total gross proceeds from the initial public offering and concurrent private placement were
$150.0 million
. Proceeds, net of offering costs, were approximately
$148.5 million
.
Distribution Policy
The timing and frequency of distributions will be determined by the Board of Trustees based upon a variety of factors deemed relevant by the Company's trustees, including restrictions under applicable law, capital requirements of the Company, and the REIT requirements of the Code. Distributions to shareholders generally will be taxable as ordinary income, although a portion of such distributions may be designated as long-term capital gain or qualified dividend income, or may constitute a return of capital. The Company will furnish annually to each shareholder a statement setting forth distributions paid during the preceding year and their U.S. federal income tax treatment.
85
It is the intention of the Company to distribute at least
100%
of its taxable income, after application of available tax attributes, within the limits prescribed by the Internal Revenue Code, which may extend into the subsequent taxable year.
12. Commitments and Contingencies
From time to time, the Company may become involved in various claims and legal actions arising in the ordinary course of business. Management is not aware of any significant contingencies at December 31, 2013.
13. Condensed Quarterly Financial Data (Unaudited)
Detailed below is unaudited quarterly information for the year ended December 31, 2013 and September 25 (commencement of operations) to December 31, 2012.
|
(In thousands except per share amounts)
|
Three Month Period Ended March 31, 2013
|
Three Month Period Ended June 30, 2013
|
Three Month Period Ended September 30, 2013
|
Three Month
Period Ended
December 31, 2013
|
||||||||||||
|
INTEREST INCOME (EXPENSE)
|
||||||||||||||||
|
Interest income
|
$
|
283
|
|
$
|
4,310
|
|
$
|
11,223
|
|
$
|
12,050
|
|
||||
|
Interest expense
|
—
|
|
(525
|
)
|
(1,248
|
)
|
(1,283
|
)
|
||||||||
|
Total net interest income
|
283
|
|
3,785
|
|
9,975
|
|
10,767
|
|
||||||||
|
EXPENSES
|
||||||||||||||||
|
Management fees
|
119
|
|
703
|
|
644
|
|
600
|
|
||||||||
|
Professional fees
|
32
|
|
237
|
|
200
|
|
155
|
|
||||||||
|
Other operating expenses
|
46
|
|
421
|
|
513
|
|
656
|
|
||||||||
|
Total expenses
|
197
|
|
1,361
|
|
1,357
|
|
1,411
|
|
||||||||
|
OTHER INCOME (LOSS)
|
||||||||||||||||
|
Net realized gains (losses) on real estate securities and financial derivatives
|
888
|
|
5,370
|
|
(19,900
|
)
|
(16,504
|
)
|
||||||||
|
Change in net unrealized gains (losses) on real estate securities and financial derivatives
|
155
|
|
(17,498
|
)
|
18,067
|
|
7,024
|
|
||||||||
|
Total other loss
|
1,043
|
|
(12,128
|
)
|
(1,833
|
)
|
(9,480
|
)
|
||||||||
|
NET INCOME (LOSS)
|
$
|
1,129
|
|
$
|
(9,704
|
)
|
$
|
6,785
|
|
$
|
(124
|
)
|
||||
|
NET INCOME (LOSS) PER COMMON SHARE:
|
||||||||||||||||
|
Basic
(1)
|
$
|
0.69
|
|
$
|
(1.55
|
)
|
$
|
0.74
|
|
$
|
(0.01
|
)
|
||||
|
(1)
|
For the year ended December 31, 2013 the sum of EPS for the four quarters of 2013 does not equal EPS as calculated for the entire year (see Note 9) as a result of issuances of common shares, as EPS is calculated using average shares outstanding during the period.
|
86
|
(In thousands except per share amounts)
|
September 25, 2012 (commencement of operations) to September 30, 2012
|
Three Month
Period Ended
December 31, 2012
|
||||||
|
INTEREST INCOME (EXPENSE)
|
||||||||
|
Interest income
|
$
|
—
|
|
$
|
239
|
|
||
|
Interest expense
|
—
|
|
—
|
|
||||
|
Total net interest income
|
—
|
|
239
|
|
||||
|
EXPENSES
|
||||||||
|
Management fees
|
8
|
|
116
|
|
||||
|
Professional fees
|
—
|
|
125
|
|
||||
|
Organizational expense
|
—
|
|
568
|
|
||||
|
Other operating expenses
|
—
|
|
45
|
|
||||
|
Total expenses
|
8
|
|
854
|
|
||||
|
OTHER INCOME (LOSS)
|
||||||||
|
Net realized gains (losses) on real estate securities
|
—
|
|
(19
|
)
|
||||
|
Change in net unrealized gains (losses) on real estate securities
|
—
|
|
106
|
|
||||
|
Total other loss
|
—
|
|
87
|
|
||||
|
NET INCOME (LOSS)
|
$
|
(8
|
)
|
$
|
(528
|
)
|
||
|
NET INCOME (LOSS) PER COMMON SHARE:
|
||||||||
|
Basic
|
$
|
(0.01
|
)
|
$
|
(0.32
|
)
|
||
14. Subsequent Events
On
March 12, 2014
the Company's Board of Trustees approved a dividend for the first quarter of 2014 in the amount of
$0.55
per share payable on
April 28, 2014
to shareholders of record as of
March 31, 2014
.
87
None.
Disclosure Controls and Procedures
We maintain disclosure controls and procedures that are designed to ensure that information required to be disclosed in the reports that we file or submit under the Securities Exchange Act of 1934, as amended, is recorded, processed, summarized and reported within the time periods specified in the rules and forms of the SEC, and that such information is accumulated and communicated to our management as appropriate to allow timely decisions regarding required disclosures. An evaluation was performed under the supervision and with the participation of our management, including our Chief Executive Officer and Chief Financial Officer, of the effectiveness of our disclosure controls and procedures (as defined in Rules 13a-15(e) and 15d-15(e) under the Securities Exchange Act of 1934, as amended) as of December 31, 2013. Based upon that evaluation, our Chief Executive Officer and Chief Financial Officer concluded that our disclosure controls and procedures were effective as of December 31, 2013.
Internal Control Over Financial Reporting
There have been no changes in our internal control over financial reporting that occurred during the last fiscal quarter that have materially affected, or are reasonably likely to materially affect, our internal control over financial reporting.
Management's Annual Report on Internal Control Over Financial Reporting
This Annual Report on Form 10-K does not include a report of management's assessment regarding internal control over financial reporting or an attestation report of our independent registered public accounting firm due to a transition period established by rules of the SEC for newly public companies.
Disclosure Pursuant to Section 219 of the Iran Threat Reduction and Syria Human Rights Act
Pursuant to Section 13(r) of the Exchange Act, if during the fiscal year ended December 31, 2013, we or any of our affiliates had engaged in certain transactions with Iran or with persons or entities designated under certain executive orders, we would be required to disclose information regarding such transactions in our Annual Report on Form 10-K as required under Section 219 of the Iran Threat Reduction and Syria Human Rights Act of 2012 ("ITRA"). During the fiscal year ended December 31, 2013, we did not engage in any transactions with Iran or with persons or entities related to Iran.
Blackstone Tactical Opportunities EARN Holdings L.L.C., an affiliate of The Blackstone Group L.P. ("Blackstone"), is a holder of approximately 28% of the outstanding equity interests of our Common Shares and has a representative on our Board of Trustees. Accordingly, Blackstone may be deemed an "affiliate" of us, as that term is defined in Exchange Act Rule 12b-2. We have received notice from Blackstone that it may include in its Annual Report on Form 10-K for the fiscal year ended December 31, 2013 disclosures pursuant to ITRA regarding one of its portfolio companies that may be deemed to be an affiliate of Blackstone. Because of the broad definition of "affiliate" in Exchange Act Rule 12b-2, this portfolio company of Blackstone, through Blackstone's ownership of us, may also be deemed to be an affiliate of ours.
We have reproduced below the disclosure of Travelport Limited, as provided to us by Blackstone. Travelport Limited may be considered an affiliate of Blackstone. We have no involvement in or control over the activities of Travelport Limited, any of its predecessor companies or any of its subsidiaries, and we have not independently verified or participated in the preparation of this disclosure.
"As part of our global business in the travel industry, we provide certain passenger travel-related GDS and airline IT services to Iran Air. We also provide certain airline IT services to Iran Air Tours. All of these services are either exempt from applicable sanctions prohibitions pursuant to a statutory exemption permitting transactions ordinarily incident to travel or, to the extent not otherwise exempt, specifically licensed by the U.S. Office of Foreign Assets Control. Subject to any changes in the exempt/licensed status of such activities, we intend to continue these business activities, which are directly related to and promote the arrangement of travel for individuals."
Neither Travelport Limited nor Blackstone has provided us with gross revenues and net profits attributable to the activities described above.
88
The information required by Item 10 is incorporated by reference to our definitive Proxy Statement for our 2014 annual shareholders' meeting.
Our Board of Trustees has established a Code of Business Conduct and Ethics that applies to our officers and trustees and to our Manager's and certain of its affiliates' officers, directors and employees when such individuals are acting for us or on our behalf which is available on our website at
www.earnreit.com
. Any waiver of our Code of Business Conduct and Ethics of our executive officers or trustees may be made only by our Board or one of its committees.
We intend to satisfy the disclosure requirement under Item 5.05 of Form 8-K relating to amendments to or waivers from any provision of our Code of Business Conduct and Ethics applicable to our principal executive officer, principal financial officer, principal accounting officer or controller or persons performing similar functions and that relates to any element of the code of ethics definition enumerated in Item 406(b) of Regulation S-K by posting such information on our website at
www.earnreit.com
under the, "For Our Shareholders-Corporate Governance" section of the website.
The information required by Item 11 is incorporated by reference to our definitive Proxy Statement for our 2014 annual shareholders' meeting.
The information required by Item 12 is incorporated by reference to our definitive Proxy Statement for our 2014 annual shareholders' meeting.
The information required by Item 13 is incorporated by reference to our definitive Proxy Statement for our 2014 annual shareholders' meeting.
The information required by Item 14 is incorporated by reference to our definitive Proxy Statement for our 2014 annual shareholders' meeting.
(a) Documents filed as part of this report:
1. Financial Statements.
See Index to consolidated financial statements, included in Part II, Item 8 of this Annual Report on Form 10-K.
2. Schedules to Financial Statements:
All financial statement schedules not included have been omitted because they are either inapplicable or the information required is provided in our Financial Statements and Notes thereto, included in Part II, Item 8, of this Annual Report on Form 10-K.
89
|
Exhibit
|
|
Description
|
|
3.1
|
|
Articles of Amendment and Restatement of Ellington Residential Mortgage REIT filed on May 3, 2013 (incorporated by reference to the Company's quarterly report on Form 10-Q for the quarter ended March 31, 2013).
|
|
3.2
|
|
Amended and Restated Bylaws of Ellington Residential Mortgage REIT (incorporated by reference to the Company's quarterly report on Form 10-Q for the quarter ended March 31, 2013).
|
|
4.1
|
Specimen Common Share Certificate of Ellington Residential Mortgage REIT (incorporated by reference to the registration statement on Form S-11 (No. 333-187662), filed on April 23, 2013).
|
|
|
10.1
|
Amended and Restated Management Agreement between Ellington Residential Mortgage REIT and Ellington Residential Mortgage Management LLC.
|
|
|
10.2+
|
2013 Equity Incentive Plan (incorporated by reference to the registration statement on Form S-11 (No. 333-187662), filed on April 23, 2013).
|
|
|
10.3+
|
Form of Share Award Agreement (for trustees) (incorporated by reference to the Company's Current Report on Form 8-K, filed on September 25, 2013).
|
|
|
10.4
|
Form of Indemnification Agreement (incorporated by reference to the registration statement on Form S-11 (No. 333-187662), filed on April 29, 2013).
|
|
|
10.5
|
Registration Rights Agreement, dated as of September 24, 2012, by and among Ellington Residential Mortgage REIT, EMG Holdings, L.P. and Blackstone Tactical Opportunities EARN Holdings, L.L.C.(incorporated by reference to the registration statement on Form S-11 (No. 333-187662), filed on April 23, 2013).
|
|
|
10.6
|
Shareholders Agreement by and among Ellington Residential Mortgage REIT, EMG Holdings, L.P., and Blackstone Tactical Opportunities EARN Holdings, L.L.C. dated May 6, 2013 (incorporated by reference to the Company's quarterly report on Form 10-Q for the quarter ended March 31, 2013).
|
|
|
10.7
|
Amended and Restated Agreement of Limited Partnership of Ellington Residential Mortgage LP (incorporated by reference to the registration statement on Form S-11 (No. 333-187662), filed on April 23, 2013).
|
|
|
21.1
|
List of Subsidiaries
|
|
|
24.1
|
Power of Attorney (included on signature page)
|
|
|
31.1
|
|
Certification of Chief Executive Officer pursuant to Section 302 of the Sarbanes – Oxley Act of 2002
|
|
31.2
|
|
Certification of Chief Financial Officer pursuant to Section 302 of the Sarbanes – Oxley Act of 2002
|
|
32.1*
|
|
Certification of Chief Executive Officer pursuant to 18 U.S.C. Section 1350, as adopted pursuant to Section 906 of the Sarbanes – Oxley Act of 2002
|
|
32.2*
|
|
Certification of Chief Financial Officer pursuant to 18 U.S.C. Section 1350, as adopted pursuant to Section 906 of the Sarbanes – Oxley Act of 2002
|
|
101**
|
|
The following financial information from Ellington Residential Mortgage REIT's Annual Report on Form 10-K for the year ended December 31, 2013, formatted in XBRL (Extensible Business Reporting Language): (i) Consolidated Balance Sheet, (ii) Consolidated Statement of Operations, (iii) Consolidated Statement of Shareholders' Equity, (iv) Consolidated Statement of Cash Flows and (v) Notes to Consolidated Financial Statements.
|
|
*
|
Furnished herewith. These certifications are not deemed "filed" for purposes of Section 18 of the Securities Exchange Act of 1934, as amended.
|
|
**
|
Users of this data are advised pursuant to Rule 406T of Regulation S-T that this interactive data file is deemed not filed or part of a registration statement or prospectus for purposes of sections 11 or 12 of the Securities Act of 1933, is deemed not filed for purposes of section 18 of the Securities and Exchange Act of 1934, and otherwise is not subject to liability under these sections.
|
|
+
|
Compensatory plan or arrangement.
|
90
Pursuant to the requirements of Section 13 or 15(d) of the Securities Exchange Act of 1934, the registrant has duly caused this report to be signed on its behalf by the undersigned, thereunto duly authorized.
|
|
ELLINGTON RESIDENTIAL MORTGAGE REIT
|
|||
|
Date:
|
March 21, 2014
|
|
By:
|
/s/ L
AURENCE
P
ENN
|
|
|
Laurence Penn
Chief Executive Officer
(Principal Executive Officer)
|
|||
KNOW ALL MEN BY THESE PRESENTS, that we, the undersigned officers and trustees of Ellington Residential Mortgage REIT, hereby severally constitute Laurence Penn, Daniel Margolis, Jason Frank and Lisa Mumford, and each of them singly, our true and lawful attorneys with full power to them, and each of them singly, to sign for us and in our names in the capacities indicated below, the Annual Report on Form 10-K filed herewith and any and all amendments to said Annual Report on Form 10-K, and generally to do all such things in our names and in our capacities as officers and trustees to enable Ellington Residential Mortgage REIT to comply with the provisions of the Securities Exchange Act of 1934, as amended, and all requirements of the SEC, hereby ratifying and confirming our signatures as they may be signed by our said attorneys, or any of them, to said Annual Report on Form 10-K and any and all amendments thereto.
Pursuant to the requirements of the Securities Exchange Act of 1934, this report has been signed below by the following persons on behalf of the registrant and in the capacities and dates indicated.
|
Signature
|
Title
|
Date
|
||
|
/s/ L
AURENCE
P
ENN
|
Chief Executive Officer, President and Trustee
(Principal Executive Officer)
|
March 21, 2014
|
||
|
L
AURENCE
P
ENN
|
||||
|
/s/ L
ISA
M
UMFORD
|
Chief Financial Officer
(Principal Financial and Accounting Officer)
|
March 21, 2014
|
||
|
L
ISA
M
UMFORD
|
||||
|
/s/ M
ICHAEL
W.
V
RANOS
|
Trustee
|
March 21, 2014
|
||
|
M
ICHAEL
W. V
RANOS
|
||||
|
/s/ T
HOMAS
F. R
OBARDS
|
Chairman of the Board
|
March 21, 2014
|
||
|
T
HOMAS
F. R
OBARDS
|
||||
|
/s/ R
ONALD
I. S
IMON
P
H.D
|
Trustee
|
March 21, 2014
|
||
|
R
ONALD
I. S
IMON
P
H.D
|
||||
|
/s/ ROBERT B. ALLARDICE, III
|
Trustee
|
March 21, 2014
|
||
|
ROBERT B. ALLARDICE, III
|
||||
|
/s/ MENES O. CHEE
|
Trustee
|
March 21, 2014
|
||
|
MENES O. CHEE
|
||||
|
/s/ DAVID MILLER
|
Trustee
|
March 21, 2014
|
||
|
DAVID MILLER
|
||||
91
EXHIBIT INDEX
|
Exhibit
|
|
Description
|
|
3.1
|
|
Articles of Amendment and Restatement of Ellington Residential Mortgage REIT filed on May 3, 2013 (incorporated by reference to the Company's quarterly report on Form 10-Q for the quarter ended March 31, 2013).
|
|
3.2
|
|
Amended and Restated Bylaws of Ellington Residential Mortgage REIT (incorporated by reference to the Company's quarterly report on Form 10-Q for the quarter ended March 31, 2013).
|
|
4.1
|
Specimen Common Share Certificate of Ellington Residential Mortgage REIT (incorporated by reference to the registration statement on Form S-11 (No. 333-187662), filed on April 23, 2013).
|
|
|
10.1
|
Amended and Restated Management Agreement between Ellington Residential Mortgage REIT and Ellington Residential Mortgage Management LLC.
|
|
|
10.2+
|
2013 Equity Incentive Plan (incorporated by reference to the registration statement on Form S-11 (No. 333-187662), filed on April 23, 2013).
|
|
|
10.3+
|
Form of Share Award Agreement (for trustees) (incorporated by reference to the Company's Current Report on Form 8-K, filed on September 25, 2013).
|
|
|
10.4
|
Form of Indemnification Agreement (incorporated by reference to the registration statement on Form S-11 (No. 333-187662), filed on April 29, 2013).
|
|
|
10.5
|
Registration Rights Agreement, dated as of September 24, 2012, by and among Ellington Residential Mortgage REIT, EMG Holdings, L.P. and Blackstone Tactical Opportunities EARN Holdings, L.L.C.(incorporated by reference to the registration statement on Form S-11 (No. 333-187662), filed on April 23, 2013).
|
|
|
10.6
|
Shareholders Agreement by and among Ellington Residential Mortgage REIT, EMG Holdings, L.P., and Blackstone Tactical Opportunities EARN Holdings, L.L.C. dated May 6, 2013 (incorporated by reference to the Company's quarterly report on Form 10-Q for the quarter ended March 31, 2013).
|
|
|
10.7
|
Amended and Restated Agreement of Limited Partnership of Ellington Residential Mortgage LP (incorporated by reference to the registration statement on Form S-11 (No. 333-187662), filed on April 23, 2013).
|
|
|
21.1
|
List of Subsidiaries
|
|
|
24.1
|
Power of Attorney (included on signature page)
|
|
|
31.1
|
|
Certification of Chief Executive Officer pursuant to Section 302 of the Sarbanes – Oxley Act of 2002
|
|
31.2
|
|
Certification of Chief Financial Officer pursuant to Section 302 of the Sarbanes – Oxley Act of 2002
|
|
32.1*
|
|
Certification of Chief Executive Officer pursuant to 18 U.S.C. Section 1350, as adopted pursuant to Section 906 of the Sarbanes – Oxley Act of 2002
|
|
32.2*
|
|
Certification of Chief Financial Officer pursuant to 18 U.S.C. Section 1350, as adopted pursuant to Section 906 of the Sarbanes – Oxley Act of 2002
|
|
101**
|
|
The following financial information from Ellington Residential Mortgage REIT's Annual Report on Form 10-K for the year ended December 31, 2013, formatted in XBRL (Extensible Business Reporting Language): (i) Consolidated Balance Sheet, (ii) Consolidated Statement of Operations, (iii) Consolidated Statement of Shareholders' Equity, (iv) Consolidated Statement of Cash Flows and (v) Notes to Consolidated Financial Statements.
|
|
*
|
Furnished herewith. These certifications are not deemed "filed" for purposes of Section 18 of the Securities Exchange Act of 1934, as amended.
|
|
**
|
Users of this data are advised pursuant to Rule 406T of Regulation S-T that this interactive data file is deemed not filed or part of a registration statement or prospectus for purposes of sections 11 or 12 of the Securities Act of 1933, is deemed not filed for purposes of section 18 of the Securities and Exchange Act of 1934, and otherwise is not subject to liability under these sections.
|
|
+
|
Compensatory plan or arrangement.
|
92
TABLE OF CONTENTS
Part IItem 1. BusinessItem 1A. Risk FactorsItem 1B. Unresolved Staff CommentsItem 2. PropertiesItem 3. Legal ProceedingsItem 4. Mine Safety DisclosuresPart IIItem 5. Market For Registrant's Common Equity, Related Shareholders Matters, and Issuer Purchases Of Equity SecuritiesItem 6. Selected Financial DataItem 7. Management's Discussion and Analysis Of Financial Condition and Results Of OperationsItem 7A. Quantitative and Qualitative Disclosures About Market RiskItem 8. Financial Statements and Supplementary DataItem 9. Changes in and Disagreements with Accountants on Accounting and Financial DisclosuresItem 9A. Controls and ProceduresItem 9B. Other InformationPart IIIItem 10. Directors, Executive Officers and Corporate GovernanceItem 11. Executive CompensationItem 12. Security Ownership Of Certain Beneficial Owners and Management and Related Shareholder MattersItem 13. Certain Relationships and Related Transactions, and Director IndependenceItem 14. Principal Accounting Fees and ServicesPart IVItem 15. Exhibits and Financial Statement Schedules