UNITED STATES
SECURITIES AND EXCHANGE COMMISSION
Washington, D.C. 20549
____________________________________________________________________________
FORM 10-K
____________________________________________________________________________
|
☒
|
ANNUAL REPORT PURSUANT TO SECTION 13 OR 15(d) OF THE SECURITIES EXCHANGE ACT OF 1934
|
For the fiscal year ended December 31, 2018
or
|
☐
|
TRANSITION REPORT PURSUANT TO SECTION 13 OR 15(d) OF THE SECURITIES EXCHANGE ACT OF 1934
|
Commission File Number: 001-38658
_______________________________________________________________________________
EVENTBRITE, INC.
(Exact name of registrant as specified in its charter)
________________________________________________________________________________
|
Delaware
|
14-1888467
|
|
(State or other jurisdiction of
incorporation or organization)
|
(I.R.S. Employer
Identification Number)
|
|
155 5th Street, 7th Floor
San Francisco, CA 94103
(415) 692-7779
(Address, including zip code and telephone number, including area code, of Registrant’s principal executive offices)
|
|
|
Securities registered pursuant to Section 12(b) of the Act:
|
|
|
Title of Each Class
|
Name of exchange on which registered
|
|
Class A Common Stock, $0.00001 par value per share
|
New York Stock Exchange
|
Indicate by check mark if the registrant is a well-known seasoned issuer, as defined in Rule 405 of the Securities
Act. ☐ Yes ☒ No
Indicate by check mark if the registrant is not required to file reports pursuant to Section 13 or 15(d) of the Act.
☐ Yes ☒ No
Indicate by check mark whether the registrant (1) has filed all reports required to be filed by Section 13 or 15(d) of the Securities Exchange Act of 1934 during the preceding 12 months (or for such shorter period that the registrant was required to file such reports), and (2) has been subject to such filing requirements for the past 90 days. Yes ☒ No ☐
Indicate by check mark whether the registrant has submitted electronically every Interactive Data File required to be submitted pursuant to Rule 405 of Regulation S-T (§232.405 of this chapter) during the preceding 12 months (or for such shorter period that the registrant was required to submit such files). Yes ☒ No ☐
Indicate by check mark whether the registrant is a large accelerated filer, an accelerated filer, a non-accelerated filer, a smaller reporting company or an emerging growth company. See the definitions of “large accelerated filer,” “accelerated filer,” “smaller reporting company” and “emerging growth company” in Rule 12b-2 of the Exchange Act.
|
Large accelerated filer
|
☐
|
Accelerated filer
|
☐
|
|
Non-accelerated filer
|
☒
|
Smaller reporting company
|
☐
|
|
Emerging Growth Company
|
☒
|
||
If an emerging growth company, indicate by check mark if the registrant has elected not to use the extended transition period for complying with any new or revised financial accounting standards provided pursuant to Section 13(a) of the Exchange Act.
☐
Indicate by check mark whether the registrant is a shell company (as defined in Rule 12b-2 of the Exchange Act). Yes ☐ No ☒
As of
February 28, 2019
,
11,502,993
shares of the registrant's Class A common stock and
67,101,088
shares of the registrant's Class B common stock were outstanding.
The aggregate market value of the voting and non-voting common equity held by non-affiliates of the registrant, based on the closing price of the shares of common stock on September 20, 2018 as reported by the New York Stock Exchange on such date was approximately
$419.8 million
. The registrant has elected to use September 20, 2018, which was the initial trading date on the New York Stock Exchange, as the calculation date because on June 30, 2018 (the last business day of the registrant’s most recently completed second fiscal quarter), the registrant was a privately held company. Shares of the registrant’s common stock held by each executive officer, director and holder of 5% or more of the outstanding common stock have been excluded in that such persons may be deemed to be affiliates. This calculation does not reflect a determination that certain persons are affiliates of the registrant for any other purpose.
DOCUMENTS INCORPORATED BY REFERENCE
Part III of this report incorporates information by reference from the definitive Proxy Statement to be filed within 120 days after the end of the registrant's fiscal year ended December 31, 2018.
EVENTBRITE, INC.
ANNUAL REPORT ON FORM 10-K
FOR THE FISCAL YEAR ENDED
DECEMBER 31, 2018
TABLE OF CONTENTS
|
Page
|
||
|
PART I.
|
||
|
Item 1.
|
||
|
Item 1A.
|
||
|
Item 1B.
|
||
|
Item 2.
|
||
|
Item 3.
|
||
|
Item 4.
|
||
|
PART II.
|
||
|
Item 5.
|
||
|
Item 6.
|
||
|
Item 7.
|
||
|
Item 7A.
|
||
|
Item 8.
|
||
|
Item 9.
|
||
|
Item 9A.
|
||
|
Item 9B.
|
||
|
PART III.
|
||
|
Item 10.
|
||
|
Item 11.
|
||
|
Item 12.
|
||
|
Item 13.
|
||
|
Item 14.
|
||
|
PART IV.
|
||
|
Item 15.
|
||
|
Item 16.
|
||
SPECIAL NOTE REGARDING FORWARD-LOOKING STATEMENTS
This Annual Report on Form 10-K contains forward-looking statements within the meaning of Section 27A of the Securities Act of 1933, as amended, and Section 21E of the Securities Exchange Act of 1934, as amended, that involve substantial risks and uncertainties. Forward-looking statements generally relate to future events or our future financial or operating performance. In some cases, you can identify forward-looking statements because they contain words such as "may," "will," "appears," "shall," "should," "expects," "plans," "anticipates," "could," "intends," "target," "projects," "contemplates," "believes," "estimates," "predicts," "potential," or "continue," or the negative of these words or other similar terms or expressions that concern our expectations, strategy, plans, or intentions. Forward-looking statements contained in this Annual Report on Form 10-K include, but are not limited to, statements about our future financial performance, including our revenue, costs of revenue and operating expenses; our anticipated growth and growth strategies and our ability to effectively manage that growth; our ability to achieve and grow profitability; the sufficiency of our cash, cash equivalents and investments to meet our liquidity needs; our ability to maintain the security and availability of our platform; our predictions about industry and market trends; our ability to attract and retain creators; our ability to successfully expand internationally; our ability to maintain, protect and enhance our intellectual property; our ability to attract and retain qualified employees and key personnel; our ability to comply with modified or new laws and regulations applying to our business; our ability to successfully defend litigation brought against us; the increased expenses associated with being a public company; and our outstanding debt under our term loan facility.
The outcome of the events described in these forward-looking statements is subject to known and unknown risks, uncertainties, and other factors described in the section titled "Risk Factors" and elsewhere in this Annual Report on Form 10-K. We caution you that the foregoing list may not contain all of the forward-looking statements made in this Annual Report on Form 10-K. You should not rely upon forward-looking statements as predictions of future events.
All forward-looking statements are based on information and estimates available to the Company at the time of this Annual Report on Form 10-K and are not guarantees of future performance. We undertake no obligation to update any forward-looking statements made in this Annual Report on Form 10-K to reflect events or circumstances after the date of this Annual Report on Form 10-K or to reflect new information or the occurrence of unanticipated events, except as required by law.
PART I
Item 1. Business
Overview
We founded Eventbrite to bring the world together through live experiences. We believe live experiences are fundamental to fulfilling a human desire to connect. Our company serves event creators—the people who bring others together to share their passions, artistry and causes through live experiences—and we empower their success.
We built a powerful, broad technology platform to enable creators to solve the challenges associated with creating live experiences. Our platform integrates components needed to seamlessly plan, promote and produce live events, thereby allowing creators to reduce friction and costs, increase reach and drive ticket sales. By reducing risk and complexity, we allow creators to focus their energy on producing compelling and successful events.
We succeed when creators succeed. Our business model is simple: we charge creators on a per-ticket basis when an attendee purchases a paid ticket for an event. We grow with the creators as they plan, promote and produce more events and grow attendance. In 2018, we helped more than 790,000 creators issue approximately 265 million tickets across approximately 3.8 million events in over 170 countries.
Creators face numerous challenges in planning, promoting and producing events. These challenges stem from complex and interdependent workflows required before, during and after events. Creators have historically relied on a fragmented set of online and offline tools that inhibit, rather than enhance, these workflows. While some of the largest professional event creators have access to costly technology systems for event management, many creators lack the budget and staff necessary to benefit from these legacy technologies. Our comprehensive platform is designed to be easy to use and intuitive while providing sophisticated capabilities to the widest range of event creators.
We designed our platform for all creators, regardless of category, country, size or type of event. We enable events ranging from fundraisers, seminars, wellness activities and music festivals to classes and cultural celebrations all over the world. Anyone can create or discover events on Eventbrite. This allows more creators to produce original and compelling experiences, attracting more attendees to these experiences. As a consequence, we believe we are expanding the global market for live experiences.
Our platform meets the complex needs of creators through a modular and extensible design. It can be accessed from Eventbrite.com, our mobile apps and through other websites. This modularity facilitates rapid product development and allows third-party developers to integrate features and functionality from Eventbrite into their environment. Our platform also allows developers to seamlessly integrate services from third-party partners such as Salesforce, Facebook and HubSpot. Importantly, we have designed our platform to produce consistent and reliable performance, handling both surges in traffic and transaction volume associated with high-demand on-sales and the load associated with supporting millions of events each year. This approach gives creators a platform that can scale to their needs, offering everything from basic registration and ticketing to a fully-featured event management platform.
This platform approach has allowed us to pioneer a powerful business model that drives our go-to-market strategy and allows us to efficiently serve a large number and variety of creators. We believe our business model will enable us to achieve and grow profitability as we increase our scale. We attract creators to our platform through multiple means, including prior experience as attendees, word of mouth from other creators, our prominence in search engine results, the ability to try our platform for free events and our library of content. More than 98% of creators who used our platform in 2018 signed themselves up for Eventbrite, and in 2018, we derived 56% of our net revenue from these creators. We augment this model with a highly-targeted sales team that focuses on acquiring creators with events in specific categories or countries. Substantially all of our creators create and manage events without the need for service or support.
4
Trends in Our Favor
We believe live experiences are fundamental to fulfilling a human desire to connect. This interest in human connection drives the creation of more diverse events today than ever before, ranging from consumer-focused experiences such as music concerts and beer festivals, to cause-related events like marches, fundraisers and political rallies. According to an Eventbrite survey conducted by Crowd DNA, four out of five adults surveyed in our top four geographic markets in April 2017 attended a live event in the past year, indicating broad interest in events.
A combination of trends in consumer behavior and technology is increasing the role and importance of live experiences and provides a tailwind for our market opportunity. We call this the “experience economy.”
|
•
|
Consumer Preferences Shifting to Experiences.
We are in the middle of a societal transition to a world that prioritizes experiences over goods. According to the U.S. Bureau of Economic Analysis, growth in consumer spending on experiences in the United States has consistently outpaced overall growth in consumer spending from 2001 to 2016, even during periods of economic recession. In a proprietary report that we commissioned, over 70% of adults surveyed in our top four geographies in April 2017 reported they would rather spend money on experiences as compared to material goods.
|
|
•
|
Rising Importance of Experiential Marketing.
Live experiences have become increasingly critical in connecting companies, products and brands to their target audiences. According to a 2017 eMarketer survey, events were rated as one of the most effective marketing channels used by business-to-business marketers to engage with potential customers and nearly 70% of marketing decision makers in the United States planned to increase spending on events in the coming year.
|
|
•
|
Content Owners Extending Monetization.
Thanks to the rise of digital distribution of content, today, traditional media companies and content owners enjoy a closer relationship with some of their end users. As a result, these media companies and content owners increasingly leverage data with direct marketing capabilities to target these end users with live experiences. Live music sales have grown steadily over the past 15 years, and are the primary source of revenue for artists in the U.S. music industry.
|
|
•
|
Technology Acting as an Enabler.
Recent advances in mobile, social media, cloud software and other digital technologies act as a catalyst for live experiences. Internet ubiquity and smartphone adoption propel the use of online and mobile ticketing, reducing the discovery and transactional friction associated with acquiring tickets. Social media enables attendees to become evangelists of events and serves as a low-cost promotion tool and distribution channel, improving the efficiency of attendee acquisition for event organizers. The shift to cloud has led to the emergence of a low-cost infrastructure upon which we can build powerful, self-service software.
|
Our Value Proposition
Our platform supports a wide range of creators through a simple interface with capabilities that are powerful and reliable and scale with their needs, delivering the following benefits:
|
•
|
Streamlined Creator Experience.
Our platform is designed to be powerful, yet easy to use, and to seamlessly support the entire lifecycle of an event. Creators are able to use our platform without training, support or professional services. As a result, our platform reduces the time and effort necessary to produce live experiences. Creators can launch an event on the platform in a matter of minutes. Our platform scales with creators. Many creators begin to use our platform for free gatherings and evolve to paid events of various sizes.
|
|
•
|
Reduced Cost to Manage Events.
Our platform is available for anyone to use for free, and we offer a range of attractively-priced packages to serve a variety of creator needs. Not only is our product affordable, but creators often find they can do more on their own, reducing the need for staff and other third-party vendors.
|
|
•
|
Real-Time Insights.
Platform analytics bring insight to creators about multiple dimensions of an event, allowing them to make real-time decisions that directly impact attendance, revenue, profitability and the attendee experience.
|
5
|
•
|
Trusted Attendee Experience.
Event registration and payments are the first touch points of the attendee with the creator brand and are critical to create an overall positive experience. Attendees are able to register, purchase and access their tickets in a few taps of a smartphone or clicks on their computer. The speed of the registration process maximizes conversion during the purchase flow and, therefore, enhances the creators’ return on marketing efforts. Furthermore, our digital tickets remove friction associated with traditional box offices and enable streamlined entry through a variety of technological improvements in access control and queuing.
|
|
•
|
Extended Creator Reach.
We have a number of capabilities to help connect attendees’ individual interests with creators’ events. Search and browse functionality allows attendees who are in the market for a particular event to easily find it on Eventbrite or through our search engine prominence. Additionally, our platform supports social sharing and has deep integrations with distribution partners where we extend the reach of creators’ events to new and relevant audiences. Finally, we offer creators access to a number of paid marketing channels to drive additional sales.
|
Our Strengths
|
•
|
Our Comprehensive Platform Serves Any Creator.
Our platform combines deep functionality designed to serve sophisticated creators yet is intuitive and easy to use for creators of all types. This platform is modular and extensible, allowing us to build new capabilities quickly and to integrate with best-in-class third-party services. In 2018, our platform supported 3.8 million events in more than 170 countries on a cloud-based infrastructure.
|
|
•
|
Our Business Model Has Cost Advantages in Creator Acquisition and Operations.
Creators become aware of Eventbrite through word of mouth, exposure from purchasing tickets as attendees and our search engine prominence, a free offering that drives paid adoption and our relevant professional content. More than 98% of creators who used our platform in 2018 signed themselves up for Eventbrite. Our single global system combined with self-service functionality allows us to reduce cost of operations and optimize service delivery. These drivers have allowed us to grow our gross profit per employee at a compound annual growth rate of 18% between 2014 and 2018.
|
|
•
|
Our Commitment to Creators Shapes Our Culture.
Our creator-centric culture drives innovation, high performance and global sensibility. Creators inspire product evolution and help us to attract a mission driven talent base with similar passion and commitment. This unique environment and focus on people and culture feeds the productivity and engagement of our team, driving long-term success for creators and our business.
|
Our Growth Strategy
|
•
|
Attract New Creators to Our Platform.
We will continue to broaden the reach of our platform by efficiently attracting new creators. We will continue to leverage a number of creator acquisition triggers, such as prior experience as attendees, word of mouth from other creators, our prominence in search engine results, the ability to try the product for free events and our library of content. By serving these new creators, we aim to benefit from the variety of high quality events they bring to our platform and enhance our reputation, driving further creator acquisition through word of mouth and referrals.
|
|
•
|
Add Capabilities to Better Serve Specific Categories.
The breadth of our platform has enabled us to build a strong historical track record of expanding our business by developing capabilities to better address specific event categories. For example, in 2016, we decided to focus on independent music venues by building out category-specific capabilities on our platform. We will continue to strategically add category-specific capabilities, expanding the breadth and depth of our platform.
|
|
•
|
Add Capabilities to Better Serve Specific Countries.
Eventbrite is globally available. In 2018, our platform supported events in more than 170 countries. However, every country is unique and requires a thoughtful process to support creators. As we serve more creators in specific countries, we intend to localize our platform by adding new capabilities, often around local payment methods or supporting local tax systems, in order to further scale in these markets.
|
6
|
•
|
Develop New Revenue Streams Based on Complementary Offerings.
As we grow and evolve with creators, we plan to develop new capabilities and solutions to enhance our core offering. These capabilities and services allow us to better serve creators, unlocking additional revenue streams and developing opportunities with attendees directly. For example, we currently offer web and mobile development on our proprietary platform to help creators express their brands through their event listing page, profile page, email and other event-related digital assets. We intend to continue to invest in these types of solutions by monitoring changing creator and attendee needs and developing offerings where we see the greatest opportunity for growth.
|
|
•
|
Selectively Acquire Businesses Focused on Serving Creators.
We have been successful leveraging our platform to make selective acquisitions that have contributed to creator and revenue growth. We accelerated our momentum through the acquisitions of ticketscript, Ticketfly, Ticketea and Picatic. By finding like-minded teams who share a common ethos around serving creators, we can continue to expand and offer new capabilities to existing creators. The modularity and extensibility of our platform enables us to integrate and migrate creators to the Eventbrite platform, allowing us to quickly deprecate the acquired technology and associated costs.
|
Our Technology Platform
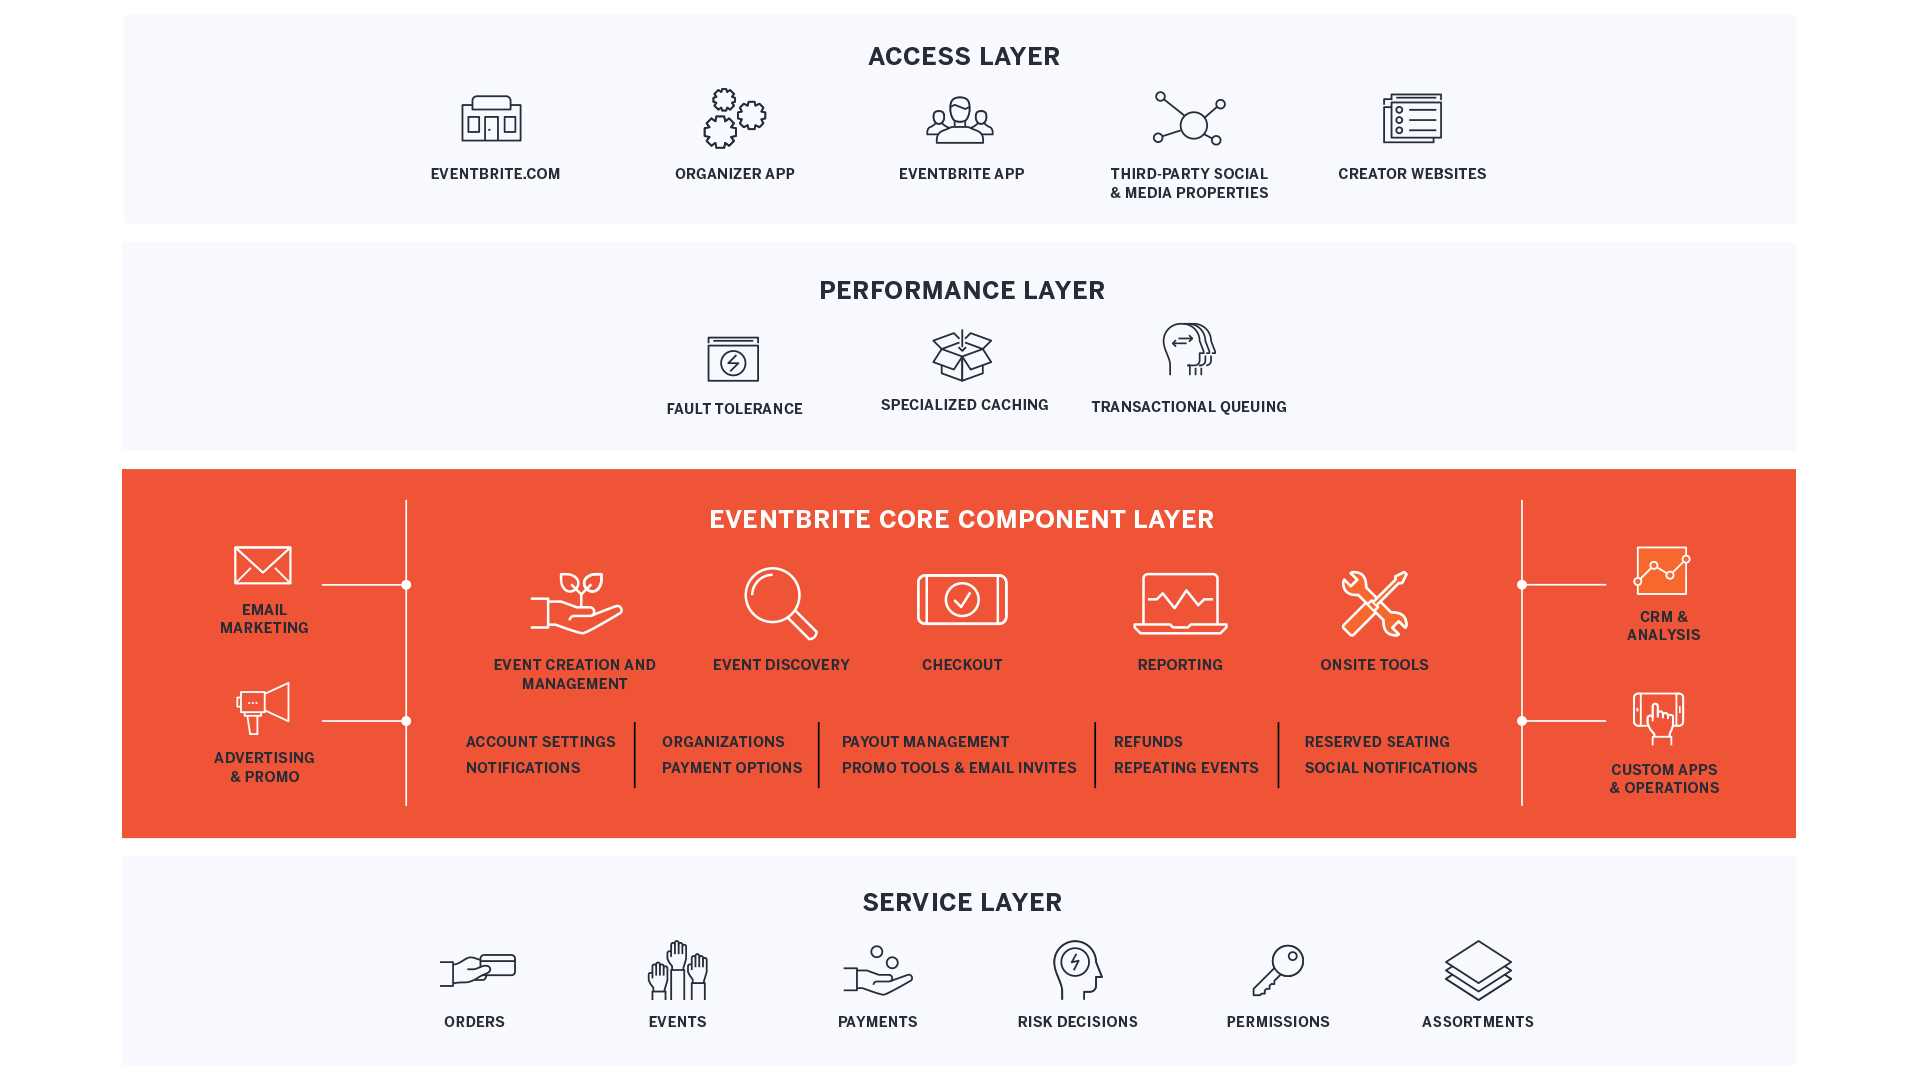
To enable creators to more easily plan, promote and produce successful events independent of size, category or geographic location, we have designed a powerful and comprehensive platform. Our platform’s cloud-based architecture supports a modular and extensible design that facilitates rapid product development and innovation by our internal development teams, our external partners and a broad developer ecosystem.
The five core tenets guiding our platform design are:
|
•
|
Accessibility.
We build intuitive mobile and Web applications that connect to a single platform. Creators can choose how they interface with our platform. Their access is not limited by the channels they prefer.
|
|
•
|
Modularity.
Our core capabilities are built as independent components and solutions so that they can be efficiently modified without redeploying the entire codebase. Similarly, new capabilities can be easily added without disturbing the functionality of the existing platform. This approach fuels rapid product development.
|
|
•
|
Extensibility.
We can extend our platform to integrate third parties, enabling creators seamless access to best-in-class partners. We also extend their reach by building Eventbrite into social and media properties with large audiences.
|
|
•
|
Flexibility.
Our proprietary and third-party components exist on our common platform, allowing creators to seamlessly customize their experience by choosing different functionalities for each event.
|
|
•
|
Reliability
. We can centrally manage the performance of our platform, providing oversight and monitoring of that performance to support high-demand on-sales while continually monitoring for fraudulent or malicious activity.
|
7
Our platform is visually depicted below.
Currently, our platform is hosted in the cloud by Amazon Web Services (AWS). AWS supports our platform’s multiple layers, variances in load and global demand by allowing us to reserve server capacity in varying amounts and sizes distributed across multiple regions of the world. In February 2012, we entered into an agreement with Amazon Web Services, Inc. for the use of cloud services from AWS. Such agreement will continue indefinitely until terminated by either party. In a December 2017 addendum to such agreement, we committed to spend an aggregate of at least $12.5 million between January 2018 and December 2020 on AWS services ($5.0 million in 2018, $3.5 million in 2019 and $4.0 million in 2020). If we fail to meet the minimum purchase commitment during any year, we may be required to pay the difference. We pay AWS monthly, and we may pay more than the minimum purchase commitment to AWS based on usage.
8
Our Access Layer

|
•
|
Eventbrite.com.
Creators, attendees and consumers who use our platform to search for events access Eventbrite’s broad functionality through our responsively designed website.
|
|
•
|
Organizer App.
Creators access Eventbrite through our proprietary creator app available on both Android and iOS. This app is customized specifically to help creators quickly create, manage and handle onsite needs.
|
|
•
|
Eventbrite App
. Consumers access Eventbrite through our proprietary consumer app available on both Android and iOS. This app is customized specifically to help consumers quickly discover, purchase and gain access to events.
|
|
•
|
Third-Party Social and Media.
Our integrations with distribution partners provide consumers access to our transactional capabilities. All events are automatically distributed to these partners and most partners have invested in integrations that allow sales to happen natively on the partner site. We have more than 50 partners today, including Google, Facebook, Spotify, Instagram and Bandsintown.
|
|
•
|
Creator Websites.
Eventbrite powers many creator sites, allowing both creators and their audiences to directly interact with the Eventbrite platform through a variety of integrations. This includes our embedded checkout widget to power native transactions directly within the creator’s website, increasing conversion and maintaining engagement in the creator’s brand post-transaction.
|
Our Performance Layer
We strive to maintain consistent performance in spite of significant variations in the load placed upon our platform at different points in time. Our platform regularly supports events which sell tens of thousands of tickets in just minutes, often with significantly more page views or inventory requests than the total capacity of the event. The timing of high demand episodes is unpredictable, and we accommodate them while managing our typical volumes.
There are three critical mechanisms to ensure this high level of steady-state performance:
|
•
|
Fault Tolerance.
Although Eventbrite is entirely in the cloud, all of our solutions are designed to handle failures either in critical support infrastructure like site operations or payments. For these kinds of solutions, we either run in multiple “zones” to avoid issues with a failure in any one zone or run multiple partners with the ability to fail-over to different partners depending on availability.
|
|
•
|
Specialized Caching.
We have developed specialized caching schemes that render common portions of our components in a highly efficient manner. Instead of requiring the whole page to render with every request straight from our data stores, we can cache elements to ensure consumers have quick load times and so the overall performance of the site is not degraded.
|
9
|
•
|
Transactional Queuing.
We have a proprietary transaction queueing system that tracks the order of arrival of potential ticket buyers across all Eventbrite channels, ensuring that all consumers have fair access to inventory, every time, no matter what channel they use.
|
Success in delivering a high level of steady-state performance depends on handling episodes of high demand amid a consistently large volume of events. Our efforts here have allowed us to maintain 99.99% system uptime on the Eventbrite platform over the last six years.
Our Core Component Layer
Components are modular elements purpose-built to be shared across points of access. Eventbrite components can be extended to third-party platforms. Additionally, we can integrate third-party components into our platform, giving third parties access to these components while using our platform.
Some of the most important components include:
|
•
|
Event Creation and Management.
Creators can set up professional ticketing and registration pages within minutes, on any device. They can customize this flow to include multiple ticket types and specifications, design checkout forms, integrate fundraising, implement waitlists and more. Once an event is published, it is immediately available to be managed both online and in our creator apps.
|
|
•
|
Event Discovery.
We take into account consumers’ interests and purchase behavior to drive discovery of relevant events and deliver incremental audience and ticket sales to creators. Consumers can search for live experiences by location, date or type of event, save those they are interested in and follow creators to receive a more personalized experience.
|
|
•
|
Checkout.
Our platform supports transactions across multiple modes of access. No matter how a consumer comes to Eventbrite, they encounter the same high-performance purchase flow. While ensuring a high-conversion experience, this component also ensures that we track inventory and test for fraud or other malicious activity. Our apps also allow attendees to store and access tickets conveniently on their mobile devices.
|
|
•
|
Reporting.
Creators can also track performance through various charts and reports, review data from past events, install tracking pixels and promote their events on social media.
|
|
•
|
Onsite Tools.
On the day of the event, we help creators with ticket scanning, streamlined entry and maintaining accurate counts and we also provide point-of-sale solutions.
|
Importantly, we are not limited to components that we have created. With Eventbrite Spectrum, we have a platform of more than 100 extensions and API integrations that bring essential software tools and adjacent workflows directly into Eventbrite. Example of areas where we use extensions to enhance creator functionality include:
|
•
|
Email Marketing.
More than ten email marketing software (EMS) providers plug into the Eventbrite APIs to deliver a unified experience of event management and email marketing. Creators are able to leverage integrations with MailChimp, AWeber, Emma and many other leading EMS providers.
|
|
•
|
Advertising & Promotion.
Through partner extensions, we give creators access to a range of promotional and advertising solutions that allow them to reach a wider audience and sell more tickets. These include solutions that enable the automation of social media advertising, software for running word of mouth marketing campaigns and deep integrations with media properties that offer incremental reach and awareness.
|
|
•
|
CRM & Analytics.
Creators are able to connect Eventbrite to a range of industry-leading customer relationship management and analytics tools through partner-built integrations. These include tools such as Salesforce, HubSpot and Zoho.
|
|
•
|
Mobile Apps and Event Operations.
Creators can take advantage of a number of best-in-class event technology providers, ranging from event mobile apps, badge and ticket printing, session scheduling and live streaming.
|
10
Our Service Layer
The base layer of our platform is a set of services accessible through programmer interfaces that allow all developers access to the platform’s data and capabilities in a powerful, secure and intuitive way.
Key services include:
|
•
|
Orders.
Our order service enables transactions on Eventbrite.com, our organizer and consumer apps, API-driven transactions from our distribution partners and embedded checkout from within creators’ websites.
|
|
•
|
Events.
Our event service captures all data around an event in the creation flow regardless of how the service is accessed and renders this data in the appropriate format depending on how the event is accessed.
|
|
•
|
Payments.
We deliver an integrated payment solution for creators as a Level 1 PCI-DSS Compliant Merchant and Service Provider. Despite having multiple vendors, our integrated approach allows us to offer a simple onboarding process, a seamless checkout experience, quick refunds for attendees, simple payout schedules and a unified chargeback process. In September 2017, we announced a partnership with Square where Square would become our primary online payment processing partner for EPP in the United States, Canada, Australia, the United Kingdom as well as any new territories Square enters into over time. Square will also become our exclusive payment processing partner for all of our point-of-sale solutions in those same territories. We estimate that the first online transaction will be processed through EPP using Square in 2019, but we are moving forward with the point-of-sale partnership as expediently as possible.
|
|
•
|
Risk Decisions.
We have built a risk and fraud system that uses machine-learning models and business rules to evaluate every transaction processed for fraud and malicious use in milliseconds. This system uses hundreds of features and data points to inform fast and accurate decisions with low false positive rates. The systems and operations that we have created to fight fraud have become a key strategic advantage.
|
|
•
|
Permissions
. Our comprehensive permissions handling service controls access to all of our platform capabilities. This system enables creators with more complex needs to handle multi-user access, multiple roles and collaboration on events and accounts.
|
|
•
|
Assortments.
We offer creators multiple packages at different price points to allow them to select the perfect package for their needs. Our creators have access to specific features, APIs and services based on their selected package.
|
Our Go-To-Market Strategy
Our go-to-market strategy allows us to efficiently serve a large number and variety of creators. We attract creators to our platform through multiple means. Our category leadership and diversity of event types brings creators to us through word of mouth or their experiences as attendees at events produced by other Eventbrite creators. In addition, we are a leading publisher and distributor of content, which elevates our brand and drives prominence in search engine results. Finally, we make our platform available for free events, which allows us to attract many creators who then use our solution for paid events. More than 98% of creators who used our platform in 2018 signed themselves up for Eventbrite and in 2018, we derived 56% of our net revenue from these creators. We augment these efforts with a highly-targeted sales team that focuses on acquiring creators with events in specific categories or countries.
Key components of our go-to-market strategy are described below:
|
•
|
Awareness
. A significant number of creators become aware of us through either word of mouth or interacting with our platform as attendees. In a 2016 internal survey of more than 3,000 global creators, 36% of creators reported first learning about Eventbrite through word of mouth and 34% of creators reported first learning of Eventbrite by attending events produced by other Eventbrite creators. Both of these factors have helped us grow organically with low creator acquisition costs.
|
|
•
|
Professional Content.
By creating valuable content focused on creator needs, we make creators aware of us as a place for high quality, professional articles housed in a constantly evolving knowledge hub, leading creators to discover our platform as an event management solution. We published approximately 1,400 pieces of content in 2018, translating this content into five languages and localized for eleven countries. Based on Internet traffic, we believe we are the largest online publisher of professional content targeted at creators.
|
11
|
•
|
Search Engine Prominence.
We enjoy an advantage in search engine prominence, driving material organic traffic to our website at no cost. Eventbrite.com is among the top 100 most linked-to sites on the Internet, granting it one of the highest domain authority scores. We enhance this advantage through search engine prominence, resulting in a steady stream of professional creators who come to Eventbrite directly as part of their search for an event management solution.
|
|
•
|
Free-to-Paid Conversion.
Our “free for free events” approach attracted more than 400,000 free creators to our platform in 2017. Since 2015, approximately 17% of creators who have produced a free event have gone on to host a paid event within twelve months of their first free event. In addition, our comprehensive platform supports a global go-to-market strategy and allows us to enter new markets or new categories with minimal additional cost.
|
Packages
We enhanced our go-to-market approach by adding pricing packages to our services in September 2017, in order to be able to meet the varying needs of creators who come to our platform. To help drive the growth of our business, we periodically adjust the pricing of our packages.
We offer three different pricing packages with corresponding levels of features to provide flexibility for each creator: Essentials, Professional and Premium.
|
•
|
Essentials.
The Essentials package offers the capabilities required for a simple event at an attractive price. Creators can build a mobile-optimized event page, accept secure payments, use our free promotional solutions, track sales and benefit from time-saving integrations and give attendees a simple, secure checkout experience.
|
|
•
|
Professional.
With the Professional package, creators get everything in Essentials plus unlimited ticket types, ticket sales on their own sites, detailed sales analytics, customizable registration forms, payouts before events, reserved seating and comprehensive support.
|
|
•
|
Premium.
The Premium package takes everything in the Professional offering and adds account management and access to a number of complementary solutions that enable these creators to scale. Premium features include branded community pages, installment payments, product training, team access and permissions, onsite staffing and support, access control technology, 24/7 phone support and more.
|
Our packages allow us to address specific types of creators with a targeted offering that balances price and functionality, covering a greater spectrum of creator willingness-to-pay. We believe this approach will allow us to optimize revenue in new creator cohorts in the future.
Our People, Culture and Values
Our mission is to bring the world together through live experiences, and we like to think about working at Eventbrite as the ultimate live experience, which we refer to as the “Briteling Experience.” This experience is built on the foundation of our five core values:
|
•
|
Be a creator.
Since day one, making it happen has been part of our DNA. It is essential to our success and integral to our culture. We are innovators and doers. We are creators.
|
|
•
|
Go all in.
Great ideas come to life when pursued with conviction. With the confidence to take smart risks and learn from failures, we dream big and go all in. It’s how success is made.
|
|
•
|
Simplify it.
Creating events is a complex and ambitious effort, so we strive to tackle that complexity at every turn and make it easy for creators to succeed.
|
|
•
|
Let ’em in.
Authenticity invites the conversations and connections that can inspire incredible growth. We encourage being yourself and welcoming diverse perspectives.
|
|
•
|
Choose brilliance
. We never opt for anything less than our best. We choose brilliance because our mission requires it—and it’s what our creators deserve.
|
12
We support a global workforce, with 14 offices in 11 countries, serving creators across the world. We maintain operations in the United States, Argentina, Australia, Belgium, Brazil, Canada, Germany, Ireland, the Netherlands, Spain and the United Kingdom.
As of December 31, 2018, we had a total of 1,094 employees, of which 1,075 were full-time employees and 37% of our total employees were located at our headquarters in San Francisco, California.
Competition
The market for event management solutions is highly fragmented and is impacted by shifting creator and attendee needs and changing technology and consumer trends. We also compete with internally-developed systems. This competitive landscape provides creators and attendees with many channels to promote or engage with live experiences.
We believe that competition varies by market, category, country and creator type, and that the most critical dimensions of competition are the following:
|
•
|
breadth and depth of functionality;
|
• quality and reliability of the technology;
• ability to assist creators in getting access to more potential attendees;
• ability to address the needs of specific categories;
• ability to adapt to specific geographies;
• pricing level and pricing model;
• reputation and brand as a seamless, transparent and secure platform for creating and attending live experiences;
• flexibility and integration of technology with complementary products and services;
• capabilities that create a comprehensive set of event management functionality that help power creator success;
• ability to provide mobile event management and ticketing; and
• willingness to offer creators access to capital ahead of the event.
We believe that our focus on providing a seamless experience for creators and attendees and a powerful but easy-to-use platform differentiate us from our competitors and that we compete favorably with respect to the factors above.
We do not typically compete with event management providers who sell sports, music and concert tickets in the world’s largest stadiums, arenas and amphitheaters. This market is characterized by multi-year financial commitments including operating leases and outright ownership of venues with commensurately higher fee structures to support the higher real estate-based cost. We also believe these systems are impractical for the majority of event creators, as they often require significant costs, substantial amounts of on-premises equipment and software customization. Finally, this segment of the market is challenged by distinct factors such as widespread and unauthorized and often highly-regulated secondary ticketing. Further, we also do not compete for every type of ticket. For instance, we do not currently participate in the movie or airline markets. Therefore, we do not consider all “ticketing” companies to be competitors.
In assessing our competitive landscape, although we believe that no single competitor focuses on all of the same markets, geographies, categories and creator types as we do at the same scale, we believe that our competitors fall into two broad groups:
|
•
|
Event management software vendors.
These providers are dedicated to a particular category of events, and typically in a limited number of countries. They often focus on providing solutions for larger scale, professional affairs, relying on a sales-driven go-to-market strategy that can be high cost and often involves the use of capital in the form of signing fees and advances to secure contracts. Lastly, their offerings tend to be proprietary on-premises software. This group also includes many internal systems, which typically lag in adoption of more modern architectures.
|
|
•
|
Smaller long-tail providers.
These providers are typically smaller in scale and have limited technology and feature functionality. While they typically use modern development methods and use a cloud infrastructure, they may lack the scale to take advantage of the efficiencies of a platform approach.
|
13
Our Product Development Approach
We invest substantial resources in product development to enhance our platform and develop new products and features.
Our product development organization consists of world-class engineering, product and design teams. As of December 31, 2018, we had 364 professionals across these teams, representing approximately 33% of our total employees. Our engineering, product and design teams work together to drive continual innovation.
In 2018, 2017 and 2016, product development expenses were
15.8%
,
15.2%
and
17.0%
of net revenue, respectively.
Intellectual Property
We protect our intellectual property through a combination of trademarks, domain names, copyrights, trade secrets and patents, as well as contractual provisions and restrictions governing access to our proprietary technology.
We registered “Eventbrite” as a trademark in the United States, Australia, Argentina, Brazil, Canada, China, European Union, Germany, Ireland, the Netherlands, Mexico, Spain, the United Kingdom and certain other jurisdictions. We also have filed other trademark applications in the United States, Argentina, Australia, Brazil, Canada, Germany, Ireland, the Netherlands, Spain, the United Kingdom and certain other jurisdictions, and will pursue additional trademark registrations to the extent we believe it would be beneficial and cost effective.
As of December 31, 2018, we had 13 issued patents, which expire between 2031 and 2032, and two patent applications pending in the United States. These patents and patent applications seek to protect proprietary inventions relevant to our business. We intend to pursue additional patent protection to the extent we believe it would be beneficial and cost effective.
We are the registered holder of a variety of domain names that include “Eventbrite” and similar variations.
In addition to the protection provided by our registered intellectual property rights, we also enter into confidentiality agreements with our employees, consultants, contractors and business partners. Our employees, consultants and contractors are also subject to invention assignment agreements, pursuant to which we obtain rights to technology that they develop for us. We further protect our rights in our proprietary technology and intellectual property through restrictive license and service use provisions in both the general and product-specific terms of use on our website and in other business contracts.
Regulatory
We are subject to a number of U.S. federal and state and foreign laws and regulations that involve matters central to our business. These laws and regulations may involve privacy, data protection, intellectual property, competition, consumer protection, export taxation or other subjects. Many of the laws and regulations to which we are subject are still evolving and being tested in courts and could be interpreted in ways that could harm our business. In addition, the application and interpretation of these laws and regulations often are uncertain, particularly in the new and rapidly evolving industry in which we operate. Because global laws and regulations have continued to develop and evolve rapidly, it is possible that we may not be, or may not have been, compliant with each such applicable law or regulation.
The Telephone Consumer Protection Act of 1991 (TCPA) restricts telemarketing and the use of automatic text messages without proper consent. The scope and interpretation of the laws that are or may be applicable to the delivery of text messages are continuously evolving and developing. If we do not comply with these laws or regulations or if we become liable under these laws or regulations due to the failure of our customers to comply with these laws by obtaining proper consent, we could face direct liability.
Information about Geographic Revenue
Information about geographic revenue is set forth in Note 15 of our Notes to our Consolidated Financial Statements included in Part II, Item 8, "Financial Statements and Supplementary Data" of this Annual Report on Form 10-K.
Corporate Information
Eventbrite Inc. was incorporated in Delaware in March 2008. Our corporate headquarters are located at 155 Fifth Street, Seventh Floor, San Francisco, California 94105. Our website address is www.eventbrite.com. Information contained on, or that can be accessed through, our website does not constitute part of this Annual Report on Form 10-K.
14
Additional Information
The following filings are available through our investor relations website after we file them with the Securities and Exchange Commission (SEC): Annual Report on Form 10-K, Quarterly Reports on Form 10-Q and our Proxy Statement for our annual meeting of stockholders. These filings are also available for download free of charge on our investor relations website. Our investor relations website is located at http://investor.eventbrite.com/. The SEC also maintains a website that contains reports, proxy statements and other information about issuers, like us, that file electronically with the SEC. The address of that website is www.sec.gov.
We webcast our earnings calls and certain events we participate in or host with members of the investment community on our investor relations website. Additionally, we provide notifications of news or announcements regarding our financial performance, including SEC filings, investor events, press and earnings releases, and blogs as part of our investor relations website. Further corporate governance information, including our corporate governance guidelines, code of conduct and committee charters is also available on our investor relations website under the heading "Corporate Governance."
The contents of the websites referenced in this Annual Report are not intended to be incorporated by reference into this Annual Report on Form 10-K or in any other report or document we file with the SEC, and any references to these websites are intended to be inactive textual references only.
15
Item 1A. Risk Factors
A description of the risks and uncertainties associated with our business is set forth below. You should carefully consider the risks and uncertainties described below, together with all of the other information in this Annual Report on Form 10-K, including the section titled “Management’s Discussion and Analysis of Financial Condition and Results of Operations” and our consolidated financial statements and related notes. The risks and uncertainties described below may not be the only ones we face. If any of the risks actually occur, our business, results of operations, financial condition and prospects could be harmed. In that event, the market price of our Class A common stock could decline, and you could lose part or all of your investment.
Risks Related to Our Business and Industry
Our continued growth depends on our ability to attract new creators and retain existing creators.
Our success depends on our ability to attract new creators and retain existing creators. We may fail to attract new creators and retain existing creators due to a number of factors outlined in this section, including:
|
|
•
|
|
our ability to maintain and continually enhance our platform and provide services that are valuable and helpful to creators, including helping them to attract and retain attendees;
|
|
•
|
competitive factors, including the actions of new and existing competitors in our industry, such as competitors buying exclusive ticketing rights or entering into or expanding within the market in which we operate;
|
||
|
•
|
our ability to convince creators to migrate to our platform from their current practices, which include online ticketing platforms, venue box offices and do-it-yourself spreadsheets and forms;
|
||
|
•
|
changes in our relationships with third parties, including our partners, developers and payment processors, that make our platform less effective for creators;
|
||
|
•
|
the quality and availability of key payment and payout methods;
|
||
|
•
|
our ability to manage fraud risk that negatively impacts creators; and
|
||
|
•
|
our ability to adapt to changes in market practices or economic incentives for creators, including larger or more frequent signing fees.
|
||
If we are unable to effectively manage these risks as they occur, creators may seek other solutions and we may not be able to retain them or acquire additional creators to offset any such departures, which would adversely affect our business and results of operations. Furthermore, the loss of creators and our inability to replace them with new creators and events of comparable quality and standing would harm our business and results of operations.
We have a history of losses and we may not be able to generate sufficient revenue to achieve and maintain profitability.
We incurred net losses of
$64.1 million
,
$38.5 million
and
$40.4 million
in 2018, 2017 and 2016, respectively. Our net revenues were
$291.6 million
,
$201.6 million
and
$133.5 million
in 2018, 2017 and 2016, respectively. This represents a
44.7%
growth rate from 2017 to 2018 and a
51.0%
growth rate from 2016 to 2017. We expect that our revenue growth rate will decline or fluctuate in the future as a result of a variety of factors, including a reduction in revenue contributed from acquisitions in a particular period. You should not rely on the revenue growth of any prior quarterly or annual period as an indication of our future performance. We also expect our costs to increase in future periods as we continue to expend substantial financial resources on technology infrastructure, product and services development and enhancement, international expansion and localization efforts, business development and acquisitions, sales and marketing and general administration, including legal and accounting expenses. These investments may not result in increased revenue or growth in our business. If we are unable to maintain adequate revenue growth and to manage our expenses effectively, we may incur significant losses in the future and may not be able to achieve and maintain profitability. As a result, we may continue to generate losses and we cannot assure you that we will achieve profitability in the future or that, if we do become profitable, we will be able to maintain profitability.
16
Further expansion into markets outside of the United States is important to the growth of our business, and if we do not manage the risks of international expansion effectively, our business and results of operations will be harmed. Furthermore, our expansion into jurisdictions where we have limited operating experience may subject us to increased business and economic risks that could harm our business and our results of operations.
In 2018, 2017 and 2016, we derived
27.4%
,
30.0%
and
27.0%
, respectively, of our net revenue from outside of the United States. Outside the U.S. we currently have 12 offices, including offices in the United Kingdom, Ireland, Spain, Belgium, Germany, the Netherlands, Australia, Argentina and Brazil. We have large engineering and business development teams in Argentina and Spain. Our international operations and results are subject to a number of risks, including:
|
|
•
|
|
currency exchange restrictions or costs and exchange rate fluctuations and the risks and costs inherent in hedging such exposures;
|
|
•
|
new and modified laws and regulations regarding data privacy, data protection and information security;
|
||
|
•
|
exposure to local economic or political instability, threatened or actual acts of terrorism and violence and changes in the rights of individuals to assemble;
|
||
|
•
|
compliance with U.S. and non-U.S. regulations, laws and requirements relating to anti-corruption, antitrust or competition, economic sanctions, data content and privacy, consumer protection, employment and labor laws, health and safety and advertising and promotions;
|
||
|
•
|
compliance with additional U.S. laws applicable to U.S. companies operating internationally and interpretations of U.S. and international tax laws;
|
||
|
•
|
weaker enforcement of our contractual and intellectual property rights;
|
||
|
•
|
preferences by local populations for local providers;
|
||
|
•
|
laws and business practices that favor local competitors or prohibit or limit foreign ownership of certain businesses; and
|
||
|
•
|
slower adoption of the Internet as a ticketing, advertising and commerce medium, which could limit our ability to migrate international operations to our existing systems.
|
||
We plan to continue to expand our international operations as part of our growth strategy. Despite our experience operating internationally, future expansion efforts into new countries may not be successful. Our international expansion has placed, and our expected future international growth will continue to place, a significant strain on our management, customer service, product development, sales and marketing, administrative, financial and other resources. We cannot be certain that the investment and additional resources required in expanding our international operations will be successful or produce desired levels of revenue or profitability in a timely manner, or at all. Furthermore, certain international markets in which we operate have lower margins than more mature markets, which could have a negative impact on our margins as our revenue from these markets grows over time.
We may choose in certain instances to localize our platform to the unique circumstances of such countries and markets in order to achieve market acceptance, which can be complex, difficult and costly and divert management and personnel resources. Our failure to adapt our practices, platform, systems, processes and contracts effectively to the creator and attendee preferences or customs of each country into which we expand could slow our growth. If we are unable to manage our international growth successfully, our results of operations could be harmed.
17
Acquisitions, investments or significant commercial arrangements could result in operating and financial difficulties.
We have acquired or entered into commercial arrangements with a number of businesses in the past. For example, since 2015 we have acquired seven companies, including ticketscript and Ticketfly in 2017 and Ticketea and Picatic in 2018. Our future growth may depend, in part, on future acquisitions, investments or significant commercial arrangements, any of which could be material to our results of operations and financial condition. Financial and operational risks related to acquisitions, investments and significant commercial arrangements that may have an impact on our business include:
|
|
•
|
|
use of cash resources and incurrence of debt and contingent liabilities in funding acquisitions may limit other potential uses of our cash, including for retirement of outstanding indebtedness, stock repurchases and dividend payments;
|
|
•
|
difficulties and expenses in assimilating the operations, products, data, technology, privacy, data protection systems and information security systems, information systems or personnel of the acquired company;
|
||
|
•
|
failure of the acquired company to achieve anticipated benefits, revenue, earnings or cash flows or our failure to retain key employees from an acquired company;
|
||
|
•
|
the assumption of known and unknown risks, debt and liabilities of the acquired company, deficiencies in systems or internal controls, impairment of goodwill or other intangible assets and costs associated with litigation or other claims arising in connection with the acquired company;
|
||
|
•
|
failure to properly and timely integrate acquired companies and their operations, reducing our ability to achieve, among other things, anticipated returns on our acquisitions through cost savings and other synergies;
|
||
|
•
|
adverse market reaction to acquisitions;
|
||
|
•
|
failure to consummate such transactions; and
|
||
|
•
|
other expected and unexpected risks with pursuing acquisitions, including, but not limited to, litigation or regulatory exposure, unfavorable accounting treatment, increases in taxes due, a loss of anticipated tax benefits, costs or delays to obtain governmental approvals, diversion of management’s attention or other resources from our existing business and other adverse effects on our business, results of operations or financial condition.
|
||
When we acquire companies or other businesses, we face the risk that creators of the acquired companies or businesses may not migrate to our platform or may choose to decrease their level of usage of our platform post migration. We have previously experienced customer loss in the process of integrating and migrating acquired companies for a variety of reasons. The pace and success rate of migration may be influenced by many factors, including the pace and quality of product development, our ability to operationally support the migrating creators and our adoption of business practices outside of our platform that matter to the creator.
Moreover, we rely heavily on the representations and warranties and related indemnities provided to us by our acquired targets and their equity holders, including as they relate to creation, ownership and rights in intellectual property, compliance with laws, contractual requirements and the ability of the acquisition target to continue exploiting material intellectual property rights and technology after the acquisition. If any such representations are inaccurate or such warranties are breached, or if we are unable to fully exercise our indemnification rights, we may incur additional liabilities, disruptions to the operations of our business and diversion of our management’s attention.
Our failure to address these risks or other problems encountered in connection with past or future acquisitions, investments and significant commercial arrangements could cause us to fail to realize the anticipated benefits of such transactions, incur unanticipated liabilities and harm our business, results of operations and financial condition.
18
If we do not continue to maintain and improve our platform or develop successful new solutions and enhancements or improve existing ones, our business will suffer.
Our ability to attract and retain creators depends in large part on our ability to provide a user-friendly and effective platform, develop and improve our platform and introduce compelling new solutions and enhancements. Our industry is characterized by rapidly changing technology, new service and product introductions and changing demands of creators. We spend substantial time and resources understanding creators’ needs and responding to them. Building new solutions is costly and complex, and the timetable for commercial release is difficult to predict and may vary from our historical experience. In addition, after development, creators may not be satisfied with our enhancements or perceive that the enhancements do not adequately respond to their needs. The success of any new solution or enhancement to our platform depends on several factors, including timely completion and delivery, competitive pricing, adequate quality testing, integration with our platform, creator awareness and overall market acceptance and adoption. If we do not continue to maintain and improve our platform or develop successful new solutions and enhancements or improve existing ones, our business will suffer.
Our payments system depends on third-party providers and is subject to risks that may harm our business.
We rely on third-party providers to support our payments system. Approximately 90% of revenue on our platform is associated with payments processed through our internal payment processing capabilities, called Eventbrite Payment Processing (EPP). EPP uses a combination of multiple external vendors to provide a single, seamless payments option for creators and attendees. Beyond EPP, the remainder of creators’ paid ticket sales are processed through linked, creator-owned, third-party accounts, including PayPal and Authorize.net, which we call Facilitated Payment Processing (FPP).
We partner with third-party vendors to support EPP. For example, in September 2017, we announced a partnership with Square where Square would become our primary online payment processing partner for EPP in the United States, Canada, Australia, the United Kingdom as well as any new territories Square enters into over-time. Square will also become our exclusive payment processing partner for all of our point-of-sale solutions in those same territories. We may supplement Square in these markets by working with other payment providers if there are local payment methods that Square does not support. We estimate that the first online transaction will be processed through EPP using Square in 2019. Our agreement with Square has an initial term of five years and automatically renews for additional one-year periods thereafter. Under the agreement, we will pay Square a percentage of each transaction processed using Square’s services plus Square’s third-party costs to process and settle such transactions. Either we or Square may terminate the partnership arrangement at any time for cause, or, after an initial no termination period of two years if terminated by Square or four years if terminated by us, for any or no reason with six months’ prior written notice to the other party. Our costs for payment processing may increase using Square due to higher direct costs of development and implementation and fee structure. We also partner with other payment processors for EPP in the United States, Canada, Australia and the United Kingdom, as well as in other jurisdictions.
As a complex, multi-vendor system with proprietary technology added, EPP relies on banks and third-party payment processors to process transactions and access various payment card networks to allow creators to manage payments in an easy and efficient manner. We also rely on our providers to process transactions as a payment facilitator of a payment network. Any of our payment providers and vendors that do not operate well with our platform could adversely affect our payments systems and our business. We have multiple integrations in place at one time allowing for back up processing on EPP if a single provider is unable or unwilling to process any given transaction, payment method or currency. However, if any or some of these providers do not perform adequately, determine certain types of transactions as prohibitive for any reason or fail to identify fraud, if these providers’ technology does not interoperate well with our platform, or if our relationships with these providers were to terminate unexpectedly, creators may find our platform more difficult to use and the ability of creators using our platform to sell tickets could be adversely affected, which could cause creators to use our platform less and harm our business.
We must also continually integrate various payment methods used both within the United States and internationally into EPP. To enhance our acceptance in certain international markets we have in the past adopted, and may in the future adopt, locally-preferred payment methods and integrate such payment methods into EPP, which may increase our costs and also require us to understand and protect against unique fraud and other risks associated with these payment methods. For example, in Brazil we localized our platform to allow the use of Boleto as a payment method, and we invested capital and management attention to achieve this. If we are not able to integrate new payment methods into EPP effectively, our business may be harmed.
19
Our payment processing partners require us to comply with payment card network operating rules, which are set and interpreted by the payment card networks. The payment card networks could adopt new operating rules or interpret or re-interpret existing rules in ways that might prohibit us from providing certain services to some creators, be costly to implement or difficult to follow. We have agreed to reimburse our payment processors for fines they are assessed by payment card networks if we or creators using our platform violate these rules, such as our processing of various types of transactions that may be interpreted as a violation of certain payment card network operating rules.
In addition, payment card networks and payment processing partners could increase the fees they charge us for their services or for an attendee using one of their cards, which would increase our operating costs and reduce our margins. If we are unable to negotiate favorable economic terms with these partners, our business and results of operations may be harmed.
We may pay up front creator signing fees and creator advances to certain creators when entering into exclusive ticketing or services agreements and if these arrangements do not perform as we expect, our business, results of operations and financial condition may be harmed.
We may pay one-time, up front non-recoupable or recoupable signing fees to certain creators in order to incentivize them to organize certain events on our platform or obtain exclusive rights to ticket their events. These payments are common practice in certain segments of the ticketing industry and are typically made to a creator upon entering into a multi-year exclusive ticketing or service contract with us. The multi-year exclusive arrangements that we entered into between 2013 and 2018 had an average term of 36 months and were typically for exclusive ticketing rights. A creator who receives a non-recoupable fee, which we refer to as creator signing fees, net, keeps the entire signing fee, so long as the creator complies with the terms of the creator’s contract with us, including performance of an event. If a creator does not comply with the terms of the contract or perform an event, such fees are refundable to us. Creator signing fees, net, including noncurrent balances, were
$17.0 million
and
$10.4 million
as of December 31, 2018 and 2017, respectively, and, as of December 31, 2018, these payments are being amortized over a weighted-average remaining life of
3.3
years on a straight-line basis. For recoupable fees, which we refer to as creator advances, net, we are entitled to recoup the entire signing fee by withholding all or a portion of the ticket sales sold by the creator to whom the recoupable signing fee was previously paid. Creator advances, net, including noncurrent balances, were
$23.1 million
and
$20.1 million
as of December 31, 2018 and 2017, respectively. We pay these signing fees based on the expectations of future ticket sales on our platform by such creators. We make the decision to make these payments based on our assessment of the past success of the creator, past event data, future events the creator is producing and other financial information. We include commercial and legal protections in our contracts that include signing fees, such as issuing the signing fee only after the creator begins selling tickets on our platform and requiring a third-party to guarantee the obligations and liabilities of the creator receiving such a payment, to mitigate the financial risk of making these payments. However, event performance may vary greatly from year-to-year and from event to event. If our assumptions and expectations with respect to event performance prove wrong or if a counterparty defaults or an event is not successful, our return on these signing fees will not be realized and our business and results of operations will be harmed.
20
Our results vary from quarter-to-quarter and year-to-year. Our results of operations in certain financial quarters or years may not be indicative of, or comparable to, our results of operations in subsequent financial quarters or years.
Our quarterly results of operations have fluctuated significantly in the past due to these factors and a variety of other factors, many of which are outside of our control and difficult to predict. It is difficult for us to forecast the level or source of our revenue accurately. Because our results may vary significantly from quarter-to-quarter and year-to-year, our financial results for one quarter or year cannot necessarily be compared to another quarter or year and may not be indicative of our future financial performance in subsequent quarters or years. Period-to-period comparisons of our results of operations may not be meaningful, and you should not rely upon them as an indication of future performance. In addition to other risk factors listed in this “Risk Factors” section, factors that may cause our results of operations to fluctuate include:
|
|
•
|
|
creator acquisition and retention;
|
|
•
|
new solution introductions and expansions, or challenges with introduction;
|
||
|
•
|
acquisition of companies and the success, or lack thereof, of migration of such companies’ creators;
|
||
|
•
|
changes in pricing or packages;
|
||
|
•
|
the development and introduction of new products or services by us or our competitors;
|
||
|
•
|
increases in operating expenses that we may incur to grow and expand our operations and to remain competitive;
|
||
|
•
|
system failures or breaches of security or privacy;
|
||
|
•
|
changes in stock-based compensation expenses;
|
||
|
•
|
adverse litigation judgments, settlements or other litigation-related costs;
|
||
|
•
|
changes in the legislative or regulatory environment, including with respect to privacy or data protection, or enforcement by government regulators, including fines, orders or consent decrees;
|
||
|
•
|
fluctuations in currency exchange rates and changes in the proportion of our revenue and expenses denominated in foreign currencies;
|
||
|
•
|
fluctuations in the market values of our portfolio investments and interest rates;
|
||
|
•
|
changes in our effective tax rate;
|
||
|
•
|
announcements by competitors or other third parties of significant new products or acquisitions or entrance into certain markets; our ability to make accurate accounting estimates and appropriately recognize revenue for our solutions for which there are no relevant comparable products;
|
||
|
•
|
changes in accounting standards, policies, guidance, interpretations, or principles; and
|
||
|
•
|
changes in business or macroeconomic conditions.
|
||
In addition, the seasonality of our business could create cash flow management risks if we do not adequately anticipate and plan for periods of decreased activity, which could negatively impact our ability to execute on our strategy, which in turn could harm our results of operations. For example, we experience more cash flow generally in the first and third quarters of a fiscal year.
21
Data loss or security breaches could harm our business, reputation, brand and results of operations.
Security breaches, computer malware and computer hacking attacks have become more prevalent across industries and may occur on our systems or those of our third-party service providers or partners. Despite the implementation of security measures, our internal computer systems and those of our third-party service providers and partners are vulnerable to damage from computer viruses, hacking and other means of unauthorized access, denial of service and other attacks, natural disasters, terrorism, war and telecommunication and electrical failures. Attacks upon information technology systems are increasing in their frequency, levels of persistence, sophistication and intensity, and are being conducted by sophisticated and organized groups and individuals with a wide range of motives and expertise. In addition to unauthorized access to or acquisition of personal data, confidential information, intellectual property, or other sensitive information, such attacks could include the deployment of harmful malware and ransomware, and may use a variety of methods, including denial-of-service attacks, social engineering and other means, to attain such unauthorized access or acquisition or otherwise affect service reliability and threaten the confidentiality, integrity and availability of information. Furthermore, the prevalent use of mobile devices increases the risk of data security incidents. In addition, misplaced, stolen or compromised mobile devices used at events for ticket scanning, or otherwise, could lead to unauthorized access to the device and data stored on or accessible through such device. We have in the past experienced breaches of our security measures and our platform and systems are at risk for future breaches as a result of third-party action or employee, service provider, partners or contractor error or malfeasance. For example, in June 2018, we publicly announced that a criminal was able to penetrate the Ticketfly website and steal certain consumer data, including names, email addresses, shipping addresses, billing addresses and phone numbers. For a short time, we disabled the Ticketfly platform to contain the risk of the cyber incident, which disabled ticket sales through Ticketfly during that period. Because of this incident, we have incurred costs related to responding to and remediating this incident and have suffered a loss of revenue for the period during which the Ticketfly platform was disabled. In the year ended
December 31, 2018
, we recorded
$7.0 million
for costs associated with this incident, of which
$6.7 million
was recorded as a reduction to net revenue and $0.3 million was recorded as an operating expense. We also recorded
$6.6 million
related to insurance proceeds to be received from the Ticketfly incident as a reduction in general and administrative expenses in the year ended
December 31, 2018
, respectively. Such proceeds are a partial reimbursement for accommodations to creators which are recorded as contra revenue. As of
December 31, 2018
, we had a remaining liability balance of
$0.3 million
related to future accommodation payments and a
$0.6 million
receivable for insurance proceeds. The cyber incident has delayed the completion of the integration of Ticketfly, which has resulted in extended customer migration time and slower realization of synergies. We may be subject to litigation, experience reputational harm, and have been subject to claims and have suffered customer loss related to this incident. In the future, our financial performance may be impacted further if we face additional costs and expenses from customer compensation and retention incentives, creator loss, regulatory inquiries, litigation and further remediation and upgrades to our security infrastructure. Although we have insurance coverage, our policy may not cover all financial expenses related to this matter.
In addition, our platform involves the storage and transmission of personal information of users of our platform in our facilities and on our equipment, networks and corporate or third-party systems. Security breaches could expose us to litigation, remediation costs, increased costs for security measures, loss of revenue, damage to our reputation and potential liability. User data and corporate systems and security measures may be breached due to the actions of outside parties, employee error or misconduct, malfeasance, a combination of these or otherwise, and, as a result, an unauthorized party may obtain access to our data or data of creators and attendees. Additionally, outside parties may attempt to fraudulently induce employees, creators or attendees to disclose sensitive information in order to gain access to creator or attendee data. We must continuously examine and modify our security controls and business policies to address the use of new devices and technologies, and the increasing focus by users and regulators on controlling and protecting user data. We may need to expend significant resources to protect against and remedy any potential security breaches and their consequences. Any security breach of our platform or systems, the systems or networks of our third-party service providers or partners, or any unauthorized access to information we or our providers and partners process or maintain, could harm our business, results of operations and financial condition.
Because the techniques used to obtain unauthorized access, disable or degrade service, or sabotage systems change frequently or may be designed to remain dormant until a predetermined or other future event and often are not recognized until launched against a target, we and our third-party service providers and partners may be unable to anticipate these techniques or implement adequate preventative measures. While we have implemented security measures intended to protect our information technology systems and infrastructure, there can be no assurance that such measures or our third-party service providers and partners’ information security measures will successfully prevent service interruptions or further security incidents. Although it is difficult to determine what harm may directly result from any specific interruption or breach, any actual or perceived failure to maintain performance, reliability, security and availability of our network infrastructure, or of any third-party networks or systems used or supplied by our third-party service providers or partners, to the satisfaction of creators and attendees may harm our reputation and our ability to retain existing creators and attendees and attract new creators and attendees.
22
Examples of situations which may lead to unauthorized access of data may include:
|
|
•
|
|
employees inadvertently sending financial information of one creator, attendee or employee to another creator, attendee or employee;
|
|
•
|
creators’ failure to properly password protect their leased ticket scanning and site operations devices leaving the data available to anyone using the device;
|
||
|
•
|
a device stolen from an event and data access, alteration or acquisition occurring prior to our remote wiping of the data;
|
||
|
•
|
an employee losing their computer or mobile device or otherwise, allowing for access to our email and/or administrative access, including access to guest lists to events;
|
||
|
•
|
external breaches leading to the circulation of “dark web” lists of user name and password combinations openly vulnerable to attack without immediate detection;
|
||
|
•
|
a hack of one of our databases;
|
||
|
•
|
account takeovers;
|
||
|
•
|
a hack of a third-party service provider or partner’s database; and
|
||
|
•
|
unauthorized access to our offices or other properties.
|
||
If an actual or perceived breach of our security occurs, the market perception of the effectiveness of our security measures could be harmed, we could lose creators and attendees or we could face lawsuits, regulatory investigations or other legal or regulatory proceedings and we could suffer financial exposure due to such events or in connection with regulatory fines, remediation efforts, investigation costs, changes or augmentation of our security measures and the expense of taking additional system protection measures.
The processing, storage, use and disclosure of personal data could give rise to liabilities as a result of governmental regulation, conflicting legal requirements or differing applications of privacy regulations.
We receive, transmit and store a large volume of personally identifiable information and other user data. Numerous federal, state and international laws address privacy, data protection and the collection, storing, sharing, use, disclosure and protection of personally identifiable information and other user data. Numerous states already have, and are looking to expand, data protection legislation requiring companies like ours to consider solutions to meet differing needs and expectations of creators and attendees. For example, in June 2018, California enacted the California Consumer Privacy Act, which takes effect on January 1, 2020, and will broadly define personal information, give California residents expanded privacy rights and protections and provide for civil penalties for violations and a private right of action for data breaches. Outside the United States, personally identifiable information and other user data is increasingly subject to legislation and regulations in numerous jurisdictions around the world, the intent of which is to protect the privacy of information that is collected, processed and transmitted in or from the governing jurisdiction. Foreign data protection, privacy, information security, user protection and other laws and regulations are often more restrictive than those in the United States. In particular, the European Union and its member states traditionally have taken broader views as to types of data that are subject to privacy and data protection laws and regulations, and have imposed greater legal obligations on companies in this regard. For example, in April 2016, European legislative bodies adopted the General Data Protection Regulation (GDPR) which became effective May 25, 2018. The GDPR applies to any company established in the European Union as well as to those outside the European Union if they collect and use personal data in connection with the offering of goods or services to individuals in the European Union or the monitoring of their behavior. The GDPR enhances data protection obligations for processors and controllers of personal data, including, for example, expanded disclosures about how personal information is to be used, limitations on retention of information, mandatory data breach notification requirements and onerous new obligations on services providers. Non-compliance with the GDPR may result in monetary penalties of up to €20 million or 4% of annual worldwide revenue, whichever is higher. In addition, some countries are considering or have passed legislation implementing data protection requirements or requiring local storage and processing of data or similar requirements that could increase the cost and complexity of delivering our services. The GDPR and other changes in laws or regulations associated with the enhanced protection of certain types of personal data, such as healthcare data or other sensitive information, could greatly increase our cost of providing our products and services or even prevent us from offering certain services in jurisdictions in which we operate.
23
We rely on a variety of legal bases to transfer certain personal information outside of the European Economic Area, including the EU-U.S. Privacy Shield Framework, or Privacy Shield, and EU Standard Contractual Clauses (SCCs). Both the Privacy Shield and SCCs are the subject of legal challenges in European courts and may face additional challenges in the future, and the absence of successor legal bases for continued data transfer could require us to create duplicative, and potentially expensive, information technology infrastructure and business operations in Europe or limit our ability to collect and use personal information collected in Europe. In addition, the EU Commission is currently negotiating a new ePrivacy Regulation that would address various matters, including provisions specifically aimed at the use of cookies to identify an individual’s online behavior, and any such ePrivacy Regulation may provide for new compliance obligations and significant penalties. Any of these changes to EU data protection law or its interpretation could disrupt and harm our business.
Further, following a referendum in June 2016 in which voters in the United Kingdom approved an exit from the European Union, the United Kingdom government has initiated a process to leave the EU, which has created uncertainty with regard to the regulation of data protection in the United Kingdom. In particular, although a Data Protection Bill designed to be consistent with the GDPR is pending in the United Kingdom’s legislative process, it is unclear whether the United Kingdom will enact data protection laws or regulations designed to be consistent with the GDPR and how data transfers to and from the United Kingdom will be regulated.
The interpretation and application of many privacy and data protection laws are, and will likely remain, uncertain, and it is possible that these laws may be interpreted and applied in a manner that is inconsistent with our existing data management practices or product features. If so, in addition to the possibility of fines, lawsuits and other claims and penalties, we could be required to fundamentally change our business activities and practices or modify our products, which could harm our business. In addition to government regulation, privacy advocacy and industry groups may propose new and different self-regulatory standards that either legally or contractually apply to us. Any inability to adequately address privacy, data protection and data security concerns or comply with applicable privacy, data protection or data security laws, regulations, policies and other obligations could result in additional cost and liability to us, damage our reputation, inhibit sales and harm our business
Our acquisition strategy to date, and going forward, often results in the winding down of the acquired platforms over a period of 12 to 24 months while the existing creators migrate to our platform. The focus often shifts away from these legacy platforms to meeting the needs of migrated creators on our platform. The existence of these legacy platforms within a shifting landscape regarding privacy, data protection and data security may result in regulatory liability or exposure to fines. A significant data incident on a legacy platform may harm our reputation and our brand and may adversely affect the migration of existing creators to our platform. We may also become exposed to potential liabilities and our attention and resources may be diverted as a result of differing privacy regulations pertaining to our applications.
Our failure, and/or the failure by the various third-party service providers and partners with which we do business, to comply with applicable privacy policies or federal, state or similar international laws and regulations or any other obligations relating to privacy, data protection or information security, or any compromise of security that results in the unauthorized release of personally identifiable information or other user data, or the perception that any such failure or compromise has occurred, could damage our reputation, result in a loss of creators or attendees, discourage potential creators and attendees from trying our platform and/or result in fines and/or proceedings by governmental agencies and/or users, any of which could have an adverse effect on our business, results of operations and financial condition. In addition, given the breadth and depth of changes in data protection obligations, ongoing compliance with evolving interpretation of the GDPR and other regulatory requirements requires time and resources and a review of the technology and systems currently in use against the requirements of GDPR and other regulations.
Our industry is highly fragmented. We compete against traditional solutions to event management and may face significant competition from both established and new companies. If we are not able to maintain or improve our competitive position, our business could suffer.
We operate in a market that is highly fragmented. We compete with a variety of competitors to secure new and retain existing creators, including traditional solutions to event management, such as offline, internal or ad hoc solutions, local or specialized market competitors, products offered by large technology companies that may enter the market, or other ticketing competitors such as Live Nation Entertainment subsidiaries Front Gate Tickets, TicketWeb and Universe. If we cannot successfully compete in the future with existing or potential competitors this will cause an adverse effect on our business, results of operations and financial condition.
24
Some of our current and potential competitors have significantly more financial, technical, marketing and other resources, are able to devote greater resources to the development, promotion, sale and support of their services, have more extensive customer bases and broader customer relationships, have longer operating histories and greater name recognition. We may also compete with potential entrants into the market that currently do not offer the same services but could potentially leverage their networks in the market in which we operate. For instance, large e-commerce companies such as eBay and Amazon have in the past, or currently, operate within the ticketing space. In addition, other large companies with large user-bases that have substantial event-related activity may be successful in adding a product in this space, such as Facebook, Google and Twitter. These competitors may be better able to undertake more extensive marketing campaigns and/or offer their solutions and services at a discount to ours. Furthermore, some of our competitors may customize their products to suit a specific event type, category or customer. We also compete with self-service products that provide creators with alternatives to ticket their events by integrating such self-service products with creators’ existing operations. If we are unable to compete with such alternatives, the demand for our solutions could decline.
If any of our competitors have existing relationships with potential creators or the venues or facilities used by those creators, those creators may be unwilling or unable to use our platform and this may limit our ability to successfully compete in certain markets where such pre-existing relationships are common. For example, some competitors purchase venues or rights to events and/or enter into exclusivity agreements with creators. If creators do not remain independent from our potential competitors, demand for our platform will diminish and our business and results of operations will be harmed.
Our business may be subject to sales tax and other indirect taxes in various jurisdictions. In addition, creators may also be subject to certain taxes.
The application of indirect taxes, such as sales and use tax, amusement tax, value-added tax, goods and services tax, business tax and gross receipt tax, to businesses like ours and to creators and attendees is a complex and evolving issue. Significant judgment is required to evaluate applicable tax obligations and as a result amounts recorded are estimates and are subject to adjustments. In many cases, the ultimate tax determination is uncertain because it is not clear how new and existing statutes might apply to our business or to creators’ businesses.
One or more states, localities, the federal government or other countries may seek to impose additional reporting, record-keeping or indirect tax collection obligations on businesses like ours that facilitate online commerce. For example, taxing authorities in the United States and other countries have identified e-commerce platforms as a means to calculate, collect and remit indirect taxes for transactions taking place over the Internet, and are considering related legislation. Certain jurisdictions have enacted laws which became effective in 2018 or will become effective later requiring marketplaces to report user activity or collect and remit taxes on certain items sold on the marketplace. Imposition of an information reporting or tax collection requirement could decrease creator or attendee activity on our platform, which would harm our business. New legislation could require us or creators to incur substantial costs in order to comply, including costs associated with tax calculation, collection and remittance and audit requirements, which could make using our platform less attractive and could adversely affect our business and results of operations.
We face sales and use tax and value-added tax audits in certain states and international jurisdictions and it is possible that we could face additional sales and use tax and value-added tax audits in the future in additional jurisdictions and that our liability for these taxes could exceed our reserves as state or international tax authorities could assert that we are obligated to collect additional amounts as taxes from creators and remit those taxes to those authorities. We could also be subject to audits and assessments with respect to states and international jurisdictions for which we have not accrued tax liabilities. A successful assertion that we should be collecting additional sales or other taxes on our services in jurisdictions where we have not historically done so and do not accrue for sales or other taxes could result in substantial tax liabilities for past sales, discourage creators from using our platform or otherwise harm our business and results of operations. Although we have reserved for potential payments of possible past tax liabilities in our financial statements as disclosed in Note 9 of the Notes to Consolidated Financial Statements, if these liabilities exceed such reserves, our financial condition will be harmed.
The reputation and brand of our platform is important to our success, and if we are not able to maintain and enhance our brand, our results of operations and financial condition may be adversely affected.
We believe that maintaining and enhancing our reputation and brand as a differentiated and category-defining ticketing company serving creators and attendees is critical to our relationship with our existing creators and to our ability to attract new creators and attendees. The successful promotion of our brand attributes will depend on a number of factors that we control and some factors outside of our control.
25
The promotion of our brand requires us to make substantial expenditures and management investment, which will increase as our market becomes more competitive and as we seek to expand our platform. To the extent that these activities yield increased revenue, this revenue may not offset the increased expenses we incur. If we do not successfully maintain and enhance our brand and successfully differentiate our platform from competitive products and services, our business may not grow, we may not be able to compete effectively and we could lose creators or fail to attract potential creators, all of which would adversely affect our business, results of operations and financial condition. Additionally, we must continue to make substantial efforts and investments to be associated with events that are positively viewed by other creators and attendees.
However, there are also factors outside of our control, which could undermine our reputation and harm our brand. Negative perception of our platform may harm our business, including as a result of complaints or negative publicity about us or creators; events being fraudulent or unsuccessful, either as a result of lack of attendance or attendee experience not meeting expectations; responsiveness to issues or complaints and timing of refunds and/or chargebacks; actual or perceived disruptions or defects in our platform; security incidents; or lack of awareness of our policies or changes to our policies that creators, attendees or others perceive as overly restrictive, unclear or inconsistent with our values.
Furthermore, creators use our platform for events that represent a variety of views, activities and interests, some of which many other creators or attendees do not agree with or find offensive, or are illegal, or are perceived as such. For example, in the past, creators have tried to use our platform for events related to illegal activity and extreme activist groups. These events may cause negative publicity and harm our reputation and brand. Some creators may not have, or are perceived not to have, legal and ethical business practices. Although we maintain procedures and policies, both automated and by human review, to prevent the usage of our platform for such purposes and to prevent such practices, our procedures and policies may not effectively reduce or eliminate the use of our platform by such creators. In addition, certain creators or attendees may not agree with our decision to restrict certain creators or events from using our platform. If our platform is associated with illegal or offensive activity or creators and attendees disagree with our decision to restrict certain creators or events from using our platform, our reputation and brand may be harmed and our ability to attract and retain creators will be adversely impacted.
If we are unable to maintain a reputable platform that provides valuable solutions and desirable events, then our ability to attract and retain creators and attendees could be impaired and our reputation, brand and business could be harmed.
Our platform might be used for illegal or improper purposes, all of which could expose us to additional liability and harm our business.
Our platform remains susceptible to potentially illegal or improper uses by creators or attendees. Illegal or improper uses of our platform may include money laundering, terrorist financing, drug trafficking, illegal online gaming, other online scams, illegal sexually-oriented services, phishing and identity theft, prohibited sales of pharmaceuticals, fraudulent sale of goods or services, posting of unauthorized intellectual property, unauthorized uses of credit and debit cards or bank accounts and similar misconduct. Creators may also encourage, promote, facilitate or instruct others to engage in illegal activities. Despite measures we have taken to detect and lessen the risk of this kind of conduct, we cannot guarantee that these measures will stop all illegal or improper uses of our platform. Our business could be harmed if creators use our system for illegal or improper purposes, which may expose us to liability. At the same time, if the measures we have taken to guard against these activities are too restrictive and inadvertently screen proper transactions, or if we are unable to apply and communicate these measures fairly and transparently, or we are perceived to have failed to do so, this could diminish the experience of creators and attendees, which could harm our business.
Factors adversely affecting the live event market could impact our results of operations.
We help creators organize, promote and sell tickets and registrations to a broad range of events. Our business is directly affected by the success of such events and our revenue is impacted by the number of events, type of events and ticket prices of events produced by creators. Adverse trends in one or more event industries could adversely affect our business. A decline in attendance at or reduction in the number of events may have an adverse effect on our revenue and operating income.
During periods of economic slowdown and recession, consumers have historically reduced their discretionary spending. The impact of economic slowdowns on our business is difficult to predict, but they may result in reductions in ticket and registration sales and our ability to generate revenue. Our business depends on discretionary consumer and corporate spending. Many factors related to discretionary consumer and corporate spending, including employment, fuel prices, interest and tax rates and inflation can adversely impact our results of operations.
26
In addition, the occurrence and threat of extraordinary events, such as terrorist attacks, mass-casualty incidents, public health concerns, natural disasters or similar events, or loss or restriction of individuals’ rights to assemble may deter creators from producing large events and substantially decrease the attendance at live events. For example, in January 2017, five people were killed at a music festival in Mexico ticketed by us. Terrorism and security incidents, military actions in foreign locations and periodic elevated terrorism alerts have increased public concerns regarding air travel, military actions and national or local catastrophic incidents. These concerns have led to numerous challenging operating factors at live events, including additional logistics for event safety and increased costs of security. These challenges may impact the creator and attendee experience, lead to fewer events by creators and as a result may harm our results of operations.
Furthermore, adverse weather and climate conditions could impact the success of an event and disrupt our operations in any of our offices or the operations of creators, third-party providers, vendors or partners. If an event is cancelled due to weather, attendees expect a refund, which harms our results of operations and those of creators.
Accordingly, any adverse condition could lead to unsatisfied attendees that require refunds or chargebacks or increase the complexity and costs for creators and us, which will have a negative effect on our business, results of operations and financial condition.
Any significant system interruption or delays could damage our reputation, result in a potential loss of creators and adversely impact our business.
Our ability to attract and retain creators depends on the reliable performance of our technology, including our websites, applications and information and related systems. System interruptions, slow-downs and a lack of integration and redundancy in our information systems and infrastructure may adversely affect our ability to operate our technology, handle sales for high-demand events, process and fulfill transactions, respond to creator and attendee inquiries and generally maintain cost-efficient operations.
We also rely on affiliate and third-party computer systems, broadband and other communications systems and service providers in connection with the provision of services generally, as well as to facilitate, process and fulfill transactions. Any interruptions, outages or delays in our systems and infrastructures, our businesses, our affiliates and/or third-party systems we use, or deterioration in the performance of these systems and infrastructures, could impair our ability to provide services, fulfill orders and/or process transactions. We have experienced, and may in the future experience, occasional system interruptions caused by outages by our partners that made some or all systems or data unavailable or prevented us from efficiently providing services or fulfilling orders.
We outsource our cloud infrastructure to Amazon Web Services (AWS), which hosts our platform, and therefore we are vulnerable to service interruptions at AWS, which could impact the ability of creators and attendees to access our platform at any time, without interruption or degradation of performance. Our customer agreement with AWS will remain in effect until terminated by AWS or us. AWS may terminate the agreement by providing 30 days prior written notice and may, in some cases, terminate the agreement immediately for cause upon notice. In the event that our AWS service agreements are terminated, or there is a lapse of service, interruption of Internet service provider connectivity or damage to such facilities, we could experience interruptions in access to our platform as well as delays and additional expense in arranging new facilities and services. For example, we previously experienced interruptions in performance of our platform because of a hardware error that AWS experienced. We may also incur significant costs for using an alternative cloud infrastructure provider or taking other actions in preparation for, or in reaction to, events that damage the AWS services we use.
In addition, fire, flood, power loss, telecommunications failure, hurricanes, tornadoes, earthquakes, acts of war or terrorism, natural disasters and similar events or disruptions may damage or interrupt computer, broadband or other communications systems and infrastructures at any time. Any of these events could cause system interruptions, outages, delays and loss of critical data, and could prevent us from providing services, fulfilling orders and/or processing transactions. While we have backup systems for certain aspects of our operations, disaster recovery planning by its nature cannot be sufficient for all eventualities. In addition, we may not have adequate insurance coverage to compensate for losses from a major interruption.
In some instances, we may not be able to identify the cause or causes of these performance problems within a period of time acceptable to creators. It may become increasingly difficult to maintain and improve our platform performance, especially during peak usage times, as the features of our platform become more complex and the usage of our platform increases. Any of the above circumstances or events may harm our reputation, cause creators to stop using our platform, impair our ability to increase revenue, impair our ability to grow our business, subject us to financial penalties and liabilities under our service level agreements and otherwise harm our business, results of operations and financial condition.
27
Our platform and solutions are accessed by a large number of creators and attendees often at the same time. As we continue to expand the number of creators and attendees and solutions available to creators and attendees, we may not be able to scale our technology to accommodate the increased capacity requirements, which may result in interruptions or delays in service. Furthermore, capacity constraints could be due to a number of potential causes including technical failures, natural disasters, fraud or security attacks. In addition, the failure of AWS cloud infrastructure or other third-party Internet service providers to meet our capacity requirements could result in interruptions or delays in access to our platform or impede our ability to scale our operations. The occurrence of any of these events could have an adverse effect on our business, results of operations and financial condition.
Creators rely on third-party platforms, such as Facebook and Spotify, to connect with and attract attendees and we depend on our platform of partners and developers to create applications that will integrate with our platform.
Our platform interoperates with other third-party distributors, such as Facebook and Spotify. Attendees are able to access our platform and purchase tickets through these third-party services. Creators are able to publicize their events and sell tickets on these third-party sites. The interoperability of our platform with these other sites allows creators to reach more attendees and makes our platform more appealing to creators. These third-party partners may terminate their relationship with us, limit certain integration functionality, change their treatment of our services or restrict access to their platform by creators at any time. For example, in the past, Facebook removed a feature of its service that allowed creators to include multiple hosts on a single event seamlessly across platforms, which negatively impacted certain music creators’ use of the Facebook integration with our platform. If any such third-party services becomes incompatible with our platform or the use of our platform and solutions on such third-party platforms are restricted in the future, our business will be harmed.
In addition, to the extent that Google, Facebook or other leading large technology companies that have a significant presence in our key markets, disintermediate ticketing or event management providers, whether by offering their own comprehensive event-focused or shopping capabilities, or by referring leads to suppliers, other favored partners or themselves directly, there could be an adverse impact on our business, results of operations and financial condition.
We also depend on our platform of integrated product partners connecting through our API to create applications that will integrate with our platform, such as Salesforce, HubSpot and MailChimp, and to allow them to integrate with our solutions. This presents certain risks to our business, including:
|
|
•
|
|
our inability to provide any assurance that these third-party applications and products meet the same quality and security standards that we apply to our own development efforts, and to the extent that they contain bugs or defects, they may create disruptions in the use of our platform by creators or negatively affect our brand;
|
|
•
|
our lack of support for software applications developed by our partner platform, which could cause creators and attendees to be left without support and consequently could cease using our services if these developers do not provide adequate support for their applications;
|
||
|
•
|
our inability to assure that our partners will be able to successfully integrate with our products or that our partners will continue to do so;
|
||
|
•
|
our inability to confirm if our partners comply with all applicable laws and regulations; and
|
||
|
•
|
the risk that these partners and developers may not possess the appropriate intellectual property rights to develop and share their applications.
|
||
Many of these risks are not within our control to prevent, and our brand may be damaged if these applications do not perform to the satisfaction of creators and attendees and that dissatisfaction is attributed to us.
Changes in Internet search engine algorithms and dynamics, or search engine disintermediation, or changes in marketplace rules could have a negative impact on traffic for our sites and ultimately, our business and results of operations.
We rely heavily on Internet search engines, such as Google, to generate traffic to our website, principally through free or organic search. Search engines frequently update and change the logic that determines the placement and display of results of a user’s search, such that the purchased or algorithmic placement of links to our websites can be negatively affected. In addition, a search engine could, for competitive or other purposes, alter its search algorithms or results causing our websites to place lower in organic search query results. If a major search engine changes its algorithms in a manner that negatively affects the search engine ranking of our websites or those of our partners, our business and financial performance would be adversely affected. Furthermore, our failure to successfully manage our search engine optimization could result in a substantial decrease in traffic to our websites, as well as increased costs if we were to replace free traffic with paid traffic.
28
We also rely on application marketplaces, such as Apple’s App Store and Google’s Play, to drive downloads of our applications. In the future, Apple, Google or other marketplace operators may make changes to their marketplaces that make access to our products more difficult. For example, our applications may receive unfavorable treatment compared to the promotion and placement of competing applications, such as the order in which they appear within marketplaces. Similarly, if problems arise in our relationships with providers of application marketplaces, traffic to our site and our user growth could be harmed.
Our business may be subject to chargebacks and other losses for various reasons, including due to fraud, unsuccessful or cancelled events. These chargebacks and other losses may harm our results of operations and business.
We have experienced, and may in the future experience, claims from attendees that creators have not performed their obligations or that events did not match their descriptions. These claims could arise from creator fraud or misuse, an unintentional failure of the event or from fraudulent claims by an attendee. We have experienced fraudulent activity on our platform in the past, including fake events in which a person sells tickets to an event but does not intend to hold an event or fulfill the ticket, email spam being sent through our platform, a third party taking over the account of a creator to receive payments owed to such creator or orders placed with fraudulent or stolen credit card data and other erroneous transmissions. Although we have measures in place to detect and reduce the occurrence of fraudulent activity on our platform, those measures may not always be effective. These measures must be continually improved and may not be effective against evolving methods of fraud or in connection with new platform offerings. If we cannot adequately control the risk of fraudulent activity on our platform, it could harm our business, results of operations and financial condition.
We also may experience chargebacks and losses as a result of advance payment of ticket fees to creators. Under our standard terms for creators using EPP, Eventbrite passes the creator’s share of ticket sales to the creator within five business days after the successful completion of the creator’s event. However, we face growing pressure from creators to advance some or most of their event funds prior to completion of their events because creators need these funds to pay for event related costs such as the venue, marketing, talent and vendors. For qualified creators who apply for such advance payments, we pass proceeds from ticket sales to the creators prior to the event as we receive the ticket proceeds, subject to certain limitations. We refer to these payments as advance payouts. In 2018, approximately 15.3% of creators received advance payouts. When we advance funds, we assume some risk that the event may be cancelled, fraudulent, materially not as described or removed from our platform due to its failure to comply with our terms of service or merchant agreement or the event has significant chargebacks, refund requests and/or disputes. The terms of our standard merchant agreement obligates creators to repay us for ticket sales advanced under such circumstances. However, we may not be able to recover our losses from these events and such unrecoverable amounts could equal up to the value of the transaction or transactions passed to the creator prior to the event that is disputed. This amount could be many multiples of the fees we collect from such transaction. In the case of failure of an entire event or series of events, the volume of transactions charged back or disputed could have an adverse impact on our financial position. We have established processes and risk mitigation measures around these advance payouts. However, these advance payments pose a challenging financial risk, and our standard fraud and risk controls may be ineffective in addressing this risk. Furthermore, we must also strike a balance between these protective measures and the needs of creators for access to ticket sales through a convenient and easy process, which many of our competitors provide. If these measures do not succeed, or if we fail to strike the right balance between protective measures and creator needs, our business and results of operations may be harmed.
The total write-off from all lost advance payouts and other chargebacks was $6.1 million and $3.6 million for the years ended December 31, 2018 and 2017, respectively. Our failure to manage the risk of advance payouts to creators and to mitigate chargebacks and disputes due to fraud of a creator or otherwise or to recover the resulting losses from creators could have an adverse effect on our business, results of operations and financial condition.
29
We rely on the experience and expertise of our founders, senior management team, key technical employees and other highly skilled personnel and the failure to retain, motivate or integrate any of these individual could have an adverse effect on our business, results of operations and financial condition.
Our success depends upon the continued service of our founders and senior management team and key technical employees, as well as our ability to continue to attract and retain additional highly qualified personnel. Our future success depends on our continuing ability to identify, hire, develop, motivate, retain and integrate highly skilled personnel for all areas of our organization. Each of our founders, executive officers, key technical personnel and other employees could terminate his or her relationship with us at any time. The loss of any of our founders or any other member of our senior management team or key personnel might significantly delay or prevent the achievement of our business objectives and could harm our business and our relationships. Competition in our industry for qualified employees is intense. In addition, our compensation arrangements, such as our equity award programs, may not always be successful in attracting new employees and retaining and motivating our existing employees. Furthermore, several members of our management team were hired recently. If we are not able to integrate these new team members or if they do not perform adequately, our business may be harmed.
We face significant competition for personnel, particularly in the San Francisco Bay Area where our headquarters is located. To attract top talent, we have had to offer, and believe we will need to continue to offer, competitive compensation and benefits packages. We may also need to increase our employee compensation levels in response to competition. We may not be able to hire new employees quickly enough to meet our needs. If we fail to effectively manage our hiring needs or successfully integrate new hires, including our recently hired management team members, our efficiency, ability to meet forecasts and our employee morale, productivity and retention could suffer, which may harm our business.
Our corporate culture has contributed to our success, and if we cannot maintain this culture as we grow, we could lose the innovation, creativity and teamwork fostered by our culture, which could harm our business.
We believe that our corporate culture has been an important contributor to our success, which we believe fosters innovation, teamwork and passion for creators. Most of our employees have been with us for fewer than two years as a result of our rapid growth. As we continue to grow, we must effectively integrate, develop and motivate a growing number of new employees. As a result, we may find it difficult to maintain our corporate culture, which could limit our ability to innovate and operate effectively. Any failure to preserve our culture could also negatively affect our ability to retain and recruit personnel, maintain our performance or execute on our business strategy.
If we fail to manage our growth effectively, our business, financial condition and results of operations could be harmed.
We have experienced, and may continue to experience, rapid growth and organizational change, such as additional controls and procedures and new functional groups within our company, through organic growth or as the result of integrating acquired companies. For example, the number of Eventbrite employees has increased from 855 on December 31, 2017 to 1,094 on December 31, 2018 and we expect to add more employees in the future. This growth and these changes have placed, and may continue to place, significant demands on our management, operational and financial resources. Our organizational structure is becoming more complex as we build the proper level of operational, financial and management controls and develop our reporting systems and procedures. We will require significant expenditures and the allocation of valuable management resources to grow and change in these areas and integrate acquired companies. If we fail to manage our anticipated growth and changes and integrate acquired companies in a manner that preserves rapid innovation, attention to creator satisfaction and overall culture, the quality of our platform and our reputation may suffer, which could negatively affect our ability to retain and attract creators and impact our business, results of operations and financial condition.
Our rapid growth makes it difficult to evaluate our future prospects and may increase the risk that we will not continue to grow at or near historical rates.
We have grown rapidly over the last several years, and as a result, our ability to forecast our future results of operations is subject to a number of uncertainties, including our ability to effectively plan for and model future growth. We have encountered in the past, and will encounter in the future, risks and uncertainties frequently experienced by growing companies in rapidly changing industries. If our assumptions regarding these risks and uncertainties, which we use to plan and operate our business, are incorrect or change, or if we do not address these risks successfully, our results of operations could differ materially from our expectations, our growth rates may slow and our business would suffer.
30
Our pricing package options were recently launched and may affect our ability to attract or retain creators.
In the past, we have adjusted our prices either for individual creators in connection with long-term agreements or for new markets. In September 2017, we launched new pricing package options for creators based on the features required, service level desired and budget and we periodically adjusted the price of our packages. While we determined these prices and packages based on prior experience and feedback from creators, our assessments may not be accurate and we could be underpricing or overpricing our services, which may require us to continue to adjust our pricing packages. Furthermore, creators’ price sensitivity may vary by location, and as we expand into different countries, our pricing packages may not enable us to compete effectively in these countries. In addition, if our platform or services change, then we may need to, or choose to, revise our pricing. Such changes to our pricing model or our ability to efficiently price our packages and solution could harm our business, results of operations and financial condition and impact our ability to predict our future performance.
If we cannot attract and retain attendees, our business will be harmed.
In order to continue to support creators, we need to continue to provide a compelling platform for creators to attract and retain attendees. Several factors may impact an attendee’s experience with our platform, including:
|
|
•
|
|
our ability to provide an easy solution for attendees to buy tickets or register for an event;
|
|
•
|
outages or delays in our platform and other services, including delays in getting into events;
|
||
|
•
|
compatibility with other third-party services, such as Facebook and Spotify, and our ability to connect with other applications through our API;
|
||
|
•
|
fraudulent or unsuccessful events that may result in a bad experience for attendees;
|
||
|
•
|
breaches and other security incidents that could compromise the data of attendees; and
|
||
|
•
|
quality of our customer service and our ability to respond to complaints and other issues in a timely and effective manner.
|
||
If attendees become dissatisfied with their experiences on our platform or at an event, they make request refunds, provide negative reviews of our platform or decide not to attend future events on our platform, all of which would harm our business and reputation.
A significant number of our employees are located in Argentina and any favorable or unfavorable developments in Argentina could have an impact on our results of operations.
A significant number of our employees, including engineering and sales and marketing employees, are located in Argentina, and therefore, a portion of our operating expenses are denominated in Argentine pesos. As of December 31, 2018, we had a total of 158 employees located in Argentina, of which 93 are engineers. If the peso strengthens against the U.S. dollar, it could have a negative impact on our results of operations as it would increase our operating expenses. Our business activities in Argentina also subject us to risks associated with changes in and interpretations of Argentine law, including laws related to employment, the protection and ownership of intellectual property and U.S. ownership of Argentine operations. Furthermore, if we had to scale down or close our Argentine operations, there would be significant time and cost required to relocate those operations elsewhere, which could have an adverse impact on our overall cost structure.
The Argentine government has historically exercised significant influence over the country’s economy. Additionally, the country’s legal and regulatory frameworks have at times suffered radical changes, due to significant political influence and uncertainties. In the past, government policies in Argentina included expropriation, nationalization, forced renegotiation or modification of existing contracts, suspension of the enforcement of creditors’ rights, new taxation policies, including royalty and tax increases and retroactive tax claims, and changes in laws and policies affecting foreign trade and investment. Such policies could destabilize the country and adversely affect our business and operating expenses.
In addition, Argentina has experienced labor unrest over wages and benefits paid to workers. In the past, the Argentine government has passed laws, regulations, and decrees requiring companies in the private sector to maintain minimum wage levels and provide specified benefits to employees and may do so again in the future. Employers have also experienced significant pressure from their employees and labor organizations to increase wages and to provide additional employee benefits. Any disruptions, labor unrest, or increased personnel-related expenses in Argentina could have an adverse effect on our business and operating expenses.
31
Our metrics and estimates are subject to inherent challenges in measurement, and real or perceived inaccuracies in those metrics may seriously harm and negatively affect our reputation and our business.
We regularly review metrics to evaluate growth trends, measure our performance, and make strategic decisions. These metrics are calculated using internal company data and have not been validated by an independent third party. Errors or inaccuracies in our metrics or data could result in incorrect business decisions and inefficiencies. Furthermore, if we discover material inaccuracies in our metrics, we may not be able to accurately assess the health of our business and our reputation and our business may be harmed.
Creator and attendee growth and retention depend upon effective interoperation with operating systems, networks, devices, web browsers and standards that we do not control.
We make our platform available across a variety of operating systems and web browsers. We are dependent on the interoperability of our platform with popular devices, mobile operating systems and web browsers that we do not control, such as Android, iOS, Chrome and Firefox. Any changes, bugs or technical issues in such systems, devices or web browsers that degrade the functionality of our platform, make it difficult for creators or attendees to access or use our platform, impose fees related to our platform or give preferential treatment to competitive products or services could adversely affect usage of our platform. In the event that it is difficult for creators or attendees to access and use our platform, our business and results of operations could be harmed.
Our failure to successfully address the evolving market for transactions on mobile devices and to build mobile products could harm our business.
A significant and growing portion of creators and attendees access our platform through mobile devices. The number of people who access the Internet and purchase goods and services through mobile devices, including smartphones and handheld tablets or computers, has increased significantly in the past few years and is expected to continue to increase. If we are not able to provide creators and attendees with the experience and solutions they want on mobile devices, our business may be harmed.
While we have created mobile applications and versions of much of our web content, if these mobile applications and versions are not well received by creators and attendees, our business may suffer. In addition, we face different fraud risks and regulatory risks from transactions sent from mobile devices than we do from personal computers. If we are unable to effectively anticipate and manage these risks, our business and results of operations may be harmed.
Our software is highly complex and may contain undetected errors.
The software underlying our platform is highly complex and may contain undetected errors or vulnerabilities, some of which may only be discovered after the code has been used in a production environment to deliver products and services. Any real or perceived errors, failures, bugs or other vulnerabilities discovered in our code could result in negative publicity and damage to our reputation, loss of creators and attendees, loss of or delay in market acceptance of our platform, loss of competitive position, loss of revenue or liability for damages, overpayments and/or underpayments, any of which could harm the confidence of creators and attendees on our platform, our business, results of operations and financial condition. In such an event, we may be required or may choose to expend additional resources in order to help correct the problem. Since creators use our platform for processes that are critical to their businesses, errors, failures or bugs in our code could result in creators seeking significant compensation from us for any losses they suffer and/or ceasing conducting business with us altogether. There can be no assurance that provisions typically included in our agreements with creators that attempt to limit our exposure to claims would be enforceable or adequate or would otherwise protect us from liabilities or damages with respect to any particular claim. Even if unsuccessful, a claim brought against us by any creators would likely be time-consuming and costly to defend and could seriously damage our reputation and brand.
32
We rely on software and services licensed from other parties. Defects in or the loss of software or services from third parties could increase our costs and adversely affect the quality of our service.
Components of our platform include various types of software and services licensed from unaffiliated third parties. Our business would be disrupted if any of the software or services we license from others or functional equivalents thereof were either no longer available to us or no longer offered on commercially reasonable terms. In either case, we would be required to either redesign our platform to function with software or services available from other parties or develop these components ourselves, which would result in increased costs and could result in delays in the release of new solutions and services on our platform. Furthermore, we might be forced to limit the features available in our platform due to changes by our third-party software and service providers. In addition, if we fail to maintain or renegotiate any of these software or service licenses, we could face significant delays and diversion of resources in attempting to license and integrate functional equivalents.
If we fail to adequately protect our intellectual property rights, our competitive position could be impaired and we may lose valuable assets, generate reduced revenue and incur costly litigation to protect our rights.
Our success is dependent, in part, upon protecting our intellectual property rights. We rely on a combination of patents, copyrights, trademarks, service marks, trade secret laws and contractual restrictions to establish and protect our intellectual property rights in our platform. However, the steps we take to protect our intellectual property may be inadequate. We will not be able to protect our intellectual property if we are unable to enforce our rights or if we do not detect unauthorized use of our intellectual property. While we take precautions, it may still be possible for unauthorized third parties to copy our technology and use our proprietary information to create solutions and services that compete with ours. Some license provisions protecting against unauthorized use, copying, transfer and disclosure of our technology may be unenforceable under the laws of certain jurisdictions and foreign countries. Further, the laws of some countries do not protect proprietary rights to the same extent as the laws of the United States. To the extent we expand our international activities, our exposure to unauthorized copying and use of our technology and proprietary information may increase.
We enter into confidentiality and invention assignment agreements with our employees and consultants and enter into confidentiality agreements with the parties with whom we have strategic relationships and business alliances. No assurance can be given that these agreements will be effective in controlling access to, and use and distribution of, our platform and proprietary information. Further, these agreements do not prevent our competitors from independently developing technologies that are substantially equivalent or superior to our platform or solutions.
In order to protect our intellectual property rights, we may be required to spend significant resources to monitor and protect these rights. Litigation may be necessary in the future to enforce our intellectual property rights and to protect our trade secrets. Litigation to protect and enforce our intellectual property rights could be costly, time consuming and distracting to management and could result in the impairment or loss of portions of our intellectual property. Our efforts to enforce our intellectual property rights may be met with defenses, counterclaims and countersuits attacking the validity and enforceability of our intellectual property rights. Our inability to protect our proprietary technology against unauthorized copying or use, as well as any costly litigation or diversion of our management’s attention and resources, could delay further sales or the implementation of our platform or solutions, impair the functionality of our platform or solutions, delay introductions of enhancements to our platform, result in our substituting inferior or more costly technologies into our platform or solutions, or injure our reputation. In addition, we may be required to license additional technology from third parties to develop and market new features in our platform or solutions, and we cannot assure you that we could license that technology on commercially reasonable terms or at all. Our inability to license such technology on commercially reasonable terms could adversely affect our ability to compete.
33
We use open source software in our platform, which could subject us to litigation or other actions.
We use open source software in our platform and may use more open source software in the future. The terms of many open source licenses to which we are subject have not been interpreted by U.S. or foreign courts, and there is a risk that open source software licenses could be construed in a manner that imposes unanticipated conditions or restrictions on our ability to provide or distribute our platform. From time to time, there have been claims challenging the ownership of open source software against companies that incorporate open source software into their solutions. As a result, we could be subject to lawsuits by parties claiming ownership of what we believe to be open source software. Litigation could be costly for us to defend, have an adverse effect on our business, results of operations or financial condition or require us to devote additional research and development resources to change our platform. In addition, if we were to combine our proprietary software with open source software in a certain manner, we could, under certain of the open source licenses, be required to release the source code of our proprietary software. If we inappropriately use open source software, we may be required to re-engineer our platform, discontinue the sale of our platform or take other remedial actions. In addition to risks related to license requirements, use of certain open source software can lead to greater risks than use of third-party commercial software, as open source licensors generally do not provide warranties or controls on the origin of software.
Our business is subject to various import and export regulations. Our failure to comply with those laws and regulations could harm our business.
Economic and trade sanctions programs that are administered by the U.S. Treasury Department’s Office of Foreign Assets Control (OFAC) prohibit or restrict transactions to or from, and dealings with specified countries, their governments, and in certain circumstances, with individuals and entities that are specially designated nationals of those countries, and other sanctioned persons, including narcotics traffickers and terrorists or terrorist organizations. As federal, state and foreign legislative regulatory scrutiny and enforcement actions in these areas increase, we expect our costs to comply with these requirements will increase, perhaps substantially. Failure to comply with any of these requirements could result in the limitation, suspension or termination of our platform, imposition of significant civil and criminal penalties, including fines, and/or the seizure and/or forfeiture of our assets. While we have policies and procedures for compliance with these economic sanctions regulations, given the technical limitations in developing measures that will prevent access to Internet-based services from particular geographies or by particular individuals, and additional factors, such as the ability of users to place on our platform false or deliberately misleading information, we believe that we may have provided services in connection with events that were located in a country subject to an embargo by the United States that may not have been in compliance with the economic sanctions regulations administered by OFAC. We have previously identified and expect we will continue to identify customer accounts for our platform and services that may originate from or are intended to benefit, persons in countries that are subject to U.S. embargoes including events in or relating to Cuba, Iran, North Korea, Syria and the Crimea region of Ukraine.
On June 11, 2018, we submitted to OFAC an initial voluntary self-disclosure, and on July 17, 2018, a final report regarding the discovery of potentially unauthorized uses of our services by persons and in countries subject to U.S. economic sanctions. We will continue to work to remediate gaps in our compliance policies and procedures, potentially in ways that may be time-consuming or result in the delay or loss of sales opportunities or impose other costs. Additionally, we cannot guarantee these measures will be fully effective in deterring unlawful activity on our platform. OFAC may conduct its own investigation of these events to determine whether to assess fines and penalties. We cannot predict when OFAC will complete its review and determine whether any violations occurred or levy penalties, including potential penalties against us for facilitating unlawful activity. Each instance in which we provide services through our platform may constitute a separate violation of these laws.
Further, our products incorporate encryption technology. These encryption products may be exported from the United States only with the required export authorizations, including by a license, a license exception or other appropriate government authorizations. Such products may also be subject to certain regulatory reporting requirements. Various countries also regulate the import of certain encryption technology, including through import permitting and licensing requirements, and have enacted laws that could limit our customers’ ability to import our services into those countries. Governmental regulation of encryption technology and of exports and imports of encryption products, or our failure to obtain required approval for our products and services, when applicable, could harm our international sales and adversely affect our revenue. Compliance with applicable regulatory requirements regarding the provision of our products and services, including with respect to new products and services, may delay the introduction of our products and services in various markets or, in some cases, prevent the provision of our products and services to some countries altogether.
34
Our business is subject to a wide range of laws and regulations. Our failure to comply with those laws and regulations could harm our business.
We are subject to a number of U.S. federal and state and foreign laws and regulations that involve matters central to our business. For example, our platform is subject to an increasingly strict set of legal and regulatory requirements intended to help detect and prevent money laundering, terrorist financing, fraud and other illicit activity. The interpretation of those requirements by judges, regulatory bodies and enforcement agencies is changing, often quickly and with little notice. Changes in laws and regulations could impose more stringent requirements on us to detect and prevent illegal and improper activity by creators, which can increase our operating costs and reduce our margins. For example, to date, platforms like ours are immune from liability resulting from the improper or illegal actions facilitated by the platform, but initiated by its users, under Section 230 of the Communications Decency Act (CDA). If the CDA is amended in a manner that reduces protections for our platform, we will need to increase our content moderation operations, which may harm our results of operations.
In addition, the ticketing business is subject to many laws and regulations, both foreign and domestic. These laws and regulations vary from jurisdiction to jurisdiction and may sometimes conflict. Outside of ticketing regulations, creators are often subject to regulations of their own, such as permitting and crowd control requirements. Regulatory agencies or courts may claim or hold that we are responsible for ensuring that creators comply with these laws and regulations, which could greatly increase our compliance costs, expose us to litigation, subject us to fines and penalties and otherwise harm our business.
Failure to comply with economic sanctions and anti-bribery, anti-corruption and similar laws associated with our activities outside of the United States could subject us to penalties and other adverse consequences.
We are subject to the United States Foreign Corrupt Practices Act of 1977, as amended (FCPA), the U.S. domestic bribery statute contained in 18 U.S.C. § 201, the U.S. Travel Act, the United Kingdom Bribery Act 2010 (Bribery Act), and other anti-corruption and anti-bribery laws in various jurisdictions, both domestic and abroad, where we conduct activities or have users. Our sales team sells use of our platform abroad, and we face significant risks if we fail to comply with the FCPA and other anti-corruption laws that prohibit companies and their agents and third-party business parties and intermediaries from authorizing, offering, or providing, directly or indirectly, improper payments or benefits to foreign government officials, political parties and private-sector recipients for the purpose of obtaining or retaining business, directing business to any person, or securing any advantage. In many foreign countries, particularly in countries with developing economies, it may be a local custom that businesses engage in practices that are prohibited by the FCPA or other applicable laws and regulations. We may have direct or indirect interactions with officials and employees of government agencies or state-owned or affiliated entities and we may be held liable for the corrupt or other illegal activities of these third-party intermediaries, our employees, representatives, contractors, partners, service providers and agents, even if we do not authorize such activities. While we have policies and procedures to address compliance with such laws, we cannot ensure that all of our employees, users and agents, as well as those contractors to which we outsource certain of our business operations, will not take actions in violation of our policies or agreements and applicable law, for which we may be ultimately held responsible.
Further, as noted above, we believe it may have been used for events located in countries subject to an embargo by the United States in potential violation of the economic sanctions regulations and has filed an initial voluntary self-disclosure with OFAC. We are conducting an internal review and will then submit a final voluntary self-disclosure to OFAC. Any violation of the FCPA or other applicable anti-bribery, anti-corruption laws, and economic sanctions laws could result in various actions, including whistleblower complaints, adverse media coverage, investigations and actions by federal or state attorneys general or foreign regulators, loss of export privileges, severe criminal or civil fines and penalties or other sanctions, forfeiture of significant assets, or suspension or debarment from U.S. government contracts, all of which may have an adverse effect on our reputation, business, results of operations and prospects. Responding to any enforcement action may result in a significant diversion of management’s attention and resources and significant defense costs and other professional fees. Civil penalties for violations of the economic sanctions regulations may include monetary penalties of up to approximately $295,000 or twice the value of the transaction, whichever is greater, per violation as well as criminal penalties for knowing and willful violations. A filing of a voluntary self-disclosure mitigates any potential civil penalties. At this time, we cannot determine if OFAC would impose any penalties against us or individuals for the potential violations and if any such penalties would be material to us.
35
Failure to comply with applicable anti-money laundering laws and regulations could harm our business and result of operations.
Due to the risk of our platform being used for illegal or illicit activity, any perceived or actual breach of compliance by us with respect to anti-money laundering (AML) laws, rules, and regulations, including the Bank Secrecy Act, USA Patriot Act and Title 18 U.S.C. Sections 1956-57 and 1960, could have a significant impact on our reputation and could cause us to lose existing creators and attendees, prevent us from obtaining new creators, require us to expend significant funds to remedy civil and criminal problems caused by violations and to avert further violations and expose us to legal risk and potential liability that could have a material effect on our business. Several of these laws require certain companies to adopt an AML compliance program, including those companies that are characterized as a money services business or money transmitter. Moreover, many states have their own AML legal regulatory regimes and interpretations and applications of those legal principles are complex and varied. If the federal government or any state government took the position that we were a money services business or money transmitter, they could require us to register as such and obtain a money transmitter license.
While we maintain that we are not a money services business or money transmitter, we have voluntarily elected to adopt an AML compliance program to mitigate the risk of our platform being used for illegal or illicit activity and to help detect and prevent fraud. Our AML compliance program is designed to foster trust in our platform and services connecting event creators and event attendees and also may mitigate our legal exposure should any federal or state regulator challenge our determination that we are not a money services business or money transmitter. Should a federal or state regulator make a determination that we have operated as an unlicensed money services business or money transmitter, we could be subject to civil and criminal fines, penalties, costs, legal fees, reputational damage or other negative consequences, all of which may have an adverse effect on our business, finances, and operations.
Failure to comply with laws and regulations related to payments could harm our business and results of operations.
The laws and regulations related to payments are complex and vary across different jurisdictions in the United States and globally. Furthermore, changes in laws, rules and regulations have occurred and may occur in the future, which may impact our business practices. As a result, we are required to spend significant time and effort to comply with those laws and regulations and to ensure that creators and attendees are complying with those laws and regulations. Any failure or claim of our failure to comply or any failure by our third-party service providers and partners to comply with such laws and regulations or other requirements, including the Payment Card Industry Data Security Standard (PCI-DSS), could divert substantial resources, result in liabilities or force us to stop offering EPP, which will harm our business and results of operations.
For example, if we are deemed to be a money transmitter as defined by applicable regulation, we could be subject to certain laws, rules and regulations enforced by multiple authorities and governing bodies in the United States and numerous state and local agencies who may define money transmitter differently. For example, certain states may have a more expansive view of money transmitter. Additionally, outside of the United States, we could be subject to additional laws, rules and regulations related to the provision of payments and financial services, and as we expand into new jurisdictions, the foreign regulations and regulators governing our business that we are subject to will expand as well. If we are found to be a money transmitter under any applicable regulation and we are not in compliance with such regulations, we may be subject to fines or other penalties in one or more jurisdictions levied by federal or state or local regulators, including state Attorneys General, as well as those levied by foreign regulators. In addition to fines, penalties for failing to comply with applicable rules and regulations could include criminal and civil proceedings, forfeiture of significant assets, or other enforcement actions. We could also be required to make changes to our business practices or compliance programs as a result of regulatory scrutiny.
Additionally, if we experience substantial losses related to payment card transactions or in the event of noncompliance with the PCI-DSS, we may choose to, or be required to, cease accepting certain payment cards for payment. If we were unable to accept payment cards through EPP, creators would be required to use third-party payment options, which would reduce the simplicity and ease-of-use of our platform.
Our reported results of operations may be adversely affected by changes in accounting principles generally accepted in the United States.
Generally accepted accounting principles in the United States are subject to interpretation by the Financial Accounting Standards Board (FASB), the SEC, and various bodies formed to promulgate and interpret appropriate accounting principles. A change in these principles or interpretations could have a significant effect on our reported results of operations, and may even affect the reporting of transactions completed before the announcement or effectiveness of a change.
36
We face potential liability, expenses for legal claims and harm to our business based on the nature of the events business.
We face potential liability and expenses for legal claims relating to the events business, including potential claims related to event injuries allegedly caused by us, creators, service providers, partners or unrelated third parties. For example, third parties could assert legal claims against us in connection with personal injuries related to occurrences at an event, including deaths. Even if our personnel are not involved in these occurrences, we may face legal claims and still incur substantial expenses to resolve such claims. Further, Eventbrite may provide guidance or onsite personnel for event safety. In such instances, if an injury occurs at an event, we may face legal claims or additional liability for providing such services.
Unfavorable outcomes in legal proceedings may harm our business and results of operations.
Our results of operations may be affected by the outcome of pending and future litigation, claims, investigations, legal and administrative cases and proceedings, whether civil or criminal, or lawsuits by governmental agencies or private parties. If the results of these legal proceedings are unfavorable to us or if we are unable to successfully defend against third-party lawsuits, we may be required to pay monetary damages or may be subject to fines, penalties, injunctions or other censure that could have an adverse effect on our business, results of operations and financial condition. Even if we adequately address the issues raised by an investigation or proceeding or successfully defend a third-party lawsuit or counterclaim, we may have to devote significant financial and management resources to address these issues, which could harm our business, results of operations and financial condition.
Our results of operations may be adversely affected if we are subject to a protracted infringement claim or a claim that results in a significant damage award.
There is considerable patent and other intellectual property development activity in our industry. Our success depends on our not infringing upon the intellectual property rights of others. Our competitors, as well as a number of other entities, including non-practicing entities and individuals, may own or claim to own intellectual property rights relating to our industry and may challenge the validity or scope of our intellectual property rights. From time to time, third parties, including our competitors and non-practicing entities, have claimed and may in the future claim that our products or technologies may infringe their intellectual property rights and may assert patent, copyright, trade secret and other claims based on intellectual property rights against us and our customers, suppliers and channel partners. For example, in February 2013, a non-practicing entity named Eventbrite as a defendant in a multi-defendant patent infringement claim. A claim may also be made relating to technology or intellectual property rights that we acquire or license from third parties. If we were subject to a claim of infringement, regardless of the merit of the claim or our defenses, the claim could:
|
|
•
|
|
require costly litigation to resolve and the payment of substantial damages;
|
|
•
|
require significant management time;
|
||
|
•
|
cause us to enter into unfavorable royalty or license agreements;
|
||
|
•
|
require us to discontinue the sale of products and solutions through our platform;
|
||
|
•
|
require us to indemnify creators or third-party service providers or partners; and/or
|
||
|
•
|
require us to expend additional development resources to redesign our platform.
|
||
If currency exchange rates fluctuate substantially in the future, our results of operations, which are reported in U.S. dollars, could be adversely affected.
Our international operations expose us to the effects of fluctuations in currency exchange rates. We incur expenses for employee compensation and other operating expenses at our international locations in the local currency, and accept payment in currencies other than the U.S. dollar. Since we conduct business in currencies other than U.S. dollars but report our results of operations in U.S. dollars, we face exposure to fluctuations in currency exchange rates, which could have a negative impact on our results of operations.
Our international operations subject us to potential adverse tax consequences and additional taxes.
We generally conduct our international operations through wholly owned subsidiaries and report our taxable income in various jurisdictions worldwide based upon our business operations in those jurisdictions. Because of these international operations, we may be subject to adverse tax changes or interpretation, increased taxes due to increased international expansion, and tax charges due to complex intercompany agreements.
37
We may be subject to income taxation in several jurisdictions around the world with increasingly complex tax laws, the application of which can be uncertain. The amount of taxes we pay in these jurisdictions could increase substantially as a result of changes in the applicable tax principles, including increased tax rates, new tax laws or revised interpretations of existing tax laws and precedents, which could have an adverse effect on our liquidity and results of operations. In addition, the authorities in these jurisdictions could review our tax returns and impose additional tax, interest and penalties, and the authorities could claim that various withholding requirements apply to us or assert that benefits of tax treaties are not available to us, any of which could have a negative impact on us or our results of operations. As we earn an increasing portion of our revenue, and accumulate a greater portion of our cash flow, in foreign jurisdictions, we could face a higher effective tax rate and incremental cash tax payments.
Additionally, our intercompany relationships are subject to complex transfer pricing regulations administered by taxing authorities in various jurisdictions. The relevant taxing authorities may disagree with our determinations as to the income and expenses attributable to specific jurisdictions. If such a disagreement were to occur, and our position was not sustained, we could be required to pay additional taxes, interest and penalties, which could result in one-time tax charges, higher effective tax rates and reduced cash flows and may harm our results of operations and financial condition. We believe that our financial statements reflect adequate reserves to cover such a contingency, but there can be no assurances in that regard.
Our ability to use our net operating losses to offset future taxable income may be subject to certain limitations.
As of December 31, 2018, we had net operating loss carryforwards (NOLs) for federal and California income tax purposes of approximately $140.6 million and $49.6 million, respectively, which may be available to offset tax income in the future. In general, under Section 382 of the Internal Revenue Code of 1986, as amended (Code), a corporation that undergoes an “ownership change” is subject to limitations on its ability to utilize its pre-change NOLs to offset future taxable income. We have undergone ownership changes in the past, which have resulted in minor limitations on our ability to utilize our NOLs, and future changes in our stock ownership, some of which are outside of our control, could result in an ownership change under Section 382 of the Code. The existing NOLs of some of our subsidiaries may be subject to limitations arising from ownership changes prior to, or in connection with, their acquisition by us. Furthermore, our ability to utilize NOLs of companies that we may acquire in the future may be subject to limitations. There is also a risk that due to regulatory changes, such as suspensions on the use of NOLs or other unforeseen reasons, our existing NOLs could expire or otherwise be unavailable to offset future income tax liabilities, including for state tax purposes. For these reasons, we may not be able to utilize some portion of our NOLs, none of which are currently reflected on our balance sheet, even if we attain profitability.
The Tax Cuts and Jobs Act (Tax Act) was enacted on December 22, 2017 and significantly reforms the Code. The Tax Act, among other things, includes changes to U.S. federal tax rates and the rules governing net operating loss carryforwards. For NOLs arising in tax years beginning after December 31, 2017, the Tax Act limits a taxpayer’s ability to utilize NOL carryforwards to 80% of taxable income (as calculated before taking the NOL carryforwards into account). In addition, NOLs arising in tax years ending after December 31, 2017 can be carried forward indefinitely, but carryback is generally prohibited. NOLs generated in tax years beginning before January 1, 2018 will not be subject to the taxable income limitation, and NOLs generated in tax years ending before January 1, 2018 will continue to have a two-year carryback and twenty-year carryforward period. As we maintain a full valuation allowance against our U.S. NOLs, these changes will not impact our balance sheet as of December 31, 2018. However, in future years, at the time a deferred tax asset is recognized related to our NOLs, the changes in the carryforward/carryback periods as well as the new limitation on use of NOLs may significantly impact our valuation allowance assessments for NOLs generated after December 31, 2017.
38
We have incurred indebtedness, which could adversely affect our ability to adjust our business to respond to competitive pressures and to obtain sufficient funds to satisfy our future research and development needs, to protect and enforce our intellectual property and to meet other needs.
In September 2018, we entered into a credit agreement (Credit Agreement) with the lenders party thereto and JPMorgan Chase Bank, N.A., as the administrative agent (in such capacity, Administrative Agent). The Credit Agreement provides for (i) the New Term Loans in the aggregate principal amount of $75.0 million and (ii) the New Revolving Credit Facility in aggregate principal amount of $75.0 million. The New Revolving Credit Facility includes a $10.0 million subfacility for the issuance of letters of credit. The full amount of the New Term Loans was drawn on September 27, 2018 (Closing Date). As of December 31, 2018, we had $73.6 million of principal indebtedness outstanding under the Credit Agreement. The New Term Loans and the New Revolving Credit Facility will each mature on the fifth anniversary of the Closing Date. The Credit Facilities are guaranteed by the our existing and future direct and indirect wholly owned material domestic subsidiaries (Guarantors). Obligations under the New Credit Facilities are secured by first priority security interests in substantially all of the our and each of the Guarantor’s current and future assets, including a pledge of the capital stock of subsidiaries held by us or the Guarantors (which pledge, in the case of any foreign subsidiary, is limited to 65% of the voting capital stock and 100% of the non-voting stock of such foreign subsidiary).
The Credit Agreement contains, and any additional debt financing we may incur would likely contain, covenants requiring us to maintain or adhere to certain covenants that restrict our operations, which include limitations on our ability to, among other things: incur additional indebtedness; create liens on property; engage in mergers, consolidations and other fundamental changes; dispose of assets; make investments, loans or advances; make certain acquisitions; engage in certain transactions with affiliates; declare or pay dividends on, or repurchase, our stock; and change our lines of business or fiscal year.
Complying with these covenants could adversely affect our ability to respond to changes in our business and manage our operations. In addition, these covenants could affect our ability to invest capital in new businesses and fund capital expenditures for existing businesses. Our ability to comply with these covenants and other provisions in our Credit Agreement and any future credit facilities or debt instruments may be affected by changes in our operating and financial performance, changes in general business and economic conditions, adverse regulatory developments or other events beyond our control. A failure by us to comply with the restrictive covenants and any financial ratios contained in our Credit Agreement and any future credit facilities or debt instruments could result in an event of default. Upon the occurrence of an event of default, the lenders could elect to declare all amounts outstanding to be due and payable and exercise other remedies as set forth in our Credit Agreement and any future credit facilities or debt instruments. In addition, if we are in default, we may be unable to borrow additional amounts under any such facilities to the extent that they would otherwise be available and our ability to obtain future financing may also be impacted negatively. If the indebtedness under our Credit Agreement and any future credit facilities or debt instruments were to be accelerated, it would have a material adverse effect on our future financial condition.
Our failure to raise additional capital or generate cash flows necessary to expand our operations and invest in new technologies in the future could reduce our ability to compete successfully and adversely affect our results of operations.
We may need to raise additional funds, and we may not be able to obtain additional debt or equity financing on favorable terms, if at all. If we raise additional equity financing, our security holders may experience significant dilution of their ownership interests, and any new equity securities we issue could have rights, preferences and privileges superior to those of holders of our Class A common stock and Class B common stock. If we engage in debt financing, we may be required to accept terms that restrict our ability to incur additional indebtedness, force us to maintain specified liquidity or other ratios or restrict our ability to pay dividends or make acquisitions, or agree to other restrictive covenants. If we need additional capital and cannot raise it on acceptable terms, if at all, we may not be able to, among other things:
|
|
•
|
|
develop and enhance our platform and solutions;
|
|
•
|
continue to expand our technology development, sales and marketing organizations;
|
||
|
•
|
hire, train and retain employees;
|
||
|
•
|
respond to competitive pressures or unanticipated working capital requirements; or
|
||
|
•
|
pursue acquisition opportunities.
|
||
In addition, access to our existing lines of credit under the Credit Agreement are subject to certain financial and other covenants. Our inability to do any of the foregoing could reduce our ability to compete successfully and could have an adverse effect on our business.
39
If we fail to maintain an effective system of disclosure controls and internal control over financial reporting, our ability to produce timely and accurate financial statements or comply with applicable regulations could be impaired.
As a public company, we are subject to the reporting requirements of the Exchange Act, the Sarbanes-Oxley Act and the listing standards of the New York Stock Exchange (NYSE). We expect that the requirements of these rules and regulations will continue to increase our legal, accounting and financial compliance costs, make some activities more difficult, time consuming and costly, and place significant strain on our personnel, systems and resources. The Sarbanes-Oxley Act requires, among other things, that we maintain effective disclosure controls and procedures, and internal control over financial reporting. Our disclosure controls and procedures are designed to ensure that information required to be disclosed by us in the reports that we file with the SEC is recorded, processed, summarized and reported within the time periods specified in SEC rules and forms. We are continuing to improve our internal control over financial reporting. We have expended, and anticipate that we will continue to expend, significant resources in order to maintain and improve the effectiveness of our disclosure controls and procedures and internal control over financial reporting.
Our current controls and any new controls that we develop may become inadequate because of changes in conditions in our business, including increased complexity resulting from our international expansion. Further, weaknesses in our disclosure controls or our internal control over financial reporting may be discovered in the future. Any failure to develop or maintain effective controls, or any difficulties encountered in their implementation or improvement, could harm our results of operations or cause us to fail to meet our reporting obligations and may result in a restatement of our financial statements for prior periods. Any failure to implement and maintain effective internal control over financial reporting could also adversely affect the results of management reports and independent registered public accounting firm audits of our internal control over financial reporting that we will eventually be required to include in our periodic reports that will be filed with the SEC. Ineffective disclosure controls and procedures, and internal control over financial reporting could also cause investors to lose confidence in our reported financial and other information, which would likely have a negative effect on the market price of our Class A common stock. In addition, if we are unable to continue to meet these requirements, we may not be able to remain listed on the NYSE.
Our independent registered public accounting firm is not required to formally attest to the effectiveness of our internal control over financial reporting until after we are no longer an “emerging growth company” as defined in the JOBS Act. At such time, our independent registered public accounting firm may issue a report that is adverse in the event it is not satisfied with the level at which our internal control over financial reporting is documented, designed or operating. Any failure to maintain effective disclosure controls and internal control over financial reporting could have an adverse effect on our business and results of operations and could cause a decline in the price of our Class A common stock.
Risks Related to Ownership of Our Class A Common Stock
We have a limited operating history in an evolving industry which makes it difficult to evaluate our current business future prospects and increases the risk of your investment.
We launched operations in 2006. This limited history in an evolving industry makes it difficult to effectively assess or forecast our future prospects. You should consider our business and prospects in light of the risks and difficulties we encounter or may encounter. These risks and difficulties include our ability to cost-effectively acquire new creators and engage and retain existing creators, maintain the quality of our technology infrastructure that can efficiently and reliably handle ticket sales and event management services globally and the deployment of new features and solutions and successfully compete with other companies that are currently in, or may enter, the ticketing and event solution space. Additional risks include our ability to effectively manage growth, responsibly use the data that creators and attendees share with us, process, store, protect and use personal data in compliance with governmental regulation, contractual obligations and other legal obligations related to privacy and security and avoid interruptions or disruptions in our service or slower than expected load times for our platform. Other risks posed by our limited operating history include the ability to hire, integrate and retain world class talent at all levels of the company, continue to expand our business in markets outside the United States, and defend ourselves against litigation, regulatory, intellectual property, privacy or other claims. If we fail to address the risks and difficulties that we face, including those associated with the challenges listed above, our business and our results of operations will be adversely affected.
40
The market price of our Class A common stock may be volatile and may decline regardless of our operating performance.
Prior to our initial public offering, there was no public market for shares of our Class A common stock. The market prices of the securities of other newly public companies have historically been highly volatile. The market price of our Class A common stock may fluctuate significantly in response to numerous factors, many of which are beyond our control, including, but not limited to:
|
|
•
|
|
overall performance of the equity markets and/or publicly-listed technology companies;
|
|
|
•
|
|
actual or anticipated fluctuations in our net revenue or other operating metrics;
|
|
|
•
|
|
changes in the financial projections we provide to the public or our failure to meet these projections;
|
|
|
•
|
|
failure of securities analysts to initiate or maintain coverage of us, changes in financial estimates by any securities analysts who follow our company or our failure to meet the estimates or the expectations of investors;
|
|
|
•
|
|
the economy as a whole and market conditions in our industry;
|
|
|
•
|
|
rumors and market speculation involving us or other companies in our industry;
|
|
|
•
|
|
announcements by us or our competitors of significant innovations, acquisitions, strategic partnerships, joint ventures or capital commitments;
|
|
|
•
|
|
new laws or regulations or new interpretations of existing laws or regulations applicable to our business;
|
|
|
•
|
|
lawsuits threatened or filed against us;
|
|
|
•
|
|
recruitment or departure of key personnel;
|
|
|
•
|
|
other events or factors, including those resulting from war, incidents of terrorism or responses to these events; and
|
|
|
•
|
|
the expiration of contractual lock-up or market standoff agreements.
|
In addition, extreme price and volume fluctuations in the stock markets have affected and continue to affect many technology companies’ stock prices. Often, their stock prices have fluctuated in ways unrelated or disproportionate to the companies’ operating performance. In the past, stockholders have filed securities class action litigation following periods of market volatility. If we were to become involved in securities litigation, it could subject us to substantial costs, divert resources and the attention of management from our business and harm our business.
Moreover, because of these fluctuations, comparing our results of operations on a period-to-period basis may not be meaningful. You should not rely on our past results as an indication of our future performance. This variability and unpredictability could also result in our failing to meet the expectations of industry or financial analysts or investors for any period. If our net revenue or results of operations fall below the expectations of analysts or investors or below any forecasts we may provide to the market, or if the forecasts we provide to the market are below the expectations of analysts or investors, the price of our Class A common stock could decline substantially. Such a stock price decline could occur even when we have met any previously publicly stated net revenue or earnings forecasts that we may provide.
The dual class structure of our common stock has the effect of concentrating voting control with our directors, executive officers and their affiliates and that may depress the trading price of our Class A common stock.
Our Class B common stock has ten votes per share and our Class A common stock has one vote per share. As of January 31, 2019, our directors, executive officers and stockholders holding more than 5% of our outstanding shares, and their affiliates, beneficially own in the aggregate 48.4% of the voting power of our capital stock. Because of the ten-to-one voting ratio between our Class B and Class A common stock, the holders of our Class B common stock collectively will continue to control a majority of the combined voting power of our common stock and therefore be able to control all matters submitted to our stockholders for approval until September 20, 2028, the date that is the ten year anniversary of the closing of our IPO. This concentrated control will limit or preclude your ability to influence corporate matters for the foreseeable future, including the election of directors, amendments of our organizational documents, and any merger, consolidation, sale of all or substantially all of our assets, or other major corporate transaction requiring stockholder approval. In addition, this may prevent or discourage unsolicited acquisition proposals or offers for our capital stock that you may feel are in your best interest as one of our stockholders.
Future transfers by holders of Class B common stock will generally result in those shares converting to Class A common stock, subject to limited exceptions, such as certain transfers effected for estate planning purposes. The conversion of Class B common stock to Class A common stock will have the effect, over time, of increasing the relative voting power of those holders of Class B common stock who retain their shares in the long-term.
41
In addition, in July 2017, Standard & Poor’s announced that they would cease to allow most newly public companies utilizing dual or multi-class capital structures to be included in their indices. Affected indices include the S&P 500, S&P MidCap 400, and S&P SmallCap 600, which together make up the S&P Composite 1500. Under the announced policies, our dual class capital structure would make us ineligible for inclusion in any of these indices, and as a result, mutual funds, exchange-traded funds, and other investment vehicles that attempt to passively track these indices will not be investing in our stock. These policies are new and it is as of yet unclear what effect, if any, they will have on the valuations of publicly-traded companies excluded from the indices, but it is possible that they may depress these valuations compared to those of other similar companies that are included.
We are an emerging growth company, and any decision on our part to comply only with certain reduced reporting and disclosure requirements applicable to emerging growth companies could make our Class A common stock less attractive to investors.
We are an emerging growth company, and, for as long as we continue to be an emerging growth company, we may choose to take advantage of exemptions from various reporting requirements applicable to other public companies but not to “emerging growth companies,” including:
|
|
•
|
|
not being required to have our independent registered public accounting firm audit our internal control over financial reporting under Section 404 of the Sarbanes-Oxley Act;
|
|
|
•
|
|
reduced disclosure obligations regarding executive compensation in our periodic reports and annual report on Form 10-K; and
|
|
|
•
|
|
exemptions from the requirements of holding a non-binding advisory vote on executive compensation and stockholder approval of any golden parachute payments not previously approved.
|
Our status as an emerging growth company will end as soon as any of the following takes place:
|
|
•
|
|
the last day of the fiscal year in which we have more than $1.07 billion in annual revenue;
|
|
|
•
|
|
the date we qualify as a “large accelerated filer,” with at least $700 million of equity securities held by non-affiliates;
|
|
|
•
|
|
the date on which we have issued, in any three-year period, more than $1.0 billion in non-convertible debt securities; or
|
|
|
•
|
|
the last day of the fiscal year ending after the fifth anniversary of the completion of our initial public offering.
|
We cannot predict if investors will find our Class A common stock less attractive if we choose to rely on the exemptions afforded to emerging growth companies. If some investors find our Class A common stock less attractive because we reply on any of these exemptions, there may be a less active trading market for our Class A common stock and the market price of our Class A common stock may be more volatile.
Under the JOBS Act, emerging growth companies can also delay adopting new or revised accounting standards until such time as those standards apply to private companies. We have elected to use this extended transition period for complying with new or revised accounting standards that have different effective dates for public and private companies until the earlier of the date we (i) are no longer an emerging growth company or (ii) affirmatively and irrevocably opt out of the extended transition period provided in the JOBS Act. As a result, our financial statements may not be comparable to companies that comply with new or revised accounting pronouncements as of public company effective dates.
If securities or industry analysts do not publish or cease publishing research, or publish inaccurate or unfavorable research, about our business, the price of our Class A common stock and trading volume could decline.
The trading market for our Class A common stock will depend in part on the research and reports that securities or industry analysts publish about us or our business. If industry analysts do not publish or cease publishing research on our company, the trading price for our Class A common stock would be negatively affected. If one or more of the analysts who cover us downgrade our Class A common stock or publish inaccurate or unfavorable research about our business, our Class A common stock price would likely decline. If one or more of these analysts cease coverage of us or fail to publish reports on us on a regular basis, demand for our Class A common stock could decrease, which might cause our Class A common stock price and trading volume to decline.
42
Sales of substantial amounts of our Class A common stock in the public markets, such as when our lock-up restrictions are released, or the perception that sales might occur, could cause the market price of our Class A common stock to decline.
Sales of a substantial number of shares of our Class A common stock into the public market, particularly sales by our directors, executive officers and principal stockholders, or the perception that these sales might occur, could cause the market price of our Class A common stock to decline. Substantially all of our securities that were outstanding prior to the completion of our initial public offering are currently restricted from resale as a result of lock-up and market standoff agreements. These securities will become available to be sold 180 days after the date of the Prospectus. Goldman Sachs & Co. LLC and J.P. Morgan Securities LLC may, in their discretion, permit our security holders to sell shares prior to the expiration of the restrictive provisions contained in the lock-up agreements. Sales of a substantial number of such shares upon expiration of the lock-up and market standoff agreements, the perception that such sales may occur or early release of these agreements could cause our market price to fall or make it more difficult for you to sell your Class A common stock at a time and price that you deem appropriate. Shares held by directors, executive officers and other affiliates will also be subject to volume limitations under Rule 144 under the Securities Act of 1933, as amended (Securities Act), and various vesting agreements.
In addition, as of
December 31, 2018
, we had
22,012,597
options outstanding that, if fully exercised, would result in the issuance of shares of Class B common stock. All of the shares of Class B common stock issuable upon the exercise of stock options and the shares reserved for future issuance under our equity incentive plans are registered for public resale under the Securities Act. Accordingly, these shares will be able to be freely sold in the public market upon issuance, subject to existing lock-up or market standoff agreements, volume limitations under Rule 144 for our executive officers and directors and applicable vesting requirements.
As of
December 31, 2018
, the holders of 42,188,624 shares of our Class B common stock have rights, subject to some conditions, to require us to file registration statements for the public resale of the Class A common stock issuable upon conversion of such shares or to include such shares in registration statements that we may file for us or other stockholders. Any registration statement we file to register additional shares, whether as a result of registration rights or otherwise, could cause the market price of our Class A common stock to decline or be volatile.
Our issuance of additional capital stock in connection with financings, acquisitions, investments, our stock incentive plans or otherwise will dilute all other stockholders.
We expect to issue additional capital stock in the future that will result in dilution to all other stockholders. We expect to grant equity awards to employees, directors and consultants under our stock incentive plans. We may also raise capital through equity financings in the future. As part of our business strategy, we may acquire or make investments in complementary companies, products or technologies and issue equity securities to pay for any such acquisition or investment. Any such issuances of additional capital stock may cause stockholders to experience significant dilution of their ownership interests and the per share value of our Class A common stock to decline.
The requirements of being a public company may strain our resources, divert management’s attention and affect our ability to attract and retain executive management and qualified board members.
As a public company, we are subject to the reporting requirements of the Exchange Act, the listing standards of the NYSE and other applicable securities rules and regulations. We expect that the requirements of these rules and regulations will continue to increase our legal, accounting and financial compliance costs, make some activities more difficult, time-consuming and costly, and place significant strain on our personnel, systems and resources. For example, the Exchange Act requires, among other things, that we file annual, quarterly and current reports with respect to our business and results of operations. As a result of the complexity involved in complying with the rules and regulations applicable to public companies, our management’s attention may be diverted from other business concerns, which could harm our business, results of operations and financial condition. Although we have already hired additional employees to assist us in complying with these requirements, we may need to hire more employees in the future or engage outside consultants, which will increase our operating expenses.
In addition, changing laws, regulations and standards relating to corporate governance and public disclosure are creating uncertainty for public companies, increasing legal and financial compliance costs, and making some activities more time-consuming. These laws, regulations and standards are subject to varying interpretations, in many cases due to their lack of specificity, and, as a result, their application in practice may evolve over time as new guidance is provided by regulatory and governing bodies. This could result in continuing uncertainty regarding compliance matters and higher costs necessitated by ongoing revisions to disclosure and governance practices. We intend to invest substantial resources to comply with evolving laws, regulations and standards, and this investment may result in increased general and administrative expenses and a diversion of management’s time and attention from business operations to compliance activities. If our efforts to comply with new laws, regulations and standards differ from the activities intended by regulatory or governing bodies due to ambiguities related to their application and practice, regulatory authorities may initiate legal proceedings against us and our business may be harmed.
43
We also expect that being a public company and these new rules and regulations will make it more expensive for us to obtain director and officer liability insurance, and we may be required to accept reduced coverage or incur substantially higher costs to obtain coverage. These factors could also make it more difficult for us to attract and retain qualified members of our board of directors, particularly to serve on our audit committee and compensation committee, and qualified executive officers.
As a result of disclosure of information in filings required of a public company, our business and financial condition will become more visible, which may result in an increased risk of threatened or actual litigation, including by competitors and other third parties. If such claims are successful, our business and results of operations could be harmed, and even if the claims do not result in litigation or are resolved in our favor, these claims, and the time and resources necessary to resolve them, could divert the resources of our management and harm our business, results of operations and financial condition.
The individuals who now constitute our senior management team have limited experience managing a publicly-traded company and limited experience complying with the increasingly complex laws pertaining to public companies. Our senior management team may not successfully or efficiently manage our transition to being a public company subject to significant regulatory oversight and reporting obligations.
We do not intend to pay dividends on our Class A common stock and, consequently, the ability of Class A common stockholders to achieve a return on investment will depend on appreciation in the price of our Class A common stock.
We have never declared or paid any dividends on our capital stock. We intend to retain any earnings to finance the operation and expansion of our business, and we do not anticipate paying any cash dividends in the foreseeable future. As a result, Class A common stockholders may only receive a return on your investment in our Class A common stock if the market price of our Class A common stock increases.
Provisions in our charter documents and under Delaware law could make an acquisition of our company more difficult, limit attempts by our stockholders to replace or remove our current board of directors and limit the market price of our Class A common stock.
Provisions that will be in our amended and restated certificate of incorporation and amended and restated bylaws may have the effect of delaying or preventing a change of control or changes in our management. Our amended and restated certificate of incorporation and amended and restated bylaws include provisions that:
|
|
•
|
|
provide that our board of directors will be classified into three classes of directors with staggered three-year terms;
|
|
|
•
|
|
permit the board of directors to establish the number of directors and fill any vacancies and newly-created directorships;
|
|
|
•
|
|
require super-majority voting to amend some provisions in our amended and restated certificate of incorporation and amended and restated bylaws;
|
|
|
•
|
|
authorize the issuance of “blank check” preferred stock that our board of directors could use to implement a stockholder rights plan;
|
|
|
•
|
|
provide that only the Chairperson of our board of directors, our Chief Executive Officer, or a majority of our board of directors will be authorized to call a special meeting of stockholders;
|
|
|
•
|
|
provide for a dual class common stock structure in which holders of our Class B common stock have the ability to control the outcome of matters requiring stockholder approval, even if they own significantly less than a majority of the outstanding shares of our Class A and Class B common stock, including the election of directors and significant corporate transactions, such as a merger or other sale of our company or its assets;
|
|
|
•
|
|
prohibit stockholder action by written consent, which requires all stockholder actions to be taken at a meeting of our stockholders;
|
|
|
•
|
|
provide that the board of directors is expressly authorized to make, alter or repeal our bylaws; and
|
|
|
•
|
|
advance notice requirements for nominations for election to our board of directors or for proposing matters that can be acted upon by stockholders at annual stockholder meetings.
|
Moreover, Section 203 of the Delaware General Corporation Law may discourage, delay, or prevent a change in control of our company. Section 203 imposes certain restrictions on mergers, business combinations, and other transactions between us and holders of 15% or more of our common stock.
44
Our amended and restated bylaws designate a state or federal court located within the State of Delaware as the exclusive forum for certain litigation that may be initiated by our stockholders, which could limit stockholders’ ability to obtain a favorable judicial forum for disputes with us.
Our amended and restated bylaws provide that a state or federal court located within the State of Delaware will be the exclusive forum for:
|
|
•
|
|
any derivative action or proceeding brought on our behalf;
|
|
|
•
|
|
any action asserting a breach of fiduciary duty;
|
|
|
•
|
|
any action asserting a claim against us arising pursuant to the Delaware General Corporation Law, our amended and restated certificate of incorporation, or our amended and restated bylaws; or
|
|
|
•
|
|
any action asserting a claim against us that is governed by the internal affairs doctrine.
|
This choice of forum provision may limit a stockholder’s ability to bring a claim in a judicial forum that it finds favorable for disputes with us or any of our directors, officers or other employees, which may discourage lawsuits with respect to such claims. Alternatively, if a court were to find the choice of forum provision which will be contained in our amended and restated bylaws to be inapplicable or unenforceable in an action, we may incur additional costs associated with resolving such action in other jurisdictions, which could harm our business, results of operations and financial condition.
45
Item 1B. Unresolved Staff Comments
None.
Item 2. Properties
We lease approximately 48,812 square feet of space in San Francisco, California for our headquarters under a lease agreement that expires in November 2021. We also lease facilities in Nashville, Tennessee, Argentina, Australia, Belgium, Brazil, Canada, Germany, Ireland, the Netherlands, Spain and the United Kingdom to support our global team.
We anticipate leasing additional office space in future periods to support our growth. We intend to further expand our facilities or add new facilities as we add employees and enter new geographic markets, and we believe that suitable additional or alternative space will be available as needed to accommodate such growth. However, we expect to incur additional expenses in connection with such new or expanded facilities.
Item 3. Legal Proceedings
We are not a party to any material legal proceedings. From time to time we may be subject to legal proceedings and claims arising in the ordinary course of business.
Item 4. Mine Safety Disclosures
Not applicable.
46
PART II
Item 5. Market for Registrant's Common Equity, Related Stockholder Matters and Issuer Purchases of Equity Securities
Market Information for Common Stock
Our Class A common stock has been listed on the New York Stock Exchange (NYSE) under the symbol “EB” since September 20, 2018. Prior to that date, there was no public trading market for our stock. Our Class B common stock is not listed or traded on any stock exchange.
Holders of Record
As of February 28, 2019, there were
9
holders of record of our Class A common stock and
635
holders of record of our Class B common stock. Because many of our shares of Class A common stock are held by brokers and other institutions on behalf of stockholders, we are unable to estimate the total number of beneficial owners of our Class A common stock represented by these record holders.
Dividend Policy
We have never declared nor paid any cash dividends on our capital stock. We currently intend to retain all available funds and any future earnings for use in the operation of our business and do not expect to pay any dividends on our capital stock in the foreseeable future. Any future determination relating to our dividend policy will be at the discretion of our board of directors, subject to applicable laws, and will depend on our financial condition, results of operations, capital requirements, general business conditions, and other factors that our board of directors considers relevant.
Unregistered Sale of Equity Securities
From January 1, 2018 through September 18, 2018, we granted to our employees, consultants and other service providers options to purchase an aggregate of 6,781,625 shares of common stock under our 2010 Stock Option Plan (the 2010 Plan) at exercise prices ranging from $8.65 to $13.72 per share, for a weighted-average exercise price of $12.61 per share.
From January 1, 2018 through September 18, 2018, we issued and sold to our employees, consultants and other service providers an aggregate of 1,589,552 shares of common stock upon the exercise of options under our 2010 Plan at exercise prices ranging from $0.30 to $13.72 per share, for a weighted-average exercise price of $4.64 per share.
From January 1, 2018 through December 31, 2018, we issued 757,218 shares of our common stock in business acquisition transactions.
We believe these transactions were exempt from registration under the Securities Act in reliance upon Section 4(a)(2) of the Securities Act, Regulation D promulgated thereunder or Rule 701 promulgated under Section 3(b) of the Securities Act as transactions by an issuer not involving any public offering or pursuant to benefit plans and contracts relating to compensation as provided under Rule 701. The recipients of the securities in each of these transactions represented their intentions to acquire the securities for investment only and not with a view to or for sale in connection with any distribution thereof, and appropriate legends were placed upon the stock certificates issued in these transactions. All recipients had adequate access, through their relationships with us, to information about Eventbrite.
Issuer Purchases of Equity Securities
None.
Securities Authorized for Issuance Under Equity Incentive Plans
See Item 12, “Security Ownership of Certain Beneficial Owners and Management and Related Stockholder Matters” for information regarding securities authorized for issuance.
47
Use of Proceeds from Initial Public Offering of Class A Common Stock
In September 2018, we closed our initial public offering of our Class A common stock (IPO), in which we sold 11,500,000 shares of our Class A common stock at a price to the public of $23.00 per share, including shares sold in connection with the exercise of the underwriters’ option to purchase additional shares. The offer and sale of all of the shares in the IPO were registered under the Securities Act pursuant to a registration statement on Form S-1 (File No. 333-226978), which was declared effective by the SEC on September 19, 2018.
We raised
$240.5 million
in net proceeds after deducting underwriters’ discounts and commissions of $18.5 million and offering expenses of
$5.5 million
. There has been no material change in the planned use of proceeds from our IPO as described in our Prospectus. No payments were made by us to directors, officers or persons owning ten percent or more of our common stock or to their associates, or to our affiliates, other than payments in the ordinary course of business to officers for salaries and to non-employee directors pursuant to our director compensation policy. Pending the uses described, we have invested or intend to invest the net proceeds in short-term interest-bearing investment-grade securities, certificates of deposit or government securities, pursuant to the investment policy approved by our board of directors.
Stock Performance Graph
This performance graph shall not be deemed “soliciting material” or to be “filed” with the SEC for purposes of Section 18 of the Securities Exchange Act of 1934, as amended (Exchange Act), or otherwise subject to the liabilities under that Section, and shall not be deemed to be incorporated by reference into any filing of Eventbrite, Inc. under the Securities Act of 1933, as amended, or the Exchange Act.
The following graph compares the cumulative total return to stockholders on our Class A common stock relative to the cumulative total returns of the Standard & Poor’s 500 Index, or S&P 500, and the S&P North American Technology Index. An investment of $100 (with reinvestment of all dividends) is assumed to have been made in our Class A common stock and in each index on September 20, 2018, the date our Class A common stock began trading on the NYSE, and its relative performance is tracked through January 31, 2019. The returns shown are based on historical results and are not intended to suggest future performance.
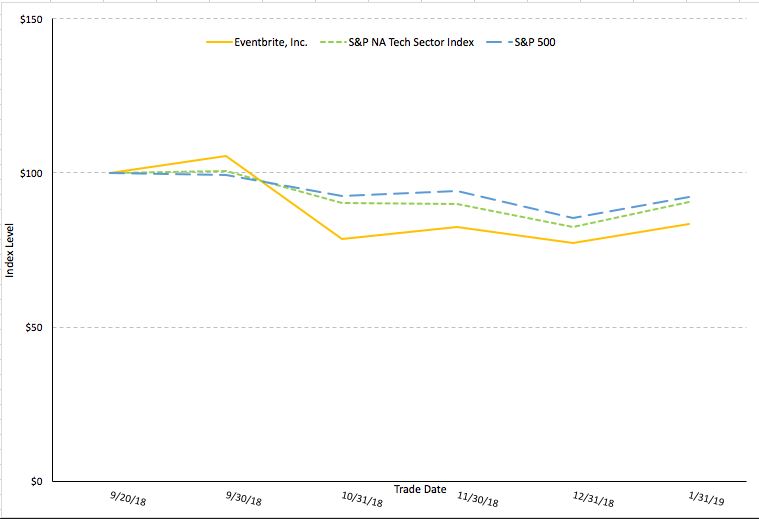
48
Item 6. Selected Financial Data
The following selected consolidated statement of operations data for the years ended December 31, 2018, 2017 and 2016 and the consolidated balance sheet data as of December 31, 2018 and 2017 have been derived from our audited consolidated financial statements and should be read in conjunction with the section titled “Management’s Discussion and Analysis of Financial Condition and Results of Operations” and our consolidated financial statements and related notes included elsewhere in this Annual Report on Form 10-K.
|
Year Ended December 31,
|
|||||||||||
|
2018
|
2017
|
2016
|
|||||||||
|
(in thousands, except share and per share data)
|
|||||||||||
|
Consolidated Statements of Operations Data
|
|||||||||||
|
Net revenue
|
$
|
291,611
|
|
$
|
201,597
|
|
$
|
133,499
|
|
||
|
Cost of net revenue
(1)
|
120,653
|
|
81,667
|
|
55,689
|
|
|||||
|
Gross profit
|
170,958
|
|
119,930
|
|
77,810
|
|
|||||
|
Operating expenses
(1)
:
|
|||||||||||
|
Product development
|
46,071
|
|
30,608
|
|
22,723
|
|
|||||
|
Sales, marketing and support
|
69,780
|
|
55,170
|
|
48,391
|
|
|||||
|
General and administrative
|
93,782
|
|
67,559
|
|
41,749
|
|
|||||
|
Total operating expenses
|
209,633
|
|
153,337
|
|
112,863
|
|
|||||
|
Loss from operations
|
(38,675
|
)
|
(33,407
|
)
|
(35,053
|
)
|
|||||
|
Interest expense
|
(11,295
|
)
|
(6,462
|
)
|
(3,513
|
)
|
|||||
|
Change in fair value of redeemable convertible preferred stock warrant liability
|
(9,591
|
)
|
(2,200
|
)
|
—
|
|
|||||
|
Loss on debt extinguishment
|
(178
|
)
|
—
|
|
—
|
|
|||||
|
Other income (expense), net
|
(3,189
|
)
|
3,509
|
|
(1,695
|
)
|
|||||
|
Loss before provision for (benefit from) income taxes
|
(62,928
|
)
|
(38,560
|
)
|
(40,261
|
)
|
|||||
|
Income tax provision (benefit)
|
1,150
|
|
(13
|
)
|
131
|
|
|||||
|
Net loss
|
$
|
(64,078
|
)
|
$
|
(38,547
|
)
|
$
|
(40,392
|
)
|
||
|
Net loss per share, basic and diluted
|
$
|
(1.71
|
)
|
$
|
(1.98
|
)
|
$
|
(2.48
|
)
|
||
|
Weighted-average number of shares outstanding used to compute net loss per share, basic and diluted
|
37,540
|
|
19,500
|
|
16,291
|
|
|||||
|
(1) Amounts include stock-based compensation as follows:
|
|||||||||||||
|
Year Ended December 31,
|
|||||||||||||
|
2018
|
2017
|
2016
|
|||||||||||
|
Cost of net revenue
|
$
|
429
|
|
$
|
200
|
|
$
|
134
|
|
||||
|
Product development
|
5,813
|
|
2,411
|
|
2,020
|
|
|||||||
|
Sales, marketing and support
|
3,570
|
|
2,364
|
|
1,767
|
|
|||||||
|
General and administrative
|
20,419
|
|
5,883
|
|
4,610
|
|
|||||||
|
Total stock-based compensation expense
|
$
|
30,231
|
|
$
|
10,858
|
|
$
|
8,531
|
|
||||
49
|
December 31,
|
|||||||||||
|
2018
|
2017
|
2016
|
|||||||||
|
(in thousands)
|
|||||||||||
|
Consolidated Balance Sheet Data:
|
|||||||||||
|
Cash and cash equivalents
|
$
|
437,892
|
|
$
|
188,986
|
|
$
|
139,538
|
|
||
|
Working capital
|
237,500
|
|
29,866
|
|
34,438
|
|
|||||
|
Total assets
|
836,884
|
|
570,837
|
|
245,337
|
|
|||||
|
Total current liabilities
|
308,204
|
|
246,182
|
|
149,266
|
|
|||||
|
Total debt
|
72,722
|
|
77,751
|
|
—
|
|
|||||
|
Total stockholders' equity (deficit)
|
415,222
|
|
(155,814
|
)
|
(149,084
|
)
|
|||||
|
Year Ended December 31,
|
|||||||||||
|
2018
|
2017
|
2016
|
|||||||||
|
(in thousands, except percentages)
|
|||||||||||
|
Non-GAAP and Other Data
|
|||||||||||
|
Paid tickets
(1)
|
97,295
|
|
71,046
|
|
44,572
|
|
|||||
|
Retention rate
(2)
|
100
|
%
|
97
|
%
|
93
|
%
|
|||||
|
Adjusted EBITDA
(3)
|
$
|
28,765
|
|
$
|
4,206
|
|
$
|
(17,591
|
)
|
||
|
Free cash flow
(4)
|
$
|
(5,488
|
)
|
$
|
21,143
|
|
$
|
(5,681
|
)
|
||
|
(1)
|
We define paid tickets as the number of tickets that generate ticket fees.
|
|||||||
|
(2)
|
To obtain our retention rate, we calculate the gross ticket fees generated by all creators in the year prior to the year of measurement (Prior Year Gross Ticket Fees). We then calculate the gross ticket fees those creators generated in the applicable year of measurement (Measurement Year Gross Ticket Fees). Finally, to calculate our retention rate for a measurement year we divide the Measurement Year Gross Ticket Fees by the Prior Year Gross Ticket Fees. Fees associated with the sale of tickets on our platform are gross ticket fees, which are the total fees generated from paid ticket sales, before adjustments for refunds, credits and amortization of non-recoupable signing fees. We calculate retention rate on an annual basis only.
|
|||||||
|
(3)
|
Adjusted EBITDA is a financial measure that is not calculated in accordance with U.S. GAAP. See the section titled “—Non-GAAP Financial Measures—Adjusted EBITDA” for information regarding Adjusted EBITDA, including the limitations of such measure, and a reconciliation of Adjusted EBITDA to net loss.
|
|||||||
|
(4)
|
Free cash flow is a financial measure that is not calculated in accordance with U.S. GAAP. See the section titled “—Non-GAAP Financial Measures—Free Cash Flow” for information regarding free cash flow, including the limitations of such measure, and a reconciliation of free cash flow to net cash provided by operating activities.
|
|||||||
Non-GAAP Financial Measures
We believe that the use of Adjusted EBITDA and free cash flow is helpful to our investors as they are metrics used by management in assessing the health of our business and our operating performance. These measures, which we refer to as our non-GAAP financial measures, are not prepared in accordance with GAAP and have limitations as analytical tools, and you should not consider them in isolation or as substitutes for analysis of our results of operations as reported under GAAP. You are encouraged to evaluate the adjustments and the reasons we consider them appropriate.
Adjusted EBITDA
Adjusted EBITDA is a key performance measure that our management uses to assess our operating performance. Because Adjusted EBITDA facilitates internal comparisons of our historical operating performance on a more consistent basis, we use this measure for business planning purposes and i evaluating acquisition opportunities.
We calculate Adjusted EBITDA as net loss attributable to common stockholders adjusted to exclude depreciation and amortization, stock-based compensation expense, interest expense, the change in fair value of redeemable convertible preferred stock warrant liability, loss on debt extinguishment, direct and indirect acquisitions related costs, income tax provisions (benefit) and other income (expense), net, which consisted of interest income, foreign exchange rate gains and losses and changes in fair value of term loan embedded derivatives. Adjusted EBITDA should not be considered as an alternative to net loss or any other measure of financial performance calculated and presented in accordance with GAAP.
50
The following table presents a reconciliation of Adjusted EBITDA from net loss for each of the periods presented:
|
Year Ended December 31,
|
|||||||||||
|
2018
|
2017
|
2016
|
|||||||||
|
(in thousands)
|
|||||||||||
|
Net loss
|
$
|
(64,078
|
)
|
$
|
(38,547
|
)
|
$
|
(40,392
|
)
|
||
|
Add:
|
|||||||||||
|
Depreciation and amortization
|
34,608
|
|
19,418
|
|
7,639
|
|
|||||
|
Stock-based compensation
|
30,231
|
|
10,858
|
|
8,531
|
|
|||||
|
Interest expense
|
11,295
|
|
6,462
|
|
3,513
|
|
|||||
|
Change in fair value of redeemable convertible preferred stock warrant liability
|
9,591
|
|
2,200
|
|
—
|
|
|||||
|
Loss on debt extinguishment
|
178
|
|
—
|
|
—
|
|
|||||
|
Direct and indirect acquisition related costs
(1)
|
2,601
|
|
7,337
|
|
1,292
|
|
|||||
|
Other income (expense), net
|
3,189
|
|
(3,509
|
)
|
1,695
|
|
|||||
|
Income tax provision (benefit)
|
1,150
|
|
(13
|
)
|
131
|
|
|||||
|
Adjusted EBITDA
|
$
|
28,765
|
|
$
|
4,206
|
|
$
|
(17,591
|
)
|
||
(1) Direct and indirect acquisition-related costs consist primarily of transaction and transition related fees and expenses incurred within one year of the acquisition date, including legal, accounting, tax and other professional fees as well as personnel-related costs such as severance and retention bonuses for completed, pending and attempted acquisitions.
Some of the limitations of Adjusted EBITDA include (i) Adjusted EBITDA does not properly reflect capital spending that occurs off of the income statement or account for future contractual commitments, (ii) although depreciation and amortization are non-cash charges, the underlying assets may need to be replaced and Adjusted EBITDA does not reflect these capital expenditures and (iii) Adjusted EBITDA does not reflect the interest and principal required to service our indebtedness. Our Adjusted EBITDA may not be comparable to similarly titled measures of other companies because they may not calculate Adjusted EBITDA in the same manner as we calculate the measure, limiting its usefulness as a comparative measure. In evaluating Adjusted EBITDA, you should be aware that in the future we will incur expenses similar to the adjustments in this presentation. Our presentation of Adjusted EBITDA should not be construed as an inference that our future results will be unaffected by these expenses or any unusual or non-recurring items. When evaluating our performance, you should consider Adjusted EBITDA alongside other financial performance measures, including our net loss and other GAAP results.
Free Cash Flow
Free cash flow is a key performance measure that our management uses to assess our overall performance. We consider free cash flow to be a liquidity measure that provides useful information to management and investors about the amount of cash generated by our business that can be used for strategic opportunities, including investing in our business, making strategic acquisitions and strengthening our financial position.
We calculate free cash flow as cash flow from operating activities less purchases of property and equipment and capitalized internal-use software development costs, over a trailing twelve-month period. Because quarters are not uniform in terms of cash usage, we believe a trailing twelve-month view provides the best understanding of the underlying trends of the business.
51
The following table presents a reconciliation of our free cash flow to the most comparable GAAP measure, net cash provided by operating activities, for each of the periods indicated:
|
Year Ended December 31,
|
|||||||||||
|
2018
|
2017
|
2016
|
|||||||||
|
(in thousands)
|
|||||||||||
|
Net cash provided by operating activities
|
$
|
7,162
|
|
$
|
29,821
|
|
$
|
2,785
|
|
||
|
Purchases of property and equipment and capitalized internal-use software development costs
|
(12,650
|
)
|
(8,678
|
)
|
(8,466
|
)
|
|||||
|
Free cash flow
|
$
|
(5,488
|
)
|
$
|
21,143
|
|
$
|
(5,681
|
)
|
||
Although we believe free cash flow provides another important lens into the business, free cash flow is presented for supplemental informational purposes only and should not be considered a substitute for financial information presented in accordance with GAAP. Free cash flow has limitations as an analytical tool, and it should not be considered in isolation or as a substitute for analysis of other GAAP financial measures, such as cash provided by operating activities. Some of the limitations of free cash flow is that it may not properly reflect capital commitments to creators that need to be paid in the future or future contractual commitments that have not been realized in the current period. Our free cash flow may not be comparable to similarly titled measures of other companies because they may not calculate free cash flow in the same manner as we calculate the measure, limiting its usefulness as a comparative measure.
52
Item 7. Management's Discussion and Analysis of Financial Condition and Results of Operations
The following discussion and analysis of our financial condition and results of operations should be read in conjunction with the information set forth under "Selected Financial Data" and our consolidated financial statements and related notes included elsewhere in this Annual Report on Form 10-K.In addition to historical financial information, the following discussion and analysis contains forward-looking statements that are based upon current plans, expectations and beliefs that involve risks and uncertainties. Our actual results may differ materially from those anticipated in these forward-looking statements as a result of various factors, including those set forth under “Risk Factors” in this Annual Report on Form 10-K. Our fiscal year ends December 31.
Our Business
We built a powerful, broad technology platform to enable creators to solve the challenges associated with creating live experiences. Our platform integrates components needed to seamlessly plan, promote and produce live events, thereby allowing creators to reduce friction and costs, increase reach and drive ticket sales. By reducing risk and complexity, we allow creators to focus their energy on producing compelling and successful events.
We charge creators on a per-ticket basis when an attendee purchases a paid ticket for an event. We grow with creators as their attendance grows and as they plan, promote and produce more events. In 2018, we helped more than 790,000 creators issue approximately 265 million tickets across approximately 3.8 million events in over 170 countries.
We derive substantially all of our revenue from fees associated with the sale of tickets on our platform, inclusive of payment processing. Our fee structure typically consists of a fixed fee and a percentage of the price of each ticket sold by a creator. Fees associated with the sale of tickets on our platform are gross ticket fees, which we define as the total fees generated from paid ticket sales, before adjustments for refunds, credits and amortization of non-recoupable creator signing fees.
Our Business Model
The key elements of our business model are:
Efficiently Acquire Creators
We are highly focused on creating a seamless experience that attracts creators to our platform organically. More than 98% of creators who used our platform in 2018 signed themselves up for Eventbrite and in 2018, we derived 56% of our net revenue from these creators. We attract creators to our platform through multiple means, including prior experience as attendees, word of mouth from other creators, our prominence in search engine results, the ability to try our platform for free events and our library of content. We augment these channels with a highly-targeted direct sales effort that focuses on acquiring creators with events in specific categories or countries. We leverage this efficient customer acquisition model to attract a wide range of creators to Eventbrite while keeping our sales and marketing costs low. Substantially all creators go on to create and manage events with little service or support.
Provide High-Quality Solutions at a Cost Advantage
We deliver our solutions on a cloud-based architecture that allows us to serve a wide variety of creators on a single global system, thereby reducing our operating and support costs. Our cloud-based platform does not require us to own or operate data centers or proprietary on-premises equipment. Additionally, our highly-automated platform requires limited service and support staff. All of this frees up capital and other resources to dedicate to enhancing our platform and growing our business. Our platform is extensible and modular, allowing us to efficiently improve and expand our services, as well as partner with third parties to deliver the best experience possible for creators.
Drive Powerful Retention
When creators enjoy success on Eventbrite, they continue to use our platform. This happens because we are able to meet their diverse and changing needs through a creator-focused approach. Our platform scales with creators, able to handle their smallest gatherings to their largest and most complex events. As creators’ needs evolve, our platform’s breadth and extensibility allow access to a full suite of solutions, enhanced by third-party integrated offerings. Further, we continually invest to deliver new and enhanced functionality. Our success in serving creators is reflected in our retention rate, which was 100%, 97% and 93% in 2018, 2017 and 2016, respectively.
53
Enhance Growth and Monetization
We believe that there are many opportunities within the fragmented event management market to expand both core ticketing and complementary solutions. We designed our business model and technology platform to take advantage of this opportunity by ensuring we can support the addition of new event categories and countries for ticketing, as well as new revenue-generating solutions beyond ticketing. For example, we evolved our platform to meet the needs of music creators, helping to grow music venues on our platform from less than 100 in 2012 to over 1,000 in 2018, inclusive of acquisitions. Similarly, after making enhancements across our platform, net revenue from outside of the United States grew from 18% to 30% from 2012 to 2017, and was
27.4%
in 2018. Finally, EPP uses multiple external vendors to provide a single, seamless payments option for creators and attendees, and has expanded to allow the use of multiple local payment methods like Boleto in Brazil and iDeal in the Netherlands. This offering has grown to support approximately 90% of paid tickets in both 2017 and 2018. We believe that our ability to extend into new event categories and countries and add new revenue streams differentiates us from our competitors.
Our Attractive Cohort Economics
The revenue we have generated from new creators has increased over time. We evaluate this trend by tracking annual cohorts of new creators. Each creator cohort consists of creators that first paid us a fee in a specific year. The gross ticket fees we have generated for the first year of each creator cohort has more than doubled from 2013 to 2018.
We have demonstrated a consistent track record of retaining gross ticket fees from creator cohorts over time. For example, we retained 81% of the gross ticket fees from our 2014 creator cohort in 2018.
Key Factors Affecting Our Performance
We believe that the growth of our business and our future success are dependent upon many factors. While each of these areas presents significant opportunities for us, they also pose important challenges that we must successfully address in order to sustain the growth of our business and improve our results of operations.
Attract New Creators and Retain Existing Creators
Attracting new creators to our platform and retaining existing creators drives our revenue growth. We expect to continue to invest in our brand and marketing to attract more new creators, while simultaneously developing our platform to delight and retain existing creators. Our ability to attract new creators and retain existing creators is impacted by how our features and functionality develop, our pricing, the creator and attendee experience on our platform, our brand awareness among the professional creator community, our search engine prominence, the quality and audience for our professional content, the continued transition of creators from using our platform for free events to paid events and solutions and the effectiveness of our direct sales efforts. We must continue to attract new creators and retain existing creators to maintain our current business as well as continue to drive growth in the future.
Enhance and Expand Our Technical Platform
We strive to provide a platform that provides creators with a seamless experience both to sign up for and publish live events. We initially started with a core ticketing platform and over time we have added meaningful capabilities to our platform, such as expansion into new categories or countries, packages that better target particular creator types, and new solutions like payment processing, custom-designed websites and proprietary technology for the day of the event. We intend to continue to invest in our platform to develop additional functionality and solutions. If we do not enhance our platform with the functionalities that are desired by creators and if we are not able to provide easy-to-use solutions required by creators in an efficient manner, our ability to attract and retain creators will be harmed.
Invest Capital to Drive Additional Growth Opportunities
We have and will continue to invest in our business, including solutions on our platform separate from generating fees from the sale and processing of tickets, such as web presence, promoted listing and on-site services and equipment. These efforts target both expanding how we serve creators as well as enhancing the benefits of our platform for attendees. We have invested $18.4 million, $10.6 million and $4.8 million in 2018, 2017 and 2016, respectively, in these complementary solutions on our platform and have generated less than five percent of our net revenue from such solutions during these periods. While our investments are based on a careful and deliberate planning process, there is no guarantee that we will choose the right investments, or that those investments pay off for us. If we are unable to effectively invest in developing new solutions, our business may be harmed.
54
Competitive Landscape
We operate in a space that is fragmented with many types of competitors, including traditional offline alternatives, internal systems, category-based competitors who operate in a single geography or region, and smaller platform providers. While we believe we have differentiated our business from these competitors by building a powerful and broad technology platform for creators, we must continue to respond to competitive pressures. Consequently, we will need to continue to invest in this platform to differentiate our business and remain competitive, as well as respond to shifts in industry pricing levels, revenue models or business practices. Further, our industry is evolving and our business may be impacted if we face additional competition from new entrants into the market, such as large advertising or e-commerce providers.
International Expansion
Our paid tickets for events outside of the United States represented 34.1%, 36.0% and 30.3% of our total paid tickets in 2018, 2017 and 2016, respectively. Net revenue outside the United States during 2018, 2017 and 2016 was
27.4%
,
30.0%
and
27.0%
, respectively, of our total net revenue. As we deepen our global penetration, we believe international demand for our platform and solutions will continue to increase. Accordingly, we believe there is significant opportunity to grow our international business. We have invested, and plan to continue to invest, in the adoption of our platform and solutions internationally, including localization of our platform and the addition of critical capabilities to our platform required to serve those local markets. Further, our international business delivers higher gross margins, primarily because of lower payment processing expenses. If we are not able to effectively address the risk associated with international expansion, such as product-market fit in a given geography, currency fluctuation or unique factors in a specific market, our business and results of operations may be harmed.
Acquisitions
In January 2017, we acquired 100% of the outstanding equity of TSTM Group Limited (ticketscript), a Dutch ticketing company with operations throughout Europe. We acquired ticketscript in order to enhance our ticketing solutions. The acquisition date fair value of the consideration transferred was $33.4 million, which consisted of $7.7 million in cash, $7.5 million in promissory notes and 2.7 million shares of our common stock and options to purchase 0.3 million shares of our common stock. These promissory notes were allowed to be prepaid at any time and we repaid the promissory notes in full, including accrued interest, in August 2017.
In September 2017, we acquired 100% of the outstanding equity of Ticketfly, LLC (Ticketfly), a subsidiary of Pandora Media, Inc. We acquired Ticketfly in order to expand our solutions for music-related events. The acquisition date fair value of the consideration transferred was $201.1 million, which consisted of $151.1 million in cash and $50.0 million in the form of convertible promissory notes which were paid and issued, respectively, at the closing of the transaction. We repaid these notes in March 2018.
In April 2018, we acquired Ticketea S.L. (Ticketea), a leading Spanish ticketing provider. We acquired Ticketea in order to enhance our ticketing solutions and expand in the Spanish market. The acquisition of Ticketea has been accounted for as a business combination
.
The acquisition date fair value of the consideration transferred was
$11.4 million
, which consisted of $3.6 million in cash and 0.7 million shares of our common stock. Of the 0.7 million shares, 0.1 million shares are being held in escrow for adjustments related to working capital requirements and breaches of representations, warranties and covenants. These escrowed shares will be released approximately 18 months from the acquisition date, net of any adjustments.
In August 2018, we acquired Picatic E-Ticket Inc. (Picatic), a Vancouver-based ticketing and event registration platform, for a purchase price of CAD $1.8 million in cash and 0.1 million shares of our common stock, less certain adjustments and holdbacks, including adjustments related to working capital requirements and breaches of representations, warranties and covenants.
For more information regarding our acquisitions of ticketscript, Ticketfly, Ticketea and Picatic, refer to Note 3 of our Notes to our Consolidated Financial Statements included in Part II, Item 8, "Financial Statements and Supplementary Data" of this Annual Report on Form 10-K.
55
Key Business Metrics
We monitor the following key metrics to help us evaluate our business, identify trends affecting our business, formulate business plans and make strategic decisions.
Paid Tickets
Our success in serving creators is measured in large part by the number of tickets that generate ticket fees. We consider this an important indicator of the underlying health of the business. We refer to these tickets as paid tickets. The below table sets forth the number of paid tickets for the periods indicated:
|
Year Ended December 31,
|
||||||||
|
2018
|
2017
|
2016
|
||||||
|
(in thousands)
|
||||||||
|
Paid Tickets
|
97,295
|
|
71,046
|
|
44,572
|
|
||
Retention Rate
When creators experience success on our platform, they continue to organize events with us. We monitor retention of our gross ticket fees to measure our ability to retain creators on our platform. To obtain our retention rate, we determine (i) the gross ticket fees generated by all creators in the year prior to the year of measurement (Prior Year Gross Ticket Fees) and (ii) the gross ticket fees those creators generated in the applicable year of measurement (Measurement Year Gross Ticket Fees). We calculate our retention rate for a measurement year by dividing the Measurement Year Gross Ticket Fees by the Prior Year Gross Ticket Fees. We calculate retention rate on an annual basis only. While we have seen a strong retention rate from creators, this measure may fluctuate from period to period based on the success of creators and the events that they produce.
|
Year Ended December 31,
|
||||||||
|
2018
|
2017
|
2016
|
||||||
|
Retention Rate
|
100
|
%
|
97
|
%
|
93
|
%
|
||
Non-GAAP Financial Measures
Adjusted EBITDA
Adjusted EBITDA is a key performance measure that our management uses to assess our operating performance. Because Adjusted EBITDA facilitates internal comparisons of our historical operating performance on a more consistent basis, we use this measure for business planning purposes and in evaluating acquisition opportunities.
We calculate Adjusted EBITDA as net loss attributable to common stockholders adjusted to exclude depreciation and amortization, stock-based compensation expense, interest expense, the change in fair value of our redeemable convertible preferred stock warrant liability, gain on extinguishment of promissory note, direct and indirect acquisition-related costs, income tax provision (benefit) and other income (expense), which consisted of interest income and foreign exchange rate gains and losses. Adjusted EBITDA should not be considered as an alternative to net loss or any other measure of financial performance calculated and presented in accordance with GAAP.
The following table presents our Adjusted EBITDA for the years ended December 31, 2018, 2017 and 2016:
|
Year Ended December 31,
|
|||||||||||
|
2018
|
2017
|
2016
|
|||||||||
|
(in thousands)
|
|||||||||||
|
Adjusted EBITDA
|
$
|
28,765
|
|
$
|
4,206
|
|
$
|
(17,591
|
)
|
||
For more information about Adjusted EBITDA, including the limitations of such measure, and a reconciliation to net loss, see Item 6, "Selected Financial Data" included in Part II of this Annual Report on Form 10-K.
56
Free Cash Flow
Free cash flow is a key performance measure that our management uses to assess our overall performance. We consider free cash flow to be a liquidity measure that provides useful information to management and investors about the amount of cash generated by our business that can be used for strategic opportunities, including investing in our business, making strategic acquisitions and strengthening our financial position.
We calculate free cash flow as cash flow from operating activities less purchases of property and equipment and capitalized internal-use software development costs, over a trailing twelve-month period. Because quarters are not uniform in terms of cash usage, we believe a trailing twelve-month view provides the best understanding of the underlying trends of the business.
The following table presents our free cash flow for the years ended December 31, 2018, 2017 and 2016:
|
Year Ended December 31,
|
|||||||||||
|
2018
|
2017
|
2016
|
|||||||||
|
(in thousands)
|
|||||||||||
|
Free cash flow
|
$
|
(5,488
|
)
|
$
|
21,143
|
|
$
|
(5,681
|
)
|
||
For more information about free cash flow, including the limitations of such measure, and a reconciliation to operating cash flow, see Item 6, "Selected Financial Data" included in Part II of this Annual Report on Form 10-K.
Components of Results of Operations
Net Revenue
We generate substantially all of our net revenue through the sale of paid tickets on our platform. Our fee structure typically consists of a fixed fee and a percentage of the price of each ticket sold by a creator. Net revenue is recognized as tickets are sold. Net revenue excludes sales taxes and value added taxes (VAT) and is presented net of estimated customer refunds, chargebacks and amortization of creator signing fees.
We also generate a small portion of our net revenue from complementary solutions, such as day-of-event on-site product and services, web presence development and branding, software solutions to manage event venue administration and marketing services, that we provide to creators. These complementary solutions represented less than five percent of our net revenue in the aggregate in each of the years ended
December 31, 2018
, 2017 and 2016.
We treat net revenue and paid tickets from an acquired business after the one-year anniversary of the completion of such acquisition as being transacted on the Eventbrite platform. For example, the acquisition of Ticketfly closed on September 1, 2017, and as such, we considered any net revenue and paid tickets transacted on the Ticketfly platform on or after September 1, 2018 as being net revenue and paid tickets on the Eventbrite platform.
Cost of Net Revenue
Cost of net revenue consists primarily of payment processing fees, expenses associated with the operation and maintenance of our platform, including website hosting fees and platform infrastructure costs, amortization of capitalized software development costs, onsite operations costs and allocated customer support costs. Cost of net revenue also includes the amortization expense related to our acquired developed technology assets. We expect to continue to incur amortization expense related to our acquired developed technology assets through the end of 2018 for prior acquisitions. We may incur such expense related to future acquisitions in future periods. We expect cost of revenue as a percentage of revenue to fluctuate in the near- to mid-term primarily as a result of our geographical revenue mix. Our payment processing costs for credit and debit card payments are generally lower outside of the United States due to a number of factors, including lower card network fees and lower cost alternative payment networks. Consequently, if we grow more rapidly internationally than in the United States, we expect that our payment processing costs will decline as a percentage of revenue. Thus, in the long-term, we expect cost of revenue to grow in absolute dollars but decrease as a percentage of revenue.
Operating Expenses
Operating expenses consist of product development, sales, marketing and support and general and administrative expenses. Direct and indirect personnel costs, including stock-based compensation expense, are the most significant component of operating expenses. We also include sublease income as a reduction of our operating expenses.
57
Product development.
Product development expenses consist primarily of costs associated with our employees in product development and product engineering activities. We expect our product development expenses to continue to increase in absolute dollars over time. In the near-term, we anticipate our product development expenses will increase as a percentage of net revenue as we focus our product development efforts on enhancing, improving and expanding the capabilities of our platform. We expect that we will continue to invest in building employee and system infrastructure to enhance and support development of new technologies and to integrate acquired businesses and technologies. We expect that the addition of our Madrid and Vancouver creative hubs in 2018, resulting from the Ticketea and Picatic acquisitions, respectively, will contribute to higher product development expenses in absolute dollars and as a percentage of revenue in the near-term, but over the long-term, we anticipate that it will decrease as a percentage of net revenue as our revenue grows and as we continue to grow our development staff in lower cost markets.
Sales, marketing and support.
Sales, marketing and support expenses consist primarily of costs associated with our employees involved in selling and marketing our products, public relations and communication activities, marketing programs, travel and customer support costs associated with free events on our platform. For our sales teams, this also includes commissions. We also classify certain organizer related expenses, such as refunds of the ticket price paid by us on behalf of a creator as sales, marketing and support expense. Sales, marketing and support expenses are driven by investments to grow and retain creators and attendees on our platform. We expect sales, marketing and support expenses to increase in absolute dollars over time. In the near-term, we anticipate sales, marketing and support expenses will fluctuate as a percentage of net revenue, but over the long-term we anticipate that it will decrease as a percentage of net revenue as we expect to see continued growth in net revenue generated from creators that signed up with us through our efficient customer acquisition channels, such as word of mouth referrals, converting free creators to paid creators and converting attendees into creators. We spend a comparatively small portion of our sales, marketing and support costs on these customer acquisition channels. We believe that, in the long-term, our sales, marketing and support expenses will decrease as a percentage of net revenue as we continue to drive sales through these efficient customer acquisition channels.
General and administrative.
General and administrative expenses consist of personnel costs for finance, accounting, legal, risk, human resources and administrative personnel. It also includes professional fees for legal, accounting, finance, human resources and other corporate matters. Our general and administrative expenses currently include two large non-compensation items: (i) amortization of acquired customer relationship and trade names assets and (ii) reserves for sales tax and VAT accrued on behalf of creators. Our general and administrative expenses have increased on an actual dollar basis over time and we expect general and administrative expenses to continue to increase in absolute dollars over time, however, we do anticipate general and administrative expenses will fluctuate as a percentage of net revenue as we expect to incur additional expenses to support our growth as we mature as a publicly-traded company and as we scale our business.
Interest Expense
Interest expense relates to our build-to-suit lease financing obligation and outstanding debt.
As a result of our build-to-suit lease accounting, a portion of our cash rent payments related to our San Francisco office are classified as interest expense for GAAP reporting purposes. We reported interest expense of $3.4 million, $3.5 million and $3.5 million for each of the years ended
December 31, 2018
, 2017 and 2016 related to build-to-suit accounting.
Other outstanding debt has been historically related to acquisitions, either as part of consideration or to finance cash consideration for an acquisition. In January 2017, we issued $7.5 million in promissory notes in connection with the ticketscript acquisition. These promissory notes plus accrued interest were fully repaid in August 2017. In September 2017, we issued $50.0 million subordinated convertible notes in connection with the Ticketfly acquisition. Also, in September 2017, we borrowed $30.0 million under the First WTI Loan Facility. The subordinated convertible notes were repaid in March 2018 at a discount to issuance, funded in part by an additional draw of $30.0 million against our First WTI Loan Facility. We drew an additional $15.0 million under the Second WTI Loan Facility in May 2018. The amounts borrowed under the WTI Loan Facilities were fully repaid in September 2018 and the underlying agreements were terminated. Also in September 2018, we borrowed $75.0 million in New Term Loans under our Credit Agreement.
Change in Fair Value of Redeemable Convertible Preferred Stock Warrant Liability
The redeemable convertible preferred stock warrant is classified as a liability on our consolidated balance sheet and remeasured to fair value at each balance sheet date with the corresponding charge recorded as a change in fair value of redeemable convertible preferred stock warrant liability on the consolidated statements of operations. In connection with our IPO, all warrants were automatically exercised for no consideration, thus we will not have a redeemable convertible preferred stock warrant liability in future periods subject to fair value adjustment.
58
Loss on debt extinguishment
Loss on debt extinguishment consists of amounts recorded related to our accounting for the retirement of our debt obligations.
Other Income (Expense), Net
Other income (expense), net consists of interest income, foreign exchange rate remeasurement gains and losses recorded from consolidating our subsidiaries each period-end and changes in fair value of the term loan embedded derivatives.
Income Tax Provision (Benefit)
Income tax provision (benefit) consists primarily of U.S. federal and state income taxes and income taxes in certain foreign jurisdictions in which we conduct business. The differences in the tax provision and benefit for the periods presented and the U.S. federal statutory rate is primarily due to foreign taxes in profitable jurisdictions and the recording of a full valuation allowance on our deferred tax assets and certain foreign losses which benefit from rates lower than the U.S. federal statutory rate. We apply the discrete method provided in ASC 740 to calculate our interim tax provision.
Results of Operations
The results of operations presented below should be reviewed in conjunction with the consolidated financial statements and notes included elsewhere in this Annual Report. The following tables set forth our consolidated results of operations data and such data as a percentage of net revenue for the periods presented:
|
Year Ended December 31,
|
|||||||||||
|
2018
|
2017
|
2016
|
|||||||||
|
(in thousands)
|
|||||||||||
|
Consolidated Statements of Operations
|
|||||||||||
|
Net revenue
|
$
|
291,611
|
|
$
|
201,597
|
|
$
|
133,499
|
|
||
|
Cost of net revenue
|
120,653
|
|
81,667
|
|
55,689
|
|
|||||
|
Gross profit
|
170,958
|
|
119,930
|
|
77,810
|
|
|||||
|
Operating expenses:
|
|||||||||||
|
Product development
|
46,071
|
|
30,608
|
|
22,723
|
|
|||||
|
Sales, marketing and support
|
69,780
|
|
55,170
|
|
48,391
|
|
|||||
|
General and administrative
|
93,782
|
|
67,559
|
|
41,749
|
|
|||||
|
Total operating expenses
|
209,633
|
|
153,337
|
|
112,863
|
|
|||||
|
Loss from operations
|
(38,675
|
)
|
(33,407
|
)
|
(35,053
|
)
|
|||||
|
Interest expense
|
(11,295
|
)
|
(6,462
|
)
|
(3,513
|
)
|
|||||
|
Change in fair value of redeemable convertible preferred stock warrant liability
|
(9,591
|
)
|
(2,200
|
)
|
—
|
|
|||||
|
Loss on debt extinguishment
|
(178
|
)
|
—
|
|
—
|
|
|||||
|
Other income (expense), net
|
(3,189
|
)
|
3,509
|
|
(1,695
|
)
|
|||||
|
Loss before provision for (benefit from) income taxes
|
(62,928
|
)
|
(38,560
|
)
|
(40,261
|
)
|
|||||
|
Income tax provision (benefit)
|
1,150
|
|
(13
|
)
|
131
|
|
|||||
|
Net loss
|
$
|
(64,078
|
)
|
$
|
(38,547
|
)
|
$
|
(40,392
|
)
|
||
59
|
Year Ended December 31,
|
||||||||
|
2018
|
2017
|
2016
|
||||||
|
Consolidated Statements of Operations, as a percentage of net revenue
|
||||||||
|
Net revenue
|
100.0
|
%
|
100.0
|
%
|
100.0
|
%
|
||
|
Cost of net revenue
|
41.4
|
|
40.5
|
|
41.7
|
|
||
|
Gross profit
|
58.6
|
|
59.5
|
|
58.3
|
|
||
|
Operating expenses:
|
||||||||
|
Product development
|
15.8
|
|
15.2
|
|
17.0
|
|
||
|
Sales, marketing and support
|
23.9
|
|
27.4
|
|
36.2
|
|
||
|
General and administrative
|
32.2
|
|
33.5
|
|
31.3
|
|
||
|
Total operating expenses
|
71.9
|
|
76.1
|
|
84.5
|
|
||
|
Loss from operations
|
(13.3
|
)
|
(16.6
|
)
|
(26.3
|
)
|
||
|
Interest expense
|
(3.9
|
)
|
(3.2
|
)
|
(2.6
|
)
|
||
|
Change in fair value of redeemable convertible preferred stock warrant liability
|
(3.3
|
)
|
(1.1
|
)
|
—
|
|
||
|
Loss on debt extinguishment
|
(0.1
|
)
|
—
|
|
—
|
|
||
|
Other income (expense), net
|
(1.1
|
)
|
1.7
|
|
(1.3
|
)
|
||
|
Loss before provision for (benefit from) income taxes
|
(21.6
|
)
|
(19.1
|
)
|
(30.2
|
)
|
||
|
Income tax provision (benefit)
|
0.4
|
|
—
|
|
0.1
|
|
||
|
Net loss
|
(22.0
|
)%
|
(19.1
|
)%
|
(30.3
|
)%
|
||
Comparison of 2018 and 2017
Net revenue
|
Year Ended December 31,
|
Change
|
|||||||||||||
|
2018
|
2017
|
$
|
%
|
|||||||||||
|
(in thousands, except percentages)
|
||||||||||||||
|
Net revenue
|
$
|
291,611
|
|
$
|
201,597
|
|
$
|
90,014
|
|
44.7
|
%
|
|||
The increase in net revenue during 2018 compared to 2017 was driven primarily by growth in paid ticket volume, which increased by
37%
during 2018 compared to 2017, from
71.0 million
to
97.3 million
. We measure acquired revenue as revenue generated from an acquired business in the first twelve months subsequent to the acquisition date. Acquired revenue increased to $36.0 million in 2018 compared to $27.5 million in 2017, driven by paid ticket volume growth from acquired businesses. Our revenue growth was strengthened by the impact of our packages launch in the fourth quarter of 2017 and by our successful migration of clients from acquired platforms to the Eventbrite platform.
Net revenue per paid ticket increased during 2018 compared to 2017 from
$2.84
per paid ticket to
$3.00
per paid ticket. This was driven by the launch of pricing packages in our self sign-on channels, improvements in fees per ticket in our sales channels and the impact of acquired businesses.
60
Cost of net revenue
|
Year Ended December 31,
|
Change
|
|||||||||||||
|
2018
|
2017
|
$
|
%
|
|||||||||||
|
(in thousands, except percentages)
|
||||||||||||||
|
Cost of net revenue
|
$
|
120,653
|
|
$
|
81,667
|
|
$
|
38,986
|
|
47.7
|
%
|
|||
|
Percentage of total net revenue
|
41.4
|
%
|
40.5
|
%
|
||||||||||
|
Gross margin
|
58.6
|
%
|
59.5
|
%
|
||||||||||
The increase in cost of net revenue during 2018 compared to 2017 was primarily due to an increase in payment processing costs of $20.7 million driven by our paid ticket growth. Additionally, there was an increase in amortization of acquired developed technology of $6.8 million, primarily resulting from the Ticketfly acquisition, and increases in platform operations costs of $3.1 million, onsite operations costs of $3.1 million and allocated customer support costs of $2.8 million. The Ticketfly acquired developed technology asset was fully amortized in the fourth quarter of 2018, which will benefit our gross margin moving forward.
Operating expense
Product development
|
Year Ended December 31,
|
Change
|
|||||||||||||
|
2018
|
2017
|
$
|
%
|
|||||||||||
|
(in thousands, except percentages)
|
||||||||||||||
|
Product development
|
$
|
46,071
|
|
$
|
30,608
|
|
$
|
15,463
|
|
50.5
|
%
|
|||
|
Percentage of total net revenue
|
15.8
|
%
|
15.2
|
%
|
||||||||||
The increase in product development expense during 2018 compared to 2017 was primarily due to increased personnel costs of $14.2 million, including $2.6 million of stock-based compensation, resulting from our ongoing hiring efforts and an increase in headcount as a result of the Ticketfly, Ticketea and Picatic acquisitions.
Sales, marketing and support
|
Year Ended December 31,
|
Change
|
|||||||||||||
|
2018
|
2017
|
$
|
%
|
|||||||||||
|
(in thousands, except percentages)
|
||||||||||||||
|
Sales, marketing and support
|
$
|
69,780
|
|
$
|
55,170
|
|
$
|
14,610
|
|
26.5
|
%
|
|||
|
Percentage of total net revenue
|
23.9
|
%
|
27.4
|
%
|
||||||||||
The increase in sales, marketing and support expenses during 2018 compared to 2017 was primarily due to increased personnel-related expenses of $13.9 million, including $1.4 million of stock-based compensation, driven by higher headcount. There was also an increase of $1.9 million in creator related expenses. These increases were partially offset by lower direct marketing spend in 2018 compared to 2017.
General and administrative
|
Year Ended December 31,
|
Change
|
|||||||||||||
|
2018
|
2017
|
$
|
%
|
|||||||||||
|
(in thousands, except percentages)
|
||||||||||||||
|
General and administrative
|
$
|
93,782
|
|
$
|
67,559
|
|
$
|
26,223
|
|
38.8
|
%
|
|||
|
Percentage of total net revenue
|
32.2
|
%
|
33.5
|
%
|
||||||||||
The increase in general and administrative expenses during 2018 compared to 2017 was a result of several factors. Personnel costs increased by $25.8 million, including $14.8 million of stock-based compensation, driven by increased headcount during 2018 compared to 2017. Amortization of acquired intangible assets increased $6.3 million primarily stemming from the Ticketfly acquisition. Contractor costs increased $2.2 million primarily for accounting services. These increases were partially offset by a decrease of $14.1 million from the reversal of sales tax reserves due to cumulative reserve remeasurements in the year ended December 31, 2018. We also recorded $6.6 million related to insurance proceeds to be received from the Ticketfly cyber incident as a reduction of expense in the year ended December 31, 2018.
61
Interest expense
|
Year Ended December 31,
|
Change
|
|||||||||||||
|
2018
|
2017
|
$
|
%
|
|||||||||||
|
(in thousands, except percentages)
|
||||||||||||||
|
Interest expense
|
$
|
(11,295
|
)
|
$
|
(6,462
|
)
|
$
|
(4,833
|
)
|
74.8
|
%
|
|||
|
Percentage of total net revenue
|
(3.9
|
)%
|
(3.2
|
)%
|
||||||||||
The increase in interest expense during 2018 compared to 2017 was driven by higher amounts of interest bearing debt that was outstanding related to the WTI loan facilities and the JPM syndicate loan.
Change in fair value of redeemable convertible preferred stock warrant liability
|
Year Ended December 31,
|
Change
|
|||||||||||||
|
2018
|
2017
|
$
|
%
|
|||||||||||
|
(in thousands, except percentages)
|
||||||||||||||
|
Change in fair value of redeemable convertible preferred stock warrant liability
|
$
|
(9,591
|
)
|
$
|
(2,200
|
)
|
$
|
(7,391
|
)
|
336.0
|
%
|
|||
|
Percentage of total net revenue
|
(3.3
|
)%
|
(1.1
|
)%
|
||||||||||
The change in fair value of our redeemable convertible preferred stock warrant liability during 2018 compared to 2017 was due to a higher increase in the underlying fair value of our redeemable convertible preferred stock from January 1, 2018 to September 20, 2018 compared to June 1, 2017 to December 31, 2017. In connection with our IPO, the redeemable convertible preferred stock warrants were automatically converted into shares of our Class B common stock.
Loss on debt extinguishment
|
Year Ended December 31,
|
Change
|
||||||||||||
|
2018
|
2017
|
$
|
%
|
||||||||||
|
(in thousands, except percentages)
|
|||||||||||||
|
Loss on debt extinguishment
|
$
|
(178
|
)
|
$
|
—
|
|
$
|
(178
|
)
|
*
|
|||
|
Percentage of total net revenue
|
(0.1
|
)%
|
—
|
%
|
|||||||||
________
* Not meaningful
The loss on debt extinguishment recorded in the year ended December 31, 2018 was due to a gain of $17.0 million related to the extinguishment of the Pandora promissory notes offset by a loss of $17.2 million related to the retirement all outstanding debt under the WTI Loan Facilities. We retired no debt in 2017.
Other income (expense), net
|
Year Ended December 31,
|
Change
|
|||||||||||||
|
2018
|
2017
|
$
|
%
|
|||||||||||
|
(in thousands, except percentages)
|
||||||||||||||
|
Other income (expense), net
|
$
|
(3,189
|
)
|
$
|
3,509
|
|
$
|
(6,698
|
)
|
(190.9
|
)%
|
|||
|
Percentage of total net revenue
|
(1.1
|
)%
|
1.7
|
%
|
||||||||||
The decrease in other income (expense), net during 2018 compared to 2017 was driven by foreign currency rate measurement fluctuations. We recognized foreign currency rate measurement gains during 2017 as a result of the weakening of the U.S. dollar compared to the currencies with which we operate and process transactions. We recognized foreign currency rate measurement losses during 2018 as a result of the overall strengthening of the U.S. dollar compared to the currencies with which we operate and process transactions. Partially offsetting these losses, we recognized a gain on the change in fair value of the term loan embedded derivative of $2.1 million in the year ended December 31, 2018.
62
Income tax provision (benefit)
|
Year Ended December 31,
|
Change
|
||||||||||||
|
2018
|
2017
|
$
|
%
|
||||||||||
|
(in thousands, except percentages)
|
|||||||||||||
|
Income tax provision (benefit)
|
$
|
1,150
|
|
$
|
(13
|
)
|
$
|
1,163
|
|
*
|
|||
|
Percentage of total net revenue
|
0.4
|
%
|
—
|
%
|
|||||||||
________
* Not meaningful
The provision for income taxes increased
$1.2 million
in 2018 compared to 2017 and was primarily attributable to changes in our jurisdictional mix of earnings and tax amortization on indefinite-lived intangible assets recorded in connection with the Ticketfly acquisition, which was completed in September 2017.
Comparison of 2017 and 2016
Net revenue
|
Year Ended December 31,
|
Change
|
|||||||||||||
|
2017
|
2016
|
$
|
%
|
|||||||||||
|
(in thousands, except percentages)
|
||||||||||||||
|
Net revenue
|
$
|
201,597
|
|
$
|
133,499
|
|
$
|
68,098
|
|
51.0
|
%
|
|||
The increase in net revenue during 2017 compared to 2016 was driven primarily by growth in paid ticket volume, which increased by 59.4% during 2017, from 44.6 million to 71.0 million in part due to ticket volume from acquired companies. Net revenue increased $27.5 million as a result of the Ticketfly and ticketscript acquisitions, which were completed in September 2017 and January 2017, respectively, and the remaining $40.6 million of growth was due to paid ticket growth on the Eventbrite platform. While net revenue and paid tickets increased year-over-year, net revenue per paid ticket decreased from $3.00 in 2016 to $2.84 in 2017. This decrease was driven by our pricing adjustments made in certain markets, which resulted in additional paid ticket volume, as well as an increase in the proportion of lower price tickets as our fees are partially based on the price of the tickets that creators sell to their events.
Cost of net revenue
|
Year Ended December 31,
|
Change
|
|||||||||||||
|
2017
|
2016
|
$
|
%
|
|||||||||||
|
(in thousands, except percentages)
|
||||||||||||||
|
Cost of net revenue
|
$
|
81,667
|
|
$
|
55,689
|
|
$
|
25,978
|
|
46.6
|
%
|
|||
|
Percentage of total net revenue
|
40.5
|
%
|
41.7
|
%
|
||||||||||
|
Gross margin
|
59.5
|
%
|
58.3
|
%
|
||||||||||
The increase in cost of net revenue during 2017 compared to 2016 was primarily due to an increase in payment processing costs of $17.0 million driven by paid ticket growth on the Eventbrite platform and paid ticket volume from acquired businesses, and increased amortization of acquired developed technology of $4.6 million, resulting from the Ticketfly and ticketscript acquisitions. We also incurred increases in platform operational costs, onsite operations costs and allocated customer support costs.
63
Operating expenses
Product development
|
Year Ended December 31,
|
Change
|
|||||||||||||
|
2017
|
2016
|
$
|
%
|
|||||||||||
|
(in thousands, except percentages)
|
||||||||||||||
|
Product development
|
$
|
30,608
|
|
$
|
22,723
|
|
$
|
7,885
|
|
34.7
|
%
|
|||
|
Percentage of total net revenue
|
15.2
|
%
|
17.0
|
%
|
||||||||||
The increase in product development expense during 2017 compared to 2016 was primarily due to increased personnel costs of $8.0 million, resulting from organic hiring efforts and an increase in headcount as a result of the Ticketfly and ticketscript acquisitions.
Sales, marketing and support
|
Year Ended December 31,
|
Change
|
|||||||||||||
|
2017
|
2016
|
$
|
%
|
|||||||||||
|
(in thousands, except percentages)
|
||||||||||||||
|
Sales, marketing and support
|
$
|
55,170
|
|
$
|
48,391
|
|
$
|
6,779
|
|
14.0
|
%
|
|||
|
Percentage of total net revenue
|
27.4
|
%
|
36.2
|
%
|
||||||||||
The increase in sales, marketing and support expenses during 2017 compared to 2016 was driven by increased personnel-related expenses of $7.4 million, driven by higher headcount, offset by lower professional services costs, creator related expenses and advertising spend as we leveraged our low-cost customer acquisition channels, such as word of mouth referrals, converting free creators to paid creators and converting attendees into creators.
General and administrative
|
Year Ended December 31,
|
Change
|
|||||||||||||
|
2017
|
2016
|
$
|
%
|
|||||||||||
|
(in thousands, except percentages)
|
||||||||||||||
|
General and administrative
|
$
|
67,559
|
|
$
|
41,749
|
|
$
|
25,810
|
|
61.8
|
%
|
|||
|
Percentage of total net revenue
|
33.5
|
%
|
31.3
|
%
|
||||||||||
The increase in general and administrative expenses during 2017 compared to 2016 was a result of several factors. Third-party legal, finance, tax and business development costs increased $5.2 million, driven by acquisitions we completed in 2017 as well as costs incurred as we prepared to become a publicly-traded company. We also incurred direct and indirect acquisitions-related expenses of $7.3 million related to the Ticketfly and ticketscript acquisitions. The increase was also attributable to higher depreciation and amortization of $5.7 million, of which $4.8 million related to acquired intangible assets. There was also an increase in accrued sales taxes and VAT of $4.8 million driven by higher paid ticket volume in 2017 compared to 2016.
Interest expense
|
Year Ended December 31,
|
Change
|
|||||||||||||
|
2017
|
2016
|
$
|
%
|
|||||||||||
|
(in thousands, except percentages)
|
||||||||||||||
|
Interest expense
|
$
|
(6,462
|
)
|
$
|
(3,513
|
)
|
$
|
(2,949
|
)
|
83.9
|
%
|
|||
|
Percentage of total net revenue
|
(3.2
|
)%
|
(2.6
|
)%
|
||||||||||
The increase in interest expense during 2017 compared to 2016 was entirely driven interest bearing debt that was outstanding during 2017, related to promissory notes issued in connection with acquisitions and the term-debt draw under our WTI credit facilities. We did not have any outstanding debt prior to 2017. The interest expense recorded in 2016 is entirely related to our build-to-suit lease accounting for our office lease in San Francisco, California.
64
Change in fair value of redeemable convertible preferred stock warrant liability
|
Year Ended December 31,
|
Change
|
||||||||||||
|
2017
|
2016
|
$
|
%
|
||||||||||
|
(in thousands, except percentages)
|
|||||||||||||
|
Change in fair value of redeemable convertible preferred stock warrant liability
|
$
|
(2,200
|
)
|
$
|
—
|
|
$
|
2,200
|
|
*
|
|||
|
Percentage of total net revenue
|
(1.1
|
)%
|
—
|
%
|
|||||||||
________
* Not meaningful
The change in fair value of our redeemable convertible preferred stock warrant liability in 2017 was due to an increase in the underlying fair value of our redeemable convertible preferred stock. We did not have any redeemable convertible preferred stock warrants outstanding in 2016.
Other income (expense), net
|
Year Ended December 31,
|
Change
|
||||||||||||
|
2017
|
2016
|
$
|
%
|
||||||||||
|
(in thousands, except percentages)
|
|||||||||||||
|
Other income (expense), net
|
$
|
3,509
|
|
$
|
(1,695
|
)
|
$
|
5,204
|
|
*
|
|||
|
Percentage of total net revenue
|
1.7
|
%
|
(1.3
|
)%
|
|||||||||
________
* Not meaningful
The increase in other income (expense), net during 2017 compared to 2016 was driven by foreign currency rate measurement fluctuations. We recognized foreign currency rate measurement losses during 2016 as a result of an overall strengthening U.S. dollar compared to the currencies in which we operate and process transactions. During 2017, we recognized foreign currency rate measurement gains as a result of an overall weakening U.S. dollar compared to the currencies in which we operate and process transactions.
65
Quarterly Results of Operations Data
The following tables set forth our unaudited quarterly statements of operations data for each of the eight quarters in the period ended December 31, 2018. The information for each quarter has been prepared on a basis consistent with our audited consolidated financial statements included in this Annual Report on Form 10-K, and, in the opinion of management, includes all adjustments, which consist only of normal recurring adjustments, necessary for the fair statement of the results of operations for these periods. This data should be read in conjunction with our audited consolidated financial statements and related notes included in this Annual Report on Form 10-K. These quarterly results of operations are not necessarily indicative of the results we may achieve in any future period.
|
|
Three Months Ended
|
||||||||||||||||||||||||||||||
|
March 31, 2017
|
June 30, 2017
|
September 30, 2017
|
December 31, 2017
|
March 31, 2018
|
June 30, 2018
|
September 30, 2018
|
December 31, 2018
|
||||||||||||||||||||||||
|
(in thousands)
|
|||||||||||||||||||||||||||||||
|
Consolidated Statements of Operations
|
|||||||||||||||||||||||||||||||
|
Net revenue
|
$
|
43,351
|
|
$
|
44,802
|
|
$
|
50,749
|
|
$
|
62,695
|
|
$
|
74,526
|
|
$
|
67,542
|
|
$
|
73,628
|
|
$
|
75,915
|
|
|||||||
|
Cost of net revenue
(1)
|
17,157
|
|
18,145
|
|
20,993
|
|
25,372
|
|
28,084
|
|
29,863
|
|
31,477
|
|
31,229
|
|
|||||||||||||||
|
Gross profit
|
26,194
|
|
26,657
|
|
29,756
|
|
37,323
|
|
46,442
|
|
37,679
|
|
42,151
|
|
44,686
|
|
|||||||||||||||
|
Operating expenses
(1)
:
|
|||||||||||||||||||||||||||||||
|
Product development
|
5,458
|
|
6,023
|
|
9,351
|
|
9,776
|
|
8,834
|
|
10,981
|
|
12,856
|
|
13,400
|
|
|||||||||||||||
|
Sales, marketing and support
|
11,039
|
|
12,132
|
|
14,351
|
|
17,648
|
|
17,538
|
|
18,085
|
|
17,428
|
|
16,729
|
|
|||||||||||||||
|
General and administrative
|
13,112
|
|
13,434
|
|
16,479
|
|
24,534
|
|
23,161
|
|
21,833
|
|
24,921
|
|
23,867
|
|
|||||||||||||||
|
Total operating expenses
|
29,609
|
|
31,589
|
|
40,181
|
|
51,958
|
|
49,533
|
|
50,899
|
|
55,205
|
|
53,996
|
|
|||||||||||||||
|
Loss from operations
|
(3,415
|
)
|
(4,932
|
)
|
(10,425
|
)
|
(14,635
|
)
|
(3,091
|
)
|
(13,220
|
)
|
(13,054
|
)
|
(9,310
|
)
|
|||||||||||||||
|
Interest expense
|
(965
|
)
|
(993
|
)
|
(1,674
|
)
|
(2,830
|
)
|
(2,909
|
)
|
(3,190
|
)
|
(3,300
|
)
|
(1,896
|
)
|
|||||||||||||||
|
Change in fair value of redeemable convertible preferred stock warrant liability
|
—
|
|
—
|
|
(1,404
|
)
|
(796
|
)
|
(1,321
|
)
|
(4,750
|
)
|
(3,520
|
)
|
—
|
|
|||||||||||||||
|
Gain (loss) on debt extinguishment
|
—
|
|
—
|
|
—
|
|
—
|
|
16,995
|
|
—
|
|
(17,173
|
)
|
—
|
|
|||||||||||||||
|
Other income (expense), net
|
641
|
|
1,263
|
|
1,606
|
|
(1
|
)
|
(281
|
)
|
(3,013
|
)
|
1,414
|
|
(1,309
|
)
|
|||||||||||||||
|
Income (loss) before provision for (benefit from) income taxes
|
(3,739
|
)
|
(4,662
|
)
|
(11,897
|
)
|
(18,262
|
)
|
9,393
|
|
(24,173
|
)
|
(35,633
|
)
|
(12,515
|
)
|
|||||||||||||||
|
Income tax provision (benefit)
|
(18
|
)
|
(37
|
)
|
(40
|
)
|
82
|
|
370
|
|
430
|
|
(117
|
)
|
467
|
|
|||||||||||||||
|
Net income (loss)
|
$
|
(3,721
|
)
|
$
|
(4,625
|
)
|
$
|
(11,857
|
)
|
$
|
(18,344
|
)
|
$
|
9,023
|
|
$
|
(24,603
|
)
|
$
|
(35,516
|
)
|
$
|
(12,982
|
)
|
|||||||
|
(1) Amounts include stock-based compensation expense as follows:
|
|||||||||||||||||||||||||||||||
|
Three Months Ended
|
|||||||||||||||||||||||||||||||
|
March 31, 2017
|
June 30, 2017
|
September 30, 2017
|
December 31, 2017
|
March 31, 2018
|
June 30, 2018
|
September 30, 2018
|
December 31, 2018
|
||||||||||||||||||||||||
|
(in thousands)
|
|||||||||||||||||||||||||||||||
|
Cost of net revenue
|
$
|
32
|
|
$
|
33
|
|
$
|
35
|
|
$
|
100
|
|
$
|
53
|
|
$
|
71
|
|
$
|
154
|
|
$
|
151
|
|
|||||||
|
Product development
|
402
|
|
433
|
|
463
|
|
1,113
|
|
601
|
|
747
|
|
2,497
|
|
1,968
|
|
|||||||||||||||
|
Sales, marketing and support
|
310
|
|
463
|
|
406
|
|
1,184
|
|
714
|
|
864
|
|
1,151
|
|
841
|
|
|||||||||||||||
|
General and administrative
|
1,061
|
|
1,027
|
|
1,042
|
|
2,754
|
|
1,492
|
|
3,566
|
|
11,247
|
|
4,114
|
|
|||||||||||||||
|
Total stock-based compensation
|
$
|
1,805
|
|
$
|
1,956
|
|
$
|
1,946
|
|
$
|
5,151
|
|
$
|
2,860
|
|
$
|
5,248
|
|
$
|
15,049
|
|
$
|
7,074
|
|
|||||||
66
|
Three Months Ended
|
|||||||||||||||||||||||
|
March 31, 2017
|
June 30, 2017
|
September 30, 2017
|
December 31, 2017
|
March 31, 2018
|
June 30, 2018
|
September 30, 2018
|
December 31, 2018
|
||||||||||||||||
|
Percentage of Net Revenue
|
|||||||||||||||||||||||
|
Net revenue
|
100.0
|
%
|
100.0
|
%
|
100.0
|
%
|
100.0
|
%
|
100.0
|
%
|
100.0
|
%
|
100.0
|
%
|
100.0
|
%
|
|||||||
|
Cost of net revenue
|
39.6
|
|
40.5
|
|
41.4
|
|
40.5
|
|
37.7
|
|
44.2
|
|
42.8
|
|
41.1
|
|
|||||||
|
Gross profit
|
60.4
|
|
59.5
|
|
58.6
|
|
59.5
|
|
62.3
|
|
55.8
|
|
57.2
|
|
58.9
|
|
|||||||
|
Operating expenses:
|
—
|
|
|||||||||||||||||||||
|
Product development
|
12.6
|
|
13.4
|
|
18.4
|
|
15.6
|
|
11.9
|
|
16.3
|
|
17.5
|
|
17.7
|
|
|||||||
|
Sales, marketing and support
|
25.5
|
|
27.1
|
|
28.3
|
|
28.1
|
|
23.5
|
|
26.8
|
|
23.7
|
|
22.0
|
|
|||||||
|
General and administrative
|
30.2
|
|
30.0
|
|
32.5
|
|
39.1
|
|
31.1
|
|
32.3
|
|
33.8
|
|
31.4
|
|
|||||||
|
Total operating expenses
|
68.3
|
|
70.5
|
|
79.2
|
|
82.9
|
|
66.5
|
|
75.4
|
|
75.0
|
|
71.1
|
|
|||||||
|
Loss from operations
|
(7.9
|
)
|
(11.0
|
)
|
(20.5
|
)
|
(23.3
|
)
|
(4.1
|
)
|
(19.6
|
)
|
(17.7
|
)
|
(12.3
|
)
|
|||||||
|
Interest expense
|
(2.2
|
)
|
(2.2
|
)
|
(3.3
|
)
|
(4.5
|
)
|
(3.9
|
)
|
(4.7
|
)
|
(4.5
|
)
|
(2.5
|
)
|
|||||||
|
Change in fair value of redeemable convertible preferred stock warrant liability
|
—
|
|
—
|
|
(2.8
|
)
|
(1.3
|
)
|
(1.8
|
)
|
(7.0
|
)
|
(4.8
|
)
|
—
|
|
|||||||
|
Gain (loss) on debt extinguishment
|
—
|
|
—
|
|
—
|
|
—
|
|
22.8
|
|
—
|
|
(23.3
|
)
|
—
|
|
|||||||
|
Other income (expense), net
|
1.5
|
|
2.8
|
|
3.2
|
|
—
|
|
(0.4
|
)
|
(4.5
|
)
|
1.9
|
|
(1.7
|
)
|
|||||||
|
Income (loss) before provision for (benefit from) income taxes
|
(8.6
|
)
|
(10.4
|
)
|
(23.4
|
)
|
(29.1
|
)
|
12.6
|
|
(35.8
|
)
|
(48.4
|
)
|
(16.5
|
)
|
|||||||
|
Income tax provision (benefit)
|
—
|
|
(0.1
|
)
|
(0.1
|
)
|
0.1
|
|
0.5
|
|
0.6
|
|
(0.2
|
)
|
0.6
|
|
|||||||
|
Net income (loss)
|
(8.6
|
)%
|
(10.3
|
)%
|
(23.3
|
)%
|
(29.2
|
)%
|
12.1
|
%
|
(36.4
|
)%
|
(48.2
|
)%
|
(17.1
|
)%
|
|||||||
The following table presents our paid ticket volume for each of the periods indicated:
|
Three Months Ended
|
|||||||||||||||||||||||
|
March 31, 2017
|
June 30, 2017
|
September 30, 2017
|
December 31, 2017
|
March 31, 2018
|
June 30, 2018
|
September 30, 2018
|
December 31, 2018
|
||||||||||||||||
|
(in thousands)
|
|||||||||||||||||||||||
|
Paid Tickets
|
14,669
|
|
15,605
|
|
18,074
|
|
22,698
|
|
23,598
|
|
23,099
|
|
23,896
|
|
26,702
|
|
|||||||
The following table presents a reconciliation of net income (loss) to Adjusted EBITDA for each of the periods indicated:
|
|
Three Months Ended
|
||||||||||||||||||||||||||||||
|
March 31, 2017
|
June 30, 2017
|
September 30, 2017
|
December 31, 2017
|
March 31, 2018
|
June 30, 2018
|
September 30, 2018
|
December 31, 2018
|
||||||||||||||||||||||||
|
(in thousands)
|
|||||||||||||||||||||||||||||||
|
Net income (loss)
|
$
|
(3,721
|
)
|
$
|
(4,625
|
)
|
$
|
(11,857
|
)
|
$
|
(18,344
|
)
|
$
|
9,023
|
|
$
|
(24,603
|
)
|
$
|
(35,516
|
)
|
$
|
(12,982
|
)
|
|||||||
|
Add:
|
|||||||||||||||||||||||||||||||
|
Depreciation and amortization
|
2,775
|
|
3,186
|
|
5,090
|
|
8,367
|
|
8,202
|
|
8,580
|
|
8,830
|
|
8,996
|
|
|||||||||||||||
|
Stock-based compensation
|
1,805
|
|
1,956
|
|
1,946
|
|
5,151
|
|
2,860
|
|
5,248
|
|
15,049
|
|
7,074
|
|
|||||||||||||||
|
Interest expense
|
965
|
|
993
|
|
1,674
|
|
2,830
|
|
2,909
|
|
3,190
|
|
3,300
|
|
1,896
|
|
|||||||||||||||
|
Change in fair value of redeemable convertible preferred stock warrant liability
|
—
|
|
—
|
|
1,404
|
|
796
|
|
1,321
|
|
4,750
|
|
3,520
|
|
—
|
|
|||||||||||||||
|
(Gain) loss on debt extinguishment
|
—
|
|
—
|
|
—
|
|
—
|
|
(16,995
|
)
|
—
|
|
17,173
|
|
—
|
|
|||||||||||||||
|
Direct and indirect acquisition related costs
|
1,097
|
|
1,228
|
|
4,406
|
|
606
|
|
823
|
|
622
|
|
611
|
|
545
|
|
|||||||||||||||
|
Other income (expense), net
|
(641
|
)
|
(1,263
|
)
|
(1,606
|
)
|
1
|
|
281
|
|
3,013
|
|
(1,414
|
)
|
1,309
|
|
|||||||||||||||
|
Income tax provision (benefit)
|
(18
|
)
|
(37
|
)
|
(40
|
)
|
82
|
|
370
|
|
430
|
|
(117
|
)
|
467
|
|
|||||||||||||||
|
Adjusted EBITDA
|
$
|
2,262
|
|
$
|
1,438
|
|
$
|
1,017
|
|
$
|
(511
|
)
|
$
|
8,794
|
|
$
|
1,230
|
|
$
|
11,436
|
|
$
|
7,305
|
|
|||||||
67
The following table presents a reconciliation of free cash flow, which is computed on a trailing twelve-month basis, from net cash provided by operating activities for each of the periods indicated:
|
|
Twelve Months Ended
|
||||||||||||||||||||||||||||||
|
March 31, 2017
|
June 30, 2017
|
September 30, 2017
|
December 31, 2017
|
March 31, 2018
|
June 30, 2018
|
September 30, 2018
|
December 31, 2018
|
||||||||||||||||||||||||
|
(in thousands)
|
|||||||||||||||||||||||||||||||
|
Net cash provided by operating activities
|
$
|
20,754
|
|
$
|
17,268
|
|
$
|
42,794
|
|
$
|
29,821
|
|
$
|
38,977
|
|
$
|
24,554
|
|
$
|
6,148
|
|
$
|
7,162
|
|
|||||||
|
Purchases of property and equipment and capitalized internal-use software development costs
|
(8,790
|
)
|
(8,716
|
)
|
(8,414
|
)
|
(8,678
|
)
|
(9,703
|
)
|
(11,392
|
)
|
(12,369
|
)
|
(12,650
|
)
|
|||||||||||||||
|
Free cash flow
|
$
|
11,964
|
|
$
|
8,552
|
|
$
|
34,380
|
|
$
|
21,143
|
|
$
|
29,274
|
|
$
|
13,162
|
|
$
|
(6,221
|
)
|
$
|
(5,488
|
)
|
|||||||
Quarterly Trends
Net revenue
Our quarterly net revenue increased sequentially for all periods presented, except the second quarter of 2018, primarily due to increases in paid ticket volume, including the impact of our acquisitions. Historically, excluding the impact of acquired businesses, we have experienced a higher increase in sequential net revenue growth in the first quarter of a year compared to the sequential net revenue growth in other quarters of that year. We acquired Ticketscript in the first quarter of 2017 and Ticketfly in the third quarter of 2018. The decrease in quarterly net revenue in the second quarter of 2018 was a result of the contra-revenue amount of $6.3 million which we recognized related to the Ticketfly cyber incident.
Cost of net revenue
Our quarterly cost of net revenue increased for all periods presented, except the fourth quarter of 2018, primarily due to increases in payment processing costs resulting from our paid ticket volume growth.
Operating expenses
Our operating expenses increased for all periods presented, except for the first and fourth quarters of 2018, primarily due to increases in compensation and benefits driven by increases in headcount. In the fourth quarter of 2017, we recognized higher stock-based compensation expense across all operating expense categories as a result of the immediate vesting of certain awards granted to employees hired in connection with the Ticketfly acquisition, which was the primary driver of the decrease in operating expenses from the fourth quarter of 2017 to the first quarter of 2018.In the third quarter of 2018, we recognized $6.9 million in stock-based compensation expense related to the vesting of a stock award as a result of our IPO, which was the primary driver of the decrease in operating expenses from the third quarter of 2018 to the fourth quarter of 2018.
Liquidity and Capital Resources
As of
December 31, 2018
, we had cash of
$437.9 million
and funds receivable of
$58.7 million
. Our cash includes bank deposits held by financial institutions and is held for working capital purposes. Our funds receivable represents cash-in-transit from credit card processors that is received to our bank accounts within five business days of the underlying ticket transaction. Collectively, our cash and funds receivable balances represent a mix of cash that belongs to us and cash that is due to the creator. The amounts due to creators, which was
$272.2 million
as of
December 31, 2018
, are captioned on our consolidated balance sheets as accounts payable, creators.
We also make payments to creators to provide the creator with short-term liquidity in advance of ticket sales. These are classified as creator advances, net, on our consolidated balance sheets. Creator advances are recovered by us as tickets are sold by the respective creator, and are expected to be recovered within 12 months of the payment date. We maintain an allowance for estimated creator advances that are not recoverable and nets this against the balance shown in assets. Creator advances, net was
$21.3 million
and
$17.6 million
as of
December 31, 2018
and 2017, respectively. Creator advances that are not expected to be recovered within 12 months are classified as creator advances, noncurrent. Such balances were
$1.9 million
and
$2.4 million
as of December 31, 2018 and 2017, respectively.
In September 2018, upon the completion of our IPO, we received aggregate proceeds of
$246.0 million
, net of underwriter discounts and commissions, before deducting offering costs of
$5.5 million
, net of reimbursements.
68
Since our inception, and prior to our IPO, we financed our operations and capital expenditures primarily through the issuance of unregistered redeemable convertible preferred stock and common stock, cash flows generated by operations and issuances of debt.
In September 2018, we entered into the New Credit Facilities. The New Term Loans were fully funded in September 2018 and we received cash proceeds of $73.6 million, net of arrangement fees of $1.1 million and upfront fees of $0.3 million. We have made no draw on the revolving credit line as of December 31, 2018.
The New Term Loans amortizes at a rate of 7.5% per annum for the first two years of the New Credit Facilities, 10.0% per annum for the third and fourth years and the first three quarters of the fifth year of the New Credit Facilities, with the balance due at maturity. The New Term Loans and the New Revolving Credit Facility are each expected to mature on the fifth anniversary of the effectiveness of the New Credit Facilities. The New Revolving Credit Facility has a commitment fee, which currently accrues at
0.40%
on the daily unused amount of the aggregate revolving commitments of the lenders.
Borrowings under the New Credit Facilities bear interest at a rate equal to an applicable margin between 2.25% and 2.75% in the case of eurocurrency loans or between 1.25% and 1.75% in the case of base rate loans, in each case determined on a quarterly basis based on our consolidated total leverage ratio, plus, at our option, either a base rate or a eurocurrency rate calculated in a customary manner.
The New Credit Facilities contain customary conditions to borrowing, events of default, and covenants. Financial covenants include maintaining a (i) maximum total leverage ratio; (ii) minimum consolidated interest coverage ratio; and (iii) minimum liquidity ratio. These financial covenants will first be tested for the three months ending December 31, 2018.
We believe that our existing cash, together with cash generated from operations and amounts available under our New Revolving Credit Facility, will be sufficient to meet our anticipated cash needs for at least the next 12 months. However, our liquidity assumptions may prove to be incorrect, and we could exhaust our available financial resources sooner than we currently expect. We may seek to raise additional funds at any time through debt, equity and equity-linked arrangements.
As of
December 31, 2018
, approximately
37.1%
of our cash was held outside of the United States, which was held primarily on behalf of, and to be remitted to, creators and to fund our foreign operations. We do not expect to incur significant taxes related to these amounts.
Cash Flows
Our cash flow activities were as follows for the periods presented:
|
Year Ended December 31,
|
|||||||||||
|
2018
|
2017
|
2016
|
|||||||||
|
(in thousands)
|
|||||||||||
|
Net cash provided by (used in):
|
|||||||||||
|
Operating activities
|
$
|
7,162
|
|
$
|
29,821
|
|
$
|
2,785
|
|
||
|
Investing activities
|
(39
|
)
|
(140,652
|
)
|
(10,159
|
)
|
|||||
|
Financing activities
|
240,056
|
|
159,514
|
|
2,325
|
|
|||||
|
Net increase (decrease) in cash and restricted cash
|
$
|
247,179
|
|
$
|
48,683
|
|
$
|
(5,049
|
)
|
||
69
Comparison of Years Ended December 31, 2018, 2017 and 2016
Cash Flows from Operating Activities
The net cash provided by operating activities of
$7.2 million
for the year ended
December 31, 2018
was due primarily to a net loss of
$64.1 million
with adjustments for depreciation and amortization of
$34.6 million
, stock-based compensation expense of
$30.2 million
, amortization of creator signing fees of
$7.1 million
, change in fair value of redeemable convertible preferred stock warrant liability of
$9.6 million
and a change in fair value of term loan embedded derivatives of
$2.1 million
. Additionally, there was an increase in accounts payable to creators of
$24.5 million
due to increases in paid tickets, an increase in other accrued liabilities of
$4.3 million
, partially offset by a decrease in accrued taxes of
$9.4 million
, an increase in creator signing fees, net of
$16.0 million
and an increase in creator advances, net of
$5.3 million
. The increases in creator signing fees, net, and creator advances, net, are due to increases in our sales contracting with creators.
The net cash provided by operating activities of
$29.8 million
for the year ended
December 31, 2017
was due primarily to a net loss of
$38.5 million
with adjustments for depreciation and amortization of
$19.4 million
, stock-based compensation expense of
$10.9 million
and amortization of creator signing fees of
$4.3 million
. Additionally, there was an increase in accounts payable to creators of
$52.8 million
due to increases in paid tickets, an increase in accrued taxes of
$10.7 million
, partially offset by an increase in funds receivable of
$18.1 million
, increases in creator signing fees, net of
$8.6 million
and creator advances, net of
$5.8 million
. The increases in creator signing fees, net, and creator advances, net, are due to increases in our sales contracting with creators.
The net cash provided by operating activities of
$2.8 million
for the year ended December 31, 2016 was due primarily to a net loss of
$40.4 million
with adjustments for depreciation and amortization of
$7.6 million
, stock-based compensation expense of
$8.5 million
and amortization of creator signing fees of
$2.7 million
. Additionally, there was an increase in accounts payable to creators of
$37.1 million
due to increases in paid tickets, an increase in accrued taxes of
$3.7 million
, partially offset by an increase in funds receivable of
$9.9 million
, increases in creator signing fees, net of
$6.0 million
and creator advances, net of
$4.6 million
. The increases in creator signing fees, net, and creator advances, net, are due to increases in our sales contracting with creators.
Cash Flows from Investing Activities
The net cash used in investing activities of
$39 thousand
for the year ended
December 31, 2018
was due to net cash provided from acquisitions of
$12.6 million
, driven by net cash acquired from Ticketea of
$13.9 million
, partially offset by capitalized software development costs of
$7.2 million
and purchases of property and equipment of
$5.4 million
.
The net cash used in investing activities of
$140.7 million
for the year ended
December 31, 2017
was due to
$132.0 million
net cash paid for the acquisitions of ticketscript and Ticketfly, capitalized software development costs of
$6.1 million
and
$2.5 million
paid for purchases of property and equipment.
The net cash used in investing activities of
$10.2 million
for the year ended December 31, 2016 was due to
$1.7 million
net cash paid for the acquisitions of ticketscript and Ticketfly, capitalized software development costs of
$5.5 million
and
$3.0 million
paid for purchases of property and equipment.
Cash Flows from Financing Activities
The net cash provided by financing activities of
$240.1 million
during the year ended
December 31, 2018
was due primarily to
$241.0 million
in aggregate proceeds from the completion of our IPO, net of underwriters' discounts and offering costs,
$118.6 million
in proceeds from term loans and
$8.1 million
in proceeds from exercise of stock options. These inflows were offset by
$111.1 million
in principal payments on our debt obligations,
$6.8 million
in prepayment penalties resulting from the extinguishment of our WTI Loan Facilities and
$9.0 million
in taxes paid related to the net share settlement of equity awards.
The net cash provided by financing activities totaled
$159.5 million
during the year ended
December 31, 2017
and was driven by
$133.9 million
received related to the issuance of our Series G redeemable convertible preferred stock, net of issuance costs,
$30.0 million
in proceeds from drawing funds under our First WTI Loan Facility,
$2.3 million
excess tax benefit from stock-based compensation awards,
$1.8 million
cash proceeds from stock option exercises, partially offset by principal payments on debt obligations of
$7.8 million
.
The net cash provided by financing activities totaled
$2.3 million
during the year ended December 31, 2016 was due to,
$2.9 million
cash proceeds from stock option exercises.
70
Concentrations of Credit Risk
As of
December 31, 2018
and December 31, 2017, there were no customers that represented 10% or more of our accounts receivable balance. There were no customers that individually exceeded 10% of our net revenue during the years ended
December 31, 2018
and 2017.
Contractual Obligations and Commitments
Our principal commitments consist of debt, capital commitments to creators, rental payments under our build-to-suit lease, operating leases, purchase commitments and capital leases. The following table summarizes our commitments to settle contractual obligations as of
December 31, 2018
:
|
Payments due by Period
|
|||||||||||||||||||
|
Total
|
Less than
1 year |
Between
1-3 years |
Between
3-5 years |
More Than 5 Years
|
|||||||||||||||
|
(in thousands)
|
|||||||||||||||||||
|
Term loan
|
$
|
73,594
|
|
$
|
5,625
|
|
$
|
14,063
|
|
$
|
53,906
|
|
$
|
—
|
|
||||
|
Future creator signing fees and creator advances
|
12,311
|
|
8,328
|
|
3,964
|
|
19
|
|
—
|
|
|||||||||
|
Build-to-suit lease obligation
|
13,318
|
|
5,604
|
|
7,714
|
|
—
|
|
—
|
|
|||||||||
|
Operating leases
|
13,675
|
|
2,514
|
|
4,230
|
|
3,161
|
|
3,770
|
|
|||||||||
|
Sublease income
|
(9,173
|
)
|
(4,003
|
)
|
(5,170
|
)
|
—
|
|
—
|
|
|||||||||
|
Purchase commitments
|
7,500
|
|
3,500
|
|
4,000
|
|
—
|
|
—
|
|
|||||||||
|
Total
|
$
|
111,225
|
|
$
|
21,568
|
|
$
|
28,801
|
|
$
|
57,086
|
|
$
|
3,770
|
|
||||
Term Loans
In September 2018, we fully repaid the WTI Loan Facilities and extinguished the existing debt for a total cash payment of $81.6 million. As of December 31, 2018, there are no amounts outstanding under the WTI Loan Facilities and all underlying agreements have been terminated.
In September 2018, we entered into the New Credit Facilities. The New Term Loans were fully funded in September 2018 and we received cash proceeds of $73.6 million, net of arrangement fees of $1.1 million and upfront fees of $0.3 million. We have made no draw on the revolving credit line as of December 31, 2018.
The New Term Loans amortizes at a rate of 7.5% per annum for the first two years of the New Credit Facilities, 10.0% per annum for the third and fourth years and the first three quarters of the fifth year of the New Credit Facilities, with the balance due at maturity. The New Term Loans and the New Revolving Credit Facility are each expected to mature on the fifth anniversary of the effectiveness of the New Credit Facilities.
Lease Commitments
We have entered into various non-cancelable leases for certain offices with contractual lease periods expiring between 2018 and 2023.
In 2014, we undertook a series of structural improvements to the floors that we occupied in our corporate headquarters in San Francisco. As a result of the requirement to fund construction costs and due to certain structural improvements that were made by us, we were considered the deemed owner of the leased floors for accounting purposes. Due to the presence of a standby letter of credit as a security deposit, we were deemed to have continuing involvement after the construction period. As such, we accounted for this arrangement as owned real estate. Legally, we do not own the floors that we have leased in the building, the property owner owns the floors. However, accounting rules require that we record an imputed financing obligation for our obligation to the legal owners as well as an asset for the fair value of the leased floors. Under these accounting rules, our monthly rental payments are allocated to (1) interest expense, (2) ground rent expense and (3) a reduction of the principal of the imputed financing obligation. We recorded interest expense related to this financing obligation for each of the years ended
December 31, 2018
and 2017. The lease financing obligation was
$28.5 million
and
$29.5 million
as of
December 31, 2018
and 2017, respectively, and the net book value of the asset as of those dates was $
28.4
million and $
29.2
million, respectively. See Note 9 to our consolidated financial statements for additional details.
71
In May 2018, we entered into a ten year lease for office space in Cork, Ireland. Monthly rent payments are due beginning in January 2019 and will total approximately $0.4 million per year and are included in the table above. The lease expires in 2028.
Off-Balance Sheet Arrangements
We do not currently have any off-balance sheet arrangements and did not have any such arrangements during 2017 or during the year ended
December 31, 2018
.
Critical Accounting Policies and Estimates
Our discussion and analysis of our financial condition and results of operations are based upon our consolidated financial statements, which have been prepared in accordance with GAAP. GAAP requires us to make certain estimates and judgments that affect the amounts reported in our consolidated financial statements related disclosures. Our estimates are based on historical experience and various other assumptions that we believe to be reasonable under the circumstances. We evaluate our estimates and assumptions on an ongoing basis and our actual results could differ from these estimates. There have been no material changes to our critical accounting policies and significant judgments as compared to the critical accounting policies and estimates disclosed in the Prospectus.
Recent Accounting Pronouncements
Refer to Note 2 of our Notes to our Consolidated Financial Statements included in Part II, Item 8, "Financial Statements and Supplementary Data" of this Annual Report on Form 10-K for more information.
72
Item 7A. Quantitative and Qualitative Disclosures About Market Risk
Interest Rate Sensitivity
Interest expense related to our outstanding debt as of December 31, 2018 is related to fixed rate debt and interest expense related to the build-to-suit lease and is not sensitive to movements in interest rates. A 10% increase or decrease in interest rates would not have a material effect on our interest expense.
Foreign Currency Risk
Many of our event organizers live or operate outside the United States, and therefore we have significant ticket sales denominated in foreign currencies, most notably the British Pound, Euro, Canadian Dollar, Australian Dollar, Brazilian Real and Argentinian Peso. If currency exchange rates remain at current levels, currency translation could continue to negatively affect net revenue growth for events that are not listed in U.S. dollars and could also reduce the demand for U.S. dollar denominated events from attendees outside of the United States. Because the functional currency of our foreign subsidiaries is the U.S. dollar, fluctuations due to changes in currency exchange rates cause us to recognize transaction gains and losses in our statement of operations. A 10% increase or decrease in current exchange rates would not have a material impact on our consolidated results of operations.
73
Item 8. Financial Statements and Supplementary Data
Eventbrite, Inc.
Index to Consolidated Financial Statements
|
Page
|
|
The supplementary financial information required by this Item 8, is included in Part II, Item 7, Management’s Discussion and Analysis of Financial Condition and Results of Operations, under the caption “Quarterly Results of Operations Data,” which is incorporated herein by reference.
74
REPORT OF INDEPENDENT REGISTERED PUBLIC ACCOUNTING FIRM
Report of Independent Registered Public Accounting Firm
To
the
Board of Directors and Stockholders of Eventbrite Inc.
Opinion on the Financial Statements
We have audited the accompanying consolidated balance sheets of Eventbrite Inc. and its subsidiaries (the “Company”) as of December 31, 2018 and 2017, and the related consolidated statements of operations, of redeemable convertible preferred stock and stockholders’ equity (deficit) and of cash flows for each of the three years in the period ended December 31, 2018, including the related notes (collectively referred to as the “consolidated financial statements”). In our opinion, the consolidated financial statements present fairly, in all material respects, the financial position of the Company as of December 31, 2018 and 2017, and the results of its operations and its cash flows for each of the three years in the period ended December 31, 2018 in conformity with accounting principles generally accepted in the United States of America.
Basis for Opinion
These consolidated financial statements are the responsibility of the Company’s management. Our responsibility is to express an opinion on the Company’s consolidated financial statements based on our audits. We are a public accounting firm registered with the Public Company Accounting Oversight Board (United States) (PCAOB) and are required to be independent with respect to the Company in accordance with the U.S. federal securities laws and the applicable rules and regulations of the Securities and Exchange Commission and the PCAOB.
We conducted our audits of these consolidated financial statements in accordance with the standards of the PCAOB. Those standards require that we plan and perform the audit to obtain reasonable assurance about whether the consolidated financial statements are free of material misstatement, whether due to error or fraud.
Our audits included performing procedures to assess the risks of material misstatement of the consolidated financial statements, whether due to error or fraud, and performing procedures that respond to those risks. Such procedures included examining, on a test basis, evidence regarding the amounts and disclosures in the consolidated financial statements. Our audits also included evaluating the accounting principles used and significant estimates made by management, as well as evaluating the overall presentation of the consolidated financial statements. We believe that our audits provide a reasonable basis for our opinion.
/s/PricewaterhouseCoopers LLP
San Jose, California
March 7, 2019
We have served as the Company's auditor since 2014
75
EVENTBRITE, INC.
CONSOLIDATED BALANCE SHEETS
(In thousands, except share and per share data)
|
December 31,
|
|||||||
|
2018
|
2017
|
||||||
|
Assets
|
|||||||
|
Current assets
|
|||||||
|
Cash and cash equivalents
|
$
|
437,892
|
|
$
|
188,986
|
|
|
|
Funds receivable
|
58,697
|
|
51,639
|
|
|||
|
Accounts receivable, net
|
4,069
|
|
2,885
|
|
|||
|
Creator signing fees, net
|
7,324
|
|
4,235
|
|
|||
|
Creator advances, net
|
21,255
|
|
17,641
|
|
|||
|
Prepaid expenses and other current assets
|
16,467
|
|
10,662
|
|
|||
|
Total current assets
|
545,704
|
|
276,048
|
|
|||
|
Property, plant and equipment, net
|
44,219
|
|
42,492
|
|
|||
|
Goodwill
|
170,560
|
|
158,766
|
|
|||
|
Acquired intangible assets, net
|
59,973
|
|
79,541
|
|
|||
|
Restricted cash
|
1,508
|
|
3,235
|
|
|||
|
Creator signing fees, noncurrent
|
9,681
|
|
6,186
|
|
|||
|
Creator advances, noncurrent
|
1,887
|
|
2,435
|
|
|||
|
Other assets
|
3,352
|
|
2,134
|
|
|||
|
Total assets
|
$
|
836,884
|
|
$
|
570,837
|
|
|
|
Liabilities, Redeemable Convertible Preferred Stock and Stockholders’ Equity (Deficit)
|
|||||||
|
Current liabilities
|
|||||||
|
Accounts payable, creators
|
$
|
272,201
|
|
$
|
228,007
|
|
|
|
Accounts payable, trade
|
1,028
|
|
1,481
|
|
|||
|
Accrued compensation and benefits
|
5,586
|
|
3,535
|
|
|||
|
Accrued taxes
|
8,028
|
|
2,615
|
|
|||
|
Current portion of term loans
|
5,635
|
|
—
|
|
|||
|
Other accrued liabilities
|
15,726
|
|
10,544
|
|
|||
|
Total current liabilities
|
308,204
|
|
246,182
|
|
|||
|
Build-to-suit lease financing obligation
|
28,510
|
|
29,494
|
|
|||
|
Accrued taxes
|
15,691
|
|
30,047
|
|
|||
|
Redeemable convertible preferred stock warrant liability
|
—
|
|
7,271
|
|
|||
|
Promissory note
|
—
|
|
51,082
|
|
|||
|
Term loans
|
67,087
|
|
26,669
|
|
|||
|
Other liabilities
|
2,170
|
|
1,888
|
|
|||
|
Total liabilities
|
421,662
|
|
392,633
|
|
|||
|
Commitments and contingencies (Note 9)
|
|
|
|||||
|
Redeemable convertible preferred stock, $0.00001 par value; no shares authorized, issued or outstanding as of December 31, 2018; 42,452,188 shares authorized, 41,628,207 shares issued and outstanding, $401,372 liquidation preference as of December 31, 2017
|
—
|
|
|
334,018
|
|
||
|
Stockholders’ equity (deficit):
|
|||||||
|
Preferred stock, $0.00001 par value; 100,000,000 shares authorized, no shares issued or outstanding as of December 31, 2018 and 2017
|
—
|
|
—
|
|
|||
|
Common stock, $0.00001 par value; 1,100,000,000 shares authorized, 78,546,874 shares issued and 78,358,394 shares outstanding as of December 31, 2018; 92,057,771 shares authorized, 20,961,921 shares issued and 20,773,441 shares outstanding as of December 31, 2017
|
—
|
|
—
|
|
|||
|
Treasury stock at cost, 188,480 shares as of December 31, 2018 and 2017
|
(488
|
)
|
(488
|
)
|
|||
|
Additional paid-in capital
|
718,405
|
|
83,291
|
|
|||
|
Accumulated deficit
|
(302,695
|
)
|
(238,617
|
)
|
|||
|
Total stockholders’ equity (deficit)
|
415,222
|
|
(155,814
|
)
|
|||
|
Total liabilities, redeemable convertible preferred stock and stockholders’ equity (deficit)
|
$
|
836,884
|
|
$
|
570,837
|
|
|
(See accompanying Notes to Consolidated Financial Statements)
76
EVENTBRITE, INC.
CONSOLIDATED STATEMENTS OF OPERATIONS
(in thousands, except per share data)
|
Year Ended December 31,
|
|||||||||||
|
2018
|
2017
|
2016
|
|||||||||
|
Net revenue
|
$
|
291,611
|
|
$
|
201,597
|
|
$
|
133,499
|
|
||
|
Cost of net revenue
(1)
|
120,653
|
|
81,667
|
|
55,689
|
|
|||||
|
Gross profit
|
170,958
|
|
119,930
|
|
77,810
|
|
|||||
|
Operating expenses
(1)
:
|
|||||||||||
|
Product development
|
46,071
|
|
30,608
|
|
22,723
|
|
|||||
|
Sales, marketing and support
|
69,780
|
|
55,170
|
|
48,391
|
|
|||||
|
General and administrative
|
93,782
|
|
67,559
|
|
41,749
|
|
|||||
|
Total operating expenses
|
209,633
|
|
153,337
|
|
112,863
|
|
|||||
|
Loss from operations
|
(38,675
|
)
|
(33,407
|
)
|
(35,053
|
)
|
|||||
|
Interest expense
|
(11,295
|
)
|
(6,462
|
)
|
(3,513
|
)
|
|||||
|
Change in fair value of redeemable convertible preferred
stock warrant liability |
(9,591
|
)
|
(2,200
|
)
|
—
|
|
|||||
|
Loss on debt extinguishment
|
(178
|
)
|
—
|
|
—
|
|
|||||
|
Other income (expense), net
|
(3,189
|
)
|
3,509
|
|
(1,695
|
)
|
|||||
|
Loss before provision for (benefit from) income taxes
|
(62,928
|
)
|
(38,560
|
)
|
(40,261
|
)
|
|||||
|
Income tax provision (benefit)
|
1,150
|
|
(13
|
)
|
131
|
|
|||||
|
Net loss
|
$
|
(64,078
|
)
|
$
|
(38,547
|
)
|
$
|
(40,392
|
)
|
||
|
Net loss per share, basic and diluted
|
$
|
(1.71
|
)
|
$
|
(1.98
|
)
|
$
|
(2.48
|
)
|
||
|
Weighted-average number of shares outstanding used to compute net loss per share, basic and diluted
|
37,540
|
|
19,500
|
|
16,291
|
|
|||||
|
(1) Amounts includes stock-based compensation as follows:
|
|
|
|
|
|
||||||
|
|
Year Ended December 31,
|
||||||||||
|
|
2018
|
|
2017
|
|
2016
|
||||||
|
Cost of net revenue
|
$
|
429
|
|
|
$
|
200
|
|
|
$
|
134
|
|
|
Product development
|
5,813
|
|
|
2,411
|
|
|
2,020
|
|
|||
|
Sales, marketing and support
|
3,570
|
|
|
2,364
|
|
|
1,767
|
|
|||
|
General and administrative
|
20,419
|
|
|
5,883
|
|
|
4,610
|
|
|||
|
Total stock-based compensation
|
$
|
30,231
|
|
|
$
|
10,858
|
|
|
$
|
8,531
|
|
(See accompanying Notes to Consolidated Financial Statements)
77
EVENTBRITE, INC.
Consolidated Statements of Redeemable Convertible Preferred Stock and Stockholders’ Equity (Deficit)
(in thousands, except share data)
|
Redeemable
Convertible Preferred Stock |
Common Stock-Class A
|
Common Stock-Class B
|
Treasury Stock
|
Additional
Paid-In Capital |
Accumulated
Deficit |
Total Stockholders’ Equity (Deficit)
|
|||||||||||||||||||||||||||||||||
|
Shares
|
Amount
|
Shares
|
Amount
|
Shares
|
Amount
|
Shares
|
Amount
|
||||||||||||||||||||||||||||||||
|
January 1, 2016
|
33,446,250
|
|
$
|
200,082
|
|
—
|
|
$
|
—
|
|
16,022,200
|
|
$
|
—
|
|
(188,480
|
)
|
$
|
(488
|
)
|
$
|
40,153
|
|
$
|
(159,678
|
)
|
$
|
(120,013
|
)
|
||||||||||
|
Issuance of common stock upon exercise of stock options
|
—
|
|
—
|
|
—
|
|
—
|
|
599,180
|
|
—
|
|
—
|
|
—
|
|
1,439
|
|
—
|
|
1,439
|
|
|||||||||||||||||
|
Issuance of common stock for acquisitions
|
—
|
|
—
|
|
—
|
|
—
|
|
72,000
|
|
—
|
|
—
|
|
—
|
|
478
|
|
—
|
|
478
|
|
|||||||||||||||||
|
Vesting of early exercised options
|
—
|
|
—
|
|
—
|
|
—
|
|
—
|
|
—
|
|
—
|
|
—
|
|
305
|
|
—
|
|
305
|
|
|||||||||||||||||
|
Stock-based compensation
|
—
|
|
—
|
|
—
|
|
—
|
|
—
|
|
—
|
|
—
|
|
—
|
|
9,099
|
|
—
|
|
9,099
|
|
|||||||||||||||||
|
Net loss
|
—
|
|
—
|
|
—
|
|
—
|
|
—
|
|
—
|
|
—
|
|
—
|
|
—
|
|
(40,392
|
)
|
(40,392
|
)
|
|||||||||||||||||
|
December 31, 2016
|
33,446,250
|
|
200,080
|
|
—
|
|
—
|
|
16,693,380
|
|
—
|
|
(188,480
|
)
|
(488
|
)
|
51,474
|
|
(200,070
|
)
|
(149,084
|
)
|
|||||||||||||||||
|
Issuance of Series G redeemable convertible preferred stock at $16.3836 per share, net of issuance costs of $0.1 million
|
8,181,957
|
|
133,936
|
|
—
|
|
—
|
|
—
|
|
—
|
|
—
|
|
—
|
|
—
|
|
—
|
|
—
|
|
|||||||||||||||||
|
Issuance of common stock upon exercise of stock options and warrants
|
—
|
|
—
|
|
—
|
|
—
|
|
1,401,870
|
|
—
|
|
—
|
|
—
|
|
1,767
|
|
—
|
|
1,767
|
|
|||||||||||||||||
|
Issuance of common stock for acquisitions
|
—
|
|
—
|
|
—
|
|
—
|
|
2,678,189
|
|
—
|
|
—
|
|
—
|
|
18,243
|
|
—
|
|
18,243
|
|
|||||||||||||||||
|
Vesting of early exercised options
|
—
|
|
—
|
|
—
|
|
—
|
|
—
|
|
—
|
|
—
|
|
—
|
|
366
|
|
—
|
|
366
|
|
|||||||||||||||||
|
Stock-based compensation
|
—
|
|
—
|
|
—
|
|
—
|
|
—
|
|
—
|
|
—
|
|
—
|
|
11,441
|
|
—
|
|
11,441
|
|
|||||||||||||||||
|
Net loss
|
—
|
|
—
|
|
—
|
|
—
|
|
—
|
|
—
|
|
—
|
|
—
|
|
—
|
|
(38,547
|
)
|
(38,547
|
)
|
|||||||||||||||||
|
Balance at December 31, 2017
|
41,628,207
|
|
334,018
|
|
—
|
|
—
|
|
20,773,441
|
|
—
|
|
(188,480
|
)
|
(488
|
)
|
83,291
|
|
(238,617
|
)
|
(155,814
|
)
|
|||||||||||||||||
|
Issuance of common stock in connection with the initial public offering, net of underwriting discounts and commissions
|
—
|
|
—
|
|
11,500,000
|
|
—
|
|
—
|
|
—
|
|
—
|
|
—
|
|
245,985
|
|
—
|
|
245,985
|
|
|||||||||||||||||
|
Costs related to initial public offering
|
—
|
|
—
|
|
—
|
|
—
|
|
—
|
|
—
|
|
—
|
|
—
|
|
(5,450
|
)
|
—
|
|
(5,450
|
)
|
|||||||||||||||||
|
Conversion of redeemable convertible preferred stock in connection with initial public offering
|
(41,628,207
|
)
|
(334,018
|
)
|
—
|
|
—
|
|
42,188,624
|
|
—
|
|
—
|
|
—
|
|
334,018
|
|
—
|
|
334,018
|
|
|||||||||||||||||
|
Automatic conversion of warrants in connection with initial public offering
|
—
|
|
—
|
|
—
|
|
—
|
|
997,193
|
|
—
|
|
—
|
|
—
|
|
21,465
|
|
—
|
|
21,465
|
|
|||||||||||||||||
|
Issuance of common stock for settlement of RSUs
|
—
|
|
—
|
|
—
|
|
—
|
|
802,900
|
|
—
|
|
—
|
|
—
|
|
—
|
|
—
|
|
—
|
|
|||||||||||||||||
|
Shares withheld related to net share settlement
|
—
|
|
—
|
|
—
|
|
—
|
|
(391,874
|
)
|
—
|
|
—
|
|
—
|
|
(9,013
|
)
|
—
|
|
(9,013
|
)
|
|||||||||||||||||
|
Issuance of common stock upon exercise of stock options
|
—
|
|
—
|
|
—
|
|
—
|
|
1,727,899
|
|
—
|
|
—
|
|
—
|
|
8,108
|
|
—
|
|
8,108
|
|
|||||||||||||||||
|
Issuance of common stock for acquisitions
|
—
|
|
—
|
|
—
|
|
—
|
|
757,218
|
|
—
|
|
—
|
|
—
|
|
8,832
|
|
—
|
|
8,832
|
|
|||||||||||||||||
|
Issuance of restricted stock awards
|
—
|
|
—
|
|
2,993
|
|
—
|
|
—
|
|
—
|
|
—
|
|
—
|
|
—
|
|
—
|
|
—
|
|
|||||||||||||||||
|
Vesting of early exercised stock options
|
—
|
|
—
|
|
—
|
|
—
|
|
—
|
|
—
|
|
—
|
|
—
|
|
366
|
|
—
|
|
366
|
|
|||||||||||||||||
|
Stock-based compensation
|
—
|
|
—
|
|
—
|
|
—
|
|
—
|
|
—
|
|
—
|
|
—
|
|
30,803
|
|
—
|
|
30,803
|
|
|||||||||||||||||
|
Net loss
|
—
|
|
—
|
|
—
|
|
—
|
|
—
|
|
—
|
|
—
|
|
—
|
|
—
|
|
(64,078
|
)
|
(64,078
|
)
|
|||||||||||||||||
|
Balance at December 31, 2018
|
—
|
|
$
|
—
|
|
11,502,993
|
|
$
|
—
|
|
66,855,401
|
|
$
|
—
|
|
(188,480
|
)
|
$
|
(488
|
)
|
$
|
718,405
|
|
$
|
(302,695
|
)
|
$
|
415,222
|
|
||||||||||
(See accompanying Notes to Consolidated Financial Statements)
78
|
EVENTBRITE, INC.
CONSOLIDATED STATEMENTS OF CASH FLOWS
(in thousands)
|
|||||||||||
|
Year Ended December 31,
|
|||||||||||
|
2018
|
2017
|
2016
|
|||||||||
|
Cash flows from operating activities
|
|||||||||||
|
Net loss
|
$
|
(64,078
|
)
|
$
|
(38,547
|
)
|
$
|
(40,392
|
)
|
||
|
Adjustments to reconcile net loss to net cash provided by operating activities:
|
|||||||||||
|
Depreciation and amortization
|
34,608
|
|
19,418
|
|
7,639
|
|
|||||
|
Amortization of creator signing fees
|
7,086
|
|
4,314
|
|
2,737
|
|
|||||
|
Accretion of term loan
|
1,718
|
|
752
|
|
—
|
|
|||||
|
Loss on debt extinguishment
|
178
|
|
—
|
|
—
|
|
|||||
|
Change in fair value of redeemable convertible preferred stock warrant liability
|
9,591
|
|
2,200
|
|
—
|
|
|||||
|
Change in fair value of term loan embedded derivatives
|
(2,119
|
)
|
—
|
|
—
|
|
|||||
|
Stock-based compensation
|
30,231
|
|
10,858
|
|
8,531
|
|
|||||
|
Impairment of long-lived assets
|
3,425
|
|
2,715
|
|
1,795
|
|
|||||
|
Provision for bad debt and creator advances
|
2,742
|
|
921
|
|
910
|
|
|||||
|
Loss on disposal of fixed assets
|
99
|
|
1,271
|
|
20
|
|
|||||
|
Deferred income taxes
|
103
|
|
(400
|
)
|
(58
|
)
|
|||||
|
Excess tax benefit from stock-based compensation awards
|
—
|
|
(2,258
|
)
|
—
|
|
|||||
|
Changes in operating assets and liabilities, net of impact of acquisitions:
|
|
||||||||||
|
Accounts receivable
|
(2,092
|
)
|
(775
|
)
|
(1,364
|
)
|
|||||
|
Funds receivable
|
(6,810
|
)
|
(18,148
|
)
|
(9,862
|
)
|
|||||
|
Creator signing fees, net
|
(15,973
|
)
|
(8,600
|
)
|
(5,980
|
)
|
|||||
|
Creator advances, net
|
(5,308
|
)
|
(5,782
|
)
|
(4,636
|
)
|
|||||
|
Prepaid expenses and other current assets
|
(5,594
|
)
|
(4,347
|
)
|
(1,890
|
)
|
|||||
|
Other assets
|
(1,643
|
)
|
668
|
|
(307
|
)
|
|||||
|
Accounts payable, creators
|
24,523
|
|
52,836
|
|
37,109
|
|
|||||
|
Accounts payable, trade
|
(507
|
)
|
386
|
|
245
|
|
|||||
|
Accrued compensation and benefits
|
1,791
|
|
(333
|
)
|
1
|
|
|||||
|
Accrued taxes
|
5,039
|
|
3,640
|
|
(1,253
|
)
|
|||||
|
Other accrued liabilities
|
4,256
|
|
693
|
|
3,939
|
|
|||||
|
Accrued taxes, noncurrent
|
(14,458
|
)
|
7,027
|
|
4,957
|
|
|||||
|
Other liabilities
|
354
|
|
1,312
|
|
644
|
|
|||||
|
Net cash provided by operating activities
|
7,162
|
|
29,821
|
|
2,785
|
|
|||||
|
Cash flows from investing activities
|
|||||||||||
|
Purchases of property and equipment
|
(5,418
|
)
|
(2,536
|
)
|
(2,983
|
)
|
|||||
|
Capitalized internal-use software development costs
|
(7,232
|
)
|
(6,142
|
)
|
(5,483
|
)
|
|||||
|
Acquisitions, net of cash acquired
|
12,611
|
|
(131,974
|
)
|
(1,693
|
)
|
|||||
|
Net cash used in investing activities
|
(39
|
)
|
(140,652
|
)
|
(10,159
|
)
|
|||||
79
|
EVENTBRITE, INC.
CONSOLIDATED STATEMENTS OF CASH FLOWS (continued)
(in thousands)
|
|||||||||||
|
Year Ended December 31,
|
|||||||||||
|
2018
|
2017
|
2016
|
|||||||||
|
Cash flows from financing activities
|
|||||||||||
|
Proceeds from initial public offering, net of underwriters' discounts and commissions and offering costs, net of reimbursements
|
240,965
|
|
—
|
|
—
|
|
|||||
|
Proceeds from exercise of stock options
|
8,108
|
|
1,767
|
|
2,903
|
|
|||||
|
Excess tax benefit from stock-based compensation awards
|
—
|
|
2,258
|
|
—
|
|
|||||
|
Taxes paid related to net share settlement of equity awards
|
(9,013
|
)
|
—
|
|
—
|
|
|||||
|
Proceeds from issuance of redeemable convertible preferred stock, net
|
—
|
|
133,936
|
|
—
|
|
|||||
|
Proceeds from term loans
|
118,578
|
|
30,000
|
|
—
|
|
|||||
|
Principal payments on debt obligations
|
(111,071
|
)
|
(7,788
|
)
|
—
|
|
|||||
|
Prepayment penalties on debt extinguishment
|
(6,803
|
)
|
—
|
|
—
|
|
|||||
|
Payments on capital lease obligations
|
(78
|
)
|
(249
|
)
|
(358
|
)
|
|||||
|
Payments on lease financing obligations
|
(630
|
)
|
(410
|
)
|
(220
|
)
|
|||||
|
Net cash provided by financing activities
|
240,056
|
|
159,514
|
|
2,325
|
|
|||||
|
Net increase (decrease) in cash, cash equivalents and restricted cash
|
247,179
|
|
48,683
|
|
(5,049
|
)
|
|||||
|
Cash, cash equivalents and restricted cash
|
|||||||||||
|
Beginning of period
|
192,221
|
|
143,538
|
|
148,587
|
|
|||||
|
End of period
|
$
|
439,400
|
|
$
|
192,221
|
|
$
|
143,538
|
|
||
|
Supplemental cash flow data
|
|||||||||||
|
Interest paid
|
$
|
7,588
|
|
$
|
868
|
|
$
|
—
|
|
||
|
Income taxes paid, net of refunds
|
202
|
|
144
|
|
78
|
|
|||||
|
Non-cash investing and financing activities
|
|||||||||||
|
Vesting of early exercised stock options
|
366
|
|
366
|
|
305
|
|
|||||
|
Issuance of shares of common stock for acquisitions
|
8,832
|
|
18,243
|
|
478
|
|
|||||
|
Promissory notes issued in connection with acquisitions
|
—
|
|
57,500
|
|
—
|
|
|||||
|
Conversion of redeemable convertible preferred stock in connection with initial public offering
|
21,465
|
|
—
|
|
—
|
|
|||||
|
Issuance of redeemable convertible preferred stock warrants in connection with loan facilities and term loan
|
4,603
|
|
5,071
|
|
—
|
|
|||||
|
Deferred offering costs included in accounts payable, trade and other accrued liabilities
|
430
|
|
—
|
|
—
|
|
|||||
(See accompanying Notes to Consolidated Financial Statements)
80
EVENTBRITE, INC.
Notes to the Consolidated Financial Statements
1. Organization
Description of business
Eventbrite, Inc. (Eventbrite or the Company) has built a powerful, broad technology platform to enable creators to solve many challenges associated with creating live experiences. The Company’s platform integrates components needed to seamlessly plan, promote and produce live events, thereby allowing creators to reduce friction and costs, increase reach and drive ticket sales.
Initial Public Offering
In September 2018, the Company completed its initial public offering (IPO) in which the Company issued and sold
11,500,000
shares of Class A common stock at a public offering price of
$23.00
per share, which included
1,500,000
shares sold pursuant to the exercise by the underwriters' option to purchase additional shares. The Company received aggregate net proceeds of
$246.0 million
from the IPO, net of underwriter discounts and commissions, before deducting offering costs of
$5.5 million
, net of reimbursements.
Immediately prior to the closing of the IPO, (i) all shares of common stock then outstanding were reclassified as Class B Common Stock, (ii)
41,628,207
shares of redeemable convertible preferred stock outstanding converted into
42,188,624
shares of Class B common stock (including additional shares issued upon conversion of our Series G redeemable convertible preferred stock based on the IPO price of
$23.00
per share) and (iii) warrants to purchase
933,269
shares of our Series G redeemable convertible preferred stock automatically exercised into
997,193
shares of Class B common stock. See Note 11 and Note 12 for additional details.
2. Significant Accounting Policies
Basis of Presentation
The consolidated financial statements have been prepared in accordance with accounting principles generally accepted in the United States of America (U.S. GAAP) and include the accounts of the Company and its wholly owned subsidiaries. All intercompany transactions and accounts have been eliminated.
Use of Estimates
In order to conform with U.S. GAAP, the Company is required to make certain estimates, judgments and assumptions when preparing its consolidated financial statements. These estimates, judgments and assumptions affect the reported assets and liabilities and disclosure of contingent assets and liabilities at the date of the financial statements, as well as the reported amounts of revenue and expenses during the reported periods. These estimates include, but are not limited to, the recoverability of creator signing fees and creator advances, the capitalization and estimated useful life of internal-use software, certain assumptions used in the valuation of equity awards, assumptions used in determining the fair value of the redeemable convertible preferred stock warrant liability prior to the IPO, fair value of the term loan derivative liability, assumptions used in determining the fair value of business combinations, the allowance for doubtful accounts, indirect tax reserves and contra-revenue amounts related to fraudulent events, customer disputed transactions and refunds. The Company evaluates these estimates on an ongoing basis. Actual results could differ from those estimates and such differences could be material to the Company’s consolidated financial statements.
Emerging Growth Company Status
As an emerging growth company (EGC), the Jump-start Our Business Start-ups Act (JOBS Act), allows the Company to delay adoption of new or revised accounting pronouncements applicable to public companies until such pronouncements are made applicable to private companies. The Company has elected to use this extended transition period under the JOBS Act. As a result, the Company’s financial statements may not be comparable to the financial statements of issuers who are required to comply with the effective dates for new or revised accounting standards that are applicable to other public companies.
81
Comprehensive Loss
For all periods presented, comprehensive loss equaled net loss. Therefore, the consolidated statements of comprehensive loss have been omitted from the consolidated financial statements.
Segment Information
The Company’s Chief Executive Officer (CEO) and Chief Financial Officer (CFO) make up the chief operating decision maker function. This function reviews financial information presented on a consolidated basis for purposes of allocating resources and evaluating the Company’s financial performance. Additionally, there are no segment managers or other individuals that are held accountable for results below the consolidated level. Accordingly, the Company has determined that it operates as a single reportable and operating segment.
Revenue Recognition
Revenue primarily consists of service fees and payment-processing fees (Eventbrite fees) recognized at the time a ticket for an event is sold and processed. The Company’s customers are event creators who are selling tickets for events using the Company’s platform.
The creator has the choice of whether to use Eventbrite Payment Processing (EPP) or to use a third-party payment processor, referred to as Facilitated Payment Processing (FPP). Under the EPP option, the Company is the merchant of record and is responsible for processing the transaction and collecting the face value of the ticket and all associated fees at the time the ticket is sold. The Company is also responsible for remitting these amounts collected, less the Company’s fees, to the creators. Under the FPP option, Eventbrite is not responsible for processing the transaction or collecting the face value of the ticket and associated fees. In this case, the Company invoices the creator for all of the Company’s fees.
The determination of whether the Company acts as a principal or an agent in a transaction is based on an evaluation of whether the Company has the substantial risks and rewards of ownership under the terms of an arrangement. The Company determined the creator is the primary obligor in a ticketing transaction as the creator is responsible for providing the event for which a ticket is sold and is the party responsible for providing a refund if the event is canceled. The Company’s service provides a platform for the creator and event attendee to transact and to facilitate payment processing of that transaction. The amount that the Company earns for this service is fixed. For the payment processing service, the Company determined that it is the primary obligor because it is acting as the principal in providing the service and has latitude in setting the price of the service. Based on management’s assessment, the Company records revenue on a net basis related to its ticketing service and on a gross basis related to its payment processing service.
The Company’s revenue is derived from its service fees and payment processing fees and is recognized as tickets for an event are sold and processed since the Company believes that is when all the following conditions are met:
• There is persuasive evidence of an arrangement;
• The service has been provided to the creator;
• The collection of the fees is reasonably assured; and
• The amount of fees to be paid is fixed or determinable.
Revenue is presented net of indirect taxes, value-added taxes, creator royalties and reserves for customer refunds, payment chargebacks and estimated uncollectible amounts. If an event is cancelled by a creator, then any obligations to provide refunds to event attendees are the responsibility of that creator. If a creator is unwilling or unable to fulfill their refund obligations, the Company may, at its discretion, provide attendee refunds. Revenue is also presented net of the amortization of creator signing fees. The benefit the Company receives by securing exclusive ticketing and payment processing rights with certain creators from these fees is inseparable from the customer relationship with the creator and accordingly these fees are recorded as a reduction of revenue.
Cost of Revenue
Cost of revenue consists primarily of payment processing fees, platform and website hosting fees and operational costs, amortization of acquired developed technology, amortization of capitalized internal-use software development costs, field operations costs and allocated customer support costs.
82
Cash, Cash Equivalents and Restricted Cash
Cash and cash equivalents includes bank deposits and money market funds held with financial institutions. Cash and cash equivalents balances include the face value of tickets sold on behalf of creators and their share of service charges, which amounts are to be remitted to the creators. Such balances were
$217.4 million
and
$179.5 million
as of
December 31, 2018
and
2017
, respectively. Although creator cash is legally unrestricted, the Company does not utilize creator cash for its own financing or investing activities as the amounts are payable to creators on a regular basis. These amounts due to creators are included in accounts payable, creators on the consolidated balance sheets. The Company also considers all highly liquid investments, including money market funds with an original maturity of three months or less at the date of purchase, to be cash equivalents.
The Company has issued letters of credit under lease agreements which have been collateralized with cash. This cash is classified as noncurrent restricted cash on the consolidated balance sheets based on the term of the underlying lease. The following table provides a reconciliation of cash and restricted cash reported within the consolidated balance sheets that sum to the total of the same amounts shown in the consolidated statements of cash flows (in thousands):
|
December 31,
|
|||||||||||
|
2018
|
2017
|
2016
|
|||||||||
|
Cash and cash equivalents
|
$
|
437,892
|
|
$
|
188,986
|
|
$
|
139,538
|
|
||
|
Restricted cash
|
1,508
|
|
3,235
|
|
4,000
|
|
|||||
|
Total cash, cash equivalents and restricted cash
|
$
|
439,400
|
|
$
|
192,221
|
|
$
|
143,538
|
|
||
Funds Receivable
Funds receivable represents cash-in-transit from third-party payment processors that is received by the Company within approximately five business days from the date of the underlying ticketing transaction. The funds receivable balances include the face value of tickets sold on behalf of creators and their share of service charges, which amounts are to be remitted to the creators. Such amounts were
$54.8 million
and
$48.5 million
as of
December 31, 2018
and
2017
, respectively.
Accounts Receivable, Net
Accounts receivable, net is comprised of invoiced amounts to creators who use a third-party facilitated payment processor (FPP). For customer accounts receivable balances related to FPP, the Company records accounts receivable at the invoiced amount, net of a reserve to provide for potentially uncollectible amounts.
In evaluating the Company’s ability to collect outstanding receivable balances, the Company considers various factors including the age of the balance, the creditworthiness of the customer and the customer’s current financial condition. Accounts receivable deemed uncollectible are charged against the allowance for doubtful accounts when identified.
Property, Plant and Equipment, Net
Property, plant and equipment, including assets acquired through capital leases, are stated at cost less accumulated depreciation. Depreciation is calculated using the straight-line method over the estimated useful lives of assets. Maintenance and repair costs are charged to expense as incurred. The estimated useful lives of the Company’s property, plant and equipment are as follows:
|
Estimated Useful Life
|
|
|
Building and improvements
|
30 years
|
|
Furniture and fixtures
|
3-5 years
|
|
Computers and computer equipment
|
1-2 years
|
|
Computer software
|
2-3 years
|
|
Capitalized internal-use software development costs
|
2 years
|
|
Leasehold improvements
|
Shorter of estimated useful life or remaining lease term
|
83
Fair Value Measurements
The Company measures its financial assets and liabilities at fair value at each reporting date using a fair value hierarchy that requires the Company to maximize the use of observable inputs and minimize the use of unobservable inputs when measuring fair value. A financial instrument’s classification within the fair value hierarchy is based upon the lowest level of input that is significant to the fair value measurement. Three levels of inputs may be used to measure fair value:
Level 1 – Observable inputs that reflect quoted prices (unadjusted) for identical assets or liabilities in active markets.
Level 2 – Other inputs that are directly or indirectly observable in the marketplace.
Level 3 – Unobservable inputs that are supported by little or no market activity.
The Company’s money market funds, funds receivable, accounts receivable, accounts payable, other current liabilities and debt approximate their fair value. All of these financial assets and liabilities are Level 1, except for debt, which is Level 2. There are no other Level 1 or Level 2 assets or liabilities recorded at
December 31, 2018
and
2017
.
The Company measures the redeemable convertible preferred stock warrant liability (as discussed in Note 11) and term loan derivative asset (as discussed in Note 10) at fair value on a recurring basis and determined these are Level 3 financial assets and liabilities, respectively, in the fair value hierarchy.
The fair value of the redeemable convertible preferred stock warrants was estimated using a hybrid between a probability-weighted expected return method (PWERM) and option pricing model (OPM), estimating the probability weighted value across multiple scenarios, while using an OPM to estimate the allocation of value within one or more of these scenarios. Under a PWERM, the value of the Company’s various equity securities was estimated based upon an analysis of future values for the Company assuming various future outcomes, including two IPO scenarios and two scenarios contemplating the continued operation of the Company as a privately held enterprise. Guideline public company multiples were used to value the Company under the IPO scenarios. The discounted cash flow method was used to value the Company under the staying private scenarios. Share value for each class of security was based upon the probability-weighted present value of expected future investment returns, considering each of these possible future outcomes, as well as the rights of each share class.
The significant unobservable inputs into the valuation model used to estimate the fair value of the redeemable convertible preferred stock warrants include the timing of potential events (IPO) and their probability of occurring, the selection of guideline public company multiples, a discount for the lack of marketability of the preferred and common stock, the projected future cash flows, and the discount rate used to calculate the present-value of the estimated equity value allocated to each share class.
The significant unobservable inputs into the valuation model used to estimate the fair value of the term loan derivative asset include the timing of potential events (primarily the IPO), probability of exercise and the discount rate used to calculate the present value of discounted cash flows.
Generally, changes in the fair value of the underlying redeemable convertible preferred stock would result in a directionally similar impact to the fair value of the redeemable convertible preferred stock warrant liability.
There were no transfers of financial assets or liabilities into or out of Level 1, Level 2 or Level 3 for the years ended
December 31, 2018
and
2017
.
Leases
The Company leases office space and certain computer equipment under noncancelable lease agreements which are accounted for as operating leases. Rent expense is recorded on a straight-line basis over the lease term. If a lease provides for fixed escalations of the minimum rental payments, the difference between the straight-line rent charged to expense and the amount payable under the lease is recognized as deferred rent.
84
The Company considers the nature of renovations and the Company’s involvement during the construction period for leased office space to determine if it should be considered the owner of the construction project during the construction period. If the Company determines that it is the owner of the construction project, it is required to capitalize the fair value of the building as well as the construction costs incurred on its consolidated balance sheet along with a corresponding liability (build-to-suit accounting). Upon occupancy for build-to-suit leases, the Company assesses whether the circumstances qualify for sales recognition under the sale-leaseback accounting guidance. If the lease meets the sale-leaseback criteria, the Company will remove the asset and related financial obligation from the consolidated balance sheet and treat the building lease as an operating lease. If upon completion of construction, the project does not meet the sale-leaseback criteria, the leased property will continue to be treated as a build-to-suit lease asset and financing obligation for financial reporting purposes.
Internal-Use Software Development Costs
The Company capitalizes certain costs associated with website and application development and software developed or obtained for internal use. Costs incurred in the preliminary stages of development are expensed as incurred. Once software has reached the end of the preliminary project stage, internal and external costs, if direct and incremental, are capitalized until the software is substantially complete and ready for its intended use, including stock-based compensation and other employee benefit costs. Capitalization ceases upon completion of all substantial testing. The Company also capitalizes costs related to specific upgrades and enhancements when it is probable the expenditures will result in additional functionality. Capitalized costs are included in property and equipment, net in the consolidated balance sheet.
Capitalized internal-use software and website development costs are amortized on a straight-line basis over their estimated useful life, which is
two
years. Amortization expense is recorded in cost of revenue within the consolidated statements of operations. Maintenance and training costs are charged to expense as incurred and included in operating expenses.
Business Combinations
The Company allocates the fair value of purchase consideration to the tangible assets acquired, liabilities assumed and intangible assets acquired based on their estimated fair values. The excess of the fair value of purchase consideration over the fair values of these identifiable assets and liabilities is recorded as goodwill. Such valuations require management to make significant estimates and assumptions, especially with respect to intangible assets. Significant estimates in valuing certain intangible assets include, but are not limited to, future expected cash flows from acquired users, acquired technology, trade names from a market participant perspective, useful lives and discount rates. Management’s estimates of fair value are based upon assumptions believed to be reasonable, but which are inherently uncertain and unpredictable and, as a result, actual results may differ from estimates. During the measurement period, which is one year from the acquisition date, the Company may record adjustments to the assets acquired and liabilities assumed, with the corresponding offset to goodwill. Upon the conclusion of the measurement period, any subsequent adjustments are recorded to earnings.
Goodwill and Acquired Intangible Assets, Net
Goodwill
Goodwill represents the excess of the aggregate fair value of the consideration transferred in a business combination over the fair value of the assets acquired, net of liabilities assumed. Goodwill is not amortized but the Company evaluates goodwill impairment of its single reporting unit annually on the first day of the fourth quarter, or more frequently if events or changes in circumstances indicate the goodwill may be impaired.
Events or changes in circumstances which could trigger an impairment review include significant changes in the manner of the Company’s use of the acquired assets or the strategy for the Company’s overall business, significant negative industry or economic trends, significant underperformance relative to historical or projected future results of operations, a significant adverse change in the business climate, an adverse action or assessment by a regulator, unanticipated competition or a loss of key personnel. The Company has the option to first assess qualitative factors to determine whether the existence of events or circumstances leads to a determination that it is more likely than not that the fair value of the reporting unit is less than its carrying amount. If, after assessing the totality of events or circumstances, an entity determines it is not more likely than not that the fair value of the reporting unit is less than its carrying amount, then additional impairment testing is not required. However, if an entity concludes otherwise, then it is required to perform the first of a two-step impairment test.
85
The first step involves comparing the estimated fair value of the reporting unit with its respective book value, including goodwill. If the estimated fair value exceeds book value, goodwill is considered not to be impaired and no additional steps are necessary. If, however, the fair value of the reporting unit is less than book value, then a second step is required that compares the carrying amount of the goodwill with its implied fair value. The estimate of implied fair value of goodwill may require valuations of certain internally-generated and unrecognized intangible and tangible net assets. If the carrying amount of goodwill exceeds the implied fair value of the goodwill, an impairment loss is recognized in an amount equal to the excess.
During the years ended
December 31, 2018
and
2017
, the Company assessed qualitative factors and determined additional impairment testing was not required, therefore
no
goodwill impairment charges have been recorded during these periods.
Acquired Intangible Assets, Net
Acquired intangible assets, net consists of identifiable intangible assets such as developed technology, customer relationships, and trade names resulting from the Company’s acquisitions. Acquired intangible assets are recorded at fair value on the date of acquisition and amortized over their estimated economic lives following the pattern in which the economic benefits of the assets will be consumed, determined to be straight-line. Acquired intangible assets are presented net of accumulated amortization in the consolidated balance sheet.
The Company evaluates the recoverability of its intangible assets for potential impairment whenever events or circumstances indicate that the carrying amount of such assets may not be recoverable. Recoverability of these assets is measured by a comparison of the carrying amounts to the future undiscounted cash flows the assets are expected to generate. If such review indicates that the carrying amount of intangible assets is not recoverable, the carrying amount of such assets is reduced to the fair value.
Creator Signing Fees, Net
Creator signing fees, net represent contractual amounts paid to creators pursuant to event ticketing and payment processing agreements. Creator signing fees are additional incentives paid by the Company to secure exclusive ticketing and payment processing rights with certain creators. These payments are amortized over the life of the contract to which they relate on a straight-line basis. Creator signing fees are presented net of reserves and allowances for potentially unrecoverable amounts on the consolidated balance sheets. Amortization of creator signing fees is recorded as a reduction of revenue in the consolidated statements of operations.
Creator Advances, Net
Creator advances, net represent contractual amounts paid to creators pursuant to event ticketing and payment processing agreements. Creator advances provide the creator with funds in advance of the event and are subsequently recovered by withholding amounts due to the Company from the sale of tickets until the creator advance has been fully recovered. Creator advances are presented net of reserves and allowances for potentially unrecoverable amounts on the consolidated balance sheets.
Impairment of Long-Lived Assets
The carrying amounts of long-lived assets, including property and equipment, capitalized internal-use software, creator signing fees, creator advances and acquisition-related intangible assets, are periodically reviewed for impairment whenever events or changes in circumstances indicate that the carrying value of these assets may not be recoverable or that the useful life is shorter than originally estimated. Recoverability of assets to be held and used is measured by comparing the carrying amount of an asset to future undiscounted net cash flows the asset is expected to generate over its remaining life.
If the asset is considered to be impaired, the amount of any impairment is measured as the difference between the carrying value and the fair value of the impaired asset. If the useful life is shorter than originally estimated, the Company amortizes the remaining carrying value over the revised shorter useful life.
Accounts Payable, Creators
Accounts payable, creators consists of unremitted ticket sale proceeds, net of Eventbrite service fees and applicable taxes. Amounts are remitted to creators within
five
business days subsequent to the completion of the related event. In certain situations, at the request of the creator, the Company may remit ticket sale proceeds in advance of the related event.
86
Advertising
Advertising costs are charged to expense as incurred. The costs of developing advertising creative and trade show expenses are initially deferred and charged to expense in the period in which the advertising is displayed or the period the trade show occurs. Advertising expenses were
$1.6 million
,
$1.9 million
and
$2.1 million
for the
years ended
December 31, 2018
,
2017
and
2016
, respectively.
Stock-Based Compensation Expense
Stock-based compensation expense to employees is measured based on the grant-date fair value of the awards and recognized in the consolidated statements of operations over the period during which the employee is required to perform services in exchange for the award (the vesting period of the award).
The Company estimates the fair value of stock options granted using the Black-Scholes option pricing model. The Company measures the fair value of RSUs based on the fair value of the underlying shares on the date of grant. Compensation expense is recognized over the vesting period of the applicable award using the straight-line method. The Company estimates forfeitures in order to calculate the stock-based compensation expense.
Compensation expense for nonemployee stock options is calculated using the Black-Scholes option pricing model and is recorded as the options vest. Options subject to vesting are revalued periodically over the service period, which is the same as the vesting period.
Deferred Offering Costs
Deferred offering costs, which consist of direct incremental legal, consulting, banking and accounting fees relating to anticipated equity offerings, are capitalized and offset against proceeds upon the consummation of the offerings within stockholders’ equity. The Company incurred
$5.5 million
of deferred offering costs in connection with its IPO, which are recorded within stockholders' equity as a reduction of the IPO proceeds.
Income Taxes
The Company records income taxes using the asset and liability method, which requires the recognition of deferred tax assets and liabilities for the expected future tax consequences of events that have been recognized in the consolidated financial statements or tax returns. Deferred tax assets and liabilities are measured using enacted tax rates that are expected to apply to taxable income for the years in which those tax assets and liabilities are expected to be realized or settled. Valuation allowances are provided when necessary to reduce deferred tax assets to the amount expected to be realized.
The Company recognizes tax benefits from uncertain tax positions if it is more likely than not that the tax position will be sustained on examination by the taxing authorities based on the technical merits of the position. Although the Company believes it has adequately provided for its uncertain tax positions, the Company can provide no assurance that the final tax outcome of these matters will not be materially different. The Company adjusts these allowances when facts and circumstances change, such as the closing of a tax audit or the refinement of an estimate. To the extent that the final tax outcome of these matters is different than the amounts recorded, such differences will affect the provision for income taxes in the period in which such determination is made and could have a material impact on the Company’s consolidated financial statements.
Foreign Currency Remeasurement
The functional currency of the Company’s international subsidiaries is the U.S. dollar. Accordingly, monetary balance sheet accounts are remeasured using exchange rates in effect at the balance sheet dates and non-monetary items are remeasured at historical exchange rates. Revenue and expenses are remeasured at the average exchange rates for the period. Foreign currency remeasurement and transaction gains and losses are included in other income (expense), net in the consolidated statements of operations. The Company recorded foreign currency rate remeasurement
losses
of
$6.5 million
, foreign currency rate remeasurement
gains
of
$3.1 million
and foreign currency rate remeasurement
losses
of
$2.0 million
during the
years ended
December 31, 2018
,
2017
and
2016
, respectively.
87
Concentrations of Risk
Financial instruments potentially exposing the Company to concentrations of credit risk consist primarily of cash, funds receivable, accounts receivable, payments to creators and creator advance payouts. The Company holds its cash with high-credit-quality financial institutions; however, the Company maintains balances in excess of the FDIC insurance limits. The Company does not require their customers to provide collateral to support accounts receivable and maintains an allowance for accounts receivable balances that are doubtful of collection.
As of
December 31, 2018
and
2017
, there were no customers that represented 10% or more of the Company’s accounts receivable balance and there were no customers that individually exceeded 10% of the Company’s net revenue for any of the
years ended
December 31, 2018
,
2017
and
2016
, respectively.
Redeemable Convertible Preferred Stock Warrants
Freestanding warrants to purchase shares of redeemable convertible preferred stock are classified as liabilities on the consolidated balance sheets at their estimated fair value because the underlying shares of redeemable convertible preferred stock are contingently redeemable and, therefore, may obligate the Company to transfer assets at some point in the future. Such warrants are recorded at fair value upon issuance and remeasured to fair value at each reporting period through the consolidated statements of operations. The Company adjusts the redeemable convertible preferred stock warrant liability for changes in estimated fair value until the earlier of the exercise or expiration or the completion of a sale of the Company or an IPO. Upon the completion of the Company's IPO in September 2018, all of the Company's outstanding warrants to purchase shares of redeemable convertible preferred stock were automatically exercised into shares of the Company’s Class B common stock.
Net Loss Per Share
The Company follows the two-class method when computing net loss per common share when shares are issued that meet the definition of participating securities. The two-class method determines net income (loss) per common share for each class of common stock and participating securities according to dividends declared or accumulated and participation rights in undistributed earnings. The two-class method requires income available to common stockholders for the period to be allocated between common stock and participating securities based upon their respective rights to receive dividends as if all income for the period had been distributed. The Company’s redeemable convertible preferred stock contractually entitles the holders of such shares to participate in dividends but does not contractually require the holders of such shares to participate in the Company’s losses. For periods in which the Company reports net losses, diluted net loss per share is the same as basic net loss per share because potentially dilutive common shares are not assumed to have been issued if their effect is anti-dilutive.
Recently Adopted Accounting Pronouncements
The Company adopted ASU No. 2016-09, Compensation—Stock Compensation (Topic 718) beginning January 1, 2018. The Company has elected to continue to estimate expected forfeitures as awards are granted. Additionally, the Company will prospectively present excess tax benefits as an operating activity on the consolidated statement of cash flows. The Company recognized the previously unrecognized excess tax benefits using the modified retrospective transition method, which did not result in a cumulative-effect adjustment to the opening balance of accumulated deficit in 2018 given the Company’s valuation allowance position. Without the valuation allowance, the Company’s deferred tax assets would have increased by
$3.4 million
.
The Company adopted ASU 2016-15, Statement of Cash Flows (Topic 230): Clarifying the Classification of Certain Cash Receipts and Cash Payments beginning January 1, 2018 using a retrospective approach. This standard applies to the Company’s reporting requirements in the recording of debt prepayment and debt extinguishment and has been reflected in the consolidated financial statements.
Recently Issued Accounting Pronouncements
In January 2017, the FASB issued ASU 2017-04,
Intangibles—Goodwill and Other (Topic 350)
:
Simplifying the Test for Goodwill Impairment
, which eliminates the requirement to calculate the implied fair value of goodwill to measure a goodwill impairment charge. This standard is effective for public business entities for the annual or any interim goodwill impairment tests in fiscal years beginning after December 15, 2019. All other entities should adopt this update for the annual or any interim goodwill impairment tests in fiscal years beginning after December 15, 2021. Early adoption is permitted. This standard will apply to the Company’s reporting requirements in performing goodwill impairment testing and the Company plans to adopt this standard January 1, 2019. The Company does not anticipate the adoption of this standard will have a material impact on its consolidated financial statements.
88
In January 2017, the FASB issued ASU 2017-01,
Business Combinations (Topic 805): Clarifying the Definition of a Business
, which clarifies the definition of a business with the objective of adding guidance to assist entities with evaluating whether transactions should be accounted for as acquisitions or disposals of assets or businesses. This standard is effective for public business entities for annual periods beginning after December 15, 2017, including interim periods within those periods. For all other entities, this standard is effective for annual periods beginning after December 15, 2018, and interim periods within annual periods beginning after December 15, 2019. The impact to the Company’s consolidated financial statements will depend on the facts and circumstances of any specific future transactions.
In February 2016, the FASB issued ASU 2016-02,
Leases (Topic 842)
which requires lessees to put most leases on their balance sheets but recognize expenses on their income statement and eliminates the real estate-specific provisions for all entities. The guidance is effective for public business entities for fiscal years beginning after December 15, 2018, including interim periods within those fiscal years. For all other entities, the amendments to the standard are effective for fiscal years beginning after December 15, 2019, and interim periods within fiscal years beginning after December 15, 2020. The Company intends to adopt this standard beginning January 1, 2020 and is currently evaluating the effect that implementation of this standard will have on its consolidated financial statements upon adoption.
In May 2014, the FASB issued ASU 2014-09,
Revenue from Contracts with Customers (Topic 606)
and
Other Assets and Deferred Costs—Contracts with Customers (Subtopic 340-40)
, which will supersede nearly all existing revenue recognition guidance. The core principle behind this standard is that an entity should recognize revenue to depict the transfer of promised goods and services to customers in an amount that reflects the consideration to which the entity expects to be entitled in exchange for delivering those goods and services. To achieve this core principle, the ASU provides a model, which involves a five-step process that includes identifying the contract with the customer, identifying the performance obligations in the contract, determining the transaction price, allocating the transaction prices to the performance obligations in the contract, and recognizing revenue when (or as) the entity satisfies the performance obligations. The standard also provides guidance on the recognition of costs related to obtaining customer contracts.
This standard permits adoption either by using a full retrospective approach, in which all comparative periods are presented in accordance with the new standard, or a modified retrospective approach with the cumulative effect of initially applying the new standard recognized at the date of initial application and providing certain additional disclosures. For public business entities, this standard is effective for annual reporting periods beginning after December 15, 2017, including interim periods within that reporting period. For all other entities, this standard is effective for annual reporting periods beginning after December 15, 2018, and interim periods within annual periods beginning after December 15, 2019. Early application is permitted for annual periods beginning after December 15, 2016. The Company has elected to adopt this standard as of January 1, 2019 using the full retrospective approach and does not expect the adoption of this standard to have a material impact on its consolidated financial statements.
3. Acquisitions
2018 Acquisitions
In August 2018, the Company acquired Picatic e-Ticket Inc. (Picatic), a Canadian ticketing company. The Company acquired Picatic primarily to bolster its engineering staff and enhance its ticketing solutions. The acquisition of Picatic has been accounted for as a business combination
.
The acquisition date fair value of the consideration transferred was
$2.9 million
, which consisted of
$1.3 million
in cash and
81 thousand
shares of the Company’s common stock. Acquisition costs directly related to the Picatic transaction were
$0.3 million
and are included in general and administrative expenses in the consolidated statements of operations for the year ended
December 31, 2018
.
The total purchase price of the Picatic acquisition was allocated to the assets acquired and liabilities assumed based on their fair value as of the acquisition date. The excess of the purchase price over the net assets acquired was recorded as goodwill. The goodwill recorded in connection with the Picatic acquisition is not deductible for tax purposes and is attributable to the assembled workforce and synergies from the future growth and strategic advantages in the ticketing industry.
In April 2018, the Company acquired Ticketea S.L. (Ticketea), a leading Spanish ticketing provider. The Company acquired Ticketea in order to enhance its ticketing solutions and expand in the Spanish market. The acquisition of Ticketea has been accounted for as a business combination
.
The acquisition date fair value of the consideration transferred was
$11.4 million
, which consisted of
$3.6 million
in cash and
0.7 million
shares of the Company’s common stock. Of the
0.7 million
shares,
0.1 million
shares are being held in escrow for adjustments related to working capital requirements and breaches of representations, warranties and covenants. These escrowed shares will be released approximately
18
months from the acquisition date, net of any adjustments. Acquisition costs directly related to the Ticketea transaction were
$0.5 million
and are
89
included in general and administrative expenses in the consolidated statement of operations for the year ended
December 31, 2018
.
The total purchase price of the Ticketea acquisition was allocated to the assets acquired and liabilities assumed based on their fair value as of the acquisition date. The excess of the purchase price over the net assets acquired was recorded as goodwill. The goodwill recorded in connection with the Ticketea acquisition is not deductible for tax purposes and is attributable to the assembled workforce and synergies from the future growth and strategic advantages in the ticketing industry.
The following table summarizes the estimated fair values of the assets acquired and liabilities assumed as of the respective acquisition dates (in thousands):
|
Picatic
|
Ticketea
|
Total
|
|||||||||
|
Cash
|
$
|
160
|
|
$
|
17,852
|
|
$
|
18,012
|
|
||
|
Funds and accounts receivable
|
10
|
|
1,058
|
|
1,068
|
|
|||||
|
Creator advances
|
—
|
|
532
|
|
532
|
|
|||||
|
Prepaid expenses and other current assets
|
87
|
|
127
|
|
214
|
|
|||||
|
Property and equipment
|
—
|
|
42
|
|
42
|
|
|||||
|
Other noncurrent assets
|
—
|
|
28
|
|
28
|
|
|||||
|
Accounts payable, creators
|
—
|
|
(19,671
|
)
|
(19,671
|
)
|
|||||
|
Other current liabilities
|
(121
|
)
|
(628
|
)
|
(749
|
)
|
|||||
|
Intangible assets
|
507
|
|
3,094
|
|
3,601
|
|
|||||
|
Goodwill
|
2,219
|
|
8,937
|
|
11,156
|
|
|||||
|
Total purchase price
|
$
|
2,862
|
|
$
|
11,371
|
|
$
|
14,233
|
|
||
The following table sets forth the components of identifiable intangible assets acquired (in thousands) and their estimated useful lives as of the date of acquisition (in years):
|
Picatic
|
Estimated
useful life |
Ticketea
|
Estimated
useful life |
||||||||
|
Customer relationships
|
$
|
507
|
|
2.5
|
$
|
2,475
|
|
5.0
|
|||
|
Developed technology
|
—
|
|
619
|
|
1.0
|
||||||
|
Total acquired intangible assets
|
$
|
507
|
|
$
|
3,094
|
|
|||||
The amount of net revenue from the Picatic and Ticketea acquisitions included in the consolidated statements of operations for the year ended
December 31, 2018
was
$3.7 million
.
2017 Acquisitions
In September 2017, the Company acquired
100%
of the outstanding equity of Ticketfly, LLC (Ticketfly), a San Francisco based subsidiary of a publicly-held company. The Company acquired Ticketfly in order to expand the Company’s solutions for music-related events. The acquisition of Ticketfly has been accounted for as a business combination
.
The acquisition date fair value of the consideration transferred was
$201.1 million
, which consisted of
$151.1 million
in cash and
$50.0 million
in Convertible Promissory Notes (Promissory Note), which were paid and issued, respectively, at the closing of the transaction. The Promissory Note had a
five
year maturity from the date of issuance and bore interest at a rate of
6.5%
per annum. Acquisition costs related to the Ticketfly transaction were
$0.5 million
and are included in general and administrative expenses in the consolidated statements of operations for the year ended December 31, 2017.
In March 2018, the Company reached an agreement with the seller of Ticketfly to repay the Promissory Note. The face value of
$50.0 million
was settled in full for
$34.7 million
which represented
$33.0 million
of principal and
$1.7 million
of accrued interest. The Company recognized a gain of
$17.0 million
resulting from the extinguishment of the Promissory Note in the consolidated statements of operations for the year ended
December 31, 2018
. As discussed in Note 10, the Company recorded a net loss on debt extinguishment of
$0.2 million
for the year ended
December 31, 2018
.
90
In January 2017, the Company acquired
100%
of the outstanding equity of TSTM Group Limited (ticketscript), a privately-held Dutch ticketing company with operations throughout Europe. The Company acquired ticketscript in order to enhance its ticketing solutions. The acquisition of ticketscript has been accounted for as a business combination
.
The acquisition date fair value of the consideration transferred was
$33.4 million
, which consisted of
$7.7 million
in cash,
$7.5 million
in promissory notes,
2.7 million
shares of the Company’s common stock and options to purchase
0.3 million
shares of Eventbrite common stock. These promissory notes were allowed to be prepaid at any time and the Company repaid these promissory notes in full, including accrued interest, in August 2017. Acquisition costs related to the ticketscript transaction were
$1.2 million
and are included in general and administrative expenses in the consolidated statements of operations. The Company retained certain former ticketscript employees under Eventbrite employment contracts and issued options to purchase an aggregate of
0.3 million
shares of common stock in connection with those employment contracts. These options vest over time and compensation expense will be recorded over the associated service period.
The total purchase prices of the Ticketfly and ticketscript acquisitions were allocated to the assets acquired and liabilities assumed based on their fair value as of the acquisition date. The excess of the purchase price over the net assets acquired was recorded as goodwill. The goodwill recorded in connection with the Ticketfly acquisition is deductible for tax purposes, while the goodwill recorded in connection with ticketscript is not. Goodwill is attributable to the assembled workforce and synergies from the future growth and strategic advantages in the ticketing industry.
The following table summarizes the fair values of the assets acquired and liabilities assumed as of the respective acquisition dates (in thousands):
|
Ticketfly
|
ticketscript
|
Total
|
|||||||||
|
Cash and restricted cash
|
$
|
23,339
|
|
$
|
3,492
|
|
$
|
26,831
|
|
||
|
Funds and accounts receivable
|
4,263
|
|
4,208
|
|
8,471
|
|
|||||
|
Creator advances
|
8,567
|
|
—
|
|
8,567
|
|
|||||
|
Prepaid expenses and other current assets
|
1,213
|
|
242
|
|
1,455
|
|
|||||
|
Property and equipment
|
2,619
|
|
425
|
|
3,044
|
|
|||||
|
Other noncurrent assets
|
15
|
|
238
|
|
253
|
|
|||||
|
Accounts payable, creators
|
(29,909
|
)
|
(7,950
|
)
|
(37,859
|
)
|
|||||
|
Other current liabilities
|
(2,138
|
)
|
(836
|
)
|
(2,974
|
)
|
|||||
|
Accrued taxes
|
(6,179
|
)
|
(1,799
|
)
|
(7,978
|
)
|
|||||
|
Deferred tax liabilities
|
—
|
|
(2,401
|
)
|
(2,401
|
)
|
|||||
|
Intangible assets
|
76,300
|
|
11,800
|
|
88,100
|
|
|||||
|
Goodwill
|
123,011
|
|
26,030
|
|
149,041
|
|
|||||
|
Total purchase price
|
$
|
201,101
|
|
$
|
33,449
|
|
$
|
234,550
|
|
||
The following table sets forth the components of identifiable intangible assets acquired (in thousands) and their estimated useful lives as of the date of acquisition (in years):
|
Ticketfly
|
Estimated
useful life
|
ticketscript
|
Estimated
useful life
|
||||||||
|
Customer relationships
|
$
|
60,500
|
|
8.0
|
$
|
10,600
|
|
5.0
|
|||
|
Developed technology
|
14,500
|
|
1.3
|
1,100
|
|
1.0
|
|||||
|
Trademark
|
1,300
|
|
1.3
|
100
|
|
1.0
|
|||||
|
Total acquired intangible assets
|
$
|
76,300
|
|
$
|
11,800
|
|
|||||
91
The following unaudited pro forma information presents the combined results of operations as if the Ticketfly acquisition had been completed on January 1, 2016, the beginning of the comparable prior annual reporting period. The pro forma results include the adjustments for amortization associated with the acquired intangible assets, interest expense on new debt, stock-based compensation and the inclusion of
$0.5 million
of non-recurring acquisition costs. The pro forma results do not reflect any cost saving synergies from operating efficiencies of the effect of the incremental costs incurred in integrating the companies. Accordingly, these pro forma results are presented for informational purpose only and are not necessarily indicative of what the actual results of operations of the combined company would have been if the acquisition had occurred at the beginning of the period presented, nor are they indicative of future results of operations (in thousands):
|
Year Ended
|
|||
|
December 31, 2017
|
|||
|
Net revenue
|
$
|
235,096
|
|
|
Net loss
|
(199,222
|
)
|
|
Pro forma information for the Ticketea, Picatic and ticketscript acquisitions is not presented as it is not material.
4. Goodwill and Acquired Intangible Assets, Net
The changes in the carrying amounts of goodwill was as follows (in thousands):
|
January 1, 2017
|
$
|
9,725
|
|
|
Additions from acquisitions
|
149,041
|
|
|
|
At December 31, 2017
|
158,766
|
|
|
|
Additions from acquisitions
|
11,023
|
|
|
|
Measurement period and other adjustments
|
771
|
|
|
|
At December 31, 2018
|
$
|
170,560
|
|
Acquired intangible assets consisted of the following as of the dates indicated (in thousands):
|
December 31, 2017
|
|||||||||||||
|
Cost
|
Accumulated
Amortization |
Net Book
Value |
Weighted-
average remaining useful life (years) |
||||||||||
|
Developed technology
|
$
|
18,477
|
|
$
|
6,679
|
|
$
|
11,798
|
|
1.0
|
|||
|
Customer relationships
|
71,502
|
|
4,743
|
|
66,759
|
|
7.2
|
||||||
|
Tradenames
|
1,600
|
|
616
|
|
984
|
|
1.0
|
||||||
|
Acquired intangible assets, net
|
$
|
91,579
|
|
$
|
12,038
|
|
$
|
79,541
|
|
||||
|
December 31, 2018
|
|||||||||||||
|
Cost
|
Accumulated
Amortization |
Net Book
Value |
Weighted-
average remaining useful life (years) |
||||||||||
|
Developed technology
|
$
|
19,096
|
|
$
|
18,628
|
|
$
|
468
|
|
0.8
|
|||
|
Customer relationships
|
74,484
|
|
14,979
|
|
59,505
|
|
6.2
|
||||||
|
Tradenames
|
1,600
|
|
1,600
|
|
—
|
|
0.0
|
||||||
|
Acquired intangible assets, net
|
$
|
95,180
|
|
$
|
35,207
|
|
$
|
59,973
|
|
||||
92
The Company recorded amortization expense related to acquired intangible assets as follows (in thousands):
|
Year Ended December 31,
|
||||||||||||
|
2018
|
2017
|
2016
|
||||||||||
|
Cost of net revenue
|
$
|
11,834
|
|
$
|
5,083
|
|
$
|
470
|
|
|||
|
General and administrative
|
11,334
|
|
5,160
|
|
157
|
|
||||||
|
Total amortization of acquired intangible assets
|
$
|
23,168
|
|
$
|
10,243
|
|
$
|
627
|
|
|||
As of
December 31, 2018
, the total expected future amortization expense of acquired intangible assets by year is as follows (in thousands):
|
2019
|
$
|
10,825
|
|
|
2020
|
10,443
|
|
|
|
2021
|
10,197
|
|
|
|
2022
|
8,202
|
|
|
|
Thereafter
|
20,306
|
|
|
|
Acquired intangible assets, net
|
$
|
59,973
|
|
5. Accounts Receivable, Net
Accounts receivable, net is comprised of invoiced amounts to customers who use FPP for payment processing as well as other invoiced amounts. The following table summarizes the Company’s accounts receivable balance (in thousands):
|
December 31,
|
|||||||||||
|
2018
|
2017
|
2016
|
|||||||||
|
Accounts receivable, customers
|
$
|
5,651
|
|
$
|
4,682
|
|
$
|
3,081
|
|
||
|
Allowance for doubtful accounts
|
(1,582
|
)
|
(1,797
|
)
|
(1,099
|
)
|
|||||
|
Accounts receivable, net
|
$
|
4,069
|
|
$
|
2,885
|
|
$
|
1,982
|
|
||
6. Creator Signing Fees, Net
Creator signing fees are additional incentives paid by the Company to secure exclusive ticketing and payment processing rights with certain creators. As of
December 31, 2018
, these payments are being amortized over a weighted-average remaining contract life of
3.3 years
on a straight-line basis. Amortization of creator signing fees is recorded as a reduction of revenue in the consolidated statements of operations and totaled
$7.1 million
,
$4.3 million
and
$2.7 million
for the years ended December 31, 2018, 2017 and 2016, respectively. The following table summarizes the activity in creator signing fees (in thousands):
|
December 31,
|
|||||||
|
2018
|
2017
|
||||||
|
Balance, beginning of period
|
$
|
10,421
|
|
$
|
6,906
|
|
|
|
Creator signing fees paid
|
15,973
|
|
8,552
|
|
|||
|
Amortization of creator signing fees
|
(7,086
|
)
|
(4,314
|
)
|
|||
|
Write-offs and other adjustments
|
(2,303
|
)
|
(723
|
)
|
|||
|
Balance, end of period
|
$
|
17,005
|
|
$
|
10,421
|
|
|
|
Creator signing fees, net
|
$
|
7,324
|
|
$
|
4,235
|
|
|
|
Creator signing fees, noncurrent
|
9,681
|
|
6,186
|
|
|||
93
7. Creator Advances, Net
Creator advances provide the creator with funds in advance of the event and are subsequently recovered by withholding amounts due to the Company from the sale of tickets for the event until the creator payment has been fully recovered. The following table summarizes the activity in creator advances for the periods indicated (in thousands):
|
December 31,
|
|||||||
|
2018
|
2017
|
||||||
|
Balance, beginning of period
|
$
|
20,076
|
|
$
|
7,583
|
|
|
|
Acquired with Ticketfly transaction
|
—
|
|
8,567
|
|
|||
|
Acquired with Ticketea transaction
|
532
|
|
—
|
|
|||
|
Creator advances paid
|
21,466
|
|
14,701
|
|
|||
|
Creator advances recouped
|
(16,158
|
)
|
(8,681
|
)
|
|||
|
Write-offs and other adjustments
|
(2,774
|
)
|
(2,094
|
)
|
|||
|
Balance, end of period
|
$
|
23,142
|
|
$
|
20,076
|
|
|
|
Creator advances, net
|
$
|
21,255
|
|
$
|
17,641
|
|
|
|
Creator advances, noncurrent
|
1,887
|
|
2,435
|
|
|||
8. Property, Plant and Equipment, Net
Property, plant and equipment, net consisted of the following as of the dates indicated (in thousands):
|
December 31,
|
|||||||
|
2018
|
2017
|
||||||
|
Building and improvements
|
$
|
33,277
|
|
$
|
33,277
|
|
|
|
Capitalized internal-use software development costs
|
35,201
|
|
27,392
|
|
|||
|
Furniture and fixtures
|
3,557
|
|
3,206
|
|
|||
|
Computers and computer equipment
|
11,676
|
|
9,716
|
|
|||
|
Leasehold improvements
|
5,084
|
|
2,950
|
|
|||
|
88,795
|
|
76,541
|
|
||||
|
Less: Accumulated depreciation and amortization
|
(44,576
|
)
|
(34,049
|
)
|
|||
|
Property, plant and equipment, net
|
$
|
44,219
|
|
$
|
42,492
|
|
|
Depreciation expense, excluding the amortization of capitalized internal-use software development costs, totaled
$5.2 million
,
$4.1 million
and
$2.6 million
for the
years ended
December 31, 2018
,
2017
, and
2016
respectively.
The Company recorded the following amounts related to capitalized internal-use software development costs during the periods indicated (in thousands):
|
Year Ended December 31,
|
|||||||||||
|
2018
|
2017
|
2016
|
|||||||||
|
Internal-use software development costs capitalized during the period
|
$
|
7,809
|
|
$
|
6,725
|
|
$
|
6,050
|
|
||
|
Amortization of capitalized internal-use software
|
6,240
|
|
5,102
|
|
4,458
|
|
|||||
|
Impairments of capitalized internal-use software
|
—
|
|
88
|
|
490
|
|
|||||
Stock-based compensation expense included in capitalized internal-use software development costs was
$0.6 million
for each of the
years ended
December 31, 2018
,
2017
and
2016
.
94
9. Commitments and Contingencies
Operating Leases
The Company leases office space under various noncancelable operating leases that expire at various dates through 2028. Rent expense from operating leases totaled
$3.0 million
,
$2.1 million
and
$1.5 million
for the years ended
December 31, 2018
,
2017
and
2016
, respectively. The Company also recognized sublease income of
$3.6 million
,
$3.1 million
and
$3.2 million
for the years ended
December 31, 2018
,
2017
and
2016
, respectively.
Build-to-Suit Lease
In December 2013, the Company executed a lease for
97,624
square feet of office space in San Francisco, California. The initial lease term is
seven years
with an option to renew for an additional
three years
, and the leased space represents two floors in a seven-floor building. The lease provided for a
$6.4 million
tenant improvement reimbursement allowance, which the Company utilized in 2014. In order for the facility to meet the Company’s operating specifications, both the landlord and the Company made structural changes as part of the improvement of the building, and as a result, the Company has concluded that it is the deemed partial owner of the building (for accounting purposes only) during the construction period. Accordingly, at lease inception, the Company recorded an asset of
$22.3 million
, representing its estimate of the fair market value of the leased space, and a corresponding lease financing obligation on the consolidated balance sheets.
Upon completion of construction, the Company evaluated the derecognition of the asset and liability as a sale-leaseback transaction. The Company concluded it did not meet the provisions needed for sale-leaseback accounting, and thus the lease is being accounted for as a financing obligation. Lease payments are allocated to (1) a reduction of the principal financing obligation; (2) imputed interest expense; and (3) land lease expense (which is considered an operating lease) representing an imputed cost to lease the underlying land of the facility. In addition, the underlying building asset is being depreciated over the building’s estimated useful life of
30 years
. At the conclusion of the lease term, the Company will derecognize both the net book values of the asset and financing obligation.
Land lease expense was
$0.9 million
for each of the years ended
December 31, 2018
,
2017
and
2016
. Interest expense related to the Company’s build-to-suit lease was
$3.4 million
,
$3.5 million
and
$3.5 million
for each of the years ended
December 31, 2018
,
2017
and
2016
, respectively.
As of
December 31, 2018
, the future minimum lease payments and sublease rental payments under noncancelable leases are as follows (in thousands):
|
Build-to-Suit
Lease |
Operating
Leases |
Sublease
Income |
Total
|
||||||||||||
|
2019
|
$
|
5,604
|
|
$
|
2,514
|
|
$
|
(4,003
|
)
|
$
|
4,115
|
|
|||
|
2020
|
5,772
|
|
2,360
|
|
(4,003
|
)
|
4,129
|
|
|||||||
|
2021
|
1,942
|
|
1,870
|
|
(1,167
|
)
|
2,645
|
|
|||||||
|
2022
|
—
|
|
1,678
|
|
—
|
|
1,678
|
|
|||||||
|
2023
|
—
|
|
1,483
|
|
—
|
|
1,483
|
|
|||||||
|
Thereafter
|
—
|
|
3,770
|
|
—
|
|
3,770
|
|
|||||||
|
Total minimum payments (income)
|
13,318
|
|
13,675
|
|
(9,173
|
)
|
17,820
|
|
|||||||
|
Less: Amount representing interest and taxes
|
(7,564
|
)
|
—
|
|
—
|
|
(7,564
|
)
|
|||||||
|
Total
|
$
|
5,754
|
|
$
|
13,675
|
|
$
|
(9,173
|
)
|
$
|
10,256
|
|
|||
In May 2018, the Company entered into a
ten
-year operating lease for its office space in Cork, Ireland. The lease expires in 2028. Monthly rent payments, which are included in the table above, are due beginning in January 2019 and total
$0.4 million
per year.
95
Letters of Credit
The Company has issued letters of credit under lease and other agreements, which have been collateralized with cash. This cash is classified as noncurrent restricted cash on the consolidated balance sheets based on the term of the underlying agreements. As of
December 31, 2018
, the Company had an outstanding letter of credit for
$1.0 million
related to its leased office space in San Francisco, California. In connection with the Ticketfly acquisition, the Company acquired a lease for which there was a letter of credit for
$0.8 million
. This letter of credit was terminated and the related restricted cash became unrestricted in the year ended December 31, 2018 as the underlying lease was terminated.
Creator Signing Fees and Creator Advances
Creator signing fees and creator advances represent contractual amounts paid in advance to customers pursuant to event ticketing and payment processing agreements. Certain of the Company’s contracts include terms where future payments to creators are committed to as part of the overall ticketing arrangement. The following table presents, by year, the future creator payments committed to under contract but not yet paid as of
December 31, 2018
(in thousands):
|
2019
|
$
|
8,328
|
|
|
2020
|
3,578
|
|
|
|
2021
|
386
|
|
|
|
2022
|
19
|
|
|
|
2023 and thereafter
|
—
|
|
|
|
$
|
12,311
|
|
|
Litigation and Loss Contingencies
The Company accrues estimates for resolution of legal and other contingencies when losses are probable and estimable. From time to time, the Company may become a party to litigation and subject to claims incident to the ordinary course of business, including intellectual property claims, labor and employment claims, and threatened claims, breach of contract claims, tax and other matters. The Company currently has no material pending litigation.
The Company is currently under audit in certain domestic jurisdictions with regard to indirect tax matters. The Company establishes reserves for indirect tax matters when it determines that the likelihood of a loss is probable, and the loss is reasonably estimable. Accordingly, the Company has established a reserve for the potential settlement of issues related to sales and other indirect taxes in the amount of $
19.2
million and
$28.9 million
as of
December 31, 2018
and 2017, respectively. These amounts, which represent management’s best estimates of its potential liability, include potential interest and penalties of $
1.2
million and $
3.5
million as of December 31, 2018 and 2017, respectively.
In June 2018, the Company publicly announced that a criminal was able to penetrate the Ticketfly website and steal certain consumer data, including names, email addresses, shipping addresses, billing addresses and phone numbers. For a short time, the Company disabled the Ticketfly platform to contain the risk of the cyber incident, which disabled ticket sales through Ticketfly during that period. Because of this incident, the Company has incurred costs related to responding to and remediating this incident and has suffered a loss of revenue for the period during which the Ticketfly platform was disabled. During the year ended December 31, 2018, the Company recorded an amount of
$7.0 million
for costs associated with this incident, of which
$6.7 million
was recorded as a reduction to net revenue and
$0.3 million
was recorded as an operating expense. This amount represents the Company’s best estimate of the total amount of creator accommodations to be made as a result of the incident. The Company also recorded
$6.6 million
related to insurance proceeds to be received from the Ticketfly incident as a reduction in general and administrative expenses in the year ended
December 31, 2018
. Such proceeds are a partial reimbursement for accommodations to creators which are recorded as contra revenue. As of December 31, 2018, the Company had a remaining liability balance of
$0.3 million
related to future accommodation payments and a
$0.6 million
receivable for insurance proceeds.
The Company does not believe that any ultimate liability resulting from any of these matters will have a material adverse effect on its business, consolidated financial position, results of operations or liquidity. However, the outcome of these matters is inherently uncertain. Therefore, if one or more of these matters were resolved against the Company for amounts in excess of management’s expectations, the Company’s financial statements, including in a particular reporting period in which any such outcome becomes probable and estimable, could be materially adversely affected.
96
Indemnifications
In the ordinary course of business, the Company enters into contractual arrangements under which the Company agrees to provide indemnification of varying scope and terms to business partners and other parties with respect to certain matters, including, but not limited to, losses arising out of the breach of such agreements, intellectual property infringement claims made by third parties, and other liabilities relating to or arising from the Company’s online ticketing platform or the Company’s acts or omissions. In these circumstances, payment may be conditional on the other party making a claim pursuant to the procedures specified in the particular contract. Further, the Company’s obligations under these agreements may be limited in terms of time and/or amount, and in some instances, the Company may have recourse against third parties for certain payments. In addition, the Company has indemnification agreements with its directors and executive officers that require the Company, among other things, to indemnify them against certain liabilities that may arise by reason of their status or service as directors or officers. The terms of such obligations vary.
10. Term Loans and Debt
Term loans consisted of the following at the dates indicated (in thousands):
|
December 31,
|
|||||||
|
2018
|
2017
|
||||||
|
Outstanding principal balance and accrued interest
|
$
|
73,594
|
|
$
|
29,704
|
|
|
|
Less: Unamortized discount and debt issuance costs
|
(872
|
)
|
(3,035
|
)
|
|||
|
Total term loans
|
$
|
72,722
|
|
$
|
26,669
|
|
|
|
Current portion of term loans
|
$
|
5,635
|
|
$
|
—
|
|
|
|
Term loans
|
67,087
|
|
26,669
|
|
|||
The Company entered into a loan and security agreement with, and issued warrants to purchase shares of redeemable convertible preferred stock to Western Technology Investments (WTI) in June 2017 (First WTI Loan Facility), which provided for a secured credit facility of up to
$60.0 million
of term debt. The First WTI Loan Facility contained customary events of default. In September 2017, the Company borrowed
$30.0 million
as a term loan under the facility with a maturity date of February 2022 which bore interest at
11.5%
annually (effective interest rate of
15.9%
). Monthly payments of interest were due for the first
24 months
and equal monthly installments of principal and interest were due for
30 months
thereafter. The loan could be prepaid at any time for an amount equal to the outstanding balance plus accrued interest, plus an amount equal to all scheduled but unpaid payments of interest that would have accrued and been payable through the maturity date.
In March 2018, the Company borrowed an additional
$30.0 million
under the First WTI Loan Facility with a maturity date of September 2022, which bore interest at
11.75%
annually (effective interest rate of
14.8%
). Monthly payments of interest were due for the first
24 months
and equal monthly installments of principal and interest were due for
30 months
thereafter.
In May 2018, the Company entered into a second loan and security agreement with WTI (Second WTI Loan Facility, and together with the First WTI Loan Facility, the WTI Loan Facilities) and issued additional warrants to purchase shares of Series G redeemable convertible preferred stock. The secured credit facility provided up to
$15.0 million
of term debt, which the Company borrowed in full as a term loan under the facility in May 2018. This debt bore interest at
12.0%
annually (effective interest rate of
14.7%
) and had a maturity date of November 2022. Monthly payments of interest were due for the first
24 months
and equal monthly installments of principal and interest were due for
30 months
thereafter. The WTI Loan Facilities were collateralized by substantially all of the Company's assets and intellectual property rights.
The Second WTI Loan Facility included a contingent prepayment feature under which if the Company consummated a qualified public offering within the first
24 months
of the term loan and the Company prepaid the term loan in conjunction with the qualified public offering, the Company would be required to prepay the outstanding contractual balance plus accrued interest within
fifteen
days of the consummation of a qualified public offering plus an additional amount equal to
50%
of all interest that would have been incurred through the end of first
24 months
of the loan. In connection with the Second WTI Loan Facility, the Company modified the terms of the First WTI Loan Facility so that the
$30.0 million
borrowed in March 2018 under the First WTI Loan Facility would be subject to the same contingent prepayment feature in the event of a qualified public offering that is included in the Second WTI Loan Facility.
97
The Company determined that these contingent prepayment features under the WTI term loans are embedded derivative assets, requiring bifurcation and separate accounting. These embedded derivatives initially had a fair value of
$2.1 million
as determined in May 2018 and immediately prior to the Company's repayment of the WTI debt (discussed below), the fair value of the embedded derivatives was determined to be
$4.2 million
. During the year ended December 31, 2018, the Company recorded the
$2.1 million
change in fair value of the term loan embedded derivatives in other income (expense), net on the consolidated statements of operations.
In September 2018, five days after the completion of the IPO, the Company exercised its prepayment option and fully repaid all amounts outstanding under the WTI Loan Facilities. The Company made a total cash payment of
$81.6 million
, consisting of
$74.2 million
of contractual principal and
$7.4 million
in prepayment penalties. The carrying value of the WTI Loan Facilities at the time of retirement was
$68.7 million
. This is less than the contractual principal paid to retire the debt due to (i) the fair value of the redeemable convertible preferred stock warrants that were issued in connection with the WTI Loan Facilities, which was bifurcated and accounted for as a discount to the face value of the WTI debt; and (ii) the fair value of the term loan embedded derivative which was bifurcated and accounted for as a premium to the face value of the WTI debt. In connection with the retirement of the WTI Loan Facilities, the Company recorded a loss on debt extinguishment of
$17.2 million
. Refer to Note 3 for discussion of the Company's gain on debt extinguishment recorded in connection with the retirement of the Promissory Note, resulting in a total net loss on debt extinguishment of
$0.2 million
for the year ended December 31, 2018. As of
December 31, 2018
, there are
no
amounts outstanding under the WTI Loan Facilities and all underlying agreements have been terminated.
In September 2018, the Company entered into a senior secured credit facility with a syndicate of banks consisting of
$75.0 million
aggregate principal amount of term loans (the New Term Loans) and a
$75.0 million
revolving credit facility (the New Revolving Credit Facility, and together with the New Term Loans, the New Credit Facilities). The New Term Loans were fully funded in September 2018 and the Company received cash proceeds of
$73.6 million
, net of arrangement fees of
$1.1 million
and upfront fees of
$0.3 million
. The Company has made no draw on the New Revolving Credit Facility as of
December 31, 2018
.
The New Term Loans amortize at a rate of
7.5%
per annum for the first
two
years of the New Credit Facilities,
10.0%
per annum for the third and fourth years and the first three quarters of the fifth year of the New Credit Facilities, with the balance due at maturity. The New Term Loans and the New Revolving Credit Facility are each expected to mature on the fifth anniversary of the effectiveness of the New Credit Facilities. The New Revolving Credit Facility has a commitment fee, which currently accrues at
0.40%
on the daily unused amount of the aggregate revolving commitments of the lenders.
All outstanding amounts under the New Credit Facilities bear interest, at the Company's options, at (i) a reserve adjusted LIBO Rate plus a margin between
2.25%
and
2.75%
or (ii) a base rate plus a margin between
1.25%
and
1.75%
, in each case determined on a quarterly basis based on the Company's consolidated total leverage ratio. The current annual interest rate for the New Term Loans is
4.88%
as of December 31, 2018.
The New Credit Facilities contain customary conditions to borrowing, events of default, and covenants. Financial covenants include maintaining a (i) maximum consolidated total leverage ratio; (ii) minimum consolidated interest coverage ratio; and (iii) minimum liquidity ratio. The Company was in compliance with all debt covenants as of December 31, 2018.
As of
December 31, 2018
, the contractual principal payments for the New Term Loans for the next five years are as follows (in thousands):
|
2019
|
$
|
5,625
|
|
|
2020
|
6,563
|
|
|
|
2021
|
7,500
|
|
|
|
2022
|
7,500
|
|
|
|
2023
|
46,406
|
|
|
|
Total
|
$
|
73,594
|
|
98
11. Redeemable Convertible Preferred Stock Warrants
In connection with the First WTI Loan Facility and the Second WTI Loan Facility discussed in Note 10, the Company issued warrants to WTI to purchase shares of our Series G redeemable convertible preferred stock. The preferred stock warrants became exercisable into
411,991
shares of Series G redeemable convertible preferred stock when the First WTI Loan Facility was executed in June 2017. In September 2017, the redeemable convertible preferred stock warrants became exercisable into an additional
205,995
shares of Series G redeemable convertible preferred stock when the Company borrowed
$30.0 million
under the First WTI Loan Facility. In March 2018, as a result of the Company borrowing the remaining
$30.0 million
under the First WTI Loan Facility, the Series G redeemable convertible preferred stock warrants became exercisable into an additional
205,995
shares of Series G redeemable convertible preferred stock. In May 2018, the Company issued additional warrants which were exercisable into
109,288
shares of Series G redeemable convertible preferred stock. The exercise price of all of the Series G redeemable convertible preferred stock warrants was
$16.3836
per share and the redeemable convertible preferred stock warrants had an expiration date
ten years
from the date of issuance. In September 2018, in connection with our IPO, the redeemable convertible preferred stock warrants were automatically exercised into shares of Class B common stock and the related liability was reclassified to additional paid-in capital.
Refer to Note 2 for discussion of the significant inputs used to determine the fair value of the redeemable convertible preferred stock warrants. The following table represents the changes in the liability relating to the redeemable convertible preferred stock warrants (in thousands):
|
Balance as of January 1, 2017
|
$
|
—
|
|
|
Issuances
|
5,071
|
|
|
|
Change in fair value
|
2,200
|
|
|
|
Balance as of December 31, 2017
|
7,271
|
|
|
|
Issuances
|
4,603
|
|
|
|
Change in fair value
|
9,591
|
|
|
|
Automatic conversion in connection with initial public offering
|
(21,465
|
)
|
|
|
Balance as of December 31, 2018
|
$
|
—
|
|
12. Stockholders' Equity
Redeemable Convertible Preferred Stock
Immediately prior to the closing of the Company's IPO,
41,628,207
shares of outstanding redeemable convertible preferred stock converted into
42,188,624
shares of Class B common stock (including additional shares issuable upon conversion of our Series G redeemable convertible preferred stock based on the IPO price of
$23.00
per share). Further, outstanding warrants to purchase
933,269
shares of our Series G redeemable convertible preferred stock automatically exercised into
997,193
shares of Class B common stock based on the IPO price of
$23.00
per share.
Common Stock
2004 and 2010 Stock Option Plans
In 2004, the board of directors and shareholders of the Company authorized and ratified the 2004 Stock Plan (2004 Plan), as amended. The 2004 Plan allows for the issuance of incentive stock options (ISOs), non-statutory stock options (NSOs) and stock purchase rights. The 2004 Plan states the maximum aggregate number of shares that may be subject to options or stock purchase rights and sold under the plan is
6,000,000
shares.
In 2010, the board of directors and shareholders of the Company authorized and ratified the 2010 Stock Plan (2010 Plan), as amended. The 2010 Plan allows for the issuance of ISOs, NSOs and stock purchase rights. The 2010 Plan states the maximum aggregate number of shares that may be subject to options or stock purchase rights and sold under the plan is
30,663,761
shares.
99
2018 Stock Option and Incentive plan
In August 2018, the 2018 Stock Option and Incentive Plan (2018 Plan) was adopted by the board of directors and approved by the shareholders and became effective in connection with the IPO. The 2018 Plan replaces the 2010 Plan as the board of directors has determined not to make additional awards under the 2010 Plan. The 2010 Plan will continue to govern outstanding equity awards granted thereunder. We initially reserved
7.7 million
shares of Class A common stock for the issuance of awards under the 2018 Plan and
7.2 million
shares of Class A common stock are reserved as of December 31, 2018.
Under the 2018 Plan, the Company’s board of directors has authorized two classes of common stock, Class A and Class B. Holders of Class A common stock are entitled to
one
vote per share and holders of Class B common stock are entitled to
ten
votes per share. The Company’s common stock has no preferences or privileges and is not redeemable. Holders of Class A and Class B common stock are entitled to dividends, if and when declared, by the Company’s board of directors. The 2018 Plan allows for the granting of options, stock appreciation rights, restricted stock and RSUs, unrestricted stock awards, dividend equivalent rights and cash-based awards.
As of
December 31, 2018
, there were
22,012,597
options issued and outstanding and
10,867,313
shares available for issuance under the 2004 Plan, 2010 Plan and 2018 Plan (collectively, the Plans).
Beginning January 1, 2019, and each January 1 thereafter, the number of shares of stock reserved and available for issuance under the 2018 Plan will cumulatively increase by five percent of the number of shares of Class A and Class B common stock outstanding on the immediately preceding December 31, or a lesser number of shares as approved by the board of directors.
Stock options granted typically vest over a
four
-year period from the date of grant. Options awarded under the Plans may be granted at an exercise price per share not less than the fair value at the date of grant and are exercisable up to
ten
years. Stock option activity under the Plans is as follows:
|
Outstanding
options |
Weighted-
average exercise price |
Weighted-
average remaining contractual term (years) |
Aggregate
intrinsic value (thousands) |
|||||||||
|
Balance as of December 31, 2016
|
13,669,181
|
|
$
|
4.60
|
|
5.9
|
$
|
26,710
|
|
|||
|
Granted
|
7,332,168
|
|
7.06
|
|
||||||||
|
Exercised
|
(1,376,872
|
)
|
1.24
|
|
7,600
|
|
||||||
|
Cancelled
|
(923,210
|
)
|
6.14
|
|
||||||||
|
Balance as of December 31, 2017
|
18,701,267
|
|
5.73
|
|
7.3
|
29,728
|
|
|||||
|
Granted
|
6,824,057
|
|
12.68
|
|
||||||||
|
Exercised
|
(1,727,899
|
)
|
4.69
|
|
16,816
|
|
||||||
|
Cancelled
|
(1,784,828
|
)
|
7.19
|
|
||||||||
|
Balance as of December 31, 2018
|
22,012,597
|
|
7.85
|
|
7.1
|
439,382
|
|
|||||
|
Vested and exercisable as of December 31, 2017
|
10,731,138
|
|
4.72
|
|
5.5
|
28,112
|
|
|||||
|
Vested and expected to vest as of December 31, 2017
|
17,781,271
|
|
5.65
|
|
6.8
|
29,978
|
|
|||||
|
Vested and exercisable as of December 31, 2018
|
12,462,693
|
|
5.75
|
|
5.6
|
274,883
|
|
|||||
|
Vested and expected to vest as of December 31, 2018
|
20,926,797
|
|
7.69
|
|
7.0
|
421,047
|
|
|||||
2018 Employee Stock Purchase plan
In August 2018, the board of directors adopted, and stockholders approved, the 2018 Employee Stock Purchase Plan (“ESPP”). A total of
1,534,500
shares of the Company’s Class A common stock have been initially authorized for issuance under the 2018 ESPP. Subject to any plan limitations, the 2018 ESPP allows eligible employees to contribute, through payroll deductions, up to
15%
of their earnings for the purchase of the Company’s Class A common stock at a discounted price per share. Except for the initial offering period, the ESPP provides for separate six-month offering periods. The initial offering period will run from September 20, 2018 through May 31, 2019. Unless otherwise determined by the board of directors, the Company’s Class A common stock will be purchased for the accounts of employees participating in the ESPP at a price per share that is the lesser of (1)
85%
of the fair market value of the Company’s Class A common stock on the first trading day of the offering period, which for the initial offering period is the price at which shares of the Company’s Class A common stock were first sold to the public, or (2)
85%
of the fair market value of the Company’s Class A common stock on the last trading
100
day of the offering period. During the year ended December 31, 2018,
no
shares of Class A common stock were purchased under the 2018 ESPP. The total expense related to the 2018 ESPP for year ended December 31, 2018 was
$0.4 million
.
Beginning January 1, 2019 and each January 1 thereafter, the number of shares of Class A common stock reserved and available for issuance under the ESPP will be cumulatively increased by the lesser of (1)
1,534,500
shares of Class A common stock, (2)
one percent
of the number of shares of Class B common stock of the Company outstanding on the immediately preceding December 31 or (3) a lesser number of shares of Class A common stock as determined by the board of directors.
Common Stock Subject to Repurchase
The 2010 Plan and the Company’s stock option agreement allow for the early exercise of stock options for certain individuals, as determined by the board of directors. Common stock purchased pursuant to an early exercise of stock options is not deemed to be outstanding for accounting purposes until those shares vest. The consideration received for an exercise of an option is considered to be a deposit of the exercise price and the related dollar amount is recorded as a liability. Upon termination of service, the Company may, at their discretion, repurchase unvested shares acquired through early exercise of stock options at a price equal to the price per share paid upon the exercise of such options. The Company includes unvested shares subject to repurchase in the number of shares of common stock outstanding.
At
December 31, 2018
and
December 31, 2017
, outstanding common stock included
55,537
and
103,133
shares, respectively, subject to repurchase related to stock options early exercised and unvested. The Company had a liability of
$0.4 million
and
$0.8 million
as of
December 31, 2018
and 2017, respectively, related to early exercises of stock options. The liability is reclassified into stockholders’ equity as the awards vest.
Stock-based Compensation Expense
All stock-based awards to employees and members of the Company’s board of directors are measured based on the grant date fair value of the awards and recognized in the consolidated statements of operations over the period during which the employee is required to perform services in exchange for the award (the vesting period of the award). The Company estimates the fair value of stock options granted using the Black-Scholes option pricing model and records stock-based compensation expense for service-based equity awards using the straight-line attribution method.
The following range of assumptions were used to estimate the fair value of stock options granted to employees:
|
Year Ended December 31,
|
|||||
|
2018
|
2017
|
2016
|
|||
|
Expected dividend yield
|
—
|
—
|
—
|
||
|
Expected volatility
|
43.5 - 48.2%
|
40.7 - 57.1%
|
57.6 - 62.8%
|
||
|
Risk-free interest rate
|
2.96 - 3.09%
|
1.92 - 2.1%
|
1.14 - 1.93%
|
||
|
Expected term (years)
|
5.28 - 6.08
|
5.02 - 6.08
|
6.02 - 6.08
|
||
The weighted-average fair value of stock options granted was
$8.16
, $
3.25
and
$4.06
for the year ended
December 31, 2018
, 2017 and
2016
, respectively. As of
December 31, 2018
and
2017
, the total unrecognized stock-based compensation related to unvested options outstanding was
$51.3 million
and
$23.7 million
, respectively, to be recognized over a weighted-average period of
2.73 years
and
2.68 years
, respectively.
The following range of assumptions were used to estimate the purchase rights granted under the 2018 ESPP on the first day of the offering period:
|
Year Ended
|
|
|
December 31, 2018
|
|
|
Expected dividend yield
|
—
|
|
Expected volatility
|
48.52%
|
|
Risk-free interest rate
|
2.37%
|
|
Expected term (years)
|
0.69
|
101
Restricted Stock Units
In 2011, the Company granted
802,900
shares of restricted stock units (RSUs) to one of its executive officers. The RSUs would fully vest upon the occurrence of a qualifying event, defined as a change of control or initial public offering of the Company under the Securities Act of 1933, as amended, within
six
years of the grant date. There is no time or service condition. On November 3, 2017, the Restricted Stock Unit Agreement was amended to modify the expiration date of November 9, 2017 to December 31, 2017. These RSUs expired on December 31, 2017 and on January 1, 2018, the Company granted RSUs with identical terms and conditions to the same executive officer with an expiration date of December 31, 2024. The Company completed its IPO in September 2018 and satisfied the performance condition. The Company recognized
$6.9 million
of stock-based compensation expense, based on the fair value of the award when it was granted, which is included in general and administrative expenses for the year ended December 31, 2018.
In May 2018, the Company granted a total of
230,000
shares of RSUs. These RSUs have both a service and performance condition. The service condition is satisfied by continued employment with the Company and these shares will lapse over a period of
four
years. The performance condition is the occurrence of a qualifying event, defined as a change of control or initial public offering of the Company under the Securities Act of 1933, as amended, within 10 years of the grant date. The performance condition has been satisfied due to the IPO taking place in September 2018 and the Company began recognizing expense for these awards. As of
December 31, 2018
, the Company has recognized $
0.4
million of stock-based compensation expense related to these RSUs.
Restricted stock activity for the year ended December 31, 2018 is presented as follows:
|
|
Outstanding
RSUs and RSAs
|
Weighted-average grant date fair value per share
|
Weighted-
average remaining contractual term (years) |
Aggregate
intrinsic value (thousands) |
||||||||
|
Balance at December 31, 2017
|
802,900
|
|
$
|
8.65
|
|
|||||||
|
Vested
|
(805,893
|
)
|
||||||||||
|
Awarded
|
686,072
|
|
16.09
|
|
||||||||
|
Cancelled
|
(8,799
|
)
|
31.79
|
|
||||||||
|
Balance at December 31, 2018
|
674,280
|
|
24.75
|
|
1.9
|
$
|
18,752
|
|
||||
|
Vested and expected to vest as of December 31, 2018
|
532,623
|
|
24.80
|
|
1.7
|
14,812
|
|
|||||
The Company recognized
$8.7 million
of stock-based compensation expense related to RSUs during the year ended December 31, 2018, and as of that date, the total unrecognized stock-based compensation related to RSUs outstanding was
$12.3 million
and will be recognized over a weighted-average period of
3.56 years
.
Sales of the Company’s Stock
In May 2018, employees and former employees of the Company sold an aggregate of
1.3 million
shares of the Company’s common stock to entities affiliated with an existing investor at a purchase price of
$13.12
per share, for an aggregate purchase price of
$17.2 million
. The purchase price was in excess of the fair value of such shares. As a result, during the year ended
December 31, 2018
, the Company recorded the excess of the purchase price above fair value of
$2.2 million
as compensation expense.
13. Net Loss Per Share
The Company calculates basic and diluted net loss per share attributable to common stockholders in conformity with the two-class method required for companies with participating securities. The Company considered all series of redeemable convertible preferred stock to have been participating securities as the holders were entitled to receive non-cumulative dividends on a pari passu basis in the event that a dividend was paid on common stock. Under the two-class method, the net loss attributable to common stockholders is not allocated to the redeemable convertible preferred stock as the holders of redeemable convertible preferred stock do not have a contractual obligation to share in losses.
Under the two-class method, basic net loss per share attributable to common stockholders is calculated by dividing the net loss by the weighted-average number of shares of common stock outstanding during the period, less shares subject to repurchase. Diluted net loss per share attributable to common stockholders is computed by giving effect to all potentially
102
dilutive common stock equivalents outstanding for the period. For purposes of this calculation, redeemable convertible preferred stock, stock options to purchase common stock, early exercised stock options, and warrants to purchase redeemable convertible preferred stock and common stock are considered common shares equivalents, but have been excluded from the calculation of diluted net loss per share attributable to common stockholders as their effect is anti-dilutive. Basic and diluted net loss per share was the same for each period presented, as the inclusion of all potential common shares outstanding would have been anti-dilutive.
The rights, including the liquidation and dividend rights, of the holders of Class A and Class B common stock are identical, except with respect to voting. As the liquidation and dividend rights are identical, the undistributed earnings are allocated on a proportionate basis and the resulting net loss per share attributed to common stockholders will, therefore, be the same for both Class A and Class B common stock on an individual or combined basis.
The following table sets forth the computation of basic and diluted net loss per share (in thousands, except per share data):
|
|
Year Ended December 31,
|
||||||||||
|
2018
|
2017
|
2016
|
|||||||||
|
Net loss
|
$
|
(64,078
|
)
|
$
|
(38,547
|
)
|
$
|
(40,392
|
)
|
||
|
Weighted-average shares used in computing net loss per share, basic and diluted
|
37,540
|
|
19,500
|
|
16,291
|
|
|||||
|
Net loss per share, basic and diluted
|
$
|
(1.71
|
)
|
$
|
(1.98
|
)
|
$
|
(2.48
|
)
|
||
The following outstanding shares of potentially dilutive securities were excluded from the computation of diluted net loss per share because including them would have had an anti-dilutive effect (in thousands):
|
December 31,
|
||||||||
|
2018
|
2017
|
2016
|
||||||
|
Redeemable convertible preferred stock
(on an if-converted basis) |
—
|
|
41,628
|
|
33,446
|
|
||
|
Stock-options to purchase common stock
|
22,013
|
|
18,701
|
|
13,709
|
|
||
|
Redeemable convertible preferred stock warrants
|
—
|
|
618
|
|
—
|
|
||
|
Restricted stock units
|
686
|
|
803
|
|
803
|
|
||
|
Early exercised options
|
56
|
|
115
|
|
151
|
|
||
|
Total
|
22,755
|
|
61,865
|
|
48,109
|
|
||
14. Income Taxes
Loss before the provision for (benefit from) income taxes consisted of the following for the periods indicated (in thousands):
|
Year Ended December 31,
|
|||||||||||
|
2018
|
2017
|
2016
|
|||||||||
|
Domestic
|
$
|
(50,133
|
)
|
$
|
(31,681
|
)
|
$
|
(37,901
|
)
|
||
|
International
|
(12,795
|
)
|
(6,879
|
)
|
(2,360
|
)
|
|||||
|
Total
|
$
|
(62,928
|
)
|
$
|
(38,560
|
)
|
$
|
(40,261
|
)
|
||
103
The components of the Company's income tax provision (benefit) were as follows for the periods indicated (in thousands):
|
Year Ended December 31,
|
|||||||||||
|
2018
|
2017
|
2016
|
|||||||||
|
Current tax expense
|
|||||||||||
|
Federal
|
$
|
234
|
|
$
|
—
|
|
$
|
—
|
|
||
|
State
|
(10
|
)
|
109
|
|
19
|
|
|||||
|
Foreign
|
823
|
|
278
|
|
170
|
|
|||||
|
Total current tax expense
|
1,047
|
|
387
|
|
189
|
|
|||||
|
Deferred tax expense (benefit)
|
|||||||||||
|
Federal
|
317
|
|
99
|
|
15
|
|
|||||
|
State
|
153
|
|
55
|
|
1
|
|
|||||
|
Foreign
|
(367
|
)
|
(554
|
)
|
(74
|
)
|
|||||
|
Total deferred tax expense (benefit)
|
103
|
|
(400
|
)
|
(58
|
)
|
|||||
|
Total income tax provision (benefit)
|
$
|
1,150
|
|
$
|
(13
|
)
|
$
|
131
|
|
||
The reconciliation of the Federal statutory income tax provision to the Company’s effective income tax provision is as follows for the periods indicated (in thousands):
|
Year Ended December 31,
|
|||||||||||
|
2018
|
2017
|
2016
|
|||||||||
|
Federal tax benefit at statutory rate
|
$
|
(13,298
|
)
|
$
|
(13,147
|
)
|
$
|
(13,733
|
)
|
||
|
State tax
|
(10
|
)
|
2,009
|
|
20
|
|
|||||
|
Foreign rate differential
|
1,315
|
|
2,513
|
|
1,125
|
|
|||||
|
Non-deductible permanent items
|
4,129
|
|
1,142
|
|
693
|
|
|||||
|
Stock-based compensation
|
(1,178
|
)
|
1,950
|
|
2,184
|
|
|||||
|
Tax credits
|
(922
|
)
|
(1,702
|
)
|
—
|
|
|||||
|
Change in valuation allowance
|
11,114
|
|
(14,653
|
)
|
9,842
|
|
|||||
|
Tax Act-revaluation of deferred taxes
|
—
|
|
21,875
|
|
—
|
|
|||||
|
Total
|
$
|
1,150
|
|
$
|
(13
|
)
|
$
|
131
|
|
||
On December 22, 2017, the Tax Act was enacted into law in the United States. The Tax Act significantly revises U.S. corporate income tax law by, among other things, lowering U.S. corporate income tax rates from 35% to 21%, implementing a territorial tax system, and imposing a one-time transition tax on deemed repatriated earnings of non-U.S. subsidiaries.
The U.S. tax law changes will not have a significant impact on the Company’s tax expense in the short-term due to the Company’s large net operating loss and tax credit carryovers and associated valuation allowance. The Tax Act’s new international rules, including Global Intangible Low-Taxed Income (GILTI), Foreign Derived Intangible Income (FDII), and Base Erosion Anti-Avoidance Tax (BEAT) are effective beginning in 2018. For 2018, the Company has included the effects of the Tax Act in its financial statements and concluded the impact was not material.
Regarding the new GILTI tax rules, the Company is required to make an accounting policy election to either treat taxes due on future GILTI inclusions in U.S. taxable income as a current period expense when incurred or reflect such portion of the future GILTI inclusions in U.S. taxable income that relate to existing basis differences in the Company's current measurement of deferred taxes. The Company has made a policy election to treat GILTI taxes as a current period expense.
Pursuant to SEC Staff Accounting Bulletin (SAB) 118 (regarding the application of ASC 740,
Income Taxes (ASC 740)
associated with the enactment of the Tax Act), the Company believes its accounting under ASC 740 for the provisions of the Tax Act is now complete.
104
The Company’s deferred tax assets and liabilities as of the dates indicated were as follows (in thousands):
|
Year Ended December 31,
|
|||||||
|
2018
|
2017
|
||||||
|
Deferred tax assets:
|
|||||||
|
Net operating losses
|
$
|
50,154
|
|
$
|
39,970
|
|
|
|
Accrual and reserves
|
7,725
|
|
7,845
|
|
|||
|
Tax credit carry-forward
|
8,503
|
|
6,683
|
|
|||
|
Stock-based compensation
|
5,944
|
|
3,642
|
|
|||
|
Depreciation and amortization
|
4,735
|
|
2,593
|
|
|||
|
Total deferred tax assets
|
77,061
|
|
60,733
|
|
|||
|
Valuation allowance
|
(75,436
|
)
|
(58,748
|
)
|
|||
|
Net deferred tax assets
|
1,625
|
|
1,985
|
|
|||
|
Deferred tax liabilities:
|
|||||||
|
Depreciation and amortization
|
(3,665
|
)
|
(3,925
|
)
|
|||
|
Net deferred taxes
|
$
|
(2,040
|
)
|
$
|
(1,940
|
)
|
|
The Company regularly assesses the realizability of its deferred tax assets and establishes a valuation allowance if it is more-likely-than-not that some portion of the deferred tax assets will not be realized. The ultimate realization of deferred tax assets is dependent upon the generation of future taxable income during the periods in which those temporary differences become deductible. Due to the Company’s history of net operating losses, the Company believes it is more likely than not that the vast majority of its federal, state, and certain foreign deferred tax assets will not be realized as of December 31, 2018 and December 31, 2017. The total valuation allowance recorded as of December 31, 2018, 2017 and 2016 was
$75.4 million
,
$58.7 million
and
$59.8 million
, respectively. The activity in the Company's deferred tax asset valuation allowance for the periods indicated was as follows (in thousands):
|
Year Ended December 31,
|
|||||||||||
|
2018
|
2017
|
2016
|
|||||||||
|
Balance, beginning of period
|
$
|
58,748
|
|
$
|
59,806
|
|
$
|
48,390
|
|
||
|
Charged to costs and expenses
|
13,243
|
|
—
|
|
11,416
|
|
|||||
|
Charged to other accounts
|
3,445
|
|
—
|
|
—
|
|
|||||
|
Deductions
|
—
|
|
(1,058
|
)
|
—
|
|
|||||
|
Balance, end of period
|
$
|
75,436
|
|
$
|
58,748
|
|
$
|
59,806
|
|
||
As of December 31, 2018 and 2017, the Company has net operating loss carryforwards for federal income tax purposes of
$140.6 million
and
$135.9 million
, respectively, available to reduce future taxable income. The federal net operating loss carryforwards will begin to expire, if not utilized, in 2025. In addition, the Company has
$49.6 million
and
$46.0 million
of net operating loss carryforwards available to reduce future taxable income for California state income tax purposes for year ended December 31, 2018 and 2017, respectively. The state net operating loss carryforwards will begin to expire, if not utilized, in 2023. The federal and state net operating loss carryforwards are subject to various annual limitations under Section 382 of the Internal Revenue Code and similar state provisions.
As of December 31, 2018, the Company had Federal and California Research and Development Credits of
$7.8 million
and
$6.6 million
, respectively. The Federal Research and Development Credits will begin to expire, if not utilized, in 2031. The California Research and Development Credits do not expire as it has an indefinite life. As of December 31, 2018 and 2017, the Company had California EZ Hiring Tax Credits of
$2.2 million
. The California Hiring Tax Credits will begin to expire, if not utilized, in 2019.
As of December 31, 2018, 2017 and 2016, the Company had unrecognized tax benefits of
$7.2 million
,
$5.5 million
and
zero
, respectively, which would not affect the effective tax rate because of the Company's valuation allowance position. A reconciliation of the unrecognized tax benefit for the periods indicated is as follows (in thousands):
105
|
Balance as of December 31, 2016
|
$
|
—
|
|
|
Gross amount of increases in unrecognized tax benefits for tax positions taken in current year
|
1,526
|
|
|
|
Gross amount of increases in unrecognized tax benefits for tax positions taken in prior period
|
3,970
|
|
|
|
Balance as of December 31, 2017
|
5,496
|
|
|
|
Gross amount of increases in unrecognized tax benefits for tax positions taken in current year
|
1,744
|
|
|
|
Gross amount of decreases in unrecognized tax benefits for tax positions taken in prior period
|
—
|
|
|
|
Balance as of December 31, 2018
|
$
|
7,240
|
|
The Company classifies uncertain tax positions as non-current income tax liabilities unless expected to be paid within one year or otherwise directly related to an existing deferred tax asset, in which case the uncertain tax position is recorded net of the asset on the consolidated balance sheet. As of December 31, 2018,
$7.2 million
of the Company’s gross unrecognized tax benefits were recorded as a reduction of the related deferred tax assets.
The Company’s policy is to recognize interest and penalties accrued on any unrecognized tax benefits as a component of its provision for income taxes. The amount of interest and penalties accrued as of December 31, 2017 and 2018 was zero.
The Company does not anticipate that its total unrecognized tax benefits will significantly change due to settlement of examination or the expiration of statute of limitations during the next 12 months.
The Company files income tax returns in the U.S. federal jurisdiction as well as many U.S. states and certain foreign jurisdictions. Material jurisdictions where the Company is subject to potential examination include the United States, United Kingdom and Netherlands. The Company is subject to examination in these jurisdictions for all years since 2006. Fiscal years outside the normal statute of limitation remain open to audit due to tax attributes generated in the early years which have been carried forward and may be audited in subsequent years when utilized. The Company is not currently under examination for income taxes in any jurisdiction.
15. Geographic Information
The following table presents the Company's total net revenue by geography based on the currency of the underlying transaction (in thousands):
|
Year Ended December 31,
|
|||||||||||
|
2018
|
2017
|
2016
|
|||||||||
|
United States
|
$
|
211,705
|
|
$
|
141,118
|
|
$
|
97,454
|
|
||
|
International
|
79,906
|
|
60,479
|
|
36,045
|
|
|||||
|
Total net revenue
|
$
|
291,611
|
|
$
|
201,597
|
|
$
|
133,499
|
|
||
No individual country included in the International line above represents more than 10% of the total consolidated net revenue for any of the periods presented. Substantially all of the Company's long-lived assets are located in the United States.
106
Item 9. Changes in and Disagreements With Accountants on Accounting and Financial Disclosures
None.
Item 9A. Controls and Procedures
Evaluation of Disclosure Controls and Procedures
Our management, with the participation of our principal executive officer and principal financial officer, has evaluated the effectiveness of our disclosure controls and procedures (as defined in Rules 13a-15(e) and 15d-15(e) under the Securities Exchange Act of 1934, as amended (the Exchange Act)), as of the end of December 31, 2018. Based on such evaluation, our principal executive officer and principal financial officer have concluded that as of such date, our disclosure controls and procedures were effective at a reasonable assurance level.
Management's Report on Internal Control Over Financial Reporting
This Annual Report on Form 10-K does not include a report of management's assessment regarding internal control over financial reporting or an attestation report of our independent registered public accounting firm as permitted in this transition period under the rules of the SEC for newly public companies.
Changes in Internal Control Over Financial Reporting
There was no change in our internal control over financial reporting (as defined in Rules 13a-15(d) and 15d-15(d) under the Exchange Act) that occurred during the fiscal quarter ended December 31, 2018 that has materially affected, or is reasonably likely to materially affect, our internal control over financial reporting.
Inherent Limitations on Effectiveness of Disclosure Controls and Procedures
Our management, including our principal executive officer and principal financial officer, do not expect that our disclosure controls and procedures or our internal control over financial reporting will prevent all errors and all fraud. A control system, no matter how well designed and operated, can provide only reasonable, not absolute, assurance that the objectives of the control system are met. Further, the design of a control system must reflect the fact that there are resource constraints, and the benefits of controls must be considered relative to their costs. Because of the inherent limitations in all control systems, no evaluation of controls can provide absolute assurance that all control issues and instances of fraud, if any, have been detected. These inherent limitations include the realities that judgments in decision-making can be faulty, and that breakdowns can occur because of a simple error or mistake. Additionally, controls can be circumvented by the individual acts of some persons, by collusion of two or more people or by management override of the controls. The design of any system of controls is also based in part upon certain assumptions about the likelihood of future events, and there can be no assurance that any design will succeed in achieving its stated goals under all potential future conditions; over time, controls may become inadequate because of changes in conditions, or the degree of compliance with policies or procedures may deteriorate. Due to inherent limitations in a cost-effective control system, misstatements due to error or fraud may occur and not be detected.
Item 9B. Other Information
None.
107
PART III
Item 10. Directors, Executive Officers and Corporate Governance
The information required by this item will be set forth in our definitive proxy statement to be filed with the Securities and Exchange Commission not later than 120 days after the end of our fiscal year ended December 31, 2018 in connection with our 2019 annual meeting of stockholders (the Proxy Statement), and is incorporated herein by reference.
Codes of Business Conduct and Ethics
Our board of directors has adopted a Code of Business Conduct and Ethics that applies to all officers, directors and employees, which is available on our website at (investor.eventbrite.com) under "Corporate Governance." We intend to satisfy the disclosure requirement under Item 5.05 of Form 8-K regarding amendments to, or waiver from, a provision of our Code of Business Conduct and Ethics and by posting such information on the website address and location specified above.
Item 11. Executive Compensation
The information required by this item will be set forth in the Proxy Statement and is incorporated herein by reference.
Item 12. Security Ownership of Certain Beneficial Owners and Management and Related Stockholder Matters
The information required by this item will be set forth in the Proxy Statement and is incorporated herein by reference.
Item 13. Certain Relationships and Related Transactions, and Director Independence
The information required by this item will be set forth in the Proxy Statement and is incorporated herein by reference.
Item 14. Principal Accounting Fees and Services
The information required by this item will be set forth in the Proxy Statement and is incorporated herein by reference.
108
PART IV
Item 15. Exhibits and Financial Statement Schedules
(a)The following documents are filed as part of this report:
1. Financial Statements
See Index to Financial Statements at Item 8 herein.
2. Financial Statement Schedules
Schedules not listed above have been omitted because they are not required, not applicable, or the required information is otherwise included.
3. Exhibits
The exhibits listed below are filed as part of this Annual Report on Form 10-K or are incorporated herein by reference, in each case as indicated below.
Exhibit Index
|
Description of Exhibits
|
Incorporated by Reference
|
|||||||
|
Exhibit
Number
|
|
Form
|
Exhibit Number
|
Date Filed
|
||||
|
S-1
|
2.1
|
August 23, 2018
|
||||||
|
S-1
|
2.2
|
August 23, 2018
|
||||||
|
S-1
|
2.3
|
August 23, 2018
|
||||||
|
S-1/A
|
3.2
|
August 28, 2018
|
||||||
|
S-1/A
|
3.4
|
August 28, 2018
|
||||||
|
S-1/A
|
4.1
|
September 7, 2018
|
||||||
|
S-1
|
4.2
|
August 23, 2018
|
||||||
109
|
S-1
|
10.1
|
August 23, 2018
|
||||||
|
S-1
|
10.2
|
August 23, 2018
|
||||||
|
S-1
|
10.3
|
August 23, 2018
|
||||||
|
10.4
#
|
S-1
|
10.4
|
August 23, 2018
|
|||||
|
10.5
#
|
S-1
|
10.5
|
August 23, 2018
|
|||||
|
10.6
#
|
||||||||
|
10.7
#
|
S-1
|
10.7
|
August 23, 2018
|
|||||
|
10.8
#
|
S-1/A
|
10.8
|
August 28, 2018
|
|||||
|
10.9
#
|
||||||||
|
10.10
#
|
S-1
|
10.10
|
August 23, 2018
|
|||||
|
10.11
#
|
S-1
|
10.11
|
August 23, 2018
|
|||||
|
10.12
#
|
S-1
|
10.22
|
August 23, 2018
|
|||||
|
10.13
#
|
S-1
|
10.13
|
August 23, 2018
|
|||||
|
10.14
#
|
S-1
|
10.14
|
August 23, 2018
|
|||||
|
10.15
#
|
S-1
|
10.15
|
August 23, 2018
|
|||||
|
10.16
#
|
S-1
|
10.16
|
August 23, 2018
|
|||||
|
10.17
#
|
S-1
|
10.17
|
August 23, 2018
|
|||||
|
10.18
#
|
S-1/A
|
10.18
|
August 28, 2018
|
|||||
|
S-1
|
10.19
|
August 23, 2018
|
||||||
|
S-1
|
10.20
|
August 23, 2018
|
||||||
|
S-1
|
10.21
|
August 23, 2018
|
||||||
|
10.22
#
|
S-1
|
10.22
|
August 23, 2018
|
|||||
|
10.23
#
|
S-1/A
|
10.23
|
September 7, 2018
|
|||||
110
|
10.24
#
|
S-1/A
|
10.24
|
September 7, 2018
|
|||||
|
S-1/A
|
10.25.1
|
September 6, 2018
|
||||||
|
S-1/A
|
10.25.2
|
September 6, 2018
|
||||||
|
8-K
|
10.1
|
October 1, 2018
|
||||||
|
10.27
#
|
||||||||
|
10.28
#
|
||||||||
|
10.29
#
|
||||||||
|
10.30
#
|
||||||||
|
10.31
#
|
8-K
|
10.1
|
January 23, 2019
|
|||||
|
101.INS
|
XBRL Instance Document
|
|||||||
|
101.SCH
|
XBRL Taxonomy Extension Schema Document
|
|||||||
|
101.CAL
|
XBRL Taxonomy Extension Calculation Linkbase Document
|
|||||||
|
101.DEF
|
XBRL Taxonomy Extension Definition Linkbase Document
|
|||||||
|
101.LAB
|
XBRL Taxonomy Extension Label Linkbase Document
|
|||||||
|
101.PRE
|
XBRL Taxonomy Extension Presentation Linkbase Document
|
|||||||
*The certifications furnished in Exhibit 32.1 hereto are deemed to accompany this Annual Report on Form 10-K and will not be deemed "filed" for purposes of Section 18 of the Securities Exchange Act of 1934, as amended, except to the extent that the registrant specifically incorporates it by reference.
# Indicates management contract or compensatory plan, contract or agreement.
111
Item 16. Form 10-K Summary
None.
112
Signatures
Pursuant to the requirements of Section 13 or 15(d) of the Securities Exchange Act of 1934, as amended, the registrant has duly caused this report to be signed on its behalf by the undersigned, thereunto duly authorized.
|
March 7, 2019
|
Eventbrite, Inc.
|
|
|
By:
|
/s/ Julia Hartz
|
|
|
Julia Hartz
|
||
|
Chief Executive Officer
|
||
POWER OF ATTORNEY
Each person whose signature appears below constitutes and appoints Julia Hartz, Randy Befumo and Samantha Harnett, and each of them, as his or her true and lawful attorney-in-fact and agent, with full power of substitution and resubstitution, for him or her and in his or her name, place and stead, in any and all capacities, to sign any and all amendments to this Annual Report on Form 10-K, and to file the same, with all exhibits thereto, and other documents in connection therewith, with the Securities and Exchange Commission, granting unto said attorneys-in-fact and agents, and each of them, full power and authority to do and perform each and every act and thing requisite and necessary to be done in connection therewith, as fully to all intents and purposes as he or she might or could do in person, hereby ratifying and confirming all that said attorneys-in-fact and agents, or any of them, or their or his or her substitutes, may lawfully do or cause to be done by virtue thereof.
Pursuant to the requirements of the Securities Exchange Act of 1934, as amended, this report has been signed below by the following persons on behalf of the registrant and in the capacities and on the dates indicated:
113
|
Signature
|
Title
|
Date
|
|
/s/ Julia Hartz
|
Chief Executive Officer and Director
(Principal Executive Officer)
|
March 7, 2019
|
|
Julia Hartz
|
||
|
/s/ Randy Befumo
|
Chief Financial Officer
(Principal Financial Officer)
|
March 7, 2019
|
|
Randy Befumo
|
||
|
/s/ Shane Crehan
|
Chief Accounting Officer
(Principal Accounting Officer)
|
March 7, 2019
|
|
Shane Crehan
|
||
|
/s/ Katherine August de-Wilde
|
Director
|
March 7, 2019
|
|
Katherine August de-Wilde
|
||
|
/s/ Roelof Botha
|
Lead Independent Director
|
March 7, 2019
|
|
Roelof Botha
|
||
|
/s/ Andrew Dreskin
|
President of Music and Director
|
March 7, 2019
|
|
Andrew Dreskin
|
||
|
/s/ Kevin Hartz
|
Chairman and Director
|
March 7, 2019
|
|
Kevin Hartz
|
||
|
/s/ Jane Lauder
|
Director
|
March 7, 2019
|
|
Jane Lauder
|
||
|
/s/ Sean P. Moriarty
|
Director
|
March 7, 2019
|
|
Sean P. Moriarty
|
||
|
/s/ Lorrie M. Norrington
|
Director
|
March 7, 2019
|
|
Lorrie M. Norrington
|
||
|
/s/ Helen Riley
|
Director
|
March 7, 2019
|
|
Helen Riley
|
||
|
/s/ Steffan C. Tomlinson
|
Director
|
March 7, 2019
|
|
Steffan C. Tomlinson
|
||
114
TABLE OF CONTENTS
Part IItem 1. BusinessItem 1A. Risk FactorsItem 1B. Unresolved Staff CommentsItem 2. PropertiesItem 3. Legal ProceedingsItem 4. Mine Safety DisclosuresPart IIItem 5. Market For Registrant's Common Equity, Related Stockholder Matters and Issuer Purchases Of Equity SecuritiesItem 6. Selected Financial DataItem 7. Management's Discussion and Analysis Of Financial Condition and Results Of OperationsItem 7A. Quantitative and Qualitative Disclosures About Market RiskItem 8. Financial Statements and Supplementary DataItem 9. Changes in and Disagreements with Accountants on Accounting and Financial DisclosuresItem 9A. Controls and ProceduresItem 9B. Other InformationPart IIIItem 10. Directors, Executive Officers and Corporate GovernanceItem 11. Executive CompensationItem 12. Security Ownership Of Certain Beneficial Owners and Management and Related Stockholder MattersItem 13. Certain Relationships and Related Transactions, and Director IndependenceItem 14. Principal Accounting Fees and ServicesPart IVItem 15. Exhibits and Financial Statement SchedulesItem 16. Form 10-k Summary