EBAY INC
10-Ks and 10-Qs
|
|
|
|
|
|
|
|
|
|
|
|
|
|
|
|
|
|
|
|
|
|
|
|
|
|
|
|
|
|
|
|
|
|
|
|
|
|
|
|
|
|
|
|
|
|
|
|
|
|
|
|
|
UNITED STATES
SECURITIES AND EXCHANGE COMMISSION
Washington, D.C. 20549
Form 10-K
|
[x]
|
ANNUAL REPORT PURSUANT TO SECTION 13 OR 15(d) OF THE SECURITIES EXCHANGE ACT OF 1934
|
For the fiscal year ended
December 31, 2011
.
OR
|
[ ]
|
TRANSITION REPORT PURSUANT TO SECTION 13 OR 15(d) OF THE SECURITIES EXCHANGE ACT OF 1934
|
For the Transition Period from to .
Commission file number 000-24821
eBay Inc.
(Exact name of registrant as specified in its charter)
|
Delaware
|
77-0430924
|
|
(State or other jurisdiction of
incorporation or organization)
|
(I.R.S. Employer
Identification Number)
|
|
2145 Hamilton Avenue
San Jose, California
|
95125
|
|
(Address of principal
executive offices)
|
(Zip Code)
|
Registrant's telephone number, including area code:
(408) 376-7400
Securities registered pursuant to Section 12(b) of the Securities Exchange Act of 1934:
|
Title of each class
|
Name of exchange on which registered
|
|
Common stock
|
The Nasdaq Global Select Market
|
Securities registered pursuant to Section 12(g) of the Securities Exchange Act of 1934:
None
Indicate by check mark if the registrant is a well-known seasoned issuer, as defined in Rule 405 of the Securities Act. Yes [x] No [ ]
Indicate by check mark if the registrant is not required to file reports pursuant to Section 13 or Section 15(d) of the Exchange Act. Yes [ ] No [x]
Indicate by check mark whether the registrant (1) has filed all reports required to be filed by Section 13 or 15(d) of the Exchange Act during the preceding 12 months (or for such shorter period that the registrant was required to file such reports), and (2) has been subject to such filing requirements for the past 90 days. Yes [x] No [ ]
Indicate by check mark whether the registrant has submitted electronically and posted on its corporate Web site, if any, every Interactive Data File required to be submitted and posted pursuant to Rule 405 of Regulation S-T (§ 232.405 of this chapter) during the preceding 12 months (or for such shorter period that the registrant was required to submit and post such files). Yes [x] No [ ]
Indicate by check mark if disclosure of delinquent filers pursuant to Item 405 of Regulation S-K is not contained herein, and will not be contained, to the best of the registrant's knowledge, in definitive proxy or information statements incorporated
by reference in Part III of this Form 10-K or any amendment to this Form 10-K. Yes [x] No [ ]
Indicate by check mark whether the registrant is a large accelerated filer, an accelerated filer, a non-accelerated filer or a smaller reporting company. See the definitions of “large accelerated filer,” “accelerated filer,” and “smaller reporting company” in Rule 12b-2 of the Exchange Act.
|
Large accelerated filer
|
[x]
|
Accelerated filer
|
[ ]
|
|
|
Non-accelerated filer
|
[ ]
|
(Do not check if a smaller reporting company)
|
Smaller reporting company
|
[ ]
|
Indicate by check mark whether the registrant is a shell company (as defined in Rule 12b-2 of the Exchange Act).
Yes [ ] No [x]
As of
June 30, 2011
, the aggregate market value of the registrant's common stock held by non-affiliates of the registrant was
$36,927,714,233
based on the closing sale price as reported on The Nasdaq Global Select Market.
Indicate the number of shares outstanding of each of the registrant's classes of common stock, as of the latest
practicable date.
|
Class
|
Outstanding as of January 23, 2012
|
|
Common Stock, $0.001 par value per share
|
1,286,914,976 shares
|
DOCUMENTS INCORPORATED BY REFERENCE
Part III incorporates information by reference from the definitive proxy statement for the registrant's Annual Meeting of Stockholders to be held on or about
April 26, 2012
.
eBay Inc.
Form 10-K
For the Fiscal Year Ended
December 31, 2011
TABLE OF CONTENTS
|
Page
|
||
|
Part I
|
||
|
Item 1.
|
Business
|
|
|
Item 1A.
|
Risk Factors
|
|
|
Item 1B.
|
Unresolved Staff Comments
|
|
|
Item 2.
|
Properties
|
|
|
Item 3.
|
Legal Proceedings
|
|
|
Item 4.
|
[Removed and Reserved]
|
|
|
Part II
|
||
|
Item 5.
|
Market for Registrant's Common Equity, Related Stockholder Matters and Issuer Purchases of Equity Securities
|
|
|
Item 6.
|
Selected Financial Data
|
|
|
Item 7.
|
Management's Discussion and Analysis of Financial Condition and Results of Operations
|
|
|
Item 7A.
|
Quantitative and Qualitative Disclosures About Market Risk
|
|
|
Item 8.
|
Financial Statements and Supplementary Data
|
|
|
Item 9.
|
Changes in and Disagreements With Accountants on Accounting and Financial Disclosure
|
|
|
Item 9A.
|
Controls and Procedures
|
|
|
Item 9B.
|
Other Information
|
|
|
Part III
|
||
|
Item 10.
|
Directors, Executive Officers and Corporate Governance
|
|
|
Item 11.
|
Executive Compensation
|
|
|
Item 12.
|
Security Ownership of Certain Beneficial Owners and Management and Related Stockholder Matters
|
|
|
Item 13.
|
Certain Relationships and Related Transactions and Director Independence
|
|
|
Item 14.
|
Principal Accounting Fees and Services
|
|
|
Part IV
|
||
|
Item 15.
|
Exhibits and Financial Statement Schedules
|
|
3
PART I
FORWARD-LOOKING STATEMENTS
This Annual Report on Form 10-K contains forward-looking statements within the meaning of Section 27A of the Securities Act of 1933 and Section 21E of the Securities Exchange Act of 1934, including statements that involve expectations, plans or intentions (such as those relating to future business, future results of operations or financial condition, new or planned features or services, or management strategies). You can identify these forward-looking statements by words such as “may,” “will,” “would,” “should,” “could,” “expect,” “anticipate,” “believe,” “estimate,” “intend,” “plan” and other similar expressions. These forward-looking statements involve risks and uncertainties that could cause our actual results to differ materially from those expressed or implied in our forward-looking statements. Such risks and uncertainties include, among others, those discussed in “Item 1A: Risk Factors” of this Annual Report on Form 10-K, as well as in our consolidated financial statements, related notes, and the other information appearing elsewhere in this report and our other filings with the Securities and Exchange Commission, or the SEC. We do not intend, and undertake no obligation, to update any of our forward-looking statements after the date of this report to reflect actual results or future events or circumstances. Given these risks and uncertainties, readers are cautioned not to place undue reliance on such forward-looking statements.
|
ITEM 1:
|
BUSINESS
|
eBay Inc. was formed as a sole proprietorship in September 1995 and was incorporated in California in May 1996. In April 1998, we reincorporated in Delaware, and in September 1998, we completed the initial public offering of our common stock. Our principal executive offices are located at 2145 Hamilton Avenue, San Jose, California 95125, and our telephone number is (408) 376-7400. When we refer to “we,” “our,” “us” or “eBay” in this Annual Report on Form 10-K, we mean the current Delaware corporation (eBay Inc.) and its California predecessor, as well as all of its consolidated subsidiaries. When we refer to “eBay.com,” we mean the online marketplace located at www.ebay.com and its localized counterparts. When we refer to “PayPal,” we mean the online payments platform located at www.paypal.com and its localized counterparts. When we refer to “GSI,” we mean the ecommerce and interactive marketing services provided by GSI Commerce, which we purchased in June 2011. When we refer to “Skype,” we mean the Internet communications offerings provided by Skype Technologies S.A., which we sold in November 2009. As part of the sale, we maintained a 30 percent equity interest in the buyer of Skype, which we sold to Microsoft Corp. in October 2011.
We are a global commerce platform and payments leader. We enable commerce through three reportable segments: Marketplaces, Payments and GSI. These segments provide online platform, services and tools to help individuals and small, medium and large merchants around the globe establish online and mobile commerce and payments. In addition, through an initiative we refer to as X.commerce, we have created an open source platform that provides software developers and merchants access to our applications programming interfaces, or APIs, to develop software and solutions for commerce. As of December 31, 2011, we had more than 100 million active users transacting on our sites, millions of merchants using one or more of our platforms, and a developer community with more than 800,000 members using our APIs. We operate a vibrant global marketplace designed to bridge online, mobile and offline shopping and enable consumers to find what they want, when they want it. See the definition of "active users" in our Marketplaces and Payments discussions below.
For financial information about our reportable segments as well as the geographic areas where we conduct business, please see "Note 6 – Segments" to the consolidated financial statements included in this report. Additionally, please see the information in "Item 1A: Risk Factors" under the caption "There are many risks associated with our international operations," which describes risks associated with the foreign operations of our reportable segments.
Marketplaces
Marketplaces brings buyers and sellers together through fully automated and easy-to-use online websites and mobile applications that are generally available throughout the world at any time, including through localized eBay.com sites in many countries. We had approximately 100.4 million active users at the end of 2011, compared to approximately 94.5 million at the end of 2010. We define an active user as any user who bid on, bought or listed an item on any of our eBay Marketplaces trading platforms, excluding users of Half.com, StubHub, and our Korean subsidiaries, during the preceding 12-month period. Users may register more than once, and as a result may have more than one account.
Our Marketplaces segment includes our core ecommerce platform eBay.com, our vertical shopping sites such as StubHub, Fashion, Motors and Half.com, our classifieds websites such as Marktplaats.nl and mobile.de, and advertising
4
services. Additionally, Marketplaces has acquired technologies to help enable new commerce opportunities, including RedLaser to facilitate mobile commerce, Milo to enable search for goods at local retailers and Hunch to improve search and merchandising based on customers' needs and tastes. These acquisitions are intended to deliver new services to merchants and consumers by utilizing innovative technology and improved experiences across multiple channels of commerce.
Our Marketplaces platforms offer the following features:
We provide a variety of access points for consumers to shop virtually anytime, anywhere
eBay's Marketplaces platforms are accessible from computers with Internet access and mobile devices. We offer downloadable, easy to use mobile applications for the iPhone, the iPad and Android devices for eBay.com and some of our other websites and vertical shopping experiences, including StubHub, Fashion, Motors and Half.com. We also maintain a mobile version of our eBay.com website for use with other Internet-enabled phones and devices and continue to develop our mobile applications on an ongoing basis. As of December 31, 2011 our mobile applications had been downloaded more than 65 million times and, in 2011, approximately $5 billion was transacted across all of our mobile applications, compared to nearly $2 billion in 2010.
We offer a number of buying and selling formats, including fixed price and auction
Sellers can choose to list their products and services through fixed price listings on eBay.com, our core Marketplaces platform, and our classifieds websites or through an auction-based format on eBay.com. Our fixed price format allows buyers and sellers to close transactions at a pre-determined price set by the seller, but also allows sellers to signal that they would be willing to close the transaction at a lower price through the Best Offer feature. Our auction-style format allows a seller to select a minimum price for opening bids. Additional options and features applicable to auction listings include the ability to set a Reserve Price and Buy It Now feature. The duration of auctions typically ranges from one day to 10 days. In 2011, our fixed-price listing format continued to increase in popularity on eBay.com, accounting for approximately 63% of our gross merchandise volume, or GMV, with our auction-style format accounting for the remaining approximately 37% of GMV. We define GMV as the total value of all successfully closed items between users on eBay Marketplaces trading platforms during the relevant period, regardless of whether the buyer and seller actually consummated the transaction (excluding eBay's classifieds websites and Shopping.com).
In addition, our eBay Stores format enables sellers to exhibit all of their listings in a single place on one of our eBay Marketplaces platforms and to describe their respective businesses through customized pages. eBay Stores also provides sellers with tools to build, manage, promote and track their businesses.
Our classified websites are available in over 1,000 cities around the world and are primarily designed to help people trade at a local level. Our classifieds websites include Den Blå Avis, BilBasen, eBay Classifieds (including eBay Anuncios, eBay Kleinanzeigen and eBay Annunci), Gumtree, Kijiji, LoQUo, Marktplaats.nl, mobile.de, Alamaula and Rent.com. In addition, we have a non-controlling equity investment in craigslist, Inc., which operates the craigslist classifieds websites.
We offer a variety of specialized vertical formats
We continue to customize our buying and selling experiences to make it easier for users to list, find and buy items by offering formats dedicated to specific products or categories. On our core eBay.com websites, we have built specialized experiences for certain vertical formats, such as Fashion, Motors (vehicles, parts and accessories), and Electronics. Our Fashion application for mobile devices comes enabled with social media and email sharing functions. In our Electronics vertical, we also offer catalogs and product
-
based experiences to help users list and find items more easily.
StubHub is a leading ticket marketplace, enabling fans to buy and sell tickets to a large selection of sports, concert, theater and other live entertainment events. StubHub's online marketplace, dedicated solely to tickets, provides fans the ability to buy and sell their tickets in a safe, convenient and reliable environment. StubHub's partners include approximately 60 teams in the NBA, NHL, MLB and NCAA. In December 2011, StubHub launched its first international website in the United Kingdom.
We are building services to help sellers offer goods locally, both online or through a mobile device, providing them with another channel for product distribution
With the acquisitions of RedLaser and Milo, we are helping merchants offer their local inventory online or through mobile devices and helping consumers find what they are looking for at local stores. RedLaser allows consumers to scan bar codes in order to find the goods they are looking for in a variety of locations, both online and offline, while Milo enables local inventory to be viewed online or on a mobile device. We plan to expand the functionality and use of these tools and services to
5
more merchants in 2012.
Our inventory offers variety and choice.
With over
300 million listings available on all of our Marketplaces websites as of December 31, 2011, we offer buyers a broad range of listings across a wide number of categories. We have new, refurbished and used products, common and rare items, and branded and unbranded products. Our listings include products and services from more than 50,000 categories. As of December 31, 2011, there were more than 80 branded Outlet stores on eBay.com offering customers new items at great values.
We maintain high standards for trust and safety and customer service.
We have developed a number of features on our platforms in the areas of trust and safety (including our Feedback Forum, SafeHarbor Program,Verified Rights Owner Program and eBay Buyer Protection), customer support and value-added tools and services, as well as loyalty programs (for both buyers and sellers). These features are designed to make users more comfortable dealing with unknown trading partners and completing commercial transactions on the Internet or through mobile devices, as well as rewarding our top buyers and sellers for their loyalty.
eBay Buyer Protection covers items purchased on our sites in the U.S., the U.K. and Germany through an eligible payment method and protects most buyers with respect to items that are not received or not as described in the listing. Some purchases, including most vehicles, are not covered. eBay Buyer Protection provides coverage for the purchase price of the item, plus original shipping costs, for a limited time period from the date of the transaction, and includes a new, streamlined online interface to help buyers and sellers navigate their way through the process.
Payments
Our payments segment provides efficient payment and settlement capabilities for consumers and merchants on and off eBay websites and other merchant websites. We have three primary payment brands: PayPal, which enables individuals and businesses to securely, easily and quickly send and receive payments online and through a broad range of mobile devices in approximately 190 markets worldwide; Bill Me Later, which enables U.S. merchants to offer, and U.S. consumers to obtain, credit at the point of sale for ecommerce and mobile transactions through Bill Me Later's relationship with a chartered financial institution; and Zong, acquired in August 2011, which enables users with a mobile phone to purchase digital goods and have the transactions charged to their phone bill. We also recently acquired BillSAFE, a provider of payment services for online merchants in Germany who offer their customers the ability to pay for purchases upon receipt of an invoice.
Our payment networks are designed to be simple, safe and secure and are built upon the existing global financial infrastructure to create global, real-time payment solutions. PayPal connects more than 15,000 financial institutions around the world, and buyers can typically use their local payment method of choice, no matter where the seller is located. Users of our PayPal payments solutions can engage in cross-border shopping, which may help merchants to increase sales volume by allowing them to sell to a global base of buyers.
We had
approximately 106 million active registered accounts in approximately 190 markets as of December 31, 2011. We define active registered accounts as all registered accounts that successfully sent or received at least one payment or payment reversal through the PayPal system or Bill Me Later accounts that are currently able to transact and that have received a statement within the last 12 months.
Our PayPal payment processing solution is available both online and on mobile.
PayPal originally started as a payment solution for online transactions between consumers and merchants. With the advent of smartphones and tablet computers, PayPal is becoming a popular form of payment for online and offline goods and services on mobile devices as well. In 2011, PayPal's net total payment volume, or TPV, for transactions using mobile devices reached $4 billion, up from approximately $750 million in 2010. PayPal's mobile checkout solutions offer merchants a convenient and easy way to accept payments through a mobile-optimized user experience. Consumers with a PayPal account have the flexibility to pay without entering a credit card number or a billing and shipping address on their devices. PayPal's mobile products are designed to
deliver an end-to-end mobile shopping experience in a safe and secure environment.
6
Our PayPal payment solution offers merchants an all-in-one payment processing experience that is generally less expensive than payment card alternatives.
PayPal offers online and mobile-enabled merchants an all-in-one payment processing solution that we believe is generally less expensive per transaction than most credit card and debit card merchant accounts. A merchant can typically open a PayPal account and begin accepting payments through PayPal within a few minutes. Most merchants are approved instantly for a PayPal account and do not need to provide a personal guarantee, acquire specialized hardware or software, prepare an application or contact a payment gateway. PayPal can reduce or eliminate the need for merchants to receive and store sensitive customer financial information. Furthermore, PayPal charges merchants no setup fees and few or no recurring monthly fees, and we believe that PayPal charges lower transaction fees than many U.S. merchant accounts.
We offer consumers choice by providing a variety of funding and withdrawal mechanisms.
Buyers can fund their PayPal accounts and payments using PayPal in a variety of ways, including by credit card, debit card, electronic funds transfers from their bank account and through a PayPal balance if the buyer has previously received payments or chosen to pre-fund a balance. We also provide a credit offering through the Bill Me Later service, which allows qualifying U.S. buyers to obtain a revolving line of credit
at the point of sale from a third-party chartered financial institution, WebBank. Bill Me Later is not a chartered financial institution nor is it licensed to make loans in any state. Accordingly, Bill Me Later must rely on a bank or licensed lender to issue the Bill Me Later credit products and extend credit to customers. U.S. buyers may also be offered an opportunity to defer payments for purchases made using Bill Me Later; under some promotional arrangements offered on select merchant sites, interest on such payments can be deferred for as long as six months.
When a consumer makes a purchase using a Bill Me Later credit product issued by a chartered financial institution, the chartered financial institution extends credit to the consumer, funds the extension of credit at the point of sale and remits funds to the merchant. We subsequently purchase the receivables related to the extensions of credit made by the chartered financial institution and, as a result of that purchase, bear the risk of loss in the event of loan defaults. Although the chartered financial institution continues to own each customer account, we own the related receivable and are responsible for all servicing functions related to the account. For information regarding risks related to our Bill Me Later business, see the information in “Item 1A: Risk Factors” under the captions "Bill Me Later's operations depend on lending services provided by an unaffiliated lender" and "Bill Me Later's operations expose us to additional risks."
Each PayPal account holder in the U.S. and in 109 other countries may withdraw money from his or her PayPal account through an electronic fund transfer to his or her U.S. bank account or, in approximately 45 of those countries, to their local bank account. In the U.S. and in five other countries, users can withdraw their funds by directing that PayPal mail them a check. Qualifying PayPal merchants in the U.S. are eligible to receive a PayPal ATM/debit card, which allows them to withdraw cash from any ATM connected to the Cirrus or Maestro networks and to make purchases at any merchant accepting MasterCard. In the U.K. and Italy, PayPal customers can apply for a prepaid card, which can be linked to a customer's PayPal account to add or withdraw funds. In certain markets, customers can also have funds in their PayPal account applied as a credit to their MasterCard credit card or debit card account.
We have embarked on plans to enable local merchants to offer PayPal at point of sale terminals.
In 2011, we began work on a PayPal point of sale payments solution for the U.S. and select European markets. In the U.S., the point of sale solution is intended to allow PayPal users who sign up for the service the ability to use their PayPal accounts to make purchases at participating local retailers. We expect that users will be able to access their PayPal account via a PayPal Access Card, mobile phone number and personal identification number (PIN), or near field communication-enabled device depending on what the retailer offers. This initiative is an important part of PayPal's strategy to provide a comprehensive payment solution for both online and brick-and-mortar retailers. We expect the pricing for PayPal's point of sale payments solution to be comparable to the pricing merchants would pay to competing processors for offline transactions. We expect the point of sale payments solution to be available, on a limited basis, as we roll out the product offering to more retailers in 2012.
PayPal also plans to leverage technology from our recent acquisition of WHERE.com to help merchants connect with local customers. WHERE.com is a local mobile discovery application and location-based mobile advertising network that provides personalized, hyper-local advertising, offers and deals to mobile consumers. We expect that integrating PayPal into the WHERE.com mobile application will enable merchants that integrate PayPal's new capabilities to push offers to a wider user base.
7
Our payments solutions offer leading fraud prevention and protection.
PayPal enables buyers to pay merchants quickly and easily without sharing sensitive financial information, such as credit card or debit card numbers. To make payments using PayPal, buyers need to disclose only their email addresses to merchants. The account-based nature of PayPal's network helps us to better detect and prevent fraud when funds enter, flow through and exit the PayPal network.
Bill Me Later accounts are most commonly opened on a U.S. merchant website offering Bill Me Later as a payment method, including eBay.com, but can also be opened via a qualified PayPal account or at the Bill Me Later website.
When using Bill Me Later, qualified buyers need to provide only their name, address, birth date and the last four digits of their social security number. When using Zong, buyers need to input only their mobile phone number and respond to a text or email requiring them to approve the transaction.
PayPal has developed a number of trust and safety programs, including PayPal's Seller Protection and Purchase Protection Programs. These programs provide additional protection to certain account holders who pay or receive payment for their transactions through PayPal on or off eBay.com in certain key geographies. PayPal's Seller Protection Program covers sellers in certain key geographies who follow specific shipping and handling practices against claims that a transaction was not authorized by the buyer or that the item was not received. PayPal's Purchase Protection Program reimburses the buyer, subject to specified limitations, for qualified purchases using PayPal on or off eBay.com in certain key geographies if the buyer does not receive the item or, in limited markets, if the item is significantly not as described. In some non-U.S. markets, protection for buyers is limited to a maximum amount per transaction.
GSI
Acquired by eBay in June 2011, GSI is a leading provider of ecommerce and interactive marketing services to enterprise clients that include some of the world's premier brands and retailers. GSI offers a broad suite of solutions designed to power merchants' online businesses and effectively integrate with their other sales channels. GSI's advanced technology, fulfillment, customer care and interactive marketing services are designed to enable its clients to elevate the consumer experience and cost-effectively sustain it over time.
GSI operates two business units: Global eCommerce Services, or GeC, and Global Marketing Services, or GMS. Each business unit offers products and services that complement the other, which allows for cross-selling opportunities. While GSI operates on a global basis, for the period from its acquisition by eBay in June 2011 through December 31, 2011, nearly all of its net revenues were derived from its North American operations and its international operations were not material.
GSI enables companies to operate ecommerce businesses and to integrate their ecommerce businesses with other multi-channel retail offerings.
GSI sells its products and services on an individual basis and also as bundled solutions. The GeC business unit
serves enterprise clients that operate in general merchandise categories, including apparel, sporting goods, toys & baby, health & beauty and home. We refer to GSI clients as enterprise clients because GSI generally serves large, nationally recognized brand name companies. The GeC ecommerce suite is comprised of three principal services: Technology & Payments, Fulfillment & Freight and Customer Care.
GSI Technology & Payments services provide retailers with ecommerce platforms, products and services.
GSI Technology & Payments uses shared sales, service, operations and administration teams for its three areas of focus: webstore & mobile, commerce exchange & multi-channel and payments.
`
Webstore & mobile provides secure shopping cart and checkout offerings, analytical tools, site management tools, including catalog, content and promotions management and guided product discovery.
Commerce exchange & multi-channel offerings provide transactional capabilities, including order management, inventory management and fulfillment integration. GSI's multi-channel offering is a suite of software products that enables in-store pickup, ship-from-store, ship-to-store and drop ship capabilities.
The payments offering provides a robust online payment processing engine with capabilities including price, tax and shipping calculations, address verification, order review and fraud prevention, credit card authorization and settlement and alternative payment processing, including PayPal as well as private label credit cards, gift cards and online gift certificates.
8
GSI Fulfillment & Freight services help retailers manage logistics complexities.
GSI operates six ecommerce fulfillment centers in the United States, one in Canada and one in the United Kingdom, encompassing over 3.2 million square feet. Within these facilities, GSI utilizes warehouse management systems and infrastructure to provide customized direct-to-consumer fulfillment solutions, including order management, real-time order status updates and reverse logistics services. Through scale and partnerships with leading freight providers, GSI offers clients favorable shipping rates and innovative freight programs, including its ShipQuik shipping program. Under this program, packages are presorted by customer zip code, which helps to shorten the time packages are in transit.
GSI Customer Care services provide retailers with integrated customer support for their online web stores.
Through three call centers in the United States and a network of customer support agents, plus one call center in the United Kingdom, GSI provides customer care services for ecommerce via telephone and email. GSI combines proprietary and third-party technologies, including automatic call distribution, computer telephony integration, interactive voice response, email, workforce management, voice recording/monitoring and customer relationship management systems in the customer care platform. The United Kingdom call center offers customer care in multiple languages.
GMS provides retailers with extensive online marketing services
The GMS business unit is focused on providing comprehensive, industry-leading solutions designed to help clients acquire new customers, convert more visitors into buyers, build significant customer loyalty and drive revenue across various channels. GMS offers a full-service digital agency, enterprise email marketing, mobile advertising, affiliate marketing, advertisement retargeting, and in-depth analytics capabilities.
X.commerce
In addition to our reportable segments, in 2011, we launched a business initiative of cloud-based commerce tools called X.commerce. X.commerce is a platform that provides software developers access to our APIs to develop functionality for merchants of all sizes. By bringing together the technology assets and developer communities of eBay, PayPal and Magento, an ecommerce storefront platform we acquired in August 2011, the X.commerce ecosystem provides tools that are designed to drive innovation for online, mobile, social and local commerce. Merchants can use these tools to create web storefronts, track sales and collect payments. We also have an application store called Magento Connect where developers can market and sell add-on functionality and solutions to merchants that use a Magento storefront.
Communications
Previously, we had a Communications reportable segment which consisted of Skype. Skype offers a way for people around the world to stay in touch over the Internet through free voice and video calls, sending instant messages, SMS (text messaging) or files, and by making low-cost calls to landline and mobile numbers.
In November 2009, we completed the sale of Skype to an entity (Buyer) owned and organized by an investor group. As part of the sale, we maintained a 30 percent equity interest in the outstanding capital stock of the Buyer. Skype was consolidated with our results of operations through the date that the sale of Skype was completed. In October 2011, we sold our remaining equity stake in the Buyer to Microsoft Corp. For additional details related to the sale of Skype, please see "Note 4 – Skype Related Transactions" to the consolidated financial statements included in this report.
Competition
We encounter vigorous competition in our businesses from numerous sources. For our Marketplaces segment, our users can find, buy, sell and pay for similar items through a variety of competing online, mobile and offline channels. These include, but are not limited to, retailers, distributors, liquidators, import and export companies, auctioneers, catalog and mail-order companies, classifieds, directories, search engines, commerce participants (consumer-to-consumer, business-to-consumer and business-to-business), shopping channels and networks. As our product offerings continue to broaden into new categories of items and new commerce formats, we expect to face additional competition from other online, mobile and offline channels for those new offerings. We compete on the basis of price, product selection and services.
For our Payments segment, our users may choose to pay through a variety of alternative means, including credit and debit cards, automated clearing house and bank wires, other online payment services, offline payment methods such as cash, check or money order and using mobile phones. Likewise, our users may elect to finance their purchases through a broad range of other sources of financing, including credit cards, lines of credit provided by financial institutions and store credit or layaway plans provided by merchants.
9
Our GSI segment faces different competitors for each of its two business units. GSI seeks to compete on the basis of offering premium capabilities with a cost advantage. While each of GSI's business units competes on a stand-alone basis, GSI also seeks to differentiate itself by cross-selling and bundling services to offer more attractive pricing and integrated implementations.
For more information regarding these risks, see the information in “Item 1A: Risk Factors” under the captions “Our industries are intensely competitive” and “We are subject to regulatory activity and antitrust litigation under competition laws.”
To compete effectively, we may need to expend significant resources in technology and marketing. These efforts may be expensive and could reduce our margins and have a materially adverse effect on our business, financial position, operating results and cash flows and reduce the trading price of our stock. Despite our efforts to preserve and expand the size, diversity and transaction activity of our users and customers and to enhance the user experience, we may not be able to continue to manage our operating expenses or increase or maintain our revenue to avoid or reduce a decline in our consolidated net income or avoid a net loss.
Seasonality
We expect transaction activity patterns on our websites to mirror general consumer buying patterns. Our GSI segment is highly seasonal. The fourth calendar quarter typically accounts for a disproportionate amount of GSI's total annual revenue because consumers increase their purchases and businesses increase their advertising to consumers during the fourth quarter holiday season.
Please see the additional information in “Item 7: Management's Discussion and Analysis of Financial Condition and Results of Operations” under the caption “Seasonality.”
Technology
Our Marketplaces, Payments and GSI platforms utilize a combination of proprietary technologies and services as well as technologies and services provided by others. We have developed intuitive user interfaces, customer tools and transaction processing, database and network applications that help enable our users to reliably and securely complete transactions on our sites and help GSI's clients to utilize its suite of services. Our technology infrastructure simplifies the storage and processing of large amounts of data, eases the deployment and operation of large-scale global products and services and automates much of the administration of large-scale clusters of computers. Our infrastructure has been designed around industry-standard architectures to reduce downtime in the event of outages or catastrophic occurrences. We strive to continually improve our technology to enhance the customer experience and to increase efficiency, scalability and security. For information regarding technology-related risks, see the information in “Item 1A: Risk Factors” under the captions “System failures and resulting interruptions in the availability of our websites and services could harm our business” and “Our failure to cost-effectively manage certain aspects of our business could harm us.”
Intellectual Property
We regard the protection of our intellectual property, including our trademarks (particularly those covering the eBay and PayPal names), patents, copyrights, domain names, trade dress and trade secrets as critical to our success. We aggressively protect our intellectual property rights by relying on federal, state and common law rights in the U.S. and internationally, as well as a variety of administrative procedures. We also rely on contractual restrictions to protect our proprietary rights in products and services. We have entered into confidentiality and invention assignment agreements with our employees and contractors and nondisclosure agreements with parties with whom we conduct business in order to limit access to and disclosure of our proprietary information.
We pursue the registration of our domain names, trademarks, and service marks in the U.S. and internationally. Additionally, we have filed U.S. and international patent applications covering certain aspects of our proprietary technology. Effective trademark, copyright, patent, domain name, trade dress and trade secret protection is very expensive to maintain and may require litigation. We must protect our intellectual property rights and other proprietary rights in an increasing number of jurisdictions, a process that is expensive and time consuming and may not be successful in every location.
We have registered our core brands as trademarks and domain names in the U.S. and a large number of other jurisdictions and have in place an active program to continue to secure trademarks and domain names that correspond to our brands in markets of interest. If we are unable to protect our trademarks or domain names, we could be adversely affected in any jurisdiction in which our trademarks or domain names are not registered. We have licensed in the past, and expect to license in the future, certain of our proprietary rights, such as trademarks or copyrighted material, to others.
10
Third parties have from time to time claimed, and others may claim in the future, that we have infringed their intellectual property rights. We currently are involved in several such legal proceedings. Please see the information in “Item 3: Legal Proceedings” and in “Item 1A: Risk Factors” under the captions "The listing or sale by our users of pirated or counterfeit items may harm our business," "We are subject to patent litigation" and "We may be unable to protect or enforce our own intellectual property rights adequately.”
Employees
As of December 31, 2011, we employed approximately
27,770
people (including temporary employees), approximately
18,720
of whom were located in the U.S.
Available Information
Our Internet address is www.ebay.com. Our investor relations website is located at http://investor.ebayinc.com. We make available free of charge on our investor relations website under the heading “SEC Filings” our Annual Reports on Form 10-K, Quarterly Reports on Form 10-Q, Current Reports on Form 8-K and amendments to those reports as soon as reasonably practicable after such materials are electronically filed with (or furnished to) the SEC. Information contained on our websites is not incorporated by reference into this Annual Report on Form 10-K.
11
|
Item 1A:
|
RISK FACTORS
|
Risk Factors That May Affect Results of Operations and Financial Condition
Our operations and financial results are subject to various risks and uncertainties that could adversely affect our business, financial condition, results of operations, cash flows, as well as the trading price of our common stock.
Our operating results have varied on a quarterly basis during our operating history. Our operating results may fluctuate significantly as a result of a variety of factors, many of which are outside our control. Factors that may affect our operating results include risks described elsewhere in this section and the following:
|
•
|
general economic conditions, including the possibility of a prolonged period of limited economic growth or possible economic decline in the U.S. and Europe; adverse effects of the ongoing sovereign debt crisis in Europe, including its expected negative impact on European economic growth versus the rest of the world; disruptions to the credit and financial markets in Europe, the U.S., and elsewhere; contractions or limited growth in consumer spending or consumer credit; and adverse economic conditions that may be specific to the Internet, ecommerce and payments industries;
|
|
•
|
our ability to retain an active user base, attract new users, and encourage existing users to list items for sale, purchase items through our websites, or use our payment services, especially when consumer spending is weak;
|
|
•
|
the primary and secondary effects of previously announced and possible future changes to our pricing, products and policies, including, among other changes, restrictions or holds on payments made to sellers or in connection with certain categories of higher-risk transactions; intermediated payments in Germany; changes to our dispute resolution process; upgrades to eBay checkout services, including the introduction of a new eBay shopping cart/basket that enables buyers to add items from multiple sellers and pay in a single checkout; and recent changes to our fee structure, including the calculation of final value fees based on the total amount of the transaction (including shipping);
|
|
•
|
our ability to improve the quality of the user experience on our websites and through mobile devices (including our customer support in the event of a problem) in light of the improved quality generally of the user experience offered by competitive merchants;
|
|
•
|
consumer confidence in the safety and security of transactions using our websites or technology and the effect of any changes in our practices and policies on such confidence;
|
|
•
|
our ability to manage the costs of and effectively implement our user protection programs;
|
|
•
|
our ability to comply with existing and new laws and regulations, especially those that impact our Payments business, as we expand the range and geographical scope of our services and as we grow larger, including those laws and regulations discussed below under the caption "If our Payments business is found to be subject to or in violation of any laws or regulations, including those governing money transmission, electronic funds transfers, money laundering, counter-terrorist financing, sanctions, banking and lending, it could be subject to liability, licensure and regulatory approval and may be forced to change its business practices";
|
|
•
|
new laws or regulations (such as the proposed Stop Online Piracy Act (SOPA) and PROTECT IP Act (PIPA) laws in the U.S.) and interpretations of existing laws or regulations, including national court interpretations of the European Court of Justice's decision in the L'Oreal case (see “Item 3: Legal Proceedings” below), that impose liability on us for the actions of our users or otherwise harm our business models, especially as we become more actively involved in transactions on our platforms;
|
|
•
|
regulatory and legal actions imposing obligations on our businesses or our users, including the injunction related to certain cosmetic and perfume brands (see “Item 3 — Legal Proceedings” below);
|
|
•
|
the impact on PayPal or Bill Me Later of regulations enacted pursuant to new laws regulating financial institutions, including the Dodd-Frank Wall Street Reform and Consumer Protection Act in the U.S.;
|
|
•
|
our ability to manage the costs of compliance with existing and new laws and regulations that affect our businesses;
|
|
•
|
the volume, velocity, size, timing, monetization, and completion rates of transactions using our websites or technology;
|
|
•
|
our ability to reduce the loss of active buyers and sellers and increase activity of the users of our Marketplaces business, especially with respect to our top buyers and sellers;
|
|
•
|
our ability to develop product enhancements, programs, and features on different platforms (e.g., mobile devices, and the availability of PayPal at the retail point of sale) at a reasonable cost and in a timely manner;
|
|
•
|
changes to our use of advertising on our sites;
|
|
•
|
our ability to upgrade and develop our systems (including the migration to GSI's new technology platform), infrastructure and customer service capabilities to accommodate growth and to improve the functionality and reliability of our websites and services at a reasonable cost while maintaining 24/7 operations;
|
|
•
|
the actions of our competitors, including the introduction of new sites, services, products and functionality;
|
12
|
•
|
the costs and results of litigation or regulatory actions that involve us;
|
|
•
|
technical difficulties or service interruptions involving our websites or services provided to us or our users by third parties;
|
|
•
|
our ability to manage the transaction loss rate in our Marketplaces, Payments and GSI ecommerce services businesses;
|
|
•
|
our ability to manage funding costs, credit risk and interest-rate risk associated with our Bill Me Later business;
|
|
•
|
our ability to successfully and cost-effectively integrate and manage businesses that we acquire, including GSI;
|
|
•
|
the amount and timing of operating costs and capital expenditures relating to the maintenance and expansion of our businesses, operations and infrastructure;
|
|
•
|
our ability to comply with the requirements of entities whose services are required for our operations, such as payment card networks and banks;
|
|
•
|
the cost and availability of online and traditional advertising, and the success of our brand building and marketing campaigns;
|
|
•
|
our ability to attract new personnel in a timely and effective manner and to retain key employees;
|
|
•
|
the continued healthy operation of our technology suppliers and other parties with which we have commercial relations;
|
|
•
|
continued consumer acceptance of the Internet and emerging consumer acceptance of mobile devices as a medium for ecommerce and payments in the face of increasing publicity about fraud, spoofing, phishing, viruses, spyware, malware and other dangers; and
|
|
•
|
macroeconomic and geopolitical events affecting commerce generally.
|
It is difficult for us to forecast the level or source of our revenues or earnings accurately. In view of the rapidly evolving nature of our business, we believe that period-to-period comparisons of our operating results may not be meaningful, and you should not rely upon them as an indication of future performance. We do not have backlog, and substantially all of our net revenues each quarter come from transactions involving sales or payments during that quarter. Due to the inherent difficulty in forecasting revenues, it is also difficult to forecast income statement expenses as a percentage of net revenues. Quarterly and annual income statement expenses as a percentage of net revenues may be significantly different from historical or projected rates. Our operating results in one or more future quarters may fall below the expectations of securities analysts and investors. In that event, the trading price of our common stock would almost certainly decline.
We invest heavily in technology, marketing and promotion, customer support, protection programs and further development of the operating infrastructure for our core and non-core operations. Some of this investment entails long-term contractual commitments. As a result, we may be unable to adjust our spending rapidly enough to compensate for any unexpected revenue shortfall, which may harm our profitability.
Growth rates of our Marketplaces businesses in some of our most established markets have been slower than that for ecommerce generally and have declined in certain periods. The growth of Internet users is slowing in many countries where we have a significant presence. Despite our efforts to stem our loss of share in these and other markets, we may not be successful. As our growth rates in established markets slow, we will increasingly need to focus on keeping existing users, especially our top buyers and sellers, active and increasing their activity level on our websites in order to continue to grow our business. The growth of Internet users is accelerating in some countries and regions where we do not have a significant presence (e.g., Brazil/Latin America, Russia, China and certain developing countries in which we do not have a meaningful (or, in some cases, any) domestic business), and our failure to establish our businesses and drive adoption of our services in such markets would negatively impact our future growth.
Our Marketplaces business is facing increased competitive pressure. In particular, the competitive norm for, and the expected level of service from, Internet ecommerce websites has significantly increased, due to, for example, improved user experience, greater ease of buying goods, lower (or no) shipping costs, faster shipping times and more favorable return policies. If we are unable to change our services in ways that reflect the changing demands of the ecommerce marketplace, particularly the higher growth of sales of fixed-price items and higher service levels (some of which depend on services provided by sellers on our platforms), our business will suffer.
We have announced changes to our Marketplaces business that are intended to drive more sales and improve seller efficiency and buyer experiences. For example, in the U.S., the U.K. and Canada, we may request that PayPal place temporary holds on seller funds in certain instances (e.g., for sellers with a limited selling history or below-standard performance ratings), which is intended to help improve seller performance and increase buyer satisfaction. We have also recently implemented a new payment process in Germany and Austria in which buyers pay eBay directly for items purchased from newly registered sellers on our localized websites in those countries, and eBay subsequently pays the seller subject to confirmation that the item has shipped. We may expand the scope of such programs in the future and introduce and implement additional programs with
13
similar aims in different businesses and geographies. Some of the changes that we have announced to date have been controversial with, and led to dissatisfaction among, our sellers, and additional changes that we announce in the future may also be negatively received by some of our sellers. This may not only impact the supply of items listed on our websites, but because many sellers also buy from our sites, it may adversely impact demand as well. Given the number of recent changes that we have made to our policies and pricing, it may take our sellers some time to fully assess and adjust to these changes, and sellers may elect to reduce volume on our sites while making such assessments and adjustments or in response to these changes. If any of these changes cause sellers to move their business (in whole or in part) away from our websites or otherwise fail to improve gross merchandise volume or the number of successful listings, our operating results and profitability will be harmed.
We believe that the mix of sales under our traditional auction-style listing format and fixed-price listing format will continue to shift towards our fixed-price format. Accordingly, we have eliminated some of the features related to our traditional auction-style format and expect others will continue to become less meaningful to, and used less frequently by, our sellers, resulting in a corresponding decrease in revenues from those features. We also expect that the costs associated with our seller discount programs will increase as more sellers become eligible for such discounts. In addition, because a large percentage of PayPal transactions originate on the eBay platform, declines in growth rates in major Marketplaces markets also adversely affect PayPal's growth. The expected future growth of our PayPal, GSI, StubHub and our other lower margin businesses may also cause downward pressure on our profit margins because those businesses have lower gross margins than our Marketplaces platforms.
The sluggish economy could harm our business.
Our Marketplaces, Payments and GSI ecommerce services businesses are dependent on consumer purchases, and our GSI business is also impacted by the offline businesses of our GSI clients. The economic downturn resulted in reduced buyer demand and reduced selling prices and the slow recovery may reduce the volume of purchases on our Marketplaces platforms and the volume of transactions paid for using our Payment services and the online and offline businesses of our GSI clients, any of which would adversely affect our business.
We are exposed to fluctuations in currency exchange rates and interest rates.
Because we conduct the majority of our business outside the United States but report our financial results in U.S. dollars, we face exposure to adverse movements in currency exchange rates. In connection with its multi-currency service, PayPal fixes exchange rates twice per day, and may face financial exposure if it incorrectly fixes the exchange rate or if exposure reports are delayed. Given that PayPal also holds some corporate and customer funds in non-U.S. currencies, its financial results are affected by the translation of these non-U.S. currencies into U.S. dollars. In addition, the results of operations of many of our internationally focused websites are exposed to foreign exchange rate fluctuations as the financial results of the applicable subsidiaries are translated from the local currency into U.S. dollars upon consolidation. If the U.S. dollar weakens against foreign currencies, the translation of these foreign currency denominated transactions will result in increased revenues, operating expenses and net income. Similarly, if the U.S. dollar strengthens against foreign currencies, our translation of foreign currency denominated transactions will result in lower net revenues, operating expenses and net income. If the U.S. dollar continues to strengthen against major European currencies (e.g., the Euro and British pound) whether because of the ongoing sovereign debt crisis in Europe or worsening economic conditions, our revenues and operating results would be adversely impacted. For the year ended December 31, 2011, foreign currency movements relative to the U.S. dollar positively impacted net revenues of $11.7 billion by approximately $202.4 million (net of a $25.9 million negative impact from hedging activities relating to PayPal's net revenue) compared to the prior year. As exchange rates vary, net revenues and other operating results, when translated, may differ materially from expectations. In particular, to the extent the U.S. dollar strengthens against the Euro, British pound, Korean won, Australian dollar or Canadian dollar, our foreign revenues and profits will be reduced as a result of these translation adjustments. While from time to time we enter into transactions to hedge portions of our foreign currency translation exposure, it is impossible to predict or completely eliminate the effects of this exposure. In addition, to the extent the U.S. dollar strengthens against the Euro, the British pound, the Australian dollar or other currencies, cross-border trade related to purchases of dollar-denominated goods (or goods from Asia-Pacific countries whose currencies tend to follow the dollar) by non-U.S. purchasers will likely decrease, and that decrease will likely not be offset by a corresponding increase in cross-border trade involving purchases by U.S. buyers of goods denominated in other currencies, which would adversely affect our business. In addition, we face exposure to fluctuations in interest rates. Relatively low interest rates have continued to limit our investment income, including income we earn on PayPal customer balances.
14
Bill Me Later's operations depend on lending services provided by an unaffiliated lender.
In November 2008, we acquired Bill Me Later, a company that facilitates credit services offered by an unaffiliated bank. Bill Me Later is neither a chartered financial institution nor is it licensed to make loans in any state. Accordingly, Bill Me Later must rely on a bank or licensed lender to issue the Bill Me Later credit products and extend credit to customers to offer the Bill Me Later service. Currently, when a consumer makes a purchase using a Bill Me Later credit product, the chartered financial institution extends credit to the consumer, funds the extension of credit at the point of sale and advances funds to the merchant. We subsequently purchase the receivables related to the extensions of credit made by the chartered financial institution and, as a result of the purchase, bear the risk of loss in the event of loan defaults. Although the chartered financial institution continues to own each customer account, we own the related receivable and Bill Me Later is responsible for all servicing functions related to the account.
In September 2010, WebBank became the issuer of the Bill Me Later credit products. WebBank is an industrial bank chartered by the State of Utah. Any termination or interruption of WebBank's ability to lend could result in our being unable to originate any new transactions for the Bill Me Later service, which would require us to either reach a similar arrangement with another chartered financial institution, which may not be available on favorable terms, if at all, or to obtain our own bank charter, which would be a time-consuming and costly process and would subject us to a number of additional laws and regulations, compliance with which would likely be burdensome.
A lawsuit has been filed against Bill Me Later, PayPal and eBay in the U.S. District Court for the Northern District of California, alleging that in its relationship with the chartered financial institution, Bill Me Later is acting as the true lender to customers in violation of various California laws, including the state's usury law. The court dismissed the usury claims in December 2010, but breach of contract and other claims remain. WebBank requested to intervene in the action and has been added as a party to the action, and in October 2011, the court transferred the case to the U.S. District Court for the District of Utah. We believe that these allegations are without merit and intend to defend ourselves vigorously. However, this area of law is uncertain and if the lawsuit is successful, Bill Me Later may be required to change its methods of operations, pay substantial damages and reduce some of its charges and fees, which would likely adversely affect our business.
If our Payments business is found to be subject to or in violation of any laws or regulations, including those governing money transmission, electronic funds transfers, money laundering, counter-terrorist financing, sanctions, banking and lending, it could be subject to liability, licensure and regulatory approval and may be forced to change its business practices.
Our Payments business is subject to various laws and regulations in the U.S. and other countries where it operates, including those governing money transmission, electronic funds transfers, money laundering, counter-terrorist financing, sanctions, banking and lending. The legal and regulatory requirements that apply to our Payments business vary in the markets where we operate. While PayPal has a compliance program focused on compliance with applicable laws and regulations and has significantly increased the resources of that program in the last several years, there can be no assurance that we will not be subject to fines or other enforcement actions in one or more jurisdictions or be required to make changes to our business practices or compliance programs to comply in the future.
While PayPal currently allows its customers with credit cards to send payments from 190 markets, PayPal only allows customers in 110 of those markets (including the U.S.) to receive payments, in some cases with significant restrictions on the manner in which customers can withdraw funds. These limitations may affect PayPal's ability to grow in these markets. Of the 190 markets whose residents can use the PayPal service, 31 (27 countries plus four French overseas departments) are members of the European Union, or EU. Since 2007, PayPal has provided localized versions of its service to customers in the EU through PayPal (Europe) S.à r.l. et Cie, SCA, a wholly-owned subsidiary of PayPal that is licensed and subject to regulation as a bank in Luxembourg. Accordingly, PayPal (Europe) is subject to significant fines or other enforcement action if it violates the disclosure, reporting, anti-money laundering, capitalization, funds management, corporate governance, sanctions or other requirements imposed on Luxembourg banks. Any fines or other enforcement actions imposed by the Luxembourg regulator could adversely affect PayPal's business. PayPal (Europe) implements its localized services in EU countries through a “passport” notification process through the Luxembourg regulator to regulators in other EU member states pursuant to EU Directives, and has completed the “passport” notification process in all EU member countries. The regulators in these countries could notify PayPal (Europe) of local consumer protection laws that will apply to its business, in addition to Luxembourg consumer protection law, and could also seek to persuade the Luxembourg regulator to order PayPal (Europe) to conduct its activities in the local country through a branch office. These or similar actions by these regulators could increase the cost of, or delay, PayPal's plans for expanding its business in EU countries. In addition, national interpretations of regulations implementing the EU Payments Service Directive, which established a new regulatory regime for payment services providers, may be inconsistent, which could make compliance more costly and operationally difficult to manage.
15
In Australia, PayPal serves its customers through PayPal Australia Pty. Ltd., which is licensed by the Australian Prudential Regulatory Authority as a purchased payment facility provider, which is a type of authorized depository institution. Accordingly, PayPal Australia is subject to significant fines or other enforcement action if it violates the disclosure, reporting, anti-money laundering, capitalization, corporate governance or other requirements imposed on Australian depository institutions. In China, PayPal is affiliated with Shanghai Wangfuyi Information Technology Ltd., which is licensed as an Internet Content Provider and operates a payments service only for Chinese customers and only for transactions denominated in Chinese currency. The People's Bank of China (PBOC) has recently enacted regulations to establish a new type of license, called a Payment Settlement Organization (PSO) license, which will be required for non-bank payment services. The PBOC regulations leave unclear whether a foreign-owned company such as PayPal can control or invest in a Payment Settlement Organization, and whether Wangfuyi or PayPal's wholly-owned subsidiary in China would be eligible to obtain a PSO license.
To date, PayPal has obtained licenses to operate as a money transmitter in 42 U.S. states, the District of Columbia and Puerto Rico. PayPal is also licensed as an escrow agent in one U.S. state. PayPal is applying for money transmitter licenses in five additional states to facilitate its planned offering of payment services at the retail point of sale. The two remaining U.S. states do not currently regulate money transmitters. As a licensed money transmitter, PayPal is subject to restrictions on its investment of customer funds, reporting requirements, bonding requirements, and inspection by state regulatory agencies. If PayPal were found to be in violation of money services laws or regulations, PayPal could be subject to liability and/or additional restrictions (e.g., liquidity requirements), forced to cease doing business with residents of certain states, forced to change its business practices, or required to obtain additional licenses or regulatory approvals that could impose a substantial cost on PayPal. Any change to PayPal's business practices that makes the service less attractive to customers or prohibits its use by residents of a particular jurisdiction could also decrease the velocity of trade on eBay and websites operated by GSI's clients that accept PayPal as a form of payment, which would further harm our business. PayPal's California regulator, the California Department of Financial Institutions (DFI), recently notified PayPal that PayPal's current practice of holding the funds underlying U.S. customer balances as an agent on behalf of its customers, rather than as owner of those funds, causes PayPal to be in violation of the liquidity rules applicable to California money transmitter licensees. PayPal has established this current practice in part to maintain potential eligibility of those funds for pass-through Federal Deposit Insurance Corporation (FDIC) insurance coverage when those funds are placed in U.S. bank accounts. PayPal has requested the DFI to grant a waiver that would allow PayPal to continue to hold those funds as an agent or custodian on behalf of customers and still qualify those funds as liquid assets. If a waiver is not granted, PayPal would have to change these arrangements to hold the funds directly. This would likely disqualify the funds from pass-through FDIC insurance, and could also result in decreased revenue to PayPal if it decides to shift the funds from bank accounts to securities that bear lower interest rates. Any potential decrease in revenue to PayPal resulting from this change is not expected to be material. This would also result in these funds, which are currently not reported as assets owned by PayPal on our consolidated balance sheet, moving onto our consolidated balance sheet (along with the accompanying liabilities). For additional information, please see “Item 7: Management's Discussion and Analysis of Financial Condition and Results of Operations” under the caption “Off-Balance Sheet Arrangements.” As of December 31, 2011, these funds totaled approximately $2.7 billion.
In markets other than the U.S., the EU, Australia, the China domestic business and Brazil, PayPal serves its customers through PayPal Private Ltd., a wholly-owned subsidiary of PayPal that is based in Singapore. PayPal Private Ltd. is regulated in Singapore as a stored value issuer. In many of these markets, it is not clear whether PayPal's Singapore-based service is subject only to Singaporean law or, if it were subject to local laws, whether such local law would require a payment processor like PayPal to be licensed as a bank or financial institution or otherwise. In such markets, the business may rely on partnerships with local banks to process payments and conduct foreign exchange in local currency. Local regulators who do not have direct jurisdiction over Singapore-based PayPal Private Ltd. may use their local regulatory power to slow or halt payments to local merchants conducted through the local banking partner. Such regulatory actions impacting local banking partner arrangements could impose substantial costs and involve considerable delay to the provision or development of PayPal services in that market, or could prevent PayPal from providing any services in a given market. The Reserve Bank of India has asserted that PayPal's offering of payment services to customers outside of India to send personal, non-commercial payments to recipients in India requires a license from the Reserve Bank. For a period of time in 2010, the Reserve Bank directed the Indian affiliate of PayPal's processing bank to suspend withdrawals to the Indian bank accounts of PayPal customers for both personal and business customers. PayPal has ended personal non-commercial payments to and from Indian accounts and the ability of Indian sellers to spend payments they receive, and has also stopped offering certain commercial payments between Indian buyers and Indian sellers. In November 2010, the Reserve Bank of India issued guidelines to Indian banks on the requirements for processing export-related transactions for online payment gateway service providers such as PayPal, including a limitation on the amount of individual transactions to no more than $500 (increased in October 2011 to $3,000). The Reserve Bank may again impose a suspension if it is not satisfied with PayPal's and its partner bank's actions to comply with these guidelines. In the event of any non-compliance, PayPal could be subject to fines from the Reserve Bank, and PayPal's prospects for future business in India, both cross-border and domestic, could be materially and adversely affected.
16
Even if PayPal is not currently required to be licensed in some jurisdictions, future localization or targeted marketing of PayPal's service or expansion of the financial products offered by PayPal (whether alone, through a commercial alliance or through an acquisition) in those countries could subject PayPal to additional licensure requirements, laws and regulations and increased regulatory scrutiny, any of which may harm PayPal's business. For example, PayPal expects it will be required to obtain licenses in Japan and Russia to expand its services in those countries. There can be no assurance that PayPal will be able to obtain such licenses. Even if PayPal were able to obtain such licenses, there would be substantial costs involved in maintaining such licenses, and PayPal would be subject to fines or other enforcement action if it violates disclosure, reporting, anti-money laundering, capitalization, corporate governance or other requirements of such licenses. These factors could impose substantial costs and involve considerable delay to the provision or development of PayPal's products. Delay or failure to receive such a license or regulatory approval could require PayPal to change its business practices or features in ways that would adversely affect PayPal's expansion plans, and force PayPal to suspend providing products and services to customers in one or more countries.
PayPal is also subject to various anti-money laundering and counter-terrorist financing laws and regulations around the world that prohibit, among other things, its involvement in transferring the proceeds of criminal activities. PayPal is focused on compliance with these laws and regulations and has programs designed to comply with new and existing legal and regulatory requirements. However, any errors, failures or delays in complying with federal, state or foreign money laundering and counter-terrorist financing laws could result in significant criminal and civil lawsuits, penalties and forfeiture of significant assets or other enforcement actions. In the United States, PayPal is subject to regulations that require it to report, within required timeframes, suspicious activities involving transactions of $2,000 or more, and may be required to obtain and keep more detailed records on the senders and recipients in certain transfers of $3,000 or more. New regulations on prepaid access programs which take full effect in March 2012 will require PayPal to take additional steps to verify the identity of customers who pre-fund a PayPal balance. U.S. regulators have increased scrutiny of compliance with these obligations. Existing and new regulations may require PayPal to revise further its compliance program, including the procedures it uses to verify the identity of its customers and to monitor international and domestic transactions.
Several countries in which PayPal is regulated, including Australia, Luxembourg and Singapore, have implemented new anti-money laundering and counter-terrorist financing laws and regulations, and PayPal has had to make changes to its procedures in response. In November 2009, the Australian anti-money laundering and counter-terrorist financing regulator (AUSTRAC) accepted an enforceable undertaking from PayPal Australia pursuant to which PayPal Australia agreed, among other things, to appoint an independent auditor to assess PayPal Australia's anti-money laundering compliance policies and procedures and issue a report identifying any unremediated deficiencies accompanied by a plan by PayPal to remedy any such deficiencies. In the enforceable undertaking, AUSTRAC expressed concern that PayPal Australia did not have systems and controls in place to manage adequately its money laundering and terrorist financing risk. In September 2010, the independent auditor completed its review and issued its report, and PayPal Australia submitted a remediation plan. PayPal Australia has invested in improvements to its anti-money laundering and counter-terrorist financing systems, policies and operations as part of its remediation plan. In addition, PayPal Australia will be required to obtain additional information from customers, verify that information, and monitor its customers' activities more closely. As PayPal continues to localize its services in additional jurisdictions, it could be required to meet standards similar to or more burdensome than those in Australia. These requirements could impose significant costs on PayPal, cause delay to other planned product improvements, make it more difficult for new customers to join its network and reduce the attractiveness of its products.
Although there have been no definitive interpretations to date, PayPal has taken actions as though its service is subject to the Electronic Fund Transfer Act and Regulation E of the U.S. Federal Reserve Board. Under such regulations, among other things, PayPal is required to provide advance disclosure of changes to its service, to follow specified error resolution procedures and to reimburse consumers for losses from certain transactions not authorized by the consumer. PayPal seeks to pass most of these losses on to the relevant merchants, but PayPal incurs losses if the merchant does not have sufficient funds in its PayPal account. Additionally, even technical violations of these laws can result in penalties of up to $1,000 for each non-compliant transaction or up to $500,000 per violation in any class action, and we could also be liable for plaintiffs' attorneys' fees. In the second quarter of 2010, two putative class-action lawsuits (Devinda Fernando and Vadim Tsigel v. eBay Inc. and PayPal, Inc. and Moises Zepeda v. PayPal, Inc.) were filed in the U.S. District Court in the Northern District of California. These lawsuits contain allegations related to violations of aspects of the Electronic Fund Transfer Act and Regulation E and violations of a previous settlement agreement related to Regulation E, and/or allege that PayPal improperly held users' funds or otherwise improperly limited users' accounts. These lawsuits seek damages as well as changes to PayPal's practices among other remedies. A determination that there have been violations of the Electronic Fund Transfer Act, Regulation E or violations of other laws relating to PayPal's practices could expose PayPal to significant liability. Any changes to PayPal's practices resulting from these lawsuits could require PayPal to incur significant costs and to expend product resources, which could delay other planned product launches or improvements and further harm our business.
17
Our Bill Me Later service is similarly subject to a variety of laws and regulations. Although we do not originate loans under the Bill Me Later service, we do purchase receivables related to the consumer loans extended by the bank which originates them. One or more jurisdictions may conclude that the eBay company which purchases those receivables is a lender or money transmitter or loan broker, which could subject us to liability or regulation in such jurisdictions. As described under the caption “Bill Me Later's operations depend on lending services provided by an unaffiliated lender” above, a lawsuit was filed against Bill Me Later in the U.S. District Court for the Northern District of California alleging that in its relationship with the former issuer of the Bill Me Later credit products, Bill Me Later was acting as the true lender to customers in violation of various California laws, including the state's usury law.
Additionally, federal regulators could mandate changes to the relationship between us and the issuing bank of the Bill Me Later credit products. Any termination or interruption of the issuing bank's lending services to consumers could result in an interruption of Bill Me Later services, as described under the caption “Bill Me Later's operations depend on lending services provided by an unaffiliated lender” above.
Given that our Payments business is subject to regulations in the manner described above, any determination that we have not properly complied with laws and regulations or any instances in which we are criminally indicted or found to have violated a criminal statute or regulation could adversely impact our regulatory status in one or more jurisdictions, which would harm our business.
The listing or sale by our users of pirated or counterfeit items may harm our business.
We have received in the past, and we anticipate receiving in the future, communications alleging that certain items listed or sold through our service by our users infringe third-party copyrights, trademarks and trade names, or other intellectual property rights. See “Item 3: Legal Proceedings” below. Although we have sought to work actively with the owners of intellectual property rights to eliminate listings offering infringing items on our websites, some rights owners have expressed the view that our efforts are insufficient. Content owners and other intellectual property rights owners have actively asserted their purported rights against online companies, including eBay. Allegations of infringement of intellectual property rights have resulted in threatened and actual litigation against us from time to time by rights owners, including litigation brought by luxury brand owners such as Tiffany & Co. in the U.S.; Rolex S.A. and Coty Prestige Lancaster Group GmbH in Germany; Louis Vuitton Malletier and Christian Dior Couture in France; and L'Oréal SA, Lancôme Parfums et Beauté & Cie and Laboratoire Garnier & Cie in several European countries. The plaintiffs in these cases seek to hold eBay liable for alleged counterfeit items listed on our sites by third parties; for “tester” and other consumer products labeled in a manner to prevent resale and for unboxed and other allegedly nonconforming products listed on our sites by third parties; for the alleged misuse of trademarks or copyrights in listings or otherwise on our sites and in connection with paid search advertisements; for alleged violations of selective distribution channel laws or parallel import laws for listings of authentic items; and for alleged non-compliance with consumer protection laws. Such plaintiffs seek, among other remedies, injunctive relief and damages. In the aggregate, these suits could result in significant damage awards and injunctions that could, individually or in the aggregate, adversely affect our business. There are approximately 30,000 rights owners in our verified rights owner (VeRO) program, and each rights owner has anywhere from one to several hundred brands. Statutory damages for copyright or trademark violations could range up to $30,000 per copyright violation and $100,000 per trademark violation in the U.S., and may be even higher in other jurisdictions. These and similar suits may force us to modify our business practices, which could lower our revenue, increase our costs or make our websites less convenient to our customers, any of which could materially harm our business. In addition, rights owners have aggressively sought to reduce the applicability of limitations to intellectual property rights such as copyright exhaustion and the first sales doctrine in cases such as Vernor v. Autodesk Inc. (Ninth Circuit Court of Appeals), Wiley v. Kirtsaeng (Second Circuit Court of Appeals) and Costco Wholesale Corp. v. Omega S.A. (Sup. Ct.). To the extent such doctrines are limited, the supply of goods available for resale on our sites may be adversely affected.
In addition to litigation from rights owners, we may be subject to regulatory, civil or criminal proceedings and penalties if governmental authorities believe we have aided in the sale of counterfeit goods. While we have had some early success in defending against such litigation, more recent cases have been based, at least in part, on different legal theories than those of earlier cases, and there is no guarantee that we will continue to be successful in defending against such litigation. Plaintiffs in recent cases have argued that we are not entitled to safe harbors under the Digital Millennium Copyright Act in the U.S. or as a hosting provider in the European Union under the Electronic Commerce Directive because of the alleged active nature of our involvement with our sellers, and that whether or not such safe harbors are available, we should be found liable because we supposedly have not adequately removed listings that are counterfeit or are authentic but allegedly violate trademark or copyright law or effectively suspended users who have created such listings. While we do not believe the European Court of Justice decision in the L'Oréal case (see “Item 3: Legal Proceedings” below) changes the standard for hosting immunity under the Electronic Commerce directive, rights owners in European jurisdictions have asserted that our degree of participation in the transaction should cause us to be unable to take advantage of the hosting immunity exception. Final resolution of this issue has been left to the national courts of countries in the European Union. We are continuously seeking to improve and modify our efforts to eliminate counterfeit and pirated items through ongoing business initiatives designed to reduce bad buyer experiences
18
and improve customer satisfaction and by responding to new patterns we are seeing among counterfeiters and others committing fraud on our users. Notwithstanding these efforts, we believe that the legal climate, especially in Europe, is becoming more adverse to our positions, which may require us to take actions which could lower our revenues, increase our costs, or make our websites less convenient to our customers, any of which could materially harm our business. In addition, a public perception that counterfeit or pirated items are commonplace on our sites, even if factually incorrect, would damage our reputation, lower the price our sellers receive for their items and damage our business.
Content owners and other intellectual property rights owners may also seek to bring legal action against entities that are peripherally involved in the sale of infringing items, such as payment companies. To the extent that intellectual property rights owners bring legal action against PayPal based upon the use of PayPal's payment services in a transaction involving the sale of infringing items, including on our websites, our business could be harmed. Several jurisdictions have adopted new laws in these areas, and others are considering imposing additional restrictions.
In addition, new laws have been proposed regulating Internet companies with respect to intellectual property issues. For example, SOPA, which has been introduced in the U.S. House of Representatives, and PIPA, which has been proposed in the U.S. Senate, would give rights owners and the government broad powers to bring lawsuits against websites accused of enabling or facilitating copyright infringement, and such lawsuits could result in, among other consequences, payment providers such as PayPal being precluded from doing business with allegedly infringing sites, as well as search engines being precluded from linking to, and Internet service providers being required to block access to, such sites. In addition, the European Commission has reopened the Intellectual Property Enforcement Directive, which could potentially increase our exposure to enforcement actions from rights owners. Implementation of these or similar laws could require us to change our business practices, increase our compliance costs and harm our business.
We are subject to patent litigation.
We have repeatedly been sued for allegedly infringing other parties' patents. We are a defendant in a number of patent suits and we have been notified of several other potential patent disputes. We expect that we will increasingly be subject to patent infringement claims involving various aspects of our Marketplaces, Payments and GSI segments as our services continue to expand in scope and complexity (e.g., our local, social, mobile and digital initiatives), as we expand into new businesses, including through acquisitions, and as the universe of patent owners who may claim that we, companies that we have acquired, or our customers infringe their patents and the aggregate number of patents controlled by such patent owners correspondingly increases. Such claims may be brought directly against our companies and/or against our customers (whom we may indemnify either because we are contractually obligated to do so or as a business matter). We and other technology companies have seen more of these claims from an increasing number of third parties whose sole or primary business is to assert such claims. These claims, whether meritorious or not, are time consuming and costly to resolve, and could require expensive changes in our methods of doing business, could require us to enter into costly royalty or licensing agreements, or could require us to cease conducting certain operations.
Use of our services for illegal purposes could harm our business.
We may be unable to prevent our users from selling unlawful or stolen goods or unlawful services, or selling goods or services in an unlawful manner, and we may be subject to allegations of civil or criminal liability for unlawful activities carried out by users through our services. We have been subject to several lawsuits based upon such allegations. In December 2004, an executive of Baazee.com, our Indian subsidiary, was arrested in connection with a user's listing of a pornographic video clip on that website. We continue to contest the charges related to this arrest. Similarly, one of our Korean subsidiaries (IAC) and one of its employees were found criminally liable for listings (which occurred prior to our acquisition of IAC) on IAC's website. The German Federal Supreme Court has ruled that we may have a duty to take reasonable measures to prevent prohibited DVDs from being sold on our site to minors and that competitors may be able to enforce this duty. In a number of circumstances, third parties, including government regulators and law enforcement officials, have alleged that our services aid and abet certain violations of certain laws, including antiscalping laws with respect to the resale of tickets, laws regarding the sale of counterfeit items, the fencing of stolen goods, selective distribution channel laws, distance selling laws and the sale of items outside of the U.S. that are regulated by U.S. export controls. As we seek to reduce bad buying experiences and improve the customer experience on our sites, our level of interaction with buyers and sellers may increase over time, which could in turn increase our potential exposure to allegations of civil or criminal liability for unlawful activities carried out by users through our services.
Although we have prohibited the listing of illegal and stolen goods and certain high-risk items and implemented other protective measures, we may be required to spend substantial resources to take additional protective measures or discontinue certain service offerings, any of which could harm our business. Any costs incurred as a result of potential liability relating to the alleged or actual sale of unlawful goods or the unlawful sale of goods could harm our business. Certain manufacturers and
19
large retailers have sought new U.S. federal and state legislation regarding stolen goods that could limit our ability to allow sellers to use our sites without confirming the source of, and their legal rights to sell, the underlying goods. In addition, from time to time we have received significant media attention relating to the listing or sale of illegal goods and stolen goods using our services. This negative publicity could damage our reputation, diminish the value of our brand names and make users reluctant to use our services.
PayPal's payment system is also susceptible to potentially illegal or improper uses, including illegal online gambling, fraudulent sales of goods or services, illicit sales of prescription medications or controlled substances, piracy of software, movies, music and other copyrighted or trademarked goods, money laundering, terrorist financing, bank fraud, child pornography trafficking, prohibited sales of alcoholic beverages or tobacco products, online securities fraud and encouraging, promoting, facilitating or instructing others to engage in illegal activities. There has been an increased focus by rights owners and U.S. government officials on the role that payments systems play in the sale of, and payment for, pirated digital goods on the Internet. Recent changes in law have increased the penalties for intermediaries providing payment services for certain illegal activities and additional payments-related proposals are under active consideration by government policymakers. Despite measures PayPal has taken to detect and lessen the risk of this kind of conduct, illegal activities could still be funded using PayPal. Any resulting claims, liabilities or loss of transaction volume could harm our business.
If our GSI business is unable to enhance its platform and migrate clients to its new platform in a timely and cost-effective manner, it would be substantially harmed.
Our GSI business is in the process of enhancing and unbundling the components of its ecommerce and payments platform and migrating its existing customers to its new platform. This project is very expensive and time consuming and involves significant technical risk. Previously planned migrations of certain clients to the new platform have been delayed into 2012 and beyond. If client migrations to the new platform continue to be delayed, the functionality of the new platform is not accepted by GSI's existing clients or prospective clients targeted by GSI, the new platform contains an unacceptable amount of design flaws or does not perform or operate as expected, or GSI fails to meet client commitments and services level agreements, GSI could be subject to substantial penalties under its agreements with its clients (including significant financial penalties and termination rights for its affected clients), our relationships with its clients and their respective businesses could be substantially harmed, and GSI clients may seek to terminate their contracts with GSI early based on actual or proposed breach. Any of these events or circumstances could materially and adversely affect our GSI business. Even if accomplished successfully, this development and migration project may cost more than expected or take longer than currently planned, which could harm our GSI business.
We are subject to risks associated with information disseminated through our service.
The law relating to the liability of online services companies for information carried on or disseminated through their services remains unsettled in many jurisdictions. Claims could be made against online services companies under both U.S. and foreign law for defamation, libel, invasion of privacy, negligence, copyright or trademark infringement, or other theories based on the nature and content of the materials disseminated through their services. Several private lawsuits seeking to impose liability under a number of these theories have been brought against us, as well as other online service companies. In addition, domestic and foreign legislation has been proposed that would prohibit or impose liability for the transmission over the Internet of certain types of information. Our Marketplaces service features a Feedback Forum, which includes information from users regarding other users. Although all such feedback is generated by users and not by us, claims of defamation or other injury have been made in the past and could be made in the future against us for not removing content posted in the Feedback Forum.
Furthermore, several court decisions arguably have narrowed the scope of the immunity provided to Internet service providers like us in the U.S. under the Communications Decency Act. For example, the Ninth Circuit has held that certain immunity provisions under the Communications Decency Act might not apply to the extent that a website owner materially contributes to the development of unlawful content on its website. As our websites evolve, challenges to the applicability of these immunities can be expected to continue. In addition, the Paris Court of Appeal has ruled in the Louis Vuitton Malletier and Christian Dior Couture cases that applicable laws protecting passive Internet “hosts” from liability are inapplicable to eBay given that eBay actively promotes bidding on its sellers' listings and receives a commission on successful transactions, and is therefore a broker. The ECJ decision in the L'Oreal case (see “Item 3: Legal Proceedings” below) gave broad discretion to national courts in Europe to determine if Internet hosting immunity applies to eBay. Accordingly, our potential liability to third parties for the user-provided content on our sites, particularly in jurisdictions outside the U.S. where laws governing Internet transactions are unsettled, may increase. If we become liable for information provided by our users and carried on our service in any jurisdiction in which we operate, we could be directly harmed and we may be forced to implement new measures to reduce our exposure to this liability, including expending substantial resources or discontinuing certain service offerings, which would negatively affect our financial results. In addition, the increased attention focused upon liability issues as a result of these
20
lawsuits and legislative proposals could require us to incur additional costs and harm our reputation and our business.
Government inquiries may lead to charges or penalties.
A large number of transactions occur on our websites on a daily basis. Government regulators have received a significant number of consumer complaints about eBay, PayPal and GSI, which, while small as a percentage of our total transactions, are large in aggregate numbers. As a result, from time to time we have been contacted by various U.S. and foreign governmental regulatory agencies that have questions about our operations and the steps we take to protect our users from fraud. PayPal has received inquiries regarding its restriction and disclosure practices from the Federal Trade Commission and regarding these and other business practices from the attorneys general of a number of states. In September 2006, PayPal entered into a settlement agreement with the attorneys general of a number of states under which it agreed to pay $1.7 million to the attorneys general, shorten and streamline its user agreement, increase educational messaging to users about funding choices and communicate more information regarding protection programs to users.
From time to time, we face inquiries from government regulators in various jurisdictions related to actions that we have taken that are designed to improve the security of transactions and the quality of the user experience on our websites and we may face similar inquiries from other government regulators in the future. For example, in 2008, the Australian Competition and Consumer Commission and the Reserve Bank of Australia reviewed our policies requiring sellers to offer PayPal as a payment alternative on most transactions on our localized Australian website and precluding sellers from imposing a surcharge or any other fee for accepting PayPal or other payment methods. Other regulators have requested information concerning PayPal's limitations of customer accounts. Similarly, Bill Me Later has from time to time received customer complaints that could result in investigations into Bill Me Later's business practices by state or federal regulators. As a result of the recent credit crisis, new laws have been, and additional new laws and regulations are expected to be, adopted that impose additional obligations and restrictions on the provision of credit, among other requirements. We are likely to receive additional inquiries from regulatory agencies in the future, including under existing or new credit laws or regulations, which may lead to action against us. We have responded to all inquiries from regulatory agencies by describing our current and planned antifraud efforts, customer support procedures, operating procedures and disclosures of the relevant business. If one or more of these agencies is not satisfied with our response to current or future inquiries, we could be subject to enforcement actions, fines or other penalties, or forced to change our operating practices in ways that could harm our business.
We are subject to general litigation and regulatory disputes.
From time to time, we are involved in other disputes or regulatory inquiries that arise in the ordinary course of business. The number and significance of these disputes and inquiries have increased as our company has grown larger and the scope and complexity of our businesses has expanded (e.g., our local, social, mobile and digital initiatives). We have in the past been forced to litigate such claims. We may also become more vulnerable to third-party claims as laws such as the Digital Millennium Copyright Act, the Lanham Act and the Communications Decency Act are interpreted by the courts as our services to users continues to expand and as we expand geographically into jurisdictions where the underlying laws with respect to the potential liability of online intermediaries such as ourselves are either unclear or less favorable. We are also subject to federal, state, local and foreign laws of general applicability, including laws regulating working conditions. Any claims or regulatory actions against us, whether meritorious or not, could be time consuming, result in costly litigation, damage awards (including statutory damages for certain causes of action in certain jurisdictions), injunctive relief, or increased costs of doing business through adverse judgment or settlement, require us to change our business practices in expensive ways, require significant amounts of management time, result in the diversion of significant operational resources, or otherwise harm our business.
Changes to our dispute resolution process could increase our costs and loss rate.
Beginning in 2009, we have transitioned buyers in the U.S., U.K. and Germany to a dispute resolution (“resolutions”) process provided by eBay customer support, which now serves as the primary entry point for buyers in these countries if they are unable to resolve their disputes with eBay sellers. Among other things, the resolutions process provides that eBay will generally reimburse the buyer for the full amount of an item's purchase price (including original shipping costs), in cases where the item was not received or the item they received was different from that described in the listing, and the seller does not provide adequate resolution to the buyer. eBay then attempts to recoup amounts paid to the buyer from the seller's PayPal accounts or through other collection methods. Our costs associated with resolutions have increased as a result of these changes to our resolutions policies and process, in part because eBay may not have the same level of rights of recoupment against sellers as PayPal, resulting in higher costs to operate the program. These changes, together with any further changes that we may make to our resolutions process in the future, may be negatively received by, and lead to dissatisfaction on the part of, some of our sellers, and may also result in an increase in buyer fraud and associated transaction losses.
21
In the event of the bankruptcy or other business interruption of a merchant that sells goods or services in advance of the date of their delivery or use (e.g., airline, cruise or concert tickets, custom-made goods, or subscriptions), eBay and/or PayPal could be liable to the buyers of such goods or services, either through its buyer protection program or through chargebacks on payment cards used by customers to fund their payment through PayPal. While we have established reserves based on assumptions and estimates that we believe are reasonable to cover such eventualities, these reserves may be insufficient and our operating results could be adversely affected.
Failure to deal effectively with bad transactions and customer disputes would increase our loss rate and harm our business.
Over the last several years, we have enhanced the buyer and seller protections offered by PayPal in certain eBay marketplaces, and in certain countries for transactions outside of eBay marketplaces. These changes to PayPal's buyer and seller protection program could result in future changes and fluctuations in our Payments transaction loss rate. For the fiscal years ended December 31, 2011 and 2010, our Payments transaction losses (including both direct losses and buyer protection payouts) totaled $246.4 million and $153.1 million, representing 0.21% and 0.17 % of our net total payment volume, respectively. Beginning in 2009, we have also changed the dispute resolution process for transactions on eBay.com, eBay.co.uk and eBay.de, as described in greater detail above under the caption “Changes to our dispute resolution process could increase our costs and loss rate,” which could result in an increase in our combined eBay and PayPal transaction losses.
PayPal's highly automated and liquid payment service makes PayPal an attractive target for fraud. In configuring its service, PayPal continually strives to maintain the right balance of appropriate measures to promote both convenience and security for customers. Identity thieves and those committing fraud using stolen credit card or bank account numbers can potentially steal large amounts of money from businesses such as PayPal. We believe that several of PayPal's current and former competitors in the electronic payments business have gone out of business or significantly restricted their businesses largely due to losses from this type of fraud. While PayPal uses advanced anti-fraud technologies, we expect that technically knowledgeable criminals will continue to attempt to circumvent PayPal's anti-fraud systems using increasingly sophisticated methods. From time to time, such fraudsters may discover and exploit vulnerabilities that may not immediately be identified and remediated, which in turn may result in one-time increases in fraud and associated transaction losses. In addition, because users frequently use the same passwords for different sites, a data breach of a third party site can result in a spike in transaction losses. Finally, PayPal's service could be subject to employee fraud or other internal security breaches, and PayPal may be required to reimburse customers for any funds stolen as a result of such breaches. Merchants could also request reimbursement, or stop using PayPal, if they are affected by buyer fraud or other types of fraud.
PayPal incurs substantial losses due to claims from buyers that merchants have not performed or that their goods or services do not match the merchant's description, whether those claims arise from merchant fraud or from an unintentional failure to perform by the merchant. PayPal seeks to recover such losses from the merchant, but may not be able to recover in full if the merchant is unwilling or unable to pay. PayPal also incurs losses from claims that the customer did not authorize the purchase, from buyer fraud, from erroneous transmissions and from customers who have closed bank accounts or have insufficient funds in them to satisfy payments. In addition, if losses incurred by PayPal related to payment card transactions become excessive, they could potentially result in PayPal losing the right to accept payment cards for payment, which would materially and adversely affect PayPal's business both on and off eBay. In the event that PayPal was unable to accept payment cards, the velocity of trade on eBay and websites operated by GSI's clients that accept PayPal as a form of payment could also decrease, in which case our business would further suffer. The Bill Me Later service is similarly subject to the risk of fraudulent activity associated with merchants, users of the Bill Me Later service and third parties handling its user information. Our Payments business has taken measures to detect and reduce the risk of fraud, but these measures need to be continually improved and may not be effective against new and continually evolving forms of fraud or in connection with new product offerings. If these measures do not succeed, our business will suffer.
eBay faces similar risks with respect to fraudulent activities on its websites. eBay periodically receives complaints from users who may not have received the goods that they had purchased. In some cases, individuals have been arrested and convicted for fraudulent activities using our websites. eBay also receives complaints from sellers who have not received payment for the goods that a buyer had contracted to purchase. Non-payment may occur because of miscommunication, because a buyer has changed his or her mind and decided not to honor the contract to purchase the item, or because the buyer bid on the item maliciously in order to harm either the seller or eBay. In some European and Asian jurisdictions, buyers may also have the right to withdraw from a sale made by a professional seller within a specified time period. While eBay can, in some cases, suspend the accounts of users who fail to fulfill their payment or delivery obligations to other users, eBay does not have the ability to require users to make payment or deliver goods, or otherwise make users whole other than through our buyer protection programs. The impact of changes to our dispute resolutions program implemented beginning in 2009 is discussed in more detail above under the caption “Changes to our dispute resolution process could increase our costs and loss rate.”
22
Our limited eBay and PayPal buyer protection programs represent the means by which we compensate users who believe that they have been defrauded, have not received the item that they purchased, or have received an item different than what was described. However, users who pay through PayPal may have reimbursement rights from their credit card company or bank, which in turn will seek recovery from PayPal. eBay also periodically receives complaints from buyers as to the quality of the goods purchased. We expect to continue to receive communications from users requesting reimbursement or threatening or commencing legal action against us if no reimbursement is made. Our liability for these sort of claims is only beginning to be clarified in some jurisdictions and may be higher in some non-U.S. jurisdictions than it is in the U.S. Litigation involving liability for third-party actions could be costly and time consuming for us, divert management attention, result in increased costs of doing business, lead to adverse judgments, or otherwise harm our business. In addition, affected users will likely complain to regulatory agencies that could take action against us, including imposing fines or seeking injunctions.
Negative publicity and user sentiment generated as a result of fraudulent or deceptive conduct by users of our Marketplaces, Payments and GSI services could damage our reputation, reduce our ability to attract new users or retain our current users and diminish the value of our brand names. We believe that negative user experiences are one of the primary reasons users stop using our services.
From time to time, we have considered more active mechanisms designed to combat bad buyer experiences and increase buyer satisfaction, including evaluating sellers on the basis of their transaction history and restricting or suspending their activity as a result. For example, in the U.S. and the U.K., we may request that PayPal hold seller funds in certain instances (e.g., for sellers with a limited selling history or below-standard performance ratings), which is intended to help improve seller performance and increase buyer satisfaction. We may expand the scope of such programs in the future and introduce other programs with similar aims in these and other countries. Our increased usage of these or other mechanisms to attempt to improve buyer satisfaction could result in dissatisfaction on the part of sellers, loss of share to competing marketplaces, reduced selection of inventory on our sites and other adverse effects.
Governmental regulators worldwide are also evaluating approaches intended to reduce online fraud. Some of the current proposals (e.g., two-factor authentication in France to verify a user's identity) could increase our costs or require us to change our business practices in a manner that could harm our business.
Any factors that reduce cross-border trade could harm our business.
Cross-border trade has become an increasingly important source of both revenue and profits for us. Cross-border transactions using our websites generally provide higher revenues and gross margins than similar transactions that take place within a single country or market. We generally earn higher transaction fees for cross-border transactions involving PayPal, and our Marketplaces business continues to represent a relatively straightforward way for buyers and sellers to engage in cross-border trade compared with other alternatives. Cross-border trade also represents our primary (or in some cases, only) presence in certain markets in which Internet use is accelerating and we have a limited (or no) domestic Marketplaces business (e.g., Brazil/Latin America, China, Russia and various developing countries).
The interpretation and application of specific national or regional laws, such as selective distribution channel laws and parallel import laws, to users in other countries (e.g., the interpretation and application of such laws to the sale of “gray market” goods) and the potential interpretation and application of laws of multiple jurisdictions (e.g., the jurisdiction of the buyer, the seller, and/or the location of the item being sold) are extremely complicated in the context of cross-border trade, and to the extent any interpretation or application of such laws imposes restrictions on, or increases the costs of, purchasing, selling or shipping goods across national borders, our business would be harmed. Any additional factors that increase the costs of purchasing, selling or shipping goods across national borders make it more difficult to do so in practice, including fluctuations in currency exchange rates, delivery service rates, currency restrictions, export control laws, customs enforcement, court rulings and tariffs, or that otherwise would result in a net reduction in cross-border trade on our sites, would adversely affect our business.
Our business is subject to online security risks, including security breaches.
Our businesses involve the storage and transmission of users' proprietary information, and security breaches could expose us to a risk of loss or misuse of this information, litigation and potential liability. An increasing number of websites, including several other large Internet companies, have recently disclosed breaches of their security, some of which have involved sophisticated and highly targeted attacks on portions of their sites. Because the techniques used to obtain unauthorized access, disable or degrade service, or sabotage systems, change frequently and often are not recognized until launched against a target, we may be unable to anticipate these techniques or to implement adequate preventative measures. If an actual or perceived breach of our security occurs, public perception of the effectiveness of our security measures could be harmed and we could lose users. A party that is able to circumvent our security measures could misappropriate our or our users' proprietary
23
information, cause interruption in our operations, damage our computers or those of our users, or otherwise damage our reputation and business. Any compromise of our security could result in a violation of applicable privacy and other laws, significant legal and financial exposure, damage to our reputation and a loss of confidence in our security measures, which could harm our business. Data security breaches may also result from non-technical means, for example, actions by a suborned employee. GSI's clients also face similar risks of security breaches, and to the extent that such clients are harmed as a result of a security breach, GSI's business would also be adversely affected.
A significant number of our users authorize us to bill their payment card accounts directly for all transaction fees charged by us. For example, PayPal's users routinely provide credit card and other financial information, and GSI customers routinely provide credit card information and other personally identifiable information which we maintain to facilitate the ease of future transactions. We rely on encryption and authentication technology licensed from third parties to provide the security and authentication to effectively secure transmission of confidential information, including customer payment card numbers. Advances in computer capabilities, new discoveries in the field of cryptography or other developments may result in the technology used by us to protect transaction data being breached or compromised.
Under payment card rules and our contracts with our card processors, if there is a breach of payment card information that we store, or that is stored by PayPal's direct payment card processing customers, we could be liable to the payment card issuing banks for their cost of issuing new cards and related expenses. In addition, if we fail to follow payment card industry security standards, even if customer information has not been compromised, we could incur significant fines or lose our ability to give customers the option of using payment cards to fund their payments or pay their fees. If we were unable to accept payment cards, our businesses would be seriously damaged.
Our servers are also vulnerable to computer viruses, physical or electronic break-ins and similar disruptions, and we have experienced “denial-of-service” type attacks on our system that have, in certain instances, made all or portions of our websites unavailable for periods of time. For example, in December 2010, PayPal was subject to a series of distributed “denial of service” attacks following PayPal's decision to permanently restrict the account used by WikiLeaks due to an alleged violation of PayPal's Acceptable Use Policy. We may need to expend significant resources to protect against security breaches or to address problems caused by breaches. These issues are likely to become more difficult as we expand the number of places where we operate. Security breaches, including any breaches of our security measures or those of parties with which we have commercial relationships (e.g., our clients and third-party service providers) that result in the unauthorized release of users' personal information, could damage our reputation and expose us to a risk of loss or litigation and possible liability. Our insurance policies carry low coverage limits, which may not be adequate to reimburse us for losses caused by security breaches.
Our users, as well as those of other prominent Internet companies, have been and will continue to be targeted by parties using fraudulent “spoof” and “phishing” emails to misappropriate passwords, credit card numbers, or other personal information or to introduce viruses or other malware through “trojan horse” programs to our users' computers. These emails appear to be legitimate emails sent by eBay, PayPal, a GSI client, or one of our other businesses (e.g., StubHub), or by a user of one of our businesses, but direct recipients to fake websites operated by the sender of the email or request that the recipient send a password or other confidential information via email or download a program. Despite our efforts to mitigate “spoof” and “phishing” emails through product improvements and user education, “spoof” and “phishing” activities remain a serious problem that may damage our brands, discourage use of our websites and increase our costs.
Changes in regulations or user concerns regarding privacy and protection of user data could adversely affect our business.
We are subject to laws relating to the collection, use, retention, security and transfer of personally identifiable information about our users, especially for financial information and for users located outside of the U.S. As an entity licensed and subject to regulation as a bank in Luxembourg, PayPal (Europe) S.A.R.L. et Cie, SCA is subject to banking secrecy laws. In many cases, these laws apply not only to third-party transactions, but also to transfers of information between ourselves and our subsidiaries, and between ourselves, our subsidiaries and other parties with which we have commercial relations. The interpretation and application of user data protection laws are in a state of flux, and may be interpreted and applied inconsistently from country to country. The European Union recently proposed new data laws that give customers additional rights and provide additional restrictions on data use by companies and harsher penalties if data is misused. Our current data protection policies and practices may not be consistent with new laws and regulations or evolving interpretations and applications. Complying with these varying international requirements could cause us to incur substantial costs or require us to change our business practices in a manner adverse to our business.
In addition, we have and post on our websites our own privacy policies and practices concerning the collection, use and disclosure of user data. Any failure, or perceived failure, by us to comply with our posted privacy policies or with any regulatory requirements or orders or other federal, state or international privacy or consumer protection-related laws and
24
regulations (or, in the case of our GSI businesses, any such failure or perceived failure on the part of GSI or GSI's clients) could result in proceedings or actions against us by governmental entities or others (e.g., class action privacy litigation), subject us to significant penalties and negative publicity, require us to change our business practices, increase our costs and adversely affect our business. For example, the Federal Trade Commission, or FTC, has recently entered into an a number of consent decrees with major online companies, including Facebook and Google, to settle allegations of unfair or deceptive privacy practices. The FTC's consent decrees with Facebook and Google require those companies to implement a comprehensive privacy program and undergo regular, independent privacy audits for the next 20 years, among other requirements.
Certain of our businesses, including GSI's interactive marketing services business, utilize “behavioral marketing” (generally, the tracking of a user's online activities) to deliver relevant content to Internet users. The FTC has released a Staff Report with principles to address consumer privacy issues that may arise from behavioral marketing and to encourage industry self-regulation. The FTC also has issued a Staff Report in December 2010 on consumer privacy policy, proposing a set of self-regulatory best practices and several policy recommendations for consideration by Congress, including institution of "do not track" mechanisms. Any such regulations or legislation could, if enacted, prohibit the use of certain technologies, including those that track individuals' activities on the Internet or geolocation via mobile devices. Such laws and regulations could restrict our ability to collect and use page viewing data and personal information, which may reduce demand for our services or require changes to our current business models, which could harm our business.
Data collection, privacy and security have become the subject of increasing public concern. If Internet and mobile users were to reduce their use of our websites and services as a result, our business could be harmed. As noted above, we are also subject to the possibility of security breaches, which themselves may result in a violation of these laws.
Our revenue from advertising is subject to factors beyond our control.
We derive significant revenue from advertising on our websites. Revenues from online advertising are sensitive to events and trends that affect advertising expenditures, such as general changes in the economy and changes in consumer spending, the effectiveness of online advertising versus offline advertising media and the value our websites provide to advertisers relative to other websites. The economic downturn adversely impacted our advertising revenue. In addition, major search engine operators have the ability to change from time to time, at their sole discretion, the rules and search algorithms governing the pricing, availability and placement of online advertising. Any changes in these rules or search algorithms could materially reduce the value that we derive from online advertising on our websites, either directly or indirectly. For example, retailers pay a fee to Shopping.com for online shoppers directed to their websites by our Shopping.com website. Rule changes made by search engines beginning in 2008 disrupted traffic to our Shopping.com website, which in turn adversely affected click-through traffic to retailers from our Shopping.com website and associated fee revenue. Finally, legislators and regulators in various jurisdictions, including the U.S. and the European Union, are reviewing Internet advertising models and the use of user-related data and considering proposals that could restrict or otherwise impact this business model. If we experience a reduction in our advertising revenues due to economic, competitive, regulatory, technological or other factors, or the renegotiation of the terms of our contracts with major advertising companies, or a reduction in our ability to effectively place advertisements on our sites, or are otherwise unable to provide value to our advertisers, our business and financial results would suffer.
Our growth will depend on our ability to develop our brands, and these efforts may be costly.
We believe that continuing to strengthen our brands will be critical to achieving widespread acceptance of our services, and will require a continued focus on active marketing efforts across all of our brands. We will need to continue to spend substantial amounts of money on, and devote substantial resources to, advertising, marketing, and other efforts to create and maintain brand loyalty among users. Since 2005, we have significantly increased the number of brands we are supporting, adding Shopping.com, our classified websites (including Den Blå Avis, BilBasen, eBay Classifieds (including eBay Anuncios, eBay Kleinanzeigen and eBay Annunci), Gumtree, Kijiji, LoQUo, Marktplaats.nl, mobile.de, Alamaula and Rent.com), StubHub, Bill Me Later, Gmarket, Milo, WHERE, Red-Laser, Zong and GSI, among others. Each of these brands requires its own resources, increasing the costs of our branding efforts. Brand promotion activities may not yield increased revenues, and even if they do, any increased revenues may not offset the expenses incurred in building our brands. Also, major search engine operators that we use to advertise our brands have frequently changing rules that govern the pricing, availability and placement of online advertisements (e.g., paid search, keywords), and changes to these rules could negatively affect our ability to use online advertising to promote our brands in a cost-effective manner. If we fail to promote and maintain our brands, or if we incur substantial expenses in an unsuccessful attempt to promote and maintain our brands, our business would be harmed.
25
New and existing regulations could harm our business.
We are subject to the same foreign and domestic laws as other companies conducting business on and off the Internet. It is not always clear how existing laws governing issues such as property ownership, copyrights, trademarks and other intellectual property issues, parallel imports and distribution controls, taxation, libel and defamation, obscenity and personal privacy apply to online businesses such as ours. The majority of these laws were adopted prior to the advent of the Internet and related technologies and, as a result, do not contemplate or address the unique issues of the Internet and related technologies. Those laws that do reference the Internet, such as the U.S. Digital Millennium Copyright Act, the U.S. “CAN-SPAM” Act and the European Union's Directives on Distance Selling and Electronic Commerce, are being interpreted by the courts, but their applicability and scope remain uncertain. As our activities and the types of goods and services listed on our websites expand, including through acquisitions such as Bill Me Later and StubHub, regulatory agencies or courts may claim or hold that we or our users are subject to licensure or prohibited from conducting our business in their jurisdiction, either generally or with respect to certain actions (e.g., the sale of real estate, event tickets, cultural goods, boats and automobiles). Recent financial and political events may increase the level of regulatory scrutiny on large companies in general, and financial services companies in particular, and regulatory agencies may view matters or interpret laws and regulations differently than they have in the past and in a manner adverse to our businesses.
Our success and increased visibility has driven some existing businesses that perceive our business model to be a threat to their business to raise concerns about our business models to policymakers and regulators. These established businesses and their trade association groups employ significant resources in their efforts to shape the legal and regulatory regimes in countries where we have significant operations. They may employ these resources in an effort to change the legal and regulatory regimes in ways intended to reduce the effectiveness of our businesses and the ability of users to use our products and services. In particular, these established businesses have raised concerns relating to pricing, parallel imports, professional seller obligations, selective distribution networks, stolen goods, copyrights, trademarks and other intellectual property rights and the liability of the provider of an Internet marketplace for the conduct of its users related to those and other issues. Changing the legal or regulatory regimes in a manner that would increase our liability for third-party listings could negatively impact our business.
Over the last few years some large retailers and their trade associations have sought legislation in a number of states and the U.S. Congress that would make eBay liable for the sale of stolen property or would ban certain categories of goods from sale on our platform, including gift cards and health and beauty products. While no such legislation has passed to date, the proponents continue to seek passage of such legislation, and if any of these laws are adopted they could harm our business.
Numerous states and foreign jurisdictions, including the State of California, where our headquarters are located, have regulations regarding “auctions” and the handling of property by “secondhand dealers” or “pawnbrokers.” Several states and some foreign jurisdictions, including France, have attempted, and may attempt in the future, to impose such regulations upon us or our users. Attempted enforcement of these laws against some of our users appears to be increasing. In France, we have been sued by Conseil des Ventes, the French auction regulatory authority, which has alleged that sales on our French website constitute illegal auctions that cannot be performed without its consent. Although we have won this lawsuit in the lower court, this decision is being appealed. A lawsuit alleging similar claims has been brought against us by two associations of French antique dealers, and is now pending on appeal after we won this lawsuit in the first instance. We intend to vigorously defend against these lawsuits. However, these and other regulatory and licensure claims and enforcement actions could result in costly litigation and, if unsuccessful, we could be required to change the way we or our users do business in ways that increase costs or reduce revenues (for example, by forcing us to prohibit listings of certain items or restrict certain listing formats in some locations). We could also be subject to fines or other penalties, and any of these outcomes could harm our business.
A number of the lawsuits against us relating to trademark issues seek to have our websites subject to unfavorable local laws. For example, “trademark exhaustion” principles provide trademark owners with certain rights to control the sale of a branded authentic product until it has been placed on the market by the trademark holder or with the holder's consent. The application of “trademark exhaustion” principles is largely unsettled in the context of the Internet, and if trademark owners are able to force us to prohibit listings of certain items in one or more locations, our business could be harmed.
As we expand and localize our international activities, we become obligated to comply with the laws of the countries or markets in which we operate. In addition, because our services are accessible worldwide and we facilitate sales of goods and provide services to users worldwide, one or more jurisdictions may claim that we or our users are required to comply with their laws based on the location of our servers or one or more of our users, or the location of the product or service being sold or provided in an ecommerce transaction. For example, in the Louis Vuitton Malletier litigation, we were found liable in France, under French law, for transactions on some of our websites worldwide that did not involve French buyers or sellers (see “Item 3: Legal Proceedings” below). Laws regulating Internet and ecommerce companies outside of the U.S. may be less favorable than those in the U.S., giving greater rights to consumers, content owners, competitors, users and other third parties. Compliance may be more costly or may require us to change our business practices or restrict our service offerings, and the
26
imposition of any regulations on us or our users may harm our business. In addition, we may be subject to overlapping legal or regulatory regimes that impose conflicting requirements on us (e.g., in cross-border trade). Our alleged failure to comply with foreign laws could subject us to penalties ranging from criminal prosecution to significant fines to bans on our services, in addition to the significant costs we may incur in defending against such actions.
Following the global financial crisis, U.S. federal lawmakers enacted legislation in 2010 overhauling the federal government's oversight of consumer financial products and systemic risk in the U.S. financial system. Although the full effect of the new legislation will be dependent on regulations to be adopted by a number of different agencies (including the recently created Consumer Financial Protection Bureau), we expect the general effect of the financial reform law will be to require PayPal and Bill Me Later to make additional disclosures to their users and to impose new restrictions on certain of their activities. These new obligations will impose new compliance requirements and obligations on us, increase our costs and may result in increased litigation, the need to make expensive product changes and other adverse impacts on our business. In addition, we also expect that the continued implementation of the financial reform law enacted in 2010 will adversely impact some significant traditional revenue streams for banks. For example, in June 2011, the Federal Reserve Board issued a final rule capping debit card interchange fees. As a result of this and other regulations implementing the financial reform law, banks may need to revise their business models to remain profitable, which may lead them to charge more for services which were previously provided for free or at lower cost. Any resulting increases in service fees required for PayPal to process transactions (e.g., service fees for automated clearing house transactions) would increase our costs and could adversely affect our business. In addition, in January 2012, the Consumer Financial Protection Bureau finalized new regulations, required by the Dodd-Frank Wall Street Reform and Consumer Protection Act, which will require PayPal, starting in 2013, to provide additional disclosures, error resolution rights and cancellation rights to U.S. consumers who make international payments. These new requirements could increase our costs of processing international payments and could adversely affect our business.
Changes to payment card networks or bank fees, rules, or practices could harm PayPal's business.
PayPal does not directly access payment card networks, such as Visa and MasterCard, which enable PayPal's acceptance of credit cards and debit cards (including some types of prepaid cards). As a result, PayPal must rely on banks or other payment processors to process transactions, and must pay fees for this service. From time to time, payment card networks have increased, and may increase in the future, the interchange fees and assessments that they charge for each transaction using one of their cards. PayPal's payment card processors have the right to pass any increases in interchange fees and assessments on to PayPal as well as increase their own fees for processing. Changes in interchange fees and assessments could increase PayPal's operating costs and reduce its profit margins. In addition, in some jurisdictions, governments have required Visa and MasterCard to reduce interchange fees, or have opened investigations as to whether Visa or MasterCard's interchange fees and practices violate antitrust law. In the United States, the financial reform law enacted in 2010 authorizes the Federal Reserve Board to regulate debit card interchange rates and debit card network exclusivity provisions, and in June 2011, the Federal Reserve Board issued a final rule capping debit card interchange fees at significantly lower rates than Visa or MasterCard previously charged. Any material reduction in credit or debit card interchange rates in the United States or other markets could jeopardize PayPal's competitive position against traditional credit and debit card processors. While the regulations adopted by the Federal Reserve Board in June 2011 do not treat PayPal as a “payment card network,” future changes to those regulations or to PayPal's business could potentially cause PayPal to be treated as a payment card network, which could subject PayPal to additional regulation and require PayPal to change its business practices, which could reduce PayPal's revenue and adversely affect PayPal's business.
PayPal is required by its processors to comply with payment card network operating rules, and PayPal has agreed to reimburse its processors for any fines they are assessed by payment card networks as a result of any rule violations by PayPal or PayPal's customers. The payment card networks set and interpret the card rules. Payment card networks could adopt new operating rules or re-interpret existing rules that PayPal or its processors might find difficult or even impossible to follow, or costly to implement. As a result, PayPal could lose its ability to give customers the option of using payment cards to fund their payments, or could lose its ability to give customers the choice of currency in which they would like their card to be charged, which would reduce PayPal's revenues from cross-border trade. If PayPal were unable to accept payment cards, its business would be seriously damaged. In addition, the velocity of trade on eBay and websites operated by GSI's clients that accept PayPal as a form of payment could decrease and our business would further suffer.
PayPal is also required to comply with payment card networks' special operating rules for Internet payment services. PayPal and its payment card processors have implemented specific business processes for merchant customers in order to comply with these rules, but any failure to comply could result in fines, the amount of which would be within the payment card networks' discretion. PayPal also could be subject to fines from payment card networks if it fails to detect that merchants are engaging in activities that are illegal or that are considered “high risk,” primarily the sale of certain types of digital content. For “high risk” merchants, PayPal must either prevent such merchants from using PayPal or register such merchants with payment
27
card networks and conduct additional monitoring with respect to such merchants. PayPal has incurred fines from its payment card processors relating to PayPal's failure to detect the use of its service by “high risk” merchants. The amount of these fines has not been material, but did increase in 2011 compared to prior years. Any additional fines in the future would likely be for larger amounts, could become material and could result in a termination of PayPal's ability to accept payment cards or changes in PayPal's process for registering new customers, which would seriously damage PayPal's business.
Similarly, consumers of the websites operated by GSI's clients typically pay for purchases by payment card or similar payment method. Accordingly, our GSI ecommerce services business faces risks similar to the risks described above for PayPal.
Bill Me Later's operations expose us to additional risks.
Risks associated with our reliance on an unaffiliated lender in providing the Bill Me Later service are discussed in detail under the caption “Bill Me Later's operations depend on lending services provided by an unaffiliated lender” above.
The Bill Me Later service relies on third-party merchant processors and payment gateways to process transactions. For the fiscal years ended December 31, 2011 and December 31, 2010, approximately 69% and 67%, respectively, of all transaction volume by dollar amount through the Bill Me Later service was settled through the facilities of a single vendor. Any disruption to these third party payment processing and gateway services would adversely affect the Bill Me Later service.
The Bill Me Later service is offered to a wide range of consumers, and the financial success of this business depends on the ability of the issuing bank of the Bill Me Later credit products to manage credit risk related to those products. The lender extends credit using Bill Me Later's proprietary segmentation and credit scoring algorithms and other analytical techniques designed to analyze the credit risk of specific customers based on their past purchasing and payment history as well as their credit scores. Based on these performance criteria, the lender may extend or increase lines of credit to consumers at the point of sale. These algorithms and techniques may not accurately predict the creditworthiness of a consumer due to inaccurate assumptions about a particular consumer or the economic environment, among other factors. The accuracy of the predictions and the ability of the lender and Bill Me Later to manage credit risk related to the Bill Me Later service may also be affected by legal or regulatory changes (e.g., bankruptcy laws and minimum payment regulations), competitors' actions, changes in consumer behavior and other factors. The lender may incorrectly interpret the data produced by these algorithms in setting its credit policies, which may impact the financial performance of the Bill Me Later service. In addition, economic and financial conditions in the U.S. may affect consumer confidence levels and reduce consumers' ability or willingness to use credit, including the credit extended by the lender to consumers who use the Bill Me Later service, which could impair the growth and profitability of this business.
We anticipate that the volume of credit extended by WebBank (the financial institution issuing the Bill Me Later credit products) will increase as we continue to enable qualified buyers with a PayPal account to use Bill Me Later as a payment funding option for transactions on eBay.com and on certain merchant websites that accept PayPal. We purchase the receivables relating to these consumer loans extended by the issuing bank, and therefore bear the risk of loss. Like other businesses with significant exposure to losses from consumer credit, the Bill Me Later service faces the risk that account holders will default on their payment obligations, making the receivables uncollectible and creating the risk of potential charge-offs. The rate at which receivables were charged off as uncollectible, or the net charge-off rate, was approximately 4.46% and 7.71%, respectively, for the fiscal years ended December 31, 2011 and December 31, 2010. The nonpayment rate among Bill Me Later users may increase due to, among other things, worsening economic conditions, such as a recession in the U.S., and high unemployment rates. Consumers who miss payments on their obligations often fail to repay them, and consumers who file for protection under the bankruptcy laws generally do not repay their credit.
We currently fund the purchase of receivables related to Bill Me Later accounts through the sale of commercial paper, our cash balances and free cash flow generated from our portfolio of businesses. Effective September 1, 2010, we have funded the purchase of receivables generated through new Bill Me Later accounts using funds from our international subsidiaries, and this funding is facilitated through our Luxembourg-based bank. A downgrade in our credit ratings, particularly our short-term credit ratings, would likely reduce the amount of commercial paper we could issue (or, in certain circumstances, could prevent us from making commercial paper borrowings), increase our commercial paper borrowing costs, or both. If we are unable to fund our purchase of receivables related to the Bill Me Later business adequately or in a cost-effective manner, the growth and profitability of this business would be significantly and adversely affected.
Additionally, in providing the Bill Me Later service, we face other risks similar to those faced by PayPal described elsewhere in these Risk Factors, including under the captions “Government inquiries may lead to charges or penalties” and “If our Payments business is found to be subject to or in violation of any laws or regulations, including those governing money transmission, electronic funds transfer, money laundering, counter-terrorist financing, banking and lending, it could be subject
28
to liability, licensure and regulatory approval and may be forced to change its business practices.”
Changes in PayPal's funding mix could adversely affect PayPal's results.
PayPal pays significant transaction fees when customers fund payment transactions using credit cards, lower fees when customers fund payments with debit cards, nominal fees when customers fund payment transactions by electronic transfer of funds from bank accounts, and no fees when customers fund payment transactions from an existing PayPal account balance or through the Bill Me Later service, or use buyer credit issued by GE Money Bank. Customers fund a significant portion of PayPal's payment volume using credit and debit cards, and PayPal's financial success will remain highly sensitive to changes in the rate at which its senders fund payments using credit and debit cards. Customers may prefer funding payment transactions using credit cards or debit cards rather than bank account transfers for a number of reasons, including the ability to dispute and reverse charges directly with their payment card provider if merchandise is not delivered or is not as described, the ability to earn frequent flier miles, cash rebates, or other incentives offered by payment card issuers, the ability to defer payment, or a reluctance to provide bank account information to PayPal. In addition, some of PayPal's offerings, including the ability for buyers to make a limited number of payments without opening a PayPal account, have a higher rate of payment card funding than PayPal's basic product offering.
PayPal's failure to manage customer funds properly could harm its business.
PayPal's ability to manage and account accurately for customer funds requires a high level of internal controls. In some of the markets that PayPal serves and currencies that PayPal offers, PayPal has a limited operating history and limited management experience in managing these internal controls. As PayPal's business continues to grow, it must continue to strengthen its internal controls accordingly. PayPal's success requires significant public confidence in its ability to handle large and growing transaction volumes and amounts of customer funds. Any failure to maintain necessary controls or to manage customer funds accurately could severely diminish customer use of PayPal's products.
Systems failures and resulting interruptions in the availability of our websites or services could harm our business.
We have experienced system failures from time to time, and any interruption in the availability of our websites will reduce our current revenues and profits, could harm our future revenues and profits and could subject us to regulatory scrutiny. Our eBay.com website has been interrupted for periods of up to 22 hours. In November 2009, technical systems issues resulted in eBay.com users being unable to search for listed items for a period of several hours. Our PayPal website has suffered intermittent unavailability for periods as long as five days, including unavailability for approximately three hours affecting payments primarily on our ebay.co.uk site in May 2011. Other of our websites (e.g., StubHub, Milo and others), as well as websites of GSI clients and hosted services offered by GSI's interactive marketing services business, have experienced intermittent unavailability from time to time. Any unscheduled interruption in our services results in an immediate, and possibly substantial, loss of revenues, as well as potential service credits or other payments by GSI to its clients. Frequent or persistent interruptions in our services could cause current or potential users to believe that our systems are unreliable, leading them to switch to our competitors or to avoid our sites, and could permanently harm our reputation and brands. Reliability is particularly critical for PayPal, especially as it seeks to expand its Merchant Services business and faces increased expectations on the part of users and merchants regarding the full-time availability of PayPal's services. Because PayPal is a regulated financial institution, frequent or persistent site interruptions could lead to fines, penalties, or mandatory and costly changes to PayPal's business practices, and ultimately could cause PayPal to lose existing licenses it needs to operate or prevent it from obtaining additional licenses that it needs to expand. Finally, because our customers may use our products for critical transactions, any system failures could result in damage to our customers' businesses. These customers could seek significant compensation from us for their losses. Even if unsuccessful, this type of claim likely would be time-consuming and costly for us to address.
Although our systems have been designed around industry-standard architectures to reduce downtime in the event of outages or catastrophic occurrences, they remain vulnerable to damage or interruption from earthquakes, floods, fires, power loss, telecommunication failures, terrorist attacks, cyber attacks, computer viruses, computer denial-of-service attacks, human error, hardware or software defects or malfunctions (including defects or malfunctions of components of our systems that are supplied by third-party service providers), and similar events or disruptions. Some of our systems, including our Shopping.com website and the systems related to the Bill Me Later business, are not fully redundant, and our disaster recovery planning is not sufficient for all eventualities. Our systems are also subject to break-ins, sabotage, and intentional acts of vandalism. Despite any precautions we may take, the occurrence of a natural disaster, a decision by any of our third-party hosting providers to close a facility we use without adequate notice for financial or other reasons, or other unanticipated problems at our hosting facilities could cause system interruptions and delays, and result in loss of critical data and lengthy interruptions in our services. We do not carry business interruption insurance sufficient to compensate us for losses that may result from interruptions in our service
29
as a result of system failures.
If we are unable to cost-effectively upgrade and expand our websites and platforms, our business would suffer.
We must constantly add new hardware, update software and add new engineering personnel to accommodate the increased use of our websites and platforms, and the new products and features we regularly introduce. As our PayPal business continues to grow, we are focused on updating our PayPal platform to provide increased scale, improved performance and additional built-in functionality addressing regulatory compliance matters (e.g., anti-money laundering). This upgrade process is expensive and time-consuming, and the increased complexity of our websites and the need to support multiple platforms as our portfolio of brands grows increases the cost of additional enhancements. Failure to upgrade our technology, features, transaction processing systems, security infrastructure, or network infrastructure in a timely and cost-effective manner to accommodate increased traffic or transaction volume or changes to our site functionality could harm our business. Adverse consequences could include unanticipated system disruptions, slower response times, degradation in levels of customer support, impaired quality of users' experiences of our services, impaired quality of services for third-party application developers using our externally accessible application programming interfaces and delays in reporting accurate financial information, and could result in customer dissatisfaction and the loss of existing users on our websites. We may be unable to effectively upgrade and expand our systems in a timely manner or smoothly integrate any newly developed or purchased technologies or businesses with our existing systems, and any failure to do so could result in problems on our sites. Further, steps to increase the reliability and redundancy of our systems are expensive, reduce our margins and may not be successful in reducing the frequency or duration of unscheduled downtime.
Risks associated with our ongoing efforts to enhance and unbundle the components of GSI's ecommerce and payments platform and to migrate GSI's existing customers to its new platform are discussed in detail under the caption “If our GSI business is unable to enhance its platform and migrate clients to its new platform in a timely and cost-effective manner, it would be substantially harmed” above.
There are many risks associated with our international operations.
Our international expansion has been rapid and our international business, especially in Germany, Korea and the U.K., has also become critical to our revenues and profits. Net revenues outside the U.S. accounted for approximately 53% and 54% of our net revenues in the fiscal years ended December 31, 2011 and December 31, 2010, respectively.
Expansion into international markets, such as our entry into Turkey in May 2011 upon the completion of our acquisition of additional shares in GittiGidiyor and PayPal's entry into emerging markets, requires management attention and resources and requires us to localize our services to conform to local cultures, standards and policies. The commercial, financial, Internet, and transportation infrastructure in lesser-developed countries may make it more difficult for us to replicate our business models. In many countries, we compete with local companies that understand the local market better than we do, and we may not benefit from first-to-market advantages. We may not be successful in expanding into particular international markets or in generating revenues from foreign operations. For example, in 2002 we withdrew our eBay marketplace offering from the Japanese market, and in 2007 we contributed our business in China to a joint venture with a local Chinese company. Even if we are successful in developing new markets, we often expect the costs of operating new sites to exceed our net revenues from those sites for at least 12 months in most countries.
As we continue to expand our businesses internationally, including through acquisitions, we are increasingly subject to risks of doing business internationally, including the following:
|
•
|
strong local competitors;
|
|
•
|
regulatory requirements, including regulation of Internet and mobile services, auctioneering, professional selling, distance selling, privacy and data protection, banking and money transmitting, that may limit or prevent the offering of our services in some jurisdictions, prevent enforceable agreements between sellers and buyers, prohibit the listing of certain categories of goods, require product changes, require special licensure, subject us to various taxes, penalties or audits, or limit the transfer of information between us and our affiliates;
|
|
•
|
greater liability or legal uncertainty regarding our liability for the listings and other content provided by our users, including uncertainty as a result of legal systems that are less developed with respect to the Internet, unique local laws, conflicting court decisions and lack of clear precedent or applicable law;
|
|
•
|
cultural ambivalence towards, or non-acceptance of, trading or payments over the Internet or through mobile devices;
|
|
•
|
laws and business practices that favor local competitors or prohibit or limit foreign ownership of certain businesses;
|
|
•
|
difficulties in integrating with local payment providers, including banks, credit and debit card networks and
|
30
electronic fund transfer systems;
|
•
|
differing levels of retail distribution, shipping and Internet and mobile infrastructures;
|
|
•
|
different employee/employer relationships and labor laws, and the existence of workers' councils and labor unions;
|
|
•
|
difficulties in staffing and managing foreign operations;
|
|
•
|
challenges associated with joint venture relationships and minority investments, including dependence on our joint venture partners;
|
|
•
|
difficulties in implementing and maintaining adequate internal controls;
|
|
•
|
longer payment cycles, different accounting practices and greater problems in collecting accounts receivable;
|
|
•
|
potentially adverse tax consequences, including local taxation of our fees or of transactions on our websites;
|
|
•
|
higher Internet service provider costs;
|
|
•
|
different and more stringent user protection, data protection, privacy and other laws;
|
|
•
|
seasonal reductions in business activity;
|
|
•
|
expenses associated with localizing our products, including offering customers the ability to transact business in the local currency;
|
|
•
|
foreign exchange rate fluctuations;
|
|
•
|
our ability to repatriate funds from abroad without adverse tax consequences;
|
|
•
|
the possibility that foreign governments may impose currency controls or other restrictions on the repatriation of funds;
|
|
•
|
volatility in a specific country's or region's political, economic or military conditions (e.g., in South Korea relating to its disputes with North Korea);
|
|
•
|
challenges associated with maintaining relationships with local law enforcement and related agencies;
|
|
•
|
potentially higher incidence of fraud and corruption and higher credit and transaction loss risks; and
|
|
•
|
differing intellectual property laws.
|
Some of these factors may cause our international costs of doing business to exceed our comparable domestic costs. As we expand our international operations and have additional portions of our international revenues denominated in foreign currencies, we also could become subject to increased difficulties in collecting accounts receivable and repatriating money without adverse tax consequences, as well as increased risks relating to foreign currency exchange rate fluctuations. The impact of currency exchange rate fluctuations on our business is discussed in more detail under the caption “We are exposed to fluctuations in currency exchange rates and interest rates” above.
In addition, we conduct certain functions, including product development, customer support and other operations, in regions outside the U.S., particularly in India and China. We are subject to both U.S. and local laws and regulations applicable to our offshore activities, and any factors which reduce the anticipated benefits associated with providing these functions outside of the U.S., including cost efficiencies and productivity improvements, could adversely affect our business.
We maintain a portion of Shopping.com's research and development facilities and personnel in Israel, and have acquired other Israeli companies. Political, economic and military conditions in Israel affect those operations. The future of peace efforts between Israel and its neighboring countries remains uncertain. Increased hostilities or terrorism within Israel or armed hostilities between Israel and neighboring countries or other entities could make it more difficult for us to continue our operations in Israel, which could increase our costs. In addition, many of our employees in Israel could be required to serve in the military for extended periods of time under emergency circumstances. Our Israeli operations could be disrupted by the absence of employees due to military service, which could adversely affect our business.
Acquisitions, joint ventures and strategic investments could result in operating difficulties, dilution, and other harmful consequences.
We have acquired a significant number of businesses, technologies, services and products, including GSI Commerce, Inc. (which provides ecommerce and interactive marketing services), Magento (an open source ecommerce platform provider) and Zong (which provides payments through mobile carrier billing). We expect to continue to evaluate and consider a wide array of potential strategic transactions as part of our overall business strategy, including business combinations, acquisitions and dispositions of businesses, technologies, services, products and other assets, as well as strategic investments and joint ventures. At any given time we may be engaged in discussions or negotiations with respect to one or more of these types of transactions. Any of these transactions could be material to our financial condition and results of operations.
31
These transactions involve significant challenges and risks. Some of the areas where we may face difficulties include:
|
•
|
the need to integrate the operations, systems (including accounting, management, information, human resource and other administrative systems), technologies, products and personnel of each acquired company, which is itself an inherently risky process; the inefficiencies and lack of control that may result if such integration is delayed or not implemented; and unforeseen difficulties and expenditures that may arise in connection with integration;
|
|
•
|
diversion of management time, as well as a shift of focus from operating the businesses to issues related to integration and administration, particularly given the number, size and varying scope of our recent acquisitions;
|
|
•
|
declining employee morale and retention issues resulting from changes in, or acceleration of, compensation, or changes in management, reporting relationships, future prospects, or the direction of the business;
|
|
•
|
the need to implement controls, procedures and policies appropriate for a larger public company at companies that prior to acquisition had lacked such controls, procedures and policies;
|
|
•
|
risks associated with our expansion into new international markets and doing business internationally, including those described under the risk factor caption "There are many risks associated with our international operations" above;
|
|
•
|
difficulties in entering new markets where we have no or limited direct prior experience or where competitors may have stronger market positions;
|
|
•
|
in the case of foreign acquisitions, the need to integrate operations across different cultures and languages and to address the particular economic, currency, political and regulatory risks associated with specific countries;
|
|
•
|
the potential loss of key customers, vendors and other business partners of the companies we acquire following and continuing after announcement of our acquisition plans;
|
|
•
|
in some cases, the need to transition operations, users and customers onto our existing or new platforms; and
|
|
•
|
liability for activities of the acquired company before the acquisition, including intellectual property and other litigation claims or disputes, violations of laws, rules and regulations, commercial disputes, tax liabilities and other known and unknown liabilities.
|
It may take us longer than expected to fully realize the anticipated benefits, such as increased revenue and enhanced efficiencies, of any or all of our acquisitions, or those benefits may ultimately be smaller than anticipated, or may not be realized at all, which could adversely affect our business and operating results. Future acquisitions may also require us to issue additional equity securities, spend our cash, or incur debt (and increased interest expense), liabilities and amortization expenses related to intangible assets or write-offs of goodwill, which could adversely affect our results of operations and dilute the economic and voting rights of our stockholders.
In addition, we have made certain investments, including through joint ventures, in which we have a minority equity interest and lack management and operational control. The controlling joint venture partner in a joint venture investment may have business interests, strategies or goals that are inconsistent with ours, and business decisions or other actions or omissions of the controlling joint venture partner or the joint venture company may result in harm to our reputation or adversely affect the value of our investment in the joint venture. Our strategic investments may expose us to additional risks. For example, GSI's minority interest in Intershop Communications AG is governed by German law, which could subject us to liability for certain disadvantages to Intershop if we were deemed to be in control of Intershop under German law. We have also been sued by craigslist, which has alleged that we improperly misused confidential information from craigslist that we received as a minority investor.
Our acquisition of GSI Commerce, Inc. exposes us to additional risks.
Our GSI business faces certain risks and challenges not shared by our other businesses, including those described under the risk factor captions "If our GSI business is unable to enhance its platform and migrate clients to that new platform in a timely and cost-effective manner, it would be substantially harmed" and "Changes in regulations or user concerns regarding privacy and protection of user data could adversely affect our business."
Competition for GSI's existing and potential clients is intense, and our GSI business may not be able to add new clients or keep existing clients on favorable terms, or at all. For example, a change in the management of a GSI client could adversely affect our relationship with that client. In addition, many of GSI's client contracts contain service level commitments. If our GSI business is unable to meet these commitments, its relationships with its clients could be damaged, and client rights to terminate their contracts with GSI and/or financial penalty provisions payable by GSI may be triggered. If any existing GSI clients were to exit the business we provide services to, be acquired, declare bankruptcy, suffer other financial difficulties, fail to pay amounts owed to GSI and/or terminate or modify their relationships with GSI in a manner unfavorable to us (in particular with respect to the large merchants and brands that GSI serves), our GSI business could be adversely affected.
32
A portion of GSI's ecommerce services
revenue is derived from the value of ecommerce transactions that flow through GSI's ecommerce services
business. Accordingly, growth in GSI's ecommerce services revenue depends upon the continued growth of the online businesses of its clients. GSI's ecommerce services business may be substantially impacted by any adverse conditions in the offline businesses of a GSI client that negatively impact that client's online businesses. Any impairment of the offline business of GSI clients, whether due to financial difficulties, impairment of client brands, reduction in marketing efforts, reduction in the number of client retail stores or otherwise, could negatively affect consumer traffic and sales through GSI's clients' websites, which would result in lower revenues generated by our GSI business. Our GSI business also relies on its clients' ability to accurately forecast product demand and select and buy the inventory for their corresponding online businesses. Under such arrangements, the client establishes product prices and pays GSI service fees based either on a fixed or variable percentage of revenues, or on the activity performed. As a result, if GSI's clients fail to accurately forecast product demand or optimize or maintain access to inventory, the client's ecommerce business (and, in turn, GSI's service fees) could be adversely affected.
Our GSI business holds inventory on behalf of its ecommerce services customers. If GSI is unable to effectively manage and handle this inventory, this may result in unexpected costs that could adversely affect our GSI business. Any theft of such inventory, or damage or interruption to such inventory, including as a result of earthquakes, floods, fire, power loss, labor disputes, terrorist attacks and similar events and disruptions, could result in losses related to such inventory and disruptions to GSI's customers' businesses, which could in turn adversely affect our GSI business.
GSI's interactive marketing services business relies on email marketing to drive consumer traffic to the websites operated by its clients. Email could become a less effective means of communicating with and marketing to consumers for a variety of reasons, including the following: problems with technology that make GSI's email communications more difficult to deliver and for consumers to read (e.g., the inability of smart phones or similar communication devices to adequately display email); consumers may disregard marketing emails due to the large volume of such emails they receive; the inability of filters to effectively screen for unwanted emails, resulting in increased levels of junk mail, or “SPAM,” which may overwhelm consumer's email accounts; increased use of social networking sites, which may result in decreased use of email as a primary means of communication; continued security concerns regarding Internet usage in general from viruses, worms or similar problems; and increased governmental regulation or restrictive policies adopted by Internet service providers that make it more difficult or costly to utilize email for marketing communications. If any of our GSI entities were to end up on SPAM lists or lists of entities that have been involved in sending unwanted, unsolicited emails, their ability to contact customers through email could be significantly restricted. If any of the foregoing were to occur, the demand for GSI's email marketing solutions could decrease and our GSI business could be harmed. GSI's interactive marketing services business also utilizes mobile messaging as a means of communicating with consumers, which carries risks similar to the risks described above for email marketing.
Our GSI business has relationships with search engines, comparison shopping sites, affiliate marketers, online advertising networks and other websites to provide content, advertising banners and other links to its clients' ecommerce businesses. Our GSI business relies on these relationships as significant sources of traffic to clients' ecommerce businesses. If we are unable to maintain these relationships or enter into new relationships on acceptable terms, our ability to attract new customers could be harmed.
Immediately following our acquisition of GSI, eBay sold 100% of GSI's sports merchandise business and 70% of its RueLaLa and ShopRunner businesses (which we refer to collectively as the divested entities), to Kynetic LLC, which we refer to as Kynetic. Kynetic is primarily owned by GSI's former Chairman, President and Chief Executive Officer, Mr. Michael Rubin. Each of the divested entities was a direct or indirect wholly-owned subsidiary of GSI Commerce. In connection with (and as a result of) the divestiture to Kynetic, our GSI business maintains certain commercial and financial relationships with the divested entities which expose it to certain risks of the businesses of Kynetic and the divested entities.
As part of the Kynetic divestiture, we loaned Kynetic and the divested entities $467 million, which is secured by certain assets of the divested entities. Kynetic and the divested entities' ability to repay this obligation is dependent on the financial performance of Kynetic and the divested entities. If Kynetic is unable to repay this obligation, our results of operations and financial condition could be harmed.
Finally, our GSI business is also party to certain acquisition agreements relating to entities purchased by GSI prior to our acquisition, and which relate to businesses owned by the divested entities. Kynetic has agreed to indemnify GSI for certain liabilities incurred by GSI under these acquisition agreements. If such liabilities were realized and Kynetic was not able or willing to meet its indemnification obligations, GSI would be liable for them and its business could be harmed.
33
Our business and users may be subject to sales tax and other taxes.
The application of indirect taxes (such as sales and use tax, value-added tax (VAT), goods and services tax, business tax and gross receipt tax) to ecommerce businesses such as eBay and to our users is a complex and evolving issue. Many of the fundamental statutes and regulations that impose these taxes were established before the adoption and growth of the Internet and ecommerce. In many cases, it is not clear how existing statutes apply to the Internet or ecommerce. In addition, some jurisdictions have implemented or may implement laws specifically addressing the Internet or some aspect of ecommerce. For example, the State of New York has passed legislation that requires any out-of-state seller of tangible personal property to collect and remit New York use tax if the seller engages affiliates above certain financial thresholds in New York to perform certain business promotion activities. Several ecommerce companies are challenging this new law. In June 2011, California enacted legislation (ABx1 28) that requires certain out-of-state retailers to collect and remit California use tax on taxable sales to California purchasers when the retailer has a relationship with a person in California that refers customers to the retailer. In September 2011, the California Governor signed into law AB 155, which supersedes ABx1 28 and delays the implementation of such collection and remittance requirements until September 2012 or January 2013 (depending on whether or not the U.S. Congress enacts legislation in this area). The new California law is similar to the law passed in New York, but provides exclusions for certain forms of Internet marketing and is limited to retailers who exceed prescribed sales volume thresholds. However, if our sellers who are not already required to collect California sales or use tax believe that their use of our websites requires them to collect California use tax, they may elect to limit their use of our websites rather than collect the tax, which would harm our business. North Carolina, Rhode Island, Illinois, Arkansas and South Dakota have also enacted similar laws related to affiliates, and a number of other states appear to be considering similar legislation. The adoption of such legislation by states where eBay has significant operations that perform certain business promotion activities could result in a use tax collection responsibility for certain of our sellers. This collection responsibility and the additional costs associated with complex use tax collection, remittance and audit requirements would make selling on our websites less attractive for small business retailers, and would harm our business.
The State of Colorado has enacted legislation that takes a different approach by imposing a set of use tax notice and reporting requirements (but not the actual tax collection responsibility) on certain retailers with no physical presence in Colorado. The law is designed to aid Colorado in collecting use tax from Colorado residents who purchase taxable items from out-of-state retailers. The regulation promulgated by the Colorado Department of Revenue excludes from these reporting obligations businesses that sell $100,000 or less into the state in a calendar year, thus limiting the impact on our sellers. The law has been challenged in Federal Court by a number of out-of-state retailers and a Federal District Court has issued an injunction blocking enforcement of the regulations pending a resolution of the case. Oklahoma has enacted a similar law. While the recent laws in New York, North Carolina, Rhode Island, Illinois, Arkansas, South Dakota, Oklahoma and Colorado do not specifically apply to our business, the proliferation of such state legislation, to expand sales and use tax collection on Internet sales, could adversely affect some of our sellers and indirectly harm our business.
In conjunction with the Streamlined Sales Tax Project — an ongoing, multi-year effort by U.S. state, and local governments to require collection and remittance of remote sales tax by out-of-state sellers — S. 1452 and H.R. 2701, U.S. Senate and U.S. House versions of the Main Street Fairness Act, have been introduced in the 112
th
Congress. These measures would allow states that meet certain simplification and other standards to require out-of-state sellers to collect and remit sales taxes on goods purchased by in-state residents. Sellers meeting an as yet undefined small seller exception would be excluded from the requirements of the Act. Other legislation introduced in the US Congress, including H.R. 3179 and S. 1832, would grant states the authority to require out-of-state retailers to collect and remit sales taxes without requiring the state to join the Streamlined Sales Tax Project. The adoption of remote sales tax collection legislation that lacks a robust small business exemption would result in the imposition of sales taxes and additional costs associated with complex sales tax collection, remittance and audit compliance requirements on our sellers. This would make selling on our websites less attractive for small retailers, and would harm our business.
From time to time, some taxing authorities have notified us that they believe we owe them certain taxes. In May 2008, the City of Chicago notified both eBay and StubHub that they are liable for a city amusement tax on tickets to events in Chicago, irrespective of the location of the buyer or seller, and filed suit to enforce collection of taxes it claims are due. In March 2009, the court ruled that StubHub is not required to collect and remit the city amusement tax. The City of Chicago requested reconsideration of this ruling and StubHub sought clarification of the ruling relative to the remaining counts as well. In August 2009, the court entered a final order dismissing the case against StubHub. In December 2009, the court also dismissed the case against eBay. The City of Chicago appealed both matters to the Seventh Circuit Court of Appeals. The Seventh Circuit has issued an opinion in the StubHub matter rejecting the federal arguments advanced by StubHub and certifying the state law arguments to the Illinois State Supreme Court. In October 2011, the Illinois Supreme Court ruled that state municipalities may not require electronic intermediaries such as StubHub to collect and remit amusement taxes on resold tickets. The City of Chicago has requested a rehearing before the Illinois Supreme Court and the court has not yet ruled on that request. The
34
application of similar existing or future laws could adversely affect our business.
Several proposals have been made at the U.S. state and local level that would impose additional taxes on the sale of goods and services over the Internet. These proposals, if adopted, could substantially impair the growth of ecommerce and our brands, and could diminish our opportunity to derive financial benefit from our activities. The U.S. federal government's moratorium on state and local taxation of Internet access or multiple or discriminatory taxes on ecommerce has been extended through November 2014. This moratorium does not prohibit federal, state, or local authorities from collecting taxes on our income or from collecting certain taxes that were in effect prior to the enactment of the moratorium and/or one of its extensions.
Similar issues exist outside of the U.S., where the application of VAT or other indirect taxes on ecommerce providers such as eBay is uncertain and evolving. While we attempt to comply in those jurisdictions where it is clear that a tax is due, certain of our subsidiaries have, from time to time, received claims relating to the applicability of indirect taxes to our fees. Should such taxes become applicable, our business could be harmed. We collect and remit indirect taxes in certain jurisdictions. However, tax authorities may raise questions about our obligation to collect and remit such taxes, as well as the proper calculation of such taxes. For example, a Korean tax authority is currently asserting that certain coupons and incentives available on our sites should not be deducted when computing taxes on our fees. Should any new taxes become applicable to our fees or if the taxes we pay are found to be deficient, our business could be harmed.
We do not collect taxes on the goods or services sold by users of our services. One or more states or the federal government or foreign countries may seek to impose a tax collection, reporting or record-keeping obligation on companies that engage in or facilitate ecommerce. Such an obligation could be imposed by legislation intended to improve tax compliance (and legislation to such effect has been discussed in the U.S. Congress, several states and a number of foreign jurisdictions) or if an eBay company was ever deemed to be the legal agent of the users of our services by a jurisdiction in which eBay operates. In July 2008, the Housing and Economic Recovery Act of 2008 (H.R. 3221) was signed into law. This law contains provisions that require companies that provide payments over electronic means to users to report to the Internal Revenue Service (IRS) information on payments received by certain customers. The legislation, effective for payments received after December 31, 2010, requires PayPal and other electronic payments providers, as well as potentially StubHub and similar companies, to report to the IRS on customers subject to U.S. income tax who receive more than $20,000 in payments and more than 200 payments in a year, to request tax ID numbers from U.S. taxpayers and track payments by tax ID number, and to withhold a proportion of payments and forward such withholding to the IRS if customers who receive more than 200 payments do not provide correct and complete information. We have had to modify our software to meet these requirements and expect increased operational costs and changes to our user experience in connection with complying with these reporting obligations. The IRS regulations may also require us to collect a certification of non-U.S. taxpayer status from international merchants. These requirements may decrease seller activity on our sites and harm our business. Any failure by us to meet these new requirements could result in substantial monetary penalties and other sanctions and could harm our business.
One or more other jurisdictions may also seek to impose tax collection or reporting obligations based on the location of the product or service being sold or provided in an ecommerce transaction, regardless of where the respective users are located. Imposition of a discriminatory record keeping or tax collecting requirement could decrease seller activity on our sites and would harm our business. Foreign authorities may also require eBay to help ensure compliance by our users with local laws regulating professional sellers, including tax requirements. In addition, we have periodically received requests from tax authorities in many jurisdictions for information regarding the transactions of large classes of sellers on our sites, and in some cases we have been legally obligated to provide this data. The imposition of any requirements on us to disclose transaction records for all or a class of sellers to tax or other regulatory authorities or to file tax forms on behalf of any sellers, especially requirements that are imposed on us but not on alternative means of ecommerce, and any use of those records to investigate, collect taxes from, or prosecute sellers, could decrease seller activity on our sites and harm our business.
We pay input VAT on applicable taxable purchases within the various countries in which we operate. In most cases, we are entitled to reclaim this input VAT from the various countries. However, because of our unique business model, the application of the laws and rules that allow such reclamation is sometimes uncertain. A successful assertion by one or more countries that we are not entitled to reclaim VAT could harm our business.
We continue to work with the relevant tax authorities and legislators to clarify eBay's obligations under new and emerging laws and regulations. Passage of new legislation and the imposition of additional tax or tax-related reporting requirements could harm our users and our business. There have been, and will continue to be, substantial ongoing costs associated with complying with the various indirect tax requirements in the numerous markets in which eBay conducts or will conduct business.
35
Our tickets business is subject to regulatory, competitive, and other risks that could harm this business.
Our tickets business, which includes our StubHub business, is subject to numerous risks. Many jurisdictions have laws and regulations covering the resale of event tickets. Some jurisdictions prohibit the resale of event tickets at prices above the face value of the tickets or at all, or highly regulate the resale of tickets, and new laws and regulations or changes to existing laws and regulations imposing these or other restrictions may be adopted that could limit or inhibit our ability to operate, or our users' ability to continue to use, our tickets business. For example, the unauthorized resale of football (soccer) tickets is illegal in the U.K., where we recently launched our StubHub site. Regulatory agencies or courts may claim or hold that we are responsible for ensuring that our users comply with these laws and regulations or that we or our users are either subject to licensure or prohibited from reselling event tickets in their jurisdictions. In October 2007, two plaintiffs filed a purported class action lawsuit in North Carolina Superior Court alleging that StubHub sold (and facilitated and participated in the sale) of concert tickets to plaintiffs with the knowledge that the tickets were resold in violation of North Carolina's maximum ticket resale price law (which has been subsequently amended). In February 2011, the trial court granted plaintiffs' motion for summary judgment, concluding that immunity under the Communications Decency Act did not apply. The trial court further held that StubHub violated the North Carolina unfair and deceptive trade practices statute as it pertains to the two named plaintiffs, and certified its decision for immediate appeal to the North Carolina Court of Appeals. StubHub has appealed this decision.
Some event organizers and professional sports teams have expressed concern about the resale of their event tickets on our sites. Suits alleging a variety of causes of actions have in the past, and may in the future, be filed against StubHub and eBay by venue owners, competitors, ticket buyers and unsuccessful ticket buyers. Such litigation could result in damage awards, could require us to change our business practices in ways that may be harmful to our business, or could otherwise negatively affect our tickets business.
Our tickets business is subject to seasonal fluctuations and the general economic and business conditions that impact the sporting events and live entertainment industries. The economic downturn resulted in a decrease in ticket prices sold on our sites and negatively impacted revenue and profits. In addition, a work stoppage, strike or lockout by a professional sports league (for example, the recently ended National Basketball Association lockout) that results in the cancellation of all or a portion of the games in a league's season would harm our tickets business. In addition, a portion of the tickets inventory sold by sellers on StubHub is held by StubHub in digital form. Systems failures, security breaches, theft or other disruptions that result in the loss of such tickets inventory could materially harm our tickets business.
Our tickets business also faces significant competition from a number of sources, including ticketing service companies (such as Live Nation Entertainment (formerly Ticketmaster), AEG, Comcast-Spectacor and Tickets.com), event organizers (such as professional sports teams and leagues), ticket brokers and other online and offline ticket resellers, such as TicketsNow (which is owned by Live Nation Entertainment) and RazorGator. In addition, some ticketing service companies and event organizers have begun to issue event tickets through various forms of electronic ticketing systems that are designed to restrict or prohibit the transferability of such event tickets. Ticketing service companies have also begun to use market-based pricing strategies or dynamic pricing to charge much higher prices than they historically have for premium tickets. Besides charging higher prices, these ticketing service companies have also imposed additional restrictions on transferability for these types of tickets, such as requiring customers to pick up these tickets at will-call with the purchasing credit card. To the extent that event tickets issued in this manner cannot be resold on our websites, or to the extent that we are otherwise unable to compete with these competitors, our tickets business would be harmed. Pursuant to commercial arrangements, StubHub provides certain of its partners with integrated resale transactions, which consumers may prefer due to, among other factors, almost instant delivery and lower fraud concerns. These integrations are largely deal-dependent, and these arrangements may not be renewed on favorable terms, or at all.
We depend on key personnel.
Our future performance depends substantially on the continued services of our senior management and other key personnel and our ability to retain and motivate them. We do not have long-term employment agreements with any of our key personnel and do not maintain any “key person” life insurance policies, and some members of our senior management team have fully vested the vast majority of their in-the-money equity incentives. The loss of the services of any of our executive officers or other key employees could harm our business. We are currently seeking to fill the position of President, PayPal on our senior management team, as well as other key management positions at PayPal.
Our businesses all depend on attracting and retaining key personnel. Our future success will depend on our ability to attract, train, retain and motivate highly skilled technical, managerial, marketing and customer support personnel. Competition for these personnel is intense, and we may be unable to successfully attract, integrate, or retain sufficiently qualified personnel. In making employment decisions, particularly in the Internet and high-technology industries, job candidates often consider the
36
value of the equity awards they would receive in connection with their employment. Fluctuations in our stock price may make it more difficult to retain and motivate employees whose stock option strike prices are substantially above current market prices. Similarly, decreases in the number of unvested in-the-money stock options held by existing employees, whether because our stock price has declined, options have vested, or because the size of follow-on option grants has declined, may make it more difficult to retain and motivate employees.
Problems with or price increases by third parties who provide services to us or to our users could harm our business.
A number of parties provide services to us or to our users that benefit us. Such services include seller tools that automate and manage listings, merchant tools that manage listings and interface with inventory management software, storefronts that help our users list items, caching services that make our sites load faster and shipping providers that deliver goods sold on our platform, among others. In some cases we have contractual agreements with these companies that give us a direct financial interest in their success, while in other cases we have none. PayPal is dependent on the processing companies and banks that link PayPal to the payment card and bank clearing networks. Similarly, Bill Me Later relies on an unaffiliated lender in providing the Bill Me Later service and also relies heavily on third parties to operate its services, including merchant processors and payment gateways to process transactions. Financial or regulatory issues, labor issues (e.g., strikes or work stoppages) or other problems that prevent these companies from providing services to us or our users could reduce the number of listings on our websites or make completing transactions or payments on our websites more difficult, thereby harming our business.
In addition, price increases by, or service terminations, disruptions or interruptions at, companies that provide services to our users and clients (such as postal and delivery services) could also reduce the number of listings on our websites or make it more difficult for our sellers to complete transactions or for us to timely fulfill and ship products sold on the websites operated by GSI's clients, thereby harming our business. The U.S. Postal Service has announced that it is considering closing thousands of local post offices and ending Saturday mail delivery. While we continue to work with global carriers to offer our sellers a variety of shipping options and to enhance our shipping experience, these closures could require certain sellers to utilize alternatives which could be more expensive or inconvenient, which could in turn decrease the velocity of trade on our site, thereby harming our business. In addition, any security breach at a company providing services to our users could also adversely affect our customers and harm our business.
In addition, we have outsourced certain functions to third-party providers, including customer support and product development functions, which are critical to our operations. If our service providers do not perform satisfactorily, our operations could be disrupted, which could result in user dissatisfaction and adversely affect our business, reputation and operating results.
Although we generally have been able to renew or extend the terms of contractual arrangements with, or if necessary replace, third parties who provide services to us on acceptable terms, there can be no assurance that we will continue to be able to do so in the future. If any third parties were to stop providing services to us on acceptable terms, including as a result of bankruptcy due to poor economic conditions, we may be unable to procure alternatives from other third parties in a timely and efficient manner and on acceptable terms, or at all. In addition, there can be no assurance that third parties who provide services directly to our users will continue to do so on acceptable terms, or at all.
Customer complaints or negative publicity about our customer support or anti-fraud measures could diminish use of our services.
Customer complaints or negative publicity about our customer support could severely diminish consumer confidence in and use of our services. Measures that we sometimes take to combat risks of fraud and breaches of privacy and security have the potential to damage relations with our customers or decrease activity on our sites by making our sites more difficult to use or restricting the activities of certain users. These measures heighten the need for prompt and accurate customer support to resolve irregularities and disputes. Effective customer support requires significant personnel expense, and if not managed properly, this expense could significantly impact our profitability. Failure to manage or train our own or outsourced customer support representatives properly could compromise our ability to handle customer complaints effectively. Negative publicity about, or negative experiences with, customer support for any of our businesses could cause our reputation to suffer or affect consumer confidence in our brands individually or as a whole. Because PayPal is providing a financial service and operating in a more regulated environment, PayPal must provide both telephone and email customer support and resolve certain customer contacts within shorter time frames. As part of PayPal's program to reduce fraud losses and prevent money laundering, PayPal may temporarily restrict the ability of customers to withdraw their funds if those funds or the customer's account activity are identified by PayPal's risk models as suspicious. PayPal has in the past received negative publicity with respect to its customer support and account restrictions, and has been the subject of purported class action lawsuits and state attorney general inquiries alleging, among other things, failure to resolve account restrictions promptly. In the second quarter of 2010, two putative class-action lawsuits (Devinda Fernando and Vadim Tsigel v. eBay Inc. and PayPal, Inc.; and Moises Zepeda v. PayPal, Inc.) were
37
filed in the U.S. District Court in the Northern District of California. These lawsuits contain allegations that PayPal improperly held users' funds or otherwise improperly limited user's accounts. These lawsuits seek damages as well as changes to PayPal's practices among other remedies. A determination that there have been violations of laws relating to PayPal's practices could expose PayPal to significant liability. Any changes to PayPal's practices resulting from these lawsuits could require PayPal to incur significant costs and to expend product resources, which could delay other planned product launches or improvements and further harm our business. If PayPal is unable to provide quality customer support operations in a cost-effective manner, PayPal's users may have negative experiences, PayPal may receive additional negative publicity, its ability to attract new customers may be damaged and it could become subject to additional litigation. As a result, current and future revenues could suffer, losses could be incurred and its operating margins may decrease.
Our industries are intensely competitive.
Marketplaces
Our Marketplaces businesses currently or potentially compete with a large number of companies providing particular categories of goods and/or broader ranges of goods. The Internet provides new, rapidly evolving and intensely competitive channels for the sale of all types of goods. We expect competition to intensify in the future. The barriers to entry into these channels can be relatively low, and current offline and new competitors, including small businesses who want to create and promote their own stores, can easily launch online sites at nominal cost using commercially available software or partnering with any one of a number of successful ecommerce companies. Moreover, online and offline businesses increasingly are competing with each other. Consumers who purchase or sell goods and services through our Marketplaces businesses have more and more alternatives.
Our competitors include the vast majority of traditional department, warehouse, discount and general merchandise stores (as well as the online operations of these traditional retailers), online retailers, online classified services and other shopping channels such as offline and online home shopping networks. In the U.S., these include Wal-Mart, Target, Sears, Macy's, JC Penney, Costco, Office Depot, Staples, OfficeMax, Sam's Club, Amazon.com (which continues to expand into new geographies and lines of business), Buy.com (owned by Rakuten), AOL.com, Yahoo! Shopping, MSN, QVC and Home Shopping Network, among others.
A number of companies offer a variety of services that provide channels for buyers to find and buy items from sellers of all sizes, including online aggregation and classifieds websites such as craigslist (in which we own a minority equity stake), Google Merchant Center, Oodle.com and a number of international websites operated by Schibsted ASA. In certain markets, our fixed-price listing and traditional auction-style listing formats are increasingly being challenged by other formats, such as classifieds. Our classifieds websites, including Den Blå Avis, BilBasen, eBay Classifieds (including eBay Anuncios, eBay Kleinanzeigen and eBay Annunci), Gumtree, Kijiji, LoQUo, Marktplaats.nl, mobile.de, Alamaula and Rent.com, offer classifieds listings in the U.S. and a variety of local international markets. In many markets in which they operate, including in the U.S., our classified platforms compete against more established online and offline classifieds platforms.
Our online shopping comparison site, Shopping.com, competes with sites such as Bing Shopping, Buy.com, Google Product Search, Nextag.com, Pricegrabber.com, Shopzilla and Yahoo! Product Search, which offer shopping search engines that allow consumers to search the Internet for specified products. Recent legal developments may affect the utility of shopping comparison sites if manufacturers limit variation in product pricing. In addition, sellers are increasingly utilizing multiple sales channels, including the acquisition of new customers by paying for search-related advertisements on search engine sites such as Bing, Google and Yahoo!. We use product search engines and paid search advertising to help users find our sites, but these services also have the potential to divert users to other online shopping destinations.
We also compete with many local, regional and national specialty retailers and exchanges in each of the major categories of products offered on our site. For example, category-specific competitors to offerings in our “Consumer Electronics, Computers, Cell Phones, Digital Imaging and Video Games” categories include, among others, Abt Electronics, Amazon.com, Apple, B&H Photo, Best Buy, Buy.com, CNET, Computer Discount Warehouse, Crutchfield, Dell, Electronics Boutique, Fry's Electronics, Gamestop, Hewlett Packard, J&R Music and Computer World, Lenovo, MicroWarehouse, Overstock.com, PC Connection, PCMall.com, Radio Shack, Ritz Camera, Sony, Tech Depot, Tiger Direct, uBid, major wireless carriers, and a variety of online and offline computer, consumer electronics, photography and video game retailers.
Our international Marketplaces websites compete with similar online and offline channels in each of their vertical categories in most countries. In addition, they compete with general online ecommerce sites such as: Amazon, Quelle and Otto in Germany; Leboncoin.fr and PriceMinister (owned by Rakuten) in France; Taobao in China; Tradus (owned by Naspers) in Poland; Yahoo-Kimo in Taiwan; Lotte, Naver and 11th Street in South Korea; Trading Post, OZtion and Aussie Bidder in Australia; and Amazon and Play.com (owned by Rakuten) in the United Kingdom and other countries. In some of these
38
countries, there are online sites that have much larger customer bases and greater brand recognition than we do, as well as competitors that may have a better understanding of local culture and commerce than we do. As our businesses in less-developed countries grow, we increasingly may compete with domestic competitors which have advantages we do not possess, such as a greater ability to operate under local regulatory authorities.
The principal competitive factors for Marketplaces include the following:
|
•
|
ability to attract and retain buyers and sellers;
|
|
•
|
volume of transactions and price and selection of goods;
|
|
•
|
trust in the seller and the transaction;
|
|
•
|
customer service; and
|
|
•
|
brand recognition.
|
With respect to our online competition, additional competitive factors include:
|
•
|
community cohesion, interaction and size;
|
|
•
|
website ease-of-use and accessibility;
|
|
•
|
system reliability;
|
|
•
|
reliability of delivery and payment;
|
|
•
|
level of service fees; and
|
|
•
|
quality of search tools.
|
We may be unable to compete successfully against current and future competitors. Some current and potential competitors have longer operating histories, larger customer bases and greater brand recognition in other business and Internet sectors than we do. Other online ecommerce sites may be acquired by, receive investments from, or enter into other commercial relationships with well-established and well-financed companies. As a result, some of our competitors with other revenue sources may be able to devote more resources to marketing and promotional campaigns, adopt more aggressive pricing policies and devote substantially more resources to website and systems development than we can. Some of our competitors may offer or continue to offer free shipping, favorable return policies or other transaction-related services which improve the user experience on their sites and which could be impractical or inefficient for eBay sellers to match. New technologies may increase the competitive pressures by enabling our competitors to offer more efficient or lower-cost services.
In addition, certain established retailers may encourage manufacturers to limit or cease distribution of their products to dealers who sell through online channels such as eBay, or may attempt to use existing or future government regulation to prohibit or limit online commerce in certain categories of goods or services. For example, manufacturers may attempt to enforce minimum resale price maintenance arrangements to prevent distributors from selling on our websites or on the Internet generally, or at prices that would make our site attractive relative to other alternatives. The adoption by manufacturers of policies, or the adoption of new laws or regulations or interpretations of existing laws or regulations by government authorities, in each case discouraging the sales of goods or services over the Internet, could force eBay users to stop selling certain products on our websites. Increased competition or anti-Internet distribution policies or regulations may result in reduced operating margins, loss of market share and diminished value of our brands. As we respond to changes in the competitive environment, we may, from time to time, make pricing, service or marketing decisions or acquisitions that may be controversial with and lead to dissatisfaction among some of our sellers, which could reduce activity on our websites and harm our profitability.
Although we have established Internet traffic arrangements with several large online services and search engine companies, these arrangements may not be renewed on favorable terms or these companies may decide to promote competitive services. Even if these arrangements are renewed, they may not result in increased usage of our sites. In addition, companies that control user access to transactions through network access, Internet browsers, mobile networks or search engines could promote our competitors, channel current or potential users to their vertically integrated electronic commerce sites or their advertisers' sites, attempt to restrict access to our sites, or charge us substantial fees for inclusion. Search engines are increasingly becoming a starting point for online shopping, and as the costs of operating an online store continue to decline, online sellers may increasingly sell goods through multiple channels, which could reduce the number and value of transactions these sellers conduct through our sites.
39
PayPal
The markets for PayPal's product are intensely competitive and are subject to rapid technological change, including but not limited to: mobile payments, electronic funds transfer networks starting to allow Internet access, cross-border access to networks, creation of new networks, expansion of prepaid cards and bill pay networks. PayPal competes with existing online and offline payment methods, including, among others:
|
•
|
payment card merchant processors that offer their services to online merchants and multi-channel merchants, including American Express, Chase Paymentech, First Data, Wells Fargo, WorldPay, Barclays Merchant Services, Global Payments, Inc. and Square, and payment gateways, including CyberSource and Authorize.net (both owned by Visa);
|
|
•
|
money remitters such as MoneyGram, Western Union, Global Payments, Inc. and Euronet;
|
|
•
|
bill payment services, including CheckFree, a subsidiary of Fiserv;
|
|
•
|
processors that provide online merchants the ability to offer their customers the option of paying for purchases from their bank account or paying on credit, including the newly-announced ClearXchange joint venture among Wells Fargo, Bank of America and JP Morgan Chase, Acculynk, Moneta, eBillMe, Dwolla, TeleCheck, a subsidiary of First Data, iDEAL in the Netherlands and Sofortuberweisung in Germany;
|
|
•
|
providers of “digital wallet” services that offer customers the ability to pay online or on mobile devices through a variety of payment methods, including the new V.me announced by Visa, American Express's newly-launched Serve and Google Wallet;
|
|
•
|
providers of traditional payment methods, particularly credit cards, checks, money orders and Automated Clearing House transactions;
|
|
•
|
issuers of stored value targeted at online payments, including VisaBuxx, NetSpend, Green Dot, PayNearMe and UKash;
|
|
•
|
mobile payments, including ISIS, Buyster, Mpass, O2 Money and Crandy;
|
|
•
|
Amazon Payments, which offers merchants the ability to accept credit card- and bank-funded payments from Amazon's base of online and mobile customers on the merchant's own website;
|
|
•
|
Google Checkout (recently integrated into the Google Wallet service), which enables the online and mobile payment of merchants using credit cards;
|
|
•
|
AliPay, an online payment services provider which operates primarily in China but has announced plans to expand internationally;
|
|
•
|
Other providers of online account-based payments, such as Skrill and ClickandBuy (primarily in the EU), Paymate and Visa PayClick in Australia,
|
|
•
|
payment services targeting users of social networks and online gaming, including Facebook and Hi5 credits, PlaySpan (which Visa has acquired) and Boku;
|
|
•
|
payment services enabling banks to offer their online banking customers the ability to send and receive payments through their bank account, including ZashPay from Fiserv and Popmoney from CashEdge, both of which have announced collaboration agreements with Visa (Fiserv recently acquired CashEdge); and
|
|
•
|
online shopping services that provide special offers linked to a specific payment provider, such as Visa's RightCliq, MasterCard MarketPlace, TrialPay and Tapjoy.
|
Some of these competitors have longer operating histories, significantly greater financial, technical, marketing, customer service and other resources, greater name recognition, or a larger base of customers in affiliated businesses than PayPal. PayPal's competitors may respond to new or emerging technologies and changes in customer requirements faster and more effectively than PayPal. Some of these competitors may also be subject to less burdensome licensing, anti-money laundering, counter-terrorist financing and other regulatory requirements than PayPal, which is subject to additional regulations based on, among other factors, its licensure as a bank in Luxembourg. They may devote greater resources to the development, promotion, and sale of products and services than PayPal, and they may offer lower prices. For example, Google Checkout has in the past offered free payments processing on transactions in an amount proportionate to certain advertising spending with Google. Competing services tied to established banks and other financial institutions may offer greater liquidity and engender greater consumer confidence in the safety and efficacy of their services than PayPal. In addition, in certain countries, such as Germany, Netherlands and Australia, electronic funds transfer is a leading method of payment for both online and offline transactions. As in the U.S., established banks and other financial institutions that do not currently offer online payments could quickly and easily develop such a service.
The principal competitive factors for PayPal include the following:
|
•
|
ability to attract and retain both buyers and sellers with relatively low marketing expense;
|
|
•
|
ability to show that sellers will achieve incremental sales by offering PayPal;
|
40
|
•
|
security of transactions and the ability for buyers to use PayPal without sharing their financial information with the seller;
|
|
•
|
low fees and simplicity of fee structure;
|
|
•
|
ability to develop services across multiple commerce channels, including mobile payments and payments at the physical point of sale;
|
|
•
|
trust in PayPal's dispute resolution and buyer and seller protection programs;
|
|
•
|
customer service; and
|
|
•
|
brand recognition.
|
With respect to our online competition, additional competitive factors include:
|
•
|
website ease-of-use and accessibility;
|
|
•
|
system reliability;
|
|
•
|
data security; and
|
|
•
|
quality of developer tools such as our Application Programming Interfaces and Software Development Kits.
|
Some of PayPal's competitors, such as Wells Fargo, First Data, American Express and Royal Bank of Scotland, also provide processing or foreign exchange services to PayPal. If PayPal were to seek to expand the financial products that it offers, either alone or through a commercial alliance or an acquisition, these processing and foreign exchange relationships could be negatively affected, or these competitors and other processors could make it more difficult for PayPal to deliver its services.
GSI
Our GSI business segment has two main businesses: ecommerce services and interactive marketing services.
Ecommerce Services
The market for the development and operation of ecommerce services that enable companies to operate ecommerce businesses and integrate their ecommerce businesses into their multichannel retail offerings is continuously evolving and intensely competitive. In our ecommerce services business, we face competition from in-house ecommerce solutions, technology and service providers which supply one or more components of an ecommerce solution, and other providers of integrated ecommerce solutions. Many of our prospective ecommerce services clients evaluate managing all or some aspects of an ecommerce operation with internal resources. As a result, we often compete with in-house solutions promoted and supported by internal information technology staffs, merchandising groups, and other internal corporate constituencies as well as with technology and service providers that supply one or more components of an ecommerce solution that allow prospective clients to develop and operate their ecommerce business in-house. This group of providers may include the prospective client itself and companies that offer: Web platforms (e.g., Art Technology Group (which is owned by Oracle), IBM, Demandware and Microsoft); customer care/call center services (e.g., West Communications, Sykes Enterprises, and Convergys); fulfillment and logistics (e.g., PFS Web, Innotrac, DHL, and UPS); and systems integrators and technology providers (e.g., Accenture, EDS, Sapient, Infosys, Oracle and IBM).
We believe that we compete with ecommerce services competitors primarily on the basis of the following:
|
•
|
offering the choice of a complete integrated solution or a component-based solution;
|
|
•
|
promoting the client's brand and business, rather than our own;
|
|
•
|
providing scale and operating leverage with an enterprise focus;
|
|
•
|
establishing a commitment to invest in and enhance our platform; and
|
|
•
|
aligning our financial interests with those of our clients.
|
Interactive Marketing Services
The market for interactive marketing services is continuously evolving and intensely competitive. In our interactive marketing services business, we face competition from other providers of interactive marketing services, other providers of traditional marketing services and in-house marketing departments, as our prospective interactive marketing services clients evaluate managing their marketing services with internal resources as well as through interactive marketing agencies. As a result, we often compete with in-house solutions promoted and supported by internal marketing departments as well as with service providers that supply one or more interactive marketing services. This group of providers may include the prospective client itself and companies that offer: email management and data aggregation (e.g., Experian, Harte-Hanks and Epsilon); online marketing and design services (digital marketing services agencies such as Omnicom Group, WPP Group, Publicis and
41
the Interpublic Group of Companies); and other interactive marketing services (e.g., Google, LinkShare (owned by Rakuten), TradeDoubler, and ValueClick). Low barriers to entry in the interactive marketing industry could also increase the number of competitors our interactive marketing services business may face.
We believe that we compete with interactive marketing services competitors primarily on the basis of the following:
|
•
|
offering digital marketing solutions that are integrated with our ecommerce services platform, which we believe provides a more strategic, cohesive and optimized approach to growing ecommerce businesses; and
|
|
•
|
providing services that utilize proprietary technology to promote stronger customer engagement designed to increase clients' return on investment.
|
Our ecommerce services and interactive marketing services businesses have competitors with longer operating histories, larger customer bases, greater brand recognition and greater financial, marketing and other resources. Those competitors may be able to secure components of their technology and services on more favorable terms and devote more resources to technology development and marketing than our ecommerce services and interactive marketing services business. In addition, as we expand our ecommerce services and interactive marketing services businesses internationally, we will face increased competition from local companies which may have a greater understanding of, and focus on, the local customer.
We are subject to regulatory activity and antitrust litigation under competition laws.
We receive scrutiny from various government agencies under U.S. and foreign competition laws. Some jurisdictions also provide private rights of action for competitors or consumers to assert claims of anti-competitive conduct. Other companies and government agencies have in the past and may in the future allege that our actions violate the antitrust or competition laws of the U.S. or other countries, or otherwise constitute unfair competition. Contractual agreements with buyers, sellers, or other companies could give rise to regulatory action or antitrust litigation. Also, our unilateral business practices could give rise to regulatory action or antitrust litigation. Some regulators, particularly those outside of the U.S., may perceive our business to have so much market power that otherwise uncontroversial business practices could be deemed anticompetitive. For example, in the U.S., we have been sued by a plaintiff representing a putative class of sellers who alleges that we have illegally monopolized a market for online auctions. In Korea, the national competition authority has investigated allegations that we have engaged in illegal exclusive conduct and rendered a decision against us in October 2010. The case is on appeal through two administrative lawsuits, and a further investigation has now been concluded by the Seoul prosecutor's office, which has chosen not to bring any charges. The competition authorities in Germany and Australia have conducted investigations (now completed) of various actions taken by our businesses. Such claims and investigations, even if without foundation, typically are very expensive to defend, involve negative publicity and substantial diversion of management time and effort, and could result in significant judgments against us.
In several jurisdictions, we have taken actions designed to improve the security of transactions and the quality of the user experience on our websites. Beginning in June 2008, we have required users in the U.K. to offer PayPal as a payment alternative on most transactions on our localized U.K. website, and since October 2008, we have required sellers on eBay.com to accept one or more accepted payment methods (currently PayPal, credit or debit cards processed through Internet merchant accounts, ProPay, Moneybookers and Paymate) and no longer allow any forms of paper payment, including checks and money orders, to be listed by sellers in the U.S. for most categories of items. While these initiatives are intended to improve and make safer our users' buying experience and/or increase activity on our sites, certain users may be negatively affected by or react negatively to these changes, and may allege that we have (and are abusing) market power. We currently face inquiries from government regulators in various jurisdictions related to such actions. For example, in 2008, both the Australian Competition and Consumer Commission and the Reserve Bank of Australia reviewed our policies requiring sellers to offer PayPal as a payment alternative on most transactions on our localized Australian website and precluding sellers from imposing a surcharge or any other fee for accepting PayPal or other payment methods. We may face similar inquiries from other government regulators in the future. Negative reactions to these changes by our users or government authorities could, among other things, force us to change our operating practices in ways that could harm our business, operating results and profitability.
Our business may be adversely affected by factors that cause our users to spend less time on our websites, including seasonal factors, national events and increased usage of other websites.
Anything that diverts our users from their customary level of usage of our websites could adversely affect our business. We would therefore be adversely affected by geopolitical events such as war, the threat of war, or terrorist activity, and natural disasters, such as hurricanes or earthquakes. Similarly, our results of operations historically have experienced seasonal fluctuations because many of our users reduce their activities on our websites with the onset of good weather during the summer months, and on and around national holidays. In particular, our GSI business is highly seasonal, with the fourth quarter
42
holiday season accounting for a disproportionate amount of GSI's net revenues due to consumers increasing their purchases and businesses increasing their advertising to consumers during that period, and any factors that limit or dampen consumer spending during the fourth quarter holiday season could harm our GSI business. In addition, increased usage of social networking or other entertainment websites may decrease the amount of time users spend on our websites, which could adversely affect our financial results.
Our failure to cost-effectively manage certain aspects of our business could harm us.
We have expanded our headcount, facilities and infrastructure in the U.S. and internationally, and anticipate that further expansion in certain areas will be required for some of our businesses. We are also increasing our product and service offerings.
This expansion increases the complexity of our businesses and has placed, and we expect it will continue to place, a significant strain on our management, operational, and financial resources. The areas that are put under strain by our growth include the following:
|
•
|
Customer Account Billing
. Our revenues depend on prompt and accurate billing processes. Our failure to grow our transaction-processing capabilities to accommodate the increasing number of transactions that must be billed on our and our subsidiaries' websites would harm our business and our ability to collect revenue.
|
|
•
|
Customer Service
. We continue to focus on providing better and more efficient customer support to our users. We intend to provide an increased level of support (including an increasing amount of telephone support) in a cost-effective manner. If we are unable to provide customer support in a cost-effective manner, users of our websites may have negative experiences, current and future revenues could suffer, our costs may increase and our operating margins may decrease.
|
We must continue to effectively hire, train and manage new employees. If our new hires perform poorly, if we are unsuccessful in hiring, training, managing and integrating new employees, or if we are unsuccessful in retaining our existing employees, our business may be harmed. To manage the expected growth of our operations and personnel, we will need to improve our transaction processing, operational and financial systems, procedures and controls. This is a special challenge as we acquire new operations with different and incompatible systems. Our current and planned personnel, systems, procedures and controls may not be adequate to support our future operations. Any capital investments that we may make will increase our cost base, which will make it more difficult for us to offset any future revenue shortfalls by expense reductions in the short term.
We may have exposure to greater than anticipated tax liabilities.
The determination of our worldwide provision for income taxes and other tax liabilities requires estimation and significant judgment, and there are many transactions and calculations where the ultimate tax determination is uncertain. Like many other multinational corporations, we are subject to tax in multiple U.S. and foreign tax jurisdictions and have structured our operations to reduce our effective tax rate. Our determination of our tax liability is always subject to audit and review by applicable domestic and foreign tax authorities, and we are currently undergoing a number of investigations, audits and reviews by taxing authorities throughout the world, including with respect to our tax structure. Any adverse outcome of any such audit or review could have a negative effect on our business, operating results and financial condition, and the ultimate tax outcome may differ from the amounts recorded in our financial statements and may materially affect our financial results in the period or periods for which such determination is made. While we have established reserves based on assumptions and estimates that we believe are reasonable to cover such eventualities, these reserves may prove to be insufficient in the event that any taxing authority is successful in asserting tax positions that are contrary to our positions.
In addition, the economic downturn reduced tax revenues for U.S. federal and state governments, and a number of proposals to increase taxes from corporate entities are being considered at various levels of government. Among the options have been a range of proposals included in the tax and budget policies recommended to the U.S. Congress by the U.S. Department of the Treasury to modify the federal tax rules related to the imposition of U.S. federal corporate income taxes for companies operating in multiple U.S. and foreign tax jurisdictions. If such proposals are enacted into law, this could increase our effective tax rate. A number of U.S. states have likewise attempted to increase corporate tax revenues by taking an expansive view of corporate presence to attempt to impose corporate income taxes and other direct business taxes on companies that have no physical presence in their state. Many U.S. states are also altering their apportionment formulas to increase the amount of taxable income/loss attributable to their state from certain out-of-state businesses. Companies that operate over the Internet, such as eBay, are a target of some of these state efforts. If more states are successful in applying direct taxes to Internet companies that do not have a physical presence in the state, this could increase our effective tax rate.
43
Our integrated X.commerce platform, which is open to third-party developers, subjects us to additional risks.
In 2009, we launched the PayPal Developer Platform to enable third-party developers to access a wide variety of PayPal product and programming code specifications and to connect to select PayPal payment application programming interfaces (APIs). We also began providing a software tool kit for building mobile payments applications, and enabling third-party developers to access certain APIs with respect to our Marketplaces platforms. In June 2011, we launched X.commerce, our integrated open commerce platform initiative, which includes our eBay Developer Program, the PayPal Developer Network and Magento, which provides open source ecommerce platforms and which we acquired in August 2011. There can be no assurance that third-party developers will develop and maintain applications and services on our open commerce platforms on a timely basis or at all, and a number of factors could cause such third-party developers to curtail or stop development for our platforms. In addition, our business is subject to many regulatory restrictions, which may be contravened by such third party applications. If this were to occur, we could be liable for the regulatory failure and our business could be adversely affected.
There are risks associated with our indebtedness.
At December 31, 2011, we had $2.0 billion in unsecured indebtedness outstanding, as well as $2.5 billion of available borrowing capacity under our existing commercial paper program and unsecured revolving credit facility (after adjusting for capacity maintained in order to repay commercial paper borrowings in the event we are unable to repay those borrowings from other sources when they become due). We may incur additional indebtedness in the future, including under our revolving credit facility or through public or private offerings of debt securities. Our outstanding indebtedness and any additional indebtedness we incur may have important consequences, including, without limitation, the following:
|
•
|
we will be required to use cash to pay the principal of and interest on our indebtedness;
|
|
•
|
our indebtedness and leverage may increase our vulnerability to adverse changes in general economic and industry conditions, as well as to competitive pressure;
|
|
•
|
our ability to obtain additional financing for working capital, capital expenditures, acquisitions and for general corporate and other purposes may be limited; and
|
|
•
|
our flexibility in planning for, or reacting to, changes in our business and our industry may be limited.
|
Our ability to make payments of principal of and interest on our indebtedness depends upon our future performance, which will be subject to general economic conditions, industry cycles and financial, business and other factors affecting our consolidated operations, many of which are beyond our control. If we are unable to generate sufficient cash flow from operations in the future to service our debt, we may be required to, among other things:
|
•
|
seek additional financing in the debt or equity markets;
|
|
•
|
refinance or restructure all or a portion of our indebtedness;
|
|
•
|
sell selected assets;
|
|
•
|
reduce or delay planned capital expenditures; or
|
|
•
|
reduce or delay planned operating expenditures.
|
Such measures might not be sufficient to enable us to service our debt. In addition, any such financing, refinancing or sale of assets might not be available on economically favorable terms or at all.
We depend on the continued growth of online commerce.
The business of selling goods over the Internet and mobile networks, particularly through online trading, is dynamic and relatively new. Concerns about fraud, privacy and other problems may discourage additional consumers from adopting the Internet or mobile devices as a medium of commerce. In countries such as the U.S., Germany, Korea and the U.K., where our services and online commerce generally have been available for some time and the level of market penetration of our services is high, acquiring new users for our services may be more difficult and costly than it has been in the past. Moreover, the growth rates of Internet users is slowing in many countries where we have a significant presence. In order to expand our user base, we must appeal to and acquire consumers who historically have used traditional means of commerce to purchase goods and may prefer Internet analogues to such traditional retail means, such as the retailer's own website, to our offerings. If these consumers prove to be less active than our earlier users due to lower levels of willingness to use the Internet or mobile devices for commerce for any reason, including lack of access to high-speed communications equipment, congestion of traffic on the Internet, Internet or mobile network outages or delays, disruptions or other damage to users' computers or mobile devices, and we are unable to gain efficiencies in our operating costs, including our cost of acquiring new customers, our business could be adversely impacted.
44
Our businesses depend on continued and unimpeded access to the Internet, as well as access to mobile networks. Internet service providers may be able to block, degrade, or charge us or our users additional fees for our offerings, which could harm our business.
Our customers rely on access to the Internet or mobile networks to use our products and services. In many cases, that access is provided by companies that compete with at least some of our offerings, including incumbent telephone companies, cable companies, mobile communications companies and large Internet service providers. Some of these providers have stated that they may take measures that could degrade, disrupt, or increase the cost of customers' use of our offerings by restricting or prohibiting the use of their infrastructure to support or facilitate our offerings, or by charging increased fees to us or our users to provide our offerings. Mobile operators or operating system providers could block or place onerous restrictions on our ability to offer our mobile applications in their mobile application stores. Internet service providers or mobile networks could attempt to charge us each time our customers use our offerings. Worldwide, a number of companies have announced plans to take such actions or are selling products designed to facilitate such actions. The United States Federal Communications Commission enacted rules in December 2010 (
Preserving the Open Internet Broadband Industry Practices [FCC-10-201]
) establishing baseline restrictions that would regulate the ability of Internet access companies to interfere with Internet traffic transported over wired and wireless networks. These FCC rules are expected to be reviewed by the Federal courts in 2012. Pending greater regulatory and judicial clarity, any interference with our offerings or higher charges for access to our offerings, whether paid by us or by our customers, could cause us to lose existing customers, impair our ability to attract new customers and harm our revenue and growth.
Our business depends on the development and maintenance of the Internet infrastructure.
The success of our services will depend largely on the development and maintenance of the Internet infrastructure. This includes maintenance of a reliable network backbone with the necessary speed, data capacity, and security, as well as timely development of complementary products, for providing reliable Internet access and services. The Internet has experienced, and is likely to continue to experience, significant growth in the numbers of users and amount of traffic. The Internet infrastructure may be unable to support such demands. In addition, increasing numbers of users, increasing bandwidth requirements, or problems caused by “viruses,” “worms,” malware and similar programs may harm the performance of the Internet. The backbone computers of the Internet have been the targets of such programs. From time to time, the Internet has experienced, and is likely to continue to experience, a variety of outages and other delays as a result of damage to portions of its infrastructure. Any such outages and delays could reduce the level of Internet usage generally as well as the level of usage of our services, which could adversely impact our business.
We may be unable to protect or enforce our own intellectual property rights adequately.
We regard the protection of our intellectual property, including our trademarks (particularly those covering the eBay and PayPal names), patents, copyrights, domain names, trade dress and trade secrets as critical to our success. We aggressively protect our intellectual property rights by relying on federal, state and common law rights in the U.S. and internationally, as well as a variety of administrative procedures. We also rely on contractual restrictions to protect our proprietary rights in products and services. We have entered into confidentiality and invention assignment agreements with our employees and contractors and confidentiality agreements with parties with whom we conduct business in order to limit access to and disclosure of our proprietary information. Effective intellectual property protection may not be available in every country in which our products and services are made available, and contractual arrangements and the other steps we have taken to protect our intellectual property may not prevent third parties from infringing or misappropriating our technology or deter independent development of equivalent or superior technologies or other intellectual property rights by others.
We pursue the registration of our domain names, trademarks and service marks in the U.S. and internationally. Additionally, we have filed U.S. and international patent applications covering certain aspects of our proprietary technology. Effective trademark, copyright, patent, domain name, trade dress and trade secret protection is very expensive to maintain and may require litigation. We must protect our intellectual property rights and other proprietary rights in an increasing number of jurisdictions, a process that is expensive and time consuming and may not be successful in every location. We may not be able to discover or determine the extent of any unauthorized use of our proprietary rights. We have licensed in the past, and expect to license in the future, certain of our proprietary rights, such as trademarks or copyrighted material, to others. These licensees may take actions that diminish the value of our proprietary rights or harm our reputation.
45
We are subject to the risks of owning real property.
We own real property, including land and buildings related to our operations. We have little experience in managing real property. Ownership of this property subjects us to a number of additional risks, including:
|
•
|
the possibility of environmental contamination and the costs associated with fixing any environmental problems;
|
|
•
|
disruptions to our operations resulting from possible natural disasters, interruptions in utilities and similar events;
|
|
•
|
adverse changes in the value of these properties due to interest rate changes, changes in the commercial property markets, or other factors;
|
|
•
|
the possible need for structural improvements in order to comply with zoning, seismic, disability law, or other requirements; and
|
|
•
|
possible disputes with tenants, neighboring owners, or others.
|
Some anti-takeover provisions may affect the price of our common stock.
Our Board of Directors has the authority to issue up to 10,000,000 shares of preferred stock and to determine the preferences, rights and privileges of those shares without any further vote or action by the stockholders. The rights of the holders of common stock may be harmed by rights granted to the holders of any preferred stock that may be issued in the future. Some provisions of our certificate of incorporation and bylaws could have the effect of making it more difficult for a potential acquirer to acquire a majority of our outstanding voting stock or take control of our board of directors. These include provisions that provide for a classified board of directors, prohibit stockholders from taking action by written consent and restrict the ability of stockholders to call special meetings. We are also subject to provisions of Delaware law that prohibit us from engaging in any business combination with any interested stockholder (as defined by Delaware law) for a period of three years from the date the person became an interested stockholder, unless certain conditions are met. This restriction could have the effect of delaying or preventing a change of control.
46
|
ITEM 1B:
|
UNRESOLVED STAFF COMMENTS
|
Not applicable.
|
ITEM 2:
|
PROPERTIES
|
We own and lease various properties in the U.S. and 29 other countries around the world. We use the properties for executive and administrative offices, data centers, product development offices, fulfillment centers and customer service offices. As of
December 31, 2011
, our owned and leased properties provided us with aggregate square footage as follows:
|
United States
|
Other Countries
|
Total
|
||||||
|
(In millions)
|
||||||||
|
Owned facilities*
|
2.6
|
|
—
|
|
2.6
|
|
||
|
Leased facilities
|
4.2
|
|
2.1
|
|
6.3
|
|
||
|
Total facilities
|
6.8
|
|
2.1
|
|
8.9
|
|
||
* We also own approximately 96 acres of land in Utah that could be developed if necessary to accommodate future growth.
Our corporate headquarters are located in San Jose, California and occupy approximately 0.2 million square feet. As of
December 31, 2011
, the total square footage generally used by each of our reportable segments was as follows:
|
Marketplaces
|
Payments
|
GSI
|
Total
|
||||||||
|
(In millions)
|
|||||||||||
|
Total facilities
|
2.5
|
|
2.2
|
|
4.0
|
|
8.7
|
|
|||
From time to time we consider various alternatives related to long-term facilities needs. While we believe our existing facilities are adequate to meet our immediate needs, it may become necessary to develop and improve land we own or lease or acquire additional or alternative space to accommodate any future growth.
|
ITEM 3:
|
LEGAL PROCEEDINGS
|
Overview
We are involved in legal proceedings on an ongoing basis. If we believe that a loss arising from such matters is probable and can be reasonably estimated, we accrue the estimated liability in our financial statements. If only a range of estimated losses can be determined, we accrue an amount within the range that, in our judgment, reflects the most likely outcome; if none of the estimates within that range is a better estimate than any other amount, we accrue the low end of the range. Amounts accrued for legal proceedings for which we believe a loss is probable were not material for the year ended December 31, 2011. Except as otherwise noted, we have concluded that reasonably possible losses arising directly from the proceedings (i.e., monetary damages or amounts paid in judgment or settlement) in excess of our accruals are also not material. For those proceedings in which an unfavorable outcome is reasonably possible but not probable, we have disclosed an estimate of the reasonably possible loss or range of losses or we have concluded that an estimate of the reasonably possible loss or range of losses arising directly from the proceeding (i.e., monetary damages or amounts paid in judgment or settlement) are not material. If we cannot estimate the probable or reasonably possible loss or range of losses arising from a legal proceeding, we have disclosed that fact.
In assessing the materiality of a legal proceeding, we evaluate, among other factors, the amount of monetary damages claimed, as well as the potential impact of non-monetary remedies sought by plaintiffs (e.g., injunctive relief) that may require us to change our business practices in a manner that could have a material adverse impact on our business. With respect to the matters disclosed in this Item 3: Legal Proceedings, we are unable to estimate the possible loss or range of losses that could potentially result from the application of such non-monetary remedies.
Specific Matters
In August 2006, Louis Vuitton Malletier and Christian Dior Couture filed two lawsuits in the Paris Court of Commerce against eBay Inc. and eBay International AG. Among other things, the complaint alleged that we violated French tort law by negligently broadcasting listings posted by third parties offering counterfeit items bearing plaintiffs' trademarks and by purchasing certain advertising keywords. Around September 2006, Parfums Christian Dior, Kenzo Parfums, Parfums Givenchy, and Guerlain Société also filed a lawsuit in the Paris Court of Commerce against eBay Inc. and eBay International AG. The
47
complaint alleged that we had interfered with the selective distribution network the plaintiffs established in France and the European Union by allowing third parties to post listings offering genuine perfumes and cosmetics for sale on our websites. In June 2008, the Paris Court of Commerce ruled that eBay and eBay International AG were liable for failing to prevent the sale of counterfeit items on its websites that traded on plaintiffs' brand names and for interfering with the plaintiffs' selective distribution network. The court awarded plaintiffs approximately EUR 38.6 million in damages and issued an injunction (enforceable by daily fines of up to EUR 100,000) prohibiting all sales of perfumes and cosmetics bearing the Dior, Guerlain, Givenchy and Kenzo brands over all worldwide eBay sites to the extent that they are accessible from France. We appealed this decision, and in September 2010, the Paris Court of Appeal reduced the damages award to EUR 5.7 million and modified the injunction. We have further appealed this decision to the French Supreme Court. In 2009, plaintiffs filed an action regarding our compliance with the original injunction, and in November 2009, the court awarded the plaintiffs EUR 1.7 million (the equivalent of EUR 2,500 per day) and indicated that as a large Internet company we should do a better job of enforcing the injunction. Parfums Christian Dior has filed another motion relating to our compliance with the injunction. We have taken measures to comply with the injunction and have appealed these rulings, noting, among other things, the modification of the initial injunction. However, these and similar suits may force us to modify our business practices, which could lower our revenue, increase our costs, or make our websites less convenient to our customers. Any such results could materially harm our business. Other brand owners have also filed suit against us or have threatened to do so in numerous different jurisdictions, seeking to hold us liable for, among other things, alleged counterfeit items listed on our websites by third parties, “tester” and other not for resale consumer products listed on our websites by third parties, alleged misuse of trademarks in listings, alleged violations of selective distribution channel laws, alleged violations of parallel import laws, alleged non-compliance with consumer protection laws and in connection with paid search advertisements. We have prevailed in some of these suits, lost in others, and many are in various stages of appeal. We continue to believe that we have meritorious defenses to these suits and intend to defend ourselves vigorously.
In May 2009, the U.K. High Court of Justice ruled in the case filed by L'Oréal SA, Lancôme Parfums et Beauté & Cie, Laboratoire Garnier & Cie and L'Oréal (UK) Ltd against eBay International AG, other eBay companies, and several eBay sellers (No. HC07CO1978) that eBay was not jointly liable with the seller co-defendants as a joint tortfeasor, and indicated that it would certify to the European Court of Justice (ECJ) questions of liability for the use of L'Oréal trademarks, hosting liability, and the scope of a possible injunction against intermediaries. On July 12, 2011 the ECJ ruled on the questions certified by the U.K. High Court of Justice. It held that (a) brand names could be used by marketplaces as keywords for paid search advertising without violating a trademark owner's rights if it were clear to consumers that the goods reached via the key word link were not being offered by the trademark owner or its designees but instead by third parties, (b) that marketplaces could invoke the limitation from liability provided by Article 14 of the ecommerce directive if they did not take such an active role with respect to the listings in question that the limitation would not be available, but that even where the limitation was available, the marketplace could be liable if it had awareness (through notice or its own investigation) of the illegality of the listings, (c) that a marketplace would be liable in a specific jurisdiction only if the offers on the site at issue were targeting that jurisdiction, a question of fact, (d) that injunctions may be issued to a marketplace in connection with infringing third party content, but that such injunctions must be proportionate and not block legitimate trade and (e) that trademark rights can only be evoked by a rights owner as a result of a seller's commercial activity as opposed to private activity. The matter will now return to the U.K. High Court of Justice for further action in light of the ECJ opinion. The case was originally filed in July 2007. L'Oréal's complaint alleged that we were jointly liable for trademark infringement for the actions of the sellers who allegedly sold counterfeit goods, parallel imports and testers (not for resale products). Additionally, L'Oréal claimed that eBay's use of L'Oréal brands on its website, in its search engine and in sponsored links, and purchase of L'Oréal trademarks as keywords, constitute trademark infringement. The suit sought an injunction preventing future infringement, full disclosure of the identity of all past and present sellers of infringing L'Oréal goods, and a declaration that our Verified Rights Owner (VeRO) program as then operated was insufficient to prevent such infringement. The scope of a possible injunction claimed is to be specified after the trial upon remand from the ECJ.
eBay's Korean subsidiary, IAC (which has merged into Gmarket and is now named eBay Korea), has notified its approximately 20 million users of a January 2008 data breach involving personally identifiable information including name, address, resident registration number and some transaction and refund data (but not including credit card information or real time banking information). Approximately 149,000 users have sued IAC over this breach in several lawsuits in Korean courts and more may do so in the future. Trial for a group of four representative suits began in August 2009 in the Seoul District Court, and trial for a group of 23 other suits began in September 2009 in the Seoul District Court. There is some precedent in Korea for a court to grant “consolation money” for data breaches without a specific finding of harm from the breach. Such precedents have involved payments of up to approximately $200 per user. In January 2010, the Seoul District Court ruled that IAC had met its obligations with respect to defending the site from intrusion and, accordingly, had no liability for the breach. This ruling has been appealed by approximately 34,000 plaintiffs to the Seoul High Court, where it is currently being heard de novo. A decision is expected in 2012.
48
General Matters
Other third parties have from time to time claimed, and others may claim in the future, that we have infringed their intellectual property rights. We are subject to patent disputes, and expect that we will increasingly be subject to additional patent infringement claims involving various aspects of our Marketplaces, Payments and GSI businesses as our services continue to expand in scope and complexity. Such claims may be brought directly against our companies and/or against our customers (who may be entitled to contractual indemnification under their contracts with us), and we are subject to increased exposure to such claims as a result of our recent acquisitions, particularly in cases where we are entering into new businesses in connection with such acquisitions. We have in the past been forced to litigate such claims. We may also become more vulnerable to third-party claims as laws such as the Digital Millennium Copyright Act, the Lanham Act and the Communications Decency Act are interpreted by the courts, and as we expand the range and geographical scope of our services and become subject to laws in jurisdictions where the underlying laws with respect to the potential liability of online intermediaries like ourselves are either unclear or less favorable. We believe that additional lawsuits alleging that we have violated patent, copyright or trademark laws will be filed against us. Intellectual property claims, whether meritorious or not, are time consuming and costly to defend and resolve, could require expensive changes in our methods of doing business, or could require us to enter into costly royalty or licensing agreements on unfavorable terms.
From time to time, we are involved in other disputes or regulatory inquiries that arise in the ordinary course of business, including suits by our users (individually or as class actions) alleging, among other things, improper disclosure of our prices, rules or policies, that our prices, rules, policies or customer/user agreements violate applicable law, or that we have not acted in conformity with such prices, rules, policies or agreements. The number and significance of these disputes and inquiries are increasing. Any claims or regulatory actions against us, whether meritorious or not, could be time consuming, result in costly litigation, damage awards (including statutory damages for certain causes of action in certain jurisdictions), injunctive relief or increased costs of doing business through adverse judgment or settlement, require us to change our business practices in expensive ways, require significant amounts of management time, result in the diversion of significant operational resources or otherwise harm our business.
|
ITEM 4:
|
[REMOVED AND RESERVED]
|
49
PART II
|
ITEM 5:
|
MARKET FOR REGISTRANT'S COMMON EQUITY, RELATED STOCKHOLDER MATTERS AND ISSUER PURCHASES OF EQUITY SECURITIES
|
Price Range of Common Stock
Our common stock has been traded on The Nasdaq Global Select Market (formerly The Nasdaq National Market) under the symbol “EBAY” since September 24, 1998. The following table sets forth the high and low per share prices of our common stock, as reported by The Nasdaq Global Select Market, for the following periods.
|
|
High
|
Low
|
|||||
|
Year Ended December 31, 2011
|
|||||||
|
First Quarter
|
$
|
34.69
|
|
$
|
27.70
|
|
|
|
Second Quarter
|
34.39
|
|
|
28.35
|
|
||
|
Third Quarter
|
34.42
|
|
|
26.95
|
|
||
|
Fourth Quarter
|
33.87
|
|
|
28.11
|
|
||
|
|
High
|
Low
|
|||||
|
Year Ended December 31, 2010
|
|||||||
|
First Quarter
|
$
|
28.37
|
|
$
|
21.51
|
|
|
|
Second Quarter
|
27.67
|
|
|
19.54
|
|
||
|
Third Quarter
|
25.16
|
|
|
19.06
|
|
||
|
Fourth Quarter
|
31.64
|
|
|
23.93
|
|
||
As of
January 20, 2012
, there were approximately
4,922
holders of record of our common stock, although we believe that there are a significantly larger number of beneficial owners of our common stock.
Dividend Policy
We have never paid cash dividends on our stock and do not anticipate paying cash dividends in the foreseeable future.
Performance Measurement Comparison
The graph below shows the cumulative total stockholder return of an investment of $100 (and the reinvestment of any dividends thereafter) on December 29, 2006 (the last trading day for the year ended December 31, 2006) in (i) our common stock, (ii) the Nasdaq Composite Index, (iii) the S&P 500 Index and (iv) the S&P North American Technology Internet Index (the successor to the GSTI Internet Index). The S&P North American Technology Internet Index is a modified-capitalization weighted index representing the Internet industry, including Internet software and services and Internet retail companies. Our stock price performance shown in the graph below is not indicative of future stock price performance.
50
The following graph and related information shall not be deemed “soliciting material” or be deemed to be “filed” with the SEC, nor shall such information be incorporated by reference into any future filing, except to the extent that we specifically state that such graph and related information are incorporated by reference into such filing.
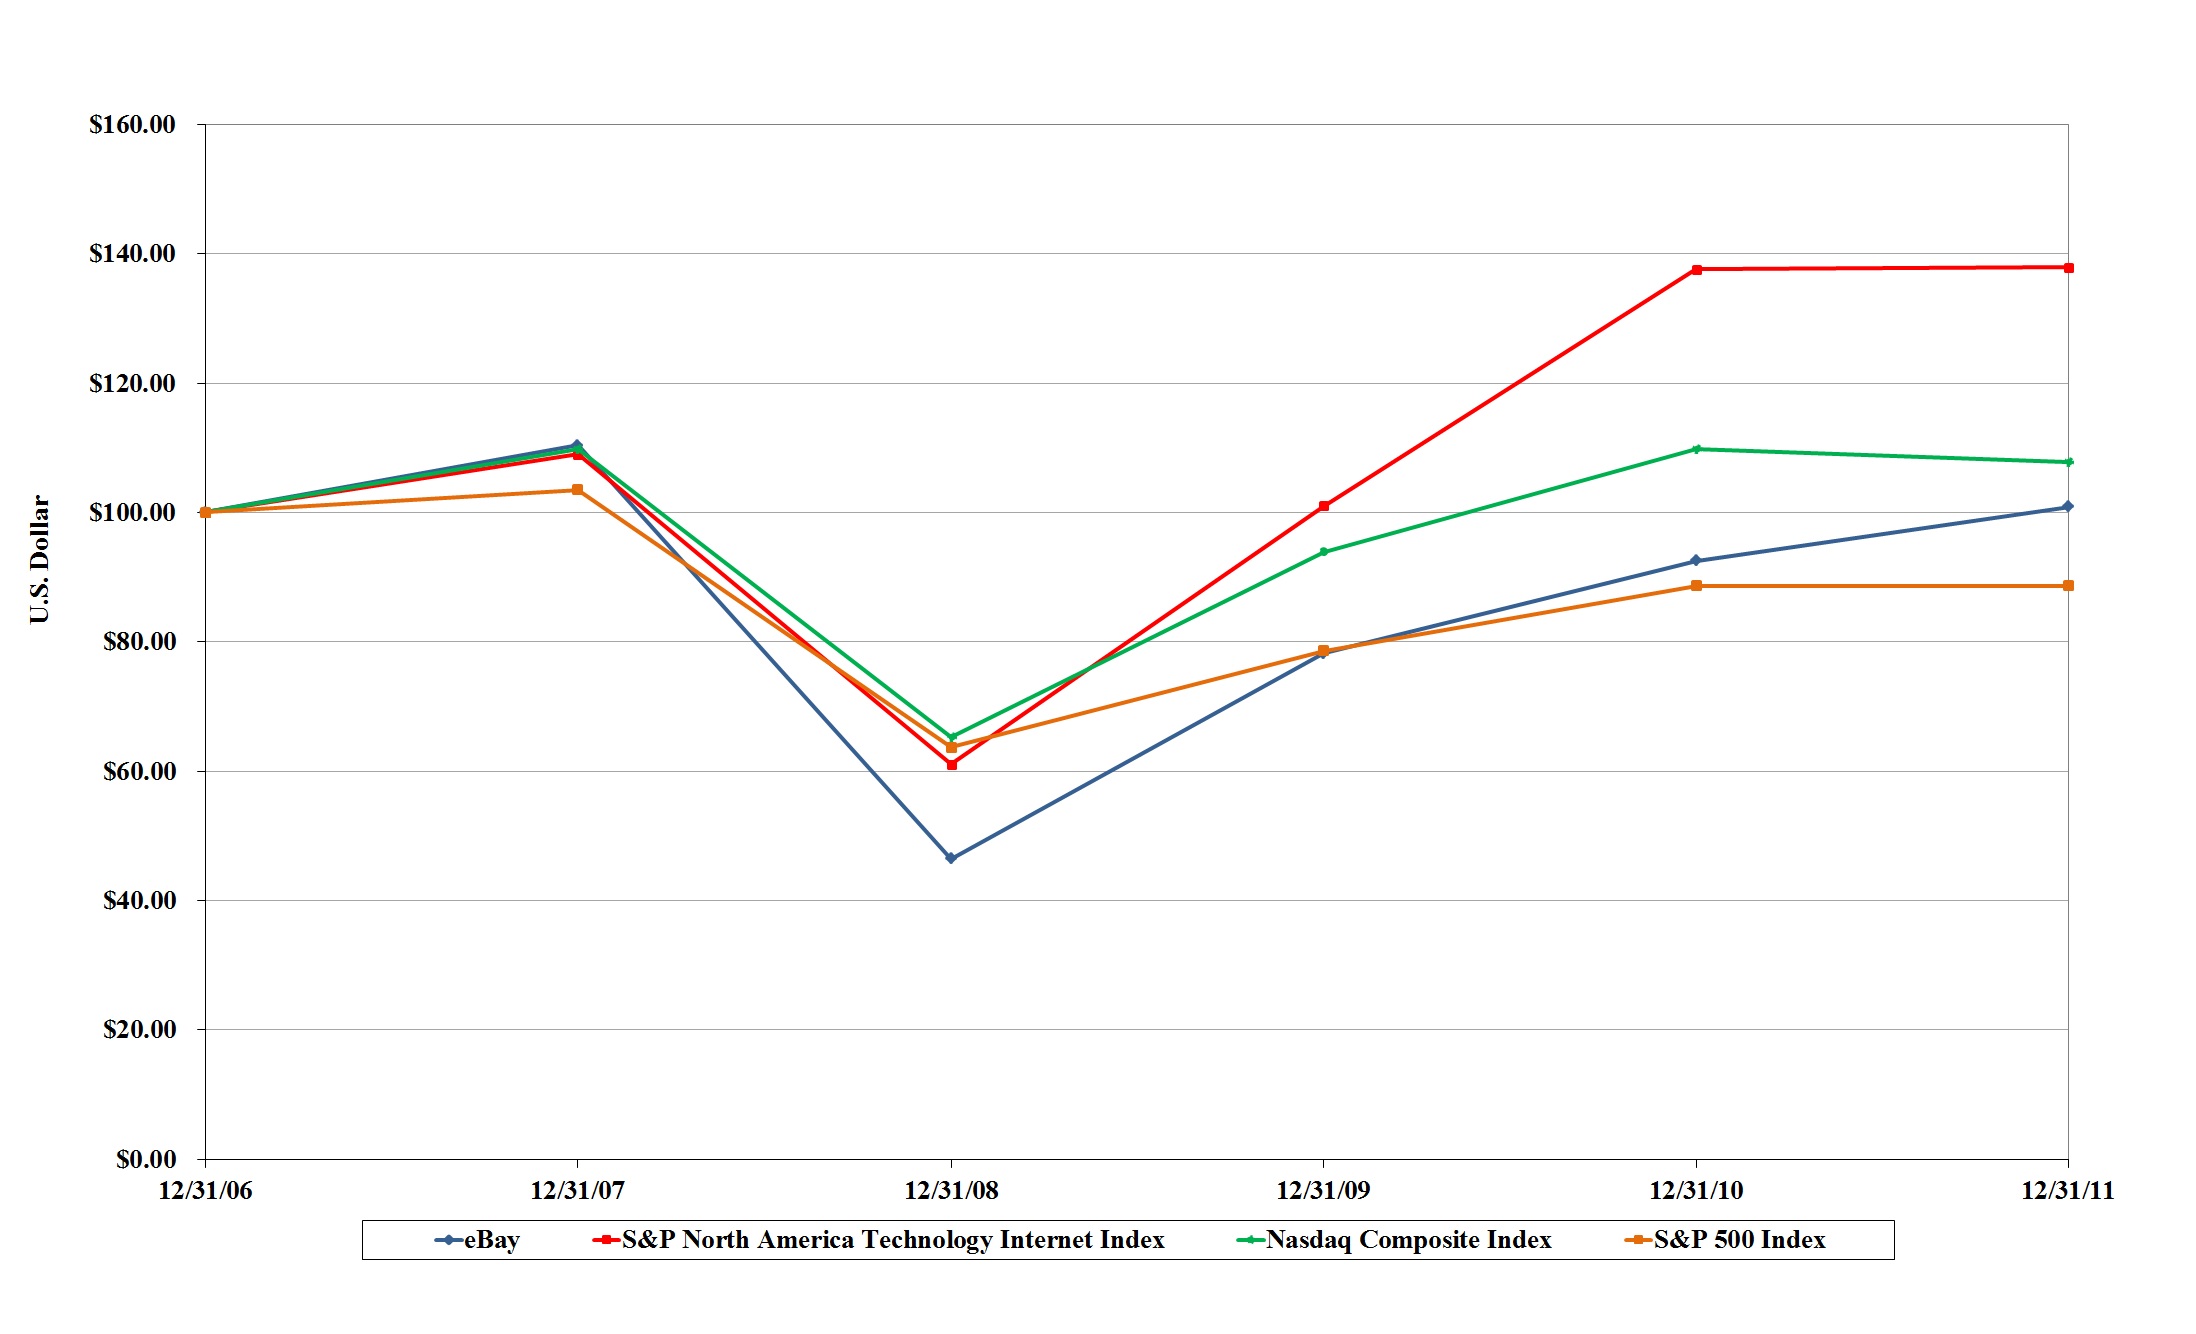
Stock repurchase activity during the three months ended
December 31, 2011
was as follows:
|
Period Ended
|
Total Number of Shares Purchased
|
Average Price Paid per Share
|
Total Number of Shares Purchased as Part of Publicly Announced Programs
|
Maximum Dollar Value of Shares that May Yet be Purchased Under the Programs (1)
|
||||||
|
October 31, 2011
|
117,000
|
|
|
$30.98
|
|
117,000
|
|
|
$1,126,591,472
|
|
|
November 30, 2011
|
7,883,000
|
|
|
$31.22
|
|
7,883,000
|
|
|
$880,522,269
|
|
|
December 31, 2011
|
—
|
|
|
$—
|
|
—
|
|
|
$880,522,269
|
|
|
8,000,000
|
|
8,000,000
|
|
|||||||
(1) In September 2010, our Board authorized a stock repurchase program that provides for the repurchase of up to
$2.0 billion
of our common stock, with no expiration from the date of authorization, for the purpose of offsetting the impact of dilution from our equity compensation programs.
|
ITEM 6:
|
SELECTED FINANCIAL DATA
|
The following selected consolidated financial data should be read in conjunction with the consolidated financial statements and notes thereto and “Management's Discussion and Analysis of Financial Condition and Results of Operations” appearing elsewhere in this Annual Report on Form 10-K. The consolidated statement of income data and the consolidated balance sheet data for the years ended, and as of,
December 31, 2011
,
2010
,
2009
,
2008
and
2007
are derived from our audited consolidated financial statements.
|
|
Year Ended December 31,
|
||||||||||||||||||
|
|
2011
(2)
|
2010
|
2009
(3)
|
2008
|
2007
(4)
|
||||||||||||||
|
|
(In thousands, except per share amounts)
|
||||||||||||||||||
|
Consolidated Statement of Income Data:
(1)
|
|||||||||||||||||||
|
Net revenues
|
$
|
11,651,654
|
|
$
|
9,156,274
|
|
$
|
8,727,362
|
|
$
|
8,541,261
|
|
$
|
7,672,329
|
|
||||
|
Gross profit
|
8,191,470
|
|
6,591,607
|
|
6,247,600
|
|
6,313,192
|
|
5,909,357
|
|
|||||||||
|
Income from operations
|
2,373,489
|
|
2,053,571
|
|
1,456,766
|
|
2,075,682
|
|
613,180
|
|
|||||||||
|
Income before income taxes
|
3,910,046
|
|
2,098,447
|
|
2,879,151
|
|
2,183,564
|
|
750,851
|
|
|||||||||
|
Net income
|
3,229,387
|
|
1,800,961
|
|
2,389,097
|
|
1,779,474
|
|
348,251
|
|
|||||||||
|
Net income per share:
|
|||||||||||||||||||
|
Basic
|
$
|
2.50
|
|
$
|
1.38
|
|
$
|
1.85
|
|
$
|
1.37
|
|
$
|
0.26
|
|
||||
|
Diluted
|
$
|
2.46
|
|
$
|
1.36
|
|
$
|
1.83
|
|
$
|
1.36
|
|
$
|
0.25
|
|
||||
|
Weighted average shares:
|
|||||||||||||||||||
|
Basic
|
1,292,775
|
|
1,305,593
|
|
1,289,848
|
|
1,303,454
|
|
1,358,797
|
|
|||||||||
|
Diluted
|
1,312,950
|
|
1,327,417
|
|
1,304,981
|
|
1,312,608
|
|
1,376,174
|
|
|||||||||
|
|
As of December 31,
|
||||||||||||||||||
|
|
2011
|
2010
|
2009
|
2008
|
2007
|
||||||||||||||
|
|
(In thousands)
|
||||||||||||||||||
|
Consolidated Balance Sheet Data:
(1)
|
|||||||||||||||||||
|
Cash and cash equivalents
|
$
|
4,691,101
|
|
$
|
5,577,411
|
|
$
|
3,999,818
|
|
$
|
3,188,928
|
|
$
|
4,221,191
|
|
||||
|
Short-term investments
|
1,238,301
|
|
1,045,403
|
|
943,986
|
|
163,734
|
|
676,264
|
|
|||||||||
|
Long-term investments
|
2,452,763
|
|
2,492,012
|
|
1,381,765
|
|
106,178
|
|
138,237
|
|
|||||||||
|
Working capital
(5)
|
5,927,250
|
|
6,548,824
|
|
4,818,240
|
|
2,581,503
|
|
4,022,926
|
|
|||||||||
|
Total assets
|
27,320,218
|
|
22,003,762
|
|
18,408,320
|
|
15,592,439
|
|
15,366,037
|
|
|||||||||
|
Short-term debt
|
564,601
|
|
300,000
|
|
—
|
|
1,000,000
|
|
200,000
|
|
|||||||||
|
Long-term debt
|
1,525,047
|
|
1,494,227
|
|
—
|
|
—
|
|
—
|
|
|||||||||
|
Total stockholders' equity
|
17,929,879
|
|
15,302,179
|
|
13,787,648
|
|
11,083,858
|
|
11,704,602
|
|
|||||||||
|
(1)
|
Includes the impact of acquisitions as well as the impact from dispositions. For a summary of recent significant acquisitions and the sale of Skype, please see “Note 3 - Business Combinations” and “Note 4 - Skype Related Transactions” to the consolidated financial statements included in this report.
|
|
(2)
|
The Consolidated Statement of Income for the year ended December 31, 2011 includes a loss on divested business of
$256.5 million
and a gain on the sale of our remaining 30% equity interest in Skype of approximately
$1.7 billion
. See "Note 3 - Business Combinations" and "Note 4 - Skype Related Transactions" to the consolidated financial statements included in this report.
|
|
(3)
|
The Consolidated Statement of Income for the year ended December 31, 2009 includes a $343.2 million charge related to the settlement of a lawsuit between Skype, Joltid and entities controlled by Joltid’s founders and a $1.4 billion gain on the sale of Skype. See “Note 4 - Skype Related Transactions” to the consolidated financial statements included in this report.
|
|
(4)
|
The Consolidated Statement of Income for the year ended December 31, 2007 includes a goodwill impairment charge of $1.4 billion related to Skype.
|
|
(5)
|
Working capital is calculated as the difference between total current assets and total current liabilities.
|
52
|
ITEM 7:
|
MANAGEMENT'S DISCUSSION AND ANALYSIS OF FINANCIAL CONDITION AND RESULTS OF OPERATIONS
|
FORWARD-LOOKING STATEMENTS
This Annual Report on Form 10-K contains forward-looking statements within the meaning of Section 27A of the Securities Act of 1933 and Section 21E of the Securities Exchange Act of 1934, including statements that involve expectations, plans or intentions (such as those relating to future business, future results of operations or financial condition, new or planned features or services, or management strategies). You can identify these forward-looking statements by words such as “may,” “will,” “would,” “should,” “could,” “expect,” “anticipate,” “believe,” “estimate,” “intend,” “plan” and other similar expressions. These forward-looking statements involve risks and uncertainties that could cause our actual results to differ materially from those expressed or implied in our forward-looking statements. Such risks and uncertainties include, among others, those discussed in “Item 1A: Risk Factors” of this Annual Report on Form 10-K, as well as in our consolidated financial statements, related notes, and the other information appearing elsewhere in this report and our other filings with the SEC. We do not intend, and undertake no obligation, to update any of our forward-looking statements after the date of this report to reflect actual results or future events or circumstances. Given these risks and uncertainties, readers are cautioned not to place undue reliance on such forward-looking statements.
You should read the following Management's Discussion and Analysis of Financial Condition and Results of Operations in conjunction with the consolidated financial statements and the related notes included in this report.
Overview
eBay is a global commerce platform and payments leader. We enable commerce through eBay, the world's largest online marketplace, which allows users to buy and sell in nearly every country on earth; through PayPal, which enables individuals and businesses to securely, easily and quickly send and receive online payments; and through GSI, which facilitates ecommerce, multichannel retailing and interactive marketing for global enterprises. X.commerce brings together the technology assets and developer communities of eBay, PayPal and Magento, an ecommerce storefront platform, to support eBay Inc.'s mission of enabling commerce. We also reach millions through specialized marketplaces such as StubHub, the world's largest ticket marketplace, and eBay classifieds sites, which together have a presence in more than 1,000 cities around the world.
We have three reportable business segments: Marketplaces, Payments and GSI. Our Marketplaces segment includes our eBay.com platform and its localized counterparts and our other online trading platforms, such as our online classifieds businesses and StubHub. Our Payments segment is comprised of PayPal, Bill Me Later and Zong. Our GSI segment was added upon the completion of our acquisition of GSI Commerce, Inc. (GSI) on June 17, 2011. The results of our new GSI segment have been included in our consolidated results of operations from the acquisition date.
In 2011, net revenues increased
27%
to
$11.7 billion
compared to
$9.2 billion
in 2010, driven primarily by a
29%
increase in PayPal net total payment volume (TPV) and a
13%
increase in Marketplaces gross merchandise volume, or GMV, excluding vehicles, as well as the impact from GSI, which we acquired in June 2011. We achieved an operating margin of
20%
in 2011 compared to
22%
in 2010. This reduction in operating margin was driven primarily by the impact of acquisitions. Our diluted earnings per share increased to
$2.46
in 2011, a
$1.10
increase compared to 2010, driven primarily by a gain resulting from the sale of our remaining 30% interest in Skype and growth in net revenue, partially offset by the impact of a loss on a divested business, acquisitions and a higher tax rate. We generated cash flow from operations of approximately
$3.3 billion
in 2011 compared to
$2.7 billion
in 2010.
Our Marketplaces segment total net revenues increased $921.1 million, or 16%, in 2011 compared to 2010. The increase in total net revenues was driven primarily by a year-over-year increase in GMV excluding vehicles of 13%, the acquisition of brands4friends in the first quarter of 2011 and an increase in revenue attributable to our classifieds and advertising businesses. Marketplaces segment operating margin decreased 0.7 percentage points in 2011 compared to 2010 due to the impact of acquisitions, primarily brands4friends. Our payments segment total net revenues increased $976.5 million, or 28%, in 2011 compared to 2010. The increase in total net revenues was driven primarily by a year-over-year increase in net TPV of 29%, growth in Bill Me Later revenue and the impact of acquisitions. Our Payments segment operating margin increased 1.2 percentage points in 2011 compared to 2010 due primarily to productivity gains, improvement in Bill Me Later's operating performance and favorable impact of regulatory changes, partially offset by higher transactions losses and investments in our platform. Our GSI segment was formed as a result of our acquisition of GSI in June 2011. From the acquisition date through December 31, 2011, GSI contributed $590.1 million in revenue and had a segment operating margin of 14%.
In 2010, net revenues increased 5% to $9.2 billion compared to $8.7 billion in 2009. Excluding 2009 revenue from Skype (sold in November 2009) of $620.4 million, net revenues would have increased 13%, from $8.1 billion in 2009 to $9.2 billion in 2010. These increases were driven by net revenue growth of 23% and 8% in our Payments and Marketplaces businesses, respectively. We achieved an operating margin of 22% in 2010 compared to 17% in 2009, driven primarily by the impact of a Skype-related legal settlement charge in 2009 and lower amortization costs associated with our acquired intangible assets. Diluted earnings per share decreased to $1.36 in 2010 compared to $1.83 in 2009 driven primarily by the gain on sale of Skype, partially offset by the impact of a Skype-related legal settlement charge in 2009. Cash flow from operations decreased to $2.7 billion in 2010 from $2.9 billion in 2009.
Some key operating metrics that members of our senior management regularly review to evaluate our financial results include net promoter score (NPS), market share, GMV, GMV excluding vehicles, number of sold items, net TPV, net number of payments, global ecommerce (GeC) merchandise sales, penetration rates, funding mix (the mix of payments vehicles such as credit cards, debit cards, bank accounts and PayPal accounts, used by customers to make payments through our Payments networks), free cash flow (which we define as net cash provided by operating activities less purchases of property and equipment, net) and revenue excluding acquisitions and foreign currency impact.
Outlook
We expect our Payments business to continue its strong performance from expanded merchant coverage and share of checkout. In addition, we expect solid performance from our Marketplaces business in its core markets with continued investment in its platform and new products. Finally, we expect strong performance from our GSI business driven by operational improvements and the realization of synergies.
Results of Operations
Summary of Net Revenues
We generate two types of net revenues: net transaction revenues and marketing services and other revenues. Our net transaction revenues are derived principally from listing fees and final value fees (which are fees payable on transactions completed on our Marketplaces trading platforms), fees paid by merchants for payment processing services and ecommerce service fees. Our marketing services revenues are derived principally from the sale of advertisements, revenue sharing arrangements, classifieds fees, marketing service fees and lead referral fees. Other revenues are derived principally from interest and fees earned on the Bill Me Later portfolio of receivables from loans, interest earned on certain PayPal customer account balances and fees from contractual arrangements with third parties that provide services to our users.
54
The following table sets forth the breakdown of net revenues by type and geography for the periods presented.
|
|
Year Ended December 31,
|
Percent Change from
|
Percent Change from
|
||||||||||||||
|
|
2011
|
2010
|
2009
(1)
|
2010 to 2011
|
2009 to 2010
|
||||||||||||
|
|
(In thousands, except percentage changes)
|
||||||||||||||||
|
Net Revenues by Type:
|
|
|
|
||||||||||||||
|
Net transaction revenues
|
|
|
|
||||||||||||||
|
Marketplaces
|
$
|
5,431,308
|
|
$
|
4,800,193
|
|
$
|
4,461,845
|
|
13
|
%
|
8
|
%
|
||||
|
Payments
|
4,123,302
|
|
3,261,314
|
|
2,641,194
|
|
26
|
%
|
23
|
%
|
|||||||
|
GSI
|
459,659
|
|
—
|
|
—
|
|
N/A
|
|
N/A
|
|
|||||||
|
Communications
|
—
|
|
—
|
|
575,096
|
|
N/A
|
|
N/A
|
|
|||||||
|
Total net transaction revenues
|
10,014,269
|
|
8,061,507
|
|
7,678,135
|
|
24
|
%
|
5
|
%
|
|||||||
|
Marketing services and other revenues
|
|
|
|
||||||||||||||
|
Marketplaces
|
1,210,462
|
|
920,434
|
|
849,169
|
|
32
|
%
|
8
|
%
|
|||||||
|
Payments
|
288,833
|
|
174,333
|
|
154,751
|
|
66
|
%
|
13
|
%
|
|||||||
|
GSI
|
130,405
|
|
—
|
|
—
|
|
N/A
|
|
N/A
|
|
|||||||
|
Communications
|
—
|
|
—
|
|
45,307
|
|
N/A
|
|
N/A
|
|
|||||||
|
Corporate and other
(2)
|
7,685
|
|
—
|
|
—
|
|
N/A
|
|
N/A
|
|
|||||||
|
Total marketing services and other revenues
|
1,637,385
|
|
1,094,767
|
|
1,049,227
|
|
50
|
%
|
4
|
%
|
|||||||
|
Total net revenues
|
$
|
11,651,654
|
|
$
|
9,156,274
|
|
$
|
8,727,362
|
|
27
|
%
|
5
|
%
|
||||
|
Net Revenues by Geography:
|
|
|
|
||||||||||||||
|
U.S.
|
$
|
5,483,641
|
|
$
|
4,214,215
|
|
$
|
3,985,068
|
|
30
|
%
|
6
|
%
|
||||
|
International
|
6,168,013
|
|
4,942,059
|
|
4,742,294
|
|
25
|
%
|
4
|
%
|
|||||||
|
Total net revenues
|
$
|
11,651,654
|
|
$
|
9,156,274
|
|
$
|
8,727,362
|
|
27
|
%
|
5
|
%
|
||||
(1) Includes Communications segment revenue generated by Skype until its sale on November 19, 2009.
(2) Represents revenues associated with our X.commerce initiative, which was launched in conjunction with our acquisition of Magento in the third quarter of 2011.
Revenues are attributed to U.S. and international geographies based primarily upon the country in which the seller, payment recipient, customer, website that displays advertising, or other service provider, or until the sale of Skype on November 19, 2009, the Skype user's Internet protocol address, as the case may be, is located.
Because we generated the majority of our net revenues internationally in recent periods, including the
years ended December 31, 2011, 2010 and 2009, we are subject to the risks of doing business in foreign countries as discussed under “Item 1A: Risk Factors.” In that regard, fluctuations in foreign currency exchange rates impact our results of operations. We have a foreign exchange risk management program that is designed to reduce our exposure to fluctuations in foreign currencies; however, the effectiveness of this program in mitigating the impact of foreign currency fluctuations on our results of operations varies from period to period, and in any given period, our operating results are usually affected, sometimes significantly, by changes in currency exchange rates. Fluctuations in exchange rates also directly affect our cross-border revenue. We calculate the year-over-year impact of foreign currency movements on our business using prior period foreign currency rates applied to current year transactional currency amounts.
For the year ended
December 31, 2011
, foreign currency movements relative to the U.S. dollar
positively
impacted net revenues by approximately
$202.4 million
(net of a
$25.9 million
negative impact from hedging activities relating to PayPal's net revenue) compared to the prior year. Foreign currency movements relative to the U.S. dollar for the year ended
December 31, 2011
,
positively
impacted Marketplaces and Payments net revenues by approximately
$166.6 million
and
$35.6 million
, respectively, compared to the prior year (net of the impact of hedging activities, noted above, in the case of Payments net revenues).
For the year ended
December 31, 2010
, foreign currency movements relative to the U.S. dollar negatively impacted net revenues by approximately
$9.6 million
(net of
$11.1 million
positive impact from hedging activities relating to PayPal's net revenue) compared to the prior year. Foreign currency movements relative to the U.S. dollar for the year ended
December 31, 2010
, negatively impacted Marketplaces and Payments net revenues by approximately
$7.1 million
and
$2.5 million
, respectively, compared to the prior year (net of the impact of hedging activities, noted above, in the case of Payments net
55
revenues).
The following table sets forth, for the periods presented, certain key operating metrics that we believe are significant factors affecting our net revenues.
|
|
Year Ended December 31,
|
Percent Change from
|
Percent Change from
|
||||||||||||||
|
|
2011
|
2010
|
2009
|
2010 to 2011
|
2009 to 2010
|
||||||||||||
|
|
(In millions, except percentage changes)
|
||||||||||||||||
|
Supplemental Operating Data:
|
|
|
|
|
|||||||||||||
|
Marketplaces Segment:
(1)
|
|
|
|
|
|
||||||||||||
|
GMV excluding vehicles
(2)
|
$
|
60,332
|
|
$
|
53,532
|
|
$
|
48,346
|
|
13
|
%
|
11
|
%
|
||||
|
GMV vehicles only
(3)
|
8,301
|
|
8,287
|
|
8,860
|
|
—
|
%
|
(6
|
)%
|
|||||||
|
Total GMV
(4)
|
$
|
68,633
|
|
$
|
61,819
|
|
$
|
57,206
|
|
11
|
%
|
8
|
%
|
||||
|
Payments Segment:
|
|||||||||||||||||
|
Net TPV
(5)
|
$
|
118,758
|
|
$
|
91,956
|
|
$
|
71,607
|
|
29
|
%
|
28
|
%
|
||||
|
GSI Segment:
|
|||||||||||||||||
|
GeC merchandise sales
(6)
|
$
|
2,046
|
|
$
|
—
|
|
$
|
—
|
|
N/A
|
|
N/A
|
|
||||
|
(1)
|
eBay's classifieds websites and Shopping.com are not included in these metrics.
|
|
(2)
|
Total value of all successfully closed items between users on eBay Marketplaces trading platforms during the period, regardless of whether the buyer and seller actually consummated the transaction, excluding vehicles GMV.
|
|
(3)
|
Total value of all successfully closed vehicle transactions between users on eBay Marketplaces trading platforms during the period, regardless of whether the buyer and seller actually consummated the transaction.
|
|
(4)
|
Total value of all successfully closed items between users on eBay Marketplaces trading platforms during the period, regardless of whether the buyer and seller actually consummated the transaction.
|
|
(5)
|
Total dollar volume of payments, net of payment reversals, successfully completed through our Payments networks (excluding PayPal's payment gateway business), Zong, and on Bill Me Later accounts during the period.
|
|
(6)
|
Represents the retail value of all sales transactions, inclusive of freight charges and net of allowance for returns and discounts, which flow through the GSI ecommerce services platform, whether we record the full amount of such transaction as a product sale or a percentage of such transaction as a service fee.
|
Seasonality
The following table sets forth, for the periods presented, our total net revenues and the sequential quarterly movements of these net revenues:
|
|
Quarter Ended
|
||||||||||||||
|
|
March 31
|
June 30
|
September 30
|
December 31
|
|||||||||||
|
|
(In thousands, except percentage changes)
|
||||||||||||||
|
2009
(1)
|
|
|
|
|
|
|
|
|
|||||||
|
Net revenues
|
$
|
2,020,586
|
|
$
|
2,097,992
|
|
$
|
2,237,852
|
|
$
|
2,370,932
|
|
|||
|
Percent change from prior quarter
|
(1
|
)%
|
4
|
%
|
7
|
%
|
6
|
%
|
|||||||
|
2010
(1)
|
|
|
|
|
|
|
|
|
|||||||
|
Net revenues
|
$
|
2,196,057
|
|
$
|
2,215,379
|
|
$
|
2,249,488
|
|
$
|
2,495,350
|
|
|||
|
Percent change from prior quarter
|
(7
|
)%
|
1
|
%
|
2
|
%
|
11
|
%
|
|||||||
|
2011
(1)(2)
|
|||||||||||||||
|
Net revenues
|
$
|
2,545,609
|
|
$
|
2,760,274
|
|
$
|
2,965,761
|
|
$
|
3,380,010
|
|
|||
|
Percent change from prior quarter
|
2
|
%
|
8
|
%
|
7
|
%
|
14
|
%
|
|||||||
|
(1)
|
On November 19, 2009, we completed the sale of a 70% equity interest in Skype to an investor group. Accordingly, Skype's revenue is not consolidated in our 2011 and 2010 results. However, Skype's results of operations are consolidated in our 2009 results through the date of that sale.
|
(2) Net revenues attributable to the GSI segment are reflected beginning from June 17, 2011 (the date the acquisition of GSI was completed).
56
We expect transaction activity patterns on our websites to mirror general consumer buying patterns. Our GSI segment is highly seasonal. The fourth calendar quarter typically accounts for a disproportionate amount of GSI's total annual revenue because consumers increase their purchases and businesses increase their advertising to consumers during the fourth quarter holiday season.
Marketplaces Net Transaction Revenues
Marketplaces net transaction revenues increased
$631.1 million
, or
13%
, in
2011
compared to
2010
, consistent with the increase in GMV excluding vehicles of
13%
in
2011
compared to
2010
. The increase in net transaction revenue and GMV excluding vehicles was due primarily to improvements in the shopping experience, foreign currency movements relative to the U.S. dollar and continued growth at StubHub. Net transaction revenues and GMV excluding vehicles increased in the U.S., Europe and Asia in 2011 compared to 2010.
Marketplaces net transaction revenues increased
$338.3 million
, or
8%
, in
2010
compared to
2009
, while GMV excluding vehicles increased
11%
in
2010
compared to
2009
. The increase in net transaction revenues was due primarily to the growth in the number of sold items, inclusion of a full year of revenue generated from Gmarket (acquired June 2009) and growth at StubHub, partially offset by the impact of pricing initiatives, including larger discounts to our highest-rated sellers, the settlement of a lawsuit and the establishment of a reserve related to certain indirect tax positions (all recorded as a reduction in revenue).
Marketplaces net transaction revenues earned internationally totaled
$3.1 billion
,
$2.7 billion
and
$2.4 billion
in
2011
,
2010
and
2009
, representing
56%
,
56%
and
55%
of total Marketplaces net transaction revenues, respectively. The increase in the dollar amount of international net transaction revenues was due primarily to growth in our existing international markets and foreign currency movements relative to the U.S. dollar.
Payments Net Transaction Revenues
Payments net transaction revenues increased
$862.0 million
, or
26%
, during
2011
compared to
2010
, due primarily to net TPV growth of
29%
. The increase in net TPV was due primarily to growth in consumer and merchant adoption of PayPal. Our Merchant Services net TPV increased
36%
during
2011
, compared to
2010
, and represented
65%
of PayPal's net TPV in
2011
, compared with
62%
in
2010
. The increase in our Merchant Services net TPV was due primarily to an increase in the number of online merchants offering PayPal as a payment option.
Payments net transaction revenues increased
$620.1 million
, or
23%
, in
2010
compared to
2009
. The increase was due primarily to net TPV growth of
28%
in
2010
compared to
2009
, partially offset by lower take rates due primarily to a shift to larger merchants in our Merchant Services business. The increase in net TPV during
2010
was due primarily to growth in consumer and merchant adoption of PayPal. Our Merchant Services net TPV experienced
42%
growth in
2010
compared to 2009 and represented
62%
of PayPal's net TPV in 2010 compared to 56% in 2009. The increase in our Merchant Services business was due primarily to an increase in the number of online merchants offering PayPal as a payment option, as well as an increase in the share of checkout of PayPal's existing customer base of merchants.
Payments net transaction revenues earned internationally totaled
$2.2 billion
,
$1.6 billion
and
$1.2 billion
in
2011
,
2010
and
2009
, representing
53%
,
49%
and
46%
of total Payments net transaction revenues, respectively. The increase in international net transaction revenues was due primarily to the growth of our Merchant Services business and increased penetration on eBay Marketplaces platforms internationally, as well as foreign currency movements relative to the U.S. dollar.
GSI Net Transaction Revenues
GSI net transaction revenues were
$459.7 million
in
2011
, which represents the revenues generated from ecommerce services from our recently acquired GSI business for the period from June 17, 2011 (the date the acquisition of GSI was completed) through
December 31, 2011
.
Communications Net Transaction Revenues
On November 19, 2009, we completed the sale of a 70% equity interest in Skype to an investor group. Accordingly, Skype's revenue is not consolidated in our 2011 or 2010 results. However, Skype's results of operations are consolidated in our 2009 results through the date of sale.
57
Marketing Services and Other Revenues
Marketing services and other revenues increased
$542.6 million
, or
50%
, in
2011
compared to
2010
, and represented
14%
and
12%
of total net revenues in
2011
and
2010
, respectively. The increase in marketing services and other revenues was primarily due to the acquisitions of GSI and brands4friends and an increase in revenues attributable to our classifieds business and advertising business, as well as interest earned on our Bill Me Later portfolio of receivables from loans.
Marketing services and other revenues increased
$45.5 million
, or
4%
, in
2010
compared to
2009
, and represented
12%
of total net revenues in both
2010
and
2009
. The increase in marketing services and other revenues was primarily attributable to our advertising and classifieds businesses, partially offset by the exclusion of marketing services and other revenues attributable to Skype.
Summary of Cost of Net Revenues
The following table summarizes changes in cost of net revenues for the periods presented:
|
|
Year Ended December 31,
|
Change from
2010 to 2011 |
Change from
2009 to 2010 |
||||||||||||||||||||||
|
|
2011
|
2010
|
2009
|
in Dollars
|
in %
|
in Dollars
|
in %
|
||||||||||||||||||
|
(In thousands, except percentages)
|
|||||||||||||||||||||||||
|
Cost of net revenues:
|
|||||||||||||||||||||||||
|
Marketplaces
|
$
|
1,209,650
|
|
$
|
1,071,499
|
|
$
|
968,266
|
|
$
|
138,151
|
|
13
|
%
|
$
|
103,233
|
|
11
|
%
|
||||||
|
As a percentage of total Marketplaces net revenues
|
18.2
|
%
|
18.7
|
%
|
18.2
|
%
|
|||||||||||||||||||
|
Payments
|
1,865,493
|
|
1,493,168
|
|
1,220,619
|
|
372,325
|
|
25
|
%
|
272,549
|
|
22
|
%
|
|||||||||||
|
As a percentage of total Payments net revenues
|
42.3
|
%
|
43.5
|
%
|
43.7
|
%
|
|
|
|||||||||||||||||
|
GSI
(1)
|
374,117
|
|
—
|
|
—
|
|
374,117
|
|
N/A
|
|
—
|
|
N/A
|
|
|||||||||||
|
As a percentage of total GSI net revenues
|
63.4
|
%
|
N/A
|
|
N/A
|
|
|||||||||||||||||||
|
Communications
|
—
|
|
—
|
|
290,877
|
|
—
|
|
N/A
|
|
(290,877
|
)
|
N/A
|
|
|||||||||||
|
As a percentage of total Communications net revenues
|
N/A
|
|
N/A
|
|
46.9
|
%
|
|||||||||||||||||||
|
Corporate and other
(2)
|
10,924
|
|
—
|
|
—
|
|
10,924
|
|
N/A
|
|
—
|
|
N/A
|
|
|||||||||||
|
Total cost of net revenues
|
$
|
3,460,184
|
|
$
|
2,564,667
|
|
$
|
2,479,762
|
|
$
|
895,517
|
|
35
|
%
|
$
|
84,905
|
|
3
|
%
|
||||||
|
As a percentage of net revenues
|
29.7
|
%
|
28.0
|
%
|
28.4
|
%
|
|
|
|||||||||||||||||
(1) GSI was acquired in June 2011.
(2) Represents costs associated with our X.commerce initiative, which was launched in conjunction with our acquisition of Magento in the third quarter of 2011.
Cost of Net Revenues
Cost of net revenues consists primarily of costs associated with payment processing, customer support, site operations, fulfillment, inventory and Skype telecommunications (through November 2009). Significant components of these costs include bank transaction fees, credit card interchange and assessment fees, interest expense on indebtedness incurred to finance the purchase of consumer loan receivables related to Bill Me Later accounts, employee compensation, contractor costs, facilities costs, depreciation of equipment and amortization expense.
Marketplaces
Marketplaces cost of net revenues increased
$138.2 million
, or
13%
, in
2011
compared to
2010
. The increase during 2011 was due primarily to the impact of acquiring brands4friends during the first quarter of 2011 and increased customer support costs associated with our GMV growth. Marketplaces cost of net revenues as a percentage of Marketplaces net revenues decreased during 2011 compared to the same period of the prior year due primarily to improved operating leverage in our site operation infrastructure, partially offset by the impact of acquisitions. In addition, Marketplaces cost of net revenues as a percentage of Marketplaces net revenues in 2010 was adversely impacted by the settlement of a lawsuit and the establishment of a reserve related to certain indirect tax positions (recorded as a reduction in revenue).
58
Marketplaces cost of net revenues increased
$103.2 million
, or
11%
, in
2010
compared to
2009
. The increase during
2010
was due primarily to the inclusion of a full year of costs attributable to Gmarket and increased site operation costs. Marketplaces cost of net revenues as a percentage of Marketplaces net revenues increased slightly in
2010
compared to
2009
due primarily to the addition of Gmarket, the settlement of a lawsuit and the establishment of a reserve related to certain indirect tax positions (recorded as a reduction in revenue).
Payments
Payments cost of net revenues increased
$372.3 million
, or
25%
, in
2011
compared to
2010
due primarily to the impact of growth in net TPV. Payments cost of net revenues as a percentage of Payments net revenues decreased during 2011, compared to 2010 due primarily to a lower transaction expense rate. The improvement in our transaction expense rate was driven primarily by the impact of certain regulatory changes, new payment processing arrangements, a favorable mix shift to lower cost international markets and a small improvement in funding mix.
Payments cost of net revenues increased
$272.5 million
, or
22%
, in
2010
compared to
2009
. The increase in cost of net revenues was primarily due to the impact from our growth in net TPV. Payments cost of net revenues as a percentage of Payments net revenues decreased slightly in
2010
compared to
2009
due primarily to improved leverage of our customer support infrastructure and existing site operations.
GSI
GSI cost of net revenues were
$374.1 million
during
2011
, which represents GSI's cost of net revenues for the period from June 17, 2011 (the date the acquisition was completed) through
December 31, 2011
.
Communications
On November 19, 2009, we completed the sale of Skype to an investor group. Accordingly, Skype's cost of net revenue is not consolidated in our 2011 or 2010 results.
Summary of Operating Expenses, Non-Operating Items and Provision for Income Taxes
The following table summarizes changes in operating expenses, non-operating items and provision for income taxes for the periods presented:
|
|
Year Ended December 31,
|
Change from
2010 to 2011 |
Change from
2009 to 2010 |
|||||||||||||||||||||||
|
|
2011
|
2010
|
2009
|
in Dollars
|
in %
|
in Dollars
|
in %
|
|||||||||||||||||||
|
|
(In thousands, except percentage changes)
|
|||||||||||||||||||||||||
|
Sales and marketing
|
$
|
2,435,048
|
|
$
|
1,946,815
|
|
$
|
1,885,677
|
|
$
|
488,233
|
|
25
|
%
|
$
|
61,138
|
|
3
|
%
|
|||||||
|
Product development
|
1,235,171
|
|
908,434
|
|
803,070
|
|
326,737
|
|
36
|
%
|
105,364
|
|
13
|
%
|
||||||||||||
|
General and administrative
|
1,364,221
|
|
1,079,383
|
|
1,418,389
|
|
284,838
|
|
26
|
%
|
(339,006
|
)
|
(24
|
)%
|
||||||||||||
|
Provision for transaction and loan losses
|
516,656
|
|
392,240
|
|
382,825
|
|
124,416
|
|
32
|
%
|
9,415
|
|
2
|
%
|
||||||||||||
|
Amortization of acquired intangible assets
|
267,374
|
|
189,727
|
|
262,686
|
|
77,647
|
|
41
|
%
|
(72,959
|
)
|
(28
|
)%
|
||||||||||||
|
Restructuring
|
(489
|
)
|
21,437
|
|
38,187
|
|
(21,926
|
)
|
(102
|
)%
|
(16,750
|
)
|
(44
|
)%
|
||||||||||||
|
Interest and other, net
|
1,536,557
|
|
44,876
|
|
1,422,385
|
|
1,491,681
|
|
3,324
|
%
|
(1,377,509
|
)
|
(97
|
)%
|
||||||||||||
|
Provision for income taxes
|
(680,659
|
)
|
(297,486
|
)
|
(490,054
|
)
|
(383,173
|
)
|
129
|
%
|
192,568
|
|
(39
|
)%
|
||||||||||||
Sales and Marketing
Sales and marketing expenses consist primarily of advertising costs and marketing programs (both online and offline), employee compensation, contractor costs, facilities costs and depreciation on equipment. Online marketing expenses represent traffic acquisition costs in various channels such as paid search, affiliates marketing and display advertising. Offline advertising includes brand campaigns, buyer/seller communications and general public relations expenses. A significant portion of our sales and marketing expense is attributable to our online marketing programs, primarily paid search, which include keyword advertising and third party lead generation costs, in order to drive traffic to our Marketplaces and Payments websites.
59
Sales and marketing expense increased by
$488.2 million
, or
25%
in
2011
compared to
2010
. The increase in sales and marketing expense was due primarily to higher marketing program costs, employee-related expenses (including consultant costs, facility costs and equipment-related costs) and the impact from acquisitions, primarily GSI.
Sales and marketing expense increased by $61.1 million, or 3% in
2010
compared to
2009
. The increase was due primarily to higher employee-related expenses (including consultant costs, facility costs and equipment-related costs), marketing program costs and costs attributable to Gmarket, partially offset by the exclusion of costs attributable to Skype.
Product Development
Product development expenses consist primarily of employee compensation, contractor costs, facilities costs and depreciation on equipment. Product development expenses are net of required capitalization of major site and other product development efforts, including the development of our next generation platform architecture, migration of certain platforms, seller tools and Payments services projects. Our top technology priorities involve search, catalog, mobile, platform and user experience. Capitalized site and product development costs were
$170.8 million
,
$135.4 million
and
$105.4 million
in
2011
,
2010
and
2009
, respectively, and are primarily reflected as a cost of net revenues when amortized in future periods.
Product development expenses increased by
$326.7 million
, or
36%
, in
2011
compared to
2010
The increase was due primarily to higher employee-related costs (including consultant costs, facility costs and equipment-related costs) driven by increased investment in our top technology priorities and the impact from acquisitions.
Product development expenses increased by $105.4 million, or 13%, in
2010
compared to
2009
. The increase was due primarily to an increase in employee-related and consultant costs driven by increased investment in our top technology priorities and the inclusion of a full fiscal year of costs attributable to Gmarket (acquired June 2009), partially offset by the exclusion of costs attributable to Skype.
General and Administrative
General and administrative expenses consist primarily of employee compensation, contractor costs, facilities costs, depreciation of equipment, employer payroll taxes on employee stock-based compensation, legal expenses, insurance premiums and professional fees. Our legal expenses, including those related to various ongoing legal proceedings, may fluctuate substantially from period to period.
General and administrative expenses increased
$284.8 million
, or
26%
, in
2011
compared to
2010
. The increase was due primarily to an increase in payroll and related expenses and the impact from acquisitions. The increase in 2011 was also due in part to an increase in professional service fees, including those relating to acquisitions.
General and administrative expenses decreased $339.0 million, or 24%, in
2010
compared to
2009
. The decrease was due primarily to a charge of $343.2 million related to the settlement of a lawsuit between Skype, Joltid and entities controlled by Joltid's founders in 2009, exclusion of costs attributable to Skype following the sale and higher costs associated with our acquisition and divestiture activities in fiscal 2009. The decreases were partially offset by higher employee-related and consultant costs as well as a full fiscal year of costs attributable to Gmarket.
Provision for Transaction and Loan Losses
Provision for transaction and loan losses consists primarily of transaction loss expense associated with our customer protection programs, fraud, chargebacks and merchant credit losses; bad debt expense associated with our accounts receivable balance; and loan reserves associated with our loan receivables balance. We expect our provision for transaction and loan loss expense to fluctuate depending on many factors, including macroeconomic conditions, our customer protection programs and the impact of regulatory changes.
Provision for transaction and loan losses increased by
$124.4 million
, or
32%
, in
2011
compared to
2010
. This increase was due primarily to higher transaction volume and higher transaction loss rates, partially offset by improvements in loan loss and bad debt rates. Transaction loss rates increased due primarily to strategic risk management decisions designed to improve the user experience and drive growth as well as the expansion of our protection programs. Our loan loss and bad debt rates declined due to continued improvements in charge-off rates.
Provision for transaction and loan losses increased by $9.4 million, or 2%, in
2010
compared to
2009
. The increase was due primarily to the ongoing roll-out of eBay's buyer protection program and increases in transaction volume, partially offset by improvements in PayPal's transaction loss rate, bad debt rates and loan loss rates. PayPal's transaction loss rate declined due
60
to improvements in fraud loss detection, as well as the substitution of eBay's Buyer Protection Program for PayPal's program, partially offset by the recent launch of PayPal's purchase protection program for Merchant Services transactions. Our bad debt rates declined from improved charge-off rates. Bill Me Later loan loss rates declined due a lower charge-off rate and improved delinquency rates.
Amortization of Acquired Intangible Assets
From time to time we have purchased, and we expect to continue to purchase, assets and businesses. These purchase transactions generally result in the creation of acquired intangible assets with finite lives and lead to a corresponding increase in our amortization expense in periods subsequent to acquisition. We amortize intangible assets over the period of estimated benefit, using the straight-line method and estimated useful lives ranging from one to eight years. Amortization of acquired intangible assets is also impacted by our sales of assets and businesses and timing of acquired intangible assets becoming fully amortized. See “Note 5 - Goodwill and Intangible Assets” to the consolidated financial statements included in this report.
Amortization of acquired intangible assets increased by
$77.6 million
, or
41%
, in
2011
compared to
2010
. The increase in amortization of acquired intangible assets was due to the thirteen acquisitions we completed in 2011, with the acquisition of GSI having the most significant impact of approximately $60.5 million.
Amortization of acquired intangible assets decreased by $73.0 million, or 28%, in
2010
compared to
2009
. The decrease in amortization of acquired intangible assets was due primarily to our sale of Skype and the timing of acquired intangible assets becoming fully amortized, partially offset by amortization of intangibles that resulted from our acquisition of Gmarket.
Restructuring
In 2009, we began the consolidation of certain customer service facilities in North America and Europe to streamline our operations and deliver better and more efficient customer support to our users. We completed these activities during the first quarter of 2011. The consolidation impacted approximately
1,000
employees. In connection with the consolidation, we incurred aggregate restructuring costs of approximately
$47.2 million
, primarily related to employee severance and benefits. During 2011, we recorded a reduction in restructuring costs of $0.5 million as a result of changes to our assumptions associated with sub-leasing our facility. During 2010 and 2009, we incurred restructuring charges of $26.0 and $21.4 million, respectively, in connection with this consolidation. See “Note 11- Restructuring” to the consolidated financial statements included in this report.
Interest and Other, Net
Interest and other, net, consists of interest earned on cash, cash equivalents and investments, as well as foreign exchange transaction gains and losses, our portion of operating results from investments accounted for under the equity method of accounting, investment gain/loss on acquisitions, and interest expense, consisting of interest charges on amounts borrowed and commitment fees on unborrowed amounts under our credit agreement and interest expense on our outstanding commercial paper and debt securities. Interest and other, net excludes interest expense on borrowings incurred to finance Bill Me Later's portfolio of loan receivables, which is included in cost of net revenues (see "Note 20 - Interest and Other, Net" to the consolidated financial statements included in this report for more information).
Interest and other, net, increased
$1.5 billion
in
2011
compared to
2010
. The increase in interest and other, net was due primarily to an investment gain of approximately $1.7 billion associated with the sale of our remaining 30% equity interest in Skype, partially offset by a loss from a divested business of $256.5 million (see "Note 3 - Business Combinations" and "Note 4 - Skype Related Transactions" to the consolidated financial statements included in this report for more information).
Interest and other, net, decreased $1.4 billion, or 97%, in
2010
compared to
2009
. The decrease was due primarily to the gain on the sale of Skype in 2009, partially offset by lower foreign exchange transaction losses, an increase in interest income due primarily to a gain on the repayment in full of the Skype note receivable and senior debt securities and higher average cash, cash equivalents and investment balances in
2010
.
Provision for Income Taxes
Our effective tax rate was
17%
in
2011
compared to
14%
in
2010
. The increase in our effective tax rate during 2011 compared to 2010 was due primarily to an increase in earnings from our operations in higher-tax jurisdictions, primarily the U.S., and U.S. taxes on the sale of our remaining equity interest in Skype.
61
Our effective tax rate was 14% in
2010
compared to 17% in
2009
. The decrease in our effective tax rate for
2010
compared to the prior year was due primarily to the settlement of multiple uncertain tax positions.
Our provision for income taxes differs from the provision computed by applying the U.S. federal statutory rate of 35% due primarily to lower tax rates associated with certain earnings from our operations in certain lower-tax jurisdictions outside the U.S. The impact on our provision for income taxes of foreign income being taxed at rates different than the U.S. federal statutory rate was a benefit of approximately $772.0 million in 2011, net of a $321.5 million charge for U.S. taxes on the sale of Skype, $441.0 million in 2010 and
$476.0 million in 2009
. A significant portion of these benefits, which totaled approximately $696.5 million in 2011, $284.0 million in 2010 and
$300.0 million in 2009
resulted from tax rulings we have received in certain foreign jurisdictions that provide for lower rates of taxation on certain classes of income and require various thresholds of investment and employment in these jurisdictions. The foreign jurisdictions with lower tax rates that had the most significant impact on our provision for income taxes in the periods presented include Singapore, Switzerland, Korea and Luxembourg. See "Note 18 - Income Taxes" to the consolidated financial statements included in this report for more information on our tax rate reconciliation.
Our provision for income taxes is volatile and, in general, is adversely impacted by earnings being lower than anticipated in countries that have lower tax rates and higher than anticipated in countries that have higher tax rates. Our provision for income taxes does not include provisions for U.S. income taxes and foreign withholding taxes associated with the repatriation of a substantial portion of undistributed earnings of certain foreign subsidiaries because we intend to reinvest those earnings indefinitely in our foreign subsidiaries. If these earnings were distributed into the United States in the form of dividends to eBay companies domiciled in the United States or otherwise, or if the shares of the relevant foreign subsidiaries were sold or otherwise transferred, we would be subject to additional U.S. income taxes (subject to an adjustment for foreign tax credits) and foreign withholding taxes. Further, as a result of certain of our ongoing employment and capital investment actions and commitments, our income in certain countries is subject to reduced tax rates and in some cases is wholly exempt from tax. Our failure to meet these commitments could adversely impact our provision for income taxes.
From time to time, we engage in certain intercompany transactions and legal entity restructurings. We consider many factors when evaluating these transactions, including the alignment of our corporate structure with our organizational objectives and the operational and tax efficiency of our corporate structure, as well as the long-term cash flows and cash needs of our different businesses. These transactions may impact our overall tax rate and/or result in additional cash tax payments. The impact in any period may be significant. These transactions may be complex and the impact of such transactions on future periods may be difficult to estimate. In 2009, we completed a legal entity restructuring as a result of which we transferred approximately $1.1 billion in cash to the U.S. The tax impact of this restructuring was included in our 2009 provision for income taxes. As a result of this transaction, we made a cash payment for taxes of approximately $207.4 million during the first quarter of 2010.
We are regularly under examination by tax authorities both domestically and internationally. We believe that adequate amounts have been reserved for any adjustments that may ultimately result from these examinations, although we cannot assure you that this will be the case given the inherent uncertainties in these examinations. Due to the ongoing tax examinations, we believe it is impractical to determine the amount and timing of these adjustments.
Liquidity and Capital Resources
Cash Flows
|
|
Year Ended December 31,
|
||||||||||
|
|
2011
|
2010
|
2009
|
||||||||
|
|
(In thousands)
|
||||||||||
|
Net cash provided by (used in):
|
|
|
|||||||||
|
Operating activities
|
$
|
3,273,674
|
|
$
|
2,745,760
|
|
$
|
2,908,086
|
|
||
|
Investing activities
|
(3,306,862
|
)
|
(2,282,470
|
)
|
(1,149,383
|
)
|
|||||
|
Financing activities
|
(838,496
|
)
|
1,234,406
|
|
(945,656
|
)
|
|||||
|
Effect of exchange rates on cash and cash equivalents
|
(14,626
|
)
|
(120,103
|
)
|
(2,157
|
)
|
|||||
|
Net increase/(decrease) in cash and cash equivalents
|
$
|
(886,310
|
)
|
$
|
1,577,593
|
|
$
|
810,890
|
|
||
Operating Activities
We generated cash from operating activities in amounts greater than net income in
2011
,
2010
and
2009
, due primarily
62
to gains on the sale of Skype and acquisitions and non-cash charges to earnings partially offset by changes in working capital. Non-cash charges to earnings included depreciation and amortization on our long-term assets, stock-based compensation, loss on a divestiture of a business and the provision for transaction and loan losses. The increase in cash provided by operating activities in 2011 compared to 2010 was due primarily to a decrease in cash paid for taxes in 2011. Cash paid for taxes in
2010
included a cash payment for taxes of approximately $207.4 million related primarily to a legal entity restructuring completed in the fourth quarter 2009.
The decrease in cash provided by operating activities in
2010
compared to
2009
was due primarily to an increase in cash paid for taxes of $303.6 million related primarily to a legal entity restructuring completed in the fourth quarter of 2009 and the settlement of uncertain tax positions in the fourth quarter of 2010.
Cash paid for income taxes in
2011
,
2010
and
2009
was
$372.5 million
,
$645.8 million
and
$342.2 million
, respectively.
Investing Activities
The net cash used in investing activities of
$3.3 billion
in
2011
was due primarily to net cash paid for acquisition of businesses of
$3.2 billion
, purchases of investments of
$2.3 billion
, purchases of property and equipment, net, of
$963.5 million
and the purchase of consumer loan receivables (net of collections) originated through our Bill Me Later merchant network of
$586.5 million
, partially offset by proceeds of
$2.3 billion
related to the sale of our remaining 30 percent interest in Skype and $1.6 billion from maturities and sales of investments.
The net cash used in investing activities of $2.3 billion in
2010
was due primarily to cash paid for purchases of investments of $2.6 billion, purchases of property and equipment, net, of $723.9 million and the purchase of consumer loan receivables (net of collections) originated through our Bill Me Later merchant network of $379.7 million, partially offset by proceeds of $1.4 billion from maturities and sales of investments.
Financing Activities
The net cash used in financing activities of
$838.5 million
in
2011
was due primarily to
$1.1 billion
in cash paid to repurchase our common stock and
$147.1 million
in cash paid for tax withholdings related to net share settlements of restricted stock units and nonvested share awards, partially offset by proceeds from net borrowings under the commercial paper program of
$250.0 million
,
$242.2 million
from the issuance of common stock in connection with the exercise of stock options and our employee stock purchase plan and
$79.7 million
in excess tax benefits from stock-based compensation.
The net cash provided by financing activities of $1.2 billion in
2010
was due primarily to cash proceeds from our sale of $1.5 billion of senior unsecured debt securities in October 2010 and $300.0 million of net borrowings under a commercial paper program that we implemented in November 2010, $235.5 million in proceeds from the issuance of common stock upon the exercise of stock options, and $41.9 million of excess tax benefits from stock-based compensation. These proceeds were partially offset by cash outflows of $711.1 million to repurchase our common stock and $120.6 million paid for tax withholdings related to the net share settlements of restricted stock awards and units.
The negative effect of currency exchange rates on cash and cash equivalents during
2011
,
2010
and
2009
was due to the strengthening of the U.S. dollar against certain foreign currencies, primarily the Euro.
Stock Repurchases
In September 2010, our Board authorized a stock repurchase program that provides for the repurchase of up to
$2.0 billion
of our common stock, with no expiration from the date of authorization, for the purpose of offsetting the impact of dilution from our equity compensation programs. During 2011, we repurchased approximately
$1.1 billion
of our common stock under this stock repurchase program. As of
December 31, 2011
, approximately
$880.5 million
remained for further repurchases of our common stock under this stock repurchase program.
Our stock repurchase programs may be limited or terminated at any time without prior notice. Stock repurchases under these programs may be made through a variety of open market and privately negotiated transactions, including structured stock repurchase transactions or other derivative transactions, at times and in such amounts as management deems appropriate and may be funded from our working capital or other financing alternatives. The timing and actual number of shares repurchased will depend on a variety of factors including corporate and regulatory requirements, price and other market conditions and management's determination as to the appropriate use of our cash. The programs are intended to comply with the volume, timing and other limitations set forth in Rule 10b-18 under the Securities Exchange Act of 1934.
63
Shelf Registration Statement
At
December 31, 2011
, we had an effective shelf registration statement on file with the Securities and Exchange Commission that allows us to issue various types of debt securities, such as fixed or floating rate notes, U.S. dollar or foreign currency denominated notes, redeemable notes, global notes, and dual currency or other indexed notes. Issuances under the shelf registration will require the filing of a prospectus supplement identifying the amount and terms of the securities to be issued. The registration statement does not limit the amount of debt securities that may be issued thereunder. Our ability to issue debt securities is subject to market conditions and other factors impacting our borrowing capacity, including our credit ratings.
In October 2010, we issued $1.5 billion aggregate principal amount of our senior unsecured debt securities under a prior shelf registration statement in an underwritten public offering. These debt securities remain outstanding and consist of $400 million aggregate principal amount of 0.875% notes due 2013, $600 million aggregate principal amount of 1.625% notes due 2015 and $500 million aggregate principal amount of 3.250% notes due 2020. The indenture pursuant to which the notes were issued includes customary covenants that, among other things, limit our ability to incur, assume or guarantee debt secured by liens on specified assets or enter into sale and lease-back transactions with respect to specified properties, and also includes customary events of default. As of December 31, 2011, we were in compliance with the covenants in the indenture.
Commercial Paper
We have a
$2.0 billion
commercial paper program pursuant to which we may issue commercial paper notes with maturities of up to
397
days from the date of issue in an aggregate principal amount of up to $2.0 billion at any time outstanding. As of
December 31, 2011
,
$550.0 million
aggregate principal amount of commercial paper was outstanding, the weighted average interest rate on those notes was
0.16%
per annum and the weighted average remaining term on those notes was
40
days.
Credit Agreement
On November 22, 2011, we entered into a credit agreement that provides for an unsecured
$3.0 billion
five-year revolving credit facility that includes a $300.0 million letter of credit sub-facility and a $100.0 million swingline sub-facility, with available borrowings under the revolving credit facility reduced by the amount of any letters of credit and swingline borrowings outstanding from time to time. We may also, subject to the agreement of the applicable lenders, increase the commitments under the revolving credit facility by up to $1.0 billion. Funds borrowed under the credit agreement may be used for working capital, capital expenditures, acquisitions and other general corporate purposes. The credit agreement replaced our prior
$1.8 billion
unsecured revolving credit agreement, dated November 7, 2006.
As of
December 31, 2011
, no borrowings or letters of credit were outstanding under our $3.0 billion credit agreement. However, as described above, we have a $2.0 billion commercial paper program and we maintain
$2.0 billion
of available borrowing capacity under our credit agreement in order to repay commercial paper borrowings in the event we are unable to repay those borrowings from other sources when they become due. Accordingly, at
December 31, 2011
,
$1.0 billion
of borrowing capacity was available for other purposes permitted by the credit agreement.
Loans under the credit agreement bear interest at either (i) the London Interbank Offered Rate (LIBOR) plus a margin (based on our public debt ratings) ranging from 0.625 percent to 1.125 percent or (ii) a formula based on the agent bank's prime rate, the federal funds effective rate or LIBOR plus a margin (based on our public debt ratings) ranging from zero percent to 0.125 percent. The credit agreement will terminate and all amounts owing thereunder will be due and payable on November 22, 2016, unless (a) the commitments are terminated earlier, either at our request or, if an event of default occurs, by the lenders (or automatically in the case of certain bankruptcy-related events of default), or (b) the maturity date is extended upon our request, subject to the agreement of the lenders. The credit agreement contains customary representations, warranties, affirmative and negative covenants, including a financial covenant, events of default and indemnification provisions in favor of the banks. The negative covenants include restrictions regarding the incurrence of liens, subject to certain exceptions. The financial covenant requires us to meet a quarterly financial test with respect to a minimum consolidated interest coverage ratio.
As of
December 31, 2011
, we were in compliance with the financial covenants in the credit agreement.
Notes Payable and Capital Lease Obligations
In addition to the debt described above, as of December 31, 2011, we had notes payable of
$16.7 million
and capital lease obligations of
$14.9 million
that were assumed as part of our GSI acquisition.
64
Commitments and Contingencies
As of
December 31, 2011
, approximately
$9.6 billion
of unused credit was available to Bill Me Later accountholders. The individual lines of credit that make up this unused credit are subject to periodic review and termination by the chartered financial institution that is the issuer of Bill Me Later credit products based on, among other things, account usage and customer creditworthiness. When a consumer makes a purchase using a Bill Me Later credit product the chartered financial institution extends credit to the consumer, funds the extension of credit at the point of sale and advances funds to the merchant. We subsequently purchase the receivables related to the consumer loans extended by the chartered financial institution and, as a result of the purchase, bear the risk of loss in the event of loan defaults. Although the chartered financial institution continues to own each customer account, we own the related receivable, and Bill Me Later is responsible for all servicing functions related to the account.
We have certain fixed contractual obligations and commitments that include future estimated payments for general operating purposes. Changes in our business needs, contractual cancellation provisions, fluctuating interest rates, and other factors may result in actual payments differing from the estimates. We cannot provide certainty regarding the timing and amounts of these payments. The following table summarizes our fixed contractual obligations and commitments (in thousands):
|
Payments Due During the Year Ending December 31,
|
Debt
|
Leases
|
Purchase Obligations
|
|
Total
|
|||||||||||
|
2012
|
$
|
588,222
|
|
$
|
94,853
|
|
$
|
209,469
|
|
$
|
892,544
|
|
||||
|
2013
|
443,370
|
|
66,771
|
|
67,523
|
|
577,664
|
|
||||||||
|
2014
|
42,786
|
|
49,820
|
|
63,384
|
|
155,990
|
|
||||||||
|
2015
|
626,484
|
|
37,587
|
|
61,152
|
|
725,223
|
|
||||||||
|
2016
|
16,261
|
|
23,730
|
|
54,652
|
|
94,643
|
|
||||||||
|
Thereafter
|
565,000
|
|
38,693
|
|
—
|
|
603,693
|
|
||||||||
|
$
|
2,282,123
|
|
$
|
311,454
|
|
$
|
456,180
|
|
$
|
3,049,757
|
|
|||||
The significant assumptions used in our determination of amounts presented in the above table are as follows:
|
•
|
Debt amounts include the principal and interest amounts of the respective debt instruments. For additional details related to our debt, please see “Note 12 – Debt” to the consolidated financial statements included in this report.
|
|
•
|
Lease amounts include minimum rental payments under our non-cancelable operating leases for office facilities, fulfillment centers, as well as computer and office equipment that we utilize under lease arrangements. The amounts presented are consistent with contractual terms and are not expected to differ significantly from actual results under our existing leases, unless a substantial change in our headcount needs requires us to expand our occupied space or exit an office facility early.
|
|
•
|
Purchase obligation amounts include minimum purchase commitments for advertising, capital expenditures (computer equipment, software applications, engineering development services, construction contracts) and other goods and services entered into in the ordinary course of business.
|
As we are unable to reasonably predict the timing of settlement of liabilities related to unrecognized tax benefits, net, the table does not include $368.9 million of such non-current liabilities included in deferred and other tax liabilities recorded on our consolidated balance sheet as of
December 31, 2011
.
Liquidity and Capital Resource Requirements
At
December 31, 2011
, we had assets classified as cash and cash equivalents, as well as time deposits and fixed income securities classified as short-term investments, in an aggregate amount of
$7.5 billion
, compared to
$7.8 billion
at
December 31, 2010
. At
December 31, 2011
, this amount included assets held in certain of our foreign operations totaling approximately
$6.6 billion
. If these assets were distributed to the U.S., we may be subject to additional U.S. taxes in certain circumstances. We actively monitor the third-party depository institutions and money market funds that hold these assets, primarily focusing on the safety of principal and secondarily maximizing yield on these assets. We diversify our cash and cash equivalents and investments among various financial institutions and money market funds in order to reduce our exposure should any one of these financial institutions or money market funds fail or encounter difficulties. To date, we have not experienced any material loss or lack of access to our invested cash, cash equivalents or short-term investments; however, we can provide no assurances that access to our invested cash, cash equivalents or short-term investments will not be impacted by adverse conditions in the financial markets. At any point in time we have funds in our operating accounts and customer
65
accounts that are deposited with third party financial institutions. These balances in the U.S. may exceed the Federal Deposit Insurance Corporation (FDIC) insurance limits. While we monitor the cash balances in our operating accounts, these cash balances could be adversely impacted if the underlying financial institutions fail and could be subject to other adverse conditions in the financial markets.
To the extent that our Bill Me Later products become more widely available through improved and more comprehensive product integrations with eBay, PayPal and other channels, and as we further promote Bill Me Later products, we expect customer adoption and usage of Bill Me Later products to expand. Any resulting growth in the portfolio of Bill Me Later loan receivables would increase our liquidity needs and any failure to meet those liquidity needs could adversely affect the Bill Me Later business. We currently fund the expansion of the Bill Me Later portfolio of loan receivables with borrowings and domestic and international cash resources.
From time to time, we engage in certain intercompany transactions and legal entity restructurings. For example, in 2009, we completed a legal entity restructuring that resulted in a cash payment for taxes of approximately $207.4 million in the first quarter of 2010. We consider many factors when evaluating these transactions, including the alignment of our corporate structure with our organizational objectives and the operational and tax efficiency of our corporate structure, as well as the long-term cash flows and cash needs of our different businesses. These transactions may impact our overall tax rate and/or result in additional cash tax payments. The impact in any period may be significant. These transactions may be complex and the impact of such transactions on future periods may be difficult to estimate.
We believe that our existing cash, cash equivalents and short-term investments, together with cash expected to be generated from operations, borrowings available under our credit agreement and commercial paper program, and our access to capital markets will be sufficient to fund our operating activities, anticipated capital expenditures, Bill Me Later portfolio of loan receivables and stock repurchases for the foreseeable future.
Off-Balance Sheet Arrangements
As of
December 31, 2011
, we had no off-balance sheet arrangements that have, or are reasonably likely to have, a current or future material effect on our consolidated financial condition, results of operations, liquidity, capital expenditures or capital resources.
In Europe, we have two cash pooling arrangements with a financial institution for cash management purposes. These arrangements allow for cash withdrawals from this financial institution based upon our aggregate operating cash balances held in Europe within the same financial institution (Aggregate Cash Deposits) for more efficient cash management and investment purposes. These arrangements also allow us to withdraw amounts exceeding the Aggregate Cash Deposits up to an agreed-upon limit. The net balance of the withdrawals and the Aggregate Cash Deposits are used by the financial institution as a basis for calculating our net interest expense or income. As of
December 31, 2011
, we had a total of
$4.9 billion
in cash withdrawals offsetting our
$4.9 billion
in Aggregate Cash Deposits held within the same financial institution under these cash pooling arrangements.
Based on differences in regulatory requirements and commercial law in the jurisdictions where PayPal operates, PayPal holds customer balances either as direct claims against PayPal or as an agent or custodian on behalf of PayPal's customers. Customer balances held as direct claims against PayPal or as an agent or custodian on behalf of our customers are not reflected in our consolidated balance sheet. These off-balance sheet funds totaled approximately
$2.7 billion
as of
December 31, 2011
and
2010
. These funds include funds held on behalf of U.S. customers that are deposited in bank accounts insured by the FDIC (subject to applicable limits). Additionally, please see the information in "Item 1A: Risk Factors" under the caption "If our Payments business is found to be subject to or in violation of any laws or regulations, including those governing money transmission, electronic funds transfers, money laundering, counter-terrorist financing, sanctions, banking and lending, it could be subject to liability, licensure and regulatory approval and may be forced to change its business practices".
Indemnification Provisions
In the ordinary course of business, we have included limited indemnification provisions in certain of our agreements with parties with which we have commercial relations, including our standard marketing, promotions and application-programming-interface license agreements. Under these contracts, we generally indemnify, hold harmless and agree to reimburse the indemnified party for losses suffered or incurred by the indemnified party in connection with claims by a third party with respect to our domain names, trademarks, logos and other branding elements to the extent that such marks are applicable to our performance under the subject agreement. GSI in many of its major ecommerce agreements has provided an indemnity for
66
other types of third-party claims, which are indemnities mainly related to various intellectual property rights, and we have provided similar indemnities in a limited number of agreements for our other businesses. In our PayPal business, we have provided an indemnity to our payment processors in the event of certain third-party claims or card association fines against the processor arising out of conduct by PayPal or PayPal customers. In connection with the sale of Skype, we made certain customary warranties to the buyer in the purchase agreement. Our liability to the buyer for inaccuracies in these warranties is generally subject to certain limitations. With respect to certain specified litigation matters involving Skype that were pending as of the closing of the transaction, we also agreed, among other things, to bear 50% of the cost of any monetary judgment that is rendered in respect of those matters. It is not possible to determine the maximum potential loss under these indemnification provisions due to our limited history of prior indemnification claims and the unique facts and circumstances involved in each particular provision. To date, losses recorded in our statement of income in connection with our indemnification provisions have not been significant, either individually or collectively.
Critical Accounting Policies, Judgments and Estimates
General
The preparation of our consolidated financial statements and related notes requires us to make judgments, estimates and assumptions that affect the reported amounts of assets, liabilities, revenue and expenses, and related disclosure of contingent assets and liabilities. We have based our estimates on historical experience and on various other assumptions that are believed to be reasonable under the circumstances, the results of which form the basis for making judgments about the carrying values of assets and liabilities that are not readily apparent from other sources. Our senior management has discussed the development, selection and disclosure of these estimates with the Audit Committee of our Board of Directors. Actual results may differ from these estimates under different assumptions or conditions.
An accounting policy is considered to be critical if it requires an accounting estimate to be made based on assumptions about matters that are highly uncertain at the time the estimate is made, and if different estimates that reasonably could have been used, or changes in the accounting estimates that are reasonably likely to occur periodically, could materially impact the consolidated financial statements. We believe the following critical accounting policies reflect the more significant estimates and assumptions used in the preparation of our consolidated financial statements. The following descriptions of critical accounting policies, judgments and estimates should be read in conjunction with our consolidated financial statements and other disclosures included in this report.
Provision for Transaction and Loan Losses
Provision for transaction and loan losses consists primarily of transaction loss expense associated with our customer protection programs, fraud, chargebacks and merchant credit losses; bad debt expense associated with our accounts receivable balance; and loan reserves associated with our loan receivables balance. Our provision for transaction and loan loss expense fluctuates depending on many factors, including macroeconomic conditions, our customer protection programs and the impact of regulatory changes.
The following table illustrates the provision for transaction and loan losses as a percentage of net revenues for
2011
,
2010
and
2009
(in thousands, except percentages):
|
|
Year Ended December 31,
|
||||||||||
|
|
2011
|
|
2010
|
|
2009
|
||||||
|
Net revenues
|
$
|
11,651,654
|
|
|
$
|
9,156,274
|
|
|
$
|
8,727,362
|
|
|
Provision for transaction and loan losses
|
$
|
516,656
|
|
|
$
|
392,240
|
|
|
$
|
382,825
|
|
|
Provision for transaction and loan losses as a % of net revenues
|
4.4
|
%
|
|
4.3
|
%
|
|
4.4
|
%
|
|||
Determining appropriate allowances for these losses is an inherently uncertain process and is subject to numerous estimates and judgments, and ultimate losses may vary from the current estimates. We regularly update our allowance estimates as new facts become known and events occur that may impact the settlement or recovery of losses. The allowances are maintained at a level we deem appropriate to adequately provide for losses incurred at the balance sheet date. An aggregate 50 basis point deviation from our provision for transaction and loan losses as a percentage of net revenues would have resulted in an increase or decrease in operating income of approximately
$58.3 million
in
2011
, resulting in an approximate
$0.04
change in diluted earnings per share.
Legal Contingencies
In connection with certain pending litigation and other claims, we have estimated the range of probable loss, net of
67
expected recoveries, and provided for such losses through charges to our consolidated statement of income. These estimates have been based on our assessment of the facts and circumstances at each balance sheet date and are subject to change based upon new information and future events.
From time to time, we are involved in disputes and regulatory inquiries that arise in the ordinary course of business. We are currently involved in certain legal proceedings as discussed in “Item 1A: Risk Factors,” “Item 3: Legal Proceedings” and “Note 13 - Commitments and Contingencies” to the consolidated financial statements included in this report. We believe that we have meritorious defenses to the claims against us, and we intend to defend ourselves vigorously. However, even if successful, our defense against certain actions will be costly and could require significant amounts of management's time and result in the diversion of significant operational resources. If the plaintiffs were to prevail on certain claims, we might be forced to pay significant damages and licensing fees, modify our business practices or even be prohibited from conducting a significant part of our business. Any such results could materially harm our business and could result in a material adverse impact on the financial position, results of operations or cash flows of any or all of our business segments.
Accounting for Income Taxes
Our annual tax rate is based on our income, statutory tax rates and tax planning opportunities available to us in the various jurisdictions in which we operate. Tax laws are complex and subject to different interpretations by the taxpayer and respective government taxing authorities. Significant judgment is required in determining our tax expense and in evaluating our tax positions, including evaluating uncertainties. We review our tax positions quarterly and adjust the balances as new information becomes available. Our income tax rate is significantly affected by the tax rates that apply to our foreign earnings. In addition to local country tax laws and regulations, our income tax rate depends on the extent that our earnings are indefinitely reinvested outside the U.S. Indefinite reinvestment is determined by management's judgment about and intentions concerning our future operations. At
December 31, 2011
,
$10.0 billion
of earnings had been indefinitely reinvested outside the U.S, primarily in active non-U.S. business operations. We do not intend to repatriate these earnings to fund U.S. operations and, accordingly, we do not provide for U.S. federal income and foreign withholding these on these earnings.
Deferred tax assets represent amounts available to reduce income taxes payable on taxable income in future years. Such assets arise because of temporary differences between the financial reporting and tax bases of assets and liabilities, as well as from net operating loss and tax credit carryforwards. We evaluate the recoverability of these future tax deductions and credits by assessing the adequacy of future expected taxable income from all sources, including reversal of taxable temporary differences, forecasted operating earnings and available tax planning strategies. These sources of income rely heavily on estimates that are based on a number of factors, including our historical experience and short- and long-range business forecasts. At
December 31, 2011
, we had a valuation allowance on certain loss carryforwards based on our assessment that it is more likely than not that the deferred tax asset will not be realized.
We recognize and measure uncertain tax positions in accordance with generally accepted accounting principles in the U.S., or GAAP, pursuant to which we only recognize the tax benefit from an uncertain tax position if it is more likely than not that the tax position will be sustained on examination by the taxing authorities, based on the technical merits of the position. The tax benefits recognized in the financial statements from such positions are then measured based on the largest benefit that has a greater than 50 percent likelihood of being realized upon ultimate settlement. We report a liability for unrecognized tax benefits resulting from uncertain tax positions taken or expected to be taken in a tax return. GAAP further requires that a change in judgment related to the expected ultimate resolution of uncertain tax positions be recognized in earnings in the quarter in which such change occurs. We recognize interest and penalties, if any, related to unrecognized tax benefits in income tax expense.
We file annual income tax returns in multiple taxing jurisdictions around the world. A number of years may elapse before an uncertain tax position is audited and finally resolved. While it is often difficult to predict the final outcome or the timing of resolution of any particular uncertain tax position, we believe that our reserves for income taxes reflect the most likely outcome. We adjust these reserves, as well as the related interest, where appropriate in light of changing facts and circumstances. Settlement of any particular position could require the use of cash.
The following table illustrates our effective tax rates for
2011
,
2010
and
2009
(in thousands, except percentages):
|
|
Year Ended December 31,
|
||||||||||
|
|
2011
|
|
2010
|
|
2009
|
||||||
|
Provision for income taxes
|
$
|
680,659
|
|
|
$
|
297,486
|
|
|
$
|
490,054
|
|
|
As a % of income before income taxes
|
17
|
%
|
|
14
|
%
|
|
17
|
%
|
|||
Our future effective tax rates could be adversely affected by earnings being lower than anticipated in countries where we have lower statutory rates and higher than anticipated in countries where we have higher statutory rates, by changes in the valuations of our deferred tax assets or liabilities, or by changes or interpretations in tax laws, regulations or accounting
68
principles. In addition, we are subject to the continuous examination of our income tax returns by the Internal Revenue Service, as well as various state and foreign tax authorities. We regularly assess the likelihood of adverse outcomes resulting from these examinations to determine the adequacy of our provision for income taxes.
Based on our results for the year ended
December 31, 2011
, a one-percentage point change in our provision for income taxes as a percentage of income before taxes would have resulted in an increase or decrease in the provision of approximately
$39.1 million
, resulting in an approximate
$0.03
change in diluted earnings per share.
Revenue Recognition
We may enter into certain revenue transactions, primarily related to advertising contracts, that are considered multiple element arrangements (arrangements with more than one deliverable). We also may enter into arrangements to purchase goods and/or services from certain customers. As a result, significant interpretation and judgment is sometimes required to determine the appropriate accounting for these transactions including: (1) how the arrangement consideration should be allocated among potential multiple deliverables; (2) developing an estimate of the stand-alone selling price of each deliverable; (3) whether revenue should be reported gross (as eBay is acting as a principal), or net (as eBay is acting as an agent); (4) when we provide cash consideration to our customers, determining whether we are receiving an identifiable benefit that is separable from the customer's purchase of our products and/or services and for which we can reasonably estimate fair value; and (5) whether the arrangement would be characterized as revenue or reimbursement of costs incurred. Changes in judgments with respect to these assumptions and estimates could impact the timing or amount of revenue recognition.
Goodwill and Intangible Assets
The purchase price of an acquired company is allocated between intangible assets and the net tangible assets of the acquired business with the residual of the purchase price recorded as goodwill. The determination of the value of the intangible assets acquired involves certain judgments and estimates. These judgments can include, but are not limited to, the cash flows that an asset is expected to generate in the future and the appropriate weighted average cost of capital.
At
December 31, 2011
, our goodwill totaled
$8.4 billion
and our identifiable intangible assets, net totaled
$1.4 billion
. We assess the impairment of goodwill of our reporting units annually, or more often if events or changes in circumstances indicate that the carrying value may not be recoverable. This assessment is based upon a discounted cash flow analysis and analysis of our market capitalization. The estimate of cash flow is based upon, among other things, certain assumptions about expected future operating performance and an appropriate discount rate determined by our management. Our estimates of discounted cash flows may differ from actual cash flows due to, among other things, economic conditions, changes to our business model or changes in operating performance. Significant differences between these estimates and actual cash flows could materially adversely affect our future financial results. These factors increase the risk of differences between projected and actual performance that could impact future estimates of fair value of all reporting units. We conducted our annual impairment test of goodwill as of August 31, 2011 and 2010. As a result of this test we determined that no adjustment to the carrying value of goodwill for any reporting units was required. See “Note 5 - Goodwill and Intangible Assets” to the consolidated financial statements included in this report. As of
December 31, 2011
, we determined that no events or circumstances from August 31, 2011 through
December 31, 2011
indicated that a further assessment was necessary.
Stock-Based Compensation
We measure and recognize stock-based compensation expense based on the fair value measurement for all share-based payment awards made to our employees and directors, including employee stock options, employee stock purchases and restricted stock awards over the service period for awards expected to vest. Stock-based compensation expense recognized for
2011
,
2010
and
2009
was
$457.2 million
,
$381.5 million
and
$394.8 million
, respectively. See “Note 17 - Stock-Based and Employee Savings Plans” to the consolidated financial statements included in this report.
We calculated the fair value of each restricted stock award based on our stock price on the date of grant. We calculated the fair value of each stock option award on the date of grant using the Black-Scholes option pricing model. The determination of fair value of stock option awards on the date of grant using an option-pricing model is affected by our stock price as well as assumptions regarding a number of additional variables described below. The use of a Black-Scholes model requires extensive actual employee exercise behavior data and a number of assumptions, including expected life, expected volatility, risk-free interest rate and dividend yield. As a result, future stock-based compensation expense may differ from our historical amounts. The weighted-average grant-date fair value of stock options granted during
2011
,
2010
and
2009
was
$9.87
,
$6.77
and
$4.59
per share, respectively, using the Black-Scholes model with the following weighted-average assumptions:
69
|
|
Year Ended December 31,
|
|||||||
|
|
2011
|
|
2010
|
|
2009
|
|||
|
Risk-free interest rate
|
1.2
|
%
|
1.4
|
%
|
1.7
|
%
|
||
|
Expected life (in years)
|
3.8
|
|
3.4
|
|
3.8
|
|
||
|
Dividend yield
|
—
|
%
|
—
|
%
|
—
|
%
|
||
|
Expected volatility
|
38
|
%
|
37
|
%
|
47
|
%
|
||
Our computation of expected volatility for
2011
,
2010
and
2009
was based on a combination of historical and market-based implied volatility from traded options on our stock. Our computation of expected life was determined based on historical experience of similar awards, giving consideration to the contractual terms of the stock-based awards, vesting schedules and expectations of future employee behavior. The interest rate for periods within the contractual life of the award was based on the U.S. Treasury yield curve in effect at the time of grant. The estimation of awards that will ultimately vest requires judgment, and to the extent actual results or updated estimates differ from our current estimates, such amounts will be recorded as a cumulative adjustment in the period estimates are revised. We consider many factors when estimating forfeitures, including employee class and historical experience.
Recent Accounting Pronouncements
See “Note 1 - The Company and Summary of Significant Accounting Policies” to the consolidated financial statements included in this report, regarding the impact of certain recent accounting pronouncements on our consolidated financial statements.
Item 7A: Quantitative and Qualitative Disclosures About Market Risk
Foreign Currency Exposure
We have significant operations internationally that are denominated in foreign currencies, primarily the Euro, British pound, Korean won, Australian dollar and Canadian dollar, subjecting us to foreign currency risk which may adversely impact our financial results. We transact business in various foreign currencies and have significant international revenues as well as costs. In addition, we charge our international subsidiaries for their use of intellectual property and technology and for certain corporate services provided by eBay and by PayPal. Our cash flow, results of operations and certain of our intercompany balances that are exposed to foreign exchange rate fluctuations may differ materially from expectations and we may record significant gains or losses due to foreign currency fluctuations and related hedging activities.
We have a foreign exchange exposure management program that aims to identify material foreign currency exposures, to manage these exposures, and to minimize the potential effects of currency fluctuations on our reported consolidated cash flows and results of operations through the purchase of foreign currency exchange contracts. These foreign currency exchange contracts are accounted for as derivative instruments. For additional details related to our derivative instruments, please see “Note 9 - Derivative Instruments” to the consolidated financial statements included in this report.
Interest Rate Risk
The primary objective of our investment activities is to preserve principal while at the same time maximizing yields without significantly increasing risk. To achieve this objective, we maintain our portfolio of cash equivalents and short-term and long-term investments in a variety of available for sale securities, including money market funds and government and corporate securities. As of
December 31, 2011
, approximately
56%
of our total cash and investment portfolio was held in bank deposits and money market funds. As such, changes in interest rates will impact our interest income. In addition, we regularly issue new commercial paper notes to repay outstanding commercial paper notes as they mature, and those new commercial paper notes bear interest at rates prevailing at the time of issuance. Accordingly, changes in interest rates will impact interest expense or cost of net revenues. As of
December 31, 2011
, we held no direct investments in auction rate securities, collateralized debt obligations, structured investment vehicles or mortgage-backed securities. For additional details related to our investment activities, please see "Note 7 - Investments" to the consolidated financial statements included in this report.
Investments in both fixed-rate and floating-rate interest-earning instruments carry varying degrees of interest rate risk. The fair market value of our fixed-rate securities may be adversely impacted due to a rise in interest rates. In general, securities with longer maturities are subject to greater interest-rate risk than those with shorter maturities. While floating rate securities generally are subject to less interest-rate risk than fixed-rate securities, floating-rate securities may produce less income than expected if interest rates decrease. Due in part to these factors, our investment income may fall short of expectations or we may suffer losses in principal if securities are sold that have declined in market value due to changes in interest rates. As of
70
December 31, 2011
, the balance of our fixed income investments was
$2.7 billion
, which represented approximately
33%
of our total cash and investment portfolio. As of
December 31, 2011
, our fixed income investments earned an average pretax yield of approximately
3%
, with a weighted average maturity of
24
months. If interest rates at the end of the year were 100 basis points higher (lower), the fair market value of our total fixed-income investment portfolio as of
December 31, 2011
could have decreased (increased) by approximately
$30.1 million
.
71
Investment Risk
As of
December 31, 2011
, our cost and equity method investments totaled
$189.9 million
, which represented approximately
2%
of our total cash and investment portfolio and were primarily related to equity method investments in companies. We review our investments for impairment when events and circumstances indicate a decline in fair value of such assets below carrying value is other-than-temporary. Our analysis includes a review of recent operating results and trends, recent sales/acquisitions of the securities in which we have invested and other publicly available data. During 2011, we did not record any material impairment on our cost or equity method investments.
On October 13, 2011, Microsoft Corp. completed its acquisition of Skype and we received approximately
$2.3 billion
in cash for our
30%
interest in Skype, resulting in a pre-tax gain of approximately
$1.7 billion
.
Equity Price Risk
We are exposed to equity price risk on marketable equity instruments due to market volatility. At
December 31, 2011
, the total fair value of our marketable equity instruments was
$646.3 million
, which represented approximately
8%
of our total cash and investment portfolio and was primarily related to our equity holdings in MercadoLibre.
We actively monitor our exposure to the European markets, including the impact of sovereign debt issues associated with Greece, Ireland, Portugal, Italy and Spain. As of December 31, 2011, we do not have any direct or indirect investments in the sovereign debt, corporations, or financial institutions of these countries. We do maintain a small number of operating bank accounts with Spanish and Italian banks that have immaterial balances.
72
|
ITEM 8:
|
FINANCIAL STATEMENTS AND SUPPLEMENTARY DATA
|
The consolidated financial statements and accompanying notes listed in Part IV, Item 15(a)(1) of this Annual Report on Form 10-K are included elsewhere in this Annual Report on Form 10-K.
|
ITEM 9:
|
CHANGES IN AND DISAGREEMENTS WITH ACCOUNTANTS ON ACCOUNTING AND FINANCIAL DISCLOSURE
|
None.
|
ITEM 9A:
|
CONTROLS AND PROCEDURES
|
Evaluation of disclosure controls and procedures.
Based on the evaluation of our disclosure controls and procedures (as defined in the Rules 13a-15(e) and 15d-15(e) under the Securities Exchange Act of 1934, or the Exchange Act) required by Exchange Act Rules 13a-15(b) or 15d-15(b), our principal executive officer and our principal financial officer have concluded that as of the end of the period covered by this report, our disclosure controls and procedures were effective.
Changes in internal controls.
There were no changes in our internal controls over financial reporting as defined in Exchange Act Rule 13a-15(f) that occurred during our most recently completed fiscal quarter that have materially affected, or are reasonably likely to materially affect, our internal control over financial reporting.
Management's Annual Report on Internal Control Over Financial Reporting.
Our management is responsible for establishing and maintaining adequate internal control over financial reporting. Our management, including our principal executive officer and principal financial officer, conducted an evaluation of the effectiveness of our internal control over financial reporting based on the framework in
Internal Control - Integrated Framework
issued by the Committee of Sponsoring Organizations of the Treadway Commission. Based on its evaluation under the framework in
Internal Control - Integrated Framework
, our management concluded that our internal control over financial reporting was effective as of
December 31, 2011
.
The effectiveness of our internal control over financial reporting as of
December 31, 2011
has been audited by PricewaterhouseCoopers LLP, an independent registered public accounting firm, as stated in their report which appears in Item 15(a) of this Annual Report on Form 10-K.
|
ITEM 9B:
|
OTHER INFORMATION
|
Not applicable.
PART III
|
ITEM 10:
|
DIRECTORS, EXECUTIVE OFFICERS AND CORPORATE GOVERNANCE
|
Incorporated by reference from our Proxy Statement for our 2012 Annual Meeting of Stockholders to be filed with the SEC within 120 days after the end of the year ended
December 31, 2011
.
Code of Ethics, Governance Guidelines and Committee Charters
We have adopted a
Code of Business Conduct and Ethics
that applies to all eBay employees. We have also adopted a
Code of Ethics for Senior Financial Officers
that applies to our senior financial officers, including our principal executive officer, principal financial officer and principal accounting officer. The
Code of Ethics for Senior Financial Officers
is included in our
Code of Business Conduct and Ethics
posted on our website at
http://investor.ebayinc.com/governance.cfm.
We will post any amendments to or waivers from the
Code of Ethics for Senior Financial Officers
at that location.
We have also adopted
Governance Guidelines for the Board of Directors
and a written committee charter for each of our Audit Committee, Compensation Committee and Corporate Governance and Nominating Committee. Each of these documents is available on our website at
http://investor.ebayinc.com/governance.cfm.
73
|
ITEM 11:
|
EXECUTIVE COMPENSATION
|
Incorporated by reference from our Proxy Statement for our 2012 Annual Meeting of Stockholders to be filed with the SEC within 120 days after the end of the year ended
December 31, 2011
.
Annual stock option grants awarded to executives are priced and granted to executives on the same date and at the same price that they are granted to and priced for the rest of our eligible employees and have the same four-year vesting schedule. In the past, these stock option grants have been awarded on March 1 of each year (or if March 1 was not a trading day, the next trading day with vesting effective as of March 1). Beginning in 2012, these annual stock option grants will be awarded on April 1 (or if April 1 is not a trading day, the next trading day with vesting effective as of April 1).
|
ITEM 12:
|
SECURITY OWNERSHIP OF CERTAIN BENEFICIAL OWNERS AND MANAGEMENT AND RELATED STOCKHOLDER MATTERS
|
Incorporated by reference from our Proxy Statement for our 2012 Annual Meeting of Stockholders to be filed with the SEC within 120 days after the end of the year ended
December 31, 2011
.
|
ITEM 13:
|
CERTAIN RELATIONSHIPS AND RELATED TRANSACTIONS, AND DIRECTOR INDEPENDENCE
|
Incorporated by reference from our Proxy Statement for our 2012 Annual Meeting of Stockholders to be filed with the SEC within 120 days after the end of the year ended
December 31, 2011
.
|
ITEM 14:
|
PRINCIPAL ACCOUNTANT FEES AND SERVICES
|
Incorporated by reference from our Proxy Statement for our 2012 Annual Meeting of Stockholders to be filed with the SEC within 120 days after the end of the year ended
December 31, 2011
.
PART IV
|
Item 15:
|
EXHIBITS AND FINANCIAL STATEMENT SCHEDULE
|
(a) The following documents are filed as part of this report:
|
1. Consolidated Financial Statements:
|
|
|
Page Number
|
|
|
Report of Independent Registered Public Accounting Firm
|
|
|
Consolidated Balance Sheet
|
|
|
Consolidated Statement of Income
|
|
|
Consolidated Statement of Other Comprehensive Income
|
|
|
Consolidated Statement of Stockholders' Equity
|
|
|
Consolidated Statement of Cash Flows
|
|
|
Notes to Consolidated Financial Statements
|
|
|
2. Financial Statement Schedule
|
|
|
Schedule II - Valuation and Qualifying Accounts
|
|
All other schedules have been omitted because the information required to be set forth therein is not applicable or is shown in the financial statements or notes thereto.
3. Exhibits.
|
No.
|
|
Exhibit Description
|
|
Filed with
this 10-K
|
|
Incorporated by Reference
|
||||
|
|
|
|
Form
|
|
File No.
|
|
Date Filed
|
|||
|
2.01
|
|
Share Allocation and Tender Offer Agreement, dated as of April 16, 2009, by and among Registrant, eBay KTA (UK). Ltd. and Gmarket Inc.
|
|
|
8-K
|
|
000-24821
|
|
4/16/2009
|
|
|
2.02
|
|
Share Purchase Agreement, dated as of April 16, 2009, by and among Registrant, eBay KTA (UK). Ltd. and Gmarket Inc.
|
|
|
8-K
|
|
000-24821
|
|
4/16/2009
|
|
|
2.03*++
|
|
Share Purchase Agreement, dated as of September 1, 2009, as amended on September 14, 2009, by and among Registrant, eBay International AG, Sonorit Holding, A.S. and Springboard Group S.à.r.l. (formerly SLP III Cayman DS IV Holdings S.à.r.l.)
|
|
|
10-Q
|
|
000-24821
|
|
10/27/2009
|
|
|
2.04*
|
|
Amendments to Share Purchase Agreement, dated as of October 19, 2009, October 21, 2009, November 5, 2009 and November 19, 2009, by and among Registrant, eBay International AG, Sonorit Holding, A.S. and Springboard Group S.à.r.l. (formerly SLP III Cayman DS IV Holdings S.à.r.l.)
|
|
|
8-K
|
|
000-24821
|
|
11/20/2009
|
|
|
2.05**
|
Agreement and Plan of Merger, dated March 27, 2011, among Registrant, Gibraltar Acquisition Corp. and GSI Commerce, Inc.
|
8-K
|
000-24821
|
3/30/2009
|
||||||
|
3.01
|
|
Registrant's Amended and Restated Certificate of Incorporation.
|
|
|
10-Q
|
|
000-24821
|
|
7/27/2005
|
|
|
3.02
|
|
Registrant's Amended and Restated Bylaws.
|
|
|
8-K
|
|
000-24821
|
|
6/28/2011
|
|
|
4.01
|
|
Form of Specimen Certificate for Registrant's Common Stock.
|
|
|
S-1
|
|
333-59097
|
|
8/19/1998
|
|
|
4.02
|
Indenture dated as of October 28, 2010 between Registrant and Wells Fargo Bank, National Association, as trustee.
|
8-K
|
|
000-24821
|
|
10/28/2010
|
||||
|
4.03
|
Supplemental Indenture dated as of October 28, 2010 between Registrant and Wells Fargo Bank, National Association, as trustee.
|
8-K
|
|
000-24821
|
|
10/28/2010
|
||||
|
4.04
|
Forms of 0.875% Senior Note due 2013, 1.625% Senior Note due 2015 and 3.250% Senior Note due 2020.
|
8-K
|
|
000-24821
|
|
10/28/2010
|
||||
|
4.05
|
Form of 2.50% Convertible Senior Note due 2027.
|
10-Q
|
000-24821
|
7/22/2011
|
||||||
|
4.06
|
Indenture dated as of July 2, 2007 between GSI Commerce, Inc. and The Bank of New York, as trustee.
|
10-Q
|
000-24821
|
7/22/2011
|
||||||
|
4.07
|
First Supplemental Indenture dated as of June 17, 2011 to the Indenture dated as of July 2, 2007 between GSI Commerce, Inc. and The Bank of New York Mellon, as trustee.
|
10-Q
|
000-24821
|
7/22/2011
|
||||||
|
10.01+
|
|
Form of Indemnity Agreement entered into by Registrant with each of its directors and executive officers.
|
|
|
S-1
|
|
333-59097
|
|
7/15/1998
|
|
|
10.02+
|
|
Registrant's 1998 Equity Incentive Plan, as amended.
|
|
|
10-K
|
|
000-24821
|
|
2/28/2007
|
|
|
10.03+
|
|
Form of Stock Bonus Agreement under Registrant's 1998 Equity Incentive Plan.
|
|
|
10-Q
|
|
000-24821
|
|
10/27/2004
|
|
|
10.04+
|
|
Form of Stock Option Agreement under Registrant's 1998 Equity Incentive Plan.
|
|
|
10-Q
|
|
000-24821
|
|
10/27/2004
|
|
75
|
No.
|
|
Exhibit Description
|
|
Filed with
this 10-K
|
|
Incorporated by Reference
|
||||
|
|
|
|
Form
|
|
File No.
|
|
Date Filed
|
|||
|
10.05+
|
|
Form of Restricted Stock Unit Agreement (and Performance-Based Restricted Stock Unit Agreement) under Registrant's 1998 Equity Incentive Plan.
|
|
|
10-K
|
|
000-24821
|
|
2/28/2007
|
|
|
10.06+
|
|
Registrant's Amended and Restated 1998 Employee Stock Purchase Plan.
|
|
|
10-Q
|
|
000-24821
|
|
7/27/2007
|
|
|
10.07+
|
|
Registrant's 1998 Directors Stock Option Plan, as amended.
|
|
|
10-K
|
|
000-24821
|
|
2/28/2007
|
|
|
10.08+
|
|
Registrant's 1999 Global Equity Incentive Plan, as amended.
|
|
|
10-Q
|
|
000-24821
|
|
7/27/2007
|
|
|
10.09+
|
|
Form of Stock Option Agreement under Registrant's 1999 Global Equity Incentive Plan.
|
|
|
10-Q
|
|
000-24821
|
|
10/27/2004
|
|
|
10.10+
|
|
Form of Restricted Stock Unit Agreement under Registrant's 1999 Global Equity Incentive Plan.
|
|
|
10-K
|
|
000-24821
|
|
2/28/2007
|
|
|
10.11+
|
|
Registrant's 2001 Equity Incentive Plan, as amended.
|
|
|
10-K
|
|
000-24821
|
|
2/28/2007
|
|
|
10.12+
|
|
Form of Stock Option Agreement under Registrant's 2001 Equity Incentive Plan.
|
|
|
10-Q
|
|
000-24821
|
|
10/27/2004
|
|
|
10.13+
|
|
Registrant's 2003 Deferred Stock Unit Plan, as amended.
|
|
|
10-K
|
|
000-24821
|
|
2/28/2007
|
|
|
10.14+
|
|
Form of 2003 Deferred Stock Unit Plan Electing Director Award Agreement, as amended.
|
|
|
10-Q
|
|
000-24821
|
|
4/25/2006
|
|
|
10.15+
|
|
Form of 2003 Deferred Stock Unit Plan New Director Award Agreement, as amended.
|
|
|
10-Q
|
|
000-24821
|
|
4/25/2006
|
|
|
10.16+
|
|
Form of 2003 Deferred Stock Unit Plan Restricted Stock Unit Grant Notice and Agreement
|
|
|
10-Q/A
|
|
000-24821
|
|
4/24/2008
|
|
|
10.17+
|
|
Registrant's 2008 Equity Incentive Award Plan, as amended and restated
|
|
|
10-Q
|
|
000-24821
|
|
7/23/2010
|
|
|
10.18+
|
|
Amendment to the Registrant's 2008 Equity Incentive Award Plan, Registrant's 2001 Equity Incentive Plan, Registrant's 1999 Global Equity Incentive Plan, Registrant's 1998 Equity Incentive Plan and Shopping.com Ltd. 2004 Equity Incentive Plan.
|
|
|
10-Q
|
|
000-24821
|
|
7/29/2009
|
|
|
10.19+
|
|
Form of Restricted Stock Unit Agreement (and Performance-Based Restricted Stock Unit Agreement) under Registrant's 2008 Equity Incentive Award Plan.
|
|
|
8-K
|
|
000-24821
|
|
6/25/2008
|
|
|
10.20+
|
|
eBay Incentive Plan.
|
|
|
DEF 14A
|
|
000-24821
|
|
3/19/2010
|
|
|
10.21+
|
|
eBay Inc. Deferred Compensation Plan.
|
|
|
8-K
|
|
000-24821
|
|
12/20/2007
|
|
|
10.22+
|
|
Employment Letter Agreement dated March 31, 2008, between John Donahoe and Registrant
|
|
|
10-Q/A
|
|
000-24821
|
|
4/24/2008
|
|
|
10.23+
|
|
Letter Agreement dated September 30, 2008 between Robert Swan and Registrant.
|
|
|
10-Q
|
|
000-24821
|
|
10/23/2008
|
|
76
|
No.
|
|
Exhibit Description
|
|
Filed with
this 10-K
|
|
Incorporated by Reference
|
||||
|
|
|
|
Form
|
|
File No.
|
|
Date Filed
|
|||
|
10.24+
|
|
Separation Agreement dated October 20, 2010 between Lorrie Norrington and Registrant.
|
|
|
10-Q
|
|
000-24821
|
|
10/23/2010
|
|
|
10.25
|
Form of Voting and Support Agreement entered into between Registrant and Michael G. Rubin.
|
8-K
|
000-24821
|
3/30/2011
|
||||||
|
10.26
|
Form of Voting and Support Agreement entered into between Registrant and the following directors and officers of GSI Commerce, Inc.: M. Jeffrey Branman, Michael J. Donahue, Ronald D. Fisher, John A. Hunter, Josh Kopelman, Mark S. Menell, Jeffrey F. Rayport, David Rosenblatt, Lawrence S. Smith, Andrea M. Weiss, Michael R. Conn, James Flanagan, J. Scott Hardy, Damon Mintzer and Christopher Saridakis.
|
8-K
|
000-24821
|
3/30/2011
|
||||||
|
10.27+
|
GSI Commerce, Inc. 2010 Equity Incentive Plan.
|
10-Q
|
000-24821
|
7/22/2011
|
||||||
|
10.28+
|
Amendment to GSI Commerce, Inc. 2010 Equity Incentive Plan.
|
10-Q
|
000-24821
|
7/22/2011
|
||||||
|
10.29+
|
Form of Restricted Stock Unit Agreement (and Performance-Based Restricted Stock Unit Agreement) under GSI Commerce, Inc. 2010 Equity Incentive Plan, as amended.
|
10-Q
|
000-24821
|
7/22/2011
|
||||||
|
10.30+
|
Letter Agreement dated July 7, 2011 between Christopher Saridakis and Registrant.
|
10-Q
|
000-24821
|
7/22/2011
|
||||||
|
10.31+
|
Performance Award Agreement dated June 16, 2011, between Christopher Saridakis and GSI Commerce, Inc.
|
10-Q
|
000-24821
|
7/22/2011
|
||||||
|
10.32+
|
Offer letter dated August 30, 2011 and executed on September 2, 2011 between Registrant and Devin Wenig.
|
8-K
|
000-24821
|
9/6/2011
|
||||||
|
10.33
|
Credit Agreement, dated as of November 22, 2011, by and among Registrant, JPMorgan Chase Bank, N.A., as Administrative Agent, and the other parties thereto.
|
8-K
|
000-24821
|
11/28/2011
|
||||||
|
12.01
|
|
Statement regarding computation of ratio of earnings to fixed charges.
|
|
X
|
|
|
|
|||
|
21.01
|
|
List of Subsidiaries.
|
|
X
|
|
|
|
|||
|
23.01
|
|
PricewaterhouseCoopers LLP consent.
|
|
X
|
|
|
|
|||
|
24.01
|
|
Power of Attorney (see signature page).
|
|
X
|
|
|
|
|||
|
31.01
|
|
Certification of Registrant's Chief Executive Officer, as required by Section 302 of the Sarbanes-Oxley Act of 2002.
|
|
X
|
|
|
|
|||
|
31.02
|
|
Certification of Registrant's Chief Financial Officer, as required by Section 302 of the Sarbanes-Oxley Act of 2002.
|
|
X
|
|
|
|
|||
|
32.01
|
|
Certification of Registrant's Chief Executive Officer, as required by Section 906 of the Sarbanes-Oxley Act of 2002.
|
|
X
|
|
|
|
|||
|
32.02
|
|
Certification of Registrant's Chief Financial Officer, as required by Section 906 of the Sarbanes-Oxley Act of 2002.
|
|
X
|
|
|
|
|||
|
101.INS
|
|
XBRL Instance Document
|
|
X
|
|
|
|
|||
|
101.SCH
|
|
XBRL Taxonomy Extension Schema Document
|
|
X
|
|
|
|
|||
77
|
No.
|
|
Exhibit Description
|
|
Filed with
this 10-K
|
|
Incorporated by Reference
|
||||
|
|
|
|
Form
|
|
File No.
|
|
Date Filed
|
|||
|
101.CAL
|
|
XBRL Taxonomy Extension Calculation Linkbase Document
|
|
X
|
|
|
|
|||
|
101.DEF
|
|
XBRL Taxonomy Extension Definition Linkbase Document
|
|
X
|
|
|
|
|||
|
101.LAB
|
|
XBRL Taxonomy Extension Label Linkbase Document
|
|
X
|
|
|
|
|||
|
101.PRE
|
|
XBRL Taxonomy Extension Presentation Linkbase Document
|
|
X
|
|
|
|
|||
|
+
|
Indicates a management contract or compensatory plan or arrangement
|
|
++
|
Portions of this exhibit are subject to a request for confidential treatment and have been redacted and filed separately with the Securities and Exchange Commission.
|
|
*
|
The annexes and schedules to the Share Purchase Agreement have been omitted from this filing pursuant to Item 601(b)(2) of Regulation S-K. The Registrant will furnish copies of any annexes or schedules to the Securities and Exchange Commission upon request.
|
|
**
|
The schedules and exhibits to the Agreement and Plan of Merger have been omitted from this filing pursuant to Item 601(b)(2) of Regulation S-K. The Registrant will furnish copies of any annexes or schedules to the Securities and Exchange Commission upon request.
|
78
Report of Independent Registered Public Accounting Firm
To the Board of Directors and Stockholders of eBay Inc.:
In our opinion, the consolidated financial statements listed in the index appearing under Item 15(a)(1) present fairly, in all material respects, the financial position of eBay Inc. and its subsidiaries at December 31, 2010 and December 31, 2011, and the results of their operations and their cash flows for each of the three years in the period ended December 31, 2011 in conformity with accounting principles generally accepted in the United States of America. In addition, in our opinion, the financial statement schedule listed in the index appearing under Item 15(a)(2) presents fairly, in all material respects, the information set forth therein when read in conjunction with the related consolidated financial statements. Also in our opinion, the Company maintained, in all material respects, effective internal control over financial reporting as of December 31, 2011, based on criteria established in
Internal Control - Integrated Framework issued
by the Committee of Sponsoring Organizations of the Treadway Commission (COSO). The Company's management is responsible for these financial statements and financial statement schedule, for maintaining effective internal control over financial reporting and for its assessment of the effectiveness of internal control over financial reporting, included in Management's Report on Internal Control over Financial Reporting. Our responsibility is to express opinions on these financial statements, on the financial statement schedule, and on the Company's internal control over financial reporting based on our integrated audits. We conducted our audits in accordance with the standards of the Public Company Accounting Oversight Board (United States). Those standards require that we plan and perform the audits to obtain reasonable assurance about whether the financial statements are free of material misstatement and whether effective internal control over financial reporting was maintained in all material respects. Our audits of the financial statements included examining, on a test basis, evidence supporting the amounts and disclosures in the financial statements, assessing the accounting principles used and significant estimates made by management, and evaluating the overall financial statement presentation. Our audit of internal control over financial reporting included obtaining an understanding of internal control over financial reporting, assessing the risk that a material weakness exists, and testing and evaluating the design and operating effectiveness of internal control based on the assessed risk. Our audits also included performing such other procedures as we considered necessary in the circumstances. We believe that our audits provide a reasonable basis for our opinions.
A company's internal control over financial reporting is a process designed to provide reasonable assurance regarding the reliability of financial reporting and the preparation of financial statements for external purposes in accordance with generally accepted accounting principles. A company's internal control over financial reporting includes those policies and procedures that (i) pertain to the maintenance of records that, in reasonable detail, accurately and fairly reflect the transactions and dispositions of the assets of the company; (ii) provide reasonable assurance that transactions are recorded as necessary to permit preparation of financial statements in accordance with generally accepted accounting principles, and that receipts and expenditures of the company are being made only in accordance with authorizations of management and directors of the company; and (iii) provide reasonable assurance regarding prevention or timely detection of unauthorized acquisition, use, or disposition of the company's assets that could have a material effect on the financial statements.
Because of its inherent limitations, internal control over financial reporting may not prevent or detect misstatements. Also, projections of any evaluation of effectiveness to future periods are subject to the risk that controls may become inadequate because of changes in conditions, or that the degree of compliance with the policies or procedures may deteriorate.
/s/ PricewaterhouseCoopers LLP
San Jose, California
January 30, 2012
F-1
|
Item 1:
|
Financial Statements
|
eBay Inc.
|
|
December 31,
2011 |
December 31,
2010 |
|||||
|
|
(In thousands, except par value amounts)
|
||||||
|
ASSETS
|
|||||||
|
Current assets:
|
|
|
|||||
|
Cash and cash equivalents
|
$
|
4,691,101
|
|
$
|
5,577,411
|
|
|
|
Short-term investments
|
1,238,301
|
|
1,045,403
|
|
|||
|
Accounts receivable, net
|
681,593
|
|
454,366
|
|
|||
|
Loans and interest receivable, net
|
1,501,473
|
|
956,189
|
|
|||
|
Funds receivable and customer accounts
|
3,967,550
|
|
2,550,731
|
|
|||
|
Other current assets
|
581,436
|
|
481,238
|
|
|||
|
Total current assets
|
12,661,454
|
|
11,065,338
|
|
|||
|
Long-term investments
|
2,452,763
|
|
2,492,012
|
|
|||
|
Property and equipment, net
|
1,986,216
|
|
1,523,333
|
|
|||
|
Goodwill
|
8,364,989
|
|
6,193,163
|
|
|||
|
Intangible assets, net
|
1,406,380
|
|
540,711
|
|
|||
|
Other assets
|
448,416
|
|
189,205
|
|
|||
|
Total assets
|
$
|
27,320,218
|
|
$
|
22,003,762
|
|
|
|
LIABILITIES AND STOCKHOLDERS' EQUITY
|
|||||||
|
Current liabilities:
|
|
|
|
|
|||
|
Short-term debt
|
$
|
564,601
|
|
$
|
300,000
|
|
|
|
Accounts payable
|
283,102
|
|
184,963
|
|
|||
|
Funds payable and amounts due to customers
|
3,967,550
|
|
2,550,731
|
|
|||
|
Accrued expenses and other current liabilities
|
1,510,836
|
|
1,343,888
|
|
|||
|
Deferred revenue
|
110,429
|
|
96,464
|
|
|||
|
Income taxes payable
|
297,686
|
|
40,468
|
|
|||
|
Total current liabilities
|
6,734,204
|
|
4,516,514
|
|
|||
|
Deferred and other tax liabilities, net
|
1,072,951
|
|
645,457
|
|
|||
|
Long-term debt
|
1,525,047
|
|
1,494,227
|
|
|||
|
Other liabilities
|
58,137
|
|
45,385
|
|
|||
|
Total liabilities
|
9,390,339
|
|
6,701,583
|
|
|||
|
Commitments and contingencies (Note 13)
|
|
|
|||||
|
Stockholders' equity:
|
|||||||
|
Common stock, $0.001 par value; 3,580,000 shares authorized; 1,286,487 and 1,297,710 shares outstanding
|
1,535
|
|
1,513
|
|
|||
|
Additional paid-in capital
|
11,144,832
|
|
10,480,709
|
|
|||
|
Treasury stock at cost, 248,687 and 215,082 shares
|
(7,155,421
|
)
|
(6,091,435
|
)
|
|||
|
Retained earnings
|
13,389,465
|
|
10,160,078
|
|
|||
|
Accumulated other comprehensive income
|
549,468
|
|
751,314
|
|
|||
|
Total stockholders' equity
|
17,929,879
|
|
15,302,179
|
|
|||
|
Total liabilities and stockholders' equity
|
$
|
27,320,218
|
|
$
|
22,003,762
|
|
|
The accompanying notes are an integral part of these consolidated financial statements.
F-2
eBay Inc.
|
|
Year Ended December 31,
|
||||||||||
|
|
2011
|
2010
|
2009
|
||||||||
|
|
(In thousands, except per share amounts)
|
||||||||||
|
Net revenues
|
$
|
11,651,654
|
|
$
|
9,156,274
|
|
$
|
8,727,362
|
|
||
|
Cost of net revenues
|
3,460,184
|
|
2,564,667
|
|
2,479,762
|
|
|||||
|
Gross profit
|
8,191,470
|
|
6,591,607
|
|
6,247,600
|
|
|||||
|
Operating expenses:
|
|
|
|
|
|||||||
|
Sales and marketing
|
2,435,048
|
|
1,946,815
|
|
1,885,677
|
|
|||||
|
Product development
|
1,235,171
|
|
908,434
|
|
803,070
|
|
|||||
|
General and administrative
|
1,364,221
|
|
1,079,383
|
|
1,418,389
|
|
|||||
|
Provision for transaction and loan losses
|
516,656
|
|
392,240
|
|
382,825
|
|
|||||
|
Amortization of acquired intangible assets
|
267,374
|
|
189,727
|
|
262,686
|
|
|||||
|
Restructuring
|
(489
|
)
|
21,437
|
|
38,187
|
|
|||||
|
Total operating expenses
|
5,817,981
|
|
4,538,036
|
|
4,790,834
|
|
|||||
|
Income from operations
|
2,373,489
|
|
2,053,571
|
|
1,456,766
|
|
|||||
|
Interest and other, net
|
1,536,557
|
|
44,876
|
|
1,422,385
|
|
|||||
|
Income before income taxes
|
3,910,046
|
|
2,098,447
|
|
2,879,151
|
|
|||||
|
Provision for income taxes
|
(680,659
|
)
|
(297,486
|
)
|
(490,054
|
)
|
|||||
|
Net income
|
$
|
3,229,387
|
|
$
|
1,800,961
|
|
$
|
2,389,097
|
|
||
|
Net income per share:
|
|
|
|||||||||
|
Basic
|
$
|
2.50
|
|
$
|
1.38
|
|
$
|
1.85
|
|
||
|
Diluted
|
$
|
2.46
|
|
$
|
1.36
|
|
$
|
1.83
|
|
||
|
Weighted average shares:
|
|
|
|||||||||
|
Basic
|
1,292,775
|
|
1,305,593
|
|
1,289,848
|
|
|||||
|
Diluted
|
1,312,950
|
|
1,327,417
|
|
1,304,981
|
|
|||||
The accompanying notes are an integral part of these consolidated financial statements.
F-3
eBay Inc.
CONSOLIDATED STATEMENT OF COMPREHENSIVE INCOME
|
Year Ended December 31,
|
||||||||||||
|
|
2011
|
2010
|
2009
|
|||||||||
|
|
(In thousands)
|
|||||||||||
|
Net income
|
$
|
3,229,387
|
|
$
|
1,800,961
|
|
$
|
2,389,097
|
|
|||
|
Other comprehensive income (loss):
|
|
|
|
|
|
|
||||||
|
Foreign currency translation
|
(280,930
|
)
|
(175,605
|
)
|
(217,724
|
)
|
||||||
|
Unrealized gains on investments
|
56,804
|
|
117,427
|
|
288,880
|
|
||||||
|
Unrealized gains (losses) on hedging activities
|
58,289
|
|
18,381
|
|
(45,173
|
)
|
||||||
|
Tax provision on above items
|
(36,009
|
)
|
(26,993
|
)
|
(111,364
|
)
|
||||||
|
Net change in accumulated other comprehensive income
|
(201,846
|
)
|
(66,790
|
)
|
(85,381
|
)
|
||||||
|
Other comprehensive income
|
$
|
3,027,541
|
|
$
|
1,734,171
|
|
$
|
2,303,716
|
|
|||
The accompanying notes are an integral part of these consolidated financial statements.
F-4
eBay Inc.
CONSOLIDATED STATEMENT OF STOCKHOLDERS' EQUITY
|
|
Year Ended December 31,
|
||||||||||
|
|
2011
|
|
2010
|
|
2009
|
||||||
|
|
(In thousands)
|
||||||||||
|
Common stock:
|
|
|
|||||||||
|
Balance, beginning of year
|
$
|
1,513
|
|
|
$
|
1,486
|
|
|
$
|
1,470
|
|
|
Common stock issued
|
22
|
|
|
27
|
|
|
16
|
|
|||
|
Balance, end of year
|
1,535
|
|
|
1,513
|
|
|
1,486
|
|
|||
|
Additional paid-in-capital:
|
|
|
|||||||||
|
Balance, beginning of year
|
10,480,709
|
|
|
9,986,199
|
|
|
9,585,853
|
|
|||
|
Common stock and stock-based awards issued and assumed
|
130,349
|
|
|
124,071
|
|
|
67,934
|
|
|||
|
Stock-based compensation
|
457,188
|
|
|
381,492
|
|
|
394,807
|
|
|||
|
Stock-based awards tax impact
|
44,044
|
|
|
(13,581
|
)
|
|
(64,136
|
)
|
|||
|
Structured stock repurchases
|
—
|
|
|
2,260
|
|
|
—
|
|
|||
|
Noncontrolling interests
|
32,542
|
|
|
268
|
|
|
1,741
|
|
|||
|
Balance, end of year
|
11,144,832
|
|
|
10,480,709
|
|
|
9,986,199
|
|
|||
|
Treasury stock at cost:
|
|
|
|||||||||
|
Balance, beginning of year
|
(6,091,435
|
)
|
|
(5,377,258
|
)
|
|
(5,376,970
|
)
|
|||
|
Common stock repurchased
|
(1,063,986
|
)
|
|
(714,177
|
)
|
|
(288
|
)
|
|||
|
Balance, end of year
|
(7,155,421
|
)
|
|
(6,091,435
|
)
|
|
(5,377,258
|
)
|
|||
|
Retained earnings:
|
|
|
|||||||||
|
Balance, beginning of year
|
10,160,078
|
|
|
8,359,117
|
|
|
5,970,020
|
|
|||
|
Net income
|
3,229,387
|
|
|
1,800,961
|
|
|
2,389,097
|
|
|||
|
Balance, end of year
|
13,389,465
|
|
|
10,160,078
|
|
|
8,359,117
|
|
|||
|
Accumulated other comprehensive income:
|
|
|
|||||||||
|
Balance, beginning of year
|
751,314
|
|
|
818,104
|
|
|
903,485
|
|
|||
|
Change in unrealized gains on investments
|
56,804
|
|
|
117,427
|
|
|
288,880
|
|
|||
|
Change in unrealized gains (losses) on cash flow hedges
|
58,289
|
|
|
18,381
|
|
|
(45,173
|
)
|
|||
|
Foreign currency translation adjustment
|
(280,930
|
)
|
|
(175,605
|
)
|
|
(217,724
|
)
|
|||
|
Tax benefit (provision) on above items
|
(36,009
|
)
|
(26,993
|
)
|
(111,364
|
)
|
|||||
|
Balance, end of year
|
549,468
|
|
|
751,314
|
|
|
818,104
|
|
|||
|
Total stockholders' equity
|
$
|
17,929,879
|
|
|
$
|
15,302,179
|
|
|
$
|
13,787,648
|
|
|
Number of Shares:
|
|
|
|||||||||
|
Common stock:
|
|
|
|||||||||
|
Balance, beginning of year
|
1,297,710
|
|
|
1,297,799
|
|
|
1,282,025
|
|
|||
|
Common stock issued
|
22,394
|
|
|
26,742
|
|
|
15,825
|
|
|||
|
Common stock repurchased/forfeited
|
(33,617
|
)
|
|
(26,831
|
)
|
|
(51
|
)
|
|||
|
Balance, end of year
|
1,286,487
|
|
|
1,297,710
|
|
|
1,297,799
|
|
|||
The accompanying notes are an integral part of these consolidated financial statements.
F-5
eBay Inc.
|
|
Year Ended December 31,
|
||||||||||
|
|
2011
|
2010
|
2009
|
||||||||
|
|
(In thousands)
|
||||||||||
|
Cash flows from operating activities:
|
|
|
|||||||||
|
Net income
|
$
|
3,229,387
|
|
$
|
1,800,961
|
|
$
|
2,389,097
|
|
||
|
Adjustments:
|
|
|
|||||||||
|
Provision for transaction and loan losses
|
516,656
|
|
392,240
|
|
382,825
|
|
|||||
|
Depreciation and amortization
|
939,953
|
|
762,465
|
|
810,946
|
|
|||||
|
Stock-based compensation
|
457,188
|
|
381,492
|
|
394,807
|
|
|||||
|
Deferred income taxes
|
16,958
|
|
349,595
|
|
(178,813
|
)
|
|||||
|
Excess tax benefits from stock-based compensation
|
(79,681
|
)
|
(41,891
|
)
|
(4,750
|
)
|
|||||
|
Gain on sale of Skype
|
(1,664,075
|
)
|
—
|
|
(1,449,800
|
)
|
|||||
|
Joltid legal settlement
|
—
|
|
—
|
|
343,199
|
|
|||||
|
Loss on divestiture of a business
|
256,501
|
|
—
|
|
—
|
|
|||||
|
Gain on acquisitions
|
(79,082
|
)
|
—
|
|
—
|
|
|||||
|
Changes in assets and liabilities, net of acquisition effects
|
|||||||||||
|
Accounts receivable
|
(291,822
|
)
|
(111,614
|
)
|
(97,494
|
)
|
|||||
|
Other current assets
|
19,380
|
|
(251,821
|
)
|
126,270
|
|
|||||
|
Other non-current assets
|
(18,298
|
)
|
73,978
|
|
(31,292
|
)
|
|||||
|
Accounts payable
|
29,424
|
|
(9,263
|
)
|
(27,235
|
)
|
|||||
|
Accrued expenses and other liabilities
|
(202,478
|
)
|
(95,522
|
)
|
(86,504
|
)
|
|||||
|
Deferred revenue
|
11,785
|
|
(3,348
|
)
|
56,855
|
|
|||||
|
Income taxes payable and other tax liabilities
|
131,878
|
|
(501,512
|
)
|
279,975
|
|
|||||
|
Net cash provided by operating activities
|
3,273,674
|
|
2,745,760
|
|
2,908,086
|
|
|||||
|
Cash flows from investing activities:
|
|
|
|
|
|
|
|||||
|
Purchases of property and equipment, net
|
(963,498
|
)
|
(723,912
|
)
|
(567,094
|
)
|
|||||
|
Changes in principal loans receivable, net
|
(586,508
|
)
|
(379,730
|
)
|
(121,138
|
)
|
|||||
|
Purchases of investments
|
(2,290,183
|
)
|
(2,643,514
|
)
|
(1,142,098
|
)
|
|||||
|
Maturities and sales of investments
|
1,596,064
|
|
1,436,207
|
|
103,572
|
|
|||||
|
Acquisitions, net of cash acquired
|
(3,223,055
|
)
|
(90,568
|
)
|
(1,209,433
|
)
|
|||||
|
Repayment of Skype note receivable
|
—
|
|
125,000
|
|
—
|
|
|||||
|
Proceeds from the sale of Skype
|
2,269,146
|
|
—
|
|
1,780,321
|
|
|||||
|
Other
|
(108,828
|
)
|
(5,953
|
)
|
6,487
|
|
|||||
|
Net cash used in investing activities
|
(3,306,862
|
)
|
(2,282,470
|
)
|
(1,149,383
|
)
|
|||||
|
Cash flows from financing activities:
|
|
|
|
|
|
|
|||||
|
Proceeds from issuance of common stock
|
242,210
|
|
235,527
|
|
102,526
|
|
|||||
|
Repurchases of common stock
|
(1,063,986
|
)
|
(711,068
|
)
|
—
|
|
|||||
|
Excess tax benefits from stock-based compensation
|
79,681
|
|
41,891
|
|
4,750
|
|
|||||
|
Tax withholdings related to net share settlements of restricted stock awards and units
|
(147,130
|
)
|
(120,646
|
)
|
(37,670
|
)
|
|||||
|
Proceeds from issuance of long-term debt, net
|
—
|
|
1,488,702
|
|
—
|
|
|||||
|
Net borrowings under commercial paper program
|
250,000
|
|
300,000
|
|
—
|
|
|||||
|
Repayment of acquired debt
|
(199,271
|
)
|
—
|
|
—
|
|
|||||
|
Net borrowings (repayments) under credit agreement
|
—
|
|
—
|
|
(1,000,000
|
)
|
|||||
|
Funds receivable and customer accounts
|
(1,368,501
|
)
|
(392,786
|
)
|
(561,709
|
)
|
|||||
|
Funds payable and amounts due to customers
|
1,368,501
|
|
392,786
|
|
561,709
|
|
|||||
|
Other
|
—
|
|
—
|
|
(15,262
|
)
|
|||||
|
Net cash (used in) provided by financing activities
|
(838,496
|
)
|
1,234,406
|
|
(945,656
|
)
|
|||||
|
Effect of exchange rate changes on cash and cash equivalents
|
(14,626
|
)
|
(120,103
|
)
|
(2,157
|
)
|
|||||
|
Net (decrease) increase in cash and cash equivalents
|
(886,310
|
)
|
1,577,593
|
|
810,890
|
|
|||||
|
Cash and cash equivalents at beginning of period
|
5,577,411
|
|
3,999,818
|
|
3,188,928
|
|
|||||
F-6
|
Cash and cash equivalents at end of period
|
$
|
4,691,101
|
|
$
|
5,577,411
|
|
$
|
3,999,818
|
|
||
|
Supplemental cash flow disclosures:
|
|
|
|
|
|
|
|||||
|
Cash paid for interest
|
$
|
29,200
|
|
$
|
54
|
|
$
|
6,050
|
|
||
|
Cash paid for income taxes
|
$
|
372,528
|
|
$
|
645,783
|
|
$
|
342,173
|
|
||
|
Non-cash investing and financing activities:
|
|||||||||||
|
Common stock options assumed pursuant to acquisition
|
$
|
31,514
|
|
$
|
2,947
|
|
$
|
5,361
|
|
||
|
Note receivable from divested business
|
$
|
288,042
|
|
$
|
—
|
|
$
|
—
|
|
||
The accompanying notes are an integral part of these consolidated financial statements.
F-7
eBay Inc.
NOTES TO CONSOLIDATED FINANCIAL STATEMENTS
The Company
eBay Inc. (“eBay”) was incorporated in California in May 1996, and reincorporated in Delaware in April 1998. eBay is a global commerce platform and payments leader. We enable commerce through eBay, the world's largest online marketplace, which allows users to buy and sell in nearly every country on earth; through PayPal, which enables individuals and businesses to securely, easily and quickly send and receive online payments; and through GSI, which facilitates ecommerce, multichannel retailing and digital marketing for global enterprises. X.commerce brings together the technology assets and developer communities of eBay, PayPal and Magento, an ecommerce storefront platform, to support eBay Inc.'s mission of enabling commerce. We also reach millions of people through specialized marketplaces such as StubHub, the world's largest ticket marketplace, and eBay classifieds sites, which together have a presence in more than
1,000
cities around the world.
We have three reportable business segments: Marketplaces, Payments and GSI. Our Marketplaces segment includes our eBay.com platform and its localized counterparts and our other online platforms, such as our online classifieds businesses and StubHub. Our Payments segment is comprised of PayPal, Bill Me Later and Zong. Our GSI segment consists of GSI, which was added upon the completion of our acquisition of GSI on June 17, 2011. The results of our new GSI segment have been included in our consolidated results of operations from the acquisition date. Historically, we also had a Communications segment that consisted of Skype Technologies S.A. (“Skype”). On November 19, 2009, we sold Skype to an investor group for cash, a subordinated note and an approximately
30%
equity stake in the outstanding capital stock of the Skype successor entity. Skype's results of operations are consolidated in our 2009 results through the date of sale. We sold our remaining interest in Skype in 2011.
We are required to comply with various regulations worldwide in order to operate our businesses, particularly our Payments business. We also partner with banks and other financial institutions in order to offer our Payments services globally. Changes in regulations, non-compliance with regulations or loss of key bank or financial institution partners could have a significant adverse impact on our ability to operate our business; therefore, we monitor these areas closely to mitigate potential adverse impacts.
When we refer to “we,” “our,” “us” or “eBay” in this document, we mean the current Delaware corporation (eBay Inc.) and its California predecessor, as well as all of our consolidated subsidiaries.
Use of estimates
The preparation of consolidated financial statements in conformity with U.S. generally accepted accounting principles (GAAP) requires management to make estimates and assumptions that affect the reported amounts of assets and liabilities and disclosure of contingent assets and liabilities at the date of the consolidated financial statements and the reported amounts of revenues and expenses during the reporting period. On an ongoing basis, we evaluate our estimates, including those related to provisions for transaction and loan losses, legal contingencies, income taxes, revenue recognition, stock-based compensation and the recoverability of goodwill and intangible assets. We base our estimates on historical experience and on various other assumptions that we believe to be reasonable under the circumstances. Actual results could differ from those estimates.
Principles of consolidation and basis of presentation
The accompanying financial statements are consolidated and include the financial statements of eBay Inc., our wholly and majority-owned subsidiaries and variable interest entities ("VIE") if we are the primary beneficiary. Ownership interests of minority interests are recorded as a noncontrolling interest. All significant intercompany balances and transactions have been eliminated in consolidation. A qualitative approach is applied to assess the consolidation requirement for VIEs. Investments in entities where we hold at least
20%
ownership interest and have the ability to exercise significant influence, but not control, over the investee are accounted for using the equity method of accounting. For such investments, our share of the investees' results of operations is included in interest and other, net and our investment balance is included in long-term investments. Investments in entities where we hold less than a
20%
ownership interest are generally accounted for using the cost method of accounting, and our share of the investees' results of operations is included in our consolidated statement of income to the extent dividends are received.
F-8
eBay Inc.
NOTES TO CONSOLIDATED FINANCIAL STATEMENTS—(Continued)
We have evaluated all subsequent events through the date the financial statements were issued.
Revenue recognition
Our Marketplaces segment generates net transaction revenues primarily from listing and final value fees paid by sellers. Listing fee revenues are recognized ratably over the estimated period of the listing, while revenues related to final value fees are recognized at the time that the transaction is successfully concluded. An auction transaction is considered successfully concluded when at least one buyer has bid above the seller's specified minimum price or reserve price, whichever is higher, at the end of the transaction term.
Our Payments segment earns net transaction revenues primarily from processing transactions for customers. Revenues resulting from a payment processing transaction are recognized once the transaction is completed.
Our GSI segment generates net transaction revenues primarily from providing ecommerce technology, order processing, fulfillment and customer care services to its clients. The revenues can be fixed or variable and are based on the activity performed and/or the value of merchandise sold. Revenues are recognized as the underlying activity is performed or upon shipment of the underlying merchandise.
Our Communications segment net transaction revenues were generated primarily from fees charged to users to connect Skype's Internet communications products to traditional telecommunication networks. These fees were recognized when the service was provided.
Our marketing services and other revenues, included in all of our segments, are derived principally from the sale of advertisements, revenue sharing arrangements, classifieds fees and lead referral fees. Our advertising revenues are derived principally from the sale of online advertisements. The duration of our advertising contracts has ranged from one week to five years, but is generally one week to one year. Advertising revenues on contracts are recognized as “impressions” (i.e., the number of times that an advertisement appears in pages viewed by users of our websites) are delivered, or as “clicks” (which are generated each time users on our websites click through our text-based advertisements to an advertiser's designated website) are provided to advertisers. For contracts with minimum monthly or quarterly advertising commitments where the fee and commitments are fixed throughout the term, we recognize revenue ratably over the term of the agreement. Some of our advertising contracts consist of multiple elements which generally include a blend of various impressions and clicks as well as other marketing deliverables. Where neither vendor-specific objective evidence nor third-party evidence of selling price exists, we use management's best estimate of selling price (BESP) to allocate arrangement consideration on a relative basis to each element. BESP is generally based on the selling prices of the various elements when they are sold to customers of a similar nature and geography on a stand-alone basis or estimated stand-alone pricing when the element has not previously been sold stand-alone. These estimates are generally based on pricing strategies, market factors and strategic objectives. Revenues related to revenue sharing arrangements are recognized based on revenue reports received from our partners, provided that collectability is reasonably assured. Revenues related to fees for listing items on our classified websites are recognized over the estimated period of the classified listing. Lead referral fee revenue is generated from lead referral fees based on the number of times a user clicks through to a merchant's website from our websites. Lead referral fees are recognized in the period in which the user clicks through to the merchant's website.
Our other revenues are derived principally from contractual arrangements with third parties that provide services to eBay and PayPal users, interest earned from banks on certain PayPal customer account balances and interest and fees earned on the Bill Me Later portfolio of loan receivables. Revenues from contractual arrangements with third parties are recognized as the contracted services are delivered to end users. Interest income on certain PayPal customer balances is recognized when earned. Interest and fees earned on the Bill Me Later portfolio of loan receivables are computed and recognized based on contractual interest and fee rates, and are net of any required reserves and amortization of deferred origination costs.
To drive traffic to our websites, we provide incentives to our users in the form of coupons and buyer and seller rewards. These incentives are treated as reductions in revenue.
Internal use software and website development costs
Direct costs incurred to develop software for internal use and website development costs are capitalized and amortized over an estimated useful life of one to five years. During the years ended
December 31, 2011, 2010 and 2009
, we capitalized costs, primarily related to labor and stock-based compensation, of
$211.5 million
,
$193.1 million
and
$160.4 million
, respectively. Amortization of previously capitalized amounts was
$166.0 million
,
$146.7 million
and
$129.1 million
for 2011, 2010, and 2009, respectively. Costs related to the design or maintenance of internal use software and website development are expensed as incurred.
F-9
eBay Inc.
NOTES TO CONSOLIDATED FINANCIAL STATEMENTS—(Continued)
Advertising expense
We expense the costs of producing advertisements at the time production occurs and expense the cost of communicating advertisements in the period during which the advertising space or airtime is used as sales and marketing expense. Internet advertising expenses are recognized based on the terms of the individual agreements, which is generally over the greater of the ratio of the number of impressions delivered over the total number of contracted impressions, on a pay-per-click basis, or on a straight-line basis over the term of the contract. Advertising expense totaled
$976.9 million
,
$808.4 million
and
$799.9 million
for the years ended
December 31, 2011, 2010 and 2009
, respectively.
Stock-based compensation
We issue two types of stock-based awards to employees: restricted stock units (including performance-based restricted stock units) and stock options. We primarily issue restricted stock units. We determine compensation expense associated with restricted stock units based on the fair value of our common stock on the date of grant. We determine compensation expense associated with stock options based on the estimated grant date fair value method using the Black-Scholes valuation model. We generally recognize compensation expense using a straight-line amortization method over the respective vesting period for awards that are ultimately expected to vest. Accordingly, stock-based compensation for
2011
,
2010
and
2009
has been reduced for estimated forfeitures. When estimating forfeitures, we consider voluntary termination behaviors as well as trends of actual option forfeitures. We recognize a benefit from stock-based compensation in equity to the extent that an incremental tax benefit is realized by following the ordering provisions of the tax law. In addition, we account for the indirect effects of stock-based compensation on the research tax credit and the foreign tax credit through our consolidated statement of income.
Provision for transaction losses
We are exposed to losses due to payment card and other payment misuse, as well as non-performance of and credit losses from sellers. Provisions for these items represent our estimate of actual losses based on our historical experience and actuarial techniques, as well as economic conditions. Provision for transaction losses includes PayPal's transaction loss expense as well as losses resulting from our customer protection programs both on and off eBay.
Income taxes
We account for income taxes using an asset and liability approach, which requires the recognition of taxes payable or refundable for the current year and deferred tax liabilities and assets for the future tax consequences of events that have been recognized in our financial statements or tax returns. The measurement of current and deferred tax assets and liabilities is based on provisions of enacted tax laws; the effects of future changes in tax laws or rates are not anticipated. If necessary, the measurement of deferred tax assets is reduced by the amount of any tax benefits that are not expected to be realized based on available evidence.
We report a liability for unrecognized tax benefits resulting from uncertain tax positions taken or expected to be taken in a tax return. We recognize interest and penalties, if any, related to unrecognized tax benefits in income tax expense.
Cash and cash equivalents
Cash and cash equivalents are short-term, highly liquid investments with original maturities of three months or less when purchased and are mainly comprised of bank deposits and money market funds.
Allowance for doubtful accounts and authorized credits
We record our allowance for doubtful accounts based upon our assessment of various factors. We consider historical experience, the age of the accounts receivable balances, credit quality of our customers, current economic conditions and other factors that may affect our customers' ability to pay. The allowance for doubtful accounts and authorized credits was
$87.2 million
and
$86.5 million
at
December 31, 2011
and
2010
, respectively.
Loans and interest receivable, net
Loans and interest receivable represent purchased consumer receivables arising from loans made by a partner chartered financial institution to individual consumers in the U.S. to purchase goods and services through our Bill Me Later merchant network. The terms of the consumer relationship require us to submit monthly bills to the consumer detailing loan repayment requirements. The terms also allow us to charge the consumer interest and fees in certain circumstances. Due to the relatively small dollar amount of individual loans and interest receivable, we do not require collateral on these balances.
F-10
eBay Inc.
NOTES TO CONSOLIDATED FINANCIAL STATEMENTS—(Continued)
Allowance for loans and interest receivable
The allowance for loans and interest receivable represents management's estimate of probable losses inherent in our Bill Me Later portfolio. The provision related to the principal is included in provision of transaction and loan losses and the provision related to the interest is recorded as a reduction of marketing services and other revenue. The allowance for loans and interest receivable represents management's estimate of probable losses inherent in our Bill Me Later portfolio which is considered to be of one segment and one class. Management's evaluation of probable losses is subject to judgments and numerous estimates, including forecasted principal balance delinquency rates ("roll rates"). Roll rates are the percentage of balances that we estimate will migrate from one stage of delinquency to the next based on our historical experience, as well as external factors such as estimated bankruptcies and levels of unemployment. The roll rates are applied to principal and interest balances for each stage of delinquency, from current to
180
days past due, in order to estimate the loans and interest that are probable to be charged off by the end of
180
days.
We charge off loans and interest receivable in the month in which the customer balance becomes
180
days past due. Bankrupt accounts are charged off within
60
days of receiving notification of customer bankruptcy from the courts. Past due loans receivable continue to accrue interest until such time as they are charged-off, with the portion of the reserve related to interest receivable balance classified as a reduction of revenue.
Funds receivable and funds payable
Funds receivable and funds payable relate primarily to our Payments segment and arise due to the time to clear transactions through external payment networks. When customers fund their account using their bank account or credit card, or withdraw money to their bank account or through a debit card transaction, there is a clearing period before the cash is received or settled, usually one to three business days for U.S. transactions, and generally up to five business days for international transactions. To a lesser extent and primarily related to our Marketplaces segment, we generate funds receivable in certain foreign locations from external credit providers that settle within 12 months (
$203.0 million
and
$132.0 million
as of
December 31, 2011
and 2010, respectively).
Customer accounts
Based on differences in regulatory requirements and commercial law in the jurisdictions where PayPal operates, PayPal holds customer balances either as direct claims against PayPal or as an agent or custodian on behalf of PayPal's customers. Customer balances held as direct claims against PayPal are included on our consolidated balance sheet as funds receivable and customer accounts with an offsetting current liability in funds payable and amounts due to customers. We maintain these customer account balances in interest bearing bank deposits, including time deposits with maturity dates of less than one year. Customer funds held by PayPal as an agent or custodian on behalf of our customers are not reflected in our consolidated balance sheet. These off-balance sheet funds include funds held in the U.S. that are deposited in bank accounts insured by the Federal Deposit Insurance Corporation (subject to applicable limits).
Investments
Short-term investments, which include marketable equity securities, time deposits and government and corporate bonds with original maturities of greater than three months but less than one year when purchased, are classified as available-for-sale and are reported at fair value using the specific identification method. Unrealized gains and losses are excluded from earnings and reported as a component of other comprehensive income (loss), net of related estimated tax provisions or benefits.
Long-term investments include government and corporate bonds, time deposits and cost and equity method investments. Debt securities are classified as available-for-sale and are reported at fair value using the specific identification method. Unrealized gains and losses are excluded from earnings and reported as a component of other comprehensive income (loss), net of related estimated tax provisions or benefits.
Time deposits are classified as held to maturity and recorded at amortized cost. Our equity method investments are investments in privately held companies. In certain circumstances, investments include goodwill. Our consolidated results of operations include, as a component of interest and other, net, our share of the net income or loss of the equity method investments. Our share of investees' results of operations is not significant for any period presented. Our cost method investments consist of investments in privately held companies and are recorded at cost. Amounts received from our cost method investees were not material to any period presented.
We assess whether an other-than-temporary impairment loss on our investments has occurred due to declines in fair value or other market conditions. With respect to our debt securities, this assessment takes into account our intent to sell the security, whether it is more likely than not that we will be required to sell the security before recovery of its amortized cost
F-11
eBay Inc.
NOTES TO CONSOLIDATED FINANCIAL STATEMENTS—(Continued)
basis, and if we do not expect to recover the entire amortized cost basis of the security (that is, a credit loss exists). We did not recognize an other-than-temporary impairment loss on our investments in
2011
,
2010
, or 2009.
Property and equipment
Property and equipment are stated at historical cost less accumulated depreciation. Depreciation is computed using the straight-line method over the estimated useful lives of the assets, generally,
one
to
three
years for computer equipment and software, up to
thirty
years for buildings and building improvements,
ten
years for aviation equipment, the shorter of
five
years or the term of the lease for leasehold improvements and
three
years for furniture, fixtures and vehicles.
Goodwill and intangible assets
Goodwill is tested for impairment at a minimum on an annual basis. Goodwill is tested for impairment at the reporting unit level by comparing the reporting unit's carrying amount, to the fair value of the reporting unit. The fair values of the reporting units are estimated using an income and discounted cash flow approach. In years 2011, 2010 and 2009 no goodwill impairment was noted.
Intangible assets consist of purchased customer lists and user base, trademarks and trade names, developed technologies and other intangible assets, including patents and contractual agreements. Intangible assets are amortized over the period of estimated benefit using the straight-line method and estimated useful lives ranging from
one
to
eight
years. No significant residual value is estimated for intangible assets.
Impairment of long-lived assets
We evaluate long-lived assets (including intangible assets) for impairment whenever events or changes in circumstances indicate that the carrying amount of a long-lived asset may not be recoverable. An asset is considered impaired if its carrying amount exceeds the undiscounted future net cash flow the asset is expected to generate. In years 2011, 2010 and 2009, no impairment was noted.
Foreign currency
Most of our foreign subsidiaries use the local currency of their respective countries as their functional currency. Assets and liabilities are translated at exchange rates prevailing at the balance sheet dates. Revenues, costs and expenses are translated into U.S. dollars using daily exchange rates if the transaction is recorded in our accounting systems on a daily basis, and otherwise using average exchange rates for the period. Gains and losses resulting from the translation of our consolidated balance sheet are recorded as a component of accumulated other comprehensive income.
Realized gains and losses from foreign currency transactions are recognized as interest and other, net.
Derivative instruments
We have significant international revenues as well as costs denominated in foreign currencies, subjecting us to foreign currency risk. We purchase foreign currency exchange contracts that qualify as cash flow hedges, generally with maturities of
18
months or less, to reduce the volatility of cash flows related primarily to forecasted revenue and intercompany transactions denominated in certain foreign currencies. All outstanding designated derivatives that qualify for hedge accounting are recognized on the balance sheet at fair value. The effective portion of the designated derivative's gain or loss is initially reported as a component of accumulated other comprehensive income and is subsequently reclassified into the financial statement line item in which the hedged item is recorded in the same period the forecasted transaction affects earnings. We also economically hedge our exposure to foreign currency denominated monetary assets and liabilities with foreign currency contracts. The gains and losses on the foreign exchange contracts economically offset transaction gains and losses on certain foreign currency denominated monetary assets and liabilities recognized in earnings. Accordingly, these outstanding non-designated derivatives are recognized on the balance sheet at fair value and changes in fair value from these contracts are recorded in interest and other, net in the consolidated statement of income. Our derivatives program is not designed or operated for trading or speculative purposes.
Our derivative instruments expose us to credit risk to the extent that our counterparties may be unable to meet the terms of the agreements. We seek to mitigate this risk by limiting our counterparties to major financial institutions and by spreading the risk across several major financial institutions. In addition, the potential risk of loss with any one counterparty resulting from this type of credit risk is monitored on an ongoing basis. See “Note 9 - Derivative Instruments” for additional information related to our derivative instruments.
F-12
eBay Inc.
NOTES TO CONSOLIDATED FINANCIAL STATEMENTS—(Continued)
Concentration of credit risk
Our cash, cash equivalents, accounts receivable, loans and interest receivable, funds receivable and customer accounts are potentially subject to concentration of credit risk. Cash, cash equivalents and customer accounts are placed with financial institutions that management believes are of high credit quality. In addition, funds receivable are generated with financial institutions or credit card companies that management believes are of high credit quality. Our accounts receivable are derived from revenue earned from customers located in the U.S. and internationally. Our loans and interest receivable are derived from consumer financing activities for customers located in the U.S. As of
December 31, 2011
and
2010
, no customer accounted for more than 10% of net accounts receivable or net loans receivable. During the years ended
December 31, 2011, 2010 and 2009
, no customer accounted for more than 10% of net revenues.
Recent Accounting Pronouncements
In 2011, the Financial Accounting Standards Board ("FASB") issued new accounting guidance that amends some fair value measurement principles and disclosure requirements. The new guidance states that the concepts of highest and best use and valuation premise are only relevant when measuring the fair value of nonfinancial assets and prohibits the grouping of financial instruments for purposes of determining their fair values when the unit of account is specified in other guidance. We will adopt this accounting standard upon its effective date for periods beginning on or after December 15, 2011, and do not anticipate that this adoption will have a significant impact on our financial position or results of operations.
In 2011, the FASB issued new disclosure guidance related to the presentation of the Statement of Comprehensive Income. This guidance eliminates the current option to report other comprehensive income and its components in the consolidated statement of stockholders' equity. The requirement to present reclassification adjustments out of accumulated other comprehensive income on the face of the consolidated statement of income has been deferred. We will adopt this accounting standard upon its effective date for periods beginning on or after December 15, 2011, and this adoption will not have any impact on our financial position or results of operations but will impact our financial statement presentation.
In 2011, the FASB issued new accounting guidance that simplifies goodwill impairment tests. The new guidance states that a "qualitative" assessment may be performed to determine whether further impairment testing is necessary. We will adopt this accounting standard upon its effective date for periods beginning on or after December 15, 2011, and do not anticipate that this adoption will have a significant impact on our financial position or results of operations.
Basic net income per share is computed by dividing net income for the period by the weighted average number of common shares outstanding during the period. Diluted net income per share is computed by dividing net income for the period by the weighted average number of shares of common stock and potentially dilutive common stock outstanding during the period. The dilutive effect of outstanding options and restricted stock is reflected in diluted net income per share by application of the treasury stock method. The calculation of diluted net income per share excludes all anti-dilutive shares. The following table sets forth the computation of basic and diluted net income per share for the periods indicated:
F-13
eBay Inc.
NOTES TO CONSOLIDATED FINANCIAL STATEMENTS—(Continued)
|
|
Year Ended December 31,
|
||||||||||
|
|
2011
|
2010
|
2009
|
||||||||
|
(In thousands, except per share amounts)
|
|||||||||||
|
Numerator:
|
|||||||||||
|
Net income
|
$
|
3,229,387
|
|
$
|
1,800,961
|
|
$
|
2,389,097
|
|
||
|
Denominator:
|
|||||||||||
|
Weighted average common shares - basic
|
1,292,775
|
|
1,305,593
|
|
1,289,848
|
|
|||||
|
Dilutive effect of equity incentive plans
|
20,175
|
|
21,824
|
|
15,133
|
|
|||||
|
Weighted average common shares - diluted
|
1,312,950
|
|
1,327,417
|
|
1,304,981
|
|
|||||
|
Net income per share:
|
|||||||||||
|
Basic
|
$
|
2.50
|
|
$
|
1.38
|
|
$
|
1.85
|
|
||
|
Diluted
|
$
|
2.46
|
|
$
|
1.36
|
|
$
|
1.83
|
|
||
|
Common stock equivalents excluded from income per diluted share because their effect would have been anti-dilutive
|
16,762
|
|
31,509
|
|
53,026
|
|
|||||
Our acquisition activity in
2011
,
2010
and
2009
, was as follows:
2011 Acquisition Activity
During
2011
, we completed thirteen acquisitions, including the acquisitions of GSI, brands4friends, GittiGidiyor and Zong. Allocation of the purchase consideration for the business combinations completed in 2011 is summarized as follows (in thousands):
|
Purchase Consideration
|
Net Tangible Assets Acquired/(Liabilities Assumed)
|
Purchased Intangible Assets
|
Goodwill
|
|||||||||
|
GSI
|
$
|
2,377,257
|
|
$
|
74,498
|
|
$
|
819,100
|
|
$
|
1,483,659
|
|
|
brands4friends
|
193,236
|
|
(33,146
|
)
|
76,143
|
|
150,239
|
|
||||
|
GittiGidiyor
|
235,278
|
|
(8,787
|
)
|
52,700
|
|
191,365
|
|
||||
|
Zong
|
231,663
|
|
(35,650
|
)
|
76,500
|
|
190,813
|
|
||||
|
Other
|
401,713
|
|
(34,332
|
)
|
163,677
|
|
272,368
|
|
||||
|
Total
|
$
|
3,439,147
|
|
$
|
(37,417
|
)
|
$
|
1,188,120
|
|
$
|
2,288,444
|
|
The purchase consideration for each acquisition was allocated to the tangible assets and intangible assets acquired and liabilities assumed based on their estimated fair values on the acquisition date, with the remaining unallocated purchase consideration recorded as goodwill. The fair value assigned to identifiable intangible assets acquired has been determined primarily by using valuation methods that discount expected future cash flows to present value using estimates and assumptions determined by management. Purchased identifiable intangible assets are amortized on a straight-line basis over the respective useful lives. We generally do not expect goodwill to be deductible for income tax purposes. The estimation of fair values for tangible assets and intangible assets acquired and liabilities assumed was subject to estimates, assumptions and other uncertainties, and it is possible that the allocation of the purchase consideration reflected in the foregoing table may change.
GSI
Acquisition
We completed the acquisition of GSI on
June 17, 2011
. GSI is a leading provider of ecommerce and interactive marketing services. We acquired GSI to utilize its comprehensive integrated suite of online commerce and interactive marketing services to strengthen our ability to connect buyers and sellers worldwide. We paid
$29.25
per share, and assumed restricted stock-based awards with a fair value of approximately
$24.8 million
, resulting in total consideration of
F-14
approximately
$2.4 billion
. In addition, we paid an amount equal to
$0.33
per share or approximately
$24.3 million
, which was separate and distinct from the per share merger consideration, to certain GSI security holders in connection with the settlement of litigation related to the acquisition of GSI and recorded that payment in general and administrative expenses. GSI is reported as a separate segment.
Divestiture
In conjunction with the acquisition of GSI, we immediately divested
100
percent of GSI's licensed sports merchandise business and
70
percent of GSI's ShopRunner and RueLaLa businesses (together, the "divested businesses"). The divested businesses were sold to a Kynetic LLC (formerly known as NRG Commerce, LLC), which we refer to as Kynetic, led by GSI's former Chairman, President and Chief Executive Officer, Mr. Michael Rubin, for a note receivable with a face value of
$467.0 million
. The note receivable bears interest at an annual rate equal to
3-month LIBOR
plus
1.10%
, matures in December 2018, and is secured by certain assets of the divested businesses. The fair value of the note receivable was determined to be
$286.8 million
based on comparable market interest rates and is recorded in other assets in our consolidated balance sheet. The difference between the fair value of the note receivable and the carrying value of the divested businesses resulted in a loss of approximately
$256.5 million
. The loss was recorded in interest and other, net in our consolidated statement of income.
The carrying value of our retained
30
percent stake in the ShopRunner and RueLaLa businesses was
$75.2 million
and is recorded in long-term investments. We account for our retained interest in the ShopRunner and RueLaLa businesses under the equity method of accounting and record our proportionate share of net income (loss) on a one-quarter lag as a component of interest and other, net in our consolidated statement of income. Our exposure to loss resulting from our financing arrangement with Kynetic and equity investments in RueLaLa and ShopRunner is limited to the carrying value of the note receivable and equity investments, respectively. We have also entered into a transitional services agreement, pursuant to which GSI will provide to the divested businesses certain transitional services for a limited period, as well as certain other commercial agreements with Kynetic and its affiliates.
Intangible Assets
The following table sets forth the components of intangible assets acquired in connection with the GSI acquisition (excluding intangible assets sold in connection with the divested businesses) (in thousands, except years):
|
Description
|
Fair Value
|
Useful Life (Years)
|
||
|
Trademarks
|
$
|
8,400
|
|
2
|
|
User base
|
667,900
|
|
5
|
|
|
Developed technology
|
142,800
|
|
5
|
|
|
Total
|
$
|
819,100
|
|
|
The allocation of the purchase price for the acquisition has been prepared on a preliminary basis and changes to that allocation may occur as additional information becomes available. We have included the financial results of GSI in our consolidated financial statements from the date of acquisition.
F-15
Pro forma financial information
The unaudited pro forma financial information in the table below summarizes the combined results of our operations and those of GSI for the periods shown as though the acquisition of GSI and the sale of the divested businesses had occurred as of the beginning of fiscal year 2010. The pro forma financial information for the periods presented includes the business combination accounting effects of the acquisition, including amortization charges from acquired intangible assets. The pro forma financial information as presented below is for informational purposes only, is subject to a number of estimates, assumptions and other uncertainties, and is not indicative of the results of operations that would have been achieved if the acquisition and divestiture had taken place at January 1, 2010. The unaudited pro forma financial information is as follows (in thousands, except per share amounts):
|
Year Ended December 31,
|
|||||||
|
2011
|
2010
|
||||||
|
Total revenues
|
$
|
12,037,877
|
|
$
|
10,023,866
|
|
|
|
Net income
|
3,169,301
|
|
1,682,396
|
|
|||
|
Basic earnings per share
|
2.45
|
|
1.29
|
|
|||
|
Diluted earnings per share
|
$
|
2.41
|
|
$
|
1.27
|
|
|
brands4friends
Brands4friends, an online shopping club for fashion and lifestyle in Germany, was acquired during the first quarter of 2011 for total cash consideration of approximately
$193.2 million
. This company is included in our Marketplaces segment. The allocation of the purchase price for this acquisition has been prepared on a preliminary basis and changes to that allocation may occur as additional information becomes available. Our consolidated financial statements include the operating results of brands4friends from the date of acquisition. Pro forma results of operations have not been presented because the effect of the acquisition was not material to our consolidated results of operations.
GittiGidiyor
In the second quarter of 2011, we acquired additional shares of GittiGidiyor, an online marketplace in Turkey. We previously held a non-controlling interest in GittiGidiyor, and following the completion of the acquisition of these additional shares, we own approximately
93%
of the outstanding shares of GittiGidiyor. The following table summarizes the purchase consideration (in thousands):
|
Cash paid
|
$
|
182,068
|
|
|
Fair value of non-controlling interest
|
31,495
|
|
|
|
Fair value of previously held equity interest
|
21,715
|
|
|
|
Total purchase consideration
|
$
|
235,278
|
|
This company is included in our Marketplaces segment. As a result of obtaining control over GittiGidiyor, our previously held
10%
interest was remeasured to fair value resulting in a gain of
$17.1 million
. The gain has been recognized in interest and other, net in our consolidated statement of income. We recorded the remaining non-controlling interest in additional paid-in capital in our consolidated balance sheet as the amount is not significant. The allocation of the purchase price for this acquisition has been prepared on a preliminary basis and changes to that allocation may occur as additional information becomes available. Our consolidated financial statements include the operating results of GittiGidiyor from the date of acquisition. Pro forma results of operations have not been presented because the effect of the acquisition was not material to our consolidated results of operations.
Zong
Zong is a provider of payment services through mobile carrier billing. We completed the acquisition of Zong on
August 11, 2011
, for total cash consideration of approximately
$231.7 million
. The business is included in our Payments segment. The allocation of the purchase price for this acquisition has been prepared on a preliminary basis and changes to that allocation may occur as additional information becomes available. Our consolidated financial statements include the operating results of Zong from the date of acquisition. Pro forma results of operations have not been presented because the effect of the acquisition was not material to our consolidated results of operations
F-16
Other
|
•
|
Magento
|
We completed our acquisition of Magento, which operates an ecommerce storefront platform, on
August 16, 2011
. We previously held a non-controlling interest in Magento of
49.9%
of the outstanding shares, and following the completion of the acquisition, we own
100%
of the outstanding shares of Magento. As a result of obtaining control over Magento, our previously held interest was remeasured to fair value, which resulted in a gain of
$56.3 million
. The gain has been recognized in interest and other, net in our consolidated statement of income. Our consolidated financial statements include the operating results of Magento from the date of acquisition. Magento is included in our X.commerce initiative. Pro forma results of operations have not been presented because the effect of the acquisition was not material to our consolidated results of operations.
|
•
|
Other
|
Other acquisition activity during 2011 consisted of eight acquisitions. Four acquisitions are included in our Marketplaces segment and four acquisitions are included in our Payments segment. The purchase consideration for these acquisitions consisted solely of cash. The allocations of the purchase price for these acquisitions have been prepared on a preliminary basis and changes to those allocations may occur as additional information becomes available. Our consolidated financial statements include the operating results of all of these acquisitions from the respective dates of acquisition. Pro forma results of operations have not been presented because the effect of these acquisitions was not material to our consolidated results of operations.
2010 Acquisition Activity
We acquired three companies during 2010 for aggregate purchase consideration of
$95.9 million
consisting primarily of cash. Each of these three companies is included in our Marketplaces segment. Allocation of the purchase consideration resulted in net tangible assets of
$0.3 million
, purchased intangible assets of
$18.0 million
and goodwill of
$77.6 million
.
2009 Acquisition Activity
We acquired Gmarket during the second quarter of 2009. Gmarket is a retail ecommerce marketplace in Korea, and is included in our Marketplaces segment. Gmarket's purchase consideration included cash of
$1.2 billion
, fair value of minority interest of
$12.2 million
and fair value of options assumed of
$5.4 million
.
Allocation of the purchase consideration for Gmarket is summarized as follows (in thousands):
|
Purchase Consideration
|
Net Tangible Assets Acquired/(Liabilities Assumed)
|
Purchased Intangible Assets
|
Goodwill
|
|||||||||
|
Gmarket Inc.
|
$
|
1,226,968
|
|
$
|
50,526
|
|
$
|
378,496
|
|
$
|
797,946
|
|
Historically, we had a Communications segment that consisted of Skype Technologies S.A. (“Skype”). On November 19, 2009, we sold Skype to an investor group. We received cash proceeds of approximately
$1.9 billion
, a subordinated note issued by a subsidiary of the Buyer in the principal amount of
$125.0 million
and a
30
percent equity stake in the outstanding capital stock of the Buyer. The sale resulted in a net gain of
$1.4 billion
, which was recorded in interest and other, net in our consolidated statement of income. In conjunction with the sale of Skype, we reached a legal settlement of a lawsuit between Skype, Joltid and entities controlled by Joltid's founders, which resulted in a
$343.2 million
charge to general and administrative expenses. Our non-controlling interest in Skype for periods after the completion of the sale was accounted for under the equity method of accounting.
On October 13, 2011, Microsoft Corp. completed its acquisition of Skype and we received approximately
$2.3 billion
in cash for our remaining
30
percent equity stake in Skype. The sale resulted in a gain of approximately
$1.7 billion
, which was recorded in interest and other, net in our consolidated statement of income.
F-17
eBay Inc.
NOTES TO CONSOLIDATED FINANCIAL STATEMENTS—(Continued)
Goodwill
The following table presents goodwill balances and adjustments to those balances for each of our reportable segments and corporate investments for the year ended
December 31, 2011
:
|
|
December 31,
2010 |
Goodwill
Acquired
|
|
Allocations
|
Adjustments
|
|
December 31,
2011 |
||||||||||||
|
(In thousands)
|
|||||||||||||||||||
|
Marketplaces
|
$
|
4,071,772
|
|
$
|
380,090
|
|
$
|
186,560
|
|
$
|
(101,632
|
)
|
|
$
|
4,536,790
|
|
|||
|
Payments
|
2,148,752
|
|
310,457
|
|
57,200
|
|
(1,290
|
)
|
|
2,515,119
|
|
||||||||
|
GSI
|
—
|
|
1,483,659
|
|
(176,500
|
)
|
(13,665
|
)
|
1,293,494
|
|
|||||||||
|
Corporate and other
|
—
|
|
114,238
|
|
(67,260
|
)
|
(33
|
)
|
46,945
|
|
|||||||||
|
Total Goodwill
|
$
|
6,220,524
|
|
$
|
2,288,444
|
|
$
|
—
|
|
$
|
(116,620
|
)
|
$
|
8,392,348
|
|
||||
A portion of goodwill acquired as part of the GSI acquisition and Magento acquisition (included in Corporate and Other) was allocated to the Marketplaces and Payments segments based on synergies expected to be realized. The adjustments to goodwill during the year ended
December 31, 2011
were due primarily to foreign currency translation.
Investments accounted for under the equity method of accounting are classified on our consolidated balance sheet as long-term investments. Such investment balances include any related goodwill. As of
December 31, 2011
and
2010
, the goodwill related to our equity method investments was approximately
$27.4 million
.
We conducted our annual impairment test of goodwill as of August 31, 2011 and determined that no adjustment to the carrying value of goodwill for any reportable units was necessary. As of
December 31, 2011
, we determined that no events or circumstances from August 31, 2011 through
December 31, 2011
indicated that a further assessment was necessary.
Intangible Assets
The components of identifiable intangible assets are as follows:
|
|
December 31, 2011
|
December 31, 2010
|
|||||||||||||||||||||||||
|
|
Gross Carrying Amount
|
Accumulated Amortization
|
Net Carrying Amount
|
Weighted Average Useful Life (Years)
|
Gross Carrying Amount
|
Accumulated Amortization
|
Net Carrying Amount
|
Weighted Average Useful Life (Years)
|
|||||||||||||||||||
|
|
(In thousands, except years)
|
||||||||||||||||||||||||||
|
Intangible assets:
|
|
|
|
|
|
|
|
|
|||||||||||||||||||
|
Customer lists and user base
|
$
|
1,633,423
|
|
$
|
(786,623
|
)
|
$
|
846,800
|
|
5
|
$
|
831,806
|
|
$
|
(625,126
|
)
|
$
|
206,680
|
|
6
|
|||||||
|
Trademarks and trade names
|
729,907
|
|
(468,905
|
)
|
261,002
|
|
5
|
632,899
|
|
(381,456
|
)
|
251,443
|
|
5
|
|||||||||||||
|
Developed technologies
|
497,883
|
|
(249,228
|
)
|
248,655
|
|
3
|
231,312
|
|
(192,421
|
)
|
38,891
|
|
3
|
|||||||||||||
|
All other
|
181,755
|
|
(131,832
|
)
|
49,923
|
|
4
|
156,306
|
|
(112,609
|
)
|
43,697
|
|
4
|
|||||||||||||
|
|
$
|
3,042,968
|
|
$
|
(1,636,588
|
)
|
$
|
1,406,380
|
|
|
$
|
1,852,323
|
|
$
|
(1,311,612
|
)
|
$
|
540,711
|
|
|
|||||||
Amortization expense for intangible assets was
$337.2 million
,
$254.1 million
and
$337.5 million
for the years ended
December 31, 2011
,
2010
and
2009
, respectively.
F-18
eBay Inc.
NOTES TO CONSOLIDATED FINANCIAL STATEMENTS—(Continued)
Expected future intangible asset amortization as of
December 31, 2011
is as follows (in thousands):
|
Fiscal Years:
|
||||
|
2012
|
$
|
411,300
|
|
|
|
2013
|
375,326
|
|
||
|
2014
|
267,248
|
|
||
|
2015
|
218,235
|
|
||
|
2016
|
96,351
|
|
||
|
Thereafter
|
37,920
|
|
||
|
$
|
1,406,380
|
|
||
We have three reporting segments: Marketplaces, Payments and GSI. We allocate resources to and assess the performance of each reporting segment using information about its revenue and operating income (loss). We do not evaluate operating segments using discrete asset information. We do not allocate gains and losses from equity investments, interest and other income, or taxes to operating segments.
The corporate and other category includes income, expenses and charges such as:
|
•
|
results of operations of our X.commerce initiative, which supports our businesses. Our X.commerce initiative was launched in conjunction with our acquisition of Magento in the third quarter of 2011;
|
|
•
|
corporate management costs, such as human resources, finance and legal, not allocated to our segments;
|
|
•
|
amortization of intangible assets;
|
|
•
|
restructuring charges; and
|
|
•
|
stock-based compensation expense.
|
F-19
eBay Inc.
NOTES TO CONSOLIDATED FINANCIAL STATEMENTS—(Continued)
The following tables summarize the financial performance of our operating segments (in the case of our GSI segment, the following information reflects its operating results from June 17, 2011, the date we acquired GSI):
|
|
Year Ended December 31,
|
||||||||||
|
|
2011
|
2010
|
2009
|
||||||||
|
(In thousands)
|
|||||||||||
|
Net Revenue
|
|||||||||||
|
Marketplaces
|
|||||||||||
|
Net transaction revenues
|
$
|
5,431,308
|
|
$
|
4,800,193
|
|
$
|
4,461,845
|
|
||
|
Marketing services and other revenues
|
1,210,462
|
|
920,434
|
|
849,169
|
|
|||||
|
6,641,770
|
|
5,720,627
|
|
5,311,014
|
|
||||||
|
Payments
|
|||||||||||
|
Net transaction revenues
|
4,123,302
|
|
3,261,314
|
|
2,641,194
|
|
|||||
|
Marketing services and other revenues
|
288,833
|
|
174,333
|
|
154,751
|
|
|||||
|
4,412,135
|
|
3,435,647
|
|
2,795,945
|
|
||||||
|
GSI
|
|||||||||||
|
Net transaction revenues
|
459,659
|
|
—
|
|
—
|
|
|||||
|
Marketing services and other revenues
|
130,405
|
|
—
|
|
—
|
|
|||||
|
590,064
|
|
—
|
|
—
|
|
||||||
|
Communications
|
|||||||||||
|
Net transaction revenues
|
—
|
|
—
|
|
575,096
|
|
|||||
|
Marketing services and other revenues
|
—
|
|
—
|
|
45,307
|
|
|||||
|
—
|
|
—
|
|
620,403
|
|
||||||
|
Corporate and other
|
|||||||||||
|
Marketing services and other revenues
|
7,685
|
|
—
|
|
—
|
|
|||||
|
Total net revenue
|
$
|
11,651,654
|
|
$
|
9,156,274
|
|
$
|
8,727,362
|
|
||
|
Operating income (loss)
|
|||||||||||
|
Marketplaces
|
$
|
2,630,639
|
|
$
|
2,304,748
|
|
$
|
2,251,920
|
|
||
|
Payments
|
978,042
|
|
721,641
|
|
463,382
|
|
|||||
|
GSI
|
83,241
|
|
—
|
|
—
|
|
|||||
|
Communications
|
—
|
|
—
|
|
157,702
|
|
|||||
|
Corporate and other
|
(1,318,433
|
)
|
(972,818
|
)
|
(1,416,238
|
)
|
|||||
|
Total operating income (loss)
|
$
|
2,373,489
|
|
$
|
2,053,571
|
|
$
|
1,456,766
|
|
||
F-20
eBay Inc.
NOTES TO CONSOLIDATED FINANCIAL STATEMENTS—(Continued)
The following tables summarize the allocation of net revenues and long-lived tangible assets based on geography (in thousands):
|
|
Year Ended December 31,
|
||||||||||
|
|
2011
|
|
2010
|
|
2009
|
||||||
|
U.S.
|
$
|
5,483,641
|
|
|
$
|
4,214,215
|
|
|
$
|
3,985,068
|
|
|
Germany
|
1,538,738
|
|
|
1,204,056
|
|
|
1,140,205
|
|
|||
|
United Kingdom
|
1,572,192
|
|
|
1,266,603
|
|
|
1,054,730
|
|
|||
|
Rest of world
|
3,057,083
|
|
|
2,471,400
|
|
|
2,547,359
|
|
|||
|
Total net revenues
|
$
|
11,651,654
|
|
|
$
|
9,156,274
|
|
|
$
|
8,727,362
|
|
|
|
December 31,
|
||||||
|
|
2011
|
|
2010
|
||||
|
U.S.
|
$
|
2,202,626
|
|
|
$
|
1,465,234
|
|
|
International
|
128,151
|
|
|
186,251
|
|
||
|
Total long-lived tangible assets
|
$
|
2,330,777
|
|
|
$
|
1,651,485
|
|
Net revenues are attributed to U.S. and international geographies primarily based upon the country in which the seller, payment recipient, customer, Skype user's Internet protocol address (through November 19, 2009), website that displays advertising, or other service provider, as the case may be, is located. Long-lived assets attributed to the U.S. and international geographies are based upon the country in which the asset is located or owned.
At
December 31, 2011
and
2010
, the estimated fair value of our short-term and long-term investments classified as available for sale, are as follows:
|
|
December 31, 2011
|
||||||||||||||
|
|
Gross
Amortized
Cost
|
|
Gross
Unrealized
Gains
|
|
Gross
Unrealized
Losses
|
|
Estimated
Fair Value
|
||||||||
|
(In thousands)
|
|||||||||||||||
|
Short-term investments:
|
|
|
|
||||||||||||
|
Restricted cash
|
$
|
19,490
|
|
|
$
|
—
|
|
|
$
|
—
|
|
|
$
|
19,490
|
|
|
Corporate debt securities
|
447,804
|
|
|
1,075
|
|
|
(384
|
)
|
|
448,495
|
|
||||
|
Government and agency securities
|
42,071
|
|
|
17
|
|
|
(2
|
)
|
|
42,086
|
|
||||
|
Time deposits and other
|
81,883
|
|
|
—
|
|
|
—
|
|
|
81,883
|
|
||||
|
Equity instruments
|
8,507
|
|
|
637,840
|
|
|
—
|
|
|
646,347
|
|
||||
|
$
|
599,755
|
|
|
$
|
638,932
|
|
|
$
|
(386
|
)
|
|
$
|
1,238,301
|
|
|
|
Long-term investments:
|
|
|
|
||||||||||||
|
Restricted cash
|
$
|
1,342
|
|
|
$
|
—
|
|
|
$
|
—
|
|
|
$
|
1,342
|
|
|
Corporate debt securities
|
2,237,395
|
|
|
6,335
|
|
|
(58,026
|
)
|
|
2,185,704
|
|
||||
|
Government and agency securities
|
70,015
|
|
|
1,131
|
|
|
(1
|
)
|
|
71,145
|
|
||||
|
$
|
2,308,752
|
|
|
$
|
7,466
|
|
|
$
|
(58,027
|
)
|
|
$
|
2,258,191
|
|
|
F-21
eBay Inc.
NOTES TO CONSOLIDATED FINANCIAL STATEMENTS—(Continued)
|
|
December 31, 2010
|
||||||||||||||
|
|
Gross
Amortized
Cost
|
|
Gross
Unrealized
Gains
|
|
Gross
Unrealized
Losses
|
|
Estimated
Fair Value
|
||||||||
|
(In thousands)
|
|||||||||||||||
|
Short-term investments:
|
|
|
|
||||||||||||
|
Restricted cash
|
$
|
20,351
|
|
|
$
|
—
|
|
|
$
|
—
|
|
|
$
|
20,351
|
|
|
Corporate debt securities
|
371,998
|
|
|
391
|
|
|
(164
|
)
|
|
372,225
|
|
||||
|
Government and agency securities
|
66,437
|
|
|
98
|
|
|
(1
|
)
|
|
66,534
|
|
||||
|
Time deposits and other
|
44,772
|
|
|
—
|
|
|
—
|
|
|
44,772
|
|
||||
|
Equity instruments
|
8,507
|
|
|
533,014
|
|
|
—
|
|
|
541,521
|
|
||||
|
$
|
512,065
|
|
|
$
|
533,503
|
|
|
$
|
(165
|
)
|
|
$
|
1,045,403
|
|
|
|
Long-term investments:
|
|
|
|
||||||||||||
|
Restricted cash
|
$
|
1,332
|
|
|
$
|
—
|
|
|
$
|
—
|
|
|
$
|
1,332
|
|
|
Corporate debt securities
|
1,606,723
|
|
|
4,541
|
|
|
(5,494
|
)
|
|
1,605,770
|
|
||||
|
Government and agency securities
|
152,170
|
|
|
149
|
|
|
(1,353
|
)
|
|
150,966
|
|
||||
|
$
|
1,760,225
|
|
|
$
|
4,690
|
|
|
$
|
(6,847
|
)
|
|
$
|
1,758,068
|
|
|
At December 31, 2011 and 2010, we held
$5.2 million
and
$4.5 million
, respectively, of time deposits classified as held to maturity which are recorded at amortized cost.
The following table summarizes the fair value and gross unrealized losses of our short-term and long-term investments, aggregated by type of investment instrument and length of time that individual securities have been in a continuous unrealized loss position, at
December 31, 2011
(in thousands):
|
|
Less than 12 Months
|
|
12 Months or Greater
|
|
Total
|
||||||||||||||||||
|
|
Fair Value
|
|
Gross
Unrealized
Losses
|
|
Fair Value
|
|
Gross
Unrealized
Losses
|
|
Fair Value
|
|
Gross
Unrealized
Losses
|
||||||||||||
|
Corporate debt securities
|
$
|
2,614,561
|
|
$
|
(57,523
|
)
|
$
|
19,638
|
|
$
|
(887
|
)
|
$
|
2,634,199
|
|
$
|
(58,410
|
)
|
|||||
|
Government and agency securities
|
113,231
|
|
(3
|
)
|
—
|
|
—
|
|
113,231
|
|
(3
|
)
|
|||||||||||
|
$
|
2,727,792
|
|
$
|
(57,526
|
)
|
$
|
19,638
|
|
$
|
(887
|
)
|
$
|
2,747,430
|
|
$
|
(58,413
|
)
|
||||||
Our fixed-income investment portfolio consists of corporate debt securities, government and agency securities and time deposits that have a maximum maturity of
five
years. The corporate debt and government and agency securities that we invest in are generally deemed to be low risk based on their credit ratings from the major rating agencies. The longer the duration of these securities, the more susceptible they are to changes in market interest rates and bond yields. As interest rates increase, those securities purchased at a lower yield show a mark-to-market unrealized loss. The unrealized losses are due primarily to changes in credit spreads and interest rates. We expect to realize the full value of all these investments upon maturity or sale. As of
December 31, 2011
, these securities had a weighted average remaining duration of approximately
13
months. Restricted cash is held primarily in money market funds and interest bearing accounts for letters of credit related primarily to our global sabbatical program and various lease arrangements.
The estimated fair values of our short-term and long-term investments classified as available for sale by date of contractual maturity at
December 31, 2011
are as follows (in thousands):
|
|
December 31,
2011 |
||
|
One year or less (including restricted cash of $19,490)
|
$
|
1,238,301
|
|
|
One year through two years
|
1,001,970
|
|
|
|
Two years through three years
|
727,175
|
|
|
|
Three years through four years
|
328,229
|
|
|
|
Four years through five years
|
200,817
|
|
|
|
$
|
3,496,492
|
|
|
F-22
eBay Inc.
NOTES TO CONSOLIDATED FINANCIAL STATEMENTS—(Continued)
Equity and cost method investments
We have made multiple equity and cost method investments which are reported in long-term investments on our consolidated balance sheet. As of
December 31, 2011
and
2010
, our equity and cost method investments totaled
$189.9 million
and
$729.4 million
, respectively.
The following tables summarize our financial assets and liabilities measured at fair value on a recurring basis as of
December 31, 2011
and
2010
:
|
Description
|
Balance as of
December 31, 2011
|
Quoted Prices in
Active Markets for
Identical Assets
(Level 1)
|
Significant Other
Observable Inputs
(Level 2)
|
|||||||||
|
(In thousands)
|
||||||||||||
|
Assets:
|
|
|
|
|||||||||
|
Cash and cash equivalents
|
$
|
4,691,101
|
|
$
|
4,691,101
|
|
$
|
—
|
|
|||
|
Short-term investments:
|
||||||||||||
|
Restricted cash
|
19,490
|
|
19,490
|
|
—
|
|
||||||
|
Corporate debt securities
|
448,495
|
|
—
|
|
448,495
|
|
||||||
|
Government and agency securities
|
42,086
|
|
—
|
|
42,086
|
|
||||||
|
Time deposits
|
81,883
|
|
—
|
|
81,883
|
|
||||||
|
Equity instruments
|
646,347
|
|
646,347
|
|
—
|
|
||||||
|
Total short-term investments
|
1,238,301
|
|
665,837
|
|
572,464
|
|
||||||
|
Derivatives
|
111,628
|
|
—
|
|
111,628
|
|
||||||
|
Long-term investments:
|
||||||||||||
|
Restricted cash
|
1,342
|
|
1,342
|
|
—
|
|
||||||
|
Corporate debt securities
|
2,185,704
|
|
—
|
|
2,185,704
|
|
||||||
|
Government and agency securities
|
71,145
|
|
—
|
|
71,145
|
|
||||||
|
Total long-term investments
|
2,258,191
|
|
1,342
|
|
2,256,849
|
|
||||||
|
Total financial assets
|
$
|
8,299,221
|
|
$
|
5,358,280
|
|
$
|
2,940,941
|
|
|||
|
Liabilities:
|
||||||||||||
|
Derivatives
|
$
|
60,227
|
|
$
|
—
|
|
$
|
60,227
|
|
|||
F-23
eBay Inc.
NOTES TO CONSOLIDATED FINANCIAL STATEMENTS—(Continued)
|
Description
|
Balance as of
December 31, 2010
|
Quoted Prices in
Active Markets for
Identical Assets
(Level 1)
|
Significant Other
Observable Inputs
(Level 2)
|
|||||||||
|
(In thousands)
|
||||||||||||
|
Assets:
|
|
|
|
|||||||||
|
Cash and cash equivalents
|
$
|
5,577,411
|
|
$
|
5,577,411
|
|
$
|
—
|
|
|||
|
Short-term investments:
|
||||||||||||
|
Restricted cash
|
20,351
|
|
20,351
|
|
—
|
|
||||||
|
Corporate debt securities
|
372,225
|
|
—
|
|
372,225
|
|
||||||
|
Government and agency securities
|
66,534
|
|
—
|
|
66,534
|
|
||||||
|
Time deposits
|
44,772
|
|
—
|
|
44,772
|
|
||||||
|
Equity instruments
|
541,521
|
|
541,521
|
|
—
|
|
||||||
|
Total short-term investments
|
1,045,403
|
|
561,872
|
|
483,531
|
|
||||||
|
Derivatives
|
37,196
|
|
—
|
|
37,196
|
|
||||||
|
Long-term investments:
|
||||||||||||
|
Restricted cash
|
1,332
|
|
1,332
|
|
—
|
|
||||||
|
Corporate debt securities
|
1,605,770
|
|
—
|
|
1,605,770
|
|
||||||
|
Government and agency securities
|
150,966
|
|
—
|
|
150,966
|
|
||||||
|
Total long-term investments
|
1,758,068
|
|
1,332
|
|
1,756,736
|
|
||||||
|
Total financial assets
|
$
|
8,418,078
|
|
$
|
6,140,615
|
|
$
|
2,277,463
|
|
|||
|
Liabilities:
|
||||||||||||
|
Derivatives
|
$
|
4,963
|
|
$
|
—
|
|
$
|
4,963
|
|
|||
Our financial assets and liabilities are valued using market prices on both active markets (level 1) and less active markets (level 2). Level 1 instrument valuations are obtained from real-time quotes for transactions in active exchange markets involving identical assets. Level 2 instrument valuations are obtained from readily available pricing sources for comparable instruments or identical instruments in less active markets. Our derivative instruments are valued using pricing models that take into account the contract terms as well as multiple inputs where applicable, such as equity prices, interest rate yield curves, option volatility and currency rates. Our derivative instruments are short-term in nature, typically one month to one year in duration. Cash and cash equivalents and short-term, highly liquid investments with original or remaining maturities of three months or less when purchased are mainly comprised of bank deposits and money market funds.
In addition to the long-term investments noted above, we had approximately
$189.9 million
and
$729.4 million
of cost and equity method investments included in long-term investments on our consolidated balance sheet at
December 31, 2011
and
2010
, respectively.
As of
December 31, 2011
, we held no direct investments in auction rate securities, collateralized debt obligations, structured investment vehicles or mortgage-backed securities.
In Europe, we have two cash pooling arrangements with a financial institution for cash management purposes. These arrangements allow for cash withdrawals from this financial institution based upon our aggregate operating cash balances held in Europe within the same financial institution (“Aggregate Cash Deposits”). These arrangements also allow us to withdraw amounts exceeding the Aggregate Cash Deposits up to an agreed-upon limit. The net balance of the withdrawals and the Aggregate Cash Deposits are used by the financial institution as a basis for calculating our net interest expense or income. As of
December 31, 2011
, we had a total of
$4.9 billion
in cash withdrawals offsetting our
$4.9 billion
in Aggregate Cash Deposits held within the same financial institution under these cash pooling arrangements.
Other financial instruments, including accounts receivable, loans and interest receivable, funds receivable, customer accounts, short-term debt, accounts payable, funds payable and amounts due to customers are carried at cost, which approximates their fair value because of the short-term nature of these instruments.
F-24
eBay Inc.
NOTES TO CONSOLIDATED FINANCIAL STATEMENTS—(Continued)
The notional amounts associated with our foreign currency contracts at
December 31, 2011
and
2010
were
$4.2 billion
and
$1.8 billion
, respectively, of which
$2.0 billion
and
$1.2 billion
, respectively, were designated as cash flow hedges. Derivative transactions are measured in terms of the notional amount, but this amount is not recorded on the balance sheet and is not, when viewed in isolation, a meaningful measure of the risk profile of the instruments. The notional amount is generally not exchanged, but is used only as the basis on which the value of foreign exchange payments under these contracts are determined
.
Fair Value of Derivative Contracts
The fair value of our outstanding derivative instruments was as follows:
|
|
Derivative Assets Reported in Other Current Assets
|
Derivative Liabilities Reported in Other Current Liabilities
|
|||||||||||||
|
|
December 31,
2011 |
December 31,
2010 |
December 31,
2011 |
December 31,
2010 |
|||||||||||
|
(In thousands)
|
|||||||||||||||
|
Foreign exchange contracts designated as cash flow hedges
|
$
|
74,772
|
|
$
|
35,853
|
|
$
|
2,927
|
|
$
|
4,162
|
|
|||
|
Foreign exchange contracts not designated as hedging instruments
|
28,885
|
|
1,343
|
|
57,300
|
|
801
|
|
|||||||
|
Other contracts not designated as hedging instruments
|
7,971
|
|
—
|
|
—
|
|
—
|
|
|||||||
|
Total fair value of derivative instruments
|
$
|
111,628
|
|
$
|
37,196
|
|
$
|
60,227
|
|
$
|
4,963
|
|
|||
Effect of Derivative Contracts on Accumulated Other Comprehensive Income
The following table summarizes the activity of derivative contracts that qualify for hedge accounting as of
December 31, 2011
and
2010
, and the impact of designated derivative contracts on accumulated other comprehensive income for the years ended
December 31, 2011
and
2010
:
|
|
December 31, 2010
|
Amount of gain (loss)
recognized in other
comprehensive income
(effective portion)
|
Amount of gain (loss)
reclassified from
accumulated other
comprehensive income
to net revenue and operating expense
(effective portion)
|
December 31, 2011
|
|||||||||||
|
(In thousands)
|
|||||||||||||||
|
Foreign exchange contracts designated as cash flow hedges
|
$
|
13,560
|
|
$
|
71,849
|
|
$
|
13,560
|
|
$
|
71,849
|
|
|||
|
|
December 31, 2009
|
Amount of gain (loss)
recognized in other
comprehensive income
(effective portion)
|
Amount of gain (loss)
reclassified from
accumulated other
comprehensive income
to net revenue and operating expense
(effective portion)
|
December 31, 2010
|
|||||||||||
|
(In thousands)
|
|||||||||||||||
|
Foreign exchange contracts designated as cash flow hedges
|
$
|
(4,821
|
)
|
$
|
30,385
|
|
$
|
12,004
|
|
$
|
13,560
|
|
|||
F-25
eBay Inc.
NOTES TO CONSOLIDATED FINANCIAL STATEMENTS—(Continued)
Effect of Derivative Contracts on Consolidated Statement of Income
The following table provides the location in our financial statements of the recognized gains or losses related to our derivative instruments:
|
Year Ended December 31,
|
|||||||||||
|
|
2011
|
2010
|
2009
|
||||||||
|
(In thousands)
|
|||||||||||
|
Foreign exchange contracts designated as cash flow hedges recognized in net revenues
|
$
|
(25,863
|
)
|
$
|
11,135
|
|
$
|
15,430
|
|
||
|
Foreign exchange contracts designated as cash flow hedges recognized in operating expenses
|
(7,062
|
)
|
—
|
|
—
|
|
|||||
|
Foreign exchange contracts not designated as hedging instruments recognized in interest and other, net
|
(5,365
|
)
|
(9,345
|
)
|
(28,933
|
)
|
|||||
|
Other contracts not designated as hedging instruments recognized in interest and other, net
|
(569
|
)
|
—
|
|
—
|
|
|||||
|
Total gain (loss) recognized from derivative contracts in the consolidated statement of income
|
$
|
(38,859
|
)
|
$
|
1,790
|
|
$
|
(13,503
|
)
|
||
|
|
As of December 31,
|
||||||
|
2011
|
|
2010
|
|||||
|
(In thousands)
|
|||||||
|
Other current assets:
|
|
||||||
|
Prepaid expenses
|
$
|
169,491
|
|
|
$
|
115,476
|
|
|
Income tax receivable
|
2,603
|
|
172,869
|
|
|||
|
Deferred tax assets, net
|
47,968
|
|
|
39,338
|
|
||
|
Interest receivables
|
42,061
|
|
23,182
|
|
|||
|
Derivatives
|
111,628
|
|
|
37,196
|
|
||
|
Other
|
207,685
|
|
|
93,177
|
|
||
|
$
|
581,436
|
|
|
$
|
481,238
|
|
|
|
|
As of December 31,
|
||||||
|
2011
|
|
2010
|
|||||
|
(In thousands)
|
|||||||
|
Property and equipment, net:
|
|
||||||
|
Computer equipment and software
|
$
|
3,369,012
|
|
|
$
|
2,729,736
|
|
|
Land and buildings, including building improvements
|
783,891
|
|
|
688,282
|
|
||
|
Leasehold improvements
|
338,501
|
|
|
288,912
|
|
||
|
Furniture and fixtures
|
149,633
|
|
|
115,588
|
|
||
|
Construction in progress and other
|
235,745
|
|
|
140,263
|
|
||
|
4,876,782
|
|
|
3,962,781
|
|
|||
|
Accumulated depreciation
|
(2,890,566
|
)
|
|
(2,439,448
|
)
|
||
|
$
|
1,986,216
|
|
|
$
|
1,523,333
|
|
|
Total depreciation expense on our property and equipment in the years ended
December 31, 2011
,
2010
and
2009
totaled
$602.8 million
,
$508.4 million
and
$473.4 million
, respectively.
F-26
eBay Inc.
NOTES TO CONSOLIDATED FINANCIAL STATEMENTS—(Continued)
|
|
As of December 31,
|
||||||
|
|
2011
|
|
2010
|
||||
|
|
(In thousands)
|
||||||
|
Accrued expenses and other current liabilities:
|
|
||||||
|
Acquisition related accrued expenses
|
$
|
23,747
|
|
|
$
|
8,266
|
|
|
Advertising
|
101,296
|
|
|
100,314
|
|
||
|
Compensation and related benefits
|
489,090
|
|
|
348,497
|
|
||
|
Contractors and consultants
|
71,209
|
|
|
66,216
|
|
||
|
Liability for unrecognized tax benefits
|
—
|
|
208,500
|
|
|||
|
Professional fees
|
127,665
|
|
|
147,880
|
|
||
|
Restructuring
|
2,244
|
|
|
5,984
|
|
||
|
Transaction loss accrual
|
62,401
|
|
|
31,900
|
|
||
|
VAT accrual
|
99,366
|
|
|
124,943
|
|
||
|
Other current liabilities
|
533,818
|
|
|
301,388
|
|
||
|
$
|
1,510,836
|
|
|
$
|
1,343,888
|
|
|
|
|
As of December 31,
|
||||||
|
|
2011
|
|
2010
|
||||
|
|
(In thousands)
|
||||||
|
Accumulated other comprehensive income:
|
|
||||||
|
Foreign currency translation
|
$
|
113,905
|
|
|
$
|
394,835
|
|
|
Unrealized gains on investments
|
587,985
|
|
|
531,181
|
|
||
|
Unrealized gains (losses) on cash flow hedges
|
71,849
|
|
|
13,560
|
|
||
|
Estimated tax provision on above items
|
(224,271
|
)
|
|
(188,262
|
)
|
||
|
$
|
549,468
|
|
|
$
|
751,314
|
|
|
2009 Customer Service Consolidation
In 2009, we began the consolidation of certain customer service facilities in North America and Europe to streamline our operations and deliver better and more efficient customer support to our users. We completed these activities during the first quarter of 2011. The consolidation impacted approximately
1,000
employees. In connection with the consolidation, we incurred aggregate costs of approximately
$47.2 million
, primarily related to employee severance and benefits. During
2011
, we incurred a credit of
$0.5 million
largely due to a change in sublease assumptions and in
2010
, we incurred restructuring charges of
$21.4 million
in connection with this consolidation.
The following table summarizes by segment the restructuring costs recognized during the years ended
December 31, 2011
and
2010
:
|
|
Year Ended December 31, 2011
|
Year Ended December 31, 2010
|
|||||||||||||||||||||
|
|
Employee
Severance and
Benefits
|
Facilities
|
Total
|
Employee
Severance and
Benefits
|
Facilities
|
Total
|
|||||||||||||||||
|
(In thousands)
|
|||||||||||||||||||||||
|
Marketplaces
|
$
|
30
|
|
$
|
(519
|
)
|
$
|
(489
|
)
|
$
|
18,607
|
|
$
|
3,223
|
|
$
|
21,830
|
|
|||||
|
Payments
|
—
|
|
—
|
|
—
|
|
(393
|
)
|
—
|
|
(393
|
)
|
|||||||||||
|
$
|
30
|
|
$
|
(519
|
)
|
$
|
(489
|
)
|
$
|
18,214
|
|
$
|
3,223
|
|
$
|
21,437
|
|
||||||
F-27
eBay Inc.
NOTES TO CONSOLIDATED FINANCIAL STATEMENTS—(Continued)
The following table summarizes the restructuring reserve activity during the year ended
December 31, 2011
:
|
|
Employee Severance
and Benefits
|
Facilities
|
Total
|
||||||||
|
(In thousands)
|
|||||||||||
|
Accrued liability as of January 1, 2011
|
$
|
2,425
|
|
$
|
3,559
|
|
$
|
5,984
|
|
||
|
Charges (benefit)
|
30
|
|
(519
|
)
|
(489
|
)
|
|||||
|
Payments
|
(2,654
|
)
|
(1,447
|
)
|
(4,101
|
)
|
|||||
|
Adjustments
|
575
|
|
275
|
|
850
|
|
|||||
|
Accrued liability as of December 31, 2011
|
$
|
376
|
|
$
|
1,868
|
|
$
|
2,244
|
|
||
In the table above, adjustments primarily reflect the impact of foreign currency translation.
The following table summarizes the carrying value of our outstanding debt (in thousands, except percentages):
|
Coupon
|
Carrying Value as of
|
Effective
|
Carrying Value as of
|
Effective
|
||||||||||
|
Rate
|
December 31, 2011
|
Interest Rate
|
December 31, 2010
|
Interest Rate
|
||||||||||
|
Long-Term Debt
|
||||||||||||||
|
Senior notes due 2013
|
0.875
|
%
|
$
|
399,500
|
|
0.946
|
%
|
$
|
399,220
|
|
0.946
|
%
|
||
|
Senior notes due 2015
|
1.625
|
%
|
598,304
|
|
1.703
|
%
|
597,857
|
|
1.703
|
%
|
||||
|
Senior notes due 2020
|
3.250
|
%
|
497,441
|
|
3.319
|
%
|
497,150
|
|
3.319
|
%
|
||||
|
Total senior notes
|
1,495,245
|
|
1,494,227
|
|
||||||||||
|
Note payable
|
14,880
|
|
—
|
|
||||||||||
|
Capital lease obligations
|
14,922
|
|
—
|
|
||||||||||
|
Total long-term debt
|
$
|
1,525,047
|
|
$
|
1,494,227
|
|
||||||||
|
Short-Term Debt
|
||||||||||||||
|
Commercial paper
|
$
|
550,000
|
|
$
|
300,000
|
|
||||||||
|
Note payable
|
1,793
|
|
—
|
|
||||||||||
|
Capital lease obligations
|
12,808
|
|
—
|
|
||||||||||
|
Total short-term debt
|
564,601
|
|
300,000
|
|
||||||||||
|
Total Debt
|
$
|
2,089,648
|
|
$
|
1,794,227
|
|
||||||||
Senior Notes
The effective interest rates for our senior notes due 2013, 2015 and 2020 includes the accretion of discount. Interest on these notes is payable semiannually on April 15 and October 15. Interest expense associated with these notes including amortization of debt issuance costs during the years ended
December 31, 2011
and
2010
was approximately
$31.9 million
and
$5.5 million
, respectively. At
December 31, 2011
, the estimated fair value of all these senior notes included in long-term debt was approximately
$1.5 billion
based on market prices on less active markets (Level 2).
The indenture pursuant to which the senior notes were issued includes customary covenants that, among other things, limit our ability to incur, assume or guarantee debt secured by liens on specified assets or enter into sale and lease-back transactions with respect to specified properties, and also includes customary events of default.
Note Payable
Note payable is comprised primarily of a mortgage note assumed as part of our acquisition of GSI. The mortgage note bears interest at
6.3%
per annum and has a maturity date of December 2015.
F-28
Capital Lease Obligations
We acquired certain warehouse equipment and computer hardware and software under capital leases as part of our acquisition of GSI. The capital leases have maturity dates from March 2012 to February 2016 and bear interest at rates ranging from
3%
to
9%
per annum. The present value of future minimum lease payments as of December 31, 2011 was as follows (in thousands):
|
December 31, 2011
|
|||
|
Gross capital lease obligations
|
$
|
29,331
|
|
|
Imputed interest
|
(1,601
|
)
|
|
|
Total present value of future minimum lease payments
|
$
|
27,730
|
|
Commercial Paper
We implemented a
$2.0 billion
commercial paper program pursuant to which we may issue commercial paper notes with maturities of up to
397
days from the date of issue. As of
December 31, 2011
,
$550.0 million
aggregate principal amount of commercial paper was outstanding, the weighted average interest rate on our outstanding commercial paper notes was
0.16%
, and the weighted average remaining term of our commercial paper notes was
40
days.
Credit Agreement
On November 22, 2011, we entered into a credit agreement that provides for an unsecured
$3.0 billion
five-year revolving credit facility that includes a
$300.0 million
letter of credit sub-facility and a
$100.0 million
swingline sub-facility, with available borrowings under the revolving credit facility reduced by the amount of any letters of credit and swingline borrowings outstanding from time to time. We may also, subject to the agreement of the applicable lenders, increase the commitments under the revolving credit facility by up to
$1.0 billion
. Funds borrowed under the credit agreement may be used for working capital, capital expenditures, acquisitions and other general corporate purposes. The credit agreement replaced our prior
$1.8 billion
unsecured revolving credit agreement, dated November 7, 2006.
As of
December 31, 2011
, no borrowings or letters of credit were outstanding under our
$3.0 billion
credit agreement. However, as described above, we have a
$2.0 billion
commercial paper program and maintain
$2.0 billion
of available borrowing capacity under our credit agreement in order to repay commercial paper borrowings in the event we are unable to repay those borrowings from other sources when they become due. Accordingly, at
December 31, 2011
,
$1.0 billion
of borrowing capacity was available for other purposes permitted by the credit agreement.
Loans under the credit agreement bear interest at either (i) the London Interbank Offered Rate (“
LIBOR
”) plus a margin (based on our public debt ratings) ranging from
0.625
percent to
1.125
percent or (ii) a formula based on the agent bank's prime rate, the federal funds effective rate or LIBOR plus a margin (based on our public debt ratings) ranging from
zero
percent to
0.125
percent. The credit agreement will terminate and all amounts owing thereunder will be due and payable on November 22, 2016, unless (a) the commitments are terminated earlier, either at our request or, if an event of default occurs, by the lenders (or automatically in the case of certain bankruptcy-related events of default), or (b) the maturity date is extended upon our request, subject to the agreement of the lenders. The credit agreement contains customary representations, warranties, affirmative and negative covenants, including a financial covenant, events of default and indemnification provisions in favor of the banks. The negative covenants include restrictions regarding the incurrence of liens, subject to certain exceptions. The financial covenant requires us to meet a quarterly financial test with respect to a minimum consolidated interest coverage ratio.
As of
December 31, 2011
, we were in compliance with all covenants in our outstanding debt instruments.
F-29
Future Maturities
Expected future principal maturities as of
December 31, 2011
is as follows (in thousands):
|
Fiscal Years:
|
||||
|
2012
|
$
|
564,601
|
|
|
|
2013
|
412,942
|
|
||
|
2014
|
16,363
|
|
||
|
2015
|
600,480
|
|
||
|
2016
|
10
|
|
||
|
Thereafter
|
500,000
|
|
||
|
$
|
2,094,396
|
|
||
Commitments
As of
December 31, 2011
, approximately
$9.6 billion
of unused credit was available to Bill Me Later accountholders. The individual lines of credit that make up this unused credit are subject to periodic review and termination by the chartered financial institution that is the issuer of Bill Me Later credit products based on, among other things, account usage and customer creditworthiness. Currently, when a consumer makes a purchase using a Bill Me Later credit product, the chartered financial institution extends credit to the consumer, funds the extension of credit at the point of sale and advances funds to the merchant. We subsequently purchase the receivables related to the consumer loans extended by the chartered financial institution and, as a result of the purchase, bear the risk of loss in the event of loan defaults. Although the chartered financial institution continues to own each customer account, we own the related receivable, and Bill Me Later is responsible for all servicing functions related to the account.
Lease Arrangements
We have lease obligations under certain non-cancelable operating leases. Future minimum rental payments under our non-cancelable operating leases at
December 31, 2011
are as follows (in thousands):
|
Year Ended December 31,
|
Leases
|
||
|
2012
|
$
|
94,853
|
|
|
2013
|
66,771
|
|
|
|
2014
|
49,820
|
|
|
|
2015
|
37,587
|
|
|
|
2016
|
23,730
|
|
|
|
Thereafter
|
38,693
|
|
|
|
Total minimum lease payments
|
$
|
311,454
|
|
Rent expense in the years ended
December 31, 2011
,
2010
and
2009
totaled
$130.9 million
,
$112.6 million
and
$92.3 million
, respectively.
Litigation and Other Legal Matters
Overview
We are involved in legal proceedings on an ongoing basis. If we believe that a loss arising from such matters is probable and can be reasonably estimated, we accrue the estimated liability in our financial statements. If only a range of estimated losses can be determined, we accrue an amount within the range that, in our judgment, reflects the most likely outcome; if none of the estimates within that range is a better estimate than any other amount, we accrue the low end of the range. Amounts
F-30
eBay Inc.
NOTES TO CONSOLIDATED FINANCIAL STATEMENTS—(Continued)
accrued for legal proceedings for which we believe a loss is probable were not material for the year ended December 31, 2011. Except as otherwise noted, we have concluded that reasonably possible losses arising directly from the proceedings (i.e., monetary damages or amounts paid in judgment or settlement) in excess of our accruals are also not material. For those proceedings in which an unfavorable outcome is reasonably possible but not probable, we have disclosed an estimate of the reasonably possible loss or range of losses or we have concluded that an estimate of the reasonably possible loss or range of losses arising directly from the proceeding (i.e., monetary damages or amounts paid in judgment or settlement) are not material. If we cannot estimate the probable or reasonably possible loss or range of losses arising from a legal proceeding, we have disclosed that fact.
In assessing the materiality of a legal proceeding, we evaluate, among other factors, the amount of monetary damages claimed, as well as the potential impact of non-monetary remedies sought by plaintiffs (e.g., injunctive relief) that may require us to change our business practices in a manner that could have a material adverse impact on our business. With respect to the matters disclosed in this Note 13, we are unable to estimate the possible loss or range of losses that could potentially result from the application of such non-monetary remedies.
Specific Matters
In August 2006, Louis Vuitton Malletier and Christian Dior Couture filed two lawsuits in the Paris Court of Commerce against eBay Inc. and eBay International AG. Among other things, the complaint alleged that we violated French tort law by negligently broadcasting listings posted by third parties offering counterfeit items bearing plaintiffs' trademarks and by purchasing certain advertising keywords. Around September 2006, Parfums Christian Dior, Kenzo Parfums, Parfums Givenchy, and Guerlain Société also filed a lawsuit in the Paris Court of Commerce against eBay Inc. and eBay International AG. The complaint alleged that we had interfered with the selective distribution network the plaintiffs established in France and the European Union by allowing third parties to post listings offering genuine perfumes and cosmetics for sale on our websites. In June 2008, the Paris Court of Commerce ruled that eBay and eBay International AG were liable for failing to prevent the sale of counterfeit items on its websites that traded on plaintiffs' brand names and for interfering with the plaintiffs' selective distribution network. The court awarded plaintiffs approximately EUR
38.6 million
in damages and issued an injunction (enforceable by daily fines of up to EUR
100,000
) prohibiting all sales of perfumes and cosmetics bearing the Dior, Guerlain, Givenchy and Kenzo brands over all worldwide eBay sites to the extent that they are accessible from France. We appealed this decision, and in September 2010, the Paris Court of Appeal reduced the damages award to EUR
5.7 million
and modified the injunction. We have further appealed this decision to the French Supreme Court. In 2009, plaintiffs filed an action regarding our compliance with the original injunction, and in November 2009, the court awarded the plaintiffs EUR
1.7 million
(the equivalent of EUR
2,500
per day) and indicated that as a large Internet company we should do a better job of enforcing the injunction. Parfums Christian Dior has filed another motion relating to our compliance with the injunction. We have taken measures to comply with the injunction and have appealed these rulings, noting, among other things, the modification of the initial injunction. However, these and similar suits may force us to modify our business practices, which could lower our revenue, increase our costs, or make our websites less convenient to our customers. Any such results could materially harm our business. Other brand owners have also filed suit against us or have threatened to do so in numerous different jurisdictions, seeking to hold us liable for, among other things, alleged counterfeit items listed on our websites by third parties, “tester” and other not for resale consumer products listed on our websites by third parties, alleged misuse of trademarks in listings, alleged violations of selective distribution channel laws, alleged violations of parallel import laws, alleged non-compliance with consumer protection laws and in connection with paid search advertisements. We have prevailed in some of these suits, lost in others, and many are in various stages of appeal. We continue to believe that we have meritorious defenses to these suits and intend to defend ourselves vigorously.
In May 2009, the U.K. High Court of Justice ruled in the case filed by L'Oréal SA, Lancôme Parfums et Beauté & Cie, Laboratoire Garnier & Cie and L'Oréal (UK) Ltd against eBay International AG, other eBay companies, and several eBay sellers (No. HC07CO1978) that eBay was not jointly liable with the seller co-defendants as a joint tortfeasor, and indicated that it would certify to the European Court of Justice ("ECJ") questions of liability for the use of L'Oréal trademarks, hosting liability, and the scope of a possible injunction against intermediaries. On July 12, 2011 the ECJ ruled on the questions certified by the U.K. High Court of Justice. It held that (a) brand names could be used by marketplaces as keywords for paid search advertising without violating a trademark owner's rights if it were clear to consumers that the goods reached via the key word link were not being offered by the trademark owner or its designees but instead by third parties, (b) that marketplaces could invoke the limitation from liability provided by Article 14 of the ecommerce directive if they did not take such an active role with respect to the listings in question that the limitation would not be available, but that even where the limitation was available, the marketplace could be liable if it had awareness (through notice or its own investigation) of the illegality of the listings, (c) that a marketplace would be liable in a specific jurisdiction only if the offers on the site at issue were targeting that jurisdiction, a question of fact, (d) that injunctions may be issued to a marketplace in connection with infringing third party
F-31
eBay Inc.
NOTES TO CONSOLIDATED FINANCIAL STATEMENTS—(Continued)
content, but that such injunctions must be proportionate and not block legitimate trade and (e) that trademark rights can only be evoked by a rights owner as a result of a seller's commercial activity as opposed to private activity. The matter will now return to the U.K. High Court of Justice for further action in light of the ECJ opinion. The case was originally filed in July 2007. L'Oréal's complaint alleged that we were jointly liable for trademark infringement for the actions of the sellers who allegedly sold counterfeit goods, parallel imports and testers (not for resale products). Additionally, L'Oréal claimed that eBay's use of L'Oréal brands on its website, in its search engine and in sponsored links, and purchase of L'Oréal trademarks as keywords, constitute trademark infringement. The suit sought an injunction preventing future infringement, full disclosure of the identity of all past and present sellers of infringing L'Oréal goods, and a declaration that our Verified Rights Owner (VeRO) program as then operated was insufficient to prevent such infringement. The scope of a possible injunction claimed is to be specified after the trial upon remand from the ECJ.
eBay's Korean subsidiary, IAC (which has merged into Gmarket and is now named eBay Korea), has notified its approximately
20 million
users of a January 2008 data breach involving personally identifiable information including name, address, resident registration number and some transaction and refund data (but not including credit card information or real time banking information). Approximately
149,000
users have sued IAC over this breach in several lawsuits in Korean courts and more may do so in the future. Trial for a group of
four
representative suits began in August 2009 in the Seoul District Court, and trial for a group of
23
other suits began in September 2009 in the Seoul District Court. There is some precedent in Korea for a court to grant “consolation money” for data breaches without a specific finding of harm from the breach. Such precedents have involved payments of up to approximately
$200
per user. In January 2010, the Seoul District Court ruled that IAC had met its obligations with respect to defending the site from intrusion and, accordingly, had no liability for the breach. This ruling has been appealed by approximately
34,000
plaintiffs to the Seoul High Court, where it is currently being heard de novo. A decision is expected in 2012.
General Matters
Other third parties have from time to time claimed, and others may claim in the future, that we have infringed their intellectual property rights. We are subject to patent disputes, and expect that we will increasingly be subject to additional patent infringement claims involving various aspects of our Marketplaces, Payments and GSI businesses as our services continue to expand in scope and complexity. Such claims may be brought directly against our companies and/or against our customers (who may be entitled to contractual indemnification under their contracts with us), and we are subject to increased exposure to such claims as a result of our recent acquisitions, particularly in cases where we are entering into new businesses in connection with such acquisitions. We have in the past been forced to litigate such claims. We may also become more vulnerable to third-party claims as laws such as the Digital Millennium Copyright Act, the Lanham Act and the Communications Decency Act are interpreted by the courts, and as we expand the range and geographical scope of our services and become subject to laws in jurisdictions where the underlying laws with respect to the potential liability of online intermediaries like ourselves are either unclear or less favorable. We believe that additional lawsuits alleging that we have violated patent, copyright or trademark laws will be filed against us. Intellectual property claims, whether meritorious or not, are time consuming and costly to defend and resolve, could require expensive changes in our methods of doing business, or could require us to enter into costly royalty or licensing agreements on unfavorable terms.
From time to time, we are involved in other disputes or regulatory inquiries that arise in the ordinary course of business, including suits by our users (individually or as class actions) alleging, among other things, improper disclosure of our prices, rules or policies, that our prices, rules, policies or customer/user agreements violate applicable law, or that we have not acted in conformity with such prices, rules, policies or agreements. The number and significance of these disputes and inquiries are increasing. Any claims or regulatory actions against us, whether meritorious or not, could be time consuming, result in costly litigation, damage awards (including statutory damages for certain causes of action in certain jurisdictions), injunctive relief or increased costs of doing business through adverse judgment or settlement, require us to change our business practices in expensive ways, require significant amounts of management time, result in the diversion of significant operational resources or otherwise harm our business.
Indemnification Provisions
In the ordinary course of business, we have included limited indemnification provisions in certain of our agreements with parties with which we have commercial relations, including our standard marketing, promotions and application-programming-interface license agreements. Under these contracts, we generally indemnify, hold harmless and agree to reimburse the indemnified party for losses suffered or incurred by the indemnified party in connection with claims by a third party with respect to our domain names, trademarks, logos and other branding elements to the extent that such marks are applicable to our
F-32
eBay Inc.
NOTES TO CONSOLIDATED FINANCIAL STATEMENTS—(Continued)
performance under the subject agreement. GSI in many of its major online commerce agreements has provided an indemnity for other types of third-party claims, which are indemnities mainly related to various intellectual property rights, and we have provided similar indemnities in a limited number of agreements for our other businesses. In our PayPal business, we have provided an indemnity to our payment processors in the event of certain third-party claims or card association fines against the processor arising out of conduct by PayPal or PayPal customers. In connection with the sale of Skype, we made certain customary warranties to the buyer in the purchase agreement. Our liability to the buyer for inaccuracies in these warranties is generally subject to certain limitations. With respect to certain specified litigation matters involving Skype that were pending as of the closing of the transaction, we also agreed, among other things, to bear
50%
of the cost of any monetary judgment that is rendered in respect of those matters. It is not possible to determine the maximum potential loss under these indemnification provisions due to our limited history of prior indemnification claims and the unique facts and circumstances involved in each particular provision. To date, losses recorded in our statement of income in connection with our indemnification provisions have not been significant, either individually or collectively.
Off-Balance Sheet Arrangements
Based on differences in regulatory requirements and commercial law in the jurisdictions where PayPal operates, PayPal holds customer balances either as direct claims against PayPal or as an agent or custodian on behalf of PayPal's customers. Customer funds held by PayPal as an agent or custodian on behalf of our customers are not reflected in our consolidated balance sheet. These off-balance sheet funds totaled approximately
$2.7 billion
as of
December 31, 2011
and
2010
. These funds include funds held on behalf of U.S. customers that are deposited in bank accounts insured by the Federal Deposit Insurance Corporation (subject to applicable limits).
We have entered into indemnification agreements with each of our directors, executive officers and certain other officers. These agreements require us to indemnify such individuals, to the fullest extent permitted by Delaware law, for certain liabilities to which they may become subject as a result of their affiliation with us.
All contracts with related parties are at rates and terms that we believe are comparable with those that could be entered into with independent third parties. There were no material related party transactions in
2011
. As of
December 31, 2011
, there were no significant amounts payable to or amounts receivable from related parties.
Preferred Stock
We are authorized, subject to limitations prescribed by Delaware law, to issue preferred stock in one or more series; to establish the number of shares included within each series; to fix the rights, preferences and privileges of the shares of each wholly unissued series and any related qualifications, limitations or restrictions; and to increase or decrease the number of shares of any series (but not below the number of shares of a series then outstanding) without any further vote or action by our stockholders. At
December 31, 2011
and
2010
, there were
10.0 million
shares of
$0.001
par value preferred stock authorized for issuance, and no shares issued or outstanding.
Common Stock
Our Certificate of Incorporation, as amended, authorizes us to issue
3.6 billion
shares of common stock.
In September 2010, our Board authorized a stock repurchase program that provides for the repurchase of up to
$2.0 billion
of our common stock, with no expiration from the date of authorization, for the purpose of offsetting the impact of dilution from our equity compensation programs. The stock repurchase activity under this stock repurchase program during
2011
is summarized as follows (in thousands, except per share amounts):
F-33
|
Shares Repurchased
|
Average Price per Share (1)
|
Value of Shares Repurchased
|
Remaining Amount Authorized
|
|||||||||||
|
Balance at January 1, 2011
|
1,880
|
|
$
|
29.94
|
|
$
|
56,293
|
|
$
|
1,943,707
|
|
|||
|
Repurchase of common stock
|
33,600
|
|
31.64
|
|
1,063,185
|
|
(1,063,185
|
)
|
||||||
|
Balance at December 31, 2011
|
35,480
|
|
$
|
31.55
|
|
$
|
1,119,478
|
|
$
|
880,522
|
|
|||
(1) Stock repurchase activity excludes broker commissions.
These repurchased shares were recorded as treasury stock and were accounted for under the cost method. No repurchased shares have been retired.
Our stock repurchase programs may be limited or terminated at any time without prior notice. Stock repurchases under these programs may be made through a variety of open market and privately negotiated transactions, including structured stock repurchase transactions or other derivative transactions, at times and in such amounts as management deems appropriate and will be funded from our working capital or other financing alternatives. The timing and actual number of shares repurchased will depend on a variety of factors including corporate and regulatory requirements, price, other market conditions and management's determination as to the appropriate use of our cash. The programs are intended to comply with the volume, timing and other limitations set forth in Rule 10b-18 under the Securities Exchange Act of 1934.
In addition to the above, we withhold shares from employees to satisfy minimum statutory tax obligations in conjunction with nonvested shares under our equity incentive plans, which are included in treasury stock.
Equity Incentive Plans
We have equity incentive plans under which we grant equity awards, including stock options, restricted stock units, nonvested shares and performance-based restricted stock units, to our directors, officers and employees. At
December 31, 2011
,
626.4 million
shares were authorized under our equity incentive plans and
54.8 million
shares were available for future grant.
All stock options granted under these plans generally vest
12.5%
six
months from the date of grant (or
25%
one year from the date of grant for grants to new employees) with the remainder vesting at a rate of
2.08%
per month thereafter, and generally expire
seven
to
ten
years from the date of grant. The cost of stock options is determined using the Black-Scholes option pricing model on the date of grant.
Restricted stock units and nonvested shares are granted to eligible employees under our equity incentive plans. In general, restricted stock units and nonvested shares vest in equal annual installments over a period of one to five years, are subject to the employees' continuing service to the Company and do not have an expiration date. The cost of restricted stock units and nonvested shares is determined using the fair value of our common stock on the date of grant.
In
2011
,
2010
and
2009
, certain executives were eligible to receive performance-based restricted stock units. The number of restricted stock units ultimately received depends on our business performance against specified performance targets set by the Compensation Committee. If the performance criteria are satisfied, the performance-based restricted stock units will be granted, with one-half of the grant vesting in March following the end of the performance period and the remaining one-half vesting one year later.
Employee Stock Purchase Plan
We have an employee stock purchase plan for all eligible employees. Under the plan, shares of our common stock may be purchased over an offering period with a maximum duration of
two
years at
85%
of the lower of the fair market value on the first day of the applicable offering period or on the last day of the six-month purchase period. Employees may purchase shares having a value not exceeding
10%
of their eligible compensation during an offering period. During the years ended
2011
,
2010
, and
2009
, employees purchased approximately
3.4 million
,
4.7 million
and
4.4 million
shares under this plan at average prices of
$23.55
,
$13.55
and
$12.82
per share, respectively. At
December 31, 2011
, approximately
3.8 million
shares of common stock were reserved for future issuance. Our employee stock purchase plan contains an “evergreen” provision that automatically increases, on each January 1, the number of shares reserved for issuance under the employee stock purchase plan by the number of shares purchased under this plan in the preceding calendar year.
Employee Savings Plan
We have a savings plan, which qualifies under Section 401(k) of the Internal Revenue Code. Participating employees may
F-34
eBay Inc.
NOTES TO CONSOLIDATED FINANCIAL STATEMENTS—(Continued)
contribute up to
50%
of their annual salary, but not more than statutory limits. In
2011
,
2010
and
2009
, we contributed one dollar for each dollar a participant contributed, with a maximum contribution of
4%
of each employee's salary, subject to a maximum employer contribution of
$10,000
per employee for each period. Our non-U.S. employees are covered by various other savings plans. Our total expenses for these savings plans were
$50.2 million
in
2011
,
$47.4 million
in
2010
and
$42.8 million
in
2009
.
Deferred Stock Units
Since December 31, 2002, we have granted deferred stock units to non-employee directors (other than Pierre Omidyar) elected to our Board of Directors with each new director receiving a one-time grant of deferred stock units equal to the result of dividing
$150,000
by the fair market value of our common stock on the date of grant. Beginning with our 2008 annual meeting of stockholders, we granted deferred stock units to each non-employee director (other than Mr. Omidyar) at the time of our annual meeting of stockholders equal to the result of dividing
$110,000
by the fair market value of our common stock on the date of grant. Beginning with the 2011 annual meeting of stockholders, we granted deferred stock units to each non-employee director (other than Mr. Omidyar) at the time of our annual meeting of stockholders equal to the result of dividing
$220,000
by the fair market value of our common stock on the date of grant. Each deferred stock unit constitutes an unfunded and unsecured promise by us to deliver one share of our common stock (or the equivalent value thereof in cash or property at our election). Each deferred stock unit award granted to a new non-employee director upon election to the Board vests
25%
one year from the date of grant, and at a rate of
2.08%
per month thereafter. If the services of the director are terminated at any time, all rights to the unvested deferred stock units will also terminate. In addition, directors may elect to receive, in lieu of annual retainer and committee chair fees and at the time these fees would otherwise be payable (i.e., on a quarterly basis in arrears for services provided), fully vested deferred stock units with an initial value equal to the amount based on the fair market value of common stock at the date of grant. Deferred stock units are payable following the termination of a director's tenure as a director. As of
December 31, 2011
, there were approximately
271,409
deferred stock units outstanding included in our restricted stock unit activity below.
Stock Option Activity
The following table summarizes stock option activity under our equity incentive plans as of and for the year ended December 31, 2011 (in thousands, except per share amounts and years):
|
|
Shares
|
|
Weighted
Average
Exercise
Price
|
Weighted Average Remaining Contractual Term (Years)
|
Aggregate Intrinsic Value
|
||||||||
|
Outstanding at January 1, 2011
|
43,907
|
|
$
|
23.67
|
|
||||||||
|
Granted and assumed
|
8,418
|
|
$
|
29.66
|
|
||||||||
|
Exercised
|
(8,991
|
)
|
$
|
18.20
|
|
||||||||
|
Forfeited/expired/canceled
|
(3,278
|
)
|
$
|
27.50
|
|
||||||||
|
Outstanding at December 31, 2011
|
40,056
|
|
$
|
25.84
|
|
3.85
|
|
$
|
249,290
|
|
|||
|
Expected to vest
|
38,587
|
|
$
|
25.78
|
|
3.77
|
|
$
|
243,461
|
|
|||
|
Options exercisable
|
27,098
|
|
$
|
25.96
|
|
2.95
|
|
$
|
176,053
|
|
|||
The aggregate intrinsic value of options was calculated as the difference between the exercise price of the underlying awards and the quoted price of our common stock. At
December 31, 2011
, options to purchase
23.7 million
shares of common stock were in-the-money.
The weighted average grant-date fair value of options granted during the years
2011
,
2010
and
2009
was
$9.87
,
$6.77
and
$4.59
, respectively. During the years
2011
,
2010
and
2009
, the aggregate intrinsic value of options exercised under our equity incentive plans was
$129.0 million
,
$140.7 million
and
$69.7 million
, respectively, determined as of the date of option exercise.
Restricted Stock Unit Activity
A summary of the status of restricted stock units ("RSU") granted (including performance-based restricted stock units that have been earned) under our equity incentive plans as of
December 31, 2011
and changes during the year ended
December 31, 2011
is presented below (in thousands, except per share amounts):
F-35
eBay Inc.
NOTES TO CONSOLIDATED FINANCIAL STATEMENTS—(Continued)
|
|
Units
|
Weighted Average
Grant-Date
Fair Value
(per share)
|
||||
|
Outstanding at January 1, 2011
|
38,348
|
|
$
|
19.55
|
|
|
|
Awarded and assumed
|
21,642
|
|
$
|
30.60
|
|
|
|
Vested
|
(14,623
|
)
|
$
|
20.61
|
|
|
|
Forfeited
|
(5,179
|
)
|
$
|
22.48
|
|
|
|
Outstanding at December 31, 2011
|
40,188
|
|
$
|
24.74
|
|
|
|
Expected to vest at December 31, 2011
|
35,258
|
|
||||
During the years
2011
,
2010
and
2009
, the aggregate intrinsic value of restricted stock units vested under our equity incentive plans was
$465.5 million
,
$362.8 million
and
$115.5 million
, respectively.
F-36
eBay Inc.
NOTES TO CONSOLIDATED FINANCIAL STATEMENTS—(Continued)
Nonvested Shares Activity
A summary of the status of and changes in nonvested shares granted under our equity incentive plans and assumed in acquisitions as of
December 31, 2011
and changes during the year ended
December 31, 2011
is presented below (in thousands, except per share amounts):
|
|
Shares
|
|
Weighted Average
Grant-Date
Fair Value
(per share)
|
|||
|
Nonvested at January 1, 2011
|
10
|
|
|
$
|
39.90
|
|
|
Granted
|
—
|
|
—
|
|
||
|
Vested
|
(10
|
)
|
$
|
39.90
|
|
|
|
Forfeited
|
—
|
|
—
|
|
||
|
Nonvested at December 31, 2011
|
—
|
|
|
$
|
—
|
|
Stock-based Compensation Expense
The impact on our results of operations of recording stock-based compensation expense for years ended
December 31, 2011
,
2010
and
2009
was as follows:
|
Year Ended December 31,
|
|||||||||||
|
|
2011
|
2010
|
2009
|
||||||||
|
(In thousands)
|
|||||||||||
|
Cost of net revenues
|
$
|
55,924
|
|
$
|
48,764
|
|
$
|
49,275
|
|
||
|
Sales and marketing
|
131,800
|
|
106,208
|
|
121,724
|
|
|||||
|
Product development
|
122,691
|
|
101,001
|
|
98,609
|
|
|||||
|
General and administrative
|
146,773
|
|
125,519
|
|
125,199
|
|
|||||
|
Total stock-based compensation expense
|
$
|
457,188
|
|
$
|
381,492
|
|
$
|
394,807
|
|
||
|
Capitalized in product development
|
$
|
17,022
|
|
$
|
10,484
|
|
$
|
9,060
|
|
||
As of
December 31, 2011
, there was approximately
$770.4 million
of unearned stock-based compensation that will be expensed from 2012 through 2015. If there are any modifications or cancellations of the underlying unvested awards, we may be required to accelerate, increase or cancel all or a portion of the remaining unearned stock-based compensation expense. Future unearned stock-based compensation will increase to the extent we grant additional equity awards, change the mix of grants between stock options and restricted stock units or assume unvested equity awards in connection with acquisitions.
Stock Option Valuation Assumptions
We calculated the fair value of each stock option award on the date of grant using the Black-Scholes option pricing model. The following weighted average assumptions were used for the years ended
December 31, 2011
,
2010
and
2009
:
|
|
Year Ended December 31,
|
|||||||
|
|
2011
|
2010
|
2009
|
|||||
|
Risk-free interest rate
|
1.2
|
%
|
1.4
|
%
|
1.7
|
%
|
||
|
Expected life (in years)
|
3.8
|
|
3.4
|
|
3.8
|
|
||
|
Dividend yield
|
—
|
%
|
—
|
%
|
—
|
%
|
||
|
Expected volatility
|
38
|
%
|
37
|
%
|
47
|
%
|
||
Our computation of expected volatility is based on a combination of historical and market-based implied volatility from traded options on our common stock. Our computation of expected life is based on historical experience of similar awards, giving consideration to the contractual terms of the stock-based awards, vesting schedules and expectations of future employee behavior. The interest rate for periods within the contractual life of the award is based on the U.S. Treasury yield curve in effect at the time
F-37
eBay Inc.
NOTES TO CONSOLIDATED FINANCIAL STATEMENTS—(Continued)
of grant.
The components of pretax income in consolidated companies for the years ended
December 31, 2011
,
2010
and
2009
are as follows (in thousands):
|
|
Year Ended December 31,
|
||||||||||
|
|
2011
|
|
2010
|
|
2009
|
||||||
|
United States
|
$
|
1,746,101
|
|
|
$
|
847,962
|
|
|
$
|
148,773
|
|
|
International
|
2,163,945
|
|
|
1,250,485
|
|
|
2,730,378
|
|
|||
|
$
|
3,910,046
|
|
|
$
|
2,098,447
|
|
|
$
|
2,879,151
|
|
|
U.S. pre-tax income for the year ended
December 31, 2011
and 2010 includes approximately
$448.5 million
and
$400.0 million
, respectively, relating to non-U.S. income recharacterized as U.S. income due to the settlement of multiple uncertain tax positions.
The provision for income taxes is comprised of the following (in thousands):
|
|
Year Ended December 31,
|
||||||||||
|
|
2011
|
|
2010
|
|
2009
|
||||||
|
Current:
|
|
|
|||||||||
|
Federal
|
$
|
517,877
|
|
|
$
|
(130,962
|
)
|
|
$
|
507,411
|
|
|
State and local
|
24,268
|
|
|
(13,356
|
)
|
|
96,496
|
|
|||
|
Foreign
|
121,556
|
|
|
92,209
|
|
|
64,960
|
|
|||
|
$
|
663,701
|
|
|
$
|
(52,109
|
)
|
|
$
|
668,867
|
|
|
|
Deferred:
|
|
|
|||||||||
|
Federal
|
$
|
64,287
|
|
|
$
|
398,597
|
|
|
$
|
(160,811
|
)
|
|
State and local
|
(3,158
|
)
|
|
8,195
|
|
|
(20,179
|
)
|
|||
|
Foreign
|
(44,171
|
)
|
|
(57,197
|
)
|
|
2,177
|
|
|||
|
16,958
|
|
|
349,595
|
|
|
(178,813
|
)
|
||||
|
$
|
680,659
|
|
|
$
|
297,486
|
|
|
$
|
490,054
|
|
|
The following is a reconciliation of the difference between the actual provision for income taxes and the provision computed by applying the federal statutory rate of
35%
for
2011
,
2010
and
2009
to income before income taxes (in thousands):
|
|
Year Ended December 31,
|
||||||||||
|
|
2011
|
|
2010
|
|
2009
|
||||||
|
Provision at statutory rate
|
$
|
1,368,516
|
|
|
$
|
734,456
|
|
|
$
|
1,007,703
|
|
|
Permanent differences:
|
|
|
|||||||||
|
Foreign income taxed at different rates
|
(1,093,508
|
)
|
|
(441,044
|
)
|
|
(475,967
|
)
|
|||
|
Gain on sale of Skype
|
321,484
|
|
|
—
|
|
|
(498,360
|
)
|
|||
|
Joltid settlement
|
—
|
|
|
—
|
|
|
120,339
|
|
|||
|
Legal entity restructuring
|
—
|
|
|
(23,649
|
)
|
|
184,410
|
|
|||
|
Change in valuation allowance
|
(787
|
)
|
|
1,407
|
|
|
58,670
|
|
|||
|
Stock-based compensation
|
31,705
|
|
|
7,595
|
|
|
41,436
|
|
|||
|
State taxes, net of federal benefit
|
21,110
|
|
|
31,003
|
|
|
49,606
|
|
|||
|
Tax credits
|
(8,039
|
)
|
|
(48,745
|
)
|
|
(13,352
|
)
|
|||
|
Divested business
|
33,743
|
|
—
|
|
—
|
|
|||||
|
Other
|
6,435
|
|
|
36,463
|
|
|
15,569
|
|
|||
|
$
|
680,659
|
|
|
$
|
297,486
|
|
|
$
|
490,054
|
|
|
F-38
eBay Inc.
NOTES TO CONSOLIDATED FINANCIAL STATEMENTS—(Continued)
Deferred tax assets and liabilities are recognized for the future tax consequences of differences between the carrying amounts of assets and liabilities and their respective tax bases using enacted tax rates in effect for the year in which the differences are expected to be reversed. Significant deferred tax assets and liabilities consist of the following (in thousands):
|
|
December 31,
|
||||||
|
|
2011
|
|
2010
|
||||
|
Deferred tax assets:
|
|
||||||
|
Net operating loss and credits
|
$
|
186,759
|
|
|
$
|
90,390
|
|
|
Accruals and allowances
|
340,074
|
|
|
310,075
|
|
||
|
Stock-based compensation
|
114,283
|
|
|
117,021
|
|
||
|
Discount on note receivable
|
67,715
|
|
—
|
|
|||
|
Net unrealized losses
|
1,621
|
|
|
1,882
|
|
||
|
Net deferred tax assets
|
710,452
|
|
|
519,368
|
|
||
|
Valuation allowance
|
(83,059
|
)
|
|
(42,740
|
)
|
||
|
627,393
|
|
|
476,628
|
|
|||
|
Deferred tax liabilities:
|
|
||||||
|
Unremitted foreign earnings
|
(198,363
|
)
|
(230,646
|
)
|
|||
|
Acquisition-related intangibles
|
(461,482
|
)
|
|
(102,894
|
)
|
||
|
Depreciation and amortization
|
(264,319
|
)
|
|
(165,563
|
)
|
||
|
Available-for-sale securities
|
(234,156
|
)
|
|
(199,421
|
)
|
||
|
Other
|
(21,320
|
)
|
|
—
|
|
||
|
(1,179,640
|
)
|
|
(698,524
|
)
|
|||
|
$
|
(552,247
|
)
|
|
$
|
(221,896
|
)
|
|
As of
December 31, 2011
, our federal, foreign and state net operating loss carryforwards for income tax purposes were approximately
$172.9 million
,
$186.3 million
and
$480.3 million
, respectively. The federal and state net operating loss carryforwards are subject to various limitations under Section 382 of the Internal Revenue Code and applicable state tax law. If not utilized, the federal net operating loss carryforwards will begin to expire in 2021 and the state net operating loss carryforwards will begin to expire in 2013. As of
December 31, 2011
, our state tax credit carryforwards for income tax purposes were approximately
$10.2 million
. If not utilized, the state tax credit carryforwards will begin to expire in 2015. As of
December 31, 2011
and 2010, our federal capital loss carryover amounted to
$150.7 million
and
$65.4 million
, respectively, which is subject to a full valuation allowance. The increase in the capital loss carryover and associated valuation allowance is primarily due to our divestiture of a business. If not utilized, the federal capital loss carryover will begin to expire in 2014.
At
December 31, 2011
and
2010
, we maintained a valuation allowance with respect to certain of our deferred tax assets relating primarily to operating losses in certain non-U.S. jurisdictions that we believe are not likely to be realized.
We have not provided for U.S. federal income and foreign withholding taxes on
$10.0 billion
of our non-U.S. subsidiaries' undistributed earnings as of
December 31, 2011
. We intend to indefinitely reinvest the
$10.0 billion
of our non-U.S. subsidiaries’ undistributed earnings in our international operations. Accordingly, we currently have no plans to repatriate those funds. As such, we do not know the time or manner in which we would repatriate those funds. Because the time or manner of repatriation is uncertain, we cannot determine the impact of local taxes, withholding taxes and foreign tax credits associated with the future repatriation of such earnings and therefore cannot quantify the tax liability. In cases where we intend to repatriate a portion of our foreign subsidiaries’ undistributed earnings, we provide U.S. taxes on such earnings and such taxes are included in our deferred taxes or tax payable liabilities depending upon the planned timing and manner of such repatriation.
On a regular basis, we develop cash forecasts to estimate our cash needs internationally and domestically. We consider projected cash needs for, among other things, investments in our existing businesses, potential acquisitions and capital transactions, including repurchases of our common stock and debt repayments. We estimate the amount of cash available or needed in the jurisdictions where these investments are expected, as well as our ability to generate cash in those jurisdictions and our access to capital markets. Such an analysis enables us to conclude whether or not we will indefinitely reinvest the current period’s foreign earnings. We benefit from tax rulings concluded in several different jurisdictions, most significantly Singapore and Switzerland. These rulings provide for lower rates of taxation on certain classes of income and require various thresholds of investment and employment in those jurisdictions. These rulings resulted in a tax savings of
$696.5 million
and
$284.0 million
in
2011
and
2010
, respectively, increasing earnings per share (diluted) by approximately
$0.53
and
$0.21
in
2011
and
2010
, respectively. These tax rulings are in effect currently and expire over periods ranging from 2016 to the duration
F-39
eBay Inc.
NOTES TO CONSOLIDATED FINANCIAL STATEMENTS—(Continued)
of business operations in the respective jurisdictions.
The following table reflects changes in unrecognized tax benefits since January 1, 2010:
|
2011
|
2010
|
||||||
|
(In thousands)
|
|||||||
|
Gross amounts of unrecognized tax benefits as of the beginning of the period
|
$
|
428,344
|
|
$
|
838,616
|
|
|
|
Increases related to prior period tax positions
|
32,582
|
|
33,904
|
|
|||
|
Decreases related to prior period tax positions
|
(138,746
|
)
|
(305,874
|
)
|
|||
|
Increases related to current period tax positions
|
40,926
|
|
22,229
|
|
|||
|
Settlements
|
(77,386
|
)
|
(160,531
|
)
|
|||
|
Gross amounts of unrecognized tax benefits as of the end of the period
|
$
|
285,720
|
|
$
|
428,344
|
|
|
In the second quarter of 2011, we settled multiple uncertain tax positions resulting in an overall decrease in our unrecognized tax benefits. As of December 31, 2011, our liabilities for unrecognized tax benefits were included in deferred and other tax liabilities, net. As of December 31, 2010,
$208.5 million
of our liabilities for unrecognized tax benefits were included in accrued expenses and other current liabilities and the remaining amount is recorded as deferred and other tax liabilities.
We recognize interest and/or penalties related to uncertain tax positions in income tax expense. In 2011, we recognized interest and penalties of
$18.4 million
. The amount of interest and penalties accrued as of
December 31, 2011
and
2010
was approximately
$83.2 million
and
$92.3 million
, respectively.
We are subject to both direct and indirect taxation in the U.S. and various states and foreign jurisdictions. We are under examination by certain tax authorities for the 2003 to 2009 tax years. We believe that adequate amounts have been reserved for any adjustments that may ultimately result from these examinations. The material jurisdictions where we are subject to potential examination by tax authorities for tax years after 2002 include, among others, the U.S. (Federal and California), France, Germany, Italy, Korea, Israel, Switzerland, Singapore and Canada.
Although the timing of the resolution and/or closure of audits is highly uncertain, it is reasonably possible that the balance of gross unrecognized tax benefits could significantly change in the next 12 months. However, given the number of years remaining subject to examination and the number of matters being examined, we are unable to estimate the full range of possible adjustments to the balance of gross unrecognized tax benefits.
Loans and interest receivable represent purchased consumer receivables arising from loans made by a partner chartered financial institution to individual consumers in the U.S. to purchase goods and services through our Bill Me Later merchant network. During the years ended December 31, 2011 and 2010, we purchased approximately
$2.3 billion
and
$1.4 billion
, respectively, in consumer receivables. Loans and interest receivable are reported at their outstanding principal balances, including unamortized deferred origination costs and net of allowance, and include the estimated collectible interest and fees. We use a consumer's FICO score, among other measures, in evaluating the credit quality of our consumer receivables. A FICO score is a type of credit score that lenders use to assess an applicant's credit risk and whether to extend credit. Individual FICO scores generally are obtained each quarter the consumer has an outstanding loan receivable owned by Bill Me Later. The weighted average consumer FICO score related to our loans and interest receivable balance outstanding at
December 31, 2011
was
692
. As of
December 31, 2011
and
2010
, approximately
59.3%
and
63.6%
, respectively, of our loans and interest receivable balance was due from consumers with FICO scores greater than
680
, which is generally considered "prime" by the consumer credit industry. As of
December 31, 2011
, approximately
91%
of our loans and interest receivable portfolio were current.
F-40
The following table summarizes the activity in the allowance for loans and interest receivable for the years ended
December 31, 2011
and 2010:
|
(In thousands)
|
||||
|
Balance as of January 1, 2010
|
$
|
50,287
|
|
|
|
Charge-offs
|
(85,282
|
)
|
||
|
Recoveries
|
6,330
|
|
||
|
Provision
|
71,005
|
|
||
|
Balance as of January 1, 2011
|
42,340
|
|
||
|
Charge-offs
|
(78,420
|
)
|
||
|
Recoveries
|
6,747
|
|
||
|
Provision
|
87,839
|
|
||
|
Balance as of December 31, 2011
|
$
|
58,506
|
|
|
The components of interest and other, net for the years ended
December 31, 2011
,
2010
and
2009
are as follows (in thousands):
|
|
Year Ended December 31,
|
||||||||||
|
|
2011
|
|
2010
|
|
2009
|
||||||
|
Interest income
|
$
|
110,753
|
|
|
$
|
86,740
|
|
|
$
|
38,410
|
|
|
Interest expense
|
(25,030
|
)
|
(3,596
|
)
|
—
|
|
|||||
|
Gain on sale of Skype
|
1,664,079
|
|
—
|
|
1,449,800
|
|
|||||
|
Loss on divestiture of a business
|
(256,501
|
)
|
—
|
|
—
|
|
|||||
|
Gain on acquisitions
|
79,082
|
|
—
|
|
—
|
|
|||||
|
Other
|
(35,826
|
)
|
|
(38,268
|
)
|
|
(65,825
|
)
|
|||
|
$
|
1,536,557
|
|
|
$
|
44,876
|
|
|
$
|
1,422,385
|
|
|
As a result of previously held non-controlling interests in certain companies we acquired, we recognized a gain on the remeasurement of our non-controlling interest to fair value upon our acquisition of a controlling interest (see "Note 3 - Business Combinations" included in this report for additional information). See "Note 3 - Business Combinations" and "Note - 4 Skype Related Transactions" included in this report for additional information on the loss on a divestiture of a business and gain on the sale of the Skype, respectively. For the years ended December 31, 2011 and 2010, interest expense on borrowings incurred to finance Bill Me Later's portfolio of loan receivables included in cost of net revenues was
$11.2 million
and
$4.5 million
, respectively.
F-41
Supplementary Data — Quarterly Financial Data — Unaudited
The following tables present certain unaudited consolidated quarterly financial information for each of the eight quarters ended
December 31, 2011
. This quarterly information has been prepared on the same basis as the Consolidated Financial Statements and includes all adjustments necessary to state fairly the information for the periods presented.
Quarterly Financial Data
(Unaudited, in thousands, except per share amounts)
|
Quarter Ended
|
|||||||||||||||
|
March 31
|
June 30
(1) (2)
|
September 30
(1)
|
December 31
(1) (3)
|
||||||||||||
|
2011
|
|||||||||||||||
|
Net revenues
|
$
|
2,545,609
|
|
$
|
2,760,274
|
|
$
|
2,965,761
|
|
$
|
3,380,010
|
|
|||
|
Gross profit
|
$
|
1,816,631
|
|
$
|
1,983,197
|
|
$
|
2,046,064
|
|
$
|
2,345,578
|
|
|||
|
Net income
|
$
|
475,865
|
|
$
|
283,407
|
|
$
|
490,503
|
|
$
|
1,979,612
|
|
|||
|
Net income per share-basic
|
$
|
0.37
|
|
$
|
0.22
|
|
$
|
0.38
|
|
$
|
1.54
|
|
|||
|
Net income per share-diluted
|
$
|
0.36
|
|
$
|
0.22
|
|
$
|
0.37
|
|
$
|
1.51
|
|
|||
|
Weighted-average shares:
|
|||||||||||||||
|
Basic
|
1,297,278
|
|
1,296,537
|
|
1,289,631
|
|
1,288,525
|
|
|||||||
|
Diluted
|
1,320,151
|
|
1,314,718
|
|
1,309,334
|
|
1,308,467
|
|
|||||||
(1) The quarterly financial information includes the operating results attributable to the GSI segment for the period beginning June 17, 2011 (the date that the acquisition was competed). See “Note 3 - Business Combinations” to the consolidated financial statements included in this report.
(2) The quarterly financial information includes a
$256.5 million
loss on the divestiture of a business. See “Note 3 - Business Combinations” to the consolidated financial statements included in this report.
(3) The quarterly financial information includes a
$1.7 billion
gain on the sale of our remaining interest in Skype. See “Note 4 - Skype Related Transactions” to the consolidated financial statements included in this report.
|
Quarter Ended
|
|||||||||||||||
|
March 31
|
June 30
|
September 30
|
December 31
|
||||||||||||
|
2010
|
|||||||||||||||
|
Net revenues
|
$
|
2,196,057
|
|
$
|
2,215,379
|
|
$
|
2,249,488
|
|
$
|
2,495,350
|
|
|||
|
Gross profit
|
$
|
1,589,502
|
|
$
|
1,600,008
|
|
$
|
1,609,220
|
|
$
|
1,792,877
|
|
|||
|
Net income
|
$
|
397,653
|
|
$
|
412,192
|
|
$
|
431,929
|
|
$
|
559,187
|
|
|||
|
Net income per share-basic
|
$
|
0.31
|
|
$
|
0.31
|
|
$
|
0.33
|
|
$
|
0.43
|
|
|||
|
Net income per share-diluted
|
$
|
0.30
|
|
$
|
0.31
|
|
$
|
0.33
|
|
$
|
0.42
|
|
|||
|
Weighted-average shares:
|
|||||||||||||||
|
Basic
|
1,301,248
|
|
1,310,042
|
|
1,308,888
|
|
1,302,239
|
|
|||||||
|
Diluted
|
1,326,021
|
|
1,329,618
|
|
1,328,415
|
|
1,325,659
|
|
|||||||
F-42
eBay Inc.
FINANCIAL STATEMENT SCHEDULE
The Financial Statement Schedule II — VALUATION AND QUALIFYING ACCOUNTS is filed as part of this Annual Report on Form 10-K.
|
Balance at Beginning of Period
|
Charged/Credited to Net Income
|
Charged to Other Account
|
Charges Utilized/Write-offs
|
Balance at End of Period
|
|||||||||||||||
|
(In thousands)
|
|||||||||||||||||||
|
Allowances for Doubtful Accounts and Authorized Credits
|
|||||||||||||||||||
|
Year ended December 31, 2009
|
$
|
104,886
|
|
$
|
83,364
|
|
$
|
—
|
|
$
|
(85,421
|
)
|
$
|
102,829
|
|
||||
|
Year Ended December 31, 2010
|
102,829
|
|
64,944
|
|
—
|
|
(81,288
|
)
|
86,485
|
|
|||||||||
|
Year Ended December 31, 2011
|
$
|
86,485
|
|
$
|
135,239
|
|
$
|
—
|
|
$
|
(134,523
|
)
|
$
|
87,201
|
|
||||
|
Allowance for Transaction, Loan and Interest Losses
|
|||||||||||||||||||
|
Year ended December 31, 2009
|
$
|
138,472
|
|
$
|
300,128
|
|
$
|
—
|
|
$
|
(290,672
|
)
|
$
|
147,928
|
|
||||
|
Year Ended December 31, 2010
|
147,928
|
|
360,403
|
|
—
|
|
(371,298
|
)
|
137,033
|
|
|||||||||
|
Year Ended December 31, 2011
|
$
|
137,033
|
|
$
|
481,618
|
|
$
|
—
|
|
$
|
(425,819
|
)
|
$
|
192,832
|
|
||||
|
Tax Valuation Allowance
|
|||||||||||||||||||
|
Year ended December 31, 2009
|
$
|
167,767
|
|
$
|
58,670
|
|
$
|
(157,691
|
)
|
$
|
—
|
|
$
|
68,746
|
|
||||
|
Year Ended December 31, 2010
|
68,746
|
|
1,407
|
|
—
|
|
(27,413
|
)
|
42,740
|
|
|||||||||
|
Year Ended December 31, 2011
|
$
|
42,740
|
|
$
|
33,171
|
|
$
|
—
|
|
$
|
7,148
|
|
$
|
83,059
|
|
||||
F-43
SIGNATURES
Pursuant to the requirements of Section 13 or 15(d) of the Securities Exchange Act of 1934, as amended, the Registrant has duly caused this report to be signed on its behalf by the undersigned, thereunto duly authorized, in the City of San Jose, State of California, on the 30th day of January, 2012.
|
eBay Inc.
|
||
|
By:
|
/s/ John J. Donahoe
|
|
|
John J. Donahoe
|
||
|
President, Chief Executive Officer and Director
|
||
POWER OF ATTORNEY
KNOW ALL PERSONS BY THESE PRESENTS, that each person whose signature appears below constitutes and appoints John Donahoe, Robert H. Swan, Phillip P. DePaul, and Michael R. Jacobson, and each or any one of them, each with the power of substitution, his or her attorney-in-fact, to sign any amendments to this report, with exhibits thereto and other documents in connection therewith, with the Securities and Exchange Commission, hereby ratifying and confirming all that each of said attorneys-in-fact, or his substitute or substitutes, may do or cause to be done by virtue hereof.
Pursuant to the requirements of the Securities Exchange Act of 1934, as amended, this report has been signed below by the following persons on behalf of the registrant and in the capacities and on the dates indicated.
|
Principal Executive Officer:
|
Principal Financial Officer:
|
|||
|
By:
|
/s/ John J. Donahoe
|
By:
|
/s/ Robert H. Swan
|
|
|
John J. Donahoe
|
Robert H. Swan
|
|||
|
President, Chief Executive Officer and Director
|
Senior Vice President, Finance and Chief Financial Officer
|
|||
|
Principal Accounting Officer:
|
||||
|
By:
|
/s/ Phillip P. DePaul
|
|||
|
Phillip P. DePaul
|
||||
|
Vice President, Chief Accounting Officer
|
||||
F-44
Additional Directors
|
By:
|
/s/ Pierre M. Omidyar
|
By:
|
/s/ Fred D. Anderson
|
|
|
Pierre M. Omidyar
|
Fred D. Anderson
|
|||
|
Founder, Chairman of the Board and Director
|
Director
|
|||
|
By:
|
/s/ Marc L. Andreessen
|
By:
|
/s/ Edward W. Barnholt
|
|
|
Marc L. Andreessen
|
Edward W. Barnholt
|
|||
|
Director
|
Director
|
|||
|
By:
|
/s/ Scott D. Cook
|
By:
|
/s/ William C. Ford, Jr.
|
|
|
Scott D. Cook
|
William C. Ford, Jr.
|
|||
|
Director
|
Director
|
|||
|
By:
|
/s/ Dawn G. Lepore
|
By:
|
/s/ Kathleen C. Mitic
|
|
|
Dawn G. Lepore
|
Kathleen C. Mitic
|
|||
|
Director
|
Director
|
|||
|
By:
|
/s/ David M. Moffett
|
By:
|
/s/ Richard T. Schlosberg, III
|
|
|
David M. Moffett
|
Richard T. Schlosberg, III
|
|||
|
Director
|
Director
|
|||
|
By:
|
/s/ Thomas J. Tierney
|
|||
|
Thomas J. Tierney
|
||||
|
Director
|
||||
Date:
January 30, 2012
F-45
INDEX TO EXHIBITS
|
No.
|
|
Exhibit Description
|
|
Filed with
this 10-K
|
|
Incorporated by Reference
|
||||
|
|
|
|
Form
|
|
File No.
|
|
Date Filed
|
|||
|
2.01
|
|
Share Allocation and Tender Offer Agreement, dated as of April 16, 2009, by and among Registrant, eBay KTA (UK). Ltd. and Gmarket Inc.
|
|
|
8-K
|
|
000-24821
|
|
4/16/2009
|
|
|
2.02
|
|
Share Purchase Agreement, dated as of April 16, 2009, by and among Registrant, eBay KTA (UK). Ltd. and Gmarket Inc.
|
|
|
8-K
|
|
000-24821
|
|
4/16/2009
|
|
|
2.03*++
|
|
Share Purchase Agreement, dated as of September 1, 2009, as amended on September 14, 2009, by and among Registrant, eBay International AG, Sonorit Holding, A.S. and Springboard Group S.à.r.l. (formerly SLP III Cayman DS IV Holdings S.à.r.l.)
|
|
|
10-Q
|
|
000-24821
|
|
10/27/2009
|
|
|
2.04*
|
|
Amendments to Share Purchase Agreement, dated as of October 19, 2009, October 21, 2009, November 5, 2009 and November 19, 2009, by and among Registrant, eBay International AG, Sonorit Holding, A.S. and Springboard Group S.à.r.l. (formerly SLP III Cayman DS IV Holdings S.à.r.l.)
|
|
|
8-K
|
|
000-24821
|
|
11/20/2009
|
|
|
2.05**
|
Agreement and Plan of Merger, dated March 27, 2011, among Registrant, Gibraltar Acquisition Corp. and GSI Commerce, Inc.
|
8-K
|
000-24821
|
3/30/2009
|
||||||
|
3.01
|
|
Registrant's Amended and Restated Certificate of Incorporation.
|
|
|
10-Q
|
|
000-24821
|
|
7/27/2005
|
|
|
3.02
|
|
Registrant's Amended and Restated Bylaws.
|
|
|
8-K
|
|
000-24821
|
|
6/28/2011
|
|
|
4.01
|
|
Form of Specimen Certificate for Registrant's Common Stock.
|
|
|
S-1
|
|
333-59097
|
|
8/19/1998
|
|
|
4.02
|
Indenture dated as of October 28, 2010 between Registrant and Wells Fargo Bank, National Association, as trustee.
|
8-K
|
|
000-24821
|
|
10/28/2010
|
||||
|
4.03
|
Supplemental Indenture dated as of October 28, 2010 between Registrant and Wells Fargo Bank, National Association, as trustee.
|
8-K
|
|
000-24821
|
|
10/28/2010
|
||||
|
4.04
|
Forms of 0.875% Senior Note due 2013, 1.625% Senior Note due 2015 and 3.250% Senior Note due 2020.
|
8-K
|
|
000-24821
|
|
10/28/2010
|
||||
|
a
|
||||||||||
|
4.05
|
Form of 2.50% Convertible Senior Note due 2027.
|
10-Q
|
000-24821
|
7/22/2011
|
||||||
|
4.06
|
Indenture dated as of July 2, 2007 between GSI Commerce, Inc. and The Bank of New York, as trustee.
|
10-Q
|
000-24821
|
7/22/2011
|
||||||
|
4.07
|
First Supplemental Indenture dated as of June 17, 2011 to the Indenture dated as of July 2, 2007 between GSI Commerce, Inc. and The Bank of New York Mellon, as trustee.
|
10-Q
|
000-24821
|
7/22/2011
|
||||||
|
10.01+
|
|
Form of Indemnity Agreement entered into by Registrant with each of its directors and executive officers.
|
|
|
S-1
|
|
333-59097
|
|
7/15/1998
|
|
|
10.02+
|
|
Registrant's 1998 Equity Incentive Plan, as amended.
|
|
|
10-K
|
|
000-24821
|
|
2/28/2007
|
|
|
10.03+
|
|
Form of Stock Bonus Agreement under Registrant's 1998 Equity Incentive Plan.
|
|
|
10-Q
|
|
000-24821
|
|
10/27/2004
|
|
|
10.04+
|
|
Form of Stock Option Agreement under Registrant's 1998 Equity Incentive Plan.
|
|
|
10-Q
|
|
000-24821
|
|
10/27/2004
|
|
|
10.05+
|
|
Form of Restricted Stock Unit Agreement (and Performance-Based Restricted Stock Unit Agreement) under Registrant's 1998 Equity Incentive Plan.
|
|
|
10-K
|
|
000-24821
|
|
2/28/2007
|
|
F-46
|
No.
|
|
Exhibit Description
|
|
Filed with
this 10-K
|
|
Incorporated by Reference
|
||||
|
|
|
|
Form
|
|
File No.
|
|
Date Filed
|
|||
|
10.06+
|
|
Registrant's Amended and Restated 1998 Employee Stock Purchase Plan.
|
|
|
10-Q
|
|
000-24821
|
|
7/27/2007
|
|
|
10.07+
|
|
Registrant's 1998 Directors Stock Option Plan, as amended.
|
|
|
10-K
|
|
000-24821
|
|
2/28/2007
|
|
|
10.08+
|
|
Registrant's 1999 Global Equity Incentive Plan, as amended.
|
|
|
10-Q
|
|
000-24821
|
|
7/27/2007
|
|
|
10.09+
|
|
Form of Stock Option Agreement under Registrant's 1999 Global Equity Incentive Plan.
|
|
|
10-Q
|
|
000-24821
|
|
10/27/2004
|
|
|
10.10+
|
|
Form of Restricted Stock Unit Agreement under Registrant's 1999 Global Equity Incentive Plan.
|
|
|
10-K
|
|
000-24821
|
|
2/28/2007
|
|
|
10.11+
|
|
Registrant's 2001 Equity Incentive Plan, as amended.
|
|
|
10-K
|
|
000-24821
|
|
2/28/2007
|
|
|
10.12+
|
|
Form of Stock Option Agreement under Registrant's 2001 Equity Incentive Plan.
|
|
|
10-Q
|
|
000-24821
|
|
10/27/2004
|
|
|
10.13+
|
|
Registrant's 2003 Deferred Stock Unit Plan, as amended.
|
|
|
10-K
|
|
000-24821
|
|
2/28/2007
|
|
|
10.14+
|
|
Form of 2003 Deferred Stock Unit Plan Electing Director Award Agreement, as amended.
|
|
|
10-Q
|
|
000-24821
|
|
4/25/2006
|
|
|
10.15+
|
|
Form of 2003 Deferred Stock Unit Plan New Director Award Agreement, as amended.
|
|
|
10-Q
|
|
000-24821
|
|
4/25/2006
|
|
|
10.16+
|
|
Form of 2003 Deferred Stock Unit Plan Restricted Stock Unit Grant Notice and Agreement
|
|
|
10-Q/A
|
|
000-24821
|
|
4/24/2008
|
|
|
10.17+
|
|
Registrant's 2008 Equity Incentive Award Plan, as amended and restated
|
|
|
10-Q
|
|
000-24821
|
|
7/23/2010
|
|
|
10.18+
|
|
Amendment to the Registrant's 2008 Equity Incentive Award Plan, Registrant's 2001 Equity Incentive Plan, Registrant's 1999 Global Equity Incentive Plan, Registrant's 1998 Equity Incentive Plan and Shopping.com Ltd. 2004 Equity Incentive Plan.
|
|
|
10-Q
|
|
000-24821
|
|
7/29/2009
|
|
|
10.19+
|
|
Form of Restricted Stock Unit Agreement (and Performance-Based Restricted Stock Unit Agreement) under Registrant's 2008 Equity Incentive Award Plan.
|
|
|
8-K
|
|
000-24821
|
|
6/25/2008
|
|
|
10.20+
|
|
eBay Incentive Plan.
|
|
|
DEF 14A
|
|
000-24821
|
|
3/19/2010
|
|
|
10.21+
|
|
eBay Inc. Deferred Compensation Plan.
|
|
|
8-K
|
|
000-24821
|
|
12/20/2007
|
|
|
10.22+
|
|
Employment Letter Agreement dated March 31, 2008, between John Donahoe and Registrant
|
|
|
10-Q/A
|
|
000-24821
|
|
4/24/2008
|
|
|
10.23+
|
|
Letter Agreement dated September 30, 2008 between Robert Swan and Registrant.
|
|
|
10-Q
|
|
000-24821
|
|
10/23/2008
|
|
F-47
|
No.
|
|
Exhibit Description
|
|
Filed with
this 10-K
|
|
Incorporated by Reference
|
||||
|
|
|
|
Form
|
|
File No.
|
|
Date Filed
|
|||
|
10.24+
|
|
Separation Agreement dated October 20, 2010 between Lorrie Norrington and Registrant.
|
|
|
10-Q
|
|
000-24821
|
|
10/23/2010
|
|
|
10.25
|
Form of Voting and Support Agreement entered into between Registrant and Michael G. Rubin.
|
8-K
|
000-24821
|
3/30/2011
|
||||||
|
10.26
|
Form of Voting and Support Agreement entered into between Registrant and the following directors and officers of GSI Commerce, Inc.: M. Jeffrey Branman, Michael J. Donahue, Ronald D. Fisher, John A. Hunter, Josh Kopelman, Mark S. Menell, Jeffrey F. Rayport, David Rosenblatt, Lawrence S. Smith, Andrea M. Weiss, Michael R. Conn, James Flanagan, J. Scott Hardy, Damon Mintzer and Christopher Saridakis.
|
8-K
|
000-24821
|
3/30/2011
|
||||||
|
10.27+
|
GSI Commerce, Inc. 2010 Equity Incentive Plan.
|
10-Q
|
000-24821
|
7/22/2011
|
||||||
|
10.28+
|
Amendment to GSI Commerce, Inc. 2010 Equity Incentive Plan.
|
10-Q
|
000-24821
|
7/22/2011
|
||||||
|
10.29+
|
Form of Restricted Stock Unit Agreement (and Performance-Based Restricted Stock Unit Agreement) under GSI Commerce, Inc. 2010 Equity Incentive Plan, as amended.
|
10-Q
|
000-24821
|
7/22/2011
|
||||||
|
10.30+
|
Letter Agreement dated July 7, 2011 between Christopher Saridakis and Registrant.
|
10-Q
|
000-24821
|
7/22/2011
|
||||||
|
10.31+
|
Performance Award Agreement dated June 16, 2011, between Christopher Saridakis and GSI Commerce, Inc.
|
10-Q
|
000-24821
|
7/22/2011
|
||||||
|
10.32+
|
Offer letter dated August 30, 2011 and executed on September 2, 2011 between Registrant and Devin Wenig.
|
8-K
|
000-24821
|
9/6/2011
|
||||||
|
10.33
|
Credit Agreement, dated as of November 22, 2011, by and among Registrant, JPMorgan Chase Bank, N.A., as Administrative Agent, and the other parties thereto.
|
8-K
|
000-24821
|
11/28/2011
|
||||||
|
12.01
|
|
Statement regarding computation of ratio of earnings to fixed charges.
|
|
X
|
|
|
|
|||
|
21.01
|
|
List of Subsidiaries.
|
|
X
|
|
|
|
|||
|
23.01
|
|
PricewaterhouseCoopers LLP consent.
|
|
X
|
|
|
|
|||
|
24.01
|
|
Power of Attorney (see signature page).
|
|
X
|
|
|
|
|||
|
31.01
|
|
Certification of Registrant's Chief Executive Officer, as required by Section 302 of the Sarbanes-Oxley Act of 2002.
|
|
X
|
|
|
|
|||
|
31.02
|
|
Certification of Registrant's Chief Financial Officer, as required by Section 302 of the Sarbanes-Oxley Act of 2002.
|
|
X
|
|
|
|
|||
|
32.01
|
|
Certification of Registrant's Chief Executive Officer, as required by Section 906 of the Sarbanes-Oxley Act of 2002.
|
|
X
|
|
|
|
|||
|
32.02
|
|
Certification of Registrant's Chief Financial Officer, as required by Section 906 of the Sarbanes-Oxley Act of 2002.
|
|
X
|
|
|
|
|||
|
101.INS
|
|
XBRL Instance Document
|
|
X
|
|
|
|
|||
|
101.SCH
|
|
XBRL Taxonomy Extension Schema Document
|
|
X
|
|
|
|
|||
F-48
|
No.
|
|
Exhibit Description
|
|
Filed with
this 10-K
|
|
Incorporated by Reference
|
||||
|
|
|
|
Form
|
|
File No.
|
|
Date Filed
|
|||
|
101.CAL
|
|
XBRL Taxonomy Extension Calculation Linkbase Document
|
|
X
|
|
|
|
|||
|
101.DEF
|
|
XBRL Taxonomy Extension Definition Linkbase Document
|
|
X
|
|
|
|
|||
|
101.LAB
|
|
XBRL Taxonomy Extension Label Linkbase Document
|
|
X
|
|
|
|
|||
|
101.PRE
|
|
XBRL Taxonomy Extension Presentation Linkbase Document
|
|
X
|
|
|
|
|||
|
+
|
Indicates a management contract or compensatory plan or arrangement
|
|
++
|
Portions of this exhibit are subject to a request for confidential treatment and have been redacted and filed separately with the Securities and Exchange Commission.
|
|
*
|
The annexes and schedules to the Share Purchase Agreement have been omitted from this filing pursuant to Item 601(b)(2) of Regulation S-K. The Registrant will furnish copies of any annexes or schedules to the Securities and Exchange Commission upon request.
|
|
**
|
The schedules and exhibits to the Agreement and Plan of Merger have been omitted from this filing pursuant to Item 601(b)(2) of Regulation S-K. The Registrant will furnish copies of any annexes or schedules to the Securities and Exchange Commission upon request.
|
F-49
TABLE OF CONTENTS
Part I: Financial InformationItem 1:financial StatementsNote 1 The Company and Summary Of Significant Accounting PoliciesNote 2 Net Income Per ShareNote 3 - Business CombinationsNote 4 - Skype Related TransactionsNote 5 Goodwill and Intangible AssetsNote 6 SegmentsNote 7 - InvestmentsNote 8 Fair Value Measurement Of Assets and LiabilitiesNote 9 Derivative InstrumentsNote 10 - Balance Sheet ComponentsNote 11 RestructuringNote 12 - DebtNote 13 Commitments and ContingenciesNote 14 - Related Party TransactionsNote 15 - Stockholders' EquityNote 16 Stock Repurchase ProgramNote 17 Stock-based and Employee Savings PlansNote 18 Income TaxesNote 19 - Loans and Interest Receivable, NetNote 20 Interest and Other, Net