UNITED STATES
SECURITIES AND EXCHANGE COMMISSION
Washington, D.C. 20549
|
FORM 10-K
|
||
(Mark One)
|
ý
|
ANNUAL REPORT PURSUANT TO SECTION 13 OR 15(d) OF THE SECURITIES EXCHANGE ACT OF 1934
|
For the fiscal year ended
December 31, 2017
OR
|
¨
|
TRANSITION REPORT PURSUANT TO SECTION 13 OR 15(d) OF THE SECURITIES EXCHANGE ACT OF 1934
|
For the transition period from to
Commission File Number: 001-38221
|
PQ Group Holdings Inc.
|
||
|
Delaware
|
|
81-3406833
|
|
(State or other jurisdiction of
incorporation or organization)
|
|
(I.R.S. Employer
Identification No.)
|
|
|
||
|
300 Lindenwood Drive
Valleybrooke Corporate Center
Malvern, Pennsylvania
|
|
19355
|
|
(Address of principal executive offices)
|
|
(Zip Code)
|
|
(610) 651-4400
(Registrant’s telephone number, including area code)
|
||
|
Securities registered pursuant to Section 12(b) of the Act:
|
||
|
Title of each class
|
|
Name of exchange on which registered
|
|
Common stock, par value $0.01 per share
|
|
New York Stock Exchange
|
Indicate by check mark if the registrant is a well-known seasoned issuer, as defined in Rule 405 of the Securities Act. Yes
¨
No
ý
Indicate by check mark if the registrant is not required to file reports pursuant to Section 13 or Section 15(d) of the Act. Yes
¨
No
ý
Indicate by check mark whether the registrant (1) has filed all reports required to be filed by Section 13 or 15(d) of the Securities Exchange Act of 1934 during the preceding 12 months (or for such shorter period that the registrant was required to file such reports), and (2) has been subject to such filing requirements for the past 90 days. Yes
ý
No
¨
Indicate by check mark whether the registrant has submitted electronically and posted on its corporate website, if any, every Interactive Data File required to be submitted and posted pursuant to Rule 405 of Regulation S-T (§ 232.405 of this chapter) during the preceding 12 months (or for such shorter period that the registrant was required to submit and post such files). Yes
ý
No
¨
Indicate by check mark if disclosure of delinquent filers pursuant to Item 405 of Regulation S-K (§ 229.405 of this chapter) is not contained herein, and will not be contained, to the best of the registrant’s knowledge, in definitive proxy or information statements incorporated by reference in Part III of this Form 10-K or any amendment to this Form 10-K. Yes
ý
No
¨
Indicate by check mark whether the registrant is a large accelerated filer, an accelerated filer, a non-accelerated filer, a smaller reporting company, or emerging growth company. See the definitions of “large accelerated filer,” “accelerated filer,” “smaller reporting company,” and “emerging growth company” in Rule 12b-2 of the Exchange Act.
|
Large accelerated filer
|
|
¨
|
|
Accelerated filer
|
|
¨
|
|
|
|
|
|
|||
|
Non-accelerated filer
|
|
ý
(Do not check if a smaller reporting company)
|
|
Smaller reporting company
|
|
¨
|
|
Emerging growth company
|
¨
|
|||||
|
If an emerging growth company, indicate by check mark if the registrant has elected not to use the extended transition period for complying with any new or revised financial accounting standards provided pursuant to Section 13(a) of the Exchange Act.
¨
|
||||||
Indicate by check mark whether the registrant is a shell company (as defined in Rule 12b-2 of the Exchange Act). Yes
¨
No
ý
PQ Group Holdings Inc. completed the initial public offering of its common stock on October 3, 2017. Accordingly, there was no public market for the registrant’s common stock as of June 30, 2017, the last business day of the registrant’s most recently completed second fiscal quarter. As of December 31, 2017, the aggregate value of the registrant’s common stock held by non-affiliates was approximately
$641,036,201
, based on the number of shares held by non-affiliates as of December 31, 2017 and the closing price of the registrant’s common stock on the New York Stock Exchange on December 31, 2017.
The number of shares of common stock outstanding as of
March 19, 2018
was
135,240,866
.
DOCUMENTS INCORPORATED BY REFERENCE
Portions of the PQ Group Holdings Inc. Proxy Statement for the 2018 Annual Meeting of Stockholders are incorporated by reference into Part III of this report.
PQ GROUP HOLDINGS INC.
INDEX—FORM 10-K
December 31, 2017
|
Page
|
||
|
PART I
|
||
|
Item 1.
|
||
|
Item 1A.
|
||
|
Item 1B.
|
||
|
Item 2.
|
||
|
Item 3.
|
||
|
Item 4.
|
||
|
PART II
|
||
|
Item 5.
|
||
|
Item 6.
|
||
|
Item 7.
|
||
|
Item 7A.
|
||
|
Item 8.
|
||
|
Item 9.
|
||
|
Item 9A.
|
||
|
Item 9B.
|
||
|
PART III
|
||
|
Item 10.
|
||
|
Item 11.
|
||
|
Item 12.
|
||
|
Item 13.
|
||
|
Item 14.
|
||
|
PART IV
|
||
|
Item 15.
|
||
|
Item 16.
|
||
i
Forward-looking Statements
This Annual Report on Form 10-K (“Form 10-K”) includes statements that express our opinions, expectations, beliefs, plans, objectives, assumptions or projections regarding future events or future results and therefore are, or may be deemed to be, “forward-looking statements” within the meaning of the Private Securities Litigation Reform Act of 1995 (the “Act”). The following cautionary statements are being made pursuant to the provisions of the Act and with the intention of obtaining the benefits of the “safe harbor” provisions of the Act. The words “believe,” “may,” “will,” “estimate,” “continue,” “anticipate,” “intend,” “expect,” “should” and similar expressions are intended to identify forward-looking statements. We have based these forward-looking statements largely on our current expectations and projections about future events and financial trends that we believe may affect our financial condition, results of operations, business strategy, short- and long-term business operations and objections, and financial needs. Examples of forward-looking statements include, but are not limited to, statements we make regarding our liquidity, including our belief that our current level of operations, cash and cash equivalents, cash flow from operations and borrowings under our credit facilities and other lines of credit will provide us adequate cash to fund the working capital, capital expenditure, debt service and other requirements for our business for the foreseeable future. These forward-looking statements are subject to a number of risks, uncertainties and assumptions. Moreover, we operate in a very competitive and rapidly changing environment and new risks emerge from time to time. It is not possible for our management to predict all risks, nor can we assess the impact of all factors on our business or the extent to which any factor, or combination of factors, may cause actual results to differ materially from those contained in any forward-looking statements we may make. In light of these risks, uncertainties and assumptions, the forward-looking events and circumstances discussed herein may not occur and actual results could differ materially and adversely from those anticipated or implied in the forward-looking statements. Some of the key factors that could cause actual results to differ from our expectations include risks related to:
|
•
|
our exposure to local business risks and regulations in different countries;
|
|
•
|
general economic conditions;
|
|
•
|
exchange rate fluctuations;
|
|
•
|
legal and regulatory compliance;
|
|
•
|
technological or other changes in our customers’ products;
|
|
•
|
our and our competitors’ research and development;
|
|
•
|
fluctuations in prices of raw materials and relationships with our key suppliers;
|
|
•
|
substantial competition;
|
|
•
|
non-payment or non-performance by our customers;
|
|
•
|
reliance on a small number of customers;
|
|
•
|
potential early termination or non-renewal of customer contracts in our refining services product group;
|
|
•
|
reductions in highway safety spending;
|
|
•
|
seasonal fluctuations in demand for some of our products;
|
|
•
|
retention of certain key personnel;
|
|
•
|
our expansion projects;
|
|
•
|
potential product liability claims;
|
|
•
|
existing and potential future government regulation;
|
|
•
|
the extensive environmental, health and safety regulations to which we are subject;
|
|
•
|
disruption of production and distribution of our products;
|
|
•
|
our insurance coverage;
|
|
•
|
product quality;
|
|
•
|
our acquisition strategy;
|
1
|
•
|
our joint venture investments;
|
|
•
|
our failure to protect our intellectual property and infringement on the intellectual property rights of third parties;
|
|
•
|
information technology risks;
|
|
•
|
potential labor disruptions;
|
|
•
|
litigation and other administrative and regulatory proceedings; and
|
|
•
|
our substantial indebtedness.
|
The forward-looking statements included herein are made only as of the date hereof. You should not rely upon forward-looking statements as predictions of future events. Although we believe that the expectations reflected in the forward-looking statements are reasonable, we cannot guarantee that the future results, levels of activity, performance or events and circumstances reflected in the forward-looking statements will be achieved or occur. Moreover, neither we nor any other person assumes responsibility for the accuracy and completeness of the forward-looking statements. We undertake no obligation to update publicly any forward-looking statements for any reason after the date of this Form 10-K to conform these statements to actual results or to changes in our expectations.
|
ITEM 1.
|
BUSINESS.
|
On May 4, 2016, we consummated a series of transactions (the “Business Combination”) to reorganize and combine the businesses of PQ Holdings Inc. (“PQ Holdings”) and Eco Services Operations LLC (“Eco”) under a new holding company, PQ Group Holdings Inc. (“PQ Group Holdings” or the “company”), pursuant to a reorganization and transaction agreement, dated August 17, 2015, as amended, by and among PQ Group Holdings, PQ Holdings, PQ Corporation, Eco, Eco Services Holdings LLC, Eco Services Group Holdings LLC and certain investment funds affiliated with CCMP Capital Advisors, LLC (now known as CCMP Capital Advisors, LP; “CCMP”). We refer to the business of PQ Holdings prior to the Business Combination as “legacy PQ” and the business of Eco prior to the Business Combination as “legacy Eco.” Unless the context otherwise indicates, the terms “PQ Group Holdings Inc.,” “we,”, “us,” “our,” or “the Company” mean PQ Group Holdings Inc. and subsidiaries.
PQ Group Holdings was incorporated in Delaware on August 7, 2015. PQ Holdings, a manufacturer of catalysts, specialty materials and chemicals, was incorporated in Delaware on June 22, 2007. Eco, which acquired substantially all of the assets of Solvay USA Inc.’s sulfuric acid refining services business unit on December 1, 2014 (the “2014 Acquisition”), was incorporated in Delaware on July 30, 2014. Our principal executive offices are located at 300 Lindenwood Drive, Valleybrooke Corporate Center, Malvern, Pennsylvania 19355.
Our Company
We are a leading global provider of catalysts, specialty materials and chemicals, and services that enable environmental improvements, enhance consumer products, and increase personal safety. Our products and solutions help companies produce vehicles with improved fuel efficiency and cleaner emissions. Our materials are critical ingredients in consumer products that make teeth brighter, skin softer, and wounds heal faster. We produce highly engineered materials that make highways and airports safer for drivers and pilots. Because our products are predominantly inorganic and carbon-free, we believe we contribute to improving the sustainability of our planet.
We believe our products deliver significant value to our customers, as demonstrated by our profit margins. Our products, which are mostly additives, catalysts, and services, typically constitute a small portion of our customers’ overall end-product costs yet are critical to product performance. For example, our catalysts are highly technical, customized products that require customer collaboration and significant lead time, resources, and intellectual property to develop. Through this collaborative innovation process, we have developed zeolite-based catalysts that are an effective and efficient method to reduce pollutants in diesel engines and enable our customers to meet increasingly stringent vehicle emission standards worldwide. In personal care applications, we have collaborated with leading consumer products companies over a number of years to develop a family of gentle silica-based dentifrice abrasives that produce more effective cleaning toothpastes. These collaborative efforts with our customers continue to drive our product innovation process.
Our value-added products seek to address global issues that are often either the subject of significant regulations or are driven by consumer preferences, which we believe positions us to grow in excess of gross domestic product growth rates. Consumer preferences and global regulations requiring environmentally friendlier products are at the core of many of our value-added products and, we believe, provide us with high-margin growth opportunities. For example, our products and services facilitate improvement in vehicle fuel efficiency and emissions, enable vehicles to be lighter, and allow tires to roll and engines to run with less friction. The production of higher octane gasoline, which is needed for certain smaller turbocharged engines, has generated additional demand for the alkylation units that use our refinery services.
2
We have two reporting segments: (1) Environmental Catalysts and Services, and (2) Performance Materials and Chemicals. In our Environmental Catalysts and Services segment, we have three product groups: silica catalysts, zeolite catalysts, and refining services. We operate our zeolite catalyst product group through Zeolyst International and Zeolyst C.V. (our 50% owned joint ventures that we refer to collectively as our “Zeolyst Joint Venture”). In our Performance Materials and Chemicals segment, we have two product groups: performance materials and performance chemicals.
In
2017
, we served over
4,000
customers globally across many end uses and, as of
December 31, 2017
, operated
72
manufacturing facilities which are strategically located across six continents. We believe we are a leader in each of our product groups, holding what we estimate to be a number one or number two supply share position for products that generated more than 90% of our
2017
sales. We believe that our global footprint and efficient network of strategically located manufacturing facilities provide us with a strong competitive advantage in serving our customers. We serve these customers both regionally as well as globally. We believe that we hold our leading supply share positions in the key regions that we serve while also benefiting from leading global presence and capabilities. Within our performance chemicals product group, we estimate that we had approximately three times the sodium silicate supply share of our closest competitor based on
2017
sales volume. This product group, which is the backbone across our additives and catalyst platform, is highly regionalized because of the expense of shipping sodium silicates extended distances due to their water content. Our refining services product group is also a highly regionalized business due to shipping costs and customer integration requirements, and in
2017
we estimate that we had a regenerated sulfuric acid supply share in excess of 50% in the United States, which we believe is substantially larger than our closest competitor. We recently reorganized our business to be market-based rather than product-based in order to better align our product groups with similar end uses to meet our customers’ needs.
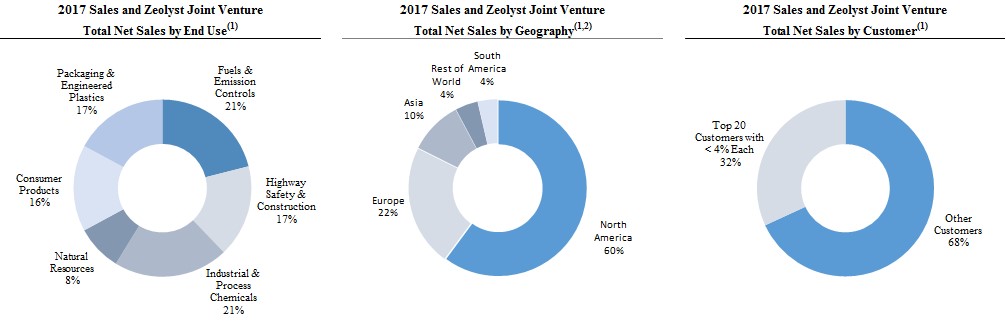
We are highly diversified by business, geography, and end use, and in
2017
the majority of our sales were into applications that have historically had relatively predictable, consistent demand patterns driven by consumption or frequent replacement cycles.
|
(1)
|
Percentage calculations include
$143.8 million
of total net sales attributable to our Zeolyst Joint Venture, which represents 50% of its total net sales for the year ended
December 31, 2017
. Refer to “Management’s Discussion and Analysis of Financial Condition and Results of Operations - Basis of Presentation” for a description of the treatment of our Zeolyst Joint Venture in our consolidated financial information.
|
|
(2)
|
Based on the delivery destination for products sold in 2017.
|
Our Industry
We compete in the specialty chemicals and materials industry. Our industry is characterized by constant development of new products and the need to support customers with new product innovation and technical services to meet their challenges. In addition, customers demand consistent product quality and a reliable source of supply. Products sold to our customers can be highly value-added even when they represent only a small portion of the overall end product costs, and success can be achieved by helping customers improve their product performance, value, and quality. As a result, operating margins in this sector have historically been high and generally stable through economic cycles. In addition, many products in the specialty chemicals and materials industry benefit from economics that favor incumbent producers because the capital cost to expand existing capacity is typically significantly less than the capital cost necessary to build a new plant. The combination of attractive operating margins and moderate and generally predictable maintenance capital expenditure requirements can produce attractive cash flows. Our industry is also characterized by the need to produce consistent quality in a safe and environmentally sustainable manner.
3
The table below summarizes our key end use applications and products as well as the significant growth drivers in those applications.
|
2017 Sales and
|
|||
|
Zeolyst Joint Venture
|
|||
|
Key End Uses
|
Total Net Sales
(1)
|
Significant Growth Drivers
|
Key PQ Products
|
|
Fuels & Emission Controls
|
21%
|
• Global regulatory requirements to:
|
• Refinery catalysts
|
|
• Remove nitrogen oxides from emissions
|
• Emission control catalysts
|
||
|
• Remove sulfur from diesel and gasoline
|
• Catalyst recycling services
|
||
|
• Increase gasoline octane in order to improve fuel efficiency while lowering vapor pressure to regulated levels for premium fuels
|
|||
|
• Improve lubricant characteristics to improve fuel efficiencies
|
|||
|
Consumer Products
|
16%
|
• Substitution of silicate materials for less environmentally friendly chemical additives in detergent and cleaning end uses
|
• Silica gels for edible oil and beer clarification
|
|
• Demand for improved quality and shelf life of beverages
|
• Precipitated silicas and zeolites for the surface coating, dentifrice, and dishwasher and laundry detergent applications
|
||
|
• Demand for improved oral hygiene and appearance
|
|||
|
Highway Safety & Construction
|
17%
|
• Demand for enhanced "dry and wet" visibility of road and airport markings to improve safety
|
• Reflective markings for roadways and airports
|
|
• Drive for weight reduction in cements
|
• Hollow glass beads, or microspheres, for cement additives
|
||
|
Packaging & Engineered Plastics
|
17%
|
• Demand for increased process efficiency and reduction of by-products in production chemicals
|
• Catalysts for high-density polyethlene and chemicals syntheses
|
|
• Demand for high-density polyethlene lightweighting of automotive components
|
• Antiblocks for film packaging
|
||
|
• Enhanced properties in plastic composites for the automotive and electronics industries
|
• Solid and hollow microspheres for composite plastics
|
||
|
Industrial & Process Chemicals
|
21%
|
• Demand in the tire industry for reduced rolling resistance
|
• Silicate precursors for the tire industry
|
|
• Usage of silicate in municipal water treatment to inhibit corrosion in aging pipelines
|
• Silicate for water treatment
|
||
|
• Growth in manufacturing North America driving demand for metal finishing
|
• Glass beads, or microspheres, for metal finishing end uses
|
||
|
Natural Resources
|
8%
|
• More environmentally friendly drilling fluids for oil and gas production
|
• Silicates for drilling muds
|
|
• Recovery in global oil drilling/U.S. copper production
|
• Hollow glass beads, or microspheres, for oil well cements
|
||
|
• Growing demand for lighter weight cements in oil and natural gas wells
|
• Sulfur derivatives for copper mining
|
||
|
• Bleaching aids for paper
|
|||
|
(1)
|
Percentage calculations include
$143.8 million
of total net sales attributable to our Zeolyst Joint Venture, which represents 50% of its total net sales for the year ended
December 31, 2017
. Refer to “Management’s Discussion and Analysis of Financial Condition
|
4
and Results of Operations - Basis of Presentation” for a description of the treatment of our Zeolyst Joint Venture in our consolidated financial information.
Our Business Segments
The table below summarizes certain information regarding our two reporting segments and our five product groups for the year ended
December 31, 2017
.
|
Year ended December 31, 2017
|
|||||||||||||||||||||||||||
|
(Dollars in millions)
Segments and Product Groups
|
Sales
|
% of
Total Sales
|
Zeolyst Joint Venture Total Net Sales
(1)
|
% of Total Sales and Zeolyst Joint Venture Total Net Sales
(1)(2)
|
Net Income
|
Adjusted EBITDA
(1)
|
% of Total Adjusted EBITDA
(1)(3)
|
Estimated Supply Share Position
(4)
|
|||||||||||||||||||
|
Environmental Catalysts and Services:
|
|||||||||||||||||||||||||||
|
Silica Catalysts
|
$
|
75.3
|
|
5.1
|
%
|
$
|
—
|
|
4.7
|
%
|
# 2
|
||||||||||||||||
|
Zeolite Catalysts
|
—
|
|
—
|
%
|
143.8
|
|
8.9
|
%
|
Primarily #1 or #2
|
||||||||||||||||||
|
Refining Services
|
398.4
|
|
27.1
|
%
|
—
|
|
24.6
|
%
|
#1
|
||||||||||||||||||
|
Subtotal
|
$
|
473.7
|
|
32.2
|
%
|
$
|
143.8
|
|
38.1
|
%
|
$
|
243.6
|
|
49.6
|
%
|
||||||||||||
|
Performance Materials and Chemicals:
|
|||||||||||||||||||||||||||
|
Performance Chemicals
|
$
|
687.6
|
|
46.7
|
%
|
$
|
—
|
|
42.5
|
%
|
Primarily #1
(5)
|
||||||||||||||||
|
Performance Materials
|
324.2
|
|
22.0
|
%
|
—
|
|
20.0
|
%
|
Primarily #1
(6)
|
||||||||||||||||||
|
Sales Eliminations
|
(10.0
|
)
|
(0.7
|
)%
|
—
|
|
(0.6
|
)%
|
|||||||||||||||||||
|
Subtotal
|
$
|
1,001.8
|
|
68.1
|
%
|
$
|
—
|
|
61.9
|
%
|
$
|
240.2
|
|
50.4
|
%
|
||||||||||||
|
Eliminations/Corporate
|
(3.4
|
)
|
—
|
|
|
(30.5
|
)
|
|
|||||||||||||||||||
|
Total
|
$
|
1,472.1
|
|
100.0
|
%
|
$
|
143.8
|
|
100.0
|
%
|
$
|
57.6
|
|
$
|
453.3
|
|
100.0
|
%
|
|||||||||
|
(1)
|
Percentage calculations include
$143.8 million
of total net sales attributable to our Zeolyst Joint Venture, which represents 50% of its total net sales for the year ended
December 31, 2017
. Refer to “Management’s Discussion and Analysis of Financial Condition and Results of Operations - Basis of Presentation” for a description of the treatment of our Zeolyst Joint Venture in our consolidated financial information.
|
|
(2)
|
Percentage calculations exclude
$3.4 million
in intersegment sales eliminations.
|
|
(3)
|
Percentage calculations exclude
$30.5 million
in corporate expenses.
|
|
(4)
|
Estimated supply share positions are based on management’s estimates based on
2017
sales volume and represent our estimated global supply share positions for each of our product groups, except that the estimated supply share position for our refining services product group reflects our estimate of only our supply share position in the United States and excludes volume attributable to manufacturers who produce primarily for their own consumption.
|
|
(5)
|
We believe we hold #1 supply share positions with respect to products that accounted for approximately
74%
of our performance chemicals product group’s
2017
sales, and that we hold #2 supply share positions with respect to products that accounted for the remaining approximately
26%
of our performance chemicals product group’s
2017
sales.
|
|
(6)
|
We believe we hold #1 supply share positions with respect to products that accounted for approximately
89%
of our performance materials product group’s
2017
sales, and that we hold #2 supply share positions with respect to products that accounted for the remaining approximately
11%
of our performance materials product group’s
2017
sales.
|
We are an integrated, global provider of catalysts, specialty materials and chemicals, and services that share common end uses, manufacturing techniques, and process technology. For example, all of our product groups address challenges faced by global automotive companies to meet increasingly strict fuel efficiency standards. Our manufacturing platform is based on furnace technology and proprietary knowledge developed from almost two centuries of combined experience at legacy PQ and legacy Eco applying silicates chemistry production and the development of applications across a broadening set of end uses. All of our product groups produce materials through our furnace process, other than our silica catalysts and zeolite catalysts product groups, which are derivatives of our performance chemicals product group. We believe we have a differentiated capability around furnace operations that enables us to operate more efficiently than most of our competitors.
5
Environmental Catalysts & Services
Our Environmental Catalysts and Services business is a leading global innovator and producer of catalysts for the refinery, emission control, and petrochemical industries and is also a leading provider of catalyst recycling services to the North American refining industry. We believe our products are critical for our customers in these growing applications and impart essential functionality in chemical and refining production processes and in emission control for engines.
Our catalysts are highly technical and customized for our customers, and can require up to ten years of development and collaboration with customers in order to commercialize. Catalyst specifications are constantly evolving in order to address changing customer demands and requirements for lower cost and improved quality. As a result, we must continuously collaborate with our customers to create new and more efficient pathways for the production of chemicals and fuels.
Silica Catalysts.
In our silica catalysts product group, we sell both the finished catalyst and catalyst supports, which are critical catalyst components for the production of HDPE, a high strength and high stiffness plastic used in packaging films, bottles, containers, and other molded applications. We also produce a catalyst that is used globally for the production of methyl methacrylate, the monomer for acrylic engineering resins, a clear scratch-resistant plastic used in sheet or molded form to replace glass and as a durable surface coating. Because these catalysts are highly technical and customized for our customers to produce resins with specific properties, they are often covered under long-term supply agreements and, in some cases, we are a customer’s sole source supplier. In addition, we produce silica products that are used to prevent opposite faces of polyolefin and polyester films from adhering to one another during manufacturing or otherwise.
Zeolite Catalysts.
Our zeolite catalysts product group is a leading global supplier of emission control catalysts as well as a supplier of specialty catalysts, precursors, and formulations to refineries and downstream petrochemicals and chemical companies. We operate this product group through our Zeolyst Joint Venture. These specialty zeolite-based catalysts are sold to the emission control industry for use in diesel emission control units in both on-road and non-road diesel engines. In addition, our zeolite catalysts product group is a leading supplier to the hydrocracking catalyst industry as a direct seller and supplier to other catalyst suppliers.
Our specialty zeolite catalysts are used in an advanced emission control technology called selective catalytic reduction. This process uses ammonia to react with engine exhaust gases via our catalysts in order to convert nitrogen oxides (NOx), a pollutant, into nitrogen and water. We believe that our zeolite catalysts can enable selective catalytic reduction technology to reduce the amount of nitrogen oxides in such exhaust gases by more than 90%. A schematic of a typical diesel emission control system is below.
Representative Diesel Emission Control System
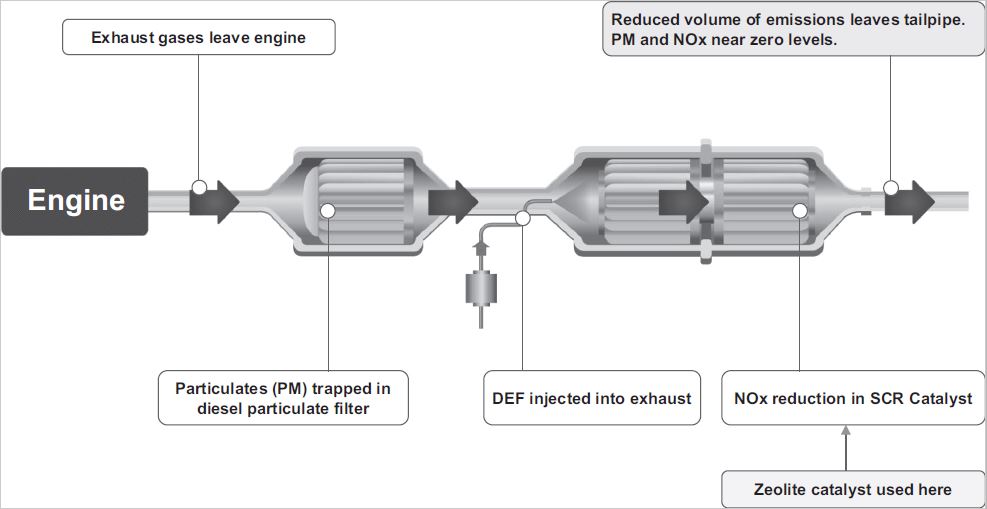
We believe that this technology is one of the most cost-effective methods to reduce diesel engine emissions. Emission control regulations have created demand for this technology, and we believe that future regulations will generate additional growth and development opportunities for this technology and, as a result, our zeolite catalysts and precursors.
6
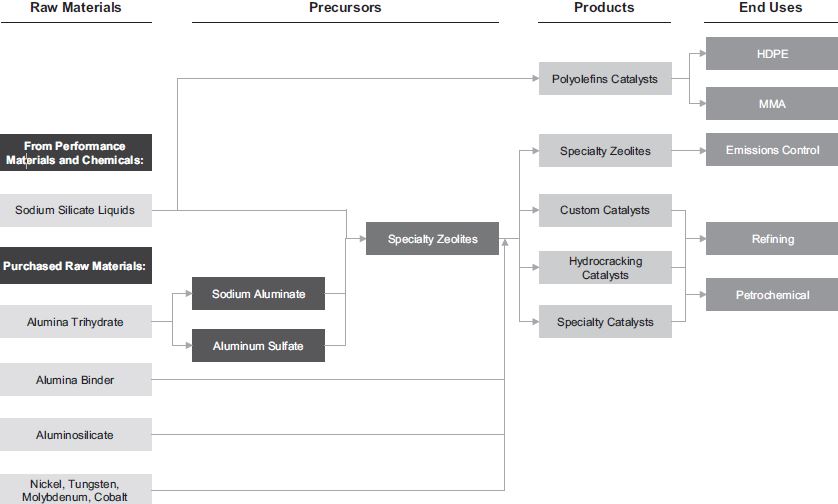
Our Zeolyst Joint Venture is a long-standing partnership dating back to 1988, which combines our expertise in zeolite supply and technology with our partner’s expertise in global refinery catalyst sales and technology. We supply sodium silicates from our performance chemicals product group to the Zeolyst Joint Venture to make specialty zeolites, which are used as precursors in emission control and custom catalysts. We also produce specialty zeolites that are precursors for the production of hydrocracking catalysts and other refinery and petrochemical catalysts that are used by our other product groups and sold to third parties. We manage the production of these specialty zeolites due to our expertise in zeolite production. These catalysts include aromatic catalysts that upgrade aromatic by-product streams, dewaxing catalysts that improve lube oil performance and diesel cold flow performance, and paraffin isomerization catalysts that upgrade olefins to high octane gasoline blending components, for refinery and petrochemical customers.
Refining Services
. Sulfuric acid is the primary catalyst used in the production of alkylates for gasoline production at refineries. Alkylates are a critical additive that increase octane in gasoline at low vapor pressure, which is needed in order for turbocharged engines to meet increasingly stringent fuel efficiency standards. Our refining services product group provides recycling and end-to-end logistics for refiners who use sulfuric acid in their alkylation units. These recycling units also produce virgin sulfuric acid and sodium bisulfate, which we sell into the water treatment, mining, and general industrial and chemicals industries.
After sulfuric acid is used in an alkylation unit, it becomes spent acid, which is diluted with water and hydrocarbons, and then needs to be recycled before it can be reused. Sulfuric acid regeneration enables refineries to manage their spent acid and obtain fresh acid for reuse in their alkylation processes. Because storage space for fresh and spent acid is typically limited, and the cost to refineries of interruption to their alkylation units would be significant, refineries seek to have a continuous and reliable source of supply for sulfuric acid. By providing regeneration services, as well as purchasing by-product sulfur from customers as a source of energy and for use in manufacturing virgin sulfuric acid, we believe that we provide our refining customers with a full solution for their sulfuric acid needs. Our refining services product group is highly regionalized due to shipping costs and our customer integration requirements. Our facilities are located near or, in some cases, within our customers’ refineries and our products are often supplied directly to our customers by pipeline. In addition product can be shipped by barge, rail and truck. As a result, we believe that our integrated and strategically located network of facilities and logistics assets in the United States provides us with a significant competitive advantage and would be costly for our competitors to replicate.
We believe that we benefit from industry economics that favor incumbent producers because the capital cost to expand existing capacity is typically significantly less than the capital cost necessary to build a new plant and new plants can involve more challenges in obtaining the necessary local, regional and state permits. In addition, existing supply chains, including captive pipeline connections and other transportation logistics add to the competitive advantages available to incumbent producers. As a result, we believe that our integrated and strategically located network of facilities and end-to-end logistics assets in the United States provide us with a significant competitive advantage and would be costly for our competitors to replicate. In
2017
we estimate that our refining services product group had a regenerated sulfuric acid supply share in excess of
52%
in the United States, which we believe is substantially larger than our closest competitor.
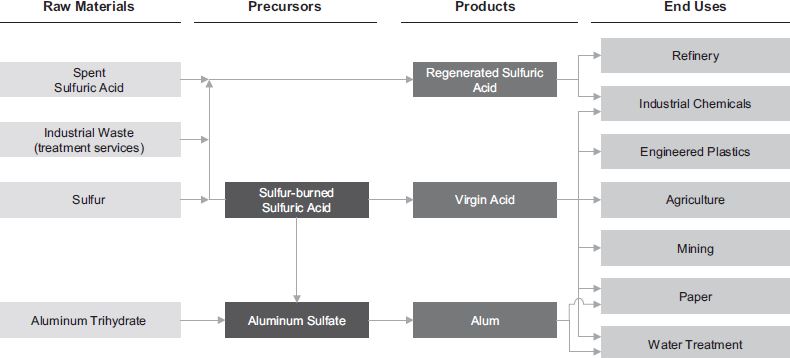
Sulfuric acid is created either through the burning of sulfur in furnaces, or as a by-product of other industrial processes, primarily the smelting of copper and other base metals. We produce a range of virgin sulfuric acid products by burning sulfur in our plants for supply to a diverse set of end uses. Sulfur-burned acid is generally considered to be of higher purity and quality than smelter-produced acid and, as a result, smelter-produced acid is not suitable for some industrial users including several of our larger customers who require higher quality and differentiated sulfuric acid products, such as super-saturated sulfuric acid (oleum) and other high purity specialty acids. Virgin sulfuric acid and regenerated sulfuric acid are manufactured in our regeneration plants using the same production equipment and, in addition, we have one facility in Houston, Texas that produces only virgin sulfuric acid from sulfur.
Sales and Marketing
Our sales and marketing strategy for our Environmental Catalysts and Services business is based on a collaborative approach to working with our customers. We have a proven track record of working closely with customers to develop and manufacture highly technical and customized products for specific uses, which generally requires significant technical support and collaboration. In our catalyst product groups, the sales force and technical experts from our research and development facilities assist with the design and development of new products for a client’s specific needs. This type of close working relationship often requires a non-disclosure agreement and joint development agreement and, in some cases, has enabled us to obtain exclusive supply arrangements for the developed product.
Our refining services product group relies on an experienced direct sales force to market our products and services. Our sales force and product stewardship staff remain engaged with our customers from the initial negotiation and implementation of a supply arrangement through the term of such supply arrangement and, in many cases, our sales force and product stewardship staff provide technical assistance to customers for the safe handling and storage of our products. We also rely on established chemical distributors to market and sell our virgin sulfuric acid and aluminum sulfate.
7
Our refining services product group is an end-to-end business model, taking spent acid from the back end of our customer’s production processes and returning cleaned, regenerated sulfuric acid via barge, trucks, rail, and pipeline for reuse by our customers. Spent acid for our refining services is generally supplied to us as part of a long-term supply contract. Pipelines are typically owned by our customers, while rail, road and some barge assets are typically third-party leased, and we own most of our barges. Managing the logistics involved in this end-to-end business model is a critical part of our refining services.
Most of our refining services contracts feature take-or-pay volume protection or quarterly price adjustments for commodity inputs, labor, the Chemical Engineering Plant Cost Index or natural gas. In
2017
, approximately
87%
of our refining services product group sales were sold under contracts that included some form of raw material pass-through clause. These price adjustments generally reflect our refining services actual cost structure in producing sulfuric acid, and tend to provide us with some protection against volatility in labor, fixed costs and raw material pricing. Freight expenses are generally passed through directly to customers. Excluding contracts with automatic evergreen provisions, approximately
70%
of our sulfuric acid volume for the year ended
December 31, 2017
was under contracts expiring at the end of
2019
or beyond.
Competition
Our silica catalysts and zeolite catalysts products groups are leading global catalyst platforms that primarily produce catalysts and services for customers in the petrochemicals and refining industries. In these areas we primarily compete with other global producers such as W.R. Grace, BASF, UOP, and Albemarle, as well as other niche competitors such as Tosoh, Axens, and Haldor Topsoe, and we typically compete on the basis of performance, product consistency, reliability, and responsiveness to changes in customer demand.
Refining services is a regional business due to shipping costs and customer integration requirements, and therefore our network of facilities is concentrated in the major areas of growth in sulfuric acid demand in the United States. These plants are located close to our major refining services customers and are typically integrated through well-established supply chain networks, including in some cases captive pipelines connecting us to our refining services customers. We compete in the North American refining services industry with competitors such as Chemtrade and Veolia and we compete on the basis of price, reliability, and responsiveness to changes in customer demand, which is a function of scale, proximity to customer locations and operational expertise. We estimate that we had a
45%
supply share in each of the West Coast and Gulf Coast regions based on
2017
sales volume, which we believe was greater than three times the supply share of our largest competitor.
Manufacturing
We manufacture our zeolyst-based catalyst products using sodium silicates liquids from our performance chemicals product group to make specialty zeolite products, which are either used directly to produce catalysts or are sold as a precursor to other catalyst manufacturers.
8
Catalyst Manufacturing Platform
We produce regenerated sulfuric acid and virgin sulfuric acid through our furnace operations. Regenerated sulfuric acid is produced by breaking down the spent acid in our furnace into the usable components of sulfuric acid and water. Virgin sulfuric acid is produced by burning sulfur and certain sulfur-rich components at high temperatures within a furnace. The chart below summarizes the manufacturing platform for our refining services product group.
Refining Services Manufacturing Platform
9
Performance Materials & Chemicals
Our Performance Materials and Chemicals business is a silicates and specialty materials producer with leading supply positions for the majority of our products sold in North America, Europe, South America, Australia and Asia (excluding China) serving diverse and growing end uses such as personal and industrial cleaning products, fuel efficient tires (“green tires”), surface coatings, and food and beverage. Our products are essential additives, ingredients, and precursors that are critical to the performance characteristics of our customers’ products, yet typically represent only a small portion of our customers’ overall end-product costs.
We believe that our global footprint enables us to compete more effectively on a global basis due to the costs associated with shipping these products over extended distances. We believe that our network of strategically located manufacturing facilities allows us to serve our customers at a lower cost than our competitors and with quicker delivery times for our products. Our performance materials are also used in some cases as a substitute for less environmentally friendly materials. For example, specialty silicates are displacing phosphates in dish detergents, precipitated silicas are displacing carbon black in tires, and hollow and solid microspheres are displacing plastic volumes in transportation lightweighting applications.
Our Performance Materials and Chemicals business consists of two product groups: performance chemicals and performance materials.
Performance Chemicals.
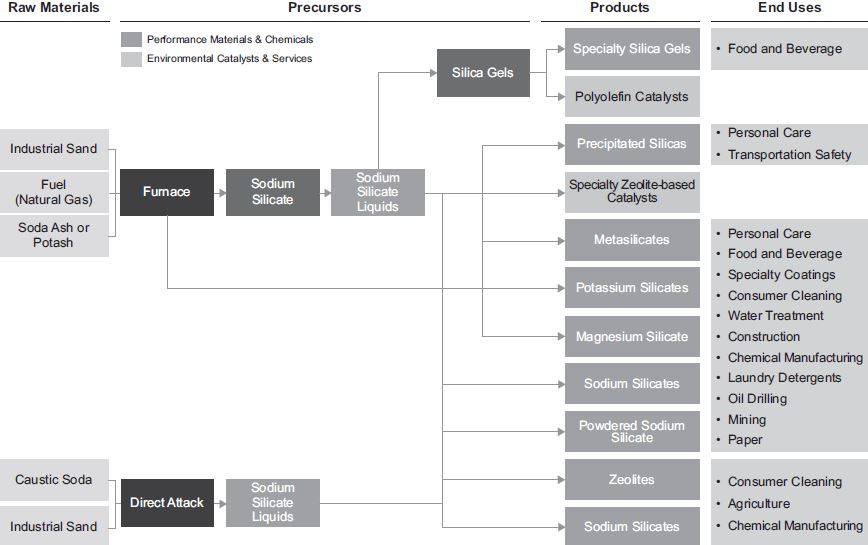
Our performance chemicals product group includes silicate products and derivatives, which are used in a variety of applications such as adsorbents for surface coatings, clarifying agents for edible oils and beverages, precursors for green tires, and additives for cleaning and personal care products. Silicates are a family of products manufactured primarily from readily available materials, such as industrial sand and soda ash. These raw materials are typically fused in a furnace and then dissolved in water under pressure to form water-soluble silicates for use in our downstream products, such as precipitated silica and silica gels. We sell our performance chemicals products to customers who use silicates as precursors, such as sodium silicates that are used in the growing precipitated silica end uses, as well as for downstream derivative products, such as silicas used as additives in toothpaste formulation and silica gels that are used as adsorbents in food and beverage manufacturing.
Our performance chemicals product group, which is the backbone across our additives and catalyst platform, is highly regionalized because of the expense of shipping sodium silicates extended distances due to their water content. As a result, our network of regional silicate plants is strategically located to support the customers that we serve. In addition, we maintain a few larger dedicated facilities to service our derivative products. Our performance chemicals product technology requires significant know-how and scale in order to be able to operate in a cost effective manner. We believe that we are the only global silicates producer who can supply all of the major regions and we estimate that we have three times the sodium silicates supply share as our nearest competitor based on
2017
sales volume. Key end uses for our performance chemicals products include catalyst precursors, food and beverage, personal care, cleaning products, coatings, tires, soil stabilization and paper de-inking.
Silicates.
Silicates and their family of derivatives, such as silicas, have functional attributes that are used as additives and ingredients to enhance product performance as binders, fillers, flow control agents, and carriers in our customers’ products. Our silicates are used in a diverse range of applications. In detergents and cleaning products, silicates provide corrosion inhibition, alkalinity, emulsification, and deflocculation. In construction materials such as roofing granules, cement, ceramics, adhesives, and coatings, our products are used as a binding agent. In addition, our products are ingredients in the consumer products, which includes personal care and consumer cleaning products, where customers are seeking more environmentally friendly products without loss of effectiveness or performance. We believe that our products have the environmental and safety profile to address these evolving customer demands. Silicates and silicate derivatives are recognized on the Safer Chemicals Ingredients List of the EPA’s Safer Choice program, which we believe positively impacts our ability to compete in consumer product applications.
Silica Derivatives.
Silica derivatives include specialty silicas, zeolite products, spray dry silicates, magnesium silicate, and other specialty chemicals. Silica derivatives are used in personal care products as a binder in pharmaceutical products, and as a source of alkaline in cleaning products, such as industrial cleaners. In addition, our silica derivatives are used in natural resources applications such as in drilling fluids as a lubricant binder. Some of our silicas and zeolites are used by our Environmental Catalysts and Services business to produce catalysts and catalyst precursors. We believe that this internal source of supply is a competitive advantage both for our performance chemicals product group, which can take advantage of opportunities to maximize the use of our sodium silicates production capacity and for our silica catalysts and zeolite catalysts product groups, which are able to access a consistent quality source of precursors.
Silica Gels.
Silica gels are used as drying agents or adsorbents and desiccants for food and industrial products. For example, silica gels are used in the brewing industry to remove certain compounds that cause chilled beer to look cloudy, and are used as clarification agents for wines and fruit juices, and as an adsorbent of free fatty acid and other contaminants in the refining of cooking oils. In personal care, silica gels are used as carriers for vitamins and pharmaceuticals, and as a flow conditioner and an oil absorption agent in face powders. In industrial and engineered plastics, silica gels are used for gloss control in coil, wood, general industrial, leather and other high-performance surface coatings applications. In addition, highly-porous specialty silica gels are used in ink-receptive coatings for inkjet media. Some recently developed silica-based products are designed for ultraviolet-cured coatings and other low solvent formulations that offer more environmentally friendly characteristics. Silica gels are also used to create coatings that have significant capacity to absorb ink in order to allow for quick setting of colorants and faster ink dry times, which can improve color density and reduce ink bleed.
10
Precipitated Silicas.
Precipitated silicas represent the largest volume of specialty silicate products based on
2017
sales volume, but are also concentrated among a limited number of suppliers. Precipitated silica applications include filler in rubber for green tire applications and gel dentifrice formulations used in toothpaste as an abrasive or thickener. Precipitated silicas are an alternative to calcium phosphates because of their compatibility with different fluorides and their softness. In addition, precipitated silicas are used as functional filler in polyethylene membranes for lead-acid batteries, which are used in most automobiles. In agricultural end uses, precipitated silicas are used as carriers for liquid ingredients in dry animal feeds and as a flow aid and dispersant in insecticide formulations for crop care. We continue to collaborate with our customers to innovate in this industry. For example, we recently worked with certain customers to deliver new products for whitening and desensitizing toothpaste applications that offer improved cleaning performance with low abrasion.
Zeolites
. We produce zeolites by combining sodium silicate with aluminum trihydrate and other materials. These products are used as adsorbents and detergents. We also use these products to serve newer applications such as stabilizers in the production of polyvinylchloride, a titanium dioxide replacement for paints and coatings, and coatings applications for food grade paper.
Other Specialty Silicates.
Other specialty silicates that we produce are used for a variety of industrial, personal care, and cleaning products. End uses include refractory, cleaning products, oil processing, hair bleach, fire retardants, water treatment, and adhesives. Our specialty silicate products are also used in drilling fluids for oil and gas wells to maintain drill hole integrity.
Performance Materials
.
Our performance materials product group includes specialty glass products, such as highly engineered microspheres made from either recycled glass or fresh batch material using our proprietary furnace operations. We believe that we are an industry leader in North America, Europe, South America, and Asia (excluding China) in microspheres. These products are used in the reflective markings used on roads and runways to enhance visibility at night and in poor weather to improve safety. Our microspheres, which can be solid or hollow, are also used as additives in plastics for lightweighting and in abrasive media, where they are used to clean, peen and debur metal surfaces, such as for turbine blades used in aerospace and power generation industries.
In the highway safety applications, our microspheres are used with a variety of binders, such as water- and solvent-borne paint, epoxy coatings, and thermoplastics. Our microspheres are mixed in with, or dropped into, these binders as pavement markings are being applied. These microspheres remain partly exposed after the markings dry and provide retroreflectivity that increases the visibility of the road markings at night and during inclement weather. We sell these microspheres primarily to federal and state government agencies, municipalities, highway contractors, binder manufacturers and airport agencies. Demand for our performance materials products has grown as a result of increased spending for maintenance and upgrading of existing roads and the construction of new roads around the world. Demand for our highway safety products is principally driven by replacement demand and new road construction and, as such, demand for these products has grown through economic cycles without exhibiting as pronounced cyclicality as other end uses. Highway safety budgets in the United States are typically funded by taxes on gasoline and are not typically tied to economic cycles or to the state and local government budgeting process. The United States federal government has taken an active role in implementing regulations and initiating infrastructure development in an effort to improve highway safety. In addition, the continuing need to maintain and upgrade an aging United States highway infrastructure, has translated into relatively consistent government expenditure in this area. The most recent innovation from our performance materials product group is our ThermoDrop® product, which simplifies the road striping operations for our customers by using a new durable thermal plastic road marking material. We have also introduced a new faster-drying road marking system, Visilok®, which can reduce traffic disruption during striping operations and improve road worker safety by reducing the amount of time needed to complete the road marking process.
We also sell highly specialized solid and hollow microspheres and metal coated particles for a variety of uses such as plastic additives, conductive applications, metal finishing, and other industrial and consumer applications. For metal finishing, our performance materials are propelled from blasting equipment to clean, peen, debur, and finish metal in industrial and process chemical end uses. Our performance material products offer the ability to design lighter parts while maintaining strength and reliability. Our performance materials are often a preferred substitute for other media such as industrial sand, aluminum oxide, iron and steel because they do not damage parts and they allow for better process control, limit surface contamination, and can be more environmentally friendly.
Other applications for our microspheres include additives into paints and coatings for thermal insulation, to reduce weight and ingredients in cosmetics to improve feel attributes and improve flow functionality. Our microspheres are also used in drilling fluids to provide lubrication and strength. Within the natural resources industry, our performance materials are used in oil-drilling muds to improve lubricity and reduce friction in horizontal drilling. In addition, our hollow microspheres are used as sensitizers for water-based industrial explosives in mining, quarrying, and construction. Sensitizers are also used in explosives to increase the energy of a detonation.
We continue to explore opportunities to expand our product offerings and geographic reach. For example, on June 12, 2017, we acquired the facilities of Sovitec Mondial S.A. (“Sovitec”), a high quality producer of engineered products used in transportation safety, metal finishing and polymer additives.
We believe that our industry leadership position, scale, and industry presence provides us with a competitive advantage over competitors who compete only in particular end uses. We believe that it would be costly and difficult for a new entrant or existing competitor to replicate our breadth or economies of scale in the production of microspheres.
11
Sales and Marketing
Our performance chemicals product group relies on a direct sales force to market our broad array of products. For most customers, our direct sales force calls on the customer, supported by our experienced technical staff. Our global sales force and technical staff employ a proactive and collaborative approach to the sales process. In many cases, particularly in our specialty products, our sales force assists our research and development team with the design and development of new products to meet a customer’s specific needs. Our performance materials product group uses a technically-trained internal sales force to market our product offerings in the different geographies that we serve. We sell highway safety products directly to road striping contractors, binder manufacturers and original equipment manufacturers through regional sales managers in North America, Europe and Asia. We also sell these products directly to states and municipalities through a bidding process that is handled by our corporate staff. Our performance materials products outside of highway safety are sold through a direct sales force and a network of distributors. In addition to our direct sales force, we use chemical distributors to market and sell a smaller portion of our performance materials and chemicals products to smaller customers.
For the year ended
December 31, 2017
, approximately
42%
of our North American silicate sales, which represented a significant portion of our performance chemicals product group sales, were derived from contracts that included raw material pass-through clauses. Under these contracts, there is usually a time lag of between three and nine months for price changes to pass-through, depending on the magnitude of the change, industry dynamics and the terms of the particular contract.
Competition
In our Performance Materials and Chemicals business, we primarily compete with other global producers such as OxyChem, PPG and Evonik. We believe that we are the only global silicates producer with operations in North America, Europe, and Australia, and we believe that we have technical and cost advantages in all of these regions as compared to our competitors as a result of the scale and breadth of our product offerings and operations. We compete primarily on a regional basis due to the costs associated with shipping sodium silicates, and we estimate that we had approximately three times the sodium silicate supply share of our nearest competitor based on
2017
sales volume. Our network of regional silicate plants is strategically located to support the industries that we serve. In addition, we maintain a few larger dedicated facilities to service our derivative products. We believe that our network of strategically located manufacturing facilities allows us to serve our customers at a lower cost than our competitors and with quicker delivery times for our products. In the industry served by our Performance Materials and Chemicals business, we compete primarily on the basis of performance, product consistency, quality, reliability, and ability to innovate in response to customer demands. Our competitors are primarily regional suppliers.
12
Manufacturing
Performance chemicals are produced through an integrated supply chain beginning with regional and large scale upstream production of sodium silicates and downstream derivatives. Sodium silicates are produced regionally because of the expense of shipping sodium silicates extended distances due to their water content. Our sodium silicates are produced by fusing industrial sand and soda ash in our proprietary furnace operations. We dissolve the molten silicate from the furnace into water and sell these products in liquid form. Downstream derivatives are produced through a variety of chemical operations that create aqueous, solid, and gel forms for our products.
Performance Chemicals Manufacturing Platform
13
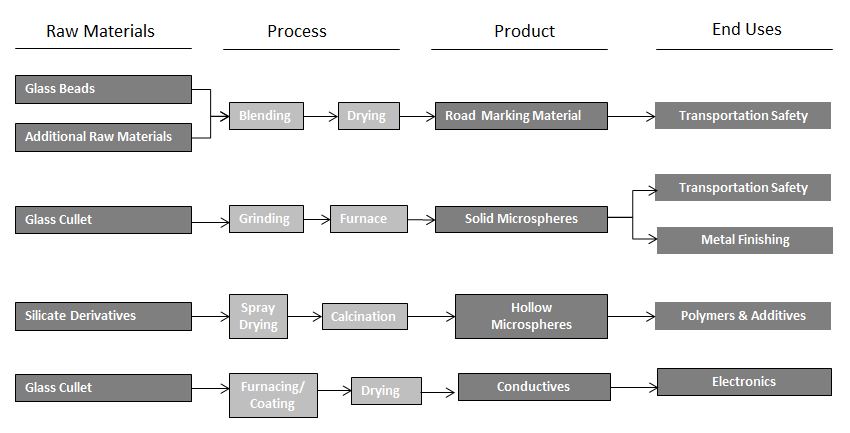
We produce our highway safety products and other microspheres by crushing raw materials, such as recycled glass or cullet, and then feeding these raw materials into a furnace. The product is coated or treated in other ways to meet particular customer and end use specifications. The beads are then bagged and stocked for shipment. The flowchart below outlines our performance materials’ production process.
Performance Materials Manufacturing Platform
Financial Information about Geographic Areas
For certain geographic information about our business, please see
Note 12
to the audited consolidated financial statements of PQ Group Holdings Inc. and subsidiaries included elsewhere in this Form 10-K.
Raw Materials
We are able to negotiate our supply agreements for our key raw materials based on our leading industry position and global scale in an effort to achieve competitive pricing. We also maintain a raw material quality audit and qualification program designed to ensure that the material we purchase satisfies stringent quality requirements. The key raw materials for our silica catalysts and zeolite catalysts product groups are sodium silicates, acids, bases and certain metals. The key raw materials used in our refining services product group include spent sulfuric acid and sulfur, both of which have generally been widely available in the geographies in which we operate. The key raw materials used in our performance chemicals product group include soda ash, industrial sand, aluminum trihydrate and sodium hydroxide. The key raw materials used in our performance materials product group include cullet, which is glass sourced from glass recyclers around the world. Cullet has generally been available in sufficient supply from local recyclers in the regions in which we operate.
While natural gas is not a direct feedstock for any individual product, we use natural gas powered furnaces to heat raw materials and create the chemical reactions necessary to manufacture our products. We maintain multiple suppliers wherever possible and we seek to hedge our exposure to fluctuations in prices for natural gas through hedging activity in the United States, forward purchases of natural gas in the United States, Canada, and Europe, and the use of pass-through clauses for raw material and natural gas costs in our customer contracts. However, we may not be successful in passing through all increases in raw material costs or maintaining an uninterrupted supply of natural gas for all of our furnaces. See “Risk Factors-Risks Related to Our Business - If we are unable to pass on increases in raw material prices, including natural gas, to our customers or to retain or replace our key suppliers, our results of operations and cash flows may be negatively affected”.
14
Research and Development
We benefit from the highly-skilled technical capabilities of our employees dedicated to new product development. We operate six research and development facilities in the United States, Canada, the United Kingdom, the Netherlands and France. Our research and development activities are directed toward the development of new and improved products, processes, systems and applications for customers. Our research and development team is organized to support each of our operating businesses and staffed with experienced scientists, technical service representatives and process engineers with direct knowledge of our products. This business group and customer-oriented team structure provides strong links between our product development and manufacturing functions and our customer collaboration and specifications. These connections enable us to focus our development on timely and relevant products for our customers while remaining attentive to manufacturing considerations to enable us to produce new products profitably and in a timely manner. Product development activities are organized into research and development projects that are subject to regular reviews by the business teams in order to understand and address our customers’ evolving needs and invest in our growth by prioritizing innovation driven by these identified needs. In addition, we are improving the way our research and development team shares information by removing silos and holding regular senior-level project reviews to ensure best practices are shared and consistent metrics are used to determine a project’s merit and the size of the potential opportunity. Company-sponsored research and development expenses were approximately
$13.9 million
for the year ended
December 31, 2017
and
$7.3 million
for the year ended
December 31, 2016
. Legacy Eco did not incur significant research and development costs during the year ended
December 31, 2015
. Legacy PQ company-sponsored research and development expenses totaled
$10.8 million
and
$10.3 million
for the years ended
December 31, 2016
and
2015
, respectively. Such totals do not include the research and development expenses incurred by our Zeolyst Joint Venture, which totaled
$16.0 million
,
$16.0 million
and
$14.0 million
for the years ended
December 31, 2017
,
2016
and
2015
, respectively.
Our Competitive Strengths
We believe that we maintain a leading supply position in each of our major product groups, holding what we estimate to be the number one or two supply share position in
2017
for products that generated more than 90% of our sales. We believe that our global footprint and efficient network of strategically located manufacturing facilities provides us with a strong competitive advantage in serving our customers both globally and regionally, and that it would be costly for our competitors to replicate our network.
In our Environmental Catalysts and Services business, we primarily compete on a global basis, with the exception of our refining services product group, where we compete on a more regional basis due to the costs associated with shipping these products over extended distances. We are a leading supplier of refinery hydrocracking catalysts and emission control catalysts that are used in the heavy- and light-duty diesel industries to reduce nitrogen oxides emissions. We are also a global leader in specialty catalysts, such as catalysts for methyl methacrylate and for lube oil and diesel fuel dewaxing. In these applications, we primarily compete with other global producers such as W.R. Grace, BASF, UOP, and Albemarle, as well as other niche competitors such as Tosoh, Axens, and Haldor Topsoe.
In our refining services product group, we compete in a number of regions where our facilities are required to be close to our refinery customers, and in some cases located within the refinery with a direct pipeline to deliver our product. We estimate that our refining services product group holds the number one supply share position in the United States in sulfuric acid regeneration based on
2017
sales volume with an estimated
52%
supply share. We also estimate that we had a
45%
supply share in each of the West Coast and Gulf Coast areas based on
2017
sales volume, which we believe was greater than three times the supply share of our largest competitor.
In our performance chemicals product group, where we also compete primarily on a regional basis due to the costs associated with shipping sodium silicates, we estimate that we had approximately three times the sodium silicates supply share of our nearest competitor based on
2017
sales volume. We believe that we are the only global silicates producer with operations in North America, Europe, and Australia. We believe that we have technical, cost, and proximity advantages in all of these regions as compared to our competitors as a result of the scale and breadth of our product offerings and operations.
These leadership positions serve industries that are attractive due to the need for customized and innovative products, stability of demand, and growth potential driven by the regulatory environment and consumer preferences. Our products generally require close customer collaboration to address end use challenges that are constantly evolving. We produce value-added products that are critical to the performance characteristics of our customers’ products. In addition, in
2017
, a majority of our sales were to end uses such as fuels and emission controls, consumer products, and highway safety and construction that generally do not exhibit as pronounced cyclicality as other applications. Further, many of these end uses are growing due to increased global regulations, such as regulations regarding sulfur content in transportation fuel and particulate matter and nitrogen oxides emissions from on-road and non-road diesel engines. Increasingly stringent automotive fuel efficiency standards are also expected to lead to an increase in the demand for higher-octane gasoline. While we believe increasing regulatory standards provide attractive growth opportunities, we may be required to develop new products in response to such regulations in order to fully capture such opportunities. In addition, our products are ingredients in consumer products, which includes personal care and consumer cleaning products, where customers are seeking more environmentally friendly products without loss of effectiveness or performance. We believe that our products have the environmental and safety profile to address these evolving customer demands.
15
Experienced Management Team
Our senior management team has substantial industry experience and a proven track record. They average over 30 years of experience in our product groups, and their cumulative industry experience extends to a broad range of execution capabilities, including acquisition integration, strategic management, operations, sales and marketing, and new product and application development. In 2016, our management team integrated legacy Eco into our Environmental Catalysts and Services business while also growing the business and successfully implementing cost initiatives. Our senior management team has also reorganized our company from a products-based business to a markets-based business to better align our offerings with the needs of our customers. There is a renewed focus on serving our customers by developing solutions through technical sales, services, and product development, and we have added additional management personnel experienced in innovation and market driven organizations. Our management currently owns approximately
5%
of our outstanding common stock, which we believe creates an alignment of interest with our shareholders.
Long-Term, High-Quality Customer Relationships and Innovation Track Record
Many of our products require close customer collaboration to address application challenges that are constantly evolving. As a result, we work with our customers over many years in order to develop products to meet customized specifications and performance characteristics while also maintaining strict quality standards. While we are unable to predict future shifts in customer demand, the long lead-time required for product development and commercialization, which can be up to ten years in our Environmental Catalysts and Services business, provides the opportunity for us to build long-term relationships with customers.
We collaborate with leading multinational companies that often seek global solutions. Our customers include large industrial companies such as BASF, Honeywell, and 3M, and global catalyst producers such as Albemarle and W.R. Grace. We also supply catalysts to leading chemical and petrochemical producers such as BASF, Dow Chemical, Lucite, LyondellBasell, and Shell. We supply personal care ingredients and additives to leading consumer products companies such as Unilever and Colgate-Palmolive. We have long-term relationships with our top ten customers, based on
2017
sales, that average more than 50 years. In addition, our customer base is diversified, with our top ten customers in
2017
representing approximately
22%
of our sales for the year ended
December 31, 2017
and no customer representing more than
5%
of our sales during this period. However, the percentage of our sales generated by our top customers may increase in the future as a result of changes in industry dynamics, shifts in customer demands and contracts or other factors.
These long-term relationships have allowed us to innovate together with our customers to meet evolving demands. For example, we have developed zeolite-based catalysts that are an effective and efficient method to reduce pollutants from heavy- and light-duty diesel engines and enable our customers to meet increasingly stringent vehicle emission standards worldwide. In personal care applications, we have collaborated with leading consumer products companies over a number of years to develop a family of gentle silica-based dentifrice abrasives that produce more effective cleaning toothpastes. In addition, our proprietary silica catalyst has enabled development of a high strength HDPE resin that is used for making lightweight plastic gasoline tanks for automobiles. While we believe we are well positioned to capitalize on future innovation opportunities, the constantly evolving needs of our customers make it difficult to predict the pace or scope of future innovation opportunities.
16
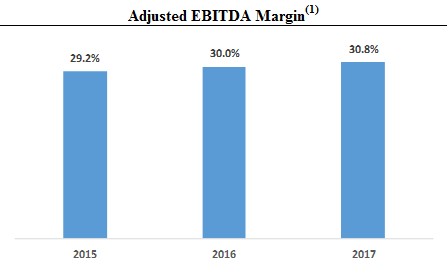
Stable Margins and Cash Flow
We have demonstrated the ability to maintain stable margins while continuing to grow our business in different macroeconomic environments. Our Adjusted EBITDA margins have averaged approximately
30%
between 2015 and 2017. We believe that the stability of our margins and cash flows during this period is because our value-added products, which are critical to the performance of our customers’ products, typically represent only a small portion of our customers’ overall end-product costs.
|
(1)
|
Pro forma Adjusted EBITDA margin is presented for
2015
and
2016
and Adjusted EBITDA margin is presented for 2017. The calculation of Adjusted EBITDA margin excludes total net sales attributable to our Zeolyst Joint Venture. Refer to “Management’s Discussion and Analysis of Financial Condition and Results of Operations - Pro Forma Results of Operations” for detail on the pro forma presentation of Adjusted EBITDA margin for the years ended
December 31, 2016
and
2015
, and to “Management’s Discussion and Analysis of Financial Condition and Results of Operations - Basis of Presentation” for a description of the treatment of our Zeolyst Joint Venture in our consolidated financial information.
|
Our products are predominantly inorganic and carbon-free, and are produced from readily available raw materials such as industrial sand and soda ash, which prices have historically been less volatile than oil. We also use natural gas in our furnaces where our North American facilities have benefited from the plentiful supplies of shale gas. In addition, we have long-term supply contracts with many of our key raw materials suppliers across our product groups. We have also been able to mitigate the impact of raw material or energy price volatility using a variety of mechanisms, including hedging and raw material cost pass-through clauses in our sales contracts and other adjustment provisions. For the year ended
December 31, 2017
, approximately
42%
of our North American silicate sales, which is a significant portion of our performance chemicals product group sales, and approximately
87%
of our refining services product group sales were sold under contracts that included raw material pass-through clauses.
Our cash flow generation is driven, in part, by our disciplined capital investment and tax attributes that may provide cash flow benefits in the future. We have invested in our infrastructure and growth over the last three years and we expect to realize returns on these investments in the future with limited additional investment requirements, although there is no assurance that we will be able to realize any returns on these investments or that significant additional investments will not be required. As of
December 31, 2017
, we had
$426.9 million
of net operating losses for U.S. federal income tax purposes, along with related net operating losses for state tax purposes, and
$483.8 million
of identified intangibles and goodwill, both of which may provide us with additional cash tax savings in future years in which we generate taxable income.
17
Strong Growth Potential Across the Portfolio
We focus on serving end use applications where we believe significant future growth potential exists. Our products address our customers’ needs, which are typically driven either by regulatory regimes or consumer preferences, on a global basis. In addition, our product sales and development efforts are driven by regional infrastructure and development trends. In vehicles, we address regulated heavy- and light-duty diesel emission standards and sulfur content and vapor pressure requirements in gasoline, with a majority of the
2017
total net sales of emission control catalysts products in our zeolite catalysts product group addressing heavy-duty diesel engines. We expect that these regulations will create growth opportunities in excess of gross domestic product growth rates due to the constantly evolving standards that our customers need to address with new and improved products.
Light- and heavy-duty diesel engines are subject to a broad set of regulatory requirements, and we expect that these increasingly stringent standards will offer opportunities for our Zeolyst Joint Venture to develop products to assist our customers in meeting these standards. Countries typically adopt a set of standards that limit the amount of nitrogen oxides, carbon dioxide, and other emissions allowed for diesel engines. In many cases countries have established regulations that generally follow United States Environmental Protection Agency or European Union standards, but typically on a later implementation timeline. In addition, even more restrictive regulations are expected to be adopted in the future in many jurisdictions, such as EU VII, which would further reduce permitted emissions levels in the European Union. We believe that compliance with existing regulations as well as any future regulations provides us with opportunities to grow our sales of emission control catalysts.
The following chart identifies the regulatory requirements for certain countries and regions in relation to the most comparable European Union standard for ease of comparability.
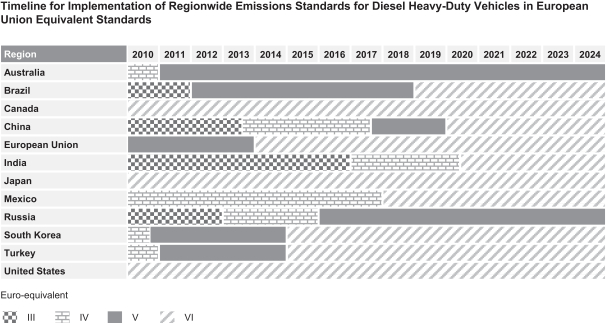
Source: The International Council on Clean Transportation
Given the fuel efficiency standards that are driving the design of new engines and the resulting higher-octane gasoline requirements that can be achieved through alkylate blending, we believe that our refining services product group is well positioned to benefit from any related growth in demand for alkylates.
We produce catalysts for HDPE and methyl methacrylate production in the packaging and engineered plastics applications. According to an industry source, North American HDPE capacity is expected to grow at a compound annual growth rate of approximately 5.1% between 2016 and 2020, driven by North America’s global cost position in petrochemicals and increased use of these plastics as a substitute for heavier and less versatile materials such as glass and metal. Methyl methacrylate is the monomer for acrylic engineering resins, a clear scratch-resistant plastic used in sheet form to replace glass and as a surface coating. We believe that we have an opportunity to grow our methyl methacrylate catalysts sales in the future as methyl methacrylate production increases as a result of, in part, increased production efficiencies enabled by our catalysts.
18
We believe that additional demand for retroreflectivity (or visibility) for roadway and aviation markings could provide us with significant growth opportunities. We benefit from increased use and density per mile of road markings that include our products. The most recent innovation from our performance materials product group is our ThermoDrop® product, which simplifies the road striping operations for our customers by using a new durable thermal plastic road marking material. We have also introduced a new faster-drying road marking system, Visilok®, which can reduce traffic disruption during striping operations and improve road worker safety by reducing the amount of time needed to complete the road marking process.
We also expect to benefit from trends towards the use of more environmentally friendly products where we believe we have opportunities to displace other less environmentally friendly materials. While there is no assurance that such trends will continue in the future, we believe our product offerings position us to capitalize on this growth opportunity. For example, our Ambosol magnesium silicate is used to eliminate color and odors in polyols, which are used in the production of polyurethane for, among other things, household products such as scratch-resistant coatings and foam insulation. In addition, our specialty silicates are displacing phosphates in dish detergents, precipitated silicas are displacing carbon black in tires, and solid and hollow microspheres are displacing plastic volumes in lightweighting applications. Most of our products are manufactured from commonly found materials such as industrial sand and soda ash, which are more environmentally friendly than carbon-based products. We have also developed a family of gentle silica-based dentifrice abrasives that produce more effective cleaning toothpastes and we have developed a product family, Britesil silicates, which improves convenience while eliminating phosphates in automatic dishwashing applications.
Our Business Strategy
Our business strategy is to capitalize on our strong foundation, market-based approach, and management team to grow sales profitably, deploy capital efficiently, and generate free cash flow in order to create shareholder value. We believe that our history of operational excellence, technology leadership, and strong business execution developed from our almost two centuries of combined industry experience at legacy PQ and legacy Eco positions us well to execute on our business strategy. In the last two years, we have added senior executives to our management team, including our chief executive officer, Jim Gentilcore, and chief financial officer, Mike Crews, who bring significant public company leadership experience and a track record of customer-focused innovation and disciplined capital allocation to our business. We believe that Mr. Gentilcore’s experience in the electronics industry is particularly relevant to our innovation efforts as we pursue new product innovation across our product groups. In addition, we believe that our recent reorganization better aligns our management structure with our customer needs to enable us to make more focused sales and product innovation investments. We believe there are significant opportunities to profitably grow our business, generate free cash flow and deliver shareholder value by executing on the following strategies:
Shift from a Products-based to a Markets-based Company
Our reorganization from a products-based to a markets-based company is fundamental to our growth strategy. Following the consummation of the Business Combination in May 2016, we have further realigned our product groups around critical markets that we serve. The combination of the legacy Eco and legacy PQ businesses expanded our presence in the refinery industry and provided us with valuable insight into key success factors for serving our refining and petrochemical customers. We have undertaken a similar approach in other important end uses that we serve such as personal care, highway safety, oil and gas, surface coatings, and electronics.
Our solution-oriented process starts with our customer’s specific needs, which are then identified as a product or service opportunity that is defined, sized, and evaluated to determine if it is within the core strength of our global development team. If not within our core capabilities, but determined to be a strategically important opportunity, we initiate a search for outside technology, partnerships, or acquisition targets that can deliver a cost-effective and profitable solution. This approach is in contrast to our prior approach developing products or new formulations first and then seeking to identify applications into which to sell that product or new formulation. We believe that our markets-based approach will result in product innovation that better meets our customers’ needs and supports our profitable growth.
Our sales and marketing organization has a broad base of customer and marketing experience. Since our business reorganization, we believe each of our operating segments has simplified its customer contact points and increased knowledge about the industries we serve. We have been able to eliminate duplicate sales calls that would occur among our previous business divisions and can prioritize our efforts around our most influential customer contacts. We have also removed the silos that previously impeded our ability to share important customer information within our organization. This integrated marketing effort allows for more rapid analysis and decision-making for our major strategic customers who are often served by multiple product groups. We believe these operational improvements will enable us to reduce product commercialization time and increase our return on marketing investment.
19
Prioritize Investment and Development to Innovate and Profitably Grow Sales
We have been able to successfully grow our sales into new applications through our innovation and development of new products to address evolving customer needs. For example, our zeolite catalysts product group developed new products to address new regulatory standards regarding vehicle emissions, and our performance chemicals product group collaborated with our customers to develop precipitated silica products to address their demands for more green tires. We will continue to focus on collaboration with our customers through our technical sales and research and development teams to better understand and address our customers’ evolving needs and invest in our growth by prioritizing innovation driven by these identified needs.
Within our innovation and product development process, our technology teams work closely with our customer facing teams to identify compelling customer needs that can be addressed through innovation or new product development. We seek to assess technology and commercialization hurdles early on in the development process so that we can quickly and efficiently evaluate our opportunity and, where appropriate, deprioritize, or abandon projects before expending significant resources. We are improving the way our research and development team shares information by removing silos and holding regular senior-level project reviews to ensure best practices are shared and consistent metrics are used to determine a project’s merit and the size of the potential opportunity. We have already begun to see the benefits of our new processes with the successful commercialization of ThermoDrop®, which we launched in February 2017. We collaborated with key customers to develop the ThermoDrop® technology, which uses our highway safety microspheres and a proprietary striping application technology to enable our customers to more efficiently stripe highways. This technology has received strong customer acceptance since launch, and we are increasing our production to meet anticipated demand.
We will also selectively consider acquisitions as part of our growth strategy. We believe that our integration of legacy Eco and acquisition of Sovitec demonstrates our ability to successfully execute on acquisitions and realize available synergies and other benefits. We have identified a number of potential acquisition targets with complementary fits across both of our operating segments and, consistent with our markets-based focus, these targets also include downstream-focused businesses. We will seek to use acquisitions to increase our geographic presence, diversify our product offerings, and further secure our leadership positions with our customer base. We intend to focus our acquisition efforts on opportunities in our higher value-added solutions within or adjacent to our current product offerings. We intend to pursue these transactions in a disciplined manner by rigorously evaluating return on capital against our cost of capital in addition to the potential strategic benefits. However, as of
December 31, 2017
, we had cash and cash equivalents of
$66.2 million
and total outstanding indebtedness of approximately
$2,270.3 million
, which may limit our ability to pursue acquisition transactions or other aspects of our growth strategy.
Maintain Strong Margins and Cash Flow with Continuous Improvement Initiatives
Our margins historically have been stable due to our strong and long-standing value proposition to our customers and our strong technological, operational, and product capabilities. We intend to maintain and improve upon these margins by leveraging our operational excellence and continuing our approach to raw material cost pass-through and other appropriate cost sharing arrangements with our customers. We believe that our new organizational structure will allow us to better leverage distribution channels across our products in order to address end uses such as paints and coatings, personal care, and oil and gas, and we have also integrated our continuous improvement teams across our operating segments. For example, we have established a new global furnace operations team, a global engineering team, and a global sales and operations planning team to share best practices across all of our product groups. We have also formalized our sharing of best practices across many functional disciplines, such as supply chain, technology, working capital, and capital expenditure management. From these efforts, we expect to be able to reduce costs in our operations in order to increase our cash flow.
Joint Ventures
We have entered into several long-standing joint ventures to supplement our businesses and access other geographic locations, minimize costs and accelerate growth in areas we believe have significant business potential, including:
Zeolyst Joint Venture
. Our Zeolyst Joint Venture is a long-standing partnership with CRI Zeolites Inc., which is an affiliate of Royal Dutch Shell, that dates back to 1988 and is focused on the development, manufacture and sale of zeolite-containing catalysts through manufacturing facilities located in Kansas and the Netherlands. We have a 50% ownership stake in our Zeolyst Joint Venture.
PQ Holdings Mexicana S.A. de C.V
. PQ Holdings Mexicana was established in 2000 as a joint venture with Solvay Alkalis, Inc. for the manufacture, marketing and sale of various chemicals, including sodium silicate and metasilicate, through manufacturing facilities in Tlalnepantla and Guadalajara, Mexico. We have an 80% ownership stake in PQ Holdings Mexicana.
Potters (Thailand) Limited
. Potters (Thailand) Limited was established in 1988 as a joint venture with Mr. Sompong Dowpiset for the manufacture of high-quality microspheres for industrial and highway safety applications through a manufacturing facility in Bangkok, Thailand. We have an approximate 75% ownership stake in Potters (Thailand) Limited.
Quaker Chemicals South Africa Pty Ltd
. Quaker Chemicals South Africa was established in 1986 as a joint venture with the Quaker Chemical Corporation (“Quaker”) for the distribution and sale of specialty chemicals utilizing Quaker’s trademarks and incorporating Quaker’s formula and technical data through a manufacturing facility in Jacobs, South Africa. We have a 49% ownership stake in Quaker Chemicals South Africa.
20
PQ Silicates Limited
. PQ Silicates was established in 1997 as a Taiwan joint venture with Mr. James Fang for the import and sale of sodium and potassium silicate. We have a 50% ownership stake in PQ Silicates.
Intellectual Property
We evaluate on a case-by-case basis how best to use patents, trademarks, copyrights, trade secrets and other available intellectual property protections in order to protect our products and our critical investments in research and development, manufacturing and marketing. We focus on securing and maintaining patents for certain inventions such as composition-of-matter, while maintaining other inventions such as process improvements as trade secrets, derived from our market-based business model, in an effort to maximize the value of our product portfolio and manufacturing capabilities and reinforce our competitive advantage. Our policy is to seek appropriate intellectual property protection for significant product and process developments in the major areas where the relevant products are manufactured or sold. Patents may cover products, processes, intermediate products and product uses. Patents extend for varying periods in accordance with the date of patent application filing and the legal life of patents in the various countries in which the patents are registered. The protection afforded, which may also vary from country to country, depends upon the type of subject matter covered by the patent and the scope of the claims of the patent.
In most industrial countries, patent protection may be available for new substances and formulations, as well as for unique applications and production processes. However, given the geographical scope of our business and our continued growth strategy, there are regions of the world in which we do business or may do business in the future where intellectual property protection may be limited and difficult to enforce. Moreover, we monitor our competitors’ products and, if circumstances were to dictate that we do so, we would vigorously challenge the actions of others that conflict with our patents, trademarks and other intellectual property rights. We maintain appropriate information security policies and procedures reasonably designed to ensure the safeguarding of confidential information including, where appropriate, data encryption, access controls and employee awareness training.
We own or have rights to a number of patents relating to our products and processes. As of
December 31, 2017
, we owned
46
patented inventions in the United States, with approximately
332
patents issued in countries around the world and approximately
128
patent applications pending worldwide covering more than
25
additional inventions. As of
December 31, 2017
, we also had trademark rights in approximately
605
trademark registrations worldwide, including approximately
75
U.S. trademark registrations. We also have approximately
65
pending trademark applications, which include applications in the United States and worldwide. In addition to our registered and applied-for intellectual property portfolio, we also claim ownership of certain trade secrets and proprietary know-how developed by and used in our business. Including our joint ventures, we are party to certain arrangements whereby we license in the right to use certain intellectual property rights in connection with our business.
Seasonality
Seasonal changes and weather conditions typically affect
our
performance materials and refining services product groups. In particular,
our
performance materials product group generally experiences lower sales and profit in the first and fourth quarters of the year because highway striping projects typically occur during warmer weather months. Additionally,
our
refining services product group typically experiences similar seasonal fluctuations as a result of higher demand for gasoline products in the summer months. As a result,
our
working capital requirements tend to be higher in the first and fourth quarters of the year, which can adversely affect
our
liquidity and cash flows. Because of this seasonality associated with certain of
our
product groups, results for any one quarter are not necessarily indicative of the results that may be achieved for any other quarter or for the full year.
Employees
As of
December 31, 2017
, we had
3,149
employees worldwide, of which
1,437
were employed in the United States,
443
were employed in Canada, Mexico and Brazil,
964
were employed throughout Europe,
36
were employed in South Africa and
99
were employed in Indonesia. Our remaining employees are dispersed throughout Asia and Australia, primarily in Australia, China, Thailand and Japan. As of
December 31, 2017
, approximately
49%
of our employees were represented by a union, works council or other employee representative body. We believe we have good relationships with our employees and their respective works councils, unions or other bargaining representatives. There have been no labor strikes or work stoppages in these locations in recent history.
Environmental Regulations
Obtaining, producing and distributing many of our products involve the use, storage, transportation and disposal of toxic and hazardous materials. We are subject to extensive, evolving and increasingly stringent national and local environmental laws and regulations, which address, among other things, the following:
|
•
|
emissions to the air;
|
|
•
|
discharges to soils and surface and subsurface waters;
|
|
•
|
other releases into the environment;
|
|
•
|
prevention, remediation or abatement of releases of hazardous materials into the indoor or outdoor environment;
|
21
|
•
|
generation, handling, storage, transportation, treatment and disposal of waste materials;
|
|
•
|
maintenance of safe conditions in the workplace;
|
|
•
|
registration and evaluation of chemicals;
|
|
•
|
production, handling, labeling or use of chemicals used or produced by us; and
|
|
•
|
stewardship of products after manufacture.
|
We apply the principles of the Environmental Management standard of the International Organization for Standardization (ISO 14001) at our facilities throughout the world. For chemical facilities in the United States, we also adhere to the Responsible Care RC14001 Technical Specifications of the American Chemistry Council.
We maintain policies and procedures to monitor and control environmental, health and safety risks, and to monitor compliance with applicable state, national, and international environmental, health and safety requirements. We have a strong environmental, health and safety organization. We have a staff of professionals who are responsible for environmental health, safety and product regulatory compliance. We have implemented a corporate audit program for all of our facilities. However, we cannot provide assurance that we will at all times be in full compliance with all applicable environmental laws and regulations. We expect that stringent environmental regulations will continue to be imposed on us and our industry in general. Evolving chemical regulation programs throughout the world could impose testing requirements or restrictions on our chemical raw materials and products. These programs include the 2016 amendments to the U.S. Toxic Substances Control Act, under which the EPA will prioritize and evaluate chemicals for regulation, the E.U. REACH regulations, which have ongoing registration and evaluation requirements with associated testing costs and potential restrictions, the Korea REACH law, which is requiring registration and potentially testing of chemicals, and similar programs being developed in Taiwan, Turkey, India, and elsewhere. Based on our chemicals and the various regulations promulgated to date, we do not anticipate costly testing requirements or severe restrictions, but cannot guarantee that we will not be subject to requirements for our products or raw materials that could materially affect our operations.
Environmental Remediation
. Environmental laws and regulations require mitigation or remediation of the effects of the disposal or release of chemical substances. Under some of these regulations, as the current or former owner or operator of a property, we could be held liable for the costs of removal or remediation of hazardous substances on or under the property, without regard to whether we knew of or caused the contamination, and regardless of whether the practices that resulted in the contamination were permitted at the time they occurred. Many of our current or former production sites have an extended history of industrial use, and it is impossible to predict precisely what effect these laws and regulations will have on us in the future. Soil and groundwater contamination requiring investigation and remediation has been discovered at some of the sites, and might occur or be discovered at other sites. Several active and former facilities currently are undergoing investigation and remediation, including sites in Rahway, NJ; Dominguez, CA; Martinez, CA; and Tacoma, WA.
Environmental Programs
.
We have comprehensive environmental, health and safety compliance, auditing and management programs in place to assist in our compliance with applicable regulatory requirements and with internal policies and procedures, as appropriate. Each facility has developed and implemented specific critical occupational health, safety, environmental, security and loss control programs.
We also have implemented a Health, Safety and Environmental (“HSE”) organizational structure with executive committee level leadership and dedicated environmental experts. We have Regional HSE Specialists and Managers who are embedded in the field and provide HSE expertise and support to operating sites. Certain, larger sites may have dedicated environmental or safety personnel. We have an established Product Safety/Stewardship management system compliant with the RC14001 technical specification along with two Product Stewardship Managers, one of which is a REACH Specialist. We conduct Product Stewardship reviews as part of new product development and routinely evaluate product safety risk for raw materials, intermediates and products.
Chemical Product Regulation
As a chemical company, we are subject to extensive and evolving regulations regarding the manufacture, processing, distribution, import, export, and labeling of our products and their raw materials. In the European Union, the REACH regulations initially went into effect in 2007, with implementation rolling out over time. REACH requires the registration of chemicals, along with a dossier of toxicological and ecotoxicity test results, or a plan to conduct such tests if they are currently unavailable. Registered chemicals then can be subject to further evaluation and potential restrictions. Our high-volume chemicals have been registered under REACH; up to 15 lower-volume chemicals (mainly catalysts) will be registered by the applicable 2018 deadline. To date, no testing has been required. A couple of our chemicals are being reviewed under REACH. Since the promulgation of REACH, other countries (e.g., China, Korea, Taiwan) have enacted and are in the process of implementing similar comprehensive regulation of chemicals. In the United States, legislation has been enacted that would require the EPA to review and require testing of certain chemicals. Based on our chemicals and the various regulations promulgated to date, we do not anticipate costly testing requirements or severe restrictions, but cannot guarantee that we will not be subject to requirements for our products or raw materials that could materially affect our operations. In particular, some of our products might be characterized as nanomaterials and then subjected to evolving, new nanomaterial regulations.
22
Available Information
Our website address is www.pqcorp.com. We make available free of charge through our website our Annual Report on Form 10-K, Quarterly Reports on Form 10-Q, Current Reports on Form 8-K and amendments to those reports filed or furnished pursuant to Section 13(a) or 15(d) of the Securities and Exchange Act of 1934, as amended (“Exchange Act”), as well as reports on Forms 3, 4 and 5 filed pursuant to Section 16 of the Exchange Act, as soon as reasonably practicable after such documents are electronically filed with, or furnished to, the Securities and Exchange Commission (“SEC”). These reports may also be obtained at the SEC’s Public Reference Room at 100 F Street, N.E., Washington, DC 20549 or at the SEC’s website at
http://www.sec.gov
. The information on our website is not, and shall not be deemed to be, a part of this report or incorporated into any other filings we make with the SEC.
Our Corporate Governance Guidelines, Code of Business Conduct and the charters of the Audit Committee, Compensation Committee, Nominating and Corporate Governance Committee and Health, Safety and Environment Committee of our Board of Directors are also available on our website and are available in print to any shareholder upon request by writing to PQ Investor Relations, 300 Lindenwood Drive, Malvern, PA 19355. In accordance with SEC rules, we intend to disclose any amendment (other than any technical, administrative or other non-substantive) to the Code of Business Conduct, or any waiver of any provision thereof with respect to any of our executive officers, on our website within four business days following such amendment or waiver.
23
|
ITEM 1A.
|
RISK FACTORS.
|
In addition to the other information contained in this Annual Report on Form 10-K, you should carefully consider the following risks that we believe are the material risks that we face. The risks described below could have a material adverse impact on our business, financial condition, cash flows and results of operations, and should be read together and in conjunction with the forward-looking statements and “Management’s Discussion and Analysis of Financial Condition and Results of Operations” included in Item 7 of this Annual Report on Form 10-K, and our consolidated financial statements and the accompanying notes thereto.
Risks Related to Our Business
As a global business, we are exposed to local business risks in different countries, which could have a material adverse effect on our financial condition, results of operations and cash flows.
We have significant operations in many countries, including manufacturing sites, research and development facilities, sales personnel and customer support operations. As of
December 31, 2017
, we operated
72
manufacturing facilities across six continents. For the year ended
December 31, 2017
, our foreign subsidiaries accounted for
41%
of our sales. Our operations are affected directly and indirectly by global regulatory, economic and political conditions, including:
|
•
|
new and different legal and regulatory requirements in local jurisdictions;
|
|
•
|
export duties or import quotas;
|
|
•
|
domestic and foreign customs and tariffs or other trade barriers;
|
|
•
|
potential difficulties in staffing and labor disputes;
|
|
•
|
potential difficulties in managing and obtaining support and distribution for local operations;
|
|
•
|
increased costs of, and availability of, raw materials, transportation or shipping;
|
|
•
|
credit risk and financial condition of local customers and distributors;
|
|
•
|
potential difficulties in protecting intellectual property rights;
|
|
•
|
risk of nationalization of private enterprises by foreign governments;
|
|
•
|
potential imposition of restrictions on investments;
|
|
•
|
the imposition of withholding taxes or other taxes or royalties on our income, or the adoption of other restrictions on foreign trade or investment, including currency exchange controls;
|
|
•
|
capital controls;
|
|
•
|
potential difficulties in obtaining and enforcing legal judgments in jurisdictions outside the United States;
|
|
•
|
potential difficulties in obtaining and enforcing relief in the United States against parties located outside the United States;
|
|
•
|
potential difficulties in enforcing agreements and collecting receivables;
|
|
•
|
risks relating to environmental, health and safety matters; and
|
|
•
|
local political, economic and social conditions, including the possibility of hyperinflationary conditions and political instability in certain countries.
|
We may not be successful in developing and implementing policies and strategies to address the foregoing factors in a timely and effective manner at each location where we do business. Consequently, the occurrence of one or more of the foregoing factors could have a material adverse effect on our international operations or upon our financial condition, results of operations and cash flows.
24
We are affected by general economic conditions and an economic downturn could adversely affect our operations and financial results.
We sell performance chemicals, performance materials and catalysts that are used in manufacturing processes and as components of, or ingredients in, other products and, as a result, our sales are correlated with and affected by fluctuations in the level of industrial production and manufacturing output and by fluctuations in general economic activity, including, for example, any potential impact of the vote by the United Kingdom to exit the European Union, commonly referred to as “Brexit.” Producers of performance chemicals, in particular, are likely to reduce their output in periods of significant contraction in industrial and consumer demand, while demand for the products we manufacture often depends on trends in demand in the end uses our customers serve. Our profit margins, as well as overall demand for our products, could decline as a result of factors outside our control, including economic recessions, changes in industrial production processes or consumer preferences, changes in laws and regulations affecting our industry and the manner in which they are enforced, inflation, fluctuations in interest and currency exchange rates and changes in the fiscal or monetary policies of governments in the regions in which we operate.
General economic conditions and macroeconomic trends could affect overall demand for our products and any overall decline in such demand could significantly reduce our sales and profitability. In addition, volatility and disruption in financial markets could adversely affect our sales and results of operations by limiting our customers’ ability to obtain the financing necessary to maintain or expand their own operations.
Exchange rate fluctuations could adversely affect our financial condition, results of operations and cash flows.
As a result of our international operations, for the year ended
December 31, 2017
, we generated
41%
of our sales and incurred a significant portion of our expenses in currencies other than U.S. dollars. We incur currency transaction risk whenever we enter into either a purchase or sale transaction using a currency other than the local currency of the transacting entity. The main currencies to which we are exposed, besides the U.S. dollar, are the Euro, British pound, Canadian dollar, Mexican peso and the Brazilian real. The exchange rates between these currencies and the U.S. dollar have fluctuated significantly in recent years and may continue to do so in the future. In many cases, we sell exclusively in those jurisdictions and do not have the ability to mitigate our exposure to currency fluctuations through our operations. Accordingly, to the extent that we are unable to match sales made in such foreign currencies with costs paid in the same currency, exchange rate fluctuations could adversely affect our financial condition, results of operations and cash flows. In the past, we have experienced economic loss and a negative impact on earnings as a result of foreign currency exchange rate fluctuations and any future fluctuations may have similar or greater impacts. We expect that the amount of our sales denominated in non-dollar currencies may increase in future periods. Given the volatility of exchange rates, there can be no assurance that we will be able to effectively manage our currency transaction risks or that any volatility in currency exchange rates will not have a material adverse effect on our financial condition or results of operations. See “Management’s Discussion and Analysis of Financial Condition and Results of Operations—Quantitative and Qualitative Disclosures about Market Risk.”
Additionally, because our consolidated financial results are reported in U.S dollars, the translation of sales or earnings generated in other currencies into U.S. dollars can result in a significant increase or decrease in the amount of those sales or earnings in our financial statements, which also affects the comparability of our results of operations and cash flows between financial periods. Further, currency fluctuations may negatively impact our debt service requirements, which are primarily in U.S. dollars.
Our international operations require us to comply with anti-corruption laws, trade and export controls and regulations of the U.S. government and various international jurisdictions in which we do business.
Doing business on a worldwide basis requires us and our subsidiaries to comply with the laws and regulations of the U.S. government and various international jurisdictions, and our failure to successfully comply with these laws and regulations may expose us to liabilities. Such laws and regulations apply to companies, individual directors, officers, employees and agents, and may restrict our operations, trade practices, investment decisions and partnering activities.
In particular, our international operations are subject to U.S. and foreign anti-corruption laws and regulations, such as the Foreign Corrupt Practices Act (“FCPA”) and the U.K. Bribery Act (“UKBA”). The FCPA prohibits us from providing anything of value to foreign officials for the purposes of influencing official decisions or obtaining or retaining business or otherwise obtaining favorable treatment, and requires us to maintain adequate record-keeping and internal accounting practices to accurately reflect our transactions. As part of our business, we may deal with state-owned business enterprises, the employees and representatives of which may be considered foreign officials for purposes of the FCPA and UKBA. In addition, some of the international locations in which we operate lack a developed legal system and have elevated levels of corruption. As a result of our international operations, we are exposed to the risk of violating anti-corruption laws.
In addition, we are subject to applicable export controls and economic sanctions laws and regulations imposed by the U.S. government and other countries. Changes in such laws and regulations may restrict our business practices, including cessation of business activities in sanctioned countries or regions or with sanctioned entities or individuals, and may result in modifications to compliance programs. Violations of these legal requirements are punishable by criminal fines and imprisonment, civil penalties, disgorgement of profits, injunctions, debarment from government contracts, loss of export privileges and other remedial measures.
25
We have established policies and procedures designed to assist us and our personnel in complying with applicable U.S. and international laws and regulations. These policies and procedures are codified in our Code of Conduct and other various policies. However, there can be no assurance that our policies and procedures will effectively prevent us from violating these laws and regulations in every transaction in which we may engage, and such a violation could subject us to governmental investigations and adversely affect our reputation, business, financial condition and results of operations.
Alternative technology or other changes in our customers’ products may reduce or eliminate the need for certain of our products.
Many of the products that we sell are used in manufacturing processes and as components of or ingredients in other products and, as a result, changes in our customers’ end products or processes or alternative technology may enable our customers to reduce or eliminate consumption or use of our products. For example, the ongoing shift in customer preferences in the detergent industry from powders to liquid has resulted in lower demand for zeolites. Additionally, shifting consumer preference could result in a significant reduction in the future use of fossil fuels, which would have a negative impact on our zeolite catalysts and refining services. If we are unable to respond appropriately to such new developments, such changes could seriously impair our ability to profitably market certain of our products.
Our new product development and research and development efforts may not succeed and our competitors may develop more effective or successful products.
The industries in which we operate are subject to periodic technological changes and ongoing product improvements. In order to maintain our margins and remain competitive, we must successfully develop, manufacture and market new or improved products. As a result, we must commit substantial resources each year to new product research and development. Ongoing investments in new product research and development could result in higher costs without a proportional increase in revenues. Additionally, for any new product program, there is a risk of technical or market failure, in which case we may need to commit additional resources to the program and may not be able to develop the new products needed to maintain our competitive position. Moreover, new products may have lower margins than the products they replace or may not successfully attract end users.
We also expect competition to increase as our competitors develop and introduce new and enhanced products. As such products are introduced, our products may become obsolete or our competitors’ products may be marketed more effectively. If we fail to develop new products, maintain or improve our margins with our new products or keep pace with technological developments, our business, financial condition, results of operations and cash flows will suffer.
Our substantial level of indebtedness could adversely affect our financial condition.
We have substantial indebtedness, which, as of
December 31, 2017
, totaled approximately $
2,270.3 million
. Our substantial indebtedness, combined with our other financial obligations and contractual commitments, could have important consequences, including:
|
•
|
requiring us to dedicate a substantial portion of our cash flows from operations to payments on our indebtedness, thereby reducing funds available for working capital, capital expenditures, acquisitions, selling and marketing efforts, product development and other purposes;
|
|
•
|
increasing our vulnerability to adverse economic and industry conditions, which could place us at a competitive disadvantage compared to our competitors that have relatively less indebtedness;
|
|
•
|
limiting our flexibility in planning for, or reacting to, changes in our business and the industries in which we operate;
|
|
•
|
increasing our exposure to rising interest rates because certain of our borrowings are at variable interest rates;
|
|
•
|
restricting us from making strategic acquisitions or causing us to make non-strategic divestitures; and
|
|
•
|
limiting our ability to borrow additional funds, or to dispose of assets to raise funds, if needed, for working capital, capital expenditures, acquisitions, product development and other corporate purposes.
|
Although the terms of the agreements governing our outstanding indebtedness contain restrictions on the incurrence of additional indebtedness, such restrictions are subject to a number of important exceptions and indebtedness incurred in compliance with such restrictions could be substantial. If we and our restricted subsidiaries incur significant additional indebtedness, the related risks that we face could increase.
26
If we are unable to pass on increases in raw material prices, including natural gas, to our customers or to retain or replace our key suppliers, our results of operations and cash flows may be negatively affected.
We purchase significant amounts of raw materials, including soda ash, cullet, industrial sand, aluminum trihydrate, sodium hydroxide (commonly known as caustic soda) and sulfur (including hydrogen sulfite), in our performance chemicals, performance materials and refining services product groups, and we purchase significant amounts of natural gas to supply the energy required in our production process. The cost of these raw materials represents a substantial portion of our operating expenses and our results of operations have been, and could in the future be, significantly affected by increases in the costs of such raw materials. In addition, we obtain a significant portion of our raw materials from certain key suppliers. If any of those suppliers is unable to meet its obligations under current supply agreements, we may be forced to pay higher prices to obtain the necessary raw materials. Furthermore, if any of the raw materials that we use become unavailable within the geographic area from which we currently source them, we may not be able to obtain suitable and cost-effective substitutes. Any interruption of supply or any price increase of raw materials could adversely affect our profitability.
While we attempt to match raw material price increases with corresponding product price increases, our ability to pass on increases in the cost of raw materials to our customers is, to a large extent, dependent upon our contractual arrangements and market conditions. There may be periods of time during which we are not able to recover increases in the cost of raw materials due to our contractual arrangements or weakness in demand for, or oversupply of, our products. Specifically, timing differences between price adjustments of raw materials, which may occur daily, and adjustments to our product prices, which in many cases are adjusted quarterly or less often, have had and may continue to have a negative effect on our profitability. Even in periods during which raw material prices decline, we may suffer decreasing profits if customers seek relief in the form of lower sales prices or if the raw material price reductions occur at a slower rate than decreases in the selling prices of our products. Furthermore, some of our performance chemicals customers may take advantage of fluctuating prices by building inventories when they expect product prices to increase and reducing inventories when they expect product prices to decrease. Such volatility can result in commercial disputes with customers and suppliers with respect to interpretations of complex contractual arrangements, the adverse resolution of which could reduce our profitability.
In the past, we have entered into long-term supply contracts for certain of our raw materials, including for certain of our North American soda ash. As these contracts expire, we may not be able to renegotiate or enter into new long-term supply contracts that will offer similar protection from price increases and other fluctuations on terms that are satisfactory to us or at all.
In addition, we have attempted to mitigate our exposure to the significant price volatility of natural gas, which has historically had a negative impact on our results of operations, by implementing a hedging program in the United States and entering into forward purchases in the United States, Canada, Europe and other parts of the world. Our hedging strategy may not be successful and if energy prices rise, our profitability could be adversely affected. With the exception of such natural gas contracts, we typically do not enter into long-term forward contracts to hedge against raw material price volatility.
We face substantial competition in the industries in which we operate.
The industries in which we operate are highly competitive and we face significant competition from large international producers and, particularly in Europe and certain Asia-Pacific regions, smaller regional competitors. Our silica catalysts and zeolite catalysts primarily compete with other global producers in the petrochemicals and refining industries such as W.R. Grace, BASF, UOP, and Albemarle, as well as other niche competitors such as Tosoh, Axens, and Haldor Topsoe. We compete in the North American refining services industry with competitors such as Chemtrade and Veolia through our refining services product group. Additionally, our Performance Materials and Chemicals business primarily competes with other global producers such as OxyChem, PPG and Evonik. We believe that we typically compete on the basis of performance, product consistency, quality, reliability, and ability to innovate in response to customer demands.
Our competitors may improve their competitive position in our core end use applications by successfully introducing new products, improving their manufacturing processes, expanding their capacity or manufacturing facilities or responding more effectively than us to new or emerging technologies and changes in customer requirements. Some of our competitors may be able to lower prices for our products if their costs are lower. In addition, consolidation among our competitors or customers may result in reduced demand for our products or make it more difficult for us to compete. Some of our competitors’ financial, technological and other resources may be greater than ours or they may have less debt than we do and, as a result, may be better able to withstand changes to industry conditions. The occurrence of any of these events could materially adversely affect our financial condition and results of operations.
We are subject to the risk of loss resulting from non-payment or non-performance by our customers.
Our credit procedures and policies may not be adequate to minimize or mitigate customer credit risk. Our customers may experience financial difficulties, including bankruptcies, restructurings and liquidations. These and other financial problems our customers may experience, as well as potential financial weakness in the industries in which we operate, may increase our risk in extending trade credit to customers. A significant adverse change in a customer’s financial position could cause us to limit or discontinue business with such customer, require us to assume more credit risk relating to such customer’s receivables or limit our ability to collect accounts receivable from such customer, any of which could have a material adverse effect on our business, results of operations, financial condition and liquidity.
27
We rely on a limited number of customers for a meaningful portion of our business. A loss of one or more of these customers could adversely impact our profitability.
A loss of any significant customer, including a pipeline customer, or a decrease in the provision of products to any significant customer could have an adverse effect on our business until alternative arrangements are secured. Any alternative arrangement to replace the loss of a customer would result in increased variable costs relating to product shipment. In addition, any new customer agreement entered into by us may not have terms as favorable as those contained in our current customer agreements, which could have a material adverse effect on our business, financial condition and results of operations. For the year ended
December 31, 2017
our top 10 customers represented approximately
22%
of our sales and no single customer represented more than
5%
of our sales.
Refineries, which represent a sizable subset of our Environmental Catalysts and Services business customers, have undergone significant consolidation and additional consolidation is possible in the future. Such consolidation could further increase our reliance on a small number of customers and further increase our customers’ leverage over us, resulting in downward pressure on prices and an adverse effect on our profitability.
Multi-year customer contracts in our refining services product group are subject to potential early termination and such contracts may not be renewed at the end of their respective terms.
Many of the customer contracts in our refining services product group are multi-year agreements. Sulfuric acid regeneration customer contracts are typically on five- to ten-year terms and virgin sulfuric acid customer contracts are typically on one- to five-year terms, with larger customers typically favoring longer terms. Excluding contracts with automatic evergreen provisions, approximately
70%
of our sulfuric acid volume for the year ended
December 31, 2017
was under contracts expiring at the end of
2019
or beyond. In addition, our sulfuric acid regeneration contracts with major refinery customers typically allow for termination with advance notice of one to two years. We cannot provide assurance that our existing contracts will not be subjected to early terminations or that our expiring contracts will be renewed at the end of their terms. If we receive a significant number of such contract terminations or experience non-renewals from key customers in our refining services product group, our results of operations, financial condition and cash flows may be materially adversely affected.
Reductions in highway safety spending or taxes earmarked for highway safety spending could result in a decline in our sales.
Approximately
13%
of our sales for the year ended
December 31, 2017
were derived from products sold into highway safety applications. Sales of our performance materials products for highway safety uses are in part dependent upon federal, state, local and foreign government budgets. A decrease in, or termination of, governmental budgeting for new highway safety programs or a significant decrease in the use of our performance materials products in any new highway safety projects could have an adverse effect on our business, financial condition, results of operations or cash flows by decreasing the profitability of our performance materials product group.
Our quarterly results of operations are subject to fluctuations because the demand for some of our products is seasonal.
Seasonal changes and weather conditions typically affect our performance materials and refining services product groups. In particular, our performance materials product group generally experiences lower sales and profit in the first and fourth quarters of the year because highway striping projects typically occur during warmer weather months. Additionally, our refining services product group typically experiences similar seasonal fluctuations as a result of higher demand for gasoline products in the summer months. As a result, our working capital requirements tend to be higher in the first and fourth quarters of the year, which can adversely affect our liquidity and cash flows. Because of this seasonality associated with certain of our product groups, results for any one quarter are not necessarily indicative of the results that may be achieved for any other quarter or for the full year.
If we lose certain key personnel or are unable to hire additional qualified personnel, we may not be able to execute our business strategy and our business could be adversely affected.
Our success depends, in part, upon the continued services of our highly skilled personnel involved in management, research, production and distribution and, in particular, upon the efforts and abilities of our key officers. Although we believe that we are adequately staffed in key positions, we may not be able to retain such personnel on acceptable terms or at all, and such personnel may seek to compete with us in the future. If we lose the service of any of our key personnel, we may not be able to hire replacements with the same level of industry experience and knowledge necessary to execute our business strategy, which in turn could have a material adverse effect on our business, financial condition, results of operations or cash flows.
28
Our expansion projects may result in significant expenditures before generating revenues, if any, which may materially and adversely affect our ability to implement our business strategy.
We have made and continue to make significant investments in each of our businesses. These projects require us to commit significant capital to, among other things, implement engineering plans and obtain the necessary permits before we generate revenues related to our investments in these businesses. Such projects may take longer to complete or require additional unanticipated expenditures and may never generate profits. If we fail to recover our investment, or these projects never become profitable, our ability to implement our business strategy may be materially and adversely affected.
We may be liable for damages based on product liability claims brought against us or our customers for costs associated with recalls of our or our customers’ products.
Even though we are generally a materials and services supplier rather than a manufacturer of finished goods, the sale of our products involves the risk of product liability claims and voluntary or government-ordered product recalls. For example, certain of the products that we manufacture provide critical performance functions to our customers’ end products, are used in and around other chemical manufacturing facilities, highways, airports and other locations where personal injury or property damage may occur or are used in certain consumer goods such as beverages, personal care products and medicinal applications. While we attempt to protect ourselves from product liability claims and exposures through our adherence to standards and specifications and through contractual negotiations, there can be no assurance that our efforts will ultimately protect us from any such claims. A product liability claim or voluntary or government-ordered product recall could result in substantial and unexpected expenditures, affect consumer or customer confidence in our products and divert management’s attention from other responsibilities. A product recall or successful product liability claim or series of claims against us in excess of our insurance coverage and for which we are not otherwise indemnified could have a material adverse effect on our business, financial condition, results of operations or cash flows.
We are required to comply with a wide variety of laws and regulations, and are subject to regulation by various federal, state and foreign agencies, and our failure to comply with existing and future regulatory requirements could adversely affect our financial condition, results of operations and cash flows.
We compete in industries in which we and our customers are subject to federal, state, local, international and transnational laws and regulations. Such laws and regulations are numerous and sometimes conflicting, and any future changes to such laws and regulations could adversely affect us. For example, our performance materials product group sells products used in highway safety applications, and such products are subject to laws and regulations that vary by state. If we fail to comply with applicable laws and regulations, we may be subject to civil remedies, including fines, injunctions, recalls or seizures, any of which could have an adverse effect on our business, financial condition and results of operations.
In order to obtain regulatory approval for certain of our new products, we must, among other things, demonstrate to the relevant authority that the product is safe and effective for its intended uses and that we are capable of manufacturing the product in accordance with current regulations. The process of seeking approvals can be costly, time-consuming and subject to unanticipated and significant delays. Any delay in obtaining, or any failure to obtain or maintain, these approvals would adversely affect our ability to introduce new products and to generate sales from those products, and could have an adverse effect on our business, financial condition, results of operations or cash flows.
Our products, including the raw materials we handle, are subject to rigorous chemical registration and industrial hygiene regulations and investigation. There is risk that a key raw material, chemical or substance, or one of the end products of which our products are a part, may be recharacterized as having a toxicological or health-related impact on the environment, our customers or our employees. Industrial hygiene regulations are continually strengthened and if such recharacterization occurred, the relevant raw material, chemical or product may be banned or we may incur increased costs in order to comply with new requirements. Changes in industrial hygiene regulations also affect the marketability of certain of our products, and future regulatory changes may have a material adverse effect on our business.
New laws and regulations, and changes in existing laws and regulations, may be introduced in the future and could prevent or inhibit the development, distribution and sale of our products, including as a result of additional compliance costs, seizures, confiscation, recall or monetary fines. For example, as discussed in more detail in “Business-Environmental Regulations” and “Business-Chemical Product Regulation,” we may be materially impacted by regulatory initiatives worldwide with respect to chemical product safety such as the 2016 amendments to the U.S. Toxic Substances Control Act, the E.U. regulation “Registration, Evaluation, Authorisation and Restriction of Chemical Substances” (“REACH”), or similar regulations being enacted in other countries (e.g., China REACH; Korea REACH). Additionally, the current U.S. administration may seek to reduce current environmental standards and regulations, such as the Corporate Average Fuel Economy standards, which could have a material adverse effect on our sales into the fuels and emission controls industries.
29
We are subject to extensive environmental, health and safety regulations and face various risks associated with potential non-compliance or releases of hazardous materials.
Like other chemical companies, our operations and properties are subject to extensive and stringent federal, state, local and foreign environmental laws and regulations. U.S. federal environmental laws that affects us include the Resource Conservation and Recovery Act (“RCRA”), the Clean Air Act, the Clean Water Act and the Comprehensive Environmental Response Compensation and Liability Act (“CERCLA”). These laws govern, among other things, emissions to the air, discharges or releases of hazardous substances to land, surface, subsurface strata and water, wastewater discharges and the generation, handling, storage, transportation, treatment, disposal and remediation of hazardous materials and petroleum products. We are also subject to other federal, state, local and foreign laws and regulations regarding chemical and product safety as well as employee health and safety matters, including process safety requirements. These laws and regulations may become more stringent over time and the failure to comply with such laws and regulations can result in significant fines or penalties.
We have in the past been and currently are the subject of investigations and enforcement actions pursuant to environmental laws, including the Clean Air Act. Some of these matters were resolved through the payment of significant monetary penalties and a requirement to implement corrective actions at our facilities. For instance, in November 2015, the Pennsylvania Department of Environmental Protection issued a $1.7 million fine against us for allegedly excessive emissions of carbon monoxide and nitrogen oxides from our Chester, Pennsylvania site. We appealed the alleged violations and the associated fine was reduced to $0.2 million. We also remain subject to a 2007 Consent Decree that resolves certain alleged Clean Air Act violations at our seven refining services operating locations involving New Source Review, Prevention of Significant Deterioration and New Source Performance Standard obligations under the U.S. federal rules for the pollutants sulfur dioxide and sulfuric acid mist. The Consent Decree required Solvay (the owner at the time) to pay a $2 million penalty and spend approximately $34 million on air pollution controls at our facilities, the majority of which was received from customers in contractual arrangements. Work under the Consent Decree has proceeded since 2007, and we believe that all of the significant capital improvements related to the Consent Decree have been completed. One of our operating locations has been released from the scope of the Consent Decree and we are seeking release of the other locations covered by the Consent Decree.
We are required by these environmental laws and regulations to obtain registrations, licenses, permits and other approvals in order to operate, to make disclosures to public authorities about our chemical handling and usage activities and to install expensive pollution control and spill containment equipment at our facilities, or to incur other capital expenditures aimed at achieving or maintaining compliance with such laws and regulations. We are preparing to implement a substantial environmentally-driven capital improvement project over the next three years and failure to complete this project or to timely identify and implement other capital projects required to achieve or maintain compliance could expose us to enforcement and penalty.
Under CERCLA and analogous statutes in local and foreign jurisdictions, current and former owners and operators of land impacted by releases of hazardous substances are strictly liable for the investigation and remediation of the contamination resulting from the release. Liability under CERCLA and analogous laws is strict, unlimited, joint, several and retroactive, may be imposed regardless of fault and may relate to historical activities or contamination not caused by the affected property’s current owner or operator. We could be held responsible for all cleanup costs at a site, whether currently or formerly owned or operated, regardless of fault, knowledge, timing or cause of the contamination. Further, under CERCLA and analogous laws, we may be jointly and severally liable for contamination at third party sites where we or our predecessors in interest have sent waste for treatment or disposal, even if we complied with applicable laws. In addition, we may face liability for personal injury, property damage and natural resource damage resulting from environmental conditions attributable to hazardous substance releases at or from facilities we currently or formerly owned or operated or to which we sent waste. As such, a product spill or emission at one of our facilities or otherwise resulting from our operations could have adverse consequences on the environment and surrounding community and could result in significant liabilities with respect to investigation and remediation.
Our facilities have an extended history of industrial use, and soil and groundwater contamination exists at some of our sites. As of
December 31, 2017
, we had current investigation, remediation or monitoring obligations at several of our current or former sites, including Rahway, New Jersey; Dominguez, California; Martinez, California; and Tacoma, Washington. As of
December 31, 2017
, we had established reserves of approximately
$4.1 million
to cover anticipated expenses at these sites, all of which have reached relatively mature stages of either the investigation, remediation or monitoring process. Actual costs to complete these projects may exceed our current estimates. In addition, we have unresolved liability at several sites to which we or our predecessors allegedly arranged for the disposal or treatment of hazardous wastes. For example, at the Boyertown Sanitary Disposal site in Gilbertsville, Pennsylvania, we are participating in a group of parties who disposed of materials at the site to fund investigatory and remedial work.
As of
December 31, 2017
, our total reserves associated with environmental remediation and enforcement matters were
$5.8 million
. In addition to the ongoing remediation and monitoring activities discussed above, there is risk that the long-term industrial use at our facilities may have resulted in, or may in the future result in, contamination that has yet to be discovered, which could require additional, unplanned investigation and remediation efforts by us for which no reserves have been established, potentially without regard to whether we knew of, or caused, the release of such hazardous substances. Discovery of additional or unknown conditions at our facilities could have an adverse impact on our business by substantially increasing our capital expenditures, including compliance, investigation and remediation costs. Such environmental liabilities attached to our properties, or for properties that we are otherwise responsible for, could have a material adverse effect on our results of operations or financial condition.
30
Existing and proposed regulations to address climate change by limiting greenhouse gas emissions may cause us to incur significant additional operating and capital expenses.
Certain of our operations result in emissions of greenhouse gases (“GHGs”), such as carbon dioxide. Growing concern about the sources and impacts of global climate change has led to a number of domestic and foreign legislative and administrative measures, both proposed and enacted, to monitor, regulate and limit carbon dioxide and other GHG emissions. In the European Union, our emissions are regulated under the E.U. Emissions Trading System (the “E.U. ETS”), an E.U.-wide trading scheme for industrial GHG emissions. The E.U. ETS is anticipated to become progressively more stringent over time, including by reducing the number of allowances to emit GHGs that E.U. member states will allocate without charge to industrial facilities. In the United States, the EPA has promulgated federal GHG regulations under the Clean Air Act that affect certain sources. For example, the EPA has issued mandatory GHG reporting requirements, under which our Dominguez, California and Baton Rouge, Louisiana facilities currently report. Moreover, California has enacted the Global Warming Solutions Act of 2006 (“Assembly Bill 32”), a law that establishes a comprehensive program to reduce GHG emissions from all sources throughout the state and contains reporting requirements under which our Dominguez and Martinez facilities currently report. Our Dominguez facility also participates in the emissions trading market established under Assembly Bill 32. Although we believe it is likely that GHG emissions will continue to be regulated in at least some regions of the United States and in other countries (in addition to the European Union) in the future, we cannot yet predict the form such regulation will take (such as a cap-and-trade program, technology mandate, emissions tax or other regulatory mechanism) or, consequently, estimate any costs that we may be required to incur in respect of such requirements, which could, for example, require that we install emission control equipment, purchase emissions allowances, administer and manage our GHG emissions program or address other regulatory obligations. Such requirements could also adversely affect our energy supply or the costs and types of raw materials that we use for fuel. Accordingly, regulations controlling or limiting GHG emissions could have a material adverse effect on our business, financial condition or results of operations, including by reducing demand for our products.
Production and distribution of our products could be disrupted for a variety of reasons, and such disruptions could expose us to significant losses or liabilities.
Certain of the hazards and risks associated with our manufacturing processes and the related storage and transportation of raw materials, products and wastes may disrupt production at our manufacturing facilities and the distribution of products to our customers. These potentially disruptive risks include, but are not limited to, the following:
|
•
|
pipeline and storage tank leaks and ruptures;
|
|
•
|
explosions and fires;
|
|
•
|
inclement weather and natural disasters;
|
|
•
|
terrorist attacks;
|
|
•
|
failure of mechanical, process safety and pollution control equipment;
|
|
•
|
chemical spills and other discharges or releases of toxic or hazardous substances or gases; and
|
|
•
|
exposure to toxic chemicals.
|
These hazards could expose employees, customers, the community and others to toxic chemicals and other hazards, contaminate the environment, damage property, result in personal injury or death, lead to an interruption or suspension of operations, damage our reputation and adversely affect the productivity and profitability of a particular manufacturing facility or our business as a whole. Such hazards could also result in the need for remediation, governmental enforcement, regulatory shutdowns, the imposition of government fines and penalties and claims brought by governmental entities or third parties. Legal claims and regulatory actions could subject us to both civil and criminal penalties, which could affect our product sales, reputation and profitability.
If disruptions at our manufacturing facilities or in our distribution channels occur, alternative options with sufficient capacity or capabilities may not be available, may cost substantially more or may require significant time to start production or distribution. Any of these scenarios could negatively affect our business and financial performance. If one of our manufacturing facilities or distribution channels is unable to produce or distribute our products for an extended period of time, our sales may be reduced by the shortfall caused by the disruption and we may not be able to meet our customers’ needs, which could cause them to seek other suppliers. Furthermore, to the extent a production disruption occurs at a manufacturing facility that has been operating at or near full capacity, the resulting shortage of our product could be particularly harmful because production at the manufacturing facility may not be able to reach levels achieved prior to the disruption. Such risks are heightened in our refining services product group, which has operations and customers primarily located in the Gulf Coast, which is susceptible to a heightened risk of hurricanes, and Northern California, which is susceptible to a heightened risk of earthquakes. For example, in August 2017 we shut down our Houston and Baytown refining services facilities in coordination with our refinery partners in anticipation of Hurricane Harvey. The operational interruption at these facilities negatively impacted our sales by approximately
$7.7 million
.
31
The insurance that we maintain may not fully cover all potential exposures.
We maintain property, business interruption, casualty and other types of insurance, but such insurance may not cover all risks associated with the operation of our business or our manufacturing process and the related use, storage and transportation of raw materials, products and wastes in or from our manufacturing sites or distribution centers. While we have purchased what we deem to be adequate limits of coverage and broadly worded policies, our coverage is subject to exclusions and limitations, including higher self-insured retentions or deductibles and maximum limits and liabilities covered. Notwithstanding diligent efforts to successfully procure specialty coverage for environmental liability and remediation, we may incur losses beyond the limits or outside the terms of coverage of our insurance policies, including liabilities for environmental remediation. In addition, from time to time, various types of insurance for companies in the industries in which we operate have not been available on commercially acceptable terms or, in some cases, at all. We are potentially at additional risk if one or more of our insurance carriers fail. Additionally, severe disruptions in the domestic and global financial markets could adversely impact the ratings and survival of some insurers. Future downgrades in the ratings of enough insurers could adversely impact both the availability of appropriate insurance coverage and its cost. In the future, we may not be able to obtain coverage at current levels, if at all, and our premiums may increase significantly on coverage that we maintain.
We could be subject to damages based on claims brought against us by our customers or lose customers as a result of the failure of our products to meet certain quality specifications.
Our products provide important performance attributes to our customers’ products. If a product fails to perform in a manner consistent with quality specifications, or has a shorter useful life than that which was guaranteed, a customer could seek replacement of the product or damages for costs incurred as a result of the product failing to perform as guaranteed. A successful claim or series of claims against us could cause reputational harm and have a material adverse effect on our financial condition and results of operations and could result in a loss of one or more customers.
We may engage in strategic acquisitions or dispositions of certain assets or businesses that could affect our business, results of operations, financial condition and liquidity.
We may selectively pursue complementary acquisitions, such as the Business Combination, and joint ventures, such as our Zeolyst Joint Venture, each of which inherently involves a number of risks and presents financial, managerial and operational challenges, including:
|
•
|
potential disruption of our ongoing business and distraction of management;
|
|
•
|
difficulty with integration of personnel and financial and other systems;
|
|
•
|
hiring additional management and other critical personnel; and
|
|
•
|
increasing the scope, geographic diversity and complexity of our operations.
|
In addition, we may encounter unforeseen obstacles or costs in the integration of acquired businesses. For example, the presence of one or more material liabilities of an acquired company that are unknown to us at the time of acquisition may have a material adverse effect on our business. Our acquisition and joint venture strategy may not be received positively by customers, and we may not realize any anticipated benefits from acquisitions or joint ventures.
We may also opportunistically pursue dispositions of certain assets and businesses, which may involve material amounts of assets or lines of business, and could adversely affect our results of operations, financial condition and liquidity. If any such dispositions were to occur, under the terms of the agreements governing our outstanding indebtedness, we may be required to apply the proceeds of the sale to repay such indebtedness.
The pro forma and non-GAAP financial information included in this Form 10-K is presented for informational purposes only and may not be an indication of our financial condition or results of operations in the future.
The unaudited pro forma combined financial information included in this Form 10-K is presented for informational purposes only and is not necessarily indicative of what our actual financial condition or results of operations would have been had the Business Combination been completed on the date indicated. The assumptions used in preparing the pro forma financial information may not prove to be accurate and other factors may affect our financial condition or results of operations. Accordingly, our financial condition and results of operations in the future may not be consistent with, or evident from, such pro forma financial information. The non-GAAP financial information included in this Form 10-K includes information that we use to evaluate our past performance, but you should not consider such information in isolation or as an alternative to measures of our performance determined under GAAP.
32
Our joint ventures may not operate according to their business plans if our partners fail to fulfill their obligations or differences in views among our partners results in delayed decisions or failures to agree on major issues, which may adversely affect our results of operations and force us to dedicate additional resources to these joint ventures.
We currently participate in a number of joint ventures and may enter into additional joint ventures in the future. The nature of a joint venture requires us to share control with unaffiliated third parties and we sometimes have joint and several liability with our joint venture partners. If our joint venture partners do not fulfill their obligations, or if differences in views among the joint venture participants results in delayed decisions or failures to agree on major issues, the affected joint venture may not be able to operate according to its business plan. For example, our Zeolyst Joint Venture is structured as a general partnership in which we are equal partners with CRI Zeolites Inc. Accordingly, we do not control the Zeolyst Joint Venture and cannot unilaterally undertake strategies, plans, goals and operations or determine when cash distributions will be made to us. Furthermore, we are liable on a joint and several basis with CRI Zeolites Inc. for all of the partnership’s liabilities if it does not have sufficient assets to satisfy such liabilities. Such factors may adversely affect our results of operation and force us to dedicate additional and unexpected resources to our joint ventures.
Our failure to protect our intellectual property rights could adversely affect our future performance and growth.
Protection of our proprietary processes, methods, compounds and other technologies is important to our business. We depend upon our ability to develop and protect our intellectual property rights to distinguish our products from those of our competitors. Failure to protect our existing intellectual property rights may allow our competitors to copy our products and may result in the loss of valuable proprietary technologies or other intellectual property. Failure to protect our innovations and trademarks by securing intellectual property rights could also result in our having to pay other companies for infringing on their intellectual property rights. We rely on a combination of patent, trade secret, trademark and copyright law as well as regulatory and judicial enforcement to protect such technologies and trademarks. In addition, the laws of many foreign countries do not protect our intellectual property rights to the same extent as the laws of the United States. As of
December 31, 2017
, we owned
46
patented inventions in the United States, with approximately
332
patents issued in countries around the world and approximately
128
patent applications pending worldwide covering more than
25
additional inventions. Some of these patents are licensed to others. In addition, we have acquired certain rights under patents and inventions of others through licenses. Should any of these licenses granted to us by third parties terminate prior to the expiration of the licensed intellectual property, we would need to cease using the licensed intellectual property, and either develop or license alternative technologies. In such a case, there can be no assurance that alternative technologies exist or that we would be able to obtain such a license on favorable terms.
Competitors and third parties may infringe on our patents or violate our intellectual property rights. Defending and enforcing our intellectual property rights can involve litigation and can be expensive and time consuming. Such proceedings could put our patents at risk of being invalidated and confidential information may be disclosed through the discovery process; these costs and diversion of resources could harm our business.
We cannot provide any assurances that any of our pending applications will mature into issued patents, or that any patents that have issued or may issue in the future do or will include claims with a scope sufficient to provide any competitive advantage. Patents involve complex legal and factual questions and, therefore, the issuance, scope, validity and enforceability of any patent claims we have or may obtain cannot be predicted with certainty. Patents may be challenged, deemed unenforceable, invalidated or circumvented. Patents may be challenged in the courts, as well as in various administrative proceedings before the United States Patent and Trademark Office or foreign patent offices. We are currently and may in the future be a party to various adversarial patent office proceedings involving our patents or the patents of third parties. Such challenges can result in some or all of the claims of the challenged patent being invalidated, deemed unenforceable, or interpreted narrowly which, in the case of challenges to our own patents, may be adverse to our interests. Accordingly, the issuance of patents is not conclusive of the validity, scope, or enforceability of such patents. Moreover, even if valid and enforceable, competitors may be able to design around our patents or use pre-existing technologies to compete with us.
We also rely upon unpatented proprietary know-how, continuing technological innovation and other trade secrets to develop and maintain our competitive position, which may not provide us with complete protection against competitors. Misappropriation or unauthorized disclosure of our proprietary know-how could harm our competitive position or have an adverse effect on our business. While it is our policy to enter into confidentiality agreements with our employees and third parties to protect our intellectual property rights and we strive to maintain the physical security of our properties and the security of our IT systems, there can be no assurances that:
|
•
|
our confidentiality agreements will not be breached;
|
|
•
|
our security measures will not be breached;
|
|
•
|
such agreements will provide meaningful protection for our trade secrets or proprietary know-how; or
|
|
•
|
adequate remedies will be available in the event of an unauthorized use or disclosure of such trade secrets and know-how.
|
In addition, there can be no assurances that others will not obtain knowledge of these trade secrets through independent development or other access by legal means.
33
Measures taken by us to protect these assets and rights may not provide meaningful protection for our trade secrets or proprietary manufacturing expertise and adequate remedies may not be available in the event of an unauthorized use or disclosure of our trade secrets or manufacturing expertise. In addition, as noted above, our patents and other intellectual property rights may be challenged, invalidated, circumvented or rendered unenforceable.
Furthermore, we cannot provide assurance that any pending patent or trademark application filed by us will result in an issued patent or registered trademark or, if patents are issued to us, that those patents will provide meaningful protection against competitors or against competitive technologies. The failure of our patents or other measures to protect our processes, apparatuses, technology, trade secrets and proprietary manufacturing expertise, methods and compounds or trademarks and provide us with freedom to exclude competition could have an adverse effect on our business, financial condition, results of operations and cash flows. See “Business-Intellectual Property.”
Our products may infringe the intellectual property rights of others, which may cause us to incur unexpected costs or prevent us from selling our products.
Our industry is characterized by vigilant pursuit of intellectual property rights, particularly with respect to our silica catalysts and zeolite catalysts product groups. Like us, our competitors rely on intellectual property rights to maintain profitability and competitiveness. As the number of products and competitors has increased, the likelihood of intellectual property disputes has risen. Although it is our policy and intention not to infringe valid patents of which we are aware, our processes, apparatuses, technology, proprietary manufacturing expertise, methods, compounds and products may infringe on issued patents or infringe or misappropriate other intellectual property rights of others. Accordingly, we continually monitor third-party intellectual property to confirm our freedom to operate. Nevertheless, we may be subject to legal proceedings and claims in the ordinary course of our business, including claims of alleged infringement of the patents or trademarks or infringement or misappropriation of other intellectual property rights of third parties by us or our licensees in connection with their use of our products. Intellectual property litigation is expensive and time-consuming, regardless of the merits of any claim, and could divert the attention of our management and technical personnel away from operating our business. If we were to discover that our processes, apparatuses, technology, products or trademarks infringe the valid intellectual property rights of others, we might need to obtain licenses from these parties or substantially reengineer or rebrand our products in order to avoid infringement. We may not be able to obtain the necessary licenses on acceptable terms, or at all, or be able to reengineer our products successfully or at an acceptable cost. Moreover, if we are sued for infringement and lose the suit, we could be required to pay substantial damages and/or be enjoined from using or selling the infringing products or technology or using the infringing trademark. Additionally or alternatively, we may seek to challenge third-party patents in administrative proceedings before the United States patent office or one or more foreign patent offices. Any of the foregoing could cause us to incur significant costs and prevent us from selling our products, which could have an adverse effect on our business, financial condition, results of operations and cash flows. Even if we ultimately prevail, the existence of lawsuits could prompt our customers to switch to alternative products. In addition, we have agreed, and will continue to agree, to indemnify certain customers for certain intellectual property infringement claims related to intellectual property relating to our products and the manufacture thereof. Should there be infringement claims against our licensees, we could be required to indemnify them for losses resulting from such claims or to refund amounts they have paid to us.
Losses and damages in connection with information technology risks could adversely affect our operations.
Our operations materially depend on the reliable performance of a complex, worldwide and highly available information technology infrastructure with integrated processes. The networks and data centers we use are subject to damage by material events such as major disruptions to public infrastructure, including power outages, cyber or terrorist attacks, viruses, physical or electronic break-ins and fires. Despite various disaster recovery plans, there can be no assurance that our systems are appropriately redundant and we do not control the operations at the back-up facility we use. Accordingly, such an event could cause material disruptions in our operations.
The broad use of information technology systems has increased the risk of unauthorized access to confidential data, such as customer information, strategic projects, product formulas and other trade secrets, and the risk of destruction or manipulation of material data by employees or third parties. Release of third party confidential information could materially harm our reputation, affect our relationships with such parties and expose us to liability. Although we have introduced many security measures, including firewalls and information technology security policies, we cannot ensure that these measures offer the appropriate level of security. A security breach or other compromise of our information security safeguards could expose our confidential information, including third party confidential information in our possession (such as customer information) to theft and misuse, which could in turn adversely affect our relationships with such third parties and have an adverse effect on our business, financial condition, results of operations and cash flows.
34
We depend on good relations with our workforce, and any significant disruptions could adversely affect our operations.
As of
December 31, 2017
, we had
3,149
employees globally, approximately
49%
of which were represented by a union, works council or other employee representative body. As of
December 31, 2017
, approximately
66%
of our U.S. unionized employees were covered under collective bargaining agreements that will expire on or before December 31, 2018. Failure to reach agreement with any of our unionized work groups regarding the terms of their collective bargaining agreements or annual pay increases may result in a labor strike, work stoppage or slowdown. In addition, a large number of our employees are employed in countries in which employment laws provide greater bargaining or other rights to employees than the laws of the United States. Such employment rights require us to work collaboratively with the legal representatives of the employees to effect any changes to labor arrangements. For example, many of our employees in Europe are represented by works councils that must approve any changes in conditions of employment, including salaries, benefits and staff changes, and may impede efforts to restructure our workforce. Although we believe that we have a good working relationship with our employees, a strike, work stoppage or slowdown by our employees or a dispute with our employees could result in a significant disruption to our operations or higher ongoing labor costs. In addition, our ability to make adjustments to control compensation and benefit costs, or otherwise adapt to changing business needs, may be limited by the terms and duration of our collective bargaining agreements.
We are subject to certain risks related to litigation filed by or against us, as well as administrative and regulatory proceedings, and adverse results may harm our business.
We cannot predict with certainty the cost of defense, the cost of prosecution or the ultimate outcome of litigation and other administrative and regulatory proceedings filed by or against us, including remedies or damage awards, and adverse results in any litigation or other administrative and regulatory proceedings may materially harm our business. Litigation and other administrative and regulatory proceedings may include, but are not limited to, actions relating to intellectual property, commercial arrangements, environmental, health and safety matters, joint venture agreements, labor and employment matters, domestic and foreign antitrust matters or other harms resulting from the actions of individuals or entities outside of our control. In the case of intellectual property litigation and proceedings, adverse outcomes could include the cancellation, invalidation or other loss of material intellectual property rights used in our business and injunctions prohibiting our use of our processes, apparatuses, technology, trade secrets and proprietary manufacturing expertise, methods and compounds that are subject to third-party patents or other third-party intellectual property rights. Litigation based on environmental matters or exposure to hazardous substances in the workplace or from our products could result in significant liability for us. For example, we are currently subject to various asbestos premises liability claims that relate to employee or contractor exposure to asbestos contained in certain building materials at our sites. Furthermore, our international operations expose us to potential administrative and regulatory proceedings in foreign jurisdictions. Antitrust authorities in Brazil have publicly announced that they are investigating alleged cartel activities by Brazilian silicate manufacturers, including our Brazilian subsidiary (“PQ Brazil”). The authorities allege that the activities occurred over an approximately 10-year period beginning in the late 1990s, which is prior to the time we owned PQ Brazil. PQ Brazil is fully cooperating with the authorities. Adverse outcomes in any of the foregoing could have a material adverse effect on our business.
The terms of our indebtedness restrict our current and future operations, particularly our ability to respond to change or to take certain actions.
The indentures governing our outstanding indebtedness contain a number of restrictive covenants that impose significant operating and financial restrictions on us and may limit our ability to engage in acts that may be in our long-term best interest, including restrictions on our ability to incur additional indebtedness, make investments, acquisitions, loans and advances, sell, transfer or otherwise dispose of our assets or incur liens. See “Management’s Discussion and Analysis of Financial Condition and Results of Operations—Financial Condition, Liquidity and Capital Resources—Debt.” In addition, the restrictive covenants in the agreements governing our senior secured credit facilities require us to maintain specified financial ratios and satisfy other financial condition tests. Our ability to meet these financial ratios and tests can be affected by events beyond our control.
A breach of such covenants could result in an event of default unless we obtain a waiver to avoid such default. If we are unable to obtain a waiver, such a default may allow our creditors to accelerate the related debt and may result in the acceleration of, or default under, any other debt to which a cross-acceleration or cross-default provision applies. In the event our lenders or noteholders accelerate the repayment of our borrowings, we and our subsidiaries may not have sufficient assets to repay that indebtedness.
35
Because our operations are conducted through our subsidiaries and joint ventures, we are dependent on the receipt of distributions and dividends or other payments from our subsidiaries and joint ventures for cash to fund our operations and expenses, including to make future dividend payments, if any.
Our operations are conducted through our subsidiaries and joint ventures. As a result, our ability to make future dividend payments, if any, is dependent on the earnings of our subsidiaries and joint ventures and the payment of those earnings to us in the form of dividends, loans or advances and through repayment of loans or advances from us. Payments to us by our subsidiaries and joint ventures will be contingent upon our subsidiaries’ or joint ventures’ earnings and other business considerations and may be subject to statutory or contractual restrictions. We do not currently expect to declare or pay dividends on our common stock for the foreseeable future; however, to the extent that we determine in the future to pay dividends on our common stock, the agreements governing our outstanding indebtedness significantly restrict the ability of our subsidiaries to pay dividends or otherwise transfer assets to us.
We may need to recognize impairment charges related to goodwill, identified intangible assets and fixed assets.
We are required to test goodwill and any other intangible asset with an indefinite life for possible impairment on the same date each year and on an interim basis if there are indicators of a possible impairment. We are also required to evaluate indefinite-lived intangible assets and fixed assets for impairment if there are indicators of a possible impairment.
There is significant judgment required in the analysis of a potential impairment of goodwill, identified intangible assets and fixed assets. If, as a result of a general economic slowdown or deterioration in one or more of the industries in which we operate or in our financial performance or future outlook, or if the estimated fair value of our long-lived assets decreases, we may determine that one or more of our long-lived assets is impaired. An impairment charge would be determined based on the estimated fair value of the assets and any such impairment charge could have a material adverse effect on our results of operations and financial position.
Our ability to utilize our net operating losses is uncertain.
As of
December 31, 2017
, we had
$426.9 million
of net operating losses for U.S. federal income tax purposes. Our ability to utilize these net operating losses to offset future income tax liabilities depends on our future financial performance and our future taxable income. In addition, our utilization of these net operating losses is currently limited under Section 382 of the Internal Revenue Code of 1986, as amended (the “Code”), impacting our ability to realize the benefits of these net operating losses. If any ownership changes occur within three years of the closing date of the Business Combination among stockholders owning directly or indirectly 5% or more of our common stock and that results in an aggregate ownership change with respect to such stockholders of more than 50% of our common stock, our utilization of these net operating losses and certain built-in losses would be subject to an additional limitation imposed by Section 382 of the Internal Revenue Code (“IRC”).
As a result of the Business Combination, $332.4 million of the
$426.9 million
of our federal net operating losses may be subject to the limitations of Section 382 of the IRC. Although potentially subject to the limitations of Section 382, our management believes it is more likely than not that we will realize the entire $332.4 million in pre-transaction net operating losses in future years. The remaining $94.5 million relates to periods after the Business Combination and would not be subject to Section 382.
On December 22, 2017, the Tax Cuts and Jobs Act (“TCJA”) was signed into law. The TCJA mandates significant changes to U.S. corporate taxation. Notable legislative changes include a reduction of the corporate tax rate from 35% to 21%, new additional limitations on the tax deductibility of interest, extensive changes to the regime governing the taxation of foreign earnings, immediate deductions for certain investments instead of deductions for depreciation expense over time, as well as modification or repeal of certain business deductions and credits. Notwithstanding the reduction in the U.S. corporate income tax rate, the overall impact of TCJA remains uncertain, in part because the Treasury Regulations implementing the law have not yet been issued, and our results of operations, cash flows and financial condition could be adversely affected.
We have unfunded and underfunded pension plan liabilities. We will require current and future operating cash flow to fund these shortfalls. We have no assurance that we will generate sufficient cash flow to satisfy these obligations.
We maintain defined benefit pension plans covering employees who meet age and service requirements. While some of our plans have been frozen, our net pension liability and cost is materially affected by the discount rate used to measure pension obligations, the longevity and actuarial profile of our workforce, the level of plan assets available to fund those obligations and the actual and expected long-term rate of return on plan assets. Significant changes in investment performance or a change in the portfolio mix of invested assets can result in corresponding increases and decreases in the valuation of plan assets, particularly equity securities, or in a change in the expected rate of return on plan assets. Assets available to fund the pension and other postemployment benefit obligations of our plans as of
December 31, 2017
were approximately
$314.9 million
, or approximately
$83.3 million
less than the measured pension benefit obligation on a GAAP basis. In addition, any changes in the discount rate could result in a significant increase or decrease in the valuation of pension obligations, affecting the reported funded status of our pension plans as well as the net periodic pension cost in the following years. Similarly, changes in the expected return on plan assets can result in significant changes in the net periodic pension cost in the following years.
36
We also contribute to two multi-employer pension plans on behalf of certain of our employees in the United States pursuant to union agreements that generally provide defined benefits to employees covered by collective bargaining agreements. A total of approximately 18 employees currently participate in such multi-employer pension plans. Funding requirements for benefit obligations of multi-employer pension plans are subject to certain regulatory requirements and we may be required to make cash contributions to one of these plans to satisfy certain underfunded benefit obligations. Absent an applicable exemption, a contributor to a U.S. multi-employer plan is liable upon its withdrawal from, or the termination of, a plan for its proportionate share of the plan’s underfunding, if any.
We also provide certain health care and life insurance benefits to certain of our employees and their dependents in the United States upon the retirement of such employee from us pursuant to union agreements. Costs of these other post-employment benefit plans are dependent upon numerous factors, assumptions and estimates.
Risks Related to our Common Stock
CCMP and INEOS continue to have significant influence over us, which could limit your ability to influence the outcome of key transactions, including a change of control.
As of
December 31, 2017
, investment funds affiliated with CCMP beneficially owned approximately
45.8%
of our outstanding common stock and INEOS beneficially owned approximately
24.3%
of our outstanding common stock. For as long as affiliates of CCMP and INEOS continue to beneficially own a substantial percentage of the voting power of our outstanding common stock, they will continue to have significant influence over us. For example, they will be able to strongly influence or effectively control the election of all of the members of our board of directors and our business and affairs, including any determinations with respect to mergers or other business combinations, the acquisition or disposition of assets, the incurrence of additional indebtedness, the issuance of any additional shares of common stock or other equity securities, the repurchase or redemption of shares of our common stock and the payment of dividends.
Additionally, CCMP and INEOS are in the business of making investments in companies and may acquire and hold interests in businesses that compete directly or indirectly with us. CCMP and INEOS may also pursue acquisition opportunities that may be complementary to our business, and, as a result, those acquisition opportunities may not be available to us.
Our stock price could be extremely volatile and, as a result, you may not be able to resell your shares at or above the price you paid for them.
Since completing our initial public offering in September 2017, the price of our common stock, as reported on the New York Stock Exchange, has ranged from a low of $12.88 on March 2, 2018 to a high of $17.65 on October 5, 2017. In addition, the stock market in general has been highly volatile. As a result, the market price of our common stock is likely to be similarly volatile, and investors in our common stock may experience a decrease, which could be substantial, in the value of their stock, including decreases unrelated to our operating performance or prospects, and could lose part or all of their investment. The price of our common stock could be subject to wide fluctuations in response to a number of factors, including those described elsewhere herein and others such as:
|
•
|
variations in our operating performance and the performance of our competitors;
|
|
•
|
actual or anticipated fluctuations in our quarterly or annual operating results;
|
|
•
|
publication of research reports by securities analysts about us, our competitors or our industry;
|
|
•
|
our failure or the failure of our competitors to meet analysts’ projections or guidance that we or our competitors may give to the market;
|
|
•
|
additions or departures of key personnel;
|
|
•
|
strategic decisions by us or our competitors, such as acquisitions, divestitures, spin-offs, joint ventures, strategic investments or changes in business strategy;
|
|
•
|
the passage of legislation or other regulatory developments affecting us or our industry;
|
|
•
|
|
|
•
|
changes in legislation, regulation and government policy as a result of the U.S. presidential and congressional elections;
|
|
•
|
speculation in the press or investment community;
|
|
•
|
changes in accounting principles;
|
|
•
|
terrorist acts, acts of war or periods of widespread civil unrest;
|
|
•
|
natural disasters and other calamities; and
|
|
•
|
changes in general market and economic conditions.
|
37
In addition, broad market and industry factors may negatively affect the market price of our common stock, regardless of our actual operating performance, and factors beyond our control may cause our stock price to decline rapidly and unexpectedly. We are exposed to the impact of any global or domestic economic disruption, including any potential impact of the vote by the United Kingdom to exit the European Union, commonly referred to as “Brexit.”
In the past, securities class action litigation has often been initiated against companies following periods of volatility in their stock price. This type of litigation could result in substantial costs and divert our management’s attention and resources, and could also require us to make substantial payments to satisfy judgments or to settle litigation.
If we fail to maintain effective internal control over financial reporting and effective disclosure controls and procedures, we may not be able to accurately report our financial results in a timely manner or prevent fraud, which may adversely affect investor confidence in our company.
We are not currently required to comply with the rules of the Securities and Exchange Commission (“SEC”) implementing Section 404 of the Sarbanes-Oxley Act and are therefore not required to make a formal assessment of the effectiveness of our internal control over financial reporting for that purpose. We are required to comply with the SEC’s rules implementing Section 302 of the Sarbanes-Oxley Act, which requires management to certify financial and other information in our quarterly and annual reports. Although we are required to disclose changes that have materially affected, or are reasonably likely to materially affect, our internal control over financial reporting on a quarterly basis, we are not required to make our first annual assessment of our internal control over financial reporting pursuant to Section 404 of the Sarbanes-Oxley Act until our second annual report on Form 10-K.
From time to time, we may need to undertake various actions, to develop, implement and test additional processes and other controls. Testing and maintaining internal controls can divert our management’s attention from other matters related to the operation of our business. In addition, when evaluating our internal control over financial reporting, we may identify material weaknesses that we may not be able to remediate resulting in our management being unable to assert that our internal control over financial reporting is effective.
A material weakness is a deficiency, or a combination of deficiencies, in internal control over financial reporting, such that there is a reasonable possibility that a material misstatement of our annual or interim consolidated financial statements will not be prevented or detected on a timely basis.
As a private company, we identified a material weakness related to our control environment following the Business Combination, which was the result of the fact that Eco had insufficient resources and financial expertise to effectively carry out the accounting functions for its business. This identified material weakness contributed to control deficiencies in Eco’s internal control over financial reporting that originated prior to the Business Combination. These deficiencies related to: (i) the inadequate design of controls to review the transactions within Eco’s account for goods received, but not invoiced, for appropriateness at period end which resulted in misstatements to cost of goods sold and property, plant and equipment and (ii) the inadequate design of appropriate controls to account for fair value adjustments to property, plant, and equipment, which resulted in misstatements to depreciation expense following the Business Combination. These control deficiencies were considered to be material weaknesses because they could have resulted in a misstatement of the aforementioned account balances or disclosures that would result in a material misstatement to the annual or interim consolidated financial statements that would not be prevented or detected.
We have implemented improved processes and internal controls through integration with the Company’s processes and upgrading the organizational design and personnel performing the processes and controls specific to the Eco business unit. These control deficiencies were remediated as of March 31, 2017 as the controls that we designed after the Business Combination to address these control deficiencies were operating for a sufficient amount of time to conclude that they had been remediated.
We cannot provide assurance that additional material weaknesses or control deficiencies will not occur in the future. If we identify additional material weaknesses in our internal control over financial reporting or are unable to comply with the requirements of Section 404 in a timely manner or assert that our internal control over financial reporting is effective, or if our independent registered public accounting firm is unable to express an unqualified opinion as to the effectiveness of our internal control over financial reporting in future periods, investors may lose confidence in the accuracy and completeness of our financial reports and the market price of our common stock could be negatively affected.
Your percentage ownership in us may be diluted by future issuances of capital stock, which could reduce your influence over matters on which stockholders vote.
Our board of directors has the authority, without action or vote of our stockholders, to issue all or any part of our authorized but unissued shares of common stock, including shares issuable upon exercise of options, or shares of our authorized but unissued preferred stock. Issuances of common stock or voting preferred stock would reduce your influence over matters on which our stockholders vote and, in the case of issuances of preferred stock, would likely result in your interest in us being subject to the prior rights of holders of that preferred stock.
38
There may be sales of a substantial amount of our common stock by our current stockholders, and these sales could cause the price of our common stock to fall.
As of
December 31, 2017
, there were
135,244,379
shares of our common stock outstanding. Approximately
45.8%
and
24.3%
of our outstanding common stock is held by affiliates of CCMP and by INEOS, respectively.
Each of our officers and directors and certain holders of our common stock entered into a lock-up agreement with Morgan Stanley & Co. LLC and Goldman Sachs & Co. LLC, as representatives of the underwriters of our initial public offering, which regulates their sales of our common stock for a period of 180 days after the date of the final prospectus for our initial public offering, subject to certain exceptions. Morgan Stanley & Co. LLC and Goldman Sachs & Co. LLC may, in their sole discretion, release all or some portion of the shares subject to lock-up agreements at any time and for any reason.
Sales of substantial amounts of our common stock in the public market, the perception that such sales will occur, or early release of these lock-up agreements could adversely affect the market price of our common stock and make it difficult for us to raise funds through securities offerings in the future. Approximately 104,051,633 shares will become eligible for sale upon expiration of the lock-up period on March 28, 2018, subject to the provisions of Rule 144 and Rule 701.
Upon expiration of the lock-up period on March 28, 2018, subject to certain exceptions, investment funds affiliated with CCMP may require us to register shares of our common stock held by them for resale under the federal securities laws, subject to reduction upon the request of the underwriter of the offering, if any. Registration of those shares would allow the investment funds affiliated with CCMP to immediately resell their shares in the public market. Any such sales or anticipation thereof could cause the market price of our common stock to decline.
In addition, we have registered shares of our common stock that are reserved for issuance under our 2016 Stock Incentive Plan and 2017 Omnibus Incentive Plan.
Provisions in our charter documents and Delaware law may deter takeover efforts that may be beneficial to stockholder value.
In addition to investment funds affiliated with CCMP’s and INEOS’s beneficial ownership of a substantial percentage of our common stock, provisions in our certificate of incorporation and bylaws and Delaware law could make it harder for a third party to acquire us, even if doing so might be beneficial to our stockholders. These provisions include a classified board of directors and the ability of our board of directors to issue preferred stock without stockholder approval that could be used to dilute a potential hostile acquiror. Our certificate of incorporation imposes some restrictions on mergers and other business combinations between us and any holder of 15% or more of our outstanding common stock other than INEOS and investment funds affiliated with CCMP. As a result, you may lose your ability to sell your stock for a price in excess of the prevailing market price due to these protective measures, and efforts by stockholders to change the direction or management of the company may be unsuccessful.
Our certificate of incorporation designates courts in the State of Delaware as the sole and exclusive forum for certain types of actions and proceedings that may be initiated by our stockholders, which could limit our stockholders’ ability to obtain a favorable judicial forum for disputes with us or our directors, officers or employees.
Our certificate of incorporation provides that, subject to limited exceptions, the Court of Chancery of the State of Delaware is the sole and exclusive forum for:
|
•
|
any derivative action or proceeding brought on our behalf;
|
|
•
|
any action asserting a claim of breach of a fiduciary duty owed by any of our directors, officers or other employees to us or our stockholders;
|
|
•
|
any action asserting a claim against us arising pursuant to any provision of the General Corporation Law of the State of Delaware, our certificate of incorporation or our bylaws;
|
|
•
|
any action to interpret, apply, enforce or determine the validity of our certificate of incorporation or bylaws; or
|
|
•
|
|
|
•
|
any other action asserting a claim against us that is governed by the internal affairs doctrine (each, a “Covered Proceeding”).
|
In addition, our certificate of incorporation provides that if any action the subject matter of which is a Covered Proceeding is filed in a court other than the specified Delaware courts without the approval of our board of directors (each, a “Foreign Action”), the claiming party will be deemed to have consented to (i) the personal jurisdiction of the specified Delaware courts in connection with any action brought in any such courts to enforce the exclusive forum provision described above and (ii) having service of process made upon such claiming party in any such enforcement action by service upon such claiming party’s counsel in the Foreign Action as agent for such claiming party.
39
Any person or entity purchasing or otherwise acquiring any interest in shares of our capital stock shall be deemed to have notice of and to have consented to these provisions. These provisions may limit a stockholder’s ability to bring a claim in a judicial forum that it finds favorable for disputes with us or our directors, officers or other employees, which may discourage such lawsuits against us and our directors, officers and employees. Alternatively, if a court were to find these provisions of our certificate of incorporation inapplicable to, or unenforceable in respect of, one or more of the specified types of actions or proceedings, we may incur additional costs associated with resolving such matters in other jurisdictions, which could adversely affect our business and financial condition.
Our certificate of incorporation contains a provision renouncing our interest and expectancy in certain corporate opportunities, which could adversely impact our business.
Each of CCMP and INEOS, and the members of our board of directors who are affiliated with CCMP and INEOS, by the terms of our certificate of incorporation, are not required to offer us any corporate opportunity of which they become aware and can take any such corporate opportunity for themselves or offer it to other companies in which they have an investment. We, by the terms of our certificate of incorporation, expressly renounce any interest or expectancy in any such corporate opportunity to the extent permitted under applicable law, even if the opportunity is one that we or our subsidiaries might reasonably have pursued or had the ability or desire to pursue if granted the opportunity to do so. Our certificate of incorporation may not be amended to eliminate our renunciation of any such corporate opportunity arising prior to the date of any such amendment.
CCMP and INEOS are in the business of making investments in companies and may from time to time acquire and hold interests in businesses that compete directly or indirectly with us. These potential conflicts of interest could have a material adverse effect on our business, financial condition, results of operations or prospects if CCMP or INEOS allocate attractive corporate opportunities to themselves or their affiliates instead of to us.
As a public company, we are subject to additional laws, regulations and stock exchange listing standards, which may impose additional costs on us and may strain our resources and divert our management’s attention.
As a public company, we are subject to the reporting requirements of the Securities Exchange Act of 1934, as amended (the “Exchange Act”), the Sarbanes-Oxley Act, the Dodd-Frank Wall Street Reform and Consumer Protection Act of 2010, the listing requirements of the New York Stock Exchange and other applicable securities laws and regulations. Compliance with these laws and regulations may increase our legal and financial compliance costs and make some activities more difficult, time-consuming or costly, which may strain our resources or divert management’s attention.
Regulations related to conflict minerals could adversely impact our business.
The Dodd-Frank Wall Street Reform and Consumer Protection Act of 2010 contains provisions to improve transparency and accountability concerning the supply of certain minerals, known as conflict minerals, originating from the Democratic Republic of Congo (the “DRC”) and adjoining countries. The SEC requires annual disclosure and reporting requirements for those companies who use conflict minerals mined from the DRC and adjoining countries in their products. These reporting requirements, first applicable to us in 2019, will require us to conduct due diligence to comply with such requirements. There will be costs associated with complying with these disclosure requirements, including for diligence to determine the sources of conflict minerals used in our products and other potential changes to products, processes or sources of supply as a consequence of such verification activities. These rules could adversely affect the sourcing, supply and pricing of materials used in our products. As there may be only a limited number of suppliers offering “conflict free” conflict minerals, we cannot be sure that we will be able to obtain necessary conflict minerals from such suppliers in sufficient quantities or at competitive prices.
Because we have no current plans to pay cash dividends on our common stock for the foreseeable future, you may not receive any return on investment unless you sell your common stock for a price greater than that which you paid for it.
We may retain future earnings, if any, for future operations, expansion and debt repayment and have no current plans to pay any cash dividends for the foreseeable future. Any decision to declare and pay dividends in the future will be made at the discretion of our board of directors and will depend on, among other things, our results of operations, financial condition, cash requirements, contractual restrictions and other factors that our board of directors may deem relevant. In addition, our ability to pay dividends may be limited by covenants of any existing and future outstanding indebtedness we or our subsidiaries incur, including our credit facilities and outstanding notes. See “-Because our operations are conducted through our subsidiaries and joint ventures, we are dependent on the receipt of distributions and dividends or other payments from our subsidiaries and joint ventures for cash to fund our operations and expenses, including to make future dividend payments, if any.” As a result, you may not receive any return on an investment in our common stock unless you sell your common stock for a price greater than that which you paid for it.
40
|
ITEM 1B.
|
UNRESOLVED STAFF COMMENTS.
|
None.
|
ITEM 2.
|
PROPERTIES.
|
Our operating headquarters are located in Malvern, Pennsylvania. As of
December 31, 2017
, we had
72
manufacturing facilities in
19
countries on six continents. We also had
15
administrative facilities and six research and development facilities located in
13
countries. Our joint ventures operated out of seven facilities located in six countries, including six manufacturing facilities. We also own or lease other properties, including office buildings, warehouses, testing facilities and sales offices.
The table below presents summary information regarding our principal facilities as of
December 31, 2017
.
|
Location
|
Approximate
Square Feet |
Owned or leased
|
PM&C
|
EC&S
|
|||||
|
Administrative facilities:
|
|
|
|
|
|||||
|
Amersfoort, Netherlands
|
7,481
|
|
Leased
|
X
|
|
||||
|
Lenexa, Kansas, United States
|
14,489
|
|
Leased
|
X
|
|
||||
|
Malvern, Pennsylvania, United States
|
33,000
|
|
Leased
|
X
|
X
|
||||
|
Research and development facilities:
|
|
|
|
|
|
||||
|
Toronto, Canada
|
2,500
|
|
Leased
|
X
|
|
||||
|
St. Pourcain-sur-Sioule, France
|
30,916
|
|
Owned
|
X
|
|
||||
|
Eijsden, Netherlands
|
4,306
|
|
Owned
|
X
|
|
||||
|
Warrington, United Kingdom
|
14,155
|
|
Owned
|
X
|
X
|
||||
|
Conshohocken, Pennsylvania, United States
|
74,968
|
|
Owned
|
X
|
X
|
||||
|
Manufacturing facilities:
|
|
|
|
|
|
||||
|
Melbourne-Dandenong, Australia
|
48,378
|
|
Owned
|
X
|
|
||||
|
Jacana, Brazil
|
43,753
|
|
Owned
|
X
|
|
||||
|
Rio Claro, Brazil
|
193,750
|
|
Owned
|
X
|
X
|
||||
|
Toronto, Canada
|
75,471
|
|
Owned
|
X
|
|
||||
|
Valleyfield, Canada
|
46,000
|
|
Owned
|
X
|
|
||||
|
Lamotte, France
|
130,567
|
|
Leased
|
X
|
|
||||
|
Wurzen, Germany
|
124,915
|
|
Owned
|
X
|
|
||||
|
Pasuruan, Indonesia
|
68,489
|
|
Owned
|
X
|
X
|
||||
|
Guadalajara, Mexico
|
105,866
|
|
Owned
|
X
|
|
||||
|
Tlalnepantla, Mexico
|
136,209
|
|
Owned
|
X
|
|
||||
|
Eijsden, Netherlands
|
165,850
|
|
Owned/Leased
(1)
|
X
|
|
||||
|
Maastricht, Netherlands
|
70,073
|
|
Leased
|
X
|
|
||||
|
Winschoten, Netherlands
|
134,548
|
|
Leased
|
X
|
|
||||
|
Delfzijl, Netherlands
|
38,373
|
|
Leased
(2)
|
|
X
|
||||
|
Bangkok, Thailand
|
12,056
|
|
Owned
|
X
|
|
||||
|
Warrington, United Kingdom
|
371,063
|
|
Owned
|
X
|
X
|
||||
|
Augusta, Georgia, United States (Plant 102/104)
|
65,178
|
|
Owned
|
X
|
|
||||
|
Augusta, Georgia, United States (Plant 500)
|
121,502
|
|
Leased
|
X
|
|
||||
|
Baltimore, Maryland, United States
|
19,852
|
|
Owned
|
X
|
|
||||
|
Baton Rouge, Louisiana, United States
|
13,503,600
|
|
Owned
|
|
X
|
||||
|
Baytown, Texas, United States
|
348,480
|
|
Owned
|
|
X
|
||||
|
Brownwood, Texas, United States
|
107,900
|
|
Owned
|
X
|
|
||||
|
Chester, Pennsylvania, United States
|
172,707
|
|
Owned
|
X
|
|
||||
|
Dominguez, California, United States
|
1,437,480
|
|
Owned
|
|
X
|
||||
|
Gurnee, Illinois, United States
|
96,000
|
|
Owned
|
X
|
|
||||
41
|
Jeffersonville, Indiana, United States
|
29,052
|
|
Owned
|
X
|
|
||||
|
Joliet, Illinois, United States
|
168,657
|
|
Owned
|
X
|
|
||||
|
Hammond, Indiana, United States
|
1,132,560
|
|
Owned
|
|
X
|
||||
|
Houston, Texas, United States
|
2,003,760
|
|
Owned
|
|
X
|
||||
|
Kansas City, Kansas, United States
|
220,679
|
|
Owned
(3)
|
|
X
|
||||
|
Martinez, California, United States
|
5,096,520
|
|
Owned
|
|
X
|
||||
|
Muscatine, Iowa, United States
|
105,072
|
|
Owned
|
X
|
|
||||
|
Rahway, New Jersey, United States
|
124,035
|
|
Owned
|
X
|
|
||||
|
Paris, Texas, United States
|
147,158
|
|
Owned
|
X
|
|
||||
|
Pineville, Louisiana, United States
|
14,522
|
|
Owned
|
X
|
|
||||
|
Portland, Oregon, United States
|
1,176,120
|
|
Owned
|
|
X
|
||||
|
Potsdam, New York, United States
|
88,798
|
|
Owned
|
X
|
|
||||
|
South Gate, California, United States
|
71,632
|
|
Owned
|
X
|
|
||||
|
St. Louis, Missouri, United States
|
44,034
|
|
Owned
|
X
|
|
||||
|
(1)
|
Approximately 89,911 square feet is owned and approximately 75,939 square feet is leased.
|
|
(2)
|
The facility is used by our Zeolyst Joint Venture under a ground lease that we entered into with a third party.
|
|
(3)
|
We lease a portion of the site to our Zeolyst Joint Venture.
|
|
ITEM 3.
|
LEGAL PROCEEDINGS.
|
From time to time we may be subject to various legal claims and proceedings incidental to the normal conduct of business, relating to such matters as personal injury, product liability and warranty claims, waste disposal practices, release of chemicals into the environment and other matters that may arise in the ordinary course of our business. We currently believe that there is no litigation pending that is likely to have a material adverse effect on our business. Regardless of the outcome, legal proceedings can have an adverse impact on us because of defense and settlement costs, diversion of management resources and other factors.
|
ITEM 4.
|
MINE SAFETY DISCLOSURES.
|
Not applicable.
42
|
ITEM 5.
|
MARKET FOR REGISTRANT’S COMMON EQUITY, RELATED STOCKHOLDER MATTERS AND ISSUER PURCHASES OF EQUITY SECURITIES.
|
Market Information, Holders and Dividends
Our common stock began trading on the New York Stock Exchange (“NYSE”) under the symbol “PQG” on September 29, 2017. The following table sets forth on a per share basis the high and low sales prices of our common stock for the periods indicated as reported on the NYSE composite transactions reporting system.
|
Common Stock Price Range
|
||||||||
|
High
|
Low
|
|||||||
|
2017
|
||||||||
|
Third Quarter (from September 29, 2017)
|
$
|
17.44
|
|
$
|
16.50
|
|
||
|
Fourth Quarter
|
$
|
17.65
|
|
$
|
14.65
|
|
||
As of
March 19, 2018
, there were
138
shareholders of record of our common stock. A substantially greater number of holders of our common stock hold their shares in “street name” through banks, brokers and other financial institutions.
We have not and do not currently intend to pay regular dividends on our common stock in the foreseeable future. The declaration and payment of any future dividends by our Board of Directors is subject to compliance with the covenants contained in the agreements governing our credit facilities, the indentures governing our outstanding notes, applicable law and other considerations. See “Management’s Discussion and Analysis of Financial Condition and Results of Operations—Financial Condition, Liquidity and Capital Resources—Debt” for details regarding covenant restrictions on the payment of dividends under our debt agreements.
Stock Performance Graph
The graph below shows the cumulative total shareholder return of our common stock for the period from September 29, 2017 to December 31, 2017 as compared to the cumulative total return of the Russell 2000 Total Return Index and the S&P 1500 Specialty Chemicals Index, assuming an investment of $100 made at the respective closing prices on September 29, 2017. The information contained in the graph below is furnished and therefore not to be considered “filed” with the SEC, and is not incorporated by reference into any document that incorporates this Annual Report on Form 10-K by reference.
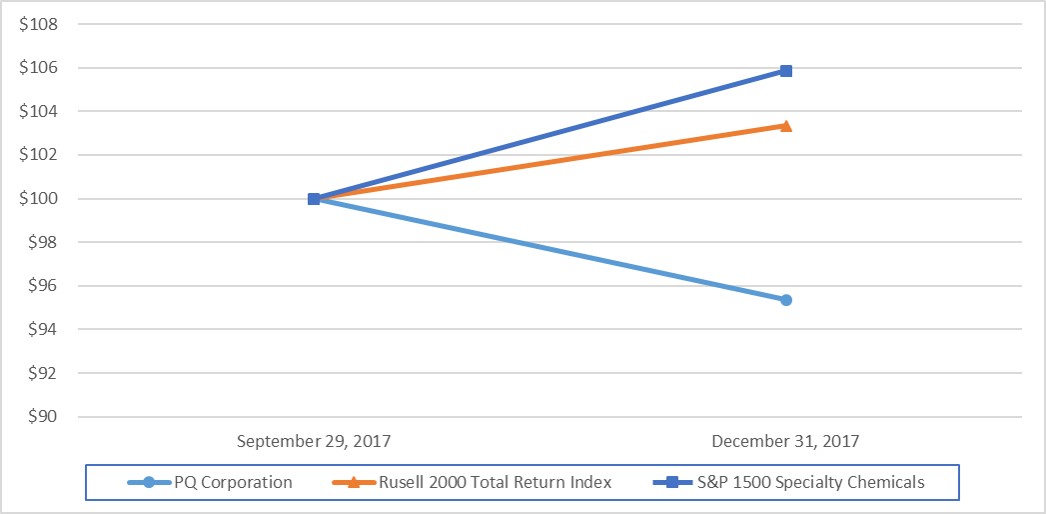
43
Recent Sale of Unregistered Securities
From January 1, 2017 through August 31, 2017, and after giving effect to the reclassification of our Class A common stock into common stock, the 8.8275-for-1 split of our common stock and the automatic conversion of our Class B common stock into shares of our common stock in connection with our initial public offering, we issued (1) an aggregate of 30,840 shares of our common stock subject to vesting conditions under the PQ Group Holdings Inc. Stock Incentive Plan and (2) options to purchase approximately 436,387 shares of our common stock at a weighted average exercise price of approximately $8.97 per share under the PQ Group Holdings Inc. Stock Incentive Plan. These securities were issued without registration in reliance on the exemptions afforded by Section 4(a)(2) of the Securities Act and Rules 506 and 701 promulgated thereunder.
Use of Proceeds from Initial Public Offering of Common Stock
On September 28, 2017, our Registration Statement on Form S-1, as amended (File No. 333-218650), relating to our initial public offering of 29,000,000 shares of common stock was declared effective by the SEC. On October 3, 2017, we closed the sale of 29,000,000 shares of our common stock at a price of $17.50. Morgan Stanley & Co. LLC, Goldman Sachs & Co. LLC, Citigroup Global Markets Inc. and Credit Suisse Securities (USA) LLC served as joint book-running managers of the offering. The offering commenced on September 28, 2017 and closed on October 3, 2017.
We raised a total of
$507.5 million
in gross proceeds in the initial public offering, or approximately
$480.7 million
in net proceeds after deducting underwriting discounts and commissions of
$24.1 million
and
$2.7 million
of offering-related expenses, net of reimbursements. On October 3, 2017, all of the net proceeds from the offering were used to redeem $446.2 million in aggregate principal amount of PQ Corporation’s Floating Rate Senior Unsecured Notes due 2022 (the “Floating Rate Senior Unsecured Notes”), together with accrued and unpaid interest, and applicable redemption premiums. Andrew Currie, a member of our board of directors, held $4.0 million in principal amount of the Floating Rate Senior Unsecured Notes, and, as a result, received a portion of the net proceeds from the initial public offering.
44
|
ITEM 6.
|
SELECTED FINANCIAL DATA.
|
Selected financial data for the Company is presented in the following table and should be read in conjunction with “Management’s Discussion and Analysis of Financial Condition and Results of Operations” included in Item 7 and our consolidated financial statements and related notes thereto included in this Annual Report on Form 10-K. Selected financial data has been derived from our audited consolidated financial statements. Historical results are not necessarily indicative of the results to be expected for future periods.
Legacy Eco operated as a business unit of Solvay until the acquisition of substantially all of the assets of Solvay’s Eco Services business unit by Eco on December 1, 2014, and therefore, the financial statements of legacy Eco contained in this 10-K for periods prior to such acquisition are not necessarily indicative of what legacy Eco’s financial position, results of operations and cash flows would have been had legacy Eco operated as a separate, standalone entity independent of Solvay. Accordingly, references to “Predecessor” include each of the periods from January 1, 2013 to November 30, 2014. For 2014, the results include 11 months of legacy Eco operating activity (January 1, 2014 to November 30, 2014) and include amounts that have been “carved out” from Solvay’s financial statements using assumptions and allocations made by Solvay to reflect Solvay’s Eco Services business unit on a stand-alone basis. References to “Successor” refer to the period from inception of Eco (July 30, 2014) to December 31, 2014, but only include one month of legacy Eco operating activity (December 1, 2014 to December 31, 2014), because there was no operating activity for the period from inception (July 30, 2014) to November 30, 2014, and reflects legacy Eco on a stand-alone basis.
In addition to the analysis of historical results of operations, we have prepared unaudited supplemental pro forma results of operations for the years ended
December 31, 2016
and
2015
. The unaudited pro forma statements of operations reflect pro forma adjustments to the results of PQ Group Holdings to give effect to the Business Combination and the related financing transactions as if they had occurred on January 1, 2015. The unaudited pro forma adjustments include:
|
•
|
elimination of intercompany sales between legacy PQ and legacy Eco;
|
|
•
|
adjustments to depreciation expense related to the step-up in fair value of property, plant and equipment;
|
|
•
|
adjustments to amortization expense related to the step-up in fair value of definite-lived intangible assets;
|
|
•
|
removal of non-recurring adjustments related to the step-up in the fair value of inventory;
|
|
•
|
adjustments to stock compensation expense to reflect charges as they relate to our new capital structure;
|
|
•
|
adjustments related to the amortization of the step-up in fair value of property, plant, equipment and definite-lived intangible assets related to our Zeolyst Joint Venture;
|
|
•
|
adjustments to interest expense related to the senior secured term loan facility;
|
|
•
|
adjustments related to the write-off of existing deferred financing fees, original issue discounts and prepayment penalties; and
|
|
•
|
the tax effect of the aforementioned adjustments, including the effect related to the change in tax status of Eco from a limited liability company to a C-corporation.
|
The unaudited pro forma statements of operations have been prepared in accordance with Article 11 of Regulation S-X by combining the historical results of operations of legacy Eco and legacy PQ for the periods prior to May 4, 2016 and should be read in conjunction with our historical consolidated financial statements and related notes thereto included elsewhere in this Form 10-K.
The unaudited pro forma statements of operations have been prepared for illustrative purposes only and are not necessarily indicative of the combined results of operations that would have been realized had the pro forma transactions been completed as of the dates indicated, nor are they meant to be indicative of any anticipated future results of operations. The unaudited pro forma adjustments are based upon available information and assumptions we believe are factually supportable, directly attributable to the Business Combination and the related financing transactions, and with respect to the statement of operations, expected to have a continuing impact on our business, and that we believe are reasonable under the circumstances. In addition, the unaudited pro forma statements of operations do not include any pro forma adjustments to reflect expected cost savings or restructuring actions which may be achievable or the impact of any non-recurring activity and transaction-related costs.
We believe that the unaudited pro forma statements of operations are a useful presentation of our results of operations as they provide comparative information, period-over-period, on a more comparable basis.
45
|
Successor
|
Predecessor
|
||||||||||||||||||||||||||||||||
|
Period
|
|||||||||||||||||||||||||||||||||
|
from
inception
|
Period from
|
||||||||||||||||||||||||||||||||
|
Historical
|
Pro Forma
|
(July 30, 2014) to
|
January 1, 2014 to
|
Year Ended
|
|||||||||||||||||||||||||||||
|
Years Ended
December 31,
|
Years Ended
December 31,
|
December 31,
|
November 30,
|
December 31,
|
|||||||||||||||||||||||||||||
|
2017
|
2016
|
2015
|
2016
|
2015
|
2014
|
2014
|
2013
|
||||||||||||||||||||||||||
|
(In thousands, except per share data)
|
(unaudited)
|
||||||||||||||||||||||||||||||||
|
Operating Results:
|
|||||||||||||||||||||||||||||||||
|
Sales
|
$
|
1,472,101
|
|
$
|
1,064,177
|
|
$
|
388,875
|
|
1,403,041
|
|
1,413,201
|
|
$
|
35,539
|
|
$
|
361,823
|
|
$
|
390,834
|
|
|||||||||||
|
Cost of goods sold
|
1,095,265
|
|
810,085
|
|
278,791
|
|
1,037,109
|
|
1,048,739
|
|
30,160
|
|
265,829
|
|
286,371
|
|
|||||||||||||||||
|
Gross profit
|
376,836
|
|
254,092
|
|
110,084
|
|
365,932
|
|
364,462
|
|
5,379
|
|
95,994
|
|
104,463
|
|
|||||||||||||||||
|
Selling, general and administrative expenses
|
145,107
|
|
107,601
|
|
34,613
|
|
145,041
|
|
140,891
|
|
2,623
|
|
45,168
|
|
46,871
|
|
|||||||||||||||||
|
Other operating expenses, net
|
64,225
|
|
62,301
|
|
19,696
|
|
74,972
|
|
67,666
|
|
16,347
|
|
5,593
|
|
—
|
|
|||||||||||||||||
|
Operating income (loss)
|
167,504
|
|
84,190
|
|
55,775
|
|
145,919
|
|
155,905
|
|
(13,591
|
)
|
45,233
|
|
57,592
|
|
|||||||||||||||||
|
Equity in net income (loss) from affiliated companies
|
38,772
|
|
(2,612
|
)
|
—
|
|
35,210
|
|
41,078
|
|
—
|
|
—
|
|
—
|
|
|||||||||||||||||
|
Interest expense, net
|
179,044
|
|
140,315
|
|
44,348
|
|
187,945
|
|
199,614
|
|
8,470
|
|
86
|
|
122
|
|
|||||||||||||||||
|
Debt extinguishment costs
|
61,886
|
|
13,782
|
|
—
|
|
1,793
|
|
—
|
|
—
|
|
—
|
|
—
|
|
|||||||||||||||||
|
Other (income) expense, net
|
25,980
|
|
(3,402
|
)
|
—
|
|
(8,869
|
)
|
21,383
|
|
—
|
|
—
|
|
(3,266
|
)
|
|||||||||||||||||
|
Income (loss) before income taxes and noncontrolling interest
|
(60,634
|
)
|
(69,117
|
)
|
11,427
|
|
260
|
|
(24,014
|
)
|
(22,061
|
)
|
45,147
|
|
60,736
|
|
|||||||||||||||||
|
(Benefit) provision for income taxes
|
(119,197
|
)
|
10,041
|
|
—
|
|
57,967
|
|
1,157
|
|
—
|
|
14,602
|
|
21,445
|
|
|||||||||||||||||
|
Net (loss) income
|
58,563
|
|
(79,158
|
)
|
11,427
|
|
(57,707
|
)
|
(25,171
|
)
|
(22,061
|
)
|
30,545
|
|
39,291
|
|
|||||||||||||||||
|
Less: Net income attributable to the noncontrolling interest
|
960
|
|
588
|
|
—
|
|
1,225
|
|
1,771
|
|
—
|
|
—
|
|
—
|
|
|||||||||||||||||
|
Net (loss) income attributable to PQ Group Holdings Inc.
|
$
|
57,603
|
|
$
|
(79,746
|
)
|
$
|
11,427
|
|
$
|
(58,932
|
)
|
$
|
(26,942
|
)
|
$
|
(22,061
|
)
|
$
|
30,545
|
|
$
|
39,291
|
|
|||||||||
|
Net income (loss) per share:
|
|||||||||||||||||||||||||||||||||
|
Basic income (loss) per share
|
$
|
0.52
|
|
$
|
(1.02
|
)
|
$
|
0.51
|
|
$
|
—
|
|
$
|
—
|
|
$
|
(0.99
|
)
|
$
|
—
|
|
$
|
—
|
|
|||||||||
|
Diluted income (loss) per share
|
$
|
0.52
|
|
$
|
(1.02
|
)
|
$
|
0.51
|
|
$
|
—
|
|
$
|
—
|
|
$
|
(0.99
|
)
|
$
|
—
|
|
$
|
—
|
|
|||||||||
|
Weighted average shares outstanding:
|
|||||||||||||||||||||||||||||||||
|
Basic
|
111,299,670
|
|
78,016,005
|
|
22,615,787
|
|
—
|
|
—
|
|
22,390,231
|
|
—
|
|
—
|
|
|||||||||||||||||
|
Diluted
|
111,669,037
|
|
78,016,005
|
|
22,615,787
|
|
—
|
|
—
|
|
22,390,231
|
|
—
|
|
—
|
|
|||||||||||||||||
During the year ended December 31, 2013 and the period from January 1, 2014 to November 30, 2014, Solvay’s Eco business unit did not have an independent capital structure. Because of the absence of an independent capital structure during this time, there was no earnings per share calculation for the Predecessor Period.
46
|
Successor
|
Predecessor
|
||||||||||||||||||||||||
|
Period from
|
|||||||||||||||||||||||||
|
inception
|
Period from
|
||||||||||||||||||||||||
|
(July 30, 2014) to
|
January 1, 2014 to
|
Year Ended
|
|||||||||||||||||||||||
|
Years Ended December 31,
|
December 31,
|
November 30,
|
December 31,
|
||||||||||||||||||||||
|
(In thousands)
|
2017
|
2016
|
2015
|
2014
|
2014
|
2013
|
|||||||||||||||||||
|
Financial Position and Other Data:
|
|||||||||||||||||||||||||
|
Cash and cash equivalents
|
$
|
66,195
|
|
$
|
70,742
|
|
$
|
25,155
|
|
$
|
22,627
|
|
$
|
—
|
|
$
|
—
|
|
|||||||
|
Property, plant and equipment, net
|
1,230,384
|
|
1,181,388
|
|
481,073
|
|
472,156
|
|
—
|
|
345,041
|
|
|||||||||||||
|
Total assets
|
4,415,455
|
|
4,259,671
|
|
1,007,636
|
|
1,025,094
|
|
—
|
|
742,046
|
|
|||||||||||||
|
Total debt, including current portion
|
2,230,486
|
|
2,562,198
|
|
673,101
|
|
675,254
|
|
—
|
|
—
|
|
|||||||||||||
|
Total stockholders' equity
|
1,631,919
|
|
1,027,944
|
|
235,293
|
|
217,824
|
|
—
|
|
540,215
|
|
|||||||||||||
|
Cash flows data:
|
|||||||||||||||||||||||||
|
Net cash provided by (used in):
|
|||||||||||||||||||||||||
|
Operating activities
|
$
|
116,062
|
|
$
|
119,720
|
|
$
|
44,715
|
|
$
|
(2,057
|
)
|
$
|
57,593
|
|
$
|
84,448
|
|
|||||||
|
Investing activities
|
(182,695
|
)
|
(1,929,680
|
)
|
(38,725
|
)
|
(888,347
|
)
|
(32,852
|
)
|
(41,703
|
)
|
|||||||||||||
|
Financing activities
|
68,944
|
|
1,861,433
|
|
(3,462
|
)
|
913,031
|
|
(24,741
|
)
|
(42,745
|
)
|
|||||||||||||
47
|
ITEM 7.
|
MANAGEMENT’S DISCUSSION AND ANALYSIS OF FINANCIAL CONDITION AND RESULTS OF OPERATIONS.
|
Overview
We are a global provider of catalysts, specialty materials and chemicals, and services with leading supply positions across our portfolio. We compete in the global specialty chemicals and materials industry where we seek to focus on attractive, high-growth applications. Our products and services provide critical performance to our customers’ products and we are able to offer many of our customers regionally sourced materials to reduce costs and improve delivery logistics. We provide our customers with a combination of product technology and applications knowledge, global supply chain capabilities, and local production and logistical support.
We conduct operations through two reporting segments: (1) Environmental Catalysts and Services, and (2) Performance Materials and Chemicals.
Our Environmental Catalysts and Services business is a leading global innovator and producer of catalysts for the refinery, emission control, and petrochemical industries and is also a leading provider of catalyst recycling services to the North American refining industry. We believe our products are critical for our customers in these growing applications and impart essential functionality in chemical and refining production processes and in emission control for engines.
Our Environmental Catalysts and Services business consists of three product groups: silica catalysts, zeolite catalysts, and refining services.
Our Performance Materials and Chemicals business is a silicates and specialty materials producer with leading supply positions for the majority of our products sold in North America, Europe, South America, Australia and Asia (excluding China) serving diverse and growing end uses such as personal and industrial cleaning products, fuel efficient tires (“green tires”), surface coatings, and food and beverage. Our products are essential additives, ingredients, and precursors that are critical to the performance characteristics of our customers’ products, yet typically represent only a small portion of our customers’ overall end-product costs.
Our Performance Materials and Chemicals business consists of two product groups: performance chemicals and performance materials.
In
2017
, we served over
4,000
customers globally across many end uses and, as of
December 31, 2017
, operated out of
72
manufacturing facilities, which are strategically located across
six
continents.
Basis of Presentation
In accordance with GAAP, legacy Eco was the accounting acquirer in the Business Combination and, as such, legacy Eco is treated as our predecessor. Investment funds affiliated with CCMP held a controlling interest in legacy Eco and a non-controlling interest in legacy PQ prior to the Business Combination.
The following table summarizes, for each of the periods specified below and for which financial information is included for PQ Group Holdings in this Form 10-K, the portion, if any, of the financial results of legacy PQ and legacy Eco that is included in the financial results for such periods presented in accordance with GAAP.
|
Years ended
December 31, |
||||||
|
2017
|
2016
|
2015
|
||||
|
Operations of legacy Eco
|
Included
|
Included
|
Included
|
|||
|
Operations of legacy PQ
|
Included
|
Partially included (May 4 to December 31)
|
Not included
|
|||
Our zeolite catalysts product group operates through our Zeolyst Joint Venture, which we account for as an equity method investment in accordance with GAAP. We do not record sales by our Zeolyst Joint Venture as revenue and such sales are not consolidated within our results of operations. However, Adjusted EBITDA reflects our share of the earnings of our Zeolyst Joint Venture that have been recorded as equity in net income from affiliated companies in our consolidated statements of operations and includes Zeolyst Joint Venture adjustments on a proportionate basis based on our 50% ownership interest.
Key Performance Indicators
Adjusted EBITDA and Adjusted Net Income
Adjusted EBITDA and adjusted net income are non-GAAP financial measures that we use to evaluate our operating performance, for business planning purposes and to measure our performance relative to that of our competitors. Adjusted EBITDA and adjusted net income are presented as key performance indicators as we believe these financial measures will enhance a prospective investor’s understanding of our results of operations and financial condition. EBITDA consists of net income (loss) attributable to PQ Group Holdings before interest, taxes, depreciation and amortization. Adjusted EBITDA consists of EBITDA adjusted for (i) non-operating income or expense, (ii) the impact of certain non-cash, nonrecurring or other items included in net income (loss) and EBITDA that we do not consider indicative of our ongoing operating performance, and (iii) depreciation, amortization and interest of our 50% share of the Zeolyst Joint
48
Venture. Adjusted net income consists of net income (loss) attributable to PQ Group Holdings adjusted for (i) non-operating income or expense and (ii) the impact of certain non-cash, nonrecurring or other items included in net income (loss) that we do not consider indicative of our ongoing operating performance. We believe that these non-GAAP financial measures provide investors with useful financial metrics to assess our operating performance from period-to-period by excluding certain items that we believe are not representative of our core business.
You should not consider adjusted EBITDA and adjusted net income in isolation or as alternatives to the presentation of our financial results in accordance with GAAP. The presentation of our adjusted EBITDA and adjusted net income financial measures may differ from similar measures reported by other companies and may not be comparable to other similarly titled measures. In evaluating adjusted EBITDA and adjusted net income, you should be aware that we are likely to incur expenses similar to those eliminated in this presentation in the future and that certain of these items could be considered recurring in nature. Our presentation of adjusted EBITDA and adjusted net income should not be construed as an inference that our future results will be unaffected by unusual or nonrecurring items. Reconciliations of adjusted EBITDA and adjusted net income to GAAP net income (loss) are included in the results of operations discussion that follows for each of the respective periods.
Key Factors and Trends Affecting Operating Results and Financial Condition
Sales
Our Environmental Catalysts and Services sales have grown primarily due to expansion into new end applications, including emission control catalysts, polymer catalysts, and refining catalysts, as well as continued supply share gains. Sales in our Environmental Catalysts and Services segment are made on both a purchase order basis and pursuant to long-term contracts.
Expansions into new applications, including personal care and consumer cleaning, as well as share gains in existing end uses, have added to our sales growth. Historically, our Performance Materials and Chemicals business has experienced relatively stable demand both seasonally and throughout economic cycles, due to the diverse consumer and industrial end uses that our products serve. Product sales from our performance chemicals product group are made on both a purchase order basis and pursuant to long-term contracts. In the performance materials product group, sales have been driven by the growth of spending on repair, maintenance and upgrade of existing highways and the construction of new highways and roads by governments around the world. Product sales in our performance materials product group are made principally on a purchase order basis. There may be modest fluctuations in timing of orders, but orders are mainly driven by demand and general economic conditions.
Cost of Goods Sold
Cost of goods sold consists of variable product costs, fixed manufacturing expenses, depreciation expense and freight expenses. Variable product costs include all raw materials, energy and packaging costs that are directly related to the manufacturing process. Fixed manufacturing expenses include all plant employment costs, manufacturing overhead and periodic maintenance costs. The primary raw materials used in the manufacture of products in our Performance Materials and Chemicals business include soda ash, industrial sand, aluminum trihydrate, sodium hydroxide, and cullet. For the year ended
December 31, 2017
approximately
42%
of sales with our largest sodium silicate customers in North America were made under contracts that include price adjustments for changes in the price of raw materials and natural gas. Under these contracts, there generally is a time lag of three to nine months for price changes to pass through, depending on the magnitude of the change in cost and other market dynamics. The primary raw materials for our Environmental Catalysts and Services business include spent sulfuric acid, sulfur, sodium silicates, acids, bases, and certain metals. Most of our refining services contracts feature take-or-pay volume protection and/or quarterly price adjustments for commodity inputs, labor, the Chemical Engineering Index (U.S. chemical plant construction cost index) and natural gas. Over
87%
of our refining services product group sales for the year ended
December 31, 2017
were under contracts featuring quarterly price adjustments. The price adjustments generally reflect actual costs for producing acid and tend to protect us from volatility in labor, fixed costs and raw material pricing. Freight expenses are generally passed through directly to customers. Spent acid for our refining services product group is supplied by customers for a nominal charge as part of their contracts. While natural gas is not a direct feedstock for any product, all businesses use natural gas powered furnaces to heat raw materials and create the chemical reactions necessary to produce end-products. We maintain multiple suppliers wherever possible, hedge exposure to fluctuations in prices for natural gas purchases in the United States, make forward purchases of natural gas in the United States, Canada, and Europe to mitigate our exposure to price volatility and structure our customer contracts when possible to allow for the pass-through of raw material and natural gas costs.
Joint Ventures
We account for our investments in our equity joint ventures under the equity method. Our largest joint venture, the Zeolyst Joint Venture, manufactures high performance, specialty, zeolite-based catalysts for use in the emission control industry, the petrochemical industry and other areas of the broader chemicals industry. We share proportionally in the management of our joint ventures with the other parties to each such joint venture.
49
Industry
We compete in the specialty chemicals and materials industry. Our industry is characterized by constant development of new products and the need to support customers with new product innovation and technical services to meet their challenges. In addition, products must maintain consistent quality and be a reliable source of supply in order to meet the needs of customers. In addition, many products in the specialty chemicals and materials industry benefit from economics that favor incumbent producers because the capital cost to expand existing capacity is typically significantly less than the capital cost necessary to build a new plant. Our industry is also characterized by the need to produce consistent quality in a safe and environmentally sustainable manner.
Seasonality
Seasonal changes and weather conditions typically affect
our
performance materials and refining services product groups. In particular,
our
performance materials product group generally experiences lower sales and profit in the first and fourth quarters of the year because highway striping projects typically occur during warmer weather months. Additionally,
our
refining services product group typically experiences similar seasonal fluctuations as a result of higher demand for gasoline products in the summer months. As a result,
our
working capital requirements tend to be higher in the first and fourth quarters of the year, which can adversely affect
our
liquidity and cash flows. Because of this seasonality associated with certain of
our
product groups, results for any one quarter are not necessarily indicative of the results that may be achieved for any other quarter or for the full year.
Inflation
Inflationary pressures may have an adverse effect on us, impacting raw material costs and other operating costs, as well as resulting in higher fixed asset replacement costs. We attempt to manage these impacts with cost control, productivity improvements and contractual arrangements, as well as price increases to customers.
Foreign Currency
As a global business, we are subject to the impact of gains and losses on currency translations, which occur when the financial statements of foreign operations are translated into U.S. dollars. We operate a geographically diverse business with approximately
41%
and
34%
of our sales for the years ended
December 31, 2017
and
2016
, respectively, in currencies other than the U.S. dollar. Because our consolidated financial results are reported in U.S. dollars, sales or earnings generated in currencies other than the U.S. dollar can result in a significant increase or decrease in the amount of those sales and earnings when translated to U.S. dollars. The foreign currencies to which we have the most significant exchange rate exposure include the Euro, British pound, Canadian dollar, Brazilian real and the Mexican peso.
Pro Forma Results of Operations
In addition to the analysis of historical results of operations, we have prepared unaudited supplemental pro forma results of operations for the years ended
December 31, 2016
and
2015
. The unaudited pro forma statements of operations reflect pro forma adjustments to the results of PQ Group Holdings to give effect to the Business Combination and the related financing transactions as if they had occurred on January 1, 2015. The unaudited pro forma adjustments include:
|
•
|
elimination of intercompany sales between legacy PQ and legacy Eco;
|
|
•
|
adjustments to depreciation expense related to the step-up in fair value of property, plant and equipment;
|
|
•
|
adjustments to amortization expense related to the step-up in fair value of definite-lived intangible assets;
|
|
•
|
removal of non-recurring adjustments related to the step-up in the fair value of inventory;
|
|
•
|
adjustments to stock compensation expense to reflect charges as they relate to our new capital structure;
|
|
•
|
adjustments related to the amortization of the step-up in fair value of property, plant, equipment and definite-lived intangible assets related to our Zeolyst Joint Venture;
|
|
•
|
adjustments to interest expense related to the senior secured term loan facility;
|
|
•
|
adjustments related to the write-off of existing deferred financing fees, original issue discounts and prepayment penalties; and
|
|
•
|
the tax effect of the aforementioned adjustments, including the effect related to the change in tax status of Eco from a limited liability company to a C-corporation.
|
The unaudited pro forma statements of operations have been prepared in accordance with Article 11 of Regulation S-X by combining the historical results of operations of legacy Eco and legacy PQ for the periods prior to May 4, 2016 and should be read in conjunction with our historical consolidated financial statements and related notes thereto included elsewhere in this Form 10-K.
50
The unaudited pro forma statements of operations have been prepared for illustrative purposes only and are not necessarily indicative of the combined results of operations that would have been realized had the pro forma transactions been completed as of the dates indicated, nor are they meant to be indicative of any anticipated future results of operations. The unaudited pro forma adjustments are based upon available information and assumptions we believe are factually supportable, directly attributable to the Business Combination and the related financing transactions, and with respect to the statement of operations, expected to have a continuing impact on our business, and that we believe are reasonable under the circumstances. In addition, the unaudited pro forma statements of operations do not include any pro forma adjustments to reflect expected cost savings or restructuring actions which may be achievable or the impact of any non-recurring activity and transaction-related costs.
We believe that the unaudited pro forma statements of operations are a useful presentation of our results of operations as they provide comparative information, period-over-period, on a more comparable basis.
51
Results of Operations
Historical and Pro Forma—Year Ended
December 31, 2017
Compared to the Year Ended
December 31, 2016
(the Pro Forma Discussion Compares the Historical Year Ended
December 31, 2017
to the Pro Forma Year Ended
December 31, 2016
)
Highlights
The following is a summary of our financial performance for the year ended
December 31, 2017
compared with the year ended
December 31, 2016
.
Sales
|
•
|
Historical:
Net sales increased
$407.9 million
to
$1,472.1 million
. The increase in sales was primarily due to the inclusion of
$1,073.8 million
of legacy PQ sales in our results of operations for the year ended
December 31, 2017
as compared to
$690.5 million
of legacy PQ sales included in our results of operations for the period of May 4, 2016 through
December 31, 2016
.
|
|
•
|
Pro Forma:
Net sales increased
$69.1 million
to
$1,472.1 million
. The increase in sales was primarily due to the inclusion of
$26.3 million
of sales related to the Sovitec acquisition, increased volumes and higher average customer prices and favorable mix for the year ended
December 31, 2017
.
|
Gross Profit
|
•
|
Historical:
Gross profit increased
$122.7 million
to
$376.8 million
. Our increase in gross profit was primarily due to the inclusion of
$247.5 million
of legacy PQ gross profit in our results of operations for the year ended
December 31, 2017
as compared to
$142.6 million
of legacy PQ gross profit included in our results of operations for the period of May 4, 2016 through
December 31, 2016
.
|
|
•
|
Pro Forma:
Gross profit increased
$10.9 million
to
$376.8 million
. Our increase in gross profit was primarily due to higher pricing, increased volumes and the earnings contributed by the Sovitec acquisition, which was partially offset by increased depreciation and higher manufacturing costs for the year ended
December 31, 2017
.
|
Operating Income
|
•
|
Historical:
Operating income increased by
$83.3 million
to
$167.5 million
. Our increase in operating income was primarily due to the inclusion of
$71.0 million
of legacy PQ operating income in our results of operations for the year ended
December 31, 2017
as compared to the inclusion of
$18.0 million
of legacy PQ operating income in our results of operations for the period of May 4, 2016 through
December 31, 2016
.
|
|
•
|
Pro forma:
Operating income increased by
$21.6 million
to
$167.5 million
. Our operating income increased due to the Sovitec acquisition, higher margins generated by favorable customer price increases and the result of cost reduction measures for the year ended
December 31, 2017
.
|
Equity in Net Income of Affiliated Companies
|
•
|
Historical:
Equity in net income of affiliated companies for the year ended
December 31, 2017
was
$38.8 million
, compared with a loss of
$2.6 million
for the year ended
December 31, 2016
. The increase was due to an increase in earnings of
$13.3 million
generated by our Zeolyst Joint Venture during the year ended
December 31, 2017
as compared to the the year ended
December 31, 2016
and
$27.7 million
of lower amortization on the fair value step-up of the underlying assets of our Zeolyst Joint Venture, which was a result of the Business Combination.
|
|
•
|
Pro Forma:
Equity in net income of affiliated companies for the year ended
December 31, 2017
was
$38.8 million
, compared with income of
$35.2 million
for the year ended
December 31, 2016
. The increase in earnings generated by our Zeolyst Joint Venture was due to higher sales for emission control and increased sales of aromatic catalysts.
|
52
The following is our condensed consolidated statement of operations and a summary of financial results, presented on a historical and pro forma basis, for the years ended
December 31, 2017
and
2016
. The historical results of operations include legacy Eco for all periods presented and legacy PQ for the year ended
December 31, 2017
and the period of May 4, 2016 through December 31, 2016. The unaudited pro forma results of operations reflect pro forma adjustments to the results of PQ Group Holdings to give effect to the Business Combination and the related financing transactions as if they had occurred on January 1, 2015.
|
Historical
|
Historical
|
Pro Forma
|
||||||||||||||||||||||||||||
|
Years ended
December 31, |
Change
|
Years ended
December 31, |
Change
|
|||||||||||||||||||||||||||
|
2017
|
2016
|
$
|
%
|
2017
|
2016
|
$
|
%
|
|||||||||||||||||||||||
|
(in millions, except percentages)
|
||||||||||||||||||||||||||||||
|
Sales
|
$
|
1,472.1
|
|
$
|
1,064.2
|
|
$
|
407.9
|
|
38.3
|
%
|
$
|
1,472.1
|
|
$
|
1,403.0
|
|
$
|
69.1
|
|
4.9
|
%
|
||||||||
|
Cost of goods sold
|
1,095.3
|
|
810.1
|
|
285.2
|
|
35.2
|
%
|
1,095.3
|
|
1,037.1
|
|
58.2
|
|
5.6
|
%
|
||||||||||||||
|
Gross profit
|
376.8
|
|
254.1
|
|
122.7
|
|
48.3
|
%
|
376.8
|
|
365.9
|
|
10.9
|
|
3.0
|
%
|
||||||||||||||
|
Gross profit margin
|
25.6
|
%
|
23.9
|
%
|
25.6
|
%
|
26.1
|
%
|
||||||||||||||||||||||
|
Selling, general and administrative expenses
|
145.1
|
|
107.6
|
|
37.5
|
|
34.9
|
%
|
145.1
|
|
145.0
|
|
0.1
|
|
0.1
|
%
|
||||||||||||||
|
Other operating expense, net
|
64.2
|
|
62.3
|
|
1.9
|
|
3.0
|
%
|
64.2
|
|
75.0
|
|
(10.8
|
)
|
(14.4
|
)%
|
||||||||||||||
|
Operating income
|
167.5
|
|
84.2
|
|
83.3
|
|
98.9
|
%
|
167.5
|
|
145.9
|
|
21.6
|
|
14.8
|
%
|
||||||||||||||
|
Operating income margin
|
11.4
|
%
|
7.9
|
%
|
11.4
|
%
|
10.4
|
%
|
||||||||||||||||||||||
|
Equity in net income (loss) from affiliated companies
|
38.8
|
|
(2.6
|
)
|
41.4
|
|
(1,592.3
|
)%
|
38.8
|
|
35.2
|
|
3.6
|
|
10.2
|
%
|
||||||||||||||
|
Interest expense
|
179.0
|
|
140.3
|
|
38.7
|
|
27.6
|
%
|
179.0
|
|
187.9
|
|
(8.9
|
)
|
(4.7
|
)%
|
||||||||||||||
|
Debt extinguishment costs
|
61.9
|
|
13.8
|
|
48.1
|
|
348.6
|
%
|
61.9
|
|
1.8
|
|
60.1
|
|
3,338.9
|
%
|
||||||||||||||
|
Other (income) expense, net
|
26.0
|
|
(3.4
|
)
|
29.4
|
|
(864.7
|
)%
|
26.0
|
|
(8.8
|
)
|
34.8
|
|
(395.5
|
)%
|
||||||||||||||
|
Income (loss) before income taxes and noncontrolling interest
|
(60.6
|
)
|
(69.1
|
)
|
8.5
|
|
(12.3
|
)%
|
(60.6
|
)
|
0.2
|
|
(60.8
|
)
|
(30,400.0
|
)%
|
||||||||||||||
|
(Benefit) provision for income taxes
|
(119.2
|
)
|
10.0
|
|
(129.2
|
)
|
(1,292.0
|
)%
|
(119.2
|
)
|
58.0
|
|
(177.2
|
)
|
(305.5
|
)%
|
||||||||||||||
|
Effective tax rate
|
196.7
|
%
|
(14.5
|
)%
|
196.7
|
%
|
22,295.0
|
%
|
||||||||||||||||||||||
|
Net income (loss)
|
58.6
|
|
(79.1
|
)
|
137.7
|
|
(174.1
|
)%
|
58.6
|
|
(57.8
|
)
|
116.4
|
|
(201.4
|
)%
|
||||||||||||||
|
Less: Net income attributable to the noncontrolling interest
|
1.0
|
|
0.6
|
|
0.4
|
|
66.7
|
%
|
1.0
|
|
1.2
|
|
(0.2
|
)
|
(16.7
|
)%
|
||||||||||||||
|
Net income (loss) attributable to PQ Group Holdings Inc.
|
$
|
57.6
|
|
$
|
(79.7
|
)
|
$
|
137.3
|
|
(172.3
|
)%
|
$
|
57.6
|
|
$
|
(59.0
|
)
|
$
|
116.6
|
|
(197.6
|
)%
|
||||||||
53
Sales
|
Historical
|
Historical
|
Pro Forma
|
||||||||||||||||||||||||||||
|
Years ended
December 31, |
Change
|
Years ended
December 31, |
Change
|
|||||||||||||||||||||||||||
|
2017
|
2016
|
$
|
%
|
2017
|
2016
|
$
|
%
|
|||||||||||||||||||||||
|
(in millions, except percentages)
|
||||||||||||||||||||||||||||||
|
Sales:
|
||||||||||||||||||||||||||||||
|
Performance Chemicals
|
$
|
687.6
|
|
$
|
437.5
|
|
$
|
250.1
|
|
57.2
|
%
|
$
|
687.6
|
|
$
|
663.9
|
|
$
|
23.7
|
|
3.6
|
%
|
||||||||
|
Performance Materials
|
324.2
|
|
206.5
|
|
117.7
|
|
57.0
|
%
|
324.2
|
|
291.3
|
|
32.9
|
|
11.3
|
%
|
||||||||||||||
|
Eliminations
|
(10.0
|
)
|
(5.0
|
)
|
(5.0
|
)
|
100.0
|
%
|
(10.0
|
)
|
(8.0
|
)
|
(2.0
|
)
|
25.0
|
%
|
||||||||||||||
|
Performance Materials & Chemicals
|
1,001.8
|
|
639.0
|
|
362.8
|
|
56.8
|
%
|
1,001.8
|
|
947.2
|
|
54.6
|
|
5.8
|
%
|
||||||||||||||
|
Silica Catalyst
|
75.3
|
|
53.0
|
|
22.3
|
|
42.1
|
%
|
75.3
|
|
84.2
|
|
(8.9
|
)
|
(10.6
|
)%
|
||||||||||||||
|
Refining Services
|
398.4
|
|
373.7
|
|
24.7
|
|
6.6
|
%
|
398.4
|
|
373.7
|
|
24.7
|
|
6.6
|
%
|
||||||||||||||
|
Environmental Catalysts & Services
|
473.7
|
|
426.7
|
|
47.0
|
|
11.0
|
%
|
473.7
|
|
457.9
|
|
15.8
|
|
3.5
|
%
|
||||||||||||||
|
Inter-segment sales eliminations
|
(3.4
|
)
|
(1.5
|
)
|
(1.9
|
)
|
126.7
|
%
|
(3.4
|
)
|
(2.1
|
)
|
(1.3
|
)
|
61.9
|
%
|
||||||||||||||
|
Total sales
|
$
|
1,472.1
|
|
$
|
1,064.2
|
|
$
|
407.9
|
|
38.3
|
%
|
$
|
1,472.1
|
|
$
|
1,403.0
|
|
$
|
69.1
|
|
4.9
|
%
|
||||||||
Historical Sales
Sales for the year ended
December 31, 2017
were
$1,472.1 million
, an increase of
$407.9 million
, or
38.3%
, compared to sales of
$1,064.2 million
for the year ended
December 31, 2016
. The increase in sales within our Performance Materials and Chemicals segment was due to the inclusion of legacy PQ sales of
$1,001.8 million
in our results of operations for the year ended
December 31, 2017
as compared to legacy PQ sales of
$639.0 million
in our results of operations for the period of May 4, 2016 through
December 31, 2016
. The increase in sales within our Environmental Catalysts and Services segment was due to the inclusion of legacy PQ sales of
$75.3 million
in our results of operations for the year ended
December 31, 2017
as compared to
$53.0 million
of legacy PQ sales in our results of operations for the period of May 4, 2016 through
December 31, 2016
and an increase of
$24.7 million
in our refining services product group. The increase in our refining services product group was primarily driven by increased higher average selling price of
$20.8 million
and increased volumes of
$3.9 million
. The increase in average selling price was driven by the higher realization from sulfuric acid regeneration contract renewals and the increase in volumes was due to an increased demand for virgin sulfuric acid.
Pro Forma Sales
Performance Materials & Chemicals:
Sales in Performance Materials and Chemicals for the year ended
December 31, 2017
were
$1,001.8 million
, an increase of
$54.6 million
, or
5.8%
, compared to sales of
$947.2 million
for the year ended
December 31, 2016
. The increase in sales was primarily due to the Sovitec acquisition, which contributed
$26.3 million
in sales, favorable volumes of
$14.4 million
, higher average selling price and favorable customer mix of
$9.1 million
and favorable effects of foreign currency translation of
$4.8 million
.
The increase in volumes within Performance Materials and Chemicals was primarily driven by higher sodium silicate industrial demand and an increased silicas demand in the personal care industry, which was partially offset by lower North America highway sales as well as lower conductive sales volumes due to timing of product life cycles in the electronics industries. The higher average selling price was principally a result of favorable U.S. dollar denominated sales and U.S. dollar cost pass through pricing in certain foreign locations. The stronger Euro and Brazilian Real as compared to the U.S. dollar favorably impacted our sales which was partially offset by a stronger U.S. dollar compared to the British Pound.
Environmental Catalysts & Services:
Sales in Environmental Catalysts and Services for the year ended
December 31, 2017
were
$473.7 million
, an increase of
$15.8 million
, or
3.5%
, compared to sales of
$457.9 million
for the year ended
December 31, 2016
. The increase in sales was primarily due to higher average selling price and customer mix of
$23.0 million
, which was partially offset by lower volumes of
$6.9 million
.
The higher average selling price and customer mix was driven by the higher realization from sulfuric acid regeneration contract renewals partly offset by unfavorable virgin sulfuric acid pricing due to the mix of customers. The decrease in volumes was driven by lower chemical catalysts sales due to record methyl methacrylate sales volumes in the prior year and the impact of hurricane Harvey, which was partially offset by higher virgin sulfuric acid sales volumes due to the timing of our customer’s plant turnarounds.
54
Gross Profit
Historical:
Gross profit for the year ended
December 31, 2017
was
$376.8 million
, an increase of
$122.7 million
, or
48.3%
, compared with
$254.1 million
for the year ended
December 31, 2016
. The increase in gross profit was due to
$247.5 million
attributable to the inclusion of legacy PQ gross profit in our results of operations for the year ended
December 31, 2017
as compared to legacy PQ gross profit of
$142.6 million
in our results of operations for the period of May 4, 2016 through December 31, 2016 and an increase of
$17.8 million
from our refining services product group. The increase in our refining services gross profit was due to favorable pricing of
$20.8 million
and higher volumes of
$2.4 million
, which was partially offset by higher manufacturing costs of
$4.4 million
.
The favorable pricing was due to higher realization from sulfuric acid regeneration contract renewals. The increase in volume was driven by higher virgin sulfuric acid shipments to the mining industry.
Pro Forma:
Gross profit for the year ended
December 31, 2017
was
$376.8 million
, an increase of
$10.9 million
, or
3.0%
, compared with
$365.9 million
for the year ended
December 31, 2016
. The increase in gross profit was due to favorable pricing of
$28.3 million
, higher volumes of
$13.7 million
and
$7.7 million
related to the Sovitec acquisition, which was partially offset by higher manufacturing costs of
$20.3 million
, higher depreciation expense of
$14.1 million
and unfavorable product mix of
$5.3 million
.
The favorable average selling price was a result of higher realization from sulfuric acid regeneration customer contracts and the positive impact of U.S. dollar denominated sales and U.S. dollar pass through pricing in certain foreign locations, partially offset by unfavorable virgin sulfuric acid customer mix. The favorable increase in volumes was due to higher sodium silicate industrial demand, increased cullet demand in Europe and higher virgin sulfuric acid sales. Higher manufacturing costs were primarily driven by increased costs to support the start-up of the ThermoDrop® production facility for which the product offering was released for sale towards the end of the second quarter of 2017, higher raw material costs and higher production and labor inflation costs. The unfavorable product mix is due to the effect of higher methyl methacrylate sales volumes through the year ended
December 31, 2017
.
Selling, General and Administrative Expenses
Historical:
Selling, general and administrative expenses for the year ended
December 31, 2017
were
$145.1 million
, an increase of
$37.5 million
, or
34.9%
, compared with
$107.6 million
for the year ended
December 31, 2016
. The increase in selling, general and administrative expenses was due to
$125.9 million
attributable to the inclusion of legacy PQ selling, general and administrative expenses in our results of operations for the year ended
December 31, 2017
as compared to legacy PQ selling, general and administrative expenses of
$76.2 million
in our results of operations for the period of May 4, 2016 through December 31, 2016. This was partly offset by
$12.0 million
of lower selling, general and administrative expenses as a result of cost reduction initiatives within our refining services group.
Pro Forma:
Selling, general and administrative expenses for the year ended
December 31, 2017
were
$145.1 million
, an increase of
$0.1 million
, or
0.1%
, compared with
$145.0 million
for the year ended
December 31, 2016
.
Other Operating Expense, Net
Historical:
Other operating expense, net for the years ended
December 31, 2017
was
$64.2 million
, an increase of
$1.9 million
, or
3.0%
, compared with
$62.3 million
for the year ended
December 31, 2016
. Included in other operating expense, net was
$50.5 million
attributable to the inclusion of legacy PQ other operating expense, net in our results of operations for the year ended
December 31, 2017
as compared to legacy PQ other operating expense, net of
$48.4 million
in our results of operations for the period of May 4, 2016 through December 31, 2016.
Pro Forma:
Other operating expense, net for the year ended
December 31, 2017
was
$64.2 million
, a decrease of
$10.8 million
, or
14.4%
, compared with
$75.0 million
for the year ended
December 31, 2016
. The decrease in other operating expense, net was due to
$5.5 million
of lower restructuring and severance related costs,
$6.9 million
of asset impairment charges incurred during the year ended
December 31, 2016
and
$1.7 million
of lower environmental remediation charges, which was offset by
$6.0 million
of transaction costs related to our initial public offering and Sovitec acquisition.
Equity in Net Income of Affiliated Companies
Historical:
Equity in net income of affiliated companies for the year ended
December 31, 2017
was
$38.8 million
, an increase of
$41.4 million
, compared with a loss of
$2.6 million
for the year ended
December 31, 2016
. The increase was primarily due to
$47.0 million
of earnings generated by our Zeolyst Joint Venture during the year ended
December 31, 2017
as compared to
$33.2 million
for the period of May 4, 2016 through December 31, 2016 and
$27.7 million
of lower amortization expense on the fair value step-up of the underlying assets of our Zeolyst Joint Venture, which was a result of the Business Combination.
Pro Forma:
Equity in net income of affiliated companies for the year ended
December 31, 2017
was
$38.8 million
, an increase of
$3.6 million
, compared with income of
$35.2 million
for the year ended
December 31, 2016
. The increase in earnings generated by our Zeolyst Joint Venture was due to higher sales for emission control and increased sales of aromatic catalysts.
55
Interest Expense, Net
Historical:
Interest expense, net for the year ended
December 31, 2017
was
$179.0 million
, an increase of
$38.7 million
, as compared with
$140.3 million
for the year ended
December 31, 2016
. Interest expense increased primarily due to higher third-party interest expense under our debt structure compared to the legacy Eco debt structure on a stand alone basis.
Pro Forma:
Interest expense, net for the year ended
December 31, 2017
was
$179.0 million
, a decrease of
$8.9 million
, as compared with
$187.9 million
for the year ended
December 31, 2016
. The decrease in interest expense is a result of the repayment of high-interest rate debt as well as a reduction in interest rates due to repricing our existing debt structure.
Debt Extinguishment Costs
Historical:
Debt extinguishment costs for the years ended
December 31, 2017
and
2016
were
$61.9 million
and
$13.8 million
, respectively.
On December 11, 2017, we completed the issuance of $300.0 million in aggregate principal amount of 5.75% Senior Unsecured Notes due 2025, which were used to repay the remaining outstanding balance on our Floating Rate Senior Unsecured Notes due 2022 and 8.5% Senior Notes due 2022. In conjunction with the issuance of the senior unsecured notes, we paid
$14.0 million
in prepayment premiums and recorded
$0.4 million
of new creditor and third-party financing fees as debt extinguishment costs. In addition, previous unamortized deferred financing costs of
$5.3 million
and original issue discount of
$1.2 million
associated with the old debt were written off as debt extinguishment costs.
On October 3, 2017, we completed our initial public offering whereby we issued 29,000,000 of our common stock at an offering price of $17.50 per share and used the proceeds to repay $446.2 million of our Floating Rate Senior Unsecured Notes due 2022. In conjunction with the initial public offering, we paid
$32.3 million
in prepayment premiums and wrote off existing unamortized deferred financing costs of
$0.7 million
and original issue discount of
$7.6 million
as debt extinguishment costs.
On August 7, 2017, we repriced the existing U.S. dollar-denominated tranche and existing Euro-denominated tranche of our term loans to reduce the applicable interest rates. We recorded
$0.2 million
of new creditor and third-party financing fees as debt extinguishment costs. In addition, previous unamortized deferred financing costs of
$0.1 million
and original issue discount of
$0.2 million
associated with the old debt were written off as debt extinguishment costs.
On November 14, 2016, we repriced our existing senior secured term loan facility. We recorded
$0.5 million
of new creditor and third-party financing costs fees as debt extinguishment costs. In addition, previously unamortized deferred financing costs of
$0.6 million
and original issue discount of
$0.8 million
associated with the previously outstanding debt were written off as debt extinguishment costs.
On May 4, 2016, and concurrently with the consummation of the Business Combination, we refinanced our existing credit facilities. We recorded
$4.7 million
of new creditor and third-party financing fees as debt extinguishment costs. In addition, previous unamortized deferred financing costs of
$6.3 million
and original issue discount of
$1.0 million
associated with the old debt were written off as debt extinguishment costs.
Pro Forma:
On November 14, 2016, we repriced our existing senior secured term loan facility. The company recorded
$0.5 million
of new creditor and third-party financing costs fees as debt extinguishment costs. In addition, previously unamortized deferred financing costs of
$0.6 million
and original issue discount of
$0.8 million
associated with the previously outstanding debt were written off as debt extinguishment costs.
Other (Income) Expense, Net
Historical:
Other expense, net was
$26.0 million
for the year ended
December 31, 2017
, an unfavorable change of
$29.4 million
, compared with other income, net of
$3.4 million
for the year ended
December 31, 2016
. The change in other expense, net primarily consisted of
$25.8 million
of foreign currency losses for the year ended
December 31, 2017
as compared to foreign currency gains of
$3.6 million
for the year ended
December 31, 2016
.
Pro Forma:
Other expense, net was
$26.0 million
for the year ended
December 31, 2017
, an unfavorable change of
$34.8 million
, compared with other income, net of
$8.8 million
for the year ended
December 31, 2016
. The change in other expense, net primarily consisted of
$25.8 million
of foreign currency losses for the year ended
December 31, 2017
as compared to foreign currency gains of
$8.8 million
for the year ended
December 31, 2016
.
56
(Benefit) Provision for Income Taxes
Historical:
The benefit for income taxes for the year ended
December 31, 2017
was
$119.2 million
compared to a
$10.0 million
provision for the year ended
December 31, 2016
. The effective income tax rate for the year ended
December 31, 2017
was
196.7%
compared to
(14.5)%
for
the year ended
December 31, 2016
. The difference between the U.S. federal statutory income tax rate and our
effective income tax rate for the year ended
December 31, 2017
was mainly due to the tax effect of U.S. tax reform that reduced the corporate tax rate, lower tax rates in foreign jurisdictions as compared to the U.S. federal tax rate, state taxes and foreign withholding taxes. The difference between the U.S. federal statutory income tax rate and our effective income tax rate for the year ended
December 31, 2016
was mainly due to the tax effect of our foreign currency exchange loss recognized as a discrete item for the purposes of calculating the effective tax rate as well as the tax effect of repatriating foreign earnings back to the U.S. as dividends, partially offset by lower tax rates in foreign jurisdictions as compared to the U.S. federal tax rate, foreign withholding taxes, state taxes, non-deductible transaction costs, and change in tax status of legacy Eco. Prior to the Business Combination on May 4, 2016, legacy Eco was a single member limited liability company and taxed as a partnership for federal and state income tax purposes. As such, all income tax liabilities and/or benefits of legacy Eco were passed through to its members. Because legacy Eco was taxed as a partnership, it did not record deferred taxes on the basis difference on its financial statements. Following the Business Combination on May 4, 2016, legacy Eco had a change in tax status and is now taxed as a C-Corporation subject to federal and state corporate level income taxes at prevailing corporate rates. Minimal taxes were recorded on the book losses incurred by legacy Eco during the periods preceding the Business Combination included in the year ended December 31, 2016, causing the fluctuation to the Company’s effective income tax rate in comparison to the taxes recorded for the year ended December 31, 2016.
Pro Forma:
The benefit for income taxes for the year ended
December 31, 2017
was
$119.2 million
compared to a
$58.0 million
provision for the year ended
December 31, 2016
. The effective income tax rate for the year ended
December 31, 2017
was
196.7%
compared to
22,295.0%
for the year ended
December 31, 2016
. The difference between the U.S. federal statutory income tax rate and our
effective income tax rate for the year ended
December 31, 2017
was mainly due to the tax effect of U.S. tax reform—reducing the corporate tax rate, lower tax rates in foreign jurisdictions as compared to the U.S. federal tax rate, state taxes and foreign withholding taxes. The difference between the U.S. federal statutory income tax rate and our effective income tax rate for the year ended
December 31, 2016
was mainly due to the tax effect of our foreign currency exchange loss recognized as a discrete item for the purposes of calculating the effective tax rate as well as the tax effect of repatriating foreign earnings back to the U.S. as dividends, partially offset by lower tax rates in foreign jurisdictions as compared to the U.S. federal tax rate, foreign withholding taxes, state taxes, non-deductible transaction costs, and change in tax status of legacy Eco. Prior to the Business Combination on May 4, 2016, legacy Eco was a single member limited liability company and taxed as a partnership for federal and state income tax purposes. As such, all income tax liabilities and/or benefits of legacy Eco were passed through to its members. Because legacy Eco was taxed as a partnership, it did not record deferred taxes on the basis difference on its financial statements. Following the Business Combination on May 4, 2016, legacy Eco had a change in tax status and is now taxed as a C-Corporation subject to federal and state corporate level income taxes at prevailing corporate rates. Minimal taxes were recorded on the book losses incurred by legacy Eco during the periods preceding the Business Combination included in the year ended December 31, 2016, causing the fluctuation to the Company’s effective income tax rate in comparison to the taxes recorded for the year ended December 31, 2016.
Net Income (Loss) Attributable to PQ Group Holdings
Historical:
For the foregoing reasons and after the effect of the non-controlling interest in earnings of subsidiaries for each period presented, net income attributable to PQ Group Holdings Inc. was
$57.6 million
for the year ended
December 31, 2017
as compared to a net loss of
$79.7 million
for the year ended
December 31, 2016
.
Pro Forma:
For the foregoing reasons and after the effect of the non-controlling interest in earnings of subsidiaries for each period presented, net income attributable to PQ Group Holdings Inc. was
$57.6 million
for the year ended
December 31, 2017
as compared to a net loss of
$59.0 million
for the year ended
December 31, 2016
.
57
Historical and Pro Forma Adjusted EBITDA
Summarized historical and pro forma Segment Adjusted EBITDA information is shown below in the following table:
|
Historical
|
Pro Forma
|
||||||||||||||
|
Years ended
December 31, |
Change
|
||||||||||||||
|
2017
|
2016
|
$
|
%
|
||||||||||||
|
(in millions, except percentages)
|
|||||||||||||||
|
Segment Adjusted EBITDA
(1)
:
|
|||||||||||||||
|
Performance Materials & Chemicals
|
$
|
240.2
|
|
$
|
231.8
|
|
$
|
8.4
|
|
3.6
|
%
|
||||
|
Environmental Catalysts & Services
(2)
|
243.6
|
|
221.8
|
|
21.8
|
|
9.8
|
%
|
|||||||
|
Total Segment Adjusted EBITDA
(3)
|
483.8
|
|
453.6
|
|
30.2
|
|
6.7
|
%
|
|||||||
|
Unallocated corporate costs
|
(30.5
|
)
|
(32.8
|
)
|
2.3
|
|
(7.0
|
)%
|
|||||||
|
Total Adjusted EBITDA
(3)
|
$
|
453.3
|
|
$
|
420.8
|
|
$
|
32.5
|
|
7.7
|
%
|
||||
|
(1)
|
We define Segment Adjusted EBITDA as EBITDA adjusted for certain items as noted in the reconciliation below. Our management evaluates the performance of our segments and allocates resources based primarily on Segment Adjusted EBITDA. Segment Adjusted EBITDA does not represent cash flow for periods presented and should not be considered as an alternative to net income as an indicator of our operating performance or as an alternative to cash flows as a source of liquidity. Segment Adjusted EBITDA may not be comparable with EBITDA or Adjusted EBITDA as defined by other companies.
|
|
(2)
|
The Adjusted EBITDA from the Zeolyst Joint Venture included in the Environmental Catalysts and Services segment is
$58.2 million
for the year ended
December 31, 2017
, which includes
$47.0 million
of equity in net income, excluding
$8.6 million
of amortization of investment in affiliate step-up plus
$11.1 million
of joint venture depreciation, amortization and interest. The pro forma Adjusted EBITDA from the Zeolyst Joint Venture included in the Environmental Catalysts and Services segment is
$52.7 million
for the year ended
December 31, 2016
, which includes
$42.3 million
of equity in net income, excluding
$7.3 million
of amortization of investment in affiliate step-up plus
$10.3 million
of joint venture depreciation, amortization and interest.
|
|
(3)
|
Our total Segment Adjusted EBITDA differs from our total consolidated Adjusted EBITDA due to unallocated corporate expenses.
|
Adjusted EBITDA for the year ended
December 31, 2017
was
$453.3 million
, an increase of
$32.5 million
, or
7.7%
, compared with
$420.8 million
on a pro forma basis for the year ended
December 31, 2016
.
Performance Materials & Chemicals:
Adjusted EBITDA for the year ended
December 31, 2017
was
$240.2 million
, an increase of
$8.4 million
, or
3.6%
, compared with
$231.8 million
on a pro forma basis for the year ended
December 31, 2016
.
The increase in Adjusted EBITDA was due to stronger sodium silicate industrial demand and earnings from the Sovitec acquisition partly offset by start-up costs for the new ThermoDrop® production facility.
Environmental Catalysts & Services:
Adjusted EBITDA for the year ended
December 31, 2017
was
$243.6 million
, an increase of
$21.8 million
, or
9.8%
, compared with
$221.8 million
on a pro forma basis for the year ended
December 31, 2016
.
The increase in Adjusted EBITDA was driven primarily by higher pricing from renegotiated regeneration services contracts and increased earnings generated by our Zeolyst Joint Venture due to higher sales volumes of aromatic catalyst and catalyst sales for emission control.
58
A reconciliation of Segment Adjusted EBITDA and pro forma Segment Adjusted EBITDA to net loss and pro forma net loss attributable to PQ Group Holdings is as follows:
|
Historical
|
Pro Forma
|
|||||||
|
Years ended
December 31, |
||||||||
|
2017
|
2016
|
|||||||
|
(in millions)
|
||||||||
|
Reconciliation of net income (loss) attributable to PQ Group Holdings Inc. to Segment Adjusted EBITDA
|
||||||||
|
Net income (loss) attributable to PQ Group Holdings Inc.
|
$
|
57.6
|
|
$
|
(59.0
|
)
|
||
|
(Benefit) provision for income taxes
|
(119.2
|
)
|
58.0
|
|
||||
|
Interest expense
|
179.0
|
|
187.9
|
|
||||
|
Depreciation and amortization
|
177.1
|
|
165.8
|
|
||||
|
EBITDA
|
294.5
|
|
352.7
|
|
||||
|
Joint venture depreciation, amortization and interest
(a)
|
11.1
|
|
10.3
|
|
||||
|
Amortization of investment in affiliate step-up
(b)
|
8.6
|
|
5.8
|
|
||||
|
Amortization of inventory step-up
(c)
|
0.9
|
|
4.9
|
|
||||
|
Impairment of fixed assets, intangibles and goodwill
|
—
|
|
6.9
|
|
||||
|
Debt extinguishment costs
|
61.9
|
|
1.8
|
|
||||
|
Net loss on asset disposals
(d)
|
5.8
|
|
4.8
|
|
||||
|
Foreign currency exchange (gain) loss
(e)
|
25.8
|
|
(9.0
|
)
|
||||
|
Non-cash revaluation of inventory, including LIFO
|
3.7
|
|
1.3
|
|
||||
|
Management advisory fees
(f)
|
3.8
|
|
5.3
|
|
||||
|
Transaction related costs
(g)
|
7.4
|
|
2.6
|
|
||||
|
Equity-based and other non-cash compensation
|
8.8
|
|
6.5
|
|
||||
|
Restructuring, integration and business optimization expenses
(h)
|
13.2
|
|
17.9
|
|
||||
|
Defined benefit plan pension cost
(i)
|
2.9
|
|
2.8
|
|
||||
|
Other
(j)
|
4.9
|
|
6.2
|
|
||||
|
Adjusted EBITDA
|
453.3
|
|
420.8
|
|
||||
|
Unallocated corporate costs
|
30.5
|
|
32.8
|
|
||||
|
Total Segment Adjusted EBITDA
|
$
|
483.8
|
|
$
|
453.6
|
|
||
|
(a)
|
We use Adjusted EBITDA as a performance measure to evaluate our financial results. Because our Environmental Catalysts and Services segment includes our 50% interest in our Zeolyst Joint Venture, we include an adjustment for our 50% proportionate share of depreciation, amortization and interest expense of our Zeolyst Joint Venture.
|
|
(b)
|
Represents the amortization of the fair value adjustments associated with the equity affiliate investment in our Zeolyst Joint Venture as a result of the Business Combination. We determined the fair value of the equity affiliate investment and the fair value step-up was then attributed to the underlying assets of our Zeolyst Joint Venture. Amortization is primarily related to the fair value adjustments associated with inventory, fixed assets and intangible assets, such as customer relationships, formulations and product technology.
|
|
(c)
|
As a result of the Business Combination, there was a step-up in the fair value of inventory at PQ Holdings, which is amortized through cost of goods sold in the income statement.
|
|
(d)
|
We do not have a history of significant asset disposals. However, when asset disposals occur, we remove the impact of net gain/loss of the disposed asset because such impact primarily reflects the non-cash write-off of long-lived assets no longer in use.
|
|
(e)
|
Reflects the exclusion of the negative or positive transaction gains and losses of foreign currency in the income statement
primarily driven by the Euro-denominated term loan
and the non-permanent intercompany debt denominated in local currency and translated to U.S. dollars
.
|
59
|
(f)
|
Reflects consulting fees paid to CCMP and affiliates of INEOS for consulting services that include certain financial advisory and management services. These payments ceased as of the closing of our initial public offering.
|
|
(g)
|
Relates to certain transaction costs described elsewhere in our consolidated financial statements as well as other costs related to several transactions that are either completed, pending or abandoned and that we believe are not representative of our ongoing business operations.
|
|
(h)
|
Includes the impact of restructuring, integration and business optimization expenses that are related to specific, one-time items, including severance for a reduction in force and post-merger integration costs that are not expected to recur.
|
|
(i)
|
Represents adjustments for defined benefit pension plan costs in our income statement. More than two-thirds of our defined benefit pension plan obligations are under defined benefit pension plans that are frozen and the remaining obligations primarily relate to plans operated in certain of our non-U.S. locations that, pursuant to jurisdictional requirements, cannot be frozen. As such, we do not view such expenses as core to our ongoing business operations.
|
|
(j)
|
Other costs consist of certain expenses that are not core to our ongoing business operations and are generally related to specific, one-time items, including environmental remediation-related costs associated with the legacy operations of our business prior to the Business Combination, capital and franchise taxes, non-cash asset retirement obligation accretion and the initial implementation of procedures to comply with Section 404 of the Sarbanes-Oxley Act.
|
60
Historical and Pro Forma Adjusted Net Income (loss)
Summarized historical and pro forma adjusted net income (loss) information is shown below in the following table:
|
Historical
|
Pro Forma
|
|||||||
|
Years ended
December 31, |
||||||||
|
2017
|
2016
|
|||||||
|
(in millions)
|
||||||||
|
Reconciliation of net income (loss) attributable to PQ Group Holdings Inc. to Adjusted Net Income (Loss)
(1) (2)
|
||||||||
|
Net income (loss) attributable to PQ Group Holdings Inc.
|
$
|
57.6
|
|
$
|
(59.0
|
)
|
||
|
Amortization of investment in affiliate step-up
(b)
|
6.5
|
|
3.6
|
|
||||
|
Amortization of inventory step-up
(c)
|
0.6
|
|
3.0
|
|
||||
|
Impairment of long-lived and intangible assets
|
—
|
|
4.3
|
|
||||
|
Debt extinguishment costs
|
46.4
|
|
1.1
|
|
||||
|
Net loss on asset disposals
(d)
|
3.9
|
|
3.1
|
|
||||
|
Foreign currency exchange (gain) loss
(e)
|
16.1
|
|
(1.6
|
)
|
||||
|
Non-cash revaluation of inventory, including LIFO
|
2.8
|
|
0.8
|
|
||||
|
Management advisory fees
(f)
|
2.8
|
|
3.3
|
|
||||
|
Transaction related costs
(g)
|
5.6
|
|
1.5
|
|
||||
|
Equity-based and other non-cash compensation
|
6.6
|
|
4.0
|
|
||||
|
Restructuring, integration and business optimization expenses
(h)
|
7.6
|
|
11.4
|
|
||||
|
Defined benefit plan pension cost
(i)
|
2.0
|
|
2.0
|
|
||||
|
Other
(j)
|
5.9
|
|
3.8
|
|
||||
|
Adjusted Net Income (Loss)
|
$
|
164.4
|
|
$
|
(18.7
|
)
|
||
|
Impact of tax reform
|
(106.5
|
)
|
||||||
|
Adjusted Net Income, excluding tax reform
|
$
|
57.9
|
|
|||||
|
(1)
|
We define adjusted net income as net income (loss) attributable to PQ Group Holdings adjusted for non-operating income or expense and the impact of certain non-cash or other items that are included in net income that we do not consider indicative of our ongoing operating performance. Adjusted net income (loss) is presented as a key performance indicator as we believe it will enhance a prospective investor’s understanding of our results of operations and financial condition. Adjusted net income (loss) may not be comparable with net income or adjusted net income as defined by other companies.
|
|
(2)
|
Refer to the Adjusted EBITDA notes above for more information with respect to each adjustment.
|
The adjustments to net income (loss) attributable to PQ Group Holdings Inc. are shown net of applicable statutory tax rates.
61
Historical and Pro Forma—Year Ended
December 31, 2016
Compared to the Year Ended
December 31, 2015
(the Pro Forma Discussion Compares the Pro Forma Year Ended
December 31, 2016
to the Pro Forma Year Ended
December 31, 2015
)
Highlights
The following is a summary of our financial performance for the year ended
December 31, 2016
compared with the year ended
December 31, 2015
.
Sales
|
•
|
Historical:
Net sales increased
$675.3 million
to
$1,064.2 million
. The increase in sales was primarily due to the inclusion of
$690.5 million
of legacy PQ sales included in our results of operations from May 4, 2016 through December 31, 2016, which was partly offset by a decrease of
$15.2 million
in sales from our refining services product group.
|
|
•
|
Pro Forma:
Net sales decreased
$10.2 million
to
$1,403.0 million
. The decrease in sales was primarily due to unfavorable foreign currency exchange variations compared to the same period in the prior year (
$27.3 million
), lower refining services pricing, which was primarily due to cost adjusted pass through contracts, and lower volumes in Performance Materials and Chemicals, partially offset by higher volumes and higher average selling price and customer mix improvement in Environmental Catalysts and Services.
|
Gross Profit
|
•
|
Historical:
Gross profit increased
$144.0 million
to
$254.1 million
. The increase in gross profit was primarily due to the inclusion of
$142.6 million
of legacy PQ gross profit included in our results of operations from May 4, 2016 through December 31, 2016.
|
|
•
|
Pro Forma:
Gross profit increased
$1.4 million
to
$365.9 million
. The increase in gross profit was driven primarily by favorable volume contribution and lower manufacturing costs in our Environmental Catalysts and Services segment. This was offset by lower Environmental Catalysts and Services pricing, the unfavorable effect of foreign currency translation totaling
$7.6 million
and
$44.8 million
of higher depreciation and amortization expense as a result of the step-up in asset values due to the Business Combination.
|
Operating Income
|
•
|
Historical:
Operating income increased
$28.4 million
to
$84.2 million
. Our operating income increased due to the inclusion of
$18.0 million
of legacy PQ operating income included in our results of operations from May 4, 2016 through December 31, 2016 and
$10.4 million
of operating income associated with our refining services product group.
|
|
•
|
Pro Forma:
Operating income decreased
$10.0 million
to
$145.9 million
. Our operating income decreased due to higher other operating expenses, primarily related to purchase accounting, restructuring, severance, and transaction costs.
|
Equity in Net (Loss) Income of Affiliated Companies
|
•
|
Historical:
Equity in net loss of affiliated companies was
$2.6 million
, which was primarily due additional amortization expense related to our Zeolyst Joint Venture incurred as a result of the Business Combination.
|
|
•
|
Pro Forma:
Equity in net income of affiliated companies was
$35.2 million
, a decrease of
$5.9 million
. The decrease was due to lower earnings generated by our Zeolyst Joint Venture, primarily from lower hydrocracking and specialty catalyst volumes, and due to various expansion and growth related cost increases.
|
62
The following is our consolidated statement of operations and a summary of financial results, presented on a historical and pro forma basis, for the years ended
December 31, 2016
and
2015
. The historical results of operations include Eco for all periods presented and legacy PQ from May 4, 2016, the date of consummation of the Business Combination, through December 31, 2016. The unaudited pro forma results of operations reflect pro forma adjustments to the results of PQ Group Holdings to give effect to the Business Combination and the related financing transactions as if they had occurred on January 1, 2015.
|
Historical
|
Pro Forma
|
|||||||||||||||||||||||||||||
|
Years ended
December 31, |
Change
|
Years ended
December 31, |
Change
|
|||||||||||||||||||||||||||
|
2016
|
2015
|
$
|
%
|
2016
|
2015
|
$
|
%
|
|||||||||||||||||||||||
|
(in millions, except percentages)
|
||||||||||||||||||||||||||||||
|
Sales
|
$
|
1,064.2
|
|
$
|
388.9
|
|
$
|
675.3
|
|
173.6
|
%
|
$
|
1,403.0
|
|
$
|
1,413.2
|
|
$
|
(10.2
|
)
|
(0.7
|
)%
|
||||||||
|
Cost of goods sold
|
810.1
|
|
278.8
|
|
531.3
|
|
190.6
|
%
|
1,037.1
|
|
1,048.7
|
|
(11.6
|
)
|
(1.1
|
)%
|
||||||||||||||
|
Gross profit
|
254.1
|
|
110.1
|
|
144.0
|
|
130.8
|
%
|
365.9
|
|
364.5
|
|
1.4
|
|
0.4
|
%
|
||||||||||||||
|
Gross profit margin
|
23.9
|
%
|
28.3
|
%
|
26.1
|
%
|
25.8
|
%
|
||||||||||||||||||||||
|
Selling, general and administrative expenses
|
107.6
|
|
34.6
|
|
73.0
|
|
211.0
|
%
|
145.0
|
|
140.9
|
|
4.1
|
|
2.9
|
%
|
||||||||||||||
|
Other operating expense, net
|
62.3
|
|
19.7
|
|
42.6
|
|
216.2
|
%
|
75.0
|
|
67.7
|
|
7.3
|
|
10.8
|
%
|
||||||||||||||
|
Operating income
|
84.2
|
|
55.8
|
|
28.4
|
|
50.9
|
%
|
145.9
|
|
155.9
|
|
(10.0
|
)
|
(6.4
|
)%
|
||||||||||||||
|
Operating income margin
|
7.9
|
%
|
14.3
|
%
|
10.4
|
%
|
11.0
|
%
|
||||||||||||||||||||||
|
Equity in net income (loss) from affiliated companies
|
(2.6
|
)
|
—
|
|
(2.6
|
)
|
0.0
|
%
|
35.2
|
|
41.1
|
|
(5.9
|
)
|
(14.4
|
)%
|
||||||||||||||
|
Interest expense
|
140.3
|
|
44.3
|
|
96.0
|
|
216.7
|
%
|
187.9
|
|
199.6
|
|
(11.7
|
)
|
(5.9
|
)%
|
||||||||||||||
|
Debt extinguishment costs
|
13.8
|
|
—
|
|
13.8
|
|
0.0
|
%
|
1.8
|
|
—
|
|
1.8
|
|
0.0
|
%
|
||||||||||||||
|
Other (income) expense, net
|
(3.4
|
)
|
—
|
|
(3.4
|
)
|
0.0
|
%
|
(8.8
|
)
|
21.3
|
|
(30.1
|
)
|
(141.3
|
)%
|
||||||||||||||
|
Income (loss) before income taxes and noncontrolling interest
|
(69.1
|
)
|
11.5
|
|
(80.6
|
)
|
(700.9
|
)%
|
0.2
|
|
(23.9
|
)
|
24.1
|
|
(100.8
|
)%
|
||||||||||||||
|
(Benefit) provision for income taxes
|
10.0
|
|
—
|
|
10.0
|
|
0.0
|
%
|
58.0
|
|
1.2
|
|
56.8
|
|
4,733.3
|
%
|
||||||||||||||
|
Effective tax rate
|
(14.5
|
)%
|
0.0
|
%
|
22,295.0
|
%
|
(4.8
|
)%
|
||||||||||||||||||||||
|
Net income (loss)
|
(79.1
|
)
|
11.5
|
|
(90.6
|
)
|
(787.8
|
)%
|
(57.8
|
)
|
(25.1
|
)
|
(32.7
|
)
|
130.3
|
%
|
||||||||||||||
|
Less: Net income attributable to the noncontrolling interest
|
0.6
|
|
—
|
|
0.6
|
|
0.0
|
%
|
1.2
|
|
1.8
|
|
(0.6
|
)
|
(33.3
|
)%
|
||||||||||||||
|
Net income (loss) attributable to PQ Group Holdings Inc.
|
$
|
(79.7
|
)
|
$
|
11.5
|
|
$
|
(91.2
|
)
|
(793.0
|
)%
|
$
|
(59.0
|
)
|
$
|
(26.9
|
)
|
$
|
(32.1
|
)
|
119.3
|
%
|
||||||||
63
Sales
|
Historical
|
Pro Forma
|
|||||||||||||||||||||||||||||
|
Years ended
December 31, |
Change
|
Years ended
December 31, |
Change
|
|||||||||||||||||||||||||||
|
2016
|
2015
|
$
|
%
|
2016
|
2015
|
$
|
%
|
|||||||||||||||||||||||
|
(in millions, except percentages)
|
||||||||||||||||||||||||||||||
|
Sales:
|
||||||||||||||||||||||||||||||
|
Performance Chemicals
|
$
|
437.5
|
|
$
|
—
|
|
$
|
437.5
|
|
0.0
|
%
|
$
|
663.9
|
|
$
|
685.4
|
|
$
|
(21.5
|
)
|
(3.1
|
)%
|
||||||||
|
Performance Materials
|
206.5
|
|
—
|
|
206.5
|
|
0.0
|
%
|
291.3
|
|
291.3
|
|
—
|
|
0.0
|
%
|
||||||||||||||
|
Eliminations
|
(5.0
|
)
|
—
|
|
(5.0
|
)
|
0.0
|
%
|
(8.0
|
)
|
(10.6
|
)
|
2.6
|
|
(24.5
|
)%
|
||||||||||||||
|
Performance Materials & Chemicals
|
639.0
|
|
—
|
|
639.0
|
|
0.0
|
%
|
947.2
|
|
966.1
|
|
(18.9
|
)
|
(2.0
|
)%
|
||||||||||||||
|
Silica Catalyst
|
53.0
|
|
—
|
|
53.0
|
|
0.0
|
%
|
84.2
|
|
58.2
|
|
26.0
|
|
44.7
|
%
|
||||||||||||||
|
Refining Services
|
373.7
|
|
388.9
|
|
(15.2
|
)
|
(3.9
|
)%
|
373.7
|
|
388.9
|
|
(15.2
|
)
|
(3.9
|
)%
|
||||||||||||||
|
Environmental Catalysts & Services
|
426.7
|
|
388.9
|
|
37.8
|
|
9.7
|
%
|
457.9
|
|
447.1
|
|
10.8
|
|
2.4
|
%
|
||||||||||||||
|
Inter-segment sales eliminations
|
(1.5
|
)
|
—
|
|
(1.5
|
)
|
0.0
|
%
|
(2.1
|
)
|
—
|
|
(2.1
|
)
|
0.0
|
%
|
||||||||||||||
|
Total sales
|
$
|
1,064.2
|
|
$
|
388.9
|
|
$
|
675.3
|
|
173.6
|
%
|
$
|
1,403.0
|
|
$
|
1,413.2
|
|
$
|
(10.2
|
)
|
(0.7
|
)%
|
||||||||
Historical Sales
Sales for the year ended
December 31, 2016
were
$1,064.2 million
, an increase of
$675.3 million
, or
173.6%
, compared to sales of
$388.9 million
for the year ended
December 31, 2015
. The increase in sales in our Performance Materials and Chemicals segment was due to the inclusion of legacy PQ sales of
$639.0 million
in our results of operations for the period from May 4, 2016 to December 31, 2016. The increase in sales within our Environmental Catalysts and Services segment was due to the inclusion of legacy PQ sales totaling
$53.0 million
in our results of operations for the period from May 4, 2016 to December 31, 2016, partly offset by a decrease of
$15.2 million
in sales from our refining services product group. The decrease in sales from our refining services product group was primarily due to lower pricing of
$29.7 million
, partially offset by an increase in volumes of
$14.5 million
. The lower pricing was driven by indexing to pass through lower raw material costs, mainly sulfur and natural gas. The higher volume was primarily driven by strong gasoline demand for the refining services product group, partly offset by lower virgin sulfuric acid shipments.
Pro Forma Sales
Performance Materials & Chemicals:
Performance Materials and Chemicals sales for the year ended
December 31, 2016
were
$947.2 million
, a decrease of
$18.9 million
, or
2.0%
, compared to sales of
$966.1 million
for the year ended
December 31, 2015
. The decrease in sales was primarily due to the unfavorable effects of foreign currency translation of
$25.1 million
, partially offset by higher average selling price and customer mix of
$4.4 million
and higher volumes of
$1.8 million
.
The increase in volumes in Performance Materials and Chemicals was the result of higher sales in precipitated silicas, spray dry silicate (in Europe) and strong customer demand for our personal care and microsphere products, which was partially offset by lower volumes of zeolite, beer gels, potassium silicate, spray dry silicate in the Americas, and microspheres within the performance materials product line. The lower demand in potassium silicate and spray dry silicate was due to lower drilling activity in North America. The higher average selling price is principally a result of favorable U.S. dollar denominated sales and U.S. dollar cost pass through pricing in certain foreign locations and higher selling prices for transportation safety and certain microsphere products, including hollow microspheres. Lower pricing for our cost adjusted pass through contracts in North America and lower microspheres customer mix partially offset this favorable pricing impact. The stronger U.S. dollar compared to a number of other major currencies, including the Canadian dollar, the Mexican peso, the British pound, and Brazilian real, unfavorably impacted our sales.
Environmental Catalysts & Services:
Environmental Catalysts and Services sales for the year ended
December 31, 2016
were
$457.9 million
, an increase of
$10.8 million
, or
2.4%
, compared to sales of
$447.1 million
for the year ended
December 31, 2015
. The increase in sales was primarily due to increased volumes of
$40.2 million
, partially offset by lower average selling price, primarily from lower cost pass through pricing of
$27.2 million
, and the unfavorable effects of foreign currency translation of
$2.2 million
.
64
Environmental Catalysts and Services sales were higher from increased sales volumes, which were primarily driven by strong demand across multiple product lines, primarily in our silica catalyst product group serving the packaging and engineered plastics end uses and strong gasoline demand within our refining services product group. Average selling prices in the silica catalysts product group increased from favorable customer mix. This was partially offset by unfavorable indexing to lower pass through raw material costs, mainly sulfur and natural gas.
Gross Profit
Historical Gross Profit
Gross profit for the year ended
December 31, 2016
was
$254.1 million
, an increase of
$144.0 million
, or
130.8%
compared with
$110.1 million
for the year ended
December 31, 2015
. The increase in gross profit was due to
$142.6 million
attributable to the inclusion of legacy PQ in our results of operations for the period from May 4, 2016 to December 31, 2016 and an increase of
$1.4 million
in gross profit from our refining services product group. The increase in refining services gross profit was due to lower manufacturing costs of
$30.6 million
and higher volumes of
$10.2 million
, which was offset by lower pricing and unfavorable customer mix of
$29.7 million
and higher depreciation expense of
$9.7 million
. The lower manufacturing costs were primarily driven by lower raw material pass through costs, including sulfur and natural gas, and from fixed plant cost reduction activities.
Pro Forma Gross Profit
Gross profit for the year ended
December 31, 2016
was
$365.9 million
, an increase of
$1.4 million
, or
0.4%
compared with
$364.5 million
for the year ended
December 31, 2015
. The increase in gross profit was due to lower manufacturing costs of
$35.5 million
and higher volumes of
$15.9 million
. The increase in gross profit was offset by increases in depreciation and amortization expense of
$19.0 million
, lower average selling price of
$22.8 million
, the unfavorable effects of foreign currency translation of
$7.6 million
and unfavorable product mix of
$0.6 million
.
The lower manufacturing costs were primarily driven by lower raw material pass-through costs, including sulfur, caustic and natural gas and by-product mix. The higher volume was primarily driven by strong demand across multiple product lines, including our silica catalyst product group serving the packaging and engineered plastics industries and our refining services product group, partially offset by lower volumes of higher margin potassium silicate and spray dry silicate (due to lower oil drilling activity) along with lower zeolite and beer gel volumes in the Americas. Our unfavorable variance in pricing relates to pass-through pricing of natural gas and sulfur.
Selling, General and Administrative Expenses
Historical:
Selling, general and administrative expenses for the year ended
December 31, 2016
were
$107.6 million
, an increase of
$73.0 million
compared with
$34.6 million
for the year ended
December 31, 2015
. The increase in selling, general and administrative expenses was due to
$76.2 million
attributable to the inclusion of legacy PQ in our results of operations for the period from May 4, 2016 to December 31, 2016, partly offset by
$3.2 million
of lower selling, general and administrative expenses from the benefit of cost reduction initiatives.
Pro Forma:
Selling, general and administrative expenses for the year ended
December 31, 2016
were
$145.0 million
as compared with
$140.9 million
for the year ended
December 31, 2015
.
Other Operating Expense, Net
Historical:
Other operating expense, net for the year ended
December 31, 2016
was
$62.3 million
, an increase of
$42.6 million
, or
216.2%
, compared with
$19.7 million
for the year ended
December 31, 2015
. The increase in other operating expense, net was due to
$48.4 million
attributable to the inclusion of legacy PQ in our results of operations for the period from May 4, 2016 to December 31, 2016, partly offset by
$5.6 million
of lower restructuring and severance related costs.
Pro Forma:
Other operating expense, net for the year ended
December 31, 2016
was
$75.0 million
, an increase of
$7.3 million
, or
10.8%
, compared with
$67.7 million
for the year ended
December 31, 2015
. The change was primarily driven by
$6.4 million
of intangible asset impairment charges,
$6.1 million
of higher restructuring and severance related charges and
$4.0 million
from the absence of prior year nitrogen oxide credit sales. These changes were partly offset by lower transaction and other related costs of
$10.2 million
. During the year ended December 31, 2015, we incurred separation charges related to an executive who left our company.
Equity in Net (Loss) Income of Affiliated Companies
Historical:
Equity in net loss of affiliated companies for the year ended
December 31, 2016
was
$2.6 million
. The loss was due to the impact of
$36.3 million
of amortization on the fair value step-up of the
underlying assets of our Zeolyst Joint Venture in connection with the Business Combination, partly offset by
$33.2 million
of earnings generated mainly by our Zeolyst Joint Venture from the Business Combination during the period from May 4, 2016 through December 31, 2016.
65
Pro Forma:
Equity in net income of affiliated companies for the year ended
December 31, 2016
was
$35.2 million
, a decrease of
$5.9 million
, compared with
$41.1 million
for the year ended
December 31, 2015
. The decrease was primarily driven by lower contribution from reduced sales of hydrocracking and specialty catalysts and other various cost increases, partially offset by increased volume in pressure products (primarily due to emission regulations). Cost drivers include higher fixed costs and depreciation from expansion and inflation, and growth-related increases in selling, general and administrative and research and development expense, partly offset by favorable inventory absorption. Hydrocracking demand was down primarily due to the timing of re-fills as the products used in hydrocracking typically have a two-to-four year life cycle before they must be replaced.
Interest Expense, Net
Historical:
Interest expense, net for the year ended
December 31, 2016
was
$140.3 million
, an increase of
$96.0 million
, or
216.7%
, as compared with
$44.3 million
for the year ended
December 31, 2015
. Interest expense increased primarily due to higher third-party interest expense under our new debt structure compared to the legacy Eco debt structure on a standalone basis.
Pro Forma:
Interest expense, net for the year ended
December 31, 2016
was
$187.9 million
, a decrease of
$11.7 million
, or
5.9%
, compared with
$199.6 million
for the year ended
December 31, 2015
. Interest expense decreased primarily due to the repricing of our new debt structure during the year ended December 31, 2016.
Debt Extinguishment Costs
Historical:
On May 4, 2016, and concurrently with the consummation of the Business Combination, the company refinanced its existing credit facilities. The company recorded
$4.7 million
of new creditor and third-party financing costs fees as debt extinguishment costs. In addition, previous unamortized deferred financing costs of
$6.3 million
and original issue discount of
$1.0 million
associated with the old debt were written off as debt extinguishment costs.
On November 14, 2016, the company repriced its existing senior secured term loan facility. The company recorded
$0.5 million
of new creditor and third-party financing costs fees as debt extinguishment costs. In addition, previously unamortized deferred financing costs of
$0.6 million
and original issue discount of
$0.7 million
associated with the previously outstanding debt were written off as debt extinguishment costs.
Pro Forma:
On November 14, 2016, the company repriced its existing senior secured term loan facility. The company recorded
$0.5 million
of new creditor and third-party financing costs fees as debt extinguishment costs. In addition, previously unamortized deferred financing costs of
$0.6 million
and original issue discount of
$0.7 million
associated with the old debt were written off as debt extinguishment costs.
Other (Income) Expense
Historical:
Other income, net was
$3.4 million
for the year ended
December 31, 2016
. Other income, net primarily consisted of
$3.6 million
of foreign currency gains for the year ended December 31, 2016 following the Business Combination,
primarily driven by the Euro-denominated term loan
and the non-permanent intercompany debt denominated in local currency and translated to U.S. dollars
. The Company did not incur any foreign exchange expense for the year ended
December 31, 2015
.
Pro Forma:
Other income, net was
$8.8 million
for the year ended
December 31, 2016
, a favorable change of
$30.1 million
, compared with
$21.3 million
of other expense, net for the year ended
December 31, 2015
. Other income, net primarily consisted of
$8.8 million
of foreign currency gains for the year ended
December 31, 2016
as compared to
$21.1 million
of foreign currency losses for the year ended
December 31, 2015
. The change in foreign currency for the year ended
December 31, 2016
was driven by gains on our Euro-denominated term loan offset by a strengthening U.S. dollar (as compared to the prior year) on non-permanent intercompany debt denominated in foreign currencies translated to U.S. dollars.
Provision for Income Taxes
Historical:
The provision for income taxes for the year ended
December 31, 2016
was
$10.0 million
. The effective income tax rate for the year ended
December 31, 2016
was
(14.5)%
. As a result of the Business Combination, Eco had a change in tax status. Eco was previously a partnership for tax purposes and, following the Business Combination, is taxed as a C-corporation. As a result of being a partnership, Eco had not previously recorded deferred taxes as its members were responsible for their respective tax liabilities. Upon the change in tax status, Eco’s net deferred tax liability was recorded as a charge to the tax provision.
66
Pro Forma:
The provision for income taxes for the year ended
December 31, 2016
was
$58.0 million
compared with a
$1.2 million
provision for the year ended
December 31, 2015
. The effective income tax rate for the year ended
December 31, 2016
was
22,295.0%
compared to
(4.8)%
for the year ended
December 31, 2015
. As a result of the Business Combination, Eco had a change in tax status. Eco was previously a partnership for tax purposes and, following the Business Combination, is taxed as a C-corporation. As a result of being a partnership, Eco had not previously recorded deferred taxes as its members were responsible for their respective tax liabilities. Upon the change in tax status, Eco’s net deferred tax liability was recorded as a charge to the tax provision. The company’s effective income tax rate fluctuates based on, among other factors, changes in income mix. The difference between the U.S. federal statutory income tax rate and the company’s effective income tax rate for the years ended
December 31, 2016
and
2015
was mainly due to the tax effect of repatriating foreign earnings back to the United States as dividends, differences between tax rates in foreign jurisdictions as compared to the U.S. tax rate, withholding taxes, and changes to reserves for uncertain tax positions.
Net (Loss) Income Attributable to PQ Group Holdings
Historical:
For the foregoing reasons and after the effect of the non-controlling interest in earnings of subsidiaries for each period presented, net loss attributable to PQ Group Holdings Inc. was
$79.7 million
for the year ended
December 31, 2016
compared with net income of
$11.5 million
for year ended
December 31, 2015
.
Pro Forma:
For the foregoing reasons and after the effect of the non-controlling interest in earnings of subsidiaries for each period presented, net loss attributable to PQ Group Holdings was
$59.0 million
for the year ended
December 31, 2016
compared to a net loss of
$26.9 million
for the year ended
December 31, 2015
.
Pro Forma Adjusted EBITDA
Summarized pro forma Segment Adjusted EBITDA information is shown below in the following table:
|
Pro Forma
|
|||||||||||||||
|
Years ended
December 31, |
Change
|
||||||||||||||
|
2016
|
2015
|
$
|
%
|
||||||||||||
|
(in millions, except percentages)
|
|||||||||||||||
|
Segment Adjusted EBITDA
(1)
:
|
|||||||||||||||
|
Performance Materials & Chemicals
|
$
|
231.8
|
|
$
|
241.7
|
|
$
|
(9.9
|
)
|
(4.1
|
)%
|
||||
|
Environmental Catalysts & Services
(2)
|
221.8
|
|
190.8
|
|
31.0
|
|
16.2
|
%
|
|||||||
|
Total Segment Adjusted EBITDA
(3)
|
453.6
|
|
432.5
|
|
21.1
|
|
4.9
|
%
|
|||||||
|
Unallocated corporate costs
|
(32.8
|
)
|
(19.4
|
)
|
(13.4
|
)
|
69.1
|
%
|
|||||||
|
Total Adjusted EBITDA
(3)
|
$
|
420.8
|
|
$
|
413.1
|
|
$
|
7.7
|
|
1.9
|
%
|
||||
|
(1)
|
We define Segment Adjusted EBITDA as EBITDA adjusted for certain items as noted in the reconciliation below. Our management evaluates the performance of our segments and allocates resources based primarily on Segment Adjusted EBITDA. Segment Adjusted EBITDA does not represent cash flow for periods presented and should not be considered as an alternative to net income as an indicator of our operating performance or as an alternative to cash flows as a source of liquidity. Segment Adjusted EBITDA may not be comparable with EBITDA or Adjusted EBITDA as defined by other companies.
|
|
(2)
|
The pro forma Adjusted EBITDA from the Zeolyst Joint Venture included in the Environmental Catalysts and Services segment is
$52.7 million
for the year ended
December 31, 2016
, which includes
$42.3 million
of equity in net income, excluding
$7.3 million
of amortization of investment in affiliate step-up plus
$10.3 million
of joint venture depreciation, amortization and interest. The pro forma Adjusted EBITDA from the Zeolyst Joint Venture included in the Environmental Catalysts and Services segment is
$55.4 million
for the year ended
December 31, 2015
, which includes
$47.4 million
of equity in net income, excluding
$6.6 million
of amortization of investment in affiliate step-up plus
$7.9 million
of joint venture depreciation, amortization and interest.
|
|
(3)
|
Our total Segment Adjusted EBITDA differs from our total consolidated Adjusted EBITDA due to unallocated corporate expenses.
|
67
Adjusted EBITDA for the year ended
December 31, 2016
was
$420.8 million
, an increase of
$7.7 million
, or
1.9%
, compared with
$413.1 million
for the year ended
December 31, 2015
.
Performance Materials & Chemicals:
Adjusted EBITDA for the year ended
December 31, 2016
was
$231.8 million
, a decrease of
$9.9 million
, or
4.1%
, compared with
$241.7 million
for the year ended
December 31, 2015
.
The decrease in Adjusted EBITDA was primarily due to the unfavorable effect of foreign currency translation of
$6.3 million
, prior year nitrogen oxide credit sales of
$4.0 million
that were not in the current year, and lower volumes of higher margin potassium silicate and spray dry silicate (due to lower oil drilling activity) along with lower zeolite and beer gel volumes in the Americas. This was partially offset by higher selling prices and mix improvements primarily from increased sales of higher margin specialty silicas, magnesium silicate, and spray dry silicates (in Europe), reduced sales of lower margin sodium silicates and improved mix in transportation safety.
Environmental Catalysts & Services:
Adjusted EBITDA for the year ended
December 31, 2016
was
$221.8 million
, an increase of
$31.0 million
, or
16.2%
, compared with
$190.8 million
for the year ended
December 31, 2015
.
The increase in Adjusted EBITDA was due to higher volume primarily driven by strong demand across multiple product lines, including our silica catalyst product group serving the packaging and engineered plastics industries and our refining services product group and lower fixed plant cost reductions and plant turnaround expense. This was partially offset by the unfavorable effect of foreign currency translation of
$1.0 million
and unfavorable product mix.
A reconciliation of pro forma Segment Adjusted EBITDA to pro forma net loss attributable to PQ Group Holdings is as follows:
|
Pro Forma
|
||||||||
|
Years ended
December 31, |
||||||||
|
2016
|
2015
|
|||||||
|
(in millions)
|
||||||||
|
Reconciliation of net loss attributable to PQ Group Holdings Inc. to Segment Adjusted EBITDA
|
||||||||
|
Net loss attributable to PQ Group Holdings Inc.
|
$
|
(59.0
|
)
|
$
|
(26.9
|
)
|
||
|
Provision for income taxes
|
58.0
|
|
1.2
|
|
||||
|
Interest expense
|
187.9
|
|
199.6
|
|
||||
|
Depreciation and amortization
|
165.8
|
|
152.2
|
|
||||
|
EBITDA
|
352.7
|
|
326.1
|
|
||||
|
Joint venture depreciation, amortization and interest
(a)
|
10.3
|
|
7.9
|
|
||||
|
Amortization of investment in affiliate step-up
(b)
|
5.8
|
|
6.6
|
|
||||
|
Amortization of inventory step-up
(c)
|
4.9
|
|
—
|
|
||||
|
Impairment of fixed assets, intangibles and goodwill
|
6.9
|
|
0.4
|
|
||||
|
Debt extinguishment costs
|
1.8
|
|
—
|
|
||||
|
Net loss on asset disposals
(d)
|
4.8
|
|
5.5
|
|
||||
|
Foreign currency exchange loss (gain)
(e)
|
(9.0
|
)
|
21.1
|
|
||||
|
Non-cash revaluation of inventory, including LIFO
|
1.3
|
|
(2.1
|
)
|
||||
|
Management advisory fees
(f)
|
5.3
|
|
5.6
|
|
||||
|
Transaction related costs
(g)
|
2.6
|
|
13.2
|
|
||||
|
Equity-based and other non-cash compensation
|
6.5
|
|
4.2
|
|
||||
|
Restructuring, integration and business optimization expenses
(h)
|
17.9
|
|
8.6
|
|
||||
|
Defined benefit plan pension cost
(i)
|
2.8
|
|
6.1
|
|
||||
|
Transition services
(j)
|
—
|
|
4.9
|
|
||||
|
Other
(k)
|
6.2
|
|
5.1
|
|
||||
|
Adjusted EBITDA
|
420.8
|
|
413.2
|
|
||||
|
Unallocated corporate costs
|
32.8
|
|
19.4
|
|
||||
|
Total Segment Adjusted EBITDA
|
$
|
453.6
|
|
$
|
432.6
|
|
||
68
|
(a)
|
We use Adjusted EBITDA as a performance measure to evaluate our financial results. Because our Environmental Catalysts and Services segment includes our 50% interest in our Zeolyst Joint Venture, we include an adjustment for our 50% proportionate share of depreciation, amortization and interest expense of our Zeolyst Joint Venture.
|
|
(b)
|
Represents the amortization of the fair value adjustments associated with the equity affiliate investment in our Zeolyst Joint Venture as a result of the Business Combination. We determined the fair value of the equity affiliate investment and the fair value step-up was then attributed to the underlying assets of our Zeolyst Joint Venture. Amortization is primarily related to the fair value adjustments associated with inventory, fixed assets and intangible assets, such as customer relationships, formulations and product technology.
|
|
(c)
|
As a result of the Business Combination, there was a step-up in the fair value of inventory at PQ Holdings, which is amortized through cost of goods sold in the income statement.
|
|
(d)
|
We do not have a history of significant asset disposals. However, when asset disposals occur, we remove the impact of net gain/loss of the disposed asset because such impact primarily reflects the non-cash write-off of long-lived assets no longer in use.
|
|
(e)
|
Reflects the exclusion of the negative or positive transaction gains and losses of foreign currency in the income statement
primarily driven by the Euro-denominated term loan
and the non-permanent intercompany debt denominated in local currency and translated to U.S. dollars
.
|
|
(f)
|
Reflects consulting fees paid to CCMP and affiliates of INEOS for consulting services that include certain financial advisory and management services. These payments ceased as of the closing of our initial public offering.
|
|
(g)
|
Relates to certain transaction costs described elsewhere in our consolidated financial statements as well as other costs related to several transactions that are either completed, pending or abandoned and that we believe are not representative of our ongoing business operations.
|
|
(h)
|
Includes the impact of restructuring, integration and business optimization expenses that are related to specific, one-time items, including severance for a reduction in force and post-merger integration costs that are not expected to recur.
|
|
(i)
|
Represents adjustments for defined benefit pension plan costs in our income statement. More than two-thirds of our defined benefit pension plan obligations are under defined benefit pension plans that are frozen and the remaining obligations primarily relate to plans operated in certain of our non-U.S. locations that, pursuant to jurisdictional requirements, cannot be frozen. As such, we do not view such expenses as core to our ongoing business operations.
|
|
(j)
|
Represents costs under a transition services agreement with Solvay that provided certain transition services to legacy Eco by Solvay following the 2014 Acquisition. The transition services agreement ended in 2015.
|
|
(k)
|
Other costs consist of certain expenses that are not core to our ongoing business operations and are generally related to specific, one-time items, including environmental remediation-related costs associated with the legacy operations of our business prior to the Business Combination, capital and franchise taxes, non-cash asset retirement obligation accretion and the initial implementation of procedures to comply with Section 404 of the Sarbanes-Oxley Act.
|
69
Pro Forma Adjusted Net Income (loss)
Summarized pro forma adjusted net income (loss) information is shown below in the following table:
|
Pro Forma
|
||||||||
|
Years ended
December 31, |
||||||||
|
2016
|
2015
|
|||||||
|
(in millions)
|
||||||||
|
Reconciliation of net loss attributable to PQ Group Holdings Inc. to Adjusted Net Income (Loss)
(1) (2)
|
||||||||
|
Net loss attributable to PQ Group Holdings Inc.
|
$
|
(59.0
|
)
|
$
|
(26.9
|
)
|
||
|
Amortization of investment in affiliate step-up
(b)
|
3.6
|
|
4.1
|
|
||||
|
Amortization of inventory step-up
(c)
|
3.0
|
|
—
|
|
||||
|
Impairment of fixed assets, intangibles and goodwill
|
4.3
|
|
0.4
|
|
||||
|
Debt extinguishment costs
|
1.1
|
|
—
|
|
||||
|
Net loss on asset disposals
(d)
|
3.1
|
|
3.5
|
|
||||
|
Foreign currency exchange loss (gain)
(e)
|
(1.6
|
)
|
15.3
|
|
||||
|
Non-cash revaluation of inventory, including LIFO
|
0.8
|
|
(1.3
|
)
|
||||
|
Management advisory fees
(f)
|
3.3
|
|
3.5
|
|
||||
|
Transaction related costs
(g)
|
1.5
|
|
8.5
|
|
||||
|
Equity-based and other non-cash compensation
|
4.0
|
|
2.6
|
|
||||
|
Restructuring, integration and business optimization expenses
(h)
|
11.4
|
|
5.5
|
|
||||
|
Defined benefit plan pension cost
(i)
|
2.0
|
|
4.1
|
|
||||
|
Transition services
(j)
|
—
|
|
3.0
|
|
||||
|
Other
(k)
|
3.8
|
|
3.2
|
|
||||
|
Adjusted Net Income (Loss)
|
$
|
(18.7
|
)
|
$
|
25.5
|
|
||
|
(1)
|
We define adjusted net income as net loss attributable to PQ Group Holdings adjusted for non-operating income or expense and the impact of certain non-cash or other items that are included in net income that we do not consider indicative of our ongoing operating performance. Adjusted net income is presented as a key performance indicator as we believe it will enhance a prospective investor’s understanding of our results of operations and financial condition. Adjusted net income may not be comparable with net income or adjusted net income as defined by other companies.
|
|
(2)
|
Refer to the Adjusted EBITDA notes above for more information with respect to each adjustment.
|
The adjustments to net income (loss) attributable to PQ Group Holdings Inc. are shown net of applicable statutory tax rates.
70
Financial Condition, Liquidity and Capital Resources
Our primary sources of liquidity consist of cash flow from operations, existing cash balances as well as funds available under our asset based lending revolving credit facility. We expect that ongoing requirements for debt service and capital expenditures will be funded from these sources. Our primary liquidity requirements include funding working capital requirements (primarily inventory and accounts receivable, net of accounts payable and other accrued liabilities), debt service requirements and capital expenditures. Our capital expenditures include both maintenance capital, which includes spending on maintenance of business and health, safety and environmental initiatives, and expansion capital, which includes spending to drive organic sales growth and cost savings initiatives. For the years ended
December 31, 2017
,
2016
and
2015
we spent approximately
$114.4 million
,
$98.7 million
and
$41.0 million
, respectively, in maintenance capital expenditures. For the years ended
December 31, 2017
,
2016
and
2015
we spent approximately
$26.7 million
,
$31.6 million
and
$0.9 million
, respectively, in expansion capital expenditures.
We believe that our existing cash, cash equivalents and cash flows from operations, combined with availability under our asset based lending revolving credit facility, will be sufficient to meet our presently anticipated future cash needs for at least the next 12 months. We may also pursue strategic acquisition opportunities, which may impact our future cash requirements. We may, from time to time, increase borrowings under our asset based lending revolving credit facility to meet our future cash needs. As of
December 31, 2017
, we had cash and cash equivalents of
$66.2 million
and availability of
$149.6 million
under our asset based lending revolving credit facility, after giving effect to
$19.6 million
of outstanding letters of credit and
$25.0 million
of revolving credit facility borrowings, for a total available liquidity of
$215.8 million
. As of
December 31, 2017
, we were in compliance with all covenants under our debt agreements.
Included in our cash and cash equivalents balance as of
December 31, 2017
was
$53.4 million
of cash and cash equivalents held in foreign jurisdictions. We repatriate cash held outside of the United States from certain foreign subsidiaries in order to meet domestic liquidity needs. In certain cases, the repatriation of foreign cash under current U.S. tax laws is subject to income taxes. We have an intercompany loan structure in place with several of our foreign subsidiaries that allows us, under current U.S. tax laws, to repatriate foreign cash in a tax efficient manner from those subsidiaries. Depending on domestic and foreign cash needs, we have the flexibility to repatriate foreign cash to meet our future liquidity needs, subject to satisfaction of any applicable U.S. income taxes. Due to the enactment of the TCJA in December 2017, future overseas earnings repatriation will no longer be subject to U.S. federal income taxes at the time of cash distribution. However, future earnings may still be taxed for state income tax purposes, as well as subject to certain foreign withholding tax obligations, when cash amounts are distributed back to the U.S.
As of
December 31, 2017
, our total indebtedness was
$2,270.3 million
, with up to
$149.6 million
of available borrowings under our asset based lending revolving credit facility. Our liquidity requirements are significant, primarily due to debt service requirements. As reported, our cash interest expense for the years ended
December 31, 2017
,
2016
and
2015
was approximately
$170.1 million
,
$132.6 million
and
$44.1 million
, respectively. Before any impact of hedges, a one percent change in assumed interest rates for our variable interest credit facilities would have an annual impact of approximately
$12.9 million
on interest expense.
On October 3, 2017, we completed the initial public offering of our common stock and issued and sold 29,000,000 shares of our common stock at a public offering price of $17.50 per share, for aggregate gross proceeds of
$507.5 million
. The aggregate net proceeds received by us from the offering were approximately
$480.7 million
, net of underwriting discounts of
$24.1 million
and offering expenses of
$2.7 million
, net of reimbursements. The net proceeds were used to repay $446.2 million in aggregate principal amount of PQ Corporation’s Floating Rate Senior Unsecured Notes due 2022, together with accrued and unpaid interest and applicable redemption premiums. We recorded approximately $40.5 million of debt extinguishment costs related to the repayment of the Floating Rate Senior Unsecured Notes due 2022 in October 2017. We anticipate the redemption of the Floating Rate Senior Unsecured Notes will reduce our annual interest expense by approximately $53.9 million. Our ability to make payments on and to refinance our indebtedness will depend on our ability to generate cash in the future.
71
Cash Flow
|
Years ended
December 31, |
||||||||||||
|
2017
|
2016
|
2015
|
||||||||||
|
(in millions)
|
||||||||||||
|
Net cash provided by (used in)
|
||||||||||||
|
Operating activities
|
$
|
116.1
|
|
$
|
119.7
|
|
$
|
44.7
|
|
|||
|
Investing activities
|
(182.7
|
)
|
(1,929.7
|
)
|
(38.7
|
)
|
||||||
|
Financing activities
|
68.9
|
|
1,861.4
|
|
(3.4
|
)
|
||||||
|
Effect of exchange rate changes on cash and cash equivalents
|
(6.9
|
)
|
(5.9
|
)
|
—
|
|
||||||
|
Net change in cash and cash equivalents
|
(4.5
|
)
|
45.5
|
|
2.6
|
|
||||||
|
Cash and cash equivalents at beginning of period
|
70.7
|
|
25.2
|
|
22.6
|
|
||||||
|
Cash and cash equivalents at end of period
|
$
|
66.2
|
|
$
|
70.7
|
|
$
|
25.2
|
|
|||
|
Years ended
December 31, |
||||||||||||
|
2017
|
2016
|
2015
|
||||||||||
|
(in millions)
|
||||||||||||
|
Working capital changes that provided (used) cash:
|
||||||||||||
|
Receivables
|
$
|
(11.5
|
)
|
$
|
27.8
|
|
$
|
(0.3
|
)
|
|||
|
Inventories
|
(21.2
|
)
|
(2.3
|
)
|
(1.7
|
)
|
||||||
|
Prepaids and other current assets
|
(3.4
|
)
|
0.5
|
|
20.1
|
|
||||||
|
Accounts payable
|
4.3
|
|
11.9
|
|
(2.5
|
)
|
||||||
|
Accrued liabilities
|
(6.5
|
)
|
(23.9
|
)
|
(13.8
|
)
|
||||||
|
Other, net
|
(3.1
|
)
|
(6.8
|
)
|
(4.7
|
)
|
||||||
|
$
|
(41.4
|
)
|
$
|
7.2
|
|
$
|
(2.9
|
)
|
||||
Year Ended
December 31, 2017
Compared to the Year Ended
December 31, 2016
Net cash provided by operating activities was
$116.1 million
for the year ended
December 31, 2017
, compared to
$119.7 million
provided in the year ended
December 31, 2016
. Cash generated by operating earnings after giving effect to non-cash items recognized in the income statement during the period was higher during the year ended
December 31, 2017
by
$45.0 million
compared to the prior year. Cash provided by working capital during the year ended
December 31, 2017
was unfavorable compared to the year ended
December 31, 2016
. Working capital for the year ended
December 31, 2017
used cash of
$41.4 million
, compared to cash provided of
$7.2 million
for the year ended
December 31, 2016
.
The increase in operating earnings after giving effect to non-cash items of
$45.0 million
as compared to the prior year was due to the inclusion of a full period of legacy PQ operating earnings, stronger results generated by increased sodium silicate industrial demand, earnings from the Sovitec acquisition, higher pricing from renegotiated regeneration services contracts and increased dividends from our Zeolyst Joint Venture which was partly offset by start-up costs for the new ThermoDrop® production facility.
The decrease in cash from working capital of
$48.6 million
compared to the prior year was primarily due to the inclusion of legacy PQ working capital for the year ended
December 31, 2017
as compared to the period from May 4, 2016 through
December 31, 2016
in the prior year. This resulted in unfavorable changes in accounts receivable, inventory, prepaid and other current assets and accounts payable. The unfavorable change was partially offset by favorable changes in accrued liabilities.
In addition to the inclusion of a full period of legacy PQ working capital, the unfavorable change in accounts receivable was a result of higher accounts receivables from higher current year pricing and volumes. The unfavorable change in inventory was driven by inventory build for our new ThermoDrop® product offering. The unfavorable change in accounts payable is due to timing of payments for capital expenditures, increased costs related to our plant closures in Europe and higher raw material costs. The favorable change in accrued liabilities is primarily due to the timing of accrued interest under our new debt structure.
Net cash used in investing activities was
$182.7 million
for the year ended
December 31, 2017
, compared to cash used of
$1,929.7 million
during the year ended
December 31, 2016
. Current year uses of cash include utilizing
$140.5 million
to fund capital expenditures and
$41.6 million
to fund the Sovitec acquisition. Prior year uses of cash include utilizing
$1,777.7 million
to fund the Business Combination and
$121.4 million
to fund capital expenditures.
72
Net cash provided by financing activities was
$68.9 million
for the year ended
December 31, 2017
, compared to net cash provided of
$1,861.4 million
for the year ended
December 31, 2016
. The current year sources of cash flows from financing activities were driven by our recent IPO, which generated
$480.7 million
of cash used to repay a portion of our Floating Rate Senior Unsecured Notes due 2022. In addition, we used the proceeds of our
$300.0 million
Senior Unsecured Notes due 2025 to repay the remaining Floating Rate Senior Unsecured Notes due 2022 as well as our 8.5% Senior Notes due 2022.
The change in cash from financing activities for the year ended
December 31, 2016
was primarily driven by the issuance of
$2,339.0 million
in debt, net of financing fees, related to the Business Combination in the prior year, partially offset by
$465.7 million
in debt repayments and
$22.0 million
in net revolver borrowings.
Year Ended
December 31, 2016
Compared to the Year Ended
December 31, 2015
Net cash provided by operating activities was
$119.7 million
for the year ended
December 31, 2016
, compared to
$44.7 million
provided in the year ended
December 31, 2015
. Cash generated by operating earnings after giving effect to non-cash items recognized in the income statement during the period was higher during the year ended
December 31, 2016
by
$64.8 million
compared to the prior year. Cash provided by working capital during the year ended
December 31, 2016
was favorable compared to the year ended
December 31, 2015
. Working capital for the year ended
December 31, 2016
provided cash of
$7.2 million
, compared to cash used of
$2.9 million
for the year ended
December 31, 2015
.
The increase in operating earnings after giving effect to non-cash items of
$64.8 million
as compared to the prior year was due to the inclusion of legacy PQ earnings from the period of May 4, 2016 through December 31, 2016.
The increase in cash from working capital of
$10.1 million
compared to the prior year was primarily due to favorable changes in accounts receivable and accounts payable, partially offset by unfavorable changes in prepaid and other current assets, accrued liabilities and other long-term assets and liabilities.
The favorable change in accounts receivable was due primarily to
$1.2 million
of lower accounts receivable from lower pricing and higher collections and
$26.9 million
due to the impact from the Business Combination. The favorable change in accounts payable includes
$12.5 million
favorability from timing of plant turnaround capital expenditures and higher raw material and transportation purchases.
The unfavorable change in prepaid expenses and other current assets was due to decreases in other receivable balances, mainly the prior year legacy Eco collection of
$23.3 million
from Solvay related to the 2014 Acquisition. The unfavorable change in accrued liabilities was mainly due to the timing of various accruals.
Net cash used in investing activities was
$1,929.7 million
for the year ended
December 31, 2016
, compared to net cash used of
$38.7 million
during the year ended
December 31, 2015
. The increase in current year cash used in investing activities compared to the prior year was primarily due to the Business Combination activity, net of cash acquired in the Business Combination of
$1,777.7 million
, increases in capital spending of
$80.4 million
and increases in loans receivable of
$15.6 million
and related increases in restricted cash of
$14.8 million
under the NMTC financing. The capital expenditures increase was primarily due to
$75.4 million
related to the companies acquired as part of the Business Combination and
$5.0 million
in legacy Eco capital spending. Higher current year strategic project costs were partly offset by lower plant turnaround expenses.
Net cash provided by financing activities was
$1,861.4 million
for the year ended
December 31, 2016
, compared to net cash used of
$3.5 million
during the year ended
December 31, 2015
. The change in cash from financing activities was primarily driven by
$1,865.0 million
debt issuance activity from the Business Combination, net of repayments,
$22.0 million
net revolver payments, recent stock purchase activity of
$2.5 million
and payments of
$1.6 million
related to hedge premiums. This was partially offset by
$22.0 million
of cash received under the issuance of long-term debt under the NMTC financing and
$5.1 million
of current year equity contributions, most of which resulted from the Business Combination.
73
Debt
|
December 31,
|
||||||||
|
2017
|
2016
|
|||||||
|
(in millions)
|
||||||||
|
Term Loan Facility (U.S. dollar denominated)
|
$
|
916.2
|
|
$
|
925.4
|
|
||
|
Term Loan Facility (Euro denominated)
|
335.8
|
|
297.3
|
|
||||
|
6.75% Senior Secured Notes due 2022
|
625.0
|
|
625.0
|
|
||||
|
5.75% Senior Unsecured Notes due 2025
|
300.0
|
|
—
|
|
||||
|
Floating Rate Senior Unsecured Notes due 2022
|
—
|
|
525.0
|
|
||||
|
8.5% Senior Notes due 2022
|
—
|
|
200.0
|
|
||||
|
ABL Facility
|
25.0
|
|
—
|
|
||||
|
Other
|
68.3
|
|
45.2
|
|
||||
|
Total debt
|
2,270.3
|
|
2,618.0
|
|
||||
|
Original issue discount
|
(18.4
|
)
|
(28.5
|
)
|
||||
|
Deferred financing costs
|
(21.4
|
)
|
(27.3
|
)
|
||||
|
Total debt, net of original issue discount and deferred financing costs
|
2,230.5
|
|
2,562.2
|
|
||||
|
Less: current portion
|
(45.2
|
)
|
(14.5
|
)
|
||||
|
Total long-term debt
|
$
|
2,185.3
|
|
$
|
2,547.7
|
|
||
As of
December 31, 2017
our total debt was
$2,270.3 million
, including
$16.5 million
of other foreign debt and
$51.8 million
of notes payable for the NMTC financing and excluding the original issue discount of
$18.4 million
and deferred financing fees of
$21.4 million
for our senior secured credit facilities and notes. Our net debt was
$2,135.8 million
, excluding
$16.5 million
of other foreign debt,
$51.8 million
of NMTC, and including cash of
$66.2 million
. Our total available liquidity as of
December 31, 2017
was
$215.8 million
, which represents our cash on hand of
$66.2 million
plus our excess availability under our asset based lending revolving credit facility of
$149.6 million
, after giving effect to
$19.6 million
of outstanding letters of credit and
$25.0 million
of ABL revolver borrowings. We may seek, subject to market conditions and other factors, opportunities to repurchase, refinance or otherwise reprice our debt.
Senior Secured USD and Euro Term Loans and Asset-Based Revolving Loan
Concurrent with the Business Combination, we entered into new senior secured credit facilities (collectively, the “New Senior Secured Credit Facilities”) comprised of a
$1,200,000.0
million term loan facility consisting of a
$900.0 million
U.S. dollar-denominated tranche and a
$300.0 million
Euro-denominated (or
€265.0 million
) tranche (the “Term Loan Facility”), and a
$200.0 million
asset-based revolving credit facility (the “ABL Facility”).
The Term Loan Facility was issued at 99.0% of the principal amount. Borrowings under the Term Loan Facility bore interest at a rate equal to the LIBOR rate (or EURIBOR rate, as applicable) or the base rate elected by us at the time of the borrowing plus a margin of 4.75% or 3.75%, respectively. Further, the LIBOR rate and base rate elected under the facilities were subject to a floor of 1.00% and 2.00%, respectively. The Term Loan Facility required minimum scheduled quarterly principal payments equal to 0.25% of the original principal amount of the term loans made on the closing date of the Business Combination. The Term Loan Facility had a maturity date of November 4, 2022.
On November 14, 2016 (the “First Amendment Closing Date”), we entered into the First Amendment Agreement to the Term Loan Facility (the “First Amendment”) pursuant to which we, among other things: (a) refinanced the existing
$900.0 million
U.S. dollar-denominated tranche by issuing a U.S. dollar-denominated replacement term loan in the amount of
$927.8 million
and (b) refinanced the existing
€265.0 million
(or
$300.0 million
) Euro-denominated tranche by issuing a Euro-denominated replacement term loan in the amount of
€283.3 million
. Included in the U.S. dollar-denominated replacement term loan was an additional
$30.0 million
principal amount of borrowings. Included in the Euro-denominated replacement term loan was an additional
€19.0 million
principal amount of borrowings. The borrowings under the First Amendment bore interest at a rate equal to the LIBOR rate or the base rate elected by us at the time of borrowing plus a margin of 4.25% for U.S. dollar-denominated LIBOR Rate loans, 4.00% for Euro-denominated LIBOR Rate loans or 3.25% for base rate loans. These new replacement term loans had substantially the same terms under the original Term Loan Facility subject to the amendments contained in the First Amendment.
74
On August 7, 2017, we re-priced the
$927.8 million
U.S. dollar-denominated tranche and the
€283.3 million
Euro-denominated tranche to reduce the applicable interest rates. The terms of the facilities were substantially consistent following the re-pricing, except that borrowings under the term loans bore interest at a rate equal to the LIBOR rate plus a margin of 3.25% with respect to U.S. dollar-denominated LIBOR rate loans, and the EURIBOR rate plus a margin of 3.25% with respect to Euro-denominated EURIBOR rate loans. In addition, the LIBOR rate elected under the facilities was subject to a floor of 0% and the EURIBOR rate elected under the facilities was subject to a floor of 0.75%.
On February 8, 2018, we refinanced the Term Loan Facility with a new $1,267.0 million senior secured term loan facility (the “New Term Loan Facility”) by entering into a third amendment agreement, which amended and restated the Term Loan Facility. The New Term Loan Facility bears interest at a floating rate of LIBOR (with a zero percent minimum LIBOR floor) plus 2.50% per annum and matures in February 2025, effectively lowering the interest rate margin and extending the maturity of our senior secured term loan facility. The New Term Loan Facility requires scheduled quarterly amortization payments, each equal to 0.25% of the original principal amount of the loans under the New Term Loan Facility.
The ABL Facility provides for up to
$200.0 million
in revolving credit borrowings consisting of up to
$150.0 million
in U.S. available borrowings, up to
$10.0 million
in Canadian available borrowings and up to
$40.0 million
of European available borrowings. Borrowings under the ABL Facility bear interest at a rate equal to the LIBOR rate or the base rate elected by us at the time of the borrowing plus a margin of between 1.50%-2.00% or 0.50%-1.00%, respectively, depending on availability under the ABL Facility. In addition, there is an annual commitment fee equal to 0.375%, with a step-down to 0.25% based on the average usage of the revolving credit borrowings available. As of December 31, 2017, there were
$25.0 million
in revolving credit borrowings under the ABL Facility. Revolving credit borrowings are payable at the option of our company throughout the term of the ABL Facility with the balance due May 4, 2021. We were in compliance with all debt covenants as of
December 31, 2017
and
2016
, respectively.
Senior Secured Notes
Concurrent with the Business Combination, we issued
$625.0 million
of 6.750% Senior Secured Notes due November 2022 (the “Senior Secured Notes”) in transactions exempt from or not subject to registration under the Securities Act pursuant to Rule 144A and Regulation S under the Securities Act of 1933. Interest on the Senior Secured Notes is payable on May 15 and November 15 of each year, commencing November 15, 2016. No principal payments are required with respect to the Senior Secured Notes prior to their final maturity. The Senior Secured Notes mature on November 15, 2022.
Senior Unsecured Notes - Redeemed as of December 11, 2017
Concurrent with the Business Combination, we issued
$525.0 million
aggregate principal amount of floating rate Senior Unsecured Notes due 2022 (the “Senior Unsecured Notes”) in a concurrent private placement exempt from the registration requirements of the Securities Act. The notes were issued at 98.0% of the principal amount. The Senior Unsecured Notes were to mature on May 1, 2022; provided that if the 2022 Notes have been refinanced or otherwise repaid prior to such date, the Senior Unsecured Notes were to mature on May 1, 2023. Interest on the Senior Unsecured Notes was paid and reset quarterly at an annual rate equal to the three-month LIBOR plus 10.75% per year, with a 1.0% LIBOR floor. Interest was payable on March 15, June 15, September 15, and December 15 of each year, commencing on June 15, 2016.
In conjunction with our IPO, on October 3, 2017, we redeemed $446.2 million in aggregate principal of the
$525.0 million
of PQ Corporation’s Senior Unsecured Notes using the proceeds from the IPO. Following the redemption, $78.8 million aggregate principal amount of the Senior Unsecured Notes remained outstanding. We paid a redemption premium of
$32.3 million
, which was recorded as debt extinguishment costs.
On December 11, 2017, we redeemed the remaining $78.8 million aggregate principal amount of the Senior Unsecured Notes with the proceeds from the issuance of the 5.75% Senior Unsecured Notes due 2025. We paid a redemption premium of
$6.0 million
, which was recorded as debt extinguishment costs. Refer to the 5.75% Senior Unsecured Notes section of this Management’s Discussion and Analysis for further information.
Senior Secured Credit Facilities - Refinanced as of May 4, 2016
In December 2014, Eco Services entered into the Senior Secured Credit Facility, which included a $500.0 million term loan facility and a $55.0 million revolving credit facility (the “Senior Credit Agreement”). The term loan facility was issued at 99.5% of the principal amount. The term loan was repaid and the existing Senior Credit Agreement was terminated in connection with the Business Combination.
8.5% Senior Notes due 2022 - Redeemed as of December 11, 2017
In December 2014, Eco Services issued
$200.0 million
aggregate principal amount of 8.50% senior notes due 2022 (the “2022 Notes”) under an indenture dated October 24, 2014. The 2022 Notes were issued in a private transaction exempt from the registration requirements of the Securities Act. Pursuant to the indenture governing the 2022 Notes, we assumed the obligations of Eco Services under the 2022 Notes following the Business Combination. Interest on the 2022 Notes was payable on May 1 and November 1 of each year.
75
On December 11, 2017, we redeemed the
$200.0 million
aggregate principal amount of the 2022 Notes with the proceeds from the issuance of the 5.75% Senior Unsecured Notes due 2025. We paid a redemption premium of $8.0 million, which was recorded as debt extinguishment costs. Refer to the 5.75% Senior Unsecured Notes section of this note for further information.
5.75% Senior Unsecured Notes due 2025
On December 11, 2017, we issued
$300.0 million
aggregate principal amount of floating rate Senior Unsecured Notes due 2025 (the “5.75% Senior Unsecured Notes”) in a private placement exempt from the registration requirements of the Securities Act. The 5.75% Senior Unsecured Notes mature on December 15, 2025. Interest on the 5.75% Senior Unsecured Notes is to be paid semi-annually on February 15 and August 15, commencing August 15, 2018, at an annual rate of 5.75% per year.
New Markets Tax Credit Financing
The Performance Materials (Potters Industries, LLC (“Potters”)) portion of our Performance Materials & Chemicals business has entered in to various New Market Tax Credit (“NMTC”) financing arrangements to fund the expansion of Potter’s manufacturing facilities in Paris, Texas and Augusta, Georgia. The NMTC program, which is administered by the United States Treasury Department, requires certain balance sheet commitments. The NMTC financing arrangements will provide us with certain monetary benefits as an offset to specifically identified capital expenditures. The NMTC arrangements require that certain commitments and covenants be maintained over the course of seven years of the closing transaction in order to recognize the benefit.
On October 24, 2013, PQ Holdings’ (and now our) subsidiary Potters entered into a NMTC financing arrangement with JPMorgan Chase Bank N.A. and several of its affiliates (“Chase”) and TX CDE V LLC, an affiliate of Texas LIC Development Company LLC d/b/a Texas Community Development Capital (“TX CDE”), whereby Chase agreed to contribute
$6.6 million
and an additional
$15.6 million
in funds lent to Chase by Potters Holdings II, L.P. to TX CDE. TX CDE, in turn, lent
$21.0 million
in the form of
$5.4 million
and
$15.6 million
notes to Potters, which used the proceeds to finance the expansion of Potters’ manufacturing facility in Paris, Texas (the “2013 NMTC Agreement”). The capital expenditures associated with the 2013 NMTC Agreement were completed in 2014. The
$21.0 million
of debt related to the 2013 NMTC Agreement was assumed as part of the Business Combination and was outstanding as of
December 31, 2017
.
On May 17, 2016, Potters entered into a NMTC financing arrangement with U.S. Bank N.A. and several of its affiliates (“USB”) and MRC XX LLC, an affiliate of Midwest Renewable Capital, LLC (“MRC”), whereby USB agreed to contribute
$3.7 million
and an additional
$7.8 million
in funds lent to USB by Potters Holdings II, L.P. to MRC. MRC, in turn, lent
$11.0 million
in the form of
$7.8 million
,
$1.3 million
and
$1.9 million
notes to Potters, which used the proceeds to finance the expansion of Potters’ manufacturing facility in Augusta, Georgia (the “May 2016 NMTC Agreement”). The
$11.0 million
was outstanding as of
December 31, 2017
. The capital expenditures associated with the May 2016 NMTC Agreement were completed in 2017.
On December 29, 2016, Potters entered into a second NMTC financing arrangement with USB and MRC whereby USB agreed to contribute
$3.8 million
and an additional
$7.8 million
in funds lent to USB by Potters Holdings II, L.P. to MRC. MRC, in turn, lent
$11.0 million
in the form of
$7.8 million
,
$1.4 million
and
$1.8 million
notes to Potters, which used the proceeds as working capital for another expansion of Potters’ manufacturing facility in Paris, Texas (the “December 2016 NMTC Agreement”). The
$11.0 million
was outstanding as of
December 31, 2017
. The capital expenditures associated with the December 2016 NMTC were completed in 2017.
On June 22, 2017, Potters entered into a NMTC financing arrangement with USB and Business Conduit No. 28, LLC, an affiliate of Community Reinvestment Fund, Inc. (“CRF”). USB contributed
$3.1 million
to USB Investment Fund, and Potters Leveraged Lender LLC, our indirect subsidiary, lent USB Investment Fund
$6.2 million
. USB Investment Fund then contributed
$9.0 million
to CRF, which in turn lent
$8.8 million
to Potters pursuant to a credit agreement (the “June 2017 NMTC Agreement”). Potters used the
$8.8 million
in proceeds to acquire equipment for the expansion of Potters’ manufacturing facility in Paris, Texas. The
$8.8 million
was outstanding as of
December 31, 2017
. The capital expenditures associated with the June 2017 NMTC Agreement are expected to be completed in 2018.
76
Sovitec Debt
On June 12, 2017, we acquired Sovitec and assumed its obligations to Belfius Bank NV (“Belfius”). On June 8, 2017, Sovitec entered into a credit agreement with Belfius governing a
€14.5 million
credit line which is divided into four tranches. Tranche A was issued in the amount of
€7.5 million
in the form of a Euro roll-over credit with a maturity date of December 31, 2021. Tranche B was issued in the amount of
€3.0 million
in the form of a Euro roll-over credit with a full principal payment due on its maturity date of September 30, 2022. A working capital line of credit (“Working Capital”) of
€3.0 million
was issued under the form of straight loans with a maturity date up to 90 days after borrowings are made on the line. A capital expenditure line of credit (“CAPEX line”) of
€1.0 million
was issued under the form of straight loans with a maturity date of September 30, 2021. Tranche A is subject to principal payments of
€0.8 million
made on September 30 and December 31 of each year. Borrowings under the credit agreement bear rates based on Sovitec’s ratio of net debt to Normalized EBITDA. Normalized EBITDA is defined as the Sovitec consolidated operating profit before non-recurring items (i.e. items non-related to normal operations of the last twelve month period and provided an acceptable description of the one-off character of those items is given) and before taxation, depreciation and amortization. Interest rate margins are subject to being reset on June 30 of each year. Interest rates reset based on three net debt to Normalized EBITDA ratio ranges of less than 2, between 2 and 3 or greater than 3. Rates for each tranche of debt reset based on 1 to 9 month EURIBOR rates (not lower than zero) plus a margin that can range between
1.10%
to
1.55%
for Tranche A,
1.85%
to
2.15%
for Tranche B,
0.90%
and
1.20%
for Working Capital and
1.25%
and
1.80%
for the CAPEX line.
As of
December 31, 2017
, the interest rate on the credit agreements are as follows: Tranche A,
1.10%
, Tranche B,
1.85%
, Working Capital,
0.90%
and CAPEX
1.40%
. As of
December 31, 2017
, the following principal balances are outstanding on each debt instrument: Tranche A,
$7.2 million
, Tranche B,
$3.6 million
, Working Capital,
$2.2 million
and CAPEX
$1.2 million
. We were in compliance with all debt covenants as of
December 31, 2017
.
Capital Expenditures
Maintenance capital expenditures include spending on maintenance of business, cost savings initiatives and health, safety and environmental initiatives. Expansion capital expenditures include spending to drive organic sales growth. These capital expenditures represent our “book” capital expenditures for which the company has recorded, but not necessarily paid for the capital expenditures.
|
|
Years ended
December 31, |
|||||||||||
|
|
2017
|
2016
|
2015
|
|||||||||
|
|
(in millions)
|
|||||||||||
|
Maintenance capital expenditures
|
$
|
114.4
|
|
$
|
98.7
|
|
$
|
41.0
|
|
|||
|
Expansion capital expenditures
|
26.7
|
|
31.6
|
|
0.9
|
|
||||||
|
Total capital expenditures
|
$
|
141.1
|
|
$
|
130.3
|
|
$
|
41.9
|
|
|||
Capital expenditures remained at a level sufficient for required maintenance and certain expansion growth initiatives during these periods. Maintenance capital expenditures are higher in the year ended
December 31, 2017
as compared to
December 31, 2016
due to the timing of maintenance capital expenditure costs incurred on projects beginning in late
2016
. Maintenance capital expenditures are higher in the year ended
December 31, 2016
as compared to
December 31, 2015
mainly due to the Business Combination, partly offset by lower refining services plant turnaround maintenance costs. Expansion capital expenditures are higher in the year ended December 31, 2016 due to timing of our expansion projects related to our strategic growth and cost reduction initiatives, each from the Business Combination and in our refining services product group.
Pension Funding
We paid
$7.9 million
,
$2.9 million
and
$14.9 million
in cash contributions into our defined benefit pension plans and other postretirement plans during the years ended
December 31, 2017
,
2016
and
2015
, respectively. Included in the 2015 cash contributions, legacy Eco paid $4.3 million in start-up contributions for the new defined benefit plan associated with the spin-off from Solvay in December 2014. The periodic pension and postretirement expense was
$3.3 million
,
$2.0 million
, and
$2.9 million
for those same periods, respectively.
As of
December 31, 2017
and
2016
, our pension plans and other post-retirement benefit plans were underfunded by
$65.9 million
and
$68.4 million
, respectively. In addition, our supplemental retirement plan had a liability balance of
$12.8 million
and
$13.2 million
as of
December 31, 2017
and
2016
, respectively, which is funded by our general assets including assets held in a Rabbi trust, or restoration plan assets, of
$5.6 million
as of both
December 31, 2017
and
2016
.
Off-Balance Sheet Arrangements
We had
$19.6 million
and
$18.4 million
of outstanding letters of credit on our revolver facility as of
December 31, 2017
and
2016
, respectively.
77
Contractual Obligations and Commitments
The following table reflects our contractual obligations, commercial commitments and long-term debt obligations as of
December 31, 2017
.
|
Payments due by period
|
||||||||||||||||||||
|
Total
|
Less than 1 year
|
1-3 years
|
3-5 years
|
More than 5 years
|
||||||||||||||||
|
(in millions)
|
||||||||||||||||||||
|
Long-term debt
(1)
|
$
|
2,270.3
|
|
$
|
45.2
|
|
$
|
29.0
|
|
$
|
1,844.3
|
|
$
|
351.8
|
|
|||||
|
Interest payments
(2)
|
590.2
|
|
117.9
|
|
234.3
|
|
185.9
|
|
52.1
|
|
||||||||||
|
Operating leases
|
63.3
|
|
16.8
|
|
21.7
|
|
12.4
|
|
12.4
|
|
||||||||||
|
Purchase obligations
(3)
|
35.0
|
|
24.1
|
|
4.0
|
|
2.4
|
|
4.5
|
|
||||||||||
|
Other obligations
(4)
|
19.6
|
|
8.3
|
|
3.2
|
|
2.7
|
|
5.4
|
|
||||||||||
|
Total contractual obligations
|
$
|
2,978.4
|
|
$
|
212.3
|
|
$
|
292.2
|
|
$
|
2,047.7
|
|
$
|
426.2
|
|
|||||
|
(1)
|
No prepayment or redemption of any of our long-term debt balances has been assumed. Refer to “Financial Condition, Liquidity and Capital Resources” section of this Management’s Discussion and Analysis and Note 15, Long-term Debt, in the Notes to the Audited Consolidated Financial Statements of PQ Group Holdings Inc. and Subsidiaries included elsewhere in this filing for information regarding the terms of our long-term debt agreements.
|
|
(2)
|
Interest on long-term debt excludes the amortization of deferred financing fees and original issue discount. The amounts represent minimum interest payments. All future interest payments on Euro-denominated loans were calculated using a
December 31, 2017
Euro to U.S. Dollar spot exchange rate.
|
|
(3)
|
Purchase obligations include agreements to purchase goods and services that are enforceable and legally binding and that specify all significant terms, including fixed and minimum quantities to be purchased, fixed, minimum or variable provisions, and the approximate timing of the transaction. Purchase obligations exclude agreements that are cancelable without penalty.
|
|
(4)
|
Other obligations represent payments related to our pension plans, supplemental retirement plans and other post-retirement benefit plans. Included in these amounts are expected pension plan contributions of
$6.5 million
in
2017
. Contributions to the pension plan beyond
2017
cannot be reasonably estimated and are not reflected in this table.
|
We expect that we will be able to fund our remaining obligations and commitments with cash flow from operations. To the extent we are unable to fund these obligations and commitments with cash flow from operations, we intend to fund these obligations and commitments with proceeds from available borrowing capacity under our ABL Facility or under future financings.
Critical Accounting Policies
We prepare our consolidated financial statements in conformity with GAAP and our significant accounting policies are described in Note 2 to our consolidated financial statements. The preparation of financial statements in conformity with GAAP requires us to make estimates and assumptions that affect reported amounts and related disclosures. We base our estimates and judgments on historical experience and other relevant factors that we believe to be reasonable under the circumstances, the results of which form the basis for making judgments about the carrying values of assets and liabilities that are not readily apparent from other sources. Actual results may differ from these estimates under different assumptions or conditions. We have identified below the accounting policies and estimates that we believe are most critical in compiling our consolidated statements of financial condition and operating results.
Business Combinations and Acquisitions
We record acquisitions using the acquisition method of accounting and accordingly, the results of operations of the businesses we acquire are included in our consolidated financial statements from the date control is obtained of each respective acquisition. The acquisition purchase price for each business is allocated based on the fair values of the assets acquired, liabilities assumed and any noncontrolling interest in the acquired entity. Acquisition-related costs attributable to a business combination are expensed as incurred and are not included in the cost allocated to the acquired assets and assumed liabilities. Goodwill is an asset representing the future economic benefits arising from other assets acquired in a business combination that are not individually identified and separately recognized. Goodwill as of the acquisition date is measured as the excess of the fair value of consideration transferred over the fair values of the net assets acquired.
78
The valuation of the net assets acquired in a business combination is subject to estimation, in particular around intangible assets other than goodwill and property, plant and equipment. To assist in the valuation of these assets, we typically utilize a third-party valuation specialist. Significant intangible assets other than goodwill acquired include customer relationships, technical know-how, trade names and trademarks. We generally value acquired intangibles other than goodwill using an income approach, namely the relief-from-royalty method for trade names, trademarks and technical know-how, and the multi-period excess earnings method for customer relationships. Key assumptions underlying the respective income approach methodologies include projected sales, estimated economic lives of the assets, discount and royalty rates, and contributory asset charges. We value acquired property, plant and equipment using either the market or cost approaches depending on the type of fixed asset.
While we use our best estimates and assumptions to accurately value assets acquired and liabilities assumed at the acquisition date, our estimates are inherently uncertain and subject to refinement to reflect information about the facts and circumstances existing as of the acquisition date that, if known, would have affected the measurement of the amounts recognized as of the acquisition date. As a result, during the measurement period, which may be up to one year from the acquisition date, we may record adjustments to the provisional amounts recorded for the net assets acquired, with the corresponding offset to goodwill. Under new guidance adopted on a prospective basis beginning on December 31, 2015, adjustments to the provisional amounts are reflected in the consolidated financial statements for the reporting period in which the adjustments are determined, including by recognizing in current period earnings the full effect of changes in depreciation, amortization or other income effects. Upon the final determination of the fair values of the net assets acquired, any subsequent adjustments are recorded in our consolidated statements of operations.
Revenue Recognition and Accounts Receivable
Revenue, net of related discounts and allowances, is recognized when both title and risk of loss of the product have been transferred to the customer (generally upon shipment), the seller’s price to the buyer is fixed or determinable, collectability is reasonably assured and persuasive evidence of an arrangement exists. Customers take title and assume all the risks of ownership based on delivery terms, which are generally included in customer contracts of sale, order confirmation documents and invoices.
We recognize rebates given to customers as a reduction of revenues based on an allocation of the cost of honoring rebates earned and claimed to each of the underlying revenue transactions that result in progress by the customer toward earning the rebate. Rebates are recognized at the time revenue is recorded. We measure the rebate obligation based on the estimated amount of sales that will result in a rebate at the adjusted sales price per the respective sales agreement.
Amounts billed to a customer in a sale transaction related to shipping and handling, if any, represent revenues earned for the goods provided and are classified as revenue. Costs related to shipping and handling of products shipped to customers are classified as cost of goods sold.
We make certain assumptions and estimates when accruing for allowances for doubtful accounts. Trade accounts receivable are recorded at the invoiced amount and do not bear interest. The allowance for doubtful accounts is our best estimate of the amount of probable credit losses in our existing accounts receivable. A specific reserve for bad debt is recorded for known or suspected doubtful accounts receivable. For all other accounts, we recognize a reserve for bad debt based on the length of time receivables are past due and historical write-off experience. Account balances are charged against the allowance when we believe it is probable that the associated receivables will not be recovered. If the financial condition of our customers was to deteriorate resulting in an impairment of their ability to make payments, additional allowances may be required. We do not have any off-balance sheet credit exposure related to our customers.
Our estimates and assumptions made under the revenue recognition policy have been applied on a consistent basis. The amounts accrued for allowances and returns have not had a material impact on our financial condition or operating performance.
Property, Plant and Equipment
Property, plant and equipment are carried at cost and include expenditures for new facilities, major renewals and betterments. We capitalize the cost of furnace rebuilds as part of property, plant and equipment. Plant and equipment under capital leases are carried at the present value of minimum lease payments as determined at the beginning of the lease term. Maintenance, repairs and minor renewals are charged to expense as incurred. We capitalize certain internal costs associated with the implementation of purchased software. When property, plant and equipment is retired or otherwise disposed of, the net carrying amount is eliminated with any gain or loss on disposition recognized in earnings at that time. We also lease property, plant and equipment, principally under operating leases. Rent expense for operating leases, which may have escalating rentals or rent holidays, is recorded on a straight-line basis over the respective lease terms.
Depreciation is provided on the straight-line method based on the estimated useful lives of the assets, which generally range from 15 to 33 years for buildings and improvements and 3 to 10 years for machinery and equipment. Leasehold improvements are depreciated using the straight-line method based on the shorter of the useful life of the improvement or remaining lease term. Interest cost associated with the development and construction of significant new plant and equipment is capitalized and depreciated over the lives of the related assets.
79
We perform
an impairment review of property, plant and equipment and definite-lived intangible assets when facts and circumstances indicate that the carrying value of an asset or asset group may not be recoverable from its undiscounted future cash flows. When evaluating long-lived assets for impairment, if the carrying amount of an asset or asset group is found not to be recoverable, a potential impairment loss may be recognized. An impairment loss is measured by comparing the carrying amount of the asset or asset group to its fair value. Fair value is determined using quoted market prices when available, or other techniques including discounted cash flows.
Our
estimates of future cash flows involve assumptions concerning future operating performance, economic conditions and technological changes that may affect the future useful lives of the assets.
Goodwill and Intangible Assets
Goodwill and intangible assets with indefinite lives are not amortized, but are tested for impairment annually or more frequently if events occur or circumstances change that would more likely than not reduce the fair value of the reporting unit below its carrying amount. We perform our annual impairment tests of goodwill and indefinite-lived intangible assets as of October 1 of each year.
Goodwill is tested for impairment at the reporting unit level. In performing tests for goodwill impairment,
we are
permitted to first perform a qualitative assessment about the likelihood of the carrying value of a reporting unit exceeding its fair value. If an entity determines that it is more likely than not that the fair value of a reporting unit is less than its carrying amount based on the qualitative assessment, it is required to perform a two-step goodwill impairment test to identify the potential goodwill impairment and measure the amount of the goodwill impairment loss, if any, to be recognized for that reporting unit. However, if an entity concludes otherwise based on the qualitative assessment, the two-step goodwill impairment test is not required. The option to perform the qualitative assessment can be utilized at
our
discretion, and the qualitative assessment need not be applied to all reporting units in a given goodwill impairment test. For an individual reporting unit, if
we elect
not to perform the qualitative assessment, or if the qualitative assessment indicates that it is more likely than not that the fair value of a reporting unit is less than its carrying amount, then
we
must perform the two-step goodwill impairment test for the reporting unit.
In applying the two-step process, the first step used to identify potential impairment involves comparing the reporting unit’s estimated fair value to its carrying value, including goodwill. If the estimated fair value of a reporting unit exceeds its carrying value, goodwill is not impaired. If the carrying value exceeds the estimated fair value, there is an indication of potential impairment and the second step is performed to measure the amount of impairment, if any. The second step of the process involves the calculation of an implied fair value of goodwill for each reporting unit for which step one indicated potential impairment. The implied fair value of goodwill is determined in a manner similar to how goodwill is calculated in a business combination. That is, the estimated fair value of the reporting unit, as calculated in step one, is allocated to the individual assets and liabilities as if the reporting unit was being acquired in a business combination. If the implied fair value of goodwill exceeds the carrying value of goodwill assigned to the reporting unit, there is no impairment. If the carrying value of goodwill assigned to a reporting unit exceeds the implied fair value of the goodwill, an impairment charge is recorded to write down the carrying value. An impairment loss cannot exceed the carrying value of goodwill assigned to a reporting unit and the loss establishes a new basis in the goodwill. Subsequent reversal of an impairment loss is not permitted.
For the purposes of the quantitative goodwill impairment test, we determine the fair value of our reporting units using a combination of a market approach and an income, or discounted cash flow, approach. Estimating the fair value of a reporting unit requires various assumptions including the use of projections of future cash flows and discount rates that reflect the risks associated with achieving those cash flows. The key assumptions used in estimating the fair value are operating margin growth rates, revenue growth rates, the weighted average cost of capital, the perpetual growth rate, and the estimated earnings market multiples of each reporting unit. The market value is estimated using publicly traded comparable company values by applying their most recent annual EBITDA multiples to the reporting unit’s EBITDA for the trailing twelve months. The income approach value is estimated using a discounted cash flow approach. The assumptions about future cash flows and growth rates are based on our assessment of a number of factors including the reporting unit’s recent performance against budget as well as management’s ability to execute on planned future strategic initiatives. Discount rate assumptions are based on an assessment of the risk inherent in those future cash flows.
For intangible assets other than goodwill, definite-lived intangible assets are amortized over their respective estimated useful lives. Intangible assets with indefinite lives are not amortized, but rather are tested for impairment at least annually or more frequently if events occur or circumstances change that would more likely than not reduce the fair value of the intangible asset below its carrying amount.
Our indefinite-lived intangible assets include trade names and certain trademarks. Similar to the goodwill impairment test, we may first assess qualitative factors to determine whether it is necessary to perform a quantitative impairment test. If we choose to bypass the qualitative assessment, or if the qualitative assessment indicates that the indefinite-lived intangible asset is more likely than not impaired, a quantitative impairment test must be performed. Unlike the goodwill impairment test, the quantitative test for indefinite-lived intangible assets is a one-step test comparing the fair value of the asset to its carrying amount. If the fair value of the indefinite-lived intangible asset is less than the carrying amount, an impairment loss is recognized in an amount equal to the difference.
The unit of accounting used to test our indefinite-lived intangible assets for impairment is at the reporting unit level. The fair values of our indefinite-lived trade names and trademarks are determined for impairment testing purposes based on an income approach using a discounted cash flow valuation model under a relief from royalty methodology. Significant assumptions under the relief from royalty method include the royalty rate a market participant may assume, projected sales and the discount rate applied to the estimated cash flows.
80
For definite-lived intangible assets, we amortize technical know-how over periods that range from fourteen to twenty years, customer relationships over periods that range from seven to fifteen years, trademarks over a fifteen year period, contracts over periods that range from two to sixteen years, and permits over five years. We perform an impairment review of definite-lived intangible assets when facts and circumstances indicate that the carrying value of an asset may not be recoverable from its undiscounted future cash flows. The impairment test for definite-lived intangible assets is consistent with the test applied to property, plant and equipment as described in our policy.
Pensions and Postretirement Benefits
We maintain defined benefit pension plans covering certain employees in the United States and Canada as well as certain employees in other international locations. Benefits for a majority of the plans are based on average final pay and years of service. Our funding policy, consistent with statutory requirements, is based on actuarial computations utilizing the projected unit credit method of calculation. Not all defined benefit pension plans are funded. In the United States and Canada, the pension plans’ assets include equity and fixed income securities. Certain assumptions are made regarding the occurrence of future events affecting pension costs, such as mortality, withdrawal, disablement and retirement, changes in compensation and benefits, and discount rates to reflect the time value of money.
The major elements in determining pension income and expense are pension liability discount rates and the expected return on plan assets. We reference rates of return on high-quality, fixed income investments when estimating the discount rate, and the expected period over which payments will be made based upon historical experience. The long-term rate of return used to calculate the expected return on plan assets is the average rate of return estimated to be earned on invested funds for providing pension benefits.
In addition to pension benefits, we provide certain health care benefits for employees who meet age, participation and length of service requirements at retirement. We use explicit assumptions using the best estimates available of the plan’s future experience. Principal actuarial assumptions include discount rates, present value factors, retirement age, participation rates, mortality rates, cost trend rates, Medicare reimbursement rates and per capita claims cost by age. Current interest rates, as of the measurement date, are used for discount rates in present value calculations.
Income Taxes
We operate
within multiple taxing jurisdictions and
are
subject to tax filing requirements and audit within these jurisdictions.
We use
the asset and liability method in accounting for income taxes. Deferred tax assets and liabilities are recorded for temporary differences between the tax basis of assets and liabilities and their reported amounts in the financial statements, using statutory tax rates in effect for the year in which the differences are expected to reverse. The effect on deferred tax assets and liabilities of a change in tax rates is recognized in the results of operations in the period that includes the enactment date.
We evaluate our
deferred tax assets each period to ensure that estimated future taxable income will be sufficient in character (e.g., capital gain versus ordinary income treatment), amount and timing to result in their recovery. A valuation allowance is recorded to reduce the carrying amounts of deferred tax assets unless it is more likely than not that those assets will be realized.
Considerable judgments are required in establishing deferred tax valuation allowances and in assessing exposures related to tax matters. The ultimate realization of deferred tax assets is dependent upon the generation of future taxable income during the periods in which those temporary differences and carryforward deferred tax assets become deductible or utilized. We consider the scheduled reversal of taxable temporary differences, projected future taxable income and tax-planning strategies in making this assessment. As events and circumstances change, related reserves and valuation allowances are adjusted to income at that time. At this time, we are still evaluating how the Tax Cuts and Jobs Act (“TCJA”) impacts our valuation allowance on federal and state net operating loss carryforwards, as well as state tax credits. As such, we may report an adjustment to the valuation allowances in subsequent reporting periods, as permitted under SEC Staff Accounting Bulletin 118 (“SAB 118”). Should we determine that a change to our deferred tax balances are needed in the future, an adjustment to deferred tax balances would be charged to income in the period such determination was made.
In determining the provision for income taxes,
we provide
deferred income taxes on income from foreign subsidiaries as such earnings are taxable upon remittance to the United States, to the extent that these earnings are considered to be available for repatriation.
We do not
provide income taxes on the cumulative unremitted earnings of foreign subsidiaries considered permanently reinvested.
We establish
contingent liabilities for possible assessments by taxing authorities resulting from uncertain tax positions including, but not limited to, transfer pricing, deductibility of certain expenses and other state, local, and foreign tax matters.
We recognize
a financial statement benefit for positions taken for tax return purposes when it will be more likely than not (greater than 50%) that the positions will be sustained upon tax examination, based solely on the technical merits of the tax positions, otherwise, no benefit is recognized. The tax benefits recognized are measured based on the largest benefit that has a greater than 50% likelihood of being realized upon ultimate settlement.
We recognize
potential accrued interest and penalties related to unrecognized tax benefits in income tax expense. Tax examinations are often complex as tax authorities may disagree with the treatment of items reported by
us
and may require several years to resolve. These accrued liabilities represent a provision for taxes that are reasonably expected to be incurred on the basis of available information but which are not certain.
81
On December 22, 2017, the TCJA was enacted into law. The TCJA provides for several significant tax law changes and modifications, including the reduction of the U.S. federal corporate income tax rate from 35.0% to 21.0%, the requirement for companies to pay a one-time transition tax on earnings of certain foreign subsidiaries that were previously tax deferred, as well as the creation of new taxes on certain foreign-sourced earnings. Certain provisions of the TCJA began to impact us in our fourth quarter of 2017, while other provisions will impact us beginning in 2018.
The corporate tax rate reduction is effective as of January 1, 2018. The TCJA also establishes other new provisions that will be effective in 2018. These include, but are not limited to, (1) a new provision designed to tax low-taxed income of foreign subsidiaries (i.e., “GILTI”), which allows for the possibility of using foreign tax credits ("FTCs") and a deduction of up to 50% to offset any resulting income tax liability (subject to some limitations); (2) limitations on the deductibility of certain executive compensation; (3) limitations on the deductibility of interest expense; and (4) limitations on the use of FTCs to reduce the U.S. income tax liability. While each of these provisions is expected to have an impact on our tax expense for 2018 and future periods, we expect the tax on low-taxed income of foreign subsidiaries and interest expense limitation to have the most significant, adverse impact. However, at this time the overall impact of the TCJA on future income tax provision amounts remains uncertain.
Due to the complexity of the new GILTI tax, we are continuing to evaluate the GILTI provision of the TCJA and its impact to the Company’s financial statements, which is currently uncertain. Based on recent FASB deliberations, it appears we will be allowed to make an accounting policy election to either (1) treat the taxes incurred as a result of the GILTI provision as a current-period expense when incurred or (2) factor such amounts into our measurement of deferred taxes. Our selection of an accounting policy election will depend, in part, on analyzing our specific facts to determine the expected impact under each method. However, at this time we expect to treat any expense incurred as a current-period expense.
Stock-Based Compensation
We grant stock-based compensation awards in connection with our stock incentive plans. Under the terms of the incentive plans, we are authorized to issue equity awards to our employees, directors and affiliates. The grants have taken the form of restricted stock awards, restricted stock units and stock options. Restricted stock awards provide the recipient with shares of our stock subject to certain vesting requirements. Restricted stock units provide the recipient with the right to receive shares of our stock at a future date if certain vesting conditions are met. Stock option awards provide the recipient the ability to purchase shares of our stock at a given strike price upon the satisfaction of certain vesting requirements.
The vesting requirements associated with the awards include a mix of both service and performance conditions. Depending on the award and recipient, the service condition may reflect a cliff vesting provision (e.g., 100% vested upon four years of service) or a graded vesting provision (e.g., 33.3% vested each year over a period of three years).
Awards issued with performance conditions vest based on the occurrence of a defined liquidity event upon which certain investment funds affiliated with CCMP receive proceeds exceeding certain thresholds.
Although achievement of the performance condition is subject to continued service with us, the terms of awards issued with performance conditions stipulate that the performance vesting condition can be attained for a period of six months following separation from service.
We recognize compensation expense related to our equity awards with service conditions on a straight-line basis over the stated vesting period for each award. Expense related to our equity awards with performance conditions is recognized in the period in which it becomes probable that the performance target will be achieved. No compensation expense has been recognized to-date on any of our equity awards subject to vesting based on performance conditions, since a liquidity event triggering vesting of the awards has not occurred, nor is it considered probable.
The grant date fair value of restricted stock awards and restricted stock units is based on the value of our common stock as traded on the New York Stock Exchange. The grant date fair value of stock option awards is estimated using a Black-Scholes option pricing model. Determining the fair value of stock option awards at the grant date requires judgment, including estimates of the average risk-free interest rate, dividend yield, volatility and expected term. Since we have limited experience with respect to historical exercise and forfeiture rates or patterns, we have estimated certain assumptions using acceptable simplified methods and through benchmarking to our peer group of companies.
Recently Issued Accounting Standards
See Note 3 to our consolidated financial statements for a discussion of recently issued accounting standards and their effect on us.
|
ITEM 7A.
|
QUANTITATIVE AND QUALITATIVE DISCLOSURES ABOUT MARKET RISK.
|
Our major market risk exposure is potential losses arising from changing rates and prices regarding foreign currency exchange rate risk, interest rate risk, commodity price risk and credit risk. The audit committee of our board of directors regularly reviews foreign exchange, interest rate and commodity hedging activity and monitors compliance with our hedging policy. We do not use financial instruments for speculative purposes, and we limit our hedging activity to the underlying economic exposure.
82
Foreign Exchange Risk
Our financial results are subject to the impact of gains and losses on currency translations, which occur when the financial statements of foreign operations are translated into U.S. dollars. We operate a geographically diverse business with approximately
41%
and
34%
of our sales during the years ended
December 31, 2017
and
2016
, respectively, coming from our international operations in currencies other than the U.S. dollar. Because consolidated financial results are reported in U.S. dollars, sales or earnings generated in currencies other than the U.S. dollar can result in a significant increase or decrease in the amount of those sales and earnings when translated to U.S. dollars. The financial statements of our operations outside the United States, where the local currency is considered to be the functional currency, are translated into U.S. dollars using the exchange rate in effect at each balance sheet date for assets and liabilities and the average exchange rate for each period for sales, expenses, gains, losses and cash flows. The exchange rates between these currencies and the U.S. dollar in recent years have fluctuated significantly and may continue to do so in the future. The foreign currencies to which we have the most significant exchange rate exposure include the Euro, British pound, Canadian dollar, Brazilian real and the Mexican peso. Sales in these top five currencies represented approximately
32%
of our sales during the year ended
December 31, 2017
. A 10% change in these currencies would have impacted sales by approximately
$47.5 million
, or
3%
of sales assuming product pricing remained constant. The effect of translating foreign subsidiaries’ balance sheets into U.S. dollars is included in other comprehensive income. The impact of gains and losses on transactions denominated in currencies other than the functional currency of the relevant operations are included in other non-operating expense. Income and expense items are translated at average exchange rates during the year. Net foreign exchange included in other expense was a
$25.8 million
loss for the year ended
December 31, 2017
. The foreign currency loss realized in the year ended
December 31, 2017
was
primarily driven by the Euro-denominated term loan
and the non-permanent intercompany debt denominated in local currency and translated to U.S. dollars
, and was principally non-cash in nature.
Interest Rate Risk
We are exposed to fluctuations in interest rates on our Senior Secured Credit Facilities and on our Floating Rate Senior Unsecured Notes. Changes in interest rates will not affect the market value of such debt but will affect the amount of our interest payments over the term of the loans. Likewise, an increase in interest rates could have a material impact on our cash flow. As of
December 31, 2017
, a 100 basis point increase in assumed interest rates for our variable interest credit facilities, before impact of any hedges, would have an annual impact of approximately
$12.9 million
on interest expense.
We hedge the interest rate fluctuations on debt obligations through interest rate cap agreements. We record the fair value of these hedges as assets or liabilities and the related unrealized gains or losses are deferred in stockholders’ equity as a component of other comprehensive income (loss), net of tax. The interest rate caps had a fair value net asset of
$1.0 million
and
$5.8 million
at
December 31, 2017
and
2016
, respectively. Fair value is determined based on estimated amounts that would be received or paid to terminate the contracts at the reporting date based on quoted market prices.
In July 2016, we entered into interest rate cap agreements, paying a premium of $1.6 million to mitigate interest rate volatility from July 2016 through July 2020 by employing varying cap rates ranging from 1.50% to 3.00% on $1.0 billion of notional variable debt.
Commodity Risk
We purchase significant amounts of natural gas to supply the energy required in our production processes for our products in each of our segments. Since we are a producer of inorganic chemicals, natural gas provides an energy source for us but is not a direct feedstock for our products. Therefore, exposure to the volatility in energy prices is less than that of producers of organic petrochemicals. We purchase approximately
15.1 million
MMBtu’s of natural gas in a given year. Thus, a $1 increase in the cost of natural gas would impact our cost of goods sold by approximately
$15.1 million
absent hedging. Our purchase agreements with our customers typically provide for the pass through of natural gas price increases; however, there is no guarantee that we will continue to be able to pass through future price increases without loss of existing customers. We have implemented a hedging program in the United States which allows us to mitigate exposure to natural gas volatility with natural gas swap agreements. We also make forward purchases of natural gas related to our production at certain subsidiary locations.
The natural gas swap agreements had a fair value net liability of
$0.4 million
and fair value net asset of
$0.6 million
at
December 31, 2017
and
2016
, respectively. Fair value is determined based on estimated amounts that would be received or paid to terminate the contracts at the reporting date based on quoted market prices of comparable contracts. The respective current and non-current assets are recorded in other current assets and other assets. The related unrealized gains or losses are recorded in stockholders’ equity as a component of other comprehensive income (loss), net of tax. Realized gains and losses on natural gas hedges are included in production cost and subsequently charged to cost of goods sold in the consolidated statements of operations in the period in which inventory is sold.
Credit Risk
We are exposed to credit risk on financial instruments to the extent our counterparty fails to perform certain duties as required under the provisions of an agreement. We only transact with counterparties having an appropriate credit rating for the risk involved. Credit exposure is managed through credit approval and monitoring procedures.
83
Concentration of credit risk can result primarily from trade receivables, for example, with certain customers operating in the same industry or customer groups located in the same geographic region. Credit risk related to these types of receivables is managed through credit approval and monitoring procedures. In the year ended
December 31, 2017
, we wrote off
$0.3 million
, or
0.02%
, in bad debt on total sales of
$1,472.1 million
.
|
ITEM 8.
|
FINANCIAL STATEMENTS AND SUPPLEMENTARY DATA.
|
The consolidated financial statements, supplementary information and financial statement schedules of the Company are set forth beginning on page F-1 of this report.
|
ITEM 9.
|
CHANGES IN AND DISAGREEMENTS WITH ACCOUNTANTS ON ACCOUNTING AND FINANCIAL DISCLOSURE.
|
None.
|
ITEM 9A.
|
CONTROLS AND PROCEDURES.
|
Evaluation of Disclosure Controls and Procedures
Our management, with the participation of our Chief Executive Officer and Chief Financial Officer, evaluated the effectiveness of our disclosure controls and procedures as of
December 31, 2017
. The term “disclosure controls and procedures,” as defined in Rules 13a-15(e) and 15d-15(e) under the Exchange Act, means controls and other procedures of a company that are designed to ensure that information required to be disclosed by a company in the reports that it files or submits under the Exchange Act is recorded, processed, summarized and reported within the time periods specified in the SEC’s rules and forms. Disclosure controls and procedures include, without limitation, controls and procedures designed to ensure that information required to be disclosed by a company in the reports that it files or submits under the Exchange Act is accumulated and communicated to the company’s management, including its principal executive and principal financial officers, as appropriate to allow timely decisions regarding required disclosure. Management recognized that any controls and procedures, no matter how well designed and operated, can provide only reasonable assurance of achieving their objectives and management necessarily applies its judgment in evaluating the cost-benefit relationship of possible controls and procedures. Based on that evaluation, our Chief Executive Officer and Chief Financial Officer concluded that, as of such date, our disclosure controls and procedures were effective.
Management’s Annual Report on Internal Control over Financial Reporting
This Annual Report on Form 10-K does not include a report of management’s assessment regarding internal control over financial reporting or an attestation report of our independent registered public accounting firm due to the existence of a transition period established by the rules of the SEC for newly public companies.
Changes in Internal Control Over Financial Reporting
No changes in our internal control over financial reporting occurred during the quarter ended
December 31, 2017
that materially affected, or which are reasonably likely to materially affect, our internal control over financial reporting.
|
ITEM 9B.
|
OTHER INFORMATION.
|
None.
84
|
ITEM 10.
|
DIRECTORS, EXECUTIVE OFFICERS AND CORPORATE GOVERNANCE.
|
The information required by this Item 10 will be included in our 2018 Proxy Statement, which we intend to file with the SEC within 120 days of the end of the fiscal year end to which this report relates, and is incorporated herein by reference.
|
ITEM 11.
|
EXECUTIVE COMPENSATION.
|
The information required by this Item 11 will be included in our 2018 Proxy Statement, which we intend to file with the SEC within 120 days of the end of the fiscal year end to which this report relates, and is incorporated herein by reference.
|
ITEM 12.
|
SECURITY OWNERSHIP OF CERTAIN BENEFICIAL OWNERS AND MANAGEMENT AND RELATED STOCKHOLDER MATTERS.
|
The information required by this Item 12 will be included in our 2018 Proxy Statement, which we intend to file with the SEC within 120 days of the end of the fiscal year end to which this report relates, and is incorporated herein by reference.
|
ITEM 13.
|
CERTAIN RELATIONSHIPS AND RELATED TRANSACTIONS, AND DIRECTOR INDEPENDENCE.
|
The information required by this Item 13 will be included in our 2018 Proxy Statement, which we intend to file with the SEC within 120 days of the end of the fiscal year end to which this report relates, and is incorporated herein by reference.
|
ITEM 14.
|
PRINCIPAL ACCOUNTING FEES AND SERVICES.
|
The information required by this Item 14 will be included in our 2018 Proxy Statement, which we intend to file with the SEC within 120 days of the end of the fiscal year end to which this report relates, and is incorporated herein by reference.
85
|
ITEM 15.
|
EXHIBITS, FINANCIAL STATEMENT SCHEDULES.
|
(a) The following documents are filed as part of this report:
(1) and (2) The response to this portion of Item 15 is submitted as a separate section of this report beginning on page F-1. All other schedules have been omitted as inapplicable or are not required, or because the required information is included in the consolidated financial statements or accompanying notes.
(3) The exhibits filed as part of this report are listed in the accompanying index.
|
Incorporated by Reference
|
|||||||
|
Exhibit No.
|
Exhibit
Description
|
Filed Herewith
|
Form
|
File
No.
|
Exhibit
|
Filing
Date
|
|
|
3.1
|
|
10-Q
|
001-38221
|
3.1
|
11/14/2017
|
||
|
3.2
|
|
S-1/A
|
333-218650
|
3.2
|
9/1/2017
|
||
|
4.1
|
|
S-1
|
333-218650
|
4.2
|
6/9/2017
|
||
|
4.2
|
|
8-K
|
001-38221
|
4.1
|
12/13/2017
|
||
|
10.1
|
|
S-1
|
333-218650
|
10.1
|
6/9/2017
|
||
|
10.2
|
|
S-1
|
333-218650
|
10.2
|
6/9/2017
|
||
|
10.3
|
|
S-1/A
|
333-218650
|
10.19
|
8/14/2017
|
||
|
10.4
|
|
8-K
|
001-38221
|
10.1
|
2/9/2018
|
||
86
|
Incorporated by Reference
|
|||||||
|
Exhibit No.
|
Exhibit
Description
|
Filed Herewith
|
Form
|
File
No.
|
Exhibit
|
Filing
Date
|
|
|
10.5
|
S-1
|
333-218650
|
10.3
|
6/9/2017
|
|||
|
10.6
|
S-1/A
|
333-218650
|
10.10
|
8/14/2017
|
|||
|
10.7
|
S-1/A
|
333-218650
|
10.11
|
8/14/2017
|
|||
|
10.8
|
S-1/A
|
333-218650
|
10.12
|
8/14/2017
|
|||
|
10.9
|
S-1/A
|
333-218650
|
10.13
|
8/14/2017
|
|||
|
10.10
|
S-1
|
333-218650
|
10.4
|
6/9/2017
|
|||
|
10.11
|
S-1/A
|
333-218650
|
10.5
|
9/1/2017
|
|||
|
10.12*
|
S-1/A
|
333-218650
|
10.14
|
9/19/2017
|
|||
|
10.13*
|
S-1/A
|
333-218650
|
10.15
|
9/1/2017
|
|||
|
10.14*
|
S-1/A
|
333-218650
|
10.16
|
9/1/2017
|
|||
|
10.15*
|
S-1/A
|
333-218650
|
10.17
|
9/1/2017
|
|||
|
10.16*
|
S-1
|
333-218650
|
10.6
|
6/9/2017
|
|||
|
10.17*
|
S-1
|
333-218650
|
10.7
|
6/9/2017
|
|||
|
10.18*
|
S-1
|
333-218650
|
10.8
|
6/9/2017
|
|||
|
10.19*
|
S-1/A
|
333-218650
|
10.9
|
9/1/2017
|
|||
|
10.20*
|
S-1/A
|
333-218650
|
10.18
|
9/19/2017
|
|||
|
10.21*
|
S-1/A
|
333-218650
|
10.19
|
9/19/2017
|
|||
|
10.22*
|
S-1/A
|
333-218650
|
10.20
|
9/19/2017
|
|||
|
10.23*
|
S-1/A
|
333-218650
|
10.21
|
9/19/2017
|
|||
|
10.24*
|
S-1/A
|
333-218650
|
10.22
|
9/19/2017
|
|||
|
10.25*
|
S-1/A
|
333-218650
|
10.23
|
9/19/2017
|
|||
87
|
Incorporated by Reference
|
|||||||
|
Exhibit No.
|
Exhibit
Description
|
Filed Herewith
|
Form
|
File
No.
|
Exhibit
|
Filing
Date
|
|
|
21.1
|
X
|
||||||
|
23.1
|
X
|
||||||
|
23.2
|
X
|
||||||
|
31.1
|
X
|
||||||
|
31.2
|
X
|
||||||
|
32.1
|
X
|
||||||
|
32.2
|
X
|
||||||
|
101.INS
|
XBRL Instance Document
|
X
|
|||||
|
101.SCH
|
XBRL Taxonomy Extension Schema Document
|
X
|
|||||
|
101.CAL
|
XBRL Taxonomy Extension Calculation Linkbase Document
|
X
|
|||||
|
101.DEF
|
XBRL Taxonomy Definition Linkbase Document
|
X
|
|||||
|
101.LAB
|
XBRL Taxonomy Extension Label Linkbase Document
|
X
|
|||||
|
101.PRE
|
XBRL Taxonomy Extension Presentation Linkbase Document
|
X
|
|||||
* Management contract or compensatory plan
|
ITEM 16.
|
FORM 10-K SUMMARY.
|
None.
88
SIGNATURES
Pursuant to the requirements of Section 13 or 15(d) of the Securities Exchange Act of 1934, the registrant has duly caused this report to be signed on its behalf by the undersigned, thereunto duly authorized.
|
PQ GROUP HOLDINGS INC.
|
|||
|
Date:
|
March 22, 2018
|
By:
|
/s/ MICHAEL CREWS
|
|
Michael Crews
|
|||
|
Executive Vice President and Chief Financial Officer
|
|||
|
(Duly Authorized Officer and Principal Financial and Accounting Officer)
|
|||
89
Pursuant to the requirements of the Securities Exchange Act of 1934, this report has been signed below by the following persons on behalf of the registrant and in the capacities and on the dates indicated.
|
Signature
|
Title
|
Date
|
||
|
/s/ JAMES F. GENTILCORE
|
Chairman of the Board, President and Chief Executive Officer
|
March 22, 2018
|
||
|
James F. Gentilcore
|
(Principal Executive Officer)
|
|||
|
/s/ MICHAEL CREWS
|
Executive Vice President and Chief Financial Officer
|
March 22, 2018
|
||
|
Michael Crews
|
(Principal Financial and Accounting Officer)
|
|||
|
/s/ GREG BRENNEMAN
|
Director
|
March 22, 2018
|
||
|
Greg Brenneman
|
||||
|
/s/ TIMOTHY WALSH
|
Director
|
March 22, 2018
|
||
|
Timothy Walsh
|
||||
|
/s/ MARK McFADDEN
|
Director
|
March 22, 2018
|
||
|
Mark McFadden
|
||||
|
/s/ ROBERT TOTH
|
Director
|
March 22, 2018
|
||
|
Robert Toth
|
||||
|
/s/ ROBERT COXON
|
Director
|
March 22, 2018
|
||
|
Robert Coxon
|
||||
|
/s/ ANDREW CURRIE
|
Director
|
March 22, 2018
|
||
|
Andrew Currie
|
||||
|
/s/ JONNY GINNS
|
Director
|
March 22, 2018
|
||
|
Jonny Ginns
|
||||
|
/s/ KYLE VANN
|
Director
|
March 22, 2018
|
||
|
Kyle Vann
|
||||
|
/s/ MARTIN S. CRAIGHEAD
|
Director
|
March 22, 2018
|
||
|
Martin S. Craighead
|
||||
|
/s/ KIMBERLY ROSS
|
Director
|
March 22, 2018
|
||
|
Kimberly Ross
|
||||
90
INDEX TO CONSOLIDATED FINANCIAL STATEMENTS
|
PQ GROUP HOLDINGS INC. AND SUBSIDIARIES
|
||
|
Audited Consolidated Financial Statements
|
||
|
ZEOLYST INTERNATIONAL
|
||
|
Audited Financial Statements
|
||
F-1
Report of Independent Registered Public Accounting Firm
To
the Board of Directors and Shareholders of PQ Group Holdings Inc.:
Opinion on the Financial Statements
We have audited the accompanying consolidated balance sheets of PQ Group Holdings Inc. and its subsidiaries as of
December 31, 2017
and
2016
, and the related consolidated statements of operations, comprehensive income (loss), stockholders’ equity and cash flows for each of the three years in the period ended
December 31, 2017
, including the related notes and schedule of condensed parent company financial statements as of
December 31, 2017
and
2016
and the years then ended as listed in the accompanying index appearing on page F-1 (collectively referred to as the “consolidated financial statements”). In our opinion, the consolidated financial statements present fairly, in all material respects, the financial position of the Company as of
December 31, 2017
and
2016
, and the results of their operations and their cash flows for each of the three years in the period ended
December 31, 2017
in conformity with accounting principles generally accepted in the United States of America.
Basis for Opinion
These consolidated financial statements are the responsibility of the Company’s management. Our responsibility is to express an opinion on the Company’s consolidated financial statements based on our audits. We are a public accounting firm registered with the Public Company Accounting Oversight Board (United States) (“PCAOB”) and are required to be independent with respect to the Company in accordance with the U.S. federal securities laws and the applicable rules and regulations of the Securities and Exchange Commission and the PCAOB.
We conducted our audits of these consolidated financial statements in accordance with the standards of the PCAOB. Those standards require that we plan and perform the audit to obtain reasonable assurance about whether the consolidated financial statements are free of material misstatement, whether due to error or fraud.
Our audits included performing procedures to assess the risks of material misstatement of the consolidated financial statements, whether due to error or fraud, and performing procedures that respond to those risks. Such procedures included examining, on a test basis, evidence regarding the amounts and disclosures in the consolidated financial statements. Our audits also included evaluating the accounting principles used and significant estimates made by management, as well as evaluating the overall presentation of the consolidated financial statements. We believe that our audits provide a reasonable basis for our opinion.
/s/ PricewaterhouseCoopers LLP
Philadelphia, Pennsylvania
March 22, 2018
We have served as the Company's auditor since 2015.
F-2
PQ GROUP HOLDINGS INC. AND SUBSIDIARIES
(in thousands, except share and per share amounts)
|
Years ended
December 31, |
|||||||||||
|
2017
|
2016
|
2015
|
|||||||||
|
Sales
|
$
|
1,472,101
|
|
$
|
1,064,177
|
|
$
|
388,875
|
|
||
|
Cost of goods sold
|
1,095,265
|
|
810,085
|
|
278,791
|
|
|||||
|
Gross profit
|
376,836
|
|
254,092
|
|
110,084
|
|
|||||
|
Selling, general and administrative expenses
|
145,107
|
|
107,601
|
|
34,613
|
|
|||||
|
Other operating expense, net (Note 8)
|
64,225
|
|
62,301
|
|
19,696
|
|
|||||
|
Operating income
|
167,504
|
|
84,190
|
|
55,775
|
|
|||||
|
Equity in net income (loss) from affiliated companies
|
38,772
|
|
(2,612
|
)
|
—
|
|
|||||
|
Interest expense
|
179,044
|
|
140,315
|
|
44,348
|
|
|||||
|
Debt extinguishment costs (Note 15)
|
61,886
|
|
13,782
|
|
—
|
|
|||||
|
Other (income) expense, net
|
25,980
|
|
(3,402
|
)
|
—
|
|
|||||
|
Income (loss) before income taxes and noncontrolling interest
|
(60,634
|
)
|
(69,117
|
)
|
11,427
|
|
|||||
|
(Benefit) provision for income taxes
|
(119,197
|
)
|
10,041
|
|
—
|
|
|||||
|
Net income (loss)
|
58,563
|
|
(79,158
|
)
|
11,427
|
|
|||||
|
Less: Net income attributable to the noncontrolling interest
|
960
|
|
588
|
|
—
|
|
|||||
|
Net income (loss) attributable to PQ Group Holdings Inc.
|
$
|
57,603
|
|
$
|
(79,746
|
)
|
$
|
11,427
|
|
||
|
Net income (loss) per share:
|
|||||||||||
|
Basic income (loss) per share
|
$
|
0.52
|
|
$
|
(1.02
|
)
|
$
|
0.51
|
|
||
|
Diluted income (loss) per share
|
$
|
0.52
|
|
$
|
(1.02
|
)
|
$
|
0.51
|
|
||
|
Weighted average shares outstanding:
|
|||||||||||
|
Basic
|
111,299,670
|
|
78,016,005
|
|
22,615,787
|
|
|||||
|
Diluted
|
111,669,037
|
|
78,016,005
|
|
22,615,787
|
|
|||||
See accompanying notes to consolidated financial statements.
F-3
PQ GROUP HOLDINGS INC. AND SUBSIDIARIES
CONSOLIDATED STATEMENTS OF COMPREHENSIVE INCOME (LOSS)
(in thousands)
|
Years ended
December 31, |
|||||||||||
|
2017
|
2016
|
2015
|
|||||||||
|
Net income (loss)
|
$
|
58,563
|
|
$
|
(79,158
|
)
|
$
|
11,427
|
|
||
|
Other comprehensive income (loss), net of tax:
|
|||||||||||
|
Pension and postretirement benefits
|
(101
|
)
|
6,865
|
|
648
|
|
|||||
|
Net (loss) gain from hedging activities
|
(3,590
|
)
|
4,557
|
|
—
|
|
|||||
|
Foreign currency translation
|
60,601
|
|
(66,834
|
)
|
—
|
|
|||||
|
Total other comprehensive income (loss)
|
56,910
|
|
(55,412
|
)
|
648
|
|
|||||
|
Comprehensive income (loss)
|
115,473
|
|
(134,570
|
)
|
12,075
|
|
|||||
|
Less: Comprehensive loss attributable to noncontrolling interests
|
(152
|
)
|
(465
|
)
|
—
|
|
|||||
|
Comprehensive income (loss) attributable to PQ Group Holdings Inc.
|
$
|
115,625
|
|
$
|
(134,105
|
)
|
$
|
12,075
|
|
||
See accompanying notes to consolidated financial statements.
F-4
PQ GROUP HOLDINGS INC. AND SUBSIDIARIES
(in thousands, except share and per share amounts)
|
December 31, 2017
|
December 31, 2016
|
||||||
|
ASSETS
|
|||||||
|
Cash and cash equivalents
|
$
|
66,195
|
|
$
|
70,742
|
|
|
|
Receivables, net
|
193,456
|
|
160,581
|
|
|||
|
Inventories (Note 9)
|
262,388
|
|
227,048
|
|
|||
|
Prepaid and other current assets
|
26,929
|
|
34,307
|
|
|||
|
Total current assets
|
548,968
|
|
492,678
|
|
|||
|
Investments in affiliated companies (Note 10)
|
469,276
|
|
459,406
|
|
|||
|
Property, plant and equipment, net
|
1,230,384
|
|
1,181,388
|
|
|||
|
Goodwill
|
1,305,956
|
|
1,241,429
|
|
|||
|
Other intangible assets, net
|
786,144
|
|
816,573
|
|
|||
|
Other long-term assets
|
74,727
|
|
68,197
|
|
|||
|
Total assets
|
$
|
4,415,455
|
|
$
|
4,259,671
|
|
|
|
LIABILITIES
|
|||||||
|
Notes payable and current maturities of long-term debt
|
$
|
45,166
|
|
$
|
14,481
|
|
|
|
Accounts payable
|
149,326
|
|
128,478
|
|
|||
|
Accrued liabilities
|
93,917
|
|
99,433
|
|
|||
|
Total current liabilities
|
288,409
|
|
242,392
|
|
|||
|
Long-term debt
|
2,185,320
|
|
2,547,717
|
|
|||
|
Deferred income taxes
|
189,336
|
|
318,463
|
|
|||
|
Other long-term liabilities
|
120,471
|
|
123,155
|
|
|||
|
Total liabilities
|
2,783,536
|
|
3,231,727
|
|
|||
|
Commitments and contingencies (Note 22)
|
|
|
|||||
|
EQUITY
|
|||||||
|
Common stock ($0.01 par); authorized shares 450,000,000; issued shares 135,244,379 and 106,452,330 on December 31, 2017 and December 31, 2016, respectively; outstanding shares 135,244,379 and 106,430,811 on December 31, 2017 and December 31, 2016, respectively
|
1,352
|
|
73
|
|
|||
|
Preferred stock ($0.01 par); authorized shares 50,000,000; no shares issued or outstanding on December 31, 2017 and December 31, 2016
|
—
|
|
—
|
|
|||
|
Additional paid-in capital
|
1,655,114
|
|
1,167,137
|
|
|||
|
Accumulated deficit
|
(32,777
|
)
|
(90,380
|
)
|
|||
|
Treasury stock, at cost; shares 21,519 on December 31, 2016
|
—
|
|
(239
|
)
|
|||
|
Accumulated other comprehensive income (loss)
|
4,311
|
|
(53,711
|
)
|
|||
|
Total PQ Group Holdings Inc. equity
|
1,628,000
|
|
1,022,880
|
|
|||
|
Noncontrolling interest
|
3,919
|
|
5,064
|
|
|||
|
Total equity
|
1,631,919
|
|
1,027,944
|
|
|||
|
Total liabilities and equity
|
$
|
4,415,455
|
|
$
|
4,259,671
|
|
|
See accompanying notes to consolidated financial statements.
F-5
PQ GROUP HOLDINGS INC. AND SUBSIDIARIES
CONSOLIDATED STATEMENTS OF STOCKHOLDERS’ EQUITY
(in thousands)
|
Shares of Common stock
|
Common
stock |
Additional
paid-in capital |
Accumulated deficit
|
Shares of Treasury stock
|
Treasury
stock, at cost |
Accumulated other comprehensive income (loss)
|
Noncontrolling interest
|
Total
|
|||||||||||||||||||||||||
|
Balance, December 31, 2014
|
22,390,231
|
|
$
|
—
|
|
$
|
239,885
|
|
$
|
(22,061
|
)
|
—
|
|
$
|
—
|
|
$
|
—
|
|
$
|
—
|
|
$
|
217,824
|
|
||||||||
|
Net income
|
—
|
|
—
|
|
—
|
|
11,427
|
|
—
|
|
—
|
|
—
|
|
—
|
|
11,427
|
|
|||||||||||||||
|
Other comprehensive income
|
—
|
|
—
|
|
—
|
|
—
|
|
—
|
|
—
|
|
648
|
|
—
|
|
648
|
|
|||||||||||||||
|
Equity contribution
|
292,846
|
|
—
|
|
3,138
|
|
—
|
|
—
|
|
—
|
|
—
|
|
—
|
|
3,138
|
|
|||||||||||||||
|
Stock compensation
|
—
|
|
—
|
|
2,256
|
|
—
|
|
—
|
|
—
|
|
—
|
|
—
|
|
2,256
|
|
|||||||||||||||
|
Balance, December 31, 2015
|
22,683,077
|
|
$
|
—
|
|
$
|
245,279
|
|
$
|
(10,634
|
)
|
—
|
|
$
|
—
|
|
$
|
648
|
|
$
|
—
|
|
$
|
235,293
|
|
||||||||
|
Business Combination
|
83,169,873
|
|
73
|
|
912,127
|
|
—
|
|
—
|
|
—
|
|
—
|
|
6,569
|
|
918,769
|
|
|||||||||||||||
|
Net income (loss)
|
—
|
|
—
|
|
—
|
|
(79,746
|
)
|
—
|
|
—
|
|
—
|
|
588
|
|
(79,158
|
)
|
|||||||||||||||
|
Other comprehensive loss
|
—
|
|
—
|
|
—
|
|
—
|
|
—
|
|
—
|
|
(54,359
|
)
|
(1,053
|
)
|
(55,412
|
)
|
|||||||||||||||
|
Stock repurchase
|
—
|
|
—
|
|
—
|
|
—
|
|
(207,546
|
)
|
(2,540
|
)
|
—
|
|
—
|
|
(2,540
|
)
|
|||||||||||||||
|
Equity contribution
|
529,375
|
|
—
|
|
6,486
|
|
—
|
|
9,255
|
|
114
|
|
—
|
|
—
|
|
6,600
|
|
|||||||||||||||
|
Dividend distribution
|
—
|
|
—
|
|
—
|
|
—
|
|
—
|
|
—
|
|
—
|
|
(1,040
|
)
|
(1,040
|
)
|
|||||||||||||||
|
Stock compensation, net of forfeitures
|
70,005
|
|
—
|
|
3,245
|
|
—
|
|
176,772
|
|
2,187
|
|
—
|
|
—
|
|
5,432
|
|
|||||||||||||||
|
Balance, December 31, 2016
|
106,452,330
|
|
$
|
73
|
|
$
|
1,167,137
|
|
$
|
(90,380
|
)
|
(21,519
|
)
|
$
|
(239
|
)
|
$
|
(53,711
|
)
|
$
|
5,064
|
|
$
|
1,027,944
|
|
||||||||
|
Net income
|
—
|
|
—
|
|
—
|
|
57,603
|
|
—
|
|
—
|
|
—
|
|
960
|
|
58,563
|
|
|||||||||||||||
|
Stock split and conversion
|
(232,571
|
)
|
989
|
|
(1,228
|
)
|
—
|
|
232,534
|
|
239
|
|
—
|
|
—
|
|
—
|
|
|||||||||||||||
|
Issuance of common stock - IPO
|
29,000,000
|
|
290
|
|
480,406
|
|
—
|
|
—
|
|
—
|
|
—
|
|
—
|
|
480,696
|
|
|||||||||||||||
|
Other comprehensive income (loss)
|
—
|
|
—
|
|
—
|
|
—
|
|
—
|
|
—
|
|
58,022
|
|
(1,112
|
)
|
56,910
|
|
|||||||||||||||
|
Dividend distribution
|
—
|
|
—
|
|
—
|
|
—
|
|
—
|
|
—
|
|
—
|
|
(993
|
)
|
(993
|
)
|
|||||||||||||||
|
Issuance of common stock - stock option exercises
|
12,063
|
|
—
|
|
—
|
|
—
|
|
—
|
|
—
|
|
—
|
|
—
|
|
—
|
|
|||||||||||||||
|
Stock compensation, net of forfeitures
|
12,557
|
|
—
|
|
8,799
|
|
—
|
|
(211,015
|
)
|
—
|
|
—
|
|
—
|
|
8,799
|
|
|||||||||||||||
|
Balance, December 31, 2017
|
135,244,379
|
|
$
|
1,352
|
|
$
|
1,655,114
|
|
$
|
(32,777
|
)
|
—
|
|
$
|
—
|
|
$
|
4,311
|
|
$
|
3,919
|
|
$
|
1,631,919
|
|
||||||||
See accompanying notes to consolidated financial statements.
F-6
PQ GROUP HOLDINGS INC. AND SUBSIDIARIES
(in thousands)
|
Years ended
December 31, |
||||||||||||
|
2017
|
2016
|
2015
|
||||||||||
|
Cash flows from operating activities:
|
||||||||||||
|
Net income (loss)
|
$
|
58,563
|
|
$
|
(79,158
|
)
|
$
|
11,427
|
|
|||
|
Adjustments to reconcile net income (loss) to net cash provided by operating activities:
|
||||||||||||
|
Depreciation
|
124,551
|
|
89,453
|
|
28,790
|
|
||||||
|
Amortization
|
52,589
|
|
38,836
|
|
10,210
|
|
||||||
|
Acquisition accounting valuation adjustments on inventory sold
|
871
|
|
29,086
|
|
—
|
|
||||||
|
Intangible asset impairment charge
|
—
|
|
6,873
|
|
—
|
|
||||||
|
Amortization of deferred financing costs and original issue discount
|
8,733
|
|
6,859
|
|
3,115
|
|
||||||
|
Debt extinguishment costs
|
15,007
|
|
8,561
|
|
—
|
|
||||||
|
Debt modification creditor fees capitalized
|
(2,756
|
)
|
(2,988
|
)
|
—
|
|
||||||
|
Foreign currency exchange (gain) loss
|
25,786
|
|
(3,558
|
)
|
—
|
|
||||||
|
Pension and postretirement healthcare benefit expense
|
3,289
|
|
1,957
|
|
2,900
|
|
||||||
|
Pension and postretirement healthcare benefit funding
|
(7,887
|
)
|
(2,887
|
)
|
(14,937
|
)
|
||||||
|
Deferred income tax benefit
|
(140,212
|
)
|
(138
|
)
|
—
|
|
||||||
|
Net loss on asset disposals
|
5,793
|
|
4,216
|
|
3,911
|
|
||||||
|
Supplemental pension plan mark-to-market gain
|
(965
|
)
|
(300
|
)
|
—
|
|
||||||
|
Stock compensation
|
8,799
|
|
5,432
|
|
2,256
|
|
||||||
|
Equity in net (income) loss from affiliated companies
|
(38,772
|
)
|
2,612
|
|
—
|
|
||||||
|
Dividends received from affiliated companies
|
44,071
|
|
7,636
|
|
—
|
|
||||||
|
Working capital changes that provided (used) cash, excluding the effect of business combinations:
|
||||||||||||
|
Receivables
|
(11,463
|
)
|
27,757
|
|
(280
|
)
|
||||||
|
Inventories
|
(21,200
|
)
|
(2,305
|
)
|
(1,738
|
)
|
||||||
|
Prepaids and other current assets
|
(3,434
|
)
|
548
|
|
20,096
|
|
||||||
|
Accounts payable
|
4,343
|
|
11,885
|
|
(2,486
|
)
|
||||||
|
Accrued liabilities
|
(6,548
|
)
|
(23,866
|
)
|
(13,809
|
)
|
||||||
|
Other, net
|
(3,096
|
)
|
(6,791
|
)
|
(4,740
|
)
|
||||||
|
Net cash provided by operating activities
|
116,062
|
|
119,720
|
|
44,715
|
|
||||||
|
Cash flows from investing activities:
|
||||||||||||
|
Purchases of property, plant and equipment
|
(140,482
|
)
|
(121,421
|
)
|
(40,994
|
)
|
||||||
|
Investment in affiliated companies
|
(9,000
|
)
|
—
|
|
—
|
|
||||||
|
Change in restricted cash, net
|
13,432
|
|
(14,786
|
)
|
—
|
|
||||||
|
Loan receivable under the New Markets Tax Credit Arrangement
|
(6,221
|
)
|
(15,598
|
)
|
—
|
|
||||||
|
Business combinations, net of cash acquired
|
(41,572
|
)
|
(1,777,740
|
)
|
3,965
|
|
||||||
|
Other, net
|
1,148
|
|
(135
|
)
|
(1,696
|
)
|
||||||
|
Net cash used in investing activities
|
(182,695
|
)
|
(1,929,680
|
)
|
(38,725
|
)
|
||||||
|
Cash flows from financing activities:
|
||||||||||||
|
Draw down of revolver
|
357,773
|
|
145,000
|
|
12,000
|
|
||||||
|
Repayments of revolver
|
(334,180
|
)
|
(167,000
|
)
|
(12,000
|
)
|
||||||
|
Issuance of long-term debt under the New Market Tax Credit arrangement
|
8,820
|
|
22,000
|
|
—
|
|
||||||
|
Issuance of long-term debt, net of original issue discount and financing fees
|
300,000
|
|
1,219,791
|
|
—
|
|
||||||
|
Issuance of long-term notes, net of original issue discount and financing fees
|
—
|
|
1,124,629
|
|
—
|
|
||||||
|
Debt issuance costs
|
(3,700
|
)
|
(5,397
|
)
|
—
|
|
||||||
|
Repayments of long-term debt
|
(739,472
|
)
|
(479,059
|
)
|
(5,000
|
)
|
||||||
|
IPO proceeds
|
507,500
|
|
—
|
|
—
|
|
||||||
|
IPO costs
|
(26,804
|
)
|
—
|
|
—
|
|
||||||
|
Interest hedge premium
|
—
|
|
(1,551
|
)
|
—
|
|
||||||
|
Equity contribution
|
—
|
|
6,600
|
|
1,538
|
|
||||||
|
Stock repurchase
|
—
|
|
(2,540
|
)
|
—
|
|
||||||
|
Distributions to noncontrolling interests
|
(993
|
)
|
(1,040
|
)
|
—
|
|
||||||
|
Net cash provided by (used in) financing activities
|
68,944
|
|
1,861,433
|
|
(3,462
|
)
|
||||||
|
Effect of exchange rate changes on cash and cash equivalents
|
(6,858
|
)
|
(5,886
|
)
|
—
|
|
||||||
|
Net change in cash and cash equivalents
|
(4,547
|
)
|
45,587
|
|
2,528
|
|
||||||
|
Cash and cash equivalents at beginning of period
|
70,742
|
|
25,155
|
|
22,627
|
|
||||||
|
Cash and cash equivalents at end of period
|
$
|
66,195
|
|
$
|
70,742
|
|
$
|
25,155
|
|
|||
For supplemental cash flow disclosures, see Note 28.
See accompanying notes to consolidated financial statements.
F-7
PQ GROUP HOLDINGS INC. AND SUBSIDIARIES
NOTES TO CONSOLIDATED FINANCIAL STATEMENTS
(Dollars in thousands, except share and per share amounts)
1. Background and Basis of Presentation:
Description of Business
PQ Group Holdings Inc. and subsidiaries (the “Company” or “PQ Group Holdings”) conducts operations through
two
reporting segments: (1) Environmental Catalysts & Services: a leading global innovator and producer of silica catalysts used in the production of high-density polyethylene (“HDPE”), methyl methacrylate (“MMA”), specialty zeolite-based catalysts sold to the emission control industry, the petrochemical industry and other areas of the broader chemicals industry and a merchant sulfuric acid producer operating a network of plants serving a variety of end uses, including the oil refining, nylon, mining, general industrial and chemical industries; and (2) Performance Materials & Chemicals: a fully integrated, global leader in silicate technology, producing sodium silicate, specialty silicas, zeolites, spray dry silicates, magnesium silicate, and other high performance chemical products used in a variety of end-uses such as adsorbents for surface coatings, clarifying agents for beverages, cleaning and personal care products and engineered glass products for use in highway safety, polymer additives, metal finishing and electronics end uses.
Seasonal changes and weather conditions typically affect
the Company’s
performance materials and refining services product groups. In particular,
the Company’s
performance materials product group generally experiences lower sales and profit in the first and fourth quarters of the year because highway striping projects typically occur during warmer weather months. Additionally,
the Company’s
refining services product group typically experiences similar seasonal fluctuations as a result of higher demand for gasoline products in the summer months. As a result,
working capital requirements tend to be higher in the first and fourth quarters of the year, which can adversely affect
the Company’s
liquidity and cash flows. Because of this seasonality associated with certain of
the Company’s
product groups, results for any one quarter are not necessarily indicative of the results that may be achieved for any other quarter or for the full year.
Basis of Presentation
PQ Merger with Eco Services
On August 17, 2015,
the Company,
PQ Holdings Inc. (“PQ Holdings”), Eco Services Operations LLC (“Eco Services”), certain investment funds affiliated with CCMP Capital Advisors, LLC (now known as CCMP Capital Advisors, LP; “CCMP”), and stockholders of PQ Holdings and Eco Services entered into a reorganization and transaction agreement pursuant to which the companies consummated a series of transactions to reorganize and combine the businesses of PQ Holdings and Eco Services (the “Business Combination”), under a new holding company, PQ Group Holdings Inc.
The Business Combination was consummated on May 4, 2016.
In accordance with accounting principles generally accepted in the United States (“GAAP”), Eco Services is the accounting predecessor to PQ Group Holdings. Certain investment funds affiliated with CCMP held a controlling interest position in Eco Services prior to the Business Combination. In addition, certain investment funds affiliated with CCMP owned a non-controlling interest in PQ Holdings prior to the Business Combination and the merger with Eco Services constituted a change in control under the PQ Holdings credit agreements and bond indenture that were in place at the time of the Business Combination. Therefore, Eco Services is deemed to be the accounting acquirer. These
consolidated
financial statements are the continuation of Eco Services’ business prior to the Business Combination.
Stock Split and Initial Public Offering
Prior to September 22, 2017, the Company had two classes of common stock designated as Class A and Class B common stock. On September 22, 2017, the Company reclassified its Class A common stock into common stock and then effected a
8.8275
-for-1 split of its common stock. On September 28, 2017, the Company converted each outstanding share of Class B common stock into
8.8275
shares of common stock plus an additional number of shares determined by dividing the unreturned paid-in capital amount of such Class B common stock, or
$113.74
per share, by
$17.50
, the initial public offering price of a share of our common stock in the Company’s initial public offering (“IPO”), rounded to the nearest whole share. Holders of Class B common stock did not receive any cash payments from the Company in connection with the conversion of the Class B common stock. As a result of the reclassification of Class A common stock into common stock, and the conversion of Class B common stock into common stock, all references to “Class A common stock” and “Class B common stock” have been changed to “common stock” for all periods presented. All previously reported per share and common share amounts in the accompanying financial statements and related notes have been restated to reflect the stock split.
F-8
PQ GROUP HOLDINGS INC. AND SUBSIDIARIES
NOTES TO CONSOLIDATED FINANCIAL STATEMENTS
(Dollars in thousands, except share and per share amounts)
On October 3, 2017, the Company completed its IPO whereby it issued
29,000,000
shares of its common stock at an initial public offering price of
$17.50
per share.
The shares began trading on the New York Stock Exchange on September 29, 2017.
The aggregate proceeds received by the Company from the offering were
$480,696
,
net of underwriting discounts, commissions and offering expenses.
The net proceeds were used to repay existing indebtedness as further described in
Note 15
.
2. Summary of Significant Accounting Policies:
Principles of Consolidation.
The consolidated financial statements include the accounts of the Company and its controlled subsidiaries. Investments in affiliated companies are recorded at cost plus the Company’s equity in their undistributed earnings. All intercompany transactions have been eliminated. Noncontrolling interests represent third-party equity ownership in certain of the Company’s consolidated subsidiaries and are presented as a component of equity separate from the equity attributable to the Company’s shareholders. The noncontrolling interests’ share in the Company’s net earnings are included in net income attributable to the noncontrolling interest in the Company’s consolidated statements of operations, and their portion of the Company’s comprehensive income is included in comprehensive loss attributable to noncontrolling interests in the Company’s consolidated statements of comprehensive income (loss). The Company’s noncontrolling interests relate to third-party minority ownership interests held in certain of the Company’s foreign subsidiaries acquired as part of the Business Combination.
All assets and liabilities of foreign subsidiaries and affiliated companies are translated to U.S. dollars using exchange rates in effect at the balance sheet date. Adjustments resulting from translation of the balance sheets and intercompany loans, which are considered permanent, are included in stockholders’ equity as part of accumulated other comprehensive income (loss). Adjustments resulting from translation of certain intercompany loans, which are not considered permanent and are denominated in foreign currencies, are included in other (income) expense, net in the consolidated statements of operations. The Company considers intercompany loans to be of a permanent or long-term nature if management expects and intends that the loans will not be repaid. For the years ended
December 31, 2017
and
2016
, all intercompany loan arrangements were determined to be non-permanent based on management’s intention as well as actual lending and repayment activity. Therefore, the foreign currency transaction gains or losses associated with the intercompany loans were recorded in the consolidated statements of operations for the years ended
December 31, 2017
and
2016
.
Income and expense items are translated at average exchange rates during the year. Net foreign exchange included in other (income) expense, net was a loss of
$25,786
and gain of
$3,558
for the years ended
December 31, 2017
and
2016
, respectively. The Company did not incur any foreign exchange expense for the year ended
December 31, 2015
. The foreign currency losses realized in 2017 and gains realized in
2016
were
primarily driven by the Euro-denominated term loan
(see Note 15 to these consolidated financial statements for further information)
and the non-permanent intercompany debt denominated in local currency and translated to U.S. dollars
.
Cash and Cash Equivalents.
Cash and cash equivalents include investments with original terms to maturity of 90 days or less from the time of purchase.
Restricted Cash.
Restricted cash, which is restricted as to withdrawal or usage, is classified separately from cash and cash equivalents on our consolidated balance sheets. The proceeds from the New Markets Tax Credit (“NMTC”) financing arrangements are restricted for use and are classified on the Company’s consolidated balance sheets as other current assets. As of
December 31, 2017
and
2016
, there remained
$348
and
$13,780
, respectively, in restricted cash that is required to be used to fund the capital expenditures associated with the NMTC financing arrangements. See
Note 15
to these consolidated financial statements for further information regarding the NMTC financing arrangements. The Company’s total restricted cash balances, including cash related to the NMTC financing arrangements, were
$1,048
and
$14,335
as of
December 31, 2017
and
2016
, respectively, and are included on the Company’s consolidated balance sheets as other current assets.
Accounts Receivable and Allowance for Doubtful Accounts.
Trade accounts receivable are recorded at the invoiced amount and do not bear interest. The allowance for doubtful accounts is the Company’s best estimate of the amount of probable credit losses in its existing accounts receivable. A specific reserve for bad debt is recorded for known or suspected doubtful accounts receivable. For all other accounts, the Company recognizes a reserve for bad debt based on the length of time receivables are past due and historical write-off experience. Account balances are charged against the allowance when the Company believes it is probable that the associated receivables will not be recovered. If the financial condition of the Company’s customers were to deteriorate resulting in an impairment of their ability to make payments, additional allowances may be required. The Company does not have any off-balance sheet credit exposure related to its customers. As of
December 31, 2017
and
2016
, the Company’s allowance for doubtful accounts was not material.
Inventories.
Certain domestic inventories are stated at the lower of cost or market and valued using the last-in, first-out (“LIFO”) method. All other inventories are stated at the lower of cost and net realizable value and valued using the weighted average cost or first-in, first-out (“FIFO”) methods.
F-9
PQ GROUP HOLDINGS INC. AND SUBSIDIARIES
NOTES TO CONSOLIDATED FINANCIAL STATEMENTS
(Dollars in thousands, except share and per share amounts)
Property, Plant and Equipment.
Property, plant and equipment are carried at cost and include expenditures for new facilities, major renewals and betterments. The Company capitalizes the cost of furnace rebuilds as part of property, plant and equipment. Plant and equipment under capital leases are carried at the present value of minimum lease payments as determined at the beginning of the lease term. Maintenance, repairs and minor renewals are charged to expense as incurred. The Company capitalizes certain internal costs associated with the implementation of purchased software. When property, plant and equipment is retired or otherwise disposed of, the net carrying amount is eliminated with any gain or loss on disposition recognized in earnings at that time. The Company also leases property, plant and equipment, principally under operating leases. Rent expense for operating leases, which may have escalating rentals or rent holidays, is recorded on a straight-line basis over the respective lease terms.
Depreciation is provided on the straight-line method based on the estimated useful lives of the assets, which generally range from
15
to
33
years for buildings and improvements and
3
to
10
years for machinery and equipment. Leasehold improvements are depreciated using the straight-line method based on the shorter of the useful life of the improvement or remaining lease term.
The Company capitalizes the interest cost associated with the development and construction of significant new plant and equipment and depreciates that amount over the lives of the related assets. Capitalized interest recorded during the years ended
December 31, 2017
and
2016
was
$5,806
and
$5,687
, respectively, and was not material for the year ended
December 31, 2015
.
Spare Parts.
Spare parts are maintained by the Company’s facilities to keep machinery and equipment in working order. Spare parts are capitalized and included in other long-term assets. Spare parts are measured at cost and are not depreciated or expensed until utilized; however, reserves may be provided on aged spare parts. When a spare part is utilized as part of an improvement to property, plant and equipment, the carrying value is depreciated over the applicable life once placed in service. Otherwise, the spare part is expensed and charged as a cost of production when utilized.
Investments in Affiliated Companies.
Investments in affiliated companies are accounted for using the equity method of accounting if the investment provides the Company with the ability to exercise significant influence, but not control, over the investee. Significant influence is generally deemed to exist if the Company’s ownership interest in the voting stock of the investee ranges between 20% and 50%, although other factors, such as representation on the investee’s board of directors and the impact of commercial arrangements, are considered in determining whether the equity method of accounting is appropriate. Under the equity method of accounting, the investments in equity-method investees are recorded in the consolidated balance sheets as investments in affiliated companies, and the Company’s share of the investees’ earnings or losses, together with other-than temporary impairments in value, is recorded as equity in net income (loss) from affiliated companies in the consolidated statements of operations. Any differences between the Company’s cost of an equity method investment and the underlying equity in the net assets of the investment, such as fair value step-ups resulting from acquisitions, are accounted for according to their nature and impact the amounts recognized as equity in net income (loss) from affiliated companies in the consolidated statements of operations.
Goodwill and Intangible Assets.
Goodwill is an asset representing the future economic benefits arising from other assets acquired in a business combination that are not individually identified and separately recognized. The Company is required to test goodwill associated with each of its reporting units for impairment at least annually and whenever events or circumstances indicate that it is more likely than not that goodwill may be impaired. The Company performs its annual goodwill impairment test as of October 1 of each year.
Goodwill is tested for impairment at the reporting unit level. In performing tests for goodwill impairment,
the Company is
permitted to first perform a qualitative assessment about the likelihood of the carrying value of a reporting unit exceeding its fair value. If an entity determines that it is more likely than not that the fair value of a reporting unit is less than its carrying amount based on the qualitative assessment, it is required to perform a two-step goodwill impairment test to identify the potential goodwill impairment and measure the amount of the goodwill impairment loss, if any, to be recognized for that reporting unit. However, if an entity concludes otherwise based on the qualitative assessment, the two-step goodwill impairment test is not required. The option to perform the qualitative assessment can be utilized at
the Company’s
discretion, and the qualitative assessment need not be applied to all reporting units in a given goodwill impairment test. For an individual reporting unit, if
the Company elects
not to perform the qualitative assessment, or if the qualitative assessment indicates that it is more likely than not that the fair value of a reporting unit is less than its carrying amount, then
the Company
must perform the two-step goodwill impairment test for the reporting unit.
F-10
PQ GROUP HOLDINGS INC. AND SUBSIDIARIES
NOTES TO CONSOLIDATED FINANCIAL STATEMENTS
(Dollars in thousands, except share and per share amounts)
In applying the two-step process, the first step used to identify potential impairment involves comparing the reporting unit’s estimated fair value to its carrying value, including goodwill. If the estimated fair value of a reporting unit exceeds its carrying value, goodwill is not impaired. If the carrying value exceeds the estimated fair value, there is an indication of potential impairment and the second step is performed to measure the amount of impairment, if any. The second step of the process involves the calculation of an implied fair value of goodwill for each reporting unit for which step one indicated potential impairment. The implied fair value of goodwill is determined in a manner similar to how goodwill is calculated in a business combination. That is, the estimated fair value of the reporting unit, as calculated in step one, is allocated to the individual assets and liabilities as if the reporting unit was being acquired in a business combination. If the implied fair value of goodwill exceeds the carrying value of goodwill assigned to the reporting unit, there is no impairment. If the carrying value of goodwill assigned to a reporting unit exceeds the implied fair value of the goodwill, an impairment charge is recorded to write down the carrying value. An impairment loss cannot exceed the carrying value of goodwill assigned to a reporting unit and the loss establishes a new basis in the goodwill. Subsequent reversal of an impairment loss is not permitted.
For intangible assets other than goodwill, definite-lived intangible assets are amortized over their respective estimated useful lives. Intangible assets with indefinite lives are not amortized, but rather are tested for impairment at least annually or more frequently if events occur or circumstances change that would more likely than not reduce the fair value of the intangible asset below its carrying amount.
The Company tests its indefinite-lived intangible assets as of October 1 of each year in conjunction with its annual goodwill impairment test.
Impairment Assessment of Long-Lived Assets.
The Company performs
an impairment review of property, plant and equipment and definite-lived intangible assets when facts and circumstances indicate that the carrying value of an asset or asset group may not be recoverable from its undiscounted future cash flows. When evaluating long-lived assets for impairment, if the carrying amount of an asset or asset group is found not to be recoverable, a potential impairment loss may be recognized. An impairment loss is measured by comparing the carrying amount of the asset or asset group to its fair value. Fair value is determined using quoted market prices when available, or other techniques including discounted cash flows.
The Company’s
estimates of future cash flows involve assumptions concerning future operating performance, economic conditions and technological changes that may affect the future useful lives of the assets.
Derivative Financial Instruments.
The Company utilizes certain derivative financial instruments to enhance its ability to manage risk, including exposure to interest rates and natural gas price fluctuations that exist as part of ongoing business operations. Derivative instruments are entered into for periods consistent with the related underlying exposures and do not constitute positions independent of those exposures.
All derivatives designated as hedges are recognized on the consolidated balance sheets at fair value. On the date a derivative contract is entered into, the Company may designate the derivative as a hedge of a forecasted transaction or as a hedge of the variability of cash flows to be received or paid related to a recognized asset or liability (cash-flow hedge). Changes in the fair value of a derivative that is highly effective and that is designated and qualifies as a cash-flow hedge are recorded in other comprehensive income (loss) to the extent that the derivative is effective as a hedge and until earnings are affected by the variability in cash flows of the designated hedged item. The ineffective portion is reported in earnings. Changes in the fair value of a derivative that is not designated or does not qualify as a cash-flow hedge are recorded in the consolidated statements of operations. Cash flows from derivative instruments are reported in the same cash-flow category as the cash flows from the items being hedged.
The Company formally documents all relationships between hedging instruments and hedged items, as well as its risk-management objective and strategy for undertaking various hedge transactions. This process includes relating all derivatives that are designated cash-flow hedges to underlying forecasted transactions. The Company also formally assesses whether each hedging relationship is highly effective in achieving offsetting changes in fair values or cash flows of the hedged item during the period both at the inception of the hedge and on an ongoing basis. If it is determined that a derivative is not highly effective as a hedge, or if a derivative ceases to be a highly-effective hedge, hedge accounting is discontinued with respect to that derivative prospectively.
Fair Value Measurements.
The Company measures fair value using the guidelines under GAAP. An asset’s fair value is defined as the price at which the asset could be exchanged in a current transaction between market participants. A liability’s fair value is defined as the amount that would be paid to transfer the liability to a market participant, not the amount that would be paid to settle the liability with the creditor. See
Note 4
to these consolidated financial statements regarding the application of fair value measurements.
The carrying values of cash, accounts receivable, accounts payable and accrued liabilities approximate fair value due to the short-term nature of these items. See
Note 15
to these consolidated financial statements regarding the fair value of debt.
F-11
PQ GROUP HOLDINGS INC. AND SUBSIDIARIES
NOTES TO CONSOLIDATED FINANCIAL STATEMENTS
(Dollars in thousands, except share and per share amounts)
Revenue Recognition.
Revenue, net of related discounts and allowances, is recognized when both title and risk of loss of the product have been transferred to the customer, the seller’s price to the buyer is fixed or determinable, collectability is reasonably assured, and persuasive evidence of an arrangement exists. Customers take title and assume all the risks of ownership based on delivery terms, which are generally included in customer contracts of sale, order confirmation documents and invoices.
The Company recognizes rebates given to customers as a reduction of revenue based on an allocation of the cost of honoring rebates earned and claimed to each of the underlying revenue transactions that result in progress by the customer toward earning the rebate. Rebates are recognized at the time revenue is recorded. The Company measures the rebate obligation based on the estimated amount of sales that will result in a rebate at the adjusted sales price per the respective sales agreement.
Shipping and Handling Costs.
Amounts billed to a customer in a sale transaction related to shipping and handling, if any, represent revenues earned for the goods provided and are classified as revenue. Costs related to shipping and handling of products shipped to customers are classified as cost of goods sold.
Research and Development.
Research and development costs of
$13,859
and
$7,266
for the years ended
December 31, 2017
and
2016
, respectively, were expensed as incurred and reported in selling, general and administrative expenses in the consolidated statements of operations. There were
no
significant research and development costs incurred during the year ended
December 31, 2015
.
Income Taxes.
Prior to the Business Combination, Eco Services was a single member limited liability company and was treated as a partnership for federal and state tax purposes. All income tax liabilities and/or benefits of the Company were passed through to the member. As such, no recognition of federal or state income taxes for the Company have been provided for tax periods prior to the Business Combination. As a result of the Business Combination, Eco Services had a change in tax status and is taxed as a C-Corporation.
The Company operates
within multiple taxing jurisdictions and
are
subject to tax filing requirements and audit within these jurisdictions.
The Company uses
the asset and liability method in accounting for income taxes. Deferred tax assets and liabilities are recorded for temporary differences between the tax basis of assets and liabilities and their reported amounts in the financial statements, using statutory tax rates in effect for the year in which the differences are expected to reverse. The effect on deferred tax assets and liabilities of a change in tax rates is recognized in the results of operations in the period that includes the enactment date.
The Company evaluates its
deferred tax assets each period to ensure that estimated future taxable income will be sufficient in character (e.g., capital gain versus ordinary income treatment), amount and timing to result in their recovery. A valuation allowance is recorded to reduce the carrying amounts of deferred tax assets unless it is more likely than not that those assets will be realized.
In determining the provision for income taxes,
the Company provides
deferred income taxes on income from foreign subsidiaries as such earnings are taxable upon remittance to the United States, to the extent that these earnings are considered to be available for repatriation.
The Company does not
provide income taxes on the cumulative unremitted earnings of foreign subsidiaries considered permanently reinvested.
The Company establishes
contingent liabilities for possible assessments by taxing authorities resulting from uncertain tax positions including, but not limited to, transfer pricing, deductibility of certain expenses and other state, local, and foreign tax matters.
The Company recognizes
a financial statement benefit for positions taken for tax return purposes when it will be more likely than not (greater than 50%) that the positions will be sustained upon tax examination, based solely on the technical merits of the tax positions, otherwise, no benefit is recognized. The tax benefits recognized are measured based on the largest benefit that has a greater than 50% likelihood of being realized upon ultimate settlement.
The Company recognizes
potential accrued interest and penalties related to unrecognized tax benefits in income tax expense. Tax examinations are often complex as tax authorities may disagree with the treatment of items reported by
the Company
and may require several years to resolve. These accrued liabilities represent a provision for taxes that are reasonably expected to be incurred on the basis of available information but which are not certain.
Pursuant to the Securities and Exchange Commission (“SEC”) Staff Accounting Bulletin No.118 (“SAB 118”), the Company is allowed a measurement period of up to one year after the enactment date of the Tax Cuts and Jobs Act (“TCJA”) to finalize the recording of the related tax impacts. While we have not yet completed our assessment of the effects of the TCJA, we are able to determine reasonable estimates for the impacts of certain key items, thus we have reported provisional amounts for these items. The Company will continue to calculate the impact of the TCJA and will record any resulting tax adjustments during 2018, prior to the permitted remeasurement date. On a provisional basis, the Company is electing to use tax net operating losses (“NOLs”) to offset any inclusion to U.S. taxable income prescribed by the guidance in new Internal Revenue Code Section 965 (“Section 965”). Given the availability to use NOLs to offset this income inclusion, at this time the Company does not expect to pay any one-time transition tax over the eight-year installment period as prescribed by Section 965. This conclusion is subject to change as we refine the provisional estimate of our total post-1986 E&P, cash position and other related calculations.
F-12
PQ GROUP HOLDINGS INC. AND SUBSIDIARIES
NOTES TO CONSOLIDATED FINANCIAL STATEMENTS
(Dollars in thousands, except share and per share amounts)
Asset Retirement Obligations.
The Company records a liability when the fair value of any future obligation to retire a long-lived asset as a result of an existing or enacted law, statute, ordinance or contract is reasonably estimable. The Company also records a liability for the fair value of a conditional asset retirement obligation if the fair value can be reasonably estimated. When the liability is initially recorded, the Company capitalizes the cost by increasing the amount of the related long-lived asset. Over time, the Company adjusts the liability to its present value by recognizing accretion expense as an operating expense in the consolidated statements of operations each period, and the capitalized cost is depreciated over the useful life of the related asset. Upon settlement of the liability, the Company records a gain or loss if the actual costs differ from the accrued amount.
The Company has recorded asset retirement obligations (“AROs”) identified as part of the Business Combination in other long-term liabilities in order to recognize legal obligations associated with the retirement of tangible long-lived assets. The Company has assessed whether an ARO is required at each manufacturing facility and has recorded an obligation for those locations for which an obligation exists. The most significant of these are primarily attributable to environmental remediation liabilities associated with current operations that were incurred during the course of normal operations. The Company has AROs that are conditional in nature. The Company identified certain conditional AROs upon which it was able to reasonably estimate their fair value and recorded a liability. These AROs were triggered upon commitments by the Company to comply with local, state, and national laws to remove environmentally hazardous materials. The AROs have been recognized on a discounted basis using a credit adjusted risk free rate. Accretion of the AROs is recorded in other operating expense, net in the Company’s consolidated statements of operations. The following table includes the changes in the Company’s ARO liability during the years ended
December 31, 2017
and
2016
:
|
Years ended
December 31, |
||||||||
|
2017
|
2016
|
|||||||
|
Beginning balance
|
$
|
3,700
|
|
$
|
—
|
|
||
|
AROs identified as part of the Business Combination
|
—
|
|
3,687
|
|
||||
|
Accretion expense
|
232
|
|
177
|
|
||||
|
Foreign exchange impact
|
162
|
|
(164
|
)
|
||||
|
Ending balance
|
$
|
4,094
|
|
$
|
3,700
|
|
||
Environmental Expenditures.
Environmental expenditures that pertain to current operations or to future revenues are expensed or capitalized consistent with the Company’s capitalization policy for property, plant and equipment. Expenditures that result from the remediation of an existing condition caused by past operations and that do not contribute to current or future revenues are expensed. Liabilities are recognized for remedial activities when the remediation is probable and the cost can be reasonably estimated. Recoveries of expenditures for environmental remediation are recognized as assets only when recovery is deemed probable. See
Note 22
to these consolidated financial statements regarding commitments and contingencies and
Note 14
regarding the accrued environmental reserve.
Deferred Financing Costs.
Financing costs incurred in connection with the issuance of long-term debt are deferred and presented as a direct reduction from the related debt instruments on the Company’s consolidated balance sheets. Deferred financing costs are amortized as interest expense using the effective interest method over the respective terms of the associated debt instruments.
Stock-Based Compensation.
The Company applies the fair value based method to account for stock options, restricted stock awards and restricted stock units issued in connection with its equity incentive plans. Stock-based compensation expense is recognized on a straight-line basis over the vesting periods of the respective awards. In connection with the adoption of new accounting guidance related to stock-based compensation (see Note 3 to these consolidated financial statements), the Company accounts for forfeitures of equity incentive awards as they occur. See
Note 21
to these consolidated financial statements regarding compensation expense associated with the Company’s equity incentive awards.
Pensions and Postretirement Benefits.
The Company maintains qualified and non-qualified defined benefit pension plans that cover employees in the United States and Canada, as well as certain employees in other international locations. Benefits for a majority of the plans are based on average final pay and years of service. Our funding policy, consistent with statutory requirements, is based on actuarial computations utilizing the projected unit credit method of calculation. Not all defined benefit pension plans are funded. In the United States and Canada, the pension plans’ assets include equity and fixed income securities. In our other international locations, the pension plans’ assets include equity and fixed income securities, as well as insurance policies. Certain assumptions are made regarding the occurrence of future events affecting pension costs, such as mortality, withdrawal, disablement and retirement, changes in compensation and benefits, and discount rates to reflect the time value of money.
F-13
PQ GROUP HOLDINGS INC. AND SUBSIDIARIES
NOTES TO CONSOLIDATED FINANCIAL STATEMENTS
(Dollars in thousands, except share and per share amounts)
The major elements in determining pension income and expense are pension liability discount rates and the expected return on plan assets. The Company references rates of return on high-quality, fixed income investments when estimating the discount rate, and the expected period over which payments will be made based upon historical experience. The long-term rate of return used to calculate the expected return on plan assets is the average rate of return estimated to be earned on invested funds for providing pension benefits.
In addition to pension benefits, the Company provides certain health care benefits for employees who meet age, participation and length of service requirements at retirement. The Company uses explicit assumptions using the best estimates available of the plan’s future experience. Principal actuarial assumptions include: discount rates, present value factors, retirement age, participation rates, mortality rates, cost trend rates, Medicare reimbursement rates and per capita claims cost by age. Current interest rates as of the measurement date are used for discount rates in present value calculations.
The Company also has defined contribution plans covering domestic employees of the Company and certain subsidiaries.
Contingencies.
Certain conditions may exist as of the date the financial statements are issued, which may result in a loss to the Company but which will only be resolved when one or more future events occur or fail to occur. The Company’s management and its legal counsel assess such contingent liabilities, and such assessment inherently involves an exercise of judgment. In assessing loss contingencies related to legal proceedings that are pending against the Company or unasserted claims that may result in such proceedings, the Company and legal counsel evaluate the perceived merits of any legal proceedings or unasserted claims as well as the perceived merits of the amount of relief sought or expected to be sought therein. If the assessment of a contingency indicates that it is probable that a loss has been incurred and the amount of the liability can be estimated, then the estimated liability is accrued in the Company’s financial statements. If the assessment indicates that a loss contingency is not probable, but is reasonably possible, or is probable but cannot be estimated, then the nature of the contingent liability, together with an estimate of the range of possible loss if determinable and material, would be disclosed. Loss contingencies considered remote are generally not disclosed unless they involve guarantees, in which case the nature of the guarantee would be disclosed, including the approximate term, how the guarantee arose, and the events or circumstances that would require the guarantor to perform under the guarantee.
Use of Estimates.
The preparation of financial statements in conformity with GAAP requires management to make estimates and assumptions that affect the reported amounts of assets and liabilities and disclosure of contingent assets and liabilities at the date of the financial statements and the reported amounts of revenues and expenses during the reporting period. Actual results could differ from those estimates.
Reclassifications.
As a result of the Business Combination, certain reclassifications have been made to the historical financial statements of Eco Services included in the consolidated financial statements to conform to the current presentation.
3. New Accounting Standards:
Recently Adopted Accounting Standards
In October 2016, the Financial Accounting Standards Board (“FASB”) issued guidance which eliminates the deferral of the tax effects of intra-entity transfers of an asset other than inventory. Previous GAAP prohibited the recognition of current and deferred income taxes for an intra-entity asset transfer until the asset had been sold to an outside party which has resulted in diversity in practice and increased complexity within financial reporting. For public companies, the new guidance is effective for fiscal years beginning after December 15, 2017, and interim periods within those fiscal years. The Company early adopted the guidance effective January 1, 2017. The guidance did not have a material impact on the Company’s consolidated financial statements.
In March 2016, the FASB issued guidance that includes targeted improvements to the accounting for employee stock-based compensation. The updates in the guidance include changes in the income tax consequences, balance sheet classification and cash flow statement reporting of stock-based payment transactions. The guidance also includes certain modifications applicable only to nonpublic entities. For public companies, the new guidance is effective for annual periods beginning after December 15, 2016, and interim periods within those years. The Company adopted this new guidance as required on January 1, 2017, with no material impact upon adoption to the Company’s consolidated financial statements. On a prospective basis from the adoption date, the Company will record all tax effects related to stock-based compensation through the statement of operations, and all tax-related cash flows resulting from stock-based award payments will be reported as operating activities in the statement of cash flows. The Company made an accounting policy election under the new guidance to account for forfeitures of stock-based compensation awards as they occur.
F-14
PQ GROUP HOLDINGS INC. AND SUBSIDIARIES
NOTES TO CONSOLIDATED FINANCIAL STATEMENTS
(Dollars in thousands, except share and per share amounts)
In July 2015, the FASB issued new guidance that changes the measurement principle for inventory from the lower of cost or market to the lower of cost or net realizable value. The amendments in this guidance do not apply to inventory that is measured using LIFO or the retail inventory method; rather, the amendments apply to all other inventory, which includes inventory that is measured using FIFO or average cost. Within the scope of this new guidance, an entity should measure inventory at the lower of cost or net realizable value. Net realizable value is defined as the estimated selling price in the ordinary course of business, less reasonably predictable costs of completion, disposal and transportation, which is consistent with existing GAAP. The Company adopted the new guidance on January 1, 2017 as required. The guidance did not have a material impact on the Company’s consolidated financial statements.
Accounting Standards Not Yet Adopted as of
December 31, 2017
In August 2017, the FASB issued amendments intended to better align hedge accounting with an entities risk management activities. The amendments expand hedge accounting for non-financial and financial risk components and revise the measurement methodologies to better align with an entities risk management activities. Separate presentation of hedge ineffectiveness is eliminated to provide greater transparency of the full impact of hedging by requiring presentation of the results of the hedged item and hedging instrument in a single financial statement line item. In addition, the amendments reduce complexity by simplifying the manner in which assessments of hedge effectiveness may be performed. The new guidance is effective for public companies for annual periods beginning after December 15, 2018, including interim periods within those years. Early adoption is permitted, and the new guidance should be applied prospectively to the presentation and disclosure guidance. The Company early adopted the guidance effective January 1, 2018. The guidance did not have a material impact on the Company’s consolidated financial statements upon adoption.
In May 2017, the FASB issued guidance to clarify which changes to the terms or conditions of a share-based payment award require an entity to apply modification accounting. Under the new guidance, an entity should account for the effects of a change in a share-based payment award using modification accounting unless the fair value, vesting conditions and classification as either a liability or equity are all the same with respect to the award immediately prior to modification and the modified award itself. The new guidance is effective for annual periods beginning after December 15, 2017, including interim periods within those years, and the new guidance should be applied prospectively to awards modified on or after the adoption date. The Company adopted the new guidance on January 1, 2018 as required, with no impact on the Company’s consolidated financial statements upon adoption. Although the new guidance is prospective in nature, there would have been no change to the accounting for the modifications of the Company’s equity incentive awards that occurred in connection with the Business Combination or the equity restructuring preceding the IPO (see Note 21 to these consolidated financial statements for further information).
In March 2017, the FASB issued guidance to improve the presentation of net periodic pension cost and net periodic postretirement benefit cost (collectively, “pension costs”). Under current GAAP, there are several components of pension costs which are presented net to arrive at pension costs as included in the income statement and disclosed in the notes. As part of this amendment to the existing guidance, the service cost component of pension costs will be bifurcated from the other components and included in the same line items of the income statement as compensation costs are reported. The remaining components will be reported together below operating income on the income statement, either as a separate line item or combined with another line item on the income statement and disclosed. Additionally, with respect to capitalization to inventory, fixed assets, etc., only the service cost component will be eligible for capitalization upon adoption of the guidance. The new guidance is effective for public companies for annual periods beginning after December 15, 2017, including interim periods within those years. The amendments should be applied retrospectively upon adoption with respect to the presentation of the service and other cost components of pension costs in the income statement, and prospectively for the capitalization of the service cost component in assets.
The Company adopted the new guidance on January 1, 2018 as required. Prior to the adoption of the guidance, the Company reflected its pension costs within cost of goods sold and selling, general and administrative expenses in the consolidated statements of operations, depending on whether the costs were associated with employees involved in manufacturing, back office support functions, etc. Under the new guidance, the service cost component of the Company’s pension costs will remain in the same line items of the consolidated statements of operations, but the remaining components will be reported as part of nonoperating income in the other (income) expense, net line item of the consolidated statements of operations. Although the guidance requires retrospective application upon adoption, a practical expedient permits the Company to use the amounts disclosed in its pension and other postretirement benefit plan note as its basis of estimation for the prior comparative periods. Based on the Company’s disclosures in Note 19 to these consolidated financial statements, the Company estimates the retrospective impact of the new guidance on its consolidated statements of operations will reduce operating income and increase other nonoperating income by
$2,651
for the year ended December 31, 2016. The impact for the year ended December 31, 2015 is not material. The Company is also adjusting any pension costs capitalized as necessary beginning on the adoption date of January 1, 2018 to reflect the service cost component only in accordance with the new guidance.
F-15
PQ GROUP HOLDINGS INC. AND SUBSIDIARIES
NOTES TO CONSOLIDATED FINANCIAL STATEMENTS
(Dollars in thousands, except share and per share amounts)
In January 2017, the FASB issued guidance which eliminates the second step from the traditional two-step goodwill impairment test. Under current guidance, an entity performed the first step of the goodwill impairment test by comparing the fair value of a reporting unit with its carrying amount; if an impairment loss was indicated, the entity computed the implied fair value of goodwill to determine whether an impairment loss existed, and if so, the amount to recognize. Under the new guidance, an impairment loss is recognized for the amount by which the carrying amount exceeds the reporting unit’s fair value (the Step 1 test), with no further testing required. Any impairment loss recognized is limited to the amount of goodwill allocated to the reporting unit. The new guidance is effective for public companies that are SEC registrants for fiscal years beginning after December 15, 2019, with early adoption permitted for goodwill impairment tests performed on testing dates after January 1, 2017. All entities are required to apply the guidance prospectively to goodwill impairment tests subsequent to adoption of the standard. The impact that the new guidance will have on the Company’s consolidated financial statements depends on whether the Company fails the Step 1 test in any interim or annual goodwill impairment test subsequent to the adoption of the new standard. Upon adoption of the new guidance, the failure of the Step 1 test will result in a goodwill impairment, while the failure of the Step 1 test under current guidance will lead to the Step 2 test, which may or may not result in a goodwill impairment charge depending on the Company’s calculation of the implied fair value of goodwill. The Company has not yet early adopted the new guidance.
In January 2017, the FASB issued guidance which clarifies the definition of a business and provides revised criteria and a framework to determine whether an integrated set of assets and activities is a business. For public companies, the new guidance is effective for fiscal years beginning after December 15, 2017, including interim periods within those years. The Company adopted the new guidance on January 1, 2018 as required, with no impact on the Company’s consolidated financial statements upon adoption.
In November 2016, the FASB issued guidance which clarifies the classification and presentation of changes in restricted cash on the statement of cash flows. The updates in the guidance require that the statement of cash flows explain the change during the period in the total of cash, cash equivalents and restricted cash when reconciling the beginning-of-period and end-of-period total amounts. The updates also require a reconciliation between cash, cash equivalents and restricted cash presented on the balance sheet to the total of the same amounts presented on the statement of cash flows. For public companies, the new guidance is effective for fiscal years beginning after December 15, 2017 and interim periods within those years, and the new guidance should be applied retrospectively to each period presented.
The Company adopted the new guidance on January 1, 2018 as required. As of
December 31, 2017
and
2016
, the Company had
$1,048
and
$14,335
, respectively, of restricted cash included in other current assets on its balance sheet related to its New Market Tax Credit financing arrangements as well as other small restricted cash balances. The activity related to these balances is presented as cash flows from investing activities in the Company’s consolidated statements of cash flow under the existing guidance in place as of December 31, 2017. Under the new guidance effective January 1, 2018, the Company’s restricted cash balances will be added to the existing cash and cash equivalents balances included in the consolidated statements of cash flow rather than reported as part of investing activities. The Company estimates the retrospective impact of the new guidance on its consolidated statements of operations for the years ended December 31, 2017 and 2016 will be as follows:
|
As reported—
|
Retrospective impact—
|
|||||||||||||||
|
Years ended
December 31,
|
Years ended
December 31,
|
|||||||||||||||
|
2017
|
2016
|
2017
|
2016
|
|||||||||||||
|
Net cash provided by operating activities
|
$
|
116,062
|
|
$
|
119,720
|
|
$
|
116,062
|
|
$
|
119,720
|
|
||||
|
Net cash used in investing activities
|
(182,695
|
)
|
(1,929,680
|
)
|
(195,982
|
)
|
(1,915,345
|
)
|
||||||||
|
Net cash provided by financing activities
|
68,944
|
|
1,861,433
|
|
68,944
|
|
1,861,433
|
|
||||||||
|
Effect of exchange rate changes on cash and cash equivalents
|
(6,858
|
)
|
(5,886
|
)
|
(6,858
|
)
|
(5,886
|
)
|
||||||||
|
Net change in cash and cash equivalents
|
(4,547
|
)
|
45,587
|
|
|
|
||||||||||
|
Cash and cash equivalents at beginning of period
|
70,742
|
|
25,155
|
|
||||||||||||
|
Cash and cash equivalents at end of period
|
$
|
66,195
|
|
$
|
70,742
|
|
||||||||||
|
Net change in cash, cash equivalents and restricted cash
|
(17,834
|
)
|
59,922
|
|
||||||||||||
|
Cash, cash equivalents and restricted cash at beginning of period
|
85,077
|
|
25,155
|
|
||||||||||||
|
Cash, cash equivalents and restricted cash at end of period
|
$
|
67,243
|
|
$
|
85,077
|
|
||||||||||
F-16
PQ GROUP HOLDINGS INC. AND SUBSIDIARIES
NOTES TO CONSOLIDATED FINANCIAL STATEMENTS
(Dollars in thousands, except share and per share amounts)
In August 2016, the FASB issued guidance which clarifies the classification of certain cash receipts and cash payments in the statement of cash flows, including debt prepayment or extinguishment costs and distributions from certain equity method investees. For public companies, the new guidance is effective for fiscal years beginning after December 15, 2017, and interim periods within those fiscal years, and the new guidance should be applied retrospectively to each period presented. The Company adopted the new guidance on January 1, 2018 as required. During the year ended December 31, 2017, the Company paid
$47,875
in debt extinguishment costs (breakage and prepayment costs) related to the pay down of its
$525,000
floating rate senior unsecured notes due 2022 and its
$200,000
8.50%
senior notes due 2022 (see Note 15 to these consolidated financial statements for further information). The Company reported these costs as part of cash outflows from operating activities in its consolidated statement of cash flows. Based on the new guidance, these costs will be reported as cash outflows from financing activities in its consolidated statement of cash flows under the retrospective presentation requirement.
No
such costs were incurred during the year ended December 31, 2016. There are no other significant impacts to the Company’s consolidated financial statements from the adoption of the new guidance.
In February 2016, the FASB issued guidance (with subsequent targeted amendments) that modifies the accounting for leases. Under the new guidance, a lessee will recognize assets and liabilities for most leases (including those classified under existing GAAP as operating leases, which based on current standards are not reflected on the balance sheet), but will recognize expenses similar to current lease accounting. For public companies, the new guidance is effective for fiscal years beginning after December 15, 2018, including interim periods within those years. Early adoption is permitted. The new guidance must be adopted using a modified retrospective transition method and provides for certain practical expedients. The Company is currently evaluating the impact that the new guidance will have on its consolidated financial statements. The Company has operating lease agreements for which it expects to recognize right of use assets and corresponding liabilities on its balance sheet upon adoption of the new guidance. A complete discussion of these leases is included in
Note 22
,
Commitments and Contingent Liabilities
.
In May 2014, the FASB issued accounting guidance (with subsequent targeted amendments) that will significantly enhance comparability of revenue recognition practices across entities, industries, jurisdictions and capital markets. The core principle of the guidance is that revenue recognized from a transaction or event that arises from a contract with a customer should reflect the consideration to which an entity expects to be entitled in exchange for goods or services provided. To achieve that core principle, the new guidance sets forth a five-step revenue recognition model that will need to be applied consistently to all contracts with customers, except those that are within the scope of other topics in the Accounting Standards Codification (“ASC”). Also required are enhanced disclosures to help users of financial statements better understand the nature, amount, timing and uncertainty of revenues and cash flows from contracts with customers. The enhanced disclosures include qualitative and quantitative information about contracts with customers, significant judgments made in applying the revenue guidance, and assets recognized related to the costs to obtain or fulfill a contract. For public companies, the new requirements are effective for annual reporting periods beginning after December 15, 2017, including interim periods within those years. The Company reviewed its key revenue streams and assessed the underlying customer contracts within the framework of the new guidance. The Company evaluated the key aspects of its revenue streams for impact under the new guidance and performed a detailed analysis of its customer agreements to quantify the changes under the guidance. The Company concluded that the guidance did not have a material impact on its existing revenue recognition practices upon adoption on January 1, 2018, but there are new robust disclosure requirements that will have an impact on the Company’s reporting beginning with its first quarter ended March 31, 2018. The Company implemented the guidance under the modified retrospective transition method of adoption.
4. Fair Value Measurements:
Fair values are based on quoted market prices when available. When market prices are not available, fair values are generally estimated using discounted cash flow analyses, incorporating current market inputs for similar financial instruments with comparable terms and credit quality. In instances where there is little or no market activity for the same or similar instruments, the Company estimates fair values using methods, models and assumptions that management believes a hypothetical market participant would use to determine a current transaction price. These valuation techniques involve some level of management estimation and judgment that becomes significant with increasingly complex instruments or pricing models. Where appropriate, adjustments are included to reflect the risk inherent in a particular methodology, model or input used.
The Company’s financial assets and liabilities carried at fair value have been classified based upon a fair value hierarchy. The hierarchy gives the highest ranking to fair values determined using unadjusted quoted prices in active markets for identical assets and liabilities (Level 1) and the lowest ranking to fair values determined using methodologies and models with unobservable inputs (Level 3). The classification of an asset or a liability is based on the lowest level input that is significant to its measurement. For example, a Level 3 fair value measurement may include inputs that are both observable (Levels 1 and 2) and unobservable (Level 3). The levels of the fair value hierarchy are as follows:
F-17
PQ GROUP HOLDINGS INC. AND SUBSIDIARIES
NOTES TO CONSOLIDATED FINANCIAL STATEMENTS
(Dollars in thousands, except share and per share amounts)
|
•
|
Level 1—Values are unadjusted quoted prices for identical assets and liabilities in active markets accessible at the measurement date. Active markets provide pricing data for trades occurring at least weekly and include exchanges and dealer markets.
|
|
•
|
Level 2—Inputs include quoted prices for similar assets or liabilities in active markets, quoted prices from those willing to trade in markets that are not active, or other inputs that are observable or can be corroborated by market data for the term of the instrument. Such inputs include market interest rates and volatilities, spreads and yield curves.
|
|
•
|
Level 3—Certain inputs are unobservable (supported by little or no market activity) and significant to the fair value measurement. Unobservable inputs reflect the Company’s best estimate of what hypothetical market participants would use to determine a transaction price for the asset or liability at the reporting date.
|
The following table presents information about the Company’s assets and liabilities that were measured at fair value on a recurring basis as of
December 31, 2017
and
2016
, and indicates the fair value hierarchy of the valuation techniques the Company utilized to determine such fair value.
|
December 31, 2017
|
Quoted Prices in
Active Markets (Level 1) |
Significant Other Observable Inputs (Level 2)
|
Significant
Unobservable Inputs (Level 3) |
|||||||||||||
|
Assets:
|
||||||||||||||||
|
Derivative contracts
|
$
|
1,043
|
|
$
|
—
|
|
$
|
1,043
|
|
$
|
—
|
|
||||
|
Restoration plan assets
|
5,576
|
|
5,576
|
|
—
|
|
—
|
|
||||||||
|
Total
|
$
|
6,619
|
|
$
|
5,576
|
|
$
|
1,043
|
|
$
|
—
|
|
||||
|
Liabilities:
|
||||||||||||||||
|
Derivative contracts
|
$
|
448
|
|
$
|
—
|
|
$
|
448
|
|
$
|
—
|
|
||||
|
Total
|
$
|
448
|
|
$
|
—
|
|
$
|
448
|
|
$
|
—
|
|
||||
|
December 31, 2016
|
Quoted Prices in
Active Markets (Level 1) |
Significant Other
Observable Inputs (Level 2) |
Significant
Unobservable Inputs (Level 3) |
|||||||||||||
|
Assets:
|
||||||||||||||||
|
Derivative contracts
|
$
|
6,434
|
|
$
|
—
|
|
$
|
6,434
|
|
$
|
—
|
|
||||
|
Restoration plan assets
|
5,594
|
|
5,594
|
|
—
|
|
—
|
|
||||||||
|
Total
|
$
|
12,028
|
|
$
|
5,594
|
|
$
|
6,434
|
|
$
|
—
|
|
||||
The following table presents information about the Company’s assets and liabilities that were measured at fair value on a non-recurring basis as of
December 31, 2016
. The Company performed its annual impairment test on its indefinite life tradenames on October 1, 2017 and determined that no impairment existed. Refer to
Note 13
for additional detail.
Refer to
Note 13
to these consolidated financial statements for a description of the valuation techniques the Company utilized to determine such fair value.
F-18
PQ GROUP HOLDINGS INC. AND SUBSIDIARIES
NOTES TO CONSOLIDATED FINANCIAL STATEMENTS
(Dollars in thousands, except share and per share amounts)
|
|
As of
December 31, 2016 |
Quoted Prices in
Active Markets (Level 1) |
Significant Other
Observable Inputs (Level 2) |
Significant
Unobservable Inputs (Level 3) |
Total
Losses |
||||||||||||||
|
Assets:
|
|
|
|
|
|
||||||||||||||
|
Indefinite life trade names
(1)
|
$
|
153,922
|
|
$
|
—
|
|
$
|
—
|
|
$
|
153,922
|
|
$
|
(6,873
|
)
|
||||
|
Total
|
$
|
153,922
|
|
$
|
—
|
|
$
|
—
|
|
$
|
153,922
|
|
$
|
(6,873
|
)
|
||||
|
|
|
|
|
|
|
||||||||||||||
|
(1)
|
Indefinite life trade names with a carrying amount of
$160,795
, net of foreign exchange impact, were written down to their implied fair value of
$153,922
as part of the Company’s annual impairment assessment on October 1, 2016. This resulted in an impairment charge of
$6,873
, which was recorded to other operating expense, net, on the consolidated statements of operations.
|
Restoration plan assets
The fair values of the Company’s restoration plan assets are determined through quoted prices in active markets. Restoration plan assets are assets held in a Rabbi trust to fund the obligations of the Company’s defined benefit supplementary retirement plans and include various stock and fixed income mutual funds. See
Note 19
to these consolidated financial statements regarding defined benefit supplementary retirement plans.
Derivative contracts
Derivative assets and liabilities can be exchange-traded or traded over-the-counter (“OTC”). The Company generally values exchange-traded derivatives using models that calibrate to market transactions and eliminate timing differences between the closing price of the exchange-traded derivatives and their underlying instruments. OTC derivatives are valued using market transactions and other market evidence whenever possible, including market-based inputs to models, model calibration to market transactions, broker or dealer quotations or alternative pricing sources with reasonable levels of price transparency. When models are used, the selection of a particular model to value an OTC derivative depends on the contractual terms of, and specific risks inherent in, the instrument as well as the availability of pricing information in the market. The Company generally uses similar models to value similar instruments. Valuation models require a variety of inputs, including contractual terms, market prices and rates, forward curves, measures of volatility, and correlations of such inputs. For OTC derivatives that trade in liquid markets, such as forward contracts, swaps and options, model inputs can generally be corroborated by observable market data by correlation or other means, and model selection does not involve significant management judgment.
The Company has interest rate caps and natural gas swaps that are fair valued using Level 2 inputs. In addition, the Company applies a credit valuation adjustment to reflect credit risk which is calculated based on credit default swaps. To the extent that the Company’s net exposure under a specific master agreement is an asset, the Company utilizes the counterparty’s default swap rate. If the net exposure under a specific master agreement is a liability, the Company utilizes a default swap rate comparable to PQ Group Holdings. The credit valuation adjustment is added to the discounted fair value to reflect the exit price that a market participant would be willing to receive to assume the Company’s liabilities or that a market participant would be willing to pay for the Company’s assets. As of
December 31, 2017
and
2016
, the credit valuation adjustment resulted in a minimal change in the fair value of the derivatives.
5. Accumulated Other Comprehensive Income (Loss):
The following table presents the components of accumulated other comprehensive income (loss), net of tax, as of
December 31, 2017
and
2016
:
F-19
PQ GROUP HOLDINGS INC. AND SUBSIDIARIES
NOTES TO CONSOLIDATED FINANCIAL STATEMENTS
(Dollars in thousands, except share and per share amounts)
|
December 31,
|
||||||||
|
2017
|
2016
|
|||||||
|
Amortization and unrealized gains on pension and postretirement plans, net of tax of ($4,761) and ($4,799)
|
$
|
7,412
|
|
$
|
7,513
|
|
||
|
Net changes in fair values of derivatives, net of tax of ($584) and ($2,793)
|
967
|
|
4,557
|
|
||||
|
Foreign currency translation adjustments, net of tax of $790 and $6,627
|
(4,068
|
)
|
(65,781
|
)
|
||||
|
Accumulated other comprehensive income (loss)
|
$
|
4,311
|
|
$
|
(53,711
|
)
|
||
The following table presents the tax effects of each component of other comprehensive income (loss) for the years ended
December 31, 2017
,
2016
and
2015
:
|
Years ended
December 31, |
||||||||||||||||||||||||||||||||||||
|
2017
|
2016
|
2015
|
||||||||||||||||||||||||||||||||||
|
Pre-tax amount
|
Tax benefit/
(expense)
|
After-tax amount
|
Pre-tax amount
|
Tax benefit/
(expense)
|
After-tax amount
|
Pre-tax amount
|
Tax benefit/
(expense)
|
After-tax amount
|
||||||||||||||||||||||||||||
|
Defined benefit and other postretirement plans:
|
||||||||||||||||||||||||||||||||||||
|
Amortization and unrealized losses
|
$
|
(139
|
)
|
$
|
38
|
|
$
|
(101
|
)
|
$
|
11,664
|
|
$
|
(4,799
|
)
|
$
|
6,865
|
|
$
|
648
|
|
$
|
—
|
|
$
|
648
|
|
|||||||||
|
Benefit plans, net
|
(139
|
)
|
38
|
|
(101
|
)
|
11,664
|
|
(4,799
|
)
|
6,865
|
|
648
|
|
—
|
|
648
|
|
||||||||||||||||||
|
Net loss from hedging activities
|
(5,799
|
)
|
2,209
|
|
(3,590
|
)
|
7,350
|
|
(2,793
|
)
|
4,557
|
|
—
|
|
—
|
|
—
|
|
||||||||||||||||||
|
Foreign currency translation
|
66,438
|
|
(5,837
|
)
|
60,601
|
|
(73,461
|
)
|
6,627
|
|
(66,834
|
)
|
—
|
|
—
|
|
—
|
|
||||||||||||||||||
|
Other comprehensive income (loss)
|
$
|
60,500
|
|
$
|
(3,590
|
)
|
$
|
56,910
|
|
$
|
(54,447
|
)
|
$
|
(965
|
)
|
$
|
(55,412
|
)
|
$
|
648
|
|
$
|
—
|
|
$
|
648
|
|
|||||||||
The following table presents the change in accumulated other comprehensive income (loss), net of tax, by component for the years ended
December 31, 2017
and
2016
:
|
Defined benefit
and other postretirement plans |
Net gain (loss) from hedging activities
|
Foreign
currency translation |
Total
|
||||||||||||
|
December 31, 2015
|
$
|
648
|
|
$
|
—
|
|
$
|
—
|
|
$
|
648
|
|
|||
|
Other comprehensive income (loss) before reclassifications
|
6,844
|
|
3,669
|
|
(65,781)
|
|
(55,268)
|
|
|||||||
|
Amounts reclassified from accumulated other comprehensive income
(1)
|
21
|
|
888
|
|
—
|
|
909
|
|
|||||||
|
Net current period other comprehensive income (loss)
|
6,865
|
|
4,557
|
|
(65,781)
|
|
(54,359)
|
|
|||||||
|
December 31, 2016
|
$
|
7,513
|
|
$
|
4,557
|
|
$
|
(65,781
|
)
|
$
|
(53,711
|
)
|
|||
|
Other comprehensive income (loss) before reclassifications
|
(208)
|
|
(3,797)
|
|
61,713
|
|
57,708
|
|
|||||||
|
Amounts reclassified from accumulated other comprehensive income (loss)
(1)
|
107
|
|
207
|
|
—
|
|
314
|
|
|||||||
|
Net current period other comprehensive income (loss)
|
(101)
|
|
(3,590)
|
|
61,713
|
|
58,022
|
|
|||||||
|
December 31, 2017
|
$
|
7,412
|
|
$
|
967
|
|
$
|
(4,068
|
)
|
$
|
4,311
|
|
|||
|
(1)
|
See the following table for details about these reclassifications.
|
F-20
PQ GROUP HOLDINGS INC. AND SUBSIDIARIES
NOTES TO CONSOLIDATED FINANCIAL STATEMENTS
(Dollars in thousands, except share and per share amounts)
The following table presents the reclassifications out of accumulated other comprehensive income (loss) for the years ended
December 31, 2017
and
2016
. Amounts in parenthesis indicate debits to profit/loss.
|
Details about Accumulated Other
Comprehensive Income (Loss) Components |
Amount Reclassified from Accumulated Other Comprehensive Income (Loss)
|
Affected Line Item in the
Statements of Operations |
||||||||
|
Years ended
December 31, |
||||||||||
|
2017
|
2016
|
|||||||||
|
Defined benefit and other postretirement plans:
|
||||||||||
|
Amortization of prior service cost
|
$
|
78
|
|
$
|
—
|
|
(a)
|
|||
|
Amortization of net gain (loss)
|
54
|
|
26
|
|
(a)
|
|||||
|
132
|
|
26
|
|
Total before tax
|
||||||
|
(25
|
)
|
(5
|
)
|
Tax (expense) benefit
|
||||||
|
$
|
107
|
|
$
|
21
|
|
Net of tax
|
||||
|
Net gain (loss) from hedging activities:
|
||||||||||
|
Interest rate caps
|
$
|
40
|
|
$
|
—
|
|
Interest expense
|
|||
|
Natural gas swaps
|
222
|
|
1,433
|
|
Cost of goods sold
|
|||||
|
262
|
|
1,433
|
|
Total before tax
|
||||||
|
(55
|
)
|
(545
|
)
|
Tax (expense) benefit
|
||||||
|
$
|
207
|
|
$
|
888
|
|
Net of tax
|
||||
|
Total reclassifications for the period
|
$
|
314
|
|
$
|
909
|
|
Net of tax
|
|||
|
(a)
|
These accumulated other comprehensive income (loss) components are included in the computation of net periodic pension and other postretirement cost (see
Note 19
to these consolidated financial statements for additional details).
|
6. Business Combination:
As described in
Note 1
to these consolidated financial statements, on May 4, 2016, the Company, PQ Holdings, Eco Services, certain investment funds affiliated with CCMP and certain other stockholders of PQ Holdings and Eco Services completed the Business Combination. Eco Services is the accounting predecessor to PQ Group Holdings. Certain investment funds affiliated with CCMP held a controlling interest position in Eco Services prior to the Business Combination. In addition, certain investment funds affiliated with CCMP owned a noncontrolling interest in PQ Holdings prior to the Business Combination and the merger with Eco constituted a change in control under the various PQ Holdings credit agreements and bond indenture. Therefore, Eco Services is deemed to be the accounting acquirer. These consolidated financial statements are the continuation of Eco Services’ business prior to the Business Combination.
The Business Combination was accounted for using the acquisition method of accounting. Under the acquisition method, the purchase price is allocated to PQ Holdings’ net assets acquired based on the fair values of assets acquired and liabilities assumed as of the acquisition date. The excess of the purchase price over the fair values of these net assets is recorded as goodwill.
F-21
PQ GROUP HOLDINGS INC. AND SUBSIDIARIES
NOTES TO CONSOLIDATED FINANCIAL STATEMENTS
(Dollars in thousands, except share and per share amounts)
The following table sets forth the calculation and allocation of the purchase price to the net assets acquired with respect to the Business Combination, which was complete as of December 31, 2016.
|
Total consideration, net of cash acquired
|
$
|
2,689,941
|
|
|
|
|
|
|
|
Recognized amounts of identifiable assets acquired and liabilities assumed:
|
|
|
|
|
Receivables
|
$
|
161,110
|
|
|
Inventories
|
254,770
|
|
|
|
Prepaid and other current assets
|
19,295
|
|
|
|
Investments in affiliated companies
|
472,994
|
|
|
|
Property, plant and equipment
|
683,673
|
|
|
|
Other intangible assets
|
754,000
|
|
|
|
Other long-term assets
|
48,127
|
|
|
|
Fair value of assets acquired
|
2,393,969
|
|
|
|
Revolver, notes payable & current debt
|
(2,441
|
)
|
|
|
Accounts payable
|
(93,222
|
)
|
|
|
Accrued liabilities
|
(98,621
|
)
|
|
|
Long-term debt
|
(20,470
|
)
|
|
|
Deferred income taxes
|
(327,296
|
)
|
|
|
Other long-term liabilities
|
(113,936
|
)
|
|
|
Noncontrolling interest
|
(6,569
|
)
|
|
|
Fair value of net assets acquired
|
1,731,414
|
|
|
|
Goodwill
|
958,527
|
|
|
|
|
$
|
2,689,941
|
|
|
|
|
||
Total consideration for the Business Combination included
$1,777,740
of cash,
$910,800
of equity in the acquired PQ Holdings entities and
$1,400
of assumed stock awards of PQ Holdings. The fair value of the equity consideration was determined based on an estimated enterprise value using a market approach as of the date of the Business Combination, reduced by borrowings to arrive at the fair value of equity. The existing PQ Holdings credit facilities were not legally assumed as part of the Business Combination, and the extinguishment of the debt concurrent with the Business Combination was included as part of the consideration transferred (see
Note 15
to these consolidated financial statements for further information). Acquisition costs of
$1,583
are included in other operating expense, net in the Company’s consolidated statement of operations for the year ended December 31, 2016.
The Company believes that its diverse range of industrial, consumer and governmental applications in which its products are used were the primary reasons that contributed to a total purchase price that resulted in the recognition of goodwill. The goodwill associated with the Business Combination is not deductible for tax purposes.
F-22
PQ GROUP HOLDINGS INC. AND SUBSIDIARIES
NOTES TO CONSOLIDATED FINANCIAL STATEMENTS
(Dollars in thousands, except share and per share amounts)
The valuation of the intangible assets acquired and the related weighted-average amortization periods are as follows:
|
|
Amount
|
Weighted-Average
Expected Useful Life (in years) |
||||
|
Intangible assets subject to amortization:
|
|
|
||||
|
Trademarks
|
$
|
35,400
|
|
15.0
|
||
|
Technical know-how
|
189,300
|
|
20.0
|
|||
|
Contracts
|
19,800
|
|
5.3
|
|||
|
Customer relationships
|
268,700
|
|
10.6
|
|||
|
In-process research and development
|
6,800
|
|
|
|||
|
|
|
|
|
|||
|
Total intangible assets subject to amortization
|
520,000
|
|
|
|||
|
Tradenames, not subject to amortization
|
151,100
|
|
Indefinite
|
|||
|
Trademarks, not subject to amortization
|
82,900
|
|
Indefinite
|
|||
|
|
|
|
|
|||
|
Total
|
$
|
754,000
|
|
|
||
|
|
|
|
||||
In accordance with the requirements of the purchase method of accounting for acquisitions, inventories were recorded at fair market value (which is defined as estimated selling prices less the sum of (a) costs of disposal and (b) a reasonable profit allowance for the selling effort of the acquiring entity), which was
$58,683
higher than the historical cost. The Company’s cost of goods sold includes a pre-tax charge of
$871
and
$29,086
for the years ended
December 31, 2017
and
2016
, respectively, relating to the portion of the step-up on inventory sold during the period. A separate portion of the fair value step-up related to the domestic inventory accounted for under the LIFO method was included in inventory on the consolidated balance sheet as of
December 31, 2016
as part of the new LIFO base layer on the acquired inventory (see
Note 9
to these consolidated financial statements for further information).
The Company’s consolidated financial statements include PQ Holdings results of operations from May 4, 2016 through
December 31, 2016
. Net sales and net loss attributable to PQ Holdings during this period are included in the Company’s consolidated financial statements for the year ended
December 31, 2016
and total
$690,459
and
$17,991
, respectively.
Pro Forma Financial Information
The unaudited pro forma information has been derived from the Company’s historical consolidated financial statements and has been prepared to give effect to the Business Combination, assuming that the Business Combination occurred on January 1, 2015. These pro forma adjustments primarily relate to depreciation expense on stepped up fixed assets, amortization of acquired intangibles, cost of goods sold expense related to the sale of stepped up inventory, interest expense related to additional debt that would be needed to fund the Business Combination, and the estimated impact of these adjustments on the Company’s tax provision. The unaudited pro forma consolidated results of operations are provided for illustrative purposes and are not indicative of the Company’s actual consolidated results of operations or consolidated financial position. The unaudited pro forma results of operations do not reflect any operating efficiencies or potential cost savings which may result from the acquisitions.
|
|
Years ended
December 31, |
|||||||
|
2016
|
2015
|
|||||||
|
Pro forma sales
|
$
|
1,403,041
|
|
$
|
1,413,201
|
|
||
|
Pro forma net loss
|
(76,994
|
)
|
(120,982
|
)
|
||||
Included in the pro forma net loss are adjustments to allocate charges incurred during the year ended December 31, 2016 to December 31, 2015. These non-recurring charges include a debt prepayment penalty of
$26,250
, one-time refinancing charges of
$4,747
and transaction fee charges of
$1,795
that are each reflected in the pro forma net loss for the year ended December 31, 2015.
F-23
PQ GROUP HOLDINGS INC. AND SUBSIDIARIES
NOTES TO CONSOLIDATED FINANCIAL STATEMENTS
(Dollars in thousands, except share and per share amounts)
7. Acquisition:
On June 12, 2017 (the “Closing Date”), the Company acquired the facilities of Sovitec Mondial S.A. (“Sovitec”) located in Belgium, Spain, Argentina and France as part of a stock transaction (the “Acquisition”) for
$41,572
in cash, excluding assumed debt. Based in Fleurus, Belgium, Sovitec is a high quality producer of engineered glass products used in transportation safety, metal finishing and polymer additives.
The Acquisition was accounted for using the acquisition method of accounting. Under the acquisition method, the purchase price was allocated to the identifiable net assets acquired based on the fair values of the identifiable assets acquired and liabilities assumed as of the Closing Date. The excess of the purchase price over the fair values of the identifiable net assets acquired was recorded to goodwill.
The following table sets forth the calculation and preliminary allocation of the purchase price to the identifiable net assets acquired with respect to the Acquisition:
|
Total consideration, net of cash acquired
|
$
|
41,572
|
|
|
|
|
|
|
|
Recognized amounts of identifiable assets acquired and liabilities assumed:
|
|
|
|
|
Receivables
|
$
|
14,305
|
|
|
Inventories
|
7,645
|
|
|
|
Prepaid and other current assets
|
400
|
|
|
|
Property, plant and equipment
|
9,020
|
|
|
|
Other long-term assets
|
129
|
|
|
|
Fair value of assets acquired
|
31,499
|
|
|
|
Current debt
|
(6,420
|
)
|
|
|
Accounts payable
|
(10,748
|
)
|
|
|
Long-term debt
|
(10,189
|
)
|
|
|
Other long-term liabilities
|
(154
|
)
|
|
|
Fair value of net assets acquired
|
3,988
|
|
|
|
Goodwill
|
37,584
|
|
|
|
|
$
|
41,572
|
|
|
|
|
||
The valuation of the identifiable assets and liabilities included in the table above is preliminary and is subject to change, as the Company is in the process of evaluating the information required to determine the fair values of certain identifiable assets and liabilities acquired, including inventory, property, plant and equipment, and intangible assets. An increased portion of the purchase price allocated to the identifiable net assets acquired will reduce the amount recognized for goodwill and may result in increased cost of goods sold, depreciation and/or amortization expense. Adjustments to the provisional amounts during the measurement period that result in changes to depreciation, amortization or other income effects will be recognized in the reporting period(s) in which the adjustments are determined.
The Company believes that the Acquisition will enable it to offer a more comprehensive, cost-effective and high-quality portfolio of products and services to its customers worldwide when, combined with anticipated synergies within its existing business, contributed to a total purchase price that resulted in the recognition of goodwill. All of the goodwill was assigned to the Company’s Performance Materials and Chemicals segment. The goodwill associated with the Acquisition is not deductible for tax purposes.
The Company’s consolidated financial statements include Sovitec’s results of operations for the period from the Closing Date through
December 31, 2017
. Net sales and net income attributable to Sovitec during this period are included in the Company’s consolidated statement of operations and total
$26,257
and
$1,370
, respectively, for the year ended
December 31, 2017
. Acquisition costs of
$2,515
are included in other operating expense, net in the Company’s consolidated statement of operations for the year ended
December 31, 2017
.
F-24
PQ GROUP HOLDINGS INC. AND SUBSIDIARIES
NOTES TO CONSOLIDATED FINANCIAL STATEMENTS
(Dollars in thousands, except share and per share amounts)
Pro Forma Financial Information
The unaudited pro forma financial information for the years ended
December 31, 2017
and
2016
has been derived from the Company’s historical consolidated financial statements and prepared to give effect to the Acquisition, assuming that the Acquisition occurred on January 1, 2016. The unaudited pro forma consolidated results of operations are provided for illustrative purposes only and are not indicative of the Company’s actual consolidated results of operations had the Acquisition been made as of January 1, 2016. The unaudited pro forma results of operations do not reflect any operating efficiencies or potential cost savings which may result from the Acquisition.
|
Years ended
December 31, |
||||||||
|
2017
|
2016
|
|||||||
|
Pro forma sales
|
$
|
1,489,957
|
|
$
|
1,105,479
|
|
||
|
Pro forma net income (loss)
|
59,968
|
|
(77,720
|
)
|
||||
Certain non-recurring charges included in the Company’s results of operations for the year ended December 31, 2017 were allocated to the respective prior year periods for pro forma purposes. For the year ended December 31, 2017, non-recurring charges allocated to the prior year period include transaction fee charges of
$2,515
which were excluded from the pro forma net income (loss) for the year ended December 31, 2017.
8. Other Operating Expense, Net:
A summary of other operating expense, net is as follows:
|
Years ended
December 31, |
||||||||||||
|
2017
|
2016
|
2015
|
||||||||||
|
Amortization expense
|
$
|
32,010
|
|
$
|
25,263
|
|
$
|
6,605
|
|
|||
|
Transaction and other related costs
(1)
|
7,415
|
|
4,952
|
|
4,241
|
|
||||||
|
Restructuring and other related costs (Note 23)
|
8,490
|
|
12,630
|
|
4,147
|
|
||||||
|
Net loss on asset disposals
|
5,793
|
|
4,216
|
|
3,911
|
|
||||||
|
Intangible asset impairment charge (Note 13)
|
—
|
|
6,873
|
|
—
|
|
||||||
|
Management advisory fees (Note 26)
|
3,777
|
|
3,584
|
|
590
|
|
||||||
|
Environmental-related costs (Note 22)
|
395
|
|
1,352
|
|
202
|
|
||||||
|
Other, net
|
6,345
|
|
3,431
|
|
—
|
|
||||||
|
$
|
64,225
|
|
$
|
62,301
|
|
$
|
19,696
|
|
||||
|
(1)
|
Transaction and other related costs for the year ended
December 31, 2017
primarily include transaction costs associated with the Company’s IPO exclusive of the direct costs recorded in stockholders’ equity net of the proceeds from the offering (see
Note 1
to these consolidated financial statements for further information) and the Acquisition (see
Note 7
). Transaction and other related costs for the years ended
December 31, 2016
and
2015
primarily include transaction costs directly attributable to the Business Combination (Note 6) and the 2014 Acquisition (see
Note 23
), as well as other business development costs.
|
F-25
PQ GROUP HOLDINGS INC. AND SUBSIDIARIES
NOTES TO CONSOLIDATED FINANCIAL STATEMENTS
(Dollars in thousands, except share and per share amounts)
9. Inventories:
Inventories are classified and valued as follows:
|
December 31,
|
||||||||
|
2017
|
2016
|
|||||||
|
Finished products and work in process
|
$
|
199,919
|
|
$
|
175,182
|
|
||
|
Raw materials
|
62,469
|
|
51,866
|
|
||||
|
$
|
262,388
|
|
$
|
227,048
|
|
|||
|
Valued at lower of cost or market:
|
||||||||
|
LIFO basis
|
$
|
162,315
|
|
$
|
135,605
|
|
||
|
Valued at lower of cost and net realizable value:
|
||||||||
|
FIFO or average cost basis
|
100,073
|
|
91,443
|
|
||||
|
$
|
262,388
|
|
$
|
227,048
|
|
|||
The domestic inventory acquired as part of the Business Combination is valued based on the LIFO method. Therefore, the fair value allocated to the acquired LIFO inventory was treated as the new base inventory value. If inventories valued under the LIFO basis had been valued using the FIFO method, inventories would have been
$26,630
and
$30,338
lower than reported as of
December 31, 2017
and
2016
, respectively, driven primarily by the purchase accounting fair value step-up of the LIFO inventory base value associated with the Business Combination. As of
December 31, 2016
, inventory quantities for one of the Company’s LIFO pools were reduced below their levels at the Business Combination date. As a result of this reduction, LIFO inventory costs charged to cost of goods sold were computed based on the lower base layer costs at the Business Combination date. The impact on cost of goods sold and net loss for the year ended
December 31, 2016
was not material.
F-26
PQ GROUP HOLDINGS INC. AND SUBSIDIARIES
NOTES TO CONSOLIDATED FINANCIAL STATEMENTS
(Dollars in thousands, except share and per share amounts)
10. Investments in Affiliated Companies:
As a result of the Business Combination, the Company acquired investments in affiliated companies accounted for under the equity method. Affiliated companies accounted for on the equity method as of
December 31, 2017
are as follows:
|
Company
|
Country
|
Percent
Ownership |
||
|
PQ Silicates Ltd.
|
Taiwan
|
50%
|
||
|
Zeolyst International
|
USA
|
50%
|
||
|
Zeolyst C.V.
|
Netherlands
|
50%
|
||
|
Quaker Holdings
|
South Africa
|
49%
|
||
Following is summarized information of the combined investments
1
:
|
|
December 31,
|
|||||||
|
|
2017
|
2016
|
||||||
|
Current assets
|
$
|
213,815
|
|
$
|
207,997
|
|
||
|
Noncurrent assets
|
235,440
|
|
212,144
|
|
||||
|
Current liabilities
|
37,018
|
|
44,741
|
|
||||
|
Noncurrent liabilities
|
1,417
|
|
1,384
|
|
||||
|
Year Ended
December 31, 2017 |
Period from May 4, 2016 to December 31, 2016
|
|||||||
|
Net sales
|
$
|
317,197
|
|
$
|
206,072
|
|
||
|
Gross profit
|
132,812
|
|
91,761
|
|
||||
|
Operating income
|
91,224
|
|
67,098
|
|
||||
|
Net income
|
94,740
|
|
67,332
|
|
||||
1
Summarized information of the combined investments is presented at 100%; the Company’s share of the net assets and net income of affiliates is calculated based on the percent ownership specified in the table above.
The Company’s investments in affiliated companies balance as of
December 31, 2017
and
2016
includes net purchase accounting fair value adjustments of
$264,700
and
$273,300
, respectively, related to the Business Combination, consisting primarily of goodwill and intangible assets such as customer relationships, technical know-how and trade names. Consolidated equity in net income (loss) from affiliates is net of
$8,599
and
$36,296
of amortization expense related to purchase accounting fair value adjustments for the years ended
December 31, 2017
and
2016
, respectively.
F-27
PQ GROUP HOLDINGS INC. AND SUBSIDIARIES
NOTES TO CONSOLIDATED FINANCIAL STATEMENTS
(Dollars in thousands, except share and per share amounts)
The following table summarizes the activity related to the Company’s investments in affiliated companies balance on the consolidated balance sheets:
|
Years ended
December 31, |
||||||||
|
|
2017
|
2016
|
||||||
|
Balance at beginning of period
|
$
|
459,406
|
|
$
|
—
|
|
||
|
Business Combination
|
—
|
|
472,994
|
|
||||
|
Acquisition
|
119
|
|
—
|
|
||||
|
Investments in affiliated companies
|
9,000
|
|
—
|
|
||||
|
Equity in net income of affiliated companies
|
47,371
|
|
33,684
|
|
||||
|
Charges related to purchase accounting fair value adjustments
|
(8,599
|
)
|
(36,296
|
)
|
||||
|
Dividends received
|
(44,071
|
)
|
(7,636
|
)
|
||||
|
Foreign currency translation adjustments
|
6,050
|
|
(3,340
|
)
|
||||
|
Balance at end of period
|
$
|
469,276
|
|
$
|
459,406
|
|
||
|
|
|
|||||||
The Company had net receivables due from affiliates of
$4,910
and
$4,196
as of
December 31, 2017
and
2016
, respectively, which are included in prepaid and other current assets. Net receivables due from affiliates are generally non-trade receivables. Sales to affiliates were
$2,853
and
$1,587
for the years ended
December 31, 2017
and
2016
, respectively. The Company purchased goods of
$2,475
and
$1,147
from affiliates, which is included in cost of goods sold during the years ended
December 31, 2017
and
2016
, respectively.
On December 18, 2013, PQ Holdings and its joint venture, Zeolyst International, entered into a real estate tax abatement agreement with the Unified Government of Wyandotte County and Kansas City, Kansas that will utilize an Industrial Revenue Bond financing structure to achieve a 75% real estate tax abatement on the value of the improvements that will be constructed during the expansion of PQ Holdings and Zeolyst International’s facilities at the jointly-operated Kansas City, Kansas plant. The financing obligation and the industrial bond receivable have been presented net, as the financing obligation and the industrial bond meet the criteria for right of setoff conditions under GAAP.
11. Property, Plant and Equipment:
A summary of property, plant and equipment, at cost, and related accumulated depreciation is as follows:
|
December 31,
|
||||||||
|
2017
|
2016
|
|||||||
|
Land
|
$
|
191,006
|
|
$
|
186,327
|
|
||
|
Buildings
|
200,054
|
|
157,944
|
|
||||
|
Machinery and equipment
|
1,005,025
|
|
788,175
|
|
||||
|
Construction in progress
|
145,414
|
|
204,138
|
|
||||
|
1,541,499
|
|
1,336,584
|
|
|||||
|
Less: accumulated depreciation
|
(311,115
|
)
|
(155,196
|
)
|
||||
|
$
|
1,230,384
|
|
$
|
1,181,388
|
|
|||
Depreciation expense was
$124,551
,
$89,453
and
$28,790
for the years ended
December 31, 2017
,
2016
and
2015
, respectively.
12. Reportable Segments:
The Company has organized its business around
two
operating segments based on the review of discrete financial results for each of the operating segments by the Company’s chief operating decision maker (the Company’s President and Chief Executive Officer), or CODM, for performance assessment and resource allocation purposes. Each of the Company’s operating segments represents a reportable segment under GAAP. The Company’s reportable segments are organized based on the nature and economic characteristics of the Company’s products. The Company’s
two
reportable segments are Performance Materials and Chemicals (“PM&C”) and Environmental Catalysts and Services (“EC&S”).
F-28
PQ GROUP HOLDINGS INC. AND SUBSIDIARIES
NOTES TO CONSOLIDATED FINANCIAL STATEMENTS
(Dollars in thousands, except share and per share amounts)
The PM&C segment is a silicates and specialty materials producer with leading supply positions for the majority of its products sold in North America, Europe, South America, Australia and Asia (excluding China) serving end uses such as personal and industrial cleaning products, fuel efficient tires (or green tires), surface coatings, and food and beverage. The
two
product groups included in the PM&C segment are performance materials and performance chemicals. The EC&S segment is a leading global innovator and producer of catalysts for the refinery, emission control, and petrochemical industries and is also a leading provider of catalyst recycling services to the North American refining industry. The
three
product groups included in the EC&S segment are silica catalysts, zeolyst catalysts, and refining services. The EC&S segment includes equity in net income from Zeolyst International and Zeolyst C.V. (collectively, the “Zeolyst Joint Venture”), each of which are 50/50 joint ventures with CRI Zeolites, Inc. (a wholly-owned subsidiary of Royal Dutch Shell). The Zeolyst Joint Venture is accounted for using the equity method in the Company’s consolidated financial statements (see Note 10 to these consolidated financial statements for further information). Company management evaluates the EC&S segment’s performance, including the Zeolyst Joint Venture, on a proportionate consolidation basis. Accordingly, the revenues and expenses used to compute the EC&S segment’s adjusted earnings before interest, income taxes, depreciation and amortization (“Adjusted EBITDA”) include the Zeolyst Joint Venture’s results of operations on a proportionate basis based on the Company’s 50% ownership level. Since the Company uses the equity method of accounting for the Zeolyst Joint Venture, these items are eliminated when reconciling to the Company’s consolidated results of operations.
The Company’s management evaluates the operating results of each reportable segment based upon Adjusted EBITDA. Adjusted EBITDA consists of EBITDA, which is a measure defined as net income before depreciation and amortization, interest expense and income taxes (each of which is included in the Company’s consolidated statements of operations), and adjusted for certain items as discussed below.
Summarized financial information for the Company’s reportable segments and product groups is shown in the following table:
|
Years ended
December 31, |
||||||||||||
|
2017
|
2016
|
2015
|
||||||||||
|
Net sales:
|
||||||||||||
|
Performance Chemicals
|
$
|
687,645
|
|
$
|
437,523
|
|
$
|
—
|
|
|||
|
Performance Materials
|
324,225
|
|
206,522
|
|
—
|
|
||||||
|
Eliminations
|
(10,021
|
)
|
(5,094
|
)
|
—
|
|
||||||
|
Performance Materials & Chemicals
|
1,001,849
|
|
638,951
|
|
—
|
|
||||||
|
Silica Catalysts
|
75,333
|
|
53,029
|
|
—
|
|
||||||
|
Refining Services
|
398,342
|
|
373,718
|
|
388,875
|
|
||||||
|
Environmental Catalysts & Services
(1)
|
473,675
|
|
426,747
|
|
388,875
|
|
||||||
|
Inter-segment sales eliminations
(2)
|
(3,423
|
)
|
(1,521
|
)
|
—
|
|
||||||
|
Total
|
$
|
1,472,101
|
|
$
|
1,064,177
|
|
$
|
388,875
|
|
|||
|
Segment Adjusted EBITDA:
(3)
|
||||||||||||
|
Performance Materials & Chemicals
|
$
|
240,128
|
|
$
|
158,679
|
|
$
|
—
|
|
|||
|
Environmental Catalysts & Services
(4)
|
243,587
|
|
196,825
|
|
117,704
|
|
||||||
|
Total Segment Adjusted EBITDA
(5)
|
$
|
483,715
|
|
$
|
355,504
|
|
$
|
117,704
|
|
|||
|
(1)
|
Excludes the Company’s proportionate share of sales from the Zeolyst International and Zeolyst C.V. joint ventures (collectively, the “Zeolyst Joint Venture”) accounted for using the equity method (see
Note 10
to these consolidated consolidated financial statements for further information). The proportionate share of sales is
$143,774
and
$94,516
for the years ended
December 31, 2017
and
2016
, respectively.
|
|
(2)
|
The Company eliminates intersegment sales when reconciling to the Company’s consolidated statements of operations.
|
F-29
PQ GROUP HOLDINGS INC. AND SUBSIDIARIES
NOTES TO CONSOLIDATED FINANCIAL STATEMENTS
(Dollars in thousands, except share and per share amounts)
|
(3)
|
The Company defines Adjusted EBITDA as EBITDA adjusted for certain items as noted in the reconciliation below. Management evaluates the performance of its segments and allocates resources based on several factors, of which the primary measure is Adjusted EBITDA. Adjusted EBITDA should not be considered as an alternative to net income as an indicator of the Company’s operating performance. Adjusted EBITDA as defined by the Company may not be comparable with EBITDA or Adjusted EBITDA as defined by other companies.
|
|
(4)
|
The Adjusted EBITDA from the Zeolyst Joint Venture included in the Environmental Catalysts and Services segment is
$58,156
for the year ended
December 31, 2017
, which includes
$46,985
of equity in net income plus
$8,600
of amortization of investment in affiliate step-up plus
$11,070
of joint venture depreciation, amortization and interest. The Adjusted EBITDA from the Zeolyst Joint Venture included in the Environmental Catalysts and Services segment is
$40,687
for the year ended
December 31, 2016
, which includes
$33,716
of equity in net income plus
$36,296
of amortization of investment in affiliate step-up plus
$6,920
of joint venture depreciation, amortization and interest.
|
|
(5)
|
Total Segment Adjusted EBITDA differs from the Company’s consolidated Adjusted EBITDA due to unallocated corporate expenses.
|
A reconciliation from net income (loss) to Segment Adjusted EBITDA is as follows:
|
Years ended
December 31, |
||||||||||||
|
2017
|
2016
|
2015
|
||||||||||
|
Reconciliation of net income (loss) attributable to PQ Group Holdings Inc. to Segment Adjusted EBITDA
|
||||||||||||
|
Net income (loss) attributable to PQ Group Holdings Inc.
|
$
|
57,603
|
|
$
|
(79,746
|
)
|
$
|
11,427
|
|
|||
|
Provision for (benefit from) income taxes
|
(119,197
|
)
|
10,041
|
|
—
|
|
||||||
|
Interest expense, net
|
179,044
|
|
140,315
|
|
44,348
|
|
||||||
|
Depreciation and amortization
|
177,140
|
|
128,288
|
|
38,999
|
|
||||||
|
Segment EBITDA
|
294,590
|
|
198,898
|
|
94,774
|
|
||||||
|
Unallocated corporate expenses
|
30,422
|
|
23,971
|
|
—
|
|
||||||
|
Joint venture depreciation, amortization and interest
|
11,070
|
|
6,920
|
|
—
|
|
||||||
|
Amortization of investment in affiliate step-up
|
8,600
|
|
36,296
|
|
—
|
|
||||||
|
Amortization of inventory step-up
|
871
|
|
29,086
|
|
—
|
|
||||||
|
Impairment of fixed assets, intangibles and goodwill
|
—
|
|
6,873
|
|
—
|
|
||||||
|
Debt extinguishment costs
|
61,886
|
|
13,782
|
|
—
|
|
||||||
|
Losses on disposal of fixed assets
|
5,793
|
|
4,216
|
|
3,911
|
|
||||||
|
Foreign currency exchange losses
|
25,786
|
|
(3,558
|
)
|
—
|
|
||||||
|
Non-cash revaluation of inventory, including LIFO
|
3,708
|
|
1,310
|
|
—
|
|
||||||
|
Management advisory fees
|
3,777
|
|
3,583
|
|
590
|
|
||||||
|
Transaction and other related costs
|
7,425
|
|
4,664
|
|
4,241
|
|
||||||
|
Equity-based and other non-cash compensation
|
8,799
|
|
7,042
|
|
2,256
|
|
||||||
|
Restructuring, integration and business optimization expenses
|
13,174
|
|
16,258
|
|
4,147
|
|
||||||
|
Defined benefit pension plan cost
|
2,940
|
|
1,375
|
|
2,903
|
|
||||||
|
Other
(1)
|
4,874
|
|
4,788
|
|
4,882
|
|
||||||
|
Segment Adjusted EBITDA
|
$
|
483,715
|
|
$
|
355,504
|
|
$
|
117,704
|
|
|||
|
(1)
|
Other includes certain legal and environmental costs and other charges such as capital taxes, asset retirement obligation accretion and other expenses.
|
The Company’s consolidated results include equity in net income from affiliated companies of
$38,772
for the year ended
December 31, 2017
and equity in net loss from affiliated companies of
$2,612
for the year ended
December 31, 2016
. This is primarily comprised of equity in net income of
$46,985
and
$33,716
in the EC&S segment from the Zeolyst Joint Venture for the years ended
December 31, 2017
and
2016
, respectively. The remaining equity in net income (loss) for the Company is included in the PM&C segment, which is attributed to smaller investments and was not material. The Company’s equity in net income from affiliates was more than offset by
$36,296
of amortization expense related to purchase accounting fair value adjustments associated with the Zeolyst Joint Venture for the year ended
December 31, 2016
as a result of the Business Combination valuation.
F-30
PQ GROUP HOLDINGS INC. AND SUBSIDIARIES
NOTES TO CONSOLIDATED FINANCIAL STATEMENTS
(Dollars in thousands, except share and per share amounts)
Capital expenditures for the Company’s reportable segments are shown in the following table:
|
|
Years ended
December 31, |
|||||||||||
|
|
2017
|
2016
|
2015
|
|||||||||
|
Capital expenditures:
|
|
|
||||||||||
|
Performance Materials & Chemicals
|
$
|
87,938
|
|
$
|
74,392
|
|
$
|
—
|
|
|||
|
Environmental Catalysts & Services
(1)
|
66,511
|
|
74,921
|
|
41,854
|
|
||||||
|
Eliminations
(1)
|
(13,366
|
)
|
(19,001
|
)
|
—
|
|
||||||
|
Total
|
$
|
141,083
|
|
$
|
130,312
|
|
$
|
41,854
|
|
|||
|
Change in non-cash capital expenditures in accounts payable
|
(601
|
)
|
(8,891
|
)
|
(860
|
)
|
||||||
|
Capital expenditures per the consolidated statement of cash flows
|
$
|
140,482
|
|
$
|
121,421
|
|
$
|
40,994
|
|
|||
|
|
|
|
||||||||||
|
(1)
|
Includes the Company’s proportionate share of capital expenditures from the Zeolyst Joint Venture. The proportionate share of capital expenditures included in the EC&S segment is
$13,366
and
$19,001
for the Zeolyst Joint Venture for the years ended
December 31, 2017
and
2016
, respectively. These capital expenditures are in turn removed in the “Eliminations” line item to reconcile to the Company’s consolidated capital expenditures.
|
Total assets by segment are not disclosed by the Company because the information is not prepared or used by the CODM to assess performance and to allocate resources.
Net sales and long-lived assets by geographic area are presented in the following tables. Net sales are attributed to countries based upon location of products shipped.
|
|
Years ended
December 31, |
|||||||||||
|
|
2017
|
2016
|
2015
|
|||||||||
|
Net sales
(1)
:
|
|
|
||||||||||
|
United States
|
$
|
874,764
|
|
$
|
705,348
|
|
$
|
388,875
|
|
|||
|
Netherlands
|
118,567
|
|
79,821
|
|
—
|
|
||||||
|
United Kingdom
|
116,410
|
|
67,494
|
|
—
|
|
||||||
|
Other foreign countries
|
362,360
|
|
211,514
|
|
—
|
|
||||||
|
Total
|
$
|
1,472,101
|
|
$
|
1,064,177
|
|
$
|
388,875
|
|
|||
|
|
|
|
||||||||||
|
(1)
|
Except for the United States, no sales in an individual country exceeded 10% of the Company’s total net sales.
|
|
|
Years ended
December 31, |
|||||||||||
|
|
2017
|
2016
|
2015
|
|||||||||
|
Long-lived assets
(1)
:
|
|
|
||||||||||
|
United States
|
$
|
2,919,458
|
|
$
|
2,870,958
|
|
$
|
936,111
|
|
|||
|
Netherlands
|
289,459
|
|
288,239
|
|
—
|
|
||||||
|
United Kingdom
|
229,595
|
|
228,924
|
|
—
|
|
||||||
|
Other foreign countries
|
425,675
|
|
378,872
|
|
—
|
|
||||||
|
Total
|
$
|
3,864,187
|
|
$
|
3,766,993
|
|
$
|
936,111
|
|
|||
|
|
|
|
||||||||||
|
(1)
|
Long-lived assets exclude intercompany notes receivable and deferred tax assets.
|
F-31
PQ GROUP HOLDINGS INC. AND SUBSIDIARIES
NOTES TO CONSOLIDATED FINANCIAL STATEMENTS
(Dollars in thousands, except share and per share amounts)
13. Goodwill and Other Intangible Assets:
The changes in the carrying amount of goodwill for the years ended
December 31, 2017
and
2016
is summarized as follows:
|
|
Performance
Materials & Chemicals |
Environmental
Catalysts & Services |
Total
|
|||||||||
|
Balance as of January 1, 2016
|
$
|
—
|
|
$
|
311,892
|
|
$
|
311,892
|
|
|||
|
Goodwill recognized
|
876,844
|
|
81,683
|
|
958,527
|
|
||||||
|
Foreign exchange impact
|
(24,338
|
)
|
(4,652
|
)
|
(28,990
|
)
|
||||||
|
Balance as of December 31, 2016
|
$
|
852,506
|
|
$
|
388,923
|
|
$
|
1,241,429
|
|
|||
|
Goodwill recognized
|
37,584
|
|
—
|
|
37,584
|
|
||||||
|
Foreign exchange impact
|
24,533
|
|
2,410
|
|
26,943
|
|
||||||
|
Balance as of December 31, 2017
|
$
|
914,623
|
|
$
|
391,333
|
|
$
|
1,305,956
|
|
|||
The Company completed its annual goodwill impairment assessments as of October 1,
2017
and
2016
. For the annual assessments, the Company bypassed the option to perform the qualitative assessment and proceeded directly to performing the first step of the two-step goodwill impairment test for each of its reporting units. As a result of the Business Combination, for the October 1,
2017
and
2016
assessments, the Company identified
four
reporting units,
two
in each of its operating segments (PM&C and EC&S).
The Company determined the fair value of its reporting units using a split between a market approach and an income, or discounted cash flow, approach. Fair value is defined as the price that would be received to sell an asset or paid to transfer a liability in an orderly transaction between market participants at the measurement date. Estimating the fair value of a reporting unit requires various assumptions including the use of projections of future cash flows and discount rates that reflect the risks associated with achieving those cash flows. The key assumptions used in estimating the fair value were the operating margin growth rates, revenue growth rates from implementation of strategic plans, the weighted average cost of capital, the perpetual growth rate, and the estimated earnings market multiples of each reporting unit. The market value was estimated using publicly traded comparable company values by applying their most recent annual EBITDA multiples to the reporting unit’s trailing twelve months EBITDA. The income approach value was estimated using a discounted cash flow approach. The assumptions about future cash flows and growth rates are based on management’s assessment of a number of factors including the reporting unit’s recent performance against budget as well as management’s ability to execute on planned future strategic initiatives. Discount rate assumptions are based on an assessment of the risk inherent in those future cash flows.
As of October 1,
2017
and
2016
, the fair values of each of the Company’s reporting units (with the exception of one in
2016
) substantially exceeded their respective carrying values and therefore, the second step of the two-step goodwill impairment test was not required. For the Company’s performance chemicals reporting unit within its PM&C segment, the result of the annual goodwill impairment test as of October 1,
2016
indicated that the fair value of the reporting unit was in excess of its carrying amount by
10%
. Actual sales trends for the reporting unit were lower than originally forecasted due to unfavorable foreign exchange as well as lower volumes in certain product groups, particularly in the base silicate, pulp and paper, and drilling markets. The Company believes the performance chemicals reporting unit remains well positioned over the long term with respect to its entire portfolio of products; however, a deterioration in the macroeconomic environment could adversely affect the fair value or carrying amount of this reporting unit. The amount of goodwill associated with this reporting unit was
$577,667
as of the October 1,
2016
testing date.
In addition to the annual goodwill impairment assessment, the Company also performed the annual impairment test over its other indefinite-lived intangible assets as of October 1,
2017
and
2016
. As a result of the prior year test, the Company determined that the trade names related to its performance chemicals reporting unit within the PM&C segment and its catalysts reporting unit within the EC&S segment were impaired as of October 1,
2016
. The impaired intangibles related to those identified as part of the Business Combination. The fair value of the respective trade names was determined using the relief-from-royalty method based on the discounted cash flows used in the goodwill impairment test. Slower sales growth rates for both reporting units led to the recognition of the impairment charges. Based on the testing performed, the Company recorded non-cash impairment charges of
$5,350
related to trade names within the performance chemicals reporting unit and
$1,523
related to trade names within the catalysts reporting unit. The impairment charges are included in the other operating expense, net line item of the Company’s consolidated statement of operations for the year ended December 31, 2016. There was no impairment of the Company’s indefinite-lived intangible assets noted for the year ended December 31, 2017 as a result of the annual impairment test. For the Company’s performance chemicals reporting unit within its PM&C segment, the result of the annual impairment test as of October 1, 2017 indicated that the fair value of the intangible assets over corporate tradenames and product tradenames were slightly in excess of the carrying amounts,
2%
and
3%
, respectively, due to the impairment taken in the previous year.
F-32
PQ GROUP HOLDINGS INC. AND SUBSIDIARIES
NOTES TO CONSOLIDATED FINANCIAL STATEMENTS
(Dollars in thousands, except share and per share amounts)
Gross carrying amounts and accumulated amortization for intangible assets other than goodwill are as follows:
|
|
December 31, 2017
|
December 31, 2016
|
||||||||||||||||||||||||||
|
|
Gross
Carrying
Amount
|
Accumulated
Amortization |
Foreign
Exchange Impact |
Net
Balance |
Gross
Carrying
Amount
|
Accumulated
Amortization |
Impairment Charge
|
Foreign Exchange Impact
|
Net
Balance
|
|||||||||||||||||||
|
Technical know-how
|
$
|
214,290
|
|
$
|
(21,138
|
)
|
$
|
(1,691
|
)
|
$
|
191,461
|
|
$
|
214,290
|
|
$
|
(10,029
|
)
|
$
|
—
|
|
$
|
(7,855
|
)
|
$
|
196,406
|
|
|
|
Customer relationships
|
368,000
|
|
(63,860
|
)
|
(1,979
|
)
|
302,161
|
|
368,000
|
|
(31,199
|
)
|
—
|
|
(11,064
|
)
|
325,737
|
|
||||||||||
|
Contracts
|
19,800
|
|
(9,205
|
)
|
—
|
|
10,595
|
|
19,800
|
|
(3,658
|
)
|
—
|
|
—
|
|
16,142
|
|
||||||||||
|
Trademarks
|
35,400
|
|
(3,911
|
)
|
(198
|
)
|
31,291
|
|
35,400
|
|
(1,573
|
)
|
—
|
|
(567
|
)
|
33,260
|
|
||||||||||
|
Permits
|
9,100
|
|
(5,612
|
)
|
—
|
|
3,488
|
|
9,100
|
|
(3,792
|
)
|
—
|
|
—
|
|
5,308
|
|
||||||||||
|
Total definite-lived intangible assets
|
646,590
|
|
(103,726
|
)
|
(3,868
|
)
|
538,996
|
|
646,590
|
|
(50,251
|
)
|
—
|
|
(19,486
|
)
|
576,853
|
|
||||||||||
|
Indefinite-lived trade names
|
159,027
|
|
—
|
|
(968
|
)
|
158,059
|
|
165,900
|
|
—
|
|
(6,873
|
)
|
(5,105
|
)
|
153,922
|
|
||||||||||
|
Indefinite-lived trademarks
|
82,900
|
|
—
|
|
(611
|
)
|
82,289
|
|
82,900
|
|
—
|
|
—
|
|
(3,902
|
)
|
78,998
|
|
||||||||||
|
In-process research and development
|
6,800
|
|
—
|
|
—
|
|
6,800
|
|
6,800
|
|
—
|
|
—
|
|
—
|
|
6,800
|
|
||||||||||
|
Total intangible assets
|
$
|
895,317
|
|
$
|
(103,726
|
)
|
$
|
(5,447
|
)
|
$
|
786,144
|
|
$
|
902,190
|
|
$
|
(50,251
|
)
|
$
|
(6,873
|
)
|
$
|
(28,493
|
)
|
$
|
816,573
|
|
|
|
|
|
|
|
|
|
|
|
|
|
|
|
|
|
|
||||||||||||||
The Company amortizes technical know-how over periods that range from
fourteen
to
twenty
years, customer relationships over periods that range from
seven
to
fifteen
years, trademarks over a
fifteen
year period, contracts over periods that range from
two
to
sixteen
years, and permits over
five
years.
Amortization of intangibles included in cost of goods sold on the consolidated statements of operations was
$20,579
,
$13,573
and
$3,605
for the years ended
December 31, 2017
,
2016
and
2015
, respectively. Amortization of intangibles included in other operating expense, net on the consolidated statements of operations was
$32,010
,
$25,263
and
$6,605
for the years ended
December 31, 2017
,
2016
and
2015
, respectively.
Estimated future aggregate amortization expense of intangible assets is as follows:
|
Year
|
Amount
|
|||
|
2018
|
$
|
51,883
|
|
|
|
2019
|
50,914
|
|
||
|
2020
|
47,363
|
|
||
|
2021
|
46,421
|
|
||
|
2022
|
46,354
|
|
||
|
Thereafter
|
296,061
|
|
||
|
Total estimated future aggregate amortization expense
|
$
|
538,996
|
|
|
|
|
|
|||
F-33
PQ GROUP HOLDINGS INC. AND SUBSIDIARIES
NOTES TO CONSOLIDATED FINANCIAL STATEMENTS
(Dollars in thousands, except share and per share amounts)
14. Accrued Liabilities:
The following table summarizes the components of accrued liabilities as follows:
|
|
December 31,
|
|||||||
|
|
2017
|
2016
|
||||||
|
Compensation and bonus
|
$
|
49,988
|
|
$
|
47,823
|
|
||
|
Interest
|
15,936
|
|
9,139
|
|
||||
|
Property tax
|
1,622
|
|
2,499
|
|
||||
|
Environmental reserves (see Note 22)
|
5,790
|
|
8,346
|
|
||||
|
Supply contract obligation (see Note 25)
|
1,638
|
|
1,638
|
|
||||
|
Income taxes
|
1,166
|
|
8,035
|
|
||||
|
Commissions and rebates
|
1,820
|
|
2,253
|
|
||||
|
Pension, postretirement and supplemental retirement plans (see Note 19)
|
2,192
|
|
2,030
|
|
||||
|
Other
|
13,765
|
|
17,670
|
|
||||
|
Total
|
$
|
93,917
|
|
$
|
99,433
|
|
||
The summary of long-term debt is as follows:
|
December 31, 2017
|
December 31, 2016
|
||||||
|
Term Loan Facility (U.S. dollar denominated)
|
$
|
916,153
|
|
$
|
925,430
|
|
|
|
Term Loan Facility (Euro denominated)
|
335,808
|
|
297,317
|
|
|||
|
6.75% Senior Secured Notes due 2022
|
625,000
|
|
625,000
|
|
|||
|
5.75% Senior Unsecured Notes due 2025
|
300,000
|
|
—
|
|
|||
|
Floating Rate Senior Unsecured Notes due 2022
|
—
|
|
525,000
|
|
|||
|
8.5% Senior Notes due 2022
|
—
|
|
200,000
|
|
|||
|
ABL Facility
|
25,000
|
|
—
|
|
|||
|
Other
|
68,318
|
|
45,223
|
|
|||
|
Total debt
|
2,270,279
|
|
2,617,970
|
|
|||
|
Original issue discount
|
(18,390
|
)
|
(28,497
|
)
|
|||
|
Deferred financing costs
|
(21,403
|
)
|
(27,275
|
)
|
|||
|
Total debt, net of original issue discount and deferred financing costs
|
2,230,486
|
|
2,562,198
|
|
|||
|
Less: current portion
|
(45,166
|
)
|
(14,481
|
)
|
|||
|
Total long-term debt
|
$
|
2,185,320
|
|
$
|
2,547,717
|
|
|
Concurrent with the closing of the Business Combination, the Company refinanced the existing credit facilities of PQ Holdings and Eco Services by (i) entering into a
$1,200,000
senior secured term loan (consisting of a
$900,000
senior secured term loan and a
$300,000
Euro equivalent senior secured term loan), (ii) issuing
$625,000
in new senior secured notes, (iii) issuing
$525,000
in senior unsecured notes, and (iv) entering into a
$200,000
asset-based secured revolving credit facility. The existing PQ Holdings credit facilities were not legally assumed as part of the Business Combination, and the extinguishment of the debt was included as part of the consideration transferred for the Business Combination (see Note 6 to these consolidated financial statements for further information).
The Company recorded
$4,747
of new creditor and third-party financing costs as debt extinguishment costs. In addition, previous unamortized deferred financing costs of
$6,252
and original issue discount of
$989
associated with the previously outstanding debt were written off as debt extinguishment costs.
F-34
PQ GROUP HOLDINGS INC. AND SUBSIDIARIES
NOTES TO CONSOLIDATED FINANCIAL STATEMENTS
(Dollars in thousands, except share and per share amounts)
The Company incurred deferred financing fees associated with the financing of its debt. Such deferred financing costs are amortized over the terms of the related agreements. Amortization of deferred costs of
$3,780
and
$2,801
for the years ended December 31, 2016 and 2015, respectively, were included in interest expense. In addition, the Company paid original issue discount associated with the financing of its debt. The original issue discount is amortized over the terms of the related agreements. Amortization of original issue discount of
$3,079
and
$314
for the years ended December 31, 2016 and 2015, respectively, were included in interest expense.
Senior Secured USD and Euro Term Loans and Asset-Based Revolving Loan
Concurrent with the Business Combination, the Company entered into new senior secured credit facilities (collectively, the “New Senior Secured Credit Facilities”) comprised of a
$1,200,000
term loan facility consisting of a
$900,000
U.S. dollar-denominated tranche and a
$300,000
Euro-denominated (or
€265,000
) tranche (the “Term Loan Facility”), and a
$200,000
asset-based revolving credit facility (the “ABL Facility”). The Term Loan Facility was issued at
99.0%
of the principal amount. Borrowings under the Term Loan Facility bore interest at a rate equal to the LIBOR rate (or EURIBOR rate, as applicable) or the base rate elected by the Company at the time of the borrowing plus a margin of
4.75%
or
3.75%
, respectively. Further, the LIBOR rate and base rate elected under the facilities are subject to a floor of
1.00%
and
2.00%
, respectively. The Term Loan Facility requires minimum scheduled quarterly principal payments equal to
0.25%
of the original principal amount of the term loans made on the closing date of the Business Combination. The Term Loan Facility has a maturity date of November 4, 2022, which date may be accelerated prior to the maturity date of the 2022 Notes unless the 2022 Notes have been refinanced or repaid prior to such time.
On November 14, 2016 (the “First Amendment Closing Date”), the Company entered into the First Amendment Agreement to the Term Loan Facility (the “First Amendment”) pursuant to which the Company, among other things: (a) refinanced the existing
$900,000
U.S. dollar-denominated tranche by issuing a U.S. dollar-denominated replacement term loan in the amount of
$927,750
and (b) refinanced the existing
€265,000
(or
$300,000
) Euro-denominated tranche by issuing a Euro-denominated replacement term loan in the amount of
€283,338
. Included in the U.S. dollar-denominated replacement term loan is an additional
$30,000
principal amount of borrowings. Included in the Euro-denominated replacement term loan is an additional
€19,000
principal amount of borrowings. The borrowings under the First Amendment bear interest at a rate equal to the LIBOR rate or the base rate elected by the Company at the time of borrowing plus a margin of
4.25%
for U.S. dollar-denominated LIBOR Rate loans,
4.00%
for Euro-denominated LIBOR Rate loans or
3.25%
for base rate loans. These new replacement term loans have substantially the same terms under the original Term Loan Facility subject to the amendments contained in the First Amendment.
The Company recorded
$474
of new creditor and third-party financing costs as debt extinguishment costs. In addition, previous unamortized deferred financing costs of
$564
and original issue discount of
$756
associated with the previously outstanding debt were written off as debt extinguishment costs.
On August 7, 2017, the Company re-priced the existing
$927,750
U.S. dollar-denominated tranche and the existing
€283,338
Euro-denominated tranche of its term loans to reduce the applicable interest rates. The terms of the facilities are substantially consistent following the re-pricing, except that borrowings under the term loans bear interest at a rate equal to the LIBOR rate plus a margin of
3.25%
with respect to U.S. dollar-denominated LIBOR rate loans and the EURIBOR rate plus a margin of
3.25%
with respect to Euro-denominated EURIBOR rate loans. In addition, the LIBOR rate elected under the facilities is subject to a floor of
0%
and the EURIBOR rate elected under the facilities is subject to a floor of
0.75%
.
The Company recorded
$199
of new creditor and third-party financing costs as debt extinguishment costs. In addition, previous unamortized deferred financing costs of
$105
and original issue discount of
$162
associated with the previously outstanding debt were written off as debt extinguishment costs.
The Company may at any time or from time to time voluntarily prepay loans under the Term Loan Facility in whole or in part without premium or penalty.
The Term Loan Facility further requires prepayments from certain “net cash proceeds” received and 50% of “excess cash flow” with step downs to lower percentages based on the Company’s leverage ratio, if applicable. In accordance with the Term Loan Facility, net cash proceeds generally relate to proceeds received from the issuance or incurrence of certain indebtedness or proceeds received on the disposition of assets, adjusted for certain costs and expenses, and are payable promptly upon receipt, subject in the case of net cash proceeds from asset dispositions or condemnation/casualty events exceeding certain thresholds. Net cash proceeds in respect of asset dispositions are not payable if such proceeds are reinvested in the Company’s business within a certain specified time period. Excess cash flow is to be calculated annually and is defined as the sum of consolidated adjusted EBITDA, consolidated working capital adjustments and consolidated net income, each adjusted for various expenditures and/or proceeds commencing with the fiscal year ending on December 31, 2017. Prepayments with respect to excess cash flow, if any, are to be made on an annual basis due within 5 business days after the annual audited financials are delivered to the lenders thereunder of each year. The remaining principal balance of the term loans are due upon maturity.
F-35
PQ GROUP HOLDINGS INC. AND SUBSIDIARIES
NOTES TO CONSOLIDATED FINANCIAL STATEMENTS
(Dollars in thousands, except share and per share amounts)
The loans and guarantees under the Term Loan Facility are secured (i) by a first-priority security interest in, among other things, substantially all of the Company’s and the guarantors’ equity interests, equipment, intellectual property, pledged debt, material real estate assets, general intangibles, books, records and supporting obligations related to the foregoing and any other assets (other than collateral securing the ABL Facility on a first-priority basis) and (ii) by a second-priority security interest in receivables, inventory, deposit accounts and other collateral securing the ABL Facility. The liens securing the Term Loan Facility and the guarantees are
pari passu
with the liens securing the Senior Secured Notes subject to the
pari passu
intercreditor agreement.
The ABL Facility provides for up to
$200,000
in revolving credit borrowings consisting of up to
$150,000
in U.S. available borrowings, up to
$10,000
in Canadian available borrowings and up to
$40,000
of European available borrowings. Borrowings under the ABL Facility bear interest at a rate equal to the LIBOR rate or the base rate elected by the Company at the time of the borrowing plus a margin of between
1.50%
-
2.00%
or
0.50%
-
1.00%
, respectively, depending on availability under the ABL Facility. In addition, there is an annual commitment fee equal to
0.375%
, with a step-down to
0.25%
based on the average usage of the revolving credit borrowings available. As of
December 31, 2017
, there were
$25,000
in revolving credit borrowings under the ABL Facility. Revolving credit borrowings are payable at the option of the Company throughout the term of the ABL Facility with the balance due May 4, 2021.
The Company has the ability to request letters of credit under the ABL Facility. The Company had
$19,741
of letters of credit outstanding as of
December 31, 2017
, which reduce available borrowings under the ABL Facility by such amounts.
The loans and guarantees under the ABL Facility are secured (i) by a first-priority security interest in, among other things, substantially all of the Company’s and the guarantors’ receivables, inventory, deposit accounts and other collateral securing the ABL Facility on a first-priority basis and (ii) by a second-priority security interest in the property and assets that secure the Term Loan Facility. In addition, the ABL Facility is secured by the equity interests in, and substantially all of the assets of, certain foreign guarantors in connection with the Canadian dollar-denominated and Euro-denominated availability.
The Term Loan Facility and the ABL Facility contain various non-financial restrictive covenants. Each limits the ability of PQ Corporation and its restricted subsidiaries to incur certain indebtedness or liens, merge, consolidate or liquidate, dispose of certain property, make investments or declare or pay dividends, make optional payments, modify certain debt instruments, enter into certain transactions with affiliates, enter into certain sales and leasebacks, and certain other non-financial restrictive covenants. The ABL Facility also contains one financial covenant which applies when minimum availability under the ABL Facility exceeds a certain threshold. During such time, the Company is required to maintain a fixed-charge coverage ratio of at least
1
.0 to 1.0. The Company is in compliance with all debt covenants as of
December 31, 2017
and
2016
, respectively.
Senior Secured Notes
Concurrent with the Business Combination, the Company issued
$625,000
of
6.750%
Senior Secured Notes due November 2022 (the “Senior Secured Notes”) in transactions exempt from or not subject to registration under the Securities Act pursuant to Rule 144A and Regulation S under the Securities Act of 1933. The Senior Secured Notes are senior secured obligations of the Company and rank equally in right of payment with all of the Company’s existing and future senior debt, and are senior in right of payment to all of the Company’s existing and future subordinated debt. The Senior Secured Notes are effectively senior to all of the Company’s existing and future unsubordinated indebtedness that is not secured, to the extent of the value of the collateral securing the Senior Secured Notes. The Senior Secured Notes are effectively subordinated to the Company’s ABL Facility, to the extent of the value of the assets securing the ABL Facility on a first priority basis. The Senior Secured Notes are also structurally subordinated to the liabilities of PQ Corporation’s existing and future non-guarantor subsidiaries. The indenture relating to the Senior Secured Notes contains various limitations on the Company’s and its restricted subsidiaries’ ability to incur additional indebtedness, pay dividends or repay certain debt, make loans and investments, sell assets, create liens, enter into transactions with affiliates, enter into agreements restricting PQ Corporation’s subsidiaries ability to pay dividends, and merge and consolidate with other companies, among other things. Interest on the Senior Secured Notes is payable on May 15 and November 15 of each year, commencing November 15, 2016. No principal payments are required with respect to the Senior Secured Notes prior to their final maturity. The Senior Secured Notes mature on November 15, 2022.
The obligations of the Company under the Senior Secured Notes and the related indenture are guaranteed by PQ Holdings and CPQ Midco I Corporation, PQ Corporation’s direct parent, and each of PQ Corporation’s current and future domestic subsidiaries that is a guarantor under the Term Loan Facility. The obligations of the Company under the Senior Secured Notes and the indenture are secured (i) by a first-priority security interest in substantially all of the Company’s and the guarantors’ property and assets that secure the Term Loan Facility (other than collateral securing the ABL Facility on a first-priority basis) and (ii) by a second-priority security interest in receivables, inventory, deposit accounts and other collateral securing the ABL Facility. The liens securing the Senior Secured Notes and the guarantees are
pari passu
with the liens securing the Term Loan Facility subject to the
pari passu
intercreditor agreement.
F-36
PQ GROUP HOLDINGS INC. AND SUBSIDIARIES
NOTES TO CONSOLIDATED FINANCIAL STATEMENTS
(Dollars in thousands, except share and per share amounts)
If any Event of Default (other than a default relating to certain events of bankruptcy or insolvency of PQ Corporation or certain of its subsidiaries) occurs and is continuing under the Indenture, the Trustee or the Holders of at least 30% in principal amount of the then total outstanding notes by notice to the Company may declare the principal, premium, if any, interest and any other monetary obligations on all the then outstanding notes to be due and payable immediately. If an event of default arising from certain events of bankruptcy or insolvency of the Company occurs, the principal of, premium, if any, and interest on all the Senior Secured Notes shall become immediately due and payable without any declaration or other act on the part of the trustee or any holders.
The Senior Secured Notes are redeemable, in whole or in part, at the redemption prices (expressed as percentages of principal amount of the Senior Secured Notes to be redeemed) set forth below, plus accrued and unpaid interest, if any, to, but not including, the redemption date, if redeemed on or after any of the dates below until the subsequent date below:
|
Year
|
Percentage
|
||
|
May 15, 2019
|
103.375
|
%
|
|
|
May 15, 2020
|
101.688
|
%
|
|
|
May 15, 2021 and thereafter
|
100.000
|
%
|
|
Upon the occurrence of a change of control, as defined, each holder will have the right to require the Company to purchase all or any part of such holder’s Senior Secured Notes at a purchase price in cash equal to
101%
of the principal amount, plus accrued and unpaid interest.
Senior Unsecured Notes - Redeemed as of December 11, 2017
Concurrent with the Business Combination, the Company issued
$525,000
aggregate principal amount of floating rate Senior Unsecured Notes due 2022 (the “Senior Unsecured Notes”) in a concurrent private placement exempt from the registration requirements of the Securities Act. The notes were issued at
98.0%
of the principal amount. The Senior Unsecured Notes were to mature on May 1, 2022; provided that if the 2022 Notes have been refinanced or otherwise repaid prior to such date, the Senior Unsecured Notes were to mature on May 1, 2023. Interest on the Senior Unsecured Notes was paid and reset quarterly at an annual rate equal to the three-month LIBOR plus
10.75%
per year, with a
1.0%
LIBOR floor. The note purchase agreement relating to the Senior Unsecured Notes contained various limitations on the Company’s and its restricted subsidiaries’ ability to incur additional indebtedness, pay dividends or repay certain debt, make loans and investments, sell assets, create liens, enter into transactions with affiliates, enter into agreements restricting PQ Corporation’s subsidiaries ability to pay dividends, and merge and consolidate with other companies, among other things. Interest was payable on March 15, June 15, September 15, and December 15 of each year, commencing on June 15, 2016. The Senior Unsecured Notes were senior unsecured obligations of the Company and the guarantors. The former obligations of the Company under the Senior Unsecured Notes and the related note purchase agreement were guaranteed by PQ Holdings and CPQ Midco I Corporation, PQ Corporation’s direct parent, and each of PQ Corporation’s subsidiaries that was a guarantor under the New Senior Secured Credit Facilities.
In conjunction with the Company’s IPO, on October 3, 2017, the Company redeemed
$446,208
in aggregate principal of the
$525,000
of PQ Corporation’s Senior Unsecured Notes using the proceeds from the IPO. Following the redemption,
$78,792
aggregate principal amount of the Senior Unsecured Notes remained outstanding. The Company paid a redemption premium of
$32,284
, which was recorded as debt extinguishment costs. In addition, previous unamortized deferred financing costs of
$696
and original issue discount of
$7,555
associated with the previously outstanding debt were written off as debt extinguishment costs.
On December 11, 2017, the Company redeemed the remaining
$78,792
aggregate principal amount of the Senior Unsecured Notes with the proceeds from its issuance of the
5.75%
Senior Unsecured Notes due 2025. The Company paid a redemption premium of
$7,091
, of which
$6,043
was recorded as debt extinguishment costs. In addition, unamortized deferred financing costs of
$108
and original issue discount of
$1,176
associated with the previously outstanding debt were written off as debt extinguishment costs. Refer to the
5.75%
Senior Unsecured Notes due 2025 section of this note for further information.
Senior Secured Credit Facilities - Refinanced as of May 4, 2016
On December 1, 2014, Eco Services entered into a credit agreement (the “Senior Credit Agreement”) governing a
$555,000
senior secured credit facility, which included a
$500,000
term loan facility and a
$55,000
revolving credit facility (collectively, the “Senior Secured Credit Facilities”). The full amount of the
$500,000
term loan facility was drawn on December 1, 2014 (the “Eco Credit Facility Closing Date”) to finance a portion of 2014 Acquisition with Solvay (as defined in
Note 23
), including working capital and/or purchase price adjustments payable on the Eco Credit Facility Closing Date and the payment of related fees, expenses and other costs of the transactions. The Senior Credit Agreement was due to mature on December 1, 2021.
F-37
PQ GROUP HOLDINGS INC. AND SUBSIDIARIES
NOTES TO CONSOLIDATED FINANCIAL STATEMENTS
(Dollars in thousands, except share and per share amounts)
Borrowings under the Senior Credit Agreement bore interest at a rate per annum equal to an applicable interest rate margin, plus, at Eco Services’ option, either (a) a base rate determined by the reference to the highest of (1) the prime commercial lending rate publicly announced by the administrative agent as the “prime rate” as in effect on such day, (2) the federal funds effective rate plus
0.50%
, and (3) the LIBOR rate determined by reference to the cost of funds for Eurodollar deposits for an interest period of one month, plus
1.00%
or (b) a LIBOR rate determined by reference to the costs of funds for Eurodollar deposits for the specified interest period, as adjusted for certain statutory reserve requirements. As of December 31, 2015, the interest rate on the Senior Credit Agreement was
4.75%
.
The term loan facility was issued at
99.5%
of the principal amount, resulting in an original issue discount on the term loan facility of
$2,500
. The accretion of the original issue discount is reported as interest expense, and is accreted under the effective interest method over the term of the loan.
Proceeds from the revolving credit facility were to be used to finance the Company’s working capital needs and other general corporate purposes, including investments, restricted payments and any other purpose not prohibited as defined in the Senior Credit Agreement. In 2015, the Company borrowed and repaid
$12,000
under the revolving credit facility, resulting in
no
outstanding credit balance on the revolving credit facility as of December 31, 2015. A portion of the revolving credit facility, not to exceed
$25,000
, was also available for the issuance of letters of credit.
Concurrent with the Business Combination, on May 4, 2016 the Senior Secured Credit Facilities were refinanced and as such, there is no principal amount outstanding as of December 31, 2017 and 2016, respectively.
2022 Notes - Redeemed as of December 11, 2017
In December 2014, Eco Services issued
$200,000
aggregate principal amount of
8.50%
senior notes due 2022 (the “2022 Notes”) under an indenture dated October 24, 2014. The 2022 Notes were issued in a private transaction exempt from the registration requirements of the Securities Act. Pursuant to the indenture governing the 2022 Notes, PQ Group Holdings assumed the obligations of Eco Services under the 2022 Notes following the Business Combination. Interest on the 2022 Notes was payable on May 1 and November 1 of each year. The 2022 Notes were to mature on November 1, 2022 and were issued at
100%
of the principal amount. In 2014, the Successor Company recorded
$3,000
of costs related to potential bridge financing that was charged to interest expense upon the issuance of the 2022 Notes. The 2022 Notes were unsecured senior obligations of the Company,
pari passu
in right of payment to all existing and future senior indebtedness of the Company, and effectively subordinated to all secured indebtedness of the Company to the extent of the value of the assets securing such senior indebtedness. The 2022 Notes were senior in right of payment to all subordinated indebtedness of the Company.
On December 11, 2017, the Company redeemed the
$200,000
aggregate principal amount of the 2022 Notes with the proceeds from its issuance of the
5.75%
Senior Unsecured Notes due 2025. The Company paid a redemption premium of
$8,500
, of which
$7,996
was recorded as debt extinguishment costs. In addition, unamortized deferred financing costs of
$5,207
associated with the previously outstanding debt were written off as debt extinguishment costs. Refer to the
5.75%
Senior Unsecured Notes due 2025 section of this note for further information.
5.75%
Senior Unsecured Notes due 2025
On December 11, 2017, the Company issued
$300,000
aggregate principal amount of floating rate Senior Unsecured Notes due 2025 (the “
5.75%
Senior Unsecured Notes”) in a private placement exempt from the registration requirements of the Securities Act. The
5.75%
Senior Unsecured Notes mature on December 15, 2025. Interest on the
5.75%
Senior Unsecured Notes is to be paid semi-annually on February 15 and August 15, commencing August 15, 2018, at an annual rate of
5.75%
. The note purchase agreement relating to the
5.75%
Senior Unsecured Notes contained various limitations on the Company’s and its restricted subsidiaries’ ability to incur additional indebtedness, pay dividends or repay certain debt, make loans and investments, sell assets, create liens, enter into transactions with affiliates, enter into agreements restricting PQ Corporation’s subsidiaries ability to pay dividends, and merge and consolidate with other companies, among other things. No principal payments are required with respect to the Senior Secured Notes prior to their final maturity.
The obligations of the Company under the
5.75%
Senior Unsecured Notes and the related indenture are guaranteed by PQ Holdings and CPQ Midco I Corporation, PQ Corporation’s direct parent, and each of PQ Corporation’s current and future domestic subsidiaries that is a guarantor under the Term Loan Facility. The obligations of the Company under the
5.75%
Senior Unsecured Notes and the indenture are secured (i) by a first-priority security interest in substantially all of the Company’s and the guarantors’ property and assets that secure the Term Loan Facility (other than collateral securing the ABL Facility on a first-priority basis) and (ii) by a second-priority security interest in receivables, inventory, deposit accounts and other collateral securing the ABL Facility. The liens securing the
5.75%
Senior Unsecured Notes and the guarantees are
pari passu
with the liens securing the Term Loan Facility subject to the
pari passu
intercreditor agreement.
F-38
PQ GROUP HOLDINGS INC. AND SUBSIDIARIES
NOTES TO CONSOLIDATED FINANCIAL STATEMENTS
(Dollars in thousands, except share and per share amounts)
If any Event of Default (other than a default relating to certain events of bankruptcy or insolvency of PQ Corporation or certain of its subsidiaries) occurs and is continuing under the Indenture, the Trustee or the Holders of at least
30%
in principal amount of the then total outstanding notes by notice to the Company may declare the principal, premium, if any, interest and any other monetary obligations on all the then outstanding notes to be due and payable immediately. If an event of default arising from certain events of bankruptcy or insolvency of the Company occurs, the principal of, premium, if any, and interest on all the Senior Secured Notes shall become immediately due and payable without any declaration or other act on the part of the trustee or any holders.
At any time prior to December 15, 2020, the Company may, at its option and on one more more occasions, redeem (a) up to
40%
of the aggregate principal amount of the
5.75%
Senior Unsecured Notes with the cash proceeds from certain equity offerings at a redemption price equal to the sum of
105.75%
of the aggregate principal amount thereof plus accrued and unpaid interest thereon, and (b) all or part of the
5.75%
Senior Unsecured Notes at
100.00%
of the aggregate principal amount redeemed plus accrued and unpaid interest thereon and a make-whole premium (the “Applicable Premium”). The Applicable Premium is equal to the greater of: (a)
1%
of the principal amount of notes redeemed, or (b) the excess, if any, of:
(1) the present value at the redemption date of (i) the redemption price of such notes at December 15, 2020 (as set forth in the table below), plus (ii) all required remaining scheduled interest payments due on such notes through December 15, 2020 (excluding accrued but unpaid interest to, but excluding, the redemption date), computed using a discount rate equal to the applicable United States Treasury rate as of such redemption date plus 50 basis points; over
(2) the outstanding principal amount of such notes on the redemption date.
On or after December 15, 2020, the
5.75%
Senior Unsecured Notes are redeemable, in whole or in part, at the redemption prices (expressed as percentages of principal amount of the
5.75%
Senior Unsecured Notes to be redeemed) set forth below, plus accrued and unpaid interest, if any, to, but not including, the redemption date, if redeemed on or after any of the dates below until the subsequent date below:
|
Year
|
Percentage
|
||
|
December 15, 2020
|
102.875
|
%
|
|
|
December 15, 2021
|
101.438
|
%
|
|
|
December 15, 2022 and thereafter
|
100.000
|
%
|
|
Upon the occurrence of a change of control, as defined, each holder will have the right to require the Company to purchase all or any part of such holder’s Senior Secured Notes at a purchase price in cash equal to
101%
of the principal amount, plus accrued and unpaid interest.
New Markets Tax Credit Financing
On October 24, 2013, PQ Holdings’ (and now the Company’s) subsidiary Potters Industries, LLC (“Potters”) entered into a NMTC financing arrangement with JPMorgan Chase Bank N.A. and several of its affiliates (“Chase”) and TX CDE V LLC, an affiliate of Texas LIC Development Company LLC d/b/a Texas Community Development Capital (“TX CDE”) to fund the expansion of Potters’ manufacturing facility in Paris, Texas (the “2013 NMTC Agreement”). The NMTC program, which is administered by the United States Treasury Department, requires certain balance sheet commitments. The 2013 NMTC Agreement will provide the Company with certain monetary benefits as an offset to specifically identified capital expenditures. The 2013 NMTC Agreement requires that certain commitments and covenants be maintained over a period of seven years in order to legally recognize the benefit. Chase agreed to contribute
$6,634
and an additional
$15,632
in funds lent to Chase by Potters Holdings II, L.P. to TX CDE. TX CDE, in turn, lent
$21,000
in the form of
$5,368
and
$15,632
of notes to Potters, which used the proceeds to finance the expansion of Potters’ manufacturing facility in Paris, Texas. The capital expenditures associated with the 2013 NMTC Agreement were completed in 2014. The
$21,000
of debt related to the 2013 NMTC was assumed as part of the Business Combination and was outstanding as of
December 31, 2017
.
F-39
PQ GROUP HOLDINGS INC. AND SUBSIDIARIES
NOTES TO CONSOLIDATED FINANCIAL STATEMENTS
(Dollars in thousands, except share and per share amounts)
On May 17, 2016, Potters entered into a NMTC financing arrangement with U.S. Bank N.A. and several of its affiliates (“USB”) and MRC XX LLC, an affiliate of Midwest Renewable Capital, LLC (“MRC”), to fund the expansion of Potters’ manufacturing facility in Augusta, Georgia (the “May 2016 NMTC Agreement”). The May 2016 NMTC Agreement provides the Company with certain monetary benefits as an offset to specifically identified capital expenditures. The May 2016 NMTC Agreement requires that certain commitments and covenants be maintained over a period of
seven years
in order to legally recognize the benefit. USB agreed to contribute
$3,732
and an additional
$7,822
in funds lent to USB by Potters Holdings II, L.P. to MRC. MRC, in turn, lent
$11,000
in the form of
$7,823
,
$1,311
and
$1,866
of notes to Potters, which used the proceeds to finance the expansion of Potters’ manufacturing facility in Augusta, Georgia. The
$11,000
was outstanding as of
December 31, 2017
. The capital expenditures associated with the May 2016 NMTC Agreement were completed in 2017.
On December 29, 2016, Potters entered into a second NMTC financing arrangement with USB and MRC whereby USB agreed to contribute
$3,815
and an additional
$7,775
in funds lent to USB by Potters Holdings II, L.P. to MRC. MRC, in turn, lent
$11,000
in the form of
$7,775
,
$1,402
and
$1,823
of notes to Potters, which will use the proceeds as working capital for another expansion of Potters’ manufacturing facility in Paris, Texas (the “December 2016 NMTC Agreement”). The
$11,000
was outstanding as of
December 31, 2017
. Potters expended the proceeds of the notes as working capital in 2017.
On June 22, 2017, Potters, entered into a NMTC financing arrangement with U.S. Bank N.A. (“USB”), one of USB’s affiliates (“USB Investment Fund”) and Business Conduit No. 28, LLC, an affiliate of Community Reinvestment Fund, Inc. (“CRF”). USB contributed
$3,054
to USB Investment Fund, and Potters Leveraged Lender LLC, an indirect subsidiary of the Company, lent USB Investment Fund
$6,221
. USB Investment Fund then contributed
$9,000
to CRF, which in turn lent
$8,820
to Potters pursuant to a credit agreement (the “June 2017 NMTC Agreement”). Potters used the
$8,820
in proceeds to acquire equipment for the expansion of Potters’ manufacturing facility in Paris, Texas. The June 2017 NMTC Agreement provides the Company with certain monetary benefits as an offset to specifically identified capital expenditures. The June 2017 NMTC Agreement requires that certain commitments and covenants are maintained over a period of
seven years
in order to legally recognize the benefit. The
$8,820
was outstanding as of
December 31, 2017
. The capital expenditures associated with the June 2017 NMTC Agreement are expected to be completed in 2018.
In connection with the aforementioned NMTC financing arrangements, the Company provided indemnifications related to its actions or inactions which cause either a NMTC disallowance or recapture event. In the event that the Company causes either a recapture or disallowance of the tax credits expected to be generated under this program, then the Company will be required to repay the disallowed or recaptured tax credits plus an amount sufficient to pay the taxes on such repayment to the counterparty of the agreement. This indemnification covers the Company’s actions and inactions prior the end of the seven-year term of each agreement. The maximum potential amount of future payments under this indemnification is approximately
$24,649
. The Company currently believes that the likelihood of a required payment under this indemnification is remote.
Other Debt
On June 12, 2017, the Company acquired Sovitec and assumed its obligations to Belfius Bank NV (“Belfius”). On June 8, 2017, Sovitec entered into a credit agreement with Belfius governing a
€14,500
credit line which is divided into
four
tranches. Tranche A was issued in the amount of
€7,500
in the form of a Euro roll-over credit with a maturity date of December 31, 2021. Tranche B was issued in the amount of
€3,000
in the form of a Euro roll-over credit with a full principal payment due on its maturity date of September 30, 2022. A working capital line of credit (“Working Capital”) of
€3,000
was issued under the form of straight loans with a maturity date up to 90 days after borrowings are made on the line. A capital expenditure line of credit (“CAPEX line”) of
€1,000
was issued under the form of straight loans with a maturity date of September 30, 2021. Tranche A is subject to principal payments of
€750
made on September 30 and December 31 of each year. Borrowings under the credit agreement bear rates based on Sovitec’s ratio of net debt to Normalized EBITDA. Normalized EBITDA is defined as the Sovitec consolidated operating profit before non-recurring items (i.e. items non-related to normal operations of the last twelve month period and provided an acceptable description of the one-off character of those items is given) and before taxation, depreciation and amortization. Interest rate margins are subject to being reset on June 30 of each year. Interest rates reset based on three net debt to Normalized EBITDA ratio ranges of less than 2, between 2 and 3 or greater than 3. Rates for each tranche of debt reset based on 1 to 9 month EURIBOR rates (not lower than zero) plus a margin that can range between
1.10%
to
1.55%
for Tranche A,
1.85%
to
2.15%
for Tranche B,
0.90%
and
1.20%
for Working Capital and
1.25%
and
1.80%
for the CAPEX line.
As of
December 31, 2017
, the interest rate on the credit agreements are as follows: Tranche A,
1.10%
, Tranche B,
1.85%
, Working Capital,
0.90%
and CAPEX
1.40%
. As of
December 31, 2017
, the following principal balances are outstanding on each debt instrument: Tranche A,
$7,201
, Tranche B,
$3,601
, Working Capital,
$2,160
and CAPEX
$1,200
.
F-40
PQ GROUP HOLDINGS INC. AND SUBSIDIARIES
NOTES TO CONSOLIDATED FINANCIAL STATEMENTS
(Dollars in thousands, except share and per share amounts)
Loans and guarantees under the credit agreement are secured by (1) a first priority security interest on the Sovitec properties located Fleurus, Belgium and Florange, France and (2) 100% of the nominative shares in Sovitec’s wholly owned parent company, Sovitec International B.V. The credit agreement contains various non-financial and financial covenants. Each limits the ability of Sovitec and its restricted subsidiaries to incur certain indebtedness or liens, merge, consolidated or liquidate, dispose of certain property, make investments or declare or pay dividends. The credit agreement also contains one financial covenant which requires maintaining a maximum net debt/EBITDA ratio of
3
:1 during the first three years of the agreement and afterwards a maximum
2.5
:1 ratio. The Company is in compliance with all debt covenants as of
December 31, 2017
.
The Company also has several note payable agreements denominated in Japanese Yen which enables the Company to borrow up to a total of
260,000
Japanese Yen, or
$2,306
. Borrowings bear interest at either TIBOR (“Tokyo Interbank Offered Rate”) plus a margin or the short-term prime rate with a weighted average rate of
0.55%
as of
December 31, 2017
. The terms of the agreements vary and are renewable upon expiration of the term with the balances due in 2018. Borrowings under the agreement are payable at the option of the Company throughout the term of the agreements. Borrowings outstanding under these agreements were
$2,306
and
$2,223
as of
December 31, 2017
and
2016
, respectively.
Certain of the Company’s foreign subsidiaries maintain other note payable agreements. These agreements are not further described as they are not significant to the consolidated financial statements.
The fair value of a financial instrument is the amount at which the instrument could be exchanged in a current transaction. As of
December 31, 2017
and
2016
, the fair value of the senior secured term loans and senior secured and unsecured notes was higher than book value by
$59,319
and
$68,477
, respectively. The fair value of the senior secured term loans and senior secured and unsecured notes was derived from published loan prices at
December 31, 2017
and
2016
, as applicable. The fair value is classified as Level 2 based upon the fair value hierarchy (see
Note 4
to these consolidated financial statements for further information on fair value measurements).
The aggregate long-term debt maturities are:
|
Year
|
Amount
|
||
|
2018
|
45,166
|
|
|
|
2019
|
14,479
|
|
|
|
2020
|
14,479
|
|
|
|
2021
|
14,488
|
|
|
|
2022
|
1,829,846
|
|
|
|
Thereafter
|
351,821
|
|
|
|
|
2,270,279
|
|
|
|
|
|
||
16. Other Long-term Liabilities:
The following table summarizes the components of other long-term liabilities as follows:
|
|
December 31,
|
|||||||
|
|
2017
|
2016
|
||||||
|
Pension benefits
|
$
|
69,914
|
|
$
|
71,443
|
|
||
|
Supply contract (see Note 25)
|
20,612
|
|
22,250
|
|
||||
|
Other postretirement benefits
|
4,503
|
|
3,991
|
|
||||
|
Supplemental retirement plans
|
11,667
|
|
12,055
|
|
||||
|
Reserve for uncertain tax positions
|
4,244
|
|
4,149
|
|
||||
|
Asset retirement obligation
|
4,094
|
|
3,700
|
|
||||
|
Other
|
5,437
|
|
5,567
|
|
||||
|
Total
|
$
|
120,471
|
|
$
|
123,155
|
|
||
|
|
|
|||||||
F-41
PQ GROUP HOLDINGS INC. AND SUBSIDIARIES
NOTES TO CONSOLIDATED FINANCIAL STATEMENTS
(Dollars in thousands, except share and per share amounts)
17. Financial Instruments:
The Company uses interest rate related derivative instruments to manage its exposure related to changes in interest rates on its variable-rate debt instruments and uses commodity derivatives to manage its exposure to commodity price fluctuations. The Company does not speculate using derivative instruments.
By using derivative financial instruments to hedge exposures to changes in interest rates and commodity prices, the Company exposes itself to credit risk and market risk. Credit risk is the failure of the counterparty to perform under the terms of the derivative contract. When the fair value of a derivative contract is an asset, the counterparty owes the Company, which creates credit risk for the Company. When the fair value of a derivative contract is a liability, the Company owes the counterparty and, therefore, the Company is not exposed to the counterparty’s credit risk in those circumstances. The Company minimizes counterparty credit risk in derivative instruments by entering into transactions with high quality counterparties. The derivative instruments entered into by the Company do not contain credit-risk-related contingent features.
Market risk is the adverse effect on the value of a derivative instrument that results from a change in interest rates, currency exchange rates, or commodity prices. The market risk associated with interest rate and commodity price contracts is managed by establishing and monitoring parameters that limit the types and degree of market risk that may be undertaken.
Use of Derivative Financial Instruments to Manage Commodity Price Risk.
The Company is exposed to risks in energy costs due to fluctuations in energy prices, particularly natural gas. The Company has a hedging program in the United States which allows the Company to mitigate exposure to natural gas volatility with natural gas swap agreements. Fair value is determined based on estimated amounts that would be received or paid to terminate the contracts at the reporting date based on quoted market prices of comparable contracts. The respective current and non-current liabilities are recorded in accrued liabilities and other long-term liabilities and the respective current and non-current assets are recorded in prepaid and other current assets and other long-term assets, as applicable. As the derivatives are highly effective and are designated and qualify as cash-flow hedges, the related unrealized gains or losses are recorded in stockholders’ equity as a component of other comprehensive income (loss), net of tax. Realized gains and losses on natural gas hedges are included in production cost and subsequently charged to cost of goods sold in the consolidated statements of operations in the period in which inventory is sold. The Company’s natural gas swaps have a remaining notional quantity of
4.3 million
MMBTU to mitigate commodity price volatility through December 2018.
Use of Derivative Financial Instruments to Manage Interest Rate Risk.
The Company is exposed to fluctuations in interest rates on its senior secured credit facilities and senior unsecured notes. Changes in interest rates will not affect the market value of such debt but will affect the amount of the Company’s interest payments over the term of the loans. Likewise, an increase in interest rates could have a material impact on the Company’s cash flow. The Company hedges the interest rate fluctuations on debt obligations through interest rate cap agreements. The Company records these agreements at fair value as assets or liabilities. As the derivatives are highly effective and are designated and qualify as cash-flow hedges, the related unrealized gains or losses are deferred in stockholders’ equity as a component of other comprehensive income (loss), net of tax. Fair value is determined based on estimated amounts that would be received or paid to terminate the contracts at the reporting date based on quoted market prices.
In July 2016, the Company entered into interest rate cap agreements, paying a premium of
$1,551
to mitigate interest rate volatility from July 2016 through July 2020 by employing varying cap rates, ranging from
1.50%
to
3.00%
on
$1,000,000
of notional variable-rate debt.
F-42
PQ GROUP HOLDINGS INC. AND SUBSIDIARIES
NOTES TO CONSOLIDATED FINANCIAL STATEMENTS
(Dollars in thousands, except share and per share amounts)
The fair values of derivative instruments held as of
December 31, 2017
and
2016
are shown below:
|
December 31,
|
||||||||||
|
Balance sheet location
|
2017
|
2016
|
||||||||
|
Asset derivatives:
|
||||||||||
|
Derivatives designated as cash flow hedges:
|
||||||||||
|
Natural gas swaps
|
Current assets
|
$
|
—
|
|
$
|
573
|
|
|||
|
Interest rate caps
|
Current assets
|
44
|
|
—
|
|
|||||
|
Natural gas swaps
|
Other long-term assets
|
—
|
|
58
|
|
|||||
|
Interest rate caps
|
Other long-term assets
|
999
|
|
5,803
|
|
|||||
|
Total asset derivatives
|
$
|
1,043
|
|
$
|
6,434
|
|
||||
|
Liability derivatives:
|
||||||||||
|
Derivatives designated as cash flow hedges:
|
||||||||||
|
Natural gas swaps
|
Current liabilities
|
$
|
318
|
|
$
|
—
|
|
|||
|
Natural gas swaps
|
Other long-term liabilities
|
130
|
|
—
|
|
|||||
|
Total liability derivatives
|
$
|
448
|
|
$
|
—
|
|
||||
The following table shows the effect of the Company’s derivative instruments designated as hedges on other comprehensive income (loss) (“OCI”) and the statements of operations for the years ended
December 31, 2017
and
2016
:
|
December 31,
|
||||||||||
|
Location in earnings
|
2017
|
2016
|
||||||||
|
Derivatives designated as cash flow hedges:
|
||||||||||
|
AOCI derivative gain at beginning of year
|
$
|
4,881
|
|
$
|
—
|
|
||||
|
Effective portion of changes in fair value recognized in OCI:
|
||||||||||
|
Interest rate caps
|
(4,760
|
)
|
4,250
|
|
||||||
|
Natural gas swaps
|
(1,300
|
)
|
(802
|
)
|
||||||
|
Amount of loss reclassified from OCI to earnings:
|
||||||||||
|
Interest rate caps
|
Interest expense
|
40
|
|
—
|
|
|||||
|
Natural gas swaps
|
Cost of goods sold
|
222
|
|
1,433
|
|
|||||
|
AOCI derivative gain (loss) at end of year
|
$
|
(917
|
)
|
$
|
4,881
|
|
||||
Amounts of unrealized losses in accumulated other comprehensive income (loss) (“AOCI”) that are expected to be reclassified to the consolidated statement of operations over the next twelve months are $
574
as of
December 31, 2017
.
18. Income Taxes:
The Tax Cuts and Jobs Act (“TCJA”) was enacted on December 22, 2017 and became effective January 1, 2018. The TCJA imposed significant changes to U.S. tax law, such as lowering U.S. corporate income tax rates, implementing a more territorial U.S. income tax system and levying a one-time transition tax on deemed repatriated earnings of foreign subsidiaries.
The TCJA reduces the U.S. corporate income tax rate from 35% to 21%, effective January 1, 2018. GAAP requires that deferred tax assets and liabilities are measured using enacted tax rates expected to apply to taxable income in the years in which those temporary differences are expected to reverse in the future. As a result of the reduction in the U.S. corporate income tax rate from 35% to 21% under the TCJA, the Company was required to remeasure existing deferred tax balances using the new U.S. statutory tax rate. As a result of this remeasurement, the Company recorded a provisional net tax benefit from the rate reduction of
$64,343
.
F-43
PQ GROUP HOLDINGS INC. AND SUBSIDIARIES
NOTES TO CONSOLIDATED FINANCIAL STATEMENTS
(Dollars in thousands, except share and per share amounts)
The TCJA also provided for a one-time transition tax on the deemed repatriation of post-1986 undistributed foreign subsidiary earnings and profits (“E&P”) from controlled foreign corporations (“CFC”) at reduced tax rates of 8% or 15.5%. The Company has historically provided a deferred tax liability for certain foreign earnings. As a result of tax reform, the Company recorded a net provisional income tax benefit of
$25,196
, because the transition tax at the reduced rates was less than the amount previously provided at 35%. After provisionally electing to utilize current year tax losses to offset the impact of the transition tax, we expect to pay no U.S. federal cash taxes with respect to the deemed repatriation.
Due to having incurred approximately
$43,000
of tax expense as of
December 31, 2017
resulting from the one-time transition tax based on the cumulative E&P of our CFCs, all previously unremitted earnings for which no U.S. deferred tax liability had been accrued have now been subjected to U.S. federal income tax. Provisionally, the Company expects to offset the full impact of the
$43,000
tax expense by utilizing tax net operating losses generated in the
2017
tax year against the deemed repatriation income inclusion. As such, no cash tax expense is expected with respect to the
$43,000
. To the extent we repatriate amounts related to these earnings to the United States, we estimate that the Company will not incur significant additional taxes related to such amounts, as they will have already been subject to U.S. federal income tax. However, our estimates are provisional and subject to further analysis.
The TCJA also includes a provision to tax global intangible low-taxed income (“GILTI”) of foreign subsidiaries and a base erosion anti-abuse tax (“BEAT”) measure that taxes certain payments between a U.S. corporation and its subsidiaries. Both of the GILTI and BEAT provisions are effective January 1, 2018. The Company is in the process of analyzing the impact of these two items. With respect to GILTI, the Company anticipates making a policy election to treat this tax as a period cost and will account for taxes on GILTI as they are incurred. With respect to BEAT, at this time the Company does not expect to be subject to that provision of the TCJA in a way that materially affects future tax provision amounts.
The SEC staff has issued Staff Accounting Bulletin No. 118 (“SAB 118”) to address the application of U.S. GAAP in situations when a registrant does not have the necessary information available, prepared, or analyzed (including computations) in reasonable detail to complete the accounting for certain income tax effects of the TCJA. As amounts are refined, SAB 118 allows the registrant to record provisional amounts during a measurement period not to extend beyond one year of the TCJA enactment date. We are in the process of analyzing the impact of the various provisions of the TCJA. The ultimate impact of TCJA to the Company’s financial statements may materially differ from these provisional amounts due to, among other things, additional analysis, changes in interpretations and assumptions we have made, additional regulatory guidance that may be issued, as well as any actions we may take as a result of the TCJA.
We expect to complete our analysis within the allowed measurement period in accordance with SAB 118.
Income (loss) before income taxes and noncontrolling interest within or outside the United States are shown below:
|
|
Years ended
December 31, |
|||||||||||
|
|
2017
|
2016
|
2015
|
|||||||||
|
Domestic
|
$
|
(137,147
|
)
|
$
|
(84,094
|
)
|
$
|
11,427
|
|
|||
|
Foreign
|
76,513
|
|
14,977
|
|
—
|
|
||||||
|
Total
|
$
|
(60,634
|
)
|
$
|
(69,117
|
)
|
$
|
11,427
|
|
|||
|
|
|
|||||||||||
F-44
PQ GROUP HOLDINGS INC. AND SUBSIDIARIES
NOTES TO CONSOLIDATED FINANCIAL STATEMENTS
(Dollars in thousands, except share and per share amounts)
The provision (benefit) for income taxes as shown in the accompanying consolidated statements of operations consists of the following:
|
|
Years ended
December 31, |
|||||||
|
|
2017
|
2016
|
||||||
|
Current:
|
|
|||||||
|
Federal
|
$
|
—
|
|
$
|
—
|
|
||
|
State
|
806
|
|
91
|
|
||||
|
Foreign
|
20,209
|
|
10,088
|
|
||||
|
|
21,015
|
|
10,179
|
|
||||
|
|
|
|
|
|
||||
|
Deferred:
|
|
|
|
|
||||
|
Federal
|
(135,970
|
)
|
8,654
|
|
||||
|
State
|
(1,817
|
)
|
292
|
|
||||
|
Foreign
|
(2,425
|
)
|
(9,084
|
)
|
||||
|
|
(140,212
|
)
|
(138
|
)
|
||||
|
|
|
|
|
|
||||
|
Provision (benefit) for income taxes
|
$
|
(119,197
|
)
|
$
|
10,041
|
|
||
|
|
|
|||||||
A reconciliation of income tax expense (benefit) at the U.S. federal statutory income tax rate of
35%
to actual income tax expense is as follows:
|
|
Years ended
December 31, |
|||||||
|
|
2017
|
2016
|
||||||
|
Tax at statutory rate
|
$
|
(21,222
|
)
|
$
|
(24,191
|
)
|
||
|
State income taxes, net of federal income tax benefit
|
(7,754
|
)
|
(4,110
|
)
|
||||
|
Repatriation of non-US earnings inclusive of mandatory repatriation toll tax
|
(24,912
|
)
|
4,576
|
|
||||
|
Change in Tax Status-Eco-Passthrough to C-Corp
|
—
|
|
33,891
|
|
||||
|
Changes in uncertain tax positions
|
974
|
|
(2,383
|
)
|
||||
|
Change in valuation allowances
|
6,771
|
|
2,577
|
|
||||
|
Rate changes
|
(63,319
|
)
|
—
|
|
||||
|
Change in state effective rates
|
(340
|
)
|
(290
|
)
|
||||
|
Foreign withholding taxes
|
978
|
|
1,505
|
|
||||
|
Foreign tax rate differential
|
(10,131
|
)
|
(1,354
|
)
|
||||
|
Non-deductible transaction costs
|
1,679
|
|
667
|
|
||||
|
Other, net
|
(1,921
|
)
|
(847
|
)
|
||||
|
Provision (benefit) for income taxes
|
$
|
(119,197
|
)
|
$
|
10,041
|
|
||
|
|
|
|||||||
The total tax (benefit) provision of
$(119,197)
and
$10,041
for the years ended
December 31, 2017
and
2016
, respectively, on the Company’s consolidated pre-tax income (loss) for the period differs from the U.S. statutory tax rate of
35%
. This difference is principally due to the impacts of U.S. tax reform, foreign income tax in jurisdictions with statutory rates different than the U.S. rate, state taxes, non-deductible transaction costs, foreign withholding taxes, changes in valuation allowance, and changes in uncertain tax positions.
F-45
PQ GROUP HOLDINGS INC. AND SUBSIDIARIES
NOTES TO CONSOLIDATED FINANCIAL STATEMENTS
(Dollars in thousands, except share and per share amounts)
Prior to the Business Combination on May 4, 2016, Eco Services was a single member limited liability company and taxed as a partnership for federal and state income tax purposes. As such, all income tax liabilities and/or benefits of Eco Services were passed through to their members. Because Eco Services was taxed as a partnership, it did not record deferred taxes on the basis difference on their financial statements. Following the Business Combination on May 4, 2016, Eco Services had a change in tax status and is now taxed as a C-Corporation subject to federal and state corporate level income taxes at prevailing corporate tax rates. As Eco Services had not previously recorded deferred taxes on the basis difference, the Company recognized net deferred tax liabilities of
$33,891
for the year ended
December 31, 2016
primarily related to basis differences in depreciable fixed assets and intangible assets based upon prevailing corporate tax rates.
Deferred tax assets (liabilities) are comprised of the following:
|
|
December 31,
|
|||||||
|
|
2017
|
2016
|
||||||
|
Deferred tax assets:
|
|
|||||||
|
Net operating loss carryforwards
|
$
|
144,267
|
|
$
|
157,811
|
|
||
|
Pension
|
16,255
|
|
21,454
|
|
||||
|
Post retirement health
|
561
|
|
1,040
|
|
||||
|
Transaction costs
|
1,183
|
|
2,896
|
|
||||
|
Natural gas contracts
|
110
|
|
—
|
|
||||
|
Interest rate swaps
|
115
|
|
—
|
|
||||
|
Unrealized translation losses
|
5,065
|
|
6,046
|
|
||||
|
Other
|
38,290
|
|
44,351
|
|
||||
|
Valuation allowance
|
(64,945
|
)
|
(38,271
|
)
|
||||
|
|
$
|
140,901
|
|
$
|
195,327
|
|
||
|
|
|
|
|
|
||||
|
Deferred tax liabilities:
|
|
|
|
|
||||
|
Depreciation
|
$
|
(86,532
|
)
|
$
|
(114,749
|
)
|
||
|
Undistributed earnings of non-US subsidiaries
|
(8,334
|
)
|
(73,205
|
)
|
||||
|
LIFO reserve
|
—
|
|
—
|
|
||||
|
Inventory
|
(11,324
|
)
|
(20,159
|
)
|
||||
|
Intangible assets
|
(184,937
|
)
|
(276,671
|
)
|
||||
|
Natural gas contracts
|
—
|
|
(241
|
)
|
||||
|
Other accruals
|
—
|
|
(1,621
|
)
|
||||
|
Other
|
(36,810
|
)
|
(27,144
|
)
|
||||
|
|
$
|
(327,937
|
)
|
$
|
(513,790
|
)
|
||
|
|
|
|
|
|
||||
|
Net deferred tax liabilities
|
$
|
(187,036
|
)
|
$
|
(318,463
|
)
|
||
|
|
|
|||||||
Included in the
2017
and
2016
deferred tax asset and liability amounts for depreciation, intangible assets, inventory, natural gas contracts, unrealized transaction losses, and other above is
$45,873
and
$75,539
, respectively, of a net deferred tax liability related to the Company’s investment in Potters, which is a partnership for federal income tax purposes. The Company and one of its subsidiaries own in aggregate 100% of Potters and the assets and liabilities of Potters are included in the consolidated financial statements of the Company.
The
$187,036
in net deferred tax liabilities as of
December 31, 2017
consists of
$2,300
in non-current deferred tax assets and
$189,336
in net non-current deferred tax liabilities. The
$318,463
in net deferred tax liabilities as of
December 31, 2016
consists of
$195,327
in non-current deferred tax assets and
$513,790
in net non-current deferred tax liabilities. Prior to the Business Combination, Eco Services was a single member LLC, treated as a partnership for federal and state tax purposes, with no deferred taxes provided.
F-46
PQ GROUP HOLDINGS INC. AND SUBSIDIARIES
NOTES TO CONSOLIDATED FINANCIAL STATEMENTS
(Dollars in thousands, except share and per share amounts)
The change in net deferred tax liabilities for the years ended
December 31, 2017
and
2016
was primarily related to the decrease in deferred tax liabilities resulting from the revaluing of domestic deferred tax amounts, pursuant to U.S. tax reform lowering the statutory tax rate, as well as the change in book amortization of intangibles with no corresponding tax basis and an increase in valuation allowance with respect to acquired Sovitec entities.
The following are changes in the deferred tax valuation allowance during the years ended
December 31, 2017
and
2016
:
|
Years ended
December 31, |
||||||||
|
2017
|
2016
|
|||||||
|
Beginning Balance
|
$
|
38,271
|
|
$
|
—
|
|
||
|
Additions
|
34,863
|
|
46,347
|
|
||||
|
Reductions
|
(8,189
|
)
|
(8,076
|
)
|
||||
|
Ending Balance
|
$
|
64,945
|
|
$
|
38,271
|
|
||
The net change in the total valuation allowance was an increase of
$26,674
in
2017
. Prior to the Business Combination, Eco Services was a single member LLC, treated as a partnership for federal and state tax purposes. Any income tax liabilities and/or benefits of Eco Services were passed through to the member. As such, prior to May 4, 2016, the date of the Business Combination, the valuation allowance was
$0
. The valuation allowance at
December 31, 2017
was primarily related to foreign and state net operating loss carryforwards and tax credits that, in the judgment of management, are not more likely than not to be realized. In assessing the ability to realize deferred tax assets, management considered whether it is more likely than not that some portion or all of the deferred tax assets will not be realized. The ultimate realization of deferred tax assets is dependent upon the generation of future taxable income during the periods in which those temporary differences become deductible. Management considered the scheduled reversal of deferred tax liabilities (including the impact of available carryback and carryforward periods), projected future taxable income, and tax-planning strategies that are prudent in making this assessment. In order to fully realize deferred tax assets, the Company will need to generate future taxable income prior to the expiration of the net operating loss and credit carryforwards. The amount of the deferred tax assets considered realizable, however, could be reduced in the near term if estimates of future taxable income during the carryforward period are reduced.
Management considered certain earnings in non-U.S. subsidiaries to be available for repatriation in the future. The tax cost associated with non-U.S. subsidiary earnings and distributions for the year ended
December 31, 2017
has been recorded as tax expense for the period. In this regard the Company expects to deduct, rather than credit, foreign tax expense in computing the U.S. tax effects of repatriation from non-U.S. subsidiaries in
2017
. The unremitted earnings of non-U.S. subsidiaries and affiliates that have not been reinvested abroad indefinitely amount to
$210,979
and
$190,586
as of
December 31, 2017
and
2016
, respectively. The deferred U.S. federal and state income tax liability and deferred foreign withholding tax liability on these undistributed earnings is estimated to be
$8,334
and
$73,205
as of
December 31, 2017
and
2016
, respectively. As a result of tax reform, the liability on unremitted earnings as of
December 31, 2017
is only related to foreign withholding taxes, as all earnings and profits were deemed repatriated for U.S. income tax purposes as a result of U.S. Tax Reform.
As a result of the transition tax computed as part of U.S. tax reform, any earnings and profits permanently reinvested as of
December 31, 2017
would have minimal taxes associated with them.
As of
December 31, 2016
, the cumulative unremitted earnings of foreign subsidiaries outside the United States, considered permanently reinvested, for which no income or withholding taxes have been provided approximated
$194,444
. Such earnings are expected to be reinvested indefinitely and, as a result, no deferred tax liability has been recognized with regard to such earnings. Determination of the deferred income tax liability on these unremitted earnings is not practicable, principally because such liability, if any, is dependent on circumstances existing if and when remittance occurs.
F-47
PQ GROUP HOLDINGS INC. AND SUBSIDIARIES
NOTES TO CONSOLIDATED FINANCIAL STATEMENTS
(Dollars in thousands, except share and per share amounts)
The following table summarizes the activity related to our gross unrecognized tax benefits:
|
|
Years ended
December 31, |
|||||||
|
|
2017
|
2016
|
||||||
|
Balance at beginning of period
|
$
|
16,128
|
|
$
|
—
|
|
||
|
Increases related to prior year tax positions
|
68
|
|
19,419
|
|
||||
|
Decreases related to prior year tax positions
|
(5,508
|
)
|
(68
|
)
|
||||
|
Increases related to current year tax positions
|
743
|
|
691
|
|
||||
|
Decreases related to current year tax positions
|
—
|
|
—
|
|
||||
|
Decreases related to settlements with taxing authorities
|
—
|
|
(3,914
|
)
|
||||
|
Decreases related to lapsing of statute of limitations
|
—
|
|
—
|
|
||||
|
Balance at end of period
|
$
|
11,431
|
|
$
|
16,128
|
|
||
|
|
|
|||||||
Included in the reduction of prior year positions is the impact of reducing the U.S. corporate tax rate from 35% to 21%, since the uncertain position that is recorded in the U.S. is recorded as a reduction in the net operating loss that is available. The net operating loss deferred tax balance was revalued along with the other domestic deferred tax assets and liabilities as of December 22, 2017.
Included in the balance of total unrecognized tax benefits are potential benefits of
$11,431
and
$16,128
arising from legacy PQ Corporation that if recognized, would affect the effective tax rate on income from continuing operations for the years ended
December 31, 2017
and
2016
, respectively.
Interest and penalties recognized related to uncertain tax positions amounted to
$52
and
$2,054
for the years ended
December 31, 2017
and
2016
, respectively. To the extent interest and penalties are not assessed with respect to uncertain tax positions, amounts accrued will be reduced and reflected as a reduction of the overall income tax provision in the period for which the event occurs requiring the adjustment. The
$1,270
and
$1,177
in accrued interest and penalties as of
December 31, 2017
and
2016
, respectively, is recorded in other long-term liabilities on the consolidated balance sheets.
Due to the Business Combination, the Company files numerous consolidated and separate income tax returns in the U.S. federal jurisdiction and in many state and foreign jurisdictions. The following describes the open tax years, by major tax jurisdiction, as of
December 31, 2017
:
|
Jurisdiction
|
Period
|
|
|
United States-Federal
|
2007-Present
|
|
|
United States-State
|
2008-Present
|
|
|
Canada
(1)
|
2009-Present
|
|
|
Germany
|
2007-Present
|
|
|
Netherlands
|
2012-Present
|
|
|
Mexico
|
2012-Present
|
|
|
United Kingdom
|
2010-Present
|
|
|
Brazil
|
2012-Present
|
|
|
(1)
|
Includes federal as well as local jurisdictions
|
Given that certain U.S. companies have net operating loss carryforwards, the statute for examination by taxing authorities in the United States, and certain state jurisdictions, will remain open for a period following the use of such net operating loss carryforwards, extending the period for examination beyond the years indicated above.
The Company has subsidiaries in various states, provinces and countries that are currently under audit for years ranging from 2007 through 2016. To date, no material adjustments have been proposed as a result of these audits. As of
December 31, 2017
, the Company does not believe that there are any positions for which it is reasonably possible that the total amount of unrecognized tax benefits will significantly increase or decrease within the next 12 months.
F-48
PQ GROUP HOLDINGS INC. AND SUBSIDIARIES
NOTES TO CONSOLIDATED FINANCIAL STATEMENTS
(Dollars in thousands, except share and per share amounts)
The Company has a net operating loss carry-forward (“NOL”) available of
$426,851
to reduce future federal taxes payable. The current federal NOL carry-forward period is
20 years
. In light of tax reform, net operating losses incurred after December 31, 2017 will be allowed to carry forward indefinitely. As a result of the Business Combination,
$332,376
of the
$426,851
may be subject to the limitations of Section 382 of the Internal Revenue Code (“IRC”). Although potentially subject to the limitations of IRC §382, management believes it is more likely than not that the Company will realize the entire
$332,376
in pre-transaction NOLs in future years. The remaining
$94,475
relates to periods after the Business Combination and would not be subject to IRC §382.
For state income tax purposes, the Company incurred net operating losses of
$119,742
for
2017
that may be carried forward at periods ranging from 5 to 20 years among the states in which the Company is subject to tax to reduce future state income taxes payable. Cumulative state net operating losses carrying forward into
2018
are
$657,738
. A valuation allowance of
$16,318
has been applied against the total
$31,389
of state net operating loss deferred tax assets, leaving losses of
$15,071
that have been recognized for financial accounting purposes for the portion of those losses that the Company believes, on a more likely than not basis, will be realized.
Foreign net operating losses of
$127,949
, of which
$4,880
will begin to expire in 2023,
$2,932
will begin to expire in 2027,
$2,441
will begin to expire in 2035,
$1,604
will begin to expire in 2038 with the remaining
$116,093
carrying forward indefinitely, are available to reduce future foreign income taxes payable. A valuation allowance of
$29,728
has been applied to
$31,294
of deferred tax assets related to foreign net operating loss carry-forwards, leaving a net deferred tax asset relating to foreign net operating losses of
$1,566
that has been recognized for financial accounting purposes.
Cash payments for income taxes are as follows:
|
|
Years ended
December 31, |
|||||||||||
|
|
2017
|
2016
|
2015
|
|||||||||
|
Domestic
|
$
|
1,647
|
|
$
|
373
|
|
$
|
8
|
|
|||
|
Foreign
|
27,552
|
|
16,608
|
|
—
|
|
||||||
|
|
$
|
29,199
|
|
$
|
16,981
|
|
$
|
8
|
|
|||
|
|
|
|
||||||||||
19. Benefit Plans:
The Company sponsors defined benefit pension plans covering employees in the United States and certain employees at its foreign subsidiaries. Benefits for a majority of the plans are based on average final pay and years of service. The Company’s funding policy is to fund the minimum required contribution under local statutory requirements.
The Company sponsors unfunded plans to provide certain health care benefits to retired employees in the United States and Canada. The plans pay a stated percentage of medical expenses reduced by deductibles and other coverage. The plans are unfunded and obligations are paid out of the Company’s operations.
The Company also has defined benefit supplementary retirement plans which provide benefits for certain U.S. employees in excess of qualified plan limitations. The obligations are paid out of the Company’s general assets, including assets held in a Rabbi trust, or restoration plan assets.
The Company uses a December 31 measurement date for all of its defined benefit pension, postretirement medical and supplementary retirement plans. The following discussion includes information for the Eco Services benefit plans for all periods presented, and the acquired PQ Holdings benefit plans beginning on the date of the Business Combination.
The Eco Services benefit plans include two defined benefit pension plans and one retiree health plan, all based in the U.S. The PQ Holdings benefit plans include a U.S. defined benefit pension plan as well as the defined benefit pension plans for all of the Company’s foreign subsidiaries, two retiree health plans (one each in the U.S and Canada), and the Company’s defined benefit supplementary retirement plans.
Of the Company’s three defined benefit pension plans covering employees in the U.S., only the Eco Services Hourly Pension Plan continues to accrue benefits subsequent to December 31, 2016. All future accruals were frozen for the PQ Corporation Retirement Plan as of December 31, 2006 and for the Eco Services Pension Equity Plan as of December 31, 2016. With respect to the Company’s three retiree health plans, the PQ Holdings plans in the U.S. and Canada were closed to new retirees as of December 31, 2006. The Eco Services Postretirement Life and Dental Plan was closed to new retirees effective July 1, 2017. The Company’s defined benefit supplementary retirement plans were frozen to future accruals as of December 31, 2006.
F-49
PQ GROUP HOLDINGS INC. AND SUBSIDIARIES
NOTES TO CONSOLIDATED FINANCIAL STATEMENTS
(Dollars in thousands, except share and per share amounts)
Defined Benefit Pension Plans
The following tables summarize changes in the benefit obligation, plan assets and funded status of the Company’s significant defined benefit pension plans as well as the components of net periodic benefit cost, including key assumptions:
|
|
U.S.
|
Foreign
|
||||||||||||||
|
|
December 31,
|
December 31,
|
||||||||||||||
|
|
2017
|
2016
|
2017
|
2016
|
||||||||||||
|
Change in benefit obligation:
|
|
|
|
|
||||||||||||
|
Benefit obligation at beginning of period
|
$
|
247,418
|
|
$
|
71,605
|
|
$
|
106,025
|
|
$
|
—
|
|
||||
|
Service cost
|
1,219
|
|
2,130
|
|
3,686
|
|
2,106
|
|
||||||||
|
Interest cost
|
10,115
|
|
7,680
|
|
3,271
|
|
2,224
|
|
||||||||
|
Participant contributions
|
—
|
|
—
|
|
493
|
|
300
|
|
||||||||
|
Plan curtailments
|
—
|
|
(1,325
|
)
|
—
|
|
(1,204
|
)
|
||||||||
|
Plan settlements
|
(2,264
|
)
|
(4,772
|
)
|
—
|
|
—
|
|
||||||||
|
Benefits paid
|
(9,591
|
)
|
(5,390
|
)
|
(2,967
|
)
|
(1,305
|
)
|
||||||||
|
Expenses paid
|
—
|
|
—
|
|
(319
|
)
|
(66
|
)
|
||||||||
|
Net transfer in
(1)
|
—
|
|
192,120
|
|
—
|
|
99,025
|
|
||||||||
|
Actuarial (gains) losses
|
14,205
|
|
(14,630
|
)
|
(2,169
|
)
|
9,804
|
|
||||||||
|
Translation adjustment
|
—
|
|
—
|
|
11,690
|
|
(4,859
|
)
|
||||||||
|
Benefit obligation at end of the period
|
$
|
261,102
|
|
$
|
247,418
|
|
$
|
119,710
|
|
$
|
106,025
|
|
||||
|
|
|
|
|
|
|
|
|
|
||||||||
|
Change in plan assets:
|
|
|
|
|
|
|
|
|
||||||||
|
Fair value of plan assets at beginning of period
|
$
|
198,915
|
|
$
|
52,678
|
|
$
|
86,145
|
|
$
|
—
|
|
||||
|
Actual return on plan assets
|
27,554
|
|
6,897
|
|
217
|
|
8,274
|
|
||||||||
|
Employer contributions
|
3,760
|
|
1,425
|
|
3,781
|
|
921
|
|
||||||||
|
Employee contributions
|
—
|
|
—
|
|
493
|
|
300
|
|
||||||||
|
Plan settlements
|
(2,264
|
)
|
(4,772
|
)
|
—
|
|
—
|
|
||||||||
|
Benefits paid
|
(9,591
|
)
|
(5,390
|
)
|
(2,967
|
)
|
(1,305
|
)
|
||||||||
|
Expenses paid
|
—
|
|
—
|
|
(319
|
)
|
(66
|
)
|
||||||||
|
Acquisitions
(1)
|
—
|
|
148,077
|
|
—
|
|
81,974
|
|
||||||||
|
Translation adjustment
|
—
|
|
—
|
|
9,168
|
|
(3,953
|
)
|
||||||||
|
Fair value of plan assets at end of the period
|
$
|
218,374
|
|
$
|
198,915
|
|
$
|
96,518
|
|
$
|
86,145
|
|
||||
|
|
|
|
|
|
|
|
|
|
||||||||
|
Funded status of the plans (underfunded)
|
$
|
(42,728
|
)
|
$
|
(48,503
|
)
|
$
|
(23,192
|
)
|
$
|
(19,880
|
)
|
||||
|
|
|
|
|
|
|
|
|
|
||||||||
|
(1)
|
Relates to the PQ Holdings defined benefit pension plans assumed as part of the Business Combination.
|
F-50
PQ GROUP HOLDINGS INC. AND SUBSIDIARIES
NOTES TO CONSOLIDATED FINANCIAL STATEMENTS
(Dollars in thousands, except share and per share amounts)
Amounts recognized in the consolidated balance sheets consist of:
|
|
U.S.
|
Foreign
|
||||||||||||||
|
|
December 31,
|
December 31,
|
||||||||||||||
|
|
2017
|
2016
|
2017
|
2016
|
||||||||||||
|
Noncurrent asset
|
$
|
—
|
|
$
|
—
|
|
$
|
3,503
|
|
$
|
3,391
|
|
||||
|
Current liability
|
—
|
|
—
|
|
(673
|
)
|
(331
|
)
|
||||||||
|
Noncurrent liability
|
(42,728
|
)
|
(48,503
|
)
|
(26,022
|
)
|
(22,940
|
)
|
||||||||
|
Accumulated other comprehensive income (loss)
|
10,499
|
|
8,190
|
|
(2,871
|
)
|
(2,085
|
)
|
||||||||
|
Net amount recognized
|
$
|
(32,229
|
)
|
$
|
(40,313
|
)
|
$
|
(26,063
|
)
|
$
|
(21,965
|
)
|
||||
|
|
|
|
|
|
||||||||||||
Amounts recognized in accumulated other comprehensive income (loss) consist of:
|
|
U.S.
|
Foreign
|
||||||||||||||
|
|
December 31,
|
December 31,
|
||||||||||||||
|
|
2017
|
2016
|
2017
|
2016
|
||||||||||||
|
Prior service credit
|
$
|
—
|
|
$
|
—
|
|
$
|
—
|
|
$
|
—
|
|
||||
|
Net gain (loss)
|
13,943
|
|
12,920
|
|
(3,923
|
)
|
(2,686
|
)
|
||||||||
|
Gross amount recognized
|
13,943
|
|
12,920
|
|
(3,923
|
)
|
(2,686
|
)
|
||||||||
|
Deferred income taxes
|
(3,444
|
)
|
(4,730
|
)
|
1,052
|
|
601
|
|
||||||||
|
Net amount recognized
|
$
|
10,499
|
|
$
|
8,190
|
|
$
|
(2,871
|
)
|
$
|
(2,085
|
)
|
||||
|
|
|
|
|
|
||||||||||||
Components of net periodic benefit cost consist of:
|
|
U.S.
|
Foreign
|
||||||||||||||||||||||
|
|
Years ended
December 31, |
Years ended
December 31, |
||||||||||||||||||||||
|
|
2017
|
2016
|
2015
|
2017
|
2016
|
2015
|
||||||||||||||||||
|
Service cost
|
$
|
1,219
|
|
$
|
2,130
|
|
$
|
2,778
|
|
$
|
3,686
|
|
$
|
2,106
|
|
$
|
—
|
|
||||||
|
Interest cost
|
10,115
|
|
7,680
|
|
2,913
|
|
3,271
|
|
2,224
|
|
—
|
|
||||||||||||
|
Expected return on plan assets
|
(12,277
|
)
|
(9,293
|
)
|
(2,885
|
)
|
(3,208
|
)
|
(2,038
|
)
|
—
|
|
||||||||||||
|
Amortization of net gain
|
—
|
|
—
|
|
—
|
|
(9
|
)
|
(10
|
)
|
—
|
|
||||||||||||
|
Curtailment gain recognized
|
—
|
|
(1,311
|
)
|
—
|
|
—
|
|
(517
|
)
|
—
|
|
||||||||||||
|
Settlement (gain) loss recognized
|
(48
|
)
|
152
|
|
(2
|
)
|
—
|
|
—
|
|
—
|
|
||||||||||||
|
Net periodic expense (benefit)
|
$
|
(991
|
)
|
$
|
(642
|
)
|
$
|
2,804
|
|
$
|
3,740
|
|
$
|
1,765
|
|
$
|
—
|
|
||||||
|
|
|
|
|
|
|
|
||||||||||||||||||
There are
$50
of estimated net actuarial losses and
no
prior service credits for the Company’s defined benefit pension plans that will be amortized from accumulated other comprehensive income (loss) into net periodic benefit cost in
2018
.
The total accumulated benefit obligation as of
December 31, 2017
and
2016
for the Company’s U.S. pension plans was
$257,882
and
$244,003
, respectively. The total accumulated benefit obligation as of
December 31, 2017
and
2016
for the Company’s foreign pension plans was
$114,095
and
$100,473
, respectively.
F-51
PQ GROUP HOLDINGS INC. AND SUBSIDIARIES
NOTES TO CONSOLIDATED FINANCIAL STATEMENTS
(Dollars in thousands, except share and per share amounts)
The following table presents selected information about the Company’s pension plans with accumulated benefit obligations in excess of plan assets:
|
|
U.S.
|
Foreign
|
|||||||||||||
|
|
December 31,
|
December 31,
|
|||||||||||||
|
|
2017
|
2016
|
2017
|
2016
|
|||||||||||
|
Projected benefit obligation
|
$
|
261,102
|
|
$
|
247,418
|
|
$
|
67,750
|
|
58,837
|
|
||||
|
Accumulated benefit obligation
|
257,882
|
|
244,003
|
|
64,526
|
|
55,981
|
|
|||||||
|
Fair value of plan assets
|
218,374
|
|
198,915
|
|
42,632
|
|
36,771
|
|
|||||||
Significant weighted average assumptions used in determining the pension obligations include the following:
|
|
U.S.
|
Foreign
|
||||||||||
|
|
December 31,
|
December 31,
|
||||||||||
|
|
2017
|
2016
|
2017
|
2016
|
||||||||
|
Discount rate
|
3.74
|
%
|
4.24
|
%
|
2.91
|
%
|
2.99
|
%
|
||||
|
Rate of compensation increase
(2)
|
3.00
|
%
|
3.00
|
%
|
2.57
|
%
|
2.97
|
%
|
||||
|
(2)
|
With respect to the U.S. plans, the weighted average rate of compensation increase as of
December 31, 2017
reflects only the Eco Services Hourly Pension Plan assumption of
3.00%
, as both the Eco Services Pension Equity Plan and the PQ Corporation Retirement Plan were frozen to new accruals as of
December 31, 2017
(and were included in the average at zero). With respect to the U.S. plans, the weighted average rate of compensation increase as of
December 31, 2016
reflects only the Eco Services Hourly Pension Plan assumption of
3.00%
, as both the Eco Services Pension Equity Plan and the PQ Corporation Retirement Plan were frozen to new accruals as of
December 31, 2016
(and were included in the average at zero).
|
Significant weighted average assumptions used in determining net periodic benefit cost include the following:
|
|
U.S.
|
Foreign
|
||||||||||||||||
|
|
Years ended
December 31, |
Years ended
December 31, |
||||||||||||||||
|
|
2017
|
2016
|
2015
|
2017
|
2016
|
2015
|
||||||||||||
|
Discount rate
|
4.24
|
%
|
4.02
|
%
|
4.09
|
%
|
2.99
|
%
|
5.16
|
%
|
—
|
|
||||||
|
Rate of compensation increase
(3)
|
3.00
|
%
|
3.10
|
%
|
Age-based /
3.00% |
|
2.97
|
%
|
3.95
|
%
|
—
|
|
||||||
|
Expected return on assets
|
6.37
|
%
|
6.34
|
%
|
None
assumed |
|
3.58
|
%
|
5.62
|
%
|
—
|
|
||||||
|
(3)
|
The weighted average rate of compensation increase for the year ended
December 31, 2015
for the U.S. plans was
3.00%
for the Eco Services Hourly Pension Plan and an age-based assumption for the Eco Services Pension Equity Plan.
|
The discount rate for each of the U.S. plans was determined by utilizing a yield curve model. The model develops a spot rate curve based on the yields available from a broad-based universe of high quality corporate bonds. The discount rate is then set as the weighted average spot rate, using the respective plan’s expected benefit cash flows as the weights.
In determining the expected return on U.S. plan assets, the Company considers the relative weighting of plan assets, the historical performance of total plan assets and individual asset classes, and expected future performance. In addition, the Company may consult with and consider the opinions of our external advisors in developing appropriate return benchmarks.
F-52
PQ GROUP HOLDINGS INC. AND SUBSIDIARIES
NOTES TO CONSOLIDATED FINANCIAL STATEMENTS
(Dollars in thousands, except share and per share amounts)
The investment objective for the U.S. plans is to generate returns sufficient to meet future obligations. The strategy to meet the objective includes generating attractive returns using higher returning assets such as equity securities and balancing risk using less volatile assets such as fixed income securities. The U.S. plans invest in an allocation of assets across the two broadly-defined financial asset categories of equity and fixed income securities. The target allocations for the plan assets across the three U.S. plans are as follows:
45%
equity securities and
55%
fixed income investments for the PQ Corporation Retirement Plan;
50%
equity securities and
50%
fixed income investments for the Eco Services Pension Equity Plan; and
48%
equity securities and
52%
fixed income investments for the Eco Services Hourly Pension Plan.
Similar considerations are applied to the investment objectives of the non-U.S. plans as well as the asset classes available in each location and any legal restrictions on plan investments.
The Company classifies plan assets based upon a fair value hierarchy (see
Note 4
to these consolidated financial statements for further information). The classification of each asset within the hierarchy is based on the lowest level input that is significant to its measurement. The fair value hierarchy consists of three levels as follows:
|
•
|
Level 1—Values are unadjusted quoted prices for identical assets and liabilities in active markets accessible at the measurement date. Active markets provide pricing data for trades occurring at least weekly and include exchanges and dealer markets. Level 1 assets primarily include investments in publicly traded equity securities and mutual funds. These securities (or the underlying investments of the funds) are actively traded and valued using quoted prices for identical securities from the market exchanges.
|
|
•
|
Level 2—Inputs include quoted prices for similar assets or liabilities in active markets, quoted prices from those willing to trade in markets that are not active, or other inputs that are observable or can be corroborated by market data for the term of the instrument. Such inputs include market interest rates and volatilities, spreads and yield curves. Level 2 assets primarily consist of fixed-income securities and comingled funds that are not actively traded or whose underlying investments are valued using observable marketplace inputs. The fair value of plan assets invested in fixed-income securities is generally determined using valuation models that use observable inputs such as interest rates, bond yields, low-volume market quotes and quoted prices for similar assets. Plan assets that are invested in comingled funds are valued using a unit price or net asset value (“NAV”) that is based on the underlying investments of the fund.
|
|
•
|
Level 3—Certain inputs are unobservable (supported by little or no market activity) and significant to the fair value measurement. Unobservable inputs reflect the Company’s best estimate of what hypothetical market participants would use to determine a transaction price for the asset or liability at the reporting date. Level 3 assets include investments covered by insurance policies and real estate funds valued using significant unobservable inputs.
|
F-53
PQ GROUP HOLDINGS INC. AND SUBSIDIARIES
NOTES TO CONSOLIDATED FINANCIAL STATEMENTS
(Dollars in thousands, except share and per share amounts)
The following tables set forth by level, within the fair value hierarchy, plan assets at fair value:
|
|
December 31, 2017
|
|||||||||||||||
|
|
Total
|
Level 1
|
Level 2
|
Level 3
|
||||||||||||
|
Cash and cash equivalents
|
$
|
1,072
|
|
$
|
934
|
|
$
|
138
|
|
$
|
—
|
|
||||
|
Equity securities:
|
|
|
|
|
|
|
|
|
||||||||
|
U.S. investment funds
|
56,309
|
|
43,625
|
|
12,684
|
|
—
|
|
||||||||
|
International investment funds
|
70,308
|
|
28,827
|
|
41,481
|
|
—
|
|
||||||||
|
Fixed income securities:
|
|
|
|
|
|
|
|
|
||||||||
|
Government securities
|
11,433
|
|
—
|
|
11,433
|
|
—
|
|
||||||||
|
Corporate bonds
|
82,585
|
|
77,685
|
|
4,900
|
|
—
|
|
||||||||
|
Investment fund bonds
|
54,263
|
|
7,719
|
|
46,544
|
|
—
|
|
||||||||
|
Other:
|
|
|
|
|
|
|
|
|
||||||||
|
Insurance policies
|
38,922
|
|
—
|
|
34,772
|
|
4,150
|
|
||||||||
|
Total
|
$
|
314,892
|
|
$
|
158,790
|
|
$
|
151,952
|
|
$
|
4,150
|
|
||||
|
|
December 31, 2016
|
|||||||||||||||
|
|
Total
|
Level 1
|
Level 2
|
Level 3
|
||||||||||||
|
Cash and cash equivalents
|
$
|
1,979
|
|
$
|
1,863
|
|
$
|
116
|
|
$
|
—
|
|
||||
|
Equity securities:
|
|
|
|
|
|
|
|
|
||||||||
|
U.S. investment funds
|
60,179
|
|
41,529
|
|
18,650
|
|
—
|
|
||||||||
|
International investment funds
|
58,457
|
|
26,119
|
|
32,338
|
|
—
|
|
||||||||
|
Fixed income securities:
|
|
|
|
|
|
|
|
|
||||||||
|
Government securities
|
25,437
|
|
—
|
|
25,437
|
|
—
|
|
||||||||
|
Corporate bonds
|
4,981
|
|
—
|
|
4,981
|
|
—
|
|
||||||||
|
Investment fund bonds
|
113,460
|
|
$
|
77,938
|
|
$
|
35,522
|
|
$
|
—
|
|
|||||
|
Other:
|
||||||||||||||||
|
Insurance policies
|
20,567
|
|
$
|
—
|
|
$
|
17,281
|
|
$
|
3,286
|
|
|||||
|
Total
|
$
|
285,060
|
|
$
|
147,449
|
|
$
|
134,325
|
|
$
|
3,286
|
|
||||
|
|
|
|
|
|
||||||||||||
The changes in the Level 3 pension plan assets are as follows for the years ended December 31:
|
Insurance Policies
|
||||||||
|
|
2017
|
2016
|
||||||
|
Beginning balance
|
$
|
3,286
|
|
$
|
—
|
|
||
|
Business Combination (May 4, 2016)
|
—
|
|
3,226
|
|
||||
|
Actual return on plan assets
|
(41
|
)
|
23
|
|
||||
|
Benefits paid
|
(48
|
)
|
(27
|
)
|
||||
|
Contributions
|
466
|
|
236
|
|
||||
|
Exchange rate changes
|
487
|
|
(172
|
)
|
||||
|
Ending balance
|
$
|
4,150
|
|
$
|
3,286
|
|
||
|
|
|
|||||||
F-54
PQ GROUP HOLDINGS INC. AND SUBSIDIARIES
NOTES TO CONSOLIDATED FINANCIAL STATEMENTS
(Dollars in thousands, except share and per share amounts)
The Company expects to contribute
$1,760
to the U.S. pension plans and
$4,769
to the foreign pension plans in 2018.
The following benefit payments, which reflect expected future service, as appropriate, are expected to be paid:
|
Year
|
U.S.
|
Foreign
|
||||||
|
2018
|
$
|
14,626
|
|
$
|
2,588
|
|
||
|
2019
|
15,363
|
|
3,331
|
|
||||
|
2020
|
15,718
|
|
2,943
|
|
||||
|
2021
|
16,371
|
|
3,197
|
|
||||
|
2022
|
15,373
|
|
3,630
|
|
||||
|
Years 2023-2027
|
76,506
|
|
22,716
|
|
||||
Certain of the Company’s foreign subsidiaries maintain other defined benefit plans that are consistent with statutory practices. These plans are not included in the disclosures above as they are not significant to the Company’s consolidated financial statements.
Supplemental Retirement Plans
The following tables summarize changes in the benefit obligation, plan assets and funded status of the Company’s defined benefit supplementary retirement plans, as well as the components of net periodic benefit cost, including key assumptions:
|
|
December 31,
|
|||||||
|
|
2017
|
2016
|
||||||
|
Change in benefit obligation:
|
|
|
||||||
|
Benefit obligation at beginning of period
|
$
|
13,225
|
|
$
|
—
|
|
||
|
Interest cost
|
489
|
|
328
|
|
||||
|
Net transfer in
(4)
|
—
|
|
14,671
|
|
||||
|
Benefits paid
|
(1,179
|
)
|
(767
|
)
|
||||
|
Actuarial (gains) losses
|
246
|
|
(1,007
|
)
|
||||
|
Benefit obligation at end of period
|
$
|
12,781
|
|
$
|
13,225
|
|
||
|
|
|
|
|
|
||||
|
Change in plan assets:
|
|
|
|
|
||||
|
Fair value of plan assets at beginning of period
|
$
|
—
|
|
$
|
—
|
|
||
|
Employer contributions
|
1,179
|
|
767
|
|
||||
|
Benefits paid
|
(1,179
|
)
|
(767
|
)
|
||||
|
Fair value of plan assets at end of period
|
$
|
—
|
|
$
|
—
|
|
||
|
Funded status of the plans (underfunded)
|
$
|
(12,781
|
)
|
$
|
(13,225
|
)
|
||
|
|
|
|
||||||
|
(4)
|
Relates to the PQ Holdings defined benefit supplementary retirement plans assumed as part of the Business Combination.
|
F-55
PQ GROUP HOLDINGS INC. AND SUBSIDIARIES
NOTES TO CONSOLIDATED FINANCIAL STATEMENTS
(Dollars in thousands, except share and per share amounts)
Amounts recognized in the consolidated balance sheets consist of:
|
|
December 31,
|
|||||||
|
|
2017
|
2016
|
||||||
|
Current liability
|
$
|
(1,115
|
)
|
$
|
(1,170
|
)
|
||
|
Noncurrent liability
|
(11,667
|
)
|
(12,055
|
)
|
||||
|
Accumulated other comprehensive income
|
573
|
|
623
|
|
||||
|
Net amount recognized
|
$
|
(12,209
|
)
|
$
|
(12,602
|
)
|
||
|
|
|
|
||||||
Amounts recognized in accumulated other comprehensive income consist of:
|
|
December 31,
|
|||||||
|
|
2017
|
2016
|
||||||
|
Net gain
|
$
|
761
|
|
$
|
1,007
|
|
||
|
Gross amount recognized
|
761
|
|
1,007
|
|
||||
|
Deferred income taxes
|
(188
|
)
|
(384
|
)
|
||||
|
Net amount recognized
|
$
|
573
|
|
$
|
623
|
|
||
|
|
|
|
||||||
Components of net periodic benefit cost consist of:
|
|
Years ended
December 31, |
|||||||||||
|
|
2017
|
2016
|
2015
|
|||||||||
|
Interest cost
|
$
|
489
|
|
$
|
328
|
|
$
|
—
|
|
|||
|
Net periodic expense
|
$
|
489
|
|
$
|
328
|
|
$
|
—
|
|
|||
|
|
|
|
||||||||||
There are
no
estimated net actuarial gains for the Company’s defined benefit supplementary retirement plans that will be amortized from accumulated other comprehensive income into net periodic benefit cost in
2018
.
The accumulated benefit obligation of the Company’s defined benefit supplemental retirement plans as of
December 31, 2017
and
2016
was
$12,781
and
$13,225
, respectively.
The discount rate used in determining the defined benefit supplemental retirement plan obligation was
3.60%
and
3.90%
as of
December 31, 2017
and
2016
, respectively.
The discount rate used in determining net periodic benefit cost was
3.90%
and
3.40%
for the years ended
December 31, 2017
and
2016
, respectively. The rate of compensation increase for the years ended
December 31, 2017
and
2016
was zero, as all future accruals were frozen for the defined benefit supplementary retirement plans as of December 31, 2006.
The Company expects to contribute
$1,115
to the defined benefit supplementary retirement plans in 2018.
F-56
PQ GROUP HOLDINGS INC. AND SUBSIDIARIES
NOTES TO CONSOLIDATED FINANCIAL STATEMENTS
(Dollars in thousands, except share and per share amounts)
The following benefit payments, which reflect expected future service, as appropriate, are expected to be paid:
|
Year
|
Amount
|
|||
|
2018
|
$
|
1,115
|
|
|
|
2019
|
1,087
|
|
||
|
2020
|
1,056
|
|
||
|
2021
|
1,024
|
|
||
|
2022
|
987
|
|
||
|
Years 2023-2027
|
4,371
|
|
||
Other Postretirement Benefit Plans
The following tables summarize changes in the benefit obligation, plan assets and funded status of the Company’s other postretirement benefit plans as well as the components of net periodic benefit cost, including key assumptions:
|
|
December 31,
|
|||||||
|
|
2017
|
2016
|
||||||
|
Change in benefit obligation:
|
|
|
||||||
|
Benefit obligation at beginning of period
|
$
|
4,620
|
|
$
|
1,296
|
|
||
|
Service cost
|
21
|
|
37
|
|
||||
|
Interest cost
|
174
|
|
151
|
|
||||
|
Employee contributions
|
251
|
|
176
|
|
||||
|
Plan amendments
|
—
|
|
(443
|
)
|
||||
|
Benefits paid
|
(923
|
)
|
(484
|
)
|
||||
|
Medical subsidies received
|
—
|
|
90
|
|
||||
|
Premiums paid
|
(3
|
)
|
(2
|
)
|
||||
|
Net transfer in
(5)
|
—
|
|
4,868
|
|
||||
|
Actuarial (gains) losses
|
418
|
|
(1,057
|
)
|
||||
|
Translation adjustment
|
54
|
|
(12
|
)
|
||||
|
Benefit obligation at end of period
|
$
|
4,612
|
|
$
|
4,620
|
|
||
|
|
|
|
|
|
||||
|
Change in plan assets:
|
|
|
|
|
||||
|
Fair value of plan assets at beginning of period
|
—
|
|
—
|
|
||||
|
Employer contributions
|
675
|
|
220
|
|
||||
|
Employee contributions
|
251
|
|
176
|
|
||||
|
Benefits paid
|
(923
|
)
|
(484
|
)
|
||||
|
Medical subsidies received
|
—
|
|
90
|
|
||||
|
Premiums paid
|
(3
|
)
|
(2
|
)
|
||||
|
Fair value of plan assets at end of period
|
$
|
—
|
|
$
|
—
|
|
||
|
Funded status of the plans (underfunded)
|
$
|
(4,612
|
)
|
$
|
(4,620
|
)
|
||
|
|
|
|
||||||
|
(5)
|
Relates to the PQ Holdings retiree health plans assumed as part of the Business Combination.
|
F-57
PQ GROUP HOLDINGS INC. AND SUBSIDIARIES
NOTES TO CONSOLIDATED FINANCIAL STATEMENTS
(Dollars in thousands, except share and per share amounts)
Amounts recognized in the consolidated balance sheets consist of:
|
|
December 31,
|
|||||||
|
|
2017
|
2016
|
||||||
|
Current liability
|
$
|
(561
|
)
|
$
|
(629
|
)
|
||
|
Noncurrent liability
|
(4,051
|
)
|
(3,991
|
)
|
||||
|
Accumulated other comprehensive income
|
885
|
|
877
|
|
||||
|
Net amount recognized
|
$
|
(3,727
|
)
|
$
|
(3,743
|
)
|
||
|
|
|
|
||||||
Amounts recognized in accumulated other comprehensive income consist of:
|
|
December 31,
|
|||||||
|
|
2017
|
2016
|
||||||
|
Prior service credit
|
$
|
366
|
|
$
|
—
|
|
||
|
Net gain
|
719
|
|
1,163
|
|
||||
|
Gross amount recognized
|
1,085
|
|
1,163
|
|
||||
|
Deferred income taxes
|
(200
|
)
|
(286
|
)
|
||||
|
Net amount recognized
|
$
|
885
|
|
$
|
877
|
|
||
|
|
|
|
||||||
Components of net periodic benefit cost consist of:
|
|
Years ended
December 31, |
|||||||||||
|
|
2017
|
2016
|
2015
|
|||||||||
|
Service cost
|
$
|
21
|
|
$
|
37
|
|
$
|
39
|
|
|||
|
Interest cost
|
174
|
|
151
|
|
57
|
|
||||||
|
Amortization of prior service credit
|
(78
|
)
|
—
|
|
—
|
|
||||||
|
Amortization of net gain
|
(45
|
)
|
(17
|
)
|
—
|
|
||||||
|
Net periodic expense
|
$
|
72
|
|
$
|
171
|
|
$
|
96
|
|
|||
|
|
|
|
||||||||||
The estimated prior service credit for the Company’s retiree health plans that will be amortized from accumulated other comprehensive income into net periodic benefit cost in 2018 is
$78
. The estimated net actuarial gain for the Company’s retiree health plans that will be amortized from accumulated other comprehensive income into net periodic benefit cost in 2018 is
$44
.
F-58
PQ GROUP HOLDINGS INC. AND SUBSIDIARIES
NOTES TO CONSOLIDATED FINANCIAL STATEMENTS
(Dollars in thousands, except share and per share amounts)
Significant weighted average assumptions used in determining the net periodic benefit cost, the postretirement benefit obligations and trend rate include the following:
|
|
December 31,
|
|||
|
|
2017
|
2016
|
||
|
Benefit obligation:
|
|
|
||
|
Discount rate
|
3.53%
|
3.74%
|
||
|
Immediate trend rate
|
6.20%
|
6.84%
|
||
|
Ultimate trend rate
|
4.50%
|
4.50%
|
||
|
Year that the rate reaches ultimate trend rate
|
2037
|
2035
|
||
|
|
December 31,
|
|||||
|
|
2017
|
2016
|
2015
|
|||
|
Benefit cost:
|
|
|
|
|||
|
Discount rate
|
3.74%
|
3.92%
|
4.36%
|
|||
|
Immediate trend rate
|
6.84%
|
7.28%
|
N/A
|
|||
|
Ultimate trend rate
|
4.50%
|
4.50%
|
N/A
|
|||
|
Year that the rate reaches ultimate trend rate
|
2035
|
2035
|
N/A
|
|||
Note that the Eco Services retiree health plan only includes a life insurance and dental component; thus, the trend rate assumptions for 2015 were not applicable. The trend rate assumptions for 2016 and 2017 reflect the acquired PQ Holdings retiree health plans.
A 1% change in the assumed health care cost trend would have increased (decreased) the accumulated postretirement benefit obligation as of
December 31, 2017
and the periodic postretirement benefit cost for the year then ended as follows:
|
|
1% Increase
|
1% Decrease
|
||||||
|
Accumulated postretirement benefit obligation
|
$
|
172
|
|
$
|
(152
|
)
|
||
|
Periodic postretirement benefit cost
|
6
|
|
(5
|
)
|
||||
The Company expects to contribute
$629
to the retiree health plans in 2018.
The following benefit payments, which reflect expected future service, as appropriate, are expected to be paid:
|
Year
|
Amount
|
|||
|
2018
|
$
|
629
|
|
|
|
2019
|
607
|
|
||
|
2020
|
457
|
|
||
|
2021
|
413
|
|
||
|
2022
|
273
|
|
||
|
Years 2023-2027
|
1,015
|
|
||
There are no expected Medicare subsidy receipts expected in future periods.
Certain of the Company’s foreign subsidiaries maintain other postretirement benefit plans that are consistent with statutory practices. These plans are not included in the disclosures above as they are not significant to the Company’s consolidated financial statements.
Defined Contribution Plans
The Company also has defined contribution plans covering domestic employees of the Company and certain subsidiaries. The Company recorded expenses of
$13,103
,
$6,864
and
$1,511
related to these plans for the years ended
December 31, 2017
,
2016
and
2015
, respectively.
F-59
PQ GROUP HOLDINGS INC. AND SUBSIDIARIES
NOTES TO CONSOLIDATED FINANCIAL STATEMENTS
(Dollars in thousands, except share and per share amounts)
20. Earnings per Share:
During the year ended December 31, 2015 to May 4, 2016, the date of the Business Combination, the Company was structured as a single member LLC, with capital contributions from affiliates of CCMP, the Company’s board of managers and management represented by a class of membership units (“Eco Services Class A Units” or “Eco Services membership units”). During this period, Eco Services also granted incentive awards to certain employees, directors and affiliates in the form of Class B Units of Eco Services (the “Eco Services Class B Units”), which provided recipients with the option to purchase Eco Services Class A Units upon the attainment of certain vesting and other restrictions (see
Note 21
to these consolidated financial statements for further information regarding the Company’s equity incentive plans). At the date of the Business Combination, the existing Eco Services Class A Units and legacy PQ Holdings equity were converted to common stock of PQ Group Holdings. None of the Eco Class B Units had been exercised prior to the Business Combination, and all Eco Class B Units converted to common stock options of PQ Group Holdings at the date of the Business Combination (see Note 21).
The weighted average number of common shares outstanding during the period for the computation of basic earnings per share excludes restricted stock awards that have legally been issued but are nonvested during the period, as the sale of these shares is prohibited pending satisfaction of certain vesting conditions by the award recipients in order to earn the rights to the shares (see Note 21 to these consolidated financial statements for further information regarding outstanding nonvested restricted stock awards). Basic earnings per share is calculated as income (loss) available to common stockholders, divided by the weighted average number of common shares outstanding during the period. Diluted earnings per share is calculated as income (loss) available to common stockholders, divided by the weighted average number of common and potential common shares outstanding during the period for each class of common stock, if dilutive. Potential shares reflect unvested restricted stock awards and restricted stock units with service conditions as well as options to purchase common stock, which have been included in the diluted earnings per share calculation using the treasury stock method.
For both the basic and dilutive weighted average shares calculations, as a result of the Business Combination, the number of Eco Services membership units outstanding from January 1, 2016 through May 4, 2016, the date of the Business Combination, as well as for the year ended December 31, 2015, were computed on the basis of the weighted average units outstanding for Eco Services during the respective periods multiplied by the exchange ratio established for common stock as part of the Business Combination.
F-60
PQ GROUP HOLDINGS INC. AND SUBSIDIARIES
NOTES TO CONSOLIDATED FINANCIAL STATEMENTS
(Dollars in thousands, except share and per share amounts)
The reconciliation from basic to diluted weighted average shares outstanding is as follows:
|
Years ended
December 31, |
|||||||||
|
2017
|
2016
|
2015
|
|||||||
|
Weighted average shares outstanding – Basic
|
111,299,670
|
|
78,016,005
|
|
22,615,787
|
|
|||
|
Dilutive effect of unvested common shares with service conditions and assumed stock option exercises and conversions
|
369,367
|
|
—
|
|
—
|
|
|||
|
Weighted average shares outstanding – Diluted
|
111,669,037
|
|
78,016,005
|
|
22,615,787
|
|
|||
Basic and diluted earnings per share are calculated as follows:
|
Years ended
December 31, |
||||||||||||
|
2017
|
2016
|
2015
|
||||||||||
|
Numerator:
|
||||||||||||
|
Net income (loss) attributable to PQ Group Holdings Inc.
|
$
|
57,603
|
|
$
|
(79,746
|
)
|
$
|
11,427
|
|
|||
|
Denominator:
|
||||||||||||
|
Weighted average shares outstanding – Basic
|
111,299,670
|
|
78,016,005
|
|
22,615,787
|
|
||||||
|
Weighted average shares outstanding – Diluted
|
111,669,037
|
|
78,016,005
|
|
22,615,787
|
|
||||||
|
Net income (loss) per share:
|
||||||||||||
|
Basic income (loss) per share
|
$
|
0.52
|
|
$
|
(1.02
|
)
|
$
|
0.51
|
|
|||
|
Diluted income (loss) per share
|
$
|
0.52
|
|
$
|
(1.02
|
)
|
$
|
0.51
|
|
|||
The table below presents the details of the Company’s equity-based awards outstanding at the end of each respective year that were excluded from the calculation of diluted earnings per share:
|
December 31,
|
|||||||||
|
2017
|
2016
|
2015
|
|||||||
|
Restricted stock awards with performance only targets not yet achieved
|
1,769,447
|
|
1,731,522
|
|
—
|
|
|||
|
Stock options with performance only targets not yet achieved
|
586,523
|
|
417,086
|
|
293,150
|
|
|||
|
Anti-dilutive restricted stock awards and restricted stock units
|
—
|
|
751,410
|
|
—
|
|
|||
|
Anti-dilutive stock options
|
621,747
|
|
1,381,352
|
|
1,085,152
|
|
|||
Restricted stock awards and stock options with performance only vesting conditions are not included in the dilution calculation, as the performance targets have not been achieved as of the end of the respective years. Anti-dilutive awards are not included in the dilution calculation, as their inclusion would have the effect of increasing diluted income per share.
21. Stock-Based Compensation:
Eco Services Class B Units
Prior to the Business Combination, the Company recognized stock-based compensation expense for incentive awards issued under the Eco Services Group Holdings Incentive Unit Agreement dated December 29, 2014 (the “Incentive Unit Agreement”). Under the Incentive Unit Agreement, the Company granted Eco Services Class B Units to certain employees, directors and affiliates of the Company. During the year ended December 31, 2015,
14,419
of Eco Services Class B Units were granted on January 13, 2015 at an exercise price of
$1,000
/unit. Immediately prior to the date of the Business Combination on May 4, 2016 and as of December 31, 2015, there were
25,093
of Eco Services Class B Units outstanding.
F-61
PQ GROUP HOLDINGS INC. AND SUBSIDIARIES
NOTES TO CONSOLIDATED FINANCIAL STATEMENTS
(Dollars in thousands, except share and per share amounts)
Of this total,
10,674
Eco Services Class B Units granted to employees (the “Management Awards”) had two vesting criteria, in which
50%
were subject to a service (time-based) vesting condition and
50%
were subject to a performance condition based upon the occurrence of specific liquidity events. The Eco Services Class B Units subject to the service condition vested
25%
annually, with the first annual vesting date of December 1, 2015. The remaining
14,419
of Eco Services Class B Units awarded to directors and affiliates (the “Director Awards”) were subject to a service vesting condition only, consistent with that of the Management Awards. The Eco Services Class B Units did not have a contractually defined maximum term. All of the Eco Services Class B Units were valued using a Black-Scholes option pricing model, and the fair value of an Eco Services Class B Unit was
$448
/unit. The key assumptions used in valuing the Eco Services Class B Units were as follows: expected term of
seven years
, expected volatility of
40.27%
, risk-free interest rate of
2.02%
and expected dividend yield of
0.00%
.
The expected term represents the period of time over which the Eco Services Class B Units were expected to be outstanding prior to exercise or forfeiture. With the limited experience of the Company with respect to historical exercise and forfeiture rates or patterns, the expected term was estimated in the context of the
four
-year service award vesting as well as the timeframe for a liquidity event for the performance awards. The expected volatility was based on the actual stock price volatility of a peer group of companies. The risk-free interest rate was based on U.S. Treasury rates in effect at the time of the grants commensurate with the expected term. There was no dividend yield assumption since the Company has not paid dividends nor does it have an expectation of future dividend payouts.
The following table summarizes the activity of the Eco Services Class B Units during the year ended December 31, 2015 and through May 3, 2016, the date immediately preceding the Business Combination:
|
Number of Units
|
Weighted Average Exercise Price
|
||||||
|
Outstanding at December 31, 2014
|
11,367
|
|
$
|
1,000
|
|
||
|
Granted
|
14,419
|
|
$
|
1,000
|
|
||
|
Forfeited
|
(693
|
)
|
$
|
1,000
|
|
||
|
Outstanding at December 31, 2015 and May 3, 2016
|
25,093
|
|
$
|
1,000
|
|
||
|
Exercisable at December 31, 2015 and May 3, 2016
|
4,939
|
|
$
|
1,000
|
|
||
PQ Group Holdings Awards
In conjunction with the Business Combination, the Company adopted an equity incentive plan, namely the PQ Group Holdings Inc. Stock Incentive Plan (“2016 Plan”). Under the terms of the 2016 Plan, the Company is authorized to issue a total of
8,017,038
shares for common stock awards to employees, directors and affiliates of the Company. Immediately preceding the IPO as of September 30, 2017, awards with respect to
7,644,518
shares of common stock had been issued under the 2016 Plan. In connection with the IPO, the Company’s board of directors adopted the PQ Group Holdings Inc. 2017 Omnibus Incentive Plan (the “2017 Plan”). Subsequent to the IPO, all equity incentive awards will be granted under the 2017 Plan. The number of shares of common stock reserved for issuance under the 2017 Plan is
7,344,000
shares, which amount is increased by the
372,520
shares remaining available for grant under the 2016 Plan as of the 2017 Plan adoption. Shares that become available for issuance pursuant to the 2016 Plan as a result of forfeiture, cancellation or termination for no consideration will be available for future awards under the 2017 Plan. Shares underlying awards granted under the 2017 Plan that are forfeited, canceled, terminated for no consideration, settled in cash or are withheld for exercise, taxes, etc. will not be deemed as delivered and will also be available for future issuance under the 2017 Plan. At
December 31, 2017
,
5,427,526
shares of common stock were available for issuance under the 2017 Plan.
Stock Options
As part of the Business Combination, the
25,093
of outstanding Eco Services Class B Units at the date of the Business Combination were canceled and replaced with
1,378,302
of options to purchase PQ Group Holdings common stock at an exercise price of
$8.04
/share. The Eco Services Class B Units were replaced by common stock options in accordance with a formula to convert such awards, plus a vested cash component. The terms of the new awards were substantially identical to those in effect prior to the Business Combination, except for adjustments to the underlying number of shares (based on the conversion ratio) and the exercise price, which was based on PQ Group Holdings common stock. Additionally, although the Eco Services Class B Units did not have a contractually defined maximum term, the maximum term of the common stock options is
ten years
.
The Company accounted for the cancellation and replacement (including a cash component) as a combination of a modification and a cash settlement. This resulted in no incremental compensation cost recognized at the time of the modification, but led to an acceleration of
$1,174
of previously measured but unrecognized compensation cost.
F-62
PQ GROUP HOLDINGS INC. AND SUBSIDIARIES
NOTES TO CONSOLIDATED FINANCIAL STATEMENTS
(Dollars in thousands, except share and per share amounts)
In addition to the Eco Services Class B Units that were canceled and replaced at the time of the Business Combination, the Company exchanged the outstanding option awards of PQ Holdings for options of PQ Group Holdings in connection with the merger. The terms of the PQ Group Holdings awards were substantially identical to those of the PQ Holdings awards, including the number of underlying shares and vesting conditions, with the exception of an exercise price of
$8.04
/share for the common stock options. There are various vesting conditions associated with the exchanged awards, including satisfaction of certain service and performance based conditions.
Between the date of the Business Combination of May 4, 2016 and December 31, 2017, the Company granted common stock options with either service or performance vesting conditions, all with a maximum contractual term of
ten years
. In connection with the IPO, the Company granted
621,747
of stock options on October 2, 2017, all of which had graded vesting conditions based on service and a maximum contractual term of
ten years
.
The following table summarizes the activity of common stock options for the period from the date of the Business Combination of May 4, 2016 through the year ended
December 31, 2017
, which includes both the Eco Services Class B Units that were canceled and replaced, as well as the PQ Holdings options that were exchanged as part of the Business Combination:
|
Number of Options
|
Weighted Average Exercise Price
|
Weighted Average Remaining Contractual Term (in years)
|
Aggregate Intrinsic Value
(in thousands)
|
||||||||||
|
Granted/assumed on May 4, 2016 in connection with the Business Combination
|
1,738,527
|
|
$
|
7.80
|
|
||||||||
|
Granted
|
538,908
|
|
$
|
8.05
|
|
||||||||
|
Forfeited
|
(478,997
|
)
|
$
|
7.49
|
|
||||||||
|
Outstanding at December 31, 2016
|
1,798,438
|
|
$
|
7.96
|
|
|
|
||||||
|
Granted
|
1,051,496
|
|
$
|
13.70
|
|
|
|
||||||
|
Exercised
|
(32,366
|
)
|
$
|
8.04
|
|
|
|||||||
|
Forfeited
|
(102,398
|
)
|
$
|
7.98
|
|
|
|||||||
|
Outstanding at December 31, 2017
|
2,715,170
|
|
$
|
10.18
|
|
|
|
||||||
|
Vested or expected to vest at December 31, 2017
|
2,064,450
|
|
$
|
10.79
|
|
8.84
|
$
|
12,004
|
|
||||
|
Exercisable at December 31, 2017
|
827,210
|
|
$
|
8.02
|
|
8.34
|
$
|
6,975
|
|
||||
The aggregate intrinsic value per the above table represents the difference between the closing stock price of the Company’s common stock on the last trading day of the reporting period and the exercise price of in-the-money stock options multiplied by the respective number of stock options as of that date. The total intrinsic value of stock options exercised during the year ended
December 31, 2017
and the resulting tax benefit recognized by the Company was not material.
The Company did not receive any cash proceeds from the
exercise of stock options during the year ended
December 31, 2017
,
as the Company withheld
shares
in satisfaction of the exercise price and taxes due.
The fair values of PQ Group Holdings common stock options granted during the years ended
December 31, 2017
and
2016
were determined on the respective grant dates using a Black-Scholes option pricing model with the following weighted-average assumptions:
|
2017
|
2016
|
|||||||
|
Expected term (in years)
|
5.85
|
|
5.00
|
|
||||
|
Expected volatility
|
34.85
|
%
|
45.79
|
%
|
||||
|
Risk-free interest rate
|
2.00
|
%
|
1.54
|
%
|
||||
|
Expected dividend yield
|
0.00
|
%
|
0.00
|
%
|
||||
|
Weighted average grant date fair value of options granted
|
$
|
4.71
|
|
$
|
3.33
|
|
||
F-63
PQ GROUP HOLDINGS INC. AND SUBSIDIARIES
NOTES TO CONSOLIDATED FINANCIAL STATEMENTS
(Dollars in thousands, except share and per share amounts)
With the limited experience of the Company with respect to historical exercise and forfeiture rates or patterns, the expected term for stock option grants in 2016 was estimated in the context of the service award vesting period as well as the timeframe for a liquidity event for the performance awards, along with the ten-year contractual maximum term, while the Company was still privately held. Beginning in 2017, the Company used the simplified method for plain vanilla stock options to estimate the expected term assumption, since the Company lacks sufficient historical exercise data to provide a reasonable basis upon which to estimate the expected term due to the limited period of time its common stock has been publicly traded. The application of the simplified method involves calculating the average of the time-to-vesting period and the total contractual life of the options.
The Company applied a consistent methodology for the remainder of the assumptions in the Black-Scholes option pricing model for stock option grants in both 2016 and 2017. The expected volatility was compared to a range of the actual stock price volatility of a peer group of companies. The risk-free interest rate was based on U.S. Treasury rates in effect at the time of the grant commensurate with the expected term. There was no dividend yield assumption since the Company has not paid dividends nor does it have an expectation of future dividend payouts.
Restricted Stock Awards and Restricted Stock Units
In addition to the exchange of the PQ Holdings options at the date of the Business Combination on May 4, 2016, the Company also exchanged unvested PQ Holdings restricted stock awards for
2,444,070
shares of restricted stock awards of PQ Group Holdings. The restricted stock awards were issued at substantially identical terms to the original PQ Holdings awards, with the exception of a new price ascribed to the shares.
The restricted stock awards were subject to the same vesting requirements as the original awards, which included awards with vesting conditions based on (1) service only, (2) performance only, or (3) a combination of service and performance conditions, dependent on which event occurs first. The vesting requirements for the majority of these awards were based upon the achievement of a performance condition. As defined in the award agreements, each award subject to the performance condition fully vests upon the occurrence of a defined liquidity event upon which certain investment funds affiliated with CCMP receive proceeds exceeding certain thresholds. Although achievement of the performance condition is subject to continued service with the Company, the terms of awards issued with performance conditions stipulate that the performance vesting condition can be attained for a period of six months following separation from service. The same performance vesting condition for the Company’s restricted stock awards also governs the achievement of the performance vesting condition for the Company’s stock options. With the exception of
21,067
of restricted stock awards granted on October 2, 2017 which immediately vested, all of the Company’s restricted stock awards were granted prior to the IPO. As a result, the Company valued restricted stock awards at grant using multiples of EBITDA and the income approach, based on a discounted free cash flow model.
In addition to restricted stock awards, the Company has granted restricted stock units as part of its equity incentive compensation program, all of which were granted on October 2, 2017 in connection with the IPO. The value of the restricted stock unit grants were based on the average of the high and low trading prices of the Company’s common stock on the NYSE on the preceding trading day, based on the Company’s policy for valuing such awards, and have graded vesting conditions based on service.
F-64
PQ GROUP HOLDINGS INC. AND SUBSIDIARIES
NOTES TO CONSOLIDATED FINANCIAL STATEMENTS
(Dollars in thousands, except share and per share amounts)
The following table summarizes the activity of restricted stock awards and restricted stock units for the period from the date of the Business Combination of May 4, 2016 through the year ended
December 31, 2017
, which includes the PQ Holdings restricted stock awards that were exchanged as part of the Business Combination:
|
Restricted Stock Awards
|
Restricted Stock Units
|
|||||||||||||
|
Number of
Shares |
Weighted Average Grant Date Fair Value (per share)
|
Number of
Units |
Weighted Average Grant Date Fair Value (per share)
|
|||||||||||
|
Granted/assumed on May 4, 2016 in connection with the Business Combination
|
2,444,070
|
|
$
|
9.27
|
|
—
|
|
$
|
—
|
|
||||
|
Granted
|
266,955
|
|
$
|
12.32
|
|
—
|
|
$
|
—
|
|
||||
|
Vested
|
(207,915
|
)
|
$
|
12.32
|
|
—
|
|
$
|
—
|
|
||||
|
Forfeited
|
(20,178
|
)
|
$
|
10.52
|
|
—
|
|
$
|
—
|
|
||||
|
Nonvested as of December 31, 2016
|
2,482,932
|
|
$
|
9.34
|
|
—
|
|
$
|
—
|
|
||||
|
Granted
|
51,907
|
|
$
|
16.11
|
|
1,654,690
|
|
$
|
16.97
|
|
||||
|
Vested
|
(187,837
|
)
|
$
|
12.84
|
|
—
|
|
$
|
—
|
|
||||
|
Forfeited
|
(250,365
|
)
|
$
|
12.03
|
|
—
|
|
$
|
—
|
|
||||
|
Nonvested as of December 31, 2017
|
2,096,637
|
|
$
|
8.87
|
|
1,654,690
|
|
$
|
16.97
|
|
||||
Business Combination and Equity Restructuring
The exchange of the PQ Holdings stock options and restricted stock awards for similar awards of PQ Group Holdings in the context of the Business Combination was accounted for as a modification of the awards. As a result, the cost of the replacement awards of PQ Group Holdings represented a combination of both pre- and post-merger services. The amount attributable to services prior to the Business Combination in connection with the modification was
$1,400
, and is considered part of the consideration transferred in the Business Combination (see Note 6 to these consolidated financial statements for further information). The remainder of the cost is attributed to post-merger services and is being recognized over the respective remaining vesting periods.
The Company’s equity restructuring which occurred prior the IPO (see Note 1 to these consolidated financial statements for further information) also constituted an event subject to modification accounting for stock-based compensation awards. However, the change to the equity incentive awards of the Company was designed to preserve the fair value of the awards before and after the reclassification and stock split (based on the existing antidilution provisions of the 2016 Plan), and included the same terms and were classified in the same manner as the equity awards preceding the modification. As a result, no incremental compensation cost was recognized by the Company.
Total Stock-Based Compensation Expense
For the years ended
December 31, 2017
,
2016
and
2015
, total stock-based compensation expense for the Company (inclusive of both the Eco Services Class B Units prior to the Business Combination and the awards replaced or exchanged at the consummation of the Business Combination) was
$8,799
,
$7,029
and
$2,256
, respectively. The income tax benefit recognized in the statements of operations for the years ended
December 31, 2017
and
2016
was
$3,345
and
$2,662
, respectively (there was
no
tax benefit for the year ended December 31, 2015 since the Company was not subject to income taxes).
As of
December 31, 2017
, there was
$3,909
of total unrecognized compensation cost related to nonvested stock options subject to service vesting conditions, which is expected to be recognized over a weighted-average period of
2.32
years. As of
December 31, 2017
, there was
$27,544
of total unrecognized compensation cost related to nonvested restricted stock awards and restricted stock units subject to service vesting conditions, which is expected to be recognized over a weighted-average period of
2.50
years.
No
expense has been recognized for any stock-based compensation awards subject to the performance condition for the years ended
December 31, 2017
,
2016
and
2015
, as the performance-based criteria was not achieved nor considered probable of achievement.
F-65
PQ GROUP HOLDINGS INC. AND SUBSIDIARIES
NOTES TO CONSOLIDATED FINANCIAL STATEMENTS
(Dollars in thousands, except share and per share amounts)
Awards issued with performance conditions vest based on the occurrence of a defined liquidity event upon which certain investment funds affiliated with CCMP receive proceeds exceeding certain thresholds.
All of the Company’s equity incentive awards with performance-based vesting, whether in the form of stock options or restricted stock awards, are subject to achievement of the same performance condition. If an exit event occurs that exceeds the defined threshold, then all performance-based awards of the Company vest
100%
, with no potential for partial vesting or excess achievement. If an exit event or events occur with no further possibility of meeting the defined threshold, then all of the Company’s awards subject to the performance vesting condition will be forfeited. In addition to the defined liquidity event, subsequent to the Company’s IPO, the performance vesting condition can also be achieved if the average closing trading price of the Company’s common stock on the NYSE over any consecutive ten-day trading period equals or exceeds a price that would be equivalent to the achievement of the threshold proceeds to CCMP. Total unrecognized compensation cost related to stock options and restricted stock awards subject to performance vesting conditions only based on the grant date fair value of the respective awards was
$16,472
as of
December 31, 2017
.
22. Commitments and Contingent Liabilities:
Environmental Contingencies
There is a risk of environmental impact in chemical manufacturing operations. The Company’s environmental policies and practices are designed to ensure compliance with existing laws and regulations and to minimize the possibility of significant environmental impact. The Company is also subject to various other lawsuits and claims with respect to matters such as governmental regulations, labor and other actions arising out of the normal course of business. No accrual for these matters currently exists, with the exception of those listed below, because management believes that the liabilities resulting from such lawsuits and claims are not probable or reasonably estimable.
The Company triggered the requirement of New Jersey’s Industrial Site Recovery Act (“ISRA”) statute with the PQ Holdings stock transfer/corporate merger in December 2004. As required under ISRA, a General Information Notice with respect to the Company’s
two
New Jersey locations was filed with the New Jersey Department of Environmental Protection (“NJDEP”) in December 2004 and again in July 2007. Based on an initial review of the facilities by the NJDEP in 2005, the Company estimated that
$500
would be required for contamination assessment and removal work of one specific contaminant (polychlorinated biphenyls) that exceeded applicable NJDEP standards at these facilities, and had recorded a reserve for such amount as of December 31, 2005. During subsequent years, it was determined that additional assessment, removal and remediation work would be required and the reserve was increased to cover the estimated cost of such work. In addition, during this period, work had been performed and the reserve was reduced for actual costs incurred for the assessment and remediation work. Work at the Carlstadt facility has been completed and is closed from an ISRA standpoint, but as of
December 31, 2017
and
2016
, the Company has recorded a reserve of $
842
and $
700
, respectively, for costs required for contamination assessment and removal work at the Rahway facility. There may be additional costs related to the remediation of Rahway, but until further investigation takes place, the Company cannot reasonably estimate the amount of additional liability that may exist.
As part of a Delaware River Basin Commission (“DRBC”) required Pollutant Minimization Plan (“PMP”), in July 2013, the Company’s Chester facility conducted limited paint sampling for polychlorinated biphenyls (“PCBs”). Also, as part of demolition, repair and maintenance projects scheduled for the Company’s Baltimore facility in 2014, the Company conducted limited paint sampling during the fall of 2013 for waste categorization purposes. Paint samples were analyzed for PCB Aroclor 1254, the specific PCB congener commonly used in the manufacture of paint until the late 1970s. The Company’s analytical results indicated that PCB Aroclor 1254 is present in paint on some structures (e.g., piping, structural steel, tanks) in excess of the fifty (50) parts per million (“ppm”) regulatory threshold. Under the Toxic Substances Control Act (“TSCA”), there is no requirement to test in use paint for PCB content. However, once PCB content is identified at concentrations at or above the regulatory threshold, absent specific approval from the U.S. Environmental Protection Agency (“EPA”), the PCB-containing paint is regulated as an unauthorized use of PCBs, and the paint must be addressed. The Company abated painted surfaces that have tested positive for PCBs at levels exceeding 50 ppm at Baltimore in 2015 and early 2016. Similar abatement of painted structures as necessary at Chester have also been substantially completed. Characterization studies to evaluate whether soils have been impacted at Baltimore have been initiated as required under the TSCA, and have yet to commence at Chester. As of
December 31, 2017
and
2016
, the Company has recorded a reserve of $
701
and $
1,048
, respectively, for the remediation costs of PCB impacted soils at the Company’s facilities.
F-66
PQ GROUP HOLDINGS INC. AND SUBSIDIARIES
NOTES TO CONSOLIDATED FINANCIAL STATEMENTS
(Dollars in thousands, except share and per share amounts)
In 2011, the Company installed a Continuous Emissions Monitor (“CEM”) to measure CO, NOx and Opacity emissions from a furnace at the Company’s Chester facility in Pennsylvania, and the Company conducted Relative Accuracy Test Audits (“RATA”) as part of its efforts to certify the CEM. On May 5, 2014, the Pennsylvania Department of Environmental Protection (“PADEP”) officially notified the Company that it was certifying the CEM based on RATA test results dating back to November 2011 and instructed the Company to start entering data previously recorded by the CEM into the Agency’s on-line database. During the third and fourth quarters of 2014, the Company officially entered data recorded from the CEM up until the second quarter of 2013. In November 2015, PADEP issued an Assessment of Civil Penalty in the amount of
$1,739
for alleged violations under the Pennsylvania Air Pollution Control Act during the period from August 11, 2011 through June 30, 2013. The Company appealed, and PADEP reduced the penalty assessment to
$1,550
. As of
December 31, 2016
, the Company has recorded a reserve of
$1,500
associated with the PADEP penalty. After a hearing on the appeal, a Pennsylvania Environmental Hearing Board (“EHB”) judge reduced the penalty assessment to
$215
in September 2017. The PADEP filed a motion to reconsider a portion of the EHB judge’s decision and the EHB denied the PADEP’s motion in October 2017. The Company repaid the
$215
assessment during the year ended
December 31, 2017
.
In 2008, the Company sold the property of a manufacturing facility located in the United States to the local port authority. In 2009, the port authority commissioned an environmental investigation of portions of the property. In 2010, the port authority advised the Company of alleged soil and groundwater contamination on the property and alleged the Company liable for certain conditions. The Company received and reviewed the environmental investigation documentation and determined it may have liability with respect to some, but not all, of the alleged contamination. As of
December 31, 2017
and
2016
, the Company has recorded a reserve of $
837
and $
913
, respectively, for costs related to this potential liability.
The Company has recorded a reserve of $
1,245
and $
1,776
as of
December 31, 2017
and
2016
, respectively, to address remaining subsurface remedial and wetlands/marsh management activities at the Company’s Martinez, CA site. Although currently a sulfuric acid regeneration plant, the site originally was operated by Mountain Copper Company (“Mococo”) as a copper smelter. Also, the site sold iron pyrite to various customers and allowed their customers to deposit waste iron pyrite cinder and slag on the site. The property is adjacent to Peyton Slough, where Mococo had a permitted discharge point from its process. In 1997, the San Francisco Bay Regional Water Quality Control Board (“RWQCB”) required characterization and remediation of Peyton Slough for Copper, Zinc and Acidic Soils. Various remediation activities were undertaken and completed, and the site has received final concurrence from the Army Corps with respect to the completed work. The RWQCB has agreed that Eco Services has achieved the goals for vegetative cover, but the current marsh condition is not sustainable without continued operation of the tide gates. The Company is continuing to work with the RWQCB on a plan to involve the County and work towards development of an alliance for operating, maintaining and funding the tide gates in the future.
As of
December 31, 2017
and
2016
, the Company has recorded a reserve of $
1,220
and $
1,755
, respectively, for subsurface remediation and the Soil Vapor Extraction Project at the Company’s Dominguez, CA site. In the 1980s and 1990s, the EPA and the Los Angeles Regional Water Quality Control Board conducted investigations of the site due to historic chlorinated pesticide and chlorinated solvent use. Soil and groundwater beneath the site were impacted by chlorinated solvents and associated breakdown products, petroleum hydrocarbons, chlorinated pesticides and metals. A Corrective Measures Plan approved in October 2011 requires (1) soil vapor extraction (“SVE”) in affected areas, (2) covering of unpaved areas containing pesticide impacted soil, and (3) annual groundwater monitoring of the perched water-bearing zone. Installation of the SVE unit has been completed and startup has occurred. The California Department of Toxic Substances Control (“DTSC”) has granted conditional approval of the Company’s soil management, and monitoring and maintenance plans. Most recently, the DTSC is requiring the Company to delineate the PCE plume on the eastern boundary of the site. The Company has submitted an action plan to address this matter and is awaiting comments from the DTSC.
F-67
PQ GROUP HOLDINGS INC. AND SUBSIDIARIES
NOTES TO CONSOLIDATED FINANCIAL STATEMENTS
(Dollars in thousands, except share and per share amounts)
Leases
The Company has entered into various lease agreements for the rental of office and plant facilities, railcars, machinery and equipment, substantially all of which are classified as operating leases. Total rent expense under these agreements was
$22,704
,
$16,315
and
$6,096
for the years ended
December 31, 2017
,
2016
and
2015
, respectively.
Total rent due under non-cancelable operating lease commitments as of
December 31, 2017
is:
|
Year
|
Amount
|
|||
|
2018
|
$
|
16,779
|
|
|
|
2019
|
11,992
|
|
||
|
2020
|
9,695
|
|
||
|
2021
|
7,253
|
|
||
|
2022
|
5,145
|
|
||
|
Thereafter
|
12,432
|
|
||
|
$
|
63,296
|
|
||
Purchase Commitments
The Company has entered into short and long-term purchase commitments for various key raw materials and energy requirements. The purchase obligations include agreements to purchase goods that are enforceable and legally binding, and that specify all significant terms. The purchase commitments covered by these agreements are with various suppliers and total approximately
$35,038
as of
December 31, 2017
. Purchases under these agreements are expected to be as follows:
|
Year
|
Amount
|
|||
|
2018
|
$
|
24,113
|
|
|
|
2019
|
2,827
|
|
||
|
2020
|
1,188
|
|
||
|
2021
|
1,186
|
|
||
|
2022
|
1,186
|
|
||
|
Thereafter
|
4,538
|
|
||
|
$
|
35,038
|
|
||
Other
PQ Holdings was previously liable to the seller of a business for potential multi-year UK tax benefits derived from the acquisition. PQ Holdings was contractually obligated to make a payment on an annual basis on its UK taxable results, which fluctuate period-to-period, until there was a change in control, as defined in the purchase agreement. As a result of the Business Combination, a change in control was triggered, and PQ Holdings is no longer liable for additional accruals under the arrangement as of May 4, 2016. At
December 31, 2017
and
2016
, the Company has accrued
$363
and
$1,919
, respectively, for this arrangement, representing the remaining payment owed on the calculation of the liability for the tax years 2016 (through May 4, 2016) and 2015. The Company recorded these expenses as transaction and other related costs in other operating expense, net in the Company’s consolidated statements of operations.
F-68
PQ GROUP HOLDINGS INC. AND SUBSIDIARIES
NOTES TO CONSOLIDATED FINANCIAL STATEMENTS
(Dollars in thousands, except share and per share amounts)
23. Restructuring and Other Related Costs:
The following table presents the components of restructuring and other related costs for the years ended
December 31, 2017
,
2016
and
2015
included in other operating expense, net, in the accompanying consolidated statements of operations:
|
Years ended
December 31, |
||||||||||||
|
2017
|
2016
|
2015
|
||||||||||
|
Severance and other employee costs related to legacy Eco restructuring plan
|
$
|
830
|
|
$
|
5,093
|
|
$
|
3,971
|
|
|||
|
Severance and other employee costs related to Performance Materials plant closure
|
4,711
|
|
—
|
|
—
|
|
||||||
|
Other related costs
|
2,949
|
|
7,537
|
|
176
|
|
||||||
|
$
|
8,490
|
|
$
|
12,630
|
|
$
|
4,147
|
|
||||
Legacy Eco Restructuring Plan
On July 30, 2014, Eco Services, a newly formed Delaware limited liability company and indirect subsidiary of certain investment funds affiliated with CCMP, entered into an Asset Purchase Agreement with Solvay USA, Inc. (“Solvay”), a Delaware corporation, which provided for the sale, transfer and assignment by Solvay and the acquisition, acceptance and assumption by Eco Services, of substantially all of the assets of Solvay’s Eco Services business unit of Solvay’s regeneration and virgin sulfuric acid production business operations in the United States (the “2014 Acquisition”). Prior to the Asset Purchase Agreement with Solvay, Eco Services operated as a business unit within Solvay, which is an indirect, wholly owned subsidiary of Solvay SA.
Subsequent to the 2014 Acquisition, the Company initiated a restructuring plan designed to improve organizational efficiency and streamline the operations of Eco Services as a stand-alone company. The primary impact of the plan to the Company’s consolidated results of operations was the recognition of severance costs related to a reduction-in-force. These costs included benefits payable under ongoing Company severance plan arrangements, whereby payments are attributable to employee services rendered with benefits that accumulate over time. The liabilities and associated charges related to these severance costs are recognized by the Company when payment of the benefits becomes probable and estimable. Charges related to severance costs for the restructuring plan were
$830
,
$5,093
and
$1,293
for the years ended
December 31, 2017
,
2016
and
2015
, respectively.
Additionally, certain one-time costs related to retention bonuses were also recognized as part of the restructuring plan. The Company recognizes costs under one-time benefit arrangements by measuring the liability as of the employee communication date, which is based on the estimated fair value of the liability at the termination date, and recognizing the liability ratably over the required future service period based on the terms of the arrangement. Charges related to one-time costs for the restructuring plan were
$2,678
for the year ended December 31, 2015.
Costs related to the restructuring plan affected employees in the Company’s EC&S segment, although these costs are excluded from the segment’s measure of profitability of Adjusted EBITDA (see
Note 12
to these consolidated financial statements for further information).
Performance Materials Plant Closure
In September 2017, the Company approved and announced a plan to consolidate its manufacturing operations in Europe for the performance materials product group and close its facility in Kirchheimbolanden, Germany. The plan is part of the Company’s overall strategy with respect to the Sovitec acquisition (see
Note 6
to these consolidated financial statements) and the realization of cost and other synergies related to the business combination. The facility will remain in operation over the short term in a reduced capacity, and the Company plans to cease operations at the location on or about March 31, 2018. The Company plans to relocate the manufacturing equipment to other European facilities, and is exploring strategic alternatives for the building and land. As a result, the Company classified the plant under the “held and used” accounting model as of
December 31, 2017
, as it did not meet the criteria to be classified as “held for sale.”
As a result of the decision and announcement regarding the plant, the Company performed an impairment assessment related to the fixed assets of the facility. In conducting the recoverability assessment, the Company compared the carrying value of the asset group that includes the plant to the undiscounted future cash flows of the asset group, noting that there was no indication of impairment. The Company does not anticipate the acceleration of depreciation on the fixed assets associated with the plant, as the Company continues to utilize the assets and ultimately expects to relocate the equipment.
F-69
PQ GROUP HOLDINGS INC. AND SUBSIDIARIES
NOTES TO CONSOLIDATED FINANCIAL STATEMENTS
(Dollars in thousands, except share and per share amounts)
In addition to the fixed asset recoverability evaluation, the Company recorded a severance charge related to the pending closure and other cost reductions for its performance materials product group in Europe of
$4,711
for the year ended
December 31, 2017
. The charge was fully recognized as of
December 31, 2017
based on the types of benefits provided and the criteria for restructuring and exit cost recognition.
Although the Company does not expect to incur additional severance costs related to the closure, the Company will incur additional costs related to the dismantling, transportation and reassembly of the manufacturing equipment after the plant ceases operations, which is currently estimated to be between
$500
and
$1,000
.
Rollforward of Restructuring Liabilities
The activity in the accrued liability balance associated with the Company’s restructuring plans, all of which related to severance and other employee costs, was as follows for the years ended
December 31, 2017
,
2016
and
2015
:
|
Legacy Eco
Restructuring Plan
|
Performance Materials
Plant Closure
|
Total Restructuring
Charges
|
||||||||||
|
Balance at December 31, 2014
|
$
|
247
|
|
$
|
—
|
|
$
|
247
|
|
|||
|
Restructuring charges
|
3,971
|
|
—
|
|
3,971
|
|
||||||
|
Cash payments
|
(2,925
|
)
|
—
|
|
(2,925
|
)
|
||||||
|
Balance at December 31, 2015
|
$
|
1,293
|
|
$
|
—
|
|
$
|
1,293
|
|
|||
|
Restructuring charges
|
5,093
|
|
—
|
|
5,093
|
|
||||||
|
Cash payments
|
(4,743
|
)
|
—
|
|
(4,743
|
)
|
||||||
|
Balance at December 31, 2016
|
$
|
1,643
|
|
$
|
—
|
|
$
|
1,643
|
|
|||
|
Restructuring charges
|
830
|
|
4,711
|
|
5,541
|
|
||||||
|
Cash payments
|
(2,258
|
)
|
(1,588
|
)
|
(3,846
|
)
|
||||||
|
Balance at December 31, 2017
|
$
|
215
|
|
$
|
3,123
|
|
$
|
3,338
|
|
|||
The remaining accrued liability balance associated with the restructuring plans at
December 31, 2017
is expected to be paid in 2018.
Other Related Costs
The Company incurred severance and other business optimization costs of
$2,949
,
$7,537
and
$176
for the years ended
December 31, 2017
,
2016
and
2015
, respectively. These costs were not associated with formal restructuring plans and primarily related to severance charges for certain executives, transition/duplicate staffing, professional fees and other expenses related to the Company’s organizational changes.
24. Relationship with Solvay:
Transition Services Agreement
Concurrent with the consummation of the 2014 Acquisition, Eco Services entered into a transition services agreement with Solvay (the “Transition Services Agreement”), which provided certain transition services by Solvay to Eco Services and from Eco Services to Solvay. The services from Solvay included the provision of information technology services, certain workspace related services, cost accounting services and consulting services, among others. The Transition Services Agreement was terminated as of December 31, 2015. The Company recorded
$4,882
of fees for the transition services provided in selling, general and administrative expenses for the year ended December 31, 2015.
Cross-Services Agreement
In connection with the 2014 Acquisition, Eco Services entered into a Cross-Services Agreement (the “CSA”) with Aroma Performance, a Solvay business unit (“Aroma”), on July 28, 2014. The CSA pertains to Eco Services’ Baton Rouge, LA site. In connection with the CSA, Eco Services (and now the Company) agreed to continue to provide certain services that it historically provided to Aroma when it operated as a component of Solvay, including its well water and process steam requirements, for an initial term of
five years
. Further, Eco Services also agreed to provide Aroma with the use of space, operating machinery and handling of chemicals on the site.
F-70
PQ GROUP HOLDINGS INC. AND SUBSIDIARIES
NOTES TO CONSOLIDATED FINANCIAL STATEMENTS
(Dollars in thousands, except share and per share amounts)
Under the CSA, the Company sells product to Aroma on an ongoing basis. Sales under the CSA totaled
$1,068
,
$1,047
and
$1,272
for the years ended
December 31, 2017
,
2016
and
2015
, respectively. The Company also provides hazardous waste removal services to Aroma under the CSA. Sales related to the hazardous waste removal services were
$1,600
,
$1,615
and
$1,544
for the years ended
December 31, 2017
,
2016
and
2015
, respectively.
The Company incurs certain shared costs, such as electricity, steam, other utility and plant administration costs, all of which are charged to Aroma primarily based on direct usage. The Company charged Aroma
$2,028
,
$2,686
and
$3,745
for such expenses for the years ended
December 31, 2017
,
2016
and
2015
, respectively.
Silica Sales Agreement
In connection with the 2014 Acquisition, Eco Services entered into an agreement (the “Silica Sales Agreement”) with Solvay’s Silica business unit (“Silica”) pursuant to which Eco Services agreed to provide Silica with sulfuric acid produced at its Hammond, IN plant for a term of
five years
, renewing automatically for one year terms thereafter. Eco Services historically provided sulfuric acid to Silica when it operated as a component of Solvay, and the Company continues to sell product to Solvay under the Silica Sales Agreement on an ongoing basis. These sales totaled
$1,666
,
$1,743
and
$1,983
for the years ended
December 31, 2017
,
2016
and
2015
, respectively.
25. Long-term Supply Contract:
As part of Solvay’s 2004 sale of its Specialty Phosphates business, Solvay agreed to continue to supply sulfuric acid to a third party in support of the phosphoric acid production for its specialty phosphates business under a preexisting supply agreement. This non-cancelable agreement extends to 2031, and was assumed by the Company in connection with the 2014 Acquisition.
The liability associated with this supply agreement was recorded at an estimated fair value of
$27,300
in connection with the 2014 Acquisition. The fair value was determined by appraisal, based on the marked up price of the sulfuric acid over the price per the supply agreement, or mark up. The liability was
$22,250
and
$23,888
at
December 31, 2017
and
2016
, respectively, and is being amortized to cost of goods sold over the remaining term of the agreement.
26. Related Party Transactions:
The Company maintains certain policies and procedures for the review, approval and ratification of related party transactions to ensure that all transactions with selected parties are fair, reasonable and in the Company’s best interests. All significant relationships and transactions are separately identified by management if they meet the definition of a related party or a related party transaction. Related party transactions include transactions that occurred during the year, or are currently proposed, in which the Company was or will be a participant, and for which any related person had or will have a direct or indirect material interest. All related party transactions are reviewed, approved and documented by the appropriate level of the Company’s management in accordance with these policies and procedures.
On December 29, 2014, PQ Holdings, CCMP and PQ Corporation entered into a consulting agreement relating to the provision of certain financial and strategic advisory services and consulting services. Similarly, the consulting agreement between PQ Holdings, INEOS Capital Partners and PQ Corporation was amended and restated. Under the new consulting agreements, the Company agreed to pay an annual monitoring fee of
$5,000
distributed to CCMP and INEOS AG equal to the Pro Rata Percentage, as defined, between CCMP and INEOS AG. These consulting agreements were terminated upon completion of the IPO. The Company recorded
$3,777
,
$3,584
and
$590
of management advisory fees in other operating expense, net in the consolidated statements of operations for the years ended
December 31, 2017
,
2016
and
2015
, respectively.
Advisory Services and Monitoring Agreement
Concurrent with the consummation of the 2014 Acquisition, the Company entered into an advisory services and monitoring agreement with CCMP, pursuant to which CCMP provided certain advisory services to the Company. Pursuant to the advisory services and monitoring agreement, CCMP and certain members of the Company’s management and board of managers were paid a one-time fee on the Closing Date of
$8,000
related to the 2014 Acquisition, Senior Secured Credit Facilities and 2022 Notes transactions, and CCMP received (i) an annual advisory fee of
$500
and (ii) reimbursement for reasonable out-of-pocket expenses incurred in connection with the provision of services, including the reasonable fees and disbursements of legal counsel and other advisors retained by CCMP and travel and reasonable out-of-pocket expenses of each director appointed by CCMP to the Company’s board of managers or the board of directors of its affiliates, and of any other representative of CCMP in connection with their provision of such services. The advisory services and monitoring agreement also provided for customary exculpation, indemnification and confidentiality provisions. The one-time management fee was recorded by the Company as an increase to selling, general and administrative expenses.
F-71
PQ GROUP HOLDINGS INC. AND SUBSIDIARIES
NOTES TO CONSOLIDATED FINANCIAL STATEMENTS
(Dollars in thousands, except share and per share amounts)
Effective January 1, 2015, the Company entered into a service agreement with CCMP (the “Services Agreement”) for the provision of services historically provided by Solvay. The services include product information and operations support, manufacturing support, electronic data processing and systems support, employee relations, and financial services. The Company recorded
$1,616
for these services and reimbursable expenses provided under the Service Agreement, which was recorded in selling, general and administrative expenses for the year ended December 31, 2015.
Pursuant to the advisory services and monitoring agreement, the Company agreed to pay certain investors a one-time fee of
$1,600
for services provided related to the 2014 Acquisition. On January 13, 2015, pursuant to a payment direction and subscription agreement, in lieu of the Company paying this fee, these investors agreed to contribute the
$1,600
transaction fee to the capital of Eco Services Group Holdings LLC (“Holdings”). Holdings contributed this fee to Eco Services Intermediate Holdings LLC (“Intermediate Holdings”). Intermediate Holdings in turn contributed this transaction fee to the Company, increasing the Company’s additional paid-in capital by
$1,600
.
Transactions with Management and Board of Managers
For the year ended December 31, 2015, certain members of the Company’s board of managers and management contributed
$1,538
in cash, which was invested directly into Holdings. Holdings contributed these proceeds to Intermediate Holdings. Intermediate Holdings in turn contributed the proceeds to the Company, increasing the Company’s additional paid-in capital by
$1,538
.
Transactions with Board of Directors
In connection with the offering by PQ Corporation of
$525,000
aggregate principal amount of Senior Unsecured Notes due 2022 in May 2016, a member of the Company’s board of directors purchased
$4,000
in principal amount of such notes. Interest accrued on the notes at an annual rate equal to three-month LIBOR plus
10.75%
, with a
1.0%
LIBOR floor, payable and reset quarterly. The director received interest payments in respect of the notes totaling
$362
and
$300
during the years ended
December 31, 2017
and
2016
, respectively. The notes were partially redeemed in October 2017, in connection with the Company’s initial public offering and December 2017, in connection with the Company’s issuance and sale of the
$300,000
Senior Unsecured Notes due 2025 (see
Note 15
). The director received
$4,000
of principal amount of such notes as well as
$338
related to the prepayment penalties in connection with these two transactions.
Joint Venture Agreement
The Company entered into a joint venture agreement (the “ZI Partnership Agreement”) in 1988 with CRI Zeolites Inc., a Royal Dutch Shell plc affiliate, to form Zeolyst International, our 50/50 joint venture partnership (the “Partnership”). Under the terms of the ZI Partnership Agreement, the Partnership leases certain land used in its Kansas City production facilities from PQ Corporation. This lease, which has been recorded as an operating lease, provided for rental payments of
$295
,
$187
and
$0
during the years ended
December 31, 2017
,
2016
and
2015
, respectively. The terms of this lease are evergreen as long as the ZI Partnership Agreement is in place. The Partnership purchases certain of its raw materials from the Company and is charged for various manufacturing costs incurred at the Company’s Kansas City production facility. The amount of these costs charged to the Partnership were
$17,470
,
$10,707
and
$0
for the years ended
December 31, 2017
,
2016
and
2015
, respectively. Certain administrative, marketing, engineering, management-related, and research and development services are provided to the Partnership by the Company. During the years ended
December 31, 2017
,
2016
and
2015
, the Partnership was charged
$12,248
,
$8,169
and
$0
, respectively, for these services. In addition, the Partnership was charged certain product demonstration costs of
$2,175
,
$1,663
and
$0
during the years ended
December 31, 2017
,
2016
and
2015
, respectively.
Other
From time to time, the Company makes sales to portfolio companies of funds that are affiliated with CCMP and companies that are affiliated with INEOS Capital Partners, but these sales are not material.
F-72
PQ GROUP HOLDINGS INC. AND SUBSIDIARIES
NOTES TO CONSOLIDATED FINANCIAL STATEMENTS
(Dollars in thousands, except share and per share amounts)
27. Quarterly Financial Summary (Unaudited):
The following tables summarize the Company’s quarterly financial results during the years ended
December 31, 2017
and
2016
:
|
2017
|
||||||||||||||||
|
First Quarter
|
Second Quarter
|
Third Quarter
|
Fourth Quarter
|
|||||||||||||
|
Sales
|
$
|
332,931
|
|
$
|
389,267
|
|
$
|
391,829
|
|
$
|
358,074
|
|
||||
|
Gross profit
|
82,712
|
|
107,414
|
|
102,559
|
|
84,151
|
|
||||||||
|
Operating income
|
37,915
|
|
55,149
|
|
46,558
|
|
27,882
|
|
||||||||
|
Net income (loss)
|
(2,315
|
)
|
(1,670
|
)
|
(3,016
|
)
|
65,564
|
|
||||||||
|
Net income (loss) attributable to PQ Group Holdings Inc.
|
(2,454
|
)
|
(1,609
|
)
|
(3,345
|
)
|
65,011
|
|
||||||||
|
Net income (loss) per common share:
|
||||||||||||||||
|
Basic income (loss) per share
|
$
|
(0.02
|
)
|
$
|
(0.02
|
)
|
$
|
(0.03
|
)
|
$
|
0.49
|
|
||||
|
Diluted income (loss) per share
|
$
|
(0.02
|
)
|
$
|
(0.02
|
)
|
$
|
(0.03
|
)
|
$
|
0.49
|
|
||||
|
Weighted average shares outstanding:
|
||||||||||||||||
|
Basic
|
103,947,888
|
|
104,015,815
|
|
104,096,837
|
|
133,138,140
|
|
||||||||
|
Diluted
|
103,947,888
|
|
104,015,815
|
|
104,096,837
|
|
133,895,646
|
|
||||||||
|
2016
|
||||||||||||||||
|
First Quarter
|
Second Quarter
|
Third Quarter
|
Fourth Quarter
|
|||||||||||||
|
Sales
|
$
|
93,913
|
|
$
|
277,554
|
|
$
|
369,979
|
|
$
|
322,731
|
|
||||
|
Gross profit
|
26,101
|
|
62,298
|
|
95,299
|
|
70,394
|
|
||||||||
|
Operating income
|
8,048
|
|
16,749
|
|
44,254
|
|
15,139
|
|
||||||||
|
Net income (loss)
|
(3,131
|
)
|
(76,948
|
)
|
(9,606
|
)
|
10,527
|
|
||||||||
|
Net income (loss) attributable to PQ Group Holdings Inc.
|
(3,131
|
)
|
(77,262
|
)
|
(10,017
|
)
|
10,664
|
|
||||||||
|
Net income (loss) per common share:
|
||||||||||||||||
|
Basic loss per share
|
$
|
(0.14
|
)
|
$
|
(0.99
|
)
|
$
|
(0.10
|
)
|
$
|
0.10
|
|
||||
|
Diluted loss per share
|
$
|
(0.14
|
)
|
$
|
(0.99
|
)
|
$
|
(0.10
|
)
|
$
|
0.10
|
|
||||
|
Weighted average shares outstanding:
|
||||||||||||||||
|
Basic
|
22,694,161
|
|
77,842,216
|
|
103,783,719
|
|
103,947,888
|
|
||||||||
|
Diluted
|
22,694,161
|
|
77,842,216
|
|
103,783,719
|
|
103,947,888
|
|
||||||||
F-73
PQ GROUP HOLDINGS INC. AND SUBSIDIARIES
NOTES TO CONSOLIDATED FINANCIAL STATEMENTS
(Dollars in thousands, except share and per share amounts)
28. Supplemental Cash Flow Information:
The following table presents supplemental cash flow information for the Company:
|
Years ended December 31,
|
||||||||||||
|
2017
|
2016
|
2015
|
||||||||||
|
Cash paid during the year for:
|
||||||||||||
|
Income taxes
|
$
|
29,199
|
|
.
|
$
|
16,981
|
|
$
|
8
|
|
||
|
Interest
|
170,131
|
|
132,579
|
|
44,074
|
|
||||||
|
Non-cash investing activity:
|
||||||||||||
|
Capital expenditures acquired on account but unpaid as of the period end
|
18,762
|
|
18,161
|
|
624
|
|
||||||
|
Non-cash financing activities:
|
||||||||||||
|
Equity consideration for the Business Combination (Note 6)
|
—
|
|
910,800
|
|
—
|
|
||||||
|
Debt assumed in the Business Combination (Note 6)
|
—
|
|
22,911
|
|
—
|
|
||||||
|
Debt assumed in the Acquisition (Note 7)
|
16,609
|
|
—
|
|
—
|
|
||||||
|
Non-cash equity contribution (Note 26)
|
—
|
|
—
|
|
1,600
|
|
||||||
The Company also issued
12,063
shares of common stock in satisfaction of the exercise of
32,366
common stock options originally issued under the Company’s equity incentive plan during the year ended
December 31, 2017
.
The Company did not receive any cash proceeds from the
transaction,
as the Company withheld
20,303
of the shares covered by the options
in satisfaction of the exercise price and taxes due.
29. Subsequent Events:
On February 8, 2018 (the “Closing Date”), PQ Corporation (the “Borrower”), an indirect, wholly owned subsidiary of the Company, refinanced its existing senior secured term loan facility with a new
$1,267,000
senior secured term loan facility (the “New Term Loan Facility”) by entering into a third amendment agreement (the “Amendment”), which amended and restated the Term Loan Credit Agreement dated as of May 4, 2016, among the Borrower, CPQ Midco I Corporation, the guarantors identified therein, Citibank, N.A., as an additional term lender, Credit Suisse AG, Cayman Island Branch, as administrative agent and collateral agent, and the lenders and the other parties party thereto from time to time (as amended prior to the Amendment, the “Existing Credit Agreement” and as amended and restated by the Amendment, the “New Credit Agreement”).
The New Term Facility bears interest at a floating rate of LIBOR (with a
zero
percent minimum LIBOR floor) plus
2.50 percent
per annum and matures in February 2025, effectively lowering the interest rate margin and extending the maturity of its senior secured term loan facility. The New Term Loan Facility requires scheduled quarterly amortization payments, each equal to
0.25%
of the original principal amount of the loans under the New Term Loan Facility. Voluntary prepayments of the New Term Loan Facility in connection with a Repricing Transaction, as defined in the New Credit Agreement, on or prior to six months after the Closing Date will be subject to a call premium of
1.0%
. Otherwise, outstanding loans under the New Term Loan Facility may be voluntarily prepaid at any time without premium or penalty. In addition, the New Credit Agreement contains customary mandatory prepayments, affirmative and negative covenants and events of default, all of which are substantially the same as under the Existing Credit Agreement.
On the Closing Date, the Borrower also entered into multiple cross currency swap arrangements to hedge foreign currency risk. With an aggregate notional amount of approximately
$342,561
, the swaps are designed to enable the Borrower to effectively convert a portion of its fixed-rate U.S. dollar denominated debt obligations into approximately
€280,000
equivalent. The swaps are expected to mature in February 2023.
The Company has evaluated subsequent events since the balance sheet date and determined that, other than the items noted above, there are no additional items to disclose.
F-74
SCHEDULE I
PQ GROUP HOLDINGS INC. AND SUBSIDIARIES (PARENT)
CONDENSED FINANCIAL INFORMATION
CONDENSED STATEMENTS OF OPERATIONS
(in thousands)
|
Years ended
December 31, |
|||||||
|
2017
|
2016
|
||||||
|
Stock compensation expense
|
$
|
8,799
|
|
$
|
7,029
|
|
|
|
Equity in income (loss) of subsidiaries
|
66,402
|
|
(72,717
|
)
|
|||
|
Net income (loss)
|
57,603
|
|
(79,746
|
)
|
|||
|
Other comprehensive income (loss), net of tax:
|
|||||||
|
Pension and postretirement benefits
|
(101
|
)
|
6,865
|
|
|||
|
Net (loss) gain from hedging activities
|
(3,590
|
)
|
4,557
|
|
|||
|
Foreign currency translation
|
61,713
|
|
(65,781
|
)
|
|||
|
Total other comprehensive income (loss)
|
58,022
|
|
(54,359
|
)
|
|||
|
Comprehensive income (loss)
|
$
|
115,625
|
|
$
|
(134,105
|
)
|
|
See accompanying notes to condensed financial statements.
F-75
SCHEDULE I
PQ GROUP HOLDINGS INC. AND SUBSIDIARIES (PARENT)
CONDENSED FINANCIAL INFORMATION
CONDENSED BALANCE SHEETS
(in thousands, except share and per share amounts)
|
December 31, 2017
|
December 31, 2016
|
||||||
|
ASSETS
|
|||||||
|
Total current assets
|
$
|
—
|
|
$
|
—
|
|
|
|
Investment in subsidiaries
|
1,628,000
|
|
1,022,880
|
|
|||
|
Total assets
|
$
|
1,628,000
|
|
$
|
1,022,880
|
|
|
|
LIABILITIES
|
|||||||
|
Total current liabilities
|
$
|
—
|
|
$
|
—
|
|
|
|
Total liabilities
|
—
|
|
—
|
|
|||
|
STOCKHOLDERS' EQUITY
|
|||||||
|
Common stock ($0.01 par); authorized shares 450,000,000; issued shares 135,244,379 and 106,452,330 on December 31, 2017 and December 31, 2016, respectively; outstanding shares 135,244,379 and 106,430,811 on December 31, 2017 and December 31, 2016, respectively
|
1,352
|
|
73
|
|
|||
|
Preferred stock ($0.01 par); authorized shares 50,000,000; no shares issued or outstanding on December 31, 2017 and December 31, 2016
|
—
|
|
—
|
|
|||
|
Additional paid-in capital
|
1,655,114
|
|
1,167,137
|
|
|||
|
Accumulated deficit
|
(32,327
|
)
|
(90,380
|
)
|
|||
|
Treasury stock, at cost; shares 21,519 on December 31, 2016
|
—
|
|
(239
|
)
|
|||
|
Accumulated other comprehensive income (loss)
|
4,311
|
|
(53,711
|
)
|
|||
|
Total PQ Group Holdings Inc. equity
|
1,628,000
|
|
1,022,880
|
|
|||
|
Total liabilities and equity
|
$
|
1,628,000
|
|
$
|
1,022,880
|
|
|
See accompanying notes to condensed financial statements.
F-76
SCHEDULE I
PQ GROUP HOLDINGS INC. AND SUBSIDIARIES (PARENT)
CONDENSED FINANCIAL INFORMATION
CONDENSED STATEMENTS OF CASH FLOWS
(in thousands)
|
Years ended
December 31, |
|||||||
|
2017
|
2016
|
||||||
|
Cash flows from operating activities:
|
|||||||
|
Net income (loss)
|
$
|
57,603
|
|
$
|
(79,746
|
)
|
|
|
Adjustments to reconcile net income (loss) to net cash provided by operating activities:
|
|||||||
|
Equity in net (income) loss from subsidiaries
|
(66,402
|
)
|
72,717
|
|
|||
|
Stock compensation expense
|
8,799
|
|
7,029
|
|
|||
|
Net cash provided by operating activities
|
—
|
|
—
|
|
|||
|
Cash flows from investing activities:
|
|||||||
|
Investment in subsidiaries
|
(480,696
|
)
|
—
|
|
|||
|
Net cash used in investing activities
|
(480,696
|
)
|
—
|
|
|||
|
Cash flows from financing activities:
|
|||||||
|
IPO proceeds
|
507,500
|
|
—
|
|
|||
|
IPO costs
|
(26,804
|
)
|
—
|
|
|||
|
Net cash provided by financing activities
|
480,696
|
|
—
|
|
|||
|
Effect of exchange rate changes on cash and cash equivalents
|
—
|
|
—
|
|
|||
|
Net change in cash and cash equivalents
|
—
|
|
—
|
|
|||
|
Cash and cash equivalents at beginning of period
|
—
|
|
—
|
|
|||
|
Cash and cash equivalents at end of period
|
$
|
—
|
|
$
|
—
|
|
|
See accompanying notes to condensed financial statements.
F-77
SCHEDULE I
PQ GROUP HOLDINGS INC. AND SUBSIDIARIES (PARENT)
CONDENSED FINANCIAL INFORMATION
NOTES TO CONDENSED SCHEDULE I
1. Description of PQ Group Holdings Inc. and Subsidiaries
On August 17, 2015,
PQ Holdings Inc. (“PQ Holdings”), Eco Services Operations LLC (“Eco Services”), certain investment funds affiliated with CCMP Capital Advisors, LLC (now known as CCMP Capital Advisors, LP; “CCMP”), and stockholders of PQ Holdings and Eco Services entered into a reorganization and transaction agreement pursuant to which the companies consummated a series of transactions to reorganize and combine the businesses of PQ Holdings and Eco Services (the “Business Combination”), under a new holding company, PQ Group Holdings Inc.
(“PQ Group Holdings” or the “Parent Company”).
The Business Combination was consummated on May 4, 2016.
In accordance with accounting principles generally accepted in the United States (“GAAP”), Eco Services is the accounting predecessor to PQ Group Holdings. Certain investment funds affiliated with CCMP held a controlling interest position in Eco Services prior to the Business Combination. In addition, certain investment funds affiliated with CCMP owned a non-controlling interest in PQ Holdings prior to the Business Combination and the merger with Eco Services constituted a change in control under the PQ Holdings credit agreements and bond indenture that were in place at the time of the Business Combination. Therefore, Eco Services is deemed to be the accounting acquirer. These
Parent Company condensed
financial statements are the continuation of Eco Services’ business prior to the Business Combination.
PQ Group Holdings is a holding company that conducts substantially all of its business operations through its wholly owned subsidiary, PQ Corporation. As specified in certain of PQ Corporation’s debt agreements entered into concurrently with the Business Combination, there are restrictions on the ability of PQ Corporation to make payments to its stockholder, PQ Group Holdings, on behalf of their equity interests (refer to
Note 15
to the PQ Group Holdings consolidated financial statements for further information regarding PQ Corporation debt).
2. Basis of Presentation
The accompanying condensed Parent Company financial statements are required in accordance with Rule 4-08(e)(3) of Regulation S-X. These condensed financial statements have been presented on a “parent-only” basis. Under a parent-only presentation, the Parent Company’s investment in its consolidated subsidiary is presented under the equity method of accounting. Under the equity method, the investment in subsidiary is stated at cost plus contributions and equity in undistributed income (loss) of the subsidiary, less distributions received since the date of acquisition. For purposes of presenting net income, this presentation assumes that the Parent Company was in existence for the full year ended December 31, 2016, the year of the Business Combination. These parent-only financial statements should be read in conjunction with PQ Group Holdings’ audited consolidated financial statements.
3. Stock-Based Compensation
Refer to
Note 21
of the notes to the PQ Group Holdings consolidated financial statements for a description of stock-based compensation.
4. Common Stock
Refer to
Note 20
of the notes to the PQ Group Holdings consolidated financial statements for a description of common stock.
F-78
Report of Independent Auditors
To the Management Committee of Zeolyst International:
We have audited the accompanying financial statements of Zeolyst International (the “Partnership”), which comprise the balance sheets as of
December 31, 2017
and
2016
, and the related statements of operations and accumulated earnings, changes in partners’ capital, and cash flows for the three years in the period ended
December 31, 2017
.
Management's Responsibility for the
Financial Statements
Management is responsible for the preparation and fair presentation of the financial statements in accordance with accounting principles generally accepted in the United States of America; this includes the design, implementation, and maintenance of internal control relevant to the preparation and fair presentation of financial statements that are free from material misstatement, whether due to fraud or error.
Auditors’ Responsibility
Our responsibility is to express an opinion on the financial statements based on our audits. We conducted our audits in accordance with auditing standards generally accepted in the United States of America. Those standards require that we plan and perform the audit to obtain reasonable assurance about whether the financial statements are free from material misstatement.
An audit involves performing procedures to obtain audit evidence about the amounts and disclosures in the financial statements. The procedures selected depend on our judgment, including the assessment of the risks of material misstatement of the financial statements, whether due to fraud or error. In making those risk assessments, we consider internal control relevant to the Company's preparation and fair presentation of the financial statements in order to design audit procedures that are appropriate in the circumstances, but not for the purpose of expressing an opinion on the effectiveness of the Company's internal control. Accordingly, we express no such opinion. An audit also includes evaluating the appropriateness of accounting policies used and the reasonableness of significant accounting estimates made by management, as well as evaluating the overall presentation of the financial statements. We believe that the audit evidence we have obtained is sufficient and appropriate to provide a basis for our audit opinion.
Opinion
In our opinion, the financial statements referred to above present fairly, in all material respects, the financial position of Zeolyst International as of
December 31, 2017
and
2016
, and the results of its operations and its cash flows for each of the three years in the period ended
December 31, 2017
in accordance with accounting principles generally accepted in the United States of America.
Emphasis of Matter
As discussed within Footnote 13 to the financial statements, the Partnership has significant related party transactions. Our opinion is not modified with respect to this matter.
/s/ PricewaterhouseCoopers LLP
Philadelphia, Pennsylvania
March 22, 2018
F-79
ZEOLYST INTERNATIONAL
BALANCE SHEETS
(in thousands)
|
December 31, 2017
|
December 31, 2016
|
||||||
|
ASSETS
|
|||||||
|
Cash
|
$
|
13,304
|
|
$
|
3,580
|
|
|
|
Trade receivables, net:
|
|||||||
|
Receivables from third parties
|
25,302
|
|
31,836
|
|
|||
|
Receivables from affiliates
|
43,837
|
|
46,891
|
|
|||
|
Non-trade receivables from affiliates
|
2,475
|
|
7,250
|
|
|||
|
Inventories
|
98,438
|
|
98,186
|
|
|||
|
Other current assets
|
290
|
|
1,328
|
|
|||
|
Total current assets
|
183,646
|
|
189,071
|
|
|||
|
Property, plant and equipment, net
|
132,258
|
|
132,645
|
|
|||
|
Intangible assets
|
6,067
|
|
—
|
|
|||
|
Other long-term assets
|
1,125
|
|
4,108
|
|
|||
|
Total assets
|
$
|
323,096
|
|
$
|
325,824
|
|
|
|
LIABILITIES
|
|||||||
|
Trade accounts payable
|
$
|
9,095
|
|
$
|
8,585
|
|
|
|
Accounts payable to affiliates
|
10,022
|
|
14,005
|
|
|||
|
Other current liabilities
|
4,873
|
|
8,668
|
|
|||
|
Total current liabilities
|
23,990
|
|
31,258
|
|
|||
|
Other long-term liabilities
|
1,436
|
|
1,400
|
|
|||
|
Total liabilities
|
25,426
|
|
32,658
|
|
|||
|
Commitments and contingencies (note 12)
|
|||||||
|
PARTNERS’ CAPITAL
|
|||||||
|
Contributed capital
|
54,930
|
|
54,930
|
|
|||
|
Accumulated earnings
|
242,740
|
|
238,236
|
|
|||
|
Net partners’ capital
|
297,670
|
|
293,166
|
|
|||
|
Total liabilities and partners' capital
|
$
|
323,096
|
|
$
|
325,824
|
|
|
See accompanying notes to financial statements.
F-80
ZEOLYST INTERNATIONAL
STATEMENTS OF OPERATIONS AND ACCUMULATED EARNINGS
(in thousands)
|
Years ended
December 31, |
|||||||||||
|
2017
|
2016
|
2015
|
|||||||||
|
Net sales
|
$
|
178,751
|
|
$
|
168,875
|
|
$
|
170,649
|
|
||
|
Related party sales
|
108,798
|
|
93,655
|
|
148,986
|
|
|||||
|
Total net sales
|
287,549
|
|
262,530
|
|
319,635
|
|
|||||
|
Cost of goods sold
|
75,597
|
|
63,591
|
|
97,995
|
|
|||||
|
Related party cost of goods sold
|
80,992
|
|
78,316
|
|
89,389
|
|
|||||
|
Total cost of goods sold
|
156,589
|
|
141,907
|
|
187,384
|
|
|||||
|
Gross profit
|
130,960
|
|
120,623
|
|
132,251
|
|
|||||
|
Selling, general and administrative expenses (SG&A)
|
5,777
|
|
3,069
|
|
4,510
|
|
|||||
|
Related party SG&A
|
31,744
|
|
34,018
|
|
31,475
|
|
|||||
|
Operating income
|
93,439
|
|
83,536
|
|
96,266
|
|
|||||
|
Interest expense, net
|
105
|
|
169
|
|
281
|
|
|||||
|
Other expense, net
|
830
|
|
505
|
|
2,553
|
|
|||||
|
Net income
|
92,504
|
|
82,862
|
|
93,432
|
|
|||||
|
Accumulated earnings at beginning of year
|
238,236
|
|
180,374
|
|
146,942
|
|
|||||
|
Dividends paid
|
(88,000
|
)
|
(25,000
|
)
|
(60,000
|
)
|
|||||
|
Accumulated earnings at end of year
|
$
|
242,740
|
|
$
|
238,236
|
|
$
|
180,374
|
|
||
See accompanying notes to financial statements.
F-81
ZEOLYST INTERNATIONAL
STATEMENTS OF CHANGES IN PARTNERS’ CAPITAL
(in thousands)
|
Contributed capital
|
Accumulated earnings
|
Net partners' capital
|
|||||||||
|
PQ Corporation:
|
|||||||||||
|
Balance, December 31, 2014
|
$
|
27,465
|
|
$
|
73,471
|
|
$
|
100,936
|
|
||
|
Dividends paid
|
(30,000
|
)
|
(30,000
|
)
|
|||||||
|
Net income
|
46,716
|
|
46,716
|
|
|||||||
|
Balance, December 31, 2015
|
$
|
27,465
|
|
$
|
90,187
|
|
$
|
117,652
|
|
||
|
Dividends paid
|
(12,500
|
)
|
(12,500
|
)
|
|||||||
|
Net income
|
41,431
|
|
41,431
|
|
|||||||
|
Balance, December 31, 2016
|
$
|
27,465
|
|
$
|
119,118
|
|
$
|
146,583
|
|
||
|
Dividends paid
|
(44,000
|
)
|
(44,000
|
)
|
|||||||
|
Net income
|
46,252
|
|
46,252
|
|
|||||||
|
Balance, December 31, 2017
|
27,465
|
|
$
|
121,370
|
|
$
|
148,835
|
|
|||
|
CRI Zeolites, Inc.:
|
|||||||||||
|
Balance, December 31, 2014
|
$
|
27,465
|
|
$
|
73,471
|
|
$
|
100,936
|
|
||
|
Dividends paid
|
(30,000
|
)
|
(30,000
|
)
|
|||||||
|
Net income
|
46,716
|
|
46,716
|
|
|||||||
|
Balance, December 31, 2015
|
$
|
27,465
|
|
$
|
90,187
|
|
$
|
117,652
|
|
||
|
Dividends paid
|
(12,500
|
)
|
(12,500
|
)
|
|||||||
|
Net income
|
41,431
|
|
41,431
|
|
|||||||
|
Balance, December 31, 2016
|
$
|
27,465
|
|
$
|
119,118
|
|
$
|
146,583
|
|
||
|
Dividends paid
|
(44,000
|
)
|
(44,000
|
)
|
|||||||
|
Net income
|
46,252
|
|
46,252
|
|
|||||||
|
Balance, December 31, 2017
|
$
|
27,465
|
|
$
|
121,370
|
|
$
|
148,835
|
|
||
|
Total partners' capital at December 31, 2014
|
$
|
54,930
|
|
$
|
146,942
|
|
$
|
201,872
|
|
||
|
Total partners' capital at December 31, 2015
|
$
|
54,930
|
|
$
|
180,374
|
|
$
|
235,304
|
|
||
|
Total partners' capital at December 31, 2016
|
$
|
54,930
|
|
$
|
238,236
|
|
$
|
293,166
|
|
||
|
Total partners' capital at December 31, 2017
|
$
|
54,930
|
|
$
|
242,740
|
|
$
|
297,670
|
|
||
See accompanying notes to financial statements.
F-82
ZEOLYST INTERNATIONAL
STATEMENTS OF CASH FLOWS
(in thousands)
|
Years ended
December 31, |
|||||||||||
|
2017
|
2016
|
2015
|
|||||||||
|
Cash flows from operating activities:
|
|||||||||||
|
Net income
|
$
|
92,504
|
|
$
|
82,862
|
|
$
|
93,432
|
|
||
|
Adjustments to reconcile net income to net cash provided by operating activities
|
|||||||||||
|
Depreciation and amortization
|
14,260
|
|
13,066
|
|
10,294
|
|
|||||
|
Loss on sale or disposal of capital assets
|
178
|
|
26
|
|
—
|
|
|||||
|
Impairment of cost investment
|
3,000
|
|
—
|
|
—
|
|
|||||
|
Net change in returns allowance
|
88
|
|
(445
|
)
|
17
|
|
|||||
|
Net change in inventory reserve
|
867
|
|
—
|
|
9
|
|
|||||
|
Working capital changes that provided (used) cash:
|
|||||||||||
|
Receivables, including affiliates
|
14,275
|
|
(16,589
|
)
|
(26,372
|
)
|
|||||
|
Inventories
|
(1,119
|
)
|
(14,726
|
)
|
16,384
|
|
|||||
|
Other current assets
|
1,038
|
|
219
|
|
(243
|
)
|
|||||
|
Accounts payable, including affiliates
|
(7,377
|
)
|
4,263
|
|
(4,095
|
)
|
|||||
|
Other current liabilities
|
(3,795
|
)
|
(3,669
|
)
|
4,025
|
|
|||||
|
Other long-term liabilities
|
—
|
|
(952
|
)
|
522
|
|
|||||
|
Other long-term assets
|
(230
|
)
|
—
|
|
—
|
|
|||||
|
Net cash provided by operating activities
|
113,689
|
|
64,055
|
|
93,973
|
|
|||||
|
Cash flows from investing activities:
|
|||||||||||
|
Purchases of property, plant and equipment
|
(9,465
|
)
|
(23,982
|
)
|
(18,619
|
)
|
|||||
|
Purchase of license
|
(6,500
|
)
|
—
|
|
—
|
|
|||||
|
Investment, at cost
|
—
|
|
—
|
|
(3,000
|
)
|
|||||
|
Net cash used for investing activities
|
(15,965
|
)
|
(23,982
|
)
|
(21,619
|
)
|
|||||
|
Cash flows from financing activities:
|
|||||||||||
|
Proceeds from line of credit
|
5,000
|
|
31,142
|
|
78,000
|
|
|||||
|
Payments on line of credit
|
(5,000
|
)
|
(46,142
|
)
|
(87,000
|
)
|
|||||
|
Payments of cash dividends
|
(88,000
|
)
|
(25,000
|
)
|
(60,000
|
)
|
|||||
|
Net cash used for financing activities
|
(88,000
|
)
|
(40,000
|
)
|
(69,000
|
)
|
|||||
|
Net change in cash
|
9,724
|
|
73
|
|
3,354
|
|
|||||
|
Cash at beginning of period
|
3,580
|
|
3,507
|
|
153
|
|
|||||
|
Cash at end of period
|
$
|
13,304
|
|
$
|
3,580
|
|
$
|
3,507
|
|
||
|
Non-cash investing activity:
|
|||||||||||
|
Capital expenditures acquired on account but unpaid
|
$
|
3,904
|
|
$
|
3,173
|
|
$
|
2,604
|
|
||
See accompanying notes to financial statements.
F-83
ZEOLYST INTERNATIONAL
NOTES TO FINANCIAL STATEMENTS
(in thousands)
1. Organization:
Zeolyst International, a General Partnership (“Partnership”) was formed in 1988 pursuant to a Joint Venture Agreement (“the Agreement”) between PQ Corporation (“PQ”) and CRI Zeolites (“CRI”), a Royal Dutch Shell affiliate (collectively, the “Partners”). The percentage interests as of
December 31, 2017
and
2016
are as follows:
|
PQ
|
50%
|
|
CRI
|
50%
|
The Partnership was formed pursuant to the Kansas Uniform Partnership Act. The Agreement specifies that the partners share equally in capital contributions. The Agreement states that the profits and losses of the Partnership will be allocated in accordance with the partners’ interests in the Partnership. The intent of the Partnership is to develop, manufacture, and sell zeolites and zeolite-containing catalysts.
The Partnership has significant transactions with its partners and related affiliates. Refer to the Related Party Transactions footnote for further disclosure.
2. Partnership Business:
The Partnership manufactures zeolites and zeolytic catalysts that are used by refiners to capture impurities in the processing of petroleum and other chemicals. The filtration ability of zeolites placed into a customer’s chemical process generally extends two to three years. As a result, a significant portion of the Partnership’s customer base tends to change on an annual basis. A significant percentage of the base materials purchased for the Partnership’s manufacturing process is acquired from related parties. In addition, a significant portion of the Partnership’s sales is transacted through Criterion Catalyst Company (“Criterion”) which is a subsidiary of CRI. The Partnership compensates Criterion with a 2% sales commission on specific sales transactions.
3. Summary of Significant Accounting Policies:
These financial statements have been prepared in accordance with generally accepted accounting principles. These financial statements are accounted for on a historical cost basis and do not reflect the results of any purchase accounting adjustments recorded in the Partner’s consolidated financial statements.
Cash and Cash Equivalents.
Cash and cash equivalents include investments with original terms to maturity of 90 days or less from the time of purchase.
Trade Accounts Receivables and Allowance for Doubtful Accounts:
Trade accounts receivables are recorded at the invoiced amount and do not bear interest. The Partnership maintains allowances for doubtful accounts for estimated losses resulting from the inability of its customers to make required payments. Allowances for doubtful accounts are based on historical experience and known factors regarding specific customers. If the financial condition of the Partnership’s customers were to deteriorate, resulting in an impairment of their ability to make payments, additional allowances would be required. Account balances are charged off against the allowance when it is probable the receivable will not be recovered.
Inventories:
Inventories are stated at the lower of cost or market, valued on the first-in, first-out (“FIFO”) method. The Partnership establishes reserves for slow-moving and obsolete inventory.
Property, Plant and Equipment:
Property, plant, and equipment are carried at cost and include expenditures for new facilities and major renewals and betterments. Interest is capitalized on capital projects as applicable. Maintenance, repairs and minor renewals are charged to expense as incurred. When assets are sold or otherwise disposed of, the related cost and accumulated depreciation are removed from the accounts, and any resulting gain or loss is included in the results of operations.
Depreciation is generally provided on the straight-line method based on estimated useful lives of the assets, ranging up to 33 years for buildings and improvements, 10 years for machinery and equipment.
We perform an impairment review of property, plant and equipment and other long-lived assets when events and circumstances indicate that those assets may be impaired by comparing the carrying amount of the assets to their fair value. Fair value is determined using quoted market prices where available, or other techniques including discounted cash flows. The Partnership’s estimates of future cash flows involve assumptions concerning future operating performance, economic conditions, and technological changes that may affect the future useful lives of the assets.
F-84
ZEOLYST INTERNATIONAL
NOTES TO FINANCIAL STATEMENTS
(in thousands)
Intangibles and Other Long-term Assets:
Other long-term assets primarily include investments, at cost and spare parts. On May 10, 2017, the Partnership made a $6,500 strategic investment for license of materials-based solutions for catalytic and separations processes. The investment is accounted for under the cost method of accounting. In December 2017, the Partnership wrote down a $3,000 investment in a technology developer and licensor of materials-based solutions for catalytic and separations processes.
Revenue Recognition:
The Partnership recognizes revenue when both title and risk of loss of the product have been transferred to the customer (generally upon shipment), the seller’s price to the buyer is fixed or determinable, collectability is reasonably assured, and persuasive evidence of an arrangement exists. Customers take title and assume all the risks of ownership upon shipment (if terms are “FOB shipping point”) or upon delivery (if terms are “FOB destination”). Any deviation from the standard terms and arrangements are reviewed for the proper accounting treatment, and revenue recognition is revised accordingly.
Prior to shipment, product specifications are verified with the customer through product samples. Specific performance reserves based on customer contracts are recorded in the other long-term liabilities account at the time of shipment. Estimates are calculated based on the performance of the catalyst over a specified run length.
We defer revenue recognition on certain of our product lines until all essential elements of the sales order have shipped and both title and risk of loss has passed to the customer. Hydrocracking and specialty catalyst orders are typically filled by a number of individual shipments, and those shipments may span the end of a fiscal quarter or year. If a portion of the order has not shipped and it is essential to the functionality of the customer’s end use, all revenue associated with that order will be deferred until the order is completed. A shipment is considered essential if each individual shipment has no value to the customer on a stand-alone basis and if the remaining shipment is not considered inconsequential and perfunctory.
The Partnership reserves 2% of the Hydrocracking sales due to a clause in the contract that allows customers to return up to 5% of the unused products they purchase within 90 days, and based on historical experience. The total sales returns reserve as of
December 31, 2017
and
2016
amounted to
$737
and
$650
, respectively.
Shipping and Handling Costs:
The Partnership classifies costs related to shipping and handling of products shipped to customers as cost of goods sold.
Research and Development:
Research and development costs of
$16,011
,
$16,033
and
$13,994
for the years ended December 31,
2017
,
2016
and
2015
, respectively, were expensed as incurred and reported in selling, general and administrative expenses in the accompanying statements of operations.
Foreign Exchange Transactions:
The functional currency of the Partnership is the U.S. Dollar. The Partnership enters into transactions that are denominated in other currencies. Gains and losses on foreign currency transactions are included in other (income) / expense, net on the statements of operations. Foreign exchange gains of
$2,569
and losses of
$264
and
$2,353
were recognized for the years ended
December 31, 2017
,
2016
and
2015
, respectively.
Fair Value Measurements:
The Partnership’s financial assets and liabilities are reflected in the financial statements at fair value. Fair value is defined as the price at which an asset could be exchanged in a current transaction between willing market participants. A liability’s fair value is defined as the amount that would be paid to transfer the liability to a market participant, not the amount that would be paid to settle the liability with a creditor. The Partnership’s cash balances approximate fair value due to their short-term maturity.
Use of Estimates:
The preparation of the Partnership’s financial statements in conformity with generally accepted accounting principles requires management to make estimates that affect the reported amounts of assets and liabilities and disclosure of contingent assets and liabilities at the date of the financial statements and the reported amounts of revenue and expenses during the reporting period. Actual results could differ from those estimates.
4. Recently Issued Accounting Standards:
In August 2016, the FASB issued guidance which clarifies the classification of certain cash receipts and cash payments in the statement of cash flows, including debt prepayment or extinguishment costs and distributions from certain equity method investees. For public companies, the new guidance is effective for fiscal years beginning after December 15, 2017, and interim periods within those fiscal years. The new guidance is effective for nonpublic entities for fiscal years beginning after December 15, 2018 and interim periods within fiscal years beginning after December 15, 2019. Early adoption is permitted, and the new guidance should be applied retrospectively to each period presented. The Partnership is evaluating the impact that the new guidance will have on its financial statements.
In February 2016, the FASB issued guidance that amends the accounting for leases. Under the new guidance, a lessee will recognize assets and liabilities for most leases (including those classified under existing GAAP as operating leases, which based on current standards are not reflected on the balance sheet), but will recognize expenses similar to current lease accounting. For public companies, the new guidance is effective for fiscal years beginning after December 15, 2018, including interim periods within those years. The guidance is
F-85
ZEOLYST INTERNATIONAL
NOTES TO FINANCIAL STATEMENTS
(in thousands)
effective for nonpublic entities for fiscal years beginning after December 15, 2019, and interim periods within fiscal years beginning after December 15, 2020. Early adoption is permitted. The new guidance must be adopted using a modified retrospective transition, and provides for certain practical expedients. The Partnership is currently evaluating the impact that the new guidance will have on its financial statements.
In July 2015, the FASB issued new guidance that changes the measurement principle for inventory from the lower of cost or market to the lower of cost or net realizable value. The amendments in this guidance do not apply to inventory that is measured using LIFO or the retail inventory method; rather, the amendments apply to all other inventory, which includes inventory that is measured using FIFO or average cost. Within the scope of this new guidance, an entity should measure inventory at the lower of cost or net realizable value. Net realizable value is defined as the estimated selling prices in the ordinary course of business, less reasonably predictable costs of completion, disposal and transportation, which is consistent with existing GAAP. The new guidance was adopted by the Partnership as of January 1, 2017 for the year ending December 31, 2017.
In May 2014, the FASB issued accounting guidance (with subsequent targeted amendments) that will significantly enhance comparability of revenue recognition practices across entities, industries, jurisdictions and capital markets. The core principle of the guidance is that revenue recognized from a transaction or event that arises from a contract with a customer should reflect the consideration to which an entity expects to be entitled in exchange for goods or services provided. To achieve that core principle, the new guidance sets forth a five-step revenue recognition model that will need to be applied consistently to all contracts with customers, except those that are within the scope of other topics in the Accounting Standards Codification (“ASC”). Also required are enhanced disclosures to help users of financial statements better understand the nature, amount, timing and uncertainty of revenues and cash flows from contracts with customers. The enhanced disclosures include qualitative and quantitative information about contracts with customers, significant judgments made in applying the revenue guidance, and assets recognized related to the costs to obtain or fulfill a contract. For public companies, the new requirements are effective for annual reporting periods beginning after December 15, 2017, including interim periods within those years. The Partnership reviewed its key revenue streams and assessed the underlying customer contracts within the framework of the new guidance. The Partnership evaluated the key aspects of its revenue streams for impact under the new guidance and performed a detailed analysis of its customer agreements to quantify the changes under the guidance. The Partnership concluded that the guidance did not have a material impact on its existing revenue recognition practices upon adoption on January 1, 2018, but there are new robust disclosure requirements that will have an impact on the Partnership’s reporting beginning with its first quarter ended March 31, 2018. The Partnership implemented the guidance under the modified retrospective transition method of adoption.
5. Accounts Receivable and Allowance for Doubtful Accounts:
The components of accounts receivable are as follows:
|
December 31,
|
||||||||
|
2017
|
2016
|
|||||||
|
Trade accounts receivable
|
$
|
69,876
|
|
$
|
79,377
|
|
||
|
Allowance
|
(737
|
)
|
(650
|
)
|
||||
|
$
|
69,139
|
|
$
|
78,727
|
|
|||
6. Inventories:
Inventories were classified and valued as follows:
|
December 31,
|
||||||||
|
2017
|
2016
|
|||||||
|
Finished products and work in process
|
$
|
92,905
|
|
$
|
91,608
|
|
||
|
Raw materials and containers
|
5,533
|
|
6,578
|
|
||||
|
$
|
98,438
|
|
$
|
98,186
|
|
|||
F-86
ZEOLYST INTERNATIONAL
NOTES TO FINANCIAL STATEMENTS
(in thousands)
7. Property, Plant and Equipment:
A summary of property, plant and equipment, at cost, and related accumulated depreciation is as follows:
|
December 31,
|
||||||||
|
2017
|
2016
|
|||||||
|
Land and buildings
|
$
|
49,508
|
|
$
|
35,298
|
|
||
|
Machinery and equipment
|
179,933
|
|
161,185
|
|
||||
|
Construction in progress
|
6,468
|
|
33,356
|
|
||||
|
235,909
|
|
229,839
|
|
|||||
|
Less: accumulated depreciation
|
(103,651
|
)
|
(97,194
|
)
|
||||
|
$
|
132,258
|
|
$
|
132,645
|
|
|||
Depreciation expense was
$13,580
,
$12,628
and
$9,406
for the years ended
December 31, 2017
,
2016
, and
2015
, respectively. Disposal of assets reduced PP&E and accumulated depreciation by
$7,299
,
$314
, and
$749
, respectively with a
$178
,
$26
, and
$0
reduction to earnings for the years ended
December 31, 2017
,
2016
, and
2015
, respectively.
8. Other Current Liabilities:
A summary of other current liabilities is as follows:
|
December 31,
|
||||||||
|
2017
|
2016
|
|||||||
|
Accrued royalties and license fees
|
$
|
2,862
|
|
$
|
5,305
|
|
||
|
Accrued commissions
|
819
|
|
863
|
|
||||
|
Accrued rebates
|
—
|
|
950
|
|
||||
|
Accrued other
|
1,192
|
|
1,550
|
|
||||
|
$
|
4,873
|
|
$
|
8,668
|
|
|||
9. Revolver:
On March 2, 2016, the Partnership entered into a five-year revolving line of credit facility of
$60,000
, which carries an initial interest rate of LIBOR. The agreement expires on March 1, 2021. The interest rate on the facility is LIBOR plus an interest margin ranging from .75% to 1.00% per annum based on the Partnership’s debt to EBITDA ratio. A commitment fee is paid to the bank for this agreement. As of
December 31, 2017
, availability under this agreement was
$60,000
.
The revolving credit agreement contains certain restrictions and covenants that require the Partnership to maintain a minimum partners’ equity, as defined, of $100,000 plus 10% of net income, and a minimum EBITDA of $40,000 on a last twelve month basis measured quarterly. The Partnership was in compliance with all covenants during
2017
.
Cash payments for interest were approximately
$108
,
$180
and
$275
for the years ended
December 31, 2017
,
2016
and
2015
, respectively.
The fair value of a financial instrument is the amount at which the instrument could be exchanged in a current transaction. The carrying amount of the revolving line of credit approximates fair value because it is a short- term liquidity tool to fund operations, which is drawn down and paid back with cash generated from operations.
10. Partners’ Contributions:
In accordance with the Agreement, in the event that cash flow from operations is insufficient to meet the Partnership’s requirements, following a majority vote by the Management Committee of the Partnership to request capital from the partners, the partners will provide additional capital to enable the Partnership to meet its obligations. No such contributions were made during the years ended
December 31, 2017
,
2016
, or
2015
as the Partnership had the ability to finance operations through cash flow from operations and borrowings under the Partnership’s revolving line of credit facility.
F-87
ZEOLYST INTERNATIONAL
NOTES TO FINANCIAL STATEMENTS
(in thousands)
11. Income Taxes:
As a partnership, Zeolyst International is not liable for the payment of taxes on income in the U.S. Net income and losses are allocated to the respective partners on an annual basis, and it is the partners’ responsibility to pay income taxes, if any, thereon according to their respective tax positions.
12. Commitments and Contingent Liabilities:
In 1998, the Partnership entered into a ten year tolling agreement (“the Tolling Agreement”) with CRI Belgium, a related party, for the manufacture of specialty extruded products. Effective January 2004, the 1998 Tolling Agreement was replaced by a new evergreen ten-year tolling agreement with CRI Belgium. Both parties can terminate this agreement without cause with twenty-four months’ notice. The Partnership pays CRI Belgium a daily charge rate based on the actual days of production. This charge is included in related party cost of goods sold and totaled
$19,241
,
$18,330
and
$29,877
for the years ended
December 31, 2017
,
2016
and
2015
, respectively. In addition, for certain capital expenditures, that are beneficial to the Partnership, the parties will mutually agree on future adjustments to the daily charge rates or propose an alternative method of the Partnership’s contribution to those costs.
During 2007, the Partnership entered into a License Agreement with a third party to obtain exclusive licensing rights to use the technology in the manufacturing, using and selling of Powder catalyst and Shaped catalyst. The consideration for the licensing rights includes (1) a down payment of $3,200 payable in six annual installments to acquire the product license, and (2) royalty payments at a rate of 10% of the Powder and Shaped Net Sale price during the royalty period. The $3,200 is payable as follows: $500 was paid at the date of the agreement, $500 at first, second, and third anniversaries of the agreement, and $600 at the fourth and fifth anniversary of the agreement. The product license intangible is being amortized over the life of the agreement on a straight-line basis, which is estimated to be 15 years. Amortization expense of
$213
was recognized in
2017
,
2016
and
2015
. The royalty period of 10 years began in 2013, immediately after the date on which the Partnership had cumulatively produced the first 250 metric tons of Powder and Shaped catalyst. If at the end of the Royalty Period, the cumulative of running royalties actually paid by the Partnership is less than $3,000, the Partnership will be obligated to pay the difference between the $3,000 and the actual cumulative running royalty amount. As of
December 31, 2017
and
2016
there were
$2,283
and
$1,982
, respectively, liabilities recorded related to this agreement.
During 2013 the Partnership entered into a Sublicense Agreement with a third party to obtain patent and know-how licensing rights to make, use, import, and sell the Licensed Process and Products in the Licensed field. The consideration for the licensing rights includes a payment of $1,500 payable in three installments. The $1,500 is payable as follows: $500 will be paid at the date of the first successful sale of commercialized product, or 36 months from execution of the license agreement, $500 after sale of 0.5 million pounds of product, or 48 months from execution of the license agreement, and $500 after sale of 1.0 million pounds of product, or 60 months from execution of the license agreement. In October 2016, the agreement was amended to extend payment terms. The payment of $1,500 is payable as follows: $500 will be paid at the date of the first successful sale of commercialized product, or 69 months from execution of the license agreement, $500 after sale of 0.5 million pounds of product, or 81 months from execution of the license agreement, and $500 after sale of 1.0 million pounds of product, or 93 months from execution of the license agreement. The product license intangible will be amortized prospectively with this change in estimated life. Amortization expense of
$36
,
$225
and
$675
was recognized in the years ending
December 31, 2017
,
2016
and
2015
, respectively.
13. Related Party Transactions:
Policies and Procedures
The Partnership maintains certain policies and procedures for the review, approval, and ratification of related party transactions to ensure that all transactions with selected parties are fair and reasonable. All significant relationships and transactions are separately identified by management if they meet the definition of a related party or a related party transaction. Related party transactions include transactions that occurred during the year, in which the Partnership was or will be a participant and which any related person had or will have a direct or indirect material interest. Due to the nature of the Partnership, material related party transactions are identified on a transaction-based approach. The types of transactions identified and reviewed include, but are not limited to, sales of products, purchases of inventory, tolling costs, sales and marketing costs, research and development, and management-related fees. All related party transactions are reviewed, approved and documented by the appropriate level of the Partnership’s management in accordance with these policies and procedures.
PQ
Under the terms of the Agreement, the Partnership leases certain land used in its Kansas City production facilities from PQ. This lease, which has been recorded as an operating lease, provided for rental payments of
$295
,
$280
, and
$265
for the years ended
December 31, 2017
,
2016
and
2015
, respectively. The rent expense is included in the related party cost of goods sold line item in the
F-88
ZEOLYST INTERNATIONAL
NOTES TO FINANCIAL STATEMENTS
(in thousands)
accompanying statements of operations. The terms of this lease are evergreen as long as the Partnership agreement is in place. The Partnership recognized sales to PQ of
$2,475
,
$1,191
, and
$0
in the years ended
December 31, 2017
,
2016
, and
2015
, respectively. The Partnership purchases certain of its raw materials from PQ and is charged for various manufacturing costs incurred at the PQ Kansas City production facility. The amount of these costs charged to the Partnership during the years ended
December 31, 2017
,
2016
and
2015
were
$17,470
,
$15,514
and
$14,021
, respectively. These costs are a component of production costs and are included in the related party cost of goods sold line item in the accompanying statements of operations when the inventory is sold. Certain administrative, marketing, engineering, management-related, and research and development services are provided to the Partnership by PQ. During the years ended
December 31, 2017
,
2016
and
2015
, the Partnership was charged
$12,248
,
$12,325
and
$12,551
, respectively, for these services. These amounts are included in the related party selling, general and administrative line item in the accompanying statements of operations. In addition, certain product demonstration costs of
$2,175
,
$2,169
and
$1,598
during the years ended
December 31, 2017
,
2016
and
2015
, respectively, were recorded in the related party cost of goods sold line of the accompanying statements of operations.
At
December 31, 2017
and
2016
, the accounts payable to affiliates consisted of
$2,594
and
$2,472
due to PQ. Included in trade accounts receivable at
December 31, 2017
and
2016
was
$69
and
$840
, respectively due from PQ.
On December 18, 2013, PQ and ZI, entered into a real estate tax abatement agreement with the Unified Government of Wyandotte County and Kansas City, Kansas that will utilize an Industrial Revenue Bond financing structure to achieve a 75% real estate tax abatement on the value of the improvements that will be constructed during the expansion of PQ’s and ZI’s facilities at the jointly-operated Kansas City, Kansas plant. In accordance with ASC 210-20-45, the financing obligation and the industrial bond receivable have been presented on a net basis.
CRI and Royal Dutch Shell Affiliates
Royal Dutch Shell affiliates include CRI Zeolites, Criterion, Shell Development Company, Shell Research and Technology Center-Amsterdam, CRI Center Marketing Asia Pacific, Shell International Oil Products, CRI Belgium and CRI Technology Services. As described in Note 2, a significant portion of the Partnership’s sales are transacted through Criterion. During the years ended
December 31, 2017
,
2016
and
2015
the Partnership recognized sales transacted through Criterion of
$106,325
,
$92,463
and
$148,986
, respectively. The Partnership purchases certain of its raw materials and is charged for tolling, customer distribution and packaging costs incurred by Criterion. The amount of these costs charged to the Partnership during the years ended
December 31, 2017
,
2016
and
2015
were
$23,965
,
$22,364
and
$44,793
, respectively. These costs are a component of production costs and are included in the related party cost of goods sold line item in the accompanying statements of operations when the inventory is sold. Certain engineering, management-related, broker-related, and research and development services are provided to the Partnership by CRI and Royal Dutch Shell affiliates. During the years ended
December 31, 2017
,
2016
and
2015
, the Partnership was charged
$19,496
,
$21,694
and
$18,923
, respectively, for these services. These amounts are included in the related party selling, general and administrative line item in the accompanying statements of operations.
At
December 31, 2017
and
2016
, the accounts payable to affiliates balance consisted of
$7,428
and
$11,533
, respectively, due to CRI and Shell affiliates. Included in trade accounts receivable at
December 31, 2017
and
2016
was
$43,768
and
$46,051
, respectively, of receivables related to sales transacted through Criterion, as described above.
Zeolyst C.V.
Zeolyst C.V. is a limited partnership formed in 1993 pursuant to a joint venture agreement between PQ Zeolites B.V. and CRI Zeolites for the purpose of the production of Zeolite powders. The Partnership entered into an agreement with Zeolyst C.V. to purchase Zeolite powders manufactured by Zeolyst C.V. Under the terms of the agreement, products manufactured by Zeolyst C.V. are supplied solely to the Partnership. The Partnership has performed a qualitative and quantitative analysis and concluded that for Zeolyst C.V. for which it holds a variable interest but will not absorb a majority of the expected losses or residual returns, the Partnership is not the primary beneficiary and therefore, this VIE was not consolidated in the Partnership’s Consolidated Financial Statements. The Partnership has no unfunded commitments or guarantees as a result of its involvement with Zeolyst C.V. The total carrying value of assets and liabilities for Zeolyst C.V was
$120,866
and
$11,986
as of
December 31, 2017
and was
$89,924
and
$12,323
as of
December 31, 2016
, respectively. The Partnership currently does not have any exposure to any losses by Zeolyst C.V. The Partnership has purchased
$37,087
,
$37,989
and
$28,711
through the sales agreement during the years ended
December 31, 2017
,
2016
and
2015
, respectively. These costs are a component of production costs and are included in the related party cost of goods sold line item in the accompanying statements of operations when the inventory is sold.
At
December 31, 2017
and
2016
, the accounts receivable from affiliates balance consisted of
$2,475
and
$7,250
, respectively, due from Zeolyst C.V.
F-89
ZEOLYST INTERNATIONAL
NOTES TO FINANCIAL STATEMENTS
(in thousands)
14. Subsequent Events:
The Partnership has evaluated subsequent events from the balance sheet date through
March 22, 2018
and determined there are no further items to disclose.
F-90
TABLE OF CONTENTS
Part IItem 1. BusinessItem 1A. Risk FactorsItem 1B. Unresolved Staff CommentsItem 2. PropertiesItem 3. Legal ProceedingsItem 4. Mine Safety DisclosuresPart IIItem 5. Market For Registrant S Common Equity, Related Stockholder Matters and Issuer Purchases Of Equity SecuritiesItem 6. Selected Financial DataItem 7. Management S Discussion and Analysis Of Financial Condition and Results Of OperationsItem 7A. Quantitative and Qualitative Disclosures About Market RiskItem 8. Financial Statements and Supplementary DataItem 9. Changes in and Disagreements with Accountants on Accounting and Financial DisclosureItem 9A. Controls and ProceduresItem 9B. Other InformationPart IIIItem 10. Directors, Executive Officers and Corporate GovernanceItem 11. Executive CompensationItem 12. Security Ownership Of Certain Beneficial Owners and Management and Related Stockholder MattersItem 13. Certain Relationships and Related Transactions, and Director IndependenceItem 14. Principal Accounting Fees and ServicesPart IVItem 15. Exhibits, Financial Statement SchedulesItem 16. Form 10-k Summary