|
|
|
|
|
|
|
|
|
|
|
|
|
|
|
|
|
|
|
|
|
|
|
|
|
|
|
|
|
|
|
|
|
|
|
|
|
|
|
|
|
|
|
|
|
|
|
|
|
|
|
|
|
|
|
|
Table of Contents
United States
Securities And Exchange Commission
Washington, D.C. 20549
FORM 10-K
| x | Annual Report Pursuant To Section 13 or 15(d) of the Securities Exchange Act of 1934 |
For The Fiscal Year Ended December 31, 2010
or
| ¨ | Transition Report Pursuant to Section 13 or 15(d) of the Securities Exchange Act of 1934 |
For the transition period from to
Commission File Number 1-14514
CONSOLIDATED EDISON, INC.
Exact name of registrant as specified in its charter
| New York | 13-3965100 | |
| (State of Incorporation) |
(I.R.S. Employer ID. Number) |
4 Irving Place,
New York, New York 10003
(principal office address)
(212) 460-4600
(telephone number)
Commission File Number 1-1217
CONSOLIDATED EDISON COMPANY OF NEW YORK, INC.
Exact name of registrant as specified in its charter
| New York | 13-5009340 | |
| (State of Incorporation) |
(I.R.S. Employer ID. Number) |
4 Irving Place,
New York, New York 10003
(principal office address)
(212) 460-4600
(telephone number)
Securities Registered Pursuant to Section 12(b) of the Act:
|
Title of each class |
Name of each exchange on which registered |
|
| Consolidated Edison, Inc., | ||
| Common Shares ($.10 par value) | New York Stock Exchange | |
| Consolidated Edison Company of New York, Inc., | ||
| $5 Cumulative Preferred Stock, without par value | New York Stock Exchange | |
| Cumulative Preferred Stock, 4.65% Series C ($100 par value) | New York Stock Exchange | |
Securities Registered Pursuant to Section 12(g) of the Act:
|
Title of each class |
||
| Consolidated Edison Company of New York, Inc. | ||
| Cumulative Preferred Stock, 4.65% Series D ($100 par value) |
Table of Contents
Indicate by check mark if the registrant is a well-known seasoned issuer, as defined in Rule 405 of the Securities Act.
| Con Edison, Inc. (Con Edison) | Yes x | No ¨ | ||||||
| Consolidated Edison Company of New York, Inc. (CECONY) | Yes x | No ¨ | ||||||
Indicate by check mark if the registrant is not required to file reports pursuant to Section 13 or Section 15(d) of the Act.
| Con Edison | Yes ¨ | No x | ||||||
| CECONY | Yes ¨ | No x | ||||||
Indicate by check mark whether the registrant (1) has filed all reports required to be filed by Section 13 or 15(d) of the Securities Exchange Act of 1934 during the preceding 12 months (or for such shorter period that the registrant was required to file such reports), and (2) has been subject to such filing requirements for the past 90 days.
| Con Edison | Yes x | No ¨ | ||||||
| CECONY | Yes x | No ¨ | ||||||
Indicate by check mark whether the registrant has submitted electronically and posted on its corporate Web site, if any, every Interactive Data File required to be submitted and posted pursuant to Rule 405 of Regulation S-T (§232.405 of this chapter) during the preceding 12 months (or for such shorter period that the registrant was required to submit and post such files).
| Con Edison | Yes x | No ¨ | ||||||
| CECONY | Yes x | No ¨ | ||||||
Indicate by check mark if disclosure of delinquent filers pursuant to Item 405 of Regulation S-K (§229.405 of this chapter) is not contained herein, and will not be contained, to the best of registrant’s knowledge, in definitive proxy or information statements incorporated by reference in Part III of this Form 10-K or any amendment to this Form 10-K.
Indicate by check mark whether the registrant is a large accelerated filer, an accelerated filer, a non-accelerated filer, or a smaller reporting company. See the definitions of “large accelerated filer”, “accelerated filer,” and “smaller reporting company” in Rule 12b-2 of the Exchange Act.
| Con Edison | ||||||||||||
| Large accelerated filer x | Accelerated filer ¨ | Non-accelerated filer ¨ | Smaller reporting company ¨ | |||||||||
| CECONY | ||||||||||||
| Large accelerated filer ¨ | Accelerated filer ¨ | Non-accelerated filer x | Smaller reporting company ¨ | |||||||||
Indicate by check mark whether the registrant is a shell company (as defined in Rule 12b-2 of the Act).
| Con Edison | Yes ¨ | No x | ||||||
| CECONY | Yes ¨ | No x | ||||||
The aggregate market value of the common equity of Con Edison held by non-affiliates of Con Edison, as of June 30, 2010, was approximately $12.2 billion.
As of January 31, 2011, Con Edison had outstanding 291,968,911 Common Shares ($.10 par value).
All of the outstanding common equity of CECONY is held by Con Edison.
Documents Incorporated By Reference
Portions of Con Edison’s definitive proxy statement and CECONY’s definitive information statement, for their respective Annual Meetings of Stockholders to be held on May 16, 2011, to be filed with the Commission pursuant to Regulation 14A and Regulation 14C, respectively, not later than 120 days after December 31, 2010, are incorporated in Part III of this report.
Filing Format
This Annual Report on Form 10-K is a combined report being filed separately by two different registrants: Consolidated Edison, Inc. (Con Edison) and Consolidated Edison Company of New York, Inc. (CECONY). CECONY is a subsidiary of Con Edison and, as such, the information in this report about CECONY also applies to Con Edison. As used in this report, the term the “Companies” refers to Con Edison and CECONY. However, CECONY makes no representation as to the information contained in this report relating to Con Edison or the subsidiaries of Con Edison other than itself.
Table of Contents
|
Glossary of Terms |
The following is a glossary of frequently used abbreviations or acronyms that are used in the Companies’ SEC reports:
| Con Edison Companies | ||
| Con Edison | Consolidated Edison, Inc. | |
| CECONY | Consolidated Edison Company of New York, Inc. | |
| Con Edison Development | Consolidated Edison Development, Inc. | |
| Con Edison Energy | Consolidated Edison Energy, Inc. | |
| Con Edison Solutions | Consolidated Edison Solutions, Inc. | |
| O&R | Orange and Rockland Utilities, Inc. | |
| Pike | Pike County Light & Power Company | |
| RECO | Rockland Electric Company | |
| The Companies | Con Edison and CECONY | |
| The Utilities | CECONY and O&R | |
| Regulatory Agencies, Government Agencies, and Quasi-governmental Not-for-Profits | ||
| EPA | U.S. Environmental Protection Agency | |
| FERC | Federal Energy Regulatory Commission | |
| IRS | Internal Revenue Service | |
| ISO-NE | ISO New England Inc. | |
| NJBPU | New Jersey Board of Public Utilities | |
| NJDEP | New Jersey Department of Environmental Protection | |
| NYAG | New York State Attorney General | |
| NYISO | New York Independent System Operator | |
| NYPA | New York Power Authority | |
| NYSDEC | New York State Department of Environmental Conservation | |
| NYSERDA | New York State Energy Research and Development Authority | |
| NYSPSC | New York State Public Service Commission | |
| NYSRC | New York State Reliability Council, LLC | |
| PAPUC | Pennsylvania Public Utility Commission | |
| PJM | PJM Interconnection LLC | |
| SEC | U.S. Securities and Exchange Commission | |
| Accounting | ||
| ABO | Accumulated Benefit Obligation | |
| ASU | Accounting Standards Update | |
| FASB | Financial Accounting Standards Board | |
| LILO | Lease In/Lease Out | |
| OCI | Other Comprehensive Income | |
| SFAS | Statement of Financial Accounting Standards | |
| SSCM | Simplified service cost method | |
| VIE | Variable interest entity | |
| Environmental | ||
| CO 2 | Carbon dioxide | |
| GHG | Greenhouse gases | |
| MGP Sites | Manufactured gas plant sites | |
| PCBs | Polychlorinated biphenyls | |
| PRP | Potentially responsible party | |
| SO 2 | Sulfur dioxide | |
| Superfund | Federal Comprehensive Environmental Response, Compensation and Liability Act of 1980 and similar state statutes | |
| 3 |
Table of Contents
|
Glossary of Terms continued |
| Units of Measure | ||
| dths | Dekatherms | |
| kV | Kilovolts | |
| kWh | Kilowatt-hour | |
| mdths | Thousand dekatherms | |
| MMlbs | Million pounds | |
| MVA | Megavolt amperes | |
| MW | Megawatts or thousand kilowatts | |
| MWH | Megawatt hour | |
| Other | ||
| AFDC | Allowance for funds used during construction | |
| COSO | Committee of Sponsoring Organizations of the Treadway Commission | |
| EMF | Electric and magnetic fields | |
| ERRP | East River Repowering Project | |
| Fitch | Fitch Ratings | |
| LTIP | Long Term Incentive Plan | |
| Moody’s | Moody’s Investors Service | |
| S&P | Standard & Poor’s Rating Services | |
| VaR | Value-at-Risk |
| 4 |
Table of Contents
| PAGE | ||||||
| Introduction | 6 | |||||
| 7 | ||||||
| 8 | ||||||
| Part I | ||||||
| Item 1: | 11 | |||||
| Item 1A: | 34 | |||||
| Item 1B: | 37 | |||||
| Item 2: | 37 | |||||
| Item 3: | 37 | |||||
| Item 4: | 38 | |||||
| 39 | ||||||
| Part II | ||||||
| Item 5: | 41 | |||||
| Item 6: | 43 | |||||
| Item 7: |
Management’s Discussion and Analysis of Financial Condition and Results of Operations |
44 | ||||
| Item 7A: | 71 | |||||
| Item 8: | 72 | |||||
| Item 9: |
Changes in and Disagreements with Accountants on Accounting and Financial Disclosure |
154 | ||||
| Item 9A: | 154 | |||||
| Item 9B: | 154 | |||||
| Part III | ||||||
| Item 10: | 155 | |||||
| Item 11: | 155 | |||||
| Item 12: |
Security Ownership of Certain Beneficial Owners and Management and Related Stockholder Matters |
155 | ||||
| Item 13: |
Certain Relationships and Related Transactions, and Director Independence |
155 | ||||
| Item 14: | 155 | |||||
| Part IV | ||||||
| Item 15: | 157 | |||||
| 162 | ||||||
| 5 |
Table of Contents
This introduction contains certain information about Con Edison and its subsidiaries, including, CECONY, and is qualified in its entirety by reference to the more detailed information appearing elsewhere or incorporated by reference in this report.
Con Edison’s mission is to provide energy services to our customers safely, reliably, efficiently, and in an environmentally sound manner; to provide a workplace that allows employees to realize their full potential; to provide a fair return to our investors; and to improve the quality of life in the communities we serve.
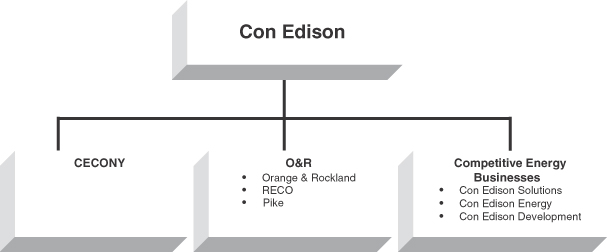
Con Edison is a holding company that owns:
| • |
CECONY, which delivers electricity, natural gas and steam to customers in New York City and Westchester County; |
| • |
O&R (together with CECONY referred to as the Utilities), which delivers electricity and natural gas to customers primarily located in southeastern New York, and northern New Jersey and northeastern Pennsylvania; and |
| • |
Competitive energy businesses, which provide retail and wholesale electricity supply and energy services. |
Con Edison anticipates that the Utilities, which are subject to extensive regulation, will continue to provide substantially all of its earnings over the next few years. The Utilities have approved rate plans that are generally designed to cover each company’s cost of service, including the capital and other costs of the company’s energy delivery systems. The Utilities recover from their full-service customers (generally, on a current basis) the cost the Utilities pay for the energy and charge all of their customers the cost of delivery service.
Selected Financial Data
Con Edison
| For the Year Ended December 31, | ||||||||||||||||||||
| (millions of dollars, except per share amounts) | 2006 | 2007 | 2008 | 2009 | 2010 | |||||||||||||||
|
Operating revenues |
$ | 11,962 | $ | 13,120 | $ | 13,583 | $ | 13,032 | $ | 13,325 | ||||||||||
|
Energy costs |
6,611 | 7,225 | 7,584 | 6,242 | 5,732 | |||||||||||||||
|
Operating income |
1,628 | 1,847 | 1,920 | 1,899 | 2,120 | |||||||||||||||
|
Income from continuing operations |
751 | 936 | 933 | 879 | 1,003 | |||||||||||||||
|
Total assets |
26,699 | 28,262 | 33,498 | (a) | 33,844 | (a) | 36,146 | (b) | ||||||||||||
|
Long-term debt |
8,298 | 7,611 | 9,232 | 9,854 | 10,671 | |||||||||||||||
|
Shareholders’ equity |
8,217 | 9,289 | 9,911 | 10,462 | 11,274 | |||||||||||||||
|
Basic earnings per share |
||||||||||||||||||||
|
Continuing operations |
$ | 2.97 | $ | 3.48 | $ | 3.37 | $ | 3.16 | $ | 3.49 | ||||||||||
|
Diluted earnings per share |
||||||||||||||||||||
|
Continuing operations |
$ | 2.96 | $ | 3.46 | $ | 3.36 | $ | 3.14 | $ | 3.47 | ||||||||||
|
Cash dividends per common share |
$ | 2.30 | $ | 2.32 | $ | 2.34 | $ | 2.36 | $ | 2.38 | ||||||||||
|
Book value per share |
$ | 31.11 | $ | 33.39 | $ | 35.43 | $ | 36.82 | $ | 37.95 | ||||||||||
|
Average common shares outstanding (millions) |
249 | 266 | 273 | 275 | 284 | |||||||||||||||
|
Stock price low |
$ | 41.17 | $ | 43.10 | $ | 34.11 | $ | 32.56 | $ | 41.52 | ||||||||||
|
Stock price high |
$ | 49.28 | $ | 52.90 | $ | 49.30 | $ | 46.35 | $ | 51.03 | ||||||||||
| (a) | Reflects a $1,130 million decrease in 2009 and a $3,519 million increase in 2008 in regulatory assets for unrecognized pension and other retirement costs. See Notes E and F to the financial statements in Item 8. |
| (b) | Reflects a $1,399 million increase in net plant, a $303 million increase in regulatory assets – environmental remediation costs and a $210 million increase in prepayments. See “Liquidity and Capital Resources – Other Changes in Assets and Liabilities” in Item 7. |
| 6 |
Table of Contents
CECONY
| For the Year Ended December 31, | ||||||||||||||||||||
| (millions of dollars) | 2006 | 2007 | 2008 | 2009 | 2010 | |||||||||||||||
|
Operating revenues |
$ | 9,288 | $ | 9,885 | $ | 10,424 | $ | 10,036 | $ | 10,573 | ||||||||||
|
Energy costs |
4,479 | 4,580 | 4,844 | 3,904 | 3,693 | |||||||||||||||
|
Operating income |
1,465 | 1,669 | 1,667 | 1,716 | 1,922 | |||||||||||||||
|
Net income for common stock |
686 | 844 | 783 | 781 | 893 | |||||||||||||||
|
Total assets |
22,816 | 24,504 | 30,415 | (a) | 30,461 | (a) | 32,435 | (b) | ||||||||||||
|
Long-term debt |
6,925 | 7,172 | 8,494 | 9,038 | 9,743 | |||||||||||||||
|
Shareholder’s equity |
7,345 | 8,299 | 9,204 | 9,560 | 10,136 | |||||||||||||||
| (a) | Reflects a $1,076 million decrease in 2009 and a $3,392 million increase in 2008 in regulatory assets for unrecognized pension and other retirement costs. See Notes E and F to the financial statements in Item 8. |
| (b) | Reflects a $1,257 million increase in net plant, a $241 million increase in regulatory assets – environmental remediation costs and a $125 million increase in accounts receivable from affiliated companies. See “Liquidity and Capital Resources – Other Changes in Assets and Liabilities” in Item 7. |
Significant 2010 Developments
| • |
CECONY delivered 58,693 millions of kWhs of electricity (3.6 percent increase from prior year), 123,972 mdths of gas (0.7 percent decrease from prior year) and 23,030 MMlbs of steam to its customers (0.1 percent increase from prior year). The company’s electric and gas rate plans include revenue decoupling mechanisms pursuant to which delivery revenues are not generally affected by changes in delivery volumes from levels assumed in the rate plans. See “Results of Operations” in Item 7. |
| • |
CECONY invested $1,866 million to upgrade and reinforce its energy delivery systems. O&R invested $135 million in its energy delivery systems. See “Capital Requirements and Resources” in Item 1. |
| • |
CECONY’s electric, gas and steam rates increased (on an annual basis) $420.4 million (April 2010), $47.1 million (October 2010) and $49.5 million (October 2010), respectively. O&R’s electric and gas rates increased (on an annual basis) $15.6 million and $9.0 million, respectively (July and November 2010). See Note B to the financial statements in Item 8. |
| • |
Con Edison issued $305 million of common stock, in addition to stock issued under its dividend reinvestment and employee stock plans. CECONY issued $925 million of debentures. O&R issued $170 million of debentures. See “Liquidity and Capital Resources – Cash Flows from Financing Activities” in Item 7. |
Con Edison and CECONY file annual, quarterly and current reports, proxy or information statements and other information with the Securities and Exchange Commission (SEC). The public may read and copy any materials that the Companies file with the SEC at the SEC’s Public Reference Room at 100 F Street, N.E., Room 1580 Washington, D.C. 20549. The public may obtain information on the operation of the Public Reference Room by calling the SEC at 1-800-SEC-0330. The SEC maintains an Internet site that contains reports, proxy and information statements, and other information regarding issuers (including Con Edison and CECONY) that file electronically with the SEC. The address of that site is http://www.sec.gov .
This information the Companies file with the SEC is also available free of charge on or through the Investor Information section of their websites as soon as reasonably practicable after the reports are electronically filed with, or furnished to, the SEC. Con Edison’s internet website is at: http://www.conedison.com ; and CECONY’s is at: http://www.coned.com .
The Investor Information section of Con Edison’s website also includes the company’s code of ethics (and amendments or waivers of the code for executive officers or directors), corporate governance guidelines and the
| 7 |
Table of Contents
charters of the following committees of the company’s Board of Directors: Audit Committee, Management Development and Compensation Committee, and Corporate Governance and Nominating Committee. This information is available in print to any shareholder who requests it. Requests should be directed to: Corporate Secretary, Consolidated Edison, Inc., 4 Irving Place, New York, NY 10003.
Information on the Companies’ websites is not incorporated herein.
This report includes forward-looking statements intended to qualify for the safe-harbor provisions of Section 27A of the Securities Act of 1933, as amended, and Section 21E of the Securities Exchange Act of 1934, as amended. Forward-looking statements are statements of future expectation and not facts. Words such as “expects,” “estimates,” “anticipates,” “intends,” “believes,” “plans,” “will” and similar expressions identify forward-looking statements. Forward-looking statements are based on information available at the time the statements are made, and accordingly speak only as of that time. Actual results or developments might differ materially from those included in the forward-looking statements because of various factors including, but not limited to, those discussed under “Risk Factors,” in Item 1A.
| 8 |
Table of Contents
| Contents of Item 1 | Page | |||
| Overview | 11 | |||
|
CECONY |
11 | |||
|
Electric |
11 | |||
|
Gas |
11 | |||
|
Steam |
11 | |||
|
O&R |
||||
|
Electric |
11 | |||
|
Gas |
12 | |||
|
Competitive Energy Businesses |
12 | |||
| Utility Regulation | ||||
|
State Utility Regulation |
12 | |||
|
Regulators |
12 | |||
|
Utility Industry Restructuring in New York |
12 | |||
|
Rate Plans |
12 | |||
|
Liability for Service Interruptions and Other Non-rate Conditions of Service |
14 | |||
|
Generic Proceedings |
15 | |||
|
Federal Utility Regulation |
15 | |||
|
New York Independent System Operator (NYISO) |
15 | |||
| Competition | 15 | |||
| The Utilities | ||||
|
CECONY |
16 | |||
|
Electric Operations |
16 | |||
|
Electric Facilities |
16 | |||
|
Electric Sales and Deliveries |
16 | |||
|
Electric Peak Demand |
17 | |||
|
Electric Supply |
17 | |||
|
Gas Operations |
19 | |||
|
Gas Facilities |
19 | |||
|
Gas Sales and Deliveries |
19 | |||
|
Gas Peak Demand |
20 | |||
|
Gas Supply |
20 | |||
|
Steam Operations |
21 | |||
|
Steam Facilities |
21 | |||
|
Steam Sales and Deliveries |
21 | |||
|
Steam Peak Demand and Capacity |
21 | |||
|
Steam Supply |
21 | |||
|
O&R |
21 | |||
|
Electric Operations |
21 | |||
|
Electric Facilities |
21 | |||
|
Electric Sales and Deliveries |
22 | |||
|
Electric Peak Demand |
22 | |||
|
Electric Supply |
22 | |||
|
Gas Operations |
23 | |||
|
Gas Facilities |
23 | |||
|
Gas Sales and Deliveries |
23 | |||
|
Gas Peak Demand |
23 | |||
|
Gas Supply |
24 | |||
| 9 |
Table of Contents
| Contents of Item 1 | Page | |||
| Competitive Energy Businesses | 24 | |||
|
Con Edison Solutions |
24 | |||
|
Con Edison Energy |
25 | |||
|
Con Edison Development |
25 | |||
| Capital Requirements and Resources | 25 | |||
| Environmental Matters | ||||
|
Climate Change |
28 | |||
|
Environmental Sustainability |
29 | |||
|
CECONY |
29 | |||
|
O&R |
32 | |||
|
Other Federal, State and Local Environmental Provisions |
33 | |||
| State Anti-Takeover Law | 33 | |||
| Employees | 34 | |||
Incorporation By Reference
Information in any item of this report as to which reference is made in this Item 1 is hereby incorporated by reference in this Item 1. The use of terms such as “see” or “refer to” shall be deemed to incorporate into Item 1 at the place such term is used the information to which such reference is made.
| 10 |
Table of Contents
Overview
Consolidated Edison, Inc. (Con Edison), incorporated in New York State in 1997, is a holding company which owns all of the outstanding common stock of Consolidated Edison Company of New York, Inc. (CECONY), Orange and Rockland Utilities, Inc. (O&R) and the competitive energy businesses. As used in this report, the term the “Companies” refers to Con Edison and CECONY.
CECONY’s principal business operations are its regulated electric, gas and steam delivery businesses. O&R’s principal business operations are its regulated electric and gas delivery businesses. The competitive energy businesses sell electricity to wholesale and retail customers, provide certain energy-related services, and participate in energy infrastructure projects. Con Edison is evaluating additional opportunities to invest in electric and gas-related businesses.
Con Edison’s strategy is to provide reliable energy services, maintain public and employee safety, promote energy efficiency, and develop cost-effective ways of performing its business. Con Edison seeks to be a responsible steward of the environment and enhance its relationships with customers, regulators and members of the communities it serves.
CECONY
Electric
CECONY provides electric service to approximately 3.3 million customers in all of New York City (except part of Queens) and most of Westchester County, an approximately 660 square mile service area with a population of more than nine million.
Gas
CECONY delivers gas to approximately 1.1 million customers in Manhattan, the Bronx and parts of Queens and Westchester County.
Steam
CECONY operates the largest steam distribution system in the United States by producing and delivering more than 23,000 MMlbs of steam annually to approximately 1,760 customers in parts of Manhattan.
O&R
Electric
O&R and its utility subsidiaries, Rockland Electric Company (RECO) and Pike County Power & Light Company (Pike) (together referred to herein as O&R) provide electric service to approximately 0.3 million customers in southeastern New York and in adjacent areas of northern New Jersey and northeastern Pennsylvania, an approximately 1,350 square mile service area.
| 11 |
Table of Contents
Gas
O&R delivers gas to over 0.1 million customers in southeastern New York and adjacent areas of northeastern Pennsylvania.
Competitive Energy Businesses
Con Edison pursues competitive energy opportunities through three wholly-owned subsidiaries: Con Edison Solutions, Con Edison Energy and Con Edison Development. These businesses include the sales and related hedging of electricity to wholesale and retail customers, sales of certain energy-related products and services, and participation in energy infrastructure projects. At December 31, 2010, Con Edison’s equity investment in its competitive energy businesses was $337 million and their assets amounted to $807 million.
In 2008, Con Edison Development and its subsidiary, CED/SCS Newington, LLC, completed the sale of their ownership interests in electricity generating plants with an aggregate capacity of approximately 1,706 MW. See Note U to the financial statements in Item 8.
Utility Regulation
State Utility Regulation
Regulators
The Utilities are subject to regulation by the New York State Public Service Commission (NYSPSC), which under the New York Public Service Law, is authorized to set the terms of service and the rates the Utilities charge for providing service in New York. It also approves the issuance of the Utilities’ securities. It exercises jurisdiction over the siting of the Utilities’ electric transmission lines and approves mergers or other business combinations involving New York utilities. O&R’s New Jersey subsidiary, RECO, is subject to similar regulation by the New Jersey Board of Public Utilities (NJBPU). O&R’s Pennsylvania subsidiary, Pike, is subject to similar regulation by the Pennsylvania Public Utility Commission (PAPUC). The NYSPSC, together with the NJBPU and the PAPUC, are referred to herein as state utility regulators.
Utility Industry Restructuring In New York
In the 1990s, the NYSPSC restructured the electric utility industry in the state. In accordance with NYSPSC orders, the Utilities sold all of their electric generating facilities other than those that also produce steam for CECONY’s steam business (see Electric Operations – Electric Facilities below) and provided all of their customers the choice to buy electricity or gas from the Utilities or other suppliers (see Electric Operations – Electric Sales and Deliveries and Gas Operations – Gas Sales and Deliveries below).
Following adoption of NYSPSC industry restructuring, there were several utility mergers as a result of which substantially all of the electric and gas delivery service in New York State is now provided by one of three investor-owned utility companies – Con Edison, National Grid plc and Iberdrola, S.A. – or one of two state authorities – New York Power Authority (NYPA) or Long Island Power Authority.
Rate Plans
Investor-owned utilities in the United States provide service to customers according to the terms of tariffs approved by the appropriate state utility regulator. The tariffs include schedules of rates for service that are designed to permit the utilities to recover from their customers the approved anticipated costs, including capital costs, of providing service to customers as defined by the tariff. The tariffs implement rate plans, that result from rate orders, settlements, or joint proposals developed during rate proceedings. The utilities’ earnings depend on the rate levels authorized in the rate plans and their ability to operate their businesses in a manner consistent with their rate plans.
The utilities’ rate plans each cover specified periods, but rates determined pursuant to a plan generally continue in effect until a new rate plan is approved by the state utility regulator. In New York, either the utility or the NYSPSC can commence a proceeding for a new rate plan, and a new rate plan filed by the utility will take effect automatically in 11 months unless prior to such time the NYSPSC approves a rate plan.
In each rate proceeding, rates are determined by the state utility regulator following the submission by the utility of testimony and supporting information, which are subject to review by the staff of the regulator. Other parties with an interest in the proceeding can
| 12 |
Table of Contents
also review the utility’s proposal and become involved in the rate case. The review process is overseen by an Administrative Law Judge. After an Administrative Law Judge issues a decision, that generally considers the interests of the utility, the regulatory staff, other parties, and legal requisites, the regulator will issue a rate order. The utility and the regulator’s staff and interested parties may enter into a settlement agreement or joint proposal prior to the completion of this administrative process, in which case the agreement would be subject to approval of the regulator.
For each rate plan, the revenues needed to provide the utility a return on invested capital is determined by multiplying the utilities’ forecasted rate base by the utility’s pre-tax weighted average cost of capital. In general, rate base is the amount of the utility’s net plant, deferred taxes and working capital. The NYSPSC uses a forecast of rate base for the rate year. The weighted average cost of capital is determined based on the forecasted amounts and costs of long-term debt and preferred equity, the forecasted amount of common equity and an allowed return on common equity determined by the state utility regulator. The NYSPSC’s current methodology for determining the allowed return on common equity assigns a one-third weight to an estimate determined from a capital asset pricing model applied to a peer group of utility companies and a two-thirds weight to an estimate determined from a dividend discount model using stock prices and dividend forecasts for a peer group of utility companies.
Pursuant to the Utilities’ rate plans, there generally can be no change to the charges to customers during the respective terms of the rate plans other than for recovery of the costs incurred for energy supply and specified adjustments provided for in the rate plans.
Common provisions of the Utilities’ rate plans may include:
“Recoverable energy cost clauses” that allow the Utilities to recover on a current basis the costs for the energy they supply with no mark-up to their full-service customers.
“Other cost reconciliations” that reconcile pension and other postretirement costs, environmental remediation costs, and certain other costs to amounts reflected in delivery rates for such costs. Utilities generally retain the right to petition for recovery or accounting deferral of extraordinary and material cost increases and provision is sometimes made for the utility to retain a share of cost reductions, for example, property tax refunds.
“Revenue decoupling mechanisms” under which actual energy delivery revenues will be compared, on a periodic basis, with the authorized delivery revenues. The difference is accrued with interest for refund to, or recovery from customers, as applicable.
“Earnings sharing provisions” require the Utilities to defer for customer benefit earnings over specified rates of return on common equity. There is no symmetric mechanism for earnings below specified rates of return on common equity.
“Negative earnings adjustments” for failure to meet certain performance standards relating to service reliability, safety and other matters.
| 13 |
Table of Contents
The following table should be read in conjunction with, and is subject to, the more detailed discussion of the Utilities’ rate plans in Note B to the financial statements in Item 8 (which information is incorporated by reference herein).
| Effective Period |
Rate Increases |
Rate Base |
Amortization
To Income of Net Regulatory (Assets) and Liabilities |
Authorized
Return on Equity (ROE) |
ROE Sharing Threshold
(Shareholders/
|
|||||||||||||||
| (millions of dollars, except percentages) | ||||||||||||||||||||
|
CECONY – Electric(b) |
||||||||||||||||||||
|
April 2010 – March 2013 |
|
Yr. 1 – $420.4
Yr. 2 – $420.4 Yr. 3 – $286.9 |
(c) |
|
Yr. 1 – $14,887
Yr. 2 – $15,987 Yr. 3 – $16,826 |
|
|
$(75)
over 3 yrs. |
|
10.15 | % |
|
Yr. 1 –11.15% -
12.149%: 50/50
12.15% - 13.149%:
> 13.149%: 10/90(d) |
|
||||||
|
CECONY – Gas(b) |
||||||||||||||||||||
|
October 2010 – September 2013 |
|
Yr. 1 – $47.1
Yr. 2 – $47.9 Yr. 3 – $46.7 |
|
|
Yr. 1 – $3,027
Yr. 2 – $3,245 Yr. 3 – $3,434 |
|
|
$(53)
over 3 yrs. |
|
9.6 | % |
|
Yr. 1 – 10.35% -
11.59%: 40/60
11.6% - 12.59%:
> 12.59%: 10/90(e) |
|
||||||
|
CECONY – Steam(b) |
||||||||||||||||||||
|
October 2010 – September 2013 |
|
Yr. 1 – $49.5
Yr. 2 – $49.5 Yr. 3 – $17.8 |
(f) |
|
Yr. 1 – $1,589
Yr. 2 – $1,603 Yr. 3 – $1,613 |
|
|
$(20)
over 3 yrs. |
|
9.6 | % |
|
Yr. 1 – 10.35% -
11.59%: 40/60
11.6% - 12.59%:
>12.59%:10/90(e) |
|
||||||
|
O&R – Electric (NY) |
||||||||||||||||||||
|
July 2008 – June 2011 |
|
Yr. 1 – $15.6
Yr. 2 – $15.6 Yr. 3 – $ 5.7 |
(g) |
|
Yr. 1 – $504
Yr. 2 – $567 Yr. 3 – $597 |
|
|
$(34)
over 3 yrs. |
|
9.4 | % |
|
10.2% - 11.2% -
50/50 >11.2% - 25/75 |
|
||||||
|
O&R – Gas (NY) |
||||||||||||||||||||
|
November 2009 – October 2012 |
|
Yr. 1 – $9.0
Yr. 2 – $9.0 Yr. 3 – $4.6 |
(h) |
|
Yr. 1 – $280
Yr. 2 – $296 Yr. 3 – $309 |
|
|
$(2)
over 3 yrs. |
|
10.4 | % |
|
11.4% - 12.4% -
50/50 12.4% - 14% - 35/65 >14% - 10/90 |
|
||||||
| (a) | Subject to limitation for cost reconciliations described in Note B to the financial statements in Item 8. |
| (b) | Pursuant to NYSPSC orders, a portion of the company’s revenues is being collected subject to refund. See “Other Regulatory Matters” in Note B to the financial statements in Item 8. |
| (c) | The rate plan provides for a one-time surcharge of $133.5 million in Year 3. |
| (d) | In Yr. 2 and Yr. 3, 10.65% – 12.149%: 40/60, 12.15% – 13.149%: 25/75, and > 13.15%: 10/90. |
| (e) | In Yr. 2 and Yr. 3, 10.10% – 11.59%: 40/60, 11.60% – 12.59%: 25/75, and >12.6%: 10/90. |
| (f) | The rate plan provides for a one-time surcharge of $31.7 million in Year 3. |
| (g) | The rate plan provides for a one-time surcharge of $9.9 million in Year 3. |
| (h) | The rate plan provides for a one-time surcharge of $4.3 million in Year 3. |
Liability for Service Interruptions and Other Non-rate Conditions of Service
The tariff provisions under which CECONY provides electric, gas and steam service limit the company’s liability to pay for damages resulting from service interruptions to circumstances resulting from its gross negligence or willful misconduct.
CECONY’s tariff for electric service provides for reimbursement to electric customers for spoilage losses resulting from service interruptions in certain circumstances. In general, the company is obligated to reimburse affected residential and commercial customers for food spoilage of up to $450 and $9,000, respectively, and reimburse affected residential customers for prescription medicine spoilage losses without limitation on amount per claim. The company’s maximum aggregate liability for such reimbursement for an incident is $15 million. The company is not required to provide reimbursement to electric customers for outages attributable to generation or transmission system facilities or events beyond its control, such as storms, provided the company makes reasonable efforts to restore service as soon as practicable.
| 14 |
Table of Contents
Generic Proceedings
The NYSPSC from time to time conducts “generic” proceedings to consider issues relating to all electric and gas utilities operating in New York State. Pending proceedings have included those relating to utilities exiting the service of selling electric energy and gas at retail (including an examination of utilities’ provider of last resort responsibility, the utilities’ vision for the ‘smart grid’, the implementation of energy efficiency and renewable energy programs and consumer protections) and addressing any rate disincentives to the promotion of energy efficiency and distributed generation. The Utilities are typically active participants in such proceedings. The Utilities do not expect that these pending generic proceedings will have a material adverse effect on their financial positions, results of operation or liquidity. In February 2011, the NYSPSC initiated a proceeding to examine the existing mechanisms pursuant to which utilities recover site investigation and remediation costs and possible alternatives. See “Environmental Matters – CECONY” and “Environmental Matters – O&R,” below, and Note G to the financial statements in Item 8.
Federal Utility Regulation
The Federal Energy Regulatory Commission (FERC), among other things, regulates the transmission and wholesale sales of electricity in interstate commerce and the transmission and sale of natural gas for resale in interstate commerce. In addition, the FERC has the authority to impose penalties, which could be substantial, including penalties for the violation of reliability rules. Certain activities of the Utilities and the competitive energy businesses are subject to the jurisdiction of FERC. The Utilities are subject to regulation by the FERC with respect to electric transmission rates and to regulation by the NYSPSC with respect to electric and gas retail commodity sales and local delivery service. As a matter of practice, the NYSPSC has approved delivery service rates that include both distribution and transmission costs.
New York Independent System Operator (NYISO)
The NYISO is a not-for-profit organization that controls and operates most of the electric transmission facilities in New York State, including those of the Utilities, as an integrated system and administers wholesale markets for electricity in New York State. In addition to operating the state’s high voltage grid, the NYISO administers the energy, ancillary services and capacity markets. The New York State Reliability Council (NYSRC) promulgates reliability standards subject to FERC oversight. Pursuant to a requirement that is set annually by the NYSRC, the NYISO requires that entities supplying electricity to customers in New York State have generating capacity (either owned or contracted for) in an amount equal to the peak demand of their customers plus the applicable reserve margin. In addition, the NYISO has determined that entities that serve customers in New York City must have enough capacity that is electrically located in New York City to cover a substantial percentage (currently 80 percent; 81 percent effective May 2011) of the peak demands of their New York City customers. These requirements apply both to regulated utilities such as CECONY and O&R for the customers they supply under regulated tariffs and to companies such as Con Edison Solutions that supply customers on market terms. RECO, O&R’s New Jersey subsidiary, provides electric service in an area that has a different independent system operator – PJM Interconnection LLC (PJM).
Competition
Competition from suppliers of oil and other sources of energy, including distributed generation (such as solar, fuel cells and micro-turbines), may provide alternatives for the Utilities’ delivery customers. See “Rate Agreements” in Note B and “Recoverable Energy Costs” in Note A to the financial statements in Item 8.
The Utilities do not consider it reasonably likely that another company would be authorized to provide utility delivery service of electricity, natural gas or steam where the company already provides service. Any such other company would need to obtain NYSPSC consent, satisfy applicable local requirements, install facilities to provide the service, meet applicable services standards, and charge customers comparable taxes and other fees and costs imposed on the service.
| 15 |
Table of Contents
A new delivery company would also be subject to extensive ongoing regulation by the NYSPSC.
The competitive energy businesses participate in competitive energy supply and services businesses that are subject to different risks than those found in the businesses of the Utilities.
The Utilities
CECONY
CECONY, incorporated in New York State in 1884, is a subsidiary of Con Edison and has no significant subsidiaries of its own. Its principal business segments are its regulated electric, gas and steam businesses.
For a discussion of the company’s operating revenues and operating income for each segment, see “Results of Operations” in Item 7. For additional information about the segments, see Note N to the financial statements in Item 8.
Electric Operations
Electric Facilities
CECONY’s capitalized costs for utility plant, net of accumulated depreciation, for distribution facilities were $12,549 million and $11,824 million at December 31, 2010 and 2009, respectively. For its transmission facilities, the costs for utility plant, net of accumulated depreciation, were $2,150 million and $1,953 million at December 31, 2010 and 2009, respectively, and for its generation facilities, the costs for utility plant, net of accumulated depreciation, were $396 million and $392 million, at December 31, 2010 and 2009, respectively.
Distribution Facilities. CECONY owns 62 area distribution substations and various distribution facilities located throughout New York City and Westchester County. At December 31, 2010, the company’s distribution system had a transformer capacity of 28,997 MVA, with 36,781 miles of overhead distribution lines and 96,324 miles of underground distribution lines. The underground distribution lines represent the single longest underground electric delivery system in the United States. To continue its commitment to upgrade and reinforce its energy delivery infrastructure so that it can continue to safely and reliably meet electric demand, the company added one new substation, Newtown, in Queens in 2010.
Transmission Facilities. The company’s transmission facilities are located in New York City and Westchester, Orange, Rockland, Putnam and Dutchess counties in New York State. At December 31, 2010, CECONY owned or jointly owned 438 miles of overhead circuits operating at 138, 230, 345 and 500 kV and 740 miles of underground circuits operating at 69, 138 and 345 kV. The company’s 38 transmission substations and 62 area stations are supplied by circuits operated at 69 kV and above. In 2011, the company expects to complete a 9 1 / 2 mile transmission line connecting its Sprainbrook substation in Westchester County with the new Academy substation being constructed in upper Manhattan.
CECONY’s transmission facilities interconnect with those of National Grid, Central Hudson Gas & Electric Corporation, O&R, Iberdrola USA, Connecticut Light and Power Company, Long Island Power Authority, NYPA and Public Service Electric and Gas Company.
Generating Facilities. CECONY’s electric generating facilities consist of plants located in Manhattan with an aggregate capacity of 698 MW. The company expects to have sufficient amounts of gas and fuel oil available in 2011 for use in these facilities.
Electric Sales and Deliveries
CECONY delivers electricity to its full service customers who purchase electricity from the company. The company also delivers electricity to its customers who purchase electricity from other suppliers through the company’s retail access plan. In addition, the company delivers electricity to state and municipal customers of NYPA and economic development customers of municipal electric agencies.
| 16 |
Table of Contents
The company charges all customers in its service area for the delivery of electricity. The company generally recovers, on a current basis, the cost of the electricity that it buys and then sells to its full-service customers. It does not make any margin or profit on the electricity it sells. Effective April 2008, CECONY’s electric revenues became subject to a revenue decoupling mechanism. As a result, its electric delivery revenues are generally not affected by changes in delivery volumes from levels assumed when rates were approved. CECONY’s electric sales and deliveries, excluding off-system sales, for the last five years were:
| Year Ended December 31, | ||||||||||||||||||||
| 2006 | 2007 | 2008 | 2009 | 2010 | ||||||||||||||||
|
Electric Energy Delivered (millions of kWhs) |
||||||||||||||||||||
|
CECONY full service customers |
26,101 | 25,314 | 24,640 | 23,483 | 24,142 | |||||||||||||||
|
Delivery service for retail access customers |
19,256 | 21,532 | 22,047 | 21,859 | 23,098 | |||||||||||||||
|
Delivery service to NYPA customers and others |
10,227 | 10,692 | 10,918 | 10,650 | 10,834 | |||||||||||||||
|
Delivery service for municipal agencies |
724 | 723 | 718 | 675 | 619 | |||||||||||||||
|
Total Deliveries in Franchise Area |
56,308 | 58,261 | 58,323 | 56,667 | 58,693 | |||||||||||||||
|
Electric Energy Delivered ($ in millions) |
||||||||||||||||||||
|
CECONY full service customers |
$ | 5,108 | $ | 5,158 | $ | 5,569 | $ | 5,040 | $ | 5,546 | ||||||||||
|
Delivery service for retail access customers |
1,040 | 1,334 | 1,507 | 1,855 | 2,123 | |||||||||||||||
|
Delivery service to NYPA customers and others |
276 | 309 | 378 | 423 | 516 | |||||||||||||||
|
Delivery service for municipal agencies |
17 | 17 | 20 | 21 | 22 | |||||||||||||||
|
Other operating revenues |
611 | 622 | 404 | 335 | 169 | |||||||||||||||
|
Total Deliveries in Franchise Area |
$ | 7,052 | $ | 7,440 | $ | 7,878 | $ | 7,674 | $ | 8,376 | ||||||||||
|
Average Revenue per kWh Sold (Cents)(a) |
||||||||||||||||||||
|
Residential |
20.9 | 21.6 | 24.2 | 23.6 | 25.8 | |||||||||||||||
|
Commercial and Industrial |
18.3 | 19.2 | 21.2 | 19.6 | 20.4 | |||||||||||||||
| (a) | Includes Municipal Agency sales. |
For further discussion of the company’s electric operating revenues and its electric results, see “Results of Operations” in Item 7. For additional segment information, see Note N to the financial statements in Item 8.
Electric Peak Demand
The electric peak demand in CECONY’s service area occurs during the summer air conditioning season. The 2010 service area peak demand, which occurred on July 6, 2010, was 12,963 MW. The 2010 peak demand included an estimated 5,815 MW for CECONY’s full-service customers, 5,125 MW for customers participating in its electric retail access program and 2,023 MW for NYPA’s customers and municipal electric agency customers. The NYISO invoked demand reduction programs on July 6, 2010, as it had on peak demand days in some previous years (most recently 2006). “Design weather” for the electric system is a standard to which the actual peak demand is adjusted for evaluation and planning purposes. Since the majority of demand reduction programs are invoked only in specific circumstances, design conditions do not include these programs’ potential impact. However, the CECONY forecasted peak demand at design conditions does include the impact of permanent demand reduction programs. The company estimates that, under design weather conditions, the 2011 service area peak demand will be 13,275 MW, including an estimated 5,735 MW for its full-service customers, 5,450 MW for its electric retail access customers and 2,090 MW for NYPA’s customers and municipal electric agency customers. The company forecasts average annual growth of the peak electric demand in the company’s service area over the next five years at design conditions to be approximately 0.7 percent per year. The company continues to monitor the potential impact on customer demand from the current economic conditions.
Electric Supply
Most of the electricity sold by CECONY to its customers in 2010 was purchased under firm power contracts or through the wholesale electricity market
| 17 |
Table of Contents
administered by the NYISO. Con Edison expects that these resources will again be adequate to meet the requirements of its customers in 2011. The company plans to meet its continuing obligation to supply electricity to its customers through a combination of electricity purchased under contracts, purchased through the NYISO’s wholesale electricity market, or generated from its electricity generating facilities. For information about the company’s contracts for approximately 3,320 MW of electric generating capacity, see Notes I and O to the financial statements in Item 8. To reduce the volatility of its customers’ electric energy costs, the company has contracts to purchase electric energy and enters into derivative transactions to hedge the costs of a portion of its expected purchases under these contracts and through the NYISO’s wholesale electricity market.
CECONY owns generating stations in New York City associated primarily with its steam system. As of December 31, 2010, the generating stations had a combined electric capacity of approximately 698 MW, based on 2010 summer test ratings. For information about electric generating capacity owned by the company, see “Electric Operations – Electric Facilities – Generating Facilities”, above.
In general, the Utilities recover their purchased power costs, including the cost of hedging purchase prices, pursuant to rate provisions approved by the state public utility regulatory authority having jurisdiction. See “Financial and Commodity Market Risks – Commodity Price Risk,” in Item 7 and “Recoverable Energy Costs” in Note A to the financial statements in Item 8. From time to time, certain parties have petitioned the NYSPSC to review these provisions, the elimination of which could have a material adverse effect on the Companies’ financial position, results of operations or liquidity.
In a July 1998 order, the NYSPSC indicated that it “agree(s) generally that CECONY need not plan on constructing new generation as the competitive market develops,” but considers “overly broad” and did not adopt CECONY’s request for a declaration that, solely with respect to providing generating capacity, it will no longer be required to engage in long-range planning to meet potential demand and, in particular, that it will no longer have the obligation to construct new generating facilities, regardless of the market price of capacity. CECONY monitors the adequacy of the electric capacity resources and related developments in its service area, and works with other parties on long-term resource adequacy issues within the framework of the NYISO. In addition, the NYISO has adopted reliability rules that include obligations on transmission owners (such as CECONY) to construct facilities that may be needed for system reliability if the market does not solve a reliability need identified by the NYISO.
In 2009, the then Governor of New York announced a new goal of meeting 45 percent of the State’s electricity needs with energy efficiency or renewable resources by 2015. The goal is to be achieved by reducing electricity consumption by 15 percent, and having 30 percent of the electricity used in New York provided by renewable resources. Establishment of the renewable resources target began in September 2004, when the NYSPSC issued an order establishing a renewable portfolio standard (RPS) which provides that by 2013, 24 percent of the State’s energy needs would come from large renewable facilities (such as wind, hydro, and biomass) and smaller customer-sited renewable generation (limited to solar, fuel cells, and wind farm less than 300 kW in size), and 1 percent would come from green marketing efforts. The NYSPSC agreed with the Utilities that the responsibility for procuring the new renewable resources would rest with the New York State Energy Research and Development Authority (NYSERDA), and not the Utilities. In implementing the RPS for large renewable resources, NYSERDA enters into long-term agreements with developers, and pays the developers renewable premiums based on the facilities’ energy output. For customer-sited resources, NYSERDA provides rebates when customers install eligible renewable technologies. The renewable premiums, rebates, and NYSERDA’s administrative fee are financed through a volumetric charge imposed on the delivery customers of each of the state’s investor-owned utilities. Pursuant to the 2004 NYSPSC order, CECONY billed customers RPS surcharges of $33 million and $32 million in 2010 and 2009, respectively.
| 18 |
Table of Contents
These surcharges will increase as NYSERDA increases its renewables energy purchases. The NYSPSC issued an order in January 2010 formally increasing the RPS target to 30 percent by 2015 and requiring NYSPSC staff to develop a program to address the geographic balance of the RPS, setting-aside up to $30 million per year to be spent in the downstate region (including in the Utilities’ service territories) until 2015 for this purpose. Large renewable resources are grid-connected and sell their energy output in the wholesale energy market administered by the NYISO. As a result of the Utilities participation in the NYISO wholesale markets, a portion of the Utilities’ NYISO energy purchases are sourced from renewable resources. The energy produced by customer-sited renewables offsets the energy which the Utilities would otherwise have procured, thereby reducing the overall level of non-renewable energy consumed. In 2008, the NYSPSC issued an order authorizing the Utilities to begin implementing energy efficiency programs. Costs of the programs will be recovered primarily through a separate non-bypassable charge.
Gas Operations
Gas Facilities
CECONY’s capitalized costs for utility plant, net of accumulated depreciation, for gas facilities, which are primarily distribution facilities, were $3,153 million and $2,892 million at December 31, 2010 and 2009, respectively.
Natural gas is delivered by pipeline to CECONY at various points in its service territory and is distributed to customers by the company through an estimated 4,340 miles of mains and 385,396 service lines. The company owns a natural gas liquefaction facility and storage tank at its Astoria property in Queens, New York. The plant can store approximately 1,000 mdths of which a maximum of about 250 mdths can be withdrawn per day. The company has about 1,226 mdths of additional natural gas storage capacity at a field in upstate New York, owned and operated by Honeoye Storage Corporation, a corporation 28.8 percent owned by CECONY and 71.2 percent owned by Con Edison Development.
Gas Sales and Deliveries
The company generally recovers the cost of the gas that it buys and then sells to its firm sales customers. It does not make any margin or profit on the gas it sells. CECONY’s gas revenues are subject to a weather normalization clause and, effective October 2007, a revenue decoupling mechanism. As a result, its gas delivery revenues are generally not affected by changes in delivery volumes from levels assumed when rates were approved.
CECONY’s gas sales and deliveries for the last five years were:
| Year Ended December 31, | ||||||||||||||||||||
| 2006 | 2007 | 2008 | 2009 | 2010 | ||||||||||||||||
|
Gas Delivered (mdth) |
||||||||||||||||||||
|
Firm Sales |
||||||||||||||||||||
|
Full service |
71,858 | 73,734 | 68,943 | 67,994 | 63,592 | |||||||||||||||
|
Firm transportation |
23,688 | 39,017 | 43,245 | 48,671 | 51,859 | |||||||||||||||
|
Total Firm Sales and Transportation |
95,546 | 112,751 | 112,188 | 116,665 | 115,451 | |||||||||||||||
|
Interruptible Sales(a) |
11,995 | 10,577 | 11,220 | 8,225 | 8,521 | |||||||||||||||
|
Total Gas Sold to CECONY Customers |
107,541 | 123,328 | 123,408 | 124,890 | 123,972 | |||||||||||||||
|
Transportation of customer-owned gas |
||||||||||||||||||||
|
NYPA |
41,057 | 42,085 | 44,694 | 37,764 | 24,890 | |||||||||||||||
|
Other (mainly generating plants) |
83,688 | 95,260 | 94,086 | 86,454 | 99,666 | |||||||||||||||
|
Off-System Sales |
691 | 2,325 | 154 | 1 | 7 | |||||||||||||||
|
Total Sales and Transportation |
232,977 | 262,998 | 262,342 | 249,109 | 248,535 | |||||||||||||||
| (a) | Includes 3,385, 2,851, 2,955, 2,043 and 462 mdths for 2010, 2009, 2008, 2007 and 2006 respectively, which are also reflected in firm transportation and other. |
| 19 |
Table of Contents
| Year Ended December 31, | ||||||||||||||||||||
| 2006 | 2007 | 2008 | 2009 | 2010 | ||||||||||||||||
|
Gas Delivered ($ in millions) |
||||||||||||||||||||
|
Firm Sales |
||||||||||||||||||||
|
Full service |
$ | 1,252 | $ | 1,341 | $ | 1,332 | $ | 1,229 | $ | 1,099 | ||||||||||
|
Firm transportation |
105 | 168 | 202 | 266 | 347 | |||||||||||||||
|
Total Firm Sales and Transportation |
1,357 | 1,509 | 1,534 | 1,495 | 1,446 | |||||||||||||||
|
Interruptible Sales |
121 | 88 | 138 | 75 | 60 | |||||||||||||||
|
Total Gas Sold to CECONY Customers |
1,478 | 1,597 | 1,672 | 1,570 | 1,506 | |||||||||||||||
|
Transportation of customer-owned gas |
||||||||||||||||||||
|
NYPA |
4 | 4 | 4 | 4 | 2 | |||||||||||||||
|
Other (mainly generating plants) |
76 | 76 | 85 | 73 | 87 | |||||||||||||||
|
Off-System Sales |
5 | 17 | 1 | — | — | |||||||||||||||
|
Other operating revenues (mainly regulatory amortizations) |
50 | 65 | 77 | 54 | (54 | ) | ||||||||||||||
|
Total Sales and Transportation |
$ | 1,613 | $ | 1,759 | $ | 1,839 | $ | 1,701 | $ | 1,541 | ||||||||||
|
Average Revenue per dth Sold |
||||||||||||||||||||
|
Residential |
$ | 19.24 | $ | 19.78 | $ | 21.15 | $ | 20.33 | $ | 19.31 | ||||||||||
|
General |
$ | 15.07 | $ | 16.01 | $ | 16.77 | $ | 14.91 | $ | 14.28 | ||||||||||
For further discussion of the company’s gas operating revenues and its gas results, see “Results of Operations” in Item 7. For additional segment information, see Note N to the financial statements in Item 8.
Gas Peak Demand
The gas peak demand for firm service customers in CECONY’s service area occurs during the winter heating season. The daily peak day demand during the winter 2010/2011 (through January 25, 2011) occurred on January 23, 2011 when the demand reached 891 mdths. The 2010/2011 winter demand included an estimated 587 mdths for CECONY’s full-service customers and 304 mdths for customers participating in its gas retail access program. “Design weather” for the gas system is a standard to which the actual peak demand is adjusted for evaluation and planning purposes. The company estimates that under design weather conditions the 2011/2012 service area peak demand will be 1,151 mdths, including an estimated 675 mdths for its full-service customers and 475 mdths for its retail access customers. The company forecasts average annual growth of the peak gas demand over the next five years at design conditions to be approximately 1.1 percent in its service area. The forecasted peak demand at design conditions does not include gas used by interruptible gas customers or in generating stations (electricity and steam). The company continues to monitor the potential impact on customer demand from the current economic conditions.
Gas Supply
CECONY and O&R have combined their gas requirements, and contracts to meet those requirements, into a single portfolio. The combined portfolio is administered by, and related management services are provided by, CECONY (for itself and as agent for O&R) and costs are allocated between the Utilities in accordance with provisions approved by the NYSPSC. See Note S to the financial statements in Item 8.
Charges from suppliers for the firm purchase of gas, which are based on formulas or indexes or are subject to negotiation, are generally designed to approximate market prices. The gas supply contracts are for various terms extending to 2014. The Utilities have contracts with interstate pipeline companies for the purchase of firm transportation from upstream points where gas has been purchased to the Utilities’ distribution systems, and for upstream storage services. Charges under these transportation and storage contracts are approved by the FERC. Such contracts are for various terms extending to 2023. The Utilities are required to pay certain fixed charges under the supply, transportation and storage contracts whether or not the contracted capacity is actually used. These fixed charges amounted to approximately $246 million in 2010, including $205 million for CECONY. See “Contractual Obligations” below. In addition, the Utilities purchase gas on the spot market and contract for interruptible gas transportation. See “Recoverable Energy Costs” in Note A to the financial statements in Item 8.
| 20 |
Table of Contents
Steam Operations
Steam Facilities
CECONY’s capitalized costs for utility plant, net of accumulated depreciation for steam facilities were $1,617 million and $1,555 million at December 31, 2010 and 2009, respectively.
CECONY generates steam at one steam-electric generating station and five steam-only generating stations and distributes steam to its customers through approximately 106 miles of transmission, distribution, and service piping.
Steam Sales and Deliveries
CECONY’s steam sales and deliveries for the last five years were:
| Year Ended December 31, | ||||||||||||||||||||
| 2006 | 2007 | 2008 | 2009 | 2010 | ||||||||||||||||
|
Steam Sold (MMlbs) |
||||||||||||||||||||
|
General |
515 | 589 | 785 | 786 | 257 | |||||||||||||||
|
Apartment house |
6,774 | 7,519 | 6,614 | 5,962 | 5,870 | |||||||||||||||
|
Annual power |
15,961 | 17,696 | 16,577 | 16,269 | 16,903 | |||||||||||||||
|
Total Steam Delivered to CECONY Customers |
23,250 | 25,804 | 23,976 | 23,017 | 23,030 | |||||||||||||||
|
Steam Sold ($ in millions) |
||||||||||||||||||||
|
General |
$ | 21 | $ | 23 | $ | 23 | $ | 28 | $ | 21 | ||||||||||
|
Apartment house |
174 | 188 | 186 | 165 | 160 | |||||||||||||||
|
Annual power |
405 | 443 | 468 | 446 | 459 | |||||||||||||||
|
Other operating revenues |
23 | 32 | 30 | 22 | 16 | |||||||||||||||
|
Total Steam Delivered to CECONY Customers |
$ | 623 | $ | 686 | $ | 707 | $ | 661 | $ | 656 | ||||||||||
|
Average Revenue per Mlb Sold |
$ | 25.81 | $ | 25.34 | $ | 28.24 | $ | 27.76 | $ | 27.79 | ||||||||||
For further discussion of the company’s steam operating revenues and its steam results, see “Results of Operations” in Item 7. For additional segment information, see Note N to the financial statements in Item 8.
Steam Peak Demand and Capacity
Demand for steam in CECONY’s service area peaks during the winter heating season. The one-hour peak demand during the winter of 2010/2011 (through January 25, 2011) occurred on January 24, 2011 when the demand reached 8,924 MMlbs per hour. The company’s estimate for the winter of 2011/2012 peak demand of its steam customers is 9,780 MMlbs per hour under design criteria, which assumes severe weather.
On December 31, 2010, the steam system had the capability of delivering approximately 13.3 MMlbs of steam per hour, and CECONY estimates that the system will have the capability to deliver 11.8 MMlbs of steam per hour in the 2011/2012 winter.
Steam Supply
Forty-four percent of the steam produced by CECONY in 2010 was supplied by the company’s steam-only generating assets; 41 percent was produced by the company’s steam-electric generating assets, where steam and electricity are primarily cogenerated; and 15 percent was purchased under an agreement with Brooklyn Navy Yard Cogeneration Partners L.P.
O&R
Electric Operations
Electric Facilities
O&R’s capitalized costs for utility plant, net of accumulated depreciation, for distribution facilities were $642 million and $618 million at December 31, 2010 and 2009, respectively. For its transmission facilities, the costs for utility plant, net of accumulated depreciation, were $134 million and $137 million at December 31, 2010 and 2009, respectively.
O&R, RECO and Pike, own, in whole or in part, transmission and distribution facilities which include 554 circuit miles of transmission lines, 13 transmission substations, 61 distribution substations, 84,809 in-service line transformers, 3,774 pole miles of overhead distribution lines and 1,727 miles of underground distribution lines. O&R’s transmission
| 21 |
Table of Contents
system is part of the NYISO system except that portions of RECO’s system are located within the transmission area controlled by the PJM.
Electric Sales and Deliveries
O&R generally recovers, on a current basis, the cost of the electricity that it buys and then sells to its full-service customers. It does not make any margin or profit on the electricity it sells. Effective July 2008, O&R’s New York electric revenues (which accounted for 66.7 percent of O&R’s electric revenues in 2010) became subject to a revenue decoupling mechanism. As a result, O&R’s New York electric delivery revenues are generally not affected by charges in delivery volumes from levels assumed when rates were approved. O&R’s electric sales in New Jersey and Pennsylvania are not subject to a decoupling mechanism. O&R’s electric sales and deliveries, excluding off-system sales for the last five years were:
| Year Ended December 31, | ||||||||||||||||||||
| 2006 | 2007 | 2008 | 2009 | 2010 | ||||||||||||||||
|
Electric Energy Delivered (millions of kWhs) |
||||||||||||||||||||
|
Total deliveries to O&R full service customers |
4,010 | 4,224 | 4,093 | 3,673 | 3,498 | |||||||||||||||
|
Delivery service for retail access customers |
1,766 | 1,688 | 1,814 | 1,901 | 2,330 | |||||||||||||||
|
Total Deliveries In Franchise Area |
5,776 | 5,912 | 5,907 | 5,574 | 5,828 | |||||||||||||||
|
Electric Energy Delivered ($ in millions) |
||||||||||||||||||||
|
Total deliveries to O&R full service customers |
$ | 503 | $ | 596 | $ | 650 | $ | 551 | $ | 570 | ||||||||||
|
Delivery service for retail access customers |
76 | 73 | 80 | 95 | 132 | |||||||||||||||
|
Other operating revenues |
3 | 2 | 3 | 2 | (10 | ) | ||||||||||||||
|
Total Deliveries In Franchise Area |
$ | 582 | $ | 671 | $ | 733 | $ | 648 | $ | 692 | ||||||||||
|
Average Revenue Per kWh Sold (Cents) |
||||||||||||||||||||
|
Residential |
14.0 | 15.6 | 17.4 | 17.2 | 18.3 | |||||||||||||||
|
Commercial and Industrial |
11.3 | 12.9 | 14.6 | 13.3 | 14.1 | |||||||||||||||
For further discussion of the company’s electric operating revenues and its electric results, see “Results of Operations” in Item 7. For additional segment information, see Note N to the financial statements in Item 8.
Electric Peak Demand
The electric peak demand in O&R’s service area occurs during the summer air conditioning season. The 2010 service area peak demand, which occurred on July 6, 2010, was 1,572 MW. The 2010 peak demand included an estimated 1,034 MW for O&R’s full-service customers and 538 MW for customers participating in its electric retail access program. The NYISO did not invoke demand reduction programs. “Design weather” for the electric system is a standard to which the actual peak demand is adjusted for evaluation and planning purposes. Since the majority of demand reduction programs are invoked only in specific circumstances, design conditions do not include these programs’ potential impact. However, the O&R forecasted peak demand at design conditions does include the impact of permanent demand reduction programs. The company estimates that, under design weather conditions, the 2011 service area peak demand will be 1,600 MW, including an estimated 1,046 MW for its full-service customers and 554 MW for its electric retail access customers. The company forecasts average annual growth of the peak electric demand in the company’s service area over the next five years at design conditions to be approximately 1.7 percent per year. The company continues to monitor the potential impact on customer demand from the current economic conditions.
Electric Supply
The electricity O&R sold to its customers in 2010 was purchased under firm power contracts or through the wholesale electricity markets administered by the NYISO and PJM. The company expects that these resources will again be adequate to meet the requirements of its customers in 2011. O&R does not own any electric generating capacity.
| 22 |
Table of Contents
Gas Operations
Gas Facilities
O&R’s capitalized costs for utility plant, net of accumulated depreciation for gas facilities, which are primarily distribution facilities, were $382 million and $334 million at December 31, 2010 and 2009, respectively. O&R and Pike own their gas distribution systems, which include 1,744 miles of mains. In addition, O&R owns a gas transmission system, which includes 81 miles of mains.
Gas Sales and Deliveries
O&R generally recovers the cost of the gas that it buys and then sells to its firm sales customers. It does not make any margin or profit on the gas it sells. O&R’s gas revenues are subject to a weather normalization clause. Effective November 2009, O&R’s New York gas revenues (which accounted for substantially all of O&R’s gas revenues in 2009) became subject to a revenue decoupling mechanism. As a result, its gas delivery revenues are generally not affected by changes in delivery volumes from levels assumed when rates were approved. O&R’s gas deliveries and sales for the last five years were:
| Year Ended December 31, | ||||||||||||||||||||
| 2006 | 2007 | 2008 | 2009 | 2010 | ||||||||||||||||
|
Gas delivered (mdth) |
||||||||||||||||||||
|
Firm Sales |
||||||||||||||||||||
|
Full service |
9,650 | 10,835 | 9,884 | 9,561 | 8,772 | |||||||||||||||
|
Firm transportation |
9,058 | 10,248 | 10,471 | 10,905 | 10,692 | |||||||||||||||
|
Total Firm Sales and Transportation |
18,708 | 21,083 | 20,355 | 20,466 | 19,464 | |||||||||||||||
|
Interruptible Sales |
2,600 | 2,652 | 2,567 | 2,390 | 675 | |||||||||||||||
|
Total Gas Sold To O&R Customers |
21,308 | 23,735 | 22,922 | 22,856 | 20,139 | |||||||||||||||
|
Transportation of customer-owned gas |
||||||||||||||||||||
|
Interruptible transportation |
3,256 | 3,331 | 2,842 | 2,112 | 3,822 | |||||||||||||||
|
Sales for resale |
939 | 1,044 | 1,007 | 953 | 840 | |||||||||||||||
|
Sales to electric generating stations |
3,036 | 4,552 | 2,327 | 1,346 | 691 | |||||||||||||||
|
Off-System Sales |
372 | 455 | 249 | 624 | 1 | |||||||||||||||
|
Total Sales and Transportation |
28,911 | 33,117 | 29,347 | 27,891 | 25,493 | |||||||||||||||
|
Gas delivered ($ in millions) |
||||||||||||||||||||
|
Firm Sales |
||||||||||||||||||||
|
Full service |
$ | 166 | $ | 186 | $ | 172 | $ | 159 | $ | 131 | ||||||||||
|
Firm transportation |
32 | 39 | 45 | 51 | 65 | |||||||||||||||
|
Total Firm Sales and Transportation |
198 | 225 | 217 | 210 | 196 | |||||||||||||||
|
Interruptible Sales |
28 | 25 | 27 | 21 | 9 | |||||||||||||||
|
Total Gas Sold To O&R Customers |
226 | 250 | 244 | 231 | 205 | |||||||||||||||
|
Transportation of customer-owned gas |
||||||||||||||||||||
|
Sales to electric generating stations |
3 | 3 | 4 | 2 | — | |||||||||||||||
|
Other operating revenues |
7 | 12 | 10 | 9 | 13 | |||||||||||||||
|
Total Sales and Transportation |
$ | 236 | $ | 265 | $ | 258 | $ | 242 | $ | 218 | ||||||||||
|
Average Revenue Per dth Sold |
||||||||||||||||||||
|
Residential |
$ | 17.38 | $ | 17.31 | $ | 17.64 | $ | 16.86 | $ | 15.20 | ||||||||||
|
General |
$ | 16.44 | $ | 16.36 | $ | 16.55 | $ | 15.58 | $ | 13.64 | ||||||||||
For further discussion of the company’s gas operating revenues and its gas results, see “Results of Operations” in Item 7. For additional segment information, see Note N to the financial statements in Item 8.
Gas Peak Demand
The gas peak demand for firm service customers in O&R’s service area occurs during the winter heating season. The daily peak day demand during the winter 2010/2011 (through January 31, 2011) occurred on January 23, 2011 when the demand reached 176 mdths. The 2010/2011 winter demand included an estimated 87 mdths for O&R’s full-service customers and 89 mdths for customers participating in its gas retail access program. “Design weather” for the gas system is a standard to which the actual peak demand is adjusted
| 23 |
Table of Contents
for evaluation and planning purposes. The company estimates that under design weather conditions the 2011/2012 service area peak demand will be 224 mdths, including an estimated 110 mdths for its full-service customers and 114 mdths for its retail access customers. The company forecasts average annual growth of the peak gas demand over the next five years at design conditions to be approximately 1.6 percent in the company’s service area. The forecasted peak demand at design conditions does not include gas used by interruptible gas customers or in generating stations. The company continues to monitor the potential impact on customer demand from the current economic conditions.
Gas Supply
O&R and CECONY have combined their gas requirements and purchase contracts to meet those requirements into a single portfolio. See “CECONY – Gas Operations – Gas Supply” above.
Competitive Energy Businesses
Con Edison pursues competitive energy opportunities through three wholly-owned subsidiaries: Con Edison Solutions, Con Edison Energy and Con Edison Development. These businesses include the sales and related hedging of electricity to wholesale and retail customers, sales of certain energy-related products and services, and participation in energy infrastructure projects. At December 31, 2010, Con Edison’s equity investment in its competitive energy businesses was $337 million and their assets amounted to $807 million.
The competitive energy businesses are pursuing opportunities to invest in renewable generation and energy-related infrastructure projects.
Con Edison Solutions
Con Edison Solutions primarily sells electricity to industrial, commercial and governmental customers in the northeastern United States and Texas. It also sells electricity to residential and small commercial customers in the northeastern United States. Con Edison Solutions does not sell electricity to the Utilities. Con Edison Solutions sells electricity to customers who are provided delivery service by the Utilities. It also provides energy efficiency services, procurement and management services to companies and governmental entities throughout most of the United States.
Con Edison Solutions was reported by KEMA, Inc. in September 2010 to be the 9th largest non-residential retail electricity provider in the United States. Most of the company’s electricity sales volumes are to industrial, large commercial and government customers. The company also sells to two retail aggregation entities in Massachusetts and to individual residential and small commercial (mass market) customers in the northeastern United States. At December 31, 2010, it served approximately 115,000 customers, not including approximately 165,000 served under the two aggregation agreements. Con Edison Solutions sold 15,993 million kWhs of electricity in 2010, a 26 percent increase from 2009 volumes.
| 2006 | 2007 | 2008 | 2009 | 2010 | ||||||||||||||||
|
Retail electric volumes sold (millions of kWhs) |
10,633 | 12,209 | 10,749 | 12,723 | 15,993 | |||||||||||||||
|
Number of retail customers accounts:(a) |
||||||||||||||||||||
|
Industrial and large commercial |
10,957 | 14,335 | 14,491 | 26,009 | 29,561 | |||||||||||||||
|
Mass market |
31,725 | 33,979 | 39,976 | 49,094 | 85,191 | |||||||||||||||
| (a) | Excludes aggregation agreement customers |
Con Edison Solutions seeks to serve customers in utility service territories that encourage retail competition through transparent pricing, purchase of receivables programs or utility-sponsored customer acquisition programs. The company currently sells electricity in the service territories of 43 utilities in the states of New York, Massachusetts, Connecticut, New Hampshire, Maine, New Jersey, Delaware, Maryland, Illinois, Pennsylvania and Texas, as well as the District of Columbia.
Total peak load at the end of 2010 was 5,300 MWs. Approximately 34 percent of the sales volumes were in New York, 27 percent in New England, 31 percent in PJM and the remainder in Texas.
| 24 |
Table of Contents
Con Edison Solutions offers the choice of green power to customers. In 2010, it sold approximately 233 million kWhs of green power, ending the year with almost 24,000 customers. Green power is a term used by electricity suppliers to describe electricity produced from renewable energy sources, including wind, hydro and solar.
Con Edison Solutions also provides energy- efficiency services to government and commercial customers. The services include the design and installation of lighting retrofits, high-efficiency heating, ventilating and air conditioning equipment and other energy saving technologies. The company is compensated for their services based primarily on the increased energy efficiency of the installed equipment over a multi-year period. Con Edison Solutions has won competitive solicitations for energy savings contracts with the Department of Energy and the Department of Defense, and a shared energy savings contract with the United States Postal Service.
Con Edison Energy
Con Edison Energy manages the output and fuel requirements for over 7,700 MW of third-party generating plants in the northeastern United States. The company also provides wholesale hedging and risk management services to Con Edison Solutions and Con Edison Development. In addition, the company sells electricity to utilities in the northeastern United States, primarily under fixed price contracts, which they use to supply their full-service customers.
| 2006 | 2007 | 2008 | 2009 | 2010 | ||||||||||||||||
|
Wholesale electricity sales (millions of kWh)(a) |
6,549 | 8,046 | 7,798 | 5,472 | 3,610 | |||||||||||||||
| (a) | Prior to 2008, wholesale electricity sales were reported as part of Con Edison Development. |
Con Edison Development
Con Edison Development participates in energy infrastructure projects. The company’s investments include ownership interests in solar energy projects being constructed with an aggregate capacity of 13 MW, a gas storage corporation (see “CECONY – Gas Operations – Gas Facilities,” above), an investment in an affordable housing partnership and leasehold interests in a gas-fired plant and a gas distribution network in the Netherlands (see Note J to the financial statements in Item 8). Con Edison Development and its subsidiary, CSD/SCS Newington, LLC, completed the sale of their ownership interests in electricity generating plants with an aggregate capacity of approximately 1,706 MW in the second quarter of 2008. See Note U to the financial statements in Item 8.
| 2006 | 2007 | 2008 | 2009 | 2010 | ||||||||||||||||
|
Generating capacity (MW) |
1,668 | 1,739 | 21 | 21 | — | |||||||||||||||
|
Generation sold (millions of kWh) |
3,155 | 3,558 | 1,422 | — | — | |||||||||||||||
Capital Requirements and Resources
Capital Requirements
The following table contains the Companies’ capital requirements for the years 2008 through 2010 and their current estimate of amounts for 2011 through 2013.
| Actual | Estimate | |||||||||||||||||||||||
| (millions of dollars) | 2008 | 2009 | 2010 | 2011 | 2012 | 2013 | ||||||||||||||||||
|
Regulated utility construction expenditures(a) |
||||||||||||||||||||||||
|
CECONY(b) |
$ | 2,202 | $ | 2,057 | $ | 1,866 | $ | 1,850 | $ | 1,851 | $ | 1,852 | ||||||||||||
|
O&R |
120 | 127 | 135 | 142 | 146 | 153 | ||||||||||||||||||
|
Total regulated utility construction expenditures |
2,322 | 2,184 | 2,001 | 1,992 | 1,997 | 2,005 | ||||||||||||||||||
|
Competitive energy businesses capital expenditures |
4 | 10 | 28 | 131 | 172 | 182 | ||||||||||||||||||
|
Sub-total |
2,326 | 2,194 | 2,029 | 2,123 | 2,169 | 2,187 | ||||||||||||||||||
|
Retirement of long-term securities(c) |
||||||||||||||||||||||||
|
Con Edison – parent company |
204 | 4 | 3 | 1 | 1 | 2 | ||||||||||||||||||
|
CECONY |
280 | 655 | 850 | — | 300 | 700 | ||||||||||||||||||
|
O&R |
3 | 3 | 158 | 3 | 3 | 3 | ||||||||||||||||||
|
Competitive energy businesses |
— | — | — | 1 | 1 | 1 | ||||||||||||||||||
|
Total retirement of long-term securities |
487 | 662 | 1,011 | 5 | 305 | 706 | ||||||||||||||||||
|
Total |
$ | 2,813 | $ | 2,856 | $ | 3,040 | $ | 2,128 | $ | 2,474 | $ | 2,893 | ||||||||||||
| (a) | Estimates for 2011-2013 include an aggregate $136 million for one-half of the costs of certain smart electric grid projects for which the company has been selected by the U.S. Department of Energy for negotiations to receive grants for the other half of the projects’ costs under the American Recovery and Reinvestment Act of 2009. |
| 25 |
Table of Contents
| (b) | CECONY’s capital expenditures for environmental protection facilities and related studies were $133 million and $148 million in 2010 and 2009, respectively, and are estimated to be $167 million in 2011. |
| (c) | For 2008, 2009 and 2010, includes long-term securities redeemed in advance of maturity. |
The Utilities have an ongoing need for substantial capital investment in order to meet the growth in demand for electricity, and electric, gas and steam reliability needs.
The estimated capital expenditures for the competitive energy businesses reflect potential investments in renewable generation and energy infrastructure projects and could significantly increase or decrease from the amounts estimated depending on market conditions and opportunities.
Contractual Obligations
The following table summarizes the Companies’ material obligations at December 31, 2010 to make payments pursuant to contracts. Long-term debt, capital lease obligations and other long-term liabilities are included on their balance sheets. Operating leases and electricity purchase agreements (for which undiscounted future annual payments are shown) are described in the notes to the financial statements.
| (millions of dollars) | Payments Due by Period | |||||||||||||||||||
| Total |
1 year
or less |
Years 2 & 3 |
Years 4 & 5 |
After 5
years |
||||||||||||||||
|
Long-term debt (Statement of Capitalization) |
||||||||||||||||||||
|
CECONY |
$ | 9,761 | $ | — | $ | 1,000 | $ | 825 | $ | 7,936 | ||||||||||
|
O&R |
613 | 3 | 6 | 146 | 458 | |||||||||||||||
|
Competitive energy businesses and parent |
321 | 2 | 5 | 5 | 309 | |||||||||||||||
|
Interest on long-term debt(a) |
9,119 | 572 | 1,091 | 996 | 6,460 | |||||||||||||||
|
Total long-term debt, including interest |
19,814 | 577 | 2,102 | 1,972 | 15,163 | |||||||||||||||
|
Capital lease obligations (Note J) |
||||||||||||||||||||
|
CECONY |
16 | 8 | 6 | — | 2 | |||||||||||||||
|
Total capital lease obligations |
16 | 8 | 6 | — | 2 | |||||||||||||||
|
Operating leases (Notes J and Q) |
||||||||||||||||||||
|
CECONY |
269 | 43 | 92 | 51 | 83 | |||||||||||||||
|
O&R |
6 | 1 | 1 | 1 | 3 | |||||||||||||||
|
Competitive energy businesses |
17 | 2 | 4 | 3 | 8 | |||||||||||||||
|
Total operating leases |
292 | 46 | 97 | 55 | 94 | |||||||||||||||
|
Purchase obligations |
||||||||||||||||||||
|
Electricity purchase power agreements – Utilities (Note I) |
||||||||||||||||||||
|
CECONY |
||||||||||||||||||||
|
Energy(b) |
8,428 | 741 | 1,323 | 1,200 | 5,164 | |||||||||||||||
|
Capacity |
3,247 | 480 | 960 | 636 | 1,171 | |||||||||||||||
|
Total CECONY |
11,675 | 1,221 | 2,283 | 1,836 | 6,335 | |||||||||||||||
|
O&R |
||||||||||||||||||||
|
Energy and Capacity(b) |
159 | 99 | 60 | — | — | |||||||||||||||
|
Total electricity and purchase power agreements – Utilities |
11,834 | 1,320 | 2,343 | 1,836 | 6,335 | |||||||||||||||
|
Natural gas supply, transportation, and storage contracts – Utilities(c) |
||||||||||||||||||||
|
CECONY |
||||||||||||||||||||
|
Natural gas supply |
321 | 198 | 123 | — | — | |||||||||||||||
|
Transportation and storage |
978 | 147 | 250 | 176 | 405 | |||||||||||||||
|
Total CECONY |
1,299 | 345 | 373 | 176 | 405 | |||||||||||||||
|
O&R |
||||||||||||||||||||
|
Natural gas supply |
41 | 25 | 16 | — | — | |||||||||||||||
|
Transportation and storage |
182 | 26 | 46 | 33 | 77 | |||||||||||||||
|
Total O&R |
223 | 51 | 62 | 33 | 77 | |||||||||||||||
|
Total natural gas supply, transportation and storage contracts |
1,522 | 396 | 435 | 209 | 482 | |||||||||||||||
| 26 |
Table of Contents
| (millions of dollars) | Payments Due by Period | |||||||||||||||||||
| Total |
1 year
or less |
Years 2 & 3 |
Years 4 & 5 |
After 5
years |
||||||||||||||||
|
Other purchase obligations(d) |
||||||||||||||||||||
|
CECONY |
3,490 | 2,001 | 1,154 | 268 | 67 | |||||||||||||||
|
O&R |
178 | 117 | 52 | 6 | 3 | |||||||||||||||
|
Total other purchase obligations |
3,668 | 2,118 | 1,206 | 274 | 70 | |||||||||||||||
|
Competitive energy businesses commodity and service agreements(e) |
146 | 116 | 23 | 2 | 5 | |||||||||||||||
|
Uncertain income taxes (Note L) |
||||||||||||||||||||
|
CECONY |
79 | 79 | — | — | — | |||||||||||||||
|
O&R |
8 | 8 | — | — | — | |||||||||||||||
|
Competitive energy businesses and parent |
(3 | ) | (3 | ) | — | — | — | |||||||||||||
|
Total uncertain income taxes |
84 | 84 | — | — | — | |||||||||||||||
|
Total |
$ | 37,376 | $ | 4,665 | $ | 6,212 | $ | 4,348 | $ | 22,151 | ||||||||||
| (a) | Includes interest on variable rate debt calculated at rates in effect at December 31, 2010. |
| (b) | Included in these amounts is the cost of minimum quantities of energy that the company is obligated to purchase at both fixed and variable prices. |
| (c) | Included in these amounts is the cost of minimum quantities of natural gas supply, transportation and storage that the Utilities are obligated to purchase at both fixed and variable prices. |
| (d) | Amounts shown for other purchase obligations, which reflect capital and operations and maintenance costs incurred by the Utilities in running their day-to-day operations, were derived from the Utilities’ purchasing systems as the difference between the amounts authorized and the amounts paid (or vouchered to be paid) for each obligation. For many of these obligations, the Utilities are committed to purchase less than the amount authorized. Payments for the “Other Purchase Obligations” are generally assumed to be made ratably over the term of the obligations. The Utilities believe that unreasonable effort and expense would be involved to modify their purchasing systems to enable them to report their “Other Purchase Obligations” in a different manner. |
| (e) | Amounts represent commitments to purchase minimum quantities of electric energy and capacity, renewable energy certificates, natural gas, natural gas pipeline capacity, energy efficiency services and construction services entered into by Con Edison’s competitive energy businesses. |
The Companies’ commitments to make payments in addition to these contractual commitments include their other liabilities reflected in their balance sheets, any funding obligations for their pension and other postretirement benefit plans, financial hedging activities, their collective bargaining agreements and Con Edison’s guarantees of certain obligations of its businesses. See Notes E, F, O and “Guarantees” in Note H to the financial statements in Item 8.
Capital Resources
Con Edison is a holding company that operates only through its subsidiaries and has no material assets other than its interests in its subsidiaries. Con Edison expects to finance its capital requirements primarily through internally-generated funds and the sale of its securities, including meeting all of its common equity needs in 2011 by issuing shares under its dividend reinvestment and employee stock plans. Con Edison’s ability to make payments on its external borrowings and dividends on its common shares is also dependent on its receipt of dividends from its subsidiaries or proceeds from the sale of its securities or its interests in its subsidiaries.
For information about restrictions on the payment of dividends by the Utilities and significant debt covenants, see Note C to the financial statements in Item 8.
For information on the Companies’ commercial paper program and revolving credit agreements with banks, see Note D to the financial statements in Item 8.
The Utilities expect to finance their operations, capital requirements and payment of dividends to Con Edison from internally-generated funds (see “Liquidity and Capital Resources – Cash Flows from Operating Activities” in Item 7), contributions of equity capital from Con Edison and external borrowings, including the issuance in 2011 of long-term debt of up to $600 million.
The Companies require access to the capital markets to fund capital requirements that are substantially in excess of available internally-generated funds. See “Capital Requirements,” above. Each of the Companies believes that it will continue to be able to access capital, although capital market conditions may affect the timing of the Companies’ financing activities. The Companies monitor the availability and costs of various forms of capital, and will seek to issue Con Edison common stock and other securities when it is necessary or advantageous to do so. For information about the Companies’ long-term debt and short-term borrowing, see Notes C and D to the financial statements in Item 8.
| 27 |
Table of Contents
In 2009, the NYSPSC authorized CECONY and O&R to issue up to $4,800 million and $500 million of securities, respectively (of which up to $550 million and $100 million, respectively, may be preferred stock and up to the entire amount authorized may be debt securities). At December 31, 2010, CECONY and O&R had issued $1,470 million and $190 million, respectively, of debt securities pursuant to such authorization. In addition, the NYSPSC has authorized the Utilities’ to refund outstanding debt securities and preferred stock should the Utilities determine that it is economic to do so.
Con Edison’s competitive energy businesses have financed their operations and capital requirements primarily with capital contributions and borrowings from Con Edison, internally-generated funds and external borrowings.
For each of the Companies, the ratio of earnings to fixed charges (SEC basis) for the last five years was:
| Earnings to Fixed Charges (Times) | ||||||||||||||||||||
| 2006 | 2007 | 2008 | 2009 | 2010 | ||||||||||||||||
|
Con Edison |
3.0 | 3.4 | 3.4 | 3.0 | 3.3 | |||||||||||||||
|
CECONY |
3.2 | 3.6 | 3.3 | 3.1 | 3.4 | |||||||||||||||
For each of the Companies, the common equity ratio for the last five years was:
|
Common Equity Ratio
(Percent of total capitalization) |
||||||||||||||||||||
| 2006 | 2007 | 2008 | 2009 | 2010 | ||||||||||||||||
|
Con Edison |
48.5 | 53.7 | 50.7 | 50.5 | 50.4 | |||||||||||||||
|
CECONY |
50.0 | 52.3 | 50.8 | 50.3 | 49.9 | |||||||||||||||
The commercial paper of the Companies is rated P-2, A-2 and F2, respectively, by Moody’s, S&P and Fitch. Con Edison’s long-term credit rating is Baa1, BBB+ and BBB+, respectively, by Moody’s, S&P and Fitch. The unsecured debt of CECONY is rated A3, A- and A-, respectively, by Moody’s, S&P and Fitch. The unsecured debt of O&R is rated Baa1, A- and A-, respectively, by Moody’s, S&P and Fitch. Securities ratings assigned by rating organizations are expressions of opinion and are not recommendations to buy, sell or hold securities. A securities rating is subject to revision or withdrawal at any time by the assigning rating organization. Each rating should be evaluated independently of any other rating.
CECONY has $636 million of tax-exempt debt for which the interest rates are to be determined pursuant to periodic auctions. Of this amount, $391 million is insured by Ambac Assurance Corporation and $245 million is insured by Syncora Guarantee Inc. (formerly XL Capital Assurance Inc.). Credit rating agencies have downgraded the ratings of these insurers from AAA to lower levels. Subsequently, there have not been sufficient bids to determine the interest rates pursuant to auctions, and interest rates have been determined by reference to a variable rate index. The weighted average annual interest rate on this tax-exempt debt was 0.54 percent on December 31, 2010. The weighted average interest rate was 0.45 percent, 0.80 percent and 3.94 percent for the years 2010, 2009 and 2008, respectively. Under CECONY’s current gas and steam and (beginning in April 2011) electric rate orders, variations in auction rate debt interest expense are reconciled to the levels set in rates.
Environmental Matters
Climate Change
As indicated in 2007 by the Intergovernmental Panel on Climate Change, emissions of greenhouse gases, including carbon dioxide, are very likely changing the world’s climate.
Climate change could affect customer demand for the Companies’ energy services. The effects of climate change might also include physical damage to the Companies’ facilities and disruption of their operations due to the impact of more extreme weather-related events.
Based on the most recent data (2008) published by the U.S. Environmental Protection Agency (EPA), Con Edison estimates that its greenhouse gas emissions constitute less than 0.1 percent of the nation’s greenhouse gas emissions. Con Edison’s emissions of greenhouse gases during the past five years (expressed in terms of millions of tons of carbon dioxide equivalent) were:
| 2006 | 2007 | 2008 | 2009 | 2010 | ||||||||||||||||
|
CO 2 equivalent emissions |
5.4 | 5.3 | 4.6 | 4.2 | 4.3 | |||||||||||||||
| 28 |
Table of Contents
The 35 percent decrease in Con Edison’s greenhouse gas emissions since 2005 (6.6 million tons) reflects the emission reductions resulting from equipment and repair projects, including projects to reduce sulfur hexafluoride emissions, and increased use of natural gas at CECONY’s steam production facilities. Emissions from electric generation at the Con Edison Development electric generating plants (which were sold in 2008 – see Note U to the financial statements in Item 8) have been removed from the above data for 2008 and prior years.
The Companies are working to further reduce greenhouse gas emissions. CECONY has participated for several years in voluntary initiatives with the EPA to reduce its methane and sulfur hexafluoride emissions. The Utilities reduce methane emissions from the operation of their gas distribution systems through pipe maintenance and replacement programs, by operating system components at lower pressure, and by introducing new technologies. The Utilities reduce emissions of sulfur hexafluoride, which is used for arc suppression in substation circuit breakers and switches, by using improved technologies to locate and repair leaks, and by replacing older equipment. The Utilities also promote energy efficiency programs for customers that help them reduce their greenhouse gas emissions.
Beginning in 2009, CECONY is subject to carbon dioxide emissions regulations established by New York State under the Regional Greenhouse Gas Initiative. The initiative, a cooperative effort by Northeastern and Mid-Atlantic states, establishes a decreasing cap on carbon dioxide emissions resulting from the generation of electricity to a level ten percent below the Initiative’s baseline by 2018. Under the initiative, affected electric generators are required to obtain emission allowances to cover their carbon dioxide emissions, available primarily through auctions administered by participating states or a secondary market.
The EPA has started regulating greenhouse gas emissions from major sources. Also, New York State has announced a goal to reduce greenhouse gas emissions 80 percent below 1990 levels by 2050, and New York City plans to reduce greenhouse gas emissions within the City 30 percent below 2005 levels by 2030. The cost to comply with legislation, regulations or initiatives limiting the Companies’ greenhouse gas emissions could be substantial.
Environmental Sustainability
Con Edison seeks to improve the environmental sustainability of its businesses. CECONY is piloting smart grid technologies to demonstrate the interoperability of distributed generation and the exchange of information between customers and utilities. The smart grid will give customers the tools to be smarter consumers of energy and will allow the utility to more quickly identify and isolate problems. The company recycles clean non-hazardous waste materials in more than a dozen categories and recycled more than 59,000 tons of waste in 2009. More than 40 percent of the company’s vehicles are now using alternative-energy technology. New environmentally friendly white roofs are in place at the corporate headquarters and more than 20 other facilities, and others are underway. A white roof reflects sunlight, lowering indoor temperatures on hot days, which reduces the need to cool the building, resulting in fewer carbon dioxide emissions.
CECONY
Superfund
The Federal Comprehensive Environmental Response, Compensation and Liability Act of 1980 and similar state statutes (Superfund) impose joint and several liability, regardless of fault, upon generators of hazardous substances for investigation costs, remediation costs and environmental damages. The sites as to which CECONY has been asserted to have liability under Superfund include its and its predecessor companies’ former manufactured gas sites, its multi-purpose Astoria site, its former Arthur Kill electric generation plant site, its former Flushing Service Center site, the Gowanus Canal site, and other Superfund sites discussed below. There may be additional sites as to which assertions will be made that the Company has liability. For a further discussion of claims and possible claims against the Company under Superfund, estimated liability accrued for Superfund claims and recovery from customers of site
| 29 |
Table of Contents
investigation and remediation costs, see Note G to the financial statements in Item 8 (which information is incorporated herein by reference).
Manufactured Gas Sites
CECONY and its predecessors formerly manufactured gas and maintained storage holders for gas manufactured at sites in New York City and Westchester County (MGP Sites). Many of these sites are now owned by parties other than CECONY and have been redeveloped by them for other uses, including schools, residential and commercial developments and hospitals. The New York State Department of Environmental Conservation (NYSDEC) requires the company to investigate, and if necessary, develop and implement remediation programs for the sites, which include 34 manufactured gas plant sites and 17 storage holder sites and any neighboring areas to which contamination may have migrated.
The information available to CECONY for many of the MGP Sites is incomplete as to the extent of contamination and scope of the remediation likely to be required. Through the end of 2010, investigations have been started for all or portions of all 51 MGP Sites, and have been completed at 23 of the sites. Coal tar and/or other manufactured gas production/storage-related environmental contaminants have been detected at 36 MGP Sites, including locations within Manhattan and other parts of New York City, and in Westchester County. Remediation has been completed at six sites and portions of six other sites.
Astoria Site
CECONY is permitted by the NYSDEC to operate a hazardous waste storage facility on property the company owns in the Astoria section of Queens, New York. Portions of the property were formerly the location of a manufactured gas plant and also have been used or are being used for, among other things, electric generation operations, electric substation operations, the storage of fuel oil and liquefied natural gas, and the maintenance and storage of electric equipment. As a condition of its NYSDEC permit, the company is required to investigate the property and, where environmental contamination is found and action is necessary, to conduct corrective action to remediate the contamination. The company has investigated various sections of the property and is performing additional investigations. The company has submitted to the NYSDEC and the New York State Department of Health reports identifying the known areas of contamination. The company estimates that its undiscounted potential liability for the completion of the site investigation and cleanup of the known contamination on the property will be at least $38 million.
Arthur Kill Site
Following a September 1998 transformer fire at CECONY’s former Arthur Kill Generating Station, it was determined that oil containing high levels of polychlorinated biphenyls (PCBs) was released to the environment during the incident. The company has completed NYSDEC-approved cleanup programs for the station’s facilities and various soil and pavement areas of the site affected by the PCB release. Pursuant to a July 1999 NYSDEC consent order, the company completed a NYSDEC-approved assessment of the nature and extent of the contamination in the waterfront area of the station. The NYSDEC selected a remediation program for the waterfront area, and the company has implemented it pursuant to an additional consent order entered into during 2005. Field work associated with the waterfront remediation program has been completed and a final engineering report has been submitted to and approved by the NYSDEC. In 2010, the NYSDEC informed the company that additional remediation is required in upland areas. The company estimates that its undiscounted potential future liability for additional upland remediation, site monitoring, maintenance, and reporting to the NYSDEC will be approximately $0.2 million.
Flushing Service Center Site
The owner of a former CECONY service center facility in Flushing, New York, informed the company that PCB contamination had been detected on a substantial portion of the property, which the owner remediated pursuant to the New York State Brownfield Cleanup Program administered by the
| 30 |
Table of Contents
NYSDEC and is redeveloping for residential and commercial use. The property owner’s claim against the company for the cost of its environmental response costs for the site has been resolved. In September 2007, the NYSDEC demanded that the company investigate and remediate PCB contamination that may have migrated into the adjacent Flushing River from the site. In April 2008, the company and NYSDEC entered into a consent order under which the company has agreed to implement a NYSDEC-approved investigation program for the Flushing River and, if deemed necessary by the NYSDEC to protect human health and the environment from such contamination, to implement a NYSDEC-approved remediation program for any PCB contamination in the river attributable to the site. At this time, the company cannot estimate its liability for the investigation and cleanup of any PCB contamination that may have migrated to the Flushing River from the site, but such liability may be substantial.
Gowanus Canal
In August 2009, CECONY received a notice of potential liability and request for information from the EPA about the operations of the company and its predecessors at sites adjacent or near the 1.8 mile Gowanus Canal in Brooklyn, New York. The company understands that the EPA also has provided or will provide notices of potential liability and information requests to other parties. In March 2010, the EPA added the Gowanus Canal to its National Priorities List of Superfund sites. The canal’s adjacent waterfront is primarily commercial and industrial, currently consisting of concrete plants, warehouses, and parking lots, and the canal is near several residential neighborhoods. In February 2011, the EPA released a report of its remedial investigation that confirmed there is significant contamination in the Gowanus Canal. The company expects that the cost of assessment and remediation of hazardous substances in and around the Gowanus Canal will be substantial. CECONY is unable to predict its exposure to liability with respect to the Gowanus Canal site.
Other Superfund Sites
CECONY is a potentially responsible party (PRP) with respect to other Superfund sites where there are other PRPs and where it is generally not responsible for managing the site investigation and remediation. Work at these sites is in various stages, with the company participating in PRP groups at some of the sites. Investigation, remediation and monitoring at some of these sites have been, and are expected to continue to be, conducted over extended periods of time. The company does not believe that it is reasonably likely that monetary sanctions, such as penalties, will be imposed upon it by any governmental authority with respect to these sites.
The following table lists each of CECONY’s other Superfund sites for which the company anticipates it may have a liability. The table also shows for each such site, its location, the year in which the company was designated or alleged to be a PRP or to otherwise have responsibilities with respect to the site (shown in the table under “Start”), the name of the court or agency in which proceedings with respect to the site are pending and CECONY’s estimated percentage of total liability for each site. The company currently estimates that its potential liability for investigation, remediation, monitoring and environmental damages at each site is less than $200,000, with the exception of the Cortese Landfill site, for which the estimate is $1.2 million and the Curcio Scrap Metal site, for which the estimate is $0.4 million. Superfund liability is joint and several. The company’s estimate of its liability for each site was determined pursuant to consent decrees, settlement agreements or otherwise and in light of the financial condition of other PRPs. The company’s actual liability could differ substantially from amounts estimated.
| Site | Location | Start |
Court or
Agency |
% of
Total Liability |
||||||
|
Maxey Flats Nuclear |
Morehead, KY | 1986 | EPA | 0.8 | % | |||||
|
Curcio Scrap Metal |
Saddle Brook, NJ | 1987 | EPA | 100 | % | |||||
|
Metal Bank of America |
Philadelphia, PA | 1987 | EPA | 0.97 | % | |||||
|
Cortese Landfill |
Narrowsburg, NY | 1987 | EPA | 6.0 | % | |||||
|
Global Landfill |
Old Bridge, NJ | 1988 | EPA | 0.3 | % | |||||
|
Borne Chemical |
Elizabeth, NJ | 1997 | NJDEP | 0.7 | % | |||||
| 31 |
Table of Contents
O&R
Superfund
The sites at which O&R has been asserted to have liability under Superfund include its manufactured gas sites, its West Nyack site, the Newark Bay site, and other Superfund sites discussed below. There may be additional sites as to which assertions will be made that O&R has liability. For a further discussion of claims and possible claims against O&R under Superfund, see Note G to the financial statements in Item 8 (which information is incorporated herein by reference).
Manufactured Gas Sites
O&R and its predecessors formerly owned and operated manufactured gas plants at seven sites (O&R MGP Sites) in Orange County and Rockland County, New York. Three of these sites are now owned by parties other than O&R, and have been redeveloped by them for residential, commercial or industrial uses. The NYSDEC is requiring O&R to develop and implement remediation programs for the O&R MGP Sites including any neighboring areas to which contamination may have migrated.
Through the end of 2010, O&R has completed remedial investigations at all seven O&R MGP Sites O&R has completed the remediation at one of its sites; has completed the NYSDEC-approved remediation program for the land portion of its Nyack site; and has received NYSDEC’s decision regarding the remedial work to be done at two other sites. Remedial design is ongoing for two of the sites and will be initiated in 2011 for the shoreline/sediment portion of the Nyack site. Feasibility studies are expected to be completed in 2011 for the remaining sites.
West Nyack Site
In 1994 and 1997, O&R entered into consent orders with the NYSDEC pursuant to which O&R agreed to conduct a remedial investigation and remediate certain property it owns in West Nyack, New York at which PCBs were discovered. Petroleum contamination related to a leaking underground storage tank was found as well. O&R has completed all remediation at the site that the NYSDEC has required to date. O&R is continuing a supplemental groundwater investigation and on-site vapor intrusion monitoring as required by the NYSDEC.
Newark Bay
Approximately 300 parties, including O&R (which was served with a third-party complaint in June 2009), were sued as third-party defendants by Tierra Solutions, Inc. (Tierra) and Maxus Energy Corporation (Maxus), successors to the Occidental Chemical Corporation and Diamond Shamrock Chemical Company. Tierra and Maxus were themselves sued in 2005 by the New Jersey Department of Environmental Protection and others for removal and cleanup costs, punitive damages, penalties, and economic losses allegedly arising from the dioxin contamination their predecessors’ pesticide/herbicide plant allegedly released to the “Newark Bay Complex,” a system of waterways including Newark Bay, the Arthur Kill, the Kill Van Kull, and lower portions of the Passaic and Hackensack Rivers. Tierra and Maxus are seeking equitable contribution from the third-party defendants for such costs, damages, penalties and losses, which are likely to be substantial. As to O&R, Tierra and Maxus allege that 1975 and 1976 shipments of waste oil by O&R from an electricity generating plant in Haverstraw, New York to the Borne Chemical Company in Elizabeth, New Jersey was a source of petroleum discharges to the Arthur Kill. Con Edison is unable to predict O&R’s exposure to liability with respect to the Newark Bay Complex.
Other Superfund Sites
O&R is a PRP with respect to other Superfund sites where there are other PRPs and it is not managing the site investigation and remediation. Work at these sites is in various stages, with the company participating in PRP groups at some of the sites. Investigation, remediation and monitoring at some of these sites have been, and are expected to continue to be, conducted over extended periods of time. The company does not believe that it is reasonably likely that monetary sanctions, such as penalties, will be imposed upon it by any governmental authority with respect to these sites.
The following table lists each of O&R’s other Superfund sites for which the company anticipates it may have liability. The table also shows for each such
| 32 |
Table of Contents
site, its location, the year in which the company was designated or alleged to be a PRP or to otherwise have responsibilities with respect to the site (shown in the table under “Start”), the name of the court or agency in which proceedings with respect to the site are pending and O&R’s estimated percentage of total liability for each site. The company currently estimates that its potential liability for investigation, remediation, monitoring and environmental damages at each site is less than $0.5 million. Superfund liability is joint and several. The company’s estimate of its anticipated share of the total liability for each site was determined pursuant to consent decrees, settlement agreements or otherwise and in light of the financial condition of other PRPs. The company’s actual liability could differ substantially from amounts estimated.
| Site | Location | Start |
Court or
Agency |
% of
Total Liability |
||||||
|
Borne Chemical |
Elizabeth, NJ | 1997 | NJDEP | 2.27 | % | |||||
|
Clarkstown Landfill |
Clarkstown, NY | 2003 | NYAG | 0.02 | % | |||||
|
Metal Bank of America |
Philadelphia, PA | 1993 | EPA | 4.58 | % | |||||
Other Federal, State and Local Environmental Provisions
Toxic Substances Control Act
Virtually all electric utilities, including CECONY, own equipment containing PCBs. PCBs are regulated under the Federal Toxic Substances Control Act of 1976.
Water Quality
Certain governmental authorities are investigating contamination in the Hudson River and the New York Harbor. These waters run through portions of CECONY’s service area. Governmental authorities could require entities that released hazardous substances that contaminated these waters to bear the cost of investigation and remediation, which could be substantial.
Air Quality
Under new source review regulations, an owner of a large generating facility, including CECONY’s steam and steam-electric generating facilities, is required to obtain a permit before making modifications to the facility, other than routine maintenance, repair, or replacement, that increase emissions of pollutants from the facility above specified thresholds. To obtain a permit, the facility owner could be required to install additional pollution controls or otherwise limit emissions from the facility. The company reviews on an on-going basis its planned modifications to its generating facilities to determine the potential applicability of new source review and similar regulations. In July 2010, revised New York State nitrogen oxides reasonably available control technology regulations became effective. The EPA is expected to adopt regulations in February 2011 establishing maximum achievable control technology standards for industrial boilers. The regulations apply to major air emissions sources, including CECONY’s generating facilities. CECONY anticipates that additional regulations will be adopted requiring further reductions in air emissions. CECONY’s plans to comply with the regulations include the modification by 2014 of certain of its generating facilities to enable the facilities to increase the use of natural gas, decreasing the use of fuel oil. For information about the company’s generating facilities, see “CECONY– Electric Operations – Electric Facilities” and “Steam Operations – Steam Facilities” above in this Item 1. The company is unable to predict the impact of these regulations on its operations or the additional costs, which could be substantial, it could incur to comply with the regulations.
State Anti-Takeover Law
New York State law provides that a “domestic corporation,” such as Con Edison, may not consummate a merger, consolidation or similar transaction with the beneficial owner of a 20 percent or greater voting stock interest in the corporation, or with an affiliate of the owner, for five years after the acquisition of the voting stock interest, unless the transaction or the acquisition of the voting stock interest was approved by the corporation’s board of directors prior to the acquisition of the voting stock interest. After the expiration of the five-year period, the transaction may be consummated only pursuant to a stringent “fair price” formula or with the approval of a majority of the disinterested stockholders.
| 33 |
Table of Contents
Employees
Con Edison has no employees other than those of CECONY, O&R and Con Edison’s competitive energy businesses (which at December 31, 2010 had 13,795, 1,093 and 292, employees, respectively). Of the 13,795 CECONY employees and 1,093 O&R employees, 8,613 and 649 were represented by a collective bargaining unit, respectively. The collective bargaining agreements covering these employees expire in June 2012 and June 2014, respectively.
Available Information
For the sources of information about the Companies, see “Available Information” in the “Introduction” appearing before this Item 1.
Information in any item of this report as to which reference is made in this Item 1A is incorporated by reference herein. The use of such terms as “see” or “refer to” shall be deemed to incorporate at the place such term is used the information to which such reference is made.
The Companies’ businesses are influenced by many factors that are difficult to predict, and that involve uncertainties that may materially affect actual operating results, cash flows and financial condition.
The Companies have established an enterprise risk management program to identify, assess, and manage its major operations and administrative risks based on established criteria for the severity of an event, the likelihood of its occurrence, and the programs in place to control the event or reduce the impact. The Companies also have financial and commodity market risks. See “Financial and Commodity Market Risks” in Item 7.
The Companies’ major risks include:
The Failure to Operate Energy Facilities Safely and Reliably Could Adversely Affect The Companies. The Utilities provide electricity, gas and steam service using energy facilities, many of which are located either in, or close to, densely populated public places. See the description of the Utilities’ facilities in Item 1. A failure of, or damage to, these facilities, or an error in the operation or maintenance of these facilities, could result in bodily injury or death, property damage, the release of hazardous substances or extended service interruptions. In such event, the Utilities could be required to pay substantial amounts, which may not be covered by the Utilities’ insurance policies, to repair or replace their facilities, compensate others for injury or death or other damage, and settle any proceedings initiated by state utility regulators or other regulatory agencies. See “Manhattan Steam Main Rupture” in Note H to the financial statements in Item 8. The occurrence of such an event could also adversely affect the cost and availability of insurance. Changes to judicial doctrines could further expand the Utilities’ liability for service interruptions. See “Utility Regulation – State Utility Regulation, Liability for Service Interruptions and Other Non-rate Conditions of Service” in Item 1.
The Failure To Properly Complete Construction Projects Could Adversely Affect The Companies. The Utilities’ ongoing construction program includes large energy transmission, substation and distribution system projects. The failure to properly complete these projects timely and effectively could adversely affect the Utilities’ ability to meet their customers’ growing energy needs with the high level of safety and reliability that they currently provide, which would adversely affect the Companies.
The Failure of Processes and Systems and the Performance of Employees and Contractors Could Adversely Affect the Companies. The Companies have developed business processes for operations, customer service, legal compliance, personnel, accounting, planning and other matters. Some of the Companies’ information systems and communications systems have been operating for many years, and may become obsolete. The Utilities are implementing new financial and supply chain enterprise resource planning information systems. See Item 9A. The failure of the Companies’ business processes or information or communication systems could adversely affect the Companies’ operations and liquidity and result in substantial liability, higher costs and increased regulatory requirements. The failure by the Companies’ employees or contractors to follow
| 34 |
Table of Contents
procedures, or their unsafe actions, errors or intentional misconduct, could also adversely affect the Companies. See “Investigations of Vendor Payments” in Note H to the financial statements in Item 8.
The Companies Are Extensively Regulated And Are Subject To Penalties. The Companies’ operations require numerous permits, approvals and certificates from various federal, state and local governmental agencies. State utility regulators may seek to impose substantial penalties on the Utilities for violations of state utility laws, regulations or orders. In addition, the Utilities rate plans usually include penalties for failing to meet certain operating standards. FERC has the authority to impose penalties on the Utilities and the competitive energy businesses, which could be substantial, for violations of the Federal Power Act, the Natural Gas Act or related rules, including reliability rules. Environmental agencies may seek penalties for failure to comply with laws, regulations or permits. See “Permit Non-Compliance and Pollution Discharges” in Item 3. The Companies may also be subject to penalties from other regulatory agencies. The Companies may be subject to new laws, regulations, accounting standards or other requirements or the revision or reinterpretation of such requirements, which could adversely affect the Companies. See “Utility Regulation” and “Environmental Matters – Climate Change and Other Federal, State and Local Environmental Provisions” in Item 1 and “Application of Critical Accounting Policies” in Item 7.
The Utilities’ Rate Plans May Not Provide A Reasonable Return. The Utilities have rate plans approved by state utility regulators that limit the rates they can charge their customers. The rates are generally designed for, but do not guarantee, the recovery of the Utilities’ cost of service (including a return on equity). The Utilities’ rate plans can involve complex accounting and other calculations, a mistake in which could have a substantial adverse affect on the Utilities. See “Utility Regulation – State Utility Regulation, Rate Plans” in Item 1 and “Rate Agreements” in Note B to the financial statements in Item 8. Rates usually may not be changed during the specified terms of the rate plans other than to recover energy costs and limited other exceptions. The Utilities’ actual costs may exceed levels provided for such costs in the rate plans. The Utilities’ rate plans usually include penalties for failing to meet certain operating standards. State utility regulators can initiate proceedings to prohibit the Utilities from recovering from their customers the cost of service (including energy costs) that the regulators determine to have been imprudently incurred (see “Other Regulatory Matters” in Note B to the financial statements in Item 8). The Utilities have from time to time entered into settlement agreements to resolve various prudence proceedings.
The Companies May Be Adversely Affected By Changes To The Utilities’ Rate Plans. The Utilities’ rate plans typically require action by regulators at their expiration dates, which may include approval of new plans with different provisions. The need to recover from customers increasing costs, taxes or state-mandated assessments or surcharges could adversely affect the Utilities’ opportunity to obtain new rate plans that provide a reasonable rate of return and continue important provisions of current rate plans. The Utilities’ current New York electric and gas rate plans include revenue decoupling mechanisms and their New York electric, gas and steam rate plans include provisions for the recovery of energy costs and reconciliation of the actual amount of pension and other postretirement, environmental and certain other costs to amounts reflected in rates. See “Rate Agreements” in Note B to the financial statements in Item 8.
The Companies Are Exposed to Risks From The Environmental Consequences Of Their Operations. The Companies are exposed to risks relating to climate change and related matters. See “Environmental Matters – Climate Change” in Item 1. CECONY may also be impacted by regulations requiring reductions in air emissions. See “Environmental Matters – Other Federal, State and Local Environmental Provisions, Air Quality” in Item 1. In addition, the Utilities are responsible for hazardous substances, such as asbestos, PCBs and coal tar, that have been used or produced in the course of the Utilities’ operations and are present on properties or in facilities and equipment currently or previously owned by them. See “Environmental Matters” in
| 35 |
Table of Contents
Item 1 and Note G to the financial statements in Item 8. Electric and magnetic fields are found wherever electricity is used. The Companies could be adversely affected if a causal relationship between these fields and adverse health effects were to be established. Negative perceptions about electric and magnetic fields can make it more difficult to construct facilities needed for the Companies’ operations.
A Disruption In The Wholesale Energy Markets Or Failure By An Energy Supplier Could Adversely Affect The Companies. Almost all the electricity and gas the Utilities sell to their full-service customers is purchased through the wholesale energy markets or pursuant to contracts with energy suppliers. See the description of the Utilities’ energy supply in Item 1. Con Edison Energy and Con Edison Solutions also depend on wholesale energy markets to supply electricity to their customers. See “Competitive Energy Businesses” in Item 1. A disruption in the wholesale energy markets or a failure on the part of the Companies’ energy suppliers or operators of energy delivery systems that connect to the Utilities’ energy facilities could adversely affect the Companies’ ability to meet their customers’ energy needs and adversely affect the Companies.
The Companies Have Substantial Unfunded Pension And Other Postretirement Benefit Liabilities. The Utilities have substantial unfunded pension and other postretirement benefit liabilities. The Utilities expect to make substantial contributions to their pension and other postretirement benefit plans. Significant declines in the market values of the investments held to fund the pension and other postretirement benefits could trigger substantial funding requirements under governmental regulations. See “Application of Critical Accounting Policies – Accounting for Pensions and Other Postretirement Benefits” and “Financial and Commodity Market Risks,” in Item 7 and Notes E and F to the financial statements in Item 8.
Con Edison’s Ability To Pay Dividends Or Interest Depends On Dividends From Its Subsidiaries. Con Edison’s ability to pay dividends on its common stock or interest on its external borrowings depends primarily on the dividends and other distributions it receives from its subsidiaries. The dividends that the Utilities may pay to Con Edison are limited by the NYSPSC to not more than 100 percent of their respective income available for dividends calculated on a two-year rolling average basis, with certain exceptions. See “Dividends” in Note C to the financial statements in Item 8.
The Companies Require Access To Capital Markets To Satisfy Funding Requirements. The Utilities estimate that their construction expenditures will exceed $5 billion over the next three years. The Utilities expect to use internally-generated funds, equity contributions from Con Edison and external borrowings to fund the construction expenditures. The competitive energy businesses are evaluating opportunities to invest in renewable generation and energy-related infrastructure projects that would require funds in excess of those produced in the businesses. Con Edison expects to finance its capital requirements primarily through internally generated funds and the sale of its securities, including stock issuances under its dividend reinvestment and employee stock plans. Changes in financial market conditions or in the Companies’ credit ratings could adversely affect their ability to raise new capital and the cost thereof. See “Capital Requirements and Resources” in Item 1.
The Internal Revenue Service Has Disallowed Substantial Tax Deductions Taken By The Company. The Companies’ federal income tax returns reflect certain tax positions with which the Internal Revenue Service does not or may not agree, particularly its tax positions for Con Edison’s lease in/lease out transactions (see Note J to the financial statements in Item 8) and the deduction of the cost of certain repairs to utility plant for which the ultimate deductibility is highly certain but for which there is uncertainty about the timing of such deductibility (see Note L to the financial statements in Item 8).
The Companies Also Face Other Risks That Are Beyond Their Control. The Companies’ results of operations can be affected by circumstances or events that are beyond their control. Weather directly influences the demand for electricity, gas and steam
| 36 |
Table of Contents
service, and can affect the price of energy commodities. Natural disasters, such as a major storm, heat wave or hurricane (see “Environmental Matters – Climate Change” in Item 1) or terrorist attacks or related acts of war could damage Company facilities. As a provider of essential utility services, the Utilities may experience more severe consequences from attempting to operate during and after such events. In addition, pandemic illness could potentially disrupt the Utilities’ employees and contractors from providing essential utility services. Economic conditions can affect customers’ demand and ability to pay for service, which could adversely affect the Companies.
Con Edison
Con Edison has no unresolved comments from the SEC staff.
CECONY
CECONY has no unresolved comments from the SEC staff.
Con Edison
Con Edison has no significant properties other than those of the Utilities and its competitive energy businesses.
For information about the capitalized cost of the Companies’ utility plant, net of accumulated depreciation, see “Plant and Depreciation” in Note A to the financial statements in Item 8 (which information is incorporated herein by reference).
CECONY
For a discussion of CECONY’s electric, gas and steam facilities, see “CECONY – Electric Operations – Electric Facilities”, “CECONY – Gas Operations – Gas Facilities”, and “CECONY – Steam Operations – Steam Facilities” in, Item 1 (which information is incorporated herein by reference).
O&R
For a discussion of O&R’s electric and gas facilities, see “O&R – Electric Operations –Transmission and Distribution Facilities” and “O&R – Gas Operations – Gas Facilities” in Item 1 (which information is incorporated herein by reference).
Competitive Energy Businesses
For a discussion of the competitive energy businesses’ facilities, see “Competitive Energy Businesses” in, Item 1 (which information is incorporated herein by reference).
Con Edison
Lease In/Lease Out Transactions
For information about legal proceedings with the IRS with respect to certain tax losses recognized in connection with the company’s lease in/lease out transactions, see Note J to the financial statements in Item 8 (which information is incorporated herein by reference).
CECONY
Manhattan Steam Main Rupture
For information about proceedings relating to the July 2007 rupture of a steam main located in midtown Manhattan, see “Manhattan Steam Main Rupture” in Note H to the financial statements in Item 8 (which information is incorporated herein by reference).
Investigations of Vendor Payments
For information about alleged unlawful conduct in connection with vendor payments, see “Investigations of Vendor Payments” in Note H to the financial statements in Item 8 (which is incorporated herein by reference).
Asbestos
For information about legal proceedings relating to exposure to asbestos, see Note G to the financial statements in Item 8 (which information is incorporated herein by reference).
Superfund
For information about CECONY Superfund sites, see “Environmental Matters – CECONY – Superfund” in Item 1 (which information is incorporated herein by reference).
| 37 |
Table of Contents
Permit Non-Compliance and Pollution Discharges
In December 2010, the NYSDEC and CECONY agreed on the terms of a consent order that settled violations of certain laws, regulations and permit conditions relating to discharges of pollutants at the company’s steam generating facilities. Pursuant to the order, CECONY paid a penalty and other amounts totaling $5 million and is required to retain an independent consultant to conduct a comprehensive audit of the company’s generating facilities to determine compliance with certain environmental laws and regulations and recommend best practices; remove certain equipment containing PCBs from the company’s steam and electric facilities; install certain wastewater treatment facilities; and comply with certain additional sampling, monitoring, and training requirements.
O&R
Asbestos
For information about legal proceedings relating to exposure to asbestos, see Note G to the financial statements in Item 8 (which information is incorporated herein by reference).
Superfund
For information about O&R Superfund sites, see “Environmental Matters – O&R– Superfund” in Item 1 (which information is incorporated herein by reference).
| 38 |
Table of Contents
Executive Officers of the Registrant
The following table sets forth certain information about the executive officers of Con Edison and CECONY as of February 22, 2011. As indicated, certain of the executive officers are executive officers of each of Con Edison and CECONY and others are executive officers of Con Edison or CECONY. The term of office of each officer, is until the next election of directors (trustees) of their company and until his or her successor is chosen and qualifies. Officers are subject to removal at any time by the board of directors (trustees) of their company. Mr. Burke has an employment agreement with Con Edison, which provides for him to serve in his present position through December 31, 2011. The employment agreement provides for automatic one-year extensions of its term, unless notice to the contrary is received six months prior to the end of the term.
| Name | Age | Offices and Positions During Past Five Years | ||||
|
Executive Officers of Con Edison and CECONY |
||||||
|
Kevin Burke |
60 | 3/06 to present – Chairman of the Board, President and Chief Executive Officer and Director of Con Edison and Chairman, Chief Executive Officer and Trustee of CECONY | ||||
| 9/05 to 2/06 – President, Chief Executive Officer and Director of Con Edison and Chief Executive Officer and Trustee of CECONY | ||||||
|
Craig S. Ivey |
48 | 12/09 to present – President of CECONY | ||||
| 8/07 to 9/09 – Senior Vice President – Transmission & Distribution, Dominion Resources, Inc. | ||||||
| 4/06 to 8/07 – Senior Vice President – Electric Distribution, Dominion Resources, Inc. | ||||||
| 9/04 to 4/06 – Vice President Electric Operations, Dominion Resources, Inc. | ||||||
|
Robert Hoglund |
49 | 9/05 to present – Senior Vice President and Chief Financial Officer of Con | ||||
| Edison and CECONY | ||||||
| 6/04 to 10/09 – Chief Financial Officer and Controller of O&R | ||||||
|
Elizabeth D. Moore |
56 | 5/09 to present – General Counsel of Con Edison and CECONY | ||||
| 1/95 to 4/09 – Partner, Nixon Peabody LLP | ||||||
|
Frances A. Resheske |
50 | 2/02 to present – Senior Vice President – Public Affairs of CECONY | ||||
|
JoAnn Ryan |
53 | 7/06 to present – Senior Vice President – Business Shared Services of CECONY | ||||
| 3/01 to 6/06 – President and CEO, Con Edison Solutions | ||||||
|
Luther Tai |
62 | 7/06 to present – Senior Vice President – Enterprise Shared Services of CECONY | ||||
| 9/01 to 6/06 – Senior Vice President – Central Services of CECONY | ||||||
|
Gurudatta Nadkarni |
45 | 1/08 to present – Vice President of Strategic Planning | ||||
| 8/06 to 12/07 – Managing Director of Growth Initiatives, Duke Energy Corporation | ||||||
| 1/05 to 7/06 – Director of Growth Initiatives, Strategy and Integration, | ||||||
| Duke Energy Corporation | ||||||
|
Scott Sanders |
47 | 2/10 to present – Vice President and Treasurer of Con Edison and CECONY | ||||
| 1/10 to 2/10 – Vice President – Finance | ||||||
| 5/09 to 12/09 – Co-founder and Partner of New Infrastructure Advisors | ||||||
| 5/05 to 1/09 – Managing Director - Investment Banking, Bank of America | ||||||
|
Robert Muccilo |
54 | 7/09 to present – Vice President and Controller of Con Edison and CECONY | ||||
| 11/09 to present – Chief Financial Officer and Controller of O&R | ||||||
| 4/08 to 6/09 – Assistant Controller of CECONY | ||||||
| 8/06 to 3/08 – General Manager – Central Field Services of CECONY | ||||||
| 9/99 to 7/06 – Assistant Controller of CECONY | ||||||
|
Executive Officers of Con Edison but not CECONY |
||||||
|
William G. Longhi |
57 | 2/09 to present – President and Chief Executive Officer of O&R | ||||
| 12/06 to 1/09 – Senior Vice President – Central Operations | ||||||
| 8/06 to 11/06 – Vice President – Manhattan Electric Operations | ||||||
| 9/01 to 7/06 – Vice President –System and Transmission Operations | ||||||
| 39 |
Table of Contents
| Name | Age | Offices and Positions During Past Five Years | ||||
|
Executive Officers of CECONY but not Con Edison |
||||||
|
(All offices and positions listed are with CECONY) |
||||||
|
Marilyn Caselli |
56 | 5/05 to present – Senior Vice President – Customer Operations | ||||
|
John McAvoy |
50 | 2/09 to present – Senior Vice President – Central Operations | ||||
| 12/06 to 1/09 – Vice President – System and Transmission Operations | ||||||
|
Claude Trahan |
58 | 5/09 to present – Senior Vice President – Gas Operations | ||||
| 2/02 to 5/09 – Vice President – Human Resources | ||||||
|
John F. Miksad |
51 | 9/05 to present – Senior Vice President – Electric Operations | ||||
| 40 |
Table of Contents
Con Edison
Con Edison’s Common Shares ($.10 par value), the only class of common equity of Con Edison, are traded on the New York Stock Exchange. As of January 31, 2011, there were 62,711 holders of record of Con Edison’s Common Shares.
The market price range for Con Edison’s Common Shares during 2010 and 2009, as reported in the consolidated reporting system, and the dividends paid by Con Edison in 2010 and 2009 were as follows:
| 2010 | 2009 | |||||||||||||||||||||||
| High | Low |
Dividends
Paid |
High | Low |
Dividends
Paid |
|||||||||||||||||||
|
1 st Quarter |
$ | 46.45 | $ | 42.09 | $ | 0.595 | $ | 41.79 | $ | 32.56 | $ | 0.59 | ||||||||||||
|
2 nd Quarter |
$ | 45.83 | $ | 41.52 | $ | 0.595 | $ | 40.00 | $ | 34.36 | $ | 0.59 | ||||||||||||
|
3 rd Quarter |
$ | 48.94 | $ | 42.50 | $ | 0.595 | $ | 41.77 | $ | 36.46 | $ | 0.59 | ||||||||||||
|
4 th Quarter |
$ | 51.03 | $ | 47.51 | $ | 0.595 | $ | 46.35 | $ | 40.15 | $ | 0.59 | ||||||||||||
On January 20, 2011, Con Edison’s Board of Directors declared a quarterly dividend of 60 cents per Common Share. The first quarter 2011 dividend will be paid on March 15, 2011.
Con Edison expects to pay dividends to its shareholders primarily from dividends and other distributions it receives from its subsidiaries. The payment of future dividends, which is subject to approval and declaration by Con Edison’s Board of Directors, will depend on a variety of factors, including business, financial and regulatory considerations. For additional information see “Dividends” in Note C to the financial statements in Item 8 (which information is incorporated herein by reference).
During 2010, the market price of Con Edison’s Common Shares increased by 9.11 percent (from $45.43 at year-end 2009 to $49.87 at year-end 2010). By comparison, the S&P 500 Index and the S&P Utilities Index increased 12.78 percent and 0.86 percent, respectively. The total return to Con Edison’s common shareholders during 2010, including both price appreciation and reinvestment of dividends, was 14.98 percent. By comparison, the total returns for the S&P 500 Index and the S&P Utilities Index were 15.08 percent and 5.49 percent, respectively. For the five-year period 2006 through 2010, Con Edison’s shareholders’ total average annual return was 6.93 percent, compared with total average annual returns for the S&P 500 Index and the S&P Utilities Index of 2.29 percent and 3.89 percent, respectively.
| 41 |
Table of Contents
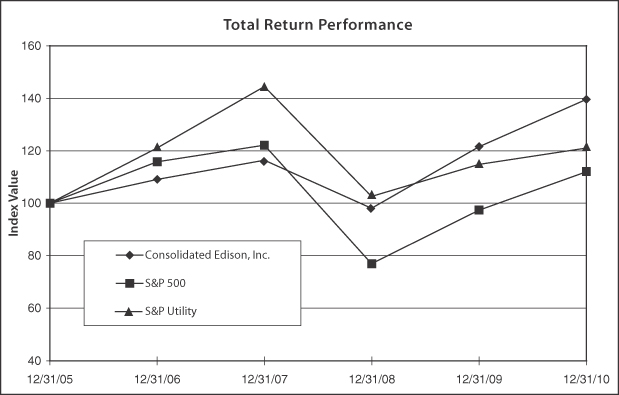
| Years Ending | ||||||||||||||||||||||||
| Company/Index | 2005 | 2006 | 2007 | 2008 | 2009 | 2010 | ||||||||||||||||||
|
Consolidated Edison, Inc. |
100.00 | 109.14 | 116.40 | 98.05 | 121.48 | 139.60 | ||||||||||||||||||
|
S&P 500 Index |
100.00 | 115.79 | 122.16 | 76.96 | 97.33 | 111.99 | ||||||||||||||||||
|
S&P Utilities |
100.00 | 120.99 | 144.43 | 102.58 | 114.79 | 121.06 | ||||||||||||||||||
Based on $100 invested at December 31, 2005, reinvestment of all dividends in equivalent shares of stock and market price changes on all such shares.
CECONY
The outstanding shares of CECONY’s Common Stock ($2.50 par value), the only class of common equity of CECONY, are held by Con Edison and are not traded.
The dividends declared by CECONY in 2010 and 2009 are shown in its Consolidated Statement of Common Shareholder’s Equity included in Item 8 (which information is incorporated herein by reference). For additional information about the payment of dividends by CECONY, and restrictions thereon, see “Dividends” in Note C to the financial statements in Item 8 (which information is incorporated herein by reference).
| 42 |
Table of Contents
For selected financial data of Con Edison and CECONY, see “Introduction” appearing before Item 1 (which selected financial data is incorporated herein by reference).
| 43 |
Table of Contents
This combined management’s discussion and analysis of financial condition and results of operations relates to the consolidated financial statements included in this report of two separate registrants: Con Edison and CECONY and should be read in conjunction with the financial statements and the notes thereto. As used in this report, the term the “Companies” refers to Con Edison and CECONY. CECONY is a subsidiary of Con Edison and, as such, information in this management’s discussion and analysis about CECONY applies to Con Edison.
Information in any item of this report referred to in this discussion and analysis is incorporated by reference herein. The use of terms such as “see” or “refer to” shall be deemed to incorporate by reference into this discussion and analysis the information to which reference is made.
Corporate Overview
Con Edison’s principal business operations are those of the Utilities. Con Edison also has competitive energy businesses. See “The Utilities” and “Competitive Energy Businesses” in Item 1. Certain financial data of Con Edison’s businesses is presented below:
| Twelve months ended December 31, 2010 | At December 31, 2010 | |||||||||||||||||||||||
| (millions of dollars, except percentages) |
Operating
Revenues |
Net Income | Assets | |||||||||||||||||||||
|
CECONY |
$ | 10,573 | 79 | % | $ | 893 | 90 | % | $ | 32,435 | 90 | % | ||||||||||||
|
O&R |
910 | 7 | % | 49 | 5 | % | 2,337 | 6 | % | |||||||||||||||
|
Total Utilities |
11,483 | 86 | % | 942 | 95 | % | 34,772 | 96 | % | |||||||||||||||
|
Con Edison Development |
3 | — | % | 1 | — | % | 467 | 1 | % | |||||||||||||||
|
Con Edison Energy(a) |
369 | 3 | % | 5 | 1 | % | 96 | — | % | |||||||||||||||
|
Con Edison Solutions(a) |
1,520 | 11 | % | 60 | 6 | % | 295 | 1 | % | |||||||||||||||
|
Other(b) |
(50 | ) | — | % | (16 | ) | (2 | )% | 516 | 2 | % | |||||||||||||
|
Total Con Edison |
$ | 13,325 | 100 | % | $ | 992 | 100 | % | $ | 36,146 | 100 | % | ||||||||||||
| (a) | Net income from the competitive energy businesses for the twelve months ended December 31, 2010 includes $11 million of net after-tax mark-to-market gains (Con Edison Energy, $11 million). |
| (b) | Represents inter-company and parent company accounting. See “Results of Operations,” below. |
Con Edison’s net income for common stock in 2010 was $992 million or $3.49 a share ($3.47 on a diluted basis). Net income for common stock in 2009 and 2008 was $868 million or $3.16 a share ($3.14 on a diluted basis) and $1,196 million or $4.38 a share ($4.37 on a diluted basis), respectively. See “Results of Operations – Summary,” below. For segment financial information, see Note N to the financial statements in Item 8 and “Results of Operations,” below.
Results of Operations — Summary
Net income for the years ended December 31, 2010, 2009 and 2008 was as follows:
| (millions of dollars) | 2010 | 2009 | 2008 | |||||||||
|
CECONY |
$ | 893 | $ | 781 | $ | 783 | ||||||
|
O&R |
49 | 43 | 44 | |||||||||
|
Competitive energy businesses(a) |
66 | 59 | 73 | |||||||||
|
Other(b) |
(16 | ) | (15 | ) | 22 | |||||||
|
Total continuing operations |
992 | 868 | 922 | |||||||||
|
Discontinued operations(c) |
— | — | 274 | |||||||||
|
Con Edison |
$ | 992 | $ | 868 | $ | 1,196 | ||||||
| (a) | Includes $11 million, $19 million and $(59) million of net after-tax mark-to-market gains/(losses) in 2010, 2009 and 2008, respectively. In 2008, also includes $131 million after-tax from the gain on sale of Con Edison Development’s ownership interests in electricity generating plants. See Note U to the financial statements in Item 8. |
| (b) | Consists of inter-company and parent company accounting. In 2008, also includes $30 million of after-tax net income related to the resolution of Con Edison’s legal proceeding with Northeast Utilities. See “Results of Operations,” below. |
| (c) | Represents the discontinued operations of certain of Con Edison Development’s ownership interests in electricity generating plants. See Note U to the financial statements in Item 8. |
| 44 |
Table of Contents
The Companies’ results of operations for 2010, as compared with 2009, reflect changes in the Utilities’ rate plans (including additional revenues designed to recover expected increases in certain operations and maintenance expenses, depreciation and property taxes and interest charges), and the operating results of the competitive energy businesses (including net mark-to-market effects). The results of operations for 2010 as compared with 2009 include a higher allowed electric return on common equity for CECONY. Operations and maintenance expenses were higher in 2010 compared with 2009 reflecting primarily higher costs for demand side management programs and employee health insurance, offset in part by savings in operating expenses through cost control efforts. The increase also reflects higher New York State assessments that are collected from customers and higher costs for pension and other postretirement benefits. Depreciation and property taxes were higher in 2010 compared with 2009 reflecting primarily the impact from higher utility plant balances.
The following table presents the estimated effect on earnings per share and net income for common stock for 2010 as compared with 2009 and 2009 as compared with 2008, resulting from these and other major factors:
| 2010 vs. 2009 | 2009 vs. 2008 | |||||||||||||||
|
Earnings per
Share |
Net Income
(Millions of Dollars) |
Earnings per
Share |
Net Income
(Millions of Dollars) |
|||||||||||||
|
CECONY |
||||||||||||||||
|
Rate plans, primarily to recover increases in certain costs |
$ | 1.48 | $ | 410 | $ | 1.28 | $ | 351 | ||||||||
|
Operations and maintenance expense |
(0.67 | ) | (184 | ) | (0.62 | ) | (169 | ) | ||||||||
|
Depreciation and property taxes |
(0.41 | ) | (116 | ) | (0.55 | ) | (151 | ) | ||||||||
|
Net interest expense |
0.02 | 6 | (0.14 | ) | (38 | ) | ||||||||||
|
Other (includes dilutive effect of new stock issuances) |
(0.12 | ) | (5 | ) | — | 5 | ||||||||||
|
Total CECONY |
0.30 | 111 | (0.03 | ) | (2 | ) | ||||||||||
|
O&R |
0.01 | 6 | — | (1 | ) | |||||||||||
|
Competitive energy businesses |
||||||||||||||||
|
Earnings excluding net mark-to-market effects, gain on the sale of ownership interests in electricity generating plants and discontinued operations |
0.05 | 15 | 0.15 | 39 | ||||||||||||
|
Net mark-to-market effects |
(0.03 | ) | (8 | ) | 0.29 | 78 | ||||||||||
|
Gain on the sale of ownership interests in electricity generating plants and discontinued operations |
— | — | (1.49 | ) | (405 | ) | ||||||||||
|
Total competitive energy businesses |
0.02 | 7 | (1.05 | ) | (288 | ) | ||||||||||
|
Northeast Utilities litigation settlement |
— | — | (0.11 | ) | (30 | ) | ||||||||||
|
Other, including parent company expenses |
— | — | (0.03 | ) | (7 | ) | ||||||||||
|
Total variations |
$ | 0.33 | $ | 124 | $ | (1.22 | ) | $ | (328 | ) | ||||||
See “Results of Operations” below for further discussion and analysis of results of operations.
Risk Factors
The Companies’ businesses are influenced by many factors that are difficult to predict, and that involve uncertainties that may materially affect actual operating results, cash flows and financial condition. See “Risk Factors” in Item 1A.
Application of Critical Accounting Policies
The Companies’ financial statements reflect the application of their accounting policies, which conform to accounting principles generally accepted in the United States of America. The Companies’ critical accounting policies include industry-specific accounting applicable to regulated public utilities and accounting for pensions and other postretirement benefits, contingencies, long-lived assets, derivative instruments, goodwill and leases.
Accounting for Regulated Public Utilities
The Utilities are subject to the accounting rules for regulated operations and the accounting requirements of the FERC and the state public utility regulatory commissions having jurisdiction.
The accounting rules for regulated operations specify the economic effects that result from the causal relationship of costs and revenues in the rate-regulated environment and how these effects are to be accounted for by a regulated enterprise. Revenues intended to
| 45 |
Table of Contents
cover some costs may be recorded either before or after the costs are incurred. If regulation provides assurance that incurred costs will be recovered in the future, these costs would be recorded as deferred charges or “regulatory assets” under the accounting rules for regulated operations. If revenues are recorded for costs that are expected to be incurred in the future, these revenues would be recorded as deferred credits or “regulatory liabilities” under the accounting rules for regulated operations.
The Utilities’ principal regulatory assets and liabilities are listed in Note B to the financial statements in Item 8. The Utilities are each receiving or being credited with a return on all regulatory assets for which a cash outflow has been made. The Utilities are each paying or being charged with a return on all regulatory liabilities for which a cash inflow has been received. The regulatory assets and liabilities will be recovered from customers, or applied for customer benefit, in accordance with rate provisions approved by the applicable public utility regulatory commission.
In the event that regulatory assets of the Utilities were no longer probable of recovery, as required by the accounting rules for regulated operations, these regulatory assets would be charged to earnings. At December 31, 2010, the regulatory assets for Con Edison and CECONY were $7,846 million and $7,209 million, respectively.
Accounting for Pensions and Other Postretirement Benefits
The Utilities provide pensions and other postretirement benefits to substantially all of their employees and retirees. Con Edison’s competitive energy businesses also provide such benefits to certain of their employees. The Companies account for these benefits in accordance with the accounting rules for retirement benefits. In addition, the Utilities apply the accounting rules for regulated operations to account for the regulatory treatment of these obligations (which, as described in Note B to the financial statements in Item 8, reconciles the amounts reflected in rates for the costs of the benefit to the costs actually incurred). In applying these accounting policies, the Companies have made critical estimates related to actuarial assumptions, including assumptions of expected returns on plan assets, discount rates, health care cost trends and future compensation. See Notes A, E and F to the financial statements in Item 8 for information about the Companies’ pension and other postretirement benefits, the actuarial assumptions, actual performance, amortization of investment and other actuarial gains and losses and calculated plan costs for 2010, 2009 and 2008.
The cost of pension and other postretirement benefits in future periods will depend on actual returns on plan assets, assumptions for future periods, contributions and benefit experience. Con Edison’s and CECONY’s current estimates for 2011 are increases, compared with 2010, in their pension and other postretirement benefits cost of $110 million and $103 million, respectively. The discount rates used to determine 2011 pension and other postretirement benefit accounting costs are 5.60 percent and 5.40 percent, respectively, and the expected return on plan assets (tax-exempt assets for postretirement benefit accounting costs) is 8.50 percent.
The discount rate for determining the present value of future period benefit payments is determined using a model to match the durations of highly-rated (Aa and Aaa, by Moody’s) corporate bonds with the projected stream of benefit payments.
In determining the health care cost trend rate, the Companies review actual recent cost trends and projected future trends.
The following table illustrates the effect on 2011 pension and other postretirement costs of changing the critical actuarial assumptions discussed above, while holding all other actuarial assumptions constant:
| Actuarial Assumption |
Change in
Assumption |
Pension |
Other Postretirement Benefits |
Total | ||||||||||||
| (millions of dollars) | ||||||||||||||||
|
Increase in accounting cost: |
||||||||||||||||
|
Discount rate |
||||||||||||||||
|
Con Edison |
(0.25 | %) | $ | 30 | $ | 5 | $ | 35 | ||||||||
|
CECONY |
(0.25 | %) | $ | 28 | $ | 4 | $ | 32 | ||||||||
|
Expected return on plan assets |
||||||||||||||||
|
Con Edison |
(0.25 | %) | $ | 20 | $ | 3 | $ | 23 | ||||||||
|
CECONY |
(0.25 | %) | $ | 19 | $ | 2 | $ | 21 | ||||||||
|
Health care trend rate |
||||||||||||||||
|
Con Edison |
1.00 | % | $ | — | $ | 5 | $ | 5 | ||||||||
|
CECONY |
1.00 | % | $ | — | $ | — | $ | — | ||||||||
|
Increase in projected benefit obligation: |
||||||||||||||||
|
Discount rate |
||||||||||||||||
|
Con Edison |
(0.25 | %) | $ | 321 | $ | 47 | $ | 368 | ||||||||
|
CECONY |
(0.25 | %) | $ | 301 | $ | 40 | $ | 341 | ||||||||
|
Health care trend rate |
||||||||||||||||
|
Con Edison |
1.00 | % | $ | — | $ | 27 | $ | 27 | ||||||||
|
CECONY |
1.00 | % | $ | — | $ | 3 | $ | 3 | ||||||||
| 46 |
Table of Contents
A 5.0 percentage point variation in the actual annual return in 2011, as compared with the expected annual asset return of 8.50 percent, would change pension and other postretirement benefit costs for both Con Edison and CECONY by approximately $19 million and $18 million, respectively, in 2012.
Pension benefits are provided through a pension plan maintained by Con Edison to which CECONY, O&R and the competitive energy businesses make contributions for their participating employees. Pension accounting by the Utilities includes an allocation of plan assets.
The Companies’ policy is to fund their pension and other postretirement benefit accounting costs to the extent tax deductible, and for the Utilities, to the extent these costs are recovered under their rate agreements. The Companies were not required to make cash contributions to the pension plan in 2010 under funding regulations and tax laws. However, CECONY and O&R made discretionary contributions to the plan in 2010 of $429 million and $39 million, respectively, and expect to make discretionary contributions in 2011 for CECONY and O&R of $502 million and $41 million, respectively. See “Expected Contributions” in Notes E and F to the financial statements in Item 8.
Accounting for Contingencies
The accounting rules for contingencies apply to an existing condition, situation or set of circumstances involving uncertainty as to possible loss that will ultimately be resolved when one or more future events occur or fail to occur. Known material contingencies, which are described in the notes to the financial statements, include the Utilities’ responsibility for hazardous substances, such as asbestos, PCBs and coal tar that have been used or generated in the course of operations (Note G); certain tax matters (Notes J and
L); and other contingencies (Note H). In accordance with the accounting rules, the Companies have accrued estimates of losses relating to the contingencies as to which loss is probable and can be reasonably estimated and no liability has been accrued for contingencies as to which loss is not probable or cannot be reasonably estimated.
The Utilities generally recover costs for asbestos lawsuits, workers’ compensation and environmental remediation pursuant to their current rate plans. Changes during the terms of the rate plans to the amounts accrued for these contingencies would not impact earnings.
Accounting for Long-Lived Assets
The accounting rules for property, plant and equipment require that certain long-lived assets must be tested for recoverability whenever events or changes in circumstances indicate their carrying amounts may not be recoverable. The carrying amount of a long-lived asset is deemed not recoverable if it exceeds the sum of the undiscounted cash flows expected to result from the use and eventual disposition of the asset. Under the accounting rules an impairment loss is recognized if the carrying amount is not recoverable from such cash flows, and exceeds its fair value, which approximates market value.
Accounting for Goodwill
In accordance with the accounting rules for goodwill and intangible assets, Con Edison is required to test goodwill for impairment annually. See Notes K and T to the financial statements in Item 8. Goodwill is tested for impairment using a two-step approach. The first step of the goodwill impairment test compares the estimated fair value of a reporting unit with its carrying value, including goodwill. If the estimated fair value of a reporting unit exceeds its carrying value, goodwill of the reporting unit is considered not impaired. If the carrying value exceeds the estimated fair value of the reporting unit, the second step is performed to measure the amount of impairment loss, if any. The second step requires a calculation of the implied fair value of goodwill.
Goodwill was $429 million at December 31, 2010. The most recent test, which was performed during the first quarter of 2010, did not require any second-step assessment and did not result in any impairment. The company’s most significant assumptions surrounding the goodwill impairment test relate to the estimates of reporting unit fair values. The company estimated fair values based primarily on discounted cash flows and on market values for a proxy group of companies.
| 47 |
Table of Contents
Accounting for Derivative Instruments
The Companies apply the accounting rules for derivatives and hedging to their derivative financial instruments. The Companies use derivative financial instruments to hedge market price fluctuations in related underlying transactions for the physical purchase and sale of electricity and gas and interest rate risk on certain debt securities. The Utilities are permitted by their respective regulators to reflect in rates all reasonably incurred gains and losses on these instruments. See “Financial and Commodity Market Risks,” below and Note O to the financial statements in Item 8.
Where the Companies are required to make mark-to-market estimates pursuant to the accounting rules, the estimates of gains and losses at a particular period end do not reflect the end results of particular transactions, and will most likely not reflect the actual gain or loss at the conclusion of a transaction. Substantially all of the estimated gains or losses are based on prices supplied by external sources such as the fair value of exchange traded futures and options and the fair value of positions for which price quotations are available through or derived from brokers or other market sources.
Accounting for Leases
The Companies apply the accounting rules for leases and other related pronouncements to their leasing transactions. See Note J to the financial statements in Item 8 for information about Con Edison Development’s “Lease In/Lease Out” or LILO transactions, a disallowance of tax losses by the IRS and a favorable court decision in the company’s litigation with the IRS. In accordance with the accounting rules, Con Edison accounted for the two LILO transactions as leveraged leases. Accordingly, the company’s investment in these leases, net of non-recourse debt, is carried as a single amount in Con Edison’s consolidated balance sheet and income is recognized pursuant to a method that incorporates a level rate of return for those years when net investment in the lease is positive, based upon the after-tax cash flows projected at the inception of the leveraged leases.
Liquidity and Capital Resources
The Companies’ liquidity reflects cash flows from operating, investing and financing activities, as shown on their respective consolidated statement of cash flows and as discussed below.
The principal factors affecting Con Edison’s liquidity are its investments in the Utilities, the dividends it pays to its shareholders and the dividends it receives from the Utilities and cash flows from financing activities discussed below.
The principal factors affecting CECONY’s liquidity are its cash flows from operating activities, cash used in investing activities (including construction expenditures), the dividends it pays to Con Edison and cash flows from financing activities discussed below.
The Companies generally maintain minimal cash balances and use short-term borrowings to meet their working capital needs and other cash requirements. The Companies repay their short-term borrowings using funds from long-term financings and operating activities. The Utilities’ cost of capital, including working capital, is reflected in the rates they charge to their customers.
Each of the Companies believes that it will be able to meet its reasonably likely short-term and long-term cash requirements. See “The Companies Require Access to Capital Market to Satisfy Funding Requirements” and “The Companies Also Face Other Risks That Are Beyond Their Control” in Item 1A, “Application of Critical Accounting Policies – Accounting for Contingencies,” above, and “Utility Regulation” in Item 1.
| 48 |
Table of Contents
Changes in the Companies’ cash and temporary cash investments resulting from operating, investing and financing activities for the years ended December 31, 2010, 2009 and 2008 are summarized as follows:
Con Edison
| (millions of dollars) | 2010 | 2009 |
Variance 2010 vs. 2009 |
2008 |
Variance 2009 vs. 2008 |
|||||||||||||||
|
Operating activities |
$ | 2,381 | $ | 2,466 | $ | (85 | ) | $ | 640 | $ | 1,826 | |||||||||
|
Investing activities |
(2,175 | ) | (2,360 | ) | 185 | (1,071 | ) | (1,289 | ) | |||||||||||
|
Financing activities |
(128 | ) | 80 | (208 | ) | 295 | (215 | ) | ||||||||||||
|
Net change |
78 | 186 | (108 | ) | (136 | ) | 322 | |||||||||||||
|
Balance at beginning of period |
260 | 74 | 186 | 210 | (136 | ) | ||||||||||||||
|
Balance at end of period |
$ | 338 | $ | 260 | $ | 78 | $ | 74 | $ | 186 | ||||||||||
CECONY
| (millions of dollars) | 2010 | 2009 |
Variance 2010 vs. 2009 |
2008 |
Variance 2009 vs. 2008 |
|||||||||||||||
|
Operating activities |
$ | 2,205 | $ | 2,222 | $ | (17 | ) | $ | 1,036 | $ | 1,186 | |||||||||
|
Investing activities |
(1,998 | ) | (2,108 | ) | 110 | (2,448 | ) | 340 | ||||||||||||
|
Financing activities |
(260 | ) | (20 | ) | (240 | ) | 1,328 | (1,348 | ) | |||||||||||
|
Net change |
(53 | ) | 94 | (147 | ) | (84 | ) | 178 | ||||||||||||
|
Balance at beginning of period |
131 | 37 | 94 | 121 | (84 | ) | ||||||||||||||
|
Balance at end of period |
$ | 78 | $ | 131 | $ | (53 | ) | $ | 37 | $ | 94 | |||||||||
Cash Flows from Operating Activities
The Utilities’ cash flows from operating activities reflect principally their energy sales and deliveries and cost of operations. The volume of energy sales and deliveries is dependent primarily on factors external to the Utilities, such as growth of customer demand, weather, market prices for energy, economic conditions and measures that promote energy efficiency. Under the revenue decoupling mechanisms in CECONY’s electric and gas rate plans and O&R’s New York electric and gas rate plans, changes in delivery volumes from levels assumed when rates were approved may affect the timing of cash flows but not net income. See Note B to the financial statements in Item 8. The prices at which the Utilities provide energy to their customers are determined in accordance with their rate agreements. In general, changes in the Utilities’ cost of purchased power, fuel and gas may affect the timing of cash flows but not net income because the costs are recovered in accordance with rate agreements. See “Recoverable Energy Costs” in Note A to the financial statements in Item 8.
The Companies’ cash flows from operating activities also reflect the timing of the deduction for income tax purposes of their construction expenditures. Cash paid by Con Edison for income taxes, net of any refunds received was $(25) million, $5 million and $394 million in 2010, 2009 and 2008, respectively (including $(18) million, $18 million and $(1) million for CECONY in 2010, 2009 and 2008, respectively). For 2010 and 2009, the Companies had no current federal income tax liability as a result, among other things, of the bonus depreciation provisions of the American Recovery and Reinvestment Act of 2009, the Small Business Jobs Act of 2010 and the Tax Relief, Unemployment Insurance Reauthorization and Job Creation Act of 2010. In addition, the company changed its method of determining the timing of deduction of certain repairs to utility plant. See Note L to the financial statements in Item 8. The Companies expect that they also will have no 2011 current federal income tax liability.
Net income is the result of cash and non-cash (or accrual) transactions. Only cash transactions affect the Companies’ cash flows from operating activities. Principal non-cash charges include depreciation, deferred income tax expense and net derivative losses. Principal non-cash credits include amortizations of
| 49 |
Table of Contents
certain net regulatory liabilities and the 2008 pre-tax gain on the sale of Con Edison Development’s ownership interests in electricity generating plants. Non-cash charges or credits may also be accrued under the revenue decoupling and cost reconciliation mechanisms in the Utilities’ electric and gas rate plans in New York. See “Rate Agreements – CECONY– Electric and O&R – Electric” in Note B to the financial statements in Item 8.
Net cash flows from operating activities in 2010 for Con Edison and CECONY were $85 million and $17 million lower, respectively, than in 2009. The decreases in net cash flows reflect the January 2010 semi-annual payment of CECONY’s New York City property taxes. A comparable semi-annual payment was not made in January 2009 because the company paid its 2008-2009 New York City fiscal year property taxes in July 2008.
Net cash flows from operating activities in 2009 for Con Edison and CECONY were $1,826 million and $1,186 million higher, respectively, than in the 2008 period. The increases in net cash flows reflect the January 2008 semi-annual payment and July 2008 annual payment of CECONY’s New York City property taxes, compared with a semi-annual payment in July 2009. The Company achieved a 1.5 percent reduction in its New York City property taxes for the fiscal year ending June 30, 2009 by prepaying the annual tax amount in July 2008. The increase is offset by the effect of changes in commodity prices on cash collateral requirements under the Companies’ derivative instruments. For Con Edison, the increase also reflects the 2008 payment of income taxes on the gain on the sale of Con Edison Development’s ownership interests in electricity generating plants.
The change in net cash flows also reflects the timing of payments for and recovery of energy costs. This timing issue is reflected within changes to accounts receivable – customers, recoverable energy costs and accounts payable balances.
The changes in regulatory assets principally reflect changes in deferred pension costs in accordance with the accounting rules for retirement benefits and changes in future federal income taxes associated with increased removal costs. See Notes A, B and E to the financial statements in Item 8.
Cash Flows Used in Investing Activities
Net cash flows used in investing activities for Con Edison and CECONY were $185 million and $110 million lower, respectively, in 2010 than in 2009. The decrease reflects primarily decreased construction expenditures in 2010, offset in part for CECONY by repayment of loans by O&R to CECONY in 2009. See Note S to the financial statements in Item 8.
Net cash flows used in investing activities for Con Edison in 2009 were $1,289 million higher compared with 2008. The increase reflects primarily the absence of, in 2009, proceeds from the sale of Con Edison Development’s ownership interests in electricity generating plants in 2008, offset in part by decreased construction expenditures in 2009. Net cash flows used in investing activities for CECONY were $340 million lower in 2009 compared with 2008 reflecting primarily decreased construction expenditures and the repayment of loans by O&R. See Note S to the financial statements in Item 8.
Cash Flows from Financing Activities
Net cash flows from financing activities in 2010 for Con Edison and CECONY were $208 million and $240 million lower, respectively, than in 2009. In 2009, cash flows from financing activities for Con Edison and CECONY were $215 million and $1,348 lower, respectively, than in 2008.
Con Edison’s cash flows from financing activities for the years ended December 31, 2010 and 2009, reflect the issuance through public offerings of 6.3 million and 5.0 million Con Edison common shares resulting in net proceeds of $305 million and $213 million, respectively. The proceeds from these offerings were invested by Con Edison in CECONY. For CECONY, cash flows from financing activities in 2008 also reflect a $752 million capital contribution from Con Edison.
Cash flows from financing activities for 2010, 2009 and 2008 also reflect the issuance of Con Edison common shares through its dividend reinvestment and employee
| 50 |
Table of Contents
stock plans (2010: 4.2 million shares for $133 million, 2009: 2.4 million shares for $68 million, 2008: 1.7 million shares for $42 million). In addition, as a result of the stock plan issuances, cash used to pay common stock dividends was reduced by $48 million in 2010 and 2009 and $21 million in 2008.
Net cash flows from financing activities during the years ended December 31, 2010, 2009 and 2008 also reflect the following CECONY transactions:
2010
| • |
Issued $350 million 4.45% 10-year debentures and $350 million 5.70% 30-year debentures; |
| • |
Redeemed at maturity $325 million 8.125% 10-year debentures and $300 million 7.50% 10-year debentures; and |
| • |
Issued $224.6 million of 1.45%, tax-exempt debt (subject to mandatory tender in 2012); the proceeds of which were used to refund 4.70% tax-exempt debt (that was also subject to redemption in 2012). |
2009
| • |
Issued $275 million 5.55% 5-year debentures, $475 million 6.65% 10-year debentures and $600 million 5.50% 30-year debentures, the proceeds of which were used to redeem in advance of maturity $105 million 7.10% debentures and $75 million 6.90% debentures due 2028, to repay short-term borrowings and for other general corporate purposes; and |
| • |
Redeemed at maturity $275 million 4.70% 5-year debentures and $200 million 7.15% 10-year debentures. |
2008
| • |
Issued $600 million 5.85% 10-year debentures, $600 million 6.75% 30-year debentures and $600 million 7.125% 10-year debentures, the proceeds of which were used to repay short-term borrowings and for other general corporate purposes; and |
| • |
Redeemed at maturity $180 million 6.25% 10-year debentures and $100 million 6.15% 10-year debentures. |
In 2008, Con Edison issued $326 million of unsecured notes in exchange for a like amount of secured project debt and redeemed at maturity $200 million 3.625% 5-year debentures.
Con Edison’s net cash flows from financing activities also reflect the following O&R transactions:
2010
| • |
Issued $115 million 5.50% 30-year debentures; |
| • |
Redeemed in advance of maturity $45 million 7.00% 30-year debentures due 2029; |
| • |
Issued $55 million 2.50% 5-year debentures; the proceeds of which were used to purchase and cancel $55 million variable rate, tax-exempt debt that was due in 2014; and |
| • |
Redeemed at maturity $55 million 7.50% 10-year debentures. |
2009
| • |
Issued $60 million 4.96% 10-year debentures and $60 million 6.00% 30-year debentures, the proceeds of which were used to redeem (in January 2010) $45 million 7.00% debentures due 2029, to repay short-term debt and for other general corporate purposes. |
2008
| • |
Issued $50 million 6.15% 10-year debentures, the net proceeds of which were used for general corporate purposes, including repayment of short-term debt. |
| 51 |
Table of Contents
Cash flows from financing activities of the Companies also reflect commercial paper issuance (included on the consolidated balance sheets as “Notes payable”). The commercial paper amounts outstanding at December 31, 2010, 2009 and 2008 and the average daily balances for 2010, 2009 and 2008 for Con Edison and CECONY were as follows:
| 2010 | 2009 | 2008 | ||||||||||||||||||||||
|
(millions of dollars, except
weighted average yield) |
Outstanding at
December 31 |
Daily
average |
Outstanding at
December 31 |
Daily
average |
Outstanding at
December 31 |
Daily
average |
||||||||||||||||||
|
Con Edison |
$ | — | $ | 370 | $ | — | $ | 277 | $ | 363 | $ | 517 | ||||||||||||
|
CECONY |
$ | — | $ | 352 | $ | — | $ | 169 | $ | 253 | $ | 380 | ||||||||||||
|
Weighted average yield |
— | % | 0.4 | % | — | % | 0.4 | % | 2.4 | % | 3.4 | % | ||||||||||||
Common stock issuances and external borrowings are sources of liquidity that could be affected by changes in credit ratings, financial performance and capital market conditions. For information about the Companies’ credit ratings and certain financial ratios, see “Capital Requirements and Resources” in Item 1.
Other Changes in Assets and Liabilities
The following table shows changes in certain assets and liabilities at December 31, 2010, compared with December 31, 2009.
| (millions of dollars) |
Con Edison
2010 vs. 2009 Variance |
CECONY
2010 vs. 2009 Variance |
||||||
|
Assets |
||||||||
|
Prepayments |
$ | 210 | $ | — | ||||
|
Accounts receivable from affiliated companies |
— | 125 | ||||||
|
Regulatory asset – Environmental remediation costs |
303 | 241 | ||||||
|
Regulatory asset – Unrecognized pension and other postretirement costs |
(101 | ) | (107 | ) | ||||
|
Liabilities |
||||||||
|
Deferred income taxes and investment tax credits |
993 | 932 | ||||||
|
Superfund and other environmental costs |
300 | 233 | ||||||
|
Pension and retiree benefits |
(76 | ) | (78 | ) | ||||
Prepayments, Accounts Receivable from Affiliated Companies and Deferred Income Taxes and Investment Tax Credits
The increase in prepayments for Con Edison, and in accounts receivable from affiliated companies for CECONY, reflects estimated federal income tax payments by the company that were made prior to the determination that the company had no current federal income tax liability for 2010. See “Cash Flows from Operating Activities,” above and Note L to the financial statements in Item 8.
The increase in the liability for deferred income taxes and investment tax credits reflects the timing of the deduction of expenditures for utility plant which resulted in amounts being collected from customers to pay income taxes in advance of when the income tax payments will be required. See “Cash Flows from Operating Activities,” above.
Regulatory Asset for Environmental Remediation Costs and Liability for Superfund and Other Environmental Costs
The increase in the regulatory asset for environmental remediation costs and Superfund and other environmental costs liability reflects an increased estimate of costs for site investigation and remediation. See Note G to the financial statements in Item 8.
Regulatory Asset for Unrecognized Pension and Other Postretirement Costs and Non-current Liability for Pension and Retiree Benefits
The decreases in the regulatory asset for unrecognized pension and other postretirement benefit costs and the non-current liability for pension and retiree benefits reflects the final actuarial valuation of the underfunding of the pension and other retiree benefit plans as measured at December 31, 2010 in accordance with the accounting rules for pensions and the year’s amortization of accounting costs. The decrease in the non-current liability for pension and retiree benefits also reflects the contributions to the pension plan made by CECONY in 2010. See Notes B, E and F to the financial statements in Item 8.
| 52 |
Table of Contents
Capital Requirements and Resources
For information about capital requirements, contractual obligations and capital resources, see “Capital Requirements and Resources” in Item 1.
Regulatory Matters
For Information about the Utilities’ rate plans and other regulatory matters affecting the Companies, see “Utility Regulation” in Item 1 and Note B to the financial statements in Item 8.
Financial and Commodity Market Risks
The Companies are subject to various risks and uncertainties associated with financial and commodity markets. The most significant market risks include interest rate risk, commodity price risk, credit risk and investment risk.
Interest Rate Risk
The interest rate risk relates primarily to variable rate debt and to new debt financing needed to fund capital requirements, including the construction expenditures of the Utilities and maturing debt securities. Con Edison and its businesses manage interest rate risk through the issuance of mostly fixed-rate debt with varying maturities and through opportunistic refinancing of debt. Con Edison and CECONY estimate that at December 31, 2010, a 10 percent variation in interest rates applicable to its variable rate debt would not result in a material change in annual interest expense. Under CECONY’s current gas, steam and (beginning in April 2011) electric rate plans and O&R’s current New York gas rate plan, variations in long-term debt costs are reconciled to levels reflected in rates. Under O&R’s current New York electric rate plan, variations in variable tax-exempt debt interest expense are reconciled to the level set in rates.
In addition, from time to time, Con Edison and its businesses enter into derivative financial instruments to hedge interest rate risk on certain debt securities. See “Interest Rate Swaps” in Note O to the financial statements in Item 8.
Commodity Price Risk
Con Edison’s commodity price risk relates primarily to the purchase and sale of electricity, gas and related derivative instruments. The Utilities and Con Edison’s competitive energy businesses have risk management strategies to mitigate their related exposures. See Note O to the financial statements in Item 8.
Con Edison estimates that, as of December 31, 2010, a 10 percent decline in market prices would result in a decline in fair value of $106 million for the derivative instruments used by the Utilities to hedge purchases of electricity and gas, of which $85 million is for CECONY and $21 million is for O&R. Con Edison expects that any such change in fair value would be largely offset by directionally opposite changes in the cost of the electricity and gas purchased. In accordance with provisions approved by state regulators, the Utilities generally recover from customers the costs they incur for energy purchased for their customers, including gains and losses on certain derivative instruments used to hedge energy purchased and related costs. See “Recoverable Energy Costs” in Note A to the financial statements in Item 8.
Con Edison’s competitive energy businesses use a value-at-risk (VaR) model to assess the market risk of their electricity and gas commodity fixed-price purchase and sales commitments, physical forward contracts and commodity derivative instruments. VaR represents the potential change in fair value of instruments or the portfolio due to changes in market factors, for a specified time period and confidence level. These businesses estimate VaR across their electricity and natural gas commodity businesses using a delta-normal variance/covariance model with a 95 percent confidence level. Since the VaR calculation involves complex methodologies and estimates and assumptions that are based on past experience, it is not necessarily indicative of future results. VaR for transactions associated with hedges on generating assets and commodity contracts, assuming a one-day holding period, for the years ended December 31, 2010, and 2009, respectively, was as follows:
|
95% Confidence Level, One-Day Holding Period |
2010 | 2009 | ||||||
| (millions of dollars) | ||||||||
|
Average for the period |
$ | 1 | $ | 1 | ||||
|
High |
1 | 2 | ||||||
|
Low |
— | — | ||||||
| 53 |
Table of Contents
Credit Risk
The Companies are exposed to credit risk related to transactions entered into primarily for the various energy supply and hedging activities by the Utilities and the competitive energy businesses. Credit risk relates to the loss that may result from a counterparty’s nonperformance. The Companies use credit policies to manage this risk, including an established credit approval process, monitoring of counterparty limits, netting provisions within agreements and collateral or prepayment arrangements, credit insurance and credit default swaps. The Companies measure credit risk exposure as the replacement cost for open energy commodity and derivative positions plus amounts owed from counterparties for settled transactions. The replacement cost of open positions represents unrealized gains, net of any unrealized losses where the company has a legally enforceable right of setoff.
The Utilities had $38 million of credit exposure in connection with energy supply and hedging activities, net of collateral, at December 31, 2010, of which $2 million was with investment grade counterparties and $36 million was with commodity exchange brokers.
Con Edison’s competitive energy businesses had $119 million of credit exposure in connection with energy supply and hedging activities, net of collateral, at December 31, 2010, of which $74 million was with investment grade counterparties, $19 million was with commodity exchange brokers and $26 million was with independent system operators.
Investment Risk
The Companies’ investment risk relates to the investment of plan assets for their pension and other postretirement benefit plans. See “Application of Critical Accounting Policies – Accounting for Pensions and Other Postretirement Benefits,” above. The Companies’ current investment policy for pension plan assets includes investment targets of 65 percent equities and 35 percent fixed income and other securities. At December 31, 2010, the pension plan investments consisted of 67 percent equity and 33 percent fixed income and other securities.
Environmental Matters
For information concerning climate change, environmental sustainability, potential liabilities arising from laws and regulations protecting the environment and other environmental matters, see “Environmental Matters” in Item 1 and Note G to the financial statements in Item 8.
Impact of Inflation
The Companies are affected by the decline in the purchasing power of the dollar caused by inflation. Regulation permits the Utilities to recover through depreciation only the historical cost of their plant assets even though in an inflationary economy the cost to replace the assets upon their retirement will substantially exceed historical costs. The impact is, however, partially offset by the repayment of the Companies’ long-term debt in dollars of lesser value than the dollars originally borrowed.
Material Contingencies
For information concerning potential liabilities arising from the Companies’ material contingencies, see “Application of Critical Accounting Policies – Accounting for Contingencies,” above, and Notes B, G, H, J and L to the financial statements in Item 8.
Results of Operations
Results of operations reflect, among other things, the Companies’ accounting policies (see “Application of Critical Accounting Policies,” above) and rate plans that limit the rates the Utilities can charge their customers (see “Utility Regulation” in Item 1). Under the revenue decoupling mechanisms currently applicable to CECONY’s electric and gas businesses and O&R’s electric and gas businesses in New York, the Utilities’ delivery revenues generally will not be affected by changes in delivery volumes from levels assumed when rates were approved. Revenues for CECONY’s steam business and O&R’s businesses in New Jersey and Pennsylvania are affected by changes in delivery volumes resulting from weather, economic conditions and other factors. See Note B to the financial statements in Item 8.
The Companies’ results of operations for 2010, as compared with 2009, reflect changes in the Utilities’
| 54 |
Table of Contents
rate plans (including additional revenues designed to recover expected increases in certain operations and maintenance expenses, depreciation and property taxes and interest charges), and the operating results of the competitive energy businesses (including net mark-to-market effects). The results of operations for 2010 as compared with 2009 include a higher allowed electric return on common equity for CECONY. Operations and maintenance expenses were higher in 2010 compared with 2009 reflecting primarily higher costs for demand side management programs and employee health insurance, offset in part by savings in operating expenses through cost control efforts. The increases also reflect higher New York State assessments that are collected from customers and higher costs for pension and other postretirement benefits. Depreciation and property taxes were higher in 2010 compared with 2009 reflecting primarily the impact from higher utility plant balances. For additional information about major factors affecting earnings, see “Results of Operations – Summary,” above.
In general, the Utilities recover on a current basis the fuel, gas purchased for resale and purchased power costs they incur in supplying energy to their full-service customers (see “Recoverable Energy Costs” in Note A and “Regulatory Matters” in Note B to the financial statements in Item 8). Accordingly, such costs do not generally affect the Companies’ results of operations. Management uses the term “net revenues” (operating revenues less such costs) to identify changes in operating revenues that may affect the Companies’ results of operations. Management believes that, although “net revenues” may not be a measure determined in accordance with accounting principles generally accepted in the United States of America, the measure facilitates the analysis by management and investors of the Companies’ results of operations.
A discussion of the results of operations by principal business segment for the years ended December 31, 2010, 2009 and 2008 follows. For additional business segment financial information, see Note N to the financial statements in Item 8.
Year Ended December 31, 2010 Compared with Year Ended December 31, 2009
The Companies’ results of operations (which were discussed above under “Results of Operations – Summary”) in 2010 compared with 2009 were:
| CECONY | O&R |
Competitive Energy
|
Con Edison(b) | |||||||||||||||||||||||||||||
| (millions of dollars) |
Increases
(Decreases) Amount |
Increases
(Decreases) Percent |
Increases
(Decreases) Amount |
Increases
(Decreases) Percent |
Increases
(Decreases) Amount |
Increases
(Decreases) Percent |
Increases
(Decreases) Amount |
Increases
(Decreases) Percent |
||||||||||||||||||||||||
|
Operating revenues |
$ | 537 | 5.4 | % | $ | 20 | 2.2 | % | $ | (264 | ) | (12.5 | )% | $ | 293 | 2.2 | % | |||||||||||||||
|
Purchased power |
100 | 3.9 | 7 | 2.1 | (270 | ) | (14.5 | ) | (163 | ) | (3.4 | ) | ||||||||||||||||||||
|
Fuel |
(45 | ) | (8.9 | ) | N/A | N/A | — | — | (45 | ) | (8.9 | ) | ||||||||||||||||||||
|
Gas purchased for resale |
(266 | ) | (32.5 | ) | (37 | ) | (27.2 | ) | 1 | 11.1 | (302 | ) | (31.4 | ) | ||||||||||||||||||
|
Operating revenues less purchased power, fuel and gas purchased for resale (net revenues) |
748 | 12.2 | 50 | 11.7 | 5 | 2.2 | 803 | 11.8 | ||||||||||||||||||||||||
|
Other operations and maintenance |
329 | 15.1 | 28 | 11.3 | (2 | ) | (1.6 | ) | 355 | 13.9 | ||||||||||||||||||||||
|
Depreciation and amortization |
43 | 5.8 | 2 | 4.8 | 4 | 80.0 | 49 | 6.2 | ||||||||||||||||||||||||
|
Taxes, other than income taxes |
170 | 11.4 | 4 | 8.9 | 4 | 28.6 | 178 | 11.5 | ||||||||||||||||||||||||
|
Operating income |
206 | 12.0 | 16 | 17.4 | (1 | ) | (1.1 | ) | 221 | 11.6 | ||||||||||||||||||||||
|
Other income less deductions |
(7 | ) | (21.2 | ) | — | — | 16 | Large | 9 | 29.0 | ||||||||||||||||||||||
|
Net interest expense |
(4 | ) | (0.7 | ) | 7 | 25.0 | (5 | ) | (16.7 | ) | (2 | ) | (0.3 | ) | ||||||||||||||||||
|
Income, before taxes |
203 | 17.0 | 9 | 13.6 | 20 | 35.1 | 232 | 17.6 | ||||||||||||||||||||||||
|
Incomes taxes |
91 | 22.5 | 3 | 13.0 | 14 | Large | 108 | 24.5 | ||||||||||||||||||||||||
|
Net income for common stock |
$ | 112 | 14.3 | % | $ | 6 | 14.0 | % | $ | 6 | 13.6 | % | $ | 124 | 14.3 | % | ||||||||||||||||
| (a) | Includes inter-company and parent company accounting. |
| (b) | Represents the consolidated financial results of Con Edison and its businesses. |
| 55 |
Table of Contents
CECONY
|
Twelve Months Ended
December 31, 2010 |
Twelve Months Ended
December 31, 2009 |
|||||||||||||||||||||||||||||||||||
| (millions of dollars) | Electric | Gas | Steam |
2010
Total |
Electric | Gas | Steam |
2009
Total |
2010-2009
Variation |
|||||||||||||||||||||||||||
|
Operating revenues |
$ | 8,376 | $ | 1,541 | $ | 656 | $ | 10,573 | $ | 7,674 | $ | 1,701 | $ | 661 | $ | 10,036 | $ | 537 | ||||||||||||||||||
|
Purchased power |
2,629 | — | 54 | 2,683 | 2,529 | — | 54 | 2,583 | 100 | |||||||||||||||||||||||||||
|
Fuel |
256 | — | 202 | 458 | 247 | — | 256 | 503 | (45 | ) | ||||||||||||||||||||||||||
|
Gas purchased for resale |
— | 552 | — | 552 | — | 818 | — | 818 | (266 | ) | ||||||||||||||||||||||||||
|
Net revenues |
5,491 | 989 | 400 | 6,880 | 4,898 | 883 | 351 | 6,132 | 748 | |||||||||||||||||||||||||||
|
Operations and maintenance |
1,963 | 368 | 184 | 2,515 | 1,734 | 281 | 171 | 2,186 | 329 | |||||||||||||||||||||||||||
|
Depreciation and amortization |
623 | 102 | 62 | 787 | 587 | 98 | 59 | 744 | 43 | |||||||||||||||||||||||||||
|
Taxes, other than income taxes |
1,356 | 209 | 91 | 1,656 | 1,209 | 195 | 82 | 1,486 | 170 | |||||||||||||||||||||||||||
|
Operating income |
$ | 1,549 | $ | 310 | $ | 63 | $ | 1,922 | $ | 1,368 | $ | 309 | $ | 39 | $ | 1,716 | $ | 206 | ||||||||||||||||||
Electric
CECONY’s results of electric operations for the year ended December 31, 2010 compared with the year ended December 31, 2009 is as follows:
| Twelve Months Ended | ||||||||||||
| (millions of dollars) |
December 31,
2010 |
December 31,
2009 |
Variation | |||||||||
|
Operating revenues |
$ | 8,376 | $ | 7,674 | $ | 702 | ||||||
|
Purchased power |
2,629 | 2,529 | 100 | |||||||||
|
Fuel |
256 | 247 | 9 | |||||||||
|
Net revenues |
5,491 | 4,898 | 593 | |||||||||
|
Operations and maintenance |
1,963 | 1,734 | 229 | |||||||||
|
Depreciation and amortization |
623 | 587 | 36 | |||||||||
|
Taxes, other than income taxes |
1,356 | 1,209 | 147 | |||||||||
|
Electric operating income |
$ | 1,549 | $ | 1,368 | $ | 181 | ||||||
CECONY’s electric sales and deliveries, excluding off-system sales, in 2010 compared with 2009 were:
| Millions of kWhs Delivered | Revenues in Millions | |||||||||||||||||||||||||||||||
| Twelve Months Ended | Twelve Months Ended | |||||||||||||||||||||||||||||||
| Description |
December 31,
2010 |
December 31,
2009 |
Variation |
Percent
Variation |
December 31,
2010 |
December 31,
2009 |
Variation |
Percent
Variation |
||||||||||||||||||||||||
|
Residential/Religious(a) |
11,518 | 10,952 | 566 | 5.2 | % | $ | 2,977 | $ | 2,583 | $ | 394 | 15.3 | % | |||||||||||||||||||
|
Commercial/Industrial |
12,559 | 12,457 | 102 | 0.8 | 2,557 | 2,444 | 113 | 4.6 | ||||||||||||||||||||||||
|
Retail access customers |
23,098 | 21,859 | 1,239 | 5.7 | 2,123 | 1,855 | 268 | 14.4 | ||||||||||||||||||||||||
|
NYPA, Municipal Agency and other sales |
11,518 | 11,399 | 119 | 1.0 | 550 | 457 | 93 | 20.4 | ||||||||||||||||||||||||
|
Other operating revenues |
— | — | — | — | 169 | 335 | (166 | ) | (49.6 | ) | ||||||||||||||||||||||
|
Total |
58,693 | 56,667 | 2,026 | 3.6 | % | $ | 8,376 | $ | 7,674 | $ | 702 | 9.1 | % | |||||||||||||||||||
| (a) | “Residential/Religious” generally includes single-family dwellings, individual apartments in multi-family dwellings, religious organizations and certain other not-for-profit organizations. |
CECONY’s electric operating revenues increased $702 million in 2010 compared with 2009 due primarily to the electric rate plans ($772 million, which among other things, reflected a 10.15 percent return on common equity, effective April 2010, a 10.0 percent return, effective April 2009 and a 9.1 percent return, effective April 2008) and higher purchased power costs ($100 million), offset in part by the accrual for the revenue decoupling mechanism (a reduction of $124 million of revenues in 2010 compared with increased revenues of $116 million in 2009). CECONY’s revenues from electric sales are subject to a revenue
| 56 |
Table of Contents
decoupling mechanism, as a result of which delivery revenues generally are not affected by changes in delivery volumes from levels assumed when rates were approved. Other electric operating revenues generally reflect changes in regulatory assets and liabilities in accordance with the revenue decoupling mechanism and other provisions of the company’s rate plans. See Note B to the financial statements in Item 8.
Electric delivery volumes in CECONY’s service area increased 3.6 percent in 2010 compared with 2009. After adjusting for variations, principally weather and billing days, electric delivery volumes in CECONY’s service area increased 0.5 percent in 2010 compared with 2009.
CECONY’s electric purchased power costs increased $100 million in 2010 compared with 2009 due to an increase in unit costs ($110 million), offset by a decrease in purchased volumes ($10 million). Electric fuel costs increased $9 million in 2010 compared with 2009 due to higher sendout volumes from the company’s electric generating facilities ($65 million), offset by lower unit costs ($56 million).
CECONY’s electric operating income increased $181 million in 2010 compared with 2009. The increase reflects primarily higher net revenues ($593 million, due primarily to the electric rate plan, including the collection of a surcharge for a New York State assessment and the recovery of higher pension expense). The higher net revenues were offset by higher operations and maintenance costs ($229 million, due primarily to higher demand side management expenses ($120 million), the surcharge for a New York State assessment ($68 million), higher pension expense ($20 million), and higher costs for injuries and damages ($16 million), offset in part by reduced operating expenses due to cost control efforts), taxes other than income taxes ($147 million, principally property taxes) and depreciation and amortization ($36 million). The increased operating expenses in the first quarter of 2010 resulting from two severe winter storms were deferred as a regulatory asset, and did not affect electric operating income. See “Regulatory Assets and Liabilities” in Note B to the financial statements in Item 8.
Gas
CECONY’s results of gas operations for the year ended December 31, 2010 compared with the year ended December 31, 2009 is as follows:
| Twelve Months Ended | ||||||||||||
| (millions of dollars) |
December 31,
2010 |
December 31,
2009 |
Variation | |||||||||
|
Operating revenues |
$ | 1,541 | $ | 1,701 | $ | (160 | ) | |||||
|
Gas purchased for resale |
552 | 818 | (266 | ) | ||||||||
|
Net revenues |
989 | 883 | 106 | |||||||||
|
Operations and maintenance |
368 | 281 | 87 | |||||||||
|
Depreciation and amortization |
102 | 98 | 4 | |||||||||
|
Taxes, other than income taxes |
209 | 195 | 14 | |||||||||
|
Gas operating income |
$ | 310 | $ | 309 | $ | 1 | ||||||
| 57 |
Table of Contents
CECONY’s gas sales and deliveries, excluding off-system sales, in 2010 compared with 2009 were:
| Thousands of dths Delivered | Revenues in Millions | |||||||||||||||||||||||||||||||
| Twelve Months Ended | Twelve Months Ended | |||||||||||||||||||||||||||||||
| Description |
December 31,
2010 |
December 31,
2009 |
Variation |
Percent
Variation |
December 31,
2010 |
December 31,
2009 |
Variation |
Percent
Variation |
||||||||||||||||||||||||
|
Residential |
37,963 | 39,749 | (1,786 | ) | (4.5 | )% | $ | 733 | $ | 808 | $ | (75 | ) | (9.3 | )% | |||||||||||||||||
|
General |
25,629 | 28,245 | (2,616 | ) | (9.3 | ) | 366 | 421 | (55 | ) | (13.1 | ) | ||||||||||||||||||||
|
Firm transportation |
51,859 | 48,671 | 3,188 | 6.6 | 347 | 266 | 81 | 30.5 | ||||||||||||||||||||||||
|
Total firm sales and transportation |
115,451 | 116,665 | (1,214 | ) | (1.0 | ) | 1,446 | 1,495 | (49 | ) | (3.3 | ) | ||||||||||||||||||||
|
Interruptible sales(a) |
8,521 | 8,225 | 296 | 6.6 | 60 | 75 | (15 | ) | (20.0 | ) | ||||||||||||||||||||||
|
NYPA |
24,890 | 37,764 | (12,874 | ) | (34.1 | ) | 2 | 4 | (2 | ) | (50.0 | ) | ||||||||||||||||||||
|
Generation plants |
78,880 | 68,157 | 10,723 | 15.7 | 36 | 34 | 2 | 5.9 | ||||||||||||||||||||||||
|
Other |
20,786 | 18,297 | 2,489 | 13.6 | 51 | 39 | 12 | 30.8 | ||||||||||||||||||||||||
|
Other operating revenues |
— | — | — | — | (54 | ) | 54 | (108 | ) | Large | ||||||||||||||||||||||
|
Total |
248,528 | 249,108 | (580 | ) | (0.2 | )% | $ | 1,541 | $ | 1,701 | $ | (160 | ) | (9.4 | )% | |||||||||||||||||
| (a) | Includes 3,385 and 2,851 thousands of dths for 2010 and 2009, respectively, which are also reflected in firm transportation and other. |
CECONY’s gas operating revenues decreased $160 million in 2010 compared with 2009 due primarily to a decrease in gas purchased for resale costs ($266 million), offset in part by the gas rate plans ($78 million). CECONY’s revenues from gas sales are subject to a weather normalization clause and a revenue decoupling mechanism as a result of which delivery revenues are generally not affected by changes in delivery volumes from levels assumed when rates were approved. Other gas operating revenues generally reflect changes in regulatory assets and liabilities in accordance with the company’s rate plans. See Note B to the financial statements in Item 8.
CECONY’s sales and transportation volumes for firm customers decreased 1.0 percent in 2010 compared with 2009. After adjusting for variations, principally weather and billing days, firm gas sales and transportation volumes in the company’s service area increased 2.1 percent in 2010, reflecting primarily new business and transfers of interruptible customers to firm service.
CECONY’s purchased gas cost decreased $266 million in 2010 compared with 2009 due to lower unit costs ($246 million) and sendout volumes ($20 million).
CECONY’s gas operating income increased $1 million in 2010 compared with 2009. The increase reflects primarily higher net revenues ($106 million), offset by higher operations and maintenance expense ($87 million, due primarily to a surcharge for a New York State assessment ($30 million) and higher pension expense ($28 million)), taxes other than income taxes ($14 million, principally property taxes) and depreciation ($4 million).
Steam
CECONY’s results of steam operations for the year ended December 31, 2010 compared with the year ended December 31, 2009 is as follows:
| Twelve Months Ended | ||||||||||||
| (millions of dollars) |
December 31,
2010 |
December 31,
2009 |
Variation | |||||||||
|
Operating revenues |
$ | 656 | $ | 661 | $ | (5 | ) | |||||
|
Purchased power |
54 | 54 | — | |||||||||
|
Fuel |
202 | 256 | (54 | ) | ||||||||
|
Net revenues |
400 | 351 | 49 | |||||||||
|
Operations and maintenance |
184 | 171 | 13 | |||||||||
|
Depreciation and amortization |
62 | 59 | 3 | |||||||||
|
Taxes, other than income taxes |
91 | 82 | 9 | |||||||||
|
Steam operating income |
$ | 63 | $ | 39 | $ | 24 | ||||||
| 58 |
Table of Contents
CECONY’s steam sales and deliveries in 2010 compared with 2009 were:
| Millions of Pounds Delivered | Revenues in Millions | |||||||||||||||||||||||||||||||
| Twelve Months Ended | Twelve Months Ended | |||||||||||||||||||||||||||||||
| Description |
December 31,
2010 |
December 31,
2009 |
Variation |
Percent
Variation |
December 31,
2010 |
December 31,
2009 |
Variation |
Percent
Variation |
||||||||||||||||||||||||
|
General |
257 | 786 | (529 | ) | (67.3 | )% | $ | 21 | $ | 28 | $ | (7 | ) | (25.0 | )% | |||||||||||||||||
|
Apartment house |
5,870 | 5,962 | (92 | ) | (1.5 | ) | 160 | 165 | (5 | ) | (3.0 | ) | ||||||||||||||||||||
|
Annual power |
16,903 | 16,269 | 634 | 3.9 | 459 | 446 | 13 | 2.9 | ||||||||||||||||||||||||
|
Other operating revenues |
— | — | — | — | 16 | 22 | (6 | ) | (27.3 | ) | ||||||||||||||||||||||
|
Total |
23,030 | 23,017 | 13 | 0.1 | % | $ | 656 | $ | 661 | $ | (5 | ) | (0.8 | )% | ||||||||||||||||||
CECONY’s steam operating revenues decreased $5 million in 2010 compared with 2009 due primarily to lower fuel costs ($54 million), offset in part by the net change in rates under the steam rate plan ($53 million). Other steam operating revenues generally reflect changes in regulatory assets and liabilities in accordance with the company’s rate plans. See Note B to the financial statements in Item 8.
Steam sales and delivery volumes increased 0.1 percent in 2010 compared with 2009. After adjusting for variations, principally weather and billing days, steam sales and deliveries decreased 1.3 percent in 2010, reflecting the impact of lower average normalized use per customer.
CECONY’s steam purchased power costs were the same in 2010 compared with 2009. Steam fuel costs decreased $54 million in 2010 compared with 2009 due to lower unit costs ($59 million), offset by higher sendout volumes ($5 million).
Steam operating income increased $24 million in 2010 compared with 2009. The increase reflects primarily higher net revenues ($49 million), offset by higher operations and maintenance expense ($13 million, due primarily to a surcharge for a New York State assessment ($8 million) and higher pension expense ($7 million), offset in part by lower customer accounts expense ($3 million)), taxes other than income taxes ($9 million, principally property taxes) and depreciation ($3 million).
Taxes Other Than Income Taxes
At over $1 billion, taxes other than income taxes remain one of CECONY’s largest operating expenses. The principal components of, and variations in, taxes other than income taxes were:
| (millions of dollars) | 2010 | 2009 |
Increase/ (Decrease) |
|||||||||
|
Property taxes |
$ | 1,271 | $ | 1,135 | $ | 136 | (a) | |||||
|
State and local taxes related to revenue receipts |
315 | 282 | 33 | |||||||||
|
Payroll taxes |
65 | 59 | 6 | |||||||||
|
Other taxes |
5 | 10 | (5 | ) | ||||||||
|
Total |
$ | 1,656 | (b) | $ | 1,486 | (b) | $ | 170 | ||||
| (a) | Property taxes increased $136 million reflecting primarily higher capital investments. |
| (b) | Including sales tax on customers’ bills, total taxes other than income taxes, billed to customers in 2010 and 2009 were $2,122 million and $1,866 million, respectively. |
Income Taxes
Income taxes increased $91 million in 2010 compared with 2009 due primarily to higher taxable income in 2010.
Other Income (Deductions)
Other income (deductions) decreased $7 million in 2010 compared with 2009 due primarily to a penalty in 2010 ($5 million) from the NYSDEC relating to pollutants at the company’s steam generating facilities. See “Permit Non-Compliance and Pollution Discharges” in Item 3.
Net Interest Expense
Net interest expense decreased $4 million in 2010 compared with 2009 due primarily to lower interest charges on customer deposits ($6 million), offset in part by new debt issuances in 2010 and late in 2009 ($3 million).
| 59 |
Table of Contents
O&R
|
Twelve Months Ended
December 31, 2010 |
Twelve Months Ended
December 31, 2009 |
|||||||||||||||||||||||||||
| (millions of dollars) | Electric | Gas |
2010
Total |
Electric | Gas |
2009
Total |
2010-2009
Variation |
|||||||||||||||||||||
|
Operating revenues |
$ | 692 | $ | 218 | $ | 910 | $ | 648 | $ | 242 | $ | 890 | $ | 20 | ||||||||||||||
|
Purchased power |
335 | — | 335 | 328 | — | 328 | 7 | |||||||||||||||||||||
|
Gas purchased for resale |
— | 99 | 99 | — | 136 | 136 | (37 | ) | ||||||||||||||||||||
|
Net revenues |
357 | 119 | 476 | 320 | 106 | 426 | 50 | |||||||||||||||||||||
|
Operations and maintenance |
216 | 59 | 275 | 193 | 54 | 247 | 28 | |||||||||||||||||||||
|
Depreciation and amortization |
32 | 12 | 44 | 30 | 12 | 42 | 2 | |||||||||||||||||||||
|
Taxes, other than income taxes |
35 | 14 | 49 | 33 | 12 | 45 | 4 | |||||||||||||||||||||
|
Operating income |
$ | 74 | $ | 34 | $ | 108 | $ | 64 | $ | 28 | $ | 92 | $ | 16 | ||||||||||||||
Electric
O&R’s results of electric operations for the year ended December 31, 2010 compared with the year ended December 31, 2009 is as follows:
| Twelve Months Ended | ||||||||||||
| (millions of dollars) |
December 31,
2010 |
December 31,
2009 |
Variation | |||||||||
|
Operating revenues |
$ | 692 | $ | 648 | $ | 44 | ||||||
|
Purchased power |
335 | 328 | 7 | |||||||||
|
Net revenues |
357 | 320 | 37 | |||||||||
|
Operations and maintenance |
216 | 193 | 23 | |||||||||
|
Depreciation and amortization |
32 | 30 | 2 | |||||||||
|
Taxes, other than income taxes |
35 | 33 | 2 | |||||||||
|
Electric operating income |
$ | 74 | $ | 64 | $ | 10 | ||||||
O&R’s electric sales and deliveries, excluding off-system sales, in 2010 compared with 2009 were:
| Millions of kWhs Delivered | Revenues in Millions | |||||||||||||||||||||||||||||||
| Twelve Months Ended | Twelve Months Ended | |||||||||||||||||||||||||||||||
| Description |
December 31,
2010 |
December 31,
2009 |
Variation |
Percent
Variation |
December 31,
2010 |
December 31,
2009 |
Variation |
Percent
Variation |
||||||||||||||||||||||||
|
Residential/Religious(a) |
1,893 | 1,799 | 94 | 5.2 | % | $ | 347 | $ | 309 | $ | 38 | 12.3 | % | |||||||||||||||||||
|
Commercial/Industrial |
1,495 | 1,763 | (268 | ) | (15.2 | ) | 211 | 231 | (21 | ) | (9.1 | ) | ||||||||||||||||||||
|
Retail access customers |
2,330 | 1,901 | 429 | 22.6 | 132 | 95 | 37 | 38.9 | ||||||||||||||||||||||||
|
Public authorities |
110 | 111 | (1 | ) | (0.9 | ) | 12 | 11 | 1 | 9.1 | ||||||||||||||||||||||
|
Other operating revenues |
— | — | — | — | (10 | ) | 2 | (12 | ) | Large | ||||||||||||||||||||||
|
Total |
5,828 | 5,574 | 254 | 4.6 | % | $ | 692 | $ | 648 | $ | 44 | 6.8 | % | |||||||||||||||||||
| (a) | “Residential/Religious” generally includes single-family dwellings, individual apartments in multi-family dwellings, religious organizations and certain other not-for-profit organizations. |
O&R’s electric operating revenues increased $44 million in 2010 compared with 2009 due primarily to the New York electric rate plan ($19 million) and for O&R’s New Jersey and Pennsylvania operations the warmer summer weather in the 2010 period ($3 million). O&R’s New York electric delivery revenues are subject to a revenue decoupling mechanism, as a result of which, delivery revenues are generally not affected by changes in delivery volumes from levels assumed when rates were approved. O&R’s electric sales in New Jersey and Pennsylvania are not subject to a decoupling mechanism, and as a result, changes in such volumes do impact revenues. Other electric operating revenues generally reflect changes in regulatory assets and liabilities in accordance with the company’s electric rate plan. See Note B to the financial statements in Item 8.
| 60 |
Table of Contents
Electric delivery volumes in O&R’s service area increased 4.6 percent in 2010 compared with 2009. After adjusting for weather variations and unbilled volumes, electric delivery volumes in O&R’s service area increased 0.7 percent in 2010 compared with 2009.
Electric operating income increased $10 million in 2010 compared with 2009. The increase reflects primarily higher net revenues ($37 million), offset by higher operations and maintenance expense ($23 million), due primarily to a surcharge for a New York State assessment ($7 million) and higher pension expense ($6 million)), taxes other than income taxes ($2 million, principally state and local taxes) and depreciation ($2 million).
Gas
O&R’s results of gas operations for the year ended December 31, 2010 compared with the year ended December 31, 2009 is as follows:
| Twelve Months Ended | ||||||||||||
| (millions of dollars) |
December 31,
2010 |
December 31,
2009 |
Variation | |||||||||
|
Operating revenues |
$ | 218 | $ | 242 | $ | (24 | ) | |||||
|
Gas purchased for resale |
99 | 136 | (37 | ) | ||||||||
|
Net revenues |
119 | 106 | 13 | |||||||||
|
Operations and maintenance |
59 | 54 | 5 | |||||||||
|
Depreciation and amortization |
12 | 12 | — | |||||||||
|
Taxes, other than income taxes |
14 | 12 | 2 | |||||||||
|
Gas operating income |
$ | 34 | $ | 28 | $ | 6 | ||||||
O&R’s gas sales and deliveries, excluding off-system sales, in 2010 compared with 2009 were:
| Thousands of dths Delivered | Revenues in Millions | |||||||||||||||||||||||||||||||
| Twelve Months Ended | Twelve Months Ended | |||||||||||||||||||||||||||||||
| Description |
December 31,
2010 |
December 31,
2009 |
Variation |
Percent
Variation |
December 31,
2010 |
December 31,
2009 |
Variation |
Percent
Variation |
||||||||||||||||||||||||
|
Residential |
7,336 | 7,811 | (475 | ) | (6.1 | )% | $ | 111 | $ | 132 | $ | (21 | ) | (15.9 | )% | |||||||||||||||||
|
General |
1,436 | 1,750 | (314 | ) | (17.9 | ) | 20 | 27 | (7 | ) | (25.9 | ) | ||||||||||||||||||||
|
Firm transportation |
10,692 | 10,905 | (213 | ) | (2.0 | ) | 65 | 51 | 14 | 27.5 | ||||||||||||||||||||||
|
Total firm sales and transportation |
19,464 | 20,466 | (1,002 | ) | (4.9 | ) | 196 | 210 | (14 | ) | (6.7 | ) | ||||||||||||||||||||
|
Interruptible sales |
4,497 | 4,502 | (5 | ) | (0.2 | ) | 9 | 21 | (12 | ) | (57.1 | ) | ||||||||||||||||||||
|
Generation plants |
691 | 1,346 | (655 | ) | (48.7 | ) | — | 2 | (2 | ) | Large | |||||||||||||||||||||
|
Other |
840 | 953 | (113 | ) | (11.9 | ) | — | — | — | — | ||||||||||||||||||||||
|
Other gas revenues |
— | — | — | — | 13 | 9 | (4 | ) | (44.5 | ) | ||||||||||||||||||||||
|
Total |
25,492 | 27,267 | (1,775 | ) | (6.5 | )% | $ | 218 | $ | 242 | $ | (24 | ) | (10.0 | )% | |||||||||||||||||
O&R’s gas operating revenues decreased $24 million in 2010 compared with 2009 due primarily to the decrease in gas purchased for resale in 2010 ($37 million), offset in part by the gas rate plan. Effective November 2009, O&R’s New York gas delivery revenues became subject to a revenue decoupling mechanism.
Sales and transportation volumes for firm customers decreased 4.9 percent in 2010 compared with 2009.
After adjusting for weather and other variations, total firm sales and transportation volumes decreased 1.2 percent in 2010 compared with 2009. O&R’s New York revenues from gas sales are subject to a weather normalization clause that moderates, but does not eliminate, the effect of weather-related changes on net income.
Gas operating income increased $6 million in 2010 compared with 2009. The increase reflects primarily higher net revenues ($13 million), offset by higher operations and maintenance costs ($5 million) and taxes other than income taxes ($2 million, principally property taxes).
| 61 |
Table of Contents
Taxes Other Than Income Taxes
Taxes, other than income taxes, increased $4 million in 2010 compared with 2009. The principal components of taxes, other than income taxes, were:
| (millions of dollars) | 2010 | 2009 |
Increase/ (Decrease) |
|||||||||
|
Property taxes |
$ | 29 | $ | 28 | $ | 1 | ||||||
|
State and local taxes related to revenue receipts |
14 | 12 | 2 | |||||||||
|
Payroll taxes |
6 | 5 | 1 | |||||||||
|
Total |
$ | 49 | (a) | $ | 45 | (a) | $ | 4 | ||||
| (a) | Including sales tax on customers’ bills, total taxes other than income taxes, billed to customers in 2010 and 2009 were $78 million and $77 million, respectively. |
Income Taxes
Income taxes increased $3 million in 2010 compared with 2009 due primarily to higher taxable income in 2010.
Other Income (Deductions)
Other income (deductions) were the same in 2010 compared with 2009.
Net Interest Expense
Net interest expense increased $7 million in 2010 compared with 2009 due primarily to new debt issuances in 2010 and late in 2009.
Competitive Energy Businesses
The competitive energy business’s results of operations for the year ended December 31, 2010 compared with the year ended December 31, 2009 is as follows:
| Twelve Months Ended | ||||||||||||
| (millions of dollars) |
December 31,
2010 |
December 31,
2009 |
Variation | |||||||||
|
Operating revenues |
$ | 1,883 | $ | 2,147 | $ | (264 | ) | |||||
|
Purchased power |
1,627 | 1,901 | (274 | ) | ||||||||
|
Gas purchased for resale |
9 | 9 | — | |||||||||
|
Net revenues |
247 | 237 | 10 | |||||||||
|
Operations and maintenance |
122 | 125 | (3 | ) | ||||||||
|
Depreciation and amortization |
9 | 5 | 4 | |||||||||
|
Taxes, other than income taxes |
18 | 13 | 5 | |||||||||
|
Operating income |
$ | 98 | $ | 94 | $ | 4 | ||||||
The competitive energy businesses’ operating revenues decreased $264 million in 2010 compared with 2009, due primarily to changes in net mark-to-market effects and lower electric wholesale revenues, offset in part by increased electric retail revenues. Electric wholesale revenues decreased $208 million in 2010 as compared with 2009, due to lower sales volumes ($178 million) and unit prices ($30 million). Electric retail revenues increased $189 million, due to higher sales volume ($271 million), offset by lower per unit prices ($82 million). Gross margins on electric retail revenues increased significantly due primarily to higher volumes. Net mark-to-market values decreased $12 million in 2010 as compared with 2009, of which $232 million in losses are reflected in revenues and $220 million in gains are reflected in purchased power costs. Other revenues decreased $13 million in 2010 as compared with 2009 due primarily to lower sales of energy efficiency services.
Purchased power costs decreased $274 million in 2010 compared with 2009, due primarily to changes in mark-to-market values of $220 million and lower purchased power costs of $54 million. Purchased power costs decreased $54 million due to lower unit prices ($174 million), offset by higher volumes ($120 million). Operating income increased $4 million in 2010 compared with 2009 due primarily to higher electric retail margins.
Other
For Con Edison, “Other” also includes inter-company eliminations relating to operating revenues and operating expenses.
| 62 |
Table of Contents
Year Ended December 31, 2009 Compared with Year Ended December 31, 2008
The Companies’ results of operations (which were discussed above under “Results of Operations – Summary”) in 2009 compared with 2008 were:
| CECONY | O&R |
Competitive Energy
Businesses and Other(a) |
Con Edison(b) | |||||||||||||||||||||||||||||
| (millions of dollars) |
Increases
(Decreases) Amount |
Increases
(Decreases) Percent |
Increases
(Decreases) Amount |
Increases
(Decreases) Percent |
Increases
(Decreases) Amount |
Increases
(Decreases) Percent |
Increases
(Decreases) Amount |
Increases
(Decreases) Percent |
||||||||||||||||||||||||
|
Operating revenues |
$ | (388 | ) | (3.7 | )% | $ | (101 | ) | (10.2 | )% | $ | (62 | ) | (2.9 | )% | $ | (551 | ) | (4.1 | )% | ||||||||||||
|
Purchased power |
(602 | ) | (18.9 | ) | (105 | ) | (24.2 | ) | (266 | ) | (12.5 | ) | (973 | ) | (16.9 | ) | ||||||||||||||||
|
Fuel |
(157 | ) | (23.8 | ) | N/A | N/A | (3 | ) | Large | (160 | ) | (24.1 | ) | |||||||||||||||||||
|
Gas purchased for resale |
(181 | ) | (18.1 | ) | (23 | ) | (14.5 | ) | (5 | ) | (35.7 | ) | (209 | ) | (17.8 | ) | ||||||||||||||||
|
Operating revenues less purchased power, fuel and gas purchased for resale (net revenues) |
552 | 9.9 | 27 | 6.8 | 212 | Large | 791 | 13.2 | ||||||||||||||||||||||||
|
Other operations and maintenance |
249 | 12.9 | 25 | 11.3 | 22 | 22.0 | 296 | 13.1 | ||||||||||||||||||||||||
|
Depreciation and amortization |
72 | 10.7 | 2 | 5.0 | — | — | 74 | 10.3 | ||||||||||||||||||||||||
|
Taxes, other than income taxes |
182 | 14.0 | 1 | 2.3 | (2 | ) | (12.5 | ) | 181 | 13.3 | ||||||||||||||||||||||
|
Gain on sale of ownership interests in electricity generating plants |
N/A | N/A | N/A | N/A | (261 | ) | Large | (261 | ) | Large | ||||||||||||||||||||||
|
Operating income |
49 | 2.9 | (1 | ) | (1.1 | ) | (69 | ) | (43.1 | ) | (21 | ) | (1.1 | ) | ||||||||||||||||||
|
Other income less deductions |
17 | Large | (1 | ) | (33.3 | ) | (66 | ) | Large | (50 | ) | (61.7 | ) | |||||||||||||||||||
|
Net interest expense |
61 | 12.4 | — | — | 6 | 25.0 | 67 | 12.3 | ||||||||||||||||||||||||
|
Income from continuing operations, before taxes |
5 | 0.4 | (2 | ) | (2.9 | ) | (141 | ) | (71.2 | ) | (138 | ) | (9.5 | ) | ||||||||||||||||||
|
Incomes taxes |
7 | 1.8 | 2 | 8.3 | (90 | ) | (87.4 | ) | (84 | ) | (16.0 | ) | ||||||||||||||||||||
|
Income from discontinued operations, net of tax(c) |
N/A | N/A | N/A | N/A | (274 | ) | Large | (274 | ) | Large | ||||||||||||||||||||||
|
Net income for common stock |
$ | (2 | ) | (0.3 | )% | $ | (1 | ) | (2.3 | )% | $ | (325 | ) | (88.1 | )% | $ | (328 | ) | (27.4 | )% | ||||||||||||
| (a) | Includes inter-company and parent company accounting. |
| (b) | Represents the consolidated financial results of Con Edison and its businesses. |
| (c) | See Note U to the financial statements in Item 8. |
CECONY
|
Twelve Months Ended
December 31, 2009 |
Twelve Months Ended
December 31, 2008 |
|||||||||||||||||||||||||||||||||||
| (millions of dollars) | Electric | Gas | Steam |
2009
Total |
Electric | Gas | Steam |
2008
Total |
2009-
2008 Variation |
|||||||||||||||||||||||||||
|
Operating revenues |
$ | 7,674 | $ | 1,701 | $ | 661 | $ | 10,036 | $ | 7,878 | $ | 1,839 | $ | 707 | $ | 10,424 | $ | (388 | ) | |||||||||||||||||
|
Purchased power |
2,529 | — | 54 | 2,583 | 3,092 | — | 93 | 3,185 | (602 | ) | ||||||||||||||||||||||||||
|
Fuel |
247 | — | 256 | 503 | 376 | — | 284 | 660 | (157 | ) | ||||||||||||||||||||||||||
|
Gas purchased for resale |
— | 818 | — | 818 | — | 999 | — | 999 | (181 | ) | ||||||||||||||||||||||||||
|
Net revenues |
4,898 | 883 | 351 | 6,132 | 4,410 | 840 | 330 | 5,580 | 552 | |||||||||||||||||||||||||||
|
Operations and maintenance |
1,734 | 281 | 171 | 2,186 | 1,518 | 261 | 158 | 1,937 | 249 | |||||||||||||||||||||||||||
|
Depreciation and amortization |
587 | 98 | 59 | 744 | 521 | 90 | 61 | 672 | 72 | |||||||||||||||||||||||||||
|
Taxes, other than income taxes |
1,209 | 195 | 82 | 1,486 | 1,038 | 186 | 80 | 1,304 | 182 | |||||||||||||||||||||||||||
|
Operating income |
$ | 1,368 | $ | 309 | $ | 39 | $ | 1,716 | $ | 1,333 | $ | 303 | $ | 31 | $ | 1,667 | $ | 49 | ||||||||||||||||||
| 63 |
Table of Contents
Electric
CECONY’s results of electric operations for the year ended December 31, 2009 compared with the year ended December 31, 2008 is as follows:
| Twelve Months Ended | ||||||||||||
| (millions of dollars) |
December 31,
2009 |
December 31,
2008 |
Variation | |||||||||
|
Operating revenues |
$ | 7,674 | $ | 7,878 | $ | (204 | ) | |||||
|
Purchased power |
2,529 | 3,092 | (563 | ) | ||||||||
|
Fuel |
247 | 376 | (129 | ) | ||||||||
|
Net revenues |
4,898 | 4,410 | 488 | |||||||||
|
Operations and maintenance |
1,734 | 1,518 | 216 | |||||||||
|
Depreciation and amortization |
587 | 521 | 66 | |||||||||
|
Taxes, other than income taxes |
1,209 | 1,038 | 171 | |||||||||
|
Electric operating income |
$ | 1,368 | $ | 1,333 | $ | 35 | ||||||
CECONY’s electric sales and deliveries, excluding off-system sales, in 2009 compared with 2008 were:
| Millions of kWhs Delivered | Revenues in Millions | |||||||||||||||||||||||||||||||
| Twelve Months Ended | Twelve Months Ended | |||||||||||||||||||||||||||||||
| Description |
December 31,
2009 |
December 31,
2008 |
Variation |
Percent
Variation |
December 31,
2009 |
December 31,
2008 |
Variation |
Percent
Variation |
||||||||||||||||||||||||
|
Residential/Religious(a) |
10,952 | 11,720 | (768 | ) | (6.6 | )% | $ | 2,583 | $ | 2,834 | $ | (251 | ) | (8.9 | )% | |||||||||||||||||
|
Commercial/Industrial |
12,457 | 12,852 | (395 | ) | (3.1 | ) | 2,444 | 2,720 | (276 | ) | (10.1 | ) | ||||||||||||||||||||
|
Retail access customers |
21,859 | 22,047 | (188 | ) | (0.9 | ) | 1,855 | 1,507 | 348 | 23.1 | ||||||||||||||||||||||
|
NYPA, Municipal Agency and other sales |
11,399 | 11,704 | (305 | ) | (2.6 | ) | 457 | 413 | 44 | 10.7 | ||||||||||||||||||||||
|
Other operating revenues |
— | — | — | — | 335 | 404 | (69 | ) | (17.1 | ) | ||||||||||||||||||||||
|
Total |
56,667 | 58,323 | (1,656 | ) | (2.8 | )% | $ | 7,674 | $ | 7,878 | $ | (204 | ) | (2.6 | )% | |||||||||||||||||
| (a) | “Residential/Religious” generally includes single-family dwellings, individual apartments in multi-family dwellings, religious organizations and certain other not-for-profit organizations. |
CECONY’s electric operating revenues decreased $204 million in 2009 compared with 2008 due primarily to lower purchased power ($563 million) and fuel costs ($129 million), offset in part by the 2009 electric rate plan ($368 million, which among other things, reflected a 10.0 percent return on common equity, effective April 2009, as compared with the 9.1 percent return previously reflected in rates) and an accrual for the revenue decoupling mechanism ($124 million). Effective April 2008, CECONY’s revenues from electric sales are subject to a revenue decoupling mechanism, as a result of which delivery revenues generally are not affected by changes in delivery volumes from levels assumed when rates were approved. Other electric operating revenues generally reflect changes in regulatory assets and liabilities in accordance with the revenue decoupling mechanism and other provisions of the company’s rate plans. See Note B to the financial statements in Item 8.
Electric delivery volumes in CECONY’s service area decreased 2.8 percent in 2009 compared with 2008. After adjusting for variations, principally weather and billing days, electric delivery volumes in CECONY’s service area decreased 1.7 percent in 2009 compared with 2008, reflecting the impact of lower average normalized use per customer.
CECONY’s electric purchased power costs decreased $563 million in 2009 compared with 2008 due to a decrease in unit costs ($480 million) and purchased volumes ($83 million). Electric fuel costs decreased $129 million in 2009 compared with 2008 due to lower unit costs ($88 million) and sendout volumes from the company’s electric generating facilities ($41 million).
| 64 |
Table of Contents
CECONY’s electric operating income increased $35 million in 2009 compared with 2008. The increase reflects primarily higher net revenues ($488 million, due primarily to the electric rate plan, including the collection of a surcharge for a New York State assessment and the recovery of higher pension expense), offset by higher operations and maintenance costs ($216 million, due primarily to the surcharge for a New York State assessment ($108 million), higher pension expense ($80 million) and higher write-offs of uncollectible accounts ($11 million)), taxes other than income taxes ($171 million, principally property taxes) and depreciation ($66 million).
Gas
CECONY’s results of gas operations for the year ended December 31, 2009 compared with the year ended December 31, 2008 is as follows:
| Twelve Months Ended | ||||||||||||
| (millions of dollars) |
December 31,
2009 |
December 31,
2008 |
Variation | |||||||||
|
Operating revenues |
$ | 1,701 | $ | 1,839 | $ | (138 | ) | |||||
|
Gas purchased for resale |
818 | 999 | (181 | ) | ||||||||
|
Net revenues |
883 | 840 | 43 | |||||||||
|
Operations and maintenance |
281 | 261 | 20 | |||||||||
|
Depreciation and amortization |
98 | 90 | 8 | |||||||||
|
Taxes, other than income taxes |
195 | 186 | 9 | |||||||||
|
Gas operating income |
$ | 309 | $ | 303 | $ | 6 | ||||||
CECONY’s gas sales and deliveries, excluding off-system sales, in 2009 compared with 2008 were:
| Thousands of dths Delivered | Revenues in Millions | |||||||||||||||||||||||||||||||
| Twelve Months Ended | Twelve Months Ended | |||||||||||||||||||||||||||||||
| Description |
December 31,
2009 |
December 31,
2008 |
Variation |
Percent
Variation |
December 31,
2009 |
December 31,
2008 |
Variation |
Percent
Variation |
||||||||||||||||||||||||
|
Residential |
39,749 | 40,195 | (446 | ) | (1.1 | )% | $ | 808 | $ | 850 | $ | (42 | ) | (4.9 | )% | |||||||||||||||||
|
General |
28,245 | 28,748 | (503 | ) | (1.7 | ) | 421 | 482 | (61 | ) | (12.7 | ) | ||||||||||||||||||||
|
Firm transportation |
48,671 | 43,245 | 5,426 | 12.5 | 266 | 202 | 64 | 31.7 | ||||||||||||||||||||||||
|
Total firm sales and transportation |
116,665 | 112,188 | 4,477 | 4.0 | 1,495 | 1,534 | (39 | ) | (2.5 | ) | ||||||||||||||||||||||
|
Interruptible sales |
8,225 | 11,220 | (2,995 | ) | (26.7 | ) | 75 | 138 | (63 | ) | (45.7 | ) | ||||||||||||||||||||
|
NYPA |
37,764 | 44,694 | (6,930 | ) | (15.5 | ) | 4 | 4 | — | — | ||||||||||||||||||||||
|
Generation plants |
68,157 | 74,082 | (5,925 | ) | (8.0 | ) | 34 | 55 | (21 | ) | (38.2 | ) | ||||||||||||||||||||
|
Other |
18,297 | 20,004 | (1,707 | ) | (8.5 | ) | 39 | 30 | 9 | 30.0 | ||||||||||||||||||||||
|
Other operating revenues |
— | — | — | — | 54 | 78 | (24 | ) | (30.8 | ) | ||||||||||||||||||||||
|
Total |
249,108 | 262,188 | (13,080 | ) | (5.0 | )% | $ | 1,701 | $ | 1,839 | $ | (138 | ) | (7.5 | )% | |||||||||||||||||
CECONY’s gas operating revenues decreased $138 million in 2009 compared with 2008 due primarily to a decrease in gas purchased for resale costs ($181 million), offset in part by the 2008 gas rate plan ($59 million). CECONY’s revenues from gas sales are subject to a weather normalization clause and a revenue decoupling mechanism as a result of which delivery revenues are generally not affected by changes in delivery volumes from levels assumed when rates were approved. Other gas operating revenues generally reflect changes in regulatory assets and liabilities in accordance with the company’s rate plans. See Note B to the financial statements in Item 8.
CECONY’s sales and transportation volumes for firm customers increased 4.0 percent in 2009 compared with 2008. After adjusting for variations, principally weather and billing days, firm gas sales and transportation volumes in the company’s service area increased 2.4 percent in 2009, reflecting primarily new business and transfers of interruptible customers to firm service, offset in part by lower average normalized use per customer.
CECONY’s purchased gas cost decreased $181 million in 2009 compared with 2008 due to lower unit costs ($152 million) and sendout volumes ($29 million).
CECONY’s gas operating income increased $6 million in 2009 compared with 2008. The increase reflects primarily higher net revenues ($43 million), offset by higher operations and maintenance expense ($20 million, due primarily to a surcharge for a New York State assessment ($15 million)), taxes other than income taxes ($9 million, principally property taxes) and depreciation ($8 million).
| 65 |
Table of Contents
Steam
CECONY’s results of steam operations for the year ended December 31, 2009 compared with the year ended December 31, 2008 is as follows:
| Twelve Months Ended | ||||||||||||
| (millions of dollars) |
December 31,
2009 |
December 31,
2008 |
Variation | |||||||||
|
Operating revenues |
$ | 661 | $ | 707 | $ | (46 | ) | |||||
|
Purchased power |
54 | 93 | (39 | ) | ||||||||
|
Fuel |
256 | 284 | (28 | ) | ||||||||
|
Net revenues |
351 | 330 | 21 | |||||||||
|
Operations and maintenance |
171 | 158 | 13 | |||||||||
|
Depreciation and amortization |
59 | 61 | (2 | ) | ||||||||
|
Taxes, other than income taxes |
82 | 80 | 2 | |||||||||
|
Steam operating income |
$ | 39 | $ | 31 | $ | 8 | ||||||
CECONY’s steam sales and deliveries in 2009 compared with 2008 were:
| Millions of Pounds Delivered | Revenues in Millions | |||||||||||||||||||||||||||||||
| Twelve Months Ended | Twelve Months Ended | |||||||||||||||||||||||||||||||
| Description |
December 31,
2009 |
December 31,
2008 |
Variation |
Percent
Variation |
December 31,
2009 |
December 31,
2008 |
Variation |
Percent
Variation |
||||||||||||||||||||||||
|
General |
786 | 785 | 1 | 0.1 | % | $ | 28 | $ | 23 | $ | 5 | 21.7 | % | |||||||||||||||||||
|
Apartment house |
5,962 | 6,614 | (652 | ) | (9.9 | ) | 165 | 186 | (21 | ) | (11.3 | ) | ||||||||||||||||||||
|
Annual power |
16,269 | 16,577 | (308 | ) | (1.9 | ) | 446 | 468 | (22 | ) | (4.7 | ) | ||||||||||||||||||||
|
Other operating revenues |
— | — | — | — | 22 | 30 | (8 | ) | (26.7 | ) | ||||||||||||||||||||||
|
Total |
23,017 | 23,976 | (959 | ) | (4.0 | )% | $ | 661 | $ | 707 | $ | (46 | ) | (6.5 | )% | |||||||||||||||||
CECONY’s steam operating revenues decreased $46 million in 2009 compared with 2008 due primarily to lower purchased power ($39 million) and fuel costs ($28 million), offset in part by the net change in rates under the steam rate plan ($27 million). Other steam operating revenues generally reflect changes in regulatory assets and liabilities in accordance with the company’s rate plans. See Note B to the financial statements in Item 8.
Steam sales and delivery volumes decreased 4.0 percent in 2009 compared with 2008. After adjusting for variations, principally weather and billing days, steam sales and deliveries decreased 4.1 percent in 2009, reflecting the impact of lower average normalized use per customer.
CECONY’s steam purchased power costs decreased $39 million in 2009 compared with 2008 due to a decrease in unit costs ($44 million), offset by an increase in purchased volumes ($5 million). Steam fuel costs decreased $28 million in 2009 compared with 2008 due to lower sendout volumes ($18 million) and unit costs ($10 million).
Steam operating income increased $8 million in 2009 compared with 2008. The increase reflects primarily higher net revenues ($21 million) and lower depreciation ($2 million), offset by higher operations and maintenance expense ($13 million, due primarily to a surcharge for a New York State assessment ($5 million) and higher production expense ($6 million)) and taxes other than income taxes ($2 million, principally property taxes).
| 66 |
Table of Contents
Taxes Other Than Income Taxes
At over $1 billion, taxes other than income taxes remain one of CECONY’s largest operating expenses. The principal components of, and variations in, taxes other than income taxes were:
| (millions of dollars) | 2009 | 2008 |
Increase/ (Decrease) |
|||||||||
|
Property taxes |
$ | 1,135 | $ | 955 | $ | 180 | (a) | |||||
|
State and local taxes related to revenue receipts |
282 | 283 | (1 | ) | ||||||||
|
Payroll taxes |
59 | 57 | 2 | |||||||||
|
Other taxes |
10 | 9 | 1 | |||||||||
|
Total |
$ | 1,486 | (b) | $ | 1,304 | (b) | $ | 182 | ||||
| (a) | Property taxes increased $180 million reflecting primarily higher capital investments and New York City property tax rates. |
| (b) | Including sales tax on customers’ bills, total taxes other than income taxes, billed to customers in 2009 and 2008 were $1,866 million and $1,684 million, respectively. |
Income Taxes
Income taxes increased $7 million in 2009 compared with 2008 due primarily to higher taxable income in the 2009 period.
Other Income (Deductions)
Other income (deductions) increased $17 million in 2009 compared with 2008 due primarily to higher income from the Deferred Income Plan returns in 2009. The Deferred Income Plan returns are also reflected in higher operations and maintenance expense.
Net Interest Expense
Net interest expense increased $61 million in 2009 compared with 2008 due primarily to new debt issuances in 2009 and late in 2008, offset in part by lower principal amounts of and rates on commercial paper outstanding in 2009.
O&R
|
Twelve Months Ended
December 31, 2009 |
Twelve Months Ended
December 31, 2008 |
|||||||||||||||||||||||||||
| (millions of dollars) | Electric | Gas |
2009
Total |
Electric | Gas |
2008
Total |
2009-2008
Variation |
|||||||||||||||||||||
|
Operating revenues |
$ | 648 | $ | 242 | $ | 890 | $ | 733 | $ | 258 | $ | 991 | $ | (101 | ) | |||||||||||||
|
Purchased power |
328 | — | 328 | 433 | — | 433 | (105 | ) | ||||||||||||||||||||
|
Gas purchased for resale |
— | 136 | 136 | — | 159 | 159 | (23 | ) | ||||||||||||||||||||
|
Net revenues |
320 | 106 | 426 | 300 | 99 | 399 | 27 | |||||||||||||||||||||
|
Operations and maintenance |
193 | 54 | 247 | 171 | 51 | 222 | 25 | |||||||||||||||||||||
|
Depreciation and amortization |
30 | 12 | 42 | 29 | 11 | 40 | 2 | |||||||||||||||||||||
|
Taxes, other than income taxes |
33 | 12 | 45 | 32 | 12 | 44 | 1 | |||||||||||||||||||||
|
Operating income |
$ | 64 | $ | 28 | $ | 92 | $ | 68 | $ | 25 | $ | 93 | $ | (1 | ) | |||||||||||||
Electric
O&R’s results of electric operations for the year ended December 31, 2009 compared with the year ended December 31, 2008 is as follows:
| Twelve Months Ended | ||||||||||||
| (millions of dollars) |
December 31,
2009 |
December 31,
2008 |
Variation | |||||||||
|
Operating revenues |
$ | 648 | $ | 733 | $ | (85 | ) | |||||
|
Purchased power |
328 | 433 | (105 | ) | ||||||||
|
Net revenues |
320 | 300 | 20 | |||||||||
|
Operations and maintenance |
193 | 171 | 22 | |||||||||
|
Depreciation and amortization |
30 | 29 | 1 | |||||||||
|
Taxes, other than income taxes |
33 | 32 | 1 | |||||||||
|
Electric operating income |
$ | 64 | $ | 68 | $ | (4 | ) | |||||
| 67 |
Table of Contents
O&R’s electric sales and deliveries, excluding off-system sales, in 2009 compared with 2008 were:
| Millions of kWhs Delivered | Revenues in Millions | |||||||||||||||||||||||||||||||
| Twelve Months Ended | Twelve Months Ended | |||||||||||||||||||||||||||||||
| Description |
December 31,
2009 |
December 31,
2008 |
Variation |
Percent
Variation |
December 31,
2009 |
December 31,
2008 |
Variation |
Percent
Variation |
||||||||||||||||||||||||
|
Residential/Religious(a) |
1,799 | 1,892 | (93 | ) | (4.9 | )% | $ | 309 | $ | 330 | $ | (21 | ) | (6.4 | )% | |||||||||||||||||
|
Commercial/Industrial |
1,763 | 2,082 | (319 | ) | (15.3 | ) | 231 | 303 | (72 | ) | (23.8 | ) | ||||||||||||||||||||
|
Retail access customers |
1,901 | 1,814 | 87 | 4.8 | 95 | 80 | 15 | 18.8 | ||||||||||||||||||||||||
|
Public authorities |
111 | 119 | (8 | ) | (6.7 | ) | 11 | 17 | (6 | ) | (35.3 | ) | ||||||||||||||||||||
|
Other operating revenues |
— | — | — | — | 2 | 3 | (1 | ) | (33.3 | ) | ||||||||||||||||||||||
|
Total |
5,574 | 5,907 | (333 | ) | (5.6 | )% | $ | 648 | $ | 733 | $ | (85 | ) | (11.6 | )% | |||||||||||||||||
| (a) | “Residential/Religious” generally includes single-family dwellings, individual apartments in multi-family dwellings, religious organizations and certain other not-for-profit organizations. |
O&R’s electric operating revenues decreased $85 million in 2009 compared with 2008 due primarily to decreased recoverable purchased power costs ($105 million). Effective July 2008, O&R’s New York electric delivery revenues are subject to a revenue decoupling mechanism, as a result of which, delivery revenues are generally not affected by changes in delivery volumes from levels assumed when rates were approved. O&R’s electric sales in New Jersey and Pennsylvania are not part of a decoupling mechanism, and as a result, they do impact revenues. Other electric operating revenues generally reflect changes in regulatory assets and liabilities in accordance with the company’s electric rate plan. See Note B to the financial statements in Item 8.
Electric delivery volumes in O&R’s service area decreased 5.6 percent in 2009 compared with 2008. After adjusting for weather variations and unbilled volumes, electric delivery volumes in O&R’s service area decreased 3.9 percent in 2009 compared with 2008, reflecting the impact of lower average normalized use per customer.
Electric operating income decreased $4 million in 2009 compared with 2008. The decrease reflects primarily higher operations and maintenance expense ($22 million), due primarily to higher demand management program expenses ($7 million), a surcharge for a New York State assessment ($5 million) and higher pension expense ($4 million)), taxes other than income taxes ($1 million, principally property taxes) and depreciation ($1 million), offset by higher net revenues ($20 million).
Gas
O&R’s results of gas operations for the year ended December 31, 2009 compared with the year ended December 31, 2008 is as follows:
| Twelve Months Ended | ||||||||||||
| (millions of dollars) |
December 31,
2009 |
December 31,
2008 |
Variation | |||||||||
|
Operating revenues |
$ | 242 | $ | 258 | $ | (16 | ) | |||||
|
Gas purchased for resale |
136 | 159 | (23 | ) | ||||||||
|
Net revenues |
106 | 99 | 7 | |||||||||
|
Operations and maintenance |
54 | 51 | 3 | |||||||||
|
Depreciation and amortization |
12 | 11 | 1 | |||||||||
|
Taxes, other than income taxes |
12 | 12 | — | |||||||||
|
Gas operating income |
$ | 28 | $ | 25 | $ | 3 | ||||||
| 68 |
Table of Contents
O&R’s gas sales and deliveries, excluding off-system sales, in 2009 compared with 2008 were:
| Thousands of dths Delivered | Revenues in Millions | |||||||||||||||||||||||||||||||
| Twelve Months Ended | Twelve Months Ended | |||||||||||||||||||||||||||||||
| Description |
December 31,
2009 |
December 31,
2008 |
Variation |
Percent
Variation |
December 31,
2009 |
December 31,
2008 |
Variation |
Percent
Variation |
||||||||||||||||||||||||
|
Residential |
7,811 | 8,068 | (257 | ) | (3.2 | )% | $ | 132 | $ | 142 | $ | (10 | ) | (7.0 | )% | |||||||||||||||||
|
General |
1,750 | 1,816 | (66 | ) | (3.6 | ) | 27 | 30 | (3 | ) | (10.0 | ) | ||||||||||||||||||||
|
Firm transportation |
10,905 | 10,471 | 434 | 4.1 | 51 | 45 | 6 | 13.3 | ||||||||||||||||||||||||
|
Total firm sales and transportation |
20,466 | 20,355 | 111 | 0.5 | 210 | 217 | (7 | ) | (3.2 | ) | ||||||||||||||||||||||
|
Interruptible sales |
4,502 | 5,409 | (907 | ) | (16.8 | ) | 21 | 27 | (6 | ) | (22.2 | ) | ||||||||||||||||||||
|
Generation plants |
1,346 | 2,327 | (981 | ) | (42.2 | ) | 2 | 4 | (2 | ) | (50.0 | ) | ||||||||||||||||||||
|
Other |
953 | 1,007 | (54 | ) | (5.4 | ) | — | — | — | — | ||||||||||||||||||||||
|
Other gas revenues |
— | — | — | — | 9 | 10 | (1 | ) | (10.0 | ) | ||||||||||||||||||||||
|
Total |
27,267 | 29,098 | (1,831 | ) | (6.3 | )% | $ | 242 | $ | 258 | $ | (16 | ) | (6.2 | )% | |||||||||||||||||
O&R’s gas operating revenues decreased $16 million in 2009 compared with 2008 due primarily to the decrease in gas purchased for resale in 2009 ($23 million). Effective November 2009, O&R’s New York gas delivery revenues became subject to a revenue decoupling mechanism.
Sales and transportation volumes for firm customers increased 0.5 percent in 2009 compared with 2008. After adjusting for weather and other variations, total firm sales and transportation volumes increased 0.2 percent in 2009 compared with 2008. O&R’s New York revenues from gas sales are subject to a weather normalization clause that moderates, but does not eliminate, the effect of weather-related changes on net income.
Gas operating income increased $3 million in 2009 compared with 2008. The increase reflects primarily higher net revenues ($7 million), offset by higher operations and maintenance costs ($3 million) and depreciation ($1 million).
Taxes Other Than Income Taxes
Taxes, other than income taxes, increased $1 million in 2009 compared with 2008. The principal components of taxes, other than income taxes, were:
| (millions of dollars) | 2009 | 2008 |
Increase/ (Decrease) |
|||||||||
|
Property taxes |
$ | 28 | $ | 27 | $ | 1 | ||||||
|
State and local taxes related to revenue receipts |
12 | 12 | — | |||||||||
|
Payroll taxes |
5 | 5 | — | |||||||||
|
Total |
$ | 45 | (a) | $ | 44 | (a) | $ | 1 | ||||
| (a) | Including sales tax on customers’ bills, total taxes other than income taxes, billed to customers in 2009 and 2008 were $77 million and $78 million, respectively. |
Income Taxes
Income taxes increased $2 million in 2009 compared with 2008.
Other Income (Deductions)
Other income (deductions) decreased $1 million in 2009 compared with 2008 due primarily to lower interest income in 2009.
Net Interest Expense
Net interest expense was the same in 2009 compared with 2008.
Competitive Energy Businesses
The competitive energy businesses’ earnings from continuing operations decreased $14 million in 2009 compared with 2008 due primarily to the after-tax gain on the sale of Con Edison Development’s ownership interests in electricity generating plants in 2008 ($131 million), offset in part by after-tax mark-to-market gains in 2009 versus mark-to-market losses in 2008 ($78 million) and higher retail electricity margins in 2009.
Operating revenues decreased $48 million in 2009 compared with 2008, due primarily to lower electric wholesale and retail revenues and the sale of Con Edison Development’s ownership interests in electricity generating plants in 2008. Electric wholesale revenues decreased $312 million in 2009 as compared with 2008, due to lower sales volumes ($261 million) and unit prices ($51 million). Electric retail revenues decreased $26 million, due to lower per unit prices ($187 million), offset by higher sales volume ($161 million). Electric retail revenues decreased 2 percent in
| 69 |
Table of Contents
2009 as compared with 2008, due to lower electricity prices, while gross margins increased significantly due primarily to the sale of higher margin contracts, lower costs and higher volumes. Net mark-to-market gains increased $131 million in 2009 as compared with 2008 due primarily to higher prices on electric and natural gas contracts, of which $296 million in gains are reflected in revenues and $165 million in losses are reflected in purchased power costs. The competitive energy businesses no longer have revenues from the sale of electricity from owned generation projects due to the sale of ownership interests in electricity generating plants in the second quarter of 2008. These revenues were $21 million in 2008 (see Note U to the financial statements in Item 8). Other revenues increased $15 million in 2009 as compared with 2008 due primarily to higher sales of energy efficiency services.
Operating expenses excluding income taxes decreased $241 million in 2009 compared with 2008, due primarily to decreased purchased power ($253 million), net of a $165 million increase in purchased power costs for mark-to-market losses, gas purchased for resale ($5 million) and fuel costs ($3 million) and taxes other than income taxes ($3 million), offset in part by higher operations and maintenance costs ($23 million).
Income taxes decreased $62 million in 2009 as compared with 2008, due primarily to income taxes related to the sale of Con Edison Development’s ownership interests in electricity generating plants in 2008 ($130 million), offset in part by higher income due to mark-to-market gains and higher earnings from electric retail sales.
Discontinued Operations
Net income from discontinued operations was $274 million lower in 2009 compared with 2008, reflecting the 2008 sale of Con Edison Development’s ownership interests in electricity generating plants. See Note U to the financial statements in Item 8.
Other
For Con Edison, “Other” also includes the receipt of $30 million after-tax for a litigation settlement with Northeast Utilities in 2008 and inter-company eliminations relating to operating revenues and operating expenses.
| 70 |
Table of Contents
Con Edison
For information about Con Edison’s primary market risks associated with activities in derivative financial instruments, other financial instruments and derivative commodity instruments, see “Financial and Commodity Market Risks,” in Item 7 (which information is incorporated herein by reference).
CECONY
For information about CECONY’s primary market risks associated with activities in derivative financial instruments, other financial instruments and derivative commodity instruments, see “Financial and Commodity Market Risks,” in Item 7 (which information is incorporated herein by reference).
| 71 |
Table of Contents
| Financial Statements | Page | |||
| Con Edison | ||||
|
Report of Management on Internal Control Over Financial Reporting |
74 | |||
|
Report of Independent Registered Public Accounting Firm |
75 | |||
|
Consolidated Income Statement for the years ended December 31, 2010, 2009 and 2008 |
76 | |||
|
Consolidated Statement of Cash Flows for the years ended December 31, 2010, 2009 and 2008 |
77 | |||
|
Consolidated Balance Sheet at December 31, 2010 and 2009 |
78 | |||
|
Consolidated Statement of Comprehensive Income for the years ended December 31, 2010, 2009 and 2008 |
80 | |||
|
Consolidated Statement of Common Shareholders’ Equity for the years ended December 31, 2010, 2009, and 2008 |
81 | |||
|
Consolidated Statement of Capitalization at December 31, 2010 and 2009 |
82 | |||
| CECONY | ||||
|
Report of Management on Internal Control Over Financial Reporting |
85 | |||
|
Report of Independent Registered Public Accounting Firm |
86 | |||
|
Consolidated Income Statement for the years ended December 31, 2010, 2009 and 2008 |
87 | |||
|
Consolidated Statement of Cash Flows for the years ended December 31, 2010, 2009 and 2008 |
88 | |||
|
Consolidated Balance Sheet at December 31, 2010 and 2009 |
89 | |||
|
Consolidated Statement of Comprehensive Income for the years ended December 31, 2010, 2009 and 2008 |
91 | |||
|
Consolidated Statement of Common Shareholder’s Equity for the years ended December 31, 2010, 2009 and 2008 |
92 | |||
|
Consolidated Statement of Capitalization at December 31, 2010 and 2009 |
93 | |||
| Notes to the Financial Statements | 95 | |||
| Financial Statement Schedules | ||||
|
Con Edison |
||||
|
Schedule I – Condensed Financial Information |
150 | |||
|
Schedule II – Valuation and Qualifying Accounts |
153 | |||
|
CECONY |
||||
|
Schedule II – Valuation and Qualifying Accounts |
153 | |||
All other schedules are omitted because they are not applicable or the required information is shown in financial statements or notes thereto.
| 72 |
Table of Contents
Supplementary Financial Information
Selected Quarterly Financial Data for the years ended December 31, 2010 and 2009 (Unaudited)
| 2010 | ||||||||||||||||
| Con Edison |
First Quarter |
Second
Quarter |
Third Quarter |
Fourth
Quarter |
||||||||||||
| (millions of dollars, except per share amounts) | ||||||||||||||||
|
Operating revenues |
$ | 3,462 | $ | 3,017 | $ | 3,707 | $ | 3,139 | ||||||||
|
Operating income |
492 | 429 | 705 | 494 | ||||||||||||
|
Net income |
229 | 186 | 353 | 235 | ||||||||||||
|
Net income for common stock |
226 | 183 | 350 | 233 | ||||||||||||
|
Basic earnings per common share |
$ | 0.80 | $ | 0.65 | $ | 1.24 | $ | 0.80 | ||||||||
|
Diluted earnings per common share |
$ | 0.80 | $ | 0.64 | $ | 1.23 | $ | 0.80 | ||||||||
| 2009 | ||||||||||||||||
| Con Edison |
First Quarter |
Second
Quarter |
Third Quarter |
Fourth
Quarter |
||||||||||||
| (millions of dollars, except per share amounts) | ||||||||||||||||
|
Operating revenues |
$ | 3,423 | $ | 2,845 | $ | 3,489 | $ | 3,273 | ||||||||
|
Operating income |
419 | 372 | 685 | 423 | ||||||||||||
|
Net income |
183 | 153 | 339 | 205 | ||||||||||||
|
Net income for common stock |
180 | 150 | 336 | 202 | ||||||||||||
|
Basic earnings per common share |
$ | 0.66 | $ | 0.55 | $ | 1.22 | $ | 0.73 | ||||||||
|
Diluted earnings per common share |
$ | 0.66 | $ | 0.55 | $ | 1.22 | $ | 0.73 | ||||||||
In the opinion of Con Edison, these quarterly amounts include all adjustments, consisting only of normal recurring accruals, necessary for a fair presentation.
| 2010 | ||||||||||||||||
| CECONY |
First
Quarter |
Second
Quarter |
Third
Quarter |
Fourth
Quarter |
||||||||||||
| (millions of dollars) | ||||||||||||||||
|
Operating revenues |
$ | 2,718 | $ | 2,432 | $ | 2,865 | $ | 2,558 | ||||||||
|
Operating income |
512 | 334 | 666 | 410 | ||||||||||||
|
Net income for common stock |
243 | 135 | 332 | 183 | ||||||||||||
| 2009 | ||||||||||||||||
| CECONY |
First
Quarter |
Second
Quarter |
Third
Quarter |
Fourth
Quarter |
||||||||||||
| (millions of dollars) | ||||||||||||||||
|
Operating revenues |
$ | 2,770 | $ | 2,220 | $ | 2,655 | $ | 2,391 | ||||||||
|
Operating income |
434 | 340 | 579 | 363 | ||||||||||||
|
Net income for common stock |
197 | 136 | 282 | 166 | ||||||||||||
In the opinion of CECONY, these quarterly amounts include all adjustments, consisting only of normal recurring accruals, necessary for a fair presentation.
Table of Contents
|
Report of Management on Internal Control Over Financial Reporting |
Management of Consolidated Edison, Inc. and its subsidiaries (the Company) is responsible for establishing and maintaining adequate internal control over financial reporting. Internal control over financial reporting is a process designed to provide reasonable, but not absolute, assurance regarding the reliability of financial reporting and the preparation of financial statements for external purposes in accordance with accounting principles generally accepted in the United States of America.
Because of its inherent limitations, internal control over financial reporting may not prevent or detect misstatements. Also, projections of the effectiveness of controls to future periods are subject to the risk that controls may become inadequate because of changes in conditions, or that the degree of compliance with policies or procedures may deteriorate.
Management of the Company assessed the effectiveness of internal control over financial reporting as of December 31, 2010, using the criteria established by the Committee of Sponsoring Organizations of the Treadway Commission (COSO) in Internal Control – Integrated Framework . Based on that assessment, management has concluded that the Company had effective internal control over financial reporting as of December 31, 2010.
The effectiveness of the Company’s internal control over financial reporting as of December 31, 2010, has been audited by PricewaterhouseCoopers LLP, Con Edison’s independent registered public accounting firm, as stated in their report which appears on the following page of this Annual Report on Form 10-K.
Kevin Burke
Chairman, President and Chief Executive Officer
Robert Hoglund
Senior Vice President and Chief Financial Officer
February 22, 2011
| 74 |
Table of Contents
|
Report of Independent Registered Public Accounting Firm |
To the Stockholders and Board of Directors of Consolidated Edison, Inc.:
In our opinion, the consolidated financial statements listed in the accompanying index present fairly, in all material respects, the financial position of Consolidated Edison, Inc. and its subsidiaries (the Company) at December 31, 2010 and 2009, and the results of their operations and their cash flows for each of the three years in the period ended December 31, 2010 in conformity with accounting principles generally accepted in the United States of America. In addition, in our opinion, the financial statement schedules listed in the accompanying index present fairly, in all material respects, the information set forth therein when read in conjunction with the related consolidated financial statements. Also in our opinion, the Company maintained, in all material respects, effective internal control over financial reporting as of December 31, 2010, based on criteria established in Internal Control – Integrated Framework issued by the Committee of Sponsoring Organizations of the Treadway Commission (COSO). The Company’s management is responsible for these financial statements and financial statement schedules, for maintaining effective internal control over financial reporting and for its assessment of the effectiveness of internal control over financial reporting, included in the accompanying Report of Management on Internal Control Over Financial Reporting. Our responsibility is to express opinions on these financial statements, on the financial statement schedules, and on the Company’s internal control over financial reporting based on our integrated audits. We conducted our audits in accordance with the standards of the Public Company Accounting Oversight Board (United States). Those standards require that we plan and perform the audits to obtain reasonable assurance about whether the financial statements are free of material misstatement and whether effective internal control over financial reporting was maintained in all material respects. Our audits of the financial statements included examining, on a test basis, evidence supporting the amounts and disclosures in the financial statements, assessing the accounting principles used and significant estimates made by management, and evaluating the overall financial statement presentation. Our audit of internal control over financial reporting included obtaining an understanding of internal control over financial reporting, assessing the risk that a material weakness exists, and testing and evaluating the design and operating effectiveness of internal control based on the assessed risk. Our audits also included performing such other procedures as we considered necessary in the circumstances. We believe that our audits provide a reasonable basis for our opinions.
A company’s internal control over financial reporting is a process designed to provide reasonable assurance regarding the reliability of financial reporting and the preparation of financial statements for external purposes in accordance with generally accepted accounting principles. A company’s internal control over financial reporting includes those policies and procedures that (i) pertain to the maintenance of records that, in reasonable detail, accurately and fairly reflect the transactions and dispositions of the assets of the company; (ii) provide reasonable assurance that transactions are recorded as necessary to permit preparation of financial statements in accordance with generally accepted accounting principles, and that receipts and expenditures of the company are being made only in accordance with authorizations of management and directors of the company; and (iii) provide reasonable assurance regarding prevention or timely detection of unauthorized acquisition, use, or disposition of the company’s assets that could have a material effect on the financial statements.
Because of its inherent limitations, internal control over financial reporting may not prevent or detect misstatements. Also, projections of any evaluation of effectiveness to future periods are subject to the risk that controls may become inadequate because of changes in conditions, or that the degree of compliance with the policies or procedures may deteriorate.
PricewaterhouseCoopers LLP
New York, New York
February 22, 2011
| 75 |
Table of Contents
|
Consolidated Edison, Inc.
|
| For the Years Ended December 31, | ||||||||||||
| 2010 | 2009 | 2008 | ||||||||||
| (Millions of Dollars/Except Share Data) | ||||||||||||
|
OPERATING REVENUES |
||||||||||||
|
Electric |
$ | 9,064 | $ | 8,320 | $ | 8,611 | ||||||
|
Gas |
1,760 | 1,943 | 2,097 | |||||||||
|
Steam |
656 | 661 | 707 | |||||||||
|
Non-utility |
1,845 | 2,108 | 2,168 | |||||||||
|
TOTAL OPERATING REVENUES |
13,325 | 13,032 | 13,583 | |||||||||
|
OPERATING EXPENSES |
||||||||||||
|
Purchased power |
4,613 | 4,776 | 5,749 | |||||||||
|
Fuel |
458 | 503 | 663 | |||||||||
|
Gas purchased for resale |
661 | 963 | 1,172 | |||||||||
|
Other operations and maintenance |
2,910 | 2,555 | 2,259 | |||||||||
|
Depreciation and amortization |
840 | 791 | 717 | |||||||||
|
Taxes, other than income taxes |
1,723 | 1,545 | 1,364 | |||||||||
|
TOTAL OPERATING EXPENSES |
11,205 | 11,133 | 11,924 | |||||||||
|
Gain on sale of electricity generating plants |
— | — | 261 | |||||||||
|
OPERATING INCOME |
2,120 | 1,899 | 1,920 | |||||||||
|
OTHER INCOME (DEDUCTIONS) |
||||||||||||
|
Investment and other income |
46 | 32 | 89 | |||||||||
|
Allowance for equity funds used during construction |
15 | 14 | 8 | |||||||||
|
Other deductions |
(21 | ) | (15 | ) | (16 | ) | ||||||
|
TOTAL OTHER INCOME (DEDUCTIONS) |
40 | 31 | 81 | |||||||||
|
INCOME BEFORE INTEREST AND INCOME TAX EXPENSE |
2,160 | 1,930 | 2,001 | |||||||||
|
INTEREST EXPENSE |
||||||||||||
|
Interest on long-term debt |
597 | 590 | 519 | |||||||||
|
Other interest |
21 | 30 | 33 | |||||||||
|
Allowance for borrowed funds used during construction |
(9 | ) | (9 | ) | (8 | ) | ||||||
|
NET INTEREST EXPENSE |
609 | 611 | 544 | |||||||||
|
INCOME FROM CONTINUING OPERATIONS BEFORE TAXES |
1,551 | 1,319 | 1,457 | |||||||||
|
INCOME TAX EXPENSE |
548 | 440 | 524 | |||||||||
|
INCOME FROM CONTINUING OPERATIONS |
1,003 | 879 | 933 | |||||||||
|
INCOME FROM DISCONTINUED OPERATIONS |
||||||||||||
|
Gain on sale of electricity generating plants, net of tax expense of $174 in 2008 |
— | — | 270 | |||||||||
|
Income from discontinued operations, net of tax expense of $3 in 2008 |
— | — | 4 | |||||||||
|
TOTAL INCOME FROM DISCONTINUED OPERATIONS |
— | — | 274 | |||||||||
|
NET INCOME |
1,003 | 879 | 1,207 | |||||||||
|
Preferred stock dividend requirements of subsidiary |
(11 | ) | (11 | ) | (11 | ) | ||||||
|
NET INCOME FOR COMMON STOCK |
$ | 992 | $ | 868 | $ | 1,196 | ||||||
|
EARNINGS PER COMMON SHARE – BASIC |
||||||||||||
|
Continuing operations |
$ | 3.49 | $ | 3.16 | $ | 3.37 | ||||||
|
Discontinued operations |
— | — | 1.01 | |||||||||
|
Net income |
$ | 3.49 | $ | 3.16 | $ | 4.38 | ||||||
|
EARNINGS PER COMMON SHARE – DILUTED |
||||||||||||
|
Continuing operations |
$ | 3.47 | $ | 3.14 | $ | 3.36 | ||||||
|
Discontinued operations |
— | — | 1.01 | |||||||||
|
Net income |
$ | 3.47 | $ | 3.14 | $ | 4.37 | ||||||
|
DIVIDENDS DECLARED PER SHARE OF COMMON STOCK |
$ | 2.38 | $ | 2.36 | $ | 2.34 | ||||||
|
AVERAGE NUMBER OF SHARES OUTSTANDING – BASIC (IN MILLIONS) |
284.3 | 275.2 | 272.9 | |||||||||
|
AVERAGE NUMBER OF SHARES OUTSTANDING – DILUTED (IN MILLIONS) |
285.9 | 276.3 | 273.6 | |||||||||
The accompanying notes are an integral part of these financial statements.
| 76 |
Table of Contents
|
Consolidated Edison, Inc.
|
| For the Twelve Months Ended December 31, | ||||||||||||
| 2010 | 2009 | 2008 | ||||||||||
| (Millions of Dollars) | ||||||||||||
|
OPERATING ACTIVITIES |
||||||||||||
|
Net Income |
$ | 1,003 | $ | 879 | $ | 1,207 | ||||||
|
PRINCIPAL NON-CASH CHARGES/(CREDITS) TO INCOME |
||||||||||||
|
Depreciation and amortization |
840 | 791 | 717 | |||||||||
|
Deferred income taxes |
659 | 436 | 470 | |||||||||
|
Rate case amortization and accruals |
13 | (63 | ) | (176 | ) | |||||||
|
Net transmission and distribution reconciliation |
— | — | (50 | ) | ||||||||
|
Common equity component of allowance for funds used during construction |
(15 | ) | (14 | ) | (8 | ) | ||||||
|
Net derivative (gains)/losses |
(19 | ) | (31 | ) | 100 | |||||||
|
Pre-tax gain on sale of electricity generating plants |
— | — | (704 | ) | ||||||||
|
Other non-cash items (net) |
(18 | ) | (77 | ) | (83 | ) | ||||||
|
CHANGES IN ASSETS AND LIABILITIES |
||||||||||||
|
Accounts receivable – customers, less allowance for uncollectibles |
(126 | ) | 51 | 18 | ||||||||
|
Materials and supplies, including fuel oil and gas in storage |
7 | 161 | (111 | ) | ||||||||
|
Other receivables and other current assets |
207 | (346 | ) | (110 | ) | |||||||
|
Prepayments |
(210 | ) | 566 | (578 | ) | |||||||
|
Recoverable energy costs |
— | 90 | 124 | |||||||||
|
Accounts payable |
(22 | ) | (18 | ) | (92 | ) | ||||||
|
Pensions and retiree benefits |
78 | (14 | ) | 18 | ||||||||
|
Accrued taxes |
38 | (6 | ) | 31 | ||||||||
|
Accrued interest |
(1 | ) | 17 | (10 | ) | |||||||
|
Deferred charges, noncurrent assets and other regulatory assets |
(590 | ) | 112 | (443 | ) | |||||||
|
Deferred credits and other regulatory liabilities |
80 | (23 | ) | 303 | ||||||||
|
Other assets |
(9 | ) | (5 | ) | 121 | |||||||
|
Other liabilities |
466 | (40 | ) | (104 | ) | |||||||
|
NET CASH FLOWS FROM OPERATING ACTIVITIES |
2,381 | 2,466 | 640 | |||||||||
|
INVESTING ACTIVITIES |
||||||||||||
|
Utility construction expenditures |
(2,001 | ) | (2,184 | ) | (2,322 | ) | ||||||
|
Cost of removal less salvage |
(149 | ) | (181 | ) | (198 | ) | ||||||
|
Non-utility construction expenditures |
(28 | ) | (9 | ) | (4 | ) | ||||||
|
Common equity component of allowance for funds used during construction |
15 | 14 | 8 | |||||||||
|
Proceeds from sale of electricity generation projects |
— | — | 1,477 | |||||||||
|
Purchase of additional ownership interest in Honeoye Storage Corporation |
(12 | ) | — | — | ||||||||
|
Purchase of ownership interest in Hawkeye lease |
— | — | (12 | ) | ||||||||
|
Purchase of ownership interest in Newington SCS |
— | — | (20 | ) | ||||||||
|
NET CASH FLOWS USED IN INVESTING ACTIVITIES |
(2,175 | ) | (2,360 | ) | (1,071 | ) | ||||||
|
FINANCING ACTIVITIES |
||||||||||||
|
Net payments of short-term debt |
— | (363 | ) | (477 | ) | |||||||
|
Retirement of long-term debt |
(1,011 | ) | (662 | ) | (487 | ) | ||||||
|
Issuance of long-term debt |
1,095 | 1,470 | 1,850 | |||||||||
|
Issuance of common stock |
439 | 257 | 51 | |||||||||
|
Debt issuance costs |
(11 | ) | (10 | ) | (13 | ) | ||||||
|
Common stock dividends |
(629 | ) | (601 | ) | (618 | ) | ||||||
|
Preferred stock dividends |
(11 | ) | (11 | ) | (11 | ) | ||||||
|
NET CASH FLOWS (USED IN)/FROM FINANCING ACTIVITIES |
(128 | ) | 80 | 295 | ||||||||
|
CASH AND TEMPORARY CASH INVESTMENTS: |
||||||||||||
|
NET CHANGE FOR THE PERIOD |
78 | 186 | (136 | ) | ||||||||
|
BALANCE AT BEGINNING OF PERIOD |
260 | 74 | 210 | |||||||||
|
BALANCE AT END OF PERIOD |
$ | 338 | $ | 260 | $ | 74 | ||||||
|
SUPPLEMENTAL DISCLOSURE OF CASH FLOW INFORMATION |
||||||||||||
|
Cash paid/(refunded) during the period for: |
||||||||||||
|
Interest |
$ | 583 | $ | 558 | $ | 557 | ||||||
|
Income taxes |
$ | (25 | ) | $ | 5 | $ | 394 | |||||
The accompanying notes are an integral part of these financial statements.
| 77 |
Table of Contents
|
Consolidated Edison, Inc.
|
|
December 31,
2010 |
December 31,
2009 |
|||||||
| (Millions of Dollars) | ||||||||
|
ASSETS |
||||||||
|
CURRENT ASSETS |
||||||||
|
Cash and temporary cash investments |
$ | 338 | $ | 260 | ||||
|
Accounts receivable – customers, less allowance for uncollectible accounts of $76 and $70 in 2010 and 2009, respectively |
1,173 | 1,047 | ||||||
|
Accrued unbilled revenue |
633 | 579 | ||||||
|
Other receivables, less allowance for uncollectible accounts of $8 and $5 in 2010 and 2009, respectively |
300 | 379 | ||||||
|
Fuel oil, gas in storage, materials and supplies, at average cost |
348 | 355 | ||||||
|
Prepayments |
341 | 131 | ||||||
|
Regulatory assets |
203 | 172 | ||||||
|
Revenue decoupling mechanism receivable |
5 | 117 | ||||||
|
Other current assets |
166 | 174 | ||||||
|
TOTAL CURRENT ASSETS |
3,507 | 3,214 | ||||||
|
INVESTMENTS |
403 | 385 | ||||||
|
UTILITY PLANT, AT ORIGINAL COST |
||||||||
|
Electric |
19,851 | 18,645 | ||||||
|
Gas |
4,344 | 3,983 | ||||||
|
Steam |
2,038 | 1,935 | ||||||
|
General |
1,911 | 1,866 | ||||||
|
TOTAL |
28,144 | 26,429 | ||||||
|
Less: Accumulated depreciation |
5,808 | 5,412 | ||||||
|
Net |
22,336 | 21,017 | ||||||
|
Construction work in progress |
1,458 | 1,422 | ||||||
|
NET UTILITY PLANT |
23,794 | 22,439 | ||||||
|
NON-UTILITY PLANT |
||||||||
|
Non-utility property, less accumulated depreciation of $51 and $45 in 2010 and 2009, respectively |
46 | 19 | ||||||
|
Construction work in progress |
23 | 6 | ||||||
|
NET PLANT |
23,863 | 22,464 | ||||||
|
OTHER NONCURRENT ASSETS |
||||||||
|
Goodwill |
429 | 416 | ||||||
|
Intangible assets, less accumulated amortization of $3 and $2 in 2010 and 2009, respectively |
3 | 4 | ||||||
|
Regulatory assets |
7,643 | 7,103 | ||||||
|
Other deferred charges and noncurrent assets |
298 | 258 | ||||||
|
TOTAL OTHER NONCURRENT ASSETS |
8,373 | 7,781 | ||||||
|
TOTAL ASSETS |
$ | 36,146 | $ | 33,844 | ||||
The accompanying notes are an integral part of these financial statements.
| 78 |
Table of Contents
|
Consolidated Edison, Inc. CONSOLIDATED BALANCE SHEET |
|
December 31,
2010 |
December 31,
2009 |
|||||||
| (Millions of Dollars) | ||||||||
|
LIABILITIES AND SHAREHOLDERS’ EQUITY |
||||||||
|
CURRENT LIABILITIES |
||||||||
|
Long-term debt due within one year |
$ | 5 | $ | 731 | ||||
|
Accounts payable |
1,151 | 1,173 | ||||||
|
Customer deposits |
289 | 274 | ||||||
|
Accrued taxes |
90 | 51 | ||||||
|
Accrued interest |
155 | 156 | ||||||
|
Accrued wages |
102 | 91 | ||||||
|
Fair value of derivative liabilities |
125 | 114 | ||||||
|
Other current liabilities |
449 | 350 | ||||||
|
TOTAL CURRENT LIABILITIES |
2,366 | 2,940 | ||||||
|
NONCURRENT LIABILITIES |
||||||||
|
Obligations under capital leases |
7 | 14 | ||||||
|
Provision for injuries and damages |
165 | 168 | ||||||
|
Pensions and retiree benefits |
3,287 | 3,363 | ||||||
|
Superfund and other environmental costs |
512 | 212 | ||||||
|
Asset retirement obligations |
109 | 122 | ||||||
|
Fair value of derivative liabilities |
77 | 131 | ||||||
|
Other noncurrent liabilities |
126 | 108 | ||||||
|
TOTAL NONCURRENT LIABILITIES |
4,283 | 4,118 | ||||||
|
DEFERRED CREDITS AND REGULATORY LIABILITIES |
||||||||
|
Deferred income taxes and investment tax credits |
6,602 | 5,609 | ||||||
|
Regulatory liabilities |
915 | 829 | ||||||
|
Other deferred credits |
35 | 32 | ||||||
|
TOTAL DEFERRED CREDITS AND REGULATORY LIABILITIES |
7,552 | 6,470 | ||||||
|
LONG-TERM DEBT (See Statement of Capitalization) |
10,671 | 9,854 | ||||||
|
SHAREHOLDERS’ EQUITY |
||||||||
|
Common shareholders’ equity (See Statement of Common Shareholders’ Equity) |
11,061 | 10,249 | ||||||
|
Preferred stock of subsidiary (See Statement of Capitalization) |
213 | 213 | ||||||
|
TOTAL SHAREHOLDERS’ EQUITY |
11,274 | 10,462 | ||||||
|
TOTAL LIABILITIES AND SHAREHOLDERS’ EQUITY |
$ | 36,146 | $ | 33,844 | ||||
The accompanying notes are an integral part of these financial statements.
| 79 |
Table of Contents
|
Consolidated Edison, Inc. CONSOLIDATED STATEMENT OF COMPREHENSIVE INCOME |
| For the Years Ended December 31, | ||||||||||||
| 2010 | 2009 | 2008 | ||||||||||
| (Millions of Dollars) | ||||||||||||
|
NET INCOME |
$ | 1,003 | $ | 879 | $ | 1,207 | ||||||
|
OTHER COMPREHENSIVE INCOME/(LOSS), NET OF TAXES |
||||||||||||
|
Pension plan liability adjustments, net of $5, $17 and $(21) taxes in 2010, 2009 and 2008, respectively |
2 | 26 | (31 | ) | ||||||||
|
Unrealized gains/(losses) on derivatives qualified as cash flow hedges, net of $(1) taxes in 2008 |
— | — | (2 | ) | ||||||||
|
Less: Reclassification adjustment for (gains)/losses included in net income, net of $1 and $(1) taxes in 2009 and 2008, respectively |
— | 1 | (1 | ) | ||||||||
|
Less: Reclassification adjustment for unrealized losses included in regulatory assets, net of $(5) taxes in 2008 |
— | — | (8 | ) | ||||||||
|
TOTAL OTHER COMPREHENSIVE INCOME/(LOSS), NET OF TAXES |
2 | 25 | (24 | ) | ||||||||
|
COMPREHENSIVE INCOME |
1,005 | 904 | 1,183 | |||||||||
|
Preferred stock dividend requirements of subsidiary |
(11 | ) | (11 | ) | (11 | ) | ||||||
|
COMPREHENSIVE INCOME FOR COMMON STOCK |
$ | 994 | $ | 893 | $ | 1,172 | ||||||
The accompanying notes are an integral part of these financial statements.
| 80 |
Table of Contents
|
Consolidated Edison, Inc. CONSOLIDATED STATEMENT OF COMMON SHAREHOLDERS’ EQUITY |
|
(Millions of Dollars/Except
|
Common Stock |
Additional Paid-
In Capital |
Retained
Earnings |
Treasury Stock |
Capital Stock Expense |
Accumulated
Other Comprehensive Income/(Loss) |
Total | |||||||||||||||||||||||||||||
| Shares | Amount | Shares | Amount | |||||||||||||||||||||||||||||||||
|
BALANCE AS OF
|
272,024,874 | $ | 29 | $ | 4,038 | $ | 6,113 | 23,210,700 | $ | (1,001 | ) | $ | (60 | ) | $ | (43 | ) | $ | 9,076 | |||||||||||||||||
|
Net income for common stock |
1,196 | 1,196 | ||||||||||||||||||||||||||||||||||
|
Common stock dividends |
(639 | ) | (639 | ) | ||||||||||||||||||||||||||||||||
|
Issuance of common shares –dividend reinvestment and employee stock plans |
1,696,812 | 74 | 74 | |||||||||||||||||||||||||||||||||
|
Other comprehensive loss |
(24 | ) | (24 | ) | ||||||||||||||||||||||||||||||||
|
Adjustment for adoption of fair value standard net of taxes |
15 | 15 | ||||||||||||||||||||||||||||||||||
|
BALANCE AS OF
|
273,721,686 | $ | 29 | $ | 4,112 | $ | 6,685 | 23,210,700 | $ | (1,001 | ) | $ | (60 | ) | $ | (67 | ) | $ | 9,698 | |||||||||||||||||
|
Net income for common stock |
868 | 868 | ||||||||||||||||||||||||||||||||||
|
Common stock dividends |
(649 | ) | (649 | ) | ||||||||||||||||||||||||||||||||
|
Issuance of common shares – public offering |
5,000,000 | 1 | 214 | (2 | ) | 213 | ||||||||||||||||||||||||||||||
|
Issuance of common shares – dividend reinvestment and employee stock plans |
2,402,055 | 94 | 94 | |||||||||||||||||||||||||||||||||
|
Other comprehensive income |
25 | 25 | ||||||||||||||||||||||||||||||||||
|
BALANCE AS OF
|
281,123,741 | $ | 30 | $ | 4,420 | $ | 6,904 | 23,210,700 | $ | (1,001 | ) | $ | (62 | ) | $ | (42 | ) | $ | 10,249 | |||||||||||||||||
|
Net income for common stock |
992 | 992 | ||||||||||||||||||||||||||||||||||
|
Common stock dividends |
(676 | ) | (676 | ) | ||||||||||||||||||||||||||||||||
|
Issuance of common shares – public offering |
6,300,000 | 1 | 307 | (2 | ) | 306 | ||||||||||||||||||||||||||||||
|
Issuance of common shares – dividend reinvestment and employee stock plans |
4,192,593 | 188 | 188 | |||||||||||||||||||||||||||||||||
|
Other comprehensive income |
2 | 2 | ||||||||||||||||||||||||||||||||||
|
BALANCE AS OF
|
291,616,334 | $ | 31 | $ | 4,915 | $ | 7,220 | 23,210,700 | $ | (1,001 | ) | $ | (64 | ) | $ | (40 | ) | $ | 11,061 | |||||||||||||||||
The accompanying notes are an integral part of these financial statements.
| 81 |
Table of Contents
|
Consolidated Edison, Inc. CONSOLIDATED STATEMENT OF CAPITALIZATION |
| Shares outstanding December 31, | At December 31, | |||||||||||||||
| 2010 | 2009 | 2010 | 2009 | |||||||||||||
| (Millions of Dollars) | ||||||||||||||||
|
TOTAL COMMON SHAREHOLDERS’ EQUITY BEFORE |
291,616,334 | 281,123,741 | $ | 11,101 | $ | 10,291 | ||||||||||
|
ACCUMULATED OTHER COMPREHENSIVE LOSS |
||||||||||||||||
|
Pension plan liability adjustments, net of $(22) and $(27) taxes in 2010 and 2009, respectively |
(37 | ) | (38 | ) | ||||||||||||
|
Unrealized gains/(losses) on derivatives qualified as cash flow hedges, less reclassification adjustment for gains/(losses) included in net income and reclassification adjustment for unrealized losses included in regulatory assets, net of $(60) and $(61) taxes in 2010 and 2009, respectively |
(3 | ) | (4 | ) | ||||||||||||
|
TOTAL ACCUMULATED OTHER COMPREHENSIVE LOSS, NET OF TAXES |
(40 | ) | (42 | ) | ||||||||||||
|
TOTAL COMMON SHAREHOLDERS’ EQUITY (SEE STATEMENT OF COMMON SHAREHOLDERS’ EQUITY) |
11,061 | 10,249 | ||||||||||||||
|
PREFERRED STOCK OF SUBSIDIARY |
||||||||||||||||
|
$5 Cumulative Preferred, without par value, authorized 1,915,319 shares |
1,915,319 | 1,915,319 | 175 | 175 | ||||||||||||
|
Cumulative Preferred, $100 par value, authorized 6,000,000 shares |
||||||||||||||||
|
4.65% Series C |
153,296 | 153,296 | 16 | 16 | ||||||||||||
|
4.65% Series D |
222,330 | 222,330 | 22 | 22 | ||||||||||||
|
TOTAL PREFERRED STOCK |
$ | 213 | $ | 213 | ||||||||||||
The accompanying notes are an integral part of these financial statements.
| 82 |
Table of Contents
|
Consolidated Edison, Inc. CONSOLIDATED STATEMENT OF CAPITALIZATION |
| LONG-TERM DEBT | At December 31, | |||||||||||||
| Maturity | Interest Rate | Series | 2010 | 2009 | ||||||||||
| (Millions of Dollars) | ||||||||||||||
|
DEBENTURES: |
||||||||||||||
|
2010 |
8.125% | 2000A | $ | — | $ | 325 | ||||||||
|
2010 |
7.50 | 2000A | — | 55 | ||||||||||
|
2010 |
7.50 | 2000B | — | 300 | ||||||||||
|
2012 |
5.625 | 2002A | 300 | 300 | ||||||||||
|
2013 |
4.875 | 2002B | 500 | 500 | ||||||||||
|
2013 |
3.85 | 2003B | 200 | 200 | ||||||||||
|
2014 |
4.70 | 2004A | 200 | 200 | ||||||||||
|
2014 |
5.55 | 2009A | 275 | 275 | ||||||||||
|
2015 |
2.50 | 2010A | 55 | — | ||||||||||
|
2015 |
5.375 | 2005C | 350 | 350 | ||||||||||
|
2015 |
5.30 | 2005A | 40 | 40 | ||||||||||
|
2016 |
5.45 | 2006A | 75 | 75 | ||||||||||
|
2016 |
5.50 | 2006C | 400 | 400 | ||||||||||
|
2016 |
5.30 | 2006D | 250 | 250 | ||||||||||
|
2018 |
5.85 | 2008A | 600 | 600 | ||||||||||
|
2018 |
7.125 | 2008C | 600 | 600 | ||||||||||
|
2018 |
6.15 | 2008A | 50 | 50 | ||||||||||
|
2019 |
4.96 | 2009A | 60 | 60 | ||||||||||
|
2019 |
6.65 | 2009B | 475 | 475 | ||||||||||
|
2020 |
4.45 | 2010A | 350 | — | ||||||||||
|
2027 |
6.50 | 1997F | 80 | 80 | ||||||||||
|
2029 |
7.00 | 1999G | — | 45 | ||||||||||
|
2033 |
5.875 | 2003A | 175 | 175 | ||||||||||
|
2033 |
5.10 | 2003C | 200 | 200 | ||||||||||
|
2034 |
5.70 | 2004B | 200 | 200 | ||||||||||
|
2035 |
5.30 | 2005A | 350 | 350 | ||||||||||
|
2035 |
5.25 | 2005B | 125 | 125 | ||||||||||
|
2036 |
5.85 | 2006A | 400 | 400 | ||||||||||
|
2036 |
6.20 | 2006B | 400 | 400 | ||||||||||
|
2036 |
5.70 | 2006E | 250 | 250 | ||||||||||
|
2037 |
6.30 | 2007A | 525 | 525 | ||||||||||
|
2038 |
6.75 | 2008B | 600 | 600 | ||||||||||
|
2039 |
6.00 | 2009B | 60 | 60 | ||||||||||
|
2039 |
5.50 | 2009C | 600 | 600 | ||||||||||
|
2040 |
5.70 | 2010B | 350 | — | ||||||||||
|
2040 |
5.50 | 2010B | 115 | — | ||||||||||
|
TOTAL DEBENTURES |
9,210 | 9,065 | ||||||||||||
|
TRANSITION BONDS: |
||||||||||||||
|
2019* |
5.22% | 2004-1 | 32 | 34 | ||||||||||
|
TOTAL TRANSITION BONDS |
32 | 34 | ||||||||||||
| 83 |
Table of Contents
|
Consolidated Edison, Inc. CONSOLIDATED STATEMENT OF CAPITALIZATION |
| LONG-TERM DEBT | At December 31, | |||||||||||||
| Maturity | Interest Rate | Series | 2010 | 2009 | ||||||||||
| (Millions of Dollars) | ||||||||||||||
|
TAX-EXEMPT DEBT - Notes issued to New York State Energy Research and Development Authority for Facilities Revenue Bonds**: |
||||||||||||||
|
2014 |
0.40% | 1994*** | — | 55 | ||||||||||
|
2015 |
0.34 | 1995*** | 44 | 44 | ||||||||||
|
2032 |
0.595 | 2004B Series 1 | 127 | 127 | ||||||||||
|
2034 |
0.548 | 1999A | 293 | 293 | ||||||||||
|
2035 |
0.525 | 2004B Series 2 | 20 | 20 | ||||||||||
|
2036 |
1.45 | 2010A | 225 | — | ||||||||||
|
2036 |
4.70 | 2001A | — | 225 | ||||||||||
|
2036 |
0.49 | 2001B | 98 | 98 | ||||||||||
|
2039 |
0.525 | 2004A | 98 | 98 | ||||||||||
|
2039 |
0.307 | 2004C | 99 | 99 | ||||||||||
|
2039 |
0.29 | 2005A | 126 | 126 | ||||||||||
|
TOTAL TAX-EXEMPT DEBT |
1,130 | 1,185 | ||||||||||||
|
Other long-term debt |
323 | 326 | ||||||||||||
|
Unamortized debt discount |
(19 | ) | (25 | ) | ||||||||||
|
TOTAL |
10,676 | 10,585 | ||||||||||||
|
Less: long-term debt due within one year |
5 | 731 | ||||||||||||
|
TOTAL LONG-TERM DEBT |
10,671 | 9,854 | ||||||||||||
|
TOTAL CAPITALIZATION |
$ | 21,945 | $ | 20,316 | ||||||||||
| * | The final date to pay the entire remaining unpaid principal balance, if any, of all outstanding bonds is May 17, 2021. |
| ** | Other than Series 2001A and Series 2010A (the proceeds of which were used to redeem the Series 2001A), rates reset weekly or by auction held every 35 days; December 31, 2010 rates shown (August 18, 2010 rate shown for Series 1994). |
| *** | Issued for O&R pollution control financing. |
The accompanying notes are an integral part of these financial statements.
| 84 |
Table of Contents
|
Report of Management on Internal Control Over Financial Reporting |
Management of Consolidated Edison Company of New York, Inc. and its subsidiaries (the Company) is responsible for establishing and maintaining adequate internal control over financial reporting. Internal control over financial reporting is a process designed to provide reasonable, but not absolute, assurance regarding the reliability of financial reporting and the preparation of financial statements for external purposes in accordance with accounting principles generally accepted in the United States of America.
Because of its inherent limitations, internal control over financial reporting may not prevent or detect misstatements. Also, projections of the effectiveness of controls to future periods are subject to the risk that controls may become inadequate because of changes in conditions, or that the degree of compliance with policies or procedures may deteriorate.
Management of the Company assessed the effectiveness of internal control over financial reporting as of December 31, 2010, using the criteria established by the Committee of Sponsoring Organizations of the Treadway Commission (COSO) in Internal Control – Integrated Framework . Based on that assessment, management has concluded that the Company had effective internal control over financial reporting as of December 31, 2010.
The effectiveness of the Company’s internal control over financial reporting as of December 31, 2010, has been audited by PricewaterhouseCoopers LLP, the Company’s independent registered public accounting firm, as stated in their report which appears on the following page of this Annual Report on Form 10-K.
Kevin Burke
Chairman and Chief Executive Officer
Robert Hoglund
Senior Vice President and Chief Financial Officer
February 22, 2011
| 85 |
Table of Contents
|
Report of Independent Registered Public Accounting Firm |
To the Stockholder and Board of Trustees of Consolidated Edison Company of New York, Inc.:
In our opinion, the consolidated financial statements listed in the accompanying index present fairly, in all material respects, the financial position of Consolidated Edison Company of New York, Inc. and its subsidiaries (the Company) at December 31, 2010 and 2009, and the results of their operations and their cash flows for each of the three years in the period ended December 31, 2010 in conformity with accounting principles generally accepted in the United States of America. In addition, in our opinion, the financial statement schedule listed in the accompanying index presents fairly, in all material respects, the information set forth therein when read in conjunction with the related consolidated financial statements. Also in our opinion, the Company maintained, in all material respects, effective internal control over financial reporting as of December 31, 2010, based on criteria established in Internal Control – Integrated Framework issued by the Committee of Sponsoring Organizations of the Treadway Commission (COSO). The Company’s management is responsible for these financial statements and financial statement schedule, for maintaining effective internal control over financial reporting and for its assessment of the effectiveness of internal control over financial reporting, included in the accompanying Report of Management on Internal Control Over Financial Reporting. Our responsibility is to express opinions on these financial statements, on the financial statement schedule, and on the Company’s internal control over financial reporting based on our audits. We conducted our audits in accordance with the standards of the Public Company Accounting Oversight Board (United States). Those standards require that we plan and perform the audits to obtain reasonable assurance about whether the financial statements are free of material misstatement and whether effective internal control over financial reporting was maintained in all material respects. Our audits of the financial statements included examining, on a test basis, evidence supporting the amounts and disclosures in the financial statements, assessing the accounting principles used and significant estimates made by management, and evaluating the overall financial statement presentation. Our audit of internal control over financial reporting included obtaining an understanding of internal control over financial reporting, assessing the risk that a material weakness exists, and testing and evaluating the design and operating effectiveness of internal control based on the assessed risk. Our audits also included performing such other procedures as we considered necessary in the circumstances. We believe that our audits provide a reasonable basis for our opinions.
A company’s internal control over financial reporting is a process designed to provide reasonable assurance regarding the reliability of financial reporting and the preparation of financial statements for external purposes in accordance with generally accepted accounting principles. A company’s internal control over financial reporting includes those policies and procedures that (i) pertain to the maintenance of records that, in reasonable detail, accurately and fairly reflect the transactions and dispositions of the assets of the company; (ii) provide reasonable assurance that transactions are recorded as necessary to permit preparation of financial statements in accordance with generally accepted accounting principles, and that receipts and expenditures of the company are being made only in accordance with authorizations of management and directors of the company; and (iii) provide reasonable assurance regarding prevention or timely detection of unauthorized acquisition, use, or disposition of the company’s assets that could have a material effect on the financial statements.
Because of its inherent limitations, internal control over financial reporting may not prevent or detect misstatements. Also, projections of any evaluation of effectiveness to future periods are subject to the risk that controls may become inadequate because of changes in conditions, or that the degree of compliance with the policies or procedures may deteriorate.
PricewaterhouseCoopers LLP
New York, New York
February 22, 2011
| 86 |
Table of Contents
|
Consolidated Edison Company of New York, Inc. CONSOLIDATED INCOME STATEMENT |
| For the Years Ended December 31, | ||||||||||||
| 2010 | 2009 | 2008 | ||||||||||
| (Millions of Dollars) | ||||||||||||
|
OPERATING REVENUES |
||||||||||||
|
Electric |
$ | 8,376 | $ | 7,674 | $ | 7,878 | ||||||
|
Gas |
1,541 | 1,701 | 1,839 | |||||||||
|
Steam |
656 | 661 | 707 | |||||||||
|
TOTAL OPERATING REVENUES |
10,573 | 10,036 | 10,424 | |||||||||
|
OPERATING EXPENSES |
||||||||||||
|
Purchased power |
2,683 | 2,583 | 3,185 | |||||||||
|
Fuel |
458 | 503 | 660 | |||||||||
|
Gas purchased for resale |
552 | 818 | 999 | |||||||||
|
Other operations and maintenance |
2,515 | 2,186 | 1,937 | |||||||||
|
Depreciation and amortization |
787 | 744 | 672 | |||||||||
|
Taxes, other than income taxes |
1,656 | 1,486 | 1,304 | |||||||||
|
TOTAL OPERATING EXPENSES |
8,651 | 8,320 | 8,757 | |||||||||
|
OPERATING INCOME |
1,922 | 1,716 | 1,667 | |||||||||
|
OTHER INCOME (DEDUCTIONS) |
||||||||||||
|
Investment and other income |
32 | 34 | 21 | |||||||||
|
Allowance for equity funds used during construction |
13 | 12 | 7 | |||||||||
|
Other deductions |
(19 | ) | (13 | ) | (12 | ) | ||||||
|
TOTAL OTHER INCOME (DEDUCTIONS) |
26 | 33 | 16 | |||||||||
|
INCOME BEFORE INTEREST AND INCOME TAX EXPENSE |
1,948 | 1,749 | 1,683 | |||||||||
|
INTEREST EXPENSE |
||||||||||||
|
Interest on long-term debt |
537 | 534 | 474 | |||||||||
|
Other interest |
19 | 27 | 25 | |||||||||
|
Allowance for borrowed funds used during construction |
(7 | ) | (8 | ) | (7 | ) | ||||||
|
NET INTEREST EXPENSE |
549 | 553 | 492 | |||||||||
|
INCOME FROM CONTINUING OPERATIONS BEFORE TAXES |
1,399 | 1,196 | 1,191 | |||||||||
|
INCOME TAX EXPENSE |
495 | 404 | 397 | |||||||||
|
NET INCOME |
904 | 792 | 794 | |||||||||
|
Preferred stock dividend requirements |
(11 | ) | (11 | ) | (11 | ) | ||||||
|
NET INCOME FOR COMMON STOCK |
$ | 893 | $ | 781 | $ | 783 | ||||||
The accompanying notes are an integral part of these financial statements.
| 87 |
Table of Contents
|
Consolidated Edison Company of New York, Inc. CONSOLIDATED STATEMENT OF CASH FLOWS |
| For the Twelve Months Ended December 31, | ||||||||||||
| 2010 | 2009 | 2008 | ||||||||||
| (Millions of Dollars) | ||||||||||||
|
OPERATING ACTIVITIES |
||||||||||||
|
Net income |
$ | 904 | $ | 792 | $ | 794 | ||||||
|
PRINCIPAL NON-CASH CHARGES/(CREDITS) TO INCOME |
||||||||||||
|
Depreciation and amortization |
787 | 744 | 672 | |||||||||
|
Deferred income taxes |
622 | 364 | 500 | |||||||||
|
Rate case amortization and accruals |
13 | (63 | ) | (176 | ) | |||||||
|
Net transmission and distribution reconciliation |
— | — | (50 | ) | ||||||||
|
Common equity component of allowance for funds used during construction |
(13 | ) | (12 | ) | (7 | ) | ||||||
|
Other non-cash items (net) |
(12 | ) | (56 | ) | (33 | ) | ||||||
|
CHANGES IN ASSETS AND LIABILITIES |
||||||||||||
|
Accounts receivable – customers, less allowance for uncollectibles |
(121 | ) | 33 | 16 | ||||||||
|
Materials and supplies, including fuel oil and gas in storage |
4 | 133 | (91 | ) | ||||||||
|
Other receivables and other current assets |
11 | (122 | ) | (195 | ) | |||||||
|
Prepayments |
— | 456 | (457 | ) | ||||||||
|
Recoverable energy costs |
— | 111 | 99 | |||||||||
|
Accounts payable |
(17 | ) | (118 | ) | 60 | |||||||
|
Pensions and retiree benefits |
68 | — | (16 | ) | ||||||||
|
Accrued taxes |
13 | (16 | ) | 36 | ||||||||
|
Accrued interest |
(7 | ) | 6 | (3 | ) | |||||||
|
Deferred charges, noncurrent assets and other regulatory assets |
(535 | ) | 57 | (374 | ) | |||||||
|
Deferred credits and other regulatory liabilities |
70 | (25 | ) | 280 | ||||||||
|
Other liabilities |
418 | (62 | ) | (19 | ) | |||||||
|
NET CASH FLOWS FROM OPERATING ACTIVITIES |
2,205 | 2,222 | 1,036 | |||||||||
|
INVESTING ACTIVITIES |
||||||||||||
|
Utility construction expenditures |
(1,866 | ) | (2,057 | ) | (2,202 | ) | ||||||
|
Cost of removal less salvage |
(145 | ) | (176 | ) | (195 | ) | ||||||
|
Common equity component of allowance for funds used during construction |
13 | 12 | 7 | |||||||||
|
Loan to affiliate |
— | 113 | (58 | ) | ||||||||
|
NET CASH FLOWS USED IN INVESTING ACTIVITIES |
(1,998 | ) | (2,108 | ) | (2,448 | ) | ||||||
|
FINANCING ACTIVITIES |
||||||||||||
|
Net payments of short-term debt |
— | (253 | ) | (302 | ) | |||||||
|
Retirement of long-term debt |
(850 | ) | (655 | ) | (280 | ) | ||||||
|
Issuance of long-term debt |
925 | 1,350 | 1,800 | |||||||||
|
Debt issuance costs |
(9 | ) | (10 | ) | (13 | ) | ||||||
|
Capital contribution by parent |
355 | 211 | 752 | |||||||||
|
Dividend to parent |
(670 | ) | (652 | ) | (618 | ) | ||||||
|
Preferred stock dividends |
(11 | ) | (11 | ) | (11 | ) | ||||||
|
NET CASH FLOWS (USED IN)/FROM FINANCING ACTIVITIES |
(260 | ) | (20 | ) | 1,328 | |||||||
|
CASH AND TEMPORARY CASH INVESTMENTS: |
||||||||||||
|
NET CHANGE FOR THE PERIOD |
(53 | ) | 94 | (84 | ) | |||||||
|
BALANCE AT BEGINNING OF PERIOD |
131 | 37 | 121 | |||||||||
|
BALANCE AT END OF PERIOD |
$ | 78 | $ | 131 | $ | 37 | ||||||
|
SUPPLEMENTAL DISCLOSURE OF CASH FLOW INFORMATION |
||||||||||||
|
Cash paid/(refunded) during the period for: |
||||||||||||
|
Interest |
$ | 528 | $ | 513 | $ | 473 | ||||||
|
Income taxes |
$ | (18 | ) | $ | 18 | $ | (1 | ) | ||||
The accompanying notes are an integral part of these financial statements.
| 88 |
Table of Contents
|
Consolidated Edison Company of New York, Inc. CONSOLIDATED BALANCE SHEET |
|
December 31,
2010 |
December 31,
2009 |
|||||||
| (Millions of Dollars) | ||||||||
|
ASSETS |
||||||||
|
CURRENT ASSETS |
||||||||
|
Cash and temporary cash investments |
$ | 78 | $ | 131 | ||||
|
Accounts receivable – customers, less allowance for uncollectible accounts of $68 and $63 in 2010 and 2009, respectively |
1,025 | 904 | ||||||
|
Other receivables, less allowance for uncollectible accounts of $7 and $4 in 2010 and 2009, respectively |
103 | 134 | ||||||
|
Accrued unbilled revenue |
473 | 413 | ||||||
|
Accounts receivable from affiliated companies |
249 | 124 | ||||||
|
Fuel oil, gas in storage, materials and supplies, at average cost |
306 | 310 | ||||||
|
Prepayments |
82 | 82 | ||||||
|
Regulatory assets |
151 | 104 | ||||||
|
Revenue decoupling mechanism receivable |
— | 107 | ||||||
|
Other current assets |
98 | 89 | ||||||
|
TOTAL CURRENT ASSETS |
2,565 | 2,398 | ||||||
|
INVESTMENTS |
167 | 126 | ||||||
|
UTILITY PLANT AT ORIGINAL COST |
||||||||
|
Electric |
18,735 | 17,570 | ||||||
|
Gas |
3,844 | 3,537 | ||||||
|
Steam |
2,038 | 1,935 | ||||||
|
General |
1,746 | 1,708 | ||||||
|
TOTAL |
26,363 | 24,750 | ||||||
|
Less: Accumulated depreciation |
5,314 | 4,947 | ||||||
|
Net |
21,049 | 19,803 | ||||||
|
Construction work in progress |
1,345 | 1,334 | ||||||
|
NET UTILITY PLANT |
22,394 | 21,137 | ||||||
|
NON-UTILITY PROPERTY |
||||||||
|
Non-utility property, less accumulated depreciation of $22 and $20 in 2010 and 2009, respectively |
7 | 9 | ||||||
|
NET PLANT |
22,401 | 21,146 | ||||||
|
OTHER NONCURRENT ASSETS |
||||||||
|
Regulatory assets |
7,058 | 6,590 | ||||||
|
Other deferred charges and noncurrent assets |
244 | 201 | ||||||
|
TOTAL OTHER NONCURRENT ASSETS |
7,302 | 6,791 | ||||||
|
TOTAL ASSETS |
$ | 32,435 | $ | 30,461 | ||||
The accompanying notes are an integral part of these financial statements.
| 89 |
Table of Contents
|
Consolidated Edison Company of New York, Inc. CONSOLIDATED BALANCE SHEET |
|
December 31,
2010 |
December 31,
2009 |
|||||||
| (Millions of Dollars) | ||||||||
|
LIABILITIES AND SHAREHOLDER’S EQUITY |
||||||||
|
CURRENT LIABILITIES |
||||||||
|
Long-term debt due within one year |
$ | — | $ | 625 | ||||
|
Accounts payable |
924 | 937 | ||||||
|
Accounts payable to affiliated companies |
13 | 17 | ||||||
|
Customer deposits |
276 | 259 | ||||||
|
Accrued taxes |
34 | 41 | ||||||
|
Accrued taxes to affiliated companies |
29 | 9 | ||||||
|
Accrued interest |
130 | 137 | ||||||
|
Accrued wages |
93 | 89 | ||||||
|
Other current liabilities |
460 | 333 | ||||||
|
TOTAL CURRENT LIABILITIES |
1,959 | 2,447 | ||||||
|
NONCURRENT LIABILITIES |
||||||||
|
Obligations under capital leases |
7 | 14 | ||||||
|
Provision for injuries and damages |
159 | 160 | ||||||
|
Pensions and retiree benefits |
2,900 | 2,978 | ||||||
|
Superfund and other environmental costs |
392 | 159 | ||||||
|
Asset retirement obligations |
109 | 122 | ||||||
|
Fair value of derivative liabilities |
29 | 44 | ||||||
|
Other noncurrent liabilities |
116 | 68 | ||||||
|
TOTAL NONCURRENT LIABILITIES |
3,712 | 3,545 | ||||||
|
DEFERRED CREDITS AND REGULATORY LIABILITIES |
||||||||
|
Deferred income taxes and investment tax credits |
6,071 | 5,139 | ||||||
|
Regulatory liabilities |
783 | 703 | ||||||
|
Other deferred credits |
31 | 29 | ||||||
|
TOTAL DEFERRED CREDITS AND REGULATORY LIABILITIES |
6,885 | 5,871 | ||||||
|
LONG-TERM DEBT (See Statement of Capitalization) |
9,743 | 9,038 | ||||||
|
SHAREHOLDER’S EQUITY |
||||||||
|
Common shareholder’s equity (See Statement of Common Shareholder’s Equity) |
9,923 | 9,347 | ||||||
|
Preferred stock (See Statement of Capitalization) |
213 | 213 | ||||||
|
TOTAL SHAREHOLDER’S EQUITY |
10,136 | 9,560 | ||||||
|
TOTAL LIABILITIES AND SHAREHOLDER’S EQUITY |
$ | 32,435 | $ | 30,461 | ||||
The accompanying notes are an integral part of these financial statements.
| 90 |
Table of Contents
|
Consolidated Edison Company of New York, Inc. CONSOLIDATED STATEMENT OF COMPREHENSIVE INCOME |
| For the Years Ended December 31, | ||||||||||||
| 2010 | 2009 | 2008 | ||||||||||
| (Millions of Dollars) | ||||||||||||
|
NET INCOME |
$ | 904 | $ | 792 | $ | 794 | ||||||
|
OTHER COMPREHENSIVE INCOME/(LOSS), NET OF TAXES |
||||||||||||
|
Pension plan liability adjustments, net of $(1), $11 and $(7) taxes in 2010, 2009 and 2008, respectively |
(2 | ) | 16 | (11 | ) | |||||||
|
TOTAL OTHER COMPREHENSIVE INCOME/(LOSS), NET OF TAXES |
(2 | ) | 16 | (11 | ) | |||||||
|
COMPREHENSIVE INCOME |
$ | 902 | $ | 808 | $ | 783 | ||||||
The accompanying notes are an integral part of these financial statements.
| 91 |
Table of Contents
|
Consolidated Edison Company of New York, Inc. CONSOLIDATED STATEMENT OF COMMON SHAREHOLDER’S EQUITY |
| Common Stock |
Additional Paid-In
|
Retained
|
Repurchased
|
Capital
|
Accumulated
|
Total |
||||||||||||||||||||||||||
| (Millions of Dollars/Except Share Data) | Shares | Amount | ||||||||||||||||||||||||||||||
|
BALANCE AS OF DECEMBER 31, 2007 |
235,488,094 | $ | 589 | $ | 2,912 | $ | 5,616 | $ | (962 | ) | $ | (60 | ) | $ | (9 | ) | $ | 8,086 | ||||||||||||||
|
Net income |
794 | 794 | ||||||||||||||||||||||||||||||
|
Common stock dividend to parent |
(618 | ) | (618 | ) | ||||||||||||||||||||||||||||
|
Capital contribution by parent |
752 | 752 | ||||||||||||||||||||||||||||||
|
Cumulative preferred dividends |
(12 | ) | (12 | ) | ||||||||||||||||||||||||||||
|
Other comprehensive loss |
(11 | ) | (11 | ) | ||||||||||||||||||||||||||||
|
BALANCE AS OF DECEMBER 31, 2008 |
235,488,094 | $ | 589 | $ | 3,664 | $ | 5,780 | $ | (962 | ) | $ | (60 | ) | $ | (20 | ) | $ | 8,991 | ||||||||||||||
|
Net income |
792 | 792 | ||||||||||||||||||||||||||||||
|
Common stock dividend to parent |
(652 | ) | (652 | ) | ||||||||||||||||||||||||||||
|
Capital contribution by parent |
213 | (2 | ) | 211 | ||||||||||||||||||||||||||||
|
Cumulative preferred dividends |
(11 | ) | (11 | ) | ||||||||||||||||||||||||||||
|
Other comprehensive income |
16 | 16 | ||||||||||||||||||||||||||||||
|
BALANCE AS OF DECEMBER 31, 2009 |
235,488,094 | $ | 589 | $ | 3,877 | $ | 5,909 | $ | (962 | ) | $ | (62 | ) | $ | (4 | ) | $ | 9,347 | ||||||||||||||
|
Net income |
904 | 904 | ||||||||||||||||||||||||||||||
|
Common stock dividend to parent |
(670 | ) | (670 | ) | ||||||||||||||||||||||||||||
|
Capital contribution by parent |
357 | (2 | ) | 355 | ||||||||||||||||||||||||||||
|
Cumulative preferred dividends |
(11 | ) | (11 | ) | ||||||||||||||||||||||||||||
|
Other comprehensive income |
(2 | ) | (2 | ) | ||||||||||||||||||||||||||||
|
BALANCE AS OF DECEMBER 31, 2010 |
235,488,094 | $ | 589 | $ | 4,234 | $ | 6,132 | $ | (962 | ) | $ | (64 | ) | $ | (6 | ) | $ | 9,923 | ||||||||||||||
The accompanying notes are an integral part of these financial statements.
| 92 |
Table of Contents
|
Consolidated Edison Company of New York, Inc. CONSOLIDATED STATEMENT OF CAPITALIZATION |
| Shares outstanding | At December 31, | |||||||||||||||
|
December 31,
2010 |
December 31,
2009 |
2010 | 2009 | |||||||||||||
| (Millions of Dollars) | ||||||||||||||||
|
TOTAL COMMON SHAREHOLDER’S EQUITY BEFORE |
235,488,094 | 235,488,094 | $ | 9,929 | $ | 9,351 | ||||||||||
|
ACCUMULATED OTHER COMPREHENSIVE LOSS |
||||||||||||||||
|
Pension plan liability adjustments, net $(2) and $(1) taxes in 2010 and 2009, respectively |
(3 | ) | (2 | ) | ||||||||||||
|
Unrealized gains on derivatives qualified as cash flow hedges, less reclassification adjustment for gains included in net income, net of $(2) taxes in 2010 and 2009, respectively |
(3 | ) | (2 | ) | ||||||||||||
|
TOTAL ACCUMULATED OTHER COMPREHENSIVE LOSS, NET OF TAXES |
(6 | ) | (4 | ) | ||||||||||||
|
TOTAL COMMON SHAREHOLDER’S EQUITY (SEE STATEMENT OF COMMON SHAREHOLDER’S EQUITY) |
9,923 | 9,347 | ||||||||||||||
|
PREFERRED STOCK |
||||||||||||||||
|
$5 Cumulative Preferred, without par value, authorized 1,915,319 shares |
1,915,319 | 1,915,319 | 175 | 175 | ||||||||||||
|
Cumulative Preferred, $100 par value, authorized 6,000,000 shares |
||||||||||||||||
|
4.65% Series C |
153,296 | 153,296 | 16 | 16 | ||||||||||||
|
4.65% Series D |
222,330 | 222,330 | 22 | 22 | ||||||||||||
|
TOTAL PREFERRED STOCK |
$ | 213 | $ | 213 | ||||||||||||
The accompanying notes are an integral part of these financial statements.
| 93 |
Table of Contents
|
Consolidated Edison Company of New York, Inc. CONSOLIDATED STATEMENT OF CAPITALIZATION |
| LONG-TERM DEBT | At December 31, | |||||||||||||
| Maturity | Interest Rate | Series | 2010 | 2009 | ||||||||||
| (Millions of Dollars) | ||||||||||||||
|
DEBENTURES: |
||||||||||||||
|
2010 |
8.125% | 2000A | $ | — | $ | 325 | ||||||||
|
2010 |
7.50 | 2000B | — | 300 | ||||||||||
|
2012 |
5.625 | 2002A | 300 | 300 | ||||||||||
|
2013 |
4.875 | 2002B | 500 | 500 | ||||||||||
|
2013 |
3.85 | 2003B | 200 | 200 | ||||||||||
|
2014 |
4.70 | 2004A | 200 | 200 | ||||||||||
|
2014 |
5.55 | 2009A | 275 | 275 | ||||||||||
|
2015 |
5.375 | 2005C | 350 | 350 | ||||||||||
|
2016 |
5.50 | 2006C | 400 | 400 | ||||||||||
|
2016 |
5.30 | 2006D | 250 | 250 | ||||||||||
|
2018 |
5.85 | 2008A | 600 | 600 | ||||||||||
|
2018 |
7.125 | 2008C | 600 | 600 | ||||||||||
|
2019 |
6.65 | 2009B | 475 | 475 | ||||||||||
|
2020 |
4.45 | 2010A | 350 | — | ||||||||||
|
2033 |
5.875 | 2003A | 175 | 175 | ||||||||||
|
2033 |
5.10 | 2003C | 200 | 200 | ||||||||||
|
2034 |
5.70 | 2004B | 200 | 200 | ||||||||||
|
2035 |
5.30 | 2005A | 350 | 350 | ||||||||||
|
2035 |
5.25 | 2005B | 125 | 125 | ||||||||||
|
2036 |
5.85 | 2006A | 400 | 400 | ||||||||||
|
2036 |
6.20 | 2006B | 400 | 400 | ||||||||||
|
2036 |
5.70 | 2006E | 250 | 250 | ||||||||||
|
2037 |
6.30 | 2007A | 525 | 525 | ||||||||||
|
2038 |
6.75 | 2008B | 600 | 600 | ||||||||||
|
2039 |
5.50 | 2009C | 600 | 600 | ||||||||||
|
2040 |
5.70 | 2010B | 350 | — | ||||||||||
|
TOTAL DEBENTURES |
|
8,675 | 8,600 | |||||||||||
|
TAX-EXEMPT DEBT – Notes issued to New York State Energy Research and Development Authority for Facilities Revenue Bonds*: |
||||||||||||||
|
2032 |
0.595% | 2004B Series 1 | 127 | 127 | ||||||||||
|
2034 |
0.548 | 1999A | 293 | 293 | ||||||||||
|
2035 |
0.525 | 2004B Series 2 | 20 | 20 | ||||||||||
|
2036 |
4.70 | 2001A | — | 225 | ||||||||||
|
2036 |
0.49 | 2001B | 98 | 98 | ||||||||||
|
2036 |
1.45 | 2010A | 225 | — | ||||||||||
|
2039 |
0.525 | 2004A | 98 | 98 | ||||||||||
|
2039 |
0.307 | 2004C | 99 | 99 | ||||||||||
|
2039 |
0.29 | 2005A | 126 | 126 | ||||||||||
|
TOTAL TAX-EXEMPT DEBT |
|
1,086 | 1,086 | |||||||||||
|
Unamortized debt discount |
|
(18 | ) | (23 | ) | |||||||||
|
TOTAL |
|
9,743 | 9,663 | |||||||||||
|
Less: long-term debt due within one year |
|
— | 625 | |||||||||||
|
TOTAL LONG-TERM DEBT |
|
9,743 | 9,038 | |||||||||||
|
TOTAL CAPITALIZATION |
|
$ | 19,879 | $ | 18,598 | |||||||||
| * | Other than Series 2001A and Series 2010A (the proceeds of which were used to redeem the Series 2001A), rates reset weekly or by auction held every 35 days; December 31, 2010 rates shown. |
The accompanying notes are an integral part of these financial statements.
| 94 |
Table of Contents
NOTES TO THE FINANCIAL STATEMENTS
General
These combined notes accompany and form an integral part of the separate consolidated financial statements of each of the two separate registrants: Consolidated Edison, Inc. and its subsidiaries (Con Edison) and Consolidated Edison Company of New York, Inc. and its subsidiaries (CECONY). CECONY is a subsidiary of Con Edison and as such its financial condition and results of operations and cash flows, which are presented separately in the CECONY consolidated financial statements, are also consolidated, along with those of Con Edison’s other utility subsidiary, Orange and Rockland Utilities, Inc. (O&R), and Con Edison’s competitive energy businesses (discussed below) in Con Edison’s consolidated financial statements. The term “Utilities” is used in these notes to refer to CECONY and O&R.
As used in these notes, the term “Companies” refers to Con Edison and CECONY and, except as otherwise noted, the information in these combined notes relates to each of the Companies. However, CECONY makes no representation as to information relating to Con Edison or the subsidiaries of Con Edison other than itself.
Con Edison has two regulated utility subsidiaries: CECONY and O&R. CECONY provides electric service and gas service in New York City and Westchester County. The company also provides steam service in parts of Manhattan. O&R, along with its regulated utility subsidiaries, provides electric service in southeastern New York and adjacent areas of northern New Jersey and eastern Pennsylvania and gas service in southeastern New York and adjacent areas of eastern Pennsylvania. Con Edison has the following competitive energy businesses: Consolidated Edison Solutions, Inc. (Con Edison Solutions), a retail energy services company that sells electricity and also offers energy-related services; Consolidated Edison Energy, Inc. (Con Edison Energy), a wholesale energy supply and services company; and Consolidated Edison Development, Inc. (Con Edison Development), a company that develops and participates in infrastructure projects. During the second quarter of 2008, Con Edison Development and its subsidiary, CED/SCS Newington, LLC, completed the sale of their ownership interests in electricity generating plants with an aggregate capacity of approximately 1,706 megawatts. See Note U to the financial statements.
Note A — Summary of Significant Accounting Policies
Principles of Consolidation
The Companies’ consolidated financial statements include the accounts of their respective majority-owned subsidiaries, and variable interest entities (see Note Q), as required. All intercompany balances and transactions have been eliminated.
Accounting Policies
The accounting policies of Con Edison and its subsidiaries conform to accounting principles generally accepted in the United States of America. For the Utilities, these accounting principles include the accounting rules for regulated operations and the accounting requirements of the Federal Energy Regulatory Commission (FERC) and the state public utility regulatory commissions having jurisdiction.
The accounting rules for regulated operations specify the economic effects that result from the causal relationship of costs and revenues in the rate-regulated environment and how these effects are to be accounted for by a regulated enterprise. Revenues intended to cover some costs may be recorded either before or after the costs are incurred. If regulation provides assurance that incurred costs will be recovered in the future, these costs would be recorded as deferred charges or “regulatory assets” under the accounting rules for regulated operations. If revenues are recorded for costs that are expected to be incurred in the future, these revenues would be recorded as deferred credits or “regulatory liabilities” under the accounting rules for regulated operations.
The Utilities’ principal regulatory assets and liabilities are detailed in Note B. The Utilities are receiving or being credited with a return on all of their regulatory assets for which a cash outflow has been made, and are paying or being charged with a return on all of their regulatory liabilities for which a cash inflow has been received. The Utilities’ regulatory assets and liabilities will be recovered from customers, or applied for
| 95 |
Table of Contents
customer benefit, in accordance with rate provisions approved by the applicable public utility regulatory commission.
Other significant accounting policies of the Companies are referenced below in this Note A and in the notes that follow.
Plant and Depreciation
Utility Plant
Utility plant is stated at original cost. The cost of repairs and maintenance is charged to expense and the cost of betterments is capitalized. The capitalized cost of additions to utility plant includes indirect costs such as engineering, supervision, payroll taxes, pensions, other benefits and an allowance for funds used during construction (AFDC). The original cost of property is charged to expense over the estimated useful lives of the assets. Upon retirement, the original cost of property is charged to accumulated depreciation. See Note R. Rates used for AFDC include the cost of borrowed funds and a reasonable rate of return on the Utilities’ own funds when so used, determined in accordance with regulations of the FERC or the state public utility regulatory authority having jurisdiction. The rate is compounded semiannually, and the amounts applicable to borrowed funds are treated as a reduction of interest charges, while the amounts applicable to the Utilities’ own funds are credited to other income (deductions). The AFDC rates for CECONY were 5.3 percent, 6.9 percent and 6.0 percent for 2010, 2009 and 2008, respectively. The AFDC rates for O&R were 5.8 percent, 4.2 percent and 3.5 percent for 2010, 2009 and 2008, respectively.
The Utilities generally compute annual charges for depreciation using the straight-line method for financial statement purposes, with rates based on average service lives and net salvage factors. The average depreciation rate for CECONY was 3.1 percent for 2010, 2009 and 2008. The average depreciation rate for O&R was 2.8 percent for 2010, 2009 and 2008.
The estimated lives for utility plant for CECONY range from 5 to 80 years for electric, 5 to 85 years for gas, 5 to 70 years for steam and 5 to 50 years for general plant. For O&R, the estimated lives for utility plant range from 5 to 65 years for electric, 5 to 75 years for gas and 5 to 50 years for general plant.
At December 31, 2010 and 2009, the capitalized cost of the Companies’ utility plant, net of accumulated depreciation, was as follows:
| Con Edison | CECONY | |||||||||||||||
| (Millions of Dollars) | 2010 | 2009 | 2010 | 2009 | ||||||||||||
|
Electric |
||||||||||||||||
|
Generation |
$ | 396 | $ | 392 | $ | 396 | $ | 392 | ||||||||
|
Transmission |
2,284 | 2,090 | 2,150 | 1,953 | ||||||||||||
|
Distribution |
13,191 | 12,442 | 12,549 | 11,824 | ||||||||||||
|
Gas* |
3,535 | 3,226 | 3,153 | 2,892 | ||||||||||||
|
Steam |
1,617 | 1,555 | 1,617 | 1,555 | ||||||||||||
|
General |
1,241 | 1,231 | 1,125 | 1,117 | ||||||||||||
|
Held for future use |
72 | 82 | 60 | 70 | ||||||||||||
|
Construction work in progress |
1,458 | 1,421 | 1,344 | 1,334 | ||||||||||||
|
Net Utility Plant |
$ | 23,794 | $ | 22,439 | $ | 22,394 | $ | 21,137 | ||||||||
| * | Primarily distribution. |
Under the Utilities’ current rate plans, the aggregate annual depreciation allowance in effect at December 31, 2010 was $838 million, including $793 million under CECONY’s electric, gas and steam rate plans that have been approved by the New York State Public Service Commission (NYSPSC).
Non-Utility Plant
Non-utility plant is stated at original cost and consists primarily of land, telecommunication, gas storage and solar facilities that are currently not used within electric, gas or steam utility operations. Depreciation on these assets is computed using the straight-line
| 96 |
Table of Contents
method for financial statement purposes over their estimated useful lives, which range from 3 to 30 years.
Goodwill
In accordance with the accounting rules for goodwill and intangible assets, Con Edison is required to test goodwill for impairment annually. Goodwill is tested for impairment using a two-step approach. The first step of the goodwill impairment test compares the estimated fair value of a reporting unit with its carrying value, including goodwill. If the estimated fair value of a reporting unit exceeds its carrying value, goodwill of the reporting unit is considered not impaired. If the carrying value exceeds the estimated fair value of the reporting unit, the second step is performed to measure the amount of impairment loss, if any. The second step requires a calculation of the implied fair value of goodwill. See Note K and Note T.
Impairments
In accordance with the accounting rules for impairment or disposal of long-lived assets, the Companies evaluate the impairment of long-lived assets, based on projections of undiscounted future cash flows, whenever events or changes in circumstances indicate that the carrying amounts of such assets may not be recoverable. In the event an evaluation indicates that such cash flows cannot be expected to be sufficient to fully recover the assets, the assets are written down to their estimated fair value.
In accordance with the accounting rules for equity method and joint ventures, Con Edison Development recognized pre-tax impairment charges of $2 million in 2008, related to its equity investment in a 29 MW electric generating plant in Michigan (which was sold in 2008), and $5 million in 2009, related to its equity investment in an electric generating plant in Guatemala (which was sold in 2010). No impairment charges were recognized in 2010.
Revenues
The Utilities and Con Edison Solutions recognize revenues for energy service on a monthly billing cycle basis. The Utilities defer over a 12-month period net interruptible gas revenues, other than those authorized by the NYSPSC to be retained by the Utilities, for refund to firm gas sales and transportation customers. The Utilities and Con Edison Solutions accrue revenues at the end of each month for estimated energy service not yet billed to customers. Prior to March 31, 2009, CECONY did not accrue revenues for energy service provided but not yet billed to customers except for certain unbilled gas revenues accrued in 1989. This change in accounting for unbilled revenues had no effect on net income. See “Regulatory Assets and Liabilities” in Note B. Unbilled revenues included in Con Edison’s balance sheet at December 31, 2010 and 2009 were $633 million (including $473 million for CECONY) and $579 million (including $413 million for CECONY), respectively.
CECONY’s electric and gas rate plans and O&R’s New York electric and gas rate plans each contain a revenue decoupling mechanism under which the company’s actual energy delivery revenues are compared on a periodic basis, with the authorized delivery revenues and the difference accrued, with interest, for refund to, or recovery from, customers, as applicable. See “Rate Agreements” in Note B.
The NYSPSC requires utilities to record gross receipts tax revenues and expenses on a gross income statement presentation basis (i.e., included in both revenue and expense). The recovery of these taxes is generally provided for in the revenue requirement within each of the respective NYSPSC approved rate plans.
Recoverable Energy Costs
The Utilities generally recover all of their prudently incurred fuel, purchased power and gas costs, including hedging gains and losses, in accordance with rate provisions approved by the applicable state public utility commissions. If the actual energy supply costs for a given month are more or less than the amounts billed to customers for that month, the difference in most cases is recoverable from or refundable to customers. Differences between actual and billed electric and steam supply costs are generally deferred for charge or refund to customers during the next billing cycle (normally within one or two months). In addition, CECONY recovers the costs of its electric demand management program, in excess of the costs reflected in rates, as part of recoverable energy costs. For the Utilities’ gas costs, differences between actual
| 97 |
Table of Contents
and billed gas costs during the 12-month period ending each August are charged or refunded to customers during a subsequent 12-month period.
New York Independent System Operator (NYISO)
The Utilities purchase electricity through the wholesale electricity market administered by the NYISO. The difference between purchased power and related costs initially billed to the Utilities by the NYISO and the actual cost of power subsequently calculated by the NYISO is refunded by the NYISO to the Utilities, or paid to the NYISO by the Utilities. The reconciliation payments or receipts are recoverable from or refundable to the Utilities’ customers.
Certain other payments to or receipts from the NYISO are also subject to reconciliation, with shortfalls or amounts in excess of specified rate allowances recoverable from or refundable to customers. These include proceeds from the sale through the NYISO of transmission rights on CECONY’s transmission system (transmission congestion contracts or TCCs).
Sulfur Dioxide (SO 2 ) Allowances
In accordance with the federal Clean Air Act, CECONY has been allocated SO 2 emission allowances which the company may sell, trade or hold for future use. Generally, CECONY defers its proceeds from the sale of SO 2 allowances as regulatory liabilities to be applied for customer benefit. The proceeds received from the sale of SO 2 allowances are included in net cash flows from operating activities in the Companies’ consolidated statements of cash flows.
Temporary Cash Investments
Temporary cash investments are short-term, highly-liquid investments that generally have maturities of three months or less at the date of purchase. They are stated at cost, which approximates market. The Companies consider temporary cash investments to be cash equivalents.
Investments
Investments consist primarily of the investments of Con Edison’s competitive energy businesses, which are accounted for under the equity method (depending on the subsidiaries’ percentage ownership) or accounted for as leveraged leases in accordance with the accounting rules for leases. See Note J for a discussion of investments in Lease In/Lease Out transactions. Utilities’ investments are recorded at either cost or fair value and include the deferred income plan and supplemental retirement income plan trust owned life insurance assets.
Pension and Other Postretirement Benefits
The accounting rules for retirement benefits require an employer to recognize an asset or liability for the overfunded or underfunded status of its pension and other postretirement benefit plans. For a pension plan, the asset or liability is the difference between the fair value of the plan’s assets and the projected benefit obligation. For any other postretirement benefit plan, the asset or liability is the difference between the fair value of the plan’s assets and the accumulated postretirement benefit obligation. The accounting rules generally require employers to recognize all unrecognized prior service costs and credits and unrecognized actuarial gains and losses in accumulated other comprehensive income (OCI), net of tax. Such amounts will be adjusted as they are subsequently recognized as components of net periodic benefit cost or income pursuant to the current recognition and amortization provisions.
For the Utilities’ pension and other postretirement benefit plans, regulatory accounting treatment is generally applied in accordance with the accounting rules for regulated operations. Unrecognized prior service costs or credits and unrecognized actuarial gains and losses are recorded to regulatory assets or liabilities, rather than OCI. See Notes E and F.
The net periodic benefit costs are recognized in accordance with the accounting rules for retirement benefits. Investment gains and losses are recognized in expense over a 15-year period and other actuarial gains and losses are recognized in expense over a 10-year period, subject to the deferral provisions in the rate plans.
In accordance with the Statement of Policy issued by the NYSPSC and its current electric, gas and steam rate agreements, CECONY defers for payment to or
| 98 |
Table of Contents
recovery from customers the difference between such expenses and the amounts for such expenses reflected in rates. Generally, O&R also defers such difference pursuant to its rate plans. See Note B – Regulatory Matters.
The Companies calculate the expected return on pension and other retirement benefit plan assets by multiplying the expected rate of return on plan assets by the market-related value (MRV) of plan assets at the beginning of the year, taking into consideration anticipated contributions and benefit payments that are to be made during the year. The accounting rules allow the MRV of plan assets to be either fair value or a calculated value that recognizes changes in fair value in a systematic and rational manner over not more than five years. The Companies use a calculated value when determining the MRV of the plan assets that adjusts for 20 percent of the difference between fair value and expected MRV of plan assets. This calculated value has the effect of stabilizing variability in assets to which the Companies apply the expected return.
Federal Income Tax
In accordance with the accounting rules for income taxes, the Companies have recorded an accumulated deferred federal income tax liability for temporary differences between the book and tax basis of assets and liabilities at current tax rates. In accordance with rate agreements, the Utilities have recovered amounts from customers for a portion of the tax liability they will pay in the future as a result of the reversal or “turn-around” of these temporary differences. As to the remaining tax liability, in accordance with the accounting rules for regulated operations, the Utilities have established regulatory assets for the net revenue requirements to be recovered from customers for the related future tax expense. See Notes B and L. In 1993, the NYSPSC issued a Policy Statement approving accounting procedures consistent with the accounting rules for income taxes and providing assurances that these future increases in taxes will be recoverable in rates. See Note L.
Accumulated deferred investment tax credits are amortized ratably over the lives of the related properties and applied as a reduction to future federal income tax expense.
The Companies’ federal income tax returns reflect certain tax positions with which the Internal Revenue Service (IRS) does not or may not agree. See “Lease In/Lease Out Transactions” in Note J and “Uncertain Tax Positions” in Note L.
Con Edison and its subsidiaries file a consolidated federal income tax return. The consolidated income tax liability is allocated to each member of the consolidated group using the separate return method. Each member pays or receives an amount based on its own taxable income or loss in accordance with tax sharing agreements between the members of the consolidated group.
State Income Tax
Con Edison and its subsidiaries file a combined New York State Corporation Business Franchise Tax Return. Similar to a federal consolidated income tax return, the income of all entities in the combined group is subject to New York State taxation, after adjustments for differences between federal and New York law and apportionment of income among the states in which the company does business. Each member of the group pays or receives an amount based on its own New York State taxable income or loss.
Research and Development Costs
Generally research and development costs are charged to operating expenses as incurred. Research and development costs were as follows:
| For the Years Ended December 31, | ||||||||||||
| (Millions of Dollars) | 2010 | 2009 | 2008 | |||||||||
|
Con Edison |
$ | 23 | $ | 27 | $ | 29 | ||||||
|
CECONY |
$ | 21 | $ | 25 | $ | 28 | ||||||
Reclassification
Certain prior year amounts have been reclassified to conform with the current year presentation.
Earnings Per Common Share
In accordance with the accounting rules for earnings per share, Con Edison presents basic and diluted earnings per share on the face of its consolidated income statement. Basic earnings per share (EPS) are calculated by dividing earnings available to common shareholders (“Net income for common stock” on
| 99 |
Table of Contents
Con Edison’s consolidated income statement) by the weighted average number of Con Edison common shares outstanding during the period. In the calculation of diluted EPS, weighted average shares outstanding are increased for additional shares that would be outstanding if potentially dilutive securities were converted to common stock.
Potentially dilutive securities for Con Edison consist of restricted stock units, deferred stock units and stock options for which the average market price of the common shares for the period was greater than the exercise price. See Note M.
Basic and diluted EPS for Con Edison are calculated as follows:
| For the Years Ended December 31, | ||||||||||||
| (Millions of Dollars, except per share amounts/Shares in Millions) | 2010 | 2009 | 2008 | |||||||||
|
Income for common stock from continuing operations |
$ | 992 | $ | 868 | $ | 922 | ||||||
|
Income for common stock from discontinued operations, net of tax |
— | — | 274 | |||||||||
|
Net income for common stock |
$ | 992 | $ | 868 | $ | 1,196 | ||||||
|
Weighted average common shares outstanding – Basic |
284.3 | 275.2 | 272.9 | |||||||||
|
Add: Incremental shares attributable to effect of potentially dilutive securities |
1.6 | 1.1 | 0.7 | |||||||||
|
Adjusted weighted average common shares outstanding – Diluted |
285.9 | 276.3 | 273.6 | |||||||||
|
Earnings per Common Share – Basic |
||||||||||||
|
Continuing operations |
$ | 3.49 | $ | 3.16 | $ | 3.37 | ||||||
|
Discontinued operations |
— | — | 1.01 | |||||||||
|
Net income for common stock |
$ | 3.49 | $ | 3.16 | $ | 4.38 | ||||||
|
Earnings per Common Share – Diluted |
||||||||||||
|
Continuing operations |
$ | 3.47 | $ | 3.14 | $ | 3.36 | ||||||
|
Discontinued operations |
— | — | 1.01 | |||||||||
|
Net income for common stock |
$ | 3.47 | $ | 3.14 | $ | 4.37 | ||||||
The computation of diluted earnings per share excludes immaterial amounts of incremental Con Edison common shares for the years ended December 31, 2010, 2009 and 2008, respectively, because the exercise prices on the options exceeded the average closing market price during these periods.
Estimates
The preparation of financial statements in conformity with generally accepted accounting principles requires management to make estimates and assumptions that affect the reported amounts of assets and liabilities and contingent assets and liabilities at the date of the financial statements and the reported amounts of revenues and expenses during the reporting period. Actual results could differ from those estimates.
Note B — Regulatory Matters
Rate Agreements
CECONY — Electric
In March 2005, the NYSPSC approved a Joint Proposal by CECONY, the staff of the NYSPSC and other parties with respect to the rates the company can charge its customers for electric delivery service (the 2005 Electric Rate Agreement). The 2005 Electric Rate Agreement covered the three-year period April 2005 through March 2008, pursuant to which CECONY’s electric base rates were increased $104.6 million, effective April 1, 2005, and were increased an additional $220.4 million (of which $60 million was accrued over the period beginning April 1, 2006 to March 31, 2007), effective April 1, 2007. In addition, the company retained the first $60 million of auction proceeds from the sale of transmission rights on the company’s transmission system in each of the three years. The rate increases also included the amortization of certain regulatory assets and liabilities. The net effect of this amortization was a non-cash increase in electric revenues of $128 million, $173 million and $249 million in the first, second and third rate years, respectively.
The 2005 Electric Rate Agreement provided for annual reconciliations of the differences between the actual amount of transmission and distribution utility plant, net of depreciation (Net T&D) and the actual
| 100 |
Table of Contents
amount of certain operating costs experienced over the term of the agreement, as compared in each case to the amounts reflected in electric rates.
Actual Net T&D was greater than the Net T&D reflected in rates, and in accordance with the 2005 Electric Rate Agreement, the company accrued a regulatory asset and increased its revenues by the revenue requirement impact of such difference (i.e., a return on investment, depreciation and income taxes). If the actual Net T&D had been less than the Net T&D reflected in rates, the company would have accrued a regulatory liability and decreased its revenues by the revenue requirement impact of such difference. For the period from April 1, 2005 through March 31, 2008, actual Net T&D exceeded the Net T&D
reflected in rates by approximately $1.5 billion. The company accrued revenues of $50 million, $187 million and $115 million in 2008, 2007 and 2006, respectively, to reflect the revenue requirement impact of the Net T&D difference. In accordance with the 2005 Electric Rate Agreement, the regulatory assets associated with the accrued revenues were offset at the end of each rate year with a like amount of regulatory liabilities.
The NYSPSC’s March 2008 and April 2009 orders and the November 2009 Joint Proposal covering CECONY’s electric rates, discussed below, provided for the collection of a portion of the company’s electric revenues ($237 million in the rate year ended March 2009, $254 million for the rate year ending March 2010 and, beginning April 2010, $249 million on an annual basis) subject to potential refund to customers following NYSPSC review and completion of an investigation by the NYSPSC staff of the company’s capital expenditures during the April 2005 through March 2008 period covered by the 2005 Electric Rate Agreement for transmission and distribution utility plant (the 2005-2008 Capital Expenditure Review). In December 2009, the company established a $24 million regulatory liability for refund to customers with respect to this matter and recognized a $14 million (after-tax) charge in its 2009 consolidated financial statements. In March 2010, the NYSPSC issued an order approving a February 2010 Joint Proposal by the company and the NYSPSC staff relating to this matter pursuant to which the company, among other things, provided a $36 million credit to customer bills in 2010.
Under the 2005 Electric Rate Agreement, if the actual amount of pension or other postretirement benefit costs, environmental remediation costs and, if the variation exceeded 2.5 percent, property taxes or the cost of moving facilities to avoid interfering with government projects was greater than the respective amount for each such cost reflected in rates, the company would accrue a regulatory asset for the difference and defer recognition in income of the difference. If the actual amount had been less than the amount reflected in electric rates, the company would have accrued a regulatory liability for the difference and deferred recognition in income of the difference. As a result of the cost reconciliations, in 2008, the company reduced pre-tax net income by $18 million.
The 2005 Electric Rate Agreement also provided for the continuation of the rate provisions pursuant to which the company recovers its potential strandable costs and its purchased power and fuel costs from customers.
The 2005 Electric Rate Agreement included potential positive earnings adjustments (incentives) if the company met certain standards for its retail access and demand side management programs, and potential negative earnings adjustments (revenue reductions), which could have been substantial, if it did not meet certain standards for (i) frequency and duration of service interruptions; (ii) major outages; (iii) repair, removal or replacement of damaged poles, temporary shunts, street lights, traffic signals and circuit breakers; and (iv) customer service. In 2008, the company recorded an incentive for demand side management initiatives of $5 million and no other incentives or revenue reductions.
In March 2008, the NYSPSC adopted an order, issued and effective March 25, 2008, granting CECONY an electric rate increase, effective April 1, 2008, of $425 million.
The NYSPSC ruling reflected the following major items:
| • |
a return on common equity of 9.1 percent; |
| 101 |
Table of Contents
| • |
an increase to $150 million from $60 million in the level of annual revenues that, for purposes of setting rates, it is assumed the company will receive and retain from the sale of transmission rights on the company’s transmission system, with the difference between such actual revenues for the rate year and $150 million to be recoverable from or refundable to customers, as the case may be (the company accrued $36 million of revenues under this provision in 2008); |
| • |
collection of $237 million of the $425 million rate increase is subject to potential refund to customers following the 2005-2008 Capital Expenditure Review (see discussion above in this Note B of the February 2010 Joint Proposal); |
| • |
continuation of the rate provisions under which pension and other post-retirement benefit expenses and environmental remediation expenses are reconciled to amounts reflected in rates (the company deferred recognition of $25 million of expenses under these provisions in 2008); |
| • |
change to the reconciliation provisions for transmission and distribution expenditures and costs to relocate facilities to accommodate government projects, which under the NYSPSC ruling will be reconciled only to the extent actual expenditures are less than amounts reflected in rates (the company reduced revenues by $15 million under this provision in 2008); |
| • |
discontinuation of the provisions under which property taxes were reconciled to amounts reflected in rates; |
| • |
potential operations penalties of up to $152 million annually if certain customer service and system reliability performance targets are not met (the company reduced revenues by $5 million under these provisions in 2008); |
| • |
implementation of a revenue decoupling mechanism under which the company’s actual energy delivery revenues would be compared, on a periodic basis, with the authorized delivery revenues and the difference accrued, with interest, for refund to, or recovery from, customers, as applicable (the company reduced revenues by $7 million pursuant to this provision in 2008); and |
| • |
continuation of the rate provisions pursuant to which the company recovers its purchased power and fuel costs from customers. |
In April 2009, the NYSPSC adopted an order granting CECONY an electric rate increase, effective April 6, 2009, of $523 million. The NYSPSC ruling reflects the following major items:
| • |
A return on common equity of 10.0 percent, based on certain assumptions, including a common equity ratio of 48 percent and achievement by the company of unspecified austerity measures required by the NYSPSC that would result in avoided revenue requirements of $60 million; |
| • |
continuation of the revenue decoupling mechanism (in 2009, the company increased revenues by $122 million pursuant to this mechanism and the corresponding provision of the March 2008 rate order); |
| • |
a decrease to $120 million from $150 million in the level of annual revenues that, for purposes of setting rates, it is assumed the company will receive and retain from the sale of transmission rights on the company’s transmission system, with the difference between such actual revenues for the rate year and $120 million to be recoverable from or refundable to customers, as the case may be (in 2009, the company accrued $7 million of revenues under this provision and the corresponding provision of the March 2008 rate order); |
| • |
reconciliation of the actual amount of pension and other postretirement benefit costs, environmental remediation expenses, property taxes and the cost of long-term debt to amounts reflected in rates (in 2009, the company deferred recognition of $36.4 million of expenses under these provisions and the corresponding provisions of the March 2008 rate order); |
| • |
if actual generation, transmission, distribution and shared service plant expenditures (other than removal |
| 102 |
Table of Contents
|
costs) and capital costs incurred to relocate facilities to accommodate government projects are less than amounts reflected in rates for the respective category of expenditures, the company will accrue a regulatory liability and reduce its revenues by the revenue requirement impact of the difference (i.e., return on investment, depreciation and income taxes) (in 2009, the company did not reduce revenues under these provisions and the corresponding provisions of the March 2008 rate order); |
| • |
collection of a surcharge (in addition to the electric rate increase) from customers in connection with an increase (estimated at $198 million), effective April 2009, in a New York State assessment; |
| • |
continuation of provisions for potential operations penalties of up to $152 million annually if certain customer service and system reliability performance targets are not met (in 2009, the company did not reduce revenues under these provisions and the corresponding provisions of the March 2008 rate order); |
| • |
continuation of the collection of a portion (increased, to reflect higher capital costs, from $237 million collected in the rate year ended March 2009 to $254 million for the rate year ending March 2010) of the April 2008 rate increase subject to potential refund to customers following the 2005-2008 Capital Expenditure Review (see discussion above in this Note B of the February 2010 Joint Proposal). The portion collected is also subject to refund in the event the NYSPSC determines that some disallowance of costs the company has recovered is warranted to address potential impacts of alleged unlawful conduct by arrested employees and contractors (see “Other Regulatory Matters” below in this Note B and “Investigations of Vendor Payments” in Note H). |
| • |
continuation of the rate provisions pursuant to which the company recovers its purchased power and fuel costs from customers. |
In May 2009, the company filed with the NYSPSC the company’s plan with respect to austerity measures that would reduce the company’s revenue requirements during the rate year ending March 31, 2010 by $60 million. The company’s austerity plans include reductions in labor costs, including compensation and other employee benefits, deferral of expenditures for capital projects and operating and maintenance programs and other initiatives. These reductions collectively represent $47 million of the $60 million reduction sought by the NYSPSC. In May 2009, the company filed with the NYSPSC a request for rehearing of the NYSPSC’s April 2009 order with respect to its austerity provisions and certain other matters. The February 2010 Joint Proposal (discussed above in Note B) provides for the company to withdraw this request.
In November 2009, CECONY, the NYSPSC staff and other parties entered into a Joint Proposal with respect to the company’s May 2009 request to the NYSPSC for an increase in the rates the company can charge its customers for electric delivery service. The Joint Proposal, which was approved in March 2010, covers the three-year period April 2010 through March 2013 and provides for electric base rate increases of $420 million, effective April 2010 and 2011, and $287 million, effective April 2012, with an additional $133 million to be collected through a surcharge in the rate year ending March 2013.
The Joint Proposal reflects the following major items:
| • |
A weighted average cost of capital of 7.76 percent, reflecting: |
| • |
return on common equity of 10.15 percent, assuming achievement by the company of unspecified austerity measures that would result in reductions in operations and maintenance expenses of $27 million, $20 million and $13 million in the rate years ending March 2011, 2012 and 2013, respectively; |
| • |
cost of long-term debt of 5.65 percent; |
| • |
common equity ratio of 48 percent; and |
| • |
average rate base of $14,887 million, $15,987 million and $16,826 million for the rate years ending March 2011, 2012 and 2013, respectively. |
| 103 |
Table of Contents
| • |
Deferral as a regulatory liability of the revenue requirement impact (i.e., return on investment, depreciation and income taxes) of the amount, if any, by which (A) actual average net plant balances allocable to the company’s electric business for (i) transmission and distribution, excluding municipal infrastructure support (T&D), (ii) generation, shared services and, subject to certain adjustments, municipal infrastructure support (Other) and (iii) a finance and supply chain enterprise resource project (ERP) are less than (B) amounts reflected in rates for the respective category for each rate year. The amounts reflected in rates are: |
| Rate Year Ending March 31, | ||||||||||||
| (Millions of Dollars) | 2011 | 2012 | 2013 | |||||||||
|
T&D |
$ | 13,818 | $ | 14,742 | $ | 15,414 | ||||||
|
Other |
1,487 | 1,565 | 1,650 | |||||||||
|
ERP |
— | 25 | 115 | |||||||||
| • |
Any deferral for T&D and Other for the rate year ending March 2011 will be based on average net plant balances for the year and for the rate years ending March 2012 and 2013 will be based on average net plant balances over the term of the Joint Proposal. |
| • |
Any deferral for ERP would be based on average net plant balances for ERP over the term of the Joint Proposal. |
| • |
During the term of the Joint Proposal, the company will not accrue any additional revenue for carrying charges on any capital expenditures allocable to its electric business in excess of specified limits (which limits exclude certain expenditures, including expenditures for projects for which the company has been selected to receive grants under the American Recovery and Reinvestment Act of 2009): |
| • |
T&D capital expenditures – $1,200 million for the rate year ending March 2011 and an aggregate $2,300 million for the period from April 2011 through March 2013; |
| • |
Other capital expenditures – $220 million for the rate year ending March 2011 and an aggregate $402 million for the period from April 2011 through March 2013; and |
| • |
ERP capital expenditures – $125 million. |
| • |
The company is not precluded from seeking to recover in rates effective after March 2013 the annual revenue requirement for T&D and Other capital expenditures made during the term of the Joint Proposal in excess of the applicable capital expenditure limit; provided that: |
| • |
the company can justify the need for and reasonableness of, and the company’s inability to reasonably avoid, such excess capital expenditures; and |
| • |
the return on investment for any such excess T&D or Other capital expenditures made during the rate year ending March 2011 will be calculated based on the company’s overall cost of debt. |
| • |
Sharing with electric customers of any actual earnings, excluding the effects of any penalties and certain other items, above specified percentage returns on equity (based on actual average common equity ratio, subject to a 50 percent maximum) as follows: |
| • |
for the rate year ending March 2011, the company will allocate to customers the revenue requirement equivalent of 50 percent of earnings above 11.15 percent up to and including 12.149 percent, 75 percent of earnings equal to or in excess of 12.15 percent up to and including 13.149 percent and 90 percent of earnings equal to or in excess of 13.15 percent; |
| • |
for the rate years ending March 2012 and 2013, the company will allocate to customers the revenue requirement equivalent of 60 percent of the earnings, calculated on a cumulative basis for such years, in excess of 10.65 percent up to and including 12.149 percent, 75 percent of such cumulative earnings equal to or in excess of 12.15 percent up to and including 13.149 percent and 90 percent of such cumulative earnings equal to or in excess of 13.15 percent; |
| • |
the customers’ share of any such earnings and 50 percent of the company’s share would be applied to reduce regulatory assets for pensions and other |
| 104 |
Table of Contents
|
post-retirement benefits and other costs; and |
| • |
in the event the company does not file for a rate increase to take effect in April 2013, the earnings sharing levels for the rate year ending March 2013 will continue in effect, calculated on an annual basis, until base rates are reset by the NYSPSC. |
| • |
Deferral as a regulatory asset or liability, as the case may be, of differences between the actual level of certain expenses, including, among others, expenses for pension and other postretirement benefits, environmental remediation, relocation of facilities to accommodate government projects, property taxes and (for the rate years ending March 2012 and 2013) long-term debt, and amounts for those expenses reflected in rates (with deferral for the difference in property taxes limited to 80 percent of the difference, subject to annual maximum for the remaining 20 percent of the difference of not more than a 10 basis point impact on return on common equity and deferral of facility relocation expenses in excess amounts reflected in rates subject to certain limitations). In 2010, the company deferred recognition of $68 million of revenue under these provisions and the corresponding provisions of the April 2009 rate order. |
| • |
Continuation of the provisions in the April 2009 order relating to revenues from the sale of transmission rights on the company’s transmission system. In 2010, the company accrued $9 million of revenues under this provision and the corresponding provision of the April 2009 rate order. |
| • |
Continuation of the revenue decoupling mechanism under which the company’s actual electric delivery revenues would be compared, on a periodic basis, with the delivery revenues reflected in rates, and the difference accrued as a regulatory liability (for refund to electric customers) or a regulatory asset (for recovery from electric customers), as the case may be. In 2010, the company deferred for customer benefit $130 million of revenues under this provision and the corresponding provision of the April 2009 rate order. |
| • |
Continuation of the rate provisions pursuant to which the company recovers its purchased power and fuel costs from electric customers. |
| • |
Continuation of provisions for potential operations penalties of up to $152 million annually if certain electric customer service and system reliability performance targets are not met. In 2010 and 2009, the company did not recognize any expenses under these provisions and the corresponding provisions of the April 2009 order. |
| • |
Collection from electric customers of $249 million on an annual basis subject to potential refund following the 2005-2008 Capital Expenditure Review (see discussion above in this Note B of the February 2010 Joint Proposal). The amount to be collected would also be subject to refund in the event the NYSPSC determined that some disallowance of costs the company has recovered is warranted to address potential impacts of alleged unlawful conduct by arrested employees and contractors (see “Other Regulatory Matters” below in this Note B and “Investigations of Vendor Payments” in Note H). |
O&R — Electric
In October 2007, the NYSPSC issued an order that continued O&R’s rates for electric service rendered in New York at current levels. The order, which was based on an allowed annual rate of return on common equity of 9.1 percent increased, effective July 1, 2007, by $13.1 million annually the amount recognized for pension and other postretirement benefit costs. Because O&R, in accordance with applicable New York regulatory provisions, defers the difference between the actual amount of such costs and the amounts for such costs reflected in rates, the effect of the increase was to decrease the company’s deferrals of such costs and increase other operations and maintenance expense by a like amount. As required by the order, the company also reduced other operating revenues and recorded a regulatory liability of $3 million for earnings attributable to its New York electric business in excess of a 9.1 percent annual rate of return on common equity applicable to the period March through June
| 105 |
Table of Contents
2007. In June 2007, O&R commenced an action in New York State Supreme Court seeking to annul the March 2007 NYSPSC order that initiated the proceeding in which the October 2007 order was issued.
In July 2008, the NYSPSC approved a Joint Proposal among O&R, the NYSPSC staff and other parties for the rates O&R can charge its New York customers for electric service from July 2008 through June 2011. The rate plan approved by the NYSPSC provides for electric rate increases of $15.6 million, $15.6 million and $5.7 million effective July 1, 2008, 2009 and 2010, respectively, and the collection of an additional $9.9 million during the 12-month period beginning July 1, 2010.
The Joint Proposal reflected the following major items:
| • |
an annual return on common equity of 9.4 percent; |
| • |
most of any actual earnings above a 10.2 percent return on equity (based on actual average common equity ratio, subject to a 50 percent maximum) are to be applied to reduce regulatory assets for pension and other post-retirement benefit expenses (the company did not reduce regulatory assets under this provision in 2010, 2009 or 2008); |
| • |
deferral as a regulatory asset or regulatory liability, as the case may be, of the difference between actual pension and other post-retirement benefit expenses, environmental remediation expenses, property taxes, tax-exempt debt costs and certain other expenses and amounts for those expenses reflected in rates (the company deferred recognition of $0.7 million revenue and $3 million and $6 million of expenses under this provision in 2010, 2009 and 2008, respectively); |
| • |
deferral as a regulatory liability of the revenue requirement impact (i.e., return on investment, depreciation and income taxes) of the amount, if any, by which actual transmission and distribution related capital expenditures are less than amounts reflected in rates (the company deferred $12 million, $8 million and $1 million of expenses under this provision in 2010, 2009 and 2008, respectively); |
| • |
deferral as a regulatory asset of increases, if any, in certain expenses above a 4 percent annual inflation rate, but only if the actual annual return on common equity is less than 9.4 percent (the company did not defer any expenses under this provision in 2009 or 2008); |
| • |
potential negative earnings adjustments of up to $3 million annually if certain customer service and system reliability performance targets are not met (the company reduced revenues by $0.4 million under these provisions in 2008; the company met the performance targets in 2009; the company reduced revenues by $1 million under these provisions in 2010); |
| • |
implementation of a revenue decoupling mechanism under which actual energy delivery revenues would be compared, on a periodic basis, with the authorized delivery revenues with the difference accrued, with interest, for refund to, or recovery from, customers, as applicable (the company accrued $5.0 million, $12.4 million and $3.6 million of revenues pursuant to this provision in 2010, 2009 and 2008, respectively); |
| • |
continuation of the rate provisions pursuant to which the company recovers its purchased power costs from customers; and |
| • |
withdrawal of the litigation O&R commenced seeking to annul the NYSPSC’s March and October 2007 orders relating to O&R’s electric rates. |
In July 2010, O&R filed a request with the NYSPSC for an increase in the rates it charges for electric service rendered in New York, effective July 2011, of $61.7 million. The filing reflects a return on common equity of 11 percent and a common equity ratio of 49.9 percent. Among other things, the filing proposes continuation of the current provisions with respect to recovery from customers of the cost of purchased power and with respect to the deferral of differences between actual expenses allocable to the electric business for pensions and other postretirement benefits, environmental, and research and developmental costs to the amounts for such costs reflected in electric rates. The filing also includes an alternative proposal for a
| 106 |
Table of Contents
three-year electric rate plan with annual rate increases of $47.1 million effective July 2011, and $33.2 million effective July 2012 and 2013. The multi-year filing reflects a return on common equity of 11.55 percent.
In March 2007, the New Jersey Board of Public Utilities (NJBPU) approved a three-year electric base rate plan for Rockland Electric Company (RECO), O&R’s New Jersey regulated utility subsidiary that went into effect on April 1, 2007. The plan provides for a $6.4 million rate increase during the first year, with no further increase during the final two years. The plan reflects a return on common equity of 9.75 percent and a common equity ratio of 46.5 percent of capitalization.
In May 2010, RECO, the Division of Rate Counsel, Staff of the NJBPU and certain other parties entered into a stipulation of settlement with respect to the company’s August 2009 request to increase the rates that it can charge its customers for electric delivery service. The stipulation, which was approved by the Board of the NJBPU, provides for an electric rate increase, effective May 17, 2010, of $9.8 million. The stipulation reflects a return on common equity of 10.3 percent and a common equity ratio of approximately 50 percent. The stipulation continues current provisions with respect to recovery from customers of the cost of purchased power and does not provide for reconciliation of actual expenses to amounts reflected in electric rates for pension and other postretirement benefit costs.
CECONY — Gas
In September 2007, the NYSPSC approved the Joint Proposal that CECONY had entered into in June 2007 with the staff of the NYSPSC and other parties with respect to the rates the company can charge its customers for gas service. The Joint Proposal had provided for rate increases of $84.6 million, $32.7 million and $42.7 million, effective October 1, 2007, 2008 and 2009, respectively, along with annual funding for new energy efficiency programs of $14 million. The NYSPSC modified the Joint Proposal to provide for levelized annual rate increases of $67.5 million in each year of the three year rate plan.
The Joint Proposal continues the previous gas rate plan provisions with respect to recovery from customers of the cost of purchased gas and environmental remediation expenses and corresponding provisions pursuant to which the effects of weather on gas income are moderated and for the reconciliation of actual expenses allocable to the gas business to the amounts for such costs reflected in gas rates for pension and other postretirement benefit costs, property taxes and interference costs. Additional provisions of the gas rate plan include: a revenue decoupling mechanism (pursuant to which the company accrued $24 million, $25 million, and $17 million of revenues in 2010, 2009, and 2008, respectively) and equal sharing with customers of earnings above a 10.7 percent return on common equity (earnings for the rate years ended September 30, 2010, 2009 and 2008 were reduced $6 million, $0 and $9 million, respectively, for earnings above the 10.7 percent threshold).
In May 2010, CECONY, the staff of the NYSPSC and other parties entered into a Joint Proposal, with respect to the company’s rates for gas delivery service. The Joint Proposal, which was approved by the NYSPSC in September 2010, covers the three-year period October 2010 through September 2013 and provides for gas base rate increases of $47.1 million, $47.9 million and $46.7 million, effective October 2010, 2011 and 2012, respectively. The Joint Proposal reflects the following major items:
| • |
A weighted average cost of capital of 7.46 percent, reflecting: |
| • |
return on common equity of 9.6 percent, assuming achievement by the company of cost avoidance for productivity and “austerity”. The unspecified austerity measures assume reductions in costs of $6 million, $4 million and $2 million in the rate years ending September 2011, 2012 and 2013, respectively; |
| • |
cost of long-term debt of 5.57 percent; |
| • |
common equity ratio of 48 percent; and |
| • |
average rate base of $3,027 million, $3,245 million and $3,434 million for the rate years ending September 2011, 2012 and 2013, respectively. |
| 107 |
Table of Contents
| • |
Deferral as a regulatory liability of the revenue requirement impact (i.e., return on investment, depreciation and income taxes) of the amount, if any, by which actual average net plant balances allocable to the company’s gas business are less than the amounts reflected in rates: $2,934 million, $3,148 million and $3,346 million for the rate years ending September 2011, 2012 and 2013, respectively. |
| • |
Sharing with gas customers of any actual earnings, excluding the effects of any penalties and certain other items, above specified percentage returns on equity (based on actual average common equity ratio, subject to a 50 percent maximum), on a cumulative basis over the term of the Joint Proposal, calculated as follows: |
| • |
for the rate year ending September 2011, the company will allocate to customers the revenue requirement equivalent of 60 percent of earnings above 10.35 percent up to and including 11.59 percent, 75 percent of earnings equal to or in excess of 11.6 percent up to and including 12.59 percent and 90 percent of earnings equal to or in excess of 12.6 percent; |
| • |
for the rate years ending September 2012 and 2013, the company will allocate to customers the revenue requirement equivalent of 60 percent of the earnings in excess of 10.1 percent up to and including 11.59 percent, 75 percent of such earnings equal to or in excess of 11.6 percent up to and including 12.59 percent and 90 percent of such earnings equal to or in excess of 12.6 percent; |
| • |
the customers’ share of any such earnings and 50 percent of the company’s share, appropriately adjusted for taxes, would be applied to reduce regulatory assets for pensions and other post-retirement benefits and other costs; and |
| • |
in the event the company does not file for a rate increase to take effect in October 2013, the earnings sharing levels for the rate year ending September 2013 will continue in effect, implemented on an annual basis, until base rates are reset by the NYSPSC. |
| • |
Deferral as a regulatory asset or liability, as the case may be, of differences between the actual level of certain expenses, including, among others, expenses for pension and other postretirement benefits, environmental remediation, property taxes and long-term debt, and amounts for those expenses reflected in rates (with deferral for the difference in property taxes limited to 80 percent of the difference, subject to annual maximum for the remaining 20 percent of the difference of not more than the equivalent in revenue requirement of a 10 basis point impact on return on common equity). |
| • |
Continuation of provisions pursuant to which the company will retain net revenues from non-firm customer transactions. In each year of the rate plan, the company will retain up to $58 million of any such revenues and 25 percent of any such revenues above $58 million. If such revenues are below $58 million in a rate year, the company will accrue a regulatory asset equal to (A) the amount by which such revenues are less than $33 million plus (B) 80 percent of the difference between $58 million and the level of such revenues at or above $33 million. |
| • |
Continuation of the provisions pursuant to which the effects of weather on gas delivery revenues during each billing cycle are reflected in customer bills for that billing cycle, and a revenue decoupling mechanism under which the company’s actual gas delivery revenues, inclusive of any such weather adjustment, would be compared, on a periodic basis, with the delivery revenues reflected in rates, with the difference accrued as a regulatory liability (for refund to gas customers) or a regulatory asset (for recovery from gas customers), as the case may be. |
| • |
Continuation of the rate provisions pursuant to which the company recovers its costs of purchased gas from gas customers. |
| • |
Continuation of provisions for potential penalties (up to $12.6 million annually) if certain gas customer service and system performance targets are not met. |
| 108 |
Table of Contents
| • |
Continued collection from gas customers of $32 million on an annual basis subject to potential refund (see “Other Regulatory Matters” below and “Investigations of Vendor Payments” in Note H). |
O&R — Gas
In October 2006, the NYSPSC approved the June 2006 settlement agreement among O&R, the staff of the NYSPSC and other parties. The settlement agreement established a rate plan that covered the three-year period November 1, 2006 through October 31, 2009. The rate plan provided for rate increases in base rates of $12 million in the first year, $0.7 million in the second year and $1.1 million in the third year. To phase-in the effect of the increase for customers, the rate plan provided for O&R to accrue revenues for, but defer billing to customers of, $5.5 million of the first rate year rate increase by establishing a regulatory asset which, together with interest, was billed to customers in the second and third years. As a result, O&R’s billings to customers increased $6.5 million in each of the first two years and $6.3 million in the third. The first year rate increase included $2.3 million relating to a change in the way customers are provided the benefit of non-firm revenue from sales of pipeline transportation capacity. Under the prior rate plan, base rates were reduced to reflect the assumption that the company would realize these revenues. Under the 2006 rate plan, such revenues were used to offset the cost of gas to be recovered from customers. The rate plan continued the provisions pursuant to which the company recovers its cost of purchasing gas and the provisions pursuant to which the effects of weather on gas income are moderated.
The rate plan provided that if the actual amount of pension or other postretirement benefit costs, environmental remediation costs, property taxes and certain other costs vary from the respective amount for each such cost reflected in gas rates (cost reconciliations), the company would defer recognition of the variation in income and, as the case may be, establish a regulatory asset or liability for recovery from, or refund to, customers of the variation (86 percent of the variation, in the case of property tax differences due to assessment changes).
Earnings attributable to its gas business excluding any revenue reductions (O&R Adjusted Earnings) in excess of an 11 percent annual return on common equity (based upon the actual average common equity ratio, subject to a maximum 50 percent of capitalization) were to be allocated as follows: above an 11 percent return were to be used to offset up to one-half of any regulatory asset to be recorded in that year resulting from the cost reconciliations (discussed in the preceding paragraph). One-half of any remaining O&R Adjusted Earnings between 11 and 12 percent return were to be retained by the company, with the balance deferred for the benefit of customers. Thirty-five percent of any remaining O&R Adjusted Earnings between a 12 and 14 percent return were to be retained by the company, with the balance deferred for the benefit of customers. Any remaining O&R Adjusted Earnings above a 14 percent return were to be deferred for the benefit of customers. For purposes of these earnings sharing provisions, if in any rate year O&R Adjusted Earnings was less than 11 percent, the shortfall was deducted from O&R Adjusted Earnings for the other rate years. The earnings sharing thresholds were to each be reduced by 20 basis points if certain objectives relating to the company’s retail choice program are not met. O&R adjusted earnings were not in excess of the 11 percent target return on equity for the rate years ended October 31, 2009, and 2008.
The rate plan also included up to $1 million of potential earnings adjustments in the first year of the agreement, increasing up to $1.2 million, if the company did not comply with certain requirements regarding gas main protection and customer service. O&R recorded a regulatory liability of $0.4 million for not complying with certain requirements regarding safety and customer service for the rate years ended October 31, 2008. The company met these requirements for the rate year ended October 31, 2009.
In October 2009, the NYSPSC adopted a June 2009 Joint Proposal among O&R, NYSPSC staff and other parties. As approved, the Joint Proposal establishes a gas rate plan that covers the three-year period November 1, 2009 through October 31, 2012 and provides for increases in base rates of $9 million in each of the first two years and $4.6 million in the third year,
| 109 |
Table of Contents
with an additional $4.3 million to be collected through a surcharge in the third rate year. The rate plan reflects the following major items:
| • |
an annual return on common equity of 10.4 percent; |
| • |
most of any actual earnings above an 11.4 percent annual return on common equity (based upon the actual average common equity ratio, subject to a maximum 50 percent of capitalization) are to be applied to reduce regulatory assets. in 2010, the company did not defer any revenues under this provision and the corresponding provision; |
| • |
deferral as a regulatory asset or liability, as the case may be, of differences between the actual level of certain expenses, including expenses for pension and other postretirement benefits, environmental remediation, property taxes and taxable and tax-exempt long-term debt, and amounts for those expenses reflected in rates; in 2010, the company accrued $2.7 million of revenues under this provision and the corresponding provision; |
| • |
deferral as a regulatory liability of the revenue requirement impact (i.e., return on investment, depreciation and income taxes) of the amount, if any, by which average gas net plant balances are less than balances reflected in rates in 2010, the company accrued $1.5 million of revenues under this provision and the corresponding provision; |
| • |
deferral as a regulatory asset of increases, if any over the course of the rate plan, in certain expenses above a 4 percent annual inflation rate, but only if the actual annual return on common equity is less than 10.4 percent; |
| • |
implementation of a revenue decoupling mechanism; in 2010, the company accrued $0.8 million of revenues under this provision and the corresponding provision; |
| • |
continuation of the provisions pursuant to which the company recovers its cost of purchasing gas and the provisions pursuant to which the effects of weather on gas income are moderated; and |
| • |
potential negative earnings adjustments of up to $1.4 million annually if certain operations and customer service requirements are not met. |
CECONY — Steam
In September 2006, the NYSPSC approved the June 2006 settlement agreement among CECONY, the staff of the NYSPSC and other parties. The settlement agreement established a rate plan that covered the two-year period October 1, 2006 through September 30, 2008. The rate plan provided for no changes in base rates or in the rate provisions pursuant to which the company recovers its fuel and purchased steam costs (the fuel adjustment clause), except for changes in the manner in which certain costs are recovered.
The rate plan provided that if the actual amount of pension or other postretirement benefit costs, environmental remediation costs, property taxes or interference costs is greater than the respective amount for each such cost reflected in steam rates, the company would recognize a regulatory asset for the difference (90 percent of the difference, in the case of property taxes and interference costs) and defer recognition in expense of the difference. If the actual amount of such costs had been less than the amount reflected in steam rates, the company would recognize a regulatory liability for the difference and decrease its revenues by the amount of such difference (90 percent of the difference, in the case of property taxes and interference costs). The company recognized a regulatory liability and increased expenses by $1.7 million under this provision in 2008.
Earnings attributable to the steam business, excluding the net revenue effect of steam sales related to colder-than-normal weather and certain other items, (Steam Adjusted Earnings) for a rate year in excess of 11 percent return on common equity (based upon the actual average common equity ratio, subject to a maximum of 50 percent of capitalization) were allocated as follows: between 11 and 12 percent were to be used first to offset up to one-half of any regulatory asset recorded in the year resulting from the cost reconciliations (discussed in the preceding paragraph) for the rate year. The company then could retain one-half of any remaining such Steam Adjusted Earnings, with the balance being deferred for the benefit of customers. Any Steam Adjusted Earnings in excess of a 12 percent return on common equity were
| 110 |
Table of Contents
to be used first to offset any regulatory asset resulting from the cost reconciliations, with the company retaining one-quarter of any remaining Steam Adjusted Earnings and the balance being deferred for the benefit of customers. The earnings sharing thresholds would each be reduced by 20 basis points if certain requirements are not met. Earnings for the rate year ended September 30, 2008 was below the 11 percent return on common equity.
The rate plan also included up to approximately $4 million of potential revenue reductions if the company did not comply with certain requirements regarding steam business development and certain other matters. There was no revenue reductions recorded for the rate year ending September 30, 2008.
In September 2008, the NYSPSC approved the June 2008 Joint Proposal among the company, the NYSPSC staff and other parties with respect to the rates the company can charge its customers for steam service. The Joint Proposal covers the period from October 1, 2008 through September 30, 2010. The Joint Proposal provides for steam rate increases of $43.7 million effective October 1, 2008 and 2009.
The Joint Proposal reflects the following major items:
| • |
an annual return on common equity of 9.3 percent; |
| • |
any actual earnings above a 10.1 percent return on equity (based on actual average common equity ratio, subject to a 50 percent maximum) are to be shared as follows: half will be deferred for the benefit of customers and the other half is to be retained by the company (with half of the company’s share subject to offset to reduce any regulatory assets for under-collections of property taxes) (earnings for the rate year ended September 30, 2009 did not exceed a 10.1 percent return on equity); |
| • |
deferral as a regulatory asset or regulatory liability, as the case may be, of the difference between (i) actual costs for pension and other post-retirement benefits, environmental remediation, property taxes, certain tax-exempt debt, municipal infrastructure support and certain other costs and (ii) amounts for those costs reflected in rates (90 percent of the difference in the case of property taxes and interference costs) (the company decreased expenses by $14.9 million and by $14.4 million and increased expenses by $3.1 million under these provisions in 2010, 2009 and 2008, respectively); |
| • |
deferral as a regulatory liability of the revenue requirement impact (i.e., return on investment, depreciation and income taxes) of the amount, if any, by which the actual capital expenditures related to steam production plant are less than amounts reflected in rates (there was no regulatory liability recorded for the rate year ended September 30, 2009 and $4 million regulatory liability recorded for the rate year ended September 30, 2010); |
| • |
potential negative earnings adjustments (revenue reductions) of approximately $0.95 million to $1 million annually if certain business development, customer service and safety performance targets are not met (the company did not record any such adjustments in 2008) (there were no negative earnings adjustments recorded for the rate year ended September 30, 2010 and 2009); |
| • |
amortization of certain regulatory assets and liabilities, the net effect of which will be a non-cash increase in steam revenues of $20.3 million over the two-year period covered by the Joint Proposal; and |
| • |
continuation of the rate provisions pursuant to which the company recovers its fuel and purchased steam costs from customers. |
In May 2010, CECONY, the NYSPSC staff and other parties entered into a Joint Proposal, with respect to the company’s rates for steam service. The Joint Proposal, which was approved by the NYSPSC in September 2010, covers the three-year period October 2010 through September 2013 and provides for rate increases of $49.5 million, effective October 2010 and 2011, and $17.8 million, effective October 2012, with an additional $31.7 million to be collected through a surcharge in the rate year ending September 2013. The Joint Proposal reflects the following major items:
| • |
The same weighted average cost of capital, return on common equity (assuming, for the steam business, |
| 111 |
Table of Contents
|
achievement of unspecified reductions in costs of $4.5 million, $3 million and $1.5 million in the rate years ending September 2011, 2012 and 2013, respectively), cost of long-term debt and common equity ratio provided for in the May 2010 Joint Proposal with respect to CECONY’s gas business (discussed above) and average steam rate base of $1,589 million, $1,603 million and $1,613 million for the rate years ending September 2011, 2012 and 2013, respectively. |
| • |
Deferral as a regulatory liability of the revenue requirement impact of the amount, if any, by which actual average net plant balances allocable to the company’s steam business are less than the amounts reflected in rates for the respective category for each rate year. The amounts reflected in rates are: |
| Rate Year Ending September 30, | ||||||||||||
| (Millions of Dollars) | 2011 | 2012 | 2013 | |||||||||
|
Steam production |
$ | 415 | $ | 426 | $ | 433 | ||||||
|
Steam distribution |
521 | 534 | 543 | |||||||||
| • |
Earnings sharing, expense deferral and potential refund ($6 million annually for steam) provisions as discussed above with respect to CECONY’s gas business. |
| • |
Continuation of the rate provisions pursuant to which the company recovers its cost of fuel and purchased steam from its steam customers. |
| • |
Continuation of provisions for potential penalties (up to approximately $1 million annually) if certain steam customer service and system performance targets are not met. |
The NYSPSC order requires CECONY, in its next steam rate filing, to propose a phase-in over a period of not more than seven years of an increase in the allocation to steam customers of the fuel costs for the company’s East River Repowering Project (ERRP, which cogenerates electricity and steam) that are above the market value of the electric energy generated by ERRP.
Other Regulatory Matters
In February 2009, the NYSPSC commenced a proceeding to examine the prudence of certain CECONY expenditures (see “Investigations of Vendor Payments” in Note H). Pursuant to NYSPSC orders, a portion of the company’s revenues (currently, $249 million, $32 million and $6 million on an annual basis for electric, gas and steam service, respectively) is being collected subject to potential refund to customers. At December 31, 2010, the company had collected an estimated $535 million from customers subject to potential refund in connection with this proceeding. In October 2010, a NYSPSC consultant reported its $21 million provisional assessment, which the company has disputed, of potential overcharges for construction work. The potential overcharges related to transactions that involved certain employees who were arrested and a contractor that performed work for the company. The NYSPSC’s consultant is expected to continue to review the company’s expenditures. The company is unable to estimate the amount, if any, of any such refund and, accordingly, has not established a regulatory liability for a refund.
In August 2009, the NYSPSC released a report on its management audit of the company. The NYSPSC is required to audit New York utilities every five years. The NYSPSC consultant that performed the audit identified areas for improvement, including with respect to the company’s construction program, planning and business processes and regulatory relationships. In October 2009, the company filed with the NYSPSC the company’s plan to implement the recommendations contained in the report. The company has implemented most of the recommendations.
| 112 |
Table of Contents
Regulatory Assets and Liabilities
Regulatory assets and liabilities at December 31, 2010 and 2009 were comprised of the following items:
| Con Edison | CECONY | |||||||||||||||
| (Millions of Dollars) | 2010 | 2009 | 2010 | 2009 | ||||||||||||
|
Regulatory assets |
||||||||||||||||
|
Unrecognized pension and other postretirement costs |
$ | 4,371 | $ | 4,472 | $ | 4,152 | $ | 4,259 | ||||||||
|
Future federal income tax |
1,593 | 1,316 | 1,515 | 1,249 | ||||||||||||
|
Environmental remediation costs |
695 | 392 | 574 | 333 | ||||||||||||
|
Surcharge for New York State Assessment |
121 | 138 | 112 | 126 | ||||||||||||
|
Net electric deferrals |
156 | 82 | 156 | 82 | ||||||||||||
|
Pension and other post-retirement benefits deferrals |
138 | 101 | 90 | 49 | ||||||||||||
|
Revenue taxes |
145 | 120 | 140 | 116 | ||||||||||||
|
Deferred derivative losses – long-term |
74 | 106 | 48 | 75 | ||||||||||||
|
Deferred storm costs |
57 | 5 | 43 | — | ||||||||||||
|
Property tax reconciliation |
34 | 85 | 27 | 85 | ||||||||||||
|
O&R transition bond charges |
48 | 55 | — | — | ||||||||||||
|
World Trade Center restoration costs |
45 | 41 | 45 | 41 | ||||||||||||
|
Workers’ compensation |
31 | 37 | 31 | 37 | ||||||||||||
|
Other |
135 | 153 | 125 | 138 | ||||||||||||
|
Regulatory assets – long-term |
7,643 | 7,103 | 7,058 | 6,590 | ||||||||||||
|
Deferred derivative losses – current |
190 | 141 | 151 | 104 | ||||||||||||
|
Recoverable energy costs – current |
13 | 31 | — | — | ||||||||||||
|
Regulatory assets – current |
203 | 172 | 151 | 104 | ||||||||||||
|
Total Regulatory Assets |
$ | 7,846 | $ | 7,275 | $ | 7,209 | $ | 6,694 | ||||||||
|
Regulatory liabilities |
||||||||||||||||
|
Allowance for cost of removal less salvage |
$ | 422 | $ | 371 | $ | 350 | $ | 303 | ||||||||
|
Net unbilled revenue deferrals |
136 | 91 | 136 | 91 | ||||||||||||
|
Refundable energy costs |
80 | 118 | 50 | 77 | ||||||||||||
|
Revenue decoupling mechanism |
32 | — | 32 | — | ||||||||||||
|
New York State tax refund |
30 | — | 30 | — | ||||||||||||
|
Gain on sale of properties |
29 | 24 | 29 | 24 | ||||||||||||
|
Rate case amortizations |
— | 21 | — | 21 | ||||||||||||
|
Electric rate case deferral |
— | 19 | — | 19 | ||||||||||||
|
2005-2008 capital expenditure reserve |
— | 24 | — | 24 | ||||||||||||
|
Other |
186 | 161 | 156 | 144 | ||||||||||||
|
Regulatory liabilities |
915 | 829 | 783 | 703 | ||||||||||||
|
Deferred derivative gains – current |
4 | 9 | 3 | 8 | ||||||||||||
|
Total Regulatory Liabilities |
$ | 919 | $ | 838 | $ | 786 | $ | 711 | ||||||||
“Unrecognized pension and other postretirement costs” represents the net regulatory asset associated with the accounting rules for retirement benefits. See Note A.
“Net electric deferrals” represents the remaining unamortized balance of certain regulatory assets and liabilities of CECONY that were combined effective April 1, 2010 and are being amortized to income over a ten year period, in accordance with CECONY’s March 2010 rate plan.
The increase in Regulatory Assets – Environmental Remediation Costs reflects an increased estimate of costs for site investigation and remediation. See Note G.
“Revenue taxes” represents the timing difference between taxes collected and paid by the Utilities to fund mass transportation.
Effective March 31, 2009, the NYSPSC authorized CECONY to accrue unbilled electric, gas and steam revenues. At December 31, 2009, CECONY has deferred the net margin on the unbilled revenues for the future benefit of customers by accruing an asset of $413 million for unbilled revenues, recording refundable energy cost regulatory liabilities of $187 million for the costs of fuel and purchased power related to services provided but not yet billed, and recording regulatory liabilities of $91 million for the
| 113 |
Table of Contents
difference between the unbilled revenues and energy cost liabilities. Also, $44 million of the regulatory asset established in 1989 for unbilled gas revenues has been offset against the unbilled revenue regulatory liability.
Note C — Capitalization
Common Stock
At December 31, 2010 and 2009, Con Edison owned all of the issued and outstanding shares of common stock of the Utilities and the competitive energy businesses. CECONY owns 21,976,200 shares of Con Edison stock, which it purchased prior to 2001 in connection with Con Edison’s stock repurchase plan. CECONY presents in the financial statements the cost of the Con Edison stock it owns as a reduction of common shareholder’s equity.
Capitalization of Con Edison
The outstanding capitalization for each of the Companies is shown on its Consolidated Statement of Capitalization, and for Con Edison includes the Utilities’ outstanding preferred stock and debt.
Preferred Stock of CECONY
As of December 31, 2010, 1,915,319 shares of CECONY’s $5 Cumulative Preferred Stock (the “$5 Preferred”) and 375,626 shares of its Cumulative Preferred Stock ($100 par value) were outstanding.
Dividends on the $5 Preferred Stock are $5 per share per annum, payable quarterly, and dividends on the Cumulative Preferred Stock are $4.65 per share per annum, payable quarterly. The preferred dividends must be declared by CECONY’s Board of Trustees to become payable. See “Dividends” below.
With respect to any corporate action to be taken by a vote of shareholders of CECONY, Con Edison (which owns all of the 235,488,094 shares of CECONY’s common stock that are outstanding) and the holders of the $5 Preferred are each entitled to one vote for each share held. Except as otherwise required by law, holders of the Cumulative Preferred Stock have no right to vote; provided, however, that if the $5 Preferred is no longer outstanding, the holders of the Cumulative Preferred Stock are entitled to one vote for each share with respect to any corporate action to be taken by a vote of the shareholders of CECONY. In addition, if dividends are in arrears for certain periods, the holders are entitled to certain rights with respect to the election of CECONY’s Trustees. Without the consent of the holders of the Cumulative Preferred Stock, CECONY may not create or authorize any kind of stock ranking prior to the Cumulative Preferred Stock or, if such actions would affect the holders of the Cumulative Preferred Stock adversely, be a party to any consolidation or merger, create or amend the terms of the Cumulative Preferred Stock or reclassify the Cumulative Preferred Stock. CECONY may redeem the $5 Preferred at a redemption price of $105 per share and the Cumulative Preferred Stock at a redemption price of $101 per share (in each case, plus accrued and unpaid dividends). In the event of the dissolution, liquidation or winding up of the affairs of CECONY, before any distribution of capital assets could be made to the holders of the company’s common stock, the holders of the $5 Preferred and the Cumulative Preferred Stock would each be entitled to receive $100 per share, in the case of an involuntary liquidation, or an amount equal to the redemption price per share, in the case of a voluntary liquidation, in each case together with all accrued and unpaid dividends.
Dividends
In accordance with NYSPSC requirements, the dividends that the Utilities generally pay are limited to not more than 100 percent of their respective income available for dividends calculated on a two-year rolling average basis. Excluded from the calculation of “income available for dividends” are non-cash charges to income resulting from accounting changes or charges to income resulting from significant unanticipated events. The restriction also does not apply to dividends paid in order to transfer to Con Edison proceeds from major transactions, such as asset sales, or to dividends reducing each utility subsidiary’s equity ratio to a level appropriate to its business risk.
In addition, no dividends may be paid, or funds set apart for payment, on CECONY’s common stock until all dividends accrued on the $5 Preferred Stock and Cumulative Preferred Stock have been paid, or declared and set apart for payment.
| 114 |
Table of Contents
Long-term debt maturing in the period 2011-2015 is as follows:
| (Millions of Dollars) | Con Edison | CECONY | ||||||
|
2011 |
$ | 5 | $ | — | ||||
|
2012 |
305 | 300 | ||||||
|
2013 |
706 | 700 | ||||||
|
2014 |
481 | 475 | ||||||
|
2015 |
495 | 350 | ||||||
The Utilities have issued $269 million of tax-exempt debt through the New York State Energy Research and Development Authority (NYSERDA) that currently bear interest at a rate determined weekly and is subject to tender by bondholders for purchase by the Utilities. In 2010, CECONY issued $225 million of tax-exempt debt that is subject to mandatory tender in 2012.
The carrying amounts and fair values of long-term debt are:
| December 31, | ||||||||||||||||
|
2010 (in millions) |
2009 (in millions) |
|||||||||||||||
|
Long-Term Debt
(including
|
Carrying
Amount |
Fair
Value |
Carrying
Amount |
Fair
Value |
||||||||||||
|
Con Edison |
$ | 10,676 | $ | 11,795 | $ | 10,585 | $ | 11,009 | ||||||||
|
CECONY |
$ | 9,743 | $ | 10,680 | $ | 9,663 | $ | 10,052 | ||||||||
Fair values of long-term debt have been estimated primarily using available market information.
At December 31, 2010 and 2009, long-term debt of Con Edison included $32 million and $34 million, respectively, of Transition Bonds issued in 2004 by O&R’s New Jersey utility subsidiary through a special purpose entity.
Significant Debt Covenants
The significant debt covenants under the financing arrangements for the notes of Con Edison and the debentures of CECONY are obligations to pay principal and interest when due, covenants not to consolidate with or merge into any other corporation unless certain conditions are met and, for Con Edison’s notes, covenants that Con Edison shall continue its utility business in New York City and shall not permit Con Edison’s ratio of consolidated debt to consolidated capital to exceed 0.675 to 1. Con Edison’s notes are also subject to cross default provisions with respect to other indebtedness of Con Edison or its material subsidiaries having a then outstanding principal balance in excess of $100 million. CECONY’s debentures have no cross default provisions. The tax-exempt financing arrangements of the Utilities are subject to covenants for the CECONY debentures discussed above and the covenants discussed below. The Companies believe that they were in compliance with their significant debt covenants at December 31, 2010.
The tax-exempt financing arrangements involved the issuance of uncollateralized promissory notes of the Utilities to NYSERDA in exchange for the net proceeds of a like amount of tax-exempt bonds with substantially the same terms sold to the public by NYSERDA. The tax-exempt financing arrangements include covenants with respect to the tax-exempt status of the financing, including covenants with respect to the use of the facilities financed. The arrangements include provisions for the maintenance of liquidity and credit facilities, the failure to comply with which would, except as otherwise provided, constitute an event of default with respect to the debt to which such provisions applied.
The failure to comply with debt covenants would, except as otherwise provided, constitute an event of default with respect to the debt to which such provisions applied. If an event of default were to occur, the principal and accrued interest on the debt to which such event of default applied and, in the case of the Con Edison notes, a make-whole premium might and, in the case of certain events of default would, become due and payable immediately.
The liquidity and credit facilities currently in effect for the tax-exempt financing include covenants that the ratio of debt to total capital of the obligated utility will not at any time exceed 0.65 to 1 and that, subject to certain exceptions, the utility will not mortgage, lien, pledge or otherwise encumber its assets. Certain of the facilities also include as events of default, defaults in payments of other debt obligations in excess of specified levels ($100 million for CECONY).
| 115 |
Table of Contents
Note D – Short-Term Borrowing
In June 2006, Con Edison and the Utilities entered into an Amended and Restated Credit Agreement (Credit Agreement) under which banks are committed to provide loans and letters of credit, on a revolving credit basis. In June 2007, the Credit Agreement, which was to expire in June 2011, was extended for an additional year. Under the Credit Agreement, there is a maximum of $2.25 billion ($2.2 billion in the additional year) of credit available, with the full amount available to CECONY and $1 billion available to Con Edison. The Credit Agreement supports the Companies’ commercial paper programs. The Companies have not borrowed under the Credit Agreement. At December 31, 2010 and 2009, Con Edison and CECONY had no commercial paper outstanding.
The banks’ commitments under the Credit Agreement are subject to certain conditions, including that there be no event of default. The commitments are not subject to maintenance of credit rating levels or the absence of a material adverse change. Upon a change of control of, or upon an event of default by one of the Companies, the banks may terminate their commitments with respect to that company and declare any amounts owed by that company under the Credit Agreement immediately due and payable. Events of default include the exceeding at any time of a ratio of consolidated debt to consolidated total capital of 0.65 to 1 (at December 31, 2010, this ratio was 0.49 to 1 for both Con Edison and CECONY); having liens on its assets in an aggregate amount exceeding 5 percent of its consolidated total capital, subject to certain exceptions; and the failure by the company, following any applicable notice period, to meet certain other customary covenants. The fees charged for the revolving credit facilities and any loans made or letters of credit issued under the Credit Agreement reflect the Companies’ respective credit ratings. At December 31, 2010 and 2009, $197 million (including $145 million for CECONY) and $193 million (including $135 million for CECONY) of letters of credit were outstanding under the Credit Agreement, respectively.
See Note S for information about short-term borrowing between related parties.
Note E — Pension Benefits
Con Edison maintains a tax-qualified, non-contributory pension plan that covers substantially all employees of CECONY and O&R and certain employees of Con Edison’s competitive energy businesses. The plan is designed to comply with the Internal Revenue Code and the Employee Retirement Income Security Act of 1974. In addition, Con Edison maintains additional non-qualified supplemental pension plans.
Net Periodic Benefit Cost
The components of the Companies’ net periodic benefit costs for 2010, 2009 and 2008 were as follows:
| Con Edison | CECONY | |||||||||||||||||||||||
| (Millions of Dollars) | 2010 | 2009 | 2008 | 2010 | 2009 | 2008 | ||||||||||||||||||
|
Service cost – including administrative expenses |
$ | 168 | $ | 159 | $ | 139 | $ | 157 | $ | 149 | $ | 129 | ||||||||||||
|
Interest cost on projected benefit obligation |
556 | 525 | 515 | 521 | 492 | 482 | ||||||||||||||||||
|
Expected return on plan assets |
(704 | ) | (691 | ) | (691 | ) | (670 | ) | (659 | ) | (660 | ) | ||||||||||||
|
Amortization of net actuarial loss |
425 | 299 | 192 | 401 | 271 | 170 | ||||||||||||||||||
|
Amortization of prior service costs |
8 | 8 | 8 | 6 | 7 | 7 | ||||||||||||||||||
|
NET PERIODIC BENEFIT COST |
$ | 453 | $ | 300 | $ | 163 | $ | 415 | $ | 260 | $ | 128 | ||||||||||||
|
Amortization of regulatory asset* |
2 | 3 | 4 | 2 | 3 | 4 | ||||||||||||||||||
|
TOTAL PERIODIC BENEFIT COST |
$ | 455 | $ | 303 | $ | 167 | $ | 417 | $ | 263 | $ | 132 | ||||||||||||
|
Cost capitalized |
(157 | ) | (109 | ) | (59 | ) | (146 | ) | (98 | ) | (50 | ) | ||||||||||||
|
Cost deferred |
(115 | ) | (38 | ) | (40 | ) | (113 | ) | (32 | ) | (40 | ) | ||||||||||||
|
Cost charged (credited) to operating expenses |
$ | 183 | $ | 156 | $ | 68 | $ | 158 | $ | 133 | $ | 42 | ||||||||||||
| * | Relates to increases in CECONY’s pension obligations of $33 million from a 1993 special retirement program and $45 million from a 1999 special retirement program. |
| 116 |
Table of Contents
Funded Status
The funded status at December 31, 2010, 2009 and 2008 was as follows:
| Con Edison | CECONY | |||||||||||||||||||||||
| (Millions of Dollars) | 2010 | 2009 | 2008 | 2010 | 2009 | 2008 | ||||||||||||||||||
|
CHANGE IN PROJECTED BENEFIT OBLIGATION |
||||||||||||||||||||||||
|
Projected benefit obligation at beginning of year |
$ | 9,408 | $ | 9,383 | $ | 8,696 | $ | 8,803 | $ | 8,793 | $ | 8,137 | ||||||||||||
|
Service cost – excluding administrative expenses |
160 | 158 | 137 | 149 | 147 | 128 | ||||||||||||||||||
|
Interest cost on projected benefit obligation |
556 | 525 | 515 | 521 | 492 | 482 | ||||||||||||||||||
|
Plan amendments |
6 | 5 | — | — | — | — | ||||||||||||||||||
|
Net actuarial (gain)/loss |
636 | (215 | ) | 468 | 607 | (216 | ) | 449 | ||||||||||||||||
|
Benefits paid |
(459 | ) | (448 | ) | (433 | ) | (427 | ) | (413 | ) | (403 | ) | ||||||||||||
|
PROJECTED BENEFIT OBLIGATION AT END OF YEAR |
$ | 10,307 | $ | 9,408 | $ | 9,383 | $ | 9,653 | $ | 8,803 | $ | 8,793 | ||||||||||||
|
CHANGE IN PLAN ASSETS |
||||||||||||||||||||||||
|
Fair value of plan assets at beginning of year |
$ | 6,877 | $ | 5,836 | $ | 8,400 | $ | 6,544 | $ | 5,562 | $ | 8,025 | ||||||||||||
|
Actual return on plan assets |
888 | 1,220 | (2,263 | ) | 846 | 1,166 | (2,158 | ) | ||||||||||||||||
|
Employer contributions |
443 | 291 | 154 | 404 | 249 | 119 | ||||||||||||||||||
|
Benefits paid |
(459 | ) | (448 | ) | (433 | ) | (427 | ) | (413 | ) | (403 | ) | ||||||||||||
|
Administrative expenses |
(28 | ) | (22 | ) | (22 | ) | (27 | ) | (20 | ) | (21 | ) | ||||||||||||
|
FAIR VALUE OF PLAN ASSETS AT END OF YEAR |
$ | 7,721 | $ | 6,877 | $ | 5,836 | $ | 7,340 | $ | 6,544 | $ | 5,562 | ||||||||||||
|
FUNDED STATUS |
$ | (2,586 | ) | $ | (2,531 | ) | $ | (3,547 | ) | $ | (2,313 | ) | $ | (2,259 | ) | $ | (3,231 | ) | ||||||
|
Unrecognized net loss |
3,915 | 3,868 | 4,890 | 3,716 | 3,666 | 4,641 | ||||||||||||||||||
|
Unrecognized prior service costs |
38 | 40 | 44 | 22 | 28 | 35 | ||||||||||||||||||
|
Accumulated benefit obligation |
9,319 | 8,598 | 8,559 | 8,694 | 8,015 | 7,993 | ||||||||||||||||||
The increase in the pension plan’s projected benefit obligation was a primary driver in the increased pension liability at Con Edison and CECONY of $55 million and $54 million, respectively, compared with December 31, 2009. For Con Edison, this increase in pension liability resulted in an increase to regulatory assets of $49 million for unrecognized net losses and unrecognized prior service costs associated with the Utilities consistent with the accounting rules for regulated operations and a credit to OCI of $3 million (net of taxes) for the unrecognized net losses and unrecognized prior service costs associated with the competitive energy businesses and O&R’s New Jersey and Pennsylvania utility subsidiaries.
For CECONY, the increase in pension liability resulted in an increase to regulatory assets of $43 million for unrecognized net losses and unrecognized prior service costs associated with the Utilities consistent with the accounting rules for regulated operations and a debit to OCI of $1 million for unrecognized net losses and unrecognized prior service costs associated with the competitive energy businesses.
A portion of the estimated net loss and prior service cost for the pension plan, equal to $536 million and $8 million, respectively, will be amortized from accumulated OCI and the regulatory asset into net periodic benefit cost over the next year for Con Edison. Included in these amounts are $508 million and $6 million, respectively, for CECONY.
At December 31, 2010 and 2009, Con Edison’s investments include $119 million and $85 million, respectively, held in external trust accounts for benefit payments pursuant to the supplemental retirement plans. Included in these amounts for CECONY were $109 million and $75 million, respectively. See Note P. The accumulated benefit obligations for the supplemental retirement plans for Con Edison and CECONY were $192 million and $158 million as of December 31, 2010 and $175 million and $142 million as of December 31, 2009, respectively.
| 117 |
Table of Contents
Assumptions
The actuarial assumptions were as follows:
| 2010 | 2009 | 2008 | ||||||||||
|
Weighted-average assumptions used to determine benefit obligations at December 31: |
||||||||||||
|
Discount rate |
5.60 | % | 6.05 | % | 5.75 | % | ||||||
|
Rate of compensation increase |
||||||||||||
|
– CECONY |
4.35 | % | 4.00 | % | 4.00 | % | ||||||
|
– O&R |
4.25 | % | 4.00 | % | 4.00 | % | ||||||
|
Weighted-average assumptions used to determine net periodic benefit cost for the years ended December 31: |
||||||||||||
|
Discount rate |
6.05 | % | 5.75 | % | 6.00 | % | ||||||
|
Expected return on plan assets |
8.50 | % | 8.50 | % | 8.50 | % | ||||||
|
Rate of compensation increase |
||||||||||||
|
– CECONY |
4.00 | % | 4.00 | % | 4.00 | % | ||||||
|
– O&R |
4.00 | % | 4.00 | % | 4.00 | % | ||||||
The expected return assumption reflects anticipated returns on the plan’s current and future assets. The Companies’ expected return was based on an evaluation of the current environment, market and economic outlook, relationships between the economy and asset class performance patterns, and recent and long-term trends in asset class performance. The projections were based on the plan’s target asset allocation and were adjusted for historical and expected experience of active portfolio management results compared to benchmark returns.
Discount Rate Assumption
To determine the assumed discount rate, the Companies use a model that produces a yield curve based on yields on selected highly rated (Aaa or Aa, by Moody’s Investors Service) corporate bonds. Bonds with insufficient liquidity, bonds with questionable pricing information and bonds that are not representative of the overall market are excluded from consideration. For example, the bonds used in the model cannot be callable, they must have a price between 50 and 200, the yield must lie between 1 percent and 20 percent, and the amount of the issue must be in excess of $100 million. The spot rates defined by the yield curve and the plan’s projected benefit payments are used to develop a weighted average discount rate.
Expected Benefit Payments
Based on current assumptions, the Companies expect to make the following benefit payments over the next ten years:
| (Millions of Dollars) | 2011 | 2012 | 2013 | 2014 | 2015 | 2016-2020 | ||||||||||||||||||
|
Con Edison |
$ | 501 | $ | 528 | $ | 554 | $ | 580 | $ | 605 | $ | 3,376 | ||||||||||||
|
CECONY |
467 | 492 | 516 | 541 | 563 | 3,150 | ||||||||||||||||||
Expected Contributions
Based on estimates as of December 31, 2010, the Companies do not expect to be required under funding regulations and laws to make any contributions to the pension plan during 2011. The Companies’ policy is to fund their accounting cost to the extent tax deductible, therefore, Con Edison expects to make discretionary contributions of $543 million including $502 million for CECONY, to the pension plan during 2011.
Plan Assets
The asset allocations for the pension plan at the end of 2010, 2009 and 2008, and the target allocation for 2011 are as follows:
|
Target
Allocation Range |
Plan Assets at December 31 | |||||||||||||||
| Asset Category | 2011 | 2010 | 2009 | 2008 | ||||||||||||
|
Equity Securities |
57% - 73% | 67 | % | 67 | % | 59 | % | |||||||||
|
Debt Securities |
21% - 33% | 28 | % | 28 | % | 33 | % | |||||||||
|
Real Estate |
5% - 11% | 5 | % | 5 | % | 8 | % | |||||||||
|
Total |
100% | 100 | % | 100 | % | 100 | % | |||||||||
Con Edison has established a pension trust for the investment of assets to be used for the exclusive purpose of providing retirement benefits to participants and beneficiaries and payment of plan expenses.
Pursuant to resolutions adopted by Con Edison’s Board of Directors, the Management Development and Compensation Committee of the Board of Directors (the Committee) has general oversight responsibility for Con Edison’s pension and other employee benefit plans. The pension plan’s named fiduciaries have been granted the authority to control and manage the operation and administration of the plans, including overall responsibility for the investment of assets in the trust and the power to appoint and terminate investment managers. The named fiduciaries consist of Con Edison’s chief executive, financial and accounting officers.
| 118 |
Table of Contents
The investment objectives of the Con Edison pension plan are to maintain a level and form of assets adequate to meet benefit obligations to participants, maximize the long-term total return on the trust assets within a prudent level of risk and maintain a level of volatility that is not expected to have a material impact on the Company’s expected contribution and expense or the Company’s ability to meet plan obligations. The assets of the plan have no significant concentration of risk in one country (other than the United States), industry or entity.
The strategic asset allocation is intended to meet the objectives of the pension plan by diversifying its funds across asset classes, investment styles and fund managers. An asset/liability study typically is conducted every few years to determine whether the current strategic asset allocation continues to represent the appropriate balance of expected risk and reward for the plan to meet expected liabilities. Each study considers the investment risk of the asset allocation and determines the optimal asset allocation for the plan. The target asset allocation for 2010 reflects the results of such a study conducted in 2007.
Individual fund managers operate under written guidelines provided by Con Edison, which cover such areas as investment objectives, performance measurement, permissible investments, investment restrictions, trading and execution, and communication and reporting requirements. Con Edison management regularly monitors, and the named fiduciaries review and report to the Committee regarding, manager performance, total fund performance, and compliance with asset allocation guidelines. Management changes fund managers and rebalances the portfolio as appropriate. At the direction of the named fiduciaries, such changes are reported to the Committee.
In accordance with the accounting rules for pensions that became effective December 2009, the Company is providing the following disclosures regarding the fair value of the pension trust’s investments.
Assets measured at fair value on a recurring basis are summarized below under a three-level hierarchy established by the accounting rules which define the levels within the hierarchy as follows:
| • |
Level 1 – Consists of fair value measurements whose value is based on quoted prices in active markets for identical assets or liabilities. |
| • |
Level 2 – Consists of fair value measurements whose value is based on significant other observable inputs. |
| • |
Level 3 – Consists of fair value measurements whose value is based on significant unobservable inputs. |
The fair values of the pension plan assets at December 31, 2010 by asset category are as follows:
| (Millions of Dollars) | Level 1 | Level 2 | Level 3 | Total | ||||||||||||
|
U.S. Equity(a) |
$ | 3,935 | $ | — | $ | — | $ | 3,935 | ||||||||
|
International Equity(b) |
1,249 | 234 | — | 1,483 | ||||||||||||
|
U.S. Government Issues(c) |
— | 1,300 | — | 1,300 | ||||||||||||
|
Corporate Bonds(d) |
— | 571 | 129 | 700 | ||||||||||||
|
Structured Assets(e) |
— | — | 87 | 87 | ||||||||||||
|
Other Fixed Income(f) |
— | 31 | 66 | 97 | ||||||||||||
|
Real Estate(g) |
— | — | 398 | 398 | ||||||||||||
|
Cash and Cash Equivalents(h) |
3 | 232 | — | 235 | ||||||||||||
|
Total investments |
$ | 5,187 | $ | 2,368 | $ | 680 | $ | 8,235 | ||||||||
|
Funds for retiree health benefits(i) |
(226 | ) | (103 | ) | (30 | ) | (359 | ) | ||||||||
|
Investments (excluding funds for retiree health benefits) |
$ | 4,961 | $ | 2,265 | $ | 650 | $ | 7,876 | ||||||||
|
Pending activities(j) |
(155 | ) | ||||||||||||||
|
Total fair value of plan net assets |
$ | 7,721 | ||||||||||||||
| (a) | U.S. Equity includes both actively- and passively-managed assets with investments in domestic equity index funds, actively-managed small-capitalization equities, rights and warrants. |
| (b) | International Equity includes international equity index funds, actively-managed international equities, rights and warrants. |
| (c) | U.S. Government Issues include agency and treasury securities. |
| (d) | Corporate Bonds held in institutional mutual funds which are measured at Net Asset Value (NAV) are classified as Level 3. |
| (e) | Structured Assets are measured using broker quotes and investment manager proprietary models and include commercial-mortgage-backed securities, collateralized mortgage obligations and asset-backed securities. |
| 119 |
Table of Contents
| (f) | Other Fixed Income includes emerging market debt valued using broker quotes, municipal bonds, sovereign debt, regional governments and government agencies. |
| (g) | Real Estate investments include real estate funds based on appraised values that are broadly diversified by geography and property type. |
| (h) | Cash and Cash Equivalents include short term investments, money markets and foreign currency. |
| (i) | The Companies set aside funds for retiree health benefits through a separate account within the pension trust, as permitted under Section 401(h) of the Internal Revenue Code of 1986, as amended. In accordance with the Code, the plan’s investments in the 401(h) account may not be used for, or diverted to, any purpose other than providing health benefits for retirees. The net assets held in the 401(h) account are calculated based on a pro-rata percentage allocation of the net assets in the pension plan. The related obligations for health benefits are not included in the pension plan’s obligations and are included in the Companies’ other postretirement benefit obligation. See Note F. |
| (j) | Pending activities include security purchases and sales that have not settled, interest and dividends that have not been received and reflects adjustments for available estimates at year end. |
The table below provides a reconciliation of the beginning and ending net balances for assets at December 31, 2010 classified as Level 3 in the fair value hierarchy.
| (Millions of Dollars) |
Beginning
Balance as of January 1, 2010 |
Assets Still Held
Reporting Date –
|
Assets Sold
During the Period – Realized Gains |
Purchases
Sales and Settlements |
Ending
Balance as of December 31, 2010 |
|||||||||||||||
|
U.S. Equity |
$ | — | — | — | — | $ | — | |||||||||||||
|
International Equity |
1 | 1 | (1 | ) | (1 | ) | — | |||||||||||||
|
Corporate Bonds |
143 | (3 | ) | 9 | (20 | ) | 129 | |||||||||||||
|
Structured Assets |
91 | 15 | (6 | ) | (13 | ) | 87 | |||||||||||||
|
Other Fixed Income |
46 | — | 2 | 18 | 66 | |||||||||||||||
|
Swaps |
(3 | ) | 2 | (1 | ) | 2 | — | |||||||||||||
|
Real Estate |
344 | 47 | — | 7 | 398 | |||||||||||||||
|
Total investments |
$ | 622 | 62 | 3 | (7 | ) | $ | 680 | ||||||||||||
|
Funds for retiree health benefits |
(28 | ) | (3 | ) | (2 | ) | 3 | (30 | ) | |||||||||||
|
Investments (excluding funds for retiree health benefits) |
$ | 594 | $ | 59 | $ | 1 | $ | (4 | ) | $ | 650 | |||||||||
The fair values of the pension plan assets at December 31, 2009 by asset category are as follows:
| (Millions of Dollars) | Level 1 | Level 2 | Level 3 | Total | ||||||||||||
|
U.S. Equity(a) |
$ | 3,470 | $ | — | $ | — | $ | 3,470 | ||||||||
|
International Equity(b) |
1,140 | 196 | 1 | 1,337 | ||||||||||||
|
U.S. Government Issues(c) |
— | 1,255 | — | 1,255 | ||||||||||||
|
Corporate Bonds(d) |
— | 435 | 143 | 578 | ||||||||||||
|
Structured Assets(e) |
— | — | 91 | 91 | ||||||||||||
|
Other Fixed Income(f) |
— | 10 | 46 | 56 | ||||||||||||
|
Swaps(g) |
— | — | (3 | ) | (3 | ) | ||||||||||
|
Real Estate(h) |
— | — | 344 | 344 | ||||||||||||
|
Cash and Cash Equivalents(i) |
197 | 141 | — | 338 | ||||||||||||
|
Total investments |
$ | 4,807 | $ | 2,037 | $ | 622 | $ | 7,466 | ||||||||
|
Funds for retiree health benefits(j) |
(215 | ) | (91 | ) | (28 | ) | (334 | ) | ||||||||
|
Investments (excluding funds for retiree health benefits) |
$ | 4,592 | $ | 1,946 | $ | 594 | $ | 7,132 | ||||||||
|
Pending activities(k) |
(255 | ) | ||||||||||||||
|
Total fair value of plan net assets |
$ | 6,877 | ||||||||||||||
| (a) | U.S. Equity includes both actively- and passively-managed assets with investments in domestic equity index funds, actively-managed small-capitalization equities, rights and warrants. |
| (b) | International Equity includes international equity index funds, actively-managed international equities, rights and warrants. |
| (c) | U.S. Government Issues include agency and treasury securities. |
| (d) | Corporate Bonds held in institutional mutual funds which are measured at Net Asset Value (NAV) are classified as Level 3. |
| (e) | Structured Assets are measured using broker quotes and investment manager proprietary models and include commercial-mortgage-backed securities, collateralized mortgage obligations and asset-backed securities. |
| (f) | Other Fixed Income includes emerging market debt valued using broker quotes, municipal bonds, sovereign debt, regional governments and government agencies. |
| (g) | Swaps include total return swaps, interest rate swaps, credit default swaps and swap collateral. Level 3 Swaps are valued using proprietary investment manager models. |
| (h) | Real Estate investments include real estate funds based on appraised values that are broadly diversified by geography and property type. |
| (i) | Cash and Cash Equivalents include short term investments, money markets and foreign currency. |
| (j) | The Companies set aside funds for retiree health benefits through a separate account within the pension trust, as permitted under Section 401(h) of the Internal Revenue Code of 1986, as amended. In accordance with the Code, the plan’s investments in the 401(h) account may not be used for, or diverted to, any purpose other than providing health benefits for retirees and their beneficiaries. The net assets held in the 401(h) account are calculated based on a pro-rata percentage allocation of the net assets in the pension plan. The related obligations for health benefits are not included in the pension plan’s obligations and are included in the other postretirement benefit obligation. See Note F. |
| (k) | Pending activities include security purchases and sales that have not settled and interest and dividends that have not been received. |
| 120 |
Table of Contents
The table below provides a reconciliation of the beginning and ending net balances for assets at December 31, 2009 classified as Level 3 in the fair value hierarchy.
| (Millions of Dollars) |
Beginning
Balance as of January 1, 2009 |
Assets Still Held
Reporting Date –
|
Assets Sold
During the Period – Realized Gains |
Purchases
Sales and Settlements |
Ending
Balance as of December 31, 2009 |
|||||||||||||||
|
U.S. Equity |
$ | 1 | $ | 2 | $ | (2 | ) | $ | (1 | ) | $ | — | ||||||||
|
International Equity |
— | — | — | 1 | 1 | |||||||||||||||
|
Corporate Bonds |
172 | 35 | (7 | ) | (57 | ) | 143 | |||||||||||||
|
Structured Assets |
194 | 93 | (70 | ) | (126 | ) | 91 | |||||||||||||
|
Other Fixed Income |
52 | 2 | 1 | (9 | ) | 46 | ||||||||||||||
|
Swaps |
(32 | ) | 13 | (51 | ) | 67 | (3 | ) | ||||||||||||
|
Options |
5 | (4 | ) | 4 | (5 | ) | — | |||||||||||||
|
Real Estate |
515 | (177 | ) | — | 6 | 344 | ||||||||||||||
|
Total investments |
$ | 907 | $ | (36 | ) | $ | (125 | ) | $ | (124 | ) | $ | 622 | |||||||
|
Funds for retiree health benefits |
(41 | ) | 2 | 6 | 5 | (28 | ) | |||||||||||||
|
Investments (excluding funds for retiree health benefits) |
$ | 866 | $ | (34 | ) | $ | (119 | ) | $ | (119 | ) | $ | 594 | |||||||
The Companies also offer a defined contribution savings plan that covers substantially all employees and made contributions to the plan as follows:
| For the Years Ended December 31 | ||||||||||||
| (Millions of Dollars) | 2010 | 2009 | 2008 | |||||||||
|
Con Edison |
$ | 19 | $ | 19 | $ | 21 | ||||||
|
CECONY |
17 | 17 | 19 | |||||||||
Note F – Other Postretirement Benefits
The Utilities currently have contributory comprehensive hospital, medical and prescription drug programs for all retirees, their dependents and surviving spouses.
CECONY also has a contributory life insurance program for bargaining unit employees and provides basic life insurance benefits up to a specified maximum at no cost to retired management employees. O&R has a non-contributory life insurance program for retirees. Certain employees of Con Edison’s competitive energy businesses are eligible to receive benefits under these programs.
Net Periodic Benefit Cost
The components of the Companies’ net periodic postretirement benefit costs for 2010, 2009 and 2008 were as follows:
| Con Edison | CECONY | |||||||||||||||||||||||
| (Millions of Dollars) | 2010 | 2009 | 2008 | 2010 | 2009 | 2008 | ||||||||||||||||||
|
Service cost |
$ | 24 | $ | 22 | $ | 20 | $ | 19 | $ | 18 | $ | 16 | ||||||||||||
|
Interest cost on accumulated other postretirement benefit obligation |
91 | 95 | 95 | 80 | 84 | 84 | ||||||||||||||||||
|
Expected return on plan assets |
(86 | ) | (86 | ) | (86 | ) | (78 | ) | (78 | ) | (79 | ) | ||||||||||||
|
Amortization of net actuarial loss |
92 | 74 | 68 | 85 | 65 | 59 | ||||||||||||||||||
|
Amortization of prior service cost |
(12 | ) | (12 | ) | (12 | ) | (14 | ) | (14 | ) | (14 | ) | ||||||||||||
|
Amortization of transition obligation |
3 | 3 | 3 | 3 | 3 | 4 | ||||||||||||||||||
|
NET PERIODIC POSTRETIREMENT BENEFIT COST |
$ | 112 | $ | 96 | $ | 88 | $ | 95 | $ | 78 | $ | 70 | ||||||||||||
|
Cost capitalized |
(39 | ) | (35 | ) | (32 | ) | (33 | ) | (29 | ) | (27 | ) | ||||||||||||
|
Cost charged/(deferred) |
4 | 3 | (11 | ) | 1 | 1 | (9 | ) | ||||||||||||||||
|
Cost charged to operating expenses |
$ | 77 | $ | 64 | $ | 45 | $ | 63 | $ | 50 | $ | 34 | ||||||||||||
| 121 |
Table of Contents
Funded Status
The funded status of the programs at December 31, 2010, 2009 and 2008 were as follows:
| Con Edison | CECONY | |||||||||||||||||||||||
| (Millions of Dollars) | 2010 | 2009 | 2008 | 2010 | 2009 | 2008 | ||||||||||||||||||
|
CHANGE IN BENEFIT OBLIGATION |
||||||||||||||||||||||||
|
Benefit obligation at beginning of year |
$ | 1,697 | $ | 1,702 | $ | 1,630 | $ | 1,495 | $ | 1,495 | $ | 1,433 | ||||||||||||
|
Service cost |
24 | 22 | 20 | 19 | 18 | 16 | ||||||||||||||||||
|
Interest cost on accumulated postretirement benefit obligation |
91 | 95 | 95 | 80 | 84 | 84 | ||||||||||||||||||
|
Net actuarial loss/(gain) |
(68 | ) | (14 | ) | 46 | (77 | ) | (3 | ) | 44 | ||||||||||||||
|
Benefits paid and administrative expenses |
(138 | ) | (141 | ) | (121 | ) | (126 | ) | (130 | ) | (111 | ) | ||||||||||||
|
Participant contributions |
29 | 26 | 25 | 28 | 25 | 24 | ||||||||||||||||||
|
Medicare prescription benefit |
7 | 7 | 7 | 7 | 6 | 5 | ||||||||||||||||||
|
BENEFIT OBLIGATION AT END OF YEAR |
$ | 1,642 | $ | 1,697 | $ | 1,702 | $ | 1,426 | $ | 1,495 | $ | 1,495 | ||||||||||||
|
CHANGE IN PLAN ASSETS |
||||||||||||||||||||||||
|
Fair value of plan assets at beginning of year |
$ | 866 | $ | 737 | $ | 988 | $ | 777 | $ | 668 | $ | 907 | ||||||||||||
|
Actual return on plan assets |
89 | 153 | (233 | ) | 78 | 137 | (215 | ) | ||||||||||||||||
|
Employer contributions |
96 | 86 | 77 | 85 | 73 | 63 | ||||||||||||||||||
|
Participant contributions |
29 | 26 | 25 | 28 | 25 | 24 | ||||||||||||||||||
|
Benefits paid |
(138 | ) | (136 | ) | (120 | ) | (129 | ) | (126 | ) | (111 | ) | ||||||||||||
|
FAIR VALUE OF PLAN ASSETS AT END OF YEAR |
$ | 942 | $ | 866 | $ | 737 | $ | 839 | $ | 777 | $ | 668 | ||||||||||||
|
FUNDED STATUS |
$ | (700 | ) | $ | (831 | ) | $ | (965 | ) | $ | (587 | ) | $ | (718 | ) | $ | (827 | ) | ||||||
|
Unrecognized net loss |
483 | 646 | 799 | 440 | 601 | 728 | ||||||||||||||||||
|
Unrecognized prior service costs |
(10 | ) | (23 | ) | (35 | ) | (26 | ) | (40 | ) | (54 | ) | ||||||||||||
|
Unrecognized net transition liability at January 1, 1993 |
7 | 11 | 15 | 7 | 11 | 15 | ||||||||||||||||||
The increase in the value of other postretirement benefit plan assets was a primary driver in the decreased liability for other postretirement benefits at Con Edison and CECONY of $131 million compared with December 31, 2009. For Con Edison, this decrease in liability resulted in a decrease to regulatory assets of $151 million for unrecognized net losses and unrecognized prior service costs associated with the Utilities consistent with the accounting rules for regulated operations and a credit to OCI of $1 million (net of taxes) for the unrecognized net losses and unrecognized prior service costs associated with the competitive energy businesses and O&R’s New Jersey and Pennsylvania utility subsidiaries.
For CECONY, the increase in the value of other postretirement benefit plan assets resulted in a decrease to regulatory assets of $150 million for unrecognized net losses and unrecognized prior service costs associated with the company consistent with the accounting rules for regulated operations and a debit to OCI of $1 million (net of taxes) for unrecognized net losses and unrecognized prior service costs associated with the competitive energy businesses.
A portion of the estimated net loss, prior service costs and transition obligation for the other postretirement benefits, equal to $92 million, $(10) million and $4 million, respectively, will be amortized from accumulated OCI and the regulatory asset into net periodic benefit cost over the next year for Con Edison. Included in these amounts are $83 million, $(11) million and $3 million, respectively, for CECONY.
| 122 |
Table of Contents
Assumptions
The actuarial assumptions were as follows:
| 2010 | 2009 | 2008 | ||||||||||
|
Weighted-average assumptions used to determine benefit obligations at December 31: |
||||||||||||
|
Discount Rate |
5.40 | % | 5.95 | % | 5.75 | % | ||||||
|
Weighted-average assumptions used to determine net periodic benefit cost for the years ended December 31: |
||||||||||||
|
Discount Rate |
5.95 | % | 5.75 | % | 6.00 | % | ||||||
|
Expected Return on Plan Assets |
||||||||||||
|
Tax-Exempt |
8.50 | % | 8.50 | % | 8.50 | % | ||||||
|
Taxable |
||||||||||||
|
CECONY |
7.50 | % | 7.50 | % | 7.50 | % | ||||||
|
O&R |
8.00 | % | 8.00 | % | 8.00 | % | ||||||
Refer to Note E for descriptions of the basis for determining the expected return on assets, investment policies and strategies, and the assumed discount rate.
The health care cost trend rate used to determine net periodic benefit cost for the year ended December 31, 2010 was 6.5 percent, which is assumed to decrease gradually to 4.5 percent by 2014 and remain at that level thereafter. The health care cost trend rate used to determine benefit obligations as of December 31, 2010 was 6.0 percent, which is assumed to decrease gradually to 4.5 percent by 2014 and remain at that level thereafter.
A one-percentage point change in the assumed health care cost trend rate would have the following effects at December 31, 2011:
| Con Edison | CECONY | |||||||||||||||
| 1-Percentage-Point | ||||||||||||||||
| (Millions of Dollars) | Increase | Decrease | Increase | Decrease | ||||||||||||
|
Effect on accumulated other postretirement benefit obligation |
$ | 27 | $ | (11 | ) | $ | 3 | $ | 9 | |||||||
|
Effect on service cost and interest cost components for 2010 |
2 | (1 | ) | — | 1 | |||||||||||
Expected Benefit Payments
Based on current assumptions, the Companies expect to make the following benefit payments over the next ten years:
| (Millions of Dollars) | 2011 | 2012 | 2013 | 2014 | 2015 | 2016-2020 | ||||||||||||||||||
|
GROSS BENEFIT PAYMENTS |
||||||||||||||||||||||||
|
Con Edison |
$ | 123 | $ | 126 | $ | 128 | $ | 130 | $ | 131 | $ | 658 | ||||||||||||
|
CECONY |
111 | 113 | 115 | 117 | 117 | 578 | ||||||||||||||||||
|
MEDICARE PRESCRIPTION BENEFIT RECEIPTS |
||||||||||||||||||||||||
|
Con Edison |
$ | 11 | $ | 12 | $ | 13 | $ | 14 | $ | 15 | $ | 88 | ||||||||||||
|
CECONY |
10 | 11 | 12 | 13 | 13 | 79 | ||||||||||||||||||
Expected Contributions
Based on estimates as of December 31, 2010, Con Edison expects to make a contribution of $93 million, including $81 million for CECONY, to the other postretirement benefit plans in 2011.
Plan Assets
The asset allocations for CECONY’s other postretirement benefit plans at the end of 2010, 2009 and 2008, and the target allocation for 2011 are as follows:
| Target Allocation Range | Plan Assets at December 31 | |||||||||||||||
| Asset Category | 2011 | 2010 | 2009 | 2008 | ||||||||||||
|
Equity Securities |
57 | % - 73% | 67 | % | 66 | % | 56 | % | ||||||||
|
Debt Securities |
26 | % - 44% | 33 | % | 34 | % | 44 | % | ||||||||
|
Total |
100 | % | 100 | % | 100 | % | 100 | % | ||||||||
| 123 |
Table of Contents
Con Edison has established postretirement health and life insurance benefit plan trusts for the investment of assets to be used for the exclusive purpose of providing other postretirement benefits to participants and beneficiaries.
Refer to Note E for a discussion of Con Edison’s investment policy for its benefit plans.
The fair values of the plan assets at December 31, 2010 by asset category (see description of levels in Note E) are as follows:
| (Millions of Dollars) | Level 1 | Level 2 | Level 3 | Total | ||||||||||||
|
U.S. Equity(a) |
$ | 118 | $ | 172 | $ | — | $ | 290 | ||||||||
|
International Equity(b) |
— | 107 | — | 107 | ||||||||||||
|
Other Fixed Income(c) |
— | — | 189 | 189 | ||||||||||||
|
Cash and Cash Equivalents(d) |
— | 11 | — | 11 | ||||||||||||
|
Total investments |
$ | 118 | $ | 290 | $ | 189 | $ | 597 | ||||||||
|
Funds for retiree health benefits(e) |
226 | 103 | 30 | 359 | ||||||||||||
|
Investments (including funds for retiree health benefits) |
$ | 344 | $ | 393 | $ | 219 | $ | 956 | ||||||||
|
Pending activities(f) |
(14 | ) | ||||||||||||||
|
Total fair value of plan net assets |
$ | 942 | ||||||||||||||
| (a) | U.S. Equity includes both actively- and passively-managed assets with investments in domestic equity index funds and commingled funds. |
| (b) | International Equity includes commingled international equity funds. |
| (c) | Other Fixed Income includes commingled funds, which are valued at Net Asset Value (NAV). |
| (d) | Cash and Cash Equivalents include short term investments and money markets. |
| (e) | The Companies set aside funds for retiree health benefits through a separate account within the pension trust, as permitted under Section 401(h) of the Internal Revenue Code of 1986, as amended. In accordance with the Code, the plan’s investments in the 401(h) account may not be used for, or diverted to, any purpose other than providing health benefits for retirees. The net assets held in the 401(h) account are calculated based on a pro-rata percentage allocation of the net assets in the pension plan. The related obligations for health benefits are not included in the pension plan’s obligations and are included in the Companies’ other postretirement benefit obligation. See Note E. |
| (f) | Pending activities include security purchases and sales that have not settled, interest and dividends that have not been received, and reflects adjustments for available estimates at year end. |
The table below provides a reconciliation of the beginning and ending net balances for assets at December 31, 2010 classified as Level 3 in the fair value hierarchy.
| (Millions of Dollars) |
Beginning
Balance as of January 1, 2010 |
Assets Still Held
at Reporting Date – Unrealized Gains (Losses) |
Assets Sold
During the Period – Realized Gains |
Purchases
Sales and Settlements |
Ending
Balance as of December 31, 2010 |
|||||||||||||||
|
Other Fixed Income |
$ | 173 | $ | 11 | $ | 1 | $ | 4 | $ | 189 | ||||||||||
|
Insurance Contracts |
8 | — | (1 | ) | (7 | ) | — | |||||||||||||
|
Total investments |
$ | 181 | $ | 11 | $ | — | $ | (3 | ) | $ | 189 | |||||||||
|
Funds for retiree health benefits |
28 | 3 | 2 | (3 | ) | 30 | ||||||||||||||
|
Investments (including funds for retiree health benefits) |
$ | 209 | $ | 14 | $ | 2 | $ | (6 | ) | $ | 219 | |||||||||
The fair values of the plan assets at December 31, 2009 by asset category are as follows:
| (Millions of Dollars) | Level 1 | Level 2 | Level 3 | Total | ||||||||||||
|
U.S. Equity(a) |
$ | 101 | $ | 143 | $ | — | $ | 244 | ||||||||
|
International Equity(b) |
— | 92 | — | 92 | ||||||||||||
|
Other Fixed Income(c) |
— | — | 173 | 173 | ||||||||||||
|
Insurance Contracts(d) |
— | — | 8 | 8 | ||||||||||||
|
Cash and Cash Equivalents(e) |
— | 9 | — | 9 | ||||||||||||
|
Total investments |
$ | 101 | $ | 244 | $ | 181 | $ | 526 | ||||||||
|
Funds for retiree health benefits(f) |
215 | 91 | 28 | 334 | ||||||||||||
|
Investments (including funds for retiree health benefits) |
$ | 316 | $ | 335 | $ | 209 | $ | 860 | ||||||||
|
Pending activities(g) |
6 | |||||||||||||||
|
Total fair value of plan net assets |
$ | 866 | ||||||||||||||
| (a) | U.S. Equity includes both actively-and passively-managed assets with investments in domestic equity index funds and commingled funds. |
| (b) | International Equity includes commingled international equity funds. |
| 124 |
Table of Contents
| (c) | Other Fixed Income includes commingled funds, which are valued at Net Asset Value (NAV). |
| (d) | Insurance Contracts represent the cash surrender value of life insurance policies. The contracts are measured at NAV, adjusted for fees charged by the insurance company. |
| (e) | Cash and Cash Equivalents include short term investments and money markets. |
| (f) | The Companies set aside funds for retiree health benefits through a separate account within the pension trust, as permitted under Section 401(h) of the Internal Revenue Code of 1986, as amended. In accordance with the Code, the plan’s investments in the 401(h) account may not be used for, or diverted to, any purpose other than providing health benefits for retirees and their beneficiaries. The net assets held in the 401(h) account are calculated based on a pro-rata percentage allocation of the net assets in the pension plan. The related obligations for health benefits are not included in the pension plan’s obligations and are included in the other postretirement benefit obligation. See Note E. |
| (g) | Pending activities include security purchases and sales that have not settled and interest and dividends that have not been received. |
The table below provides a reconciliation of the beginning and ending net balances for assets at December 31, 2009 classified as Level 3 in the fair value hierarchy.
| (Millions of Dollars) |
Beginning
Balance as of January 1, 2009 |
Assets Still Held
at Reporting Date – Unrealized Gains (Losses) |
Assets Sold
During the Period – Realized Gains |
Purchases
Sales and Settlements |
Ending
Balance as of December 31, 2009 |
|||||||||||||||
|
Other Fixed Income |
$ | 197 | $ | 11 | $ | 3 | $ | (38 | ) | $ | 173 | |||||||||
|
Insurance Contracts |
8 | — | — | — | 8 | |||||||||||||||
|
Total investments |
$ | 205 | $ | 11 | $ | 3 | $ | (38 | ) | $ | 181 | |||||||||
|
Funds for retiree health benefits |
41 | (2 | ) | (6 | ) | (5 | ) | 28 | ||||||||||||
|
Investments (including funds for retiree health benefits) |
$ | 246 | $ | 9 | $ | (3 | ) | $ | (43 | ) | $ | 209 | ||||||||
Effect of Medicare Prescription Benefit
The Medicare Prescription Drug, Improvement and Modernization Act of 2003 created a benefit for certain employers who provide postretirement drug programs. The accounting rules for retirement benefits provide accounting and disclosure requirements relating to the Act. The Companies’ actuaries have determined that each of their prescription drug plans provides a benefit that is at least actuarially equivalent to the Medicare prescription drug plan and projections indicate that this will be the case for 20 years; therefore, the Companies are eligible to receive the benefit that the Act makes available. When the plans’ benefits are no longer actuarially equivalent to the Medicare plan, 25 percent of the retirees in each plan are assumed to begin to decline participation in the Companies’ prescription programs.
In March 2010, the Patient Protection and Affordable Care Act and the Health Care and Education Reconciliation Act of 2010 became law. In the first half of 2010, the Companies reduced their deferred tax asset to reflect the laws’ repeal, effective 2013, of the deduction for federal income tax purposes of the portion of the cost of an employer’s retiree prescription drug coverage for which the employer received a benefit under the Medicare Prescription Drug Improvement and Modernization Act of 2003. For CECONY, the reductions in its deferred tax asset of $33 million had no effect on net income because a regulatory asset in a like amount on a pre-tax basis was established to reflect future recovery from customers of the increased cost of its retiree prescription drug coverage resulting from the loss of the tax deduction. For O&R’s New York electric and gas services the reductions in their deferred tax assets of $3 million had no effect on net income because a regulatory asset in a like amount on a pre-tax basis was established to reflect future recovery from customers of the increased cost of their retiree prescription drug coverage resulting from the loss of the tax deduction. For RECO and Pike County Light & Power Company, the reduction in their deferred tax assets of $1 million was taken as a charge to net income. The impact on Con Edison’s deferred tax assets for its other businesses was not material to its results of operations.
Note G — Environmental Matters
Superfund Sites
Hazardous substances, such as asbestos, polychlorinated biphenyls (PCBs) and coal tar, have been used or generated in the course of operations of the Utilities and their predecessors and are present at sites and in facilities and equipment they currently or previously owned, including sites at which gas was manufactured or stored.
| 125 |
Table of Contents
The Federal Comprehensive Environmental Response, Compensation and Liability Act of 1980 and similar state statutes (Superfund) impose joint and several liability, regardless of fault, upon generators of hazardous substances for investigation and remediation costs (which include costs of demolition, removal, disposal, storage, replacement, containment, and monitoring) and natural resource damages. Liability under these laws can be material and may be imposed for contamination from past acts, even though such past acts may have been lawful at the time they occurred. The sites at which the Utilities have been asserted to have liability under these laws, including their manufactured gas plant sites and any neighboring areas to which contamination may have migrated, are referred to herein as “Superfund Sites.”
For Superfund Sites where there are other potentially responsible parties and the Utilities are not managing the site investigation and remediation, the accrued liability represents an estimate of the amount the Utilities will need to pay to investigate and, where determinable, discharge their related obligations. For Superfund Sites (including the manufactured gas plant sites) for which one of the Utilities is managing the investigation and remediation, the accrued liability represents an estimate of the company’s share of undiscounted cost to investigate the sites and, for sites that have been investigated in whole or in part, the cost to remediate the sites, if remediation is necessary and if a reasonable estimate of such cost can be made. Remediation costs are estimated in light of the information available, applicable remediation standards, and experience with similar sites.
The accrued liabilities and regulatory assets related to Superfund Sites at December 31, 2010 and 2009 were as follows:
| Con Edison | CECONY | |||||||||||||||
| (Millions of Dollars) | 2010 | 2009 | 2010 | 2009 | ||||||||||||
|
Accrued Liabilities: |
||||||||||||||||
|
Manufactured gas plant sites |
$ | 446 | $ | 164 | $ | 327 | $ | 112 | ||||||||
|
Other Superfund Sites |
66 | 48 | 65 | 47 | ||||||||||||
|
Total |
$ | 512 | $ | 212 | $ | 392 | $ | 159 | ||||||||
|
Regulatory assets |
$ | 692 | $ | 388 | $ | 571 | $ | 329 | ||||||||
Most of the accrued Superfund Site liability relates to sites that have been investigated, in whole or in part. However, for some of the sites, the extent and associated cost of the required remediation has not yet been determined. As investigations progress and information pertaining to the required remediation becomes available, the Utilities expect that additional liability may be accrued, the amount of which is not presently determinable but may be material. Under their current rate agreements, the Utilities are permitted to recover or defer as regulatory assets (for subsequent recovery through rates) certain site investigation and remediation costs. In February 2011, the NYSPSC initiated a proceeding to examine the existing mechanisms pursuant to which utilities recover such costs and possible alternatives.
Environmental remediation costs incurred and insurance recoveries received related to Superfund Sites at December 31, 2010 and 2009, were as follows:
| Con Edison | CECONY | |||||||||||||||
| (Millions of Dollars) | 2010 | 2009 | 2010 | 2009 | ||||||||||||
|
Remediation costs incurred |
$ | 39 | $ | 77 | $ | 36 | $ | 75 | ||||||||
|
Insurance recoveries received* |
1 | 4 | 1 | 4 | ||||||||||||
| * | Reduced amount deferred for recovery from customers |
In 2010, CECONY estimated that for its manufactured gas plant sites, its aggregate undiscounted potential liability for the investigation and remediation of coal tar and/or other manufactured gas plant-related environmental contaminants could range up to $1.9 billion. In 2010, O&R estimated that for its manufactured gas plant sites, each of which has been investigated, the aggregate undiscounted potential liability for the remediation of such contaminants could range up to $200 million. These estimates were based on the assumption that there is contamination at all sites, including those that have not yet been fully investigated and additional assumptions about the extent of the contamination and the type and extent of the remediation that may be required. Actual experience may be materially different.
Asbestos Proceedings
Suits have been brought in New York State and federal courts against the Utilities and many other defendants, wherein a large number of plaintiffs sought large
| 126 |
Table of Contents
amounts of compensatory and punitive damages for deaths and injuries allegedly caused by exposure to asbestos at various premises of the Utilities. The suits that have been resolved, which are many, have been resolved without any payment by the Utilities, or for amounts that were not, in the aggregate, material to them. The amounts specified in all the remaining thousands of suits total billions of dollars; however, the Utilities believe that these amounts are greatly exaggerated, based on the disposition of previous claims. In 2010, CECONY estimated that its aggregate undiscounted potential liability for these suits and additional suits that may be brought over the next 15 years is $10 million. The estimate was based upon a combination of modeling, historical data analysis and risk factor assessment. Actual experience may be materially different. In addition, certain current and former employees have claimed or are claiming workers’ compensation benefits based on alleged disability from exposure to asbestos. Under its current rate agreements, CECONY is permitted to defer as regulatory assets (for subsequent recovery through rates) costs incurred for its asbestos lawsuits and workers’ compensation claims. The accrued liability for asbestos suits and workers’ compensation proceedings (including those related to asbestos exposure) and the amounts deferred as regulatory assets for the Companies at December 31, 2010 and 2009 were as follows:
| Con Edison | CECONY | |||||||||||||||
| (Millions of Dollars) | 2010 | 2009 | 2010 | 2009 | ||||||||||||
|
Accrued liability – asbestos suits |
$ | 10 | $ | 10 | $ | 10 | $ | 9 | ||||||||
|
Regulatory assets – asbestos suits |
$ | 10 | $ | 10 | $ | 10 | $ | 9 | ||||||||
|
Accrued liability – workers’ compensation |
$ | 106 | $ | 113 | $ | 101 | $ | 108 | ||||||||
|
Regulatory assets – workers’ compensation |
$ | 31 | $ | 37 | $ | 31 | $ | 37 | ||||||||
Note H — Other Material Contingencies
Manhattan Steam Main Rupture
In July 2007, a CECONY steam main located in midtown Manhattan ruptured. It has been reported that one person died and others were injured as a result of the incident. Several buildings in the area were damaged. Debris from the incident included dirt and mud containing asbestos. The response to the incident required the closing of several buildings and streets for various periods. Approximately 110 suits are pending against the company seeking generally unspecified compensatory and, in some cases, punitive damages, for personal injury, property damage and business interruption. The company has not accrued a liability for the suits. The company has notified its insurers of the incident and believes that the policies in force at the time of the incident will cover most of the company’s costs, which the company is unable to estimate, but which could be substantial, to satisfy its liability to others in connection with the incident.
Investigations of Vendor Payments
In January 2009, CECONY commenced an internal investigation relating to the arrests of certain employees and retired employees (all of whom have since pleaded guilty) for accepting kickbacks from contractors that performed construction work for the company. The company has retained a law firm, which has retained an accounting firm, to assist in the company’s investigation. The company is providing information to governmental authorities, which consider the company to be a victim of unlawful conduct, in connection with their investigation of the arrested employees and contractors. The company has terminated its employment of the arrested employees and its contracts with the contractors (one of which is suing the company for substantial damages claiming wrongful termination). In February 2009, the NYSPSC commenced a proceeding that, among other things, will examine the prudence of certain of the company’s expenditures relating to the arrests and consider whether additional expenditures should also be examined (see “Other Regulatory Matters” in Note B).
CECONY is also investigating the September 2010 arrest of a retired employee (for participating in a bribery scheme in which the employee received payments from a bidder that was selected to supply materials to the company) and the January 2011 arrest of an employee (for accepting kickbacks from an engineering firm that performed work for the company). CECONY has provided information to governmental authorities in connection with their ongoing investigations of these matters.
The company, based upon its evaluation of its internal controls for 2010 and previous years, believes that the
| 127 |
Table of Contents
controls were effective to provide reasonable assurance that its financial statements have been fairly presented, in all material respects, in conformity with generally accepted accounting principles. Because the company’s investigations are ongoing, the company is unable to predict the impact of any of the employees’ unlawful conduct on the company’s internal controls, business, results of operations or financial position.
Other Contingencies
See “Lease In/Lease Out Transactions” in Note J.
Guarantees
Con Edison and its subsidiaries enter into various agreements providing financial or performance assurance primarily to third parties on behalf of their subsidiaries. Maximum amounts guaranteed by Con Edison totaled $859 million and $929 million at December 31, 2010 and 2009, respectively.
A summary, by type and term, of Con Edison’s total guarantees at December 31, 2010 is as follows:
| Guarantee Type | 0 – 3 years | 4 – 10 years | > 10 years | Total | ||||||||||||
| (Millions of Dollars) | ||||||||||||||||
|
Commodity transactions |
$ | 543 | $ | 76 | $ | 141 | $ | 760 | ||||||||
|
Affordable housing program |
1 | — | — | 1 | ||||||||||||
|
Intra-company guarantees |
30 | — | 1 | 31 | ||||||||||||
|
Other guarantees |
47 | 20 | — | 67 | ||||||||||||
|
TOTAL |
$ | 621 | $ | 96 | $ | 142 | $ | 859 | ||||||||
Commodity Transactions – Con Edison guarantees payments on behalf of its competitive energy businesses in order to facilitate physical and financial transactions in gas, pipeline capacity, transportation, oil, electricity and related commodity services. To the extent that liabilities exist under the contracts subject to these guarantees, such liabilities are included in Con Edison’s consolidated balance sheet.
Affordable Housing Program – Con Edison Development guarantees the repurchase and remarketing obligations of one of its subsidiaries for debt relating to moderate-income rental apartment properties eligible for tax credits under Section 42 of the Internal Revenue Code. In accordance with applicable accounting rules, neither the rental apartment properties nor the related indebtedness is included on Con Edison’s consolidated balance sheet.
Intra-company Guarantees – Con Edison guarantees electricity sales made by Con Edison Energy and Con Edison Solutions to O&R and CECONY.
Other Guarantees – Con Edison, Con Edison Development and its subsidiaries also guarantee the following:
| • |
$20 million relates to guarantees issued by Con Edison covering RCN Corporation’s lease payment to use CECONY’s conduit system in accordance with a tariff approved by the NYSPSC and rent payment obligations under a lease for an office building. RCN Corporation is obligated to reimburse Con Edison for any payments made under these guarantees. In the case of the guarantee to CECONY, this obligation is partially secured by a letter of credit of $15 million, and, in the case of the other guarantee, this reimbursement is fully secured by a letter of credit; |
| • |
$25 million for guarantees provided by Con Edison for indemnity agreements for surety bonds; |
| • |
$16 million for collateral posted with wholesale counterparties; |
| • |
$6 million for a guarantee provided by Con Edison for Con Edison Development payment of certain solar equipment purchases; |
| • |
In connection with the sale in 2008 by Con Edison Development and its subsidiary of their ownership interests in their electricity generating plants, Con Edison also issued guarantees, which have no specified limitation on the amount guaranteed, covering certain representations and the obligations of Con Edison Development and its subsidiary to pay taxes relating to periods before the sale. See Note U; and |
| • |
Con Edison, on behalf of Con Edison Solutions, as a retail electric provider, issued a guarantee with no specified limitation on the amount guaranteed, covering the payment of all obligations of a retail electric provider required by the Public Utility Commission of Texas. Con Edison’s estimate of the maximum potential obligation is $10 million as of December 31, 2010. |
| 128 |
Table of Contents
Note I — Electricity Purchase Agreements
CECONY has long-term electricity purchase agreements with non-utility generators and others for generating capacity. The company recovers its purchased power costs in accordance with provisions approved by the NYSPSC. See “Recoverable Energy Costs” in Note A.
At December 31, 2010, the significant terms of the electricity purchase agreements were as follows:
| Facility | Equity Owner |
Plant
Output (MW) |
Contracted Output (MW) |
Contract Start Date |
Contract
Term (Years) |
|||||||||||
|
Indian Point |
Entergy Nuclear Power Marketing, LLC | 1,299 | 850 | * | August 2001 | 11 | ||||||||||
|
Independence |
Sithe/Independence Power Partners, LP | 1,254 | 690 | November 1994 | 20 | |||||||||||
|
Linden Cogeneration |
Cogen Technologies Linden Venture, LP | 1,035 | 632 | May 1992 | 25 | |||||||||||
|
Astoria Energy |
Astoria Energy, LLC | 640 | 500 | May 2006 | 10 | |||||||||||
|
Selkirk |
Selkirk Cogen Partners, LP | 383 | 265 | September 1994 | 20 | |||||||||||
|
Brooklyn Navy Yard |
Brooklyn Navy Yard Cogeneration Partners, LP | 322 | 268 | November 1996 | 40 | |||||||||||
|
Indeck Corinth |
Indeck Energy Services of Corinth, Inc. | 147 | 115 | July 1995 | 20 | |||||||||||
| * | Contracted output will decrease to 350 MW in 2011 and in 2012. |
Assuming performance by the parties to the electricity purchase agreements, CECONY is obligated over the terms of the agreements to make capacity and other fixed payments.
For the years 2011 through 2015, the capacity and other fixed payments under the contracts are estimated to be as follows:
| (Millions of Dollars) | 2011 | 2012 | 2013 | 2014 | 2015 | |||||||||||||||
|
CECONY |
$ | 480 | $ | 481 | $ | 479 | $ | 420 | $ | 216 | ||||||||||
For energy delivered under most of the electricity purchase agreements, CECONY is obligated to pay variable prices. The company’s payments under the agreements for capacity, energy and other fixed payments in 2010, 2009 and 2008 were as follows:
| For the Years Ended December 31, | ||||||||||||
| (Millions of Dollars) | 2010 | 2009 | 2008 | |||||||||
|
Indian Point |
$ | 524 | $ | 620 | $ | 561 | ||||||
|
Linden Cogeneration |
414 | 395 | 629 | |||||||||
|
Selkirk |
185 | 175 | 236 | |||||||||
|
Astoria Energy |
223 | 192 | 248 | |||||||||
|
Brooklyn Navy Yard |
123 | 124 | 154 | |||||||||
|
Independence |
119 | 122 | 101 | |||||||||
|
Indeck Corinth |
68 | 68 | 120 | |||||||||
|
Wheelabrator |
0 | 10 | 35 | |||||||||
|
Total |
$ | 1,656 | $ | 1,706 | $ | 2,084 | ||||||
Note J — Leases
Con Edison’s subsidiaries lease electric generating and gas distribution facilities, other electric transmission and distribution facilities, office buildings and equipment. In accordance with the accounting rules for leases, these leases are classified as either capital leases, operating leases or leveraged leases. Most of the operating leases provide the option to renew at the fair rental value for future periods. Generally, it is expected that leases will be renewed or replaced in the normal course of business.
Capital leases: For ratemaking purposes capital leases are treated as operating leases; therefore, in accordance with the accounting rules for regulated operations, the amortization of the leased asset is based on the rental payments recovered from customers. The following assets under capital leases are included in the Companies’ consolidated balance sheets at December 31, 2010 and 2009:
| Con Edison | CECONY | |||||||||||||||
| (Millions of Dollars) | 2010 | 2009 | 2010 | 2009 | ||||||||||||
|
UTILITY PLANT |
||||||||||||||||
|
Transmission |
$ | 2 | $ | 3 | $ | 2 | $ | 3 | ||||||||
|
Common |
11 | 16 | 11 | 16 | ||||||||||||
|
TOTAL |
$ | 13 | $ | 19 | $ | 13 | $ | 19 | ||||||||
| 129 |
Table of Contents
The accumulated amortization of the capital leases for Con Edison and CECONY was $59 million each at December 31, 2010, and $53 million each at December 31, 2009.
The future minimum lease commitments for the above assets are as follows:
| (Millions of Dollars) | Con Edison | CECONY | ||||||
|
2011 |
$ | 8 | $ | 8 | ||||
|
2012 |
6 | 6 | ||||||
|
2013 |
— | — | ||||||
|
2014 |
— | — | ||||||
|
2015 |
— | — | ||||||
|
All years thereafter |
2 | 2 | ||||||
|
Total |
16 | 16 | ||||||
|
Less: amount representing interest |
3 | 3 | ||||||
|
Present value of net minimum lease payment |
$ | 13 | $ | 13 | ||||
CECONY subleases one of its capital leases. The minimum rental to be received in the future under the non-cancelable sublease is $7 million.
Operating leases: The future minimum lease commitments under the Companies’ non-cancelable operating lease agreements are as follows:
| (Millions of Dollars) |
Con
Edison |
CECONY | ||||||
|
2011 |
$ | 46 | $ | 43 | ||||
|
2012 |
47 | 45 | ||||||
|
2013 |
50 | 47 | ||||||
|
2014 |
43 | 41 | ||||||
|
2015 |
12 | 10 | ||||||
|
All years thereafter |
94 | 83 | ||||||
|
Total |
$ | 292 | $ | 269 | ||||
Lease In/Lease Out Transactions
In each of 1997 and 1999, Con Edison Development entered into a transaction in which it leased property and then immediately subleased it back to the lessor (termed “Lease In/Lease Out,” or LILO transactions). The transactions respectively involve electric generating and gas distribution facilities in the Netherlands, with a total investment of $259 million. The transactions were financed with $93 million of equity and $166 million of non-recourse, long-term debt secured by the underlying assets. In accordance with the accounting rules for leases, Con Edison is accounting for the two LILO transactions as leveraged leases. Accordingly, the company’s investment in these leases, net of non-recourse debt, is carried as a single amount in Con Edison’s consolidated balance sheet and income is recognized pursuant to a method that incorporates a level rate of return for those years when net investment in the lease is positive, based upon the after-tax cash flows projected at the inception of the leveraged leases. The company’s investment in these leveraged leases was $(41) million at December 31, 2010 and $(24) million at December 31, 2009 and is comprised of a $235 million gross investment less $276 million of deferred tax liabilities at December 31, 2010 and $235 million gross investment less $259 million of deferred tax liabilities at December 31, 2009.
On audit of Con Edison’s tax return for 1997, the IRS disallowed the tax losses in connection with the 1997 LILO transaction. In December 2005, Con Edison paid a $0.3 million income tax deficiency asserted by the IRS for the tax year 1997 with respect to the 1997 LILO transaction. In April 2006, the company paid interest of $0.2 million associated with the deficiency and commenced an action in the United States Court of Federal Claims, entitled Consolidated Edison Company of New York, Inc. v. United States, to obtain a refund of this tax payment and interest. A trial was completed in November 2007. In October 2009, the court issued a decision in favor of the company concluding that the 1997 LILO transaction was, in substance, a true lease that possessed economic substance, the loans relating to the lease constituted bona fide indebtedness, and the deductions for the 1997 LILO transactions claimed by the company in its 1997 federal income tax return are allowable. The IRS is entitled to appeal the decision.
In connection with its audit of Con Edison’s federal income tax returns for 1998 through 2007, the IRS disallowed $416 million of net tax deductions taken with respect to both of the LILO transactions for the tax years. Con Edison is pursuing administrative appeals of these audit level disallowances. In connection with its audit of Con Edison’s federal income tax return for 2009 and 2008, the IRS has disallowed $41 million and $42 million, respectively, of net tax deductions taken with respect to both of the LILO transactions. When
| 130 |
Table of Contents
these audit level disallowances become appealable, Con Edison intends to file an appeal of the disallowances.
Con Edison believes that its LILO transactions have been correctly reported, and has not recorded any reserve with respect to the disallowance of tax losses, or related interest, in connection with its LILO transactions. Con Edison’s estimated tax savings, reflected in its financial statements, from the two LILO transactions through December 31, 2010, in the aggregate, was $222 million. If Con Edison were required to repay all or a portion of these amounts, it would also be required to pay interest of up to $77 million net of tax at December 31, 2010.
Pursuant to the accounting rules for leveraged lease transactions, the expected timing of income tax cash flows generated by Con Edison’s LILO transactions are required to be reviewed at least annually. If the expected timing of the cash flows is revised, the rate of return and the allocation of income would be recalculated from the inception of the LILO transactions, and the company would be required to recalculate the accounting effect of the LILO transactions, which would result in a charge to earnings that could have a material adverse effect on the company’s results of operations.
Note K — Goodwill
In 2010 and 2009, Con Edison completed impairment tests for its goodwill of $406 million related to the O&R merger, and determined that it was not impaired. For the impairment test, $245 million and $161 million of the goodwill were allocated to CECONY and O&R, respectively. In 2010 and 2009, Con Edison completed impairment tests for the goodwill of $14 million and $10 million, respectively, related to two energy services companies acquired by Con Edison Solutions and determined that it was not impaired. Goodwill of $9 million related to an interest in a gas storage company acquired in 2010 by Con Edison Development will be considered in connection with Con Edison’s 2011 goodwill impairment tests.
Note L — Income Tax
The components of income tax are as follows:
| Con Edison | CECONY | |||||||||||||||||||||||
| (Millions of Dollars) | 2010 | 2009 | 2008 | 2010 | 2009 | 2008 | ||||||||||||||||||
|
State |
||||||||||||||||||||||||
|
Current |
$ | 23 | $ | (12 | ) | $ | 53 | $ | 13 | $ | (1 | ) | $ | 7 | ||||||||||
|
Deferred – net |
106 | 118 | 84 | 100 | 103 | 86 | ||||||||||||||||||
|
Federal |
||||||||||||||||||||||||
|
Current |
(144 | ) | 16 | 1 | (139 | ) | 42 | (110 | ) | |||||||||||||||
|
Deferred – net |
569 | 324 | 392 | 527 | 266 | 420 | ||||||||||||||||||
|
Amortization of investment tax credits |
(6 | ) | (6 | ) | (6 | ) | (6 | ) | (6 | ) | (6 | ) | ||||||||||||
|
TOTAL CHARGE TO INCOME TAX EXPENSE |
$ | 548 | $ | 440 | $ | 524 | $ | 495 | $ | 404 | $ | 397 | ||||||||||||
| 131 |
Table of Contents
The tax effect of temporary differences, which gave rise to deferred tax assets and liabilities, is as follows:
| Con Edison | CECONY | |||||||||||||||
| (Millions of Dollars) | 2010 | 2009 | 2010 | 2009 | ||||||||||||
|
Deferred tax liabilities: |
||||||||||||||||
|
Depreciation |
$ | 3,019 | $ | 2,569 | $ | 2,851 | $ | 2,426 | ||||||||
|
Regulatory Asset – future income tax |
1,760 | 1,489 | 1,666 | 1,404 | ||||||||||||
|
Unrecognized pension and other postretirement costs |
1,775 | 1,814 | 1,686 | 1,727 | ||||||||||||
|
State income tax |
760 | 645 | 668 | 563 | ||||||||||||
|
Capitalized overheads |
508 | 477 | 444 | 419 | ||||||||||||
|
Other |
744 | 646 | 519 | 434 | ||||||||||||
|
Total deferred tax liabilities |
8,566 | 7,640 | 7,834 | 6,973 | ||||||||||||
|
Deferred tax assets: |
||||||||||||||||
|
Unrecognized pension and other postretirement costs |
1,775 | 1,814 | 1,686 | 1,727 | ||||||||||||
|
Regulatory liability – future income tax |
135 | 172 | 119 | 155 | ||||||||||||
|
State income tax |
20 | 27 | 15 | 14 | ||||||||||||
|
Other |
95 | 84 | 1 | 1 | ||||||||||||
|
Total deferred tax assets |
2,025 | 2,097 | 1,821 | 1,897 | ||||||||||||
|
NET LIABILITIES |
6,541 | 5,543 | 6,013 | 5,076 | ||||||||||||
|
INVESTMENT TAX CREDITS |
61 | 66 | 58 | 63 | ||||||||||||
|
DEFERRED INCOME TAXES AND INVESTMENT TAX CREDITS – Non current |
$ | 6,602 | $ | 5,609 | $ | 6,071 | $ | 5,139 | ||||||||
|
DEFERRED INCOME TAXES – RECOVERABLE ENERGY COSTS – Current |
5 | 12 | — | — | ||||||||||||
|
TOTAL DEFERRED INCOME TAXES AND INVESTMENT TAX CREDITS |
$ | 6,607 | $ | 5,621 | $ | 6,071 | $ | 5,139 | ||||||||
Reconciliation of the difference between income tax expense and the amount computed by applying the prevailing statutory income tax rate to income before income taxes is as follows:
| Con Edison | CECONY | |||||||||||||||||||||||
| (% of Pre-tax income) | 2010 | 2009 | 2008 | 2010 | 2009 | 2008 | ||||||||||||||||||
|
STATUTORY TAX RATE |
||||||||||||||||||||||||
|
Federal |
35 | % | 35 | % | 35 | % | 35 | % | 35 | % | 35 | % | ||||||||||||
|
Changes in computed taxes resulting from: |
||||||||||||||||||||||||
|
State income tax |
5 | 5 | 6 | 5 | 6 | 5 | ||||||||||||||||||
|
Depreciation related differences |
— | 1 | 1 | — | 1 | 1 | ||||||||||||||||||
|
Cost of removal |
(4 | ) | (5 | ) | (5 | ) | (4 | ) | (6 | ) | (6 | ) | ||||||||||||
|
Other |
(1 | ) | (3 | ) | (1 | ) | (1 | ) | (2 | ) | (2 | ) | ||||||||||||
|
Effective Tax Rate |
35 | % | 33 | % | 36 | % | 35 | % | 34 | % | 33 | % | ||||||||||||
For federal income tax purposes in 2010, the Companies are projecting a net operating loss of $105 million, primarily as a result of deductions for accelerated depreciation. The Companies intend to file a request for a refund using this net operating loss to offset prior years’ federal taxable income. At December 31, 2010, the refund receivable of $37 million was classified as an other current asset and the estimated 2010 federal income tax payments of $240 million were classified as a prepayment on the Companies’ consolidated balance sheet.
For New York State income tax purposes in 2010, the Companies have a net operating loss carryforward available from the 2009 tax return filing of $220 million, primarily as a result of repair allowance deductions discussed below. A deferred tax asset has been recognized for this New York State net operating loss that will not expire until year end 2029. A valuation allowance has not been provided against the deferred tax asset, as it is more likely than not that the deferred tax asset will be realized.
| 132 |
Table of Contents
Uncertain Tax Positions
Under the accounting rules for income taxes, an enterprise is not allowed to recognize, in its financial statements, the benefit of a tax position unless that position is more likely than not to be sustained upon examination by taxing authorities, including resolution of any related appeals and litigation processes, based solely on the technical merits of the position.
The IRS has essentially completed its field audits of the Companies’ federal income tax returns through 2009. The Companies’ federal income tax returns for 1998 through 2009, which remain open to examination by the IRS, reflect certain tax positions with which the IRS does not or may not agree. Any adjustments to federal income tax returns will result in the Companies’ filing the federal audit changes with New York State to incorporate in the applicable state income tax returns. In addition, the Companies’ New York State tax returns for years beginning with 2006 remain open to examination by New York State.
In September 2010, Con Edison filed the Companies’ federal income tax return for 2009 reflecting, among other things, the deduction of the costs of certain repairs to utility plant as an operating expense (the “repair allowance deductions”). Previously, the Companies capitalized such costs and reported their depreciation in their tax returns. Taking the repair allowance deductions accelerated the timing of the deduction of the cost of the repairs. The Companies had a net operating loss for federal income tax purposes in 2009 reflecting, among other things, the repair allowance deductions and the bonus depreciation provisions of the American Recovery and Reinvestment Act of 2009. In November 2010, Con Edison received a $297 million refund (including $281 million attributable to CECONY) of certain prior years’ federal tax payments based upon the carry-back of the 2009 net operating loss. The Companies also estimate that they had a net operating loss for state income tax purposes for 2009, which is being carried forward and as to which, at December 31, 2010, Con Edison has included a $19 million other current asset in its consolidated balance sheet (including $17 million attributable to CECONY, which is included in accounts receivable from affiliated companies in CECONY’s consolidated balance sheet). At December 31, 2010, with respect to the repair allowance deductions, Con Edison accrued a liability for uncertain tax positions of $51 million (including $49 million attributable to CECONY).
The methods the Companies used to determine which construction-related costs incurred from 2002 through 2008 could be deducted resulted in an uncertain tax position. In July 2008, the IRS entered into a closing agreement with Con Edison covering the extent to which such costs could be deducted in 2002 through 2004. In August 2010, the IRS entered into a closing agreement with Con Edison, covering the extent to which such costs could be deducted in 2005 through 2008. In 2010 the Company instructed the IRS to use the $160 million deposit that it paid to the IRS in June 2007 (of which, $146 million was attributable to CECONY) to pay the taxes due pursuant to the closing agreements. At December 31, 2010, the unrecognized tax benefits included $8 million (including $8 million attributable to CECONY) relating to the deduction of construction-related costs for New York State income tax purposes in 2005 through 2008.
At December 31, 2010, the Companies’ estimated liabilities for uncertain tax positions ($93 million for Con Edison and $79 million for CECONY) were classified as current liabilities on their respective consolidated balance sheets. The Companies reasonably expect to resolve these uncertain tax positions with the IRS in the next 12 months.
The Companies recognize interest accrued related to the liability for uncertain tax positions in interest expense and would recognize penalties, if any, in operating expenses in the Companies’ consolidated income statements. In 2010 and 2009, the Companies recognized an immaterial amount of interest expense for uncertain tax positions.
| 133 |
Table of Contents
A reconciliation of the beginning and ending amounts of unrecognized tax benefits for Con Edison and CECONY follows:
| Con Edison | CECONY | |||||||||||||||||||||||
| (Millions of Dollars) | 2010 | 2009 | 2008 | 2010 | 2009 | 2008 | ||||||||||||||||||
|
Balance at the beginning of the year |
$ | 86 | $ | 118 | $ | 155 | $ | 92 | $ | 108 | $ | 142 | ||||||||||||
|
Additions based on tax positions related to the current year |
5 | — | — | 4 | — | — | ||||||||||||||||||
|
Additions based on tax positions of prior years |
67 | 3 | — | 49 | 1 | — | ||||||||||||||||||
|
Reductions for tax positions of prior years |
(4 | ) | (21 | ) | (14 | ) | (4 | ) | (5 | ) | (13 | ) | ||||||||||||
|
Settlements |
(61 | ) | (14 | ) | (23 | ) | (62 | ) | (12 | ) | (21 | ) | ||||||||||||
|
Balance at the end of the year |
$ | 93 | $ | 86 | $ | 118 | $ | 79 | $ | 92 | $ | 108 | ||||||||||||
Note M — Stock-Based Compensation
The Companies may compensate employees and directors with, among other things, stock options, restricted stock units and contributions to a discount stock purchase plan. The Stock Option Plan (the 1996 Plan) provided for awards of stock options to officers and employees for up to 10 million shares of Con Edison common stock. The Long Term Incentive Plan (LTIP), among other things, provides for awards of restricted stock units, stock options and, to Con Edison’s non-officer directors, deferred stock units for up to 10 million shares of common stock (of which not more than four million shares may be restricted stock or stock units).
Shares of Con Edison common stock used to satisfy the Companies’ obligations with respect to stock-based compensation may be new (authorized, but unissued) shares, treasury shares or shares purchased in the open market. The shares used during the periods ended December 31, 2010 and 2009 have been new shares.
Under the accounting rules for stock compensation, the Companies have recognized the cost of stock-based compensation as an expense using a fair value measurement method. The following table summarizes stock-based compensation expense recognized by the Companies in the period ended December 31, 2010, 2009 and 2008:
| Con Edison | CECONY | |||||||||||||||||||||||
| (Millions of Dollars) | 2010 | 2009 | 2008 | 2010 | 2009 | 2008 | ||||||||||||||||||
|
Stock options |
$ | — | $ | — | $ | 1 | $ | — | $ | — | $ | 1 | ||||||||||||
|
Restricted stock units |
1 | 1 | 1 | 1 | 1 | 1 | ||||||||||||||||||
|
Performance-based restricted stock |
27 | 20 | 8 | 25 | 19 | 7 | ||||||||||||||||||
|
Non-officer director deferred stock compensation |
1 | 1 | 1 | 1 | 1 | 1 | ||||||||||||||||||
|
Total |
$ | 29 | $ | 22 | $ | 11 | $ | 27 | $ | 21 | $ | 10 | ||||||||||||
Stock Options
The Companies last issued stock options in 2006. The stock options generally vested over a three-year period and have a term of ten years. Options were granted at an exercise price equal to the fair market value of a common share when the option was granted. The Companies generally recognized compensation expense (based on the fair value of stock option awards) over the continuous service period in which the options vested. Awards to employees eligible for retirement were expensed in the month awarded.
The outstanding options are “equity awards” because shares of Con Edison common stock are delivered upon exercise of the options. As equity awards, the fair value of the options is measured at the grant date. There were no options granted in 2010 and 2009.
A summary of changes in the status of stock options awarded as of December 31, 2010 is as follows:
| Con Edison | CECONY | |||||||||||||||
| Shares |
|
Weighted
Average Exercise Price |
|
Shares |
|
Weighted
Average Exercise Price |
|
|||||||||
|
Outstanding at 12/31/09 |
5,313,300 | $ | 42.955 | 4,368,800 | $ | 42.988 | ||||||||||
|
Exercised |
(2,372,550 | ) | $ | 42.175 | (1,957,600 | ) | $ | 42.173 | ||||||||
|
Forfeited |
(5,500 | ) | $ | 40.544 | (4,500 | ) | $ | 42.331 | ||||||||
|
Outstanding at 12/31/10 |
2,935,250 | $ | 43.588 | 2,406,700 | $ | 43.652 | ||||||||||
The changes in the fair value of all outstanding options from their grant dates to December 31, 2010 and 2009 (aggregate intrinsic value) for Con Edison were $18 million and $13 million, respectively. The changes in the fair value of all outstanding options from their grant dates to December 31, 2010 and 2009 (aggregate intrinsic value) for CECONY was $14 million and $11
| 134 |
Table of Contents
million, respectively. The aggregate intrinsic value of options exercised in 2010 and 2009 were $15 million and $1 million, respectively, and the cash received by Con Edison for payment of the exercise price was $100 million and $13 million, respectively. The weighted average remaining contractual life of options outstanding is four years as of December 31, 2010.
The following table summarizes stock options outstanding at December 31, 2010 for each plan year for the Companies:
| Con Edison | CECONY | |||||||||||||||||||||||||||
| Plan Year |
Remaining
Contractual Life |
Options Outstanding |
Weighted
Average Exercise Price |
Options
Exercisable |
Options Outstanding |
Weighted
Average Exercise Price |
Options
Exercisable |
|||||||||||||||||||||
|
2006 |
5 | 1,167,200 | $ | 45.418 | 1,167,200 | 1,000,200 | $ | 45.463 | 1,000,200 | |||||||||||||||||||
|
2005 |
4 | 641,000 | 42.729 | 641,000 | 508,750 | 42.696 | 508,750 | |||||||||||||||||||||
|
2004 |
3 | 621,850 | 43.810 | 621,850 | 484,050 | 43.806 | 484,050 | |||||||||||||||||||||
|
2003 |
2 | 208,600 | 39.076 | 208,600 | 167,100 | 39.226 | 167,100 | |||||||||||||||||||||
|
2002 |
1 | 199,300 | 42.510 | 199,300 | 166,800 | 42.510 | 166,800 | |||||||||||||||||||||
|
2001 |
1 | 97,300 | 37.750 | 97,300 | 79,800 | 37.750 | 79,800 | |||||||||||||||||||||
|
Total |
2,935,250 | $ | 43.588 | 2,935,250 | 2,406,700 | $ | 43.652 | 2,406,700 | ||||||||||||||||||||
Restricted Stock Units
Restricted stock unit awards under the LTIP have been made as follows: (i) to officers and certain employees, including awards that provide for adjustment of the number of units (performance-restricted stock units or Performance RSUs); and (ii) in connection with the directors’ deferred compensation plan. Each restricted stock unit awarded represents the right to receive, upon vesting, one share of Con Edison common stock, or, except for units awarded under the directors’ plan, the cash value of a share or a combination thereof.
In accordance with the accounting rules for stock compensation, for outstanding restricted stock awards other than Performance RSUs or awards under the directors’ deferred compensation plan, the Companies have accrued a liability based on the market value of a common share on the grant date and are recognizing compensation expense over the vesting period. The weighted average vesting period for outstanding awards is three years and is based on the employee’s continuous service to Con Edison. Prior to vesting, the awards are subject to forfeiture in whole or in part under certain circumstances. The awards are “liability awards” because each restricted stock unit represents the right to receive, upon vesting, one share of Con Edison common stock, the cash value of a share or a combination thereof. As such, prior to vesting, changes in the fair value of the units are reflected in net income. At December 31, 2010 and 2009, there were 136,359 and 135,048 units outstanding, respectively, for Con Edison, of which 97,959 and 96,598 units were outstanding, respectively, for CECONY. The weighted average fair value as of the grant date of the outstanding units other than Performance RSUs or awards under the directors’ deferred compensation plan for December 31, 2010 and 2009 was $39.898 and $40.812 per unit, respectively, for Con Edison. The weighted average fair value as of the grant date of the outstanding units for December 31, 2010 and 2009 was $41.674 and $42.895 per unit, respectively, for CECONY. The total expense to be recognized by the Companies in future periods for unvested awards outstanding as of December 31, 2010 for Con Edison and CECONY was $1 million.
The number of units in each annual Performance RSU award is subject to adjustment as follows: (i) 50 percent of the units awarded will be multiplied by a factor that may range from 0 to 150 percent based on Con Edison’s total shareholder return relative to a specified peer group during a specified performance period (the TSR portion); and (ii) 50 percent of the units awarded will be multiplied by a factor that may range from 0 to 200 percent based on determinations made in connection with CECONY’s Executive Incentive Plan, or, for certain officers, the O&R Annual Team Incentive Plan or goals relating to Con Edison’s
| 135 |
Table of Contents
competitive energy businesses (the EIP portion). Units generally vest when the performance period ends.
For the TSR portion of Performance RSU, the Companies use a Monte Carlo simulation model to estimate the fair value of the awards. The fair value is recomputed each reporting period as of the earlier of the reporting date and the vesting date. For the EIP portion of Performance RSU, the fair value of the awards is determined using the market price as of the earlier of the reporting date or the vesting date multiplied by the average EIP determination over the vesting period. Performance RSU awards are “liability awards” because each Performance RSU represents the right to receive, upon vesting, one share of Con Edison common stock, the cash value of a share or a combination thereof. As such, changes in the fair value of the Performance RSUs are reflected in net income. The following table illustrates the assumptions used to calculate the fair value of the awards:
| 2010 | ||||
|
Risk-free interest rate |
0.30% -5.62 % | |||
|
Expected term |
3 years | |||
|
Expected volatility |
21.85% | |||
The risk-free rate is based on the U.S. Treasury zero-coupon yield curve on the date of grant. The expected term of the Performance RSUs is three years, which equals the vesting period. The Companies do not expect significant forfeitures to occur. The expected volatility is calculated using daily closing stock prices over a period of three years, which approximates the expected term of the awards.
A summary of changes in the status of the Performance RSUs TSR portion during the period ended December 31, 2010 is as follows:
| Con Edison | CECONY | |||||||||||||||
| Units |
Weighted
Average Fair Value* |
Units |
Weighted
Average Fair Value* |
|||||||||||||
|
Non-vested at 12/31/09 |
426,686 | $ | 54.316 | 357,063 | $ | 54.436 | ||||||||||
|
Granted |
243,750 | 41.340 | 197,074 | 41.340 | ||||||||||||
|
Vested |
(168,511 | ) | 73.035 | (139,163 | ) | 72.873 | ||||||||||
|
Forfeited |
(7,737 | ) | — | (7,113 | ) | — | ||||||||||
|
Non-vested at 12/31/10 |
494,188 | $ | 59.096 | 407,861 | $ | 59.306 | ||||||||||
| * | Fair value is determined using the Monte Carlo simulation described above. Weighted average fair value at December 31, 2010 and weighted average fair value of Performance RSUs granted do not reflect any accrual or payment of dividends prior to vesting. |
A summary of changes in the status of the Performance RSUs’ EIP portion during the period ended December 31, 2010 is as follows:
| Con Edison | CECONY | |||||||||||||||
| Units |
Weighted
Average Fair Value |
Units |
Weighted
Average Fair Value |
|||||||||||||
|
Non-vested at 12/31/09 |
426,686 | $ | 45.430 | 357,063 | $ | 45.430 | ||||||||||
|
Granted |
243,750 | 44.540 | 197,074 | 44.540 | ||||||||||||
|
Vested |
(168,511 | ) | 55.359 | (139,163 | ) | 55.104 | ||||||||||
|
Forfeited |
(7,737 | ) | — | (7,113 | ) | — | ||||||||||
|
Non-vested at 12/31/10 |
494,188 | $ | 55.226 | 407,861 | $ | 55.127 | ||||||||||
| * | Fair value is determined using the market price of one share of Con Edison common stock on the respective dates indicated or the grant or vesting date multiplied by the average Executive Incentive Plan determination over the vesting period. The market price has not been discounted to reflect that dividends do not accrue and are not payable on Performance RSUs until vesting. |
The total expense to be recognized by Con Edison in future periods for unvested Performance RSUs outstanding as of December 31, 2010 is $29 million, including $24 million for CECONY.
Con Edison has a deferred stock compensation plan for non-officer directors. Awards under the deferred compensation stock plan are covered by the LTIP. Each director received 1,500 stock units in 2010 for service as a director. These stock units are deferred until the director’s termination of service. Directors may elect to receive dividend equivalents earned on stock units in cash payments. Restricted stock units issued under the directors’ deferred compensation plan are considered “equity awards,” because they may only be settled in shares. Directors immediately vest in units issued to them. The fair value of the units is determined using the closing price of Con Edison’s common stock on the business day immediately preceding the date of issue. In the period ended December 31, 2010, approximately 24,982 units were issued.
Stock Purchase Plan
The Stock Purchase Plan provides for the Companies to contribute up to $1 for each $9 invested by their directors, officers or employees to purchase Con Edison common stock under the plan. Eligible participants may invest up to $25,000 during any calendar year (subject to an additional limitation for
| 136 |
Table of Contents
officers and employees of not more than 20% of their pay). Dividends paid on shares held under the plan are reinvested in additional shares unless otherwise directed by the participant.
Participants in the plan immediately vest in shares purchased by them under the plan. The fair value of the shares of Con Edison common stock purchased under the plan was calculated using the average of the high and low composite sale prices at which shares were traded at the New York Stock Exchange on the trading day immediately preceding such purchase dates. During 2010, 2009 and 2008, 738,951, 868,622 and 745,869 shares were purchased under the Stock Purchase Plan at a weighted average price of $45.52, $38.15 and $42.47 per share, respectively.
Note N — Financial Information by Business Segment
The business segments of each of the Companies were determined based on management’s reporting and decision-making requirements in accordance with the accounting rules for segment reporting.
Con Edison’s principal business segments are CECONY’s regulated electric, gas and steam utility activities, O&R’s regulated electric and gas utility activities and Con Edison’s competitive energy businesses. See Note U. CECONY’s principal business segments are its regulated electric, gas and steam utility activities.
All revenues of these business segments, excluding revenues earned by Con Edison Development on certain energy infrastructure projects, which are deemed to be immaterial, are from customers located in the United States of America. Also, all assets of the business segments, excluding certain investments in energy infrastructure projects by Con Edison Development ($235 million at December 31, 2010), are located in the United States of America. The accounting policies of the segments are the same as those described in Note A.
Common services shared by the business segments are assigned directly or allocated based on various cost factors, depending on the nature of the service provided.
| 137 |
Table of Contents
The financial data for the business segments are as follows:
|
As of and for the Year Ended December 31, 2010 (Millions of Dollars) |
Operating
revenues |
Inter-segment
revenues |
Depreciation
and amortization |
Operating
income |
Interest
charges |
Income
tax expense |
Total
assets* |
Construction
expenditures |
||||||||||||||||||||||||
|
CECONY |
||||||||||||||||||||||||||||||||
|
Electric |
$ | 8,376 | $ | 12 | $ | 623 | $ | 1,549 | $ | 424 | $ | 371 | $ | 24,942 | $ | 1,421 | ||||||||||||||||
|
Gas |
1,541 | 5 | 102 | 310 | 82 | 91 | 5,038 | 334 | ||||||||||||||||||||||||
|
Steam |
656 | 74 | 62 | 63 | 43 | 29 | 2,455 | 111 | ||||||||||||||||||||||||
|
Consolidation adjustments |
— | (91 | ) | — | — | — | — | — | — | |||||||||||||||||||||||
|
Total CECONY |
$ | 10,573 | $ | — | $ | 787 | $ | 1,922 | $ | 549 | $ | 491 | $ | 32,435 | $ | 1,866 | ||||||||||||||||
|
O&R |
||||||||||||||||||||||||||||||||
|
Electric |
$ | 692 | $ | — | $ | 32 | $ | 74 | $ | 22 | $ | 18 | $ | 1,621 | $ | 99 | ||||||||||||||||
|
Gas |
218 | — | 12 | 34 | 12 | 8 | 684 | 36 | ||||||||||||||||||||||||
|
Other* |
— | — | — | — | 1 | — | 32 | — | ||||||||||||||||||||||||
|
Total O&R |
$ | 910 | $ | — | $ | 44 | $ | 108 | $ | 35 | $ | 26 | $ | 2,337 | $ | 135 | ||||||||||||||||
|
Competitive energy businesses |
$ | 1,883 | $ | 9 | $ | 9 | $ | 97 | $ | (3 | ) | $ | 37 | $ | 807 | $ | 28 | |||||||||||||||
|
Other** |
(41 | ) | (9 | ) | — | (7 | ) | 28 | — | 567 | — | |||||||||||||||||||||
|
Total Con Edison |
$ | 13,325 | $ | — | $ | 840 | $ | 2,120 | $ | 609 | $ | 554 | $ | 36,146 | $ | 2,029 | ||||||||||||||||
|
As of and for the Year Ended December 31, 2009 (Millions of Dollars) |
Operating
revenues |
Inter-segment
revenues |
Depreciation
and amortization |
Operating
income |
Interest
charges |
Income
tax expense |
Total
assets* |
Construction
expenditures |
||||||||||||||||||||||||
|
CECONY |
||||||||||||||||||||||||||||||||
|
Electric |
$ | 7,674 | $ | 12 | $ | 587 | $ | 1,368 | $ | 425 | $ | 300 | $ | 23,309 | $ | 1,596 | ||||||||||||||||
|
Gas |
1,701 | 5 | 98 | 309 | 82 | 90 | 4,796 | 339 | ||||||||||||||||||||||||
|
Steam |
661 | 73 | 59 | 39 | 46 | 12 | 2,356 | 122 | ||||||||||||||||||||||||
|
Consolidation adjustments |
— | (90 | ) | — | — | — | — | — | — | |||||||||||||||||||||||
|
Total CECONY |
$ | 10,036 | $ | — | $ | 744 | $ | 1,716 | $ | 553 | $ | 402 | $ | 30,461 | $ | 2,057 | ||||||||||||||||
|
O&R |
||||||||||||||||||||||||||||||||
|
Electric |
$ | 648 | $ | — | $ | 30 | $ | 64 | $ | 18 | $ | 15 | $ | 1,525 | $ | 85 | ||||||||||||||||
|
Gas |
242 | — | 12 | 28 | 9 | 7 | 627 | 42 | ||||||||||||||||||||||||
|
Other* |
— | — | — | — | 2 | — | 35 | — | ||||||||||||||||||||||||
|
Total O&R |
$ | 890 | $ | — | $ | 42 | $ | 92 | $ | 29 | $ | 22 | $ | 2,187 | $ | 127 | ||||||||||||||||
|
Competitive energy businesses |
$ | 2,147 | $ | — | $ | 5 | $ | 93 | $ | — | $ | 31 | $ | 751 | $ | 10 | ||||||||||||||||
|
Other** |
(41 | ) | — | — | (3 | ) | 29 | — | 445 | — | ||||||||||||||||||||||
|
Total Con Edison |
$ | 13,032 | $ | — | $ | 791 | $ | 1,899 | $ | 611 | $ | 455 | $ | 33,844 | $ | 2,194 | ||||||||||||||||
|
As of and for the Year Ended December 31, 2008 (Millions of Dollars) |
Operating
revenues |
Inter-segment
revenues |
Depreciation
and amortization |
Operating
income |
Interest
charges |
Income
tax expense |
Total
assets* |
Construction
expenditures |
||||||||||||||||||||||||
|
CECONY |
||||||||||||||||||||||||||||||||
|
Electric |
$ | 7,878 | $ | 12 | $ | 521 | $ | 1,333 | $ | 375 | $ | 295 | $ | 23,181 | $ | 1,743 | ||||||||||||||||
|
Gas |
1,839 | 5 | 90 | 303 | 75 | 91 | 4,882 | 338 | ||||||||||||||||||||||||
|
Steam |
707 | 74 | 61 | 31 | 42 | 10 | 2,352 | 121 | ||||||||||||||||||||||||
|
Consolidation adjustments |
— | (91 | ) | — | — | — | — | — | — | |||||||||||||||||||||||
|
Total CECONY |
$ | 10,424 | $ | — | $ | 672 | $ | 1,667 | $ | 492 | $ | 396 | $ | 30,415 | $ | 2,202 | ||||||||||||||||
|
O&R |
||||||||||||||||||||||||||||||||
|
Electric |
$ | 733 | $ | — | $ | 29 | $ | 68 | $ | 18 | $ | 18 | $ | 1,514 | $ | 88 | ||||||||||||||||
|
Gas |
258 | — | 11 | 25 | 9 | 6 | 590 | 32 | ||||||||||||||||||||||||
|
Other* |
— | — | — | — | 1 | — | 58 | — | ||||||||||||||||||||||||
|
Total O&R |
$ | 991 | $ | — | $ | 40 | $ | 93 | $ | 28 | $ | 24 | $ | 2,162 | $ | 120 | ||||||||||||||||
|
Competitive energy businesses |
$ | 2,195 | $ | (11 | ) | $ | 5 | $ | 162 | $ | (2 | ) | $ | 92 | $ | 668 | $ | 4 | ||||||||||||||
|
Other** |
(27 | ) | 11 | — | (2 | ) | 26 | — | 253 | — | ||||||||||||||||||||||
|
Total Con Edison |
$ | 13,583 | $ | — | $ | 717 | $ | 1,920 | $ | 544 | $ | 512 | $ | 33,498 | $ | 2,326 | ||||||||||||||||
| * | Includes amounts related to the RECO securitization. |
| ** | Parent company expenses, primarily interest, and consolidation adjustments. Other does not represent a business segment. |
| 138 |
Table of Contents
Note O — Derivative Instruments and Hedging Activities
Under the accounting rules for derivatives and hedging, derivatives are recognized on the balance sheet at fair value, unless an exception is available under the accounting rules. Certain qualifying derivative contracts have been designated as normal purchases or normal sales contracts. These contracts are not reported at fair value under the accounting rules.
Energy Price Hedging
Con Edison’s subsidiaries hedge market price fluctuations associated with physical purchases and sales of electricity, natural gas, and steam by using derivative instruments including futures, forwards, basis swaps, options, transmission congestion contracts and financial transmission rights contracts. The fair values of these hedges at December 31, 2010 and 2009 were as follows:
| Con Edison | CECONY | |||||||||||||||
| (Millions of Dollars) | 2010 | 2009 | 2010 | 2009 | ||||||||||||
|
Fair value of net derivative assets/(liabilities) – gross |
$ | (261 | ) | $ | (266 | ) | $ | (156 | ) | $ | (137 | ) | ||||
|
Impact of netting of cash collateral |
176 | 162 | 104 | 87 | ||||||||||||
|
Fair value of net derivative assets/(liabilities) – net |
$ | (85 | ) | $ | (104 | ) | $ | (52 | ) | $ | (50 | ) | ||||
Credit Exposure
The Companies are exposed to credit risk related to transactions entered into primarily for the various energy supply and hedging activities by the Utilities and the competitive energy businesses. The Companies use credit policies to manage this risk, including an established credit approval process, monitoring of counterparty limits, netting provisions within agreements, collateral or prepayment arrangements, credit insurance and credit default swaps.
At December 31, 2010, Con Edison and CECONY had $157 million and $36 million of credit exposure in connection with energy supply and hedging activities, net of collateral, respectively. Con Edison’s net credit exposure consisted of $76 million with investment-grade counterparties, $55 million with commodity exchange brokers and $26 million with independent system operators. CECONY’s net credit exposure was primarily with commodity exchange brokers.
Economic Hedges
The Companies enter into certain derivative instruments that do not qualify or are not designated as hedges under the accounting rules for derivatives and hedging. However, management believes these instruments represent economic hedges that mitigate exposure to fluctuations in commodity prices.
| 139 |
Table of Contents
The fair values of the Companies’ commodity derivatives at December 31, 2010 were:
| Fair Value of Commodity Derivatives(a) | ||||||||||
| (Millions of Dollars) | Balance Sheet Location |
Con
Edison |
CECONY | |||||||
| Derivatives Asset | ||||||||||
|
Current |
Other current assets | $ | 184 | $ | 29 | |||||
|
Long term |
Other deferred charges and non-current assets | 51 | 19 | |||||||
|
Total derivatives asset |
$ | 235 | $ | 48 | ||||||
|
Impact of netting |
(129 | ) | — | |||||||
|
Net derivatives asset |
$ | 106 | $ | 48 | ||||||
| Derivatives Liability | ||||||||||
|
Current |
Fair value of derivative liabilities | $ | 385 | $ | — | |||||
|
Current |
Other current liabilities | — | 148 | |||||||
|
Long term |
Fair value of derivative liabilities | 111 | 56 | |||||||
|
Total derivatives liability |
$ | 496 | $ | 204 | ||||||
|
Impact of netting |
(305 | ) | (104 | ) | ||||||
|
Net derivatives liability |
$ | 191 | $ | 100 | ||||||
| (a) | Qualifying derivative contracts, which have been designated as normal purchases or normal sales contracts, are not reported at fair value under the accounting rules for derivatives and hedging and, therefore, are excluded from the table. |
The fair value of the Companies’ commodity derivatives at December 31, 2009 were:
| Fair Value of Commodity Derivatives(a) | ||||||||||
| (Millions of Dollars) | Balance Sheet Location |
Con
Edison |
CECONY | |||||||
| Derivatives Asset | ||||||||||
|
Current |
Other current assets | $ | 213 | $ | 40 | |||||
|
Long term |
Other deferred charges and non-current assets | 148 | 19 | |||||||
|
Total derivatives asset |
$ | 361 | $ | 59 | ||||||
|
Impact of netting |
(231 | ) | (20 | ) | ||||||
|
Net derivatives asset |
$ | 130 | $ | 39 | ||||||
| Derivatives Liability | ||||||||||
|
Current |
Fair value of derivative liabilities | $ | 401 | $ | — | |||||
|
Current |
Other current liabilities | — | 110 | |||||||
|
Long term |
Fair value of derivative liabilities | 226 | 86 | |||||||
|
Total derivatives liability |
$ | 627 | $ | 196 | ||||||
|
Impact of netting |
(393 | ) | (107 | ) | ||||||
|
Net derivatives liability |
$ | 234 | $ | 89 | ||||||
| (a) | Qualifying derivative contracts, which have been designated as normal purchases or normal sales contracts, are not reported at fair value under the accounting rules for derivatives and hedging and, therefore, are excluded from the table. |
The Utilities generally recover all of their prudently incurred fuel, purchased power and gas cost, including hedging gains and losses, in accordance with rate provisions approved by the applicable state utility commissions. See “Recoverable Energy Costs” in Note A. In accordance with the accounting rules for regulated operations, the Utilities record a regulatory asset or liability to defer recognition of unrealized gains and losses on their electric and gas derivatives. As gains and losses are realized in future periods, they will be recognized as purchased power, gas and fuel costs in the Companies’ consolidated income statements. Con Edison’s competitive energy businesses record realized and unrealized gains and losses on their derivative contracts in earnings in the reporting period in which they occur.
| 140 |
Table of Contents
The following table presents the changes in the fair values of commodity derivatives that have been deferred or recognized in earnings for the year ended December 31, 2010:
|
Realized and Unrealized Gains/(Losses) on Commodity Derivatives(a) Deferred or Recognized in Income for the Year Ended December 31, 2010 |
||||||||||||
| (Millions of Dollars) | Balance Sheet Location | Con Edison | CECONY | |||||||||
|
Pre-tax gains/(losses) deferred in accordance with accounting rules for regulated operations: |
||||||||||||
|
Current |
Deferred derivative gains | $ | (5 | ) | $ | (5 | ) | |||||
|
Long-term |
Regulatory liabilities | 1 | 1 | |||||||||
|
Total deferred gains |
|
$ | (4 | ) | $ | (4 | ) | |||||
|
Current |
Deferred derivative losses | $ | (49 | ) | $ | (47 | ) | |||||
|
Current |
Recoverable energy costs | (285 | ) | (240 | ) | |||||||
|
Long term |
Regulatory assets | 32 | 27 | |||||||||
|
Total deferred losses |
|
$ | (302 | ) | $ | (260 | ) | |||||
|
Net deferred losses |
|
$ | (306 | ) | $ | (264 | ) | |||||
| Income Statement Location | ||||||||||||
|
Pre-tax gain/(loss) recognized in income |
||||||||||||
| Purchased power expense | $ | (173 | )(b) | $ | — | |||||||
| Gas purchased for resale | (9 | ) | — | |||||||||
| Non-utility revenue | 26 | (b) | — | |||||||||
|
Total pre-tax gain/(loss) recognized in income |
|
$ | (156 | ) | $ | — | ||||||
| (a) | Qualifying derivative contracts, which have been designated as normal purchases or normal sales contracts, are not reported at fair value under the accounting rules for derivatives and hedging and, therefore, are excluded from the table. |
| (b) | For the year ended December 31, 2010, Con Edison recorded in non-utility operating revenues and purchased power expense an unrealized pre-tax gain/(loss) of $(36) million and $56 million, respectively. |
The following table presents the changes in the fair values of commodity derivatives that have been deferred or recognized in earnings for the year ended December 31, 2009:
|
Realized and Unrealized Gains/(Losses) on Commodity Derivatives(a) Deferred or Recognized in Income for the Year Ended December 31, 2009 |
||||||||||||
| (Millions of Dollars) | Balance Sheet Location | Con Edison | CECONY | |||||||||
|
Pre-tax gains/(losses) deferred in accordance with accounting rules for regulated operations: |
||||||||||||
|
Current |
Deferred derivative gains | $ | (15 | ) | $ | (15 | ) | |||||
|
Total deferred gains |
$ | (15 | ) | $ | (15 | ) | ||||||
|
Current |
Deferred derivative losses | $ | 147 | $ | 143 | |||||||
|
Current |
Recoverable energy costs | (558 | ) | (471 | ) | |||||||
|
Long term |
Regulatory assets | (15 | ) | (21 | ) | |||||||
|
Total deferred losses |
$ | (426 | ) | $ | (349 | ) | ||||||
|
Net deferred losses |
$ | (441 | ) | $ | (364 | ) | ||||||
| Income Statement Location | ||||||||||||
|
Pre-tax gain/(loss) recognized in income |
||||||||||||
| Purchased power expense | $ | (562 | )(b) | $ | — | |||||||
| Gas purchased for resale | 9 | — | ||||||||||
| Non-utility revenue | 30 | (b) | — | |||||||||
|
Total pre-tax gain/(loss) recognized in income |
$ | (523 | ) | $ | — | |||||||
| (a) | Qualifying derivative contracts, which have been designated as normal purchases or normal sales contracts, are not reported at fair value under the accounting rules for derivatives and hedging and, therefore, are excluded from the table. |
| (b) | For the year ended December 31, 2009, Con Edison recorded in non-utility operating revenues and purchased power expense an unrealized pre-tax gain/(loss) of $196 million and $(165) million, respectively. |
| 141 |
Table of Contents
As of December 31, 2010, Con Edison had 1,559 contracts, including 697 CECONY contracts, which were considered to be derivatives under the accounting rules for derivatives and hedging (excluding qualifying derivative contracts, which have been designated as normal purchases or normal sales contracts). The following table presents the number of contracts by commodity type:
| Electric Derivatives | Gas Derivatives | |||||||||||||||||||||||||||
|
Number of
Energy Contracts(a) |
MWhs(b) |
Number of
Capacity Contracts(a) |
MWs(b) |
Number
of
|
Dths(b) |
Total Number Of Contracts(a) |
||||||||||||||||||||||
|
Con Edison |
799 | 20,569,025 | 48 | 10,524 | 712 | 136,269,210 | 1,559 | |||||||||||||||||||||
|
CECONY |
161 | 4,556,675 | — | — | 536 | 126,050,000 | 697 | |||||||||||||||||||||
| (a) | Qualifying derivative contracts, which have been designated as normal purchases or normal sales contracts, are not reported at fair value under the accounting rules for derivatives and hedging and, therefore, are excluded from the table. |
| (b) | Volumes are reported net of long and short positions. |
The Companies also enter into electric congestion and gas basis swap contracts to hedge the congestion and transportation charges which are associated with electric and gas contracts and hedged volumes.
The collateral requirements associated with, and settlement of, derivative transactions are included in net cash flows from operating activities in the Companies’ consolidated statement of cash flows. Most derivative instrument contracts contain provisions that may require the Companies to provide collateral on derivative instruments in net liability positions. The amount of collateral to be provided will depend on the fair value of the derivative instruments and the Companies’ credit ratings.
The aggregate fair value of all derivative instruments with credit-risk-related contingent features that are in a net liability position and collateral posted at December 31, 2010, and the additional collateral that would have been required to be posted had the lowest applicable credit rating been reduced one level and to below investment grade were:
| (Millions of Dollars) | Con Edison(a) | CECONY(a) | ||||||
|
Aggregate fair value – net liabilities |
$ | 249 | $ | 124 | ||||
|
Collateral posted |
$ | 105 | $ | 78 | (b) | |||
|
Additional collateral(c) (downgrade one level from current ratings(d)) |
$ | 58 | $ | 9 | ||||
|
Additional collateral(c) (downgrade to below investment grade from current ratings(d)) |
$ | 180 | (e) | $ | 55 | (e) | ||
| (a) | Non-derivative transactions for the purchase and sale of electricity and gas and qualifying derivative instruments, which have been designated as normal purchases or normal sales, are excluded from the table. These transactions primarily include purchases of electricity from independent system operators. In the event the Utilities and Con Edison’s competitive energy businesses were no longer extended unsecured credit for such purchases, the Companies would be required to post collateral, which at December 31, 2010, would have amounted to an estimated $101 million for Con Edison, including $0 million for CECONY. For certain other such non-derivative transactions, the Companies could be required to post collateral under certain circumstances, including in the event counterparties had reasonable grounds for insecurity. |
| (b) | Across the Utilities’ energy derivative positions, credit limits for the same counterparties are generally integrated. At December 31, 2010, the Utilities posted combined collateral of $102 million, including an estimated $24 million attributable to O&R. |
| (c) | The Companies measure the collateral requirements by taking into consideration the fair value amounts of derivative instruments that contain credit-risk-related contingent features that are in a net liabilities position plus amounts owed to counterparties for settled transactions and amounts required by counterparties for minimum financial security. The fair value amounts represent unrealized losses, net of any unrealized gains where the Companies have a legally enforceable right of setoff. |
| (d) | The current ratings are Moody’s, S&P and Fitch long-term credit rating of, as applicable, Con Edison (Baa1/BBB+/BBB+), CECONY (A3/A-/A-) or O&R (Baa1/A-/A-). Credit ratings assigned by rating agencies are expressions of opinions that are subject to revision or withdrawal at any time by the assigning rating agency. |
| (e) | Derivative instruments that are net assets have been excluded from the table. At December 31, 2010, if Con Edison had been downgraded to below investment grade, it would have been required to post additional collateral for such derivative instruments of not more than $24 million. |
Interest Rate Swaps
O&R has an interest rate swap pursuant to which it pays a fixed-rate of 6.09 percent and receives a LIBOR-based variable rate. The fair value of this interest rate swap at December 31, 2010 was an unrealized loss of $10 million, which has been included in Con Edison’s consolidated balance sheet as a noncurrent liability/fair value of derivative liabilities and a regulatory asset. The increase in the fair value of the swap for the year ended December 31, 2010 was $1 million. In the event O&R’s credit rating was downgraded to BBB- or lower by S&P or Baa3 or lower by Moody’s, the swap counterparty could elect to terminate the agreement and, if it did so, the parties would then be required to settle the transaction.
| 142 |
Table of Contents
Note P — Fair Value Measurements
The accounting rules for fair value measurements and disclosures define fair value as the price that would be received to sell an asset or paid to transfer a liability in an orderly transaction between market participants at the measurement date in a principal or most advantageous market. Fair value is a market-based measurement that is determined based on inputs, which refer broadly to assumptions that market participants use in pricing assets or liabilities. These inputs can be readily observable, market corroborated, or generally unobservable firm inputs. The Companies often make certain assumptions that market participants would use in pricing the asset or liability, including assumptions about risk, and the risks inherent in the inputs to valuation techniques. The Companies use valuation techniques that maximize the use of observable inputs and minimize the use of unobservable inputs.
The accounting rules for fair value measurements and disclosures require consideration of the impact of nonperformance risk (including credit risk) from a market participant perspective in the measurement of the fair value of assets and liabilities. At December 31, 2010, the Companies determined that nonperformance risk would have no material impact on their financial position or results of operations. To assess nonperformance risk, the Companies considered information such as collateral requirements, master netting arrangements, letters of credit and parent company guarantees, and applied a market-based method by using the counterparty (for an asset) or the Companies’ (for a liability) credit default swaps rates.
The accounting rules for fair value measurements and disclosures established a fair value hierarchy, which prioritizes the inputs to valuation techniques used to measure fair value in three broad levels. The rules require that assets and liabilities be classified in their entirety based on the level of input that is significant to the fair value measurement. Assessing the significance of a particular input may require judgment considering factors specific to the asset or liability, and may affect the valuation of the asset or liability and their placement within the fair value hierarchy. The Companies classify fair value balances based on the fair value hierarchy defined by the accounting rules for fair value measurements and disclosures as follows:
| • |
Level 1 – Consists of assets or liabilities whose value is based on unadjusted quoted prices in active markets at the measurement date. An active market is one in which transactions for assets or liabilities occur with sufficient frequency and volume to provide pricing information on an ongoing basis. This category includes contracts traded on active exchange markets valued using unadjusted prices quoted directly from the exchange. |
| • |
Level 2 – Consists of assets or liabilities valued using industry standard models and based on prices, other than quoted prices within Level 1, that are either directly or indirectly observable as of the measurement date. The industry standard models consider observable assumptions including time value, volatility factors, and current market and contractual prices for the underlying commodities, in addition to other economic measures. This category includes contracts traded on active exchanges or in over-the-counter markets priced with industry standard models. |
| • |
Level 3 – Consists of assets or liabilities whose fair value is estimated based on internally developed models or methodologies using inputs that are generally less readily observable and supported by little, if any, market activity at the measurement date. Unobservable inputs are developed based on the best available information and subject to cost benefit constraints. This category includes contracts priced using models that are internally developed and contracts placed in illiquid markets. It also includes contracts that expire after the period of time for which quoted prices are available and internal models are used to determine a significant portion of the value. |
Effective January 1, 2010, the Companies adopted Accounting Standards Update (ASU) No. 2010-06, “Fair Value Measurements and Disclosures (Topic 820): Improving Disclosures about Fair Value Measurements,” This update requires the Companies to disclose significant transfers in and out of Level 1
| 143 |
Table of Contents
and Level 2 fair value measurements and describe the reasons for the transfers. The guidance also clarifies level of disaggregation and disclosure requirements about inputs and valuation techniques used to measure fair value for both recurring and nonrecurring fair value measurements and the meaning of a class of assets and liabilities. In addition, the update requires the Companies to present information about purchases, sales, issuances, and settlements on a gross basis in the reconciliation for fair value measurements using significant unobservable inputs (Level 3).
The valuation technique used by the Companies with regard to commodity derivatives and other assets that fall into either Level 2 or Level 3 is the market approach, which uses prices and other relevant information generated by market transactions involving identical or comparable assets and liabilities. The valuation technique used by the Companies with regard to the interest rate contract that falls into Level 3 is the income approach which uses valuation techniques to convert future income stream amounts to a single amount in present value terms.
Assets and liabilities measured at fair value on a recurring basis as of December 31, 2010 are summarized below.
| Level 1 | Level 2 | Level 3 |
Netting Adjustments (4) |
Total | ||||||||||||||||||||||||||||||||||||
| (Millions of Dollars) |
Con
Edison |
CECONY |
Con
Edison |
CECONY |
Con
Edison |
CECONY |
Con
Edison |
CECONY |
Con
Edison |
CECONY | ||||||||||||||||||||||||||||||
|
Derivative assets: |
||||||||||||||||||||||||||||||||||||||||
|
Commodity(1) |
$ | 2 | $ | 1 | $ | 72 | $ | 21 | $ | 144 | $ | 13 | $ | (112 | ) | $ | 13 | $ | 106 | $ | 48 | |||||||||||||||||||
|
Other assets(3) |
65 | 64 | — | — | 101 | 92 | — | — | 166 | 156 | ||||||||||||||||||||||||||||||
|
Total |
$ | 67 | $ | 65 | $ | 72 | $ | 21 | $ | 245 | $ | 105 | $ | (112 | ) | $ | 13 | $ | 272 | $ | 204 | |||||||||||||||||||
|
Derivative liabilities: |
||||||||||||||||||||||||||||||||||||||||
|
Commodity |
$ | 4 | $ | 2 | $ | 270 | $ | 177 | $ | 205 | $ | 12 | $ | (288 | ) | $ | (91 | ) | $ | 191 | $ | 100 | ||||||||||||||||||
|
Transfer in(5)(6)(7) |
— | — | (36 | ) | (36 | ) | (9 | ) | (9 | ) | — | — | (45 | ) | (45 | ) | ||||||||||||||||||||||||
|
Transfer out(5)(6)(7) |
— | — | 9 | 9 | 36 | 36 | — | — | 45 | 45 | ||||||||||||||||||||||||||||||
|
Commodity(1) |
$ | 4 | $ | 2 | $ | 243 | $ | 150 | 232 | 39 | $ | (288 | ) | $ | (91 | ) | $ | 191 | $ | 100 | ||||||||||||||||||||
|
Interest rate contract(2) |
— | — | — | — | 10 | — | — | — | 10 | — | ||||||||||||||||||||||||||||||
|
Total |
$ | 4 | $ | 2 | $ | 243 | $ | 150 | $ | 242 | $ | 39 | $ | (288 | ) | $ | (91 | ) | $ | 201 | $ | 100 | ||||||||||||||||||
| (1) | A significant portion of the commodity derivative contracts categorized in Level 3 is valued using either an industry acceptable model or an internally developed model with observable inputs. The models also include some less readily observable inputs resulting in the classification of the entire contract as Level 3. See Note O. |
| (2) | See Note O. |
| (3) | Other assets are comprised of assets such as life insurance contracts within the Deferred Income Plan and Supplemental Retirement Income Plans, held in rabbi trusts. |
| (4) | Amounts represent the impact of legally-enforceable master netting agreements that allow the Companies to net gain and loss positions and cash collateral held or placed with the same counterparties. |
| (5) | The Companies’ policy is to recognize transfers into and transfers out of the levels at the end of the reporting period. |
| (6) | Transferred from Level 2 to Level 3 because of reassessment of the levels in the fair value hierarchy within which certain inputs fall. |
| (7) | Transferred from Level 3 to Level 2 because of availability of observable market data due to decrease in the terms of certain contracts from beyond one year as of December 31, 2009 to less than one year as of December 31, 2010. |
Table of Contents
Assets and liabilities measured at fair value on a recurring basis as of December 31, 2009 are summarized below.
| Level 1 | Level 2 | Level 3 |
Netting Adjustments(4) |
Total | ||||||||||||||||||||||||||||||||||||
| (Millions of Dollars) |
Con
Edison |
CECONY |
Con
Edison |
CECONY |
Con
Edison |
CECONY |
Con
Edison |
CECONY |
Con
Edison |
CECONY | ||||||||||||||||||||||||||||||
|
Derivative assets: |
||||||||||||||||||||||||||||||||||||||||
|
Commodity (1) |
$ | 3 | $ | 3 | $ | 92 | $ | 21 | $ | 201 | $ | 17 | $ | (166 | ) | $ | (2 | ) | $ | 130 | $ | 39 | ||||||||||||||||||
|
Other assets (3) |
36 | 36 | — | — | 92 | 83 | — | — | 128 | 119 | ||||||||||||||||||||||||||||||
|
Total |
$ | 39 | $ | 39 | $ | 92 | $ | 21 | $ | 293 | $ | 100 | $ | (166 | ) | $ | (2 | ) | $ | 258 | $ | 158 | ||||||||||||||||||
|
Derivative liabilities: |
||||||||||||||||||||||||||||||||||||||||
|
Commodity (1) |
$ | 6 | $ | 1 | $ | 296 | $ | 155 | $ | 260 | $ | 22 | $ | (328 | ) | $ | (89 | ) | $ | 234 | $ | 89 | ||||||||||||||||||
|
Interest rate contract (2) |
— | — | — | — | 11 | — | — | — | 11 | — | ||||||||||||||||||||||||||||||
|
Total |
$ | 6 | $ | 1 | $ | 296 | $ | 155 | $ | 271 | $ | 22 | $ | (328 | ) | $ | (89 | ) | $ | 245 | $ | 89 | ||||||||||||||||||
| (1) | A significant portion of the commodity derivative contracts categorized in Level 3 is valued using either an industry acceptable model or an internally developed model with observable inputs. The models also include some less readily observable inputs resulting in the classification of the entire contract as Level 3. See Note O. |
| (2) | See Note O. |
| (3) | Other assets are comprised of assets such as life insurance contracts within the Deferred Income Plan and Supplemental Retirement Income Plans, held in rabbi trusts. |
| (4) | Amounts represent the impact of legally-enforceable master netting agreements that allow the Companies to net gain and loss positions and cash collateral held or placed with the same counterparties. |
The table listed below provides a reconciliation of the beginning and ending net balances for assets and liabilities measured at fair value for the years ended December 31, 2010 and 2009 and classified as Level 3 in the fair value hierarchy:
| For the Year Ended December 31, 2010 | ||||||||||||||||||||||||
| (Millions of Dollars) |
Beginning
Balance as of January 1, 2010 |
Total Gains/(Losses) – Realized and Unrealized |
Purchases,
Issuances, Sales and Settlements |
Transfer
In/Out of Level 3 |
Ending
Balance as of
|
|||||||||||||||||||
|
Included in
Earnings |
Included in
Regulatory Assets and Liabilities |
|||||||||||||||||||||||
|
Con Edison |
||||||||||||||||||||||||
|
Derivatives: |
||||||||||||||||||||||||
|
Commodity |
$ | (59 | ) | $ | (73 | ) | $ | (37 | ) | $ | 54 | $ | 27 | $ | (88 | ) | ||||||||
|
Interest rate contract |
(11 | ) | (3 | ) | 1 | 3 | — | (10 | ) | |||||||||||||||
|
Other assets(1) |
92 | 3 | 6 | — | — | 101 | ||||||||||||||||||
|
Total |
$ | 22 | $ | (73 | ) | $ | (30 | ) | $ | 57 | $ | 27 | $ | 3 | ||||||||||
|
CECONY |
||||||||||||||||||||||||
|
Derivatives: |
||||||||||||||||||||||||
|
Commodity |
$ | (5 | ) | $ | (14 | ) | $ | (44 | ) | $ | 10 | $ | 27 | $ | (26 | ) | ||||||||
|
Other assets(1) |
83 | 3 | 6 | — | — | 92 | ||||||||||||||||||
|
Total |
$ | 78 | $ | (11 | ) | $ | (38 | ) | $ | 10 | $ | 27 | $ | 66 | ||||||||||
| (1) | Amounts included in earnings are reported in investment and other income on the consolidated income statement. |
| 145 |
Table of Contents
| For the Year Ended December 31, 2009 | ||||||||||||||||||||||||
|
(Millions of Dollars) |
Total Gains/(Losses) –
Realized and Unrealized |
Transfer
In/Out of Level 3 |
Ending
Balance as of December 31, 2009 |
|||||||||||||||||||||
|
Beginning
Balance as of January 1, 2009 |
Included in
Earnings |
Included in
Regulatory Assets and Liabilities |
Purchases,
Issuances, Sales and Settlements |
|||||||||||||||||||||
|
Con Edison |
||||||||||||||||||||||||
|
Derivatives: |
||||||||||||||||||||||||
|
Commodity |
$ | (50 | ) | $ | (249 | ) | $ | (23 | ) | $ | 263 | $ | — | $ | (59 | ) | ||||||||
|
Interest rate contract |
(15 | ) | (3 | ) | 4 | 3 | — | (11 | ) | |||||||||||||||
|
Other assets(1) |
73 | 7 | 12 | — | — | 92 | ||||||||||||||||||
|
Total |
$ | 8 | $ | (245 | ) | $ | (7 | ) | $ | 266 | $ | — | $ | 22 | ||||||||||
|
CECONY |
||||||||||||||||||||||||
|
Derivatives: |
||||||||||||||||||||||||
|
Commodity |
$ | 1 | $ | (23 | ) | $ | (20 | ) | $ | 37 | $ | — | $ | (5 | ) | |||||||||
|
Other assets(1) |
65 | 7 | 11 | — | — | 83 | ||||||||||||||||||
|
Total |
$ | 66 | $ | (16 | ) | $ | (9 | ) | $ | 37 | $ | — | $ | 78 | ||||||||||
| (1) | Amounts included in earnings are reported in investment and other income on the consolidated income statement. |
For the Utilities, realized gains and losses on Level 3 commodity derivative assets and liabilities are reported as part of purchased power, gas and fuel costs. The Utilities generally recover these costs in accordance with rate provisions approved by the applicable state public utilities commissions. See Note A. Unrealized gains and losses for commodity derivatives are generally deferred on the consolidated balance sheet in accordance with the accounting rules for regulated operations.
For the competitive energy businesses, realized and unrealized gains and losses on Level 3 commodity derivative assets and liabilities are reported in non-utility revenues ($22 million gain and $17 million gain) and purchased power costs ($44 million loss and $184 million loss) on the consolidated income statement for the years ended December 31, 2010 and 2009, respectively. The change in fair value relating to Level 3 commodity derivative assets held at December 31, 2010 and 2009 is included in non-utility revenues ($37 million loss and $27 million loss), and purchased power costs ($24 million gain and $28 million gain) on the consolidated income statement for the years ended December 31, 2010 and 2009, respectively.
Note Q – Variable Interest Entities
Effective January 1, 2010, the Companies adopted ASU No. 2009-17, “Consolidations (Topic 810): Improvements to Financial Reporting by Enterprises Involved with Variable Interest Entities.” The Companies have not identified any interests they have in any variable interest entity (VIE) that would require the Companies to include the financial position and results of operations of the VIE in the Companies’ consolidated financial statements.
The accounting rules for consolidation address the consolidation of a VIE by a business enterprise that is the primary beneficiary. A VIE is an entity that does not have a sufficient equity investment at risk to permit it to finance its activities without additional subordinated financial support, or whose equity investors lack the characteristics of a controlling financial interest. The primary beneficiary is the business enterprise that has the power to direct the activities of the VIE that most significantly impact the VIE’s economic performance and either absorbs a significant amount of the VIE’s losses or has the right to receive benefits that could be significant to the VIE.
Con Edison enters into arrangements including leases, partnerships and electricity purchase agreements, with various entities. As a result of these arrangements, Con Edison retains or may retain a variable interest in these entities.
Con Edison has a variable interest in a non-consolidated VIE related to Con Edison Development’s sole limited interest in an affordable
| 146 |
Table of Contents
housing partnership that began in 2000. Con Edison is not the primary beneficiary of this VIE since Con Edison Development is a limited partner in the arrangement and does not hold any rights to manage or control the business of the partnership. Con Edison Development’s maximum exposure to loss as a result of its involvement with the VIE is $0.3 million at December 31, 2010 and $4 million at December 31, 2009. The maximum exposure to loss is the carrying value of the investment less amortization. In addition, Con Edison has guaranteed the debt undertaken by the partnership. See Note H.
CECONY has a variable interest in a non-consolidated VIE, Astoria Energy, LLC (Astoria Energy), with which CECONY has entered into a long-term electricity purchase agreement. CECONY is not the primary beneficiary of this VIE since CECONY does not have the power to direct the activities that CECONY believes most significantly impact the economic performance of Astoria Energy. In particular, CECONY has not invested in, or guaranteed the indebtedness of, Astoria Energy and CECONY does not operate or maintain Astoria Energy’s generating facilities. CECONY also has long-term electricity purchase agreements with the following five potential VIEs: Sithe/Independence Power Partners, LP, Cogen Technologies Linden Venture, LP, Selkirk Cogen Partners, LP, Brooklyn Navy Yard Cogeneration Partners, LP, and Indeck Energy Services of Corinth, Inc. In each quarter of 2010, requests were made of these five counterparties for information necessary to determine whether the entity was a VIE and whether CECONY is the primary beneficiary; however, the information was not made available. See Note I for information on these electricity purchase agreements, the payments pursuant to which constitute CECONY’s maximum exposure to loss with respect to Astoria Energy and the five potential VIEs.
Con Edison has a variable interest in a non-consolidated VIE, Pilesgrove Solar, LLC (Pilesgrove), in which Con Edison Development, starting in 2010, is participating with a third party to develop, construct, and operate a photovoltaic solar energy generation project. Con Edison is not the primary beneficiary of this VIE since the power to direct the activities that most significantly impact the economics of Pilesgrove is shared equally between Con Edison Development and the third party. Included in the Companies’ consolidated balance sheet at December 31, 2010 is $32 million in assets related to Pilesgrove which primarily represents the amount of a construction loan provided by Con Edison Development plus accrued interest. The maximum exposure to loss is the carrying value of the loan provided to date plus up to $52 million of additional financing which Con Edison Development is obligated to provide.
Note R – Asset Retirement Obligations
Con Edison and CECONY account for retirement obligations on their assets in accordance with the accounting rules for asset retirement obligations. This accounting standard requires recognition of a liability for legal obligations associated with the retirement of long-lived assets. When the liability is initially recorded, asset retirement costs are capitalized by increasing the carrying amount of the related asset. The liability is accreted to its present value each period and the capitalized cost is depreciated over the useful life of the related asset.
The Utilities include in depreciation the estimated removal costs, less salvage, for utility plant assets. In accordance with the accounting rules for asset retirement obligations, future removal costs that do not represent legal asset retirement obligations are recorded as regulatory liabilities pursuant to the accounting rules for regulated operations. The related regulatory liabilities recorded for Con Edison and CECONY were $421 million and $349 million at December 31, 2010 and $371 million and $303 million at December 31, 2009, respectively.
The Companies identified future asset retirement obligations associated with the removal of asbestos and asbestos-containing material in their buildings and equipment within the generating stations and substations, and within the steam and gas distribution systems. The Companies also identified asset retirement obligations relating to gas pipelines abandoned in place. The estimates of future liabilities were developed using historical information, and where available, quoted
| 147 |
Table of Contents
prices from outside contractors. The obligation for the cost of asbestos removal from the Companies’ generating stations and substation structures was not accrued since the retirement dates cannot be reasonably estimated.
At December 31, 2010, the liabilities of Con Edison and CECONY for the fair value of their legal asset retirement obligations were $109 million, as compared with $122 million at December 31, 2009. In addition, Con Edison and CECONY increased utility plant, net of accumulated depreciation, for asset retirement costs at December 31, 2010 by $18 million, as compared with $28 million at December 31, 2009. Pursuant to the accounting rules for regulated operations, CECONY also recorded a reduction of $91 million and $94 million at December 31, 2010 and 2009, respectively, to the regulatory liability associated with cost of removal to reflect accumulated depreciation and interest accretion costs.
Note S – Related Party Transactions
The Utilities and Con Edison’s competitive businesses provide administrative and other services to each other pursuant to cost allocation procedures approved by the NYSPSC. The costs of administrative and other services provided by CECONY to, and received by it from, Con Edison and its other subsidiaries for the years ended December 31, 2010, 2009 and 2008 were as follows:
| CECONY | ||||||||||||
| (Millions of Dollars) | 2010 | 2009 | 2008 | |||||||||
|
Cost of services provided |
$ | 74 | $ | 75 | $ | 65 | ||||||
|
Cost of services received |
$ | 45 | $ | 45 | $ | 50 | ||||||
In addition, CECONY and O&R have joint gas supply arrangements, in connection with which CECONY sold to O&R $99 million, $124 million and $183 million of natural gas for the years ended December 31, 2010, 2009 and 2008, respectively. These amounts are net of the effect of related hedging transactions.
CECONY entered into financial contracts on behalf of O&R with various brokers and counterparties to hedge purchases of electricity. For the year ended December 31, 2008, the realized gains recorded as part of purchase power expense is $0.2 million. There were no electric hedging transactions executed by CECONY on behalf of O&R for the years ended December 31, 2010 and 2009.
FERC has authorized CECONY through 2011 to lend funds to O&R from time to time, for periods of not more than 12 months, in amounts not to exceed $250 million outstanding at any time, at prevailing market rates. There were no outstanding loans to O&R at December 31, 2010 and 2009.
Note T – New Financial Accounting Standards
In February 2010, the Financial Accounting Standards Board (FASB) issued new guidance for subsequent events through Accounting Standards Update (ASU) No. 2010-09, “Subsequent Events (Topic 855): Amendments to Certain Recognition and Disclosure Requirements.” The amendments in this update eliminates requirements for SEC filers to disclose the date through which subsequent events have been evaluated. The application of this guidance did not have a material impact on the Companies’ financial position, results of operations or liquidity.
In December 2010, the FASB issued amendments to the guidance for intangibles through ASU No. 2010-28, “Intangibles – Goodwill and Other (Topic 360): When to Perform Step 2 of the Goodwill Impairment Test for Reporting Units with Zero or Negative Carrying Amounts.” The amendments in this update to the ASC modifies Step 1 of the goodwill impairment test to require those reporting units with zero or negative carrying value to be evaluated under Step 2 of the impairment test if circumstances or events indicate that it is more likely than not that a goodwill impairment exists. For public entities, this update is effective for the fiscal year and interim periods within those years, beginning after December 15, 2010. The application of this guidance is not expected to have a material impact on the Companies’ financial position, results of operations or liquidity.
| 148 |
Table of Contents
Note U – Con Edison Development
During the second quarter of 2008, Con Edison Development and its subsidiary, CED/SCS Newington, LLC, completed the sale of their ownership interests in electricity generating plants (Rock Springs, Ocean Peaking Power, CEEMI, Newington and Lakewood) with an aggregate capacity of approximately 1,706 megawatts to North American Energy Alliance, LLC. The sale resulted in total cash proceeds, net of estimated taxes and transaction expenses, of $1,067 million, and an after-tax gain, net of all transaction expenses, of approximately $400 million.
In May 2008, Con Edison Energy entered into agreements to provide energy management services, such as plant scheduling and fuel procurement, for the Rock Springs, Ocean Peaking Power and CEEMI projects for one to two years. Such services were expected to give rise to a significant level of continuing direct cash flows between Con Edison Energy and the disposed projects, and to provide Con Edison Energy with significant continuing involvement with the operations of the disposed projects. As a result, under the guidance of the accounting rules for presentation of financial statements – discontinued operations, Con Edison concluded that the Rock Springs, Ocean Peaking Power and CEEMI projects did not qualify for discontinued operations. Accordingly, the results of operations of these projects prior to the completion of the sale in 2008, along with the after-tax gain, net of transaction expenses, of $136 million associated with the sale of these projects, have been reported within continuing operations in the accompanying Con Edison consolidated income statement.
Con Edison’s competitive energy businesses engaged in certain services for the Newington and Lakewood projects on a short-term basis after the sale. However, such services were much more limited than those provided to the Rock Springs, Ocean Peaking Power and CEEMI projects, and did not give rise to a significant level of continuing direct cash flows between Con Edison and the disposed projects, or provide Con Edison with significant continuing involvement in the operating or financial policies of the disposed projects. As a result, Con Edison believes that the criteria within the accounting rules for presentation of financial statements – discontinued operations have been met for the Newington and Lakewood projects. Accordingly, the results of operations of these projects prior to the completion of the sale in 2008 have been reflected in income from discontinued operations (net of income taxes) in the accompanying Con Edison consolidated income statement. The Newington and Lakewood projects had revenues of $143 million and pre-tax profit of $7 million for the year ended December 31, 2008. Income from discontinued operations also includes the after-tax gain, net of transaction expenses, of $270 million associated with the sale of these projects.
| 149 |
Table of Contents
Schedule I
Condensed Financial Information of Consolidated Edison, Inc.*
Condensed Income Statement
(Parent Company Only)
| 2010 | 2009 | 2008 | ||||||||||
|
(Millions of Dollars, except per
share amounts) |
||||||||||||
|
Equity in earnings of subsidiaries |
$ | 1,008 | $ | 883 | $ | 900 | ||||||
|
Other income (deductions), net of taxes |
12 | 14 | 48 | |||||||||
|
Interest expense |
(28 | ) | (29 | ) | (26 | ) | ||||||
|
Income From Continuing Operations |
992 | 868 | 922 | |||||||||
|
Income from Discontinued Operations (Net of Tax Expense of $177 in 2008) |
— | — | 274 | |||||||||
|
Net Income for Common Stock |
$ | 992 | $ | 868 | $ | 1,196 | ||||||
|
Earnings Per Common Share – Basic |
||||||||||||
|
Continuing operations |
$ | 3.49 | $ | 3.16 | $ | 3.37 | ||||||
|
Discontinued operations |
— | — | 1.01 | |||||||||
|
Net Income Per Common Share – Basic |
$ | 3.49 | $ | 3.16 | $ | 4.38 | ||||||
|
Earnings Per Common Share – Diluted |
||||||||||||
|
Continuing operations |
$ | 3.47 | $ | 3.14 | $ | 3.36 | ||||||
|
Discontinued operations |
— | — | 1.01 | |||||||||
|
Net Income Per Common Share – Diluted |
$ | 3.47 | $ | 3.14 | $ | 4.37 | ||||||
|
Dividends Declared Per Share Of Common Stock |
$ | 2.38 | $ | 2.36 | $ | 2.34 | ||||||
|
Average Number Of Shares Outstanding – Basic (In Millions) |
284.3 | 275.2 | 272.9 | |||||||||
|
Average Number Of Shares Outstanding – Diluted (In Millions) |
285.9 | 276.3 | 273.6 | |||||||||
| * | These financial statements, in which Con Edison’s subsidiaries have been included using the equity method, should be read together with its consolidated financial statements and the notes thereto appearing above. |
| 150 |
Table of Contents
Condensed Financial Information of Consolidated Edison, Inc.*
Condensed Statement of Cash Flows
(Parent Company Only)
| 2010 | 2009 | 2008 | ||||||||||
| (Millions of Dollars) | ||||||||||||
|
Net Income |
$ | 992 | $ | 868 | $ | 1,196 | ||||||
|
Equity in earnings of subsidiaries |
(1,008 | ) | (883 | ) | (1,174 | ) | ||||||
|
Dividends received from: |
||||||||||||
|
CECONY |
670 | 652 | 618 | |||||||||
|
O&R |
32 | 32 | 31 | |||||||||
|
Competitive energy businesses |
8 | 8 | 12 | |||||||||
|
Other – net |
(4 | ) | 85 | (462 | ) | |||||||
|
Net Cash Flows From Operating Activities |
690 | 762 | 221 | |||||||||
|
INVESTING ACTIVITIES |
||||||||||||
|
Contributions to subsidiaries |
(355 | ) | (241 | ) | (791 | ) | ||||||
|
Proceeds from sale of subsidiaries |
— | — | 1,461 | |||||||||
|
Net Cash Flows (Used In)/From Investing Activities |
(355 | ) | (241 | ) | 670 | |||||||
|
FINANCING ACTIVITIES |
||||||||||||
|
Net payments of short-term debt |
— | (110 | ) | (130 | ) | |||||||
|
Retirement of long-term debt |
(3 | ) | (4 | ) | (200 | ) | ||||||
|
Common shares issued |
439 | 257 | 42 | |||||||||
|
Common stock dividends |
(629 | ) | (601 | ) | (618 | ) | ||||||
|
Net Cash Flows Used In Financing Activities |
(192 | ) | (458 | ) | (906 | ) | ||||||
|
Net Change For The Period |
142 | 63 | (15 | ) | ||||||||
|
Balance At Beginning Of Period |
80 | 17 | 32 | |||||||||
|
Balance At End Of Period |
$ | 222 | $ | 80 | $ | 17 | ||||||
| * | These financial statements, in which Con Edison’s subsidiaries have been included using the equity method, should be read together with its consolidated financial statements and the notes thereto appearing above. |
| 151 |
Table of Contents
Condensed Financial Information of Consolidated Edison, Inc.*
Condensed Balance Sheet
(Parent Company Only)
| At December 31, | ||||||||
| 2010 | 2009 | |||||||
| (Millions of Dollars) | ||||||||
|
ASSETS |
||||||||
|
CURRENT ASSETS |
||||||||
|
Cash and temporary cash investments |
$ | 222 | $ | 80 | ||||
|
Accounts receivable – other |
123 | 79 | ||||||
|
Accounts receivable from affiliated companies |
— | 1 | ||||||
|
Prepayments |
240 | 32 | ||||||
|
Other current assets |
50 | 158 | ||||||
|
Total Current Assets |
635 | 350 | ||||||
|
Investments in subsidiaries and others |
11,807 | 11,152 | ||||||
|
Goodwill |
406 | 406 | ||||||
|
Federal income tax due from taxing authority |
1 | 1 | ||||||
|
Deferred income tax |
38 | 22 | ||||||
|
Other assets |
4 | 10 | ||||||
|
Total Assets |
$ | 12,891 | $ | 11,941 | ||||
|
LIABILITIES AND SHAREHOLDERS’ EQUITY |
||||||||
|
CURRENT LIABILITIES |
||||||||
|
Long-term debt due within one year |
$ | 1 | $ | 3 | ||||
|
Accounts payable |
7 | 8 | ||||||
|
Accounts payable from affiliated companies |
176 | — | ||||||
|
Other current liabilities |
312 | 309 | ||||||
|
Total Current Liabilities |
496 | 320 | ||||||
|
Noncurrent Liabilities |
— | 36 | ||||||
|
Total Liabilities |
503 | 356 | ||||||
|
LONG-TERM DEBT |
314 | 316 | ||||||
|
SHAREHOLDERS’ EQUITY |
||||||||
|
Common stock |
4,900 | 4,404 | ||||||
|
Retained earnings |
7,181 | 6,865 | ||||||
|
Total Shareholders’ Equity |
12,081 | 11,269 | ||||||
|
Total Liabilities And Shareholders’ Equity |
$ | 12,891 | $ | 11,941 | ||||
| * | These financial statements, in which Con Edison’s subsidiaries have been included using the equity method, should be read together with its consolidated financial statements and the notes thereto appearing above. |
| 152 |
Table of Contents
Schedule II
Valuation and Qualifying Accounts
For the Years Ended December 31, 2010, 2009 and 2008
|
COLUMN C
Additions |
||||||||||||||||||||||||
| Company |
COLUMN A
Description |
COLUMN B
Balance at Beginning of Period |
(1)
Charged To Costs And Expenses |
(2)
Charged To Other Accounts |
COLUMN D
Deductions(b) |
COLUMN E
Balance At End of Period |
||||||||||||||||||
| (Millions of Dollars) | ||||||||||||||||||||||||
|
Con Edison |
|
Allowance for
uncollectible accounts(a): |
|
|||||||||||||||||||||
| 2010 | $ | 75 | $ | 91 | — | $ | 82 | $ | 84 | |||||||||||||||
| 2009 | $ | 64 | $ | 98 | — | $ | 87 | $ | 75 | |||||||||||||||
| 2008 | $ | 52 | $ | 85 | — | $ | 73 | $ | 64 | |||||||||||||||
|
CECONY |
|
Allowance for
uncollectible accounts(a): |
|
|||||||||||||||||||||
| 2010 | $ | 67 | $ | 82 | — | $ | 74 | $ | 75 | |||||||||||||||
| 2009 | $ | 56 | $ | 93 | — | $ | 82 | $ | 67 | |||||||||||||||
| 2008 | $ | 46 | $ | 79 | — | $ | 69 | $ | 56 | |||||||||||||||
| (a) | This is a valuation account deducted in the balance sheet from the assets (Accounts receivable-customers) to which they apply. |
| (b) | Accounts written off less cash collections, miscellaneous adjustments and amounts reinstated as receivables previously written off. |
| 153 |
Table of Contents
Con Edison
None.
CECONY
None.
The Companies maintain disclosure controls and procedures designed to provide reasonable assurance that the information required to be disclosed in the reports that they submit to the Securities and Exchange Commission (SEC) is recorded, processed, summarized and reported within the time periods specified in the rules and forms of the SEC. Disclosure controls and procedures include, without limitation, controls and procedures designed to ensure that information required to be disclosed by an issuer in the reports that it files or submits under the Securities Exchange Act of 1934, as amended, is accumulated and communicated to the issuer’s management, including its principal executive and principal financial officers, or persons performing similar functions, as appropriate to allow timely decisions regarding required disclosure. For each of the Companies, its management, with the participation of its principal executive officer and principal financial officer, has evaluated its disclosure controls and procedures as of the end of the period covered by this report and, based on such evaluation, has concluded that the controls and procedures are effective to provide such reasonable assurance. Reasonable assurance is not absolute assurance, however, and there can be no assurance that any design of controls or procedures would be effective under all potential future conditions, regardless of how remote.
For the Companies’ Reports of Management On Internal Control Over Financial Reporting and the related opinions of PricewaterhouseCoopers LLP (presented in the Reports of Independent Registered Public Accounting Firm), see Item 8 of this report (which information is incorporated herein by reference).
There was no change in the Companies’ internal control over financial reporting that occurred during the Companies’ most recent fiscal quarter that has materially affected, or is reasonably likely to materially affect, the Companies’ internal control over financial reporting.
The Utilities are undertaking a project with the objective of improving business processes and information systems. The Utilities expect the project to reduce costs, improve support of operating activities, reduce financial reporting risks, and simplify compliance activities. The focus of the project is the implementation, starting in 2011, of new financial and supply-chain enterprise resource planning information systems. The Utilities expect the project to enhance the processes used by employees to record financial transactions and analyze data; purchase materials and services and manage inventory; develop business plans and budgets and report financial and purchasing data.
Con Edison
None.
CECONY
None.
| 154 |
Table of Contents
Con Edison
Information required by Part III as to Con Edison, other than the information required in Item 12 of this report by Item 201 (d) of Regulation S-K, is incorporated by reference from Con Edison’s definitive proxy statement for its Annual Meeting of Stockholders to be held on May 16, 2011. The proxy statement is to be filed pursuant to Regulation 14A not later than 120 days after December 31, 2010, the close of the fiscal year covered by this report.
| 155 |
Table of Contents
The information required pursuant to Item 201 (d) of Regulation S-K as at December 31, 2010 is as follows:
Equity Compensation Plan Information
| Plan category |
Number of securities to
be issued upon exercise of outstanding options, warrants and rights |
Weighted-average
exercise price of outstanding options, warrants and rights |
Number of securities
remaining available for future issuance under equity compensation plans (excluding securities reflected in column(a)) |
|||||||||
| (a) | (b) | (c) | ||||||||||
|
Equity compensation plans approved by security holders |
||||||||||||
|
Stock options |
2,935,250 | $ | 43.588 | 3,512,601 | ||||||||
|
Restricted stock |
136,359 | — | 3,381,291 | |||||||||
|
Total equity compensation plans approved by security holders |
3,071,609 | — | 6,893,892 | |||||||||
|
Total equity compensation plans not approved by security holders |
40,000 | — | ||||||||||
|
Total |
3,111,609 | — | 6,893,892 | |||||||||
The 40,000 securities shown in the Equity Compensation Plan table in the line captioned “Total equity compensation plans not approved by security holders” represent shares of Con Edison common stock to be issued to two officers who had elected to defer receipt of these shares until separation from service or later. These shares are issuable pursuant to awards of restricted stock units made in 2000 and 2002, which vested in 2004 and 2005.
For additional information about Con Edison’s stock-based compensation, see Note M to the financial statements in Item 8 of this report (which information is incorporated herein by reference).
In accordance with General Instruction G(3) to Form 10-K, other information regarding Con Edison’s Executive Officers may be found in Part I of this report under the caption “Executive Officers of the Registrant.”
CECONY
Information required by Part III as to CECONY is incorporated by reference from CECONY’s definitive information statement for its Annual Meeting of Stockholders to be held on May 16, 2011. The information statement is to be filed pursuant to Regulation 14C not later than 120 days after December 31, 2010, the close of the fiscal year covered by this report.
In accordance with General Instruction G(3) to Form 10-K, other information regarding CECONY’s Executive Officers may be found in Part I of this report under the caption “Executive Officers of the Registrant.”
| 156 |
Table of Contents
(a) Documents filed as part of this report:
1. List of Financial Statements – See financial statements listed in Item 8.
2. List of Financial Statement Schedules – See schedules listed in Item 8.
3. List of Exhibits
Exhibits listed below which have been filed previously with the Securities and Exchange Commission pursuant to the Securities Act of 1933 and the Securities Exchange Act of 1934, and which were designated as noted below, are hereby incorporated by reference and made a part of this report with the same effect as if filed with the report. Exhibits listed below that were not previously filed are filed herewith.
Con Edison
| 3.1.1 | Restated Certificate of Incorporation of Consolidated Edison, Inc. (Con Edison) (Designated in the Registration Statement on Form S-4 of Con Edison (No. 333-39165) as Exhibit 3.1.) | |||
| 3.1.2 | By-laws of Con Edison, effective as of February 19, 2009. (Designated in Con Edison's Current Report on Form 8-K, dated February 19, 2009 (File No. 1-14514) as Exhibit 3.1.) | |||
| 4.1.1 | Indenture, dated as of April 1, 2002, between Con Edison and JP Morgan Chase Bank (formerly known as The Chase Manhattan Bank), as Trustee. (Designated in the Registration Statement on Form S-3 of Con Edison (No. 333-102005) as Exhibit 4.1.) | |||
| 4.1.2 | Note Assumption and Exchange Agreement, dated as of June 20, 2008, between Con Edison and the institutional investors listed in Schedule I thereto. (Designated in Con Edison’s Current Report on Form 8-K, dated June 20, 2008 (File No. 1-14514) as Exhibit 4.) | |||
| 4.1.3.1 | Amended and Restated Credit Agreement, dated as of June 22, 2006 among CECONY, Con Edison, O&R, the banks party thereto and JPMorgan Chase Bank, N.A., as Administrative Agent. (Designated in Con Edison’s Quarterly Report on Form 10-Q for the quarterly period ended June 30, 2010 (File No. 1-14514) as Exhibit 4.1.) | |||
| 10.1.1 | Con Edison 1996 Stock Option Plan, as amended and restated effective February 24, 1998. (Designated in Con Edison’s Annual Report on Form 10-K for the year ended December 31, 1997 (File No. 1-14514) as Exhibit 10.20.) | |||
| 10.1.2 | Employment agreement, dated December 15, 2008, between Con Edison and Kevin Burke. (Designated in Con Edison’s Annual Report on Form 10-K for the year ended December 31, 2008 (File No. 1-14514) as Exhibit 10.1.2) | |||
| 10.1.3 | Severance Program for Officers of Consolidated Edison, Inc. and its Subsidiaries, as amended, effective as of January 1, 2008. (Designated in Con Edison’s Annual Report on Form 10-K for the year ended December 31, 2008 (File No. 1-14514) as Exhibit 10.1.3) | |||
| 10.1.4.1 | The Consolidated Edison, Inc. Stock Purchase Plan, as amended and restated as of May 19, 2008. (Designated in Con Edison’s Annual Report on Form 10-K for the year ended December 31, 2008 (File No. 1-14514) as Exhibit 10.1.4) | |||
| 10.1.4.2 | Amendment, dated October 21, 2009, to The Consolidated Edison Stock Purchase Plan. (Designated in Con Edison’s Quarterly Report on Form 10-Q for the quarterly period ended September 30, 2009 (File No. 1-14514) as Exhibit 10.1.1) | |||
| 10.1.4.3 | Amendment Number 2, dated December 17, 2010, to the Consolidated Edison Stock Purchase Plan. | |||
| 10.1.5.1 | The Consolidated Edison Retirement Plan, as amended December 18, 2008. (Designated in Con Edison’s Annual Report on Form 10-K for the year ended December 31, 2008 (File No. 1-14514) as Exhibit 10.1.5) | |||
| 10.1.5.2 | Amendment, dated September 29, 2009, to The Consolidated Edison Retirement Plan. (Designated in Con Edison’s Quarterly Report on Form 10-Q for the quarterly period ended September 30, 2009 (File No. 1-14514) as Exhibit 10.1.2) | |||
| 10.1.5.3 | Amendment, executed December 31, 2009, to The Consolidated Edison Retirement Plan. (Designated in Con Edison’s Annual Report on Form 10-K for the year ended December 31, 2009 (File No. 1-14514 as Exhibit 10.1.5.3) | |||
| 10.1.5.4 | Amendment, effective January 1, 2010, to the Consolidated Edison Retirement Plan. | |||
| 10.1.6.1 | The Consolidated Edison Thrift Plan, as amended December 23, 2008. (Designated in Con Edison’s Annual Report on Form 10-K for the year ended December 31, 2008 (File No. 1-14514) as Exhibit 10.1.6) | |||
| 10.1.6.2 | Amendment, dated September 29, 2009, to The Consolidated Edison Thrift Plan. (Designated in Con Edison’s Quarterly Report on Form 10-Q for the quarterly period ended September 30, 2009 (File No. 1-14514) as Exhibit 10.1.3) | |||
| 10.1.7.1 | Consolidated Edison, Inc. Long-Term Incentive Plan, as amended and restated effective as of January 1, 2008. (Designated in Con Edison’s Annual Report on Form 10-K for the year ended December 31, 2008 (File No. 1-14514) as Exhibit 10.1.7.1) | |||
| 157 |
Table of Contents
| 10.1.7.2 | Form of Restricted Stock Unit Award under the Con Edison Long Term Incentive Plan. (Designated in Con Edison’s Annual Report on Form 10-K for the year ended December 31, 2008 (File No. 1-14514) as Exhibit 10.1.7.2) | |||
| 10.1.7.3 | Form of Stock Option Agreement under the Con Edison Long Term Incentive Plan. (Designated in Con Edison’s Current Report on Form 8-K, dated January 24, 2005, (File No. 1-14514) as Exhibit 10.3.) | |||
| 10.1.7.4 | Amendment Number 1, effective July 1, 2010, to the Consolidated Edison, Inc. Long-Term Incentive Plan, as amended and restated effective as of January 1, 2008 (Designated in Con Edison’s Quarterly Report on Form 10-Q for the quarterly period ended June 30, 2010 as Exhibit 10.1) | |||
| 10.1.7.5 | Amendment Number 2, effective January 1, 2011, to the Consolidated Edison, Inc. Long-Term Incentive Plan, as amended and restated effective as of January 1, 2008. | |||
| 10.1.8 | Description of Directors’ Compensation. (Designated in Con Edison's Quarterly Report on Form 10-Q for the quarterly period ended June 30, 2010 (File No. 1-14514) as Exhibit 10.2.) | |||
| 10.1.9 | Letter, dated February 23, 2004, to Robert Hoglund. (Designated in Con Edison’s Current Report on Form 8-K, dated July 21, 2005, (File No. 1-14514) as Exhibit 10.5.) | |||
| 10.1.10 | Purchase and Sale Agreement, dated as of December 10, 2007, by and between Consolidated Edison Development, Inc. and North American Energy Alliance, LLC. (Designated in Con Edison’s Current Report on Form 8-K, dated December 14, 2007, (File No. 1-14514) as Exhibit 10.1.) | |||
| 10.1.11 | Purchase and Sale Agreement, dated as of December 10, 2007, by and between CED/SCS Newington, LLC and North American Energy Alliance, LLC. (Designated in Con Edison’s Current Report on Form 8-K, dated December 14, 2007 (File No. 1-14514) as Exhibit 10.2.) | |||
| 12.1 | Statement of computation of Con Edison’s ratio of earnings to fixed charges for the years 2006-2010. | |||
| 21.1 | Subsidiaries of Con Edison. (Designated in Con Edison’s Annual Report on Form 10-K for the year ended December 31, 2003 (File No. 1-14514) as Exhibit 21.1.) | |||
| 23.1 | Consent of PricewaterhouseCoopers LLP. | |||
| 31.1.1 | Rule 13a-14(a)/15d-14(a) Certifications – Chief Executive Officer. | |||
| 31.1.2 | Rule 13a-14(a)/15d-14(a) Certifications – Chief Financial Officer. | |||
| 32.1.1 | Section 1350 Certifications – Chief Executive Officer. | |||
| 32.1.2 | Section 1350 Certifications – Chief Financial Officer. | |||
| 101.INS | XBRL Instance Document. | |||
| 101.SCH | XBRL Taxonomy Extension Schema. | |||
| 101.CAL | XBRL Taxonomy Extension Calculation Linkbase. | |||
| 101.DEF | XBRL Taxonomy Extension Definition Linkbase. | |||
| 101.LAB | XBRL Taxonomy Extension Label Linkbase. | |||
| 101.PRE | XBRL Taxonomy Extension Presentation Linkbase. | |||
CECONY
| 3.2.1.1 | Restated Certificate of Incorporation of CECONY filed with the Department of State of the State of New York on December 31, 1984. (Designated in the Annual Report on Form 10-K of CECONY for the year ended December 31, 1989 (File No. 1-1217) as Exhibit 3(a).) | |||
| 3.2.1.2 | The following certificates of amendment of Restated Certificate of Incorporation of CECONY filed with the Department of State of the State of New York, which are designated as follows: | |||
|
Securities Exchange Act
File No. 1-1217 |
||||||||||||
| Date Filed With Department of State | Form | Date | Exhibit | |||||||||
|
5/16/88 |
10-K | 12/31/89 | 3 | (b) | ||||||||
|
6/2/89 |
10-K | 12/31/89 | 3 | (c) | ||||||||
|
4/28/92 |
8-K | 4/24/92 | 4 | (d) | ||||||||
|
8/21/92 |
8-K | 8/20/92 | 4 | (e) | ||||||||
|
2/18/98 |
10-K | 12/31/97 | 3.1.2.3 | |||||||||
| 158 |
Table of Contents
| 3.2.2 | By-laws of CECONY, effective May 18, 2009. (Designated in CECONY’s Current Report on Form 8-K, dated April 16, 2009 (File No. 1-1217) as Exhibit 3.2) | |||
| 4.2.1 | Participation Agreement, dated as of July 1, 1999, between New York State Energy Research and Development Authority (NYSERDA) and CECONY. (Designated in CECONY's Quarterly Report on Form 10-Q for the quarterly period ended June 30, 1999 (File No. 1-1217) as Exhibit 4.1.) | |||
| 4.2.2 | Participation Agreement, dated as of November 1, 2010, between NYSERDA and CECONY. | |||
| 4.2.3 | Participation Agreement, dated as of November 1, 2001, between NYSERDA and CECONY. (Designated in CECONY’s Quarterly Report on Form 10-Q for the quarterly period ended September 30, 2001 (File No. 1-1217) as Exhibit 10.2.1.) | |||
| 4.2.4 | Participation Agreement, dated as of January 1, 2004, between NYSERDA and CECONY. (Designated in CECONY’s Annual Report on Form 10-K for the year ended December 31, 2003 (File No. 1-1217) as Exhibit 4.2.6.) | |||
| 4.2.5 | Participation Agreement, dated as of January 1, 2004, between NYSERDA and CECONY. (Designated in CECONY’s Annual Report on Form 10-K for the year ended December 31, 2003 (File No. 1-1217) as Exhibit 4.2.7.) | |||
| 4.2.6 | Participation Agreement, dated as of November 1, 2004, between NYSERDA and CECONY. (Designated in CECONY’s Current Report on Form 8-K, dated November 9, 2004 (File No. 1-1217) as Exhibit 4.1.) | |||
| 4.2.7 | Participation Agreement, dated as of May 1, 2005, between NYSERDA and CECONY. (Designated in CECONY’s Current Report on Form 8-K, dated May 25, 2005 (File No. 1-1217) as Exhibit 4.1.) | |||
| 4.2.8.1 | Indenture of Trust, dated as of July 1, 1999 between NYSERDA and HSBC Bank USA, as trustee. (Designated in CECONY’s Quarterly Report on Form 10-Q for the quarterly period ended June 30, 1999 (File No. 1-1217) as Exhibit 4.2.) | |||
| 4.2.8.2 | Supplemental Indenture of Trust, dated as of July 1, 2001, to Indenture of Trust, dated July 1, 1999 between NYSERDA and HSBC Bank USA, as trustee. (Designated in CECONY’s Quarterly Report on Form 10-Q for the quarterly period ended June 30, 2001 (File No. 1-1217) as Exhibit 10.2.2.) | |||
| 4.2.9 | Trust Indenture, dated as of November 1, 2010 between NYSERDA and The Bank of New York Mellon, as trustee. | |||
| 4.2.10 | Indenture of Trust, dated as of November 1, 2001, between NYSERDA and The Bank of New York, as trustee. (Designated in CECONY’s Quarterly Report on Form 10-Q for the quarterly period ended September 30, 2001 (File No. 1-1217) as Exhibit 10.2.2.) | |||
| 4.2.11 | Indenture of Trust, dated as of January 1, 2004, between NYSERDA and The Bank of New York. (Designated in CECONY's Annual Report on Form 10-K for the year ended December 31, 2003 (File No. 1-1217) as Exhibit 4.2.12.) | |||
| 4.2.12 | Indenture of Trust, dated as of January 1, 2004, between NYSERDA and The Bank of New York. (Designated in CECONY's Annual Report on Form 10-K for the year ended December 31, 2003 (File No. 1-1217) as Exhibit 4.2.13.) | |||
| 4.2.13 | Indenture of Trust, dated as of November 1, 2004, between NYSERDA and The Bank of New York. (Designated in CECONY's Current Report on Form 8-K, dated November 9, 2004 (File No. 1-1217) as Exhibit 4.2.) | |||
| 4.2.14.1 | Indenture of Trust, dated as of May 1, 2005, between NYSERDA and The Bank of New York. (Designated in CECONY's Current Report on Form 8-K, dated May 25, 2005 (File No. 1-1217) as Exhibit 4.2.) | |||
| 4.2.14.2 | Supplemental Indenture of Trust, dated as of June 30, 2010, to Indenture of Trust, dated May 1, 2005 between NYSERDA and The Bank of New York Mellon (formerly known as The Bank of New York), as trustee. | |||
| 4.2.15.1 | Indenture, dated as of December 1, 1990, between CECONY and The Chase Manhattan Bank (National Association), as Trustee (the “Debenture Indenture”). (Designated in CECONY's Annual Report on Form 10-K for the year ended December 31, 1990 (File No. 1-1217) as Exhibit 4(h).) | |||
| 4.2.15.2 | First Supplemental Indenture (to the Debenture Indenture), dated as of March 6, 1996, between CECONY and The Chase Manhattan Bank (National Association), as Trustee. (Designated in CECONY's Annual Report on Form 10-K for the year ended December 31, 1995 (File No. 1-1217) as Exhibit 4.13.) | |||
| 4.2.15.3 | Second Supplemental Indenture (to the Debenture Indenture), dated as of June 23, 2005, between CECONY and JPMorgan Chase Bank, N.A. (successor to The Chase Manhattan Bank (National Association)), as Trustee. (Designated in CECONY’s Current Report on Form 8-K, dated November 16, 2005 (File No. 1-1217) as Exhibit 4.1.) | |||
| 159 |
Table of Contents
| 4.2.16 | The following forms of CECONY’s Debentures: |
|
Securities Exchange Act File No. 1-1217 |
||||||||||||||
| Debenture | Form | Date | Exhibit | |||||||||||
|
5.625% |
Series 2002 A | 8-K | 6/19/02 | 4 | ||||||||||
|
4.875% |
Series 2002 B | 8-K | 12/19/02 | 4 | ||||||||||
|
5.875% |
Series 2003 A | 8-K | 4/7/03 | 4 | ||||||||||
|
3.85% |
Series 2003 B | 8-K | 6/12/03 | 4.1 | ||||||||||
|
5.10% |
Series 2003 C | 8-K | 6/12/03 | 4.2 | ||||||||||
|
4.70% |
Series 2004 A | 8-K | 2/11/04 | 4.1 | ||||||||||
|
5.70% |
Series 2004 B | 8-K | 2/11/04 | 4.2 | ||||||||||
|
5.30% |
Series 2005 A | 8-K | 3/7/05 | 4 | ||||||||||
|
5.250% |
Series 2005 B | 8-K | 6/20/05 | 4 | ||||||||||
|
5.375% |
Series 2005 C | 8-K | 11/16/05 | 4.2 | ||||||||||
|
5.85% |
Series 2006 A | 8-K | 3/9/06 | 4 | ||||||||||
|
6.20% |
Series 2006 B | 8-K | 6/15/06 | 4 | ||||||||||
|
5.50% |
Series 2006 C | 8-K | 9/25/06 | 4 | ||||||||||
|
5.30% |
Series 2006 D | 8-K | 12/1/06 | 4.1 | ||||||||||
|
5.70% |
Series 2006 E | 8-K | 12/1/06 | 4.2 | ||||||||||
|
6.30% |
Series 2007 A | 8-K | 8/28/07 | 4 | ||||||||||
|
5.85% |
Series 2008 A | 8-K | 4/4/08 | 4.1 | ||||||||||
|
6.75% |
Series 2008 B | 8-K | 4/4/08 | 4.2 | ||||||||||
|
7.125% |
Series 2008 C | 8-K | 12/4/08 | 4 | ||||||||||
|
5.55% |
Series 2009 A | 8-K | 3/25/09 | 4.1 | ||||||||||
|
6.65% |
Series 2009 B | 8-K | 3/25/09 | 4.2 | ||||||||||
|
5.50% |
Series 2009 C | 8-K | 12/4/09 | 4 | ||||||||||
|
4.45% |
Series 2010 A | 8-K | 6/7/10 | 4.1 | ||||||||||
|
5.70% |
Series 2010 B | 8-K | 6/7/10 | 4.2 | ||||||||||
| 10.2.1 | Amended and Restated Agreement and Settlement, dated September 19, 1997, between CECONY and the Staff of the New York State Public Service Commission (without Appendices). (Designated in CECONY’s Current Report on Form 8-K, dated September 23, 1997 (File No. 1-1217) as Exhibit 10.) | |||
| 10.2.2 | Settlement Agreement, dated October 2, 2000, by and among CECONY, the Staff of the New York State Public Service Commission and certain other parties. (Designated in CECONY’s Current Report on Form 8-K, dated September 22, 2000 (File No. 1-1217) as Exhibit 10.) | |||
| 10.2.3.1 | Planning and Supply Agreement, dated March 10, 1989, between CECONY and the Power Authority of the State of New York. (Designated in CECONY’s Annual Report on Form 10-K for the year ended December 31, 1992 (File No. 1-1217) as Exhibit 10(gg).) | |||
| 10.2.3.2 | Delivery Service Agreement, dated March 10, 1989, between CECONY and the Power Authority of the State of New York. (Designated in CECONY’s Annual Report on Form 10-K for the year ended December 31, 1992 (File No. 1-1217) as Exhibit 10(hh).) | |||
| 10.2.4 | Agreement and Plan of Exchange, entered into on October 28, 1997, between Con Edison and CECONY. (Designated in the Registration Statement on Form S-4 of Con Edison (No. 333-39165) as Exhibit 2.) | |||
| 10.2.5 | The Consolidated Edison Company of New York, Inc. Executive Incentive Plan, as amended and restated as of January 1, 2008. (Designated in CECONY's Annual Report on Form 10-K for the year ended December 31, 2008 (File No. 1-1217) as Exhibit 10.2.5.) | |||
| 10.2.6 | Consolidated Edison Company of New York, Inc. Supplemental Retirement Income Plan, as amended and restated as of January 1, 2009. (Designated in CECONY’s Annual Report on Form 10-K for the year ended December 31, 2009 (File No. 1-1217) as Exhibit 10.2.6.) | |||
| 10.2.7 | Deferred Compensation Plan for the Benefit of Trustees of CECONY, as amended effective January 1, 2008. (Designated in CECONY's Annual Report on Form 10-K for the year ended December 31, 2008 (File No. 1-1217) as Exhibit 10.2.7.) | |||
| 10.2.8 | Supplemental Medical Plan for the Benefit of CECONY's officers. (Designated in CECONY’s Annual Report on Form 10-K for the year ended December 31, 1991 (File No. 1-1217) as Exhibit 10(aa).) | |||
| 10.2.9 | The CECONY Severance Pay Plan for Management Employees, effective January 1, 2008. (Designated in CECONY’s Annual Report on Form 10-K for the year ended December 31, 2008 (File No. 1-1217) as Exhibit 10.2.9.) | |||
| 160 |
Table of Contents
| 10.2.10 | The Consolidated Edison Company of New York, Inc. Deferred Income Plan, as amended and restated as of January 1, 2008. (Designated in CECONY’s Annual Report on Form 10-K for the year ended December 31, 2008 (File No. 1-1217) as Exhibit 10.2.10.) | |||
| 10.2.11.1 | The Consolidated Edison Company of New York, Inc. 2005 Executive Incentive Plan, effective as of January 1, 2005, as amended effective as of January 1, 2008. (Designated in CECONY's Annual Report on Form 10-K for the year ended December 31, 2008 (File No. 1-1217) as Exhibit 10.2.11) | |||
| 10.2.11.2 | Amendment, dated October 21, 2009, to The Consolidated Edison Company of New York, Inc. 2005 Executive Incentive Plan. (Designated in CECONY’s Quarterly Report on Form 10-Q for the quarterly period ended September 30, 2009 (File No. 1-1217) as Exhibit 10.2.1) | |||
| 10.2.11.3 | Amendment Number 2, dated December 17, 2010 to The Consolidated Edison Company of New York, Inc. 2005 Executive Incentive Plan. | |||
| 10.2.12.1 | Trust Agreement, dated as of March 31, 1999, between CECONY and Mellon Bank, N.A., as Trustee. (Designated in CECONY’s Annual Report on Form 10-K, for the year ended December 31, 2005 (File No. 1-1217) as Exhibit 10.2.13.1.) | |||
| 10.2.12.2 | Amendment Number 1 to the CECONY Rabbi Trust, executed October 24, 2003, between CECONY and Mellon Bank, N.A., as Trustee. (Designated in CECONY’s Annual Report on Form 10-K, for the year ended December 31, 2005 (File No. 1-1217) as Exhibit 10.2.13.2.) | |||
| 10.2.13 | Employment Agreement, dated February 18, 1999, between CECONY and Frances Resheske. (Designated in CECONY’s Annual Report on Form 10-K, for the year ended December 31, 2006 (File No. 1-1217) as Exhibit 10.2.14.) | |||
| 12.2 | Statement of computation of CECONY’s ratio of earnings to fixed charges for the years 2006 – 2010. | |||
| 23.2 | Consent of PricewaterhouseCoopers LLP. | |||
| 31.2.1 | Rule 13a-14(a)/15d-14(a) Certifications – Chief Executive Officer. | |||
| 31.2.2 | Rule 13a-14(a)/15d-14(a) Certifications – Chief Financial Officer. | |||
| 32.2.1 | Section 1350 Certifications – Chief Executive Officer. | |||
| 32.2.2 | Section 1350 Certifications – Chief Financial Officer. | |||
| 101.INS | XBRL Instance Document. | |||
| 101.SCH | XBRL Taxonomy Extension Schema. | |||
| 101.CAL | XBRL Taxonomy Extension Calculation Linkbase. | |||
| 101.DEF | XBRL Taxonomy Extension Definition Linkbase. | |||
| 101.LAB | XBRL Taxonomy Extension Label Linkbase. | |||
| 101.PRE | XBRL Taxonomy Extension Presentation Linkbase. | |||
| 161 |
Table of Contents
Pursuant to the requirements of Section 13 or 15(d) of the Securities Exchange Act of 1934, each Registrant has duly caused this report to be signed on its behalf by the undersigned, thereunto duly authorized, on February 22, 2011.
Consolidated Edison, Inc.
Consolidated Edison Company of New York, Inc.
| By | /s/ Robert Hoglund | |
|
Robert Hoglund Senior Vice President and Chief Financial Officer |
||
Pursuant to the requirements of the Securities Exchange Act of 1934, this report has been signed below by the following persons on behalf of the Registrant, and in the capacities indicated, on February 22, 2011.
| Signature | Registrant | Title | ||
|
/s/ Kevin Burke Kevin Burke |
Con Edison | Chairman of the Board, President, Chief Executive Officer and Director (Principal Executive Officer) | ||
| CECONY | Chairman of the Board, Chief Executive Officer and Trustee (Principal Executive Officer) | |||
|
/s/ Robert Hoglund Robert Hoglund |
Con Edison | Senior Vice President and Chief Financial Officer (Principal Financial Officer) | ||
| CECONY | Senior Vice President and Chief Financial Officer (Principal Financial Officer) | |||
|
/s/ Robert Muccilo Robert Muccilo |
Con Edison | Vice President, Controller and Chief Accounting Officer (Principal Accounting Officer) | ||
| CECONY | Vice President, Controller and Chief Accounting Officer (Principal Accounting Officer) | |||
|
/s/ Vincent A. Calarco Vincent A. Calarco |
Con Edison | Director | ||
| CECONY | Trustee | |||
|
/s/ George Campbell Jr. George Campbell Jr. |
Con Edison | Director | ||
| CECONY | Trustee | |||
|
/s/ Gordon J. Davis Gordon J. Davis |
Con Edison | Director | ||
| CECONY | Trustee | |||
|
/s/ Michael J. Del Giudice Michael J. Del Giudice |
Con Edison | Director | ||
| 162 |
Table of Contents
| Signature | Registrant | Title | ||
| CECONY | Trustee | |||
|
/s/ Ellen V. Futter Ellen V. Futter |
Con Edison | Director | ||
|
CECONY |
Trustee |
|||
|
/s/ John F. Hennessy III John F. Hennessy III |
Con Edison | Director | ||
|
CECONY |
Trustee |
|||
|
/s/ Sally Hernandez Sally Hernandez |
Con Edison | Director | ||
|
CECONY |
Trustee |
|||
|
/s/ John F. Killian John F. Killian |
Con Edison | Director | ||
|
CECONY |
Trustee |
|||
|
/s/ Eugene R. McGrath Eugene R. McGrath |
Con Edison | Director | ||
|
CECONY |
Trustee |
|||
|
/s/ Michael W. Ranger Michael W. Ranger |
Con Edison | Director | ||
|
CECONY |
Trustee |
|||
|
/s/ L. Frederick Sutherland L. Frederick Sutherland |
Con Edison | Director | ||
|
CECONY |
Trustee | |||