|
|
|
|
|
|
|
|
|
|
|
|
|
|
|
|
|
|
|
|
|
|
|
|
|
|
|
|
|
|
|
|
|
|
|
|
|
|
|
|
|
|
|
|
|
|
|
|
|
|
|
|
|
|
|
|
Table of Contents
UNITED STATES
SECURITIES AND EXCHANGE COMMISSION
WASHINGTON, D.C. 20549
FORM 10-Q
| x | Quarterly Report Pursuant To Section 13 or 15(d) of the Securities Exchange Act of 1934 |
FOR THE QUARTERLY PERIOD ENDED MARCH 31, 2011
OR
| ¨ | Transition Report Pursuant to Section 13 or 15(d) of the Securities Exchange Act of 1934 |
For the transition period from to
|
Commission
|
Exact name of registrant as specified in its charter and principal office address and telephone number |
State of
|
I.R.S. Employer
|
|||
| 1-14514 | Consolidated Edison, Inc. | New York | 13-3965100 | |||
| 4 Irving Place, New York, New York 10003 | ||||||
| (212) 460-4600 | ||||||
| 1-1217 | Consolidated Edison Company of New York, Inc. | New York | 13-5009340 | |||
| 4 Irving Place, New York, New York 10003 | ||||||
| (212) 460-4600 | ||||||
Indicate by check mark whether the registrant (1) has filed all reports required to be filed by Section 13 or 15(d) of the Securities Exchange Act of 1934 during the preceding 12 months (or for such shorter period that the registrant was required to file such reports), and (2) has been subject to such filing requirements for the past 90 days.
| Consolidated Edison, Inc. (Con Edison) | Yes x | No ¨ | ||||||
| Consolidated Edison of New York, Inc. (CECONY) | Yes x | No ¨ | ||||||
Indicate by check mark whether the registrant has submitted electronically and posted on its corporate Web site, if any, every Interactive Data File required to be submitted and posted pursuant to Rule 405 of Regulation S-T (§232.405 of this chapter) during the preceding 12 months (or for such shorter period that the registrant was required to submit and post such files).
| Con Edison | Yes x | No ¨ | ||||||
| CECONY | Yes x | No ¨ | ||||||
Indicate by check mark whether the registrant is a large accelerated filer, an accelerated filer, a non-accelerated filer, or a smaller reporting company. See the definitions of “large accelerated filer”, “accelerated filer” and “smaller reporting company” in Rule 12b-2 of the Exchange Act.
| Con Edison | ||||||||||||
| Large accelerated filer x | Accelerated filer ¨ | Non-accelerated filer ¨ | Smaller reporting company ¨ | |||||||||
| CECONY | ||||||||||||
| Large accelerated filer ¨ | Accelerated filer ¨ | Non-accelerated filer x | Smaller reporting company ¨ | |||||||||
Indicate by check mark whether the registrant is a shell company (as defined in Rule 12b-2 of the Exchange Act).
| Con Edison | Yes ¨ | No x | ||||||
| CECONY | Yes ¨ | No x | ||||||
As of April 29, 2011, Con Edison had outstanding 292,577,516 Common Shares ($.10 par value). All of the outstanding common equity of CECONY is held by Con Edison.
Filing Format
This Quarterly Report on Form 10-Q is a combined report being filed separately by two different registrants: Consolidated Edison, Inc. (Con Edison) and Consolidated Edison Company of New York, Inc. (CECONY). CECONY is a subsidiary of Con Edison and, as such, the information in this report about CECONY also applies to Con Edison. As used in this report, the term the “Companies” refers to Con Edison and CECONY. However, CECONY makes no representation as to the information contained in this report relating to Con Edison or the subsidiaries of Con Edison other than itself.
Table of Contents
| PAGE | ||||||
| PART I—Financial Information | ||||||
| ITEM 1 |
Financial Statements (Unaudited) |
|||||
|
Con Edison |
||||||
| 6 | ||||||
| 7 | ||||||
| 8 | ||||||
| 10 | ||||||
| 11 | ||||||
|
CECONY |
||||||
| 12 | ||||||
| 13 | ||||||
| 14 | ||||||
| 16 | ||||||
| 17 | ||||||
| ITEM 2 |
Management’s Discussion and Analysis of Financial Condition and Results of Operations |
32 | ||||
| ITEM 3 | 47 | |||||
| ITEM 4 | 47 | |||||
| PART II—Other Information | ||||||
| ITEM 1 | 48 | |||||
| ITEM 1A | 48 | |||||
| ITEM 6 | 49 | |||||
| Signatures | 50 | |||||
| 2 |
Table of Contents
Glossary of Terms
The following is a glossary of frequently used abbreviations or acronyms that are used in the Companies’ SEC reports:
| Con Edison Companies | ||
| Con Edison | Consolidated Edison, Inc. | |
| CECONY | Consolidated Edison Company of New York, Inc. | |
| Con Edison Development | Consolidated Edison Development, Inc. | |
| Con Edison Energy | Consolidated Edison Energy, Inc. | |
| Con Edison Solutions | Consolidated Edison Solutions, Inc. | |
| O&R | Orange and Rockland Utilities, Inc. | |
| Pike | Pike County Light & Power Company | |
| RECO | Rockland Electric Company | |
| The Companies | Con Edison and CECONY | |
| The Utilities | CECONY and O&R | |
| Regulatory Agencies, Government Agencies, and Quasi-governmental Not-for-Profits | ||
| EPA | U. S. Environmental Protection Agency | |
| FERC | Federal Energy Regulatory Commission | |
| IRS | Internal Revenue Service | |
| ISO-NE | ISO New England Inc. | |
| NJBPU | New Jersey Board of Public Utilities | |
| NJDEP | New Jersey Department of Environmental Protection | |
| NYAG | New York State Attorney General | |
| NYISO | New York Independent System Operator | |
| NYPA | New York Power Authority | |
| NYSDEC | New York State Department of Environmental Conservation | |
| NYSERDA | New York State Energy Research and Development Authority | |
| NYSPSC | New York State Public Service Commission | |
| NYSRC | New York State Reliability Council, LLC | |
| PAPUC | Pennsylvania Public Utility Commission | |
| PJM | PJM Interconnection LLC | |
| SEC | U.S. Securities and Exchange Commission | |
| Accounting | ||
| ABO | Accumulated Benefit Obligation | |
| ASU | Accounting Standards Update | |
| FASB | Financial Accounting Standards Board | |
| LILO | Lease In/Lease Out | |
| OCI | Other Comprehensive Income | |
| SFAS | Statement of Financial Accounting Standards | |
| SSCM | Simplified service cost method | |
| VIE | Variable interest entity | |
| Environmental | ||
| CO 2 | Carbon dioxide | |
| GHG | Greenhouse gases | |
| MGP Sites | Manufactured gas plant sites | |
| PCBs | Polychlorinated biphenyls | |
| PRP | Potentially responsible party | |
| SO 2 | Sulfur dioxide | |
| Superfund | Federal Comprehensive Environmental Response, Compensation and Liability Act of 1980 and similar state statutes | |
| 3 |
Table of Contents
| Units of Measure | ||
| dths | Dekatherms | |
| kV | Kilovolts | |
| kWh | Kilowatt-hour | |
| mdths | Thousand dekatherms | |
| MMlbs | Million pounds | |
| MVA | Megavolt amperes | |
| MW | Megawatts or thousand kilowatts | |
| MWH | Megawatt hour | |
| Other | ||
| AFDC | Allowance for funds used during construction | |
| COSO | Committee of Sponsoring Organizations of the Treadway Commission | |
| EMF | Electric and magnetic fields | |
| ERRP | East River Repowering Project | |
| Fitch | Fitch Ratings | |
| First Quarter Form 10-Q | The Companies’ combined Quarterly Report on Form 10-Q for the quarterly period ended March 31, 2011 | |
| Form 10-K | The Companies’ combined Annual Report on Form 10-K for the year ended December 31, 2010 | |
| LTIP | Long Term Incentive Plan | |
| Moody’s | Moody’s Investors Service | |
| S&P | Standard & Poor’s Rating Services | |
| VaR | Value-at-Risk | |
| 4 |
Table of Contents
Forward-Looking Statements
This report includes forward-looking statements intended to qualify for the safe-harbor provisions of Section 27A of the Securities Act of 1933, as amended, and Section 21E of the Securities Exchange Act of 1934, as amended. Forward-looking statements are statements of future expectation and not facts. Words such as “expects,” “estimates,” “anticipates,” “intends,” “believes,” “plans,” “will” and similar expressions identify forward-looking statements. Forward-looking statements are based on information available at the time the statements are made, and accordingly speak only as of that time. Actual results or developments might differ materially from those included in the forward-looking statements because of various factors such as those discussed under “Risk Factors” in Item 1A of the Form 10-K.
| 5 |
Table of Contents
| Consolidated Edison, Inc. |
|
For the Three Months
Ended March 31, |
||||||||
| 2011 | 2010 | |||||||
|
(Millions of Dollars/
Except Share Data) |
||||||||
|
OPERATING REVENUES |
||||||||
|
Electric |
$ | 1,869 | $ | 1,889 | ||||
|
Gas |
755 | 773 | ||||||
|
Steam |
325 | 307 | ||||||
|
Non-utility |
400 | 493 | ||||||
|
TOTAL OPERATING REVENUES |
3,349 | 3,462 | ||||||
|
OPERATING EXPENSES |
||||||||
|
Purchased power |
865 | 1,143 | ||||||
|
Fuel |
176 | 150 | ||||||
|
Gas purchased for resale |
308 | 343 | ||||||
|
Other operations and maintenance |
698 | 702 | ||||||
|
Depreciation and amortization |
218 | 204 | ||||||
|
Taxes, other than income taxes |
458 | 428 | ||||||
|
TOTAL OPERATING EXPENSES |
2,723 | 2,970 | ||||||
|
OPERATING INCOME |
626 | 492 | ||||||
|
OTHER INCOME (DEDUCTIONS) |
||||||||
|
Investment and other income |
9 | 6 | ||||||
|
Allowance for equity funds used during construction |
4 | 5 | ||||||
|
Other deductions |
(4 | ) | (3 | ) | ||||
|
TOTAL OTHER INCOME (DEDUCTIONS) |
9 | 8 | ||||||
|
INCOME BEFORE INTEREST AND INCOME TAX EXPENSE |
635 | 500 | ||||||
|
INTEREST EXPENSE |
||||||||
|
Interest on long-term debt |
147 | 150 | ||||||
|
Other interest |
7 | 2 | ||||||
|
Allowance for borrowed funds used during construction |
(2 | ) | (3 | ) | ||||
|
NET INTEREST EXPENSE |
152 | 149 | ||||||
|
INCOME BEFORE INCOME TAX EXPENSE |
483 | 351 | ||||||
|
INCOME TAX EXPENSE |
169 | 122 | ||||||
|
NET INCOME |
314 | 229 | ||||||
|
Preferred stock dividend requirements of subsidiary |
(3 | ) | (3 | ) | ||||
|
NET INCOME FOR COMMON STOCK |
$ | 311 | $ | 226 | ||||
|
EARNINGS PER COMMON SHARE—BASIC |
||||||||
|
Net income for common stock |
$ | 1.07 | $ | 0.80 | ||||
|
EARNINGS PER COMMON SHARE—DILUTED |
||||||||
|
Net income for common stock |
$ | 1.06 | $ | 0.80 | ||||
|
DIVIDENDS DECLARED PER SHARE OF COMMON STOCK |
$ | 0.600 | $ | 0.595 | ||||
|
AVERAGE NUMBER OF SHARES OUTSTANDING—BASIC (IN MILLIONS) |
292.0 | 281.4 | ||||||
|
AVERAGE NUMBER OF SHARES OUTSTANDING—DILUTED (IN MILLIONS) |
293.6 | 282.7 | ||||||
The accompanying notes are an integral part of these financial statements.
| 6 |
Table of Contents
|
Consolidated Edison, Inc. |
|
For the Three Months
Ended March 31, |
||||||||
| 2011 | 2010 | |||||||
| (Millions of Dollars) | ||||||||
|
OPERATING ACTIVITIES |
||||||||
|
Net Income |
$ | 314 | $ | 229 | ||||
|
PRINCIPAL NON-CASH CHARGES/(CREDITS) TO INCOME |
||||||||
|
Depreciation and amortization |
218 | 204 | ||||||
|
Deferred income taxes |
232 | 37 | ||||||
|
Common equity component of allowance for funds used during construction |
(4 | ) | (5 | ) | ||||
|
Net derivative (gains)/losses |
(37 | ) | 64 | |||||
|
Other non-cash items (net) |
2 | 104 | ||||||
|
CHANGES IN ASSETS AND LIABILITIES |
||||||||
|
Accounts receivable – customers, less allowance for uncollectibles |
(5 | ) | (139 | ) | ||||
|
Materials and supplies, including fuel oil and gas in storage |
103 | 52 | ||||||
|
Other receivables and other current assets |
66 | 8 | ||||||
|
Prepayments |
(217 | ) | (289 | ) | ||||
|
Refundable energy costs |
— | (69 | ) | |||||
|
Accounts payable |
(154 | ) | (100 | ) | ||||
|
Pensions and retiree benefits |
(232 | ) | 58 | |||||
|
Accrued taxes |
(20 | ) | 70 | |||||
|
Accrued interest |
51 | 44 | ||||||
|
Deferred charges, deferred derivative losses, noncurrent assets and other regulatory assets |
(19 | ) | (502 | ) | ||||
|
Deferred credits and other regulatory liabilities |
67 | 178 | ||||||
|
Other assets |
(1 | ) | (3 | ) | ||||
|
Other liabilities |
(2 | ) | 60 | |||||
|
NET CASH FLOWS FROM OPERATING ACTIVITIES |
362 | 1 | ||||||
|
INVESTING ACTIVITIES |
||||||||
|
Utility construction expenditures |
(398 | ) | (430 | ) | ||||
|
Cost of removal less salvage |
(39 | ) | (34 | ) | ||||
|
Non-utility construction expenditures |
(23 | ) | (1 | ) | ||||
|
Loan to affiliate |
(40 | ) | ||||||
|
Common equity component of allowance for funds used during construction |
4 | 5 | ||||||
|
NET CASH FLOWS USED IN INVESTING ACTIVITIES |
(496 | ) | (460 | ) | ||||
|
FINANCING ACTIVITIES |
||||||||
|
Net proceeds from short-term debt |
464 | 475 | ||||||
|
Retirement of long-term debt |
(1 | ) | (45 | ) | ||||
|
Issuance of common stock |
25 | 14 | ||||||
|
Common stock dividends |
(173 | ) | (155 | ) | ||||
|
Preferred stock dividends |
(3 | ) | (3 | ) | ||||
|
NET CASH FLOWS FROM FINANCING ACTIVITIES |
312 | 286 | ||||||
|
CASH AND TEMPORARY CASH INVESTMENTS: |
||||||||
|
NET CHANGE FOR THE PERIOD |
178 | (173 | ) | |||||
|
BALANCE AT BEGINNING OF PERIOD |
338 | 260 | ||||||
|
BALANCE AT END OF PERIOD |
$ | 516 | $ | 87 | ||||
|
SUPPLEMENTAL DISCLOSURE OF CASH FLOW INFORMATION |
||||||||
|
Cash paid/(refunded) during the period for: |
||||||||
|
Interest |
$ | 90 | $ | 103 | ||||
|
Income taxes |
$ | (172 | ) | — | ||||
The accompanying notes are an integral part of these financial statements.
| 7 |
Table of Contents
|
Consolidated Edison, Inc. |
|
March 31,
2011 |
December 31,
2010 |
|||||||
| (Millions of Dollars) | ||||||||
|
ASSETS |
||||||||
|
CURRENT ASSETS |
||||||||
|
Cash and temporary cash investments |
$ | 516 | $ | 338 | ||||
|
Accounts receivable – customers, less allowance for uncollectible accounts of $81 and $76 in 2011 and 2010, respectively |
1,178 | 1,173 | ||||||
|
Accrued unbilled revenue |
413 | 633 | ||||||
|
Other receivables, less allowance for uncollectible accounts of $9 and $8 in 2011 and 2010, respectively |
331 | 300 | ||||||
|
Fuel oil, gas in storage, materials and supplies, at average cost |
245 | 348 | ||||||
|
Prepayments |
558 | 341 | ||||||
|
Regulatory assets |
147 | 203 | ||||||
|
Other current assets |
202 | 171 | ||||||
|
TOTAL CURRENT ASSETS |
3,590 | 3,507 | ||||||
|
INVESTMENTS |
413 | 403 | ||||||
|
UTILITY PLANT, AT ORIGINAL COST |
||||||||
|
Electric |
20,273 | 19,851 | ||||||
|
Gas |
4,392 | 4,344 | ||||||
|
Steam |
2,055 | 2,038 | ||||||
|
General |
1,899 | 1,911 | ||||||
|
TOTAL |
28,619 | 28,144 | ||||||
|
Less: Accumulated depreciation |
5,891 | 5,808 | ||||||
|
Net |
22,728 | 22,336 | ||||||
|
Construction work in progress |
1,253 | 1,458 | ||||||
|
NET UTILITY PLANT |
23,981 | 23,794 | ||||||
|
NON-UTILITY PLANT |
||||||||
|
Non-utility property, less accumulated depreciation of $53 and $51 in 2011 and 2010, respectively |
50 | 46 | ||||||
|
Construction work in progress |
37 | 23 | ||||||
|
NET PLANT |
24,068 | 23,863 | ||||||
|
OTHER NONCURRENT ASSETS |
||||||||
|
Goodwill |
429 | 429 | ||||||
|
Intangible assets, less accumulated amortization $3 in 2011 and 2010 |
3 | 3 | ||||||
|
Regulatory assets |
7,374 | 7,643 | ||||||
|
Other deferred charges and noncurrent assets |
309 | 298 | ||||||
|
TOTAL OTHER NONCURRENT ASSETS |
8,115 | 8,373 | ||||||
|
TOTAL ASSETS |
$ | 36,186 | $ | 36,146 | ||||
The accompanying notes are an integral part of these financial statements.
| 8 |
Table of Contents
|
Consolidated Edison, Inc. CONSOLIDATED BALANCE SHEET |
|
March 31,
2011 |
December 31,
2010 |
|||||||
| (Millions of Dollars) | ||||||||
|
LIABILITIES AND SHAREHOLDERS' EQUITY |
||||||||
|
CURRENT LIABILITIES |
||||||||
|
Long-term debt due within one year |
$ | 5 | $ | 5 | ||||
|
Notes payable |
464 | — | ||||||
|
Accounts payable |
967 | 1,151 | ||||||
|
Customer deposits |
296 | 289 | ||||||
|
Accrued taxes |
70 | 90 | ||||||
|
Accrued interest |
206 | 155 | ||||||
|
Accrued wages |
94 | 102 | ||||||
|
Fair value of derivative liabilities |
117 | 125 | ||||||
|
Other current liabilities |
457 | 449 | ||||||
|
TOTAL CURRENT LIABILITIES |
2,676 | 2,366 | ||||||
|
NONCURRENT LIABILITIES |
||||||||
|
Obligations under capital leases |
5 | 7 | ||||||
|
Provision for injuries and damages |
167 | 165 | ||||||
|
Pensions and retiree benefits |
2,659 | 3,287 | ||||||
|
Superfund and other environmental costs |
511 | 512 | ||||||
|
Asset retirement obligations |
111 | 109 | ||||||
|
Fair value of derivative liabilities |
52 | 77 | ||||||
|
Other noncurrent liabilities |
121 | 126 | ||||||
|
TOTAL NONCURRENT LIABILITIES |
3,626 | 4,283 | ||||||
|
DEFERRED CREDITS AND REGULATORY LIABILITIES |
||||||||
|
Deferred income taxes and investment tax credits |
6,871 | 6,602 | ||||||
|
Regulatory liabilities |
865 | 915 | ||||||
|
Other deferred credits |
34 | 35 | ||||||
|
TOTAL DEFERRED CREDITS AND REGULATORY LIABILITIES |
7,770 | 7,552 | ||||||
|
LONG-TERM DEBT |
10,670 | 10,671 | ||||||
|
SHAREHOLDERS' EQUITY |
||||||||
|
Common shareholders' equity (See Statement of Common Shareholders' Equity) |
11,231 | 11,061 | ||||||
|
Preferred stock of subsidiary |
213 | 213 | ||||||
|
TOTAL SHAREHOLDERS' EQUITY |
11,444 | 11,274 | ||||||
|
TOTAL LIABILITIES AND SHAREHOLDERS' EQUITY |
$ | 36,186 | $ | 36,146 | ||||
The accompanying notes are an integral part of these financial statements.
| 9 |
Table of Contents
| Consolidated Edison, Inc. |
CONSOLIDATED STATEMENT OF COMPREHENSIVE INCOME (UNAUDITED)
|
For the Three Months
Ended March 31, |
||||||||
| 2011 | 2010 | |||||||
| (Millions of Dollars) | ||||||||
|
NET INCOME |
$ | 314 | $ | 229 | ||||
|
OTHER COMPREHENSIVE INCOME, NET OF TAXES |
||||||||
|
Pension plan liability adjustments, net of taxes of $2 in 2011 and 2010 |
3 | 3 | ||||||
|
TOTAL OTHER COMPREHENSIVE INCOME, NET OF TAXES |
3 | 3 | ||||||
|
COMPREHENSIVE INCOME |
$ | 317 | $ | 232 | ||||
|
Preferred stock dividend requirements of subsidiary |
(3 | ) | (3 | ) | ||||
|
COMPREHENSIVE INCOME FOR COMMON STOCK |
$ | 314 | $ | 229 | ||||
The accompanying notes are an integral part of these financial statements.
| 10 |
Table of Contents
| Consolidated Edison, Inc. |
CONSOLIDATED STATEMENT OF COMMON SHAREHOLDERS' EQUITY (UNAUDITED)
|
(Millions of Dollars/Except Share
|
Common Stock |
Additional Paid- In Capital |
Retained Earnings |
Treasury Stock |
Capital
Expense |
Accumulated
Income/(Loss) |
||||||||||||||||||||||||||||||
| Shares | Amount | Shares | Amount | Total | ||||||||||||||||||||||||||||||||
|
BALANCE AS OF DECEMBER 31, 2009 |
281,123,741 | $ | 30 | $ | 4,420 | $ | 6,904 | 23,210,700 | $ | (1,001 | ) | $ | (62 | ) | $ | (42 | ) | $ | 10,249 | |||||||||||||||||
|
Net income for common stock |
226 | 226 | ||||||||||||||||||||||||||||||||||
|
Common stock dividends |
(167 | ) | (167 | ) | ||||||||||||||||||||||||||||||||
|
Issuance of common shares – dividend reinvestment and employee stock plans |
647,731 | 28 | 28 | |||||||||||||||||||||||||||||||||
|
Other comprehensive income |
3 | 3 | ||||||||||||||||||||||||||||||||||
|
BALANCE AS OF MARCH 31, 2010 |
281,771,472 | $ | 30 | $ | 4,448 | $ | 6,963 | 23,210,700 | $ | (1,001 | ) | $ | (62 | ) | $ | (39 | ) | $ | 10,339 | |||||||||||||||||
|
BALANCE AS OF DECEMBER 31, 2010 |
291,616,334 | $ | 31 | $ | 4,915 | $ | 7,220 | 23,210,700 | $ | (1,001 | ) | $ | (64 | ) | $ | (40 | ) | $ | 11,061 | |||||||||||||||||
|
Net income for common stock |
311 | 311 | ||||||||||||||||||||||||||||||||||
|
Common stock dividends |
(175 | ) | (175 | ) | ||||||||||||||||||||||||||||||||
|
Issuance of common shares – dividend reinvestment and employee stock plans |
656,049 | 1 | 30 | 31 | ||||||||||||||||||||||||||||||||
|
Other comprehensive income |
3 | 3 | ||||||||||||||||||||||||||||||||||
|
BALANCE AS OF MARCH 31, 2011 |
292,272,383 | $ | 32 | $ | 4,945 | $ | 7,356 | 23,210,700 | $ | (1,001 | ) | $ | (64 | ) | $ | (37 | ) | $ | 11,231 | |||||||||||||||||
The accompanying notes are an integral part of these financial statements.
| 11 |
Table of Contents
|
Consolidated Edison Company of New York, Inc. |
|
For the Three Months
Ended March 31, |
||||||||
| 2011 | 2010 | |||||||
| (Millions of Dollars) | ||||||||
|
OPERATING REVENUES |
||||||||
|
Electric |
$ | 1,721 | $ | 1,728 | ||||
|
Gas |
663 | 683 | ||||||
|
Steam |
325 | 307 | ||||||
|
TOTAL OPERATING REVENUES |
2,709 | 2,718 | ||||||
|
OPERATING EXPENSES |
||||||||
|
Purchased power |
483 | 552 | ||||||
|
Fuel |
176 | 150 | ||||||
|
Gas purchased for resale |
263 | 294 | ||||||
|
Other operations and maintenance |
597 | 608 | ||||||
|
Depreciation and amortization |
204 | 191 | ||||||
|
Taxes, other than income taxes |
440 | 411 | ||||||
|
TOTAL OPERATING EXPENSES |
2,163 | 2,206 | ||||||
|
OPERATING INCOME |
546 | 512 | ||||||
|
OTHER INCOME (DEDUCTIONS) |
||||||||
|
Investment and other income |
5 | 3 | ||||||
|
Allowance for equity funds used during construction |
3 | 4 | ||||||
|
Other deductions |
(3 | ) | (2 | ) | ||||
|
TOTAL OTHER INCOME (DEDUCTIONS) |
5 | 5 | ||||||
|
INCOME BEFORE INTEREST AND INCOME TAX EXPENSE |
551 | 517 | ||||||
|
INTEREST EXPENSE |
||||||||
|
Interest on long-term debt |
132 | 135 | ||||||
|
Other interest |
5 | 3 | ||||||
|
Allowance for borrowed funds used during construction |
(2 | ) | (2 | ) | ||||
|
NET INTEREST EXPENSE |
135 | 136 | ||||||
|
INCOME BEFORE INCOME TAX EXPENSE |
416 | 381 | ||||||
|
INCOME TAX EXPENSE |
145 | 135 | ||||||
|
NET INCOME |
271 | 246 | ||||||
|
Preferred stock dividend requirements |
(3 | ) | (3 | ) | ||||
|
NET INCOME FOR COMMON STOCK |
$ | 268 | $ | 243 | ||||
The accompanying notes are an integral part of these financial statements.
| 12 |
Table of Contents
| Consolidated Edison Company of New York, Inc. |
CONSOLIDATED STATEMENT OF CASH FLOWS (UNAUDITED)
|
For the Three Months
Ended March 31, |
||||||||
| 2011 | 2010 | |||||||
| (Millions of Dollars) | ||||||||
|
OPERATING ACTIVITIES |
||||||||
|
Net income |
$ | 271 | $ | 246 | ||||
|
PRINCIPAL NON-CASH CHARGES/(CREDITS) TO INCOME |
||||||||
|
Depreciation and amortization |
204 | 191 | ||||||
|
Deferred income taxes |
207 | 64 | ||||||
|
Common equity component of allowance for funds used during construction |
(3 | ) | (4 | ) | ||||
|
Other non-cash items (net) |
29 | 29 | ||||||
|
CHANGES IN ASSETS AND LIABILITIES |
||||||||
|
Accounts receivable – customers, less allowance for uncollectibles |
22 | (110 | ) | |||||
|
Materials and supplies, including fuel oil and gas in storage |
84 | 38 | ||||||
|
Other receivables and other current assets |
(77 | ) | 99 | |||||
|
Prepayments |
(291 | ) | (284 | ) | ||||
|
Refundable energy costs |
— | (77 | ) | |||||
|
Accounts payable |
(119 | ) | (77 | ) | ||||
|
Pensions and retiree benefits |
(255 | ) | 39 | |||||
|
Accrued taxes |
(37 | ) | (4 | ) | ||||
|
Accrued interest |
44 | 35 | ||||||
|
Deferred charges, deferred derivative losses, noncurrent assets and other regulatory assets |
(63 | ) | (346 | ) | ||||
|
Deferred credits and other regulatory liabilities |
52 | 134 | ||||||
|
Other liabilities |
4 | 49 | ||||||
|
NET CASH FLOWS FROM OPERATING ACTIVITIES |
72 | 22 | ||||||
|
INVESTING ACTIVITIES |
||||||||
|
Utility construction expenditures |
(379 | ) | (412 | ) | ||||
|
Cost of removal less salvage |
(37 | ) | (33 | ) | ||||
|
Common equity component of allowance for funds used during construction |
3 | 4 | ||||||
|
NET CASH FLOWS USED IN INVESTING ACTIVITIES |
(413 | ) | (441 | ) | ||||
|
FINANCING ACTIVITIES |
||||||||
|
Net proceeds from short-term debt |
464 | 475 | ||||||
|
Capital contribution by parent |
— | 12 | ||||||
|
Dividend to parent |
(170 | ) | (167 | ) | ||||
|
Preferred stock dividends |
(3 | ) | (3 | ) | ||||
|
NET CASH FLOWS FROM FINANCING ACTIVITIES |
291 | 317 | ||||||
|
CASH AND TEMPORARY CASH INVESTMENTS: |
||||||||
|
NET CHANGE FOR THE PERIOD |
(50 | ) | (102 | ) | ||||
|
BALANCE AT BEGINNING OF PERIOD |
78 | 131 | ||||||
|
BALANCE AT END OF PERIOD |
$ | 28 | $ | 29 | ||||
|
SUPPLEMENTAL DISCLOSURE OF CASH FLOW INFORMATION |
||||||||
|
Cash paid during the period for: |
||||||||
|
Interest |
$ | 82 | $ | 96 | ||||
|
Income taxes |
$ | 35 | — | |||||
The accompanying notes are an integral part of these financial statements.
| 13 |
Table of Contents
| Consolidated Edison Company of New York, Inc. |
|
March 31,
2011 |
December 31,
2010 |
|||||||
| (Millions of Dollars) | ||||||||
|
ASSETS |
||||||||
|
CURRENT ASSETS |
||||||||
|
Cash and temporary cash investments |
$ | 28 | $ | 78 | ||||
|
Accounts receivable – customers, less allowance for uncollectible accounts of $73 and $68 in 2011 and 2010, respectively |
1,003 | 1,025 | ||||||
|
Other receivables, less allowance for uncollectible accounts of $8 and $7 in 2011 and 2010, respectively |
122 | 103 | ||||||
|
Accrued unbilled revenue |
288 | 473 | ||||||
|
Accounts receivable from affiliated companies |
310 | 249 | ||||||
|
Fuel oil, gas in storage, materials and supplies, at average cost |
222 | 306 | ||||||
|
Prepayments |
373 | 82 | ||||||
|
Regulatory assets |
116 | 151 | ||||||
|
Other current assets |
108 | 98 | ||||||
|
TOTAL CURRENT ASSETS |
2,570 | 2,565 | ||||||
|
INVESTMENTS |
177 | 167 | ||||||
|
UTILITY PLANT AT ORIGINAL COST |
||||||||
|
Electric |
19,140 | 18,735 | ||||||
|
Gas |
3,891 | 3,844 | ||||||
|
Steam |
2,055 | 2,038 | ||||||
|
General |
1,731 | 1,746 | ||||||
|
TOTAL |
26,817 | 26,363 | ||||||
|
Less: Accumulated depreciation |
5,389 | 5,314 | ||||||
|
Net |
21,428 | 21,049 | ||||||
|
Construction work in progress |
1,143 | 1,345 | ||||||
|
NET UTILITY PLANT |
22,571 | 22,394 | ||||||
|
NON-UTILITY PROPERTY |
||||||||
|
Non-utility property, less accumulated depreciation of $22 in 2011 and 2010 |
7 | 7 | ||||||
|
NET PLANT |
22,578 | 22,401 | ||||||
|
OTHER NONCURRENT ASSETS |
||||||||
|
Regulatory assets |
6,813 | 7,058 | ||||||
|
Other deferred charges and noncurrent assets |
258 | 244 | ||||||
|
TOTAL OTHER NONCURRENT ASSETS |
7,071 | 7,302 | ||||||
|
TOTAL ASSETS |
$ | 32,396 | $ | 32,435 | ||||
The accompanying notes are an integral part of these financial statements.
| 14 |
Table of Contents
| Consolidated Edison Company of New York, Inc. |
|
March 31,
2011 |
December 31,
2010 |
|||||||
| (Millions of Dollars) | ||||||||
|
LIABILITIES AND SHAREHOLDER'S EQUITY |
||||||||
|
CURRENT LIABILITIES |
||||||||
|
Notes payable |
$ | 464 | $ | — | ||||
|
Accounts payable |
771 | 924 | ||||||
|
Accounts payable to affiliated companies |
15 | 13 | ||||||
|
Customer deposits |
283 | 276 | ||||||
|
Accrued taxes |
17 | 34 | ||||||
|
Accrued taxes to affiliated companies |
9 | 29 | ||||||
|
Accrued interest |
174 | 130 | ||||||
|
Accrued wages |
87 | 93 | ||||||
|
Other current liabilities |
452 | 460 | ||||||
|
TOTAL CURRENT LIABILITIES |
2,272 | 1,959 | ||||||
|
NONCURRENT LIABILITIES |
||||||||
|
Obligations under capital leases |
5 | 7 | ||||||
|
Provision for injuries and damages |
160 | 159 | ||||||
|
Pensions and retiree benefits |
2,280 | 2,900 | ||||||
|
Superfund and other environmental costs |
392 | 392 | ||||||
|
Asset retirement obligations |
111 | 109 | ||||||
|
Fair value of derivative liabilities |
22 | 29 | ||||||
|
Other noncurrent liabilities |
113 | 116 | ||||||
|
TOTAL NONCURRENT LIABILITIES |
3,083 | 3,712 | ||||||
|
DEFERRED CREDITS AND REGULATORY LIABILITIES |
||||||||
|
Deferred income taxes and investment tax credits |
6,309 | 6,071 | ||||||
|
Regulatory liabilities |
724 | 783 | ||||||
|
Other deferred credits |
31 | 31 | ||||||
|
TOTAL DEFERRED CREDITS AND REGULATORY LIABILITIES |
7,064 | 6,885 | ||||||
|
LONG-TERM DEBT |
9,743 | 9,743 | ||||||
|
SHAREHOLDER'S EQUITY |
||||||||
|
Common shareholder's equity (See Statement of Common Shareholder's Equity) |
10,021 | 9,923 | ||||||
|
Preferred stock |
213 | 213 | ||||||
|
TOTAL SHAREHOLDER'S EQUITY |
10,234 | 10,136 | ||||||
|
TOTAL LIABILITIES AND SHAREHOLDER'S EQUITY |
$ | 32,396 | $ | 32,435 | ||||
The accompanying notes are an integral part of these financial statements.
| 15 |
Table of Contents
| Consolidated Edison Company of New York, Inc. |
CONSOLIDATED STATEMENT OF COMMON SHAREHOLDER'S EQUITY (UNAUDITED)
| Common Stock |
Additional
Paid-In Capital |
Retained Earnings |
Repurchased
Stock |
Capital
Expense |
Accumulated
Income/(Loss) |
|||||||||||||||||||||||||||
| (Millions of Dollars/Except Share Data) | Shares | Amount | Total | |||||||||||||||||||||||||||||
|
BALANCE AS OF DECEMBER 31, 2009 |
235,488,094 | $ | 589 | $ | 3,877 | $ | 5,909 | $ | (962 | ) | $ | (62 | ) | $ | (4 | ) | $ | 9,347 | ||||||||||||||
|
Net income |
246 | 246 | ||||||||||||||||||||||||||||||
|
Capital contribution from parent |
12 | 12 | ||||||||||||||||||||||||||||||
|
Common stock dividend to parent |
(167 | ) | (167 | ) | ||||||||||||||||||||||||||||
|
Cumulative preferred dividends |
(3 | ) | (3 | ) | ||||||||||||||||||||||||||||
|
BALANCE AS OF MARCH 31, 2010 |
235,488,094 | $ | 589 | $ | 3,889 | $ | 5,985 | $ | (962 | ) | $ | (62 | ) | $ | (4 | ) | $ | 9,435 | ||||||||||||||
|
BALANCE AS OF DECEMBER 31, 2010 |
235,488,094 | $ | 589 | $ | 4,234 | $ | 6,132 | $ | (962 | ) | $ | (64 | ) | $ | (6 | ) | $ | 9,923 | ||||||||||||||
|
Net income |
271 | 271 | ||||||||||||||||||||||||||||||
|
Common stock dividend to parent |
(170 | ) | (170 | ) | ||||||||||||||||||||||||||||
|
Cumulative preferred dividends |
(3 | ) | (3 | ) | ||||||||||||||||||||||||||||
|
BALANCE AS OF MARCH 31, 2011 |
235,488,094 | $ | 589 | $ | 4,234 | $ | 6,230 | $ | (962 | ) | $ | (64 | ) | $ | (6 | ) | $ | 10,021 | ||||||||||||||
The accompanying notes are an integral part of these financial statements.
| 16 |
Table of Contents
NOTES TO THE FINANCIAL STATEMENTS (UNAUDITED)
General
These combined notes accompany and form an integral part of the separate consolidated financial statements of each of the two separate registrants: Consolidated Edison, Inc. and its subsidiaries (Con Edison) and Consolidated Edison Company of New York, Inc. and its subsidiaries (CECONY). CECONY is a subsidiary of Con Edison and as such its financial condition and results of operations and cash flows, which are presented separately in the CECONY consolidated financial statements, are also consolidated, along with those of Con Edison’s other utility subsidiary, Orange and Rockland Utilities, Inc. (O&R), and Con Edison’s competitive energy businesses (discussed below) in Con Edison’s consolidated financial statements. The term “Utilities” is used in these notes to refer to CECONY and O&R.
As used in these notes, the term “Companies” refers to Con Edison and CECONY and, except as otherwise noted, the information in these combined notes relates to each of the Companies. However, CECONY makes no representation as to information relating to Con Edison or the subsidiaries of Con Edison other than itself.
The separate interim consolidated financial statements of each of the Companies are unaudited but, in the opinion of their respective managements, reflect all adjustments (which include only normally recurring adjustments) necessary for a fair presentation of the results for the interim periods presented. The Companies’ separate interim consolidated financial statements should be read together with their separate audited financial statements (including the combined notes thereto) included in Item 8 of their combined Annual Report on Form 10-K for the year ended December 31, 2010 (the Form 10-K). Information in the notes to the consolidated financial statements in the Form 10-K referred to in these notes is incorporated by reference herein. The use of terms such as “see” or “refer to” shall be deemed to incorporate by reference into these notes the information to which reference is made.
Con Edison has two regulated utility subsidiaries: CECONY and O&R. CECONY provides electric service and gas service in New York City and Westchester County. The company also provides steam service in parts of Manhattan. O&R, along with its regulated utility subsidiaries, provides electric service in southeastern New York and adjacent areas of northern New Jersey and eastern Pennsylvania and gas service in southeastern New York and adjacent areas of eastern Pennsylvania. Con Edison has the following competitive energy businesses: Consolidated Edison Solutions, Inc. (Con Edison Solutions), a retail energy services company that sells electricity and also offers energy-related services; Consolidated Edison Energy, Inc. (Con Edison Energy), a wholesale energy supply and services company; and Consolidated Edison Development, Inc. (Con Edison Development), a company that develops and participates in infrastructure projects.
| 17 |
Table of Contents
Note A — Summary of Significant Accounting Policies
Earnings Per Common Share
Reference is made to “Earnings Per Common Share” in Note A to the financial statements included in Item 8 of the Form 10-K. For the three months ended March 31, 2011 and 2010, Con Edison’s basic and diluted EPS for Con Edison are calculated as follows:
| (Millions of Dollars, except per share amounts/Shares in Millions) | 2011 | 2010 | ||||||
|
Net income for common stock |
$ | 311 | $ | 226 | ||||
|
Weighted average common shares outstanding – Basic |
292.0 | 281.4 | ||||||
|
Add: Incremental shares attributable to effect of potentially dilutive securities |
1.6 | 1.3 | ||||||
|
Adjusted weighted average common shares outstanding – Diluted |
293.6 | 282.7 | ||||||
|
Earnings per Common Share – Basic |
||||||||
|
Net income for common stock |
$ | 1.07 | $ | 0.80 | ||||
|
Earnings per Common Share – Diluted |
||||||||
|
Net income for common stock |
$ | 1.06 | $ | 0.80 | ||||
Note B — Regulatory Matters
Reference is made to “Accounting Policies” in Note A and “Rate Agreements” in Note B to the financial statements included in Item 8 of the Form 10-K.
Rate Agreements
O&R — Electric
In April 2011, NYSPSC administrative law judges (ALJ) issued a recommended decision with respect to O&R’s July 2010 electric rate filing recommending that the NYSPSC grant the company a $26.6 million rate increase, effective July 2011. The ALJ’s recommended decision reflects a return on common equity of 9.2 percent and a common equity ratio of 49 percent. See “Regulatory Matters – O&R – Electric” in Note B to the financial statements in Item 8 of the Form 10-K.
Other Regulatory Matters
In February 2009, the NYSPSC commenced a proceeding to examine the prudence of certain CECONY expenditures (see “Investigations of Vendor Payments” in Note G). Pursuant to NYSPSC orders, a portion of the company’s revenues (currently, $249 million, $32 million and $6 million on an annual basis for electric, gas and steam service, respectively) is being collected subject to potential refund to customers. At March 31, 2011, the company had collected an estimated $605 million from customers subject to potential refund in connection with this proceeding. In October 2010, a NYSPSC consultant reported its $21 million provisional assessment, which the company has disputed, of potential overcharges for construction work. The potential overcharges related to transactions that involved certain employees who were arrested and a contractor that performed work for the company. The NYSPSC’s consultant is expected to continue to review the company’s expenditures. The company is unable to estimate the amount, if any, of any such refund and, accordingly, has not established a regulatory liability for a refund.
In February 2011, the NYSPSC initiated a proceeding to examine the existing mechanisms pursuant to which utilities recover site investigation and remediation costs and possible alternatives. See Note G to the financial statements in Item 8 of the Form 10-K and Note F to the First Quarter Financial Statements.
| 18 |
Table of Contents
Regulatory Assets and Liabilities
Regulatory assets and liabilities at March 31, 2011 and December 31, 2010 were comprised of the following items:
| Con Edison | CECONY | |||||||||||||||
| (Millions of Dollars) | 2011 | 2010 | 2011 | 2010 | ||||||||||||
|
Regulatory assets |
||||||||||||||||
|
Unrecognized pension and other postretirement costs |
$ | 4,074 | $ | 4,371 | $ | 3,873 | $ | 4,152 | ||||||||
|
Future federal income tax |
1,622 | 1,593 | 1,542 | 1,515 | ||||||||||||
|
Environmental remediation costs |
693 | 695 | 573 | 574 | ||||||||||||
|
Surcharge for New York State Assessment |
159 | 121 | 148 | 112 | ||||||||||||
|
Net electric deferrals |
134 | 156 | 134 | 156 | ||||||||||||
|
Pension and other post retirement benefits deferrals |
183 | 138 | 138 | 90 | ||||||||||||
|
Revenue taxes |
152 | 145 | 147 | 140 | ||||||||||||
|
Deferred derivative losses – long-term |
57 | 74 | 37 | 48 | ||||||||||||
|
Deferred storm costs |
55 | 57 | 42 | 43 | ||||||||||||
|
Property tax reconciliation |
32 | 34 | 23 | 27 | ||||||||||||
|
O&R transition bond charges |
48 | 48 | — | — | ||||||||||||
|
World Trade Center restoration costs |
— | 45 | — | 45 | ||||||||||||
|
Workers’ compensation |
33 | 31 | 33 | 31 | ||||||||||||
|
Other |
132 | 135 | 123 | 125 | ||||||||||||
|
Regulatory assets – long-term |
7,374 | 7,643 | 6,813 | 7,058 | ||||||||||||
|
Deferred derivative losses – current |
146 | 190 | 116 | 151 | ||||||||||||
|
Recoverable energy costs – current |
1 | 13 | — | — | ||||||||||||
|
Regulatory assets – current |
147 | 203 | 116 | 151 | ||||||||||||
|
Total Regulatory Assets |
$ | 7,521 | $ | 7,846 | $ | 6,929 | $ | 7,209 | ||||||||
|
Regulatory liabilities |
||||||||||||||||
|
Allowance for cost of removal less salvage |
$ | 422 | $ | 422 | $ | 349 | $ | 350 | ||||||||
|
Refundable energy costs |
91 | 78 | 61 | 50 | ||||||||||||
|
Revenue decoupling mechanism |
54 | 38 | 54 | 38 | ||||||||||||
|
Net unbilled revenue deferrals |
33 | 136 | 33 | 136 | ||||||||||||
|
New York State tax refund |
30 | 30 | 30 | 30 | ||||||||||||
|
Gain on sale of properties |
15 | 31 | 15 | 31 | ||||||||||||
|
Other |
220 | 180 | 182 | 148 | ||||||||||||
|
Regulatory liabilities |
865 | 915 | 724 | 783 | ||||||||||||
|
Deferred derivative gains – current |
10 | 4 | 8 | 3 | ||||||||||||
|
Total Regulatory Liabilities |
$ | 875 | $ | 919 | $ | 732 | $ | 786 | ||||||||
Note C — Short-Term Borrowing
Reference is made to Note D to the financial statements in Item 8 of the Form 10-K.
At March 31, 2011, Con Edison had $464 million of commercial paper outstanding, all of which was outstanding under CECONY’s program. The weighted average interest rate was 0.3 percent. At December 31, 2010, Con Edison and CECONY had no commercial paper outstanding.
At March 31, 2011 and December 31, 2010, no loans were outstanding under the Companies’ Credit Agreement and $192 million (including $142 million for CECONY) and $197 million (including $145 million for CECONY) of letters of credit were outstanding under the Credit Agreement, respectively.
Note D — Pension Benefits
Reference is made to Note E to the financial statements in Item 8 of the Form 10-K.
| 19 |
Table of Contents
Net Periodic Benefit Cost
The components of the Companies’ net periodic benefit costs for the three months ended March 31, 2011 and 2010 were as follows:
| Con Edison | CECONY | |||||||||||||||
| (Millions of Dollars) | 2011 | 2010 | 2011 | 2010 | ||||||||||||
|
Service cost – including administrative expenses |
$ | 47 | $ | 42 | $ | 44 | $ | 39 | ||||||||
|
Interest cost on projected benefit obligation |
140 | 139 | 131 | 130 | ||||||||||||
|
Expected return on plan assets |
(183 | ) | (176 | ) | (175 | ) | (167 | ) | ||||||||
|
Amortization of net actuarial loss |
132 | 106 | 125 | 100 | ||||||||||||
|
Amortization of prior service costs |
2 | 2 | 2 | 2 | ||||||||||||
|
NET PERIODIC BENEFIT COST |
$ | 138 | $ | 113 | $ | 127 | $ | 104 | ||||||||
|
TOTAL PERIODIC BENEFIT COST |
$ | 138 | $ | 113 | $ | 127 | $ | 104 | ||||||||
|
Cost capitalized |
(48 | ) | (41 | ) | (45 | ) | (39 | ) | ||||||||
|
Cost deferred |
(51 | ) | (23 | ) | (52 | ) | (21 | ) | ||||||||
|
Cost charged to operating expenses |
$ | 39 | $ | 49 | $ | 30 | $ | 44 | ||||||||
Expected Contributions
Based on estimates as of March 31, 2011, the Companies are not required under funding regulations and laws to make any contributions to the pension plan during 2011. The Companies’ policy is to fund their accounting cost to the extent tax deductible. In 2011, Con Edison expects to make discretionary contributions to the pension plan of $533 million, of which CECONY contributed $491 million during the first quarter. The Companies also expect to fund $11 million for their non-qualified supplemental pension plans in 2011.
Note E — Other Postretirement Benefits
Reference is made to Note F to the financial statements in Item 8 of the Form 10-K.
Net Periodic Benefit Cost
The components of the Companies’ net periodic postretirement benefit costs for the three months ended March 31, 2011 and 2010 were as follows:
| Con Edison | CECONY | |||||||||||||||
| (Millions of Dollars) | 2011 | 2010 | 2011 | 2010 | ||||||||||||
|
Service cost |
$ | 6 | $ | 6 | $ | 5 | $ | 5 | ||||||||
|
Interest cost on accumulated other postretirement benefit obligation |
21 | 23 | 18 | 20 | ||||||||||||
|
Expected return on plan assets |
(22 | ) | (22 | ) | (19 | ) | (19 | ) | ||||||||
|
Amortization of net actuarial loss |
22 | 23 | 20 | 21 | ||||||||||||
|
Amortization of prior service cost |
(2 | ) | (3 | ) | (3 | ) | (4 | ) | ||||||||
|
Amortization of transition obligation |
1 | 1 | 1 | 1 | ||||||||||||
|
NET PERIODIC POSTRETIREMENT BENEFIT COST |
$ | 26 | $ | 28 | $ | 22 | $ | 24 | ||||||||
|
Cost capitalized |
(9 | ) | (10 | ) | (8 | ) | (9 | ) | ||||||||
|
Cost deferred |
4 | (1 | ) | 3 | (2 | ) | ||||||||||
|
Cost charged to operating expenses |
$ | 21 | $ | 17 | $ | 17 | $ | 13 | ||||||||
| 20 |
Table of Contents
Expected Contributions
Based on estimates as of March 31, 2011, Con Edison expects to make a contribution of $84 million, including $74 million for CECONY, to the other postretirement benefit plans in 2011.
Note F — Environmental Matters
Superfund Sites
Hazardous substances, such as asbestos, polychlorinated biphenyls (PCBs) and coal tar, have been used or generated in the course of operations of the Utilities and their predecessors and are present at sites and in facilities and equipment they currently or previously owned, including sites at which gas was manufactured or stored.
The Federal Comprehensive Environmental Response, Compensation and Liability Act of 1980 and similar state statutes (Superfund) impose joint and several liability, regardless of fault, upon generators of hazardous substances for investigation and remediation costs (which include costs of demolition, removal, disposal, storage, replacement, containment, and monitoring) and natural resource damages. Liability under these laws can be material and may be imposed for contamination from past acts, even though such past acts may have been lawful at the time they occurred. The sites at which the Utilities have been asserted to have liability under these laws, including their manufactured gas plant sites and any neighboring areas to which contamination may have migrated, are referred to herein as “Superfund Sites.”
For Superfund Sites where there are other potentially responsible parties and the Utilities are not managing the site investigation and remediation, the accrued liability represents an estimate of the amount the Utilities will need to pay to investigate and, where determinable, discharge their related obligations. For Superfund Sites (including the manufactured gas plant sites) for which one of the Utilities is managing the investigation and remediation, the accrued liability represents an estimate of the company’s share of undiscounted cost to investigate the sites and, for sites that have been investigated in whole or in part, the cost to remediate the sites, if remediation is necessary and if a reasonable estimate of such cost can be made. Remediation costs are estimated in light of the information available, applicable remediation standards, and experience with similar sites.
The accrued liabilities and regulatory assets related to Superfund Sites at March 31, 2011 and December 31, 2010 were as follows:
| Con Edison | CECONY | |||||||||||||||
| (Millions of Dollars) | 2011 | 2010 | 2011 | 2010 | ||||||||||||
|
Accrued Liabilities: |
||||||||||||||||
|
Manufactured gas plant sites |
$ | 441 | $ | 446 | $ | 323 | $ | 327 | ||||||||
|
Other Superfund Sites |
70 | 66 | 69 | 65 | ||||||||||||
|
Total |
$ | 511 | $ | 512 | $ | 392 | $ | 392 | ||||||||
|
Regulatory assets |
$ | 691 | $ | 692 | $ | 571 | $ | 571 | ||||||||
Most of the accrued Superfund Site liability relates to sites that have been investigated, in whole or in part. However, for some of the sites, the extent and associated cost of the required remediation has not yet been determined. As investigations progress and information pertaining to the required remediation becomes available, the Utilities expect that additional liability may be accrued, the amount of which is not presently determinable but may be material. Under their current rate agreements, the Utilities are permitted to recover or defer as regulatory assets (for subsequent recovery through rates) certain site investigation and remediation costs. In February 2011, the NYSPSC initiated a proceeding to examine the existing mechanisms pursuant to which utilities recover such costs and possible alternatives.
Environmental remediation costs incurred related to Superfund Sites for the three months ended March 31, 2011 and 2010, were as follows:
| Con Edison | CECONY | |||||||||||||||
| (Millions of Dollars) | 2011 | 2010 | 2011 | 2010 | ||||||||||||
|
Remediation costs incurred |
$ | 6 | $ | 9 | $ | 5 | $ | 8 | ||||||||
There were no insurance recoveries received related to Superfund Sites for the three months ended March 31, 2011. Insurance recoveries related to Superfund Sites for the three months ended March 31, 2010 were immaterial.
| 21 |
Table of Contents
In 2010, CECONY estimated that for its manufactured gas plant sites, its aggregate undiscounted potential liability for the investigation and remediation of coal tar and/or other manufactured gas plant-related environmental contaminants could range up to $1.9 billion. In 2010, O&R estimated that for its manufactured gas plant sites, each of which has been investigated, the aggregate undiscounted potential liability for the remediation of such contaminants could range up to $200 million. These estimates were based on the assumption that there is contamination at all sites, including those that have not yet been fully investigated and additional assumptions about the extent of the contamination and the type and extent of the remediation that may be required. Actual experience may be materially different.
Asbestos Proceedings
Suits have been brought in New York State and federal courts against the Utilities and many other defendants, wherein a large number of plaintiffs sought large amounts of compensatory and punitive damages for deaths and injuries allegedly caused by exposure to asbestos at various premises of the Utilities. The suits that have been resolved, which are many, have been resolved without any payment by the Utilities, or for amounts that were not, in the aggregate, material to them. The amounts specified in all the remaining thousands of suits total billions of dollars; however, the Utilities believe that these amounts are greatly exaggerated, based on the disposition of previous claims. In 2010, CECONY estimated that its aggregate undiscounted potential liability for these suits and additional suits that may be brought over the next 15 years is $10 million. The estimate was based upon a combination of modeling, historical data analysis and risk factor assessment. Actual experience may be materially different. In addition, certain current and former employees have claimed or are claiming workers’ compensation benefits based on alleged disability from exposure to asbestos. Under its current rate agreements, CECONY is permitted to defer as regulatory assets (for subsequent recovery through rates) costs incurred for its asbestos lawsuits and workers’ compensation claims. The accrued liability for asbestos suits and workers’ compensation proceedings (including those related to asbestos exposure) and the amounts deferred as regulatory assets for the Companies at March 31, 2011 and December 31, 2010 were as follows:
| Con Edison | CECONY | |||||||||||||||
| (Millions of Dollars) | 2011 | 2010 | 2011 | 2010 | ||||||||||||
|
Accrued liability – asbestos suits |
$ | 10 | $ | 10 | $ | 10 | $ | 10 | ||||||||
|
Regulatory assets – asbestos suits |
$ | 10 | $ | 10 | $ | 10 | $ | 10 | ||||||||
|
Accrued liability – workers’ compensation |
$ | 108 | $ | 106 | $ | 103 | $ | 101 | ||||||||
|
Regulatory assets – workers’ compensation |
$ | 33 | $ | 31 | $ | 33 | $ | 31 | ||||||||
Note G – Other Material Contingencies
Manhattan Steam Main Rupture
In July 2007, a CECONY steam main located in midtown Manhattan ruptured. It has been reported that one person died and others were injured as a result of the incident. Several buildings in the area were damaged. Debris from the incident included dirt and mud containing asbestos. The response to the incident required the closing of several buildings and streets for various periods. Approximately 100 suits are pending against the company seeking generally unspecified compensatory and, in some cases, punitive damages, for personal injury, property damage and business interruption. The company has not accrued a liability for the suits. The company has notified its insurers of the incident and believes that the policies in force at the time of the incident will cover most of the company’s costs, which the company is unable to estimate, but which could be substantial, to satisfy its liability to others in connection with the incident.
Investigations of Vendor Payments
In January 2009, CECONY commenced an internal investigation relating to the arrests of certain employees and retired employees (all of whom have since pleaded guilty) for accepting kickbacks from contractors that performed construction work for the company. The company has retained a law firm, which has retained an accounting firm, to assist in the company’s investigation. The company is providing information
to governmental authorities, which consider the company to be a victim of unlawful conduct, in connection with their investigation of the arrested
| 22 |
Table of Contents
employees and contractors. The company has terminated its employment of the arrested employees and its contracts with the contractors. In February 2009, the NYSPSC commenced a proceeding that, among other things, will examine the prudence of certain of the company's expenditures relating to the arrests and consider whether additional expenditures should also be examined (see “Other Regulatory Matters” in Note B).
CECONY is also investigating the September 2010 arrest of a retired employee (who has since pleaded guilty to participating in a bribery scheme in which the employee received payments from two companies that supplied materials to the company) and the January 2011 arrest of an employee (for accepting kickbacks from an engineering firm that performed work for the company). CECONY has provided information to governmental authorities in connection with their ongoing investigations of these matters.
The company, based upon its evaluation of its internal controls for 2010 and previous years, believes that the controls were effective to provide reasonable assurance that its financial statements have been fairly presented, in all material respects, in conformity with generally accepted accounting principles. Because the company’s investigations are ongoing, the company is unable to predict the impact of any of the employees’ unlawful conduct on the company’s internal controls, business, results of operations or financial position.
Lease In/Lease Out Transactions
In each of 1997 and 1999, Con Edison Development entered into a transaction in which it leased property and then immediately subleased it back to the lessor (termed “Lease In/Lease Out,” or LILO transactions). The transactions respectively involve electric generating and gas distribution facilities in the Netherlands, with a total investment of $259 million. The transactions were financed with $93 million of equity and $166 million of non-recourse, long-term debt secured by the underlying assets. In accordance with the accounting rules for leases, Con Edison is accounting for the two LILO transactions as leveraged leases. Accordingly, the company’s investment in these leases, net of non-recourse debt, is carried as a single amount in Con Edison’s consolidated balance sheet and income is recognized pursuant to a method that incorporates a level rate of return for those years when net investment in the lease is positive, based upon the after-tax cash flows projected at the inception of the leveraged leases. The company's investment in these leveraged leases was $(45) million at March 31, 2011 and $(41) million at December 31, 2010 and is comprised of a $234 million gross investment less $279 million deferred tax liabilities at March 31, 2011 and $235 million gross investment less $276 million of deferred tax liabilities at December 31, 2010.
On audit of Con Edison’s tax return for 1997, the IRS disallowed the tax losses in connection with the 1997 LILO transaction. In December 2005, Con Edison paid a $0.3 million income tax deficiency asserted by the IRS for the tax year 1997 with respect to the 1997 LILO transaction. In April 2006, the company paid interest of $0.2 million associated with the deficiency and commenced an action in the United States Court of Federal Claims, entitled Consolidated Edison Company of New York, Inc. v. United States, to obtain a refund of this tax payment and interest. A trial was completed in November 2007. In October 2009, the court issued a decision in favor of the company concluding that the 1997 LILO transaction was, in substance, a true lease that possessed economic substance, the loans relating to the lease constituted bona fide indebtedness, and the deductions for the 1997 LILO transactions claimed by the company in its 1997 federal income tax return are allowable. The IRS is entitled to appeal the decision.
In connection with its audit of Con Edison’s federal income tax returns for 1998 through 2007, the IRS disallowed $416 million of net tax deductions taken with respect to both of the LILO transactions for the tax years. Con Edison is pursuing administrative appeals of these audit level disallowances. In connection with its audit of Con Edison’s federal income tax returns for 2009 and 2008, the IRS has disallowed $41 million and $42 million, respectively, of net tax deductions taken with respect to both of the LILO transactions. When
| 23 |
Table of Contents
these audit level disallowances become appealable, Con Edison intends to file an appeal of the disallowances.
Con Edison believes that its LILO transactions have been correctly reported, and has not recorded any reserve with respect to the disallowance of tax losses, or related interest, in connection with its LILO transactions. Con Edison’s estimated tax savings, reflected in its financial statements, from the two LILO transactions through March 31, 2011, in the aggregate, was $225 million. If Con Edison were required to repay all or a portion of these amounts, it would also be required to pay interest of up to $79 million net of tax at March 31, 2011.
Pursuant to the accounting rules for leveraged lease transactions, the expected timing of income tax cash flows generated by Con Edison’s LILO transactions are required to be reviewed at least annually. If the expected timing of the cash flows is revised, the rate of return and the allocation of income would be recalculated from the inception of the LILO transactions, and the company would be required to recalculate the accounting effect of the LILO transactions, which would result in a charge to earnings that could have a material adverse effect on the company’s results of operations.
Guarantees
Con Edison and its subsidiaries enter into various agreements providing financial or performance assurance primarily to third parties on behalf of their subsidiaries. Maximum amounts guaranteed by Con Edison totaled $897 million and $859 million at March 31, 2011 and December 31, 2010, respectively.
A summary, by type (described in Note H to the financial statements in Item 8 of the Form 10-K) and term, of Con Edison’s total guarantees at March 31, 2011 is as follows:
| Guarantee Type | 0 –3 years | 4 –10 years | > 10 years | Total | ||||||||||||
| (Millions of Dollars) | ||||||||||||||||
|
Commodity transactions |
$ | 645 | $ | 29 | $ | 131 | $ | 805 | ||||||||
|
Affordable housing program |
$ | 1 | — | — | $ | 1 | ||||||||||
|
Intra-company guarantees |
$ | 30 | — | $ | 1 | $ | 31 | |||||||||
|
Other guarantees |
$ | 47 | $ | 13 | — | $ | 60 | |||||||||
|
TOTAL |
$ | 723 | $ | 42 | $ | 132 | $ | 897 | ||||||||
Note H — Financial Information by Business Segment
Reference is made to Note N to the financial statements in Item 8 of the Form 10-K.
The financial data for the business segments are as follows:
| For the Three Months Ended March 31, | ||||||||||||||||||||||||||||||||
|
Operating revenues |
Inter-segment
revenues |
Depreciation and
amortization |
Operating income |
|||||||||||||||||||||||||||||
| (Millions of Dollars) | 2011 | 2010 | 2011 | 2010 | 2011 | 2010 | 2011 | 2010 | ||||||||||||||||||||||||
|
CECONY |
||||||||||||||||||||||||||||||||
|
Electric |
$ | 1,721 | $ | 1,728 | $ | 3 | $ | 3 | $ | 161 | $ | 151 | $ | 217 | $ | 195 | ||||||||||||||||
|
Gas |
663 | 683 | 1 | 1 | 27 | 25 | 204 | 215 | ||||||||||||||||||||||||
|
Steam |
325 | 307 | 20 | 18 | 16 | 15 | 125 | 102 | ||||||||||||||||||||||||
|
Consolidation adjustments |
— | — | (24 | ) | (22 | ) | — | — | — | — | ||||||||||||||||||||||
|
Total CECONY |
$ | 2,709 | $ | 2,718 | $ | — | $ | — | $ | 204 | $ | 191 | $ | 546 | $ | 512 | ||||||||||||||||
|
O&R |
||||||||||||||||||||||||||||||||
|
Electric |
$ | 149 | $ | 161 | $ | — | $ | — | $ | 9 | $ | 8 | $ | 10 | $ | 5 | ||||||||||||||||
|
Gas |
92 | 90 | — | — | 3 | 3 | 28 | 23 | ||||||||||||||||||||||||
|
Total O&R |
$ | 241 | $ | 251 | $ | — | $ | — | $ | 12 | $ | 11 | $ | 38 | $ | 28 | ||||||||||||||||
|
Competitive energy businesses |
$ | 408 | $ | 500 | $ | 3 | $ | 2 | $ | 2 | $ | 2 | $ | 44 | $ | (48 | ) | |||||||||||||||
|
Other* |
(9 | ) | (7 | ) | (3 | ) | (2 | ) | — | — | (2 | ) | — | |||||||||||||||||||
|
Total Con Edison |
$ | 3,349 | $ | 3,462 | $ | — | $ | — | $ | 218 | $ | 204 | $ | 626 | $ | 492 | ||||||||||||||||
| * | Parent company expenses, primarily interest, and consolidation adjustments. Other does not represent a business segment. |
| 24 |
Table of Contents
Note I — Derivative Instruments and Hedging Activities
Under the accounting rules for derivatives and hedging, derivatives are recognized on the balance sheet at fair value, unless an exception is available under the accounting rules. Certain qualifying derivative contracts have been designated as normal purchases or normal sales contracts. These contracts are not reported at fair value under the accounting rules.
Energy Price Hedging
Con Edison’s subsidiaries hedge market price fluctuations associated with physical purchases and sales of electricity, natural gas, and steam by using derivative instruments including futures, forwards, basis swaps, options, transmission congestion contracts and financial transmission rights contracts. The fair values of these hedges at March 31, 2011 and December 31, 2010 were as follows:
| Con Edison | CECONY | |||||||||||||||
| (Millions of Dollars) | 2011 | 2010 | 2011 | 2010 | ||||||||||||
|
Fair value of net derivative assets/(liabilities) - gross |
$ | (150 | ) | $ | (261 | ) | $ | (94 | ) | $ | (156 | ) | ||||
|
Impact of netting of cash collateral |
137 | 176 | 85 | 104 | ||||||||||||
|
Fair value of net derivative assets/(liabilities) - net |
$ | (13 | ) | $ | (85 | ) | $ | (9 | ) | $ | (52 | ) | ||||
Credit Exposure
The Companies are exposed to credit risk related to transactions entered into primarily for the various energy supply and hedging activities by the Utilities and the competitive energy businesses. The Companies use credit policies to manage this risk, including an established credit approval process, monitoring of counterparty limits, netting provisions within agreements, collateral or prepayment arrangements, credit insurance and credit default swaps.
At March 31, 2011, Con Edison and CECONY had
$178 million and $44 million of credit exposure in connection with energy supply and hedging activities, net of collateral, respectively. Con Edison’s net credit exposure consisted of $66 million with investment-grade counterparties, $65 million with commodity exchange brokers, $45 million with independent system operators and $2 million with non-investment grade counterparties. CECONY’s net credit exposure consisted of $2 million with investment-grade counterparties and $42 million with commodity exchange brokers.
Economic Hedges
The Companies enter into certain derivative instruments that do not qualify or are not designated as hedges under the accounting rules for derivatives and hedging. However, management believes these instruments represent economic hedges that mitigate exposure to fluctuations in commodity prices.
| 25 |
Table of Contents
The fair values of the Companies’ commodity derivatives at March 31, 2011 were:
| (Millions of Dollars) |
Fair Value of Commodity Derivatives(a)
Balance Sheet Location |
Con
Edison |
CECONY | |||||||
| Derivative Assets | ||||||||||
|
Current |
Other current assets | $ | 173 | $ | 46 | |||||
|
Long-term |
Other deferred charges and non-current assets | 49 | 21 | |||||||
|
Total derivative assets |
$ | 222 | $ | 67 | ||||||
|
Impact of netting |
(75 | ) | (2 | ) | ||||||
|
Net derivative assets |
$ | 147 | $ | 65 | ||||||
| Derivative Liabilities | ||||||||||
|
Current |
Fair value of derivative liabilities | $ | 287 | $ | — | |||||
|
Current |
Other current liabilities | — | 115 | |||||||
|
Long-term |
Fair value of derivative liabilities | 85 | 46 | |||||||
|
Total derivative liabilities |
$ | 372 | $ | 161 | ||||||
|
Impact of netting |
(212 | ) | (87 | ) | ||||||
|
Net derivative liabilities |
$ | 160 | $ | 74 | ||||||
| (a) | Qualifying derivative contracts, which have been designated as normal purchases or normal sales contracts, are not reported at fair value under the accounting rules for derivatives and hedging and, therefore, are excluded from the table. |
The fair values of the Companies’ commodity derivatives at December 31, 2010 were:
| (Millions of Dollars) |
Fair Value of Commodity Derivatives(a)
Balance Sheet Location |
Con
Edison |
CECONY | |||||||
| Derivative Assets | ||||||||||
|
Current |
Other current assets | $ | 184 | $ | 29 | |||||
|
Long-term |
Other deferred charges and non-current assets | 51 | 19 | |||||||
|
Total derivative assets |
$ | 235 | $ | 48 | ||||||
|
Impact of netting |
(129 | ) | — | |||||||
|
Net derivative assets |
$ | 106 | $ | 48 | ||||||
| Derivative Liabilities | ||||||||||
|
Current |
Fair value of derivative liabilities | $ | 385 | $ | — | |||||
|
Current |
Other current liabilities | — | 148 | |||||||
|
Long-term |
Fair value of derivative liabilities | 111 | 56 | |||||||
|
Total derivative liabilities |
$ | 496 | $ | 204 | ||||||
|
Impact of netting |
(305 | ) | (104 | ) | ||||||
|
Net derivative liabilities |
$ | 191 | $ | 100 | ||||||
| (a) | Qualifying derivative contracts, which have been designated as normal purchases or normal sales contracts, are not reported at fair value under the accounting rules for derivatives and hedging and, therefore, are excluded from the table. |
The Utilities generally recover all of their prudently incurred fuel, purchased power and gas cost, including hedging gains and losses, in accordance with rate provisions approved by the applicable state utility commissions. See “Recoverable Energy Costs” in Note A to the financial statements in Item 8 of the Form 10-K. In accordance with the accounting rules for regulated operations, the Utilities record a regulatory asset or liability to defer recognition of unrealized gains and losses on their electric and gas derivatives. As gains and losses are realized in future periods, they will be recognized as purchased power, gas and fuel costs in the Companies’ consolidated income statements. Con Edison’s competitive energy businesses record realized and unrealized gains and losses on their derivative contracts in earnings in the reporting period in which they occur.
| 26 |
Table of Contents
The following table presents the changes in the fair values of commodity derivatives that have been deferred or recognized in earnings for the three months ended March 31, 2011:
|
Realized and Unrealized Gains/(Losses) on Commodity Derivatives(a) Deferred or Recognized in Income for the three months ended March 31, 2011 |
||||||||||
| (Millions of Dollars) | Balance Sheet Location |
Con
Edison |
CECONY | |||||||
|
Pre-tax gains/(losses) deferred in accordance with accounting rules for regulated operations: |
|
|||||||||
|
Current |
Deferred derivative gains | $ | 6 | $ | 5 | |||||
|
Long-term |
Regulatory liabilities | 3 | 3 | |||||||
|
Total deferred gains |
$ | 9 | $ | 8 | ||||||
|
Current |
Deferred derivative losses | $ | 17 | $ | 11 | |||||
|
Current |
Recoverable energy costs | (49 | ) | (42 | ) | |||||
|
Long-term |
Regulatory assets | 44 | 35 | |||||||
|
Total deferred losses |
$ | 12 | $ | 4 | ||||||
|
Net deferred losses |
$ | 21 | $ | 12 | ||||||
| Income Statement Location | ||||||||||
|
Pre-tax gain/(loss) recognized in income |
|
|||||||||
| Purchased power expense | $ | (21 | )(b) | $ | — | |||||
| Gas purchased for resale | (6 | ) | — | |||||||
| Non-utility revenue | 10 | (b) | — | |||||||
|
Total pre-tax gain/(loss) recognized in income |
$ | (17 | ) | $ | — | |||||
| (a) | Qualifying derivative contracts, which have been designated as normal purchases or normal sales contracts, are not reported at fair value under the accounting rules for derivatives and hedging and, therefore, are excluded from the table. |
| (b) | For the three months ended March 31, 2011 Con Edison recorded in non-utility operating revenues and purchased power expense an unrealized pre-tax (loss)/gain of $(13) million and $50 million, respectively. |
The following table presents the changes in the fair values of commodity derivatives that have been deferred or recognized in earnings for the three months ended March 31, 2010:
|
Realized and Unrealized Gains/(Losses) on Commodity Derivatives(a) Deferred or Recognized in Income for the Three Months Ended March 31, 2010 |
||||||||||
| (Millions of Dollars) | Balance Sheet Location |
Con
Edison |
CECONY | |||||||
|
Pre-tax gains/(losses) deferred in accordance with accounting rules for regulated operations: |
|
|||||||||
|
Current |
Deferred derivative gains | $ | (6 | ) | $ | (6 | ) | |||
|
Total deferred gains |
$ | (6 | ) | $ | (6 | ) | ||||
|
Current |
Deferred derivative losses | $ | (161 | ) | $ | (138 | ) | |||
|
Current |
Recoverable energy costs | $ | (55 | ) | $ | (42 | ) | |||
|
Long-term |
Regulatory assets | $ | (74 | ) | $ | (56 | ) | |||
|
Total deferred losses |
$ | (290 | ) | $ | (236 | ) | ||||
|
Net deferred losses |
$ | (296 | ) | $ | (242 | ) | ||||
| Income Statement Location | ||||||||||
|
Pre-tax gain/(loss) recognized in income |
|
|||||||||
| Purchased power expense | $ | (70 | )(b) | $ | — | |||||
| Gas purchased for resale | 5 | — | ||||||||
| Non-utility revenue | 14 | (b) | — | |||||||
|
Total pre-tax gain/(loss) recognized in income |
$ | (51 | ) | $ | — | |||||
| (a) | Qualifying derivative contracts, which have been designated as normal purchases or normal sales contracts, are not reported at fair value under the accounting rules for derivatives and hedging and, therefore, are excluded from the table. |
| (b) | For the three months ended March 31, 2010, Con Edison recorded in non-utility operating revenues and purchased power expense an unrealized pre-tax gain/(loss) of $46 million and $(110) million, respectively. |
| 27 |
Table of Contents
As of March 31, 2011, Con Edison had 1,664 contracts, including 686 CECONY contracts, which were considered to be derivatives under the accounting rules for derivatives and hedging (excluding qualifying derivative contracts, which have been designated as normal purchases or normal sales contracts). The following table presents the number of contracts by commodity type:
| Electric Derivatives | Gas Derivatives | |||||||||||||||||||||||||||
|
Number
of
Energy Contracts (a) |
MWhs (b) |
Number
of
Capacity Contracts (a) |
MWs (b) |
Number
of
Contracts (a) |
Dths (b) |
Total
Contracts (a) |
||||||||||||||||||||||
|
Con Edison |
915 | 20,692,742 | 63 | 10,164 | 686 | 118,524,450 | 1,664 | |||||||||||||||||||||
|
CECONY |
183 | 5,332,425 | — | — | 503 | 109,330,000 | 686 | |||||||||||||||||||||
| (a) | Qualifying derivative contracts, which have been designated as normal purchases or normal sales contracts, are not reported at fair value under the accounting rules for derivatives and hedging and, therefore, are excluded from the table. |
| (b) | Volumes are reported net of long and short positions. |
The Companies also enter into electric congestion and gas basis swap contracts to hedge the congestion and transportation charges which are associated with electric and gas contracts and hedged volumes.
The collateral requirements associated with, and settlement of, derivative transactions are included in net cash flows from operating activities in the Companies’ consolidated statement of cash flows. Most derivative instrument contracts contain provisions that may require the Companies to provide collateral on derivative instruments in net liability positions. The amount of collateral to be provided will depend on the fair value of the derivative instruments and the Companies’ credit ratings.
The aggregate fair value of all derivative instruments with credit-risk-related contingent features that are in a net liability position and collateral posted at March 31, 2011, and the additional collateral that would have been required to be posted had the lowest applicable credit rating been reduced one level and to below investment grade were:
| (Millions of Dollars) | Con Edison (a) | CECONY (a) | ||||||
|
Aggregate fair value – net liabilities |
$ | 172 | $ | 92 | ||||
|
Collateral posted |
$ | 68 | $ | 51 | (b) | |||
|
Additional collateral (c) (downgrade one level from current ratings(d)) |
$ | 11 | $ | 6 | ||||
|
Additional collateral (c) (downgrade to below investment grade from current ratings(d)) |
$ | 140 | (e) | $ | 52 | (e) | ||
| (a) | Non-derivative transactions for the purchase and sale of electricity and gas and qualifying derivative instruments, which have been designated as normal purchases or normal sales, are excluded from the table. These transactions primarily include purchases of electricity from independent system operators. In the event the Utilities and Con Edison’s competitive energy businesses were no longer extended unsecured credit for such purchases, the Companies would be required to post collateral, which at March 31, 2011, would have amounted to an estimated $127 million for Con Edison, including $33 million for CECONY. For certain other such non-derivative transactions, the Companies could be required to post collateral under certain circumstances, including in the event counterparties had reasonable grounds for insecurity. |
| (b) | Across the Utilities’ energy derivative positions, credit limits for the same counterparties are generally integrated. At March 31, 2011, the Utilities posted combined collateral of $68 million, including an estimated $17 million attributable to O&R. |
| (c) | The Companies measure the collateral requirements by taking into consideration the fair value amounts of derivative instruments that contain credit-risk-related contingent features that are in a net liabilities position plus amounts owed to counterparties for settled transactions and amounts required by counterparties for minimum financial security. The fair value amounts represent unrealized losses, net of any unrealized gains where the Companies have a legally enforceable right of setoff. |
| (d) | The current ratings are Moody’s, S&P and Fitch long-term credit rating of, as applicable, Con Edison (Baa1/BBB+/BBB+), CECONY (A3/A-/A-) or O&R (Baa1/A-/A-). Credit ratings assigned by rating agencies are expressions of opinions that are subject to revision or withdrawal at any time by the assigning rating agency. |
| (e) | Derivative instruments that are net assets have been excluded from the table. At March 31, 2011, if Con Edison had been downgraded to below investment grade, it would have been required to post additional collateral for such derivative instruments of not more than $24 million. |
| 28 |
Table of Contents
Interest Rate Swap
O&R has an interest rate swap pursuant to which it pays a fixed-rate of 6.09 percent and receives a LIBOR-based variable rate. The fair value of this interest rate swap at March 31, 2011 was an unrealized loss of $10 million, which has been included in Con Edison’s consolidated balance sheet as a noncurrent liability/fair value of derivative liabilities and a regulatory asset. The change in the fair value of the swap for the three months ended March 31, 2011 was not material. In the event O&R’s credit rating was downgraded to BBB- or lower by S&P or Baa3 or lower by Moody’s, the swap counterparty could elect to terminate the agreement and, if it did so, the parties would then be required to settle the transaction.
Note J — Fair Value Measurements
Reference is made to Note P to the financial statements in Item 8 of the Form 10-K.
Assets and liabilities measured at fair value on a recurring basis as of March 31, 2011 are summarized below.
| Level 1 | Level 2 | Level 3 |
Netting Adjustments (4) |
Total | ||||||||||||||||||||||||||||||||||||
| (Millions of Dollars) |
Con
Edison |
CECONY |
Con
Edison |
CECONY |
Con
Edison |
CECONY |
Con
Edison |
CECONY |
Con
Edison |
CECONY | ||||||||||||||||||||||||||||||
|
Derivative assets: |
||||||||||||||||||||||||||||||||||||||||
|
Commodity (1) |
$ | 2 | $ | 1 | $ | 71 | $ | 27 | $ | 140 | $ | 23 | $ | (67 | ) | $ | 14 | $ | 146 | $ | 65 | |||||||||||||||||||
|
Other assets (3) |
68 | 68 | — | — | 105 | 95 | — | — | 173 | 163 | ||||||||||||||||||||||||||||||
|
Total |
$ | 70 | $ | 69 | $ | 71 | $ | 27 | $ | 245 | $ | 118 | $ | (67 | ) | $ | 14 | $ | 319 | $ | 228 | |||||||||||||||||||
|
Derivative liabilities: |
||||||||||||||||||||||||||||||||||||||||
|
Commodity |
$ | 3 | $ | 1 | $ | 184 | $ | 118 | $ | 176 | $ | 26 | $ | (204 | ) | $ | (71 | ) | $ | 159 | $ | 74 | ||||||||||||||||||
|
Transfer in (5) (6) |
— | — | 5 | 5 | — | — | — | — | 5 | 5 | ||||||||||||||||||||||||||||||
|
Transfer out (5) (6) |
— | — | — | — | (5 | ) | (5 | ) | — | — | (5 | ) | (5 | ) | ||||||||||||||||||||||||||
|
Commodity (1) |
$ | 3 | $ | 1 | $ | 189 | $ | 123 | $ | 171 | $ | 21 | $ | (204 | ) | $ | (71 | ) | $ | 159 | $ | 74 | ||||||||||||||||||
|
Interest rate contract (2) |
— | — | — | — | 10 | — | — | — | 10 | — | ||||||||||||||||||||||||||||||
|
Total |
$ | 3 | $ | 1 | $ | 189 | $ | 123 | $ | 181 | $ | 21 | $ | (204 | ) | $ | (71 | ) | $ | 169 | $ | 74 | ||||||||||||||||||
| (1) | A significant portion of the commodity derivative contracts categorized in Level 3 is valued using either an industry acceptable model or an internally developed model with observable inputs. The models also include some less readily observable inputs resulting in the classification of the entire contract as Level 3. See Note I. |
| (2) | See Note I. |
| (3) | Other assets are comprised of assets such as life insurance contracts within the Deferred Income Plan and Supplemental Retirement Income Plans, held in rabbi trusts. |
| (4) | Amounts represent the impact of legally-enforceable master netting agreements that allow the Companies to net gain and loss positions and cash collateral held or placed with the same counterparties. |
| (5) | The Companies’ policy is to recognize transfers into and transfers out of the levels at the end of the reporting period. |
| (6) | Transferred from Level 3 to Level 2 because of availability of observable market data due to decrease in the terms of certain contracts from beyond one year as of December 31, 2010 to less than one year as of March 31, 2011. |
| 29 |
Table of Contents
Assets and liabilities measured at fair value on a recurring basis as of December 31, 2010 are summarized below.
| Level 1 | Level 2 | Level 3 |
Netting Adjustments (4) |
Total | ||||||||||||||||||||||||||||||||||||
| (Millions of Dollars) |
Con
Edison |
CECONY |
Con
Edison |
CECONY |
Con
Edison |
CECONY |
Con
Edison |
CECONY |
Con
Edison |
CECONY | ||||||||||||||||||||||||||||||
|
Derivative assets: |
||||||||||||||||||||||||||||||||||||||||
|
Commodity (1) |
$ | 2 | $ | 1 | $ | 72 | $ | 21 | $ | 144 | $ | 13 | $ | (112 | ) | $ | 13 | $ | 106 | $ | 48 | |||||||||||||||||||
|
Other assets (3) |
65 | 64 | — | — | 101 | 92 | — | — | 166 | 156 | ||||||||||||||||||||||||||||||
|
Total |
$ | 67 | $ | 65 | $ | 72 | $ | 21 | $ | 245 | $ | 105 | $ | (112 | ) | $ | 13 | $ | 272 | $ | 204 | |||||||||||||||||||
|
Derivative liabilities: |
||||||||||||||||||||||||||||||||||||||||
|
Commodity |
$ | 4 | $ | 2 | $ | 270 | $ | 177 | $ | 205 | $ | 12 | $ | (288 | ) | $ | (91 | ) | $ | 191 | $ | 100 | ||||||||||||||||||
|
Transfer in (5) (6) (7) |
— | — | (36 | ) | (36 | ) | (9 | ) | (9 | ) | — | — | (45 | ) | (45 | ) | ||||||||||||||||||||||||
|
Transfer out (5) (6) (7) |
— | — | 9 | 9 | 36 | 36 | — | — | 45 | 45 | ||||||||||||||||||||||||||||||
|
Commodity (1) |
$ | 4 | $ | 2 | $ | 243 | $ | 150 | $ | 232 | $ | 39 | $ | (288 | ) | $ | (91 | ) | $ | 191 | $ | 100 | ||||||||||||||||||
|
Interest rate contract (2) |
— | — | — | — | 10 | — | — | — | 10 | — | ||||||||||||||||||||||||||||||
|
Total |
$ | 4 | $ | 2 | $ | 243 | $ | 150 | $ | 242 | $ | 39 | $ | (288 | ) | $ | (91 | ) | $ | 201 | $ | 100 | ||||||||||||||||||
| (1) | A significant portion of the commodity derivative contracts categorized in Level 3 is valued using either an industry acceptable model or an internally developed model with observable inputs. The models also include some less readily observable inputs resulting in the classification of the entire contract as Level 3. See Note O to the financial statements in Item 8 of the Form 10-K. |
| (2) | See Note O to the financial statements in Item 8 of the Form 10-K. |
| (3) | Other assets are comprised of assets such as life insurance contracts within the Deferred Income Plan and Supplemental Retirement Income Plans, held in rabbi trusts. |
| (4) | Amounts represent the impact of legally-enforceable master netting agreements that allow the Companies to net gain and loss positions and cash collateral held or placed with the same counterparties. |
| (5) | The Companies’ policy is to recognize transfers into and transfers out of the levels at the end of the reporting period. |
| (6) | Transferred from Level 2 to Level 3 because of reassessment of the levels in the fair value hierarchy within which certain inputs fall. |
| (7) | Transferred from Level 3 to Level 2 because of availability of observable market data due to decrease in the terms of certain contracts from beyond one year as of December 31, 2009 to less than one year as of December 31, 2010. |
The table listed below provides a reconciliation of the beginning and ending net balances for assets and liabilities measured at fair value as of March 31, 2011 and 2010 and classified as Level 3 in the fair value hierarchy below.
| For the Three Months Ended March 31, 2011 | ||||||||||||||||||||||||||||||||||||
|
Total Gains/(Losses) – Realized and Unrealized |
||||||||||||||||||||||||||||||||||||
| (Millions of Dollars) |
Beginning
Balance as of January 1, 2011 |
Included in
Earnings |
Included in
Regulatory Assets and Liabilities |
Purchases | Issuances | Sales | Settlements |
Transfer
In/Out of Level 3 |
Ending Balance
as of March 31, 2011 |
|||||||||||||||||||||||||||
|
Con Edison |
||||||||||||||||||||||||||||||||||||
|
Derivatives: |
||||||||||||||||||||||||||||||||||||
|
Commodity |
$ | (88 | ) | $ | 33 | $ | 40 | $ | 10 | $ | — | $ | — | $ | (21 | ) | $ | (5 | ) | $ | (31 | ) | ||||||||||||||
|
Interest rate contract |
(10 | ) | (1 | ) | — | — | — | — | 1 | — | (10 | ) | ||||||||||||||||||||||||
|
Other assets (1) |
101 | 2 | 2 | — | — | — | — | — | 105 | |||||||||||||||||||||||||||
|
Total |
$ | 3 | $ | 34 | $ | 42 | $ | 10 | $ | — | $ | — | $ | (20 | ) | $ | (5 | ) | $ | 64 | ||||||||||||||||
|
CECONY |
||||||||||||||||||||||||||||||||||||
|
Derivatives: |
||||||||||||||||||||||||||||||||||||
|
Commodity |
$ | (26 | ) | $ | (1 | ) | $ | 27 | $ | 10 | $ | — | $ | — | $ | (3 | ) | $ | (5 | ) | $ | 2 | ||||||||||||||
|
Other assets(1) |
92 | 2 | 1 | — | — | — | — | — | 95 | |||||||||||||||||||||||||||
|
Total |
$ | 66 | $ | 1 | $ | 28 | $ | 10 | $ | — | $ | — | $ | (3 | ) | $ | (5 | ) | $ | 97 | ||||||||||||||||
| (1) | Amounts included in earnings are reported in investment and other income on the consolidated income statement. |
| 30 |
Table of Contents
| For the Three Months Ended March 31, 2010 | ||||||||||||||||||||||||||||||||||||
|
Total Gains/(Losses) – Realized and Unrealized |
||||||||||||||||||||||||||||||||||||
| (Millions of Dollars) |
Beginning
Balance as of January 1, 2010 |
Included in
Earnings |
Included in
Regulatory Assets and Liabilities |
Purchases | Issuances | Sales | Settlements |
Transfer
In/Out of Level 3 |
Ending Balance
as of March 31, 2010 |
|||||||||||||||||||||||||||
|
Con Edison |
||||||||||||||||||||||||||||||||||||
|
Derivatives: |
||||||||||||||||||||||||||||||||||||
|
Commodity |
$ | (59 | ) | $ | (44 | ) | $ | (72 | ) | $ | — | $ | — | $ | — | $ | 7 | $ | — | $ | (168 | ) | ||||||||||||||
|
Interest rate contract |
(11 | ) | (1 | ) | — | — | — | — | 1 | — | (11 | ) | ||||||||||||||||||||||||
|
Other assets (1) |
92 | — | 1 | — | — | — | — | — | 93 | |||||||||||||||||||||||||||
|
Total |
$ | 22 | $ | (45 | ) | $ | (71 | ) | $ | — | $ | — | $ | — | $ | 8 | $ | — | $ | (86 | ) | |||||||||||||||
|
CECONY |
||||||||||||||||||||||||||||||||||||
|
Derivatives: |
||||||||||||||||||||||||||||||||||||
|
Commodity |
$ | (5 | ) | $ | (5 | ) | $ | (33 | ) | $ | — | $ | — | $ | — | $ | (5 | ) | $ | — | $ | (48 | ) | |||||||||||||
|
Other assets(1) |
83 | — | 1 | — | — | — | — | — | 84 | |||||||||||||||||||||||||||
|
Total |
$ | 78 | $ | (5 | ) | $ | (32 | ) | $ | — | $ | — | $ | — | $ | (5 | ) | $ | — | $ | 36 | |||||||||||||||
| (1) | Amounts included in earnings are reported in investment and other income on the consolidated income statement. |
For the Utilities, realized gains and losses on Level 3 commodity derivative assets and liabilities are reported as part of purchased power, gas and fuel costs. The Utilities generally recover these costs in accordance with rate provisions approved by the applicable state public utilities commissions. See Note A to the financial statements in Item 8 of the Form 10-K. Unrealized gains and losses for commodity derivatives are generally deferred on the consolidated balance sheet in accordance with the accounting rules for regulated operations.
For the competitive energy businesses, realized and unrealized gains and losses on Level 3 commodity derivative assets and liabilities are reported in non-utility revenues ($2 million loss and $60 million gain) and purchased power costs ($41 million gain and $89 million loss) on the consolidated income statement for the three months ended March 31, 2011 and 2010, respectively. The change in fair value relating to Level 3 commodity derivative assets held at March 31, 2011 and 2010 is included in non-utility revenues ($12 million loss and $46 million gain), and purchased power costs ($29 million gain and $71 million loss) on the consolidated income statement for the three months ended March 31, 2011 and 2010, respectively.
The accounting rules for fair value measurements and disclosures require consideration of the impact of nonperformance risk (including credit risk) from a market participant perspective in the measurement of the fair value of assets and liabilities. At March 31, 2011, the Companies determined that nonperformance risk would have no material impact on their financial position or results of operations. To assess nonperformance risk, the Companies considered information such as collateral requirements, master netting arrangements, letters of credit and parent company guarantees, and applied a market-based method by using the counterparty’s (for an asset) or the Companies’ (for a liability) credit default swaps rates.
| 31 |
Table of Contents
This combined management’s discussion and analysis of financial condition and results of operations (MD&A) relates to the consolidated financial statements (the First Quarter Financial Statements) included in this report of two separate registrants: Consolidated Edison, Inc. (Con Edison) and Consolidated Edison Company of New York, Inc. (CECONY) and should be read in conjunction with the financial statements and the notes thereto. As used in this report, the term the “Companies” refers to Con Edison and CECONY. CECONY is a subsidiary of Con Edison and, as such, information in this MD&A about CECONY applies to Con Edison.
This MD&A should be read in conjunction with the First Quarter Financial Statements and the notes thereto and the MD&A in Item 7 of the Companies’ combined Annual Report on Form 10-K for the year ended December 31, 2010 (File Nos. 1-14514 and 1-1217, the Form 10-K).
Information in any item of this report referred to in this discussion and analysis is incorporated by reference herein. The use of terms such as “see” or “refer to” shall be deemed to incorporate by reference into this discussion and analysis the information to which reference is made.
Con Edison, incorporated in New York State in 1997, is a holding company which owns all of the outstanding common stock of CECONY, Orange and Rockland Utilities, Inc. (O&R) and the competitive energy businesses. As used in this report, the term the “Utilities” refers to CECONY and O&R.
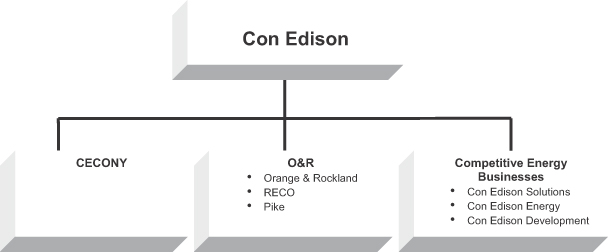
CECONY’s principal business operations are its regulated electric, gas and steam delivery businesses. O&R’s principal business operations are its regulated electric and gas delivery businesses. The competitive energy businesses sell electricity to wholesale and retail customers, provide certain energy-related services, and participate in energy infrastructure projects. Con Edison is evaluating additional opportunities to invest in electric and gas-related businesses.
Con Edison’s strategy is to provide reliable energy services, maintain public and employee safety, promote energy efficiency, and develop cost-effective ways of performing its business. Con Edison seeks to be a responsible steward of the environment and enhance its relationships with customers, regulators and members of the communities it serves.
| 32 |
Table of Contents
CECONY
Electric
CECONY provides electric service to approximately 3.3 million customers in all of New York City (except part of Queens) and most of Westchester County, an approximately 660 square mile service area with a population of more than nine million.
Gas
CECONY delivers gas to approximately 1.1 million customers in Manhattan, the Bronx and parts of Queens and Westchester County.
Steam
CECONY operates the largest steam distribution system in the United States by producing and delivering more than 23,000 MMlbs of steam annually to approximately 1,760 customers in parts of Manhattan.
O&R
Electric
O&R and its utility subsidiaries, Rockland Electric Company (RECO) and Pike County Power & Light Company (Pike) (together referred to herein as O&R) provide electric service to approximately 0.3 million customers in southeastern New York and in adjacent areas of northern New Jersey and northeastern Pennsylvania, an approximately 1,350 square mile service area.
Gas
O&R delivers gas to over 0.1 million customers in southeastern New York and adjacent areas of northeastern Pennsylvania.
Competitive Energy Businesses
Con Edison pursues competitive energy opportunities through three wholly-owned subsidiaries: Con Edison Solutions, Con Edison Energy and Con Edison Development. These businesses include the sales and related hedging of electricity to wholesale and retail customers, sales of certain energy-related products and services, and participation in energy infrastructure projects. At March 31, 2011, Con Edison’s equity investment in its competitive energy businesses was $361 million and their assets amounted to $841 million.
Certain financial data of Con Edison’s businesses is presented below:
|
Three months ended March 31, 2011 |
At March 31, 2011 | |||||||||||||||||||||||
| (Millions of Dollars, except percentages) |
Operating
Revenues |
Net Income for
Common Stock |
Assets | |||||||||||||||||||||
|
CECONY |
$ | 2,709 | 81 | % | $ | 268 | 86 | % | $ | 32,396 | 90 | % | ||||||||||||
|
O&R |
241 | 7 | % | 19 | 6 | % | 2,318 | 6 | % | |||||||||||||||
|
Total Utilities |
2,950 | 88 | % | 287 | 92 | % | 34,714 | 96 | % | |||||||||||||||
|
Con Edison Solutions (a) |
344 | 10 | % | 27 | 9 | % | 280 | 1 | % | |||||||||||||||
|
Con Edison Energy (a) |
66 | 2 | % | — | — | % | 77 | — | % | |||||||||||||||
|
Con Edison Development |
1 | — | % | — | — | % | 484 | 1 | % | |||||||||||||||
|
Other(b) |
(12 | ) | — | % | (3 | ) | (1 | )% | 631 | 2 | % | |||||||||||||
|
Total Con Edison |
$ | 3,349 | 100 | % | $ | 311 | 100 | % | $ | 36,186 | 100 | % | ||||||||||||
| (a) | Net income from the competitive energy businesses for the three months ended March 31, 2011 includes $22 million of net after-tax mark-to-market gains (Con Edison Solutions, $20 million and Con Edison Energy, $2 million). |
| (b) | Represents inter-company and parent company accounting. See “Results of Operations,” below. |
Con Edison’s net income for common stock for the three months ended March 31, 2011 was $311 million or $1.07 a share ($1.06 on a diluted basis) compared with $226 million or $0.80 a share (basic and diluted basis) for the three months ended March 31, 2010. See “Results of Operations – Summary,” below. For segment financial information, see Note H to the First Quarter Financial Statements and “Results of Operations,” below.
| 33 |
Table of Contents
Results of Operations — Summary
Net income for common stock for the three months ended March 31, 2011 and 2010 was as follows:
| (Millions of Dollars) | 2011 | 2010 | ||||||
|
CECONY |
$ | 268 | $ | 243 | ||||
|
O&R |
19 | 13 | ||||||
|
Competitive energy businesses(a) |
27 | (28 | ) | |||||
|
Other(b) |
(3 | ) | (2 | ) | ||||
|
Con Edison |
$ | 311 | $ | 226 | ||||
| (a) | Includes $22 million and $(38) million of net after-tax mark-to-market gains/(losses) in the three months ended March 31, 2011 and 2010, respectively. |
| (b) | Consists of inter-company and parent company accounting. |
The Companies’ results of operations for the three months ended March 31, 2011, as compared with the 2010 period, reflect changes in the Utilities’ rate plans. These rate plans provide for additional revenues to cover expected increases in certain operations and maintenance expenses and depreciation and property taxes. The results of operations include the operating results of the competitive energy businesses, including net mark-to-market effects.
Operations and maintenance expenses were lower in the three months ended March 31, 2011 compared with the 2010 period reflecting lower costs for employee health insurance, demand management programs and savings from cost control efforts, offset in part by winter storm related emergency response costs and higher regulatory assessments in the 2011 period. Depreciation and property taxes were higher in the 2011 period reflecting primarily the impact from higher utility plant balances.
The following table presents the estimated effect on earnings per share and net income for common stock for the three months ended March 31, 2011 as compared with the 2010 period, resulting from these and other major factors:
|
Earnings per Share |
Net Income for
Common Stock (Millions of Dollars) |
|||||||
|
CECONY |
||||||||
|
Rate plans, primarily to recover increases in certain costs |
$ | 0.18 | $ | 51 | ||||
|
Operations and maintenance expense |
0.02 | 7 | ||||||
|
Depreciation, property taxes and other tax matters |
(0.10 | ) | (29 | ) | ||||
|
Net interest expense |
0.01 | 4 | ||||||
|
Other (includes dilutive effect of new stock issuances) |
(0.05 | ) | (8 | ) | ||||
|
Total CECONY |
0.06 | 25 | ||||||
|
O&R |
0.02 | 6 | ||||||
|
Competitive energy businesses |
||||||||
|
Earnings excluding net mark-to-market effects |
(0.02 | ) | (5 | ) | ||||
|
Net mark-to-market effects |
0.21 | 60 | ||||||
|
Total competitive energy businesses |
0.19 | 55 | ||||||
|
Other, including parent company expenses |
— | (1 | ) | |||||
|
Total variations |
$ | 0.27 | $ | 85 | ||||
See “Results of Operations” below for further discussion and analysis of results of operations.
Risk Factors
The Companies’ businesses are influenced by many factors that are difficult to predict, and that involve uncertainties that may materially affect actual operating results, cash flows and financial condition. See “Risk Factors” in Item 1A of the Form 10-K.
| 34 |
Table of Contents
Application of Critical Accounting Policies
The Companies’ financial statements reflect the application of their accounting policies, which conform to accounting principles generally accepted in the United States of America. The Companies’ critical accounting policies include industry-specific accounting applicable to regulated public utilities and accounting for pensions and other postretirement benefits, contingencies, long-lived assets, derivative instruments,
goodwill and leases. See “Application of Critical Accounting Policies” in Item 7 of the Form 10-K.
Liquidity and Capital Resources
The Companies’ liquidity reflects cash flows from operating, investing and financing activities, as shown on their respective consolidated statement of cash flows and as discussed below. See “Liquidity and Capital Resources” in Item 7 of the Form 10-K.
Changes in the Companies’ cash and temporary cash investments resulting from operating, investing and financing activities for the three months ended March 31, 2011 and 2010 are summarized as follows:
Con Edison
| (Millions of Dollars) | 2011 | 2010 | Variance | |||||||||
|
Operating activities |
$ | 362 | $ | 1 | $ | 361 | ||||||
|
Investing activities |
(496 | ) | (460 | ) | (36 | ) | ||||||
|
Financing activities |
312 | 286 | 26 | |||||||||
|
Net change |
178 | (173 | ) | 351 | ||||||||
|
Balance at beginning of period |
338 | 260 | 78 | |||||||||
|
Balance at end of period |
$ | 516 | $ | 87 | $ | 429 | ||||||
CECONY
| (Millions of Dollars) | 2011 | 2010 | Variance | |||||||||
|
Operating activities |
$ | 72 | $ | 22 | $ | 50 | ||||||
|
Investing activities |
(413 | ) | (441 | ) | 28 | |||||||
|
Financing activities |
291 | 317 | (26 | ) | ||||||||
|
Net change |
(50 | ) | (102 | ) | 52 | |||||||
|
Balance at beginning of period |
78 | 131 | (53 | ) | ||||||||
|
Balance at end of period |
$ | 28 | $ | 29 | $ | (1 | ) | |||||
Cash Flows from Operating Activities
The Utilities’ cash flows from operating activities reflect principally their energy sales and deliveries and cost of operations. The volume of energy sales and deliveries is dependent primarily on factors external to the Utilities, such as growth of customer demand, weather, market prices for energy, economic conditions and measures that promote energy efficiency. Under the revenue decoupling mechanisms in CECONY’s electric and gas rate plans and O&R’s New York electric and gas rate plans, changes in delivery volumes from levels assumed when rates were approved may affect the timing of cash flows but not net income. See Note B to the financial statements in Item 8 of the Form 10-K. The prices at which the Utilities provide energy to their customers are determined in accordance with their rate agreements. In general, changes in the Utilities’ cost of purchased power, fuel and gas may affect the timing of cash flows but not net income because the costs are recovered in accordance with rate agreements. See “Recoverable Energy Costs” in Note A to the financial statements in Item 8 of the Form 10-K.
Net income is the result of cash and non-cash (or accrual) transactions. Only cash transactions affect the Companies’ cash flows from operating activities. Principal non-cash charges include depreciation, deferred income tax expense and net derivative losses. Non-cash charges or credits may also be accrued under the revenue decoupling and cost reconciliation mechanisms in the Utilities’ electric and gas rate plans in New York. See “Rate Agreements” in Note B to the financial statements in Item 8 of the Form 10-K.
| 35 |
Table of Contents
Net cash flows from operating activities for the three months ended March 31, 2011 for Con Edison and CECONY were $361 million and $50 million higher, respectively, than in the 2010 period. For Con Edison, this increase reflects primarily the receipt of refunds in 2011, at the parent company, for estimated federal income tax payments made in 2010 by the company prior to the determination that the company had no current federal income tax liability for 2010. For Con Edison, this increase also reflects lower cash collateral paid to brokers and counterparties generally reflecting higher commodity prices for derivative transactions.
The change in net cash flows also reflects the timing of payments for and recovery of energy costs. This timing is reflected within changes to accounts receivable – customers, recoverable energy costs and accounts payable balances.
Cash Flows Used in Investing Activities
Net cash flows used in investing activities for Con Edison and CECONY were $36 million higher and $28 million lower, respectively, for the three months ended March 31, 2011 compared with the 2010 period. The increase for Con Edison reflects primarily a loan to an affiliate for a solar project offset in part by lower construction expenditures in the 2011 period. The decrease for CECONY reflects primarily lower construction expenditures in the 2011 period.
Cash Flows from Financing Activities
Net cash flows from financing activities for Con Edison increased $26 million in the three months ended March 31, 2011 compared with the 2010 period. Net cash flows from financing activities for CECONY decreased $26 million in the three months ended March 31, 2011 compared with the 2010 period.
Cash flows from financing activities for the three months ended March 31, 2011 and 2010 reflect the issuance of Con Edison common shares through its dividend reinvestment and employee stock plans (2011: 0.7 million shares for $25 million, 2010: 0.6 million shares for $14 million). In addition, as a result of the stock plan issuances, cash used to pay common stock dividends was reduced by $3 million and $12 million in the 2011 and 2010 periods, respectively.
Cash flows from financing activities of the Companies also reflect commercial paper issuance (included on the consolidated balance sheets as “Notes payable”). The commercial paper amounts outstanding at March 31, 2011 and March 31, 2010 and the average daily balances for the three months ended March 31, 2011 and 2010 for Con Edison and CECONY were as follows:
| 2011 | 2010 | |||||||||||||||
|
(Millions of Dollars, except
Weighted Average Yield) |
Outstanding at
March 31 |
Daily
average |
Outstanding at
March 31 |
Daily
average |
||||||||||||
|
Con Edison |
$ | 464 | $ | 140 | $ | 475 | $ | 297 | ||||||||
|
CECONY |
$ | 464 | $ | 140 | $ | 475 | $ | 296 | ||||||||
|
Weighted average yield |
0.3 | % | 0.3 | % | 0.3 | % | 0.3 | % | ||||||||
Common stock issuances and external borrowings are sources of liquidity that could be affected by changes in credit ratings, financial performance and capital market conditions.
| 36 |
Table of Contents
Other Changes in Assets and Liabilities
The following table shows changes in certain assets and liabilities at March 31, 2011, compared with December 31, 2010.
| Con Edison | CECONY | |||||||
| (Millions of Dollars) |
2011 vs. 2010 Variance |
2011 vs. 2010 Variance |
||||||
|
Assets |
||||||||
|
Prepayments |
$ | 217 | $ | 291 | ||||
|
Regulatory asset – Unrecognized pension and other postretirement costs |
(297 | ) | (279 | ) | ||||
|
Accrued unbilled revenue |
(220 | ) | (185 | ) | ||||
|
Liabilities |
||||||||
|
Deferred income taxes and investment tax credits |
269 | 238 | ||||||
|
Pension and retiree benefits |
(628 | ) | (620 | ) | ||||
|
Regulatory liability – Net unbilled revenue |
(103 | ) | (103 | ) | ||||
Prepayments and Deferred Income Taxes and Investment Tax Credits
The increase in prepayments for Con Edison and CECONY, reflects primarily CECONY’s January 2011 payment of its New York City semi-annual property taxes, offset by three months of amortization, while the December 2010 balance reflects a full amortization of the previous semi-annual prepayment. For Con Edison, this increase is offset by the receipt of refunds in 2011 for estimated federal income tax payments made in 2010 by the company prior to the determination that the company had no current federal income tax liability for 2010. See “Cash Flows from Operating Activities,” above.
The increase in the liability for deferred income taxes and investment tax credits reflects the timing of the deduction of expenditures for utility plant which resulted in amounts being collected from customers to pay income taxes in advance of when the income tax payments will be required. See “Cash Flows from Operating Activities,” above.
Accrued Unbilled Revenues/Net Unbilled Revenues
The decrease in accrued unbilled revenues and the regulatory liability for net unbilled revenues reflects primarily the colder weather in December 2010 compared with March 2011.
Regulatory Asset for Unrecognized Pension and Other Postretirement Costs and Noncurrent Liability for Pension and Retiree Benefits
The decreases in the regulatory asset for unrecognized pension and other postretirement benefit costs and the noncurrent liability for pension and retiree benefits reflect the final actuarial valuation of the underfunding of the pension and other retiree benefit plans as measured at December 31, 2010, in accordance with the accounting rules for pensions and the year’s amortization of accounting costs. The decrease in the noncurrent liability for pension and retiree benefits also reflects the contributions to the pension plan made by CECONY in 2011. See Notes E and F to the First Quarter Financial Statements.
Capital Requirements and Resources
At March 31, 2011, there was no material change in the Companies’ capital requirements and resources compared to those disclosed under “Capital Requirements and Resources – Capital Resources” in Item 1 of the Form 10-K, other than as described below.
| 37 |
Table of Contents
For each of the Companies, the ratio of earnings to fixed charges (Securities and Exchange Commission basis) for the three months ended March 31, 2011 and 2010 and the twelve months ended December 31, 2010 was:
| Earnings to Fixed Charges (Times) | ||||||||||||
|
For the Three Months
Ended March 31, 2011 |
For the Three Months
Ended March 31, 2010 |
For the Twelve Months
Ended December 31, 2010 |
||||||||||
|
Con Edison |
3.9 | 3.1 | 3.3 | |||||||||
|
CECONY |
3.9 | 3.7 | 3.4 | |||||||||
For each of the Companies, the common equity ratio at March 31, 2011 and December 31, 2010 was:
|
Common Equity Ratio (Percent of total capitalization) |
||||||||
|
March 31,
2011 |
December 31,
2010 |
|||||||
|
Con Edison |
50.8 | 50.4 | ||||||
|
CECONY |
50.2 | 49.9 | ||||||
Contractual Obligations
At March 31, 2011, there were no material changes in the Companies’ aggregate obligation to make payments pursuant to contracts compared to those discussed under “Capital Requirements and Resources –Contractual Obligations” in Item 1 of the Form 10-K.
Regulatory Matters
For Information about the Utilities’ rate plans and other regulatory matters affecting the Companies, see “Utility Regulation” in Item 1 of the Form 10-K and “Rate Agreements” in Note B to the financial statements in Item 8 of the Form 10-K and Note B to the First Quarter Financial Statements.
Financial and Commodity Market Risks
The Companies are subject to various risks and uncertainties associated with financial and commodity markets. The most significant market risks include interest rate risk, commodity price risk, credit risk and investment risk. At March 31, 2011, there were no material changes in the Companies’ financial and commodity market risks compared to those discussed under “Financial and Commodity Market Risks” in Item 7 of the Form 10-K, other than as described below and in Note I to the First Quarter Financial Statements.
Commodity Price Risk
Con Edison’s commodity price risk relates primarily to the purchase and sale of electricity, gas and related derivative instruments. The Utilities and Con Edison’s competitive energy businesses have risk management strategies to mitigate their related exposures. See Note I to the First Quarter Financial Statements.
Con Edison estimates that, as of March 31, 2011, a 10 percent decline in market prices would result in a decline in fair value of $107 million for the derivative instruments used by the Utilities to hedge purchases of electricity and gas, of which $88 million is for CECONY and $19 million is for O&R. Con Edison expects that any such change in fair value would be largely offset by directionally opposite changes in the cost of the electricity and gas purchased. In accordance with provisions approved by state regulators, the Utilities generally recover from customers the costs they incur for energy purchased for their customers, including gains and losses on certain derivative instruments used to hedge energy purchased and related costs. See “Recoverable Energy Costs” in Note A to the financial statements in Item 8 of the Form 10-K.
Con Edison’s competitive energy businesses use a value-at-risk (VaR) model to assess the market risk of their electricity and gas commodity fixed-price purchase and sales commitments, physical forward contracts and commodity derivative instruments. VaR represents the potential change in fair value of instruments or the portfolio due to changes in market factors, for a specified time period and confidence level. These businesses estimate VaR across their electricity and natural gas commodity businesses using a delta-normal variance/covariance model with a 95 percent confidence level. Since the VaR calculation involves complex methodologies and estimates and assumptions that are based on past experience, it is not necessarily indicative of future results. VaR for transactions associated with hedges on generating assets and commodity contracts, assuming a one-day holding
| 38 |
Table of Contents
period, for the three months ended March 31, 2011 and the year ended December 31, 2010 was as follows:
|
March 31,
2011 |
December 31,
2010 |
|||||||
| (Millions of Dollars) | ||||||||
|
95% Confidence Level, One-Day Holding Period |
||||||||
|
Average for the period |
$ | 1 | $ | 1 | ||||
|
High |
1 | 1 | ||||||
|
Low |
— | — | ||||||
Credit Risk
The Companies are exposed to credit risk related to transactions entered into primarily for the various energy supply and hedging activities by the Utilities and the competitive energy businesses. Credit risk relates to the loss that may result from a counterparty’s nonperformance. The Companies use credit policies to manage this risk, including an established credit approval process, monitoring of counterparty limits, netting provisions within agreements and collateral or prepayment arrangements, credit insurance and credit default swaps. The Companies measure credit risk exposure as the replacement cost for open energy commodity and derivative positions plus amounts owed from counterparties for settled transactions. The replacement cost of open positions represents unrealized gains, net of any unrealized losses where the Companies have a legally enforceable right of setoff. See “Credit Exposure” in Note I to the First Quarter Financial Statements.
Environmental Matters
For information concerning climate change, environmental sustainability, potential liabilities arising from laws and regulations protecting the environment and other environmental matters, see “Environmental Matters” in Item 1 of the Form 10-K and Notes F and G to the First Quarter Financial Statements.
Impact of Inflation
The Companies are affected by the decline in the purchasing power of the dollar caused by inflation. Regulation permits the Utilities to recover through depreciation only the historical cost of their plant assets even though in an inflationary economy the cost to replace the assets upon their retirement will substantially exceed historical costs. The impact is, however, partially offset by the repayment of the Companies’ long-term debt in dollars of lesser value than the dollars originally borrowed.
Material Contingencies
For information concerning potential liabilities arising from the Companies’ material contingencies, see “Application of Critical Accounting Policies – Accounting for Contingencies,” in Item 7 of the Form 10-K and Notes B, G and H to the First Quarter Financial Statements.
Results of Operations
See “Results of Operations – Summary,” above.
Results of operations reflect, among other things, the Companies’ accounting policies (see “Application of Critical Accounting Policies,” in Item 7 of the Form 10-K) and rate plans that limit the rates the Utilities can charge their customers (see “Utility Regulation” in Item 1 of the Form 10-K). Under the revenue decoupling mechanisms currently applicable to CECONY’s electric and gas businesses and O&R’s electric and gas businesses in New York, the Utilities’ delivery revenues generally will not be affected by changes in delivery volumes from levels assumed when rates were approved. Revenues for CECONY’s steam business and O&R’s businesses in New Jersey and Pennsylvania are affected by changes in delivery volumes resulting from weather, economic conditions and other factors. See Note B to the First Quarter Financial Statements.
In general, the Utilities recover on a current basis the fuel, gas purchased for resale and purchased power costs they incur in supplying energy to their full-service customers (see “Recoverable Energy Costs” in Note A and “Regulatory Matters” in Note B to the financial statements in Item 8 of the Form 10-K). Accordingly, such costs do not generally affect the Companies’ results of operations. Management uses the term “net revenues” (operating revenues less such costs) to identify changes in operating revenues that may affect the Companies’ results of operations. Management believes that, although “net revenues” may not be a measure determined in accordance with accounting
| 39 |
Table of Contents
principles generally accepted in the United States of America, the measure facilitates the analysis by management and investors of the Companies’ results of operations.
Con Edison’s principal business segments are CECONY’s regulated electric, gas and steam utility activities, O&R’s regulated electric and gas utility activities and Con Edison’s competitive energy businesses. CECONY’s principal business segments are its regulated electric, gas and steam utility activities. A discussion of the results of operations by principal business segment for the three months ended March 31, 2011 and 2010 follows. For additional business segment financial information, see Note H to the First Quarter Financial Statements.
Three Months Ended March 31, 2011 Compared with Three Months Ended March 31, 2010
The Companies’ results of operations in 2011 compared with 2010 were:
| CECONY | O&R |
Competitive Energy
Businesses and Other (a) |
Con Edison (b) | |||||||||||||||||||||||||||||
| (Millions of Dollars) |
Increases
(Decreases) Amount |
Increases
(Decreases) Percent |
Increases
(Decreases) Amount |
Increases
(Decreases) Percent |
Increases
(Decreases) Amount |
Increases
(Decreases) Percent |
Increases
(Decreases) Amount |
Increases
(Decreases) Percent |
||||||||||||||||||||||||
|
Operating revenues |
$ | (9 | ) | (0.3 | )% | $ | (10 | ) | (4.0 | )% | $ | (94 | ) | (19.1 | )% | $ | (113 | ) | (3.3 | )% | ||||||||||||
|
Purchased power |
(69 | ) | (12.5 | ) | (18 | ) | (20.9 | ) | (191 | ) | (37.8 | ) | (278 | ) | (24.3 | ) | ||||||||||||||||
|
Fuel |
26 | 17.3 | N/A | N/A | — | — | 26 | 17.3 | ||||||||||||||||||||||||
|
Gas purchased for resale |
(31 | ) | (10.5 | ) | (5 | ) | (11.4 | ) | 1 | 20.0 | (35 | ) | (10.2 | ) | ||||||||||||||||||
|
Operating revenues less purchased power, fuel and gas purchased for resale (net revenues) |
65 | 3.8 | 13 | 10.7 | 96 | Large | 174 | 9.5 | ||||||||||||||||||||||||
|
Other operations and maintenance |
(11 | ) | (1.8 | ) | 2 | 2.9 | 5 | 20.0 | (4 | ) | (0.6 | ) | ||||||||||||||||||||
|
Depreciation and amortization |
13 | 6.8 | 1 | 9.1 | — | — | 14 | 6.9 | ||||||||||||||||||||||||
|
Taxes, other than income taxes |
29 | 7.1 | — | — | 1 | 25.0 | 30 | 7.0 | ||||||||||||||||||||||||
|
Operating income |
34 | 6.6 | 10 | 35.7 | 90 | Large | 134 | 27.2 | ||||||||||||||||||||||||
|
Other income less deductions |
— | — | 1 | Large | — | — | 1 | 12.5 | ||||||||||||||||||||||||
|
Net interest expense |
(1 | ) | (0.7 | ) | 2 | 25.0 | 2 | 40.0 | 3 | 2.0 | ||||||||||||||||||||||
|
Income before income tax expense |
35 | 9.2 | 9 | 45.0 | 88 | Large | 132 | 37.6 | ||||||||||||||||||||||||
|
Income tax expense |
10 | 7.4 | 3 | 42.9 | 34 | Large | 47 | 38.5 | ||||||||||||||||||||||||
|
Net income for common stock |
$ | 25 | 10.3 | % | $ | 6 | 46.2 | % | $ | 54 | Large | $ | 85 | 37.6 | % | |||||||||||||||||
| (a) | Includes inter-company and parent company accounting. |
| (b) | Represents the consolidated financial results of Con Edison and its businesses. |
CECONY
|
Three Months Ended
March 31, 2011 |
Three Months Ended
March 31, 2010 |
|||||||||||||||||||||||||||||||||||
| (Millions of Dollars) | Electric | Gas | Steam |
2011
Total |
Electric | Gas | Steam |
2010
Total |
2011-2010
Variation |
|||||||||||||||||||||||||||
|
Operating revenues |
$ | 1,721 | $ | 663 | $ | 325 | $ | 2,709 | $ | 1,728 | $ | 683 | $ | 307 | $ | 2,718 | $ | (9 | ) | |||||||||||||||||
|
Purchased power |
464 | — | 19 | 483 | 529 | — | 23 | 552 | (69 | ) | ||||||||||||||||||||||||||
|
Fuel |
76 | — | 100 | 176 | 60 | — | 90 | 150 | 26 | |||||||||||||||||||||||||||
|
Gas purchased for resale |
— | 263 | — | 263 | — | 294 | — | 294 | (31 | ) | ||||||||||||||||||||||||||
|
Net revenues |
1,181 | 400 | 206 | 1,787 | 1,139 | 389 | 194 | 1,722 | 65 | |||||||||||||||||||||||||||
|
Operations and maintenance |
459 | 103 | 35 | 597 | 468 | 88 | 52 | 608 | (11 | ) | ||||||||||||||||||||||||||
|
Depreciation and amortization |
161 | 27 | 16 | 204 | 151 | 25 | 15 | 191 | 13 | |||||||||||||||||||||||||||
|
Taxes, other than income taxes |
344 | 66 | 30 | 440 | 325 | 61 | 25 | 411 | 29 | |||||||||||||||||||||||||||
|
Operating income |
$ | 217 | $ | 204 | $ | 125 | $ | 546 | $ | 195 | $ | 215 | $ | 102 | $ | 512 | $ | 34 | ||||||||||||||||||
| 40 |
Table of Contents
Electric
CECONY’s results of electric operations for the three months ended March 31, 2011 compared with the 2010 period is as follows:
| Three Months Ended | ||||||||||||
| (Millions of Dollars) |
March 31,
2011 |
March 31,
2010 |
Variation | |||||||||
|
Operating revenues |
$ | 1,721 | $ | 1,728 | $ | (7 | ) | |||||
|
Purchased power |
464 | 529 | (65 | ) | ||||||||
|
Fuel |
76 | 60 | 16 | |||||||||
|
Net revenues |
1,181 | 1,139 | 42 | |||||||||
|
Operations and maintenance |
459 | 468 | (9 | ) | ||||||||
|
Depreciation and amortization |
161 | 151 | 10 | |||||||||
|
Taxes, other than income taxes |
344 | 325 | 19 | |||||||||
|
Electric operating income |
$ | 217 | $ | 195 | $ | 22 | ||||||
CECONY’s electric sales and deliveries, excluding off-system sales, for the three months ended March 31, 2011 compared with the 2010 period were:
| Millions of kWhs Delivered | Revenues in Millions | |||||||||||||||||||||||||||||||
| Three Months Ended | Three Months Ended | |||||||||||||||||||||||||||||||
| Description |
March 31,
2011 |
March 31,
2010 |
Variation |
Percent
Variation |
March 31,
2011 |
March 31,
2010 |
Variation |
Percent
Variation |
||||||||||||||||||||||||
|
Residential/Religious (a) |
2,664 | 2,671 | (7 | ) | (0.3 | )% | $ | 648 | $ | 633 | $ | 15 | 2.4 | % | ||||||||||||||||||
|
Commercial/Industrial |
2,860 | 2,994 | (134 | ) | (4.5 | ) | 561 | 554 | 7 | 1.3 | ||||||||||||||||||||||
|
Retail access customers |
5,558 | 5,385 | 173 | 3.2 | 474 | 468 | 6 | 1.3 | ||||||||||||||||||||||||
|
NYPA, Municipal Agency and other sales |
2,774 | 2,898 | (124 | ) | (4.3 | ) | 117 | 120 | (3 | ) | (2.5 | ) | ||||||||||||||||||||
|
Other operating revenues |
— | — | — | — | (79 | ) | (47 | ) | (32 | ) | (68.1 | ) | ||||||||||||||||||||
|
Total |
13,856 | 13,948 | (92 | ) | (0.7 | )% | $ | 1,721 | $ | 1,728 | $ | (7 | ) | (0.4 | )% | |||||||||||||||||
| (a) | “Residential/Religious” generally includes single-family dwellings, individual apartments in multi-family dwellings, religious organizations and certain other not-for-profit organizations. |
CECONY’s electric operating revenues decreased $7 million in the three months ended March 31, 2011 compared with the 2010 period due primarily to lower purchased power costs ($65 million), offset in part by higher revenues from the electric rate plan ($50 million). The change in rate plan revenues reflects, among other things, reductions in revenues pursuant to the rate plan’s revenue decoupling mechanism ($28 million) and reconciliations of costs for municipal infrastructure support and capital expenditures ($5 million). CECONY’s revenues from electric sales are subject to a revenue decoupling mechanism, as a result of which delivery revenues generally are not affected by changes in delivery volumes from levels assumed when rates were approved. Other electric operating revenues generally reflect changes in regulatory assets and liabilities in accordance with the revenue decoupling mechanism and other provisions of the company’s rate plans. See “Rate Agreements – CECONY – Electric” in Note B to the financial statements in Item 8 of the Form 10-K.
Electric delivery volumes in CECONY’s service area decreased 0.7 percent in the three months ended March 31, 2011 compared with the 2010 period. After adjusting for variations, principally weather and billing days, electric delivery volumes in CECONY’s service area decreased 1.3 percent in the three months ended March 31, 2011 compared with the 2010 period.
CECONY’s electric fuel costs increased $16 million in the three months ended March 31, 2011 compared with the 2010 period due to higher sendout volumes from the company’s electric generating facilities ($11 million) and unit costs ($5 million). Electric purchased power costs decreased $65 million in the three months ended March 31, 2011 compared with the 2010 period due to a decrease in unit costs ($42 million) and purchased volumes ($23 million).
CECONY’s electric operating income increased $22 million in the three months ended March 31, 2011 compared with the 2010 period. The increase reflects
| 41 |
Table of Contents
primarily higher net revenues ($42 million, due primarily to the electric rate plan, including the collection of a surcharge for a New York State assessment) and lower operations and maintenance costs ($9 million). The lower operations and maintenance costs reflect primarily lower costs for injuries and damages ($6 million), employees’ health and group life insurance ($6 million), pension ($3 million) and cost control efforts, offset in part by an increase in the surcharge for a New York State assessment ($5 million) and winter storm related emergency response costs ($5 million). The increase in electric operating income was offset by higher depreciation and amortization ($10 million) and taxes, other than income taxes ($19 million, principally property taxes). See “Regulatory Assets and Liabilities” in Note B to the First Quarter Financial Statements.
Gas
CECONY’s results of gas operations for the three months ended March 31, 2011 compared with the 2010 period is as follows:
| Three Months Ended | ||||||||||||
| (Millions of Dollars) |
March 31,
2011 |
March 31,
2010 |
Variation | |||||||||
|
Operating revenues |
$ | 663 | $ | 683 | $ | (20 | ) | |||||
|
Gas purchased for resale |
263 | 294 | (31 | ) | ||||||||
|
Net revenues |
400 | 389 | 11 | |||||||||
|
Operations and maintenance |
103 | 88 | 15 | |||||||||
|
Depreciation and amortization |
27 | 25 | 2 | |||||||||
|
Taxes, other than income taxes |
66 | 61 | 5 | |||||||||
|
Gas operating income |
$ | 204 | $ | 215 | $ | (11 | ) | |||||
CECONY’s gas sales and deliveries, excluding off-system sales, for the three months ended March 31, 2011 compared with the 2010 period were:
| Thousands of dths Delivered | Revenues in Millions | |||||||||||||||||||||||||||||||
| Three Months Ended | Three Months Ended | |||||||||||||||||||||||||||||||
| Description |
March 31,
2011 |
March 31,
2010 |
Variation |
Percent
Variation |
March 31,
2011 |
March 31,
2010 |
Variation |
Percent
Variation |
||||||||||||||||||||||||
|
Residential |
18,783 | 19,345 | (562 | ) | (2.9 | )% | $ | 326 | $ | 346 | $ | (20 | ) | (5.8 | )% | |||||||||||||||||
|
General |
13,250 | 11,482 | 1,768 | 15.4 | 152 | 163 | (11 | ) | (6.7 | ) | ||||||||||||||||||||||
|
Firm transportation |
24,096 | 22,941 | 1,155 | 5.0 | 144 | 148 | (4 | ) | (2.7 | ) | ||||||||||||||||||||||
|
Total firm sales and transportation |
56,129 | 53,768 | 2,361 | 4.4 | 622 | 657 | (35 | ) | (5.3 | ) | ||||||||||||||||||||||
|
Interruptible sales (a) |
3,562 | 3,167 | 395 | 12.5 | 36 | 30 | 6 | 20.0 | ||||||||||||||||||||||||
|
NYPA |
5,820 | 6,042 | (222 | ) | (3.7 | ) | 1 | 1 | — | — | ||||||||||||||||||||||
|
Generation plants |
12,359 | 12,265 | 94 | 0.8 | 7 | 8 | (1 | ) | (12.5 | ) | ||||||||||||||||||||||
|
Other |
7,687 | 7,814 | (127 | ) | (1.6 | ) | 19 | 22 | (3 | ) | (13.6 | ) | ||||||||||||||||||||
|
Other operating revenues |
— | — | — | — | (22 | ) | (35 | ) | 13 | 37.1 | ||||||||||||||||||||||
|
Total |
85,557 | 83,056 | 2,501 | 3.0 | % | $ | 663 | $ | 683 | $ | (20 | ) | (2.9 | )% | ||||||||||||||||||
| (a) | Includes 984 and 986 thousands of dths for the 2011 and 2010 period, respectively, which are also reflected in firm transportation and other. |
CECONY’s gas operating revenues decreased $20 million in the three months ended March 31, 2011 compared with the 2010 period due primarily to a decrease in gas purchased for resale costs ($31 million), offset in part by higher revenues from the gas rate plans ($24 million). CECONY’s revenues from gas sales are subject to a weather normalization clause and a revenue decoupling mechanism as a result of which delivery revenues are generally not affected by changes in delivery volumes from levels assumed when rates were approved. Other gas operating revenues generally reflect changes in regulatory assets and liabilities in accordance with the company’s rate plans. See “Rate Agreements – CECONY – Gas” in Note B to the financial statements in Item 8 of the Form 10-K.
CECONY’s sales and transportation volumes for firm customers increased 4.4 percent in the three months ended March 31, 2011 compared with the 2010 period. After adjusting for variations, principally weather and billing days, firm gas sales and transportation volumes in the company’s service area increased 1.2 percent in the three months ended March 31, 2011 reflecting an increase in the number of customers, offset in part by net transfers from firm service to interruptible service.
| 42 |
Table of Contents
CECONY’s purchased gas cost decreased $31 million in the three months ended March 31, 2011 compared with the 2010 period due to lower unit costs ($50 million), offset by higher sendout volumes ($19 million).
CECONY’s gas operating income decreased $11 million in the three months ended March 31, 2011 compared with the 2010 period. The decrease reflects primarily higher operations and maintenance costs ($15 million, due primarily to an increase in the surcharge for a New York State assessment ($3 million) and pension expense ($7 million)), taxes, other than income taxes ($5 million, principally property taxes) and depreciation and amortization ($2 million), offset by higher net revenues ($11 million).
Steam
CECONY’s results of steam operations for the three months ended March 31, 2011 compared with the 2010 period is as follows:
| Three Months Ended | ||||||||||||
| (Millions of Dollars) |
March 31,
2011 |
March 31,
2010 |
Variation | |||||||||
|
Operating revenues |
$ | 325 | $ | 307 | $ | 18 | ||||||
|
Purchased power |
19 | 23 | (4 | ) | ||||||||
|
Fuel |
100 | 90 | 10 | |||||||||
|
Net revenues |
206 | 194 | 12 | |||||||||
|
Operations and maintenance |
35 | 52 | (17 | ) | ||||||||
|
Depreciation and amortization |
16 | 15 | 1 | |||||||||
|
Taxes, other than income taxes |
30 | 25 | 5 | |||||||||
|
Steam operating income |
$ | 125 | $ | 102 | $ | 23 | ||||||
CECONY’s steam sales and deliveries for the three months ended March 31, 2011 compared with the 2010 period were:
| Millions of Pounds Delivered | Revenues in Millions | |||||||||||||||||||||||||||||||
| Three Months Ended | Three Months Ended | |||||||||||||||||||||||||||||||
| Description |
March 31,
2011 |
March 31,
2010 |
Variation |
Percent
Variation |
March 31,
2011 |
March 31,
2010 |
Variation |
Percent
Variation |
||||||||||||||||||||||||
|
General |
334 | 61 | 273 | Large | $ | 15 | $ | 10 | $ | 5 | 50.0 | % | ||||||||||||||||||||
|
Apartment house |
2,593 | 2,631 | (38 | ) | (1.4 | ) | 83 | 80 | 3 | 3.8 | ||||||||||||||||||||||
|
Annual power |
6,541 | 6,523 | 18 | 0.3 | 234 | 218 | 16 | 7.3 | ||||||||||||||||||||||||
|
Other operating revenues |
— | — | — | — | (7 | ) | (1 | ) | (6 | ) | Large | |||||||||||||||||||||
|
Total |
9,468 | 9,215 | 253 | 2.7 | % | $ | 325 | $ | 307 | $ | 18 | 5.9 | % | |||||||||||||||||||
CECONY’s steam operating revenues increased $18 million in the three months ended March 31, 2011 compared with the 2010 period due primarily to higher fuel costs ($10 million), the net change in rates under the steam rate plans ($6 million) and colder winter weather in 2011 compared with the 2010 period ($8 million), offset in part by lower purchased power costs ($4 million). Other steam operating revenues generally reflect changes in regulatory assets and liabilities in accordance with the company’s rate plans. See “Rate Agreements – CECONY – Steam” in Note B to the financial statements in Item 8 of the Form 10-K.
Steam sales and delivery volumes increased 2.7 percent in the three months ended March 31, 2011 compared with the 2010 period. After adjusting for variations, principally weather and billing days, steam sales and deliveries decreased 2.4 percent in the three months ended March 31, 2011 reflecting lower average normalized use per customer.
CECONY’s steam purchased fuel costs increased $10 million in the three months ended March 31, 2011 compared with the 2010 period due to higher unit costs ($5 million) and sendout volumes ($5 million). Steam purchased power costs decreased $4 million in the three months ended March 31, 2011 compared with the 2010 period due to a decrease in unit costs ($5 million), offset by an increase in purchased volumes ($1 million).
Steam operating income increased $23 million in the three months ended March 31, 2011 compared with the 2010 period. The increase reflects primarily higher net revenues ($12 million) and lower operations and maintenance costs ($17 million, due primarily to lower pension expense ($13 million)), offset by higher taxes, other than income taxes ($5 million, principally property taxes) and depreciation and amortization ($1 million).
| 43 |
Table of Contents
O&R
|
Three Months Ended
March 31, 2011 |
Three Months Ended
March 31, 2010 |
|||||||||||||||||||||||||||
| (Millions of Dollars) | Electric | Gas |
2011
Total |
Electric | Gas |
2010
Total |
2011-2010
Variation |
|||||||||||||||||||||
|
Operating revenues |
$ | 149 | $ | 92 | $ | 241 | $ | 161 | $ | 90 | $ | 251 | $ | (10 | ) | |||||||||||||
|
Purchased power |
68 | — | 68 | 86 | — | 86 | (18 | ) | ||||||||||||||||||||
|
Gas purchased for resale |
— | 39 | 39 | — | 44 | 44 | (5 | ) | ||||||||||||||||||||
|
Net revenues |
81 | 53 | 134 | 75 | 46 | 121 | 13 | |||||||||||||||||||||
|
Operations and maintenance |
53 | 18 | 71 | 53 | 16 | 69 | 2 | |||||||||||||||||||||
|
Depreciation and amortization |
9 | 3 | 12 | 8 | 3 | 11 | 1 | |||||||||||||||||||||
|
Taxes, other than income taxes |
9 | 4 | 13 | 9 | 4 | 13 | — | |||||||||||||||||||||
|
Operating income |
$ | 10 | $ | 28 | $ | 38 | $ | 5 | $ | 23 | $ | 28 | $ | 10 | ||||||||||||||
Electric
O&R’s results of electric operations for the three months ended March 31, 2011 compared with the 2010 period is as follows:
| Three Months Ended | ||||||||||||
| (Millions of Dollars) |
March 31,
2011 |
March 31,
2010 |
Variation | |||||||||
|
Operating revenues |
$ | 149 | $ | 161 | $ | (12 | ) | |||||
|
Purchased power |
68 | 86 | (18 | ) | ||||||||
|
Net revenues |
81 | 75 | 6 | |||||||||
|
Operations and maintenance |
53 | 53 | — | |||||||||
|
Depreciation and amortization |
9 | 8 | 1 | |||||||||
|
Taxes, other than income taxes |
9 | 9 | — | |||||||||
|
Electric operating income |
$ | 10 | $ | 5 | $ | 5 | ||||||
O&R’s electric sales and deliveries, excluding off-system sales, for the three months ended March 31, 2011 compared with the 2010 period were:
| Millions of kWhs Delivered | Revenues in Millions | |||||||||||||||||||||||||||||||
| Three Months Ended | Three Months Ended | |||||||||||||||||||||||||||||||
| Description |
March 31,
2011 |
March 31,
2010 |
Variation |
Percent
Variation |
March 31,
2011 |
March 31,
2010 |
Variation |
Percent
Variation |
||||||||||||||||||||||||
|
Residential/Religious(a) |
429 | 448 | (19 | ) | (4.2 | )% | $ | 74 | $ | 80 | $ | (6 | ) | (7.5 | )% | |||||||||||||||||
|
Commercial/Industrial |
316 | 382 | (66 | ) | (17.3 | ) | 41 | 54 | (13 | ) | (24.1 | ) | ||||||||||||||||||||
|
Retail access customers |
625 | 507 | 118 | 23.3 | 33 | 26 | 7 | 26.9 | ||||||||||||||||||||||||
|
Public authorities |
24 | 27 | (3 | ) | (11.1 | ) | 3 | 3 | — | — | ||||||||||||||||||||||
|
Other operating revenues |
— | — | — | — | (2 | ) | (2 | ) | — | — | ||||||||||||||||||||||
|
Total |
1,394 | 1,364 | 30 | 2.2 | % | $ | 149 | $ | 161 | $ | (12 | ) | (7.5 | )% | ||||||||||||||||||
| (a) | “Residential/Religious” generally includes single-family dwellings, individual apartments in multi-family dwellings, religious organizations and certain other not-for-profit organizations. |
O&R’s electric operating revenues decreased $12 million in the three months ended March 31, 2011 compared with the 2010 period due primarily to lower costs for purchased power ($18 million). O&R’s New York electric delivery revenues are subject to a revenue decoupling mechanism, as a result of which, delivery revenues are generally not affected by changes in delivery volumes from levels assumed when rates were approved. O&R’s electric sales in New Jersey and Pennsylvania are not subject to a decoupling mechanism, and as a result, changes in such volumes do impact revenues. Other electric operating revenues generally reflect changes in regulatory assets and liabilities in accordance with the company’s electric rate plan. See Note B to the First Quarter Financial Statements and “Rate Agreements – O&R – Electric” in Note B to the financial statements in Item 8 of the Form 10-K.
| 44 |
Table of Contents
Electric delivery volumes in O&R’s service area increased 2.2 percent in the three months ended March 31, 2011 compared with the 2010 period. After adjusting for weather variations, electric delivery volumes in O&R’s service area increased 1.0 percent in the three months ended March 31, 2011 compared with the 2010 period reflecting higher average normalized use per customer.
Electric operating income increased $5 million in the three months ended March 31, 2011 compared with the 2010 period. The increase reflects primarily higher net revenues ($6 million), offset by higher depreciation and amortization ($1 million).
Gas
O&R’s results of gas operations for the three months ended March 31, 2011 compared with the 2010 period is as follows:
| Three Months Ended | ||||||||||||
| (Millions of Dollars) |
March 31,
2011 |
March 31,
2010 |
Variation | |||||||||
|
Operating revenues |
$ | 92 | $ | 90 | $ | 2 | ||||||
|
Gas purchased for resale |
39 | 44 | (5 | ) | ||||||||
|
Net revenues |
53 | 46 | 7 | |||||||||
|
Operations and maintenance |
18 | 16 | 2 | |||||||||
|
Depreciation and amortization |
3 | 3 | — | |||||||||
|
Taxes, other than income taxes |
4 | 4 | — | |||||||||
|
Gas operating income |
$ | 28 | $ | 23 | $ | 5 | ||||||
O&R’s gas sales and deliveries, excluding off-system sales, for the three months ended March 31, 2011 compared with the 2010 period were:
| Thousands of dths Delivered | Revenues in Millions | |||||||||||||||||||||||||||||||
| Three Months Ended | Three Months Ended | |||||||||||||||||||||||||||||||
| Description |
March 31,
2011 |
March 31,
2010 |
Variation |
Percent
Variation |
March 31,
2011 |
March 31,
2010 |
Variation |
Percent
Variation |
||||||||||||||||||||||||
|
Residential |
3,774 | 3,525 | 249 | 7.1 | % | $ | 53 | $ | 50 | $ | 3 | 6.0 | % | |||||||||||||||||||
|
General |
737 | 710 | 27 | 3.8 | 9 | 9 | — | — | ||||||||||||||||||||||||
|
Firm transportation |
5,296 | 4,678 | 618 | 13.2 | 31 | 25 | 6 | 24.0 | ||||||||||||||||||||||||
|
Total firm sales and transportation |
9,807 | 8,913 | 894 | 10.0 | 93 | 84 | 9 | 10.7 | ||||||||||||||||||||||||
|
Interruptible sales |
1,311 | 1,411 | (100 | ) | (7.1 | ) | 1 | 6 | (5 | ) | (83.3 | ) | ||||||||||||||||||||
|
Generation plants |
98 | 140 | (42 | ) | (30.0 | ) | — | — | — | — | ||||||||||||||||||||||
|
Other |
399 | 369 | 30 | 8.1 | — | — | — | — | ||||||||||||||||||||||||
|
Other gas revenues |
— | — | — | — | (2 | ) | — | (2 | ) | Large | ||||||||||||||||||||||
|
Total |
11,615 | 10,833 | 782 | 7.2 | % | $ | 92 | $ | 90 | $ | 2 | 2.2 | % | |||||||||||||||||||
O&R’s gas operating revenues increased $2 million in the three months ended March 31, 2011 compared with the 2010 period due primarily to the gas rate plan, offset in part by the decrease in gas purchased for resale ($5 million).
Sales and transportation volumes for firm customers increased 10.0 percent in the three months ended March 31, 2011 compared with the 2010 period. After adjusting for weather and other variations, total firm sales and transportation volumes decreased 0.4 percent in the three months ended March 31, 2011 compared with the 2010 period. O&R’s New York revenues from gas sales are subject to a weather normalization clause and a revenue decoupling mechanism, as a result of which delivery revenues are generally not affected by changes in delivery volumes from levels assumed when rates were approved.
Gas operating income increased $5 million in the three months ended March 31, 2011 compared with the 2010 period. The increase reflects primarily higher net revenues ($7 million), offset by higher operations and maintenance costs ($2 million).
| 45 |
Table of Contents
Competitive Energy Businesses
The competitive energy business’s results of operations for the three months ended March 31, 2011 compared with the 2010 period is as follows:
| Three Months Ended | ||||||||||||
| (Millions of Dollars) |
March 31,
2011 |
March 31,
2010 |
Variation | |||||||||
|
Operating revenues |
$ | 408 | $ | 500 | $ | (92 | ) | |||||
|
Purchased power |
321 | 513 | (192 | ) | ||||||||
|
Gas purchased for resale |
6 | 5 | 1 | |||||||||
|
Net revenues |
81 | (18 | ) | 99 | ||||||||
|
Operations and maintenance |
30 | 24 | 6 | |||||||||
|
Depreciation and amortization |
2 | 2 | — | |||||||||
|
Taxes, other than income taxes |
5 | 4 | 1 | |||||||||
|
Operating income |
$ | 44 | $ | (48 | ) | $ | 92 | |||||
The competitive energy businesses’ operating revenues decreased $92 million in the three months ended March 31, 2011 compared with the 2010 period due primarily to net mark-to-market effects ($60 million) and a decrease in electric wholesale revenues ($29 million). Electric wholesale revenues decreased $29 million in the three months ended March 31, 2011 compared with the 2010 period due to lower sales volume ($31 million), offset by higher unit prices ($2 million). Electric retail revenues decreased $7 million in the three months ended March 31, 2011 compared with the 2010 period due to lower unit prices ($12 million), offset by higher sales volume ($5 million). Gross margins on electric retail revenues decreased in the three months ended March 31, 2011 compared with the 2010 period due primarily to lower unit gross margins. Net mark-to-market values increased $101 million in the three months ended March 31, 2011 as compared with the 2010 period, of which $161 million in gains are reflected in purchased power costs and $60 million in losses are reflected in revenues. Other revenues increased $4 million in the three months ended March 31, 2011 as compared with the 2010 period due primarily to higher sales of energy efficiency services ($5 million).
Purchased power costs decreased $192 million in the three months ended March 31, 2011 compared with the 2010 period due primarily to changes in mark-to-market values ($161 million) and lower purchased power costs ($31 million). Purchased power costs decreased $31 million due to lower unit prices ($9 million) and volumes ($22 million). Operating income increased $92 million in the three months ended March 31, 2011 compared with the 2010 period due primarily to net mark-to-market effects ($101 million).
Other
For Con Edison, “Other” also includes inter-company eliminations relating to operating revenues and operating expenses.
| 46 |
Table of Contents
For information about the Companies’ primary market risks associated with activities in derivative financial instruments, other financial instruments and derivative commodity instruments, see “Financial and Commodity Market Risks,” in Part I, Item 2 of this report, which information is incorporated herein by reference. Also, see Item 7A of the Form 10-K.
The Companies maintain disclosure controls and procedures designed to provide reasonable assurance that the information required to be disclosed in the reports that they submit to the Securities and Exchange Commission (SEC) is recorded, processed, summarized and reported within the time periods specified in the rules and forms of the SEC. Disclosure controls and procedures include, without limitation, controls and procedures designed to ensure that information required to be disclosed by an issuer in the reports that it files or submits under the Securities Exchange Act of 1934, as amended, is accumulated and communicated to the issuer’s management, including its principal executive and principal financial officers, or persons performing similar functions, as appropriate to allow timely decisions regarding required disclosure. For each of the Companies, its management, with the participation of its principal executive officer and principal financial officer, has evaluated its disclosure controls and procedures as of the end of the period covered by this report and, based on such evaluation, has concluded that the controls and procedures are effective to provide such reasonable assurance. Reasonable assurance is not absolute assurance, however, and there can be no assurance that any design of controls or procedures would be effective under all potential future conditions, regardless of how remote.
In January 2011, the Companies implemented a consolidation, reporting, and analysis system as part of a large ongoing project to implement a new financial and supply-chain enterprise resource planning information system. See Item 9A of the Form 10-K (which information is incorporated herein by reference). The project is reasonably likely to materially affect the Companies’ internal control over financial reporting. There was no other change in the Companies’ internal control over financial reporting that occurred during the Companies’ most recent fiscal quarter that has materially affected, or is reasonably likely to materially affect, the Companies’ internal control over financial reporting.
| 47 |
Table of Contents
For information about certain legal proceedings affecting the Companies, see Notes B, F and G to the financial statements in Part I, Item 1 of this report, which information is incorporated herein by reference.
There were no material changes in the Companies’ risk factors compared to those disclosed in Item 1A of the Form 10-K.
| 48 |
Table of Contents
CON EDISON
| Exhibit 10.1 | Form of Restricted Stock Unit Award for Officers under the Con Edison Long-Term Incentive Plan. | |
| Exhibit 12.1 | Statement of computation of Con Edison’s ratio of earnings to fixed charges for the three-month periods ended March 31, 2011 and 2010, and the 12-month period ended December 31, 2010. | |
| Exhibit 31.1.1 | Rule 13a-14(a)/15d-14(a) Certifications – Chief Executive Officer. | |
| Exhibit 31.1.2 | Rule 13a-14(a)/15d-14(a) Certifications – Chief Financial Officer. | |
| Exhibit 32.1.1 | Section 1350 Certifications – Chief Executive Officer. | |
| Exhibit 32.1.2 | Section 1350 Certifications – Chief Financial Officer. | |
| Exhibit 101.INS | XBRL Instance Document. | |
| Exhibit 101.SCH | XBRL Taxonomy Extension Schema. | |
| Exhibit 101.CAL | XBRL Taxonomy Extension Calculation Linkbase. | |
| Exhibit 101.DEF | XBRL Taxonomy Extension Definition Linkbase. | |
| Exhibit 101.LAB | XBRL Taxonomy Extension Label Linkbase. | |
| Exhibit 101.PRE | XBRL Taxonomy Extension Presentation Linkbase. | |
CECONY
| Exhibit 12.2 | Statement of computation of CECONY’s ratio of earnings to fixed charges for the three-month periods ended March 31, 2011 and 2010, and the 12-month period ended December 31, 2010. | |
| Exhibit 31.2.1 | Rule 13a-14(a)/15d-14(a) Certifications – Chief Executive Officer. | |
| Exhibit 31.2.2 | Rule 13a-14(a)/15d-14(a) Certifications – Chief Financial Officer. | |
| Exhibit 32.2.1 | Section 1350 Certifications – Chief Executive Officer. | |
| Exhibit 32.2.2 | Section 1350 Certifications – Chief Financial Officer. | |
| Exhibit 101.INS | XBRL Instance Document. | |
| Exhibit 101.SCH | XBRL Taxonomy Extension Schema. | |
| Exhibit 101.CAL | XBRL Taxonomy Extension Calculation Linkbase. | |
| Exhibit 101.DEF | XBRL Taxonomy Extension Definition Linkbase. | |
| Exhibit 101.LAB | XBRL Taxonomy Extension Label Linkbase. | |
| Exhibit 101.PRE | XBRL Taxonomy Extension Presentation Linkbase. | |
| 49 |
Table of Contents
Pursuant to the requirements of the Securities Exchange Act of 1934, each Registrant has duly caused this report to be signed on its behalf by the undersigned thereunto duly authorized.
| CONSOLIDATED EDISON, INC. | ||||||
| CONSOLIDATED EDISON COMPANY OF NEW YORK, INC. | ||||||
| DATE: May 5, 2011 | By | / S / R OBERT H OGLUND | ||||
|
Robert Hoglund Senior Vice President, Chief Financial Officer and Duly Authorized Officer |
||||||
| 50 |