|
|
|
|
|
|
|
|
|
|
|
|
|
|
|
|
|
|
|
|
|
|
|
|
|
|
|
|
|
|
|
|
|
|
|
|
|
|
|
|
|
|
|
|
|
|
|
|
|
|
|
|
|
|
|
|
Table of Contents
UNITED STATES
SECURITIES AND EXCHANGE COMMISSION
WASHINGTON, D.C. 20549
FORM 10-Q
| x | Quarterly Report Pursuant To Section 13 or 15(d) of the Securities Exchange Act of 1934 |
FOR THE QUARTERLY PERIOD ENDED SEPTEMBER 30, 2012
OR
| ¨ | Transition Report Pursuant to Section 13 or 15(d) of the Securities Exchange Act of 1934 |
For the transition period from to
|
Commission
|
Exact name of registrant as specified in its charter and principal office address and telephone number |
State of
|
I.R.S. Employer
|
|||
| 1-14514 | Consolidated Edison, Inc. | New York | 13-3965100 | |||
| 4 Irving Place, New York, New York 10003 | ||||||
| (212) 460-4600 | ||||||
| 1-1217 | Consolidated Edison Company of New York, Inc. | New York | 13-5009340 | |||
| 4 Irving Place, New York, New York 10003 | ||||||
| (212) 460-4600 | ||||||
Indicate by check mark whether the registrant (1) has filed all reports required to be filed by Section 13 or 15(d) of the Securities Exchange Act of 1934 during the preceding 12 months (or for such shorter period that the registrant was required to file such reports), and (2) has been subject to such filing requirements for the past 90 days.
| Consolidated Edison, Inc. (Con Edison) | Yes x | No ¨ | ||||||
| Consolidated Edison of New York, Inc. (CECONY) | Yes x | No ¨ | ||||||
Indicate by check mark whether the registrant has submitted electronically and posted on its corporate Web site, if any, every Interactive Data File required to be submitted and posted pursuant to Rule 405 of Regulation S-T (232.405 of this chapter) during the preceding 12 months (or for such shorter period that the registrant was required to submit and post such files).
| Con Edison | Yes x | No ¨ | ||||||
| CECONY | Yes x | No ¨ | ||||||
Indicate by check mark whether the registrant is a large accelerated filer, an accelerated filer, a non-accelerated filer, or a smaller reporting company. See the definitions of “large accelerated filer”, “accelerated filer” and “smaller reporting company” in Rule 12b-2 of the Exchange Act.
| Con Edison | ||||||
| Large accelerated filer x | Accelerated filer ¨ | Non-accelerated filer ¨ | Smaller reporting company ¨ | |||
| CECONY | ||||||
| Large accelerated filer ¨ | Accelerated filer ¨ | Non-accelerated filer x | Smaller reporting company ¨ | |||
Indicate by check mark whether the registrant is a shell company (as defined in Rule 12b-2 of the Exchange Act).
| Con Edison | Yes ¨ | No x | ||||||
| CECONY | Yes ¨ | No x | ||||||
As of October 31, 2012, Con Edison had outstanding 292,872,896 Common Shares ($.10 par value). All of the outstanding common equity of CECONY is held by Con Edison.
Filing Format
This Quarterly Report on Form 10-Q is a combined report being filed separately by two different registrants: Consolidated Edison, Inc. (Con Edison) and Consolidated Edison Company of New York, Inc. (CECONY). CECONY is a subsidiary of Con Edison and, as such, the information in this report about CECONY also applies to Con Edison. As used in this report, the term the “Companies” refers to Con Edison and CECONY. However, CECONY makes no representation as to the information contained in this report relating to Con Edison or the subsidiaries of Con Edison other than itself.
Table of Contents
Glossary of Terms
The following is a glossary of frequently used abbreviations or acronyms that are used in the Companies’ SEC reports:
| Con Edison Companies | ||
| Con Edison | Consolidated Edison, Inc. | |
| CECONY | Consolidated Edison Company of New York, Inc. | |
| Con Edison Development | Consolidated Edison Development, Inc. | |
| Con Edison Energy | Consolidated Edison Energy, Inc. | |
| Con Edison Solutions | Consolidated Edison Solutions, Inc. | |
| O&R | Orange and Rockland Utilities, Inc. | |
| Pike | Pike County Light & Power Company | |
| RECO | Rockland Electric Company | |
| The Companies | Con Edison and CECONY | |
| The Utilities | CECONY and O&R | |
| Regulatory Agencies, Government Agencies, and Quasi-governmental Not-for-Profits | ||
| EPA | U. S. Environmental Protection Agency | |
| FERC | Federal Energy Regulatory Commission | |
| IRS | Internal Revenue Service | |
| ISO-NE | ISO New England Inc. | |
| NJBPU | New Jersey Board of Public Utilities | |
| NJDEP | New Jersey Department of Environmental Protection | |
| NYISO | New York Independent System Operator | |
| NYPA | New York Power Authority | |
| NYSAG | New York State Attorney General | |
| NYSDEC | New York State Department of Environmental Conservation | |
| NYSERDA | New York State Energy Research and Development Authority | |
| NYSPSC | New York State Public Service Commission | |
| NYSRC | New York State Reliability Council, LLC | |
| PAPUC | Pennsylvania Public Utility Commission | |
| PJM | PJM Interconnection LLC | |
| SEC | U.S. Securities and Exchange Commission | |
| Accounting | ||
| ABO | Accumulated Benefit Obligation | |
| ASU | Accounting Standards Update | |
| FASB | Financial Accounting Standards Board | |
| LILO | Lease In/Lease Out | |
| OCI | Other Comprehensive Income | |
| SFAS | Statement of Financial Accounting Standards | |
| VIE | Variable interest entity | |
| Environmental | ||
| CO 2 | Carbon dioxide | |
| GHG | Greenhouse gases | |
| MGP Sites | Manufactured gas plant sites | |
| PCBs | Polychlorinated biphenyls | |
| PRP | Potentially responsible party | |
| SO 2 | Sulfur dioxide | |
| Superfund | Federal Comprehensive Environmental Response, Compensation and Liability Act of 1980 and similar state statutes | |
| 2 |
Table of Contents
| Units of Measure | ||
| AC | Alternating current | |
| dths | Dekatherms | |
| kV | Kilovolt | |
| kWh | Kilowatt-hour | |
| mdths | Thousand dekatherms | |
| MMlbs | Million pounds | |
| MVA | Megavolt ampere | |
| MW | Megawatt or thousand kilowatts | |
| MWH | Megawatt hour | |
| Other | ||
| AFDC | Allowance for funds used during construction | |
| COSO | Committee of Sponsoring Organizations of the Treadway Commission | |
| EMF | Electric and magnetic fields | |
| ERRP | East River Repowering Project | |
| Fitch | Fitch Ratings | |
| First Quarter Form 10-Q | The Companies’ combined Quarterly Report on Form 10-Q for the quarterly period ended March 31, 2012 | |
| Form 10-K | The Companies’ combined Annual Report on Form 10-K for the year ended December 31, 2011 | |
| LTIP | Long Term Incentive Plan | |
| Moody’s | Moody’s Investors Service | |
| S&P | Standard & Poor’s Financial Services LLC | |
| Second Quarter Form 10-Q | The Companies’ combined Quarterly Report on Form 10-Q for the quarterly period ended June 30, 2012 | |
| Third Quarter Form 10-Q | The Companies’ combined Quarterly Report on Form 10-Q for the quarterly period ended September 30, 2012 | |
| VaR | Value-at-Risk |
| 3 |
Table of Contents
| PAGE | ||||||
| PART I—Financial Information | ||||||
| ITEM 1 |
Financial Statements (Unaudited) |
|||||
|
Con Edison |
||||||
| 6 | ||||||
| 7 | ||||||
| 8 | ||||||
| 9 | ||||||
| 11 | ||||||
|
CECONY |
||||||
| 12 | ||||||
| 13 | ||||||
| 14 | ||||||
| 15 | ||||||
| 17 | ||||||
| 18 | ||||||
| ITEM 2 |
Management’s Discussion and Analysis of Financial Condition and Results of Operations |
40 | ||||
| ITEM 3 | 63 | |||||
| ITEM 4 | 63 | |||||
| PART II—Other Information | ||||||
| ITEM 1 | 64 | |||||
| ITEM 1A | 64 | |||||
| ITEM 2 | 64 | |||||
| ITEM 6 | 65 | |||||
| 66 | ||||||
| 4 |
Table of Contents
FORWARD-LOOKING STATEMENTS
This report includes forward-looking statements intended to qualify for the safe-harbor provisions of Section 27A of the Securities Act of 1933, as amended, and Section 21E of the Securities Exchange Act of 1934, as amended. Forward-looking statements are statements of future expectation and not facts. Words such as “expects,” “estimates,” “anticipates,” “intends,” “believes,” “plans,” “will” and similar expressions identify forward-looking statements. Forward-looking statements are based on information available at the time the statements are made, and accordingly speak only as of that time. Actual results or developments might differ materially from those included in the forward-looking statements because of various risks, including:
| • |
the failure to operate energy facilities safely and reliably could adversely affect the Companies; |
| • |
the failure to properly complete construction projects could adversely affect the Companies; |
| • |
the failure of processes and systems and the performance of employees and contractors could adversely affect the Companies; |
| • |
the Companies are extensively regulated and are subject to penalties; |
| • |
the Utilities’ rate plans may not provide a reasonable return; |
| • |
the Companies may be adversely affected by changes to the Utilities’ rate plans; |
| • |
the Companies are exposed to risks from the environmental consequences of their operations; |
| • |
a disruption in the wholesale energy markets or failure by an energy supplier could adversely affect the Companies; |
| • |
the Companies have substantial unfunded pension and other postretirement benefit liabilities; |
| • |
Con Edison’s ability to pay dividends or interest depends on dividends from its subsidiaries; |
| • |
the Companies require access to capital markets to satisfy funding requirements; |
| • |
the Internal Revenue Service has disallowed substantial tax deductions taken by the company; |
| • |
a cyber attack could adversely affect the Companies; and |
| • |
the Companies also face other risks that are beyond their control. |
| 5 |
Table of Contents
| Consolidated Edison, Inc. |
|
For the Three Months
Ended September 30, |
For the Nine Months
Ended September 30, |
|||||||||||||||
| 2012 | 2011 | 2012 | 2011 | |||||||||||||
| (Millions of Dollars/Except Share Data) | ||||||||||||||||
|
OPERATING REVENUES |
||||||||||||||||
|
Electric |
$2,810 | $2,861 | $6,762 | $6,883 | ||||||||||||
|
Gas |
216 | 220 | 1,161 | 1,309 | ||||||||||||
|
Steam |
68 | 76 | 414 | 508 | ||||||||||||
|
Non-utility |
344 | 472 | 950 | 1,272 | ||||||||||||
|
TOTAL OPERATING REVENUES |
3,438 | 3,629 | 9,287 | 9,972 | ||||||||||||
|
OPERATING EXPENSES |
||||||||||||||||
|
Purchased power |
930 | 1,239 | 2,440 | 3,124 | ||||||||||||
|
Fuel |
59 | 73 | 213 | 317 | ||||||||||||
|
Gas purchased for resale |
56 | 73 | 314 | 491 | ||||||||||||
|
Operations and maintenance |
826 | 783 | 2,365 | 2,213 | ||||||||||||
|
Depreciation and amortization |
240 | 222 | 709 | 659 | ||||||||||||
|
Taxes, other than income taxes |
476 | 483 | 1,360 | 1,387 | ||||||||||||
|
TOTAL OPERATING EXPENSES |
2,587 | 2,873 | 7,401 | 8,191 | ||||||||||||
|
OPERATING INCOME |
851 | 756 | 1,886 | 1,781 | ||||||||||||
|
OTHER INCOME (DEDUCTIONS) |
||||||||||||||||
|
Investment and other income |
4 | — | 14 | 19 | ||||||||||||
|
Allowance for equity funds used during construction |
1 | 2 | 3 | 8 | ||||||||||||
|
Other deductions |
(3 | ) | (3 | ) | (13 | ) | (14 | ) | ||||||||
|
TOTAL OTHER INCOME (DEDUCTIONS) |
2 | (1 | ) | 4 | 13 | |||||||||||
|
INCOME BEFORE INTEREST AND INCOME TAX EXPENSE |
853 | 755 | 1,890 | 1,794 | ||||||||||||
|
INTEREST EXPENSE |
||||||||||||||||
|
Interest on long-term debt |
146 | 145 | 440 | 437 | ||||||||||||
|
Other interest |
6 | — | 17 | 15 | ||||||||||||
|
Allowance for borrowed funds used during construction |
— | (1 | ) | (2 | ) | (4 | ) | |||||||||
|
NET INTEREST EXPENSE |
152 | 144 | 455 | 448 | ||||||||||||
|
INCOME BEFORE INCOME TAX EXPENSE |
701 | 611 | 1,435 | 1,346 | ||||||||||||
|
INCOME TAX EXPENSE |
261 | 225 | 501 | 477 | ||||||||||||
|
NET INCOME |
440 | 386 | 934 | 869 | ||||||||||||
|
Preferred stock dividend requirements of subsidiary |
— | (3 | ) | (3 | ) | (9 | ) | |||||||||
|
NET INCOME FOR COMMON STOCK |
$440 | $383 | $931 | $860 | ||||||||||||
|
Net income for common stock per common share—basic |
$1.50 | $1.31 | $3.18 | $2.94 | ||||||||||||
|
Net income for common stock per common share—diluted |
$1.49 | $1.30 | $3.16 | $2.92 | ||||||||||||
|
DIVIDENDS DECLARED PER SHARE OF COMMON STOCK |
$0.605 | $0.600 | $1.815 | $1.800 | ||||||||||||
|
AVERAGE NUMBER OF SHARES OUTSTANDING—BASIC (IN MILLIONS) |
292.9 | 292.9 | 292.9 | 292.5 | ||||||||||||
|
AVERAGE NUMBER OF SHARES OUTSTANDING—DILUTED (IN MILLIONS) |
294.6 | 294.6 | 294.6 | 294.2 | ||||||||||||
The accompanying notes are an integral part of these financial statements.
| 6 |
Table of Contents
| Consolidated Edison, Inc. |
CONSOLIDATED STATEMENT OF COMPREHENSIVE INCOME (UNAUDITED)
|
For the Three Months
Ended September 30, |
For the Nine Months
Ended September 30, |
|||||||||||||||
| 2012 | 2011 | 2012 | 2011 | |||||||||||||
| (Millions of Dollars) | ||||||||||||||||
|
NET INCOME |
$440 | $386 | $934 | $869 | ||||||||||||
|
OTHER COMPREHENSIVE INCOME, NET OF TAXES |
||||||||||||||||
|
Pension plan liability adjustments, net of $1 and $5 taxes in 2012 and $1 and $4 in taxes 2011, respectively |
2 | 2 | 8 | 7 | ||||||||||||
|
TOTAL OTHER COMPREHENSIVE INCOME, NET OF TAXES |
2 | 2 | 8 | 7 | ||||||||||||
|
COMPREHENSIVE INCOME |
$442 | $388 | $942 | $876 | ||||||||||||
|
Preferred stock dividend requirements of subsidiary |
— | (3 | ) | (3 | ) | (9 | ) | |||||||||
|
COMPREHENSIVE INCOME FOR COMMON STOCK |
$442 | $385 | $939 | $867 | ||||||||||||
The accompanying notes are an integral part of these financial statements.
| 7 |
Table of Contents
| Consolidated Edison, Inc. |
|
For the Nine Months
Ended September 30, |
||||||||
| 2012 | 2011 | |||||||
| (Millions of Dollars) | ||||||||
|
OPERATING ACTIVITIES |
||||||||
|
Net Income |
$ 934 | $ 869 | ||||||
|
PRINCIPAL NON-CASH CHARGES/(CREDITS) TO INCOME |
||||||||
|
Depreciation and amortization |
709 | 659 | ||||||
|
Deferred income taxes |
344 | 368 | ||||||
|
Rate case amortization and accruals |
32 | 39 | ||||||
|
Common equity component of allowance for funds used during construction |
(3 | ) | (8 | ) | ||||
|
Net derivative gains |
(61 | ) | (25 | ) | ||||
|
Other non-cash items (net) |
(53 | ) | 6 | |||||
|
CHANGES IN ASSETS AND LIABILITIES |
||||||||
|
Accounts receivable – customers, less allowance for uncollectibles |
(196 | ) | (4 | ) | ||||
|
Materials and supplies, including fuel oil and gas in storage |
1 | (27 | ) | |||||
|
Other receivables and other current assets |
54 | 70 | ||||||
|
Prepayments |
(288 | ) | (128 | ) | ||||
|
Accounts payable |
18 | (50 | ) | |||||
|
Pensions and retiree benefits obligations |
713 | 578 | ||||||
|
Pensions and retiree benefits contributions |
(821 | ) | (579 | ) | ||||
|
Accrued taxes |
(80 | ) | 76 | |||||
|
Accrued interest |
46 | 57 | ||||||
|
Superfund and environmental remediation costs (net) |
7 | — | ||||||
|
Deferred charges, noncurrent assets and other regulatory assets |
183 | 92 | ||||||
|
Deferred credits and other regulatory liabilities |
83 | 158 | ||||||
|
Other liabilities |
16 | 10 | ||||||
|
NET CASH FLOWS FROM OPERATING ACTIVITIES |
1,638 | 2,161 | ||||||
|
INVESTING ACTIVITIES |
||||||||
|
Utility construction expenditures |
(1,450 | ) | (1,404 | ) | ||||
|
Cost of removal less salvage |
(118 | ) | (123 | ) | ||||
|
Non-utility construction expenditures |
(68 | ) | (57 | ) | ||||
|
Acquisition of Alpaugh solar energy projects |
(286 | ) | — | |||||
|
Proceeds from grants related to renewable energy investments |
27 | 4 | ||||||
|
Net investment in Pilesgrove solar project and other |
28 | (31 | ) | |||||
|
NET CASH FLOWS USED IN INVESTING ACTIVITIES |
(1,867 | ) | (1,611 | ) | ||||
|
FINANCING ACTIVITIES |
||||||||
|
Net proceeds from short-term debt |
340 | — | ||||||
|
Preferred stock redemption |
(239 | ) | — | |||||
|
Retirement of long-term debt |
(304 | ) | (3 | ) | ||||
|
Issuance of long-term debt |
400 | — | ||||||
|
Issuance of common shares for stock plans, net of repurchases |
(16 | ) | 41 | |||||
|
Debt issuance costs |
(4 | ) | — | |||||
|
Common stock dividends |
(524 | ) | (519 | ) | ||||
|
Preferred stock dividends |
(3 | ) | (9 | ) | ||||
|
NET CASH FLOWS USED IN FINANCING ACTIVITIES |
(350 | ) | (490 | ) | ||||
|
CASH AND TEMPORARY CASH INVESTMENTS: |
||||||||
|
NET CHANGE FOR THE PERIOD |
(579 | ) | 60 | |||||
|
BALANCE AT BEGINNING OF PERIOD |
648 | 338 | ||||||
|
BALANCE AT END OF PERIOD |
$ 69 | $ 398 | ||||||
|
SUPPLEMENTAL DISCLOSURE OF CASH FLOW INFORMATION |
||||||||
|
Cash paid/(refunded) during the period for: |
||||||||
|
Interest |
$ 379 | $ 371 | ||||||
|
Income taxes |
$ 46 | $ (132 | ) | |||||
The accompanying notes are an integral part of these financial statements.
| 8 |
Table of Contents
| Consolidated Edison, Inc. |
|
September 30,
2012 |
December 31,
2011 |
|||||||
| (Millions of Dollars) | ||||||||
|
ASSETS |
||||||||
|
CURRENT ASSETS |
||||||||
|
Cash and temporary cash investments |
$ 69 | $ 648 | ||||||
|
Accounts receivable – customers, less allowance for uncollectible accounts of $85 and $87 in 2012 and 2011, respectively |
1,319 | 1,123 | ||||||
|
Accrued unbilled revenue |
451 | 474 | ||||||
|
Other receivables, less allowance for uncollectible accounts of $10 in 2012 and 2011 |
216 | 303 | ||||||
|
Fuel oil, gas in storage, materials and supplies, at average cost |
355 | 356 | ||||||
|
Prepayments |
433 | 145 | ||||||
|
Deferred tax assets – current |
113 | 266 | ||||||
|
Regulatory assets |
77 | 164 | ||||||
|
Other current assets |
207 | 159 | ||||||
|
TOTAL CURRENT ASSETS |
3,240 | 3,638 | ||||||
|
INVESTMENTS |
462 | 455 | ||||||
|
UTILITY PLANT, AT ORIGINAL COST |
||||||||
|
Electric |
22,019 | 21,114 | ||||||
|
Gas |
5,009 | 4,734 | ||||||
|
Steam |
2,034 | 1,983 | ||||||
|
General |
2,253 | 1,944 | ||||||
|
TOTAL |
31,315 | 29,775 | ||||||
|
Less: Accumulated depreciation |
6,388 | 6,051 | ||||||
|
Net |
24,927 | 23,724 | ||||||
|
Construction work in progress |
898 | 1,241 | ||||||
|
NET UTILITY PLANT |
25,825 | 24,965 | ||||||
|
NON-UTILITY PLANT |
||||||||
|
Non-utility property, less accumulated depreciation of $66 and $59 in 2012 and 2011, respectively |
99 | 89 | ||||||
|
Construction work in progress |
400 | 39 | ||||||
|
NET PLANT |
26,324 | 25,093 | ||||||
|
OTHER NONCURRENT ASSETS |
||||||||
|
Goodwill |
429 | 429 | ||||||
|
Intangible assets, less accumulated amortization of $3 in 2012 and 2011 |
3 | 3 | ||||||
|
Regulatory assets |
8,897 | 9,337 | ||||||
|
Other deferred charges and noncurrent assets |
278 | 259 | ||||||
|
TOTAL OTHER NONCURRENT ASSETS |
9,607 | 10,028 | ||||||
|
TOTAL ASSETS |
$39,633 | $39,214 | ||||||
The accompanying notes are an integral part of these financial statements.
| 9 |
Table of Contents
| Consolidated Edison, Inc. |
CONSOLIDATED BALANCE SHEET (UNAUDITED)
|
September 30,
2012 |
December 31,
2011 |
|||||||
| (Millions of Dollars) | ||||||||
|
LIABILITIES AND SHAREHOLDERS’ EQUITY |
||||||||
|
CURRENT LIABILITIES |
||||||||
|
Long-term debt due within one year |
$ 930 | $ 530 | ||||||
|
Notes payable |
340 | — | ||||||
|
Accounts payable |
968 | 955 | ||||||
|
Customer deposits |
308 | 303 | ||||||
|
Accrued taxes |
108 | 188 | ||||||
|
Accrued interest |
206 | 160 | ||||||
|
Accrued wages |
88 | 91 | ||||||
|
Fair value of derivative liabilities |
56 | 169 | ||||||
|
Regulatory liabilities |
231 | 118 | ||||||
|
Other current liabilities |
489 | 473 | ||||||
|
TOTAL CURRENT LIABILITIES |
3,724 | 2,987 | ||||||
|
NONCURRENT LIABILITIES |
||||||||
|
Obligations under capital leases |
2 | 2 | ||||||
|
Provision for injuries and damages |
145 | 181 | ||||||
|
Pensions and retiree benefits |
4,039 | 4,835 | ||||||
|
Superfund and other environmental costs |
537 | 489 | ||||||
|
Asset retirement obligations |
149 | 145 | ||||||
|
Fair value of derivative liabilities |
34 | 48 | ||||||
|
Other noncurrent liabilities |
124 | 131 | ||||||
|
TOTAL NONCURRENT LIABILITIES |
5,030 | 5,831 | ||||||
|
DEFERRED CREDITS AND REGULATORY LIABILITIES |
||||||||
|
Deferred income taxes and investment tax credits |
8,026 | 7,563 | ||||||
|
Regulatory liabilities |
1,102 | 977 | ||||||
|
Other deferred credits |
70 | 64 | ||||||
|
TOTAL DEFERRED CREDITS AND REGULATORY LIABILITIES |
9,198 | 8,604 | ||||||
|
LONG-TERM DEBT |
9,839 | 10,143 | ||||||
|
SHAREHOLDERS’ EQUITY |
||||||||
|
Common shareholders’ equity (See Statement of Common Shareholders’ Equity) |
11,842 | 11,436 | ||||||
|
Preferred stock of subsidiary |
— | 213 | ||||||
|
TOTAL SHAREHOLDERS’ EQUITY |
11,842 | 11,649 | ||||||
|
TOTAL LIABILITIES AND SHAREHOLDERS’ EQUITY |
$39,633 | $39,214 | ||||||
The accompanying notes are an integral part of these financial statements.
| 10 |
Table of Contents
| Consolidated Edison, Inc. |
CONSOLIDATED STATEMENT OF COMMON SHAREHOLDERS’ EQUITY (UNAUDITED)
|
Common Stock |
Additional
|
Retained
|
Treasury Stock |
Capital
|
Accumulated
Other Comprehensive Income/(Loss) |
Total |
||||||||||||||||||||||||||||||
| (Millions of Dollars/Except Share Data) | Shares | Amount | Shares | Amount | ||||||||||||||||||||||||||||||||
|
BALANCE AS OF DECEMBER 31, 2010 |
291,616,334 | $31 | $4,915 | $7,220 | 23,210,700 | $(1,001 | ) | $(64 | ) | $(40 | ) | $11,061 | ||||||||||||||||||||||||
|
Net income for common stock |
311 | 311 | ||||||||||||||||||||||||||||||||||
|
Common stock dividends |
(175 | ) | (175 | ) | ||||||||||||||||||||||||||||||||
|
Issuance of common shares – dividend reinvestment and employee stock plans |
656,049 | 1 | 30 | 31 | ||||||||||||||||||||||||||||||||
|
Other comprehensive income |
3 | 3 | ||||||||||||||||||||||||||||||||||
|
BALANCE AS OF MARCH 31, 2011 |
292,272,383 | $32 | $4,945 | $7,356 | 23,210,700 | $(1,001 | ) | $(64 | ) | $(37 | ) | $11,231 | ||||||||||||||||||||||||
|
Net income for common stock |
165 | 165 | ||||||||||||||||||||||||||||||||||
|
Common stock dividends |
(175 | ) | (175 | ) | ||||||||||||||||||||||||||||||||
|
Issuance of common shares – dividend reinvestment and employee stock plans |
603,513 | 32 | (182,942 | ) | 5 | 37 | ||||||||||||||||||||||||||||||
|
Common stock repurchases |
178,942 | (9 | ) | (9 | ) | |||||||||||||||||||||||||||||||
|
Other comprehensive income |
2 | 2 | ||||||||||||||||||||||||||||||||||
|
BALANCE AS OF JUNE 30, 2011 |
292,875,896 | $32 | $4,977 | $7,346 | 23,206,700 | $(1,005 | ) | $(64 | ) | $(35 | ) | $11,251 | ||||||||||||||||||||||||
|
Net income for common stock |
383 | 383 | ||||||||||||||||||||||||||||||||||
|
Common stock dividends |
(176 | ) | (176 | ) | ||||||||||||||||||||||||||||||||
|
Issuance of common shares – dividend reinvestment and employee stock plans |
8,000 | 6 | (554,356 | ) | 19 | 25 | ||||||||||||||||||||||||||||||
|
Common stock repurchases |
546,356 | (31 | ) | (31 | ) | |||||||||||||||||||||||||||||||
|
Other comprehensive income |
2 | 2 | ||||||||||||||||||||||||||||||||||
|
BALANCE AS OF SEPTEMBER 30, 2011 |
292,883,896 | $32 | $4,983 | $7,553 | 23,198,700 | $(1,017 | ) | $(64 | ) | $(33 | ) | $11,454 | ||||||||||||||||||||||||
|
BALANCE AS OF DECEMBER 31, 2011 |
292,888,521 | $32 | $4,991 | $7,568 | 23,194,075 | $(1,033 | ) | $(64 | ) | $(58 | ) | $11,436 | ||||||||||||||||||||||||
|
Net income for common stock |
277 | 277 | ||||||||||||||||||||||||||||||||||
|
Common stock dividends |
(177 | ) | (177 | ) | ||||||||||||||||||||||||||||||||
|
Issuance of common shares for stock plans, net of repurchases |
(7,225 | ) | 7,225 | (2 | ) | (2 | ) | |||||||||||||||||||||||||||||
|
Preferred stock redemption |
4 | 4 | ||||||||||||||||||||||||||||||||||
|
Other comprehensive income |
7 | 7 | ||||||||||||||||||||||||||||||||||
|
BALANCE AS OF MARCH 31, 2012 |
292,881,296 | $32 | $4,991 | $7,668 | 23,201,300 | $(1,035 | ) | $(60 | ) | $(51 | ) | $11,545 | ||||||||||||||||||||||||
|
Net income for common stock |
214 | 214 | ||||||||||||||||||||||||||||||||||
|
Common stock dividends |
(178 | ) | (178 | ) | ||||||||||||||||||||||||||||||||
|
Issuance of common shares for stock plans, net of repurchases |
1,700 | — | (1,700 | ) | — | (1 | ) | (1 | ) | |||||||||||||||||||||||||||
|
Other comprehensive loss |
(1 | ) | (1 | ) | ||||||||||||||||||||||||||||||||
|
BALANCE AS OF JUNE 30, 2012 |
292,882,996 | $32 | $4,991 | $7,704 | 23,199,600 | $(1,035 | ) | $(61 | ) | $(52 | ) | $11,579 | ||||||||||||||||||||||||
|
Net income for common stock |
440 | 440 | ||||||||||||||||||||||||||||||||||
|
Common stock dividends |
(177 | ) | (177 | ) | ||||||||||||||||||||||||||||||||
|
Issuance of common shares for stock plans, net of repurchases |
(11,100 | ) | — | 11,100 | (2 | ) | — | (2 | ) | |||||||||||||||||||||||||||
|
Other comprehensive income |
2 | 2 | ||||||||||||||||||||||||||||||||||
|
BALANCE AS OF September 30, 2012 |
292,871,896 | $32 | $4,991 | $7,967 | 23,210,700 | $(1,037 | ) | $(61 | ) | $(50 | ) | $11,842 | ||||||||||||||||||||||||
The accompanying notes are an integral part of these financial statements.
| 11 |
Table of Contents
| Consolidated Edison Company of New York, Inc. |
CONSOLIDATED INCOME STATEMENT (UNAUDITED)
|
For the Three Months
Ended September 30, |
For the Nine Months
Ended September 30, |
|||||||||||||||
| 2012 | 2011 | 2012 | 2011 | |||||||||||||
| (Millions of Dollars) | ||||||||||||||||
|
OPERATING REVENUES |
||||||||||||||||
|
Electric |
$2,611 | $2,644 | $6,307 | $6,378 | ||||||||||||
|
Gas |
189 | 197 | 1,017 | 1,156 | ||||||||||||
|
Steam |
68 | 76 | 414 | 508 | ||||||||||||
|
TOTAL OPERATING REVENUES |
2,868 | 2,917 | 7,738 | 8,042 | ||||||||||||
|
OPERATING EXPENSES |
||||||||||||||||
|
Purchased power |
604 | 736 | 1,554 | 1,840 | ||||||||||||
|
Fuel |
59 | 73 | 213 | 317 | ||||||||||||
|
Gas purchased for resale |
45 | 57 | 264 | 412 | ||||||||||||
|
Other operations and maintenance |
725 | 678 | 2,065 | 1,906 | ||||||||||||
|
Depreciation and amortization |
225 | 209 | 664 | 618 | ||||||||||||
|
Taxes, other than income taxes |
456 | 462 | 1,300 | 1,330 | ||||||||||||
|
TOTAL OPERATING EXPENSES |
2,114 | 2,215 | 6,060 | 6,423 | ||||||||||||
|
OPERATING INCOME |
754 | 702 | 1,678 | 1,619 | ||||||||||||
|
OTHER INCOME (DEDUCTIONS) |
||||||||||||||||
|
Investment and other income |
2 | (6 | ) | 6 | 3 | |||||||||||
|
Allowance for equity funds used during construction |
— | 1 | 2 | 6 | ||||||||||||
|
Other deductions |
(2 | ) | (3 | ) | (10 | ) | (12 | ) | ||||||||
|
TOTAL OTHER INCOME (DEDUCTIONS) |
— | (8 | ) | (2 | ) | (3 | ) | |||||||||
|
INCOME BEFORE INTEREST AND INCOME TAX EXPENSE |
754 | 694 | 1,676 | 1,616 | ||||||||||||
|
INTEREST EXPENSE |
||||||||||||||||
|
Interest on long-term debt |
130 | 130 | 395 | 393 | ||||||||||||
|
Other interest |
8 | 4 | 19 | 13 | ||||||||||||
|
Allowance for borrowed funds used during construction |
— | (1 | ) | (1 | ) | (3 | ) | |||||||||
|
NET INTEREST EXPENSE |
138 | 133 | 413 | 403 | ||||||||||||
|
INCOME BEFORE INCOME TAX EXPENSE |
616 | 561 | 1,263 | 1,213 | ||||||||||||
|
INCOME TAX EXPENSE |
227 | 205 | 436 | 425 | ||||||||||||
|
NET INCOME |
389 | 356 | 827 | 788 | ||||||||||||
|
Preferred stock dividend requirements |
— | (3 | ) | (3 | ) | (9 | ) | |||||||||
|
NET INCOME FOR COMMON STOCK |
$389 | $353 | $824 | $779 | ||||||||||||
The accompanying notes are an integral part of these financial statements.
| 12 |
Table of Contents
| Consolidated Edison Company of New York, Inc. |
CONSOLIDATED STATEMENT OF COMPREHENSIVE INCOME (UNAUDITED)
|
For the Three Month
Ended September 30, |
For the Nine Month
Ended September 30, |
|||||||||||||||
| 2012 | 2011 | 2012 | 2011 | |||||||||||||
| (Millions of Dollars) | ||||||||||||||||
|
NET INCOME |
$389 | $356 | $827 | $788 | ||||||||||||
|
OTHER COMPREHENSIVE LOSS, NET OF TAXES |
||||||||||||||||
|
Pension plan liability adjustments, net of $(1) taxes in 2012 |
— | — | (2 | ) | — | |||||||||||
|
TOTAL OTHER COMPREHENSIVE LOSS, NET OF TAXES |
— | — | (2 | ) | — | |||||||||||
|
COMPREHENSIVE INCOME |
$389 | $356 | $825 | $788 | ||||||||||||
The accompanying notes are an integral part of these financial statements.
| 13 |
Table of Contents
| Consolidated Edison Company of New York, Inc. |
CONSOLIDATED STATEMENT OF CASH FLOWS (UNAUDITED)
|
For the Nine Months
Ended September 30, |
||||||||
| 2012 | 2011 | |||||||
| (Millions of Dollars) | ||||||||
|
OPERATING ACTIVITIES |
||||||||
|
Net income |
$ 827 | $ 788 | ||||||
|
PRINCIPAL NON-CASH CHARGES/(CREDITS) TO INCOME |
||||||||
|
Depreciation and amortization |
664 | 618 | ||||||
|
Deferred income taxes |
220 | 309 | ||||||
|
Rate case amortization and accruals |
32 | 38 | ||||||
|
Common equity component of allowance for funds used during construction |
(2 | ) | (6 | ) | ||||
|
Other non-cash items (net) |
84 | 60 | ||||||
|
CHANGES IN ASSETS AND LIABILITIES |
||||||||
|
Accounts receivable – customers, less allowance for uncollectibles |
(197 | ) | 3 | |||||
|
Materials and supplies, including fuel oil and gas in storage |
12 | 2 | ||||||
|
Other receivables and other current assets |
(41 | ) | 243 | |||||
|
Prepayments |
(308 | ) | (303 | ) | ||||
|
Accounts payable |
50 | (45 | ) | |||||
|
Pensions and retiree obligations |
639 | 527 | ||||||
|
Pensions and retiree contributions |
(761 | ) | (532 | ) | ||||
|
Accrued taxes |
40 | (7 | ) | |||||
|
Accrued interest |
46 | 46 | ||||||
|
Superfund and environmental remediation costs (net) |
7 | — | ||||||
|
Deferred charges, deferred derivative losses, noncurrent assets and other regulatory assets |
84 | 33 | ||||||
|
Deferred credits and other regulatory liabilities |
88 | 167 | ||||||
|
Other liabilities |
(21 | ) | 19 | |||||
|
NET CASH FLOWS FROM OPERATING ACTIVITIES |
1,463 | 1,960 | ||||||
|
INVESTING ACTIVITIES |
||||||||
|
Utility construction expenditures |
(1,368 | ) | (1,332 | ) | ||||
|
Cost of removal less salvage |
(115 | ) | (118 | ) | ||||
|
NET CASH FLOWS USED IN INVESTING ACTIVITIES |
(1,483 | ) | (1,450 | ) | ||||
|
FINANCING ACTIVITIES |
||||||||
|
Net proceeds from short-term debt |
332 | — | ||||||
|
Preferred stock redemption |
(239 | ) | — | |||||
|
Retirement of long-term debt |
(300 | ) | ||||||
|
Issuance of long-term debt |
400 | — | ||||||
|
Debt issuance costs |
(4 | ) | — | |||||
|
Dividend to parent |
(512 | ) | (509 | ) | ||||
|
Preferred stock dividends |
(3 | ) | (9 | ) | ||||
|
NET CASH FLOWS USED IN FINANCING ACTIVITIES |
(326 | ) | (518 | ) | ||||
|
CASH AND TEMPORARY CASH INVESTMENTS: |
||||||||
|
NET CHANGE FOR THE PERIOD |
(346 | ) | (8 | ) | ||||
|
BALANCE AT BEGINNING OF PERIOD |
372 | 78 | ||||||
|
BALANCE AT END OF PERIOD |
$26 | $70 | ||||||
|
SUPPLEMENTAL DISCLOSURE OF CASH FLOW INFORMATION |
||||||||
|
Cash paid/(refunded) during the period for: |
||||||||
|
Interest |
$ 344 | $ 336 | ||||||
|
Income taxes |
$ 50 | $ (103 | ) | |||||
The accompanying notes are an integral part of these financial statements.
| 14 |
Table of Contents
|
Consolidated Edison Company of New York, Inc. CONSOLIDATED BALANCE SHEET (UNAUDITED) |
|
September 30,
2012 |
December 31,
2011 |
|||||||
| (Millions of Dollars) | ||||||||
|
ASSETS |
||||||||
|
CURRENT ASSETS |
||||||||
|
Cash and temporary cash investments |
$ 26 | $ 372 | ||||||
|
Accounts receivable – customers, less allowance for uncollectible accounts of $79 in 2012 and 2011 |
1,174 | 977 | ||||||
|
Other receivables, less allowance for uncollectible accounts of $9 in 2012 and 2011 |
103 | 102 | ||||||
|
Accrued unbilled revenue |
347 | 366 | ||||||
|
Accounts receivable from affiliated companies |
82 | 54 | ||||||
|
Fuel oil, gas in storage, materials and supplies, at average cost |
296 | 308 | ||||||
|
Prepayments |
393 | 85 | ||||||
|
Regulatory assets |
62 | 140 | ||||||
|
Deferred tax assets – current |
62 | 157 | ||||||
|
Other current assets |
114 | 100 | ||||||
|
TOTAL CURRENT ASSETS |
2,659 | 2,661 | ||||||
|
INVESTMENTS |
203 | 177 | ||||||
|
UTILITY PLANT AT ORIGINAL COST |
||||||||
|
Electric |
20,728 | 19,886 | ||||||
|
Gas |
4,448 | 4,200 | ||||||
|
Steam |
2,034 | 1,983 | ||||||
|
General |
2,081 | 1,785 | ||||||
|
TOTAL |
29,291 | 27,854 | ||||||
|
Less: Accumulated depreciation |
5,834 | 5,523 | ||||||
|
Net |
23,457 | 22,331 | ||||||
|
Construction work in progress |
850 | 1,165 | ||||||
|
NET UTILITY PLANT |
24,307 | 23,496 | ||||||
|
NON-UTILITY PROPERTY |
||||||||
|
Non-utility property, less accumulated depreciation of $25 and $24 in 2012 and 2011, respectively |
4 | 6 | ||||||
|
NET PLANT |
24,311 | 23,502 | ||||||
|
OTHER NONCURRENT ASSETS |
||||||||
|
Regulatory assets |
8,285 | 8,661 | ||||||
|
Other deferred charges and noncurrent assets |
241 | 217 | ||||||
|
TOTAL OTHER NONCURRENT ASSETS |
8,526 | 8,878 | ||||||
|
TOTAL ASSETS |
$35,699 | $35,218 | ||||||
The accompanying notes are an integral part of these financial statements.
| 15 |
Table of Contents
|
Consolidated Edison Company of New York, Inc. CONSOLIDATED BALANCE SHEET (UNAUDITED) |
|
September 30,
2012 |
December 31,
2011 |
|||||||
| (Millions of Dollars) | ||||||||
|
LIABILITIES AND SHAREHOLDER’S EQUITY |
||||||||
|
CURRENT LIABILITIES |
||||||||
|
Long-term debt due within one year |
$ 925 | $ 525 | ||||||
|
Notes payable |
332 | — | ||||||
|
Accounts payable |
772 | 774 | ||||||
|
Accounts payable to affiliated companies |
22 | 16 | ||||||
|
Customer deposits |
295 | 290 | ||||||
|
Accrued taxes |
33 | 32 | ||||||
|
Accrued taxes to affiliated companies |
165 | 126 | ||||||
|
Accrued interest |
179 | 133 | ||||||
|
Accrued wages |
83 | 81 | ||||||
|
Fair value of derivative liabilities |
30 | 98 | ||||||
|
Regulatory liabilities |
199 | 79 | ||||||
|
Other current liabilities |
400 | 396 | ||||||
|
TOTAL CURRENT LIABILITIES |
3,435 | 2,550 | ||||||
|
NONCURRENT LIABILITIES |
||||||||
|
Obligations under capital leases |
2 | 2 | ||||||
|
Provision for injuries and damages |
138 | 173 | ||||||
|
Pensions and retiree benefits |
3,627 | 4,337 | ||||||
|
Superfund and other environmental costs |
423 | 373 | ||||||
|
Asset retirement obligations |
148 | 145 | ||||||
|
Fair value of derivative liabilities |
12 | 24 | ||||||
|
Other noncurrent liabilities |
116 | 120 | ||||||
|
TOTAL NONCURRENT LIABILITIES |
4,466 | 5,174 | ||||||
|
DEFERRED CREDITS AND REGULATORY LIABILITIES |
||||||||
|
Deferred income taxes and investment tax credits |
7,301 | 6,921 | ||||||
|
Regulatory liabilities |
978 | 861 | ||||||
|
Other deferred credits |
67 | 61 | ||||||
|
TOTAL DEFERRED CREDITS AND REGULATORY LIABILITIES |
8,346 | 7,843 | ||||||
|
LONG-TERM DEBT |
8,920 | 9,220 | ||||||
|
SHAREHOLDER’S EQUITY |
||||||||
|
Common shareholder’s equity (See Statement of Common Shareholder’s Equity) |
10,532 | 10,218 | ||||||
|
Preferred stock |
— | 213 | ||||||
|
TOTAL SHAREHOLDER’S EQUITY |
10,532 | 10,431 | ||||||
|
TOTAL LIABILITIES AND SHAREHOLDER’S EQUITY |
$35,699 | $35,218 | ||||||
The accompanying notes are an integral part of these financial statements.
| 16 |
Table of Contents
|
Consolidated Edison Company of New York, Inc. CONSOLIDATED STATEMENT OF COMMON SHAREHOLDER’S EQUITY (UNAUDITED) |
| Common Stock |
Additional
Paid-In Capital |
Retained
Earnings |
Repurchased
Con Edison Stock |
Capital
Stock Expense |
Accumulated
Other Comprehensive Income/(Loss) |
Total | ||||||||||||||||||||||||||
| (Millions of Dollars/Except Share Data) | Shares | Amount | ||||||||||||||||||||||||||||||
|
BALANCE AS OF DECEMBER 31, 2010 |
235,488,094 | $589 | $4,234 | $6,132 | $(962 | ) | $(64 | ) | $ (6 | ) | $ 9,923 | |||||||||||||||||||||
|
Net income |
271 | 271 | ||||||||||||||||||||||||||||||
|
Common stock dividend to parent |
(170 | ) | (170 | ) | ||||||||||||||||||||||||||||
|
Cumulative preferred dividends |
(3 | ) | (3 | ) | ||||||||||||||||||||||||||||
|
Other comprehensive income |
— | — | ||||||||||||||||||||||||||||||
|
BALANCE AS OF MARCH 31, 2011 |
235,488,094 | $589 | $4,234 | $6,230 | $(962 | ) | $(64 | ) | $ (6 | ) | $10,021 | |||||||||||||||||||||
|
Net income |
160 | 160 | ||||||||||||||||||||||||||||||
|
Common stock dividend to parent |
(170 | ) | (170 | ) | ||||||||||||||||||||||||||||
|
Cumulative preferred dividends |
(3 | ) | (3 | ) | ||||||||||||||||||||||||||||
|
Other comprehensive income |
— | — | ||||||||||||||||||||||||||||||
|
BALANCE AS OF JUNE 30, 2011 |
235,488,094 | $589 | $4,234 | $6,217 | $(962 | ) | $(64 | ) | $ (6 | ) | $10,008 | |||||||||||||||||||||
|
Net income |
356 | 356 | ||||||||||||||||||||||||||||||
|
Common stock dividend to parent |
(169 | ) | (169 | ) | ||||||||||||||||||||||||||||
|
Cumulative preferred dividends |
(3 | ) | (3 | ) | ||||||||||||||||||||||||||||
|
Other comprehensive income |
— | — | ||||||||||||||||||||||||||||||
|
BALANCE AS OF SEPTEMBER 30, 2011 |
235,488,094 | $589 | $4,234 | $6,401 | $(962 | ) | $(64 | ) | $ (6 | ) | $10,192 | |||||||||||||||||||||
|
BALANCE AS OF DECEMBER 31, 2011 |
235,488,094 | $589 | $4,234 | $6,429 | $(962 | ) | $(64 | ) | $ (8 | ) | $10,218 | |||||||||||||||||||||
|
Net income |
276 | 276 | ||||||||||||||||||||||||||||||
|
Common stock dividend to parent |
(171 | ) | (171 | ) | ||||||||||||||||||||||||||||
|
Cumulative preferred dividends |
(3 | ) | (3 | ) | ||||||||||||||||||||||||||||
|
Preferred stock redemption |
4 | 4 | ||||||||||||||||||||||||||||||
|
Other comprehensive income |
— | — | ||||||||||||||||||||||||||||||
|
BALANCE AS OF MARCH 31, 2012 |
235,488,094 | $589 | $4,234 | $6,531 | $(962 | ) | $(60 | ) | $ (8 | ) | $10,324 | |||||||||||||||||||||
|
Net income |
163 | 163 | ||||||||||||||||||||||||||||||
|
Common stock dividend to parent |
(171 | ) | (171 | ) | ||||||||||||||||||||||||||||
|
Other comprehensive loss |
(2 | ) | (2 | ) | ||||||||||||||||||||||||||||
|
BALANCE AS OF JUNE 30, 2012 |
235,488,094 | $589 | $4,234 | $6,523 | $(962 | ) | $(60 | ) | $(10 | ) | $10,314 | |||||||||||||||||||||
|
Net income |
389 | 389 | ||||||||||||||||||||||||||||||
|
Common stock dividend to parent |
(171 | ) | (171 | ) | ||||||||||||||||||||||||||||
|
Other comprehensive loss |
— | — | ||||||||||||||||||||||||||||||
|
BALANCE AS OF SEPTEMBER 30, 2012 |
235,488,094 | $589 | $4,234 | $6,741 | $(962 | ) | $(60 | ) | $(10 | ) | $10,532 | |||||||||||||||||||||
The accompanying notes are an integral part of these financial statements.
| 17 |
Table of Contents
NOTES TO THE FINANCIAL STATEMENTS (UNAUDITED)
General
These combined notes accompany and form an integral part of the separate consolidated financial statements of each of the two separate registrants: Consolidated Edison, Inc. and its subsidiaries (Con Edison) and Consolidated Edison Company of New York, Inc. and its subsidiaries (CECONY). CECONY is a subsidiary of Con Edison and as such its financial condition and results of operations and cash flows, which are presented separately in the CECONY consolidated financial statements, are also consolidated, along with those of Con Edison’s other utility subsidiary, Orange and Rockland Utilities, Inc. (O&R), and Con Edison’s competitive energy businesses (discussed below) in Con Edison’s consolidated financial statements. The term “Utilities” is used in these notes to refer to CECONY and O&R.
As used in these notes, the term “Companies” refers to Con Edison and CECONY and, except as otherwise noted, the information in these combined notes relates to each of the Companies. However, CECONY makes no representation as to information relating to Con Edison or the subsidiaries of Con Edison other than itself.
The separate interim consolidated financial statements of each of the Companies are unaudited but, in the opinion of their respective managements, reflect all adjustments (which include only normally recurring adjustments) necessary for a fair presentation of the results for the interim periods presented. The Companies’ separate interim consolidated financial statements should be read together with their separate audited financial statements (including the combined notes thereto) included in Item 8 of their combined Annual Report on Form 10-K for the year ended December 31, 2011 and their separate unaudited financial statements (including the combined notes thereto) included in Part I, Item 1 of their combined Quarterly Reports on Form 10-Q for the quarterly periods ended March 31, 2012 and June 30, 2012. Certain prior period amounts have been reclassified to conform to the current period presentation.
Con Edison has two regulated utility subsidiaries: CECONY and O&R. CECONY provides electric service and gas service in New York City and Westchester County. The company also provides steam service in parts of Manhattan. O&R, along with its regulated utility subsidiaries, provides electric service in southeastern New York and adjacent areas of northern New Jersey and eastern Pennsylvania and gas service in southeastern New York and adjacent areas of eastern Pennsylvania. Con Edison has the following competitive energy businesses: Consolidated Edison Solutions, Inc. (Con Edison Solutions), a retail energy services company that sells electricity and also offers energy-related services; Consolidated Edison Energy, Inc. (Con Edison Energy), a wholesale energy supply and services company; and Consolidated Edison Development, Inc. (Con Edison Development), a company that develops and participates in infrastructure projects.
| 18 |
Table of Contents
Note A — Summary of Significant Accounting Policies
Earnings Per Common Share
For the three and nine months ended September 30, 2012 and 2011, basic and diluted EPS for Con Edison are calculated as follows:
|
For the Three Months
Ended September 30, |
For the Nine Months
Ended September 30, |
|||||||||||||||
| (Millions of Dollars, except per share amounts/Shares in Millions) | 2012 | 2011 | 2012 | 2011 | ||||||||||||
|
Net income for common stock |
$ 440 | $ 383 | $ 931 | $ 860 | ||||||||||||
|
Weighted average common shares outstanding – basic |
292.9 | 292.9 | 292.9 | 292.5 | ||||||||||||
|
Add: Incremental shares attributable to effect of potentially dilutive securities |
1.7 | 1.7 | 1.7 | 1.7 | ||||||||||||
|
Adjusted weighted average common shares outstanding – diluted |
294.6 | 294.6 | 294.6 | 294.2 | ||||||||||||
|
Net income for common stock per common share – basic |
$ 1.50 | $ 1.31 | $ 3.18 | $ 2.94 | ||||||||||||
|
Net income for common stock per common share – diluted |
$ 1.49 | $ 1.30 | $ 3.16 | $ 2.92 | ||||||||||||
Note B — Regulatory Matters
Rate Agreements
CECONY — Electric
In March 2012, the NYSPSC issued an order requiring that the $134 million surcharge that was to have been collected from customers during the rate year ending March 2013 instead be offset using certain CECONY regulatory liabilities that would have otherwise been refundable to or applied for the benefit of customers after the rate year.
O&R — Electric
On February 24, 2012, O&R, the staff of the NYSPSC and the Utility Intervention Unit of New York State’s Division of Consumer Protection entered into a Joint Proposal with respect to the company’s rates for electric delivery service rendered in New York. The Joint Proposal, which the NYSPSC approved in June 2012, covers the three-year period from July 2012 through June 2015. The Joint Proposal provides for electric base rate increases of $19.4 million, $8.8 million and $15.2 million, effective July 2012, 2013 and 2014, respectively, which is being implemented, at the NYSPSC’s option, with increases of $15.2 million effective July 2012 and 2013 and an increase of $13.1 million, together with a surcharge of $2.1 million, effective July 2014. The Joint Proposal reflects the following major items:
| • |
a weighted average cost of capital of 7.61 percent, 7.65 percent and 7.48 percent for the rate years ending June 30, 2013, 2014 and 2015, respectively, reflecting: |
| • |
a return on common equity of 9.4 percent, 9.5 percent and 9.6 percent for the rate years ending June 30, 2013, 2014 and 2015, respectively; |
| • |
cost of long-term debt of 6.07 percent for each of the rate years ending June 30, 2013 and 2014 and 5.64 percent for the rate year ending June 30, 2015; |
| • |
common equity ratio of 48 percent for each of the rate years ending June 30, 2013, 2014 and 2015; and |
| • |
average rate base of $671 million, $708 million and $759 million for the rate years ending June 30, 2013, 2014 and 2015, respectively; |
| • |
sharing with electric customers of any actual earnings, excluding the effects of any penalties and certain other items, above specified percentage returns on common equity (based on the actual average common equity ratio, subject to a 50 percent maximum): |
| • |
the company will allocate to customers the revenue requirement equivalent of 50 percent, 75 percent and 90 percent of any such earnings for each rate year in excess of 80 basis points, 180 basis points and 280 basis points, respectively, above the return on common equity for that rate year indicated above; and |
| • |
the earnings sharing allocation between the company and customers will be on a cumulative basis at the end of rate year three; |
| • |
continuation of a revenue decoupling mechanism; |
| 19 |
Table of Contents
| • |
continuation of a provision which defers as a regulatory liability for the benefit of customers or, subject to certain limitations, a regulatory asset for recovery from customers, as the case may be, the revenue requirement impact of the amount by which actual average net utility plant for each rate year is different than the average net utility plant reflected in rates ($678 million, $704 million and $753 million for the rate years ending June 30, 2013, 2014 and 2015, respectively); |
| • |
continuation of the rate provisions pursuant to which the company recovers its purchased power costs from customers; |
| • |
continuation of rate provisions under which pension and other post-retirement benefit expenses, environmental remediation expenses, tax-exempt debt costs, property taxes and certain other expenses are reconciled to amounts for those expenses reflected in rates; and |
| • |
continuation of provisions for potential operations penalties of up to $3 million annually if certain customer service and system reliability performance targets are not met. |
Other Regulatory Matters
In February 2009, the NYSPSC commenced a proceeding to examine the prudence of certain CECONY expenditures (see “Investigations of Vendor Payments” in Note H). Pursuant to NYSPSC orders, a portion of the company’s revenues (currently, $249 million, $32 million and $6 million on an annual basis for electric, gas and steam service, respectively) is being collected subject to potential refund to customers. At September 30, 2012, the company had collected an estimated $1,031 million from customers subject to potential refund in connection with this proceeding. In October 2010, a NYSPSC consultant reported its $21 million provisional assessment, which the company has disputed, of potential overcharges for construction work. These estimated potential overcharges related to transactions that involved certain employees who were arrested and a contractor that performed work for the company. The company expects that the NYSPSC’s consultant will be reporting an estimate of potential overcharges with respect to a substantial portion of the company’s construction expenditures from January 2000 to January 2009, including expenditures for transactions that did not involve the arrested employees and contractor. The NYSPSC consultant’s estimate is expected to be materially higher than its $21 million provisional assessment. The NYSPSC’s consultant is developing its estimate based on its review of a selection of the construction expenditures and its extrapolation of the results of its review (which the company is disputing). The NYSPSC’s consultant is expected to continue to review the company’s expenditures. At September 30, 2012, the company had a $15 million regulatory liability relating to this matter. The company is unable to estimate the amount, if any, by which any refund required by the NYSPSC may exceed this regulatory liability.
In February 2011, the NYSPSC initiated a proceeding to examine the existing mechanisms pursuant to which utilities recover site investigation and remediation costs and possible alternatives. See Note G.
| 20 |
Table of Contents
Regulatory Assets and Liabilities
Regulatory assets and liabilities at September 30, 2012 and December 31, 2011 were comprised of the following items:
| Con Edison | CECONY | |||||||||||||||
| (Millions of Dollars) | 2012 | 2011 | 2012 | 2011 | ||||||||||||
|
Regulatory assets |
||||||||||||||||
|
Unrecognized pension and other postretirement costs |
$5,211 | $5,852 | $4,972 | $5,554 | ||||||||||||
|
Future income tax |
1,888 | 1,798 | 1,810 | 1,724 | ||||||||||||
|
Environmental remediation costs |
722 | 681 | 607 | 564 | ||||||||||||
|
Pension and other post retirement benefits deferrals |
205 | 198 | 174 | 157 | ||||||||||||
|
Revenue taxes |
177 | 163 | 171 | 158 | ||||||||||||
|
Surcharge for New York State assessment |
135 | 90 | 125 | 82 | ||||||||||||
|
Deferred storm costs |
120 | 128 | 78 | 80 | ||||||||||||
|
Net electric deferrals |
107 | 121 | 107 | 121 | ||||||||||||
|
Deferred derivative losses – long-term |
47 | 60 | 25 | 44 | ||||||||||||
|
O&R transition bond charges |
40 | 44 | — | — | ||||||||||||
|
Preferred stock redemption |
29 | — | 29 | — | ||||||||||||
|
Workers’ compensation |
19 | 23 | 19 | 23 | ||||||||||||
|
Property tax reconciliation |
15 | 13 | — | — | ||||||||||||
|
Recoverable energy costs – long-term |
1 | 14 | 1 | 14 | ||||||||||||
|
Other |
181 | 152 | 167 | 140 | ||||||||||||
|
Regulatory assets – long-term |
8,897 | 9,337 | 8,285 | 8,661 | ||||||||||||
|
Deferred derivative losses – current |
75 | 164 | 62 | 140 | ||||||||||||
|
Recoverable energy costs – current |
2 | — | — | — | ||||||||||||
|
Regulatory assets – current |
77 | 164 | 62 | 140 | ||||||||||||
|
Total Regulatory Assets |
$8,974 | $9,501 | $8,347 | $8,801 | ||||||||||||
|
Regulatory liabilities |
||||||||||||||||
|
Allowance for cost of removal less salvage |
$ 488 | $ 448 | $ 407 | $ 372 | ||||||||||||
|
Property tax reconciliation |
137 | 35 | 137 | 35 | ||||||||||||
|
Net unbilled revenue deferrals |
121 | 104 | 121 | 104 | ||||||||||||
|
World Trade Center settlement proceeds |
62 | 62 | 62 | 62 | ||||||||||||
|
Long-term interest rate reconciliation |
54 | 30 | 54 | 30 | ||||||||||||
|
Carrying charges on transmission and distribution net plant |
36 | 38 | 16 | 14 | ||||||||||||
|
Expenditure prudence proceeding |
15 | 11 | 15 | 11 | ||||||||||||
|
Gas line losses |
14 | 21 | 14 | 21 | ||||||||||||
|
Energy efficiency programs |
5 | 22 | 5 | 20 | ||||||||||||
|
Other |
170 | 206 | 147 | 192 | ||||||||||||
|
Regulatory liabilities – long-term |
1,102 | 977 | 978 | 861 | ||||||||||||
|
Revenue decoupling mechanism |
107 | 66 | 103 | 66 | ||||||||||||
|
Electric surcharge offset |
60 | — | 60 | — | ||||||||||||
|
Refundable energy costs – current |
58 | 51 | 30 | 12 | ||||||||||||
|
Deferred derivative gains – current |
6 | 1 | 6 | 1 | ||||||||||||
|
Regulatory liabilities – current |
231 | 118 | 199 | 79 | ||||||||||||
|
Total Regulatory Liabilities |
$1,333 | $1,095 | $1,177 | $ 940 | ||||||||||||
Note C — Capitalization
In March 2012, CECONY issued $400 million of 4.20 percent 30-year debentures, $239 million of the net proceeds from the sale of which were used to redeem on May 1, 2012 all outstanding shares of its $5 Cumulative Preferred Stock and Cumulative Preferred Stock ($100 par value). In November 2012, CECONY purchased $225 million of its tax-exempt debt that was subject to mandatory tender.
The carrying amounts and fair values of long-term debt are:
| (Millions of Dollars) | September 30, 2012 | December 31, 2011 | ||||||||||||||
| Long-Term Debt (including current portion) |
Carrying Amount |
Fair
Value |
Carrying Amount |
Fair
Value |
||||||||||||
|
Con Edison |
$10,769 | $13,197 | $10,673 | $12,744 | ||||||||||||
|
CECONY |
$ 9,845 | $12,001 | $ 9,745 | $11,593 | ||||||||||||
| 21 |
Table of Contents
Fair values of long-term debt have been estimated primarily using available market information. For Con Edison, $12,561 million and $636 million of the fair value of long-term debt at September 30, 2012 are classified as Level 2 and Level 3, respectively. For CECONY, $11,365 million and $636 million of the fair value of long-term debt at September 30, 2012 are classified as Level 2 and Level 3, respectively (see Note K). The $636 million of long-term debt classified as Level 3 is CECONY’s tax-exempt, auction-rate securities for which the market is highly illiquid and there is a lack of observable inputs.
Note D — Short-Term Borrowing
At September 30, 2012, Con Edison had $340 million of commercial paper outstanding, $332 million of which was outstanding under CECONY’s program. The weighted average interest rate was 0.3 percent for each of Con Edison and CECONY. The Companies have not borrowed under their October 2011 credit agreement. Con Edison had $207 million of letters of credit outstanding under the credit agreement (including $192 million for CECONY).
Note E — Pension Benefits
Net Periodic Benefit Cost
The components of the Companies’ net periodic benefit costs for the three and nine months ended September 30, 2012 and 2011 were as follows:
| For the Three Months Ended September 30, | ||||||||||||||||
| Con Edison | CECONY | |||||||||||||||
| (Millions of Dollars) | 2012 | 2011 | 2012 | 2011 | ||||||||||||
|
Service cost – including administrative expenses |
$ 59 | $ 48 | $ 55 | $ 45 | ||||||||||||
|
Interest cost on projected benefit obligation |
137 | 140 | 128 | 131 | ||||||||||||
|
Expected return on plan assets |
(176 | ) | (184 | ) | (168 | ) | (174 | ) | ||||||||
|
Amortization of net actuarial loss |
177 | 133 | 168 | 126 | ||||||||||||
|
Amortization of prior service costs |
2 | 2 | 2 | — | ||||||||||||
|
NET PERIODIC BENEFIT COST |
$ 199 | $ 139 | $ 185 | $ 128 | ||||||||||||
|
Cost capitalized |
(64 | ) | (45 | ) | (60 | ) | (42 | ) | ||||||||
|
Reconciliation to rate level |
— | (11 | ) | (1 | ) | (11 | ) | |||||||||
|
Cost charged to operating expenses |
$ 135 | $ 83 | $ 124 | $ 75 | ||||||||||||
| For the Nine Months Ended September 30, | ||||||||||||||||
| Con Edison | CECONY | |||||||||||||||
| (Millions of Dollars) | 2012 | 2011 | 2012 | 2011 | ||||||||||||
|
Service cost – including administrative expenses |
$ 177 | $ 142 | $ 165 | $ 133 | ||||||||||||
|
Interest cost on projected benefit obligation |
410 | 420 | 385 | 393 | ||||||||||||
|
Expected return on plan assets |
(528 | ) | (550 | ) | (503 | ) | (524 | ) | ||||||||
|
Amortization of net actuarial loss |
531 | 397 | 503 | 376 | ||||||||||||
|
Amortization of prior service costs |
6 | 6 | 4 | 4 | ||||||||||||
|
NET PERIODIC BENEFIT COST |
$ 596 | $ 415 | $ 554 | $ 382 | ||||||||||||
|
Amortization of regulatory asset |
1 | 1 | 1 | 1 | ||||||||||||
|
TOTAL PERIODIC BENEFIT COST |
$ 597 | $ 416 | $ 555 | $ 383 | ||||||||||||
|
Cost capitalized |
(200 | ) | (141 | ) | (186 | ) | (131 | ) | ||||||||
|
Reconciliation to rate level |
(37 | ) | (68 | ) | (36 | ) | (70 | ) | ||||||||
|
Cost charged to operating expenses |
$ 360 | $ 207 | $ 333 | $ 182 | ||||||||||||
Expected Contributions
The Companies made contributions to the pension plan during 2012 of $775 million (of which $721 million was contributed by CECONY). The Companies’ policy is to fund their pension plan’s accounting cost to the extent tax deductible. During the first nine months of 2012, CECONY also funded $12 million for the non-qualified supplemental plan.
| 22 |
Table of Contents
Note F — Other Postretirement Benefits
Net Periodic Benefit Cost
The components of the Companies’ net periodic postretirement benefit costs for the three and nine months ended September 30, 2012 and 2011 were as follows:
| For the Three Months Ended September 30, | ||||||||||||||||
| Con Edison | CECONY | |||||||||||||||
| (Millions of Dollars) | 2012 | 2011 | 2012 | 2011 | ||||||||||||
|
Service cost |
$ 6 | $ 7 | $ 5 | $ 5 | ||||||||||||
|
Interest cost on accumulated other postretirement benefit obligation |
18 | 20 | 16 | 18 | ||||||||||||
|
Expected return on plan assets |
(21 | ) | (22 | ) | (19 | ) | (21 | ) | ||||||||
|
Amortization of net actuarial loss |
24 | 22 | 22 | 20 | ||||||||||||
|
Amortization of prior service cost |
(5 | ) | (3 | ) | (4 | ) | (3 | ) | ||||||||
|
Amortization of transition obligation |
— | 1 | — | 1 | ||||||||||||
|
NET PERIODIC POSTRETIREMENT BENEFIT COST |
$ 22 | $ 25 | $ 20 | $ 20 | ||||||||||||
|
Cost capitalized |
(8 | ) | (9 | ) | (7 | ) | (7 | ) | ||||||||
|
Reconciliation to rate level |
3 | 3 | 3 | 3 | ||||||||||||
|
Cost charged to operating expenses |
$ 17 | $ 19 | $ 16 | $ 16 | ||||||||||||
| For the Nine Months Ended September 30, | ||||||||||||||||
| Con Edison | CECONY | |||||||||||||||
| (Millions of Dollars) | 2012 | 2011 | 2012 | 2011 | ||||||||||||
|
Service cost |
$ 20 | $ 19 | $ 15 | $ 15 | ||||||||||||
|
Interest cost on accumulated other postretirement benefit obligation |
55 | 62 | 48 | 54 | ||||||||||||
|
Expected return on plan assets |
(64 | ) | (66 | ) | (56 | ) | (59 | ) | ||||||||
|
Amortization of net actuarial loss |
73 | 66 | 65 | 60 | ||||||||||||
|
Amortization of prior service cost |
(16 | ) | (7 | ) | (13 | ) | (9 | ) | ||||||||
|
Amortization of transition obligation |
1 | 3 | 1 | 3 | ||||||||||||
|
NET PERIODIC POSTRETIREMENT BENEFIT COST |
$ 69 | $ 77 | $ 60 | $ 64 | ||||||||||||
|
Cost capitalized |
(24 | ) | (27 | ) | (20 | ) | (22 | ) | ||||||||
|
Reconciliation to rate level |
15 | 12 | 12 | 10 | ||||||||||||
|
Cost charged to operating expenses |
$ 60 | $ 62 | $ 52 | $ 52 | ||||||||||||
Expected Contributions
Con Edison expects to make a contribution of $83 million, including $71 million for CECONY, to the other postretirement benefit plans in 2012. During the first nine months of 2012, Con Edison contributed $34 million to the other postretirement benefit plans (of which $28 million was contributed by CECONY).
Note G — Environmental Matters
Superfund Sites
Hazardous substances, such as asbestos, polychlorinated biphenyls (PCBs) and coal tar, have been used or generated in the course of operations of the Utilities and their predecessors and are present at sites and in facilities and equipment they currently or previously owned, including sites at which gas was manufactured or stored.
The Federal Comprehensive Environmental Response, Compensation and Liability Act of 1980 and similar state statutes (Superfund) impose joint and several liability, regardless of fault, upon generators of hazardous substances for investigation and remediation costs (which include costs of demolition, removal, disposal, storage, replacement, containment, and monitoring) and natural resource damages. Liability under these laws can be material and may be imposed for contamination from past acts, even though such past acts may have been lawful at the time they occurred. The sites at which the Utilities have been asserted to have liability under these laws, including their manufactured gas plant sites and any neighboring areas to which contamination may have migrated, are referred to herein as “Superfund Sites.”
| 23 |
Table of Contents
For Superfund Sites where there are other potentially responsible parties and the Utilities are not managing the site investigation and remediation, the accrued liability represents an estimate of the amount the Utilities will need to pay to investigate and, where determinable, discharge their related obligations. For Superfund Sites (including the manufactured gas plant sites) for which one of the Utilities is managing the investigation and remediation, the accrued liability represents an estimate of the company’s share of undiscounted cost to investigate the sites and, for sites that have been investigated in whole or in part, the cost to remediate the sites, if remediation is necessary and if a reasonable estimate of such cost can be made. Remediation costs are estimated in light of the information available, applicable remediation standards, and experience with similar sites.
The accrued liabilities and regulatory assets related to Superfund Sites at September 30, 2012 and December 31, 2011 were as follows:
| Con Edison | CECONY | |||||||||||||||
| (Millions of Dollars) | 2012 | 2011 | 2012 | 2011 | ||||||||||||
|
Accrued Liabilities: |
||||||||||||||||
|
Manufactured gas plant sites |
$466 | $422 | $352 | $307 | ||||||||||||
|
Other Superfund Sites |
71 | 67 | 71 | 66 | ||||||||||||
|
Total |
$537 | $489 | $423 | $373 | ||||||||||||
|
Regulatory assets |
$722 | $681 | $607 | $564 | ||||||||||||
Most of the accrued Superfund Site liability relates to sites that have been investigated, in whole or in part. However, for some of the sites, the extent and associated cost of the required remediation has not yet been determined. As investigations progress and information pertaining to the required remediation becomes available, the Utilities expect that additional liability may be accrued, the amount of which is not presently determinable but may be material. Under their current rate agreements, the Utilities are permitted to recover or defer as regulatory assets (for subsequent recovery through rates) certain site investigation and remediation costs. In February 2011, the NYSPSC initiated a proceeding to examine the existing mechanisms pursuant to which utilities recover such costs and possible alternatives.
Environmental remediation costs incurred and insurance recoveries received related to Superfund Sites for the three and nine months ended September 30, 2012 and 2011, were as follows:
| For the Three Months Ended September 30, | ||||||||||||||||
| Con Edison | CECONY | |||||||||||||||
| (Millions of Dollars) | 2012 | 2011 | 2012 | 2011 | ||||||||||||
|
Remediation costs incurred |
$3 | $9 | $1 | $9 | ||||||||||||
|
Insurance recoveries received |
— | — | — | — | ||||||||||||
| For the Nine Months Ended September 30, | ||||||||||||||||
| Con Edison | CECONY | |||||||||||||||
| (Millions of Dollars) | 2012 | 2011 | 2012 | 2011 | ||||||||||||
|
Remediation costs incurred |
$18 | $24 | $15 | $22 | ||||||||||||
|
Insurance recoveries received |
— | — | — | — | ||||||||||||
In 2010, CECONY estimated that for its manufactured gas plant sites, its aggregate undiscounted potential liability for the investigation and remediation of coal tar and/or other manufactured gas plant-related environmental contaminants could range up to $1.9 billion. In 2010, O&R estimated that for its manufactured gas plant sites, each of which has been investigated, the aggregate undiscounted potential liability for the remediation of such contaminants could range up to $200 million. These estimates were based on the assumption that there is contamination at all sites, including those that have not yet been fully investigated and additional assumptions about the extent of the contamination and the type and extent of the remediation that may be required. Actual experience may be materially different.
Asbestos Proceedings
Suits have been brought in New York State and federal courts against the Utilities and many other defendants, wherein a large number of plaintiffs sought large amounts of compensatory and punitive damages for deaths and injuries allegedly caused by exposure to asbestos at various premises of the Utilities. The suits that have been resolved, which are many, have been resolved without any payment by the Utilities, or for amounts that were not, in the aggregate, material to them. The amounts specified in all the remaining
| 24 |
Table of Contents
thousands of suits total billions of dollars; however, the Utilities believe that these amounts are greatly exaggerated, based on the disposition of previous claims. In 2010, CECONY estimated that its aggregate undiscounted potential liability for these suits and additional suits that may be brought over the next 15 years is $10 million. The estimate was based upon a combination of modeling, historical data analysis and risk factor assessment. Actual experience may be materially different. In addition, certain current and former employees have claimed or are claiming workers’ compensation benefits based on alleged disability from exposure to asbestos. Under its current rate agreements, CECONY is permitted to defer as regulatory assets (for subsequent recovery through rates) costs incurred for its asbestos lawsuits and workers’ compensation claims. The accrued liability for asbestos suits and workers’ compensation proceedings (including those related to asbestos exposure) and the amounts deferred as regulatory assets for the Companies at September 30, 2012 and December 31, 2011 were as follows:
| Con Edison | CECONY | |||||||||||||||
| (Millions of Dollars) | 2012 | 2011 | 2012 | 2011 | ||||||||||||
|
Accrued liability – asbestos suits |
$10 | $10 | $10 | $10 | ||||||||||||
|
Regulatory assets – asbestos suits |
$10 | $10 | $10 | $10 | ||||||||||||
|
Accrued liability – workers’ compensation |
$94 | $98 | $89 | $93 | ||||||||||||
|
Regulatory assets – workers’ compensation |
$19 | $23 | $19 | $23 | ||||||||||||
Note H — Other Material Contingencies
Manhattan Steam Main Rupture
In July 2007, a CECONY steam main located in midtown Manhattan ruptured. It has been reported that one person died and others were injured as a result of the incident. Several buildings in the area were damaged. Debris from the incident included dirt and mud containing asbestos. The response to the incident required the closing of several buildings and streets for various periods. Approximately 93 suits are pending against the company seeking generally unspecified compensatory and, in some cases, punitive damages, for personal injury, property damage and business interruption. The company has not accrued a liability for the suits. The company has notified its insurers of the incident and believes that the policies in force at the time of the incident will cover most of the company’s costs, which the company is unable to estimate, but which could be substantial, to satisfy its liability to others in connection with the incident.
Investigations of Vendor Payments
In January 2009, CECONY commenced an internal investigation relating to the arrests of certain employees and retired employees (all of whom have since been convicted) for accepting kickbacks from contractors that performed construction work for the company. The company has retained a law firm, which has retained an accounting firm, to assist in the company’s investigation. The company has provided information to governmental authorities, which consider the company to be a victim of unlawful conduct, in connection with their investigation of the arrested employees and contractors. The company has terminated its employment of the arrested employees and its contracts with the contractors. In February 2009, the NYSPSC commenced a proceeding that, among other things, will examine the prudence of certain of the company’s expenditures relating to the arrests and consider whether additional expenditures should also be examined (see “Other Regulatory Matters” in Note B).
CECONY is also investigating the September 2010 arrest of a retired employee (who has since been convicted of participating in a bribery scheme in which the employee received payments from two companies that supplied materials to the company) and the January 2011 arrest of an employee (for accepting kickbacks from an engineering firm that performed work for the company). CECONY has provided information to governmental authorities in connection with their ongoing investigations of these matters.
The company, based upon its evaluation of its internal controls for 2011 and previous years, believes that the controls were effective to provide reasonable assurance that its financial statements have been fairly presented, in all material respects, in conformity with generally accepted accounting principles. Because the company’s investigations are ongoing, the company is unable to predict the impact of any of the employees’ unlawful
| 25 |
Table of Contents
conduct on the company’s internal controls, business, results of operations or financial position.
Lease In/Lease Out Transactions
In each of 1997 and 1999, Con Edison Development entered into a transaction in which it leased property and then immediately subleased it back to the lessor (termed “Lease In/Lease Out,” or LILO transactions). The transactions respectively involve electric generating and gas distribution facilities in the Netherlands, with a total investment of $259 million. The transactions were financed with $93 million of equity and $166 million of non-recourse, long-term debt secured by the underlying assets. In accordance with the accounting rules for leases, Con Edison is accounting for the two LILO transactions as leveraged leases. Accordingly, the company’s investment in these leases, net of non-recourse debt, is carried as a single amount in Con Edison’s consolidated balance sheet and income is recognized pursuant to a method that incorporates a level rate of return for those years when net investment in the lease is positive, based upon the after-tax cash flows projected at the inception of the leveraged leases. The company’s investment in these leveraged leases was $(73) million at September 30, 2012 and $(55) million at December 31, 2011 and is comprised of a $228 million gross investment less $301 million of deferred tax liabilities at September 30, 2012 and $234 million gross investment less $289 million of deferred tax liabilities at December 31, 2011.
On audit of Con Edison’s tax return for 1997, the IRS disallowed the tax losses in connection with the 1997 LILO transaction. In December 2005, Con Edison paid a $0.3 million income tax deficiency asserted by the IRS for the tax year 1997 with respect to the 1997 LILO transaction. In April 2006, the company paid interest of $0.2 million associated with the deficiency and commenced an action in the United States Court of Federal Claims, entitled Consolidated Edison Company of New York, Inc. v. United States, to obtain a refund of this tax payment and interest. A trial was completed in November 2007. In October 2009, the court issued a decision in favor of the company concluding that the 1997 LILO transaction was, in substance, a true lease that possessed economic substance, the loans relating to the lease constituted bona fide indebtedness, and the deductions for the 1997 LILO transactions claimed by the company in its 1997 federal income tax return are allowable. The IRS appealed the decision in December 2011. Oral argument on the appeal is scheduled to be held in November 2012.
In connection with its audit of Con Edison’s federal income tax returns for 1998 through 2007, the IRS disallowed $416 million of net tax deductions taken with respect to both of the LILO transactions for the tax years. Con Edison is pursuing administrative appeals of these audit level disallowances. In connection with its audit of Con Edison’s federal income tax returns for 2011, 2010, 2009 and 2008, the IRS has disallowed $35 million, $40 million, $41 million and $42 million, respectively, of net tax deductions taken with respect to both of the LILO transactions. When these audit level disallowances become appealable, Con Edison intends to file an appeal of the disallowances.
Con Edison believes that its LILO transactions have been correctly reported, and has not recorded any reserve with respect to the disallowance of tax losses, or related interest, in connection with its LILO transactions. Con Edison’s estimated tax savings, reflected in its financial statements, from the two LILO transactions through September 30, 2012, in the aggregate, was $248 million. If Con Edison were required to repay all or a portion of these amounts, it would also be required to pay interest of up to $122 million net of tax at September 30, 2012.
Pursuant to the accounting rules for leveraged lease transactions, the expected timing of income tax cash flows generated by Con Edison’s LILO transactions are required to be reviewed at least annually. If the expected timing of the cash flows is revised, the rate of return and the allocation of income would be recalculated from the inception of the LILO transactions, and the company would be required to recalculate the accounting effect of the LILO transactions, which would result in a charge to earnings that could have a material adverse effect on the company’s results of operations.
| 26 |
Table of Contents
Guarantees
Con Edison and its subsidiaries enter into various agreements providing financial or performance assurance primarily to third parties on behalf of their subsidiaries. Maximum amounts guaranteed by Con Edison totaled $823 million and $760 million at September 30, 2012 and December 31, 2011, respectively.
A summary, by type and term, of Con Edison’s total guarantees at September 30, 2012 is as follows:
| Guarantee Type | 0 – 3 years | 4 – 10 years | > 10 years | Total | ||||||||||||
| (Millions of Dollars) | ||||||||||||||||
|
Energy transactions |
$696 | $2 | $66 | $764 | ||||||||||||
|
Intra-company guarantees |
15 | — | 1 | 16 | ||||||||||||
|
Other guarantees |
38 | 5 | — | 43 | ||||||||||||
|
TOTAL |
$749 | $7 | $67 | $823 | ||||||||||||
Energy Transactions — Con Edison guarantees payments on behalf of its competitive energy businesses in order to facilitate physical and financial transactions in gas, pipeline capacity, transportation, oil, electricity and energy services. To the extent that liabilities exist under the contracts subject to these guarantees, such liabilities are included in Con Edison’s consolidated balance sheet.
Intra-company Guarantees — Con Edison guarantees electricity sales made by Con Edison Energy and Con Edison Solutions to O&R and CECONY.
Other Guarantees — Con Edison and Con Edison Development also guarantee the following:
| • |
$7 million relates to guarantees issued by Con Edison to CECONY covering a former Con Edison subsidiary’s lease payment to use CECONY’s conduit system in accordance with a tariff approved by the NYSPSC and a guarantee issued by Con Edison to a landlord to guarantee the former subsidiary’s obligations under a building lease. The former subsidiary is obligated to reimburse Con Edison for any payments made under these guarantees. This obligation is fully secured by letters of credit; |
| • |
$25 million for guarantees provided by Con Edison to Travelers Insurance Company for indemnity agreements for surety bonds in connection with energy service projects performed by Con Edison Solutions; |
| • |
$11 million for guarantees provided by Con Edison Development to Travelers Insurance Company for indemnity agreements for surety bonds in connection with the construction and operation of solar facilities performed by its subsidiaries; and |
| • |
Con Edison, on behalf of Con Edison Solutions, as a retail electric provider, issued a guarantee to the Public Utility Commission of Texas with no specified limitation on the amount guaranteed, covering the payment of all obligations of a retail electric provider. Con Edison’s estimate of the maximum potential obligation is $5 million as of September 30, 2012. |
| 27 |
Table of Contents
Note I — Financial Information by Business Segment
The financial data for the business segments are as follows:
| For the Three Months Ended September 30, | ||||||||||||||||||||||||||||||||
|
Operating revenues |
Inter-segment
revenues |
Depreciation and
amortization |
Operating income |
|||||||||||||||||||||||||||||
| (Millions of Dollars) | 2012 | 2011 | 2012 | 2011 | 2012 | 2011 | 2012 | 2011 | ||||||||||||||||||||||||
|
CECONY |
||||||||||||||||||||||||||||||||
|
Electric |
$2,611 | $2,644 | $ 4 | $ 3 | $179 | $166 | $812 | $758 | ||||||||||||||||||||||||
|
Gas |
189 | 197 | 1 | 1 | 31 | 28 | (21 | ) | (23 | ) | ||||||||||||||||||||||
|
Steam |
68 | 76 | 20 | 20 | 15 | 15 | (37 | ) | (33 | ) | ||||||||||||||||||||||
|
Consolidation adjustments |
— | — | (25 | ) | (24 | ) | — | — | — | — | ||||||||||||||||||||||
|
Total CECONY |
$2,868 | $2,917 | $ — | $ — | $225 | $209 | $754 | $702 | ||||||||||||||||||||||||
|
O&R |
||||||||||||||||||||||||||||||||
|
Electric |
$ 199 | $ 217 | $ — | $ — | $ 10 | $ 9 | $ 50 | $ 44 | ||||||||||||||||||||||||
|
Gas |
27 | 24 | — | — | 3 | 3 | (6 | ) | (6 | ) | ||||||||||||||||||||||
|
Total O&R |
$ 226 | $ 241 | $ — | $ — | $ 13 | $ 12 | $ 44 | $ 38 | ||||||||||||||||||||||||
|
Competitive energy businesses |
$ 344 | $ 472 | $ 2 | $ 3 | $ 2 | $ 1 | $ 53 | $ 16 | ||||||||||||||||||||||||
|
Other* |
— | (1 | ) | (2 | ) | (3 | ) | — | — | — | — | |||||||||||||||||||||
|
Total Con Edison |
$3,438 | $3,629 | $ — | $ — | $240 | $222 | $851 | $756 | ||||||||||||||||||||||||
| * | Parent company expenses, primarily interest, and consolidation adjustments. Other does not represent a business segment. |
| For the Nine Months Ended September 30, | ||||||||||||||||||||||||||||||||
|
Operating revenues |
Inter-segment
revenues |
Depreciation and
amortization |
Operating income |
|||||||||||||||||||||||||||||
| (Millions of Dollars) | 2012 | 2011 | 2012 | 2011 | 2012 | 2011 | 2012 | 2011 | ||||||||||||||||||||||||
|
CECONY |
||||||||||||||||||||||||||||||||
|
Electric |
$6,307 | $6,378 | $ 11 | $ 9 | $527 | $489 | $1,383 | $1,326 | ||||||||||||||||||||||||
|
Gas |
1,017 | 1,156 | 4 | 4 | 89 | 82 | 255 | 212 | ||||||||||||||||||||||||
|
Steam |
414 | 508 | 58 | 59 | 48 | 47 | 40 | 81 | ||||||||||||||||||||||||
|
Consolidation adjustments |
— | — | (73 | ) | (72 | ) | — | — | — | — | ||||||||||||||||||||||
|
Total CECONY |
$7,738 | $8,042 | $ — | $ — | $664 | $618 | $1,678 | $1,619 | ||||||||||||||||||||||||
|
O&R |
||||||||||||||||||||||||||||||||
|
Electric |
$ 457 | $ 507 | $ — | $ — | $ 28 | $ 26 | $ 74 | $ 69 | ||||||||||||||||||||||||
|
Gas |
144 | 153 | — | — | 11 | 10 | 26 | 22 | ||||||||||||||||||||||||
|
Total O&R |
$ 601 | $ 660 | $ — | $ — | $ 39 | $ 36 | $ 100 | $ 91 | ||||||||||||||||||||||||
|
Competitive energy businesses |
$ 954 | $1,286 | $ 6 | $ 9 | $ 6 | $ 5 | $ 111 | $ 75 | ||||||||||||||||||||||||
|
Other* |
(6 | ) | (16 | ) | (6 | ) | (9 | ) | — | — | (3 | ) | (4 | ) | ||||||||||||||||||
|
Total Con Edison |
$9,287 | $9,972 | $ — | $ — | $709 | $659 | $1,886 | $1,781 | ||||||||||||||||||||||||
| * | Parent company expenses, primarily interest, and consolidation adjustments. Other does not represent a business segment. |
In July 2012, Con Edison Development purchased a company that is developing 70 MW (AC) of solar energy projects in Alpaugh, California (Alpaugh). Electricity generated by the projects is to be purchased by Pacific Gas and Electric Company pursuant to long-term power purchase agreements (PPA). Alpaugh was purchased for $288 million, including contingent consideration of $2 million, of which $284 million has been allocated to construction work in progress and $4 million to deposits relating to the PPA and interconnection agreements. The total cost to acquire and construct these projects is estimated to be $350 million.
In October 2012, Con Edison Development purchased two companies that are developing 40 MW (AC) of solar energy projects in Tulare and Kings County, California. Electricity generated by the projects is to be purchased by Pacific Gas and Electric Company pursuant to long-term PPAs. The projects were purchased for approximately $51 million, of which $39 million has been allocated to construction work in progress and $12 million to deposits relating to the PPA and interconnection agreements. The total cost to acquire and construct these projects is estimated to be $200 million.
| 28 |
Table of Contents
Note J — Derivative Instruments and Hedging Activities
Under the accounting rules for derivatives and hedging, derivatives are recognized on the balance sheet at fair value, unless an exception is available under the accounting rules. Certain qualifying derivative contracts have been designated as normal purchases or normal sales contracts. These contracts are not reported at fair value under the accounting rules.
Energy Price Hedging
Con Edison’s subsidiaries hedge market price fluctuations associated with physical purchases and sales of electricity, natural gas, and steam by using derivative instruments, including futures, forwards, basis swaps, options, transmission congestion contracts and financial transmission rights contracts. The fair values of the Companies’ commodity derivatives at September 30, 2012 and December 31, 2011 were as follows:
| Con Edison | CECONY | |||||||||||||||
| (Millions of Dollars) | 2012 | 2011 | 2012 | 2011 | ||||||||||||
|
Fair value of net derivative assets/(liabilities) – gross |
$(92 | ) | $(249 | ) | $(48 | ) | $(144 | ) | ||||||||
|
Impact of netting of cash collateral |
59 | 110 | 33 | 46 | ||||||||||||
|
Fair value of net derivative assets/(liabilities) – net |
$(33 | ) | $(139 | ) | $(15 | ) | $ (98 | ) | ||||||||
Credit Exposure
The Companies are exposed to credit risk related to transactions entered into primarily for the various energy supply and hedging activities by the Utilities and the competitive energy businesses. The Companies use credit policies to manage this risk, including an established credit approval process, monitoring of counterparty limits, netting provisions within agreements, collateral or prepayment arrangements, credit insurance and credit default swaps.
At September 30, 2012, Con Edison and CECONY had $118 million and $13 million of credit exposure in connection with energy supply and hedging activities, net of collateral, respectively. Con Edison’s net credit exposure consisted of $44 million with investment-grade counterparties, $25 million with commodity exchange brokers, $47 million with independent system operators and $2 million with non-rated counterparties. CECONY’s net credit exposure consisted of $3 million with investment-grade counterparties and $10 million with commodity exchange brokers.
Economic Hedges
The Companies enter into certain derivative instruments that do not qualify or are not designated as hedges under the accounting rules for derivatives and hedging. However, management believes these instruments represent economic hedges that mitigate exposure to fluctuations in commodity prices.
The fair values of the Companies’ commodity derivatives at September 30, 2012 were:
| (Millions of Dollars) |
Fair Value of Commodity Derivatives (a)
Balance Sheet Location |
Con
Edison |
CECONY | |||||||
| Derivative Assets | ||||||||||
|
Current |
Other current assets | $ 91 | $ 30 | |||||||
|
Long-term |
Other deferred charges and non-current assets | 19 | 10 | |||||||
|
Total derivative assets |
$ 110 | $ 40 | ||||||||
|
Impact of netting |
(59 | ) | (13 | ) | ||||||
|
Net derivative assets |
$ 51 | $ 27 | ||||||||
| Derivative Liabilities | ||||||||||
|
Current |
Fair value of derivative liabilities | $ 149 | $ 60 | |||||||
|
Long-term |
Fair value of derivative liabilities | 53 | 28 | |||||||
|
Total derivative liabilities |
$ 202 | $ 88 | ||||||||
|
Impact of netting |
(118 | ) | (46 | ) | ||||||
|
Net derivative liabilities |
$ 84 | $ 42 | ||||||||
| (a) | Qualifying derivative contracts, which have been designated as normal purchases or normal sales contracts, are not reported at fair value under the accounting rules for derivatives and hedging and, therefore, are excluded from the table. |
| 29 |
Table of Contents
The fair values of the Companies’ commodity derivatives at December 31, 2011 were:
| (Millions of Dollars) |
Fair Value of Commodity Derivatives (a)
Balance Sheet Location |
Con
Edison |
CECONY | |||||||
| Derivative Assets | ||||||||||
|
Current |
Other current assets | $ 139 | $ 16 | |||||||
|
Long-term |
Other deferred charges and non-current assets | 26 | 14 | |||||||
|
Total derivative assets |
$ 165 | $ 30 | ||||||||
|
Impact of netting |
(95 | ) | (6 | ) | ||||||
|
Net derivative assets |
$ 70 | $ 24 | ||||||||
| Derivative Liabilities | ||||||||||
|
Current |
Fair value of derivative liabilities | $ 331 | $127 | |||||||
|
Long-term |
Fair value of derivative liabilities | 83 | 48 | |||||||
|
Total derivative liabilities |
$ 414 | $175 | ||||||||
|
Impact of netting |
(205 | ) | (53 | ) | ||||||
|
Net derivative liabilities |
$ 209 | $122 | ||||||||
| (a) | Qualifying derivative contracts, which have been designated as normal purchases or normal sales contracts, are not reported at fair value under the accounting rules for derivatives and hedging and, therefore, are excluded from the table. |
The Utilities generally recover all of their prudently incurred fuel, purchased power and gas cost, including hedging gains and losses, in accordance with rate provisions approved by the applicable state utility commissions. In accordance with the accounting rules for regulated operations, the Utilities record a regulatory asset or liability to defer recognition of unrealized gains and losses on their electric and gas derivatives. As gains and losses are realized in future periods, they will be recognized as purchased power, gas and fuel costs in the Companies’ consolidated income statements. Con Edison’s competitive energy businesses record realized and unrealized gains and losses on their derivative contracts in earnings in the reporting period in which they occur.
The following tables present the changes in the fair values of commodity derivatives that have been deferred or recognized in earnings for the three and nine months ended September 30, 2012:
|
Realized and Unrealized Gains/(Losses) on Commodity Derivatives (a) Deferred or Recognized in Income for the Three Months Ended September 30, 2012 |
||||||||||
| (Millions of Dollars) | Balance Sheet Location |
Con
Edison |
CECONY | |||||||
|
Pre-tax gains/(losses) deferred in accordance with accounting rules for regulated operations: |
|
|||||||||
|
Current |
Deferred derivative gains | $ 5 | $ 5 | |||||||
|
Long-term |
Deferred derivative gains | 1 | 1 | |||||||
|
Total deferred gains/(losses) |
$ 6 | $ 6 | ||||||||
|
Current |
Deferred derivative losses | $ 51 | $ 42 | |||||||
|
Current |
Recoverable energy costs | (60 | ) | (52 | ) | |||||
|
Long-term |
Deferred derivative losses | 22 | 20 | |||||||
|
Total deferred gains/(losses) |
$ 13 | $ 10 | ||||||||
|
Net deferred gains/(losses) |
$ 19 | $ 16 | ||||||||
| Income Statement Location | ||||||||||
|
Pre-tax gain/(loss) recognized in income |
|
|||||||||
| Purchased power expense | $ 9 | (b) | $ — | |||||||
| Gas purchased for resale | — | — | ||||||||
| Non-utility revenue | 1 | (b) | — | |||||||
|
Total pre-tax gain/(loss) recognized in income |
$ 10 | $ — | ||||||||
| (a) | Qualifying derivative contracts, which have been designated as normal purchases or normal sales contracts, are not reported at fair value under the accounting rules for derivatives and hedging and, therefore, are excluded from the table. |
| (b) | For the three months ended September 30, 2012, Con Edison recorded in purchased power expense an unrealized pre-tax gain/(loss) of $30 million. |
| 30 |
Table of Contents
|
Realized and Unrealized Gains/(Losses) on Commodity Derivatives (a) Deferred or Recognized in Income for the Nine Months Ended September 30, 2012 |
||||||||||
| (Millions of Dollars) | Balance Sheet Location |
Con
Edison |
CECONY | |||||||
|
Pre-tax gains/(losses) deferred in accordance with accounting rules for regulated operations: |
|
|||||||||
|
Current |
Deferred derivative gains | $ 5 | $ 5 | |||||||
|
Long-term |
Deferred derivative gains | 1 | 1 | |||||||
|
Total deferred gains/(losses) |
$ 6 | $ 6 | ||||||||
|
Current |
Deferred derivative losses | $ 89 | $ 78 | |||||||
|
Current |
Recoverable energy costs | (187 | ) | (164 | ) | |||||
|
Long-term |
Deferred derivative losses | 13 | 19 | |||||||
|
Total deferred gains/(losses) |
$ (85 | ) | $ (67 | ) | ||||||
|
Net deferred gains/(losses) |
$ (79 | ) | $ (61 | ) | ||||||
| Income Statement Location | ||||||||||
|
Pre-tax gain/(loss) recognized in income |
|
|||||||||
| Purchased power expense | $ (49 | )(b) | $ — | |||||||
| Gas purchased for resale | (2 | ) | — | |||||||
| Non-utility revenue | (11 | )(b) | — | |||||||
|
Total pre-tax gain/(loss) recognized in income |
$ (62 | ) | $ — | |||||||
| (a) | Qualifying derivative contracts, which have been designated as normal purchases or normal sales contracts, are not reported at fair value under the accounting rules for derivatives and hedging and, therefore, are excluded from the table. |
| (b) | For the nine months ended September 30, 2012, Con Edison recorded in non-utility revenues and purchased power expense an unrealized pre-tax gain/(loss) of $(13) million and $75 million, respectively. |
The following tables present the changes in the fair values of commodity derivatives that have been deferred or recognized in earnings for the three and nine months ended September 30, 2011:
|
Realized and Unrealized Gains/(Losses) on Commodity Derivatives (a) Deferred or Recognized in Income for the Three Months Ended September 30, 2011 |
||||||||||
| (Millions of Dollars) | Balance Sheet Location |
Con
Edison |
CECONY | |||||||
|
Pre-tax gains/(losses) deferred in accordance with accounting rules for regulated operations: |
|
|||||||||
|
Current |
Deferred derivative gains | $ (2 | ) | $ (1 | ) | |||||
|
Long-term |
Regulatory liabilities | 1 | 1 | |||||||
|
Total deferred gains/(losses) |
$ (1 | ) | $ — | |||||||
|
Current |
Deferred derivative losses | $ 12 | $ 7 | |||||||
|
Current |
Recoverable energy costs | (75 | ) | (53 | ) | |||||
|
Long-term |
Regulatory assets | 10 | 6 | |||||||
|
Total deferred gains/(losses) |
$(53 | ) | $(40 | ) | ||||||
|
Net deferred gains/(losses) |
$(54 | ) | $(40 | ) | ||||||
| Income Statement Location | ||||||||||
|
Pre-tax gain/(loss) recognized in income |
|
|||||||||
| Purchased power expense | $ 29 | (b) | $ — | |||||||
| Gas purchased for resale | 6 | — | ||||||||
| Non-utility revenue | 5 | (b) | — | |||||||
|
Total pre-tax gain/(loss) recognized in income |
$ 40 | $ — | ||||||||
| (a) | Qualifying derivative contracts, which have been designated as normal purchases or normal sales contracts, are not reported at fair value under the accounting rules for derivatives and hedging and, therefore, are excluded from the table. |
| (b) | For the three months ended September 30, 2011, Con Edison recorded in non-utility revenues and purchased power expense an unrealized pre-tax gain/(loss) of $(10) million and $(1) million, respectively. |
| 31 |
Table of Contents
|
Realized and Unrealized Gains/(Losses) on Commodity Derivatives (a) Deferred or Recognized in Income for the Nine Months Ended September 30, 2011 |
||||||||||
| (Millions of Dollars) | Balance Sheet Location |
Con
Edison |
CECONY | |||||||
|
Pre-tax gains/(losses) deferred in accordance with accounting rules for regulated operations: |
|
|||||||||
|
Current |
Deferred derivative gains | $ — | $ — | |||||||
|
Long-term |
Regulatory liabilities | 3 | 3 | |||||||
|
Total deferred gains/(losses) |
$ 3 | $ 3 | ||||||||
|
Current |
Deferred derivative losses | $ 80 | $ 60 | |||||||
|
Current |
Recoverable energy costs | (177 | ) | (134 | ) | |||||
|
Long-term |
Regulatory assets | 38 | 27 | |||||||
|
Total deferred gains/(losses) |
$ (59 | ) | $ (47 | ) | ||||||
|
Net deferred gains/(losses) |
$ (56 | ) | $ (44 | ) | ||||||
| Income Statement Location | ||||||||||
|
Pre-tax gain/(loss) recognized in income |
|
|||||||||
| Purchased power expense | $ 81 | (b) | $ — | |||||||
| Gas purchased for resale | 17 | — | ||||||||
| Non-utility revenue | 22 | (b) | — | |||||||
|
Total pre-tax gain/(loss) recognized in income |
$ 120 | $ — | ||||||||
| (a) | Qualifying derivative contracts, which have been designated as normal purchases or normal sales contracts, are not reported at fair value under the accounting rules for derivatives and hedging and, therefore, are excluded from the table. |
| (b) | For the nine months ended September 30, 2011, Con Edison recorded in non-utility revenues and purchased power expense an unrealized pre-tax gain/(loss) of $(35) million and $59 million, respectively. |
As of September 30, 2012, Con Edison had 1,289 contracts, including 628 CECONY contracts, which were considered to be derivatives under the accounting rules for derivatives and hedging (excluding qualifying derivative contracts, which have been designated as normal purchases or normal sales contracts). The following table presents the number of contracts by commodity type:
| Electric Derivatives |
Gas Derivatives |
|||||||||||||||||||||||||||
|
Number of
Energy Contracts (a) |
MWHs (b) |
Number of
Capacity Contracts (a) |
MW-Months (b) |
Number of
Contracts (a) |
dths (b) |
Total
Number of Contracts (a) |
||||||||||||||||||||||
|
Con Edison |
576 | 12,807,613 | 78 | 10,019 | 635 | 86,541,700 | 1,289 | |||||||||||||||||||||
|
CECONY |
113 | 3,271,000 | — | — | 515 | 81,080,000 | 628 | |||||||||||||||||||||
| (a) | Qualifying derivative contracts, which have been designated as normal purchases or normal sales contracts, are not reported at fair value under the accounting rules for derivatives and hedging and, therefore, are excluded from the table. |
| (b) | Volumes are reported net of long and short positions. |
The Companies also enter into electric congestion and gas basis swap contracts to hedge the congestion and transportation charges which are associated with electric and gas contracts and hedged volumes.
The collateral requirements associated with the clearing and settlement of derivative transactions are included in net cash flows from operating activities in the Companies’ consolidated statement of cash flows. Most derivative instrument contracts contain provisions that may require the Companies to provide collateral on derivative instruments in net liability positions. The amount of collateral to be provided will depend on the fair value of the derivative instruments and the Companies’ credit ratings.
| 32 |
Table of Contents
The aggregate fair value of all derivative instruments with credit-risk-related contingent features that are in a net liability position and collateral posted at September 30, 2012, and the additional collateral that would have been required to be posted had the lowest applicable credit rating been reduced one level and to below investment grade were:
| (Millions of Dollars) | Con Edison (a) | CECONY (a) | ||||||
|
Aggregate fair value – net liabilities |
$62 | $41 | ||||||
|
Collateral posted |
$14 | $ 9 | ||||||
|
Additional collateral (b) (downgrade one level from current ratings (c)) |
$ — | $ — | ||||||
|
Additional collateral (b) (downgrade to below investment grade from current ratings (c)) |
$85 | (d) | $45 | (d) | ||||
| (a) | Non-derivative transactions for the purchase and sale of electricity and gas and qualifying derivative instruments, which have been designated as normal purchases or normal sales, are excluded from the table. These transactions primarily include purchases of electricity from independent system operators. In the event the Utilities and Con Edison’s competitive energy businesses were no longer extended unsecured credit for such purchases, the Companies would be required to post collateral, which at September 30, 2012, would have amounted to an estimated $25 million for Con Edison. For certain other such non-derivative transactions, the Companies could be required to post collateral under certain circumstances, including in the event counterparties had reasonable grounds for insecurity. |
| (b) | The Companies measure the collateral requirements by taking into consideration the fair value amounts of derivative instruments that contain credit-risk-related contingent features that are in a net liabilities position plus amounts owed to counterparties for settled transactions and amounts required by counterparties for minimum financial security. The fair value amounts represent unrealized losses, net of any unrealized gains where the Companies have a legally enforceable right of setoff. |
| (c) | The current ratings are Moody’s, S&P and Fitch long-term credit rating of, as applicable, Con Edison (Baa1/BBB+/BBB+), CECONY (A3/A-/A-) or O&R (Baa1/A-/A-). Credit ratings assigned by rating agencies are expressions of opinions that are subject to revision or withdrawal at any time by the assigning rating agency. |
| (d) | Derivative instruments that are net assets have been excluded from the table. At September 30, 2012, if Con Edison had been downgraded to below investment grade, it would have been required to post additional collateral for such derivative instruments of $27 million. |
Interest Rate Swap
O&R has an interest rate swap pursuant to which it pays a fixed-rate of 6.09 percent and receives a LIBOR-based variable rate. The fair value of this interest rate swap at September 30, 2012 was an unrealized loss of $6 million, which has been included in Con Edison’s consolidated balance sheet as a noncurrent liability/fair value of derivative liabilities and a regulatory asset. The increase in the fair value of the swap for the three and nine months ended September 30, 2012 was $1 million and $2 million, respectively. In the event O&R’s credit rating was downgraded to BBB- or lower by S&P or Baa3 or lower by Moody’s, the swap counterparty could elect to terminate the agreement and, if it did so, the parties would then be required to settle the transaction.
Note K — Fair Value Measurements
The accounting rules for fair value measurements and disclosures define fair value as the price that would be received to sell an asset or paid to transfer a liability in an orderly transaction between market participants at the measurement date in a principal or most advantageous market. Fair value is a market-based measurement that is determined based on inputs, which refer broadly to assumptions that market participants use in pricing assets or liabilities. These inputs can be readily observable, market corroborated, or generally unobservable firm inputs. The Companies often make certain assumptions that market participants would use in pricing the asset or liability, including assumptions about risk, and the risks inherent in the inputs to valuation techniques. The Companies use valuation techniques that maximize the use of observable inputs and minimize the use of unobservable inputs.
The accounting rules for fair value measurements and disclosures established a fair value hierarchy, which prioritizes the inputs to valuation techniques used to measure fair value in three broad levels. The rules require that assets and liabilities be classified in their entirety based on the level of input that is significant to the fair value measurement. Assessing the significance of a particular input may require judgment considering factors specific to the asset or liability, and may affect the valuation of the asset or liability and their placement within the fair value hierarchy. The Companies classify fair value balances based on the fair value hierarchy defined by the accounting rules for fair value measurements and disclosures as follows:
| • |
Level 1 – Consists of assets or liabilities whose value is based on unadjusted quoted prices in active markets at the measurement date. An active market is one in which transactions for assets or liabilities occur with sufficient frequency and volume to provide pricing information on an ongoing basis. |
| 33 |
Table of Contents
|
This category includes contracts traded on active exchange markets valued using unadjusted prices quoted directly from the exchange. |
| • |
Level 2 – Consists of assets or liabilities valued using industry standard models and based on prices, other than quoted prices within Level 1, that are either directly or indirectly observable as of the measurement date. The industry standard models consider observable assumptions including time value, volatility factors, and current market and contractual prices for the underlying commodities, in addition to other economic measures. This category includes contracts traded on active exchanges or in over-the-counter markets priced with industry standard models. |
| • |
Level 3 – Consists of assets or liabilities whose fair value is estimated based on internally developed models or methodologies using inputs that are generally less readily observable and supported by little, if any, market activity at the measurement date. Unobservable inputs are developed based on the best available information and subject to cost benefit constraints. This category includes contracts priced using models that are internally developed and contracts placed in illiquid markets. It also includes contracts that expire after the period of time for which quoted prices are available and internal models are used to determine a significant portion of the value. |
Effective January 1, 2012, the Companies adopted Accounting Standards Update (ASU) No. 2011-04, “Fair Value Measurement (Topic 820): Amendments to Achieve Common Fair Value Measurement and Disclosure Requirements in U.S. GAAP and IFRSs.” The amendments expand existing disclosure requirements for fair value measurements and make other amendments. For fair value measurements in Level 3, this update requires the Companies to provide a description of the valuation process in place, a quantitative disclosure of unobservable inputs and assumptions used in the measurement as well as a narrative description of the sensitivity of the fair value to changes in unobservable inputs and interrelationships between those inputs. The update also requires the Companies to disclose any transfers between Levels 1 and 2 of fair value hierarchy measurements and the reasons for the transfers.
Assets and liabilities measured at fair value on a recurring basis as of September 30, 2012 are summarized below.
| Level 1 | Level 2 | Level 3 |
Netting Adjustments (4) |
Total | ||||||||||||||||||||||||||||||||||||
| (Millions of Dollars) |
Con
Edison |
CECONY |
Con
Edison |
CECONY |
Con
Edison |
CECONY |
Con
Edison |
CECONY |
Con
Edison |
CECONY | ||||||||||||||||||||||||||||||
|
Derivative assets: |
||||||||||||||||||||||||||||||||||||||||
|
Commodity (1) |
$ 2 | $ 2 | $ 48 | $ 16 | $ 47 | $ 12 | $ (46 | ) | $ (3 | ) | $ 51 | $ 27 | ||||||||||||||||||||||||||||
|
Transfer in (5) (6) |
— | — | 24 | — | — | — | — | — | 24 | — | ||||||||||||||||||||||||||||||
|
Transfer out (5) (6) |
— | — | — | — | (24 | ) | — | — | — | (24 | ) | — | ||||||||||||||||||||||||||||
|
Commodity Total |
$ 2 | $ 2 | $ 72 | $ 16 | $ 23 | $ 12 | $ (46 | ) | $ (3 | ) | $ 51 | $ 27 | ||||||||||||||||||||||||||||
|
Other assets |
103 | 96 | — | 1 | 105 | 95 | — | — | 208 | 192 | ||||||||||||||||||||||||||||||
|
Transfer in (5) (6) |
— | — | 105 | 95 | — | — | — | — | 105 | 95 | ||||||||||||||||||||||||||||||
|
Transfer out (5) (6) |
— | — | — | — | (105 | ) | (95 | ) | — | — | (105 | ) | (95 | ) | ||||||||||||||||||||||||||
|
Other assets (3) |
$103 | $96 | $105 | $ 96 | $ — | $ — | $ — | $ — | $ 208 | $192 | ||||||||||||||||||||||||||||||
|
Total |
$105 | $98 | $177 | $112 | $ 23 | $ 12 | $ (46 | ) | $ (3 | ) | $ 259 | $219 | ||||||||||||||||||||||||||||
|
Derivative liabilities: |
||||||||||||||||||||||||||||||||||||||||
|
Commodity |
$ 4 | $ 1 | $114 | $ 68 | $ 71 | $ 9 | $(105 | ) | $(36 | ) | $ 84 | $ 42 | ||||||||||||||||||||||||||||
|
Transfer in (5) (6) |
7 | 7 | 50 | 12 | 3 | 3 | — | — | 60 | 22 | ||||||||||||||||||||||||||||||
|
Transfer out (5) (6) |
(2 | ) | — | (10 | ) | (10 | ) | (48 | ) | (12 | ) | — | — | (60 | ) | (22 | ) | |||||||||||||||||||||||
|
Commodity Total (1) |
$9 | $ 8 | $154 | $ 70 | $ 26 | $ — | $(105 | ) | $(36 | ) | $ 84 | $ 42 | ||||||||||||||||||||||||||||
|
Interest rate contract |
— | — | (2 | ) | — | 8 | — | — | — | 6 | — | |||||||||||||||||||||||||||||
|
Transfer in (5) (6) |
— | — | 8 | — | — | — | — | — | 8 | — | ||||||||||||||||||||||||||||||
|
Transfer out (5) (6) |
— | — | — | — | (8 | ) | — | — | — | (8 | ) | — | ||||||||||||||||||||||||||||
|
Interest rate contract (2) |
$ — | $ — | $ 6 | $ — | $ — | $ — | $ — | $ — | $ 6 | $ — | ||||||||||||||||||||||||||||||
|
Total |
$ 9 | $ 8 | $160 | $70 | $ 26 | $ — | $(105 | ) | $(36 | ) | $ 90 | $ 42 | ||||||||||||||||||||||||||||
| 34 |
Table of Contents
| (1) | A portion of the commodity derivatives categorized in Level 3 is valued using an internally developed model with observable inputs. The models also include some less readily observable inputs resulting in the classification of the entire contract as Level 3. See Note J. |
| (2) | See Note J. |
| (3) | Other assets are comprised of assets such as life insurance contracts within the deferred compensation plan and non-qualified retirement plans. |
| (4) | Amounts represent the impact of legally-enforceable master netting agreements that allow the Companies to net gain and loss positions and cash collateral held or placed with the same counterparties. |
| (5) | The Companies’ policy is to recognize transfers into and transfers out of the levels at the end of the reporting period. |
| (6) | Transferred between Level 3 and Levels 1 and 2 because of reassessment of the levels in the fair value hierarchy within which certain inputs fall. Other assets and interest rate contract were transferred as of March 31, 2012. |
Assets and liabilities measured at fair value on a recurring basis as of December 31, 2011 are summarized below.
| Level 1 | Level 2 | Level 3 |
Netting Adjustments (4) |
Total | ||||||||||||||||||||||||||||||||||||
| (Millions of Dollars) |
Con
Edison |
CECONY |
Con
Edison |
CECONY |
Con
Edison |
CECONY |
Con
Edison |
CECONY |
Con
Edison |
CECONY | ||||||||||||||||||||||||||||||
|
Derivative assets: |
||||||||||||||||||||||||||||||||||||||||
|
Commodity (1) |
$ 3 | $ — | $ 64 | $ 8 | $ 87 | $ 11 | $ (84 | ) | $ 5 | $ 70 | $ 24 | |||||||||||||||||||||||||||||
|
Other assets (3) |
76 | 76 | — | — | 99 | 90 | — | — | 175 | 166 | ||||||||||||||||||||||||||||||
|
Total |
$79 | $76 | $ 64 | $ 8 | $186 | $101 | $ (84 | ) | $ 5 | $ 245 | $190 | |||||||||||||||||||||||||||||
|
Derivative liabilities: |
||||||||||||||||||||||||||||||||||||||||
|
Commodity |
$12 | $ 4 | $222 | $122 | $169 | $ 37 | $(194 | ) | $(41 | ) | $ 209 | $122 | ||||||||||||||||||||||||||||
|
Transfer in (5) (6) (7) |
— | — | 26 | 25 | 6 | 6 | — | — | 32 | 31 | ||||||||||||||||||||||||||||||
|
Transfer out (5) (6) (7) |
— | — | (6 | ) | (6 | ) | (26 | ) | (25 | ) | — | — | (32 | ) | (31 | ) | ||||||||||||||||||||||||
|
Commodity (1) |
$12 | $ 4 | $242 | $141 | $149 | $ 18 | $(194 | ) | $(41 | ) | $ 209 | $122 | ||||||||||||||||||||||||||||
|
Interest rate contract (2) |
— | — | — | — | 8 | — | — | — | 8 | — | ||||||||||||||||||||||||||||||
|
Total |
$12 | $ 4 | $242 | $141 | $157 | $ 18 | $(194 | ) | $(41 | ) | $ 217 | $122 | ||||||||||||||||||||||||||||
| (1) | A portion of the commodity derivatives categorized in Level 3 is valued using an internally developed model with observable inputs. The models also include some less readily observable inputs resulting in the classification of the entire contract as Level 3. See Note J. |
| (2) | See Note J. |
| (3) | Other assets are comprised of assets such as life insurance contracts within the deferred compensation plan and non-qualified retirement plans. |
| (4) | Amounts represent the impact of legally-enforceable master netting agreements that allow the Companies to net gain and loss positions and cash collateral held or placed with the same counterparties. |
| (5) | The Companies’ policy is to recognize transfers into and transfers out of the levels at the end of the reporting period. |
| (6) | Transferred from Level 2 to Level 3 because of reassessment of the levels in the fair value hierarchy within which certain inputs fall. |
| (7) | Transferred from Level 3 to Level 2 because of availability of observable market data due to decrease in the terms of certain contracts from beyond one year as of December 31, 2010 to less than one year as of December 31, 2011. |
| 35 |
Table of Contents
The employees in the risk management groups of the Utilities and the competitive energy businesses develop and maintain the Companies’ valuation policies and procedures for, and verify pricing and fair value valuation of, commodity derivatives. Under the Companies’ policies and procedures, multiple independent sources of information are obtained for forward price curves used to value commodity derivatives. Fair value and changes in fair value of commodity derivatives are reported on a monthly basis to the Companies’ risk committees, comprised of officers and employees of the Companies that oversee energy hedging at the Utilities and the competitive energy businesses. The managers of the risk management groups report to the Companies’ Vice President and Treasurer.
|
Fair Value of
Level 3 at
(Millions of Dollars) |
Valuation Techniques |
Unobservable Inputs | Range | |||||||
|
Con Edison—Commodity |
||||||||||
|
Electricity Swaps |
$ | (9 | ) | Discounted Cash Flow | Forward prices (1) |
$22-$64 per
MWH |
||||
|
Electricity Wholesale Contract |
4 | Discounted Cash Flow |
Auction prices (2)
New Jersey solar renewable energy credit
|
$29-$52 per
MWH $85 per SREC |
||||||
|
Standard Offer Capacity Agreements |
(12 | ) | Discounted Cash Flow |
Forward capacity prices (1) Forward price escalator (1) Present value factor (1) |
$166 MW per day
0%-3% 1.66% |
|||||
|
Transmission Congestion Contracts / Financial Transmission Rights |
14 | Discounted Cash Flow |
Discount to adjust auction prices for inter-zonal forward price curves (2)
Discount to adjust auction prices for historical monthly realized
settlements
(2)
|
17.5%-38%
(3)%-26.5% 8% |
||||||
|
Total Con Edison—Commodity |
$ | (3 | ) | |||||||
|
CECONY—Commodity |
||||||||||
|
Transmission Congestion Contracts |
$ | 12 | Discounted Cash Flow |
Discount to adjust auction prices for inter-zonal forward price curves (2) Discount to adjust auction prices for historical monthly realized settlements (2) |
17.5%-38% (3)%- 26.5% |
|||||
| (1) | Generally, increases/(decreases) in this input in isolation would result in a higher/(lower) fair value measurement. |
| (2) | Generally, increases/(decreases) in this input in isolation would result in a lower/(higher) fair value measurement. |
The table listed below provides a reconciliation of the beginning and ending net balances for assets and liabilities measured at fair value for the three and nine months ended September 30, 2012 and classified as Level 3 in the fair value hierarchy:
| For the Three Months Ended September 30, 2012 | ||||||||||||||||||||||||||||||||||||
|
Total Gains/(Losses)— Realized and Unrealized |
||||||||||||||||||||||||||||||||||||
| (Millions of Dollars) |
Beginning
Balance as of July 1, 2012 |
Included in
Earnings |
Included in
Regulatory Assets and Liabilities |
Purchases | Issuances | Sales | Settlements |
Transfer
Level 3 |
Ending Balance as of September 30, 2012 |
|||||||||||||||||||||||||||
|
Con Edison |
||||||||||||||||||||||||||||||||||||
|
Derivatives: |
||||||||||||||||||||||||||||||||||||
|
Commodity |
$(61 | ) | $(15 | ) | $19 | $7 | $— | $— | $25 | $22 | $ (3 | ) | ||||||||||||||||||||||||
|
CECONY |
||||||||||||||||||||||||||||||||||||
|
Derivatives: |
||||||||||||||||||||||||||||||||||||
|
Commodity |
$(10 | ) | $ (9 | ) | $ 8 | $7 | $— | $— | $ 5 | $11 | $ 12 | |||||||||||||||||||||||||
| 36 |
Table of Contents
| For the Nine Months Ended September 30, 2012 | ||||||||||||||||||||||||||||||||||||
|
Total Gains/(Losses)— Realized and Unrealized |
||||||||||||||||||||||||||||||||||||
| (Millions of Dollars) |
Beginning
Balance as of January 1, 2012 |
Included in Earnings |
Included in Regulatory Assets and Liabilities |
Purchases | Issuances | Sales | Settlements |
Transfer
Level 3 |
Ending Balance as of September 30, 2012 |
|||||||||||||||||||||||||||
|
Con Edison |
||||||||||||||||||||||||||||||||||||
|
Derivatives: |
||||||||||||||||||||||||||||||||||||
|
Commodity |
$(62) | $(97) | $11 | $18 | $— | $— | $106 | $ 21 | $ (3) | |||||||||||||||||||||||||||
|
Interest rate contract |
(8) | (1) | — | — | — | — | 1 | 8(2 | ) | — | ||||||||||||||||||||||||||
|
Other assets (1) |
99 | 3 | 3 | — | — | — | — | (105 | )(2) | — | ||||||||||||||||||||||||||
|
Total |
$ 29 | $(95) | $14 | $18 | $— | $— | $107 | $ (76) | $ (3) | |||||||||||||||||||||||||||
|
CECONY |
||||||||||||||||||||||||||||||||||||
|
Derivatives: |
||||||||||||||||||||||||||||||||||||
|
Commodity |
$ (7) | $(25) | $ 8 | $15 | $— | $— | $ 12 | $ 9(2 | ) | $ 12 | ||||||||||||||||||||||||||
|
Other assets (1) |
90 | 3 | 2 | — | — | — | — | (95 | )(2) | — | ||||||||||||||||||||||||||
|
Total |
$ 83 | $(22) | $10 | $15 | $— | $— | $ 12 | $ (86) | $ 12 | |||||||||||||||||||||||||||
| (1) | Amounts included in earnings are reported in investment and other income on the consolidated income statement. |
| (2) | Other assets and interest rate contract were transferred as of March 31, 2012. |
The table listed below provides a reconciliation of the beginning and ending net balances for assets and liabilities measured at fair value for the three and nine months ended September 30, 2011 and classified as Level 3 in the fair value hierarchy:
| For the Three Months Ended September 30, 2011 | ||||||||||||||||||||||||||||||||||||
|
Total Gains/(Losses)— Realized and Unrealized |
||||||||||||||||||||||||||||||||||||
| (Millions of Dollars) |
Beginning Balance as of July 1, 2011 |
Included in
Earnings |
Included in
and Liabilities |
Purchases | Issuances | Sales | Settlements |
Transfer In/Out of Level 3 |
Ending Balance as of September 30, 2011 |
|||||||||||||||||||||||||||
|
Con Edison |
||||||||||||||||||||||||||||||||||||
|
Derivatives: |
||||||||||||||||||||||||||||||||||||
|
Commodity |
$ (25 | ) | $(37 | ) | $ 9 | $8 | $— | $— | $14 | $24 | $ (7 | ) | ||||||||||||||||||||||||
|
Interest rate contract |
(10 | ) | (1 | ) | 1 | — | — | — | 1 | — | (9 | ) | ||||||||||||||||||||||||
|
Other assets (1) |
106 | (3 | ) | (3 | ) | — | — | — | — | — | 100 | |||||||||||||||||||||||||
|
Total |
$ 71 | $(41 | ) | $ 7 | $8 | $— | $— | $15 | $24 | $ 84 | ||||||||||||||||||||||||||
|
CECONY |
||||||||||||||||||||||||||||||||||||
|
Derivatives: |
||||||||||||||||||||||||||||||||||||
|
Commodity |
$ — | $ (8 | ) | $ 1 | $8 | $— | $— | $ 3 | $ 9 | $ 13 | ||||||||||||||||||||||||||
|
Other assets (1) |
96 | (3 | ) | (2 | ) | — | — | — | — | — | 91 | |||||||||||||||||||||||||
|
Total |
$ 96 | $(11 | ) | $(1 | ) | $8 | $— | $— | $ 3 | $ 9 | $ 104 | |||||||||||||||||||||||||
| (1) | Amounts included in earnings are reported in investment and other income on the consolidated income statement. |
| 37 |
Table of Contents
| For the Nine Months Ended September 30, 2011 | ||||||||||||||||||||||||||||||||||||
|
Total Gains/(Losses)—
Realized and Unrealized |
||||||||||||||||||||||||||||||||||||
| (Millions of Dollars) |
Beginning Balance as of January 1, 2011 |
Included in Earnings |
Included in Regulatory Assets and Liabilities |
Purchases | Issuances | Sales | Settlements |
Transfer
Level 3 |
Ending
Balance as of
2011 |
|||||||||||||||||||||||||||
|
Con Edison |
||||||||||||||||||||||||||||||||||||
|
Derivatives: |
||||||||||||||||||||||||||||||||||||
|
Commodity |
$ (88 | ) | $(59 | ) | $54 | $22 | $— | $— | $35 | $29 | $ (7 | ) | ||||||||||||||||||||||||
|
Interest rate contract |
(10 | ) | (3 | ) | 1 | — | — | — | 3 | — | (9 | ) | ||||||||||||||||||||||||
|
Other assets (1) |
101 | — | (1 | ) | — | — | — | — | — | 100 | ||||||||||||||||||||||||||
|
Total |
$ 3 | $(62 | ) | $54 | $22 | $— | $— | $38 | $29 | $ 84 | ||||||||||||||||||||||||||
|
CECONY |
||||||||||||||||||||||||||||||||||||
|
Derivatives: |
||||||||||||||||||||||||||||||||||||
|
Commodity |
$ (26 | ) | $(11 | ) | $22 | $18 | $— | $— | $ (4 | ) | $14 | $ 13 | ||||||||||||||||||||||||
|
Other assets (1) |
92 | — | (1 | ) | — | — | — | — | — | 91 | ||||||||||||||||||||||||||
|
Total |
$ 66 | $(11 | ) | $21 | $18 | $— | $— | $ (4 | ) | $14 | $ 104 | |||||||||||||||||||||||||
| (1) | Amounts included in earnings are reported in investment and other income on the consolidated income statement. |
For the Utilities, realized gains and losses on Level 3 commodity derivative assets and liabilities are reported as part of purchased power, gas and fuel costs. The Utilities generally recover these costs in accordance with rate provisions approved by the applicable state public utilities commissions. Unrealized gains and losses for commodity derivatives are generally deferred on the consolidated balance sheet in accordance with the accounting rules for regulated operations.
For the competitive energy businesses, realized and unrealized gains and losses on Level 3 commodity derivative assets and liabilities are reported in non-utility revenues ($2 million loss and $10 million loss) and purchased power costs ($2 million gain and $12 million loss) on the consolidated income statement for the three months ended September 30, 2012 and 2011, respectively. Realized and unrealized gains and losses on Level 3 commodity derivative assets and liabilities are reported in non-utility revenues ($11 million loss and $35 million loss), and purchased power costs ($42 million loss and $6 million gain) on the consolidated income statement for the nine months ended September 30, 2012 and 2011, respectively. The change in fair value relating to Level 3 commodity derivative assets held at September 30, 2012 and 2011 is included in non-utility revenues ($2 million loss and $10 million loss), and purchased power costs ($16 million gain and $5 million loss) on the consolidated income statement for the three months ended September 30, 2012 and 2011, respectively. For the nine months ended September 30, 2012 and 2011, the change in fair value relating to Level 3 commodity derivative assets and liabilities included in non-utility revenues ($11 million loss and $35 million loss), and purchased power costs ($40 million gain and $31 million gain) on the consolidated income statement, respectively.
The accounting rules for fair value measurements and disclosures require consideration of the impact of nonperformance risk (including credit risk) from a market participant perspective in the measurement of the fair value of assets and liabilities. At September 30, 2012, the Companies determined that nonperformance risk would have no material impact on their financial position or results of operations. To assess nonperformance risk, the Companies considered information such as collateral requirements, master netting arrangements, letters of credit and parent company guarantees, and applied a market-based method by using the counterparty (for an asset) or the Companies’ (for a liability) credit default swaps rates.
| 38 |
Table of Contents
Note L — Hurricane Sandy
In late October 2012, Hurricane Sandy caused extensive damage to the Utilities’ electric distribution system and interrupted service to approximately 950,000 CECONY customers and approximately 250,000 O&R customers. Hurricane Sandy also damaged CECONY’s steam system and interrupted service to many of its steam customers. To restore service to their customers and repair their energy systems, the Utilities are incurring substantial operating costs and making substantial capital expenditures, the amount of which the Utilities are unable to estimate at this time. The Utilities’ rate plans provide for operating costs and capital expenditures under different provisions. The Utilities expect that most of their operating expenses attributable to Hurricane Sandy will be deferred for recovery as a regulatory asset under their electric rate plans. The Utilities’ capital expenditures, up to specified levels, are reflected in rates under their rate plans. In addition CECONY’s rate plans provide that it may request in its next base rate filings to recover additional capital expenditures (provided the company can justify the need for and reasonableness of, and its inability to reasonably avoid, such additional capital expenditures). Under its New York electric rate plan and subject to certain limitations, O&R defers as a regulatory asset the revenue requirement impact of the amount by which actual average net utility plant is different than the average net utility plant reflected in rates. Under the New York rate plans, the Utilities also may petition the NYSPSC for authorization to defer extraordinary expenditures not otherwise addressed in their rate plans. The Utilities’ New York electric rate plans include provisions for revenue decoupling, as a result of which delivery revenues generally are not affected by changes in delivery volumes from levels assumed when rates were approved. The provisions of the Utilities’ New York electric plans that impose penalties for operating performance provide for exceptions for major storms and catastrophic events beyond the control of the companies, including natural disasters such as hurricanes and floods. The Utilities expect the NYSPSC to investigate the preparation and performance of New York utilities in connection with Hurricane Sandy.
| 39 |
Table of Contents
This combined management’s discussion and analysis of financial condition and results of operations (MD&A) relates to the consolidated financial statements (the Third Quarter Financial Statements) included in this report of two separate registrants: Consolidated Edison, Inc. (Con Edison) and Consolidated Edison Company of New York, Inc. (CECONY). This MD&A should be read in conjunction with the financial statements and the notes thereto. As used in this report, the term the “Companies” refers to Con Edison and CECONY. CECONY is a subsidiary of Con Edison and, as such, information in this management’s discussion and analysis about CECONY applies to Con Edison.
This MD&A should be read in conjunction with the Third Quarter Financial Statements and the notes thereto and the MD&A in Item 7 of the Companies’ combined Annual Report on Form 10-K for the year ended December 31, 2011 (File Nos. 1-14514 and 1-1217, the Form 10-K) and the MD&A in Part 1, Item 2 of the Companies’ combined Quarterly Reports on Form 10-Q for the quarterly periods ended March 31, 2012 and June 30, 2012 (File Nos. 1-14514 and 1-1217).
Information in any item of this report referred to in this discussion and analysis is incorporated by reference herein. The use of terms such as “see” or “refer to” shall be deemed to incorporate by reference into this discussion and analysis the information to which reference is made.
Con Edison, incorporated in New York State in 1997, is a holding company which owns all of the outstanding common stock of CECONY, Orange and Rockland Utilities, Inc. (O&R) and the competitive energy businesses. As used in this report, the term the “Utilities” refers to CECONY and O&R.
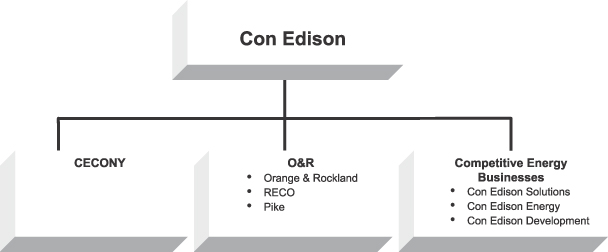
CECONY’s principal business operations are its regulated electric, gas and steam delivery businesses. O&R’s principal business operations are its regulated electric and gas delivery businesses. The competitive energy businesses sell electricity to retail and wholesale customers, provide certain energy-related services, and participate in energy infrastructure projects. Con Edison is evaluating additional opportunities to invest in electric and gas-related businesses.
Con Edison’s strategy is to provide reliable energy services, maintain public and employee safety, promote energy efficiency, and develop cost-effective ways of performing its business. Con Edison seeks to be a responsible steward of the environment and enhance its relationships with customers, regulators and members of the communities it serves.
In the late October 2012, Hurricane Sandy caused extensive damage to the Utilities’ electric distribution system and interrupted service to approximately 950,000 CECONY customers and approximately 250,000 O&R customers. See Note L to the Third Quarter Financial Statements.
| 40 |
Table of Contents
CECONY
Electric
CECONY provides electric service to approximately 3.3 million customers in all of New York City (except part of Queens) and most of Westchester County, an approximately 660 square mile service area with a population of more than nine million.
Gas
CECONY delivers gas to approximately 1.1 million customers in Manhattan, the Bronx and parts of Queens and Westchester County.
In June 2012, the company increased its forecast of average annual growth of the peak gas demand in its service area over the next five years at design conditions from approximately 3.5 percent to 4.3 percent, reflecting, among other things, oil to gas conversions anticipated to result from changes to New York City regulations that will phase out the use of certain types of heating oil and the relative prices of oil and natural gas.
Steam
CECONY operates the largest steam distribution system in the United States by producing and delivering more than 22,000 MMlbs of steam annually to approximately 1,735 customers in parts of Manhattan.
Collective Bargaining Agreement
In July 2012, CECONY reached a four-year collective bargaining agreement covering approximately 8,000 employees (which was ratified in August 2012 by the employees) ending a 26-day work stoppage involving those employees. During the work stoppage, the company operated its electric, gas and steam businesses with approximately 5,500 employees and additional resources.
O&R
Electric
O&R and its utility subsidiaries, Rockland Electric Company (RECO) and Pike County Light & Power Company (Pike) (together referred to herein as O&R) provide electric service to approximately 0.3 million customers in southeastern New York and in adjacent areas of northern New Jersey and northeastern Pennsylvania, an approximately 1,350 square mile service area.
Gas
O&R delivers gas to over 0.1 million customers in southeastern New York and adjacent areas of northeastern Pennsylvania.
Competitive Energy Businesses
Con Edison pursues competitive energy opportunities through three wholly-owned subsidiaries: Con Edison Solutions, Con Edison Energy and Con Edison Development. These businesses include the sales and related hedging of electricity to retail and wholesale customers, sales of certain energy-related products and services, and participation in energy infrastructure projects. At September 30, 2012, Con Edison’s equity investment in its competitive energy businesses was $514 million and their assets amounted to $1,021 million. For information about purchases of solar energy companies during 2012, see “Liquidity and Capital Resources – Capital Requirements and Resources,” below.
Certain financial data of Con Edison’s businesses is presented below:
| Three Months Ended September 30, 2012 | Nine Months Ended September 30, 2012 | At September 30, 2012 | ||||||||||||||||||||||||||||||||||||||
|
(Millions of Dollars, except
percentages) |
Operating Revenues |
Net Income for
Common Stock |
Operating Revenues |
Net Income for
Common Stock |
Assets |
|||||||||||||||||||||||||||||||||||
|
CECONY |
$2,868 | 83% | $389 | 88% | $7,738 | 83% | $824 | 88% | $35,699 | 90% | ||||||||||||||||||||||||||||||
|
O&R |
226 | 7% | 24 | 6% | 601 | 7% | 54 | 6% | 2,474 | 6% | ||||||||||||||||||||||||||||||
|
Total Utilities |
3,094 | 90% | 413 | 94% | 8,339 | 90% | 878 | 94% | 38,173 | 96% | ||||||||||||||||||||||||||||||
|
Con Edison Solutions (a) |
321 | 9% | 28 | 6% | 874 | 9% | 60 | 6% | 304 | 1% | ||||||||||||||||||||||||||||||
|
Con Edison Energy (a) |
20 | 1% | 1 | —% | 69 | 1% | — | —% | 65 | —% | ||||||||||||||||||||||||||||||
|
Con Edison Development |
5 | —% | 2 | 1% | 17 | —% | 5 | 1% | 676 | 2% | ||||||||||||||||||||||||||||||
|
Other (b) |
(2) | —% | (4) | (1)% | (12) | —% | (12) | (1)% | 415 | 1% | ||||||||||||||||||||||||||||||
|
Total Con Edison |
$3,438 | 100 | % | $440 | 100 | % | $9,287 | 100 | % | $931 | 100 | % | $39,633 | 100 | % | |||||||||||||||||||||||||
| (a) | Net income from the competitive energy businesses for the three and nine months ended September 30, 2012 includes $17 million and $35 million, respectively, of net after-tax mark-to-market gains/(losses) (Con Edison Solutions, $17 million and $37 million and Con Edison Energy, $0 million and $(2) million)). |
| (b) | Represents inter-company and parent company accounting. See “Results of Operations,” below. |
| 41 |
Table of Contents
Con Edison’s net income for common stock for the three months ended September 30, 2012 was $440 million or $1.50 a share ($1.49 on a diluted basis) compared with $383 million or $1.31 a share ($1.30 on a diluted basis) for the three months ended September 30, 2011. Net income for common stock for the nine months ended September 30, 2012 was $931 million or $3.18 a share ($3.16 on a diluted basis) compared with earnings of $860 million or $2.94 a share ($2.92 on a diluted basis) for the nine months ended September 30, 2011. See “Results of Operations – Summary,” below. For segment financial information, see Note I to the Third Quarter Financial Statements and “Results of Operations,” below.
Results of Operations — Summary
Net income for common stock for the three and nine months ended September 30, 2012 and 2011 was as follows:
| Three Months Ended September 30, | Nine Months Ended September 30, | |||||||||||||||
| (millions of dollars) | 2012 | 2011 | 2012 | 2011 | ||||||||||||
|
CECONY |
$389 | $353 | $824 | $779 | ||||||||||||
|
O&R |
24 | 20 | 54 | 44 | ||||||||||||
|
Competitive energy businesses (a) |
31 | 10 | 65 | 46 | ||||||||||||
|
Other (b) |
(4 | ) | — | (12 | ) | (9 | ) | |||||||||
|
Con Edison |
$440 | $383 | $931 | $860 | ||||||||||||
| (a) | Includes $17 million and $(7) million of net after-tax mark-to-market gains/(losses) for the three months ended September 30, 2012 and 2011, respectively. Includes $35 million and $14 million of net after-tax mark-to-market gains for the nine months ended September 30, 2012 and 2011, respectively. |
| (b) | Consists of inter-company and parent company accounting. |
The Companies’ results of operations for the three and nine months ended September 30, 2012, as compared with the 2011 periods, reflect changes in the Utilities’ rate plans and the effects of the milder winter weather on steam revenues. These rate plans provide for additional revenues to cover expected increases in certain operations and maintenance expenses, and depreciation. The results of operations include the operating results of the competitive energy businesses, including net mark-to-market effects.
Operations and maintenance expenses were higher in the 2012 periods due to pension costs and the support and maintenance of company underground facilities to accommodate municipal projects. Depreciation was higher in the 2012 periods reflecting the impact of higher utility plant balances.
The following table presents the estimated effect on earnings per share and net income for common stock for the three and nine months ended 2012 as compared with the 2011 period, resulting from these and other major factors:
| Three Months Variation | Nine Months Variation | |||||||||||||||
|
Earnings
per Share |
Net Income
(millions of dollars) |
Earnings
per Share |
Net Income
(millions of dollars) |
|||||||||||||
|
CECONY |
||||||||||||||||
|
Rate plans, primarily to recover increases in certain costs |
$0.24 | $71 | $0.65 | $192 | ||||||||||||
|
Weather impact on steam revenues |
— | — | (0.10 | ) | (28 | ) | ||||||||||
|
Operations and maintenance expenses |
(0.10 | ) | (31 | ) | (0.33 | ) | (98 | ) | ||||||||
|
Depreciation |
(0.03 | ) | (10 | ) | (0.09 | ) | (27 | ) | ||||||||
|
Other |
0.01 | 6 | 0.02 | 6 | ||||||||||||
|
Total CECONY |
0.12 | 36 | 0.15 | 45 | ||||||||||||
|
O&R |
0.01 | 4 | 0.04 | 11 | ||||||||||||
|
Competitive energy businesses (a) |
0.08 | 21 | 0.06 | 19 | ||||||||||||
|
Other, including parent company expenses |
(0.02 | ) | (4 | ) | (0.01 | ) | (4 | ) | ||||||||
|
Total variations |
$0.19 | $57 | $0.24 | $71 | ||||||||||||
| (a) | These variations reflect after-tax net mark-to-market gains/(losses) of $17 million or $0.06 a share and $(7) million or $(0.02) a share for the three months ended September 30, 2012 and 2011, respectively, and after-tax net mark-to-market gains of $35 million or $0.12 a share and $14 million or $0.05 a share for the nine months ended September 30, 2012 and 2011, respectively. |
See “Results of Operations” below for further discussion and analysis of results of operations.
| 42 |
Table of Contents
Liquidity and Capital Resources
The Companies’ liquidity reflects cash flows from operating, investing and financing activities, as shown on their respective consolidated statement of cash flows and as discussed below. Changes in the Companies’ cash and temporary cash investments resulting from operating, investing and financing activities for the nine months ended September 30, 2012 and 2011 are summarized as follows:
Con Edison
| Con Edison | CECONY | |||||||||||||||||||||||
| (millions of dollars) | 2012 | 2011 | Variance | 2012 | 2011 | Variance | ||||||||||||||||||
|
Operating activities |
$ 1,638 | $ 2,161 | $(523 | ) | $ 1,463 | $ 1,960 | $(497 | ) | ||||||||||||||||
|
Investing activities |
(1,867 | ) | (1,611 | ) | (256 | ) | (1,483 | ) | (1,450 | ) | (33 | ) | ||||||||||||
|
Financing activities |
(350 | ) | (490 | ) | 140 | (326 | ) | (518 | ) | 192 | ||||||||||||||
|
Net change |
(579 | ) | 60 | (639 | ) | (346 | ) | (8 | ) | (338 | ) | |||||||||||||
|
Balance at beginning of period |
648 | 338 | 310 | 372 | 78 | 294 | ||||||||||||||||||
|
Balance at end of period |
$ 69 | $ 398 | $(329 | ) | $ 26 | $ 70 | $ (44 | ) | ||||||||||||||||
Cash Flows from Operating Activities
The Utilities’ cash flows from operating activities reflect principally their energy sales and deliveries and cost of operations. The volume of energy sales and deliveries is dependent primarily on factors external to the Utilities, such as growth of customer demand, weather, market prices for energy, economic conditions and measures that promote energy efficiency. Under the revenue decoupling mechanisms in CECONY’s electric and gas rate plans and O&R’s New York electric and gas rate plans, changes in delivery volumes from levels assumed when rates were approved may affect the timing of cash flows but not net income. The prices at which the Utilities provide energy to their customers are determined in accordance with their rate agreements. In general, changes in the Utilities’ cost of purchased power, fuel and gas may affect the timing of cash flows but not net income because the costs are recovered in accordance with rate agreements.
Net income is the result of cash and non-cash (or accrual) transactions. Only cash transactions affect the Companies’ cash flows from operating activities. Principal non-cash charges include depreciation and deferred income tax expense. Principal non-cash credits include amortizations of certain net regulatory liabilities. Non-cash charges or credits may also be accrued under the revenue decoupling and cost reconciliation mechanisms in the Utilities’ electric and gas rate plans in New York. In addition, the Companies’ cash flows from operating activities reflect the timing of the deduction for income tax purposes of their construction expenditures.
Net cash flows from operating activities for the nine months ended September 30, 2012 for Con Edison and CECONY were $523 million and $497 million lower, respectively, compared with the 2011 period. The decrease in net cash flows reflects primarily the increased pension contributions in 2012 ($243 million for Con Edison and $231 million for CECONY). The Companies contributed $787 million and $544 million (of which $733 million and $502 million was contributed by CECONY) to the pension plan during 2012 and 2011, respectively. The decrease in net cash flows is also due to higher estimated income tax payments, net of refunds received, in 2012 ($178 million for Con Edison and $153 million for CECONY) and lower cash flows associated with collateral paid to brokers and counterparties in the 2012 period ($53 million for Con Edison and $50 million for CECONY).
The change in net cash flows also reflects the timing of payments for and recovery of energy costs. This timing is reflected within changes to accounts receivable – customers, recoverable energy costs and accounts payable balances.
The changes in regulatory assets principally reflect changes in deferred pension costs in accordance with the accounting rules for retirement benefits. See Note B to the Third Quarter Financial Statements.
Cash Flows Used in Investing Activities
Net cash flows used in investing activities for Con Edison and CECONY were $256 million and
| 43 |
Table of Contents
$33 million higher for the nine months ended September 30, 2012 compared with the 2011 period. The changes for Con Edison and CECONY reflect increased utility construction expenditures in 2012. In addition, for Con Edison, the change reflects capital expenditures for Alpaugh and other solar energy projects (see “Capital Requirements and Resources,” below), return of investment resulting from the receipt of government grant proceeds at the Pilesgrove solar project and proceeds from grants related to other renewable investments.
Cash Flows from Financing Activities
Net cash flows from financing activities for Con Edison and CECONY were $140 million and $192 million higher, respectively, in the nine months ended September 30, 2012 compared with the 2011 period.
In March 2012, CECONY issued $400 million of 4.20 percent 30-year debentures, $239 million of the net proceeds from the sale of which were used to redeem on May 1, 2012 all outstanding shares of its $5 Cumulative Preferred Stock and Cumulative Preferred Stock ($100 par value). In July 2012, CECONY redeemed at maturity $300 million 5.625 percent 10-year debentures. The Companies had no issuances of long-term debt in 2011.
Cash flows from financing activities of the Companies also reflect commercial paper issuances (included on the consolidated balance sheets as “Notes payable”). The commercial paper amounts outstanding at September 30, 2012 and 2011 and the average daily balances for the nine months ended September 30, 2012 and 2011 for Con Edison and CECONY were as follows:
| 2012 | 2011 | |||||||||||||||
| (millions of dollars, except Weighted Average Yield) |
Outstanding
at September 30 |
Daily
average |
Outstanding
at September 30 |
Daily
average |
||||||||||||
|
Con Edison |
$340 | $116 | $— | $110 | ||||||||||||
|
CECONY |
$332 | $112 | $— | $110 | ||||||||||||
|
Weighted average yield |
0.3 | % | 0.3 | % | — | % | 0.3 | % | ||||||||
Other Changes in Assets and Liabilities
The following table shows changes in certain assets and liabilities at September 30, 2012, compared with December 31, 2011.
| Con Edison | CECONY | |||||||
| (millions of dollars) |
2012 vs. 2011 Variance |
2012 vs. 2011 Variance |
||||||
|
Assets |
||||||||
|
Regulatory asset – Unrecognized pension and other postretirement costs |
$(641 | ) | $(582 | ) | ||||
|
Non-utility plant – Construction work in progress |
361 | — | ||||||
|
Prepayments |
288 | 308 | ||||||
|
Liabilities |
||||||||
|
Pensions and retiree benefits |
(796 | ) | (710 | ) | ||||
|
Deferred income taxes and investment tax credits |
463 | 380 | ||||||
Regulatory Asset for Unrecognized Pension and Other Postretirement Costs and Noncurrent Liability for Pensions and Retiree Benefits
The decrease in the regulatory asset for unrecognized pension and other postretirement costs and the noncurrent liability for pension and retiree benefits reflects the final actuarial valuation of the pension and other retiree benefit plans as measured at December 31, 2011 in accordance with the accounting rules for retirement benefits. The change in the regulatory asset also reflects the year’s amortization of accounting costs. The decrease in the noncurrent liability for pension and retiree benefits reflects in part contributions to the plans made by the Utilities in 2012. See Notes B, E and F to the Third Quarter Financial Statements.
| 44 |
Table of Contents
Non-Utility Plant – Construction Work in Progress
The increase in non-utility plant – construction work in progress for Con Edison reflects the Alpaugh and other solar energy projects. See Note I to the Third Quarter Financial Statements.
Prepayments
The increase in prepayments for Con Edison and CECONY reflects the portion allocable to the 2012 fourth quarter of CECONY’s July 2012 payment of its New York City semi-annual property taxes.
Deferred Income Taxes and Investment Tax Credits
The increase in the liability for deferred income taxes and investment tax credits reflects the timing of the deduction of expenditures for utility plant which resulted in amounts being collected from customers to pay income taxes in advance of when the income tax payments will be required. See “Cash Flows from Operating Activities,” above.
Capital Requirements and Resources
As of September 30, 2012, there was no material change in the Companies’ capital requirements, contractual obligations and capital resources compared to those disclosed under “Capital Requirements and Resources” in Item 1 of the Form 10-K other than as described below and in Note C to the Third Quarter Financial Statements.
In July 2012, Con Edison Development purchased a company that is developing 70 MW (AC) of solar energy projects in Alpaugh, California. In October 2012, Con Edison Development purchased two companies that are developing 40 MW (AC) of solar energy projects in Tulare and Kings County, California. Electricity generated by the projects is to be purchased by Pacific Gas and Electric Company pursuant to long-term power purchase agreements. See Note I to the Third Quarter Financial Statements.
Con Edison has increased its estimate of capital expenditures in 2012 by its competitive energy businesses from $119 million to approximately $500 million and in 2013 from $86 million to approximately $240 million to reflect the costs to purchase the solar energy companies and complete the projects. The acquisitions of the solar energy companies were funded at the closing with available cash balances and commercial paper issuances. Con Edison is evaluating long-term financing for the projects. Con Edison expects to receive investment tax credits or grants for the projects.
For each of the Companies, the ratio of earnings to fixed charges (Securities and Exchange Commission basis) for the nine months ended September 30, 2012 and 2011 and the twelve months ended December 31, 2011 was:
| Ratio of Earnings to Fixed Charges | ||||||||||||
|
For the Nine Months Ended
September 30, 2012 |
For the Twelve Months Ended
December 31, 2011 |
For the Nine Months Ended
September 30, 2011 |
||||||||||
|
Con Edison |
3.9 | 3.6 | 3.8 | |||||||||
|
CECONY |
3.9 | 3.8 | 3.9 | |||||||||
For each of the Companies, the common equity ratio at September 30, 2012 and December 31, 2011 was:
|
Common Equity Ratio (Percent of total capitalization) |
||||||||
| September 30, 2012 | December 31, 2011 | |||||||
|
Con Edison |
54.6 | 52.5 | ||||||
|
CECONY |
54.1 | 52.0 | ||||||
Regulatory Matters
CECONY’s current electric rate plan covers the three-year period ending March 31, 2013. Either the company or the New York State Public Service Commission (NYSPSC) can initiate a proceeding for a new rate plan. A new rate plan filed by the company would take effect automatically in approximately 11 months unless prior to such time the NYSPSC adopts a rate plan. CECONY understands that the base rates determined pursuant to the current rate plan and the other provisions of the current rate plan would continue in effect after March 31, 2013 until a new rate plan is effective. The company is preparing to
| 45 |
Table of Contents
file a new rate plan with the NYSPSC in November 2012. A new rate plan is expected to be effective in October 2013.
CECONY’s current gas and steam rate agreements cover the three-year period ending September 30, 2013. The company is preparing to file new gas and steam rate plans with the NYSPSC in November 2012. New gas and steam rate plans are expected to be effective in October 2013.
For information about a March 2012 NYSPSC order relating to a surcharge that CECONY was to have collected from customers and O&R’s February 2012 Joint Proposal (which was adopted by the NYSPSC in June 2012) with respect to its rates for electric service rendered in New York, see Note B to the Third Quarter Financial Statements.
Financial and Commodity Market Risks
The Companies are subject to various risks and uncertainties associated with financial and commodity markets. The most significant market risks include interest rate risk, commodity price risk, credit risk and investment risk.
Interest Rate Risk
The interest rate risk relates primarily to variable rate debt and to new debt financing needed to fund capital requirements, including the construction expenditures of the Utilities and maturing debt securities. Con Edison and its businesses manage interest rate risk through the issuance of mostly fixed-rate debt with varying maturities and through opportunistic refinancing of debt. Con Edison and CECONY estimate that at September 30, 2012, a 10 percent variation in interest rates applicable to its variable rate debt would not result in a material change in annual interest expense. Under CECONY’s current gas, steam and electric rate plans, variations in actual long-term debt interest rates are reconciled to levels reflected in rates. Under O&R’s current New York rate plans, variations in actual tax-exempt (and under the gas rate plan, taxable) long-term debt interest expense are reconciled to the level set in rates.
In addition, from time to time, Con Edison and its businesses enter into derivative financial instruments to hedge interest rate risk on certain debt securities. See “Interest Rate Swap” in Note J to the Third Quarter Financial Statements.
Commodity Price Risk
Con Edison’s commodity price risk relates primarily to the purchase and sale of electricity, gas and related derivative instruments. The Utilities and Con Edison’s competitive energy businesses apply risk management strategies to mitigate their related exposures. See Note J to the Third Quarter Financial Statements.
Con Edison estimates that, as of September 30, 2012, a 10 percent decline in market prices would result in a decline in fair value of $54 million for the derivative instruments used by the Utilities to hedge purchases of electricity and gas, of which $43 million is for CECONY and $11 million is for O&R. Con Edison expects that any such change in fair value would be largely offset by directionally opposite changes in the cost of the electricity and gas purchased. In accordance with provisions approved by state regulators, the Utilities generally recover from customers the costs they incur for energy purchased for their customers, including gains and losses on certain derivative instruments used to hedge energy purchased and related costs.
Con Edison’s competitive energy businesses use a value-at-risk (VaR) model to assess the market risk of their electricity and gas commodity fixed-price purchase and sales commitments, physical forward contracts and commodity derivative instruments. VaR represents the potential change in fair value of instruments or the portfolio due to changes in market factors, for a specified time period and confidence level. These businesses estimate VaR across their electricity and natural gas commodity businesses using a delta-normal variance/covariance model with a 95 percent confidence level. Since the VaR calculation involves complex methodologies and estimates and assumptions that are based on past experience, it is not necessarily indicative of future results. VaR for transactions associated with hedges on generating assets
| 46 |
Table of Contents
and commodity contracts, assuming a one-day holding period, for the nine months ended September 30, 2012 and the year ended December 31, 2011, respectively, was as follows:
|
95% Confidence Level, One-Day Holding Period |
September 30, 2012 | December 31, 2011 | ||||||
| (millions of dollars) | ||||||||
|
Average for the period |
$1 | $1 | ||||||
|
High |
1 | 1 | ||||||
|
Low |
— | — | ||||||
Credit Risk
The Companies are exposed to credit risk related to transactions entered into primarily for the various energy supply and hedging activities by the Utilities and the competitive energy businesses. Credit risk relates to the loss that may result from a counterparty’s nonperformance. The Companies use credit policies to manage this risk, including an established credit approval process, monitoring of counterparty limits, netting provisions within agreements and collateral or prepayment arrangements, credit insurance and credit default swaps. The Companies measure credit risk exposure as the replacement cost for open energy commodity and derivative positions plus amounts owed from counterparties for settled transactions. The replacement cost of open positions represents unrealized gains, net of any unrealized losses where the Companies have a legally enforceable right of setoff. See “Credit Exposure” in Note J to the Third Quarter Financial Statements.
Investment Risk
The Companies’ investment risk relates to the investment of plan assets for their pension and other postretirement benefit plans. The Companies’ current investment policy for pension plan assets includes investment targets of 60 percent equities and 40 percent fixed income and other securities. At September 30, 2012, the pension plan investments consisted of 62 percent equity and 38 percent fixed income and other securities.
Material Contingencies
For information concerning potential liabilities arising from the Companies’ material contingencies, see Notes B, G, and H to the Third Quarter Financial Statements.
Results of Operations
See “Results of Operations – Summary,” above.
Results of operations reflect, among other things, the Companies’ accounting policies and rate plans that limit the rates the Utilities can charge their customers. Under the revenue decoupling mechanisms currently applicable to CECONY’s electric and gas businesses and O&R’s electric and gas businesses in New York, the Utilities’ delivery revenues generally will not be affected by changes in delivery volumes from levels assumed when rates were approved. Delivery revenues for CECONY’s steam business and O&R’s businesses in New Jersey and Pennsylvania are affected by changes in delivery volumes resulting from weather, economic conditions and other factors. See Note B to the Third Quarter Financial Statements.
In general, the Utilities recover on a current basis the fuel, gas purchased for resale and purchased power costs they incur in supplying energy to their full-service customers. Accordingly, such costs do not generally affect the Companies’ results of operations. Management uses the term “net revenues” (operating revenues less such costs) to identify changes in operating revenues that may affect the Companies’ results of operations. Management believes that, although “net revenues” may not be a measure determined in accordance with accounting principles generally accepted in the United States of America, the measure facilitates the analysis by management and investors of the Companies’ results of operations.
Con Edison’s principal business segments are CECONY’s regulated utility activities, O&R’s regulated utility activities and Con Edison’s competitive energy businesses. CECONY’s principal business segments are its regulated electric, gas and steam utility activities. A discussion of the results of operations by principal business segment for the three and nine months ended September 30, 2012 and 2011 follows. For additional business segment financial information, see Note I to the Third Quarter Financial Statements.
| 47 |
Table of Contents
Three Months Ended September 30, 2012 Compared with Three Months Ended September 30, 2011
The Companies’ results of operations (which were discussed above under “Results of Operations – Summary”) in 2012 compared with 2011 were:
| CECONY | O&R |
Competitive Energy
Businesses and Other (a) |
Con Edison (b) | |||||||||||||||||||||||||||||
| (millions of dollars) |
Increases
(Decreases) Amount |
Increases
(Decreases) Percent |
Increases
(Decreases) Amount |
Increases
(Decreases) Percent |
Increases
(Decreases) Amount |
Increases
(Decreases) Percent |
Increases
(Decreases) Amount |
Increases
(Decreases) Percent |
||||||||||||||||||||||||
|
Operating revenues |
$ (49 | ) | (1.7 | )% | $(15 | ) | (6.2 | )% | $(127 | ) | (27.0 | )% | $(191 | ) | (5.3 | )% | ||||||||||||||||
|
Purchased power |
(132 | ) | (17.9 | ) | (25 | ) | (26.3 | ) | (152 | ) | (37.3 | ) | (309 | ) | (24.9 | ) | ||||||||||||||||
|
Fuel |
(14 | ) | (19.2 | ) | — | — | — | — | (14 | ) | (19.2 | ) | ||||||||||||||||||||
|
Gas purchased for resale |
(12 | ) | (21.1 | ) | 2 | 22.2 | (7 | ) | Large | (17 | ) | (23.3 | ) | |||||||||||||||||||
|
Operating revenues less purchased power, fuel and gas purchased for resale (net revenues) |
109 | 5.3 | 8 | 5.8 | 32 | 57.1 | 149 | 6.6 | ||||||||||||||||||||||||
|
Operations and maintenance |
47 | 6.9 | 1 | 1.4 | (5 | ) | (14.7 | ) | 43 | 5.5 | ||||||||||||||||||||||
|
Depreciation and amortization |
16 | 7.7 | 1 | 8.3 | 1 | Large | 18 | 8.1 | ||||||||||||||||||||||||
|
Taxes, other than income taxes |
(6 | ) | (1.3 | ) | — | — | (1 | ) | (20.0 | ) | (7 | ) | (1.4 | ) | ||||||||||||||||||
|
Operating income |
52 | 7.4 | 6 | 15.8 | 37 | Large | 95 | 12.6 | ||||||||||||||||||||||||
|
Other income less deductions |
8 | Large | (1 | ) | Large | (4 | ) | (66.7 | ) | 3 | Large | |||||||||||||||||||||
|
Net interest expense |
5 | 3.8 | — | — | 3 | 60.0 | 8 | 5.6 | ||||||||||||||||||||||||
|
Income before income tax expense |
55 | 9.8 | 5 | 15.2 | 30 | Large | 90 | 14.7 | ||||||||||||||||||||||||
|
Income tax expense |
22 | 10.7 | 1 | 7.7 | 13 | Large | 36 | 16.0 | ||||||||||||||||||||||||
|
Net income |
33 | 9.3 | 4 | 20.0 | 17 | Large | 54 | 14.0 | ||||||||||||||||||||||||
|
Preferred stock dividend requirements |
(3 | ) | Large | — | — | — | — | (3 | ) | Large | ||||||||||||||||||||||
|
Net income for common stock |
$ 36 | 10.2 | % | $ 4 | 20.0 | % | $ 17 | Large | $ 57 | 14.9 | % | |||||||||||||||||||||
| (a) | Includes inter-company and parent company accounting. |
| (b) | Represents the consolidated financial results of Con Edison and its businesses. |
CECONY
|
Three Months Ended
September 30, 2012 |
Three Months Ended
September 30, 2011 |
|||||||||||||||||||||||||||||||||||
| (millions of dollars) | Electric | Gas | Steam |
2012
Total |
Electric | Gas | Steam |
2011
Total |
2012-2011
Variation |
|||||||||||||||||||||||||||
|
Operating revenues |
$2,611 | $189 | $ 68 | $2,868 | $2,644 | $197 | $ 76 | $2,917 | $ (49 | ) | ||||||||||||||||||||||||||
|
Purchased power |
597 | — | 7 | 604 | 726 | — | 10 | 736 | (132 | ) | ||||||||||||||||||||||||||
|
Fuel |
42 | — | 17 | 59 | 51 | — | 22 | 73 | (14 | ) | ||||||||||||||||||||||||||
|
Gas purchased for resale |
— | 45 | — | 45 | — | 57 | — | 57 | (12 | ) | ||||||||||||||||||||||||||
|
Net revenues |
1,972 | 144 | 44 | 2,160 | 1,867 | 140 | 44 | 2,051 | 109 | |||||||||||||||||||||||||||
|
Operations and maintenance |
601 | 81 | 43 | 725 | 559 | 82 | 37 | 678 | 47 | |||||||||||||||||||||||||||
|
Depreciation and amortization |
179 | 31 | 15 | 225 | 166 | 28 | 15 | 209 | 16 | |||||||||||||||||||||||||||
|
Taxes, other than income taxes |
380 | 53 | 23 | 456 | 384 | 53 | 25 | 462 | (6 | ) | ||||||||||||||||||||||||||
|
Operating income |
$ 812 | $ (21 | ) | $(37 | ) | $ 754 | $ 758 | $ (23 | ) | $(33 | ) | $ 702 | $ 52 | |||||||||||||||||||||||
| 48 |
Table of Contents
Electric
CECONY’s results of electric operations for the three months ended September 30, 2012 compared with the 2011 period is as follows:
| Three Months Ended | ||||||||||||
| (millions of dollars) |
September 30,
2012 |
September 30,
2011 |
Variation | |||||||||
|
Operating revenues |
$2,611 | $2,644 | $ (33 | ) | ||||||||
|
Purchased power |
597 | 726 | (129 | ) | ||||||||
|
Fuel |
42 | 51 | (9 | ) | ||||||||
|
Net revenues |
1,972 | 1,867 | 105 | |||||||||
|
Operations and maintenance |
601 | 559 | 42 | |||||||||
|
Depreciation and amortization |
179 | 166 | 13 | |||||||||
|
Taxes, other than income taxes |
380 | 384 | (4 | ) | ||||||||
|
Electric operating income |
$ 812 | $ 758 | $ 54 | |||||||||
CECONY’s electric sales and deliveries, excluding off-system sales, for the three months ended September 30, 2012 compared with the 2011 period were:
| Millions of kWhs Delivered | Revenues in Millions | |||||||||||||||||||||||||||||||
| Three Months Ended | Three Months Ended | |||||||||||||||||||||||||||||||
| Description |
September 30,
2012 |
September 30,
2011 |
Variation |
Percent
Variation |
September 30,
2012 |
September 30,
2011 |
Variation |
Percent
Variation |
||||||||||||||||||||||||
|
Residential/Religious (a) |
3,735 | 3,808 | (73 | ) | (1.9 | )% | $ | 959 | $ | 999 | $ | (40 | ) | (4.0 | )% | |||||||||||||||||
|
Commercial/Industrial |
2,908 | 3,165 | (257 | ) | (8.1 | ) | 616 | 705 | (89 | ) | (12.6 | ) | ||||||||||||||||||||
|
Retail access customers |
7,874 | 7,151 | 723 | 10.1 | 894 | 766 | 128 | 16.7 | ||||||||||||||||||||||||
|
NYPA, Municipal Agency and other sales |
2,957 | 3,103 | (146 | ) | (4.7 | ) | 202 | 192 | 10 | 5.2 | ||||||||||||||||||||||
|
Other operating revenues |
— | — | — | — | (60 | ) | (18 | ) | (42 | ) | Large | |||||||||||||||||||||
|
Total |
17,474 | 17,227 | 247 | 1.4 | % | $ | 2,611 | $ | 2,644 | $ | (33 | ) | (1.2 | )% | ||||||||||||||||||
| (a) | “Residential/Religious” generally includes single-family dwellings, individual apartments in multi-family dwellings, religious organizations and certain other not-for-profit organizations. |
CECONY’s electric operating revenues decreased $33 million in the three months ended September 30, 2012 compared with the 2011 period due primarily to lower purchased power ($129 million) and fuel costs ($9 million), offset in part by higher revenues from the electric rate plan ($112 million). CECONY’s revenues from electric sales are subject to a revenue decoupling mechanism, as a result of which delivery revenues generally are not affected by changes in delivery volumes from levels assumed when rates were approved. Other electric operating revenues generally reflect changes in regulatory assets and liabilities in accordance with the revenue decoupling mechanism and other provisions of the company’s rate plan.
Electric delivery volumes in CECONY’s service area increased 1.4 percent in the three months ended September 30, 2012 compared with the 2011 period. After adjusting for variations, principally weather and billing days, electric delivery volumes in CECONY’s service area increased 2.0 percent in the three months ended September 30, 2012 compared with the 2011 period reflecting higher average use per customer.
CECONY’s electric purchased power costs decreased $129 million in the three months ended September 30, 2012 compared with the 2011 period due to a decrease in purchased volumes ($88 million) and unit costs ($41 million). Electric fuel costs decreased $9 million in the three months ended September 30, 2012 compared with the 2011 period due to lower unit costs ($16 million), offset by higher sendout volumes from the company’s electric generating facilities ($7 million).
CECONY’s electric operating income increased $54 million in the three months ended September 30, 2012 compared with the 2011 period. The increase reflects primarily higher net revenues ($105 million, due
| 49 |
Table of Contents
primarily to the electric rate plan) and lower taxes, other than income taxes ($4 million, principally property taxes), offset by higher operations and maintenance costs ($42 million) and higher depreciation and amortization ($13 million). The increase in operations and maintenance costs of $42 million is due primarily to higher pension expense ($40 million) and higher support and maintenance of company underground facilities to accommodate municipal projects ($2 million).
Gas
CECONY’s results of gas operations for the three months ended September 30, 2012 compared with the 2011 period is as follows:
| Three Months Ended | ||||||||||||
| (millions of dollars) |
September 30,
2012 |
September 30,
2011 |
Variation | |||||||||
|
Operating revenues |
$ | 189 | $ | 197 | $ | (8 | ) | |||||
|
Gas purchased for resale |
45 | 57 | (12 | ) | ||||||||
|
Net revenues |
144 | 140 | 4 | |||||||||
|
Operations and maintenance |
81 | 82 | (1 | ) | ||||||||
|
Depreciation and amortization |
31 | 28 | 3 | |||||||||
|
Taxes, other than income taxes |
53 | 53 | — | |||||||||
|
Gas operating income |
$ | (21 | ) | $ | (23 | ) | $ | 2 | ||||
CECONY’s gas sales and deliveries, excluding off-system sales, for the three months ended September 30, 2012 compared with the 2011 period were:
| Thousands of dths Delivered | Revenues in Millions | |||||||||||||||||||||||||||||||
| Three Months Ended | Three Months Ended | |||||||||||||||||||||||||||||||
| Description |
September 30,
2012 |
September 30,
2011 |
Variation |
Percent
Variation |
September 30,
2012 |
September 30,
2011 |
Variation |
Percent
Variation |
||||||||||||||||||||||||
|
Residential |
2,971 | 2,984 | (13 | ) | (0.4 | )% | $ | 75 | $ | 82 | $ | (7 | ) | (8.5 | )% | |||||||||||||||||
|
General |
3,415 | 3,453 | (38 | ) | (1.1 | ) | 38 | 45 | (7 | ) | (15.6 | ) | ||||||||||||||||||||
|
Firm transportation |
6,752 | 6,751 | 1 | — | 47 | 45 | 2 | 4.4 | ||||||||||||||||||||||||
|
Total firm sales and transportation |
13,138 | 13,188 | (50 | ) | (0.4 | ) | 160 | 172 | (12 | ) | (7.0 | ) | ||||||||||||||||||||
|
Interruptible sales (a) |
1,217 | 2,020 | (803 | ) | (39.8 | ) | — | 9 | (9 | ) | Large | |||||||||||||||||||||
|
NYPA |
13,716 | 13,401 | 315 | 2.4 | 1 | 1 | — | — | ||||||||||||||||||||||||
|
Generation plants |
29,644 | 26,501 | 3,143 | 11.9 | 10 | 9 | 1 | 11.1 | ||||||||||||||||||||||||
|
Other |
4,791 | 4,425 | 366 | 8.3 | 9 | 7 | 2 | 28.6 | ||||||||||||||||||||||||
|
Other operating revenues |
— | — | — | — | 9 | (1 | ) | 10 | Large | |||||||||||||||||||||||
|
Total |
62,506 | 59,535 | 2,971 | 5.0 | % | $ | 189 | $ | 197 | $ | (8 | ) | (4.1 | )% | ||||||||||||||||||
| (a) | Includes 2,801 mdths and 1,138 mdths for the three months ended September 30, 2012 and 2011, respectively, which are also reflected in firm transportation and other. |
CECONY’s gas operating revenues decreased $8 million in the three months ended September 30, 2012 compared with the 2011 period due primarily to a decrease in gas purchased for resale costs ($12 million). CECONY’s revenues from gas sales are subject to a revenue decoupling mechanism as a result of which delivery revenues are generally not affected by changes in delivery volumes from levels assumed when rates were approved. Other gas operating revenues generally reflect changes in regulatory assets and liabilities in accordance with the company’s rate plan.
CECONY’s sales and transportation volumes for firm customers decreased 0.4 percent in the three months ended September 30, 2012 compared with the 2011 period. After adjusting for variations, principally weather and billing days, firm gas sales and transportation volumes in the company’s service area decreased 1.0 percent in the three months ended September 30, 2012.
CECONY’s purchased gas cost decreased $12 million in the three months ended September 30, 2012 compared with the 2011 period due to lower unit costs ($18 million), offset by higher sendout volumes ($6 million).
CECONY’s gas operating income increased $2 million in the three months ended September 30, 2012 compared with the 2011 period. The increase reflects primarily higher net revenues ($4 million) and lower operations and maintenance costs ($1 million), offset by higher depreciation ($3 million).
| 50 |
Table of Contents
Steam
CECONY’s results of steam operations for the three months ended September 30, 2012 compared with the 2011 period is as follows:
| Three Months Ended | ||||||||||||
| (millions of dollars) |
September 30,
2012 |
September 30,
2011 |
Variation | |||||||||
|
Operating revenues |
$ | 68 | $ | 76 | $ | (8 | ) | |||||
|
Purchased power |
7 | 10 | (3 | ) | ||||||||
|
Fuel |
17 | 22 | (5 | ) | ||||||||
|
Net revenues |
44 | 44 | — | |||||||||
|
Operations and maintenance |
43 | 37 | 6 | |||||||||
|
Depreciation and amortization |
15 | 15 | — | |||||||||
|
Taxes, other than income taxes |
23 | 25 | (2 | ) | ||||||||
|
Steam operating income |
$ | (37 | ) | $ | (33 | ) | $ | (4 | ) | |||
CECONY’s steam sales and deliveries for the three months ended September 30, 2012 compared with the 2011 period were:
| Millions of Pounds Delivered | Revenues in Millions | |||||||||||||||||||||||||||||||
| Three Months Ended | Three Months Ended | |||||||||||||||||||||||||||||||
| Description |
September 30,
2012 |
September 30,
2011 |
Variation |
Percent
Variation |
September 30,
2012 |
September 30,
2011 |
Variation |
Percent
Variation |
||||||||||||||||||||||||
|
General |
15 | 15 | — | — | % | $ | 2 | $ | 2 | $ | — | — | % | |||||||||||||||||||
|
Apartment house |
816 | 799 | 17 | 2.1 | 17 | 17 | — | — | ||||||||||||||||||||||||
|
Annual power |
3,487 | 3,440 | 47 | 1.4 | 59 | 58 | 1 | 1.7 | ||||||||||||||||||||||||
|
Other operating revenues |
— | — | — | — | (10 | ) | (1 | ) | (9 | ) | Large | |||||||||||||||||||||
|
Total |
4,318 | 4,254 | 64 | 1.5 | % | $ | 68 | $ | 76 | $ | (8 | ) | (10.5 | )% | ||||||||||||||||||
CECONY’s steam operating revenues decreased $8 million in the three months ended September 30, 2012 compared with the 2011 period due primarily to lower fuel ($5 million) and purchased power costs ($3 million). Other steam operating revenues generally reflect changes in regulatory assets and liabilities in accordance with the company’s rate plan.
Steam sales and delivery volumes increased 1.5 percent in the three months ended September 30, 2012 compared with the 2011 period. After adjusting for variations, principally weather and billing days, steam sales and deliveries increased 1.9 percent in the three months ended September 30, 2012, reflecting higher average normalized use per customer.
CECONY’s steam fuel costs decreased $5 million in the three months ended September 30, 2012 compared with the 2011 period due to lower unit costs ($5 million). Steam purchased power costs decreased $3 million in the three months ended September 30, 2012 compared with the 2011 period due to a decrease in unit costs ($3 million).
Steam operating income decreased $4 million in the three months ended September 30, 2012 compared with the 2011 period. The decrease reflects primarily higher operations and maintenance costs ($6 million, due primarily to higher pension expense ($8 million)), offset by lower taxes, other than income taxes ($2 million, principally property taxes).
| 51 |
Table of Contents
Net Interest Expense
Net interest expense increased $5 million in the three months ended September 30, 2012 compared with the 2011 period due primarily to the issuance by CECONY in March 2012 of $400 million of 4.20 percent 30-year debentures.
O&R
|
Three Months Ended
September 30, 2012 |
Three Months Ended
September 30, 2011 |
|||||||||||||||||||||||||||
| (millions of dollars) | Electric | Gas |
2012
Total |
Electric | Gas |
2011
Total |
2012-2011
Variation |
|||||||||||||||||||||
|
Operating revenues |
$ | 199 | $ | 27 | $ | 226 | $ | 217 | $ | 24 | $ | 241 | $ | (15 | ) | |||||||||||||
|
Purchased power |
70 | — | 70 | 95 | — | 95 | (25 | ) | ||||||||||||||||||||
|
Gas purchased for resale |
— | 11 | 11 | — | 9 | 9 | 2 | |||||||||||||||||||||
|
Net revenues |
129 | 16 | 145 | 122 | 15 | 137 | 8 | |||||||||||||||||||||
|
Operations and maintenance |
57 | 15 | 72 | 56 | 15 | 71 | 1 | |||||||||||||||||||||
|
Depreciation and amortization |
10 | 3 | 13 | 9 | 3 | 12 | 1 | |||||||||||||||||||||
|
Taxes, other than income taxes |
12 | 4 | 16 | 13 | 3 | 16 | — | |||||||||||||||||||||
|
Operating income |
$ | 50 | $ | (6 | ) | $ | 44 | $ | 44 | $ | (6 | ) | $ | 38 | $ | 6 | ||||||||||||
Electric
O&R’s results of electric operations for the three months ended September 30, 2012 compared with the 2011 period is as follows:
| Three Months Ended | ||||||||||||
| (millions of dollars) |
September 30, 2012 |
September 30, 2011 |
Variation | |||||||||
|
Operating revenues |
$ | 199 | $ | 217 | $ | (18 | ) | |||||
|
Purchased power |
70 | 95 | (25 | ) | ||||||||
|
Net revenues |
129 | 122 | 7 | |||||||||
|
Operations and maintenance |
57 | 56 | 1 | |||||||||
|
Depreciation and amortization |
10 | 9 | 1 | |||||||||
|
Taxes, other than income taxes |
12 | 13 | (1 | ) | ||||||||
|
Electric operating income |
$ | 50 | $ | 44 | $ | 6 | ||||||
O&R’s electric sales and deliveries, excluding off-system sales, for the three months ended September 30, 2012 compared with the 2011 period were:
| Millions of kWhs Delivered | Revenues in Millions | |||||||||||||||||||||||||||||||
| Three Months Ended | Three Months Ended | |||||||||||||||||||||||||||||||
| Description |
September 30,
2012 |
September 30,
2011 |
Variation |
Percent
Variation |
September 30,
2012 |
September 30,
2011 |
Variation |
Percent
Variation |
||||||||||||||||||||||||
|
Residential/Religious (a) |
550 | 578 | (28 | ) | (4.8 | )% | $ | 97 | $ | 113 | $ | (16 | ) | (14.2 | )% | |||||||||||||||||
|
Commercial/Industrial |
247 | 315 | (68 | ) | (21.6 | ) | 38 | 49 | (11 | ) | (22.4 | ) | ||||||||||||||||||||
|
Retail access customers |
885 | 789 | 96 | 12.2 | 59 | 53 | 6 | 11.3 | ||||||||||||||||||||||||
|
Public authorities |
32 | 33 | (1 | ) | (3.0 | ) | 3 | 3 | — | — | ||||||||||||||||||||||
|
Other operating revenues |
— | — | — | — | 2 | (1 | ) | 3 | Large | |||||||||||||||||||||||
|
Total |
1,714 | 1,715 | (1 | ) | (0.1 | )% | $ | 199 | $ | 217 | $ | (18 | ) | (8.3 | )% | |||||||||||||||||
| (a) | “Residential/Religious” generally includes single-family dwellings, individual apartments in multi-family dwellings, religious organizations and certain other not-for-profit organizations. |
O&R’s electric operating revenues decreased $18 million in the three months ended September 30, 2012 compared with the 2011 period due primarily to lower purchased power costs ($25 million), offset in part by higher revenues from the New York rate plan ($3 million). O&R’s New York electric delivery revenues
| 52 |
Table of Contents
are subject to a revenue decoupling mechanism, as a result of which delivery revenues are generally not affected by changes in delivery volumes from levels assumed when rates were approved. O&R’s electric sales in New Jersey and Pennsylvania are not subject to a decoupling mechanism, and as a result, changes in such volumes do impact such revenues. Other electric operating revenues generally reflect changes in regulatory assets and liabilities in accordance with the company’s electric rate plan. See “Rate Agreements – O&R – Electric” in Note B to the Second Quarter Financial Statements.
Electric delivery volumes in O&R’s service area decreased 0.1 percent in the three months ended September 30, 2012 compared with the 2011 period. After adjusting for weather and other variations, electric delivery volumes in O&R’s service area increased 2.7 percent in the three months ended September 30, 2012 compared with the 2011 period.
Electric operating income increased $6 million in the three months ended September 30, 2012 compared with the 2011 period. The increase reflects primarily higher net revenues ($7 million) and lower taxes, other than income taxes ($1 million), offset by higher operations and maintenance costs ($1 million), and depreciation and amortization ($1 million).
Gas
O&R’s results of gas operations for the three months ended September 30, 2012 compared with the 2011 period is as follows:
| Three Months Ended | ||||||||||||
| (millions of dollars) |
September 30,
2012 |
September 30,
2011 |
Variation | |||||||||
|
Operating revenues |
$ | 27 | $ | 24 | $ | 3 | ||||||
|
Gas purchased for resale |
11 | 9 | 2 | |||||||||
|
Net revenues |
16 | 15 | 1 | |||||||||
|
Operations and maintenance |
15 | 15 | — | |||||||||
|
Depreciation and amortization |
3 | 3 | — | |||||||||
|
Taxes, other than income taxes |
4 | 3 | 1 | |||||||||
|
Gas operating income |
$ | (6 | ) | $ | (6 | ) | $ | — | ||||
O&R’s gas sales and deliveries, excluding off-system sales, for the three months ended September 30, 2012 compared with the 2011 period were:
| Thousands of dths Delivered | Revenues in Millions | |||||||||||||||||||||||||||||||
| Three Months Ended | Three Months Ended | |||||||||||||||||||||||||||||||
| Description |
September 30,
2012 |
September 30,
2011 |
Variation |
Percent
Variation |
September 30,
2012 |
September 30,
2011 |
Variation |
Percent
Variation |
||||||||||||||||||||||||
|
Residential |
433 | 380 | 53 | 13.9 | % | $ | 8 | $ | 8 | $ | — | — | % | |||||||||||||||||||
|
General |
103 | 77 | 26 | 33.8 | 1 | 1 | — | — | ||||||||||||||||||||||||
|
Firm transportation |
910 | 714 | 196 | 27.5 | 9 | 8 | 1 | 12.5 | ||||||||||||||||||||||||
|
Total firm sales and transportation |
1,446 | 1,171 | 275 | 23.5 | 18 | 17 | 1 | 5.9 | ||||||||||||||||||||||||
|
Interruptible sales |
995 | 907 | 88 | 9.7 | 1 | 1 | — | — | ||||||||||||||||||||||||
|
Generation plants |
444 | 359 | 85 | 23.7 | — | — | — | — | ||||||||||||||||||||||||
|
Other |
65 | 77 | (12 | ) | (15.6 | ) | — | — | — | — | ||||||||||||||||||||||
|
Other gas revenues |
— | — | — | — | 8 | 6 | 2 | 33.3 | ||||||||||||||||||||||||
|
Total |
2,950 | 2,514 | 436 | 17.3 | % | $ | 27 | $ | 24 | $ | 3 | 12.5 | % | |||||||||||||||||||
O&R’s gas operating revenues increased $3 million in the three months ended September 30, 2012 compared with the 2011 period due primarily to the increase in gas purchased for resale in 2012 ($2 million). O&R’s New York revenues from gas sales are subject to a revenue decoupling mechanism as a result of which delivery revenues are generally not affected by changes in delivery volumes from levels assumed when rates were approved.
| 53 |
Table of Contents
Sales and transportation volumes for firm customers increased 23.5 percent in the three months ended September 30, 2012 compared with the 2011 period. After adjusting for weather and other variations, total firm sales and transportation volumes decreased 5.3 percent in the three months ended September 30, 2012 compared with the 2011 period.
Gas operating income was the same in the three months ended September 30, 2012 compared with the 2011 period.
Competitive Energy Businesses
The competitive energy businesses’ results of operations for the three months ended September 30, 2012 compared with the 2011 period is as follows:
| Three Months Ended | ||||||||||||
| (millions of dollars) |
September 30,
2012 |
September 30,
2011 |
Variation | |||||||||
|
Operating revenues |
$ | 344 | $ | 472 | $ | (128 | ) | |||||
|
Purchased power |
256 | 408 | (152 | ) | ||||||||
|
Gas purchased for resale |
— | 6 | (6 | ) | ||||||||
|
Net revenues |
88 | 58 | 30 | |||||||||
|
Operations and maintenance |
29 | 35 | (6 | ) | ||||||||
|
Depreciation and amortization |
2 | 1 | 1 | |||||||||
|
Taxes, other than income taxes |
4 | 6 | (2 | ) | ||||||||
|
Operating income |
$ | 53 | $ | 16 | $ | 37 | ||||||
The competitive energy businesses’ operating revenues decreased $128 million in the three months ended September 30, 2012 compared with the 2011 period, due primarily to lower electric retail and wholesale revenues. Electric wholesale revenues decreased $47 million in the three months ended September 30, 2012 as compared with the 2011 period, due to lower unit prices ($27 million) and sales volumes ($20 million). Electric retail revenues decreased $81 million, due to lower unit prices ($44 million) and sales volume ($37 million). Net mark-to-market values increased $41 million in the three months ended September 30, 2012 as compared with the 2011 period, of which $32 million in gains are reflected in purchased power costs and $9 million in gains are reflected in revenues. Other revenues decreased $9 million in the three months ended September 30, 2012 as compared with the 2011 period due primarily to lower other wholesale revenue.
Purchased power costs decreased $152 million in the three months ended September 30, 2012 compared with the 2011 period, due primarily to lower volumes ($69 million), lower unit prices ($51 million) and changes in mark-to-market values ($32 million). Operating income increased $37 million in the three months ended September 30, 2012 compared with the 2011 period due primarily to net mark-to-market effects ($41 million).
Other
For Con Edison, “Other” includes inter-company eliminations relating to operating revenues and operating expenses.
| 54 |
Table of Contents
Nine Months Ended September 30, 2012 Compared with Nine Months Ended September 30, 2011
The Companies’ results of operations (which were discussed above under “Results of Operations – Summary”) in 2012 compared with 2011 were:
| CECONY | O&R |
Competitive Energy
Businesses and Other (a) |
Con Edison (b) | |||||||||||||||||||||||||||||
| (millions of dollars) |
Increases
(Decreases) Amount |
Increases
(Decreases) Percent |
Increases
(Decreases) Amount |
Increases
(Decreases) Percent |
Increases
(Decreases) Amount |
Increases
(Decreases) Percent |
Increases
(Decreases) Amount |
Increases
(Decreases) Percent |
||||||||||||||||||||||||
|
Operating revenues |
$ | (304 | ) | (3.8 | )% | $ | (59 | ) | (8.9 | )% | $ | (322 | ) | (25.4 | )% | $ | (685 | ) | (6.9 | )% | ||||||||||||
|
Purchased power |
(286 | ) | (15.5 | ) | (68 | ) | (31.2 | ) | (330 | ) | (31.0 | ) | (684 | ) | (21.9 | ) | ||||||||||||||||
|
Fuel |
(104 | ) | (32.8 | ) | — | — | — | — | (104 | ) | (32.8 | ) | ||||||||||||||||||||
|
Gas purchased for resale |
(148 | ) | (35.9 | ) | (14 | ) | (22.6 | ) | (15 | ) | (88.2 | ) | (177 | ) | (36.0 | ) | ||||||||||||||||
|
Operating revenues less purchased power, fuel and gas purchased for resale (net revenues) |
234 | 4.3 | 23 | 6.1 | 23 | 12.3 | 280 | 4.6 | ||||||||||||||||||||||||
|
Operations and maintenance |
159 | 8.3 | 7 | 3.3 | (14 | ) | (14.7 | ) | 152 | 6.9 | ||||||||||||||||||||||
|
Depreciation and amortization |
46 | 7.4 | 3 | 8.3 | 1 | 20.0 | 50 | 7.6 | ||||||||||||||||||||||||
|
Taxes, other than income taxes |
(30 | ) | (2.3 | ) | 4 | 9.8 | (1 | ) | (6.3 | ) | (27 | ) | (1.9 | ) | ||||||||||||||||||
|
Operating income |
59 | 3.6 | 9 | 9.9 | 37 | 52.1 | 105 | 5.9 | ||||||||||||||||||||||||
|
Other income less deductions |
1 | 33.3 | (3 | ) | Large | (7 | ) | (53.8 | ) | (9 | ) | (69.2 | ) | |||||||||||||||||||
|
Net interest expense |
10 | 2.5 | (4 | ) | (15.4 | ) | 1 | 5.3 | 7 | 1.6 | ||||||||||||||||||||||
|
Income before income tax expense |
50 | 4.1 | 10 | 14.7 | 29 | 44.6 | 89 | 6.6 | ||||||||||||||||||||||||
|
Income tax expense |
11 | 2.6 | — | — | 13 | 46.4 | 24 | 5.0 | ||||||||||||||||||||||||
|
Net income |
39 | 4.9 | 10 | 22.7 | 16 | 43.2 | 65 | 7.5 | ||||||||||||||||||||||||
|
Preferred stock dividend requirements |
(6 | ) | (66.7 | ) | — | — | — | — | (6 | ) | (66.7 | ) | ||||||||||||||||||||
|
Net income for common stock |
$ | 45 | 5.8 | % | $ | 10 | 22.7 | % | $ | 16 | 43.2 | % | $ | 71 | 8.3 | % | ||||||||||||||||
| (a) | Includes inter-company and parent company accounting. |
| (b) | Represents the consolidated financial results of Con Edison and its businesses. |
CECONY
|
Nine Months Ended September 30, 2012 |
Nine Months Ended September 30, 2011 |
|||||||||||||||||||||||||||||||||||
| (millions of dollars) | Electric | Gas | Steam |
2012
Total |
Electric | Gas | Steam |
2011
Total |
2012-2011
Variation |
|||||||||||||||||||||||||||
|
Operating revenues |
$ | 6,307 | $ | 1,017 | $ | 414 | $ | 7,738 | $ | 6,378 | $ | 1,156 | $ | 508 | $ | 8,042 | $ | (304 | ) | |||||||||||||||||
|
Purchased power |
1,527 | — | 27 | 1,554 | 1,799 | — | 41 | 1,840 | (286 | ) | ||||||||||||||||||||||||||
|
Fuel |
122 | — | 91 | 213 | 167 | — | 150 | 317 | (104 | ) | ||||||||||||||||||||||||||
|
Gas purchased for resale |
— | 264 | — | 264 | — | 412 | — | 412 | (148 | ) | ||||||||||||||||||||||||||
|
Net revenues |
4,658 | 753 | 296 | 5,707 | 4,412 | 744 | 317 | 5,473 | 234 | |||||||||||||||||||||||||||
|
Operations and maintenance |
1,691 | 242 | 132 | 2,065 | 1,522 | 275 | 109 | 1,906 | 159 | |||||||||||||||||||||||||||
|
Depreciation and amortization |
527 | 89 | 48 | 664 | 489 | 82 | 47 | 618 | 46 | |||||||||||||||||||||||||||
|
Taxes, other than income taxes |
1,057 | 167 | 76 | 1,300 | 1,075 | 175 | 80 | 1,330 | (30 | ) | ||||||||||||||||||||||||||
|
Operating income |
$ | 1,383 | $ | 255 | $ | 40 | $ | 1,678 | $ | 1,326 | $ | 212 | $ | 81 | $ | 1,619 | $ | 59 | ||||||||||||||||||
| 55 |
Table of Contents
Electric
CECONY’s results of electric operations for the nine months ended September 30, 2012 compared with the 2011 period is as follows:
| Nine Months Ended | ||||||||||||
| (millions of dollars) |
September 30,
2012 |
September 30,
2011 |
Variation | |||||||||
|
Operating revenues |
$ | 6,307 | $ | 6,378 | $ | (71 | ) | |||||
|
Purchased power |
1,527 | 1,799 | (272 | ) | ||||||||
|
Fuel |
122 | 167 | (45 | ) | ||||||||
|
Net revenues |
4,658 | 4,412 | 246 | |||||||||
|
Operations and maintenance |
1,691 | 1,522 | 169 | |||||||||
|
Depreciation and amortization |
527 | 489 | 38 | |||||||||
|
Taxes, other than income taxes |
1,057 | 1,075 | (18 | ) | ||||||||
|
Electric operating income |
$ | 1,383 | $ | 1,326 | $ | 57 | ||||||
CECONY’s electric sales and deliveries, excluding off-system sales, for the nine months ended September 30, 2012 compared with the 2011 period were:
| Millions of kWhs Delivered | Revenues in Millions | |||||||||||||||||||||||||||||||
| Nine Months Ended | Nine Months Ended | |||||||||||||||||||||||||||||||
| Description |
September 30,
2012 |
September 30,
2011 |
Variation |
Percent
Variation |
September 30,
2012 |
September 30,
2011 |
Variation |
Percent
Variation |
||||||||||||||||||||||||
|
Residential/Religious (a) |
8,393 | 8,934 | (541 | ) | (6.1 | )% | $ | 2,147 | $ | 2,299 | $ | (152 | ) | (6.6 | )% | |||||||||||||||||
|
Commercial/Industrial |
7,561 | 8,639 | (1,078 | ) | (12.5 | ) | 1,526 | 1,823 | (297 | ) | (16.3 | ) | ||||||||||||||||||||
|
Retail access customers |
19,768 | 18,339 | 1,429 | 7.8 | 2,117 | 1,794 | 323 | 18.0 | ||||||||||||||||||||||||
|
NYPA, Municipal Agency and other sales |
8,233 | 8,407 | (174 | ) | (2.1 | ) | 477 | 448 | 29 | 6.5 | ||||||||||||||||||||||
|
Other operating revenues |
— | — | — | 40 | 14 | 26 | Large | |||||||||||||||||||||||||
|
Total |
43,955 | 44,319 | (364 | ) | (0.8 | )% | $ | 6,307 | $ | 6,378 | $ | (71 | ) | (1.1 | )% | |||||||||||||||||
| (a) | “Residential/Religious” generally includes single-family dwellings, individual apartments in multi-family dwellings, religious organizations and certain other not-for-profit organizations. |
CECONY’s electric operating revenues decreased $71 million in the nine months ended September 30, 2012 compared with the 2011 period due primarily to lower purchased power ($272 million) and fuel costs ($45 million) offset in part by higher revenues from the electric rate plan ($270 million). CECONY’s revenues from electric sales are subject to a revenue decoupling mechanism, as a result of which delivery revenues generally are not affected by changes in delivery volumes from levels assumed when rates were approved. Other electric operating revenues generally reflect changes in regulatory assets and liabilities in accordance with the revenue decoupling mechanism and other provisions of the company’s rate plan.
Electric delivery volumes in CECONY’s service area decreased 0.8 percent in the nine months ended September 30, 2012 compared with the 2011 period. After adjusting for variations, principally weather and billing days, electric delivery volumes in CECONY’s service area increased 0.5 percent in the nine months ended September 30, 2012 compared with the 2011 period reflecting higher average use per customer.
CECONY’s electric purchased power costs decreased $272 million in the nine months ended September 30, 2012 compared with the 2011 period due to a decrease in purchased volumes ($224 million) and unit costs ($48 million). Electric fuel costs decreased $45 million in the nine months ended September 30, 2012 compared with the 2011 period due to lower unit costs ($51 million), offset by higher sendout volumes from the company’s electric generating facilities ($6 million).
CECONY’s electric operating income increased $57 million in the nine months ended September 30, 2012 compared with the 2011 period. The increase reflects primarily higher net revenues ($246 million, due primarily to the electric rate plan) and lower taxes,
| 56 |
Table of Contents
other than income taxes ($18 million, principally property taxes). The higher net revenues were offset by higher operations and maintenance costs ($169 million, due primarily to higher pension expense ($118 million), an increase in surcharges that are collected from customers ($35 million) and higher support and maintenance of company underground facilities to accommodate municipal projects ($11 million)) and higher depreciation and amortization ($38 million).
Gas
CECONY’s results of gas operations for the nine months ended September 30, 2012 compared with the 2011 period is as follows:
| Nine Months Ended | ||||||||||||
| (millions of dollars) |
September 30,
2012 |
September 30,
2011 |
Variation | |||||||||
|
Operating revenues |
$ | 1,017 | $ | 1,156 | $ | (139 | ) | |||||
|
Gas purchased for resale |
264 | 412 | (148 | ) | ||||||||
|
Net revenues |
753 | 744 | 9 | |||||||||
|
Operations and maintenance |
242 | 275 | (33 | ) | ||||||||
|
Depreciation and amortization |
89 | 82 | 7 | |||||||||
|
Taxes, other than income taxes |
167 | 175 | (8 | ) | ||||||||
|
Gas operating income |
$ | 255 | $ | 212 | $ | 43 | ||||||
CECONY’s gas sales and deliveries, excluding off-system sales, for the nine months ended September 30, 2012 compared with the 2011 period were:
| Thousands of dths Delivered | Revenues in Millions | |||||||||||||||||||||||||||||||
| Nine Months Ended | Nine Months Ended | |||||||||||||||||||||||||||||||
| Description |
September 30,
2012 |
September 30,
2011 |
Variation |
Percent
Variation |
September 30,
2012 |
September 30,
2011 |
Variation |
Percent
Variation |
||||||||||||||||||||||||
|
Residential |
24,590 | 30,384 | (5,794 | ) | (19.1 | )% | $ | 450 | $ | 553 | $ | (103 | ) | (18.6 | )% | |||||||||||||||||
|
General |
18,012 | 20,896 | (2,884 | ) | (13.8 | ) | 211 | 269 | (58 | ) | (21.6 | ) | ||||||||||||||||||||
|
Firm transportation |
38,620 | 41,859 | (3,239 | ) | (7.7 | ) | 284 | 263 | 21 | 8.0 | ||||||||||||||||||||||
|
Total firm sales and transportation |
81,222 | 93,139 | (11,917 | ) | (12.8 | ) | 945 | 1,085 | (140 | ) | (12.9 | ) | ||||||||||||||||||||
|
Interruptible sales (a) |
4,542 | 8,278 | (3,736 | ) | (45.1 | ) | 24 | 65 | (41 | ) | (63.1 | ) | ||||||||||||||||||||
|
NYPA |
34,285 | 24,536 | 9,749 | 39.7 | 2 | 2 | — | — | ||||||||||||||||||||||||
|
Generation plants |
63,161 | 60,706 | 2,455 | 4.0 | 23 | 25 | (2 | ) | (8.0 | ) | ||||||||||||||||||||||
|
Other |
17,128 | 17,245 | (117 | ) | (0.7 | ) | 30 | 40 | (10 | ) | (25.0 | ) | ||||||||||||||||||||
|
Other operating revenues |
— | — | — | — | (7 | ) | (61 | ) | 54 | 88.5 | ||||||||||||||||||||||
|
Total |
200,338 | 203,904 | (3,566 | ) | (1.7 | )% | $ | 1,017 | $ | 1,156 | $ | (139 | ) | (12.0 | )% | |||||||||||||||||
| (a) |
Includes 4,613 mdths and 3,214 mdths for the nine months ended September 30, 2012 and 2011, respectively, which are also reflected in firm transportation and other. |
CECONY’s gas operating revenues decreased $139 million in the nine months ended September 30, 2012 compared with the 2011 period due primarily to a decrease in gas purchased for resale costs ($148 million). CECONY’s revenues from gas sales are subject to a weather normalization clause and a revenue decoupling mechanism as a result of which delivery revenues are generally not affected by changes in delivery volumes from levels assumed when rates were approved. Other gas operating revenues generally reflect changes in regulatory assets and liabilities in accordance with the company’s rate plan.
CECONY’s sales and transportation volumes for firm customers decreased 12.8 percent in the nine months ended September 30, 2012 compared with the 2011 period. After adjusting for variations, principally weather and billing days, firm gas sales and transportation volumes in the company’s service area increased 0.6 percent in the nine months ended September 30, 2012.
| 57 |
Table of Contents
CECONY’s purchased gas cost decreased $148 million in the nine months ended September 30, 2012 compared with the 2011 period due to lower unit costs ($111 million) and sendout volumes ($37 million).
CECONY’s gas operating income increased $43 million in the nine months ended September 30, 2012 compared with the 2011 period. The increase reflects primarily lower operations and maintenance costs ($33 million, due primarily to a decrease in the surcharges that are collected from customers ($19 million) and higher support and maintenance of company underground facilities to accommodate municipal projects ($6 million)), lower taxes, other than income taxes ($8 million, principally property taxes and local revenue taxes) and higher net revenues ($9 million), offset by higher depreciation ($7 million).
Steam
CECONY’s results of steam operations for the nine months ended September 30, 2012 compared with the 2011 period is as follows:
| Nine Months Ended | ||||||||||||
| (millions of dollars) |
September 30,
2012 |
September 30,
2011 |
Variation | |||||||||
|
Operating revenues |
$ | 414 | $ | 508 | $ | (94 | ) | |||||
|
Purchased power |
27 | 41 | (14 | ) | ||||||||
|
Fuel |
91 | 150 | (59 | ) | ||||||||
|
Net revenues |
296 | 317 | (21 | ) | ||||||||
|
Operations and maintenance |
132 | 109 | 23 | |||||||||
|
Depreciation and amortization |
48 | 47 | 1 | |||||||||
|
Taxes, other than income taxes |
76 | 80 | (4 | ) | ||||||||
|
Steam operating income |
$ | 40 | $ | 81 | $ | (41 | ) | |||||
CECONY’s steam sales and deliveries for the nine months ended September 30, 2012 compared with the 2011 period were:
| Millions of Pounds Delivered | Revenues in Millions | |||||||||||||||||||||||||||||||
| Nine Months Ended | Nine Months Ended | |||||||||||||||||||||||||||||||
| Description |
September 30,
2012 |
September 30,
2011 |
Variation |
Percent
Variation |
September 30,
2012 |
September 30,
2011 |
Variation |
Percent
Variation |
||||||||||||||||||||||||
|
General |
308 | 422 | (114 | ) | (27.0 | )% | $ | 18 | $ | 22 | $ | (4 | ) | (18.2 | )% | |||||||||||||||||
|
Apartment house |
3,858 | 4,515 | (657 | ) | (14.6 | ) | 112 | 131 | (19 | ) | (14.5 | ) | ||||||||||||||||||||
|
Annual power |
10,999 | 13,041 | (2,042 | ) | (15.7 | ) | 315 | 375 | (60 | ) | (16.0 | ) | ||||||||||||||||||||
|
Other operating revenues |
— | — | — | — | (31 | ) | (20 | ) | (11 | ) | (55.0 | ) | ||||||||||||||||||||
|
Total |
15,165 | 17,978 | (2,813 | ) | (15.6 | )% | $ | 414 | $ | 508 | $ | (94 | ) | (18.5 | )% | |||||||||||||||||
CECONY’s steam operating revenues decreased $94 million in the nine months ended September 30, 2012 compared with the 2011 period due primarily to lower fuel ($59 million), the impact of milder weather ($47 million) and lower purchased power costs ($14 million), offset by the net change in rates under the steam rate plan ($29 million). Other steam operating revenues generally reflect changes in regulatory assets and liabilities in accordance with the company’s rate plan.
Steam sales and delivery volumes decreased 15.6 percent in the nine months ended September 30, 2012 compared with the 2011 period reflecting milder winter weather. After adjusting for variations, principally weather and billing days, steam sales and deliveries decreased 0.8 percent in the nine months ended September 30, 2012, reflecting lower average normalized use per customer.
CECONY’s steam fuel costs decreased $59 million in the nine months ended September 30, 2012 compared with the 2011 period due to lower unit costs ($44 million) and sendout volumes ($15 million). Steam purchased power costs decreased $14 million in the nine months ended September 30, 2012 compared with the 2011 period due to a decrease in unit costs ($38 million) offset by an increase in purchased volumes ($24 million).
| 58 |
Table of Contents
Steam operating income decreased $41 million in the nine months ended September 30, 2012 compared with the 2011 period. The decrease reflects primarily lower net revenues ($21 million), higher operations and maintenance costs ($23 million, due primarily to higher pension expense ($31 million)) and higher depreciation and amortization ($1 million), offset by lower taxes, other than income taxes ($4 million, principally property taxes and local revenue taxes).
Net Interest Expense
Net interest expense increased $10 million in the nine months ended September 30, 2012 compared with the 2011 period due primarily to the issuance by CECONY in March 2012 of $400 million of 4.20 percent 30-year debentures.
Income Taxes
Income taxes increased $11 million in the nine months ended September 30, 2012 compared with the 2011 period reflecting higher income before income tax expense, offset by higher deductions for injuries and damages payments in the 2012 period.
O&R
|
Nine Months Ended
September 30, 2012 |
Nine Months Ended September 30, 2011 |
|||||||||||||||||||||||||||
| (millions of dollars) | Electric | Gas |
2012
Total |
Electric | Gas |
2011
Total |
2012-2011
Variation |
|||||||||||||||||||||
|
Operating revenues |
$ | 457 | $ | 144 | $ | 601 | $ | 507 | $ | 153 | $ | 660 | $ | (59 | ) | |||||||||||||
|
Purchased power |
150 | — | 150 | 218 | — | 218 | (68 | ) | ||||||||||||||||||||
|
Gas purchased for resale |
— | 48 | 48 | — | 62 | 62 | (14 | ) | ||||||||||||||||||||
|
Net revenues |
307 | 96 | 403 | 289 | 91 | 380 | 23 | |||||||||||||||||||||
|
Operations and maintenance |
171 | 48 | 219 | 164 | 48 | 212 | 7 | |||||||||||||||||||||
|
Depreciation and amortization |
28 | 11 | 39 | 26 | 10 | 36 | 3 | |||||||||||||||||||||
|
Taxes, other than income taxes |
34 | 11 | 45 | 30 | 11 | 41 | 4 | |||||||||||||||||||||
|
Operating income |
$ | 74 | $ | 26 | $ | 100 | $ | 69 | $ | 22 | $ | 91 | $ | 9 | ||||||||||||||
Electric
O&R’s results of electric operations for the nine months ended September 30, 2012 compared with the 2011 period is as follows:
| Nine Months Ended | ||||||||||||
| (millions of dollars) |
September 30,
2012 |
September 30,
2011 |
Variation | |||||||||
|
Operating revenues |
$ | 457 | $ | 507 | $ | (50 | ) | |||||
|
Purchased power |
150 | 218 | (68 | ) | ||||||||
|
Net revenues |
307 | 289 | 18 | |||||||||
|
Operations and maintenance |
171 | 164 | 7 | |||||||||
|
Depreciation and amortization |
28 | 26 | 2 | |||||||||
|
Taxes, other than income taxes |
34 | 30 | 4 | |||||||||
|
Electric operating income |
$ | 74 | $ | 69 | $ | 5 | ||||||
| 59 |
Table of Contents
O&R’s electric sales and deliveries, excluding off-system sales, for the nine months ended September 30, 2012 compared with the 2011 period were:
| Millions of kWhs Delivered | Revenues in Millions | |||||||||||||||||||||||||||||||
| Nine Months Ended | Nine Months Ended | |||||||||||||||||||||||||||||||
| Description |
September 30,
2012 |
September 30,
2011 |
Variation |
Percent
Variation |
September 30,
2012 |
September 30,
2011 |
Variation |
Percent
Variation |
||||||||||||||||||||||||
|
Residential/Religious (a) |
1,297 | 1,388 | (91 | ) | (6.6 | )% | $ | 210 | $ | 253 | $ | (43 | ) | (17.0 | )% | |||||||||||||||||
|
Commercial/Industrial |
736 | 912 | (176 | ) | (19.3 | ) | 94 | 128 | (34 | ) | (26.6 | ) | ||||||||||||||||||||
|
Retail access customers |
2,315 | 2,079 | 236 | 11.4 | 138 | 121 | 17 | 14.0 | ||||||||||||||||||||||||
|
Public authorities |
89 | 83 | 6 | 7.2 | 7 | 8 | (1 | ) | (12.5 | ) | ||||||||||||||||||||||
|
Other operating revenues |
— | — | — | — | 8 | (3 | ) | 11 | Large | |||||||||||||||||||||||
|
Total |
4,437 | 4,462 | (25 | ) | (0.6 | )% | $ | 457 | $ | 507 | $ | (50 | ) | (9.9 | )% | |||||||||||||||||
| (a) | “Residential/Religious” generally includes single-family dwellings, individual apartments in multi-family dwellings, religious organizations and certain other not-for-profit organizations. |
O&R’s electric operating revenues decreased $50 million in the nine months ended September 30, 2012 compared with the 2011 period due primarily to lower purchased power costs ($68 million), offset in part by higher revenues from the New York rate plan ($8 million). O&R’s New York electric delivery revenues are subject to a revenue decoupling mechanism, as a result of which delivery revenues are generally not affected by changes in delivery volumes from levels assumed when rates were approved. O&R’s electric sales in New Jersey and Pennsylvania are not subject to a decoupling mechanism, and as a result, changes in such volumes do impact such revenues. Other electric operating revenues generally reflect changes in regulatory assets and liabilities in accordance with the company’s electric rate plan. See “Rate Agreements – O&R – Electric” in Note B to the Second Quarter Financial Statements.
Electric delivery volumes in O&R’s service area decreased 0.6 percent in the nine months ended September 30, 2012 compared with the 2011 period. After adjusting for weather and other variations, electric delivery volumes in O&R’s service area increased 1.8 percent in the nine months ended September 30, 2012 compared with the 2011 period.
Electric operating income increased $5 million in the nine months ended September 30, 2012 compared with the 2011 period. The increase reflects primarily higher net revenues ($18 million), offset by higher operations and maintenance costs ($7 million, due to higher pension and health care expense), taxes other than income taxes ($4 million, principally property taxes) and higher depreciation and amortization ($2 million).
Gas
O&R’s results of gas operations for the nine months ended September 30, 2012 compared with the 2011 period is as follows:
| Nine Months Ended | ||||||||||||
| (millions of dollars) |
September 30,
2012 |
September 30,
2011 |
Variation | |||||||||
|
Operating revenues |
$ | 144 | $ | 153 | $ | (9 | ) | |||||
|
Gas purchased for resale |
48 | 62 | (14 | ) | ||||||||
|
Net revenues |
96 | 91 | 5 | |||||||||
|
Operations and maintenance |
48 | 48 | — | |||||||||
|
Depreciation and amortization |
11 | 10 | 1 | |||||||||
|
Taxes, other than income taxes |
11 | 11 | — | |||||||||
|
Gas operating income |
$ | 26 | $ | 22 | $ | 4 | ||||||
| 60 |
Table of Contents
O&R’s gas sales and deliveries, excluding off-system sales, for the nine months ended September 30, 2012 compared with the 2011 period were:
| Thousands of dths Delivered | Revenues in Millions | |||||||||||||||||||||||||||||||
| Nine Months Ended | Nine Months Ended | |||||||||||||||||||||||||||||||
| Description |
September 30,
2012 |
September 30,
2011 |
Variation |
Percent
Variation |
September 30,
2012 |
September 30,
2011 |
Variation |
Percent
Variation |
||||||||||||||||||||||||
|
Residential |
4,114 | 5,127 | (1,013 | ) | (19.8 | )% | $ | 59 | $ | 76 | $ | (17 | ) | (22.4 | )% | |||||||||||||||||
|
General |
827 | 1,006 | (179 | ) | (17.8 | ) | 10 | 13 | (3 | ) | (23.1 | ) | ||||||||||||||||||||
|
Firm transportation |
6,860 | 7,672 | (812 | ) | (10.6 | ) | 54 | 52 | 2 | 3.8 | ||||||||||||||||||||||
|
Total firm sales and transportation |
11,801 | 13,805 | (2,004 | ) | (14.5 | ) | 123 | 141 | (18 | ) | (12.8 | ) | ||||||||||||||||||||
|
Interruptible sales |
3,250 | 3,213 | 37 | 1.2 | 3 | 3 | — | — | ||||||||||||||||||||||||
|
Generation plants |
444 | 1,109 | (665 | ) | (60.0 | ) | — | — | — | — | ||||||||||||||||||||||
|
Other |
506 | 612 | (106 | ) | (17.3 | ) | — | — | — | — | ||||||||||||||||||||||
|
Other gas revenues |
— | — | — | — | 18 | 9 | 9 | Large | ||||||||||||||||||||||||
|
Total |
16,001 | 18,739 | (2,738 | ) | (14.6 | )% | $ | 144 | $ | 153 | $ | (9 | ) | (5.9 | )% | |||||||||||||||||
O&R’s gas operating revenues decreased $9 million in the nine months ended September 30, 2012 compared with the 2011 period due primarily to the decrease in gas purchased for resale in 2012 ($14 million). O&R’s New York revenues from gas sales are subject to a weather normalization clause and a revenue decoupling mechanism as a result of which delivery revenues are generally not affected by changes in delivery volumes from levels assumed when rates were approved.
Sales and transportation volumes for firm customers decreased 14.5 percent in the nine months ended September 30, 2012 compared with the 2011 period. After adjusting for weather and other variations, total firm sales and transportation volumes increased 0.6 percent in the nine months ended September 30, 2012 compared with the 2011 period.
Gas operating income increased $4 million in the nine months ended September 30, 2012 compared with the 2011 period. The increase reflects primarily higher net revenues ($5 million), offset by higher depreciation and amortization ($1 million).
Competitive Energy Businesses
The competitive energy businesses’ results of operations for the nine months ended September 30, 2012 compared with the 2011 period is as follows:
| Nine Months Ended | ||||||||||||
| (millions of dollars) |
September 30,
2012 |
September 30,
2011 |
Variation | |||||||||
|
Operating revenues |
$ | 954 | $ | 1,286 | $ | (332 | ) | |||||
|
Purchased power |
736 | 1,076 | (340 | ) | ||||||||
|
Gas purchased for resale |
2 | 17 | (15 | ) | ||||||||
|
Net revenues |
216 | 193 | 23 | |||||||||
|
Operations and maintenance |
85 | 97 | (12 | ) | ||||||||
|
Depreciation and amortization |
6 | 5 | 1 | |||||||||
|
Taxes, other than income taxes |
14 | 16 | (2 | ) | ||||||||
|
Operating income |
$ | 111 | $ | 75 | $ | 36 | ||||||
The competitive energy businesses’ operating revenues decreased $332 million in the nine months ended September 30, 2012 compared with the 2011 period, due primarily to lower electric retail and wholesale revenues. Electric wholesale revenues decreased $122 million in the nine months ended September 30, 2012 as compared with the 2011 period, due to lower sales volumes ($93 million) and unit prices ($29 million). Electric retail revenues decreased $213 million, due to lower sales volume ($115 million) and unit prices ($98 million). Net mark-to-market values increased $37 million in the nine months ended September 30, 2012
| 61 |
Table of Contents
as compared with the 2011 period, of which $16 million in gains are reflected in purchased power costs and $21 million in gains are reflected in revenues. Other revenues decreased $18 million in the nine months ended September 30, 2012 as compared with the 2011 period due primarily to lower other wholesale revenue ($17 million) and energy services revenue ($16 million), offset by higher solar revenue ($14 million).
Purchased power costs decreased $340 million in the nine months ended September 30, 2012 compared with the 2011 period, due primarily to lower volumes ($175 million), lower unit prices ($149 million) and changes in mark-to-market values ($16 million). Operating income increased $36 million in the nine months ended September 30, 2012 compared with the 2011 due primarily to net mark-to-market effects ($37 million).
Other
For Con Edison, “Other” includes inter-company eliminations relating to operating revenues and operating expenses.
| 62 |
Table of Contents
For information about the Companies’ primary market risks associated with activities in derivative financial instruments, other financial instruments and derivative commodity instruments, see “Financial and Commodity Market Risks,” in Part I, Item 2 of this report, which information is incorporated herein by reference.
The Companies maintain disclosure controls and procedures designed to provide reasonable assurance that the information required to be disclosed in the reports that they submit to the Securities and Exchange Commission (SEC) is recorded, processed, summarized and reported within the time periods specified in the rules and forms of the SEC. Disclosure controls and procedures include, without limitation, controls and procedures designed to ensure that information required to be disclosed by an issuer in the reports that it files or submits under the Securities Exchange Act of 1934, as amended, is accumulated and communicated to the issuer’s management, including its principal executive and principal financial officers, or persons performing similar functions, as appropriate to allow timely decisions regarding required disclosure. For each of the Companies, its management, with the participation of its principal executive officer and principal financial officer, has evaluated its disclosure controls and procedures as of the end of the period covered by this report and, based on such evaluation, has concluded that the controls and procedures are effective to provide such reasonable assurance. Reasonable assurance is not absolute assurance, however, and there can be no assurance that any design of controls or procedures would be effective under all potential future conditions, regardless of how remote.
The Utilities have undertaken a project with the objective of improving business processes and information systems. The Utilities expect the project to reduce costs, improve support of operating activities, reduce financial reporting risks, and simplify compliance activities. The focus of the project is the new financial and supply chain enterprise resource planning information systems that the Utilities began to use in July 2012. The Utilities expect the project to enhance the processes used by employees to record financial transactions and analyze data; purchase materials and services and manage inventory; develop business plans and budgets and report financial and purchasing data. The project has materially affected the Companies’ internal control over financial reporting. There was no other change in the Companies’ internal control over financial reporting that occurred during the Companies’ most recent fiscal quarter that has materially affected, or is reasonably likely to materially affect, the Companies’ internal control over financial reporting.
| 63 |
Table of Contents
For information about certain legal proceedings affecting the Companies, see Notes B, G and H to the financial statements in Part I, Item 1 of this report, which information is incorporated herein by reference.
There were no material changes in the Companies’ risk factors compared to those disclosed in Item 1A of the Form 10-K.
ISSUER PURCHASES OF EQUITY SECURITIES
| Period |
Total
Number of Shares (or Units) Purchased* |
Average
per Share (or Unit) |
Total
Number of Shares (or Units) Purchased as Part of Publicly Announced Plans or Programs |
Maximum
Number (or Appropriate Dollar Value) of Shares (or Units) that May Yet Be Purchased Under the Plans or Programs |
||||||||||||
|
July 1, 2012 to July 31, 2012 |
107,165 | $62.91 | — | — | ||||||||||||
|
August 1, 2012 to August 31, 2012 |
46,777 | 63.88 | — | — | ||||||||||||
|
September 1, 2012 to September 30, 2012 |
49,752 | 59.66 | — | — | ||||||||||||
|
Total |
203,694 | $62.34 | — | — | ||||||||||||
| * | Represents Con Edison common shares purchased in open-market transactions. The number of shares purchased approximated the number of treasury shares used for the company’s employee stock plans. |
| 64 |
Table of Contents
CON EDISON
| Exhibit 12.1 | Statement of computation of Con Edison’s ratio of earnings to fixed charges for the nine-month periods ended September 30, 2012 and 2011, and the 12-month period ended December 31, 2011. | |
| Exhibit 31.1.1 | Rule 13a-14(a)/15d-14(a) Certifications – Chief Executive Officer. | |
| Exhibit 31.1.2 | Rule 13a-14(a)/15d-14(a) Certifications – Chief Financial Officer. | |
| Exhibit 32.1.1 | Section 1350 Certifications – Chief Executive Officer. | |
| Exhibit 32.1.2 | Section 1350 Certifications – Chief Financial Officer. | |
| Exhibit 101.INS | XBRL Instance Document. | |
| Exhibit 101.SCH | XBRL Taxonomy Extension Schema. | |
| Exhibit 101.CAL | XBRL Taxonomy Extension Calculation Linkbase. | |
| Exhibit 101.DEF | XBRL Taxonomy Extension Definition Linkbase. | |
| Exhibit 101.LAB | XBRL Taxonomy Extension Label Linkbase. | |
| Exhibit 101.PRE | XBRL Taxonomy Extension Presentation Linkbase. | |
CECONY
| Exhibit 12.2 | Statement of computation of CECONY’s ratio of earnings to fixed charges for the nine-month periods ended September 30, 2012 and 2011, and the 12-month period ended December 31, 2011. | |
| Exhibit 31.2.1 | Rule 13a-14(a)/15d-14(a) Certifications – Chief Executive Officer. | |
| Exhibit 31.2.2 | Rule 13a-14(a)/15d-14(a) Certifications – Chief Financial Officer. | |
| Exhibit 32.2.1 | Section 1350 Certifications – Chief Executive Officer. | |
| Exhibit 32.2.2 | Section 1350 Certifications – Chief Financial Officer. | |
| Exhibit 101.INS | XBRL Instance Document. | |
| Exhibit 101.SCH | XBRL Taxonomy Extension Schema. | |
| Exhibit 101.CAL | XBRL Taxonomy Extension Calculation Linkbase. | |
| Exhibit 101.DEF | XBRL Taxonomy Extension Definition Linkbase. | |
| Exhibit 101.LAB | XBRL Taxonomy Extension Label Linkbase. | |
| Exhibit 101.PRE | XBRL Taxonomy Extension Presentation Linkbase. | |
| 65 |
Table of Contents
Pursuant to the requirements of the Securities Exchange Act of 1934, each Registrant has duly caused this report to be signed on its behalf by the undersigned thereunto duly authorized.
| CONSOLIDATED EDISON, INC. | ||||||
| CONSOLIDATED EDISON COMPANY OF NEW YORK, INC. | ||||||
| DATE: November 5, 2012 | By | /s/ Robert Hoglund | ||||
|
Robert Hoglund Senior Vice President, Chief Financial Officer and Duly Authorized Officer |
||||||
| 66 |