EURONET WORLDWIDE INC
10-Ks and 10-Qs
|
|
|
|
|
|
|
|
|
|
|
|
|
|
|
|
|
|
|
|
|
|
|
|
|
|
|
|
|
|
|
|
|
|
|
|
|
|
|
|
|
|
|
|
|
|
|
|
|
|
|
|
|
UNITED STATES
SECURITIES AND EXCHANGE COMMISSION
WASHINGTON, D.C. 20549
_________________________
FORM 10-K
_________________________
|
(Mark One)
|
|
|
þ
|
ANNUAL REPORT PURSUANT TO SECTION 13 OR 15(d) OF THE SECURITIES EXCHANGE ACT OF 1934
|
|
For the fiscal year ended: December 31, 2018
|
|
|
OR
|
|
|
¨
|
TRANSITION REPORT PURSUANT TO SECTION 13 OR 15(d) OF THE SECURITIES EXCHANGE ACT OF 1934
|
|
For the transition period from to
|
|
Commission File Number 001-31648
EURONET WORLDWIDE, INC.
(Exact name of Registrant as specified in its charter)
________________________
|
DELAWARE
|
74-2806888
|
|
(State or other jurisdiction of incorporation or organization)
|
(I.R.S. Employer Identification No.)
|
|
3500 COLLEGE BOULEVARD
LEAWOOD, KANSAS
|
66211
|
|
(Address of principal executive offices)
|
(Zip Code)
|
(913) 327-4200
(Registrant's telephone number, including area code)
Securities registered pursuant to Section 12(b) of the Act:
|
Title of Each Class
|
Name of Each Exchange on Which Registered
|
|
Common Stock, $0.02 par value
|
The Nasdaq Stock Market, LLC
|
Securities registered pursuant to Section 12(g) of the Act: None
_________________________
Indicate by check mark if the registrant is a well-known seasoned issuer, as defined in Rule 405 of the Securities Act. Yes
þ
No
¨
Indicate by check mark if the registrant is not required to file reports pursuant to Section 13 or Section 15(d) of the Act. Yes
¨
No
þ
Indicate by check mark whether the registrant (1) has filed all reports required to be filed by Section 13 or 15(d) of the Securities Exchange Act of 1934 during the preceding 12 months (or for such shorter period that the registrant was required to file such reports), and (2) has been subject to such filing requirements for the past 90 days. Yes
þ
No
¨
Indicate by check mark whether the registrant has submitted electronically, every Interactive Data File required to be submitted pursuant to Rule 405 of Regulation S-T (§232.405 of this chapter) during the preceding 12 months (or for such shorter period that the registrant was required to submit such files). Yes
þ
No
¨
Indicate by check mark if disclosure of delinquent filers pursuant to Item 405 of Regulation S-K (§229.405 of this chapter) is not contained herein, and will not be contained, to the best of registrant's knowledge, in definitive proxy or information statements incorporated by reference in Part III of this Form 10-K or any amendment to this Form 10-K.
¨
Indicate by check mark whether the registrant is a large accelerated filer, an accelerated filer, a non-accelerated filer, smaller reporting company, or an emerging growth company. See the definitions of “large accelerated filer,” “accelerated filer,” “smaller reporting company” and “emerging growth company” in Rule 12b-2 of the Exchange Act.
|
Large accelerated filer
þ
|
Accelerated filer
o
|
Non-accelerated filer
o
|
|
|
Smaller reporting company
o
|
Emerging growth company
o
|
||
|
|
|||
|
If an emerging growth company, indicate by check mark if the registrant has elected not to use the extended transition period for complying with any new or revised financial accounting standards provided pursuant to Section 13(a) of the Exchange Act.
o
|
|||
Indicate by check mark whether the registrant is a shell company (as defined in Rule 12b-2 of the Act). Yes
¨
No
þ
As of
June 29, 2018
, the aggregate market value of the voting and non-voting common equity held by non-affiliates of the registrant was approximately
$4.1 billion
. The aggregate market value was determined based on the closing price of the Common Stock on
June 29, 2018
.
As of
February 27, 2019
, the registrant had
51,871,238
shares of Common Stock outstanding.
Documents Incorporated By Reference
Portions of the registrant's Proxy Statement for its
2019
Annual Meeting of Stockholders, which will be filed with the Securities and Exchange Commission no later than 120 days after
December 31, 2018
, are incorporated by reference into Part III of this Annual Report on Form 10-K.
Table of Contents
|
Item Number
|
Item Description
|
Page
|
|
Item 1.
|
||
|
Item IA.
|
||
|
Item 1B.
|
||
|
Item 2.
|
||
|
Item 3.
|
||
|
Item 4
|
||
|
Item 5.
|
||
|
Item 6.
|
||
|
Item 7.
|
||
|
Item 7A.
|
||
|
Item 8.
|
||
|
Item 9.
|
||
|
Item 9A.
|
||
|
Item 9B.
|
||
|
Item 10.
|
||
|
Item 11.
|
||
|
Item 12.
|
||
|
Item 13.
|
||
|
Item 14.
|
||
|
Item 15.
|
||
Part I
Item 1. Business
References in this report to
“we,” “our,” “us,” the “Company”
and
“Euronet”
refer to Euronet Worldwide, Inc. and its subsidiaries unless the context requires otherwise.
Business Overview
General Overview
Euronet is a leading electronic payments provider. We offer payment and transaction processing and distribution solutions to financial institutions, retailers, service providers and individual consumers. Our primary product offerings include comprehensive automated teller machine (“ATM”), point-of-sale (“POS”), card outsourcing, card issuing and merchant acquiring services; software solutions and cloud based payment solutions; electronic distribution of prepaid mobile airtime and other electronic payment products; foreign exchange services and global money transfer services.
Core Business Segments
We operate in the following three segments as of
December 31, 2018
:
The EFT Processing Segment processes transactions for a network of
40,354
ATMs and approximately
293,000
POS terminals across Europe, the Middle East and Asia Pacific. We provide comprehensive electronic payment solutions consisting of ATM cash withdrawal and deposit services, ATM network participation, outsourced ATM and POS management solutions, credit and debit card outsourcing, and card issuing and merchant acquiring services. In addition to our core business, we offer a variety of value added services, including ATM and POS dynamic currency conversion, domestic and international surcharge, advertising, customer relationship management (“CRM”), mobile top-up, bill payment, fraud management, foreign remittance payout, cardless payout, banknote recycling solutions and tax-refund services. Through this segment, we also offer a suite of integrated electronic financial transaction (“EFT”) software solutions for electronic payment and transaction delivery systems. In
2018
, the EFT Processing Segment accounted for approximately
30%
of Euronet's consolidated revenues.
The epay Segment provides distribution and processing of prepaid mobile airtime and other electronic content and payment processing services for various prepaid products, cards and services throughout its worldwide distribution network. We operate a network that includes approximately
719,000
POS terminals that enable electronic processing of prepaid mobile airtime “top-up” services and other non-mobile content in Europe, the Middle East, Asia Pacific, the United States and South America. We also provide vouchers and physical gift fulfillment services in Europe, gift card distribution and processing services in most of our markets and digital code distribution in a growing number of markets. In
2018
, the epay Segment accounted for approximately
29%
of Euronet's consolidated revenues.
The Money Transfer Segment provides global consumer-to-consumer money transfer services, primarily under the brand names Ria, AFEX Money Express, and IME, and global account-to-account money transfer services under the brand names HiFX and xe. We offer services under the brand names Ria, AFEX Money Express and IME through a network of sending agents, Company-owned stores (primarily in North America, Europe and Malaysia) and our websites (riamoneytransfer.com and online.imeremit.com), disbursing money transfers through a worldwide correspondent network that includes approximately
369,000
locations. xe is a provider of foreign currency exchange information on its currency data websites (www.xe.com and www.x-rates.com). We offer global account-to-account money transfer services under the brand names HiFX and xe through our websites (www.xe.com and https://transferxe.com) and xe and HiFX customer service representatives. Late in 2018, we started the process of rebranding our HiFX global account-to-account money transfer services, integrating them under the single brand name of xe. We anticipate that this process will be completed globally during the first half of 2019. In addition to money transfers, we offer customers bill payment services (primarily in the U.S.), payment alternatives such as money orders, comprehensive check cashing services for a wide variety of issued checks, along with competitive foreign currency exchange services and mobile top-up. Through our HiFM brand, we offer cash management solutions and foreign currency risk management services to small-to-medium sized businesses. We are one of the largest global money transfer companies in terms of revenues and transaction volumes. In
2018
, the Money Transfer Segment accounted for approximately
41%
of Euronet's consolidated revenues.
3
Euronet conducts business globally, serving customers in approximately
165
countries. We have
13
transaction processing centers, including
six
in Europe,
five
in Asia Pacific and
two
in North America. We also maintain
65
business offices that are located in
41
countries. Our corporate offices are located in Leawood, Kansas, USA.
Historical Perspective
Euronet was established in 1994 as Euronet Bank Access Kft., a Hungarian limited liability company. Operations began in 1995 when we established a processing center in Budapest, Hungary and installed our first ATMs in Hungary, followed by Poland and Germany in 1996. Euronet was reorganized in March 1997, in connection with its initial public offering, and at that time, our operating entities became wholly owned subsidiaries of Euronet Services, Inc., a Delaware corporation. We changed our name from Euronet Services, Inc. to Euronet Worldwide, Inc. in August 2001.
Initially, most of Euronet's resources were devoted to establishing and expanding the ATM network and ATM management services business in Europe. In December 1998, we acquired Arkansas Systems, Inc. (now known as "Euronet USA"), a U.S.-based company that produces electronic payment and transaction delivery systems software for retail banks internationally, which resulted in significant ongoing savings in third-party licensing, services and maintenance costs. By the end of 1998, we were doing business in Hungary, Poland, Germany, the Czech Republic and Croatia. From 1998 until 2005, we developed networks in India, Slovakia, Serbia and Bulgaria.
In 2005, we expanded the product offerings of the EFT Processing Segment through the acquisition of Instreamline S.A., a Greek company that provides credit card and POS outsourcing services in addition to debit card and transaction gateway switching services in Greece and the Balkan region. In 2007, we combined our EFT and Software segments as both businesses are strategically aligned due to the fact that our software segment primarily supports our EFT service offerings and processing centers. In 2009 Euronet, through one of its group companies, was granted authorization as an e-money institution in the United Kingdom ("U.K.") under the E-Money Directive of the European Union ("E.U."). In 2011, the Second E-Money Directive ("2EMD") came into effect. 2EMD enables authorized e-money institutions to provide payment services and issue e-money throughout the European Economic Area ("EEA") under a single regulatory framework. As a result of 2EMD, Euronet, through one of its group companies, obtained relevant memberships of Visa and MasterCard during 2011. By obtaining the status as an authorized e-money institution together with its principal memberships of Visa and MasterCard, Euronet has been able to expand its Independent ATM Deployed ("IAD") networks across Europe. In 2018, Euronet, through one of its group companies, was reauthorized by the U.K. Financial Conduct Authority to provide payment services under the Second Payment Services Directive (“PSD2”) as well as continue to provide e-money serves under the 2EMD. By the end of
2018
, Euronet's IAD network of ATMs had expanded to include 24 countries. Our product portfolio for the EFT Processing Segment operates in 86 countries.
In 2003, Euronet added a complementary business line through the acquisition of epay Limited (“epay”), which had offices in the U.K. and Australia. Through subsequent acquisitions between 2003 and 2011, the epay Segment continued to expand in Europe (Germany, Romania, Spain and the U.K.), the U.S., the Middle East, Asia and Brazil, and established new offices in New Zealand, Poland, India and Italy. We believe the epay Segment is the world's leading international network for distribution and processing of prepaid mobile airtime ("top-up") as well as other electronic payment products and services.
In 2007, we established the Money Transfer Segment after completing the acquisition of Los Angeles-based Ria, one of the largest global money transfer companies in terms of revenues and transaction volumes. Established in 1987, Ria originates and terminates transactions through a network of sending agents and Company-owned stores located around the world. In November 2009, Ria obtained a payment services license under the E.U.'s Payment Services Directive ("PSD") from the U.K. Financial Services Authority, (now the Financial Conduct Authority), which allowed Ria to operate under one license and one regulator for all EEA Member States ("Member States"). Ria also obtained payment services licenses in Spain and France. The licenses also facilitated expansion into new markets through the sales of money transfers through agents in countries where the use of agents was not previously permitted. Ria became reauthorized under PSD2 in 2018. In 2014, Euronet added a complementary product to the money transfer portfolio through the acquisition of HiFX, which offers account-to-account international payment services to high-income individuals and small-to-medium sized businesses. In 2015, we completed the acquisition of IME (M) Sdn Bhd ("IME") which provided Euronet with immediate entry into the Asian and Middle East money transfer send markets. In 2015, we also added a complementary business line through the acquisition of xe Corporation ("xe"), which provides currency-related data and international payment services. In addition to expanding its money transfer network, the segment expanded its product portfolio to offer complementary non-money transfer products such as bill payment and check cashing, and prepaid services in conjunction with the epay Segment.
In October 2016, the Company completed the acquisition of YourCash Europe Limited and its subsidiaries (“YourCash”). YourCash is a company incorporated in England that owns and operates primarily merchant filled ATMs in the United
4
Kingdom, Netherlands, and Ireland. In March 2018, the Company completed the acquisition of Innova Tax Free Group S.L. and its subsidiaries (“Innova”). Innova is a company incorporated in Spain and offers tax refunds services to consumers in Spain, Portugal, United Kingdom, France, Italy and Germany. In May 2018, the Company acquired Easycash Ireland Limited (“Easycash”). Easycash owns and operates a network of ATMs in the Republic of Ireland.
Business Segment Overview
For a discussion of operating results by segment, please see Item 7 - Management's Discussion and Analysis of Financial Condition and Results of Operations, and Note 16, Business Segment Information, to the Consolidated Financial Statements.
EFT Processing Segment
Overview
Our EFT Processing Segment provides comprehensive electronic payment solutions consisting of ATM cash withdrawal and deposit services, ATM network participation, outsourced ATM and POS management solutions, credit and debit card outsourcing; card issuing and merchant acquiring services. In addition to our core business, we offer a variety of value added services, including ATM and POS dynamic currency conversion, domestic and international surcharge, advertising, CRM, prepaid mobile top-up, bill payment, money transfer, fraud management, foreign remittance payout, cardless payout, banknote recycling solutions and tax-refund services. We provide these services either through our Euronet-owned ATMs and POS terminals, through contracts under which we operate ATMs and POS terminals on behalf of our customers or, for certain services, as stand alone products. Through this segment, we also offer a suite of integrated EFT software solutions for electronic payment and transaction delivery systems.
The major sources of revenues generated by our ATM network are recurring monthly management fees, transaction-based fees, surcharges and margins earned on dynamic currency conversion transactions. We receive fixed monthly fees under many of our outsourced management contracts. The EFT Processing Segment also generates revenues from POS operations and merchant management, card network management for credit, debit, prepaid and loyalty cards, prepaid mobile airtime recharge and other electronic content on ATMs and ATM advertising. We primarily service financial institutions in the developing markets of Central, Eastern and Southern Europe (Hungary, Poland, the Czech Republic, Croatia, Romania, Serbia, Greece and Ukraine), the Middle East and Asia Pacific (India, China, Malaysia and Pakistan), as well as several developed countries of Western Europe. As of
December 31, 2018
, we operated
40,354
ATMs compared to
37,133
at
December 31,
2017
. The increase was largely due to the expansion of our ATM networks in India and several European countries, and the acquisition of Easycash.
We monitor the number of transactions made by cardholders on our network. These include cash withdrawals, balance inquiries, deposits, prepaid mobile airtime recharge purchases, dynamic currency conversion transactions and certain denied (unauthorized) transactions. We do not bill certain transactions on our network to financial institutions, and we have excluded these transactions for reporting purposes. The number of transactions processed over our networks has increased over the last five years at a compound annual growth rate (“CAGR”) of approximately
21.2%
as indicated in the following table:
|
(in millions)
|
2014
|
2015
|
2016
|
2017
|
2018
|
|
EFT Processing transactions per year
|
1,262
|
1,523
|
1,885
|
2,352
|
2,721
|
Our processing centers for the EFT Processing Segment are located in
Budapest, Hungary; Mumbai, India; Beijing, China; and Karachi, Pakistan
. Our processing centers run two types of proprietary transaction switching software: our legacy ITM software, which we have used and sold to banks since 1998 through our Software Solutions unit, and a new, innovative switching software package named “REN” which is hosted in Martinsried, Germany. The software operates 24 hours a day, seven days a week. We have been progressively transitioning all of our networks to REN.
EFT Processing Products and Services
Outsourced Management Solutions
Euronet offers outsourced management services to financial institutions, merchants, mobile phone operators and other organizations using our processing centers' electronic financial transaction processing software. Our outsourced management services include management of existing ATM networks, development of new ATM networks, management of POS networks, management of automated deposit terminals, management of credit and debit card databases and other financial processing services. These services include 24-hour monitoring of each ATM's status and cash condition, managing the cash levels in each
5
ATM, coordinating the cash delivery and providing automatic dispatches for necessary service calls. We also provide real-time transaction authorization, advanced monitoring, network gateway access, network switching, 24-hour customer service, maintenance, cash settlement and reconciliation, forecasting and reporting. Since our infrastructure can support a significant increase in transactions, any new outsourced management services agreements should provide additional revenue with lower incremental cost.
Our outsourced management services agreements generally provide for fixed monthly management fees and, in most cases, fees payable for each transaction. The transaction fees under these agreements are generally lower than those under card acceptance agreements.
Euronet-Branded ATM Transaction Processing
Our Euronet-branded ATM networks, also known as IAD networks, are primarily managed by a processing center that uses our internally developed software solutions. The ATMs in our IAD networks are able to process transactions for holders of credit and debit cards issued by or bearing the logos of financial institutions and international card organizations such as American Express
®
, Visa
®
, MasterCard
®
, Diners Club International
®
, Discover
®
and UnionPay International
©
, as well as international ATM networks such as PULSE
®
. This is accomplished through our agreements and relationships with these institutions, international credit and debit card issuers and international card associations.
When a bank cardholder conducts a transaction on a Euronet-owned ATM or automated deposit terminal ("ADT"), we receive a fee from the cardholder's bank for that transaction. The bank pays us this fee either directly or indirectly through a central switching and settlement network. When paid indirectly, this fee is referred to as the “interchange fee.” All of the banks in a shared ATM and POS switching system establish the amount of the interchange fee by agreement. We receive transaction-processing fees for successful transactions and, in certain circumstances, for transactions that are not completed because they fail to receive authorization. The fees paid to us by the card issuers are independent of any fees charged by the card issuers to cardholders in connection with the ATM transactions. In some cases, we may also charge a direct access fee or surcharge to cardholders at the ATM. The direct access fee is added to the amount of the cash withdrawal and debited to the cardholder's account.
We generally receive fees or earn margin from our customers for six types of ATM transactions:
|
•
|
Cash withdrawals;
|
|
•
|
Cash deposits;
|
|
•
|
Balance inquiries;
|
|
•
|
Transactions not completed because the relevant card issuer does not give authorization;
|
|
•
|
Dynamic currency conversion; and
|
|
•
|
Prepaid telecommunication recharges and other electronic content.
|
Card Acceptance or Sponsorship Agreements
Our agreements with financial institutions and international card organizations generally provide that all credit and debit cards issued by the customer financial institution or organization may be used at all ATMs that we operate in a given market. In most markets, we act under sponsorship by our own e-money licensed entity, Euronet 360 Finance Limited ("E360"). In a few markets, we have agreements with a financial institution under which we are designated as a service provider (which we refer to as “sponsorship agreements”) for the acceptance of cards bearing international logos, such as Visa and MasterCard. These card acceptance or sponsorship agreements allow us to receive transaction authorization directly from the card issuing institution or international card organizations on a stand-in basis. Our agreements generally provide for a term of three to seven years and renew automatically unless either party provides notice of non-renewal prior to the termination date. In some cases, the agreements are terminable by either party upon six months' notice. We are generally able to connect a financial institution to our network within 30 to 90 days of signing a card acceptance agreement. The financial institution provides the cash needed to complete transactions on the ATM, but we do provide a significant portion of the cash to our IAD network to fund ATM transactions ourselves. Euronet is generally liable for the cash in the ATM networks.
6
Under our card acceptance agreements, the ATM transaction fees we charge vary depending on the type of transaction and the number of transactions attributable to a particular card issuer. Our agreements generally provide for payment in local currency. Transaction fees are sometimes denominated in euros or U.S. dollars. Transaction fees are billed to financial institutions and card organizations with payment terms typically no longer than one month.
Dynamic Currency Conversion
We offer dynamic currency conversion (“DCC”) over our IAD networks, ATM networks that we operate on an outsourced basis for banks, and over banks' ATM networks or POS devices as a stand-alone service. DCC is a feature of the underlying ATM or POS transaction that is offered to customers completing transactions using a foreign debit or credit card issued in a country with a currency other than the currency where the ATM or POS is located. The customer is offered a choice between completing the transaction in the local currency or in the customer's home currency via a DCC transaction. If a cardholder chooses to perform a DCC transaction, the acquirer or processor performs the foreign exchange conversion at the time that the funds are delivered at an ATM or transactions completed through the POS terminal, which results in a pre-defined amount of the customer's home currency being charged to their card. Alternatively, the customer may have the transaction converted by the card issuing bank, in which the amount of local currency is communicated to the card issuing bank and the card issuing bank makes the conversion to the customer's home currency.
When a customer chooses DCC at an ATM or POS device and Euronet acts as the acquirer or processor, we receive all or a portion of the foreign exchange margin on the conversion of the transaction. On our IAD ATMs, Euronet receives the entire foreign exchange margin. If Euronet is not the acquirer or processor of the transaction, we share the DCC revenue with the sponsor bank. On ATMs or POS devices that are operated for banks, or where we offer DCC as a stand-alone service to banks or merchants, we share the foreign exchange margin. The foreign exchange margin on a DCC transaction increases the amount Euronet earns from the underlying ATM or POS transaction and supports deployment of additional ATMs in new locations.
Other Products and Services
Our network of owned or operated ATMs allows for the sale of financial and other products or services at a low incremental cost. We have developed value added services in addition to basic cash withdrawal and balance inquiry transactions. These value added services include mobile top-up, fraud management, bill payment, domestic and international surcharge, CRM, foreign remittance payout, cardless payout, banknote recycling, electronic content, ticket and voucher, and advertising. We are committed to the ongoing development of innovative new products and services to offer our EFT processing customers.
Euronet offers multinational merchants a Single European Payments Area (“SEPA”)-compliant cross-border transaction processing solution. SEPA is an area in which all electronic payments can be made and received in euros, whether between or within national boundaries, under the same basic conditions, rights and obligations, regardless of their location. This single, centralized acquiring platform enables merchants to benefit from cost savings and faster, more efficient payments transfer. Although many European countries are not members of the eurozone, the platform can serve the merchants in these countries as well, through its multi-currency functionality.
Software Solutions
We also offer a suite of integrated software solutions for electronic payments and transaction delivery systems. We generate revenues for our software products from licensing, professional services and maintenance fees for software and sales of related hardware, primarily to financial institutions around the world.
Additionally, our software products are an integral part of the EFT Processing Segment product lines, and our investment in research, development, delivery and customer support reflects our ongoing commitment to an expanded customer base both internally and externally. Our proprietary software is used by processing centers in our EFT Processing Segment, resulting in cost savings and added value compared to third-party license and maintenance options. Our proprietary software consists of our legacy ITM software, which we have used and sold to banks since 1998 through our Software Solutions unit, and an innovative switching software package named REN that we released in 2017.
We currently operate REN in our processing center to process payments for our own networks in Europe and we are progressively transitioning all our networks globally to REN. The private cloud architecture of REN allows us to simultaneously deploy REN across multiple physical locations. While we currently only operate REN for our internal resources, REN is scalable and will allow us to offer payment and digital solutions to third parties. In addition to payments processing, REN also supports other digital elements, including card issuing for physical and virtual cards, loyalty services,
7
Know Your Customer compliance, real time settlement, inventory management, risk and fraud management and other services. REN will be used as a platform to connect Euronet assets to offer digital payment solutions.
EFT Processing Segment Strategy
The EFT Processing Segment maintains a strategy to expand the network of ATMs and POS terminals into developed and developing markets that have the greatest potential for growth. In addition, we follow a supporting strategy to increase the penetration of value added (or complementary) services across our existing customer base, including DCC, surcharge, cardless payment, banknote recycling solutions, tax refund services, advertising, fraud management, bill payment, mobile top-up, CRM and foreign remittance payout.
We continually strive to make our own ATM networks more efficient by eliminating underperforming ATMs and installing ATMs in more desirable locations. We make selective additions to our own ATM network if we see market demand and profit opportunities. In tourist locations, we also shut down ATMs during the winter season when tourist activity is low.
In recent years, the need for “all-in” services has increased. Banks, particularly smaller banks, are increasingly looking for integrated ATM, POS and card issuing processing and management services. Euronet is well positioned for this opportunity as it can offer a full end-to-end solution to the potential partners.
Additional growth opportunities are driven through financial institutions that are receptive to outsourcing the operation of their ATM, POS and card networks. The operation of these devices requires expensive hardware and software and specialized personnel. These resources are available to us, and we offer them to our customers under outsourcing contracts. The expansion and enhancement of our outsourced management solutions in new and existing markets will remain an important business opportunity for Euronet. Increasing the number of non-owned ATMs and POS terminals that we operate under management services agreements and continued development of our credit and debit card outsourcing business would provide continued growth while minimizing our capital investment.
Complementary services offered by our epay Segment, where we provide prepaid top-up services through POS terminals, strengthens the EFT Processing Segment's line of services. We plan to continue to expand our technology and business methods into other markets where we operate and further leverage our relationships with mobile phone operators and financial institutions to facilitate that expansion.
Seasonality
Our EFT Processing business experiences its heaviest demand for cash withdrawals and DCC during the third quarter of the fiscal year, coinciding with the tourism season. It is also impacted by seasonality during the fourth quarter and first quarter of each year due to higher transaction levels during the holiday season and lower levels after the holiday season. This seasonality is increased due to our practice of "winterizing" ATMs in tourist locations that experience significantly higher traffic during the summer. Winterizing involves shutting down the ATMs during the slower winter months and results in lower overall transaction volumes in the EFT Processing Segment during those months. As we have expanded our IAD network in tourist locations, the financial impact of winterization has increased, because we continue to bear the expense of winterized ATMs even though they do not generate transactions during the winter months.
Significant Customers and Government Contracts
No individual customer of the EFT Processing Segment makes up greater than 10% of total consolidated revenues. In India, we have contracts with government-owned banks to provide certain ATM driving and transaction switching services and mobile airtime recharge services. Additionally, certain government-owned banks are members of our shared ATM network in India. In Croatia, we lease land and other property for certain ATM sites from companies that are majority-owned by the government. In Pakistan, we have a contract with a government-owned bank to provide software support services.
Competition
Our principal EFT Processing competitors include ATM networks owned by financial institutions and national switches consisting of consortiums of local banks that provide outsourcing and transaction services to financial institutions and independent ATM deployers in a particular country. Additionally, large, well-financed companies that operate ATMs offer ATM network and outsourcing services, and those that provide card outsourcing, POS processing and merchant acquiring services also compete with us in various markets. Small local operators have also recently begun offering their services, particularly in the IAD market. None of these competitors has a dominant market share in any of our markets. Competitive factors in our EFT
8
Processing Segment include breadth of service offering, network availability and response time, price to both the financial institution and to its customers, ATM location and access to other networks.
epay Segment
Overview
We currently offer prepaid mobile airtime top-up services and other electronic content and payment processing services for various prepaid products, cards and services on a network of approximately
719,000
POS terminals across approximately
334,000
retailer locations in Europe, the Middle East, Asia Pacific, the United States and South America. Our processing centers for the epay Segment are located in
Billericay, U.K.; Martinsried, Germany; Hamburg, Germany; Milan, Italy; Buena Park, California, USA; and Kansas City, Missouri, USA
.
Since 2003, we have expanded our prepaid business in new and existing markets by drawing upon our depth of experience to build and expand relationships with content providers, mobile phone operators and retailers. We offer a wide range of products across our retail networks, including prepaid mobile airtime, prepaid debit cards, prepaid gift cards, prepaid electronic content such as music, games and software, prepaid vouchers, transport payments, lottery payments, prepaid long distance and bill payment processing assistance through partnerships with various licensed money transmitters.
Sources of Revenues
The epay Segment generates commissions or processing fees from the distribution of electronic content and from telecommunications service providers for the sale and distribution of prepaid mobile airtime. In 2018, of the total revenues and gross profit for the epay Segment, approximately
62%
of total revenues and approximately
69%
of gross profit was from electronic content other than prepaid mobile airtime (non-mobile products).
Customers generally purchase non-mobile prepaid content as a gift or for self-use. Content is generally purchased in two ways:
|
•
|
Directly online from the content provider using an online payment method; or
|
|
•
|
Through physical retail stores, online retailers or other electronic channels, including payment wallets, online banking, mobile applications and other sources.
|
Customers using mobile phones generally pay for their usage in one of two ways:
|
•
|
Through “postpaid” accounts, where usage is billed at the end of each billing period; or
|
|
•
|
Through “prepaid” accounts, where customers pay in advance by crediting their accounts prior to usage.
|
Although mobile phone operators in the U.S. and certain European countries have provided service principally through postpaid accounts, the norm in many other countries in Europe and the rest of the world is to offer wireless service on a prepaid basis.
Prepaid mobile phone credits are generally distributed using personal identification numbers or "PINs." We distribute PINs in two ways. First, we establish an electronic connection to the mobile operator and the retailer. When the sale to a customer is initiated, the terminal requests the PIN from the mobile operator via our transaction processing platform. These transactions obtain the PIN directly from the mobile operator and, therefore, Euronet does not carry PIN inventory. The customer pays the retailer and the retailer becomes obligated to make settlement to us of the principal amount of the mobile airtime sold. We maintain systems that know the amount of mobile top-up sold by the retailer which allows us in turn to bill that retailer for the mobile top-up sold.
Second, we purchase PINs from the mobile operator which are electronically sent to our processing platform. We establish an electronic connection with the POS terminals in retailer locations and our processing platform provides the terminal with a PIN when the mobile top-up is purchased. We maintain systems that monitor transaction levels at each terminal. As sales of prepaid mobile airtime to customers are completed, the inventory on the platform is reduced by the PIN purchased. The customer payment and settlement with the retailer are the same as described above.
We expand our distribution networks through the signing of new contracts with retailers, and in some markets, through the acquisition of existing networks. We are continuing to focus on growing our distribution network through independent sales organizations that contract directly with retailers in their network to distribute prepaid mobile airtime or other non-mobile content from the retailers' POS terminals. We continue to increase our focus on direct relationships with chains of
9
supermarkets, convenience stores, petrol stations, and other larger scale retailers, where we can negotiate agreements with the retailers on multi-year bases.
In addition to sale of traditional mobile top-up volume described above, we have expanded distribution into non-mobile products and other value-added services. We have leveraged our existing technology infrastructure to sell non-mobile products, which have been sold through our traditional retailer network and new retailer networks such as electronic channels. In the U.S., most prepaid non-mobile content is purchased for gifting; in markets outside the U.S., consumers generally purchase prepaid non-mobile content for self-use.
epay Products and Services
Prepaid Mobile Airtime Transaction Processing
We process prepaid mobile airtime top-up transactions on our POS network across Europe, the Middle East, Asia Pacific, North America and South America for two types of clients: distributors and retailers. Both types of client transactions start with a consumer in a retail store. The retailer uses a specially programmed POS terminal in the store, the retailer's electronic cash register (ECR) system, or web-based POS device that is connected to our network to buy prepaid mobile airtime. The consumer will select a predefined amount of mobile airtime from the carrier of choice, and the retailer enters the selection into the POS terminal. The consumer will pay that amount to the retailer (in cash or other payment methods accepted by the retailer). The POS device then transmits the selected transaction to our processing center. Using the electronic connection we maintain with the mobile phone operator or drawing from our inventory of PINs, the purchased amount of mobile airtime will be either credited to the consumer's account or delivered via a PIN printed by the terminal and given to the consumer. In the case of PINs printed by the terminal, the consumer must then call the mobile phone operator's toll-free number to activate the purchased airtime to the consumer's mobile account.
One difference in our relationships with various retailers and distributors is the way in which we charge for our services. For distributors and certain very large retailers, we charge a processing fee. However, the majority of our transactions occur with smaller retailers. With these clients, we receive a commission or discount on each transaction that is withheld from the payments made to the mobile phone operator, and we share that commission/discount with the retailers.
Closed Loop Gift Cards
Closed loop (private-branded) gift cards are generally described as merchant-specific prepaid cards, used for purchases exclusively at a particular merchant's locations. We distribute closed loop gift cards in various categories, including dining, retail, and digital media, such as music, games and software. Generally, the gift card is activated when a consumer loads funds (with cash, debit or credit card payment) or purchases a preloaded value gift card at a retail store location or online.
Open Loop Gift Cards
Open loop (network-branded) gift cards are prepaid gift cards associated with an electronic payment network (such as Visa or MasterCard) and are honored at multiple, unaffiliated locations (wherever cards from these networks are generally accepted). They are not merchant-specific. We distribute and issue single-use, non-reloadable open loop gift cards carrying the Visa brand in our retail channels. After the consumer purchases the preloaded value gift card at a retail store location or online, the consumer must call the toll-free number on the back of the card to activate it.
Open Loop Reloadable
We distribute Visa and MasterCard issued debit cards provided by Green Dot, NetSpend and other card issuers. We also manage and distribute a proprietary debit card that allows a retailer to issue its own reloadable store-branded card. Open loop reloadable cards have features similar to a bank checking account, including direct deposit, purchasing capability wherever a credit card is accepted, bill payment and ATM access. Fees are charged to consumers for the initial load and reload transactions, monthly account maintenance and other transactions.
Other Products and Services
Our POS network is used for the distribution of other products and services, including games and software, bill payment, lottery tickets and transportation products. Through our cadooz subsidiary, we also distribute vouchers and physical gifts into the business-to-business ("B2B") channel principally for the purposes of employee and customer incentives and rewards. In
10
certain locations, the terminals used for prepaid services can also be used for electronic funds transfer to process credit and debit card payments for retail merchandise. We provide promotion and advertising for content providers of their prepaid content throughout our retail distribution network. We also provide card production and processing services to some of our prepaid gift card partners and telecom content providers.
Retailer and Distributor Contracts
We provide our prepaid services through POS terminals or web-based POS devices installed in retail outlets or, in the case of major retailers, through direct connections between their ECR systems and our processing centers. In markets where we operate proprietary technology (the U.K., Germany, Australia, Poland, Ireland, New Zealand, Spain, Greece, India, Italy, Brazil and the U.S.), we generally own and maintain the POS terminals. In certain countries in Europe, the terminals are sold to the retailers or to distributors who service the retailer. Our agreements with major retailers for the POS services typically have one to three-year terms. These agreements include terms regarding the connection of our networks to the respective retailer's registers or payment terminals or the maintenance of POS terminals, and obligations concerning settlement and liability for transactions processed. Generally, our agreements with individual or small retailers have shorter terms and provide that either party can terminate the agreement upon three to six months' notice.
In Germany, distributors are key intermediaries in the sale of mobile top-up. As a result, our business in Germany is substantially concentrated in, and dependent upon, relationships with our major distributors. The termination of any of our agreements with major distributors could materially and adversely affect our prepaid business in Germany. However, we have been establishing agreements with independent German retailers in order to diversify our exposure to such distributors.
The number of transactions processed on our POS network over the last five years are indicated in the table below:
|
(in millions)
|
2014
|
2015
|
2016
|
2017
|
2018
|
|
epay processing transactions per year
|
1,244
|
1,335
|
1,294
|
1,186
|
1,149
|
The loss of a high-volume, low-margin customer in the Middle East in 2017 contributed to an overall decline in processing transactions.
epay Segment Strategy
Mobile top-up transactions are declining in many developed markets and transaction fees for mobile transactions are being compressed by the mobile operators. epay's strategy is to defend margins in developing markets by providing value added services to mobile operators and to decrease our reliance on mobile top-up by increasing distribution of other electronic content. New product initiatives focus on products such as gift card malls, prepaid debit cards, transport and electronic content, including music, software and games. Strategic execution behind new products includes the development of relationships with global consumer product brands. This strategy leverages the global scale of the epay business allowing global brands to be sold in many or all of the countries in which we have a presence. Examples of global brands we distribute include iTunes, Google Play, Sony, and Microsoft.
Telecommunications companies and other content providers have a substantial opportunity to increase revenues by diversifying the products and services currently offered to their retailers. epay is deploying additional content through its POS network to retailers and distributors all over the world. The reach, capabilities and quality of the epay network are appealing as a global distribution channel. We are one of the largest worldwide multi-country operators, and believe we have a distinct competitive advantage from the existing relationships that we maintain with prepaid content providers and retailers.
Seasonality
As the product mix continues to change, the epay business is impacted by seasonality during the fourth quarter and first quarter of each year due to the higher transaction levels during the holiday season and lower levels following the holiday season.
11
Significant Customers and Government Contracts
No individual customer of our epay Segment makes up greater than 10% of total consolidated revenues. epay has a contract for the technology and distribution infrastructure for six state-owned lotteries in Germany. In addition, epay has contracts with the state of Florida's (USA) Turnpike partners and Transurban Limited, the largest manager of toll road networks in Australia, Cubic supporting New South Wales Transport ticketing in Australia and with New Zealand Transport Authority, which operates all toll roads in New Zealand. In Germany, cadooz has a contract with Deutsche Bahn, which is majority owned by the German state. We also have a contract for the distribution of mobile airtime with a Saudi company, which is majority owned by the Saudi government. There are no other government contracts in the epay Segment.
Competition
We face competition in the prepaid business in all of our markets. We compete with a few multinational companies that operate in several of our markets. In other markets, our competition is from smaller, local companies. The mobile operators in all of our markets have retail distribution networks, and in some markets, on-line distribution of their own through which they offer top-up services for their own products.
We believe our size and market share are competitive advantages in many markets. In addition, we believe our processing platforms are a competitive advantage. We have extremely flexible technical platforms that enable us to tailor POS solutions to individual retailers and mobile operator and non-mobile content provider requirements where appropriate. Our platforms are also able to provide value added services other than processing which makes us a more valuable partner to the content providers and retailers. We have introduced new digital products into the marketplace such as digital payment for online media subscriptions. Many of these products are not offered by our competitors and in many countries, these are new products. We are capitalizing on being the first to market for these products.
The principal competitive factors in the epay Segment include price (that is, the level of commission paid to retailers for each transaction), breadth of products and up-time offered on the system. Major retailers with high volumes are in a position to demand a larger share of the commission, which increases the amount of competition among service providers. We are seeing signs that some mobile operators are expanding their distribution networks to provide top-up services on-line or via mobile devices, which provides other alternatives for consumers to use.
Money Transfer Segment
Overview
We provide global money transfer services primarily under the brand names Ria, IME, xe and HiFX. Ria and IME provide consumer-to-consumer money transfer services through a global network of more than
369,000
locations and our website riamoneytransfer.com and online.imeremit.com. Most of our money transfers are originated through sending agents in approximately
33
countries, with money transfer delivery completed in
149
countries. The initiation of a consumer money transfer occurs through retail agents, Company-owned stores or online, while the delivery of money transfers can occur with bank correspondents, retailer agents or from certain ATMs. Our websites allow consumers to send funds online, using a bank account or credit or debit card, for pay-out directly to a bank account or for cash pickup.
In addition, we provide global account-to-account money transfer services under the brand names HiFX and xe. We offer money transfer services via our websites (www.xe.com and https://transferxe.com) and through HiFX and xe customer service representatives. Late in 2018, we started the process of rebranding our HiFX global account-to-account money transfer services, integrating them under the single brand name of xe. We anticipate that this process will be completed globally during the first half of 2019. xe also provides foreign currency exchange information on its currency data websites (www.xe.com and www.x-rates.com). Through our HiFM brand, we offer cash management solutions and foreign currency risk management services to small-to-medium sized businesses.
We monitor the number of transactions made through our money transfer networks. The number of transactions processed on our network has increased over the last five years at a CAGR of approximately
22.0%
as indicated in the following table:
|
(in millions)
|
2014
|
2015
|
2016
|
2017
|
2018
|
|
Money transfer transactions per year
|
48.5
|
68.7
|
82.3
|
92.2
|
107.6
|
12
Our sending agent network includes a variety of agents, including Walmart, large/medium size regional retailers, convenience stores, bodegas, multi-service shops and phone centers, which are predominantly found in areas with a large immigrant population. Each Ria money transfer transaction is processed using Euronet's proprietary software system and checked for security, completeness and compliance with federal and state regulations at every step of the process. Senders can track the progress of their transfers through Ria's customer service representatives, and funds are delivered quickly to their beneficiaries via our extensive payout network, which includes large banks and non-bank financial institutions, post offices and large retailers. Our processing centers for the Money Transfer Segment are located in
Buena Park, California, USA; Bracknell, U.K.; Auckland, New Zealand; Kansas City, Missouri, USA; and Kuala Lumpur, Malaysia
. We mainly operate Ria call centers in Buena Park, California; Antiguo Cuscatlán, El Salvador; Kuala Lumpur, Malaysia; Dakar, Senegal; Mumbai, India and Madrid, Spain and provide multi-lingual customer service for both our agents and consumers. Additionally, we operate a call center for xe and HiFX in Sydney, Australia.
We are one of the largest global money transfer companies in terms of revenues and transaction volumes. Our Money Transfer Segment processed approximately
$49.7 billion
in money transfers in
2018
.
Money Transfer Products and Services
Money transfer products and services are sold primarily through three channels at agent locations, Company-owned stores and on internet enabled devices at riamoneytransfer.com, online.imeremit.com, xe.com, and https://transferxe.com (online transactions).
In an online transaction, customers send funds, using a bank account or credit or debit card, for pay-out at most of our agent locations around the world or directly to a bank account.
Through our TeleRia service, customers connect to our call center from a telephone available at an agent location and a representative collects the information over the telephone and enters it directly into our secure proprietary system. As soon as the data capture is complete, our central system automatically faxes a confirmation receipt to the agent location for the customer to review and sign and the customer pays the agent the money to be transferred, together with a fee. The agent then faxes the signed receipt back to Ria to complete the transaction.
Through our Walmart-2-Walmart Money Transfer Service, which allows customers to transfer money to and from Walmart stores in the U.S., our Ria business executes the transfers with Walmart serving as both the sending agent and payout correspondent. Ria earns a significantly lower margin from these transactions than its traditional money transfers; however, the arrangement adds a significant number of transactions to Ria’s business. The agreement with Walmart establishes Ria as the only party through which Walmart will sell U.S. domestic money transfers branded with Walmart marks. The agreement had an initial term expiring in April 2017 and was renewed for an additional three-year period until April 2020. Thereafter, it will automatically renew for one year terms unless either party provides notice to the contrary. The agreement imposes certain obligations on each party, the most significant being service level requirements by Ria and money transfer compliance requirements by Walmart. Any violation of these requirements by Ria could result in an obligation to indemnify Walmart or termination of the contract by Walmart. However, the agreement allows the parties to resolve disputes by mutual agreement without termination of the agreement.
In addition to money transfers, Ria also offers customers bill payment services, payment alternatives such as money orders, comprehensive check cashing services for a wide variety of issued checks, along with competitive foreign currency exchange services and mobile top-up. These services are all offered through our Company-owned stores while select services are offered through our agents in certain markets.
Ria money orders are widely recognized and exchanged throughout the United States. Our check cashing services cover payroll and personal checks, cashier checks, tax refund checks, government checks, insurance drafts and money orders. Our bill payment services offer timely posting of customer bills for over 3000 companies, including electric and gas utilities and telephone/wireless companies. Bill payment services are offered primarily in the U.S.
xe and HiFX offer account-to-account international payment service to high-income individuals and small-to-medium sized businesses, complementing our existing consumer-to-consumer money transfer business. xe has an innovative multi-channel platform which allows customers to make transfers, track payments and manage their international payment activity online or through a customer service representative. HiFM offers cash management solutions and foreign currency risk management services to small-to-medium sized businesses. xe also offers foreign currency exchange subscriptions and advertising on its websites.
13
Sources of Revenues
Revenues in the Money Transfer Segment are derived through the charging of a transaction fee, as well as a margin earned from purchasing foreign currency at wholesale exchange rates and selling the foreign currency to customers at retail exchange rates. Sending agents and receiving agents for consumer-to-consumer products each earn fees for cash collection and distribution services. Euronet recognizes these fees as direct operating costs at the time of sale.
Money Transfer Segment Strategy
The Money Transfer Segment's strategy is to increase the volume of money transfers processed by leveraging our existing banking and merchant/retailer relationships to expand our agent and correspondent networks in existing corridors. In addition, we pursue expansion into high-potential money transfer corridors from the U.S. and internationally beyond the traditional U.S. to Mexico corridor. Further, we expect to continue to take advantage of cross-selling opportunities with our epay and EFT Processing Segments by providing prepaid services through our stores and agents, and offering our money transfer services at select prepaid retail locations and ATMs we operate in key markets. We will continue to make investments in our systems to support this growth. Additionally, we are expanding our xe business into new markets.
Seasonality
Our money transfer business is significantly impacted by seasonality that varies by region. In most of our markets, we experience increased money transfer transaction levels during the month of May and in the fourth quarter of each year, coinciding with various holidays. Additionally, in the U.S. to Mexico corridor, we usually experience our heaviest volume during the May through October time frame, coinciding with the increase in worker migration patterns and various holidays, and our lowest volumes during the first quarter.
Significant Customers and Government Contracts
No individual customer of our Money Transfer Segment makes up greater than 10% of total consolidated revenues. The Money Transfer Segment maintains correspondent relationships with a number of financial institutions whose ownership includes governments of the correspondents' countries of origin. Those countries include Armenia, Bangladesh, Benin, Bhutan, Bosnia-Herzegovina, Burundi, China, Costa Rica, Cote d'Ivoire, Cuba, Djibouti, Dominican Republic, Ecuador, Egypt, Eritrea, Ethiopia, Fiji, Gabon, Ghana, Guatemala,Indonesia, Mali, Mauritania, Mexico, Pakistan, Philippines, Poland, Romania, Saudi Arabia, Senegal, Tunisia, Uganda, Ukraine, Vietnam, Burkina Faso, El Salvador, Gambia, Georgia, Guinea, Guinea Bissau, Honduras, India, Kenya, Kyrgyzstan, Liberia, Mauritius, Moldova, Morocco, Myanmar, Niger, Nigeria, Rwanda, Sri Lanka, Suriname, Tanzania, Thailand, Turkey, Yemen and Zambia.
Competition
Our primary competitors in the money transfer and bill payment business include other large money transfer companies and electronic money transmitters, together with hundreds of smaller registered and unregistered money transmitters, as well as certain major national and regional banks, financial institutions and independent sales organizations. Our competition includes The Western Union Company, the leading competitor with revenue approximately three times greater than the next largest competitor. The Western Union Company has a significant competitive advantage due to its greater resources and access to capital for expansion. This may allow them to offer better pricing terms to customers, agents or correspondents, which may result in a loss of our current or potential customers or could force us to lower our prices. In addition to traditional money payment services, new technologies are emerging that compete with traditional money payment services, such as stored-value cards, debit networks and web-based services and digital currencies. Our continued growth also depends upon our ability to compete effectively with these alternative technologies.
Employees
We had approximately
7,100
,
6,600
and
6,200
employees as of
December 31, 2018
,
2017
, and
2016
, respectively. We believe our future success will depend in part on our ability to continue to recruit, retain and motivate qualified management, technical and administrative employees. Currently, no union represents any of our employees, except in one of our Spanish subsidiaries. We experienced no work stoppages or strikes by our workforce in
2018
and we consider relations with our employees to be good.
14
Government Regulation
As discussed below, many of our business activities are subject to regulation in our current markets. In the Money Transfer Segment, we are subject to a wide variety of laws and regulations of the U.S., individual U.S. states and foreign governments. These include international, federal and state anti-money laundering laws and regulations, money transfer and payment instrument licensing laws, escheat laws, laws covering consumer privacy, data protection and information security and consumer disclosure and consumer protection laws. Our operations have also been subject to increasingly strict requirements intended to help prevent and detect a variety of illegal financial activity, including money laundering, terrorist financing, unauthorized access to personal customer data and other illegal activities. The more significant of these laws and regulations are discussed below. Noncompliance with these laws and requirements could result in the loss or suspension of licenses or registrations required to provide money transfer services through retail agents, Company owned stores or online. For more discussion, see Item 1A - Risk Factors.
Any further expansion of our activity into areas that are qualified as “financial activity” under local legislation may subject us to licensing and we may be required to comply with various conditions to obtain such licenses. Moreover, the interpretations of bank regulatory authorities as to the activity we currently conduct might change in the future. We monitor our business for compliance with applicable laws or regulations regarding financial activities.
Certain of our European product offerings, including in particular, our money transfer services, merchant acquiring and bill payment products, are regulated services requiring a license under the PSD2, which replaced PSD effective January 13, 2018. Key changes made by PSD2 to PSD include: extension of PSD rules on transparency to additional transactions not currently covered by PSD; enhanced cooperation and information exchange between authorities in the context of authorization and supervision of payment institutions; and increased obligations around the management of operational and security risk, increased obligations relating to complaints handling and additional requirements regarding payment security.
PSD2 requires a license to perform certain defined "payment services" in a European country, which may be extended throughout the Member States through passporting. Conditions for obtaining the license include minimum capital requirements, establishment of procedures for safeguarding of funds, and certain governance and reporting requirements. In addition, certain obligations relating to internal controls and the conduct of business, in particular, consumer disclosure requirements and certain rules regarding the timing and settlement of payments, must be met. We have payment institution licenses in the U.K., France, Germany, and Spain and are complying with these requirements. To date, we have passported our U.K. authorization to several Member States and our Spanish authorization to several host Member States. Additionally, in the U.K., we have obtained an e-money license under the 2EMD. The e-money license allows Euronet to issue e-money and provide the same payment services as a PSD2 licensee. The e-money license imposes certain requirements similar to those of the payment services license, including minimum capital requirements, consumer disclosure and internal controls and can be passported to Member States. Our e-money license holder is currently operating in over twenty-one Member States.
Money Transfer and Payment Instrument Licensing
Licensing requirements in the U.S. are generally driven by the various state banking departments regulating the businesses of money transfers and issuances of payment instruments. Typical requirements include the meeting of minimum net worth requirements, maintaining permissible investments (e.g., cash, agent receivables, and government-backed securities) at levels commensurate with outstanding payment obligations and the filing of a security instrument (typically in the form of a surety bond) to offset the risk of default of trustee obligations by the license holder. We are required by many state regulators to submit ongoing reports of licensed activity, most often on a quarterly or monthly basis, that address changes to agent and branch locations, operating and financial performance, permissible investments and outstanding transmission liabilities. These periodic reports are utilized by the regulator to monitor ongoing compliance with state licensing laws. A number of major state regulators also conduct periodic examinations of license holders and their authorized delegates, generally with a frequency of every one to two years. Examinations are most often comprehensive in nature, addressing both the safety and soundness and overall compliance by the license holder with regard to state and federal regulations. Such examinations are typically performed on-site at the license holder's headquarters or operations center; however, certain states may choose to perform examinations off-site as well.
Money transmitters, issuers of payment instruments and their agents are required to comply with U.S. federal, state and/or foreign anti-money laundering laws and regulations. In summary, our Money Transfer Segment, as well as our agent network, is subject to regulations issued by the different state and foreign national regulators who license us, the Office of Foreign Assets Control (“OFAC”), the Bank Secrecy Act as amended by the USA PATRIOT (“BSA”), the Financial Crimes Enforcement Network (“FINCEN”), as well as any existing or future regulations that impact any aspect of our money transfer business.
15
A similar set of regulations applies to our money transfer businesses in most of the foreign countries in which we originate transactions. These laws and regulations include monetary limits for money transfers into or out of a country, rules regarding the foreign currency exchange rates offered, as well as other limitations or rules for which we must maintain compliance.
Regulatory bodies in the U.S. and abroad may impose additional rules on the conduct of our Money Transfer Segment that could have a significant impact on our operations and our agent network. In this regard, the U.S. federal government has implemented U.S. federal regulations for electronic money transfers, including the Electronic Fund Transfer Act, which provides consumer protections for international remittance transfers. The Consumer Financial Protection Bureau ("CFPB"), adopted a rule that provides additional protections for consumers who transmit money internationally, including disclosure requirements, cancellation rights and error resolution procedures for consumer complaints. Under U.S. federal law, it is unlawful for any provider of consumer financial products or services to engage in unfair, deceptive or abusive acts or practices (collectively, "UDAAPs"). The CFPB has rule making and enforcement authority to prevent UDAAPs in connection with transactions for consumer financial products or services. The CFPB audits our compliance with these rules, and we may be subject to fines or penalties for violations of any of such rules.
Escheat Regulations
Our Money Transfer Segment is subject to the unclaimed or abandoned property (i.e., “escheat”) regulations of the United States and certain foreign countries in which we operate. These laws require us to turn over property held by Euronet on behalf of others remaining unclaimed after specified periods of time (i.e., “dormancy” or “escheat” periods). Such abandoned property is generally attributable to the failure of beneficiary parties to claim money transfers or the failure to negotiate money orders, a form of payment instrument. We have policies and programs in place to help us monitor the required information relating to each money transfer or payment instrument for possible eventual reporting to the jurisdiction from which the order was originally received. In the U.S., reporting of unclaimed property by money service companies is performed annually, generally with a due date of on or before November 1. State banking department regulators will typically include a review of Euronet escheat procedures and related filings as part of their examination protocol.
Privacy and Information Security Regulations
Our Money Transfer Segment operations involve the collection and storage of certain types of personal customer data that are subject to privacy and security laws in the U.S. and abroad. In the United States, we are subject to the Gramm-Leach-Bliley Act (“GLBA”), which requires that financial institutions have in place policies regarding the collection, processing, storage and disclosure of information considered nonpublic personal information. Laws in other countries include the E.U.'s General Data Protection Regulation (2016/679) ("GDPR"), which became effective from May 25, 2018, as well as the laws of other countries.
The GDPR establishes stringent requirements for the collection and processing of personal information of individuals within the E.U. The GDPR establishes certain rights of individuals regarding personal information processed by companies as well as requirements for information security, and imposes significant fines that may be revenue-based for violation of its requirements. Any failure on our part to meet the requirements of the GDPR could result in the imposition of fines and penalties that could affect our financial results.
We comply with the GLBA and state privacy provisions. In October 2015, the European Court of Justice invalidated the European Commission’s decision of 2000 regarding the transfer of personal data from the E.U. to the United States (known as the "Safe Harbor Decision"). Despite the October 2015 ruling of the European Court of Justice, we believe we remain in compliance with E.U. regulations regarding the transfer of personal data to the United States.
Recently, as identity theft has been on the rise, there has been increased public attention to concerns about information security and consumer privacy, accompanied by laws and regulations addressing the issue. We believe we are compliant with these laws and regulations; however, this is a rapidly evolving area and there can be no assurance that we will continue to meet the existing and new regulations, which could have a material, adverse impact on our Money Transfer Segment business.
Anti-corruption and Bribery
We are subject to the Foreign Corrupt Practices Act ("FCPA"), which prohibits U.S. and other business entities from making improper payments to foreign government officials, political parties or political party officials. We are also subject to the applicable anti-corruption laws in the jurisdictions in which we operate, such as the U.K. Bribery Act, thus potentially exposing us to liability and potential penalties in multiple jurisdictions. The anti-corruption provisions of the FCPA are enforced by the United States Department of Justice. In addition, the Securities and Exchange Commission ("SEC") requires strict compliance
16
with certain accounting and internal control standards set forth under the FCPA. Because our services are offered in many countries throughout the world, we face a higher risk associated with FCPA, the U.K. Bribery Act and other similar laws than many other companies and we have policies and procedures in place to address compliance with the FCPA, the U.K. Bribery Act and other similar laws. Any determination that we have violated these laws could have an adverse effect on our business, financial position and results of operations. Failure to comply with our policies and procedures or the FCPA and other laws can expose Euronet and/or individual employees to potentially severe criminal and civil penalties. Such penalties could have a material adverse effect on our business, financial condition and results of operations.
Money Transfer Compliance Policies and Programs
We have developed risk-based policies and programs to comply with existing and new laws, regulations and other requirements outlined above, including having dedicated compliance personnel, training programs, automated monitoring systems and support functions for our offices and agents. To assist in managing and monitoring our money laundering and terrorist financing risks, we continue to have our compliance programs, in many countries, independently examined on an annual basis. In addition, we continue to enhance our anti-money laundering, counter-terrorist financing compliance policy, procedures and monitoring systems, as well as our consumer protection policies and procedures.
Intellectual Property
Each of our three operating segments utilizes intellectual property which is protected in varying degrees by a combination of trademark, patent and copyright laws, as well as trade secret protection, license and confidentiality agreements.
The brand names of “Ria,” “Ria Financial Services,” “Ria Envia,” “HiFX,” “HiFM,” “xe,” derivations of those brand names and certain other brand names are material to our Money Transfer Segment and are registered trademarks and/or service marks in most of the markets in which our Money Transfer Segment operates. Consumer perception of these brand names is important to the growth prospects of our money transfer business. We also hold a U.S. patent on a card-based money transfer and bill payment system that allows transactions to be initiated primarily through POS terminals and integrated cash register systems.
With respect to our EFT Processing Segment, we have registered or applied for registration of our trademarks, including the names “Euronet” and “Bankomat” and/or our blue diamond logo, as well as other trade names in most markets in which these trademarks are used. Certain trademark authorities have notified us that they consider these trademarks to be generic and, therefore, not protected by trademark laws. This determination does not affect our ability to use the Euronet trademark in those markets, but it would prevent us from stopping other parties from using it in competition with Euronet. We have registered the “Euronet” trademark in the class of ATM machines in Germany, the U.K. and certain other Western European countries. We have filed pending applications and/or obtained patents for a number of our new software products and our processing technology, including certain top-up services.
With respect to our epay Segment, we have filed trademark applications for the “epay” brand in the U.S., U.K., the E.U. through a Community Trademark application, Brazil, India, Australia and New Zealand. The epay trademark has issued to registration in the U.S., U.K., the E.U., Australia, New Zealand and Brazil. The trademark application in India is still pending. We cannot be certain that we are entitled to use the epay trademark in any markets other than those in which we have registered the trademark. We have filed patent applications for some of our POS top-up and certain other products in support of epay technology. Certain patents have been granted while others have been refused or are still pending. We also hold a patent license covering certain of epay's operations in the U.S.
Technology in the areas in which we operate is developing very rapidly, and we are aware that many other companies have filed patent applications for products, processes and services similar to those we provide. The procedures of the U.S. patent office make it impossible for us to predict whether our patent applications will be approved or will be granted priority dates that are earlier than other patents that have been filed for similar products or services. Moreover, many “process patents” have been filed in the U.S. over recent years covering processes that are in wide use in the money transfer, EFT and prepaid processing industries. If any of these patents are considered to cover technology that has been incorporated into our systems, we may be required to obtain additional licenses and pay royalties to the holders of such patents to continue to use the affected technology or be prohibited from continuing the offering of such services if licenses are not obtained. This could materially and adversely affect our business.
17
Executive Officers of the Registrant
The name, age, period of service and position held by each of our Executive Officers as of
February 28, 2019
are as follows:
|
Name
|
Age
|
Served Since
|
Position Held
|
|
Michael J. Brown
|
62
|
July 1994
|
Chairman, Chief Executive Officer and President
|
|
Rick L. Weller
|
61
|
November 2002
|
Executive Vice President - Chief Financial Officer
|
|
Jeffrey B. Newman
|
64
|
December 1996
|
Executive Vice President - General Counsel
|
|
Kevin J. Caponecchi
|
52
|
July 2007
|
Executive Vice President - Chief Executive Officer, epay, Software and EFT Asia Pacific Division
|
|
Juan C. Bianchi
|
48
|
April 2007
|
Executive Vice President - Chief Executive Officer, Money Transfer Segment
|
|
Nikos Fountas
|
55
|
September 2009
|
Executive Vice President - Chief Executive Officer, EFT Europe, Middle East and Africa Division
|
|
Martin L. Bruckner
|
43
|
January 2014
|
Senior Vice President - Chief Technology Officer
|
MICHAEL J. BROWN, Chairman, Chief Executive Officer and President. Mr. Brown is one of the founders of Euronet and has served as our Chairman of the Board and Chief Executive Officer since 1996, and has served as President since December 2014. He also co-founded our predecessor company in 1994. Mr. Brown has been a Director of Euronet since our incorporation in December 1996 and previously served on the boards of Euronet's predecessor companies. In 1979, Mr. Brown founded Innovative Software, Inc., a computer software company that was merged in 1988 with Informix. Mr. Brown served as President and Chief Operating Officer of Informix from February 1988 to January 1989. He served as President of the Workstation Products Division of Informix from January 1989 until April 1990. In 1993, Mr. Brown was a founding investor of Visual Tools, Inc. Visual Tools, Inc. was acquired by Sybase Software in 1996. Mr. Brown received a B.S. in Electrical Engineering from the University of Missouri - Columbia in 1979 and a M.S. in Molecular and Cellular Biology at the University of Missouri - Kansas City in 1997.
RICK L. WELLER, Executive Vice President, Chief Financial Officer. Mr. Weller has been Executive Vice President and Chief Financial Officer of Euronet since he joined Euronet in November 2002. From January 2002 to October 2002, he was the sole proprietor of Pivotal Associates, a business development firm. From November 1999 to December 2001, Mr. Weller held the position of Chief Operating Officer of ionex telecommunications, inc., a local exchange company. He is a certified public accountant and received his B.S. in Accounting from the University of Central Missouri.
JEFFREY B. NEWMAN, Executive Vice President, General Counsel. Mr. Newman has been Executive Vice President and General Counsel of Euronet since January 2000. He joined Euronet in December 1996 as Vice President and General Counsel. Prior to this, he practiced law with the Washington, D.C. based law firm of Arent Fox Kintner Plotkin & Kahn and the Paris based law firm of Salans Hertzfeld & Heilbronn. He is a member of the District of Columbia, California and Paris, France bars. He received a B.A. in Political Science and French from Ohio University in 1976 and law degrees from Ohio State University and the University of Paris.
KEVIN J. CAPONECCHI, Executive Vice President, Chief Executive Officer, epay, Software and EFT Asia Pacific Division. Mr. Caponecchi joined Euronet in July 2007 and served as President until assuming his current role in December 2014. Prior to joining Euronet, Mr. Caponecchi served in various capacities with subsidiaries of General Electric Company for 17 years. From 2003 until June 2007, Mr. Caponecchi served as President of GE Global Signaling, a provider of products and services to freight, passenger and mass transit systems. From 1998 through 2002, Mr. Caponecchi served as General Manager - Technology for GE Consumer & Industrial, a provider of consumer appliances, lighting products and electrical products. Mr. Caponecchi holds degrees in physics from Franklin and Marshall College and industrial engineering from Columbia University.
JUAN C. BIANCHI, Executive Vice President - Chief Executive Officer, Money Transfer Segment. Mr. Bianchi joined Euronet subsequent to the acquisition of Ria in 2007. Prior to the acquisition, Mr. Bianchi served as the Chief Executive Officer of Ria and has spent his entire career at either Ria or AFEX Money Express, a money transfer company purchased by Ria's founders. Mr. Bianchi began his career at AFEX in Chile in 1992, joined AFEX USA's operations in 1996, and became chief operating officer of AFEX-Ria in 2003. Mr. Bianchi studied business at the Universidad Andres Bello in Chile and completed the Executive Program in Management at UCLA's John E. Anderson School of Business.
18
NIKOS FOUNTAS, Executive Vice President - Chief Executive Officer, EFT Europe, Middle East and Africa Division. Mr. Fountas has been Executive Vice President of the Company's EFT Processing Segment in Europe since December 2012. Mr. Fountas joined Euronet subsequent to the Company's 2005 acquisition of Instreamline S.A. (now Euronet Card Services) in Greece. He served as managing director of the Company's Greece EFT subsidiary, responsible for Euronet's European card processing and cross-border acquiring operations until September 2009. In September 2009, Mr. Fountas took over responsibilities as managing director of Euronet's Europe EFT Processing Segment. Prior to joining Euronet, Mr. Fountas spent over 20 years working in management and executive-level positions in the IT field for several companies, including IBM for 12 years. He has a degree in computer science (Honors) from York University in Canada and post graduate studies in business administration from Henley Management School and IBM Business Professional Institute.
MARTIN L. BRUCKNER, Senior Vice President - Chief Technology Officer. Mr. Bruckner has been Senior Vice President and Chief Technology Officer of Euronet since January 2014. Mr. Bruckner joined Euronet in 2007 as head of software development and IT operations for Transact GmbH. In 2009, he was promoted to Chief Technology Officer of Euronet's epay segment. Prior to joining Euronet, Mr. Bruckner established his own IT company called MLB Development GmbH, where he developed software systems for various European companies. Mr. Bruckner has more than 20 years of software development experience and published his first software product (BBS systems) at the age of 15. He received a Doctorate of Law from the University of Rostock and a law degree from the University of Bielefeld.
Availability of Reports, Certain Committee Charters and Other Information
Our Website addresses are www.euronetworldwide.com and www.eeft.com. We make available all SEC public filings, including our annual reports on Form 10-K, quarterly reports on Form 10-Q, current reports on Form 8-K, and all amendments to those reports filed or furnished pursuant to Sections 13(a) or 15(d) of the Securities Exchange Act of 1934, as amended ("Exchange Act") on our Websites free of charge as soon as reasonably practicable after these documents are electronically filed with, or furnished to, the SEC. The information on our Websites is not, and shall not be deemed to be, a part of this report or incorporated into any other filings we make with the SEC. In addition, our SEC filings are made available via the SEC's EDGAR filing system accessible at www.sec.gov.
The charters for our Audit, Compensation, and Corporate Governance and Nominating Committees, as well as the Code of Business Conduct & Ethics for our employees, including our Chief Executive Officer and Chief Financial Officer, are available on our Website at www.euronetworldwide.com in the “For Investors” section under "Document and Charters".
Item 1A. Risk Factors
Our operations are subject to a number of risks and uncertainties, including those described below. You should carefully consider the risks described below before making an
investment decision. The risks and uncertainties described below are not necessarily
organized in order of priority or probability.
If any of the following risks actually occurs, our business, financial
condition or results of operations could be materially adversely affected. In
that case, the trading price of our Common Stock could decline substantially.
This Annual Report also contains forward-looking statements that involve risks
and uncertainties. Our actual results could differ materially from those
anticipated in the forward-looking statements as a result of a number of
factors, including the risks described below and elsewhere in this Annual
Report.
Our business may suffer from risks related to acquisitions and potential future
acquisitions.
A substantial portion of our growth has been due to acquisitions, and we continue to evaluate and engage in discussions concerning potential acquisition opportunities, some of which could be material. We cannot assure you that we will be able to successfully integrate, or otherwise realize anticipated benefits from, our recent acquisitions or any future acquisitions. Failure to successfully integrate or otherwise realize the anticipated benefits of these acquisitions could adversely impact our long-term competitiveness and profitability. The integration of any future acquisitions will involve a number of risks that could harm our financial condition, results of operations and competitive position. In particular:
|
•
|
The integration plans for our acquisitions are based on benefits that involve assumptions as to future events, including our ability to successfully achieve anticipated synergies, leveraging our existing relationships, as well as general business and industry conditions, many of which are beyond our control and may not materialize. Unforeseen factors may offset components of our integration plans in whole or in part. As a result, our actual results may vary considerably, or be considerably delayed, compared to our estimates;
|
19
|
•
|
The integration process could disrupt the activities of the businesses that are being combined. The combination of companies requires, among other things, coordination of administrative and other functions. In addition, the loss of key employees, customers or vendors of acquired businesses could materially and adversely impact the integration of the acquired businesses;
|
|
•
|
The execution of our integration plans may divert the attention of our management from other key responsibilities;
|
|
•
|
We may assume unanticipated liabilities and contingencies; or
|
|
•
|
Our acquisition targets could fail to perform in accordance with our expectations at the time of purchase.
|
Future acquisitions may be effected through the issuance of our Common Stock or securities convertible into our Common Stock, which could substantially dilute the ownership percentage of our current stockholders. In addition, shares issued in connection with future acquisitions could be publicly tradable, which could result in a material decrease in the market price of our Common Stock.
A lack of business opportunities or financial or other resources may impede our
ability to continue to expand at desired levels, and our failure to expand
operations could have an adverse impact on our financial condition.
Certain factors on which our ability to expand each of our divisions is dependent are set forth at Item 7, Management's Discussion and Analysis of Financial Condition and Results of Operations - Opportunities and Challenges. If any of such factors impede our ability to expand our businesses, our financial results and condition could be materially and adversely affected.
We are subject to business cycles, seasonality and other outside factors that
may negatively affect our business.
A recessionary economic environment in any of our markets or other outside factors could have a negative impact on banks, mobile phone operators, content providers, retailers and our individual customers and could reduce the level of transactions in all of our divisions, which would, in turn, negatively impact our financial results. If banks, mobile phone operators and content providers experience decreased demand for their products and services, or if the locations where we provide services decrease in number, we will process fewer transactions, resulting in lower revenues. In addition, a recessionary economic environment could reduce the level of transactions taking place on our networks, which will have a negative impact on our business.
Our experience is that the level of transactions on our networks is also subject to substantial seasonal variation. In the EFT Processing Segment, mostly in Europe, we usually experience our heaviest demand for dynamic currency conversion during the third quarter of the fiscal year, coinciding with the tourism season in Europe. As a result, our revenues earned in the third quarter of the year will usually be greater than other quarters of the fiscal year. Additionally, transaction levels have consistently been higher in the fourth quarter of the fiscal year due to increased use of ATMs, prepaid products and money transfer services during the holiday season. Generally, the level of transactions drops in the first quarter, during which transaction levels are generally the lowest we experience during the year, which reduces the level of revenues that we record. In the Money Transfer Segment, we experience increased transaction levels during the May through October timeframe, coinciding with certain holidays and the increase in worker migration patterns. As a result of these seasonal variations, our quarterly operating results may fluctuate materially and could lead to volatility in the price of our shares.
Additionally, economic or political instability, wars, civil unrest, terrorism and natural disasters may make money transfers to, from or within a particular country more difficult. The inability to timely complete money transfers could adversely affect our business.
The current U.S. presidential administration has proposed certain actions that could have an adverse effect on our money transfer business.
Our money transfer business relies on the free flow of funds along remittance corridors, and our largest corridor is the U.S. to Mexico. Our business benefits from free trade agreements such as the North American Free Trade Agreement ("NAFTA"). On September 30, 2018, the U.S. signed a new free trade agreement with Canada and Mexico. The United States-Mexico-Canada Agreement (“USMCA”) will replace NAFTA if approved by the legislatures of the three countries. If the new USMCA Agreement is not approved by all three countries, then the U.S. administration may exercise its right to withdraw from NAFTA after a six month notice period. Any withdrawal from NAFTA or the adoption of other proposals that tax, restrict or otherwise limit remittances or transfers of money out of the U.S. could have a material adverse impact on our business.
20
A prolonged economic slowdown or lengthy or severe recession in the U.S. or
elsewhere could harm our operations.
Concerns over slow economic growth, level of sovereign debt in many parts of the world, inflation levels, energy costs and geopolitical issues have contributed to increased volatility and diminished expectations for the world economy and the markets going forward. These factors, combined with volatile energy and commodity prices, reduced business and consumer confidence and slow recovery from high unemployment rates, have negatively impacted the world economy. A prolonged economic downturn or recession could materially impact our results from operations. A recessionary economic environment could have a negative impact on mobile phone operators, content providers, retailers and our other customers and could reduce the level of transactions processed on our networks, which would, in turn, negatively impact our financial results. If content providers and financial institutions experience decreased demand for their products and services, or if the locations where we provide services decrease in number, we will process fewer transactions, resulting in lower revenues.
Retaining the founder and key executives of our company, and of companies that
we acquire, and finding and retaining qualified personnel is important to our
continued success, and any inability to attract and retain such personnel could harm our operations.
The development and implementation of our strategy has depended in large part on the co-founder of our company, Michael J. Brown. The retention of Mr. Brown is important to our continued success. In addition, the success of the expansion of businesses that we acquire may depend in large part upon the retention of the founders or leaders of those businesses. Our success also depends in part on our ability to hire and retain highly skilled and qualified management, operating, marketing, financial and technical personnel. The competition for qualified personnel in the markets where we conduct our business is intense and, accordingly, we cannot assure you that we will be able to continue to hire or retain the required personnel.
Our officers and some of our key personnel have entered into service or employment agreements containing non-competition, non-disclosure and non-solicitation covenants, which grant incentive stock options and/or restricted stock with long-term vesting requirements. However, most of these contracts do not guarantee that these individuals will continue their employment with us. The loss of our key personnel could have a material adverse effect on our business, growth, financial condition or results of operations.
We have a moderate amount of debt and other contractual commitments, and while the
cost of servicing those obligations is not expected to adversely affect our business, the risk could increase if we incur more debt. We may be required to prepay
our obligations under the credit facility.
As of
December 31, 2018
, total liabilities were
$2,088 million
, of which
$590 million
represents long-term debt obligations, and total assets were
$3,321 million
. We may not have sufficient funds to satisfy all such obligations as a result of a variety of factors, some of which may be beyond our control. If the opportunity of a strategic acquisition arises or if we enter into new contracts that require the installation or servicing of infrastructure, such as processing centers, ATM machines or POS terminals on a faster pace than anticipated, we may be required to incur additional debt for these purposes and to fund our working capital needs, including ATM network cash, which we may not be able to obtain. The level of our indebtedness could have important consequences to investors, including the following:
|
•
|
our ability to obtain any necessary financing in the future for working capital, capital expenditures, debt service requirements or other purposes may be limited or financing may be unavailable;
|
|
•
|
a portion of our cash flows must be dedicated to the payment of principal and interest on our indebtedness and other obligations and will not be available for use in our business;
|
|
•
|
our level of indebtedness could limit our flexibility in planning for, or reacting to, changes in our business and the markets in which we operate;
|
|
•
|
our level of indebtedness will make us more vulnerable to changes in general economic conditions and/or a downturn in our business, thereby making it more difficult for us to satisfy our obligations; and
|
|
•
|
because a portion of our debt bears interest at a variable rate of interest, our actual debt service obligations could increase as a result of adverse changes in interest rates.
|
21
If we fail to make required debt payments, or if we fail to comply with other covenants in our debt service agreements, we would be in default under the terms of these agreements. This default would permit the holders of the indebtedness to accelerate repayment of this debt and could cause defaults under other indebtedness that we have.
Restrictive covenants in our credit facilities may adversely affect us. Our credit facility contains two financial covenants that we must meet as defined in the agreement: (1) Consolidated Total Leverage Ratio, and (2) Consolidated Interest Coverage Ratio. To remain in compliance with our debt covenants, we may be required to increase Earnings Before Interest, Taxes, Depreciation and Amortization ("EBITDA"), repay debt, or both. We cannot assure you that we will have sufficient assets, liquidity or EBITDA to meet or avoid these obligations, which could have an adverse impact on our financial condition.
Our ability to secure additional financing for growth or to refinance any of our existing debt is also dependent upon the availability of credit in the marketplace, which has experienced severe disruptions in the past. If we are unable to secure additional financing or such financing is not available at acceptable terms, we may be unable to secure financing for growth or refinance our debt obligations, if necessary.
In the event that we need debt financing in the future, uncertainty in
the credit markets could affect our ability to obtain debt financing on
reasonable terms.
In the event we were to require additional debt financing in the future, uncertainty in the credit markets could materially impact our ability to obtain debt financing on reasonable terms. The inability to access debt financing on reasonable terms could materially impact our ability to make acquisitions, refinance existing debt or materially expand our business in the future.
Increases in interest rates will adversely impact our results of operations.
A portion of our existing indebtedness has variable interest rates. Increases in variable interest rates will increase the amount of interest expense that we pay for our borrowings and have a negative impact on our results of operations.
We may be required to recognize impairment charges related to
long-lived assets and goodwill recorded in connection with our acquisitions, which would adversely impact our results of operations.
Our total assets include approximately
$818.7 million
, or
25%
of total assets, in goodwill and acquired intangible assets recorded as a result of acquisitions. We assess our goodwill, intangible assets and other long-lived assets as and when required by accounting principles generally accepted in the U.S. to determine whether they are impaired. If operating results in any of our key markets, including Australia, Germany, Greece, Malaysia, India, New Zealand, the U.S., Poland and Romania, deteriorate or our plans do not progress as expected when we acquired these entities, or if capital markets depress our value or that of similar companies, we may be required to record additional impairment write-downs of goodwill, intangible assets or other long-lived assets. This could have a material adverse effect on our results of operations and financial condition.
The processes and systems we employ may be subject to patent protection by
other parties, and any claims could adversely affect our business and results of operations.
In certain countries, including the U.S., patent protection legislation permits the protection of processes and systems. We employ processes and systems in various markets that have been used in the industry by other parties for many years, and which we or other companies that use the same or similar processes and systems consider to be in the public domain. However, we are aware that certain parties believe they hold valid patents that cover some of the processes and systems employed in our business lines in the U.S. and elsewhere. We believe the processes and systems we use have been in the public domain prior to the patents we are aware of. The question of whether a process or system is in the public domain is a legal determination, and if this issue is litigated we cannot be certain of the outcome of any such litigation. If a person were to assert that it holds a patent covering any of the processes or systems we use, we would be required to defend ourselves against such claim. If unsuccessful, we may be required to pay damages for past infringement, which could be trebled if the infringement was found to be willful. We may also be required to seek a license to continue to use the processes or systems. Such a license may require either a single payment or an ongoing license fee. No assurance can be given that we will be able to obtain a license which is reasonable in fee and scope. If a patent owner is unwilling to grant such a license, or we decide not to obtain such a license, we may be required to modify our processes and systems to avoid future infringement. Any such occurrences could materially and adversely affect one or more of our business lines in any affected markets and could result in our reconsidering the rate of expansion of business in those markets.
22
We conduct a significant portion of our business in Central and Eastern
European countries, and we have subsidiaries in the Middle East, Asia Pacific
and South America, where the risk of continued political, economic and
regulatory change that could impact our operating results is greater than in
the U.S. or Western Europe.
We have subsidiaries in Central and Eastern Europe, the Middle East, Asia Pacific and South America. We expect to continue to expand our operations to other countries in these regions. Some of these countries have undergone significant political, economic and social change in recent years and the risk of new, unforeseen changes in these countries remains greater than in the U.S. or Western Europe. In particular, changes in laws or regulations or in the interpretation of existing laws or regulations, whether caused by a change in government or otherwise, could materially adversely affect our business, growth, financial condition or results of operations.
For example, currently there are no limitations in any of the countries in which we have subsidiaries on the repatriation of profits from these countries, but foreign currency exchange control restrictions, taxes or limitations may be imposed or tightened in the future with regard to repatriation of earnings and investments from these countries. If exchange control restrictions, taxes or limitations are imposed or tightened, our ability to receive dividends or other payments from affected subsidiaries could be reduced, which may have a material adverse effect on us. As discussed under "Liquidity and Capital Resources" in Item 7 - Management's Discussion and Analysis of Financial Condition and Results of Operations, under existing U.S. tax laws, repatriation of certain assets to the U.S. could have adverse tax consequences.
In addition, corporate, contract, property, insolvency, competition, securities and other laws and regulations in many of the countries in which we operate have been, and continue to be, substantially revised. Therefore, the interpretation and procedural safeguards of the new legal and regulatory systems are in the process of being developed and defined, and existing laws and regulations may be applied inconsistently. Also, in some circumstances, it may not be possible to obtain the legal remedies provided for under these laws and regulations in a reasonably timely manner, if at all.
We conduct business in many international markets with complex and evolving tax
rules, including value added tax rules, which subjects us to international tax
compliance risks which could adversely affect our operating results.
While we obtain advice from legal and tax advisors as necessary to help assure compliance with tax and regulatory matters, most tax jurisdictions that we operate in have complex and subjective rules regarding the valuation of intercompany services, cross-border payments between affiliated companies and the related effects on income tax, value added tax (“VAT”), transfer tax and share registration tax. Our foreign subsidiaries frequently undergo VAT reviews, and from time to time undergo comprehensive tax reviews and may be required to make additional tax payments should the review result in different interpretations, allocations or valuations of our services.
Uncertainties in the interpretation and application of the Tax Cuts and Jobs Act of 2017 could materially affect our tax obligations and effective tax rate.
The Tax Cuts and Jobs Act of 2017 (the "Act") was enacted on December 22, 2017, and it significantly affected U.S. tax law by, among other things, changing how the U.S. imposes income tax on multinational corporations. The Act contains several key tax provisions that affect us, including a one-time mandatory transition tax on previously undistributed foreign earnings, a reduction of the corporate income tax rate to 21% effective January 1, 2018, and new taxes on certain foreign sourced earnings, among others.
We are required to recognize the effect of the tax law changes in the period of enactment, including determining the transition tax, re-measuring our U.S. deferred tax assets and liabilities and reassessing the net realizability of our deferred tax assets and liabilities. Staff Accounting Bulletin No. 118, Income Tax Accounting Implications of the Tax Cuts and Jobs Act (“SAB 118”) allows us to record provisional amounts during a measurement period not to extend beyond one year of the enactment date. As of December 31, 2017, we recorded provisional estimates in our financial statements with respect to certain income tax effects of the Act for which the accounting is incomplete, but a reasonable estimate was able to be determined. During 2018, we continued to perform additional analysis on the application of the Act, taking into account any additional regulatory guidance that was issued by the applicable taxing authorities, which resulted in adjustments to our previously reported provisional estimates, some of which materially affected our tax obligations and our effective tax rate.
In addition, the Act requires complex computations not previously provided in U.S. tax law, and the application of accounting guidance for such items is currently uncertain in some respects. Further, compliance with the Act and the accounting for such provisions require accumulation of information not previously required or regularly produced. The U.S. Department of Treasury has broad authority to issue regulations and interpretative guidance that may significantly impact how the law is applied and thus impact our results of operations in the period issued.
23
Increases in taxes could negatively impact our operating results.
As a result of economic downturns, tax receipts have decreased and/or government spending has increased in many of the countries in which we operate. Consequently, governments may increase tax rates or implement new taxes in order to compensate for gaps between tax revenues and expenditures. Additionally, governments may prohibit or restrict the use of certain legal structures designed to minimize taxes. Any such tax increases, whether borne by us or our customers, could negatively impact our operating results or the demand for our products.
We could be adversely affected by violations of the U.S. Foreign Corrupt Practices Act or other similar anti-corruption laws.
Our operations in countries outside the United States are subject to anti-corruption laws and regulations, including restrictions imposed by the FCPA. The FCPA and similar anti-corruption laws in other jurisdictions, such as the U.K. Bribery Act, generally prohibit companies and their intermediaries from making improper payments to government officials or employees of commercial enterprises for the purpose of obtaining or retaining business. We operate in many parts of the world that have experienced corruption to some degree and, in certain circumstances, strict compliance with anti-corruption laws may conflict with local customs and practices.
Our employees and agents interact with government officials on our behalf, including as necessary to obtain licenses and other regulatory approvals necessary to operate our business, import or export equipment, employ expatriates and resolve tax disputes. We also have a number of contracts with foreign governments or entities owned or controlled by foreign governments. These interactions and contracts create a risk of violation of the FCPA or other similar laws.
Although we have implemented policies and procedures designed to ensure compliance with local laws and regulations as well as U.S. laws and regulations, including the FCPA, there can be no assurance that all of our employees, consultants, contractors and agents will abide by our policies. If we are found to be liable for violations of the FCPA or similar anti-corruption laws in other jurisdictions, either due to our own or others' acts or inadvertence, we could suffer from criminal or civil penalties which could have a material and adverse effect on our results of operations, financial condition and cash flows.
Because we are a multinational company conducting a complex business in many
markets worldwide, we are subject to legal and operational risks related to
staffing and management, as well as a broad array of local legal and regulatory
requirements which could adversely affect our operations.
Operating outside of the U.S. creates difficulties associated with staffing and managing our international operations, as well as complying with local legal and regulatory requirements. We operate financial transaction processing networks that offer new products and services to customers, and the laws and regulations in the markets in which we operate evolve and are subject to rapid change. Although we have knowledgeable local staff in countries in which we deem it appropriate, we cannot assure you that we will continue to be found to be operating in compliance with all applicable customs, currency exchange control, data protection, employment, transfer pricing and other laws or regulations to which we may be subject. We also cannot assure you that these laws will not be modified in ways that may adversely affect our business.
Our business may be adversely affected if recent developments to applicable data protection regulations in the European Union require us to cease the transfer of personal data from the European Union to the United States.
In October 2015, the European Court of Justice invalidated the European Commission’s decision regarding the transfer of personal data from the E.U. to the United States (known as the "Safe Harbor Decision"). Prior to the ruling of the European Court of Justice, the Safe Harbor Decision provided a mechanism that facilitated personal data transfers to the United States in compliance with the E.U.’s Directive on Data Protection. Our money transfer business relies on the transfer of E.U. citizens’ personal information to the United States to enable payment of money remittance transactions to beneficiaries through our correspondent network. Despite the October 2015 ruling of the European Court of Justice, we believe we remain in compliance with E.U. regulations regarding the transfer of personal data to the United States. If we are unable to transfer personal data from the E.U. to the United States or other countries where we operate, then it could affect the manner in which we provide our services or adversely affect our financial results.
24
Because we derive our revenues from a multitude of countries with different
currencies, our business may be adversely affected by local inflation and foreign currency
exchange rates and policies.
We report our results in U.S. dollars, although a majority of our income is realized in foreign currencies. As exchange rates among the U.S. dollar, the euro, and other currencies fluctuate, the impact of these fluctuations may have a material adverse effect on our results of operations or financial condition as reported in U.S. dollars.
A significant number of our ATMs are located in countries in the European Union that use the euro. From time to time, some of these countries, including Greece, have considered leaving the European Union and adopting another currency. If such an event were to occur, the conversion of cash that we hold in banks and in our ATM network in that country from euros to another currency could have an adverse effect on our financial condition or results of operations, either from initial conversion or from subsequent changes in currency exchange rates. The magnitude of this risk increases when cash balances in our ATM network increase during the tourism season. While such currency change does not appear to be an immediate risk under current circumstances, the Company continues to monitor developments in this area and will attempt to mitigate any adverse effects where possible.
In November 2016, without advance warning, the Indian government announced that it would remove from circulation two of the most often used Indian banknotes, the Rs 500 and Rs 1000 banknotes. The government expected that the notes would rapidly be replaced with a new Rs 500 note and a new Rs 2000 note, retiring (or demonetizing) completely the Rs 1000 banknote. However, distribution of the new notes was delayed, and circulation of the new notes only commenced in February 2017. While the cash supply was restored during the first months of 2017, the shortage of cash in November and December 2016 adversely impacted Euronet's 2016 fourth quarter revenue earned from ATM cash withdrawals on the more than 12,000 ATMs Euronet owns or operates as well as revenue earned from money transfer remittance payout in India. The action by the Indian government was motivated by a desire to penalize Indians holding large quantities of money earned from illicit business. Any similar action by other governments in countries in which we do business could have an adverse effect on our business.
Our Money Transfer Segment is subject to foreign currency exchange risks because our customers deposit funds in one currency at our retail and agent locations worldwide or in an online account and we typically deliver funds denominated in a different, destination country currency. Although we use foreign currency derivative contracts to mitigate a portion of this risk, we cannot eliminate all of the exposure to the impact of changes in foreign currency exchange rates for the period between collection and disbursement of the money transfers.
We have various mechanisms in place to discourage takeover attempts, which may
reduce or eliminate our stockholders' ability to sell their shares for a
premium in a change of control transaction.
Various provisions of our certificate of incorporation and bylaws and of Delaware corporate law may discourage, delay or prevent a change in control or takeover attempt of our company by a third party which our management and board of directors opposes. Public stockholders who might desire to participate in such a transaction may not have the opportunity to do so. These anti-takeover provisions could substantially impede the ability of public stockholders to benefit from a change of control or change in our management and board of directors. These provisions include:
|
•
|
preferred stock that could be issued by our board of directors to make it more difficult for a third party to acquire, or to discourage a third party from acquiring, a majority of our outstanding voting stock;
|
|
•
|
classification of our directors into three classes with respect to the time for which they hold office;
|
|
•
|
supermajority voting requirements to amend the provision in our certificate of incorporation providing for the classification of our directors into three such classes;
|
|
•
|
non-cumulative voting for directors;
|
|
•
|
control by our board of directors of the size of our board of directors;
|
|
•
|
limitations on the ability of stockholders to call special meetings of stockholders; and
|
|
•
|
advance notice requirements for nominations of candidates for election to our board of directors or for proposing matters that can be acted upon by our stockholders at stockholder meetings.
|
We are authorized to issue up to a total of 90 million shares of Common Stock,
potentially diluting equity ownership of current holders and the share price of
our Common Stock.
25
We believe that it is necessary to maintain a sufficient number of available authorized shares of our Common Stock in order to provide us with the flexibility to issue Common Stock for business purposes that may arise as deemed advisable by our Board. These purposes could include, among other things, (i) to declare future stock dividends or stock splits, which may increase the liquidity of our shares; (ii) the sale of stock to obtain additional capital or to acquire other companies or businesses, which could enhance our growth strategy or allow us to reduce debt if needed; (iii) use in additional stock incentive programs and (iv) other bona fide purposes. Our Board of Directors may issue the available authorized shares of Common Stock without notice to, or further action by, our stockholders, unless stockholder approval is required by law or the rules of the NASDAQ Global Select Market. The issuance of additional shares of Common Stock may significantly dilute the equity ownership of the current holders of our Common Stock. Further, over the course of time, all of the issued shares have the potential to be publicly traded, perhaps in large blocks. This may result in dilution of the market price of the Common Stock.
An additional
11.9 million
shares of Common Stock, representing approximately
23%
of the
shares outstanding as of
December 31, 2018
, could be added to our total Common
Stock outstanding through the exercise of options or the issuance of additional
shares of our Common Stock pursuant to existing convertible debt and other agreements. Once issued, these shares of Common Stock could be traded into the
market and result in a decrease in the market price of our Common Stock.
As of
December 31, 2018
, we had
2.6 million
and
0.4 million
options and restricted stock awards outstanding, respectively, held by our directors, officers and employees, which entitle these holders to acquire an equal number of shares of our Common Stock. Of this amount,
1.6 million
options are vested and exercisable as of
December 31, 2018
. Approximately
3.4 million
additional shares of our Common Stock may be issued in connection with our stock incentive and employee stock purchase plans.
Accordingly, based on current trading prices of our Common Stock, approximately
2.0 million
shares could potentially be added to our total current Common Stock outstanding through the exercise of options and the vesting of restricted stock awards, which could adversely impact the trading price for our stock.
Of the
2.9 million
total options and restricted stock awards outstanding, an aggregate of
1.7 million
options and restricted stock awards are held by persons who may be deemed to be our affiliates and who would be subject to Rule 144. Thus, upon exercise of their options or sale of shares for which restrictions have lapsed, these affiliates' shares would be subject to the trading restrictions imposed by Rule 144. The remainder of the common shares issuable under option and restricted stock award arrangements would be freely tradable in the public market. Over the course of time, all of the issued shares have the potential to be publicly traded, perhaps in large blocks.
Upon the occurrence of certain events, another
5.6 million
shares of Common Stock could be issued upon conversion of the Company's convertible notes issued in October 2014; in certain situations, the number of shares issuable could be higher. While we have stated that we intend to settle any conversion of these notes by issuing cash for the principal value of the
notes and issuing shares of Common Stock for the conversion value in excess of the principal, which would significantly
reduce the number of shares issued upon conversion, if our financial condition significantly and adversely changes, we may not be able to settle as intended should the notes be converted.
Our competition in the EFT Processing Segment, epay Segment and Money Transfer
Segment includes large, well-financed companies and financial institutions
larger than us with earlier entry into the market. As a result, we may lack the
financial resources and access to capital needed to capture increased market
share.
EFT Processing Segment
- Our principal EFT Processing competitors include ATM networks owned by banks and national switches consisting of consortiums of local banks that provide outsourcing and transaction services only to banks and independent ATM deployers in that country. Large, well-financed companies offer ATM network and outsourcing services that compete with us in various markets. In some cases, these companies also sell a broader range of card and processing services than we do, and are, in some cases, willing to discount ATM services to obtain large contracts covering a broad range of services. Competitive factors in our EFT Processing Segment include network availability and response time, breadth of service offering, price to both the bank and to its customers, ATM location and access to other networks.
epay Segment
- We face competition in the epay business in all of our markets. A few multinational companies operate in several of our markets, and we therefore compete with them in a number of countries. In other markets, our competition is from smaller, local companies. Major retailers with high volumes are in a position to demand a larger share of commissions or to negotiate directly with the mobile phone operators, which may compress our margins. Additionally, certain of our content providers, including mobile phone operators have entered into direct contracts with retailers and/or have developed processing technology that diminishes or eliminates the need for intermediate processors and distributors.
26
Money Transfer Segment -
Our primary competitors in the money transfer and bill payment business include other large money transfer companies and electronic money transmitters, as well as certain major national and regional banks, financial institutions and independent sales organizations. Our competitors include The Western Union Company and MoneyGram International Inc. The Western Union Company has a significant competitive advantage due to its greater resources and access to capital for expansion. This may allow them to offer better pricing terms to customers, which may result in a loss of our current or potential customers or could force us to lower our prices. Either of these actions could have an adverse impact on our revenues. In addition, our competitors may have the ability to devote more financial and operational resources than we can to the development of new technologies that provide improved functionality and features to their product and service offerings. If successful, their development efforts could render our product and service offerings less desirable, resulting in the loss of customers or a reduction in the price we could demand for our services. In addition to traditional money payment services, new technologies are emerging that may effectively compete with traditional money payment services, such as stored-value cards, debit networks, web-based services and digital currencies. Our continued growth depends upon our ability to compete effectively with these alternative technologies.
If processing fees and commissions in our epay business continue to decline, our financial results may be adversely affected.
Our epay Segment derives revenues based on processing fees and commissions from mobile phone operators and other content providers. Growth in our prepaid mobile business in any given market is driven by a number of factors, including the overall pace of growth in the prepaid mobile phone market which is impacted by competing postpaid services, our market share of the retail distribution capacity, the level of commission that is paid to the various intermediaries in the prepaid mobile airtime distribution chain, and the value provided to the retailers through the types of products offered and the level of integration with their systems. Also, competition among prepaid mobile distributors results in retailer churn and the reduction of commissions paid by prepaid content providers, although a portion of such reductions can be passed along to retailers. In recent years, processing fees and commissions per transaction have declined in most markets, and we expect that trend to continue. Additionally, the number of prepaid mobile top-up transactions we process has declined in certain markets. We have generally been able to mitigate these trends due to growth in the number of higher margin non-mobile product transactions, driven by acquisitions and organic growth. If we cannot continue to increase our transaction levels and per-transaction fees and commissions continue to decline, the combined impact of these factors could adversely impact our financial results.
Our epay and money transfer businesses may be susceptible to fraud and/or
credit risks occurring at the retailer, correspondent and/or consumer level, which could adversely affect our results of operations.
In our epay Segment, we contract with retailers that accept payment on our behalf, which we then transfer to a trust or other operating account for payment to content providers. In the event a retailer does not transfer to us payments that it receives for prepaid content sales, whether as a result of fraud, insolvency, billing delays or otherwise, we are responsible to the content provider for the cost of the product sold. We can provide no assurance that retailer fraud or insolvency will not increase in the future or that any proceeds we receive under our credit enhancement or insurance policies will be adequate to cover losses resulting from retailer fraud, which could have a material adverse effect on our business, financial condition and results of operations.
With respect to our money transfer business, we conduct the majority of our business through our agent network, which provides money transfer services directly to consumers at retail locations. Our agents collect funds directly from consumers and in turn, we collect from the agents the proceeds due to us resulting from the money transfer transactions. In addition, we advance funds to our correspondent banks to pay out money transfers and they may hold our funds for several days or more pending payment to beneficiaries. Therefore, we have credit exposure to our agents and correspondents. Additionally, our Company-owned stores transact a significant amount of business in cash. Although we have safeguards in place, cash transactions have a higher exposure to fraud and theft than other types of transactions. The failure of agents owing us significant amounts to remit funds to us or to repay such amounts, or the loss of cash in our stores could have a material adverse effect our business, financial condition and results of operations.
27
Because we typically enter into short-term contracts with content providers and
retailers, our epay business is subject to the risk of non-renewal of those
contracts, or renewal under less favorable terms.
Our contracts with content providers to distribute and process content, including prepaid mobile airtime top-up services, typically have terms of less than three years. Many of those contracts may be canceled by either party upon three months' notice. Our contracts with content providers are not exclusive, so these providers may enter into contracts with other service providers. In addition, our service contracts with major retailers typically have terms of one to three years, and our contracts with smaller retailers typically may be canceled by either party upon three to six months' notice. The cancellation or non-renewal of one or more of our significant content provider or retail contracts, or of a large enough group of our contracts with smaller retailers, could have a material adverse effect on our business, financial condition and results of operations. The renewal of contracts under less favorable payment terms, commission terms or other terms could have a material adverse impact on our working capital requirements and/or results from operations. In addition, our contracts generally permit operators to reduce our fees at any time. Commission revenue or fee reductions by any of the content providers could also have a material adverse effect on our business, financial condition or results of operations.
The growth and profitability of our epay business may be adversely affected by
changes in state, federal or foreign laws, rules and regulations.
As we continue to expand our electronic payment product offerings, certain of those products may become regulated by state, federal or foreign laws, rules and regulations, including the U.S. CFPB. New product offerings may be considered to be money transfer related products which would require licensure for entities distributing or processing such products. If such products become more highly regulated and ultimately require licensure, our epay business may be adversely affected. Further, if regulations regarding the expiration of gift vouchers change in the countries where we offer them, the revenue epay recognizes from unredeemed vouchers may be negatively affected.
The growth in our epay business may be adversely affected if we are unable to expand and differentiate our offering of new electronic payment products.
The prepaid marketplace is currently experiencing high growth in the differentiation of product offerings. While our epay business is focused on expanding and differentiating its suite of prepaid product offerings on a global basis, there can be no assurance that we will be able to enter into relationships on favorable terms with additional content providers or renew or expand current relationships and contracts on favorable terms. Inability to continue to grow our suite of electronic payment product offerings could have a material adverse effect on our business, financial condition and results of operations.
The stability and growth of our EFT Processing Segment may be adversely affected if we are unable to maintain
our current card acceptance and ATM management agreements with banks and
international card organizations, and to secure new arrangements for card
acceptance and ATM management.
The stability and future growth of our EFT Processing Segment depends in part on our ability to sign card acceptance and ATM management agreements with banks and international card organizations. Card acceptance agreements allow our ATMs to accept credit and debit cards issued by banks and international card organizations. ATM management agreements generate service income from our management of ATMs for banks.
These agreements have expiration dates, and banks and international card organizations are generally not obligated to renew them. Our existing contacts generally have terms of five to seven years and a number of them expire or are up for renewal each year. In some cases, banks may terminate their contracts prior to the expiration of their terms. We cannot assure you that we will be able to continue to sign or maintain these agreements on terms and conditions acceptable to us or that international card organizations will continue to permit our ATMs to accept their credit and debit cards. The inability to continue to sign or maintain these agreements, or to continue to accept the credit and debit cards of local banks and international card organizations at our ATMs in the future, could have a material adverse effect on our business, growth, financial condition or results of operations.
28
Our operating results depend, in part, on the volume of transactions on ATMs in our network and the fees we can collect from processing these transactions. We generally have little control over the ATM transaction fees established in the markets where we operate, and therefore, cannot control any potential reductions in these fees which may adversely affect our results of operations.
Transaction fees from banks, customers and international card organizations for transactions processed on our ATMs have historically accounted for a substantial portion of our revenues. These fees are set by agreement among all banks in a particular market. The future operating results of our ATM business depend on the following factors:
|
•
|
the acceptance of our ATM processing and management services in our target markets;
|
|
•
|
the maintenance of the level of transaction fees we receive;
|
|
•
|
the continued use of our ATMs by credit and debit cardholders; and
|
|
•
|
our ability to generate revenues from interchange fees and from other value added services, including dynamic currency conversion.
|
The amount of fees we receive per transaction is set in various ways in the markets in which we do business. We have card acceptance agreements or ATM management agreements with some banks under which fees are set. However, we derive a significant portion of our revenues in many markets from interchange fees, surcharges or cash withdrawal related services that are set by the central ATM processing switch or various card organizations. The banks that participate in these switches or the card organizations that enable the services or transactions set the interchange fee and/or establish the rules regarding the services allowed, and we are not in a position in any market to greatly influence these fees or rules, which may change over time. A significant decrease in the interchange fee, or limitations placed on our ability to offer value added services via our ATM network, in any market could adversely affect our results in that market.
Although we believe that the volume of transactions in developing countries may increase due to growth in the number of cards being issued by banks in these markets, we anticipate that transaction levels on any given ATM in developing markets will not increase significantly. We can attempt to improve the levels of transactions on our ATM network overall by acquiring good sites for our ATMs, eliminating poor locations, entering new, less-developed markets and adding new transactions, including new value added services, to the sets of transactions that are available on our ATMs. However, we may not be successful in materially increasing transaction levels through these measures. Per-transaction fees paid by international card organizations have declined in certain markets in the past and competitive factors have required us to reduce the transaction fees we charge customers. If we cannot continue to increase our transaction levels and per-transaction fees generally decline, our results would be adversely affected.
Tightening of regulations may adversely affect our results.
The evolving regulatory environment may change the competitive landscape across various jurisdictions and adversely affect our financial results. If governments implement new laws or regulations, or organizations such as Visa and MasterCard issue new rules, that effectively limit our ability to provide DCC or set fees and/or foreign currency exchange spreads, then our business, financial condition and results of operations could be materially and adversely affected. In addition, changes in regulatory interpretations or practices could increase the risk of regulatory enforcement actions, fines and penalties and such changes may be replicated across multiple jurisdictions.
In March 2018, the E.U. proposed additional regulations on cross border transactions within the E.U., including specific regulations on DCC. In December 2018, the European Commission, European Council and European Parliament agreed to legislation that requires disclosure of foreign exchange margins applicable to DCC transactions and eventual comparability between foreign exchange rates offered by DCC providers and bank card issuers. The new legislation is expected to come into effect in mid-2020. Such regulation could materially and adversely impact our financial results, by reducing the number of DCC transactions performed over our networks and the level of profit we generate from such transactions.
The E.U. has passed a new regulation called the GDPR that establishes stringent requirements for the collection and processing of personal information of individuals within the E.U. The GDPR came into effect across the E.U. on May 25, 2018. The GDPR establishes stringent requirements for the collection and processing of personal information of individuals within the E.U., establishes certain rights of individuals regarding personal information processed by companies as well as requirements for information security and imposes significant fines that may be revenue-based for violation of its requirements. The GDPR applies to transfers of personal information from the E.U. to countries outside the E.U., including the U.S. Any failure on our
29
part to meet the requirements of the GDPR could result in the imposition of fines and penalties that could materially and adversely affect our financial results.
Developments in payments could materially reduce our
transaction levels and revenues.
Certain developments in the field of payments may reduce the need for ATMs, prepaid product POS terminals and money transfer agents. An example of this type of development is the use of near field technology in retail transactions, which if widely accepted in a market reduces the need for cash and can negatively impact the level of ATM transactions in that market. Advances in biometric payment solutions could have similar adverse impacts. These developments may reduce the transaction levels that we experience on our networks in the markets where they occur. Financial institutions, retailers and agents could elect to increase fees to their customers for using our services, which may cause a decline in the use of our services and have an adverse effect on our revenues. If transaction levels over our existing network of ATMs, POS terminals, agents and other distribution methods do not increase, growth in our revenues will depend primarily on increased capital investment for new sites and developing new markets, which reduces the margin we realize from our revenues.
The mobile phone industry is a rapidly evolving area, in which technological developments, in particular the development of new billing models (such as "all you can eat" plans) and distribution methods or services, may affect the demand for other services in a dramatic way. The development of any new models or technology that reduce the need or demand for prepaid mobile airtime could materially and adversely affect our business.
In some cases, we are dependent upon international card organizations and
national transaction processing switches to provide assistance in obtaining
settlement from card issuers of funds relating to transactions on our ATMs, and any failure by them to provide the required cooperation could result in our inability to obtain settlement of funds relating to transactions.
Our ATMs dispense cash relating to transactions on credit and debit cards issued by banks. We have in place arrangements for the settlement to us of all of those transactions, but in some cases, we do not have a direct relationship with the card-issuing bank and rely for settlement on the application of rules that are administered by international card associations (such as Visa or MasterCard) or national transaction processing switching networks. If a bankcard association fails to settle transactions in accordance with those rules, we are dependent upon cooperation from such organizations or switching networks to enforce our right of settlement against such banks or card associations. Failure by such organizations or switches to provide the required cooperation could result in our inability to obtain settlement of funds relating to transactions and adversely affect our business. Moreover, international card associations and issuers of their cards (and, in the case of Visa, member banks) have the ability to change or apply their rules in ways that could negatively impact our business. As an example, DCC is not permitted on certain cards in certain geographic territories, and the scope of such restrictions could be extended. Any such change or application of the rules of international card associations could materially and adversely affect our business.
Because our business is highly dependent on the proper operation of our
computer networks and telecommunications connections, significant technical
disruptions to these systems would adversely affect our revenues and financial
results.
Our business involves the operation and maintenance of sophisticated computer networks and telecommunications connections with financial institutions, mobile phone operators, other content providers, retailers and agents. This, in turn, requires the maintenance of computer equipment and infrastructure, including telecommunications and electrical systems, and the integration and enhancement of complex software applications. There are operational risks inherent in this type of business that can result in the temporary shutdown of part or all of our processing systems, such as failure of electrical supply, failure of computer hardware, security breaches and software errors. Transactions in the EFT Processing Segment are processed through our Budapest, Beijing, Mumbai and Karachi processing centers. Transactions in the epay Segment are processed through our London, Martinsried, Hamburg, Milan, Buena Park, California and Kansas City, Missouri processing centers. Transactions in our Money Transfer Segment are processed through our Buena Park, California, Kansas City, Missouri, Bracknell, Auckland, and Kuala Lumpur processing centers. Any operational problem in these centers may have a significant adverse impact on the operation of our networks. Even with disaster recovery procedures in place, these risks cannot be eliminated entirely, and any technical failure that prevents operation of our systems for a significant period of time will prevent us from processing transactions during that period of time and will directly and adversely affect our revenues and financial results.
We are subject to security breaches of our systems. Any such breach may cause us to incur financial losses, liability, harm to our reputation, litigation, regulatory enforcement actions and limitations on our ability to conduct our businesses.
30
We capture, transmit, handle and store sensitive information in conducting and managing electronic, financial and mobile transactions, such as card information, PIN numbers and personal information of various types. These businesses involve certain inherent security risks, in particular: the risk of electronic interception and theft of the information for use in fraudulent or other card transactions by persons outside the Company, including third party vendors or by our own employees; and the use of fraudulent cards on our network of owned or outsourced ATMs and POS devices. We incorporate industry-standard encryption technology and processing methodology into our systems and software, and maintain controls and procedures regarding access to our computer systems by employees and others, to maintain high levels of security. Although this technology and methodology decreases security risks, they cannot be eliminated entirely as criminal elements apply increasingly sophisticated technology to attempt to obtain unauthorized access to the information handled by ATM, money transfer and electronic financial transaction networks. In addition, the cost and timeframes required for implementation of new technology may result in a time lag between availability of such technology and our adoption of it. Further, our controls, procedures and technology may not be able to detect when there is a breach, causing a delay in our ability to mitigate it. As previously disclosed in our SEC filings, we were the subject of a computer security breach, and we cannot exclude the possibility of additional breaches in the future.
Any breach in our security systems could result in the perpetration of fraudulent financial transactions for which we may bear the liability. We are insured against various risks, including theft and negligence, but such insurance coverage is subject to deductibles, exclusions and limits that may leave us bearing some or all of any losses arising from security breaches.
We also collect, transfer and retain personal data as part of our money transfer business. These activities are subject to certain privacy laws and regulations in the U.S. and in other jurisdictions where our money transfer services are offered. We maintain technical and operational safeguards designed to comply with applicable legal requirements. Despite these safeguards, there remains a risk that these safeguards could be breached resulting in improper access to, and disclosure of, sensitive customer information. Breaches of our security policies or applicable legal requirements resulting in a compromise of customer data could expose us to regulatory enforcement action, subject us to litigation, limit our ability to provide money transfer services and/or cause harm to our reputation.
In addition to electronic fraud issues and breaches of our systems, the possible theft and vandalism of ATMs or cash in the ATMs present risks for our ATM business. We install ATMs at high-traffic sites and consequently our ATMs are exposed to theft and vandalism, and to a new form of attack whereby the security of the ATM is breached electronically by transmitting a command to the ATM to dispense cash without a card being present. We constantly monitor ATM security and
take measures to protect our systems from such attacks and other breaches, but we cannot be certain that our measures will be effective against new, rapidly developing methods used by criminal elements. Although we are insured against such risks, deductibles, exclusions or limitations in such insurance may leave us bearing some or all of any losses arising from theft or vandalism of ATMs or loss of cash due to security breaches of our ATM networks. In addition, we have experienced increases in claims under our insurance, which has increased our insurance premiums.
We could incur substantial losses if one of the third party depository
institutions we use in our operations were to fail.
As part of our business operations, we maintain cash balances at third party depository institutions. We could incur substantial losses if a financial institution in which we have significant deposits fails.
We are required under certain national laws and the rules of financial transaction
switching networks in many of our markets to have ''sponsors'' to operate ATMs
and switch ATM transactions. Our failure to secure ''sponsor'' arrangements in any of our markets that require bank sponsors could prevent us from doing business in that
market.
Under the laws of some countries, only a licensed financial institution may operate ATMs. Because we are not a licensed financial institution outside of the E.U. we are required to have a ''sponsor'' bank to conduct ATM operations in those countries. In addition, in all of our non-E.U. markets, the rules governing national transaction switching networks owned or operated by banks, and other international financial transaction switching networks operated by organizations such as Citibank, Visa and MasterCard, require any company sending transactions through these switches to be a bank or a technical service processor that is approved and monitored by a bank. As a result, the operation of our ATM network in many of our markets depends on our ability to secure these ''sponsor'' arrangements with financial institutions.
To date, we have been successful in reaching contractual arrangements that have permitted us to operate in all of our target markets. However, we cannot assure you that we will continue to be successful in reaching these arrangements, and it is possible that our current arrangements will not continue to be renewed. If we are unable to secure “sponsor” arrangements in any market, we could be prevented from doing business in that market.
31
We rely on third party financial institutions to provide us with a portion of the cash required to operate our ATM networks in certain countries. If these institutions were unable or unwilling to provide us with the cash necessary to operate our ATM networks, we would be required to locate additional alternative sources of cash to operate these networks.
In our EFT Processing Segment, we primarily rely on third party financial institutions in certain countries in Europe and Asia Pacific to provide us with the cash required to operate our ATM networks. Under our agreements with these providers, we pay fees or interest, which is generally variable and could increase, based on the total amount of cash we are using from such provider at a given time, as well as other costs such as bank fees and cash transportation costs. As of
December 31, 2018
, the amount of cash used in our ATM networks under these supply agreements was approximately
$523 million
. Before the cash is disbursed to ATM customers, beneficial ownership of the cash is generally retained by the cash providers, and we have no access or proprietary rights to the cash.
Our existing agreements with cash providers are generally multi-year agreements that expire at various times. However, each provider may have the right to demand the return of all or any portion of its cash at any time upon the occurrence of certain events beyond our control, including certain bankruptcy events affecting us or our subsidiaries, or a breach of the terms of our cash provider agreements.
If any of our cash supply providers were to demand return of their cash or terminate their agreements with us and remove their cash from our ATM devices, or if they fail to provide us with the cash our operations require, our ability to operate the ATM networks to which the provider supplies cash would be jeopardized, and we would need to locate additional alternative sources of cash, including, potentially the increased use of our own cash. Under those circumstances, the terms and conditions of the new or renewed agreements could potentially be less favorable to us, which would negatively impact our results of operations. Furthermore, restrictions on our access to cash to supply our ATMs could severely restrict our ability to keep our ATMs operating, which could subject us to performance penalties under our contracts with our customers.
We have encountered difficulty in obtaining cash supply arrangements in certain of our markets, including Greece, and directly provide cash for our ATM transactions in those markets. While the amounts involved are currently well within our capabilities given our cash flows and available financing, any failure to renew a major cash supply arrangement could require that we commit significant financial resources to the supply of cash to our ATM networks, which could adversely impact our results of operations.
Competition in our EFT Processing Segment has increased over the last several
years, increasing the risk that certain of our long-term bank outsourcing
contracts may be terminated or not renewed upon expiration.
The developing markets in which we have done business have matured over the years, resulting in increasing competition. In addition, as consolidation of financial institutions in Central and Eastern Europe continues, certain of our customers have established or are establishing internal ATM management and processing capabilities. As a result of these developments, negotiations regarding renewal of contracts have become increasingly challenging and in certain cases we have reduced fees to extend contracts beyond their original terms. In certain other cases, contracts have been, and in the future may be, terminated by financial institutions resulting in a substantial reduction in revenue. Contract termination payments, if any, may be inadequate to replace revenues and operating income associated with these contracts. Although we have historically considered the risk of non-renewal of major contracts to be relatively low because of complex interfaces and operational procedures established for those contracts, the risk of non-renewal or early termination is increasing.
Our operating results in the money transfer business may be harmed if there are adverse changes in worker immigration patterns, our ability to expand our share of the
existing electronic market and to expand into new markets and our ability to
continue complying with regulations issued by the OFAC, BSA, FINCEN, USA PATRIOT Act regulations, the Dodd-Frank Act or any other existing or future
regulations that impact any aspect of our money transfer business.
Our money transfer business primarily focuses on workers who migrate to foreign countries in search of employment and then send a portion of their earnings to family members in their home countries. Changes in U.S. and foreign government policies or enforcement, including changes that have been, or may be, implemented by the U.S. President or Congress, toward immigration may have a negative effect on immigration in the U.S. and other countries, which could also have an adverse impact on our money transfer revenues.
Both U.S. and foreign regulators have become increasingly aggressive in the enforcement of the various regulatory regimes applicable to our businesses and the imposition of fines and penalties in the event of violations. Our ability to continue
32
complying with the requirements of OFAC, BSA, FINCEN, the USA PATRIOT Act, the Dodd-Frank Act and other regulations (both U.S. and foreign) is important to our success in achieving growth and an inability to do this could have an adverse impact on our revenues and earnings. Anti-money laundering and consumer protection regulations require us to be responsible for the compliance by agents with such regulations. Although we have training and compliance programs in place, we cannot be certain our agents will comply with such regulations and we may be held responsible for their failure to comply, resulting in fines and penalties.
Future growth and profitability depend upon expansion within the markets in which we currently operate and the development of new markets for our money transfer services. Our expansion into new markets is dependent upon our ability to successfully apply our existing technology or to develop new applications to satisfy market demand. We may not have adequate financial and technological resources to expand our distribution channels and product applications to satisfy these demands, which may have an adverse impact on our ability to achieve expected growth in revenues and earnings.
Changes in state, federal or foreign laws, rules and regulations could impact
the money transfer industry, making it more difficult for our customers to
initiate money transfers which would harm our money transfer business.
Our money transfer services are subject to regulation by the U.S. states in which we operate, by the U.S. federal government and the governments of the other countries in which we operate. Changes in the laws, rules and regulations of these governmental entities, and our ability to obtain or retain required licensure, could have a material adverse impact on our results of operations, financial condition and cash flow.
Changes in banking industry regulation and practice could make it more
difficult for us and our agents to maintain depository accounts with banks, which would harm our business.
The banking industry, in light of increased regulatory oversight, is continually examining its business relationships with companies that offer money transfer services and with retail agents that collect and remit cash collected from end consumers. Certain major national and international banks have already withdrawn from providing service to money services businesses. Should our own banks decide to not offer depository services to companies engaged in processing money transfer transactions, or to retail agents that collect and remit cash from end customers, our ability to complete money transfers, and to administer and collect fees from money transfer transactions, could be adversely impacted.
If we are unable to maintain our money transfer agent and correspondent
networks, our business may be adversely affected.
Our consumer-to-consumer money transfer based revenues are primarily generated through the use of our agent and correspondent networks. If agents or correspondents decide to leave our network or if we are unable to sign new agents or correspondents, our revenue and profit growth rates may be adversely affected. Our agents and correspondents are also subject to a wide variety of laws and regulations that vary significantly, depending on the legal jurisdiction. Changes in these laws and regulations could adversely affect our ability to maintain the networks or the cost of providing money transfer services. In addition, agents may generate fewer transactions or less revenue due to various factors, including increased competition. Because our agents and correspondents are third parties that may sell products and provide services in addition to our money transfer services, they may encounter business difficulties unrelated to the provision of our services, which may cause the agents or correspondents to reduce their number of locations or hours of operation, or cease doing business altogether.
If consumer confidence in our money transfer business or brands declines, our
business may be adversely affected.
Our money transfer business relies on customer confidence in our brands and our ability to provide efficient and reliable money transfer services. A decline in customer confidence in our business or brands, or in traditional money transfer providers as a means to transfer money, may adversely impact transaction volumes which would, in turn, be expected to adversely impact our business and possibly result in recording charges for the impairment of goodwill and/or other long-lived assets.
33
Our money transfer service offerings are dependent on financial institutions to
provide such offerings, and any adverse change in such offerings would harm our money transfer business.
Our money transfer business involves transferring funds internationally and is dependent upon foreign and domestic financial institutions, including our competitors, to execute funds transfers and foreign currency transactions. Changes to existing regulations of financial institution operations, such as those designed to combat terrorism or money laundering, could require us to alter our operating procedures in a manner that increases our cost of doing business or to terminate certain product offerings. In addition, as a result of existing regulations and/or changes to those regulations, financial institutions could decide to cease providing the services on which we depend, requiring us to terminate certain product offerings.
The Dodd-Frank Act could have
an adverse effect on our ability to hedge risks associated with our business.
The Dodd-Frank Act established federal oversight and regulation of the over-the-counter derivatives market and entities that participate in that market. The act requires the U.S. Commodity Futures Trade Commission ("CFTC") to institute broad new position limits for futures and options traded on regulated exchanges. As the law favors exchange trading and clearing, the Dodd-Frank Act also may require us to move certain derivatives transactions to exchanges where no trade credit is provided and also comply with margin requirements in connection with our derivatives activities that are not exchange traded, although the application of those provisions to us is uncertain at this time. The Dodd-Frank Act also requires many counterparties to our derivatives instruments to spin off some of their derivatives activities to a separate entity, which may not be as creditworthy as the current counterparty, or cause the entity to comply with the capital requirements, which could result in increased costs to counterparties such as us. The Dodd-Frank Act and any new regulations could (i) significantly increase the cost of derivative contracts (including requirements to post collateral, which could adversely affect our available liquidity); (ii) reduce the availability of derivatives to protect against risks we encounter; and (iii) reduce the liquidity of foreign currency related derivatives.
If we reduce our use of derivatives as a result of the legislation and regulations, our results of operations may become more volatile and our cash flows may be less predictable, which could adversely affect our ability to plan for and fund capital expenditures and working capital. Increased volatility may make us less attractive to certain types of investors. Any of these consequences could have a material adverse effect on our financial condition and results of operations.
The United Kingdom's departure from the European Union could adversely affect us.
On June 23, 2016, the U.K. held a referendum in which voters approved an exit from the E.U., commonly referred to as Brexit. The announcement of the results of the referendum resulted in significant volatility in global stock markets and currency exchange rate fluctuations that resulted in the strengthening of the U.S. dollar against foreign currencies in which we conduct business. The strengthening of the U.S. dollar relative to other currencies negatively impacts the amount of our reported earnings outside the U.S. because
foreign currencies translate into fewer U.S. dollars.
As a result of the referendum, the British government has been negotiating the terms of the U.K.’s future relationship with the E.U. Although it remains unknown what the final terms will be, it is likely that there will be greater restrictions on the terms of trade and immigration between the U.K. and E.U. countries, and increased regulatory complexities. The effects of Brexit will depend on any agreements the U.K. makes to retain access to E.U. markets either during a transitional period or more permanently.
Our EFT Processing Segment and our Money Transfer Segment operate subsidiaries that are licensed in the U.K. as payment institutions and as an e-money institution and have passported their licenses under the PSD2 and 2EMD, respectively, across the Member States. If the U.K. leaves the E.U. single market without an agreement or without an agreement to continue passporting rights for a transitional period, then U.K. payment and/or e-money institutions may lose their rights to continue providing services in the E.U. after March 29, 2019. These measures could potentially disrupt the markets we serve and cause us to use one of our other E.U. licenses or obtain new licenses in another E.U. member state to continue operating in the markets throughout the E.U.
If we are unable to shift business to one of our other E.U. licenses or obtain additional licenses by the date that the U.K. leaves the E.U., then we may have a disruption to the services that we provide in the E.U. under our U.K. licenses. Any disruption of our business following Brexit could have a material adverse effect on our business or financial results.
34
Item 1B. Unresolved Staff Comments
None.
Item 2. Properties
Our executive offices are located in Leawood, Kansas. As of
December 31, 2018
, we also have
36
principal offices in Europe,
14
in Asia Pacific,
nine
in North America,
three
in the Middle East,
two
in South America and
one
in Africa. Our office leases generally provide for initial terms ranging from two to twelve years.
Our processing centers for the EFT Processing Segment are located in
Budapest, Hungary; Mumbai, India; Beijing, China; and Karachi, Pakistan
. Processing centers we operate for the epay Segment are located in
Billericay, U.K.; Martinsried, Germany; Hamburg, Germany; Milan, Italy; Buena Park, California, USA; and Kansas City, Missouri, USA
. Our processing centers for the Money Transfer Segment are located in
Buena Park, California, USA; Bracknell, U.K.; Auckland, New Zealand; Kansas City, Missouri, USA; and Kuala Lumpur, Malaysia
.
All of our processing centers are leased and have off-site real time backup processing centers that are capable of providing full or partial processing services in the event of failure of the primary processing centers.
Item 3. Legal Proceedings
The Company is, from time to time, a party to legal or regulatory proceedings arising in the ordinary course of its business.
The discussion regarding litigation in Part II, Item 8 - Financial Statements and Supplementary Data and Note 18, Litigation and Contingencies, to the Consolidated Financial Statements included elsewhere in this report is incorporated herein by reference.
Currently, there are no legal or regulatory proceedings that management believes, either individually or in the aggregate, would have a material adverse effect upon the Consolidated Financial Statements of the Company. In accordance with U.S. Generally Accepted Accounting Principles ("U.S. GAAP"), we record a liability when it is both probable that a liability has been incurred and the amount of the loss can be reasonably estimated. These liabilities are reviewed at least quarterly and adjusted to reflect the impacts of negotiations, settlements, rulings, advice of legal counsel, and other information and events pertaining to a particular case or proceeding.
Item 4. Mine Safety Disclosures
Not applicable.
35
Part II
Item 5. Market for Registrant’s Common Equity, Related Stockholder Matters and Issuer Purchases of Equity Securities
Market Information
Our Common Stock, $0.02 par value per share, is quoted on the NASDAQ Global Select Market under the symbol EEFT.
Dividends
Since our inception, no dividends have been paid on our Common Stock or Preferred Stock. We do not intend to distribute dividends for the foreseeable future.
Holders
At
December 31, 2018
, we had
45
stockholders of record of our Common Stock, and none of our Preferred Stock was outstanding. This figure does not include an estimate of the indeterminate number of beneficial holders whose shares may be held of record by brokerage firms and clearing agencies.
Private Placements and Issuances of Equity
During
2018
, we did not issue any equity securities that were not registered under the Securities Act of 1933, which have not been previously reported in a Quarterly Report on Form 10-Q or a Current Report on Form 8-K.
36
Stock Performance Graph
Set forth below is a graph comparing the total cumulative return on our Common Stock from December 31, 2013 through December 31, 2018 with the Total Returns Index for U.S. companies traded on the NASDAQ Global Select Market (the “Market Group”) and an index group of peer companies, the Total Returns Index for U.S. NASDAQ Financial Stocks (the “Peer Group”). Returns are based on monthly changes in price and assume reinvested dividends. These calculations assume the value of an investment in the Common Stock, the Market Group and the Peer Group was $100 on December 31, 2013.
The following performance graph and related text are being furnished to and not filed with the SEC, and will not be deemed to be “soliciting material” or subject to Regulation 14A or 14C under the Exchange Act or to the liabilities of Section 18 of the Exchange Act and will not be deemed to be incorporated by reference into any filing under the Securities Act of 1933 or the Exchange Act, except to the extent we specifically incorporate such information by reference into such filing.
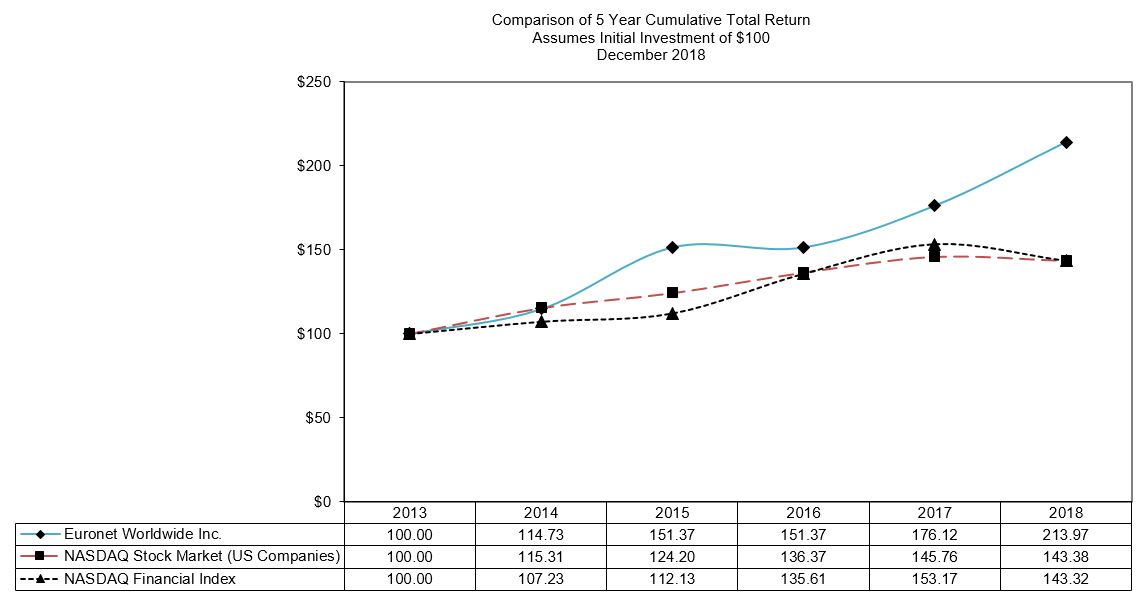
NOTE: Index Data: Calculated (or Derived) based from CRSP NASDAQ Stock Market (US Companies) and CRSP NASDAQ Financial Index, Center for Research in Security Prices (CRSP®), Graduate School of Business, The University of Chicago. Copyright 2019. Used with permission. All rights reserved.
37
Equity Compensation Plan Information
The table below sets forth information with respect to shares of Common Stock that may be issued under our equity compensation plans as of
December 31, 2018
.
|
(a)
|
(b)
|
(c)
|
||||||||
|
Plan category
|
Number of Securities to be
Issued Upon Exercise of Outstanding
Options and Rights
|
Weighted Average
Exercise Price of
Outstanding Options and Rights (1)
|
Number of Securities Remaining Available for Future Issuance Under Equity Compensation
Plans (Excluding Securities Reflected in Column (a))(2)
|
|||||||
|
Equity compensation plans approved by security holders:
|
3,391,373
|
|
||||||||
|
Stock option awards
|
2,562,570
|
|
$
|
57.10
|
|
|||||
|
Restricted stock unit awards
|
371,841
|
|
—
|
|
||||||
|
Equity compensation plans not approved by security holders
|
—
|
|
—
|
|
—
|
|
||||
|
Total
|
2,934,411
|
|
$
|
57.10
|
|
3,391,373
|
|
|||
____________________________
|
(1)
|
The weighted average exercise price in this column does not take into account the restricted stock unit awards.
|
|
(2)
|
Included in this column is
0.3 million
shares remaining under our employee stock purchase plan. During 2018, Euronet issued
21,872
shares to employees under the employee stock purchase plan.
|
Stock Repurchases
During the quarter ended
December 31, 2018
, the Company did not repurchase any common stock.
|
Period
|
Total Number of Shares Purchased
|
Average Price Paid per Share
|
Total Number of Shares Purchased as Part of Publicly Announced Plans or Programs
|
Maximum Dollar Value of Shares that May Yet Be Purchased Under the Programs (in thousands) (1)
|
||||||||||
|
October 1 - October 31, 2018
|
—
|
|
$
|
—
|
|
—
|
|
$
|
200,000
|
|
||||
|
November 1 - November 30, 2018
|
—
|
|
—
|
|
—
|
|
200,000
|
|
||||||
|
December 1 - December 31, 2018
|
—
|
|
—
|
|
—
|
|
200,000
|
|
||||||
|
Total
|
—
|
|
$
|
—
|
|
—
|
|
|||||||
(1) Amount remaining to be repurchased at the end of the period. In June 2016, the Board of Directors authorized a stock repurchase program ("Repurchase Program") allowing Euronet to repurchase up to
$125 million
in value or
3.0 million
shares of its common stock through June 14, 2018. In December 2017, the Board of Directors amended the Repurchase Program, allowing Euronet to repurchase up to
$250 million
in value or
6.0 million
shares of its common stock through December 31, 2019. On February 27, 2018, the Repurchase Program was further amended to increase the amount of common stock that may be purchased to an aggregate of $375 million in value or 10.0 million shares of stock and extending the expiration date of the Repurchase Program to March 31, 2020. Repurchases under the Repurchase Program may take place in the open market or in privately negotiated transactions, including derivative transactions, and may be made under a Rule 10b5-1 plan.
38
Item 6. Selected Financial Data
The following information should be read in conjunction with Item 7 - Management's Discussion and Analysis of Financial Condition and Results of Operations and our Consolidated Financial Statements and accompanying notes contained in Item 8 - Financial Statements and Supplementary Data in this report. The historical results are not necessarily indicative of the results to be expected in any future period.
|
Year Ended December 31,
|
||||||||||||||||||||
|
(dollar amounts in thousands, except per share amounts)
|
2018
|
2017
|
2016
|
2015
|
2014
|
|||||||||||||||
|
Income statement data:
|
||||||||||||||||||||
|
Revenues
|
$
|
2,536,629
|
|
$
|
2,252,422
|
|
$
|
1,958,615
|
|
$
|
1,772,262
|
|
$
|
1,664,150
|
|
|||||
|
Operating expenses (1)
|
|
2,072,694
|
|
1,891,395
|
|
1,628,313
|
|
1,497,396
|
|
1,433,964
|
|
|||||||||
|
Depreciation and amortization
|
106,021
|
|
95,030
|
|
80,529
|
|
70,025
|
|
71,455
|
|
||||||||||
|
Operating income (1)
|
357,914
|
|
265,997
|
|
249,773
|
|
204,841
|
|
158,731
|
|
||||||||||
|
Other expenses, net
|
(62,998
|
)
|
(9,662
|
)
|
(16,880
|
)
|
(63,747
|
)
|
(17,228
|
)
|
||||||||||
|
Income from continuing operations before income taxes
|
294,916
|
|
256,335
|
|
232,893
|
|
141,094
|
|
141,503
|
|
||||||||||
|
Income tax expense
|
(62,785
|
)
|
(99,395
|
)
|
(58,795
|
)
|
(42,602
|
)
|
(40,015
|
)
|
||||||||||
|
Income from continuing operations
|
$
|
232,131
|
|
$
|
156,940
|
|
$
|
174,098
|
|
$
|
98,492
|
|
$
|
101,488
|
|
|||||
|
Earnings per share from continuing operations:
|
||||||||||||||||||||
|
Basic
|
$
|
4.52
|
|
$
|
2.99
|
|
$
|
3.34
|
|
$
|
1.89
|
|
$
|
1.96
|
|
|||||
|
Diluted
|
$
|
4.26
|
|
$
|
2.85
|
|
$
|
3.23
|
|
$
|
1.83
|
|
$
|
1.89
|
|
|||||
|
Balance sheet data
(at period end)
:
|
||||||||||||||||||||
|
Assets
|
$
|
3,321,155
|
|
$
|
3,140,029
|
|
$
|
2,712,872
|
|
$
|
2,192,714
|
|
$
|
2,038,447
|
|
|||||
|
Debt obligations, long-term portion
|
589,782
|
|
404,012
|
|
561,663
|
|
405,472
|
|
397,256
|
|
||||||||||
|
Capital lease obligations, long-term portion
|
8,199
|
|
9,753
|
|
6,969
|
|
4,147
|
|
2,148
|
|
||||||||||
|
Summary network data
|
||||||||||||||||||||
|
Number of operational ATMs at end of period
|
40,354
|
|
37,133
|
|
33,973
|
|
21,360
|
|
20,364
|
|
||||||||||
|
EFT processing transactions during the period (millions)
|
2,721
|
|
2,352
|
|
1,885
|
|
1,523
|
|
1,262
|
|
||||||||||
|
Number of operational prepaid processing POS terminals at end of period (rounded)
|
719,000
|
|
683,000
|
|
661,000
|
|
674,000
|
|
681,000
|
|
||||||||||
|
Prepaid processing transactions during the period (millions)
|
1,149
|
|
1,186
|
|
1,294
|
|
1,335
|
|
1,244
|
|
||||||||||
|
Money transfer transactions during the period (millions)
|
107.6
|
|
92.2
|
|
82.3
|
|
68.7
|
|
48.5
|
|
||||||||||
___________________
|
(1)
|
The results of 2018 and 2017 include non-cash charges related to impairment of goodwill and acquired intangible assets of $7.0 million and $34.1 million, respectively.
|
39
Item 7. Management’s Discussion and Analysis of Financial Condition and Results of Operations
Company Overview, Geographic Locations and Principal Products and Services
Euronet is a leading electronic payments provider. We offer payment and transaction processing and distribution solutions to financial institutions, retailers, service providers and individual consumers. Our primary product offerings include comprehensive ATM, POS, card outsourcing, card issuing and merchant acquiring services, software solutions, electronic distribution of prepaid mobile airtime and other electronic payment products, foreign currency exchange services and global money transfer services. We operate in the following three segments:
|
•
|
The EFT Processing Segment, which processes transactions for a network of
40,354
ATMs and approximately
293,000
POS terminals across Europe, the Middle East, Asia Pacific, and the United States. We provide comprehensive electronic payment solutions consisting of ATM cash withdrawal and deposit services, ATM network participation, outsourced ATM and POS management solutions, credit and debit card outsourcing, DCC, and other value added services. Through this segment, we also offer a suite of integrated electronic financial transaction software solutions for electronic payment and transaction delivery systems.
|
|
•
|
The epay Segment, which provides distribution, processing and collection services for prepaid mobile airtime and other electronic content. We operate a network of approximately
719,000
POS terminals providing electronic processing of prepaid mobile airtime top-up services and other electronic content in Europe, the Middle East, Asia Pacific, the United States and South America. We also provide vouchers and physical gift fulfillment services in Europe.
|
|
•
|
The Money Transfer Segment, which provides global consumer-to-consumer money transfer services, primarily under the brand names Ria, IME and xe and global account-to-account money transfer services under the brand names xe and HiFX. We offer services under the brand names Ria and IME through a network of sending agents, Company-owned stores (primarily in North America, Europe and Malaysia) and our websites (riamoneytransfer.com and online.imeremit.com), disbursing money transfers through a worldwide correspondent network that includes approximately
369,000
locations. xe is a provider of foreign currency exchange information and offers money transfer services on its currency data websites (xe.com and x-rates.com). We offer services under the brand name xe through our websites (www.xe.com and https://transfer.xe.com) and through our xe and HiFX customer service representatives. In addition to money transfers, we also offer customers bill payment services (primarily in the U.S.), payment alternatives such as money orders and prepaid debit cards, comprehensive check cashing services for a wide variety of issued checks, along with competitive foreign currency exchange services and prepaid mobile top-up. Through our HiFM brand, we offer cash management solutions and foreign currency risk management services to small-to-medium sized businesses.
|
We have
six
processing centers in Europe,
five
in Asia Pacific and
two
in North America. We have
36
principal offices in Europe,
14
in Asia Pacific,
nine
in North America,
three
in the Middle East,
two
in South America and
one
in Africa. Our executive offices are located in Leawood, Kansas, USA. With approximately
72%
of our revenues denominated in currencies other than the U.S. dollar, any significant changes in foreign currency exchange rates will likely have a significant impact on our results of operations (for a further discussion, see Item 1A - Risk Factors and Item 7A - Quantitative and Qualitative Disclosures About Market Risk).
Sources of Revenues and Cash Flow
Euronet primarily earns revenues and income from ATM management fees, transaction fees, commissions and foreign currency exchange margin. Each operating segment’s sources of revenues are described below.
EFT Processing Segment
— Revenues in the EFT Processing Segment, which represented approximately
30%
of total consolidated revenues for the year ended
December 31, 2018
, are derived from fees charged for transactions made by cardholders on our proprietary network of ATMs, fixed management fees and transaction fees we charge to customers for operating ATMs and processing debit and credit cards under outsourcing and cross-border acquiring agreements, foreign currency exchange margin on DCC transactions, domestic and international surcharge, foreign currency dispensing and other value added services such as advertising, prepaid telecommunication recharges, bill payment, and money transfers provided over ATMs. Revenues in this segment are also derived from cardless payment, banknote recycling, tax refund services, license fees, professional services and maintenance fees for proprietary application software and sales of related hardware.
40
epay Segment
— Revenues in the epay Segment, which represented approximately
29%
of total consolidated revenues for the year ended
December 31, 2018
, are primarily derived from commissions or processing fees received from mobile phone operators for the processing and distribution of prepaid mobile airtime and commissions earned from the distribution of other electronic content, vouchers, and physical gifts. The proportion of epay Segment revenues earned from the distribution of prepaid mobile phone time as compared with other electronic products has decreased over time, and non-mobile content now produces approximately
62%
of epay Segment revenues. Other electronic content offered by this segment includes digital content such as music, games and software, as well as, other products including prepaid long distance calling card plans, prepaid Internet plans, prepaid debit cards, gift cards, vouchers, transport payments, lottery payments, bill payment, and money transfer.
Money Transfer Segment
— Revenues in the Money Transfer Segment, which represented approximately
41%
of total consolidated revenues for the year ended
December 31, 2018
, are primarily derived from transaction fees, as well as the margin earned from purchasing foreign currency at wholesale exchange rates and selling the foreign currency to customers at retail exchange rates. We have a sending agent network in place comprised of agents, customer service representatives, Company-owned stores, primarily in North America, Europe and Malaysia, and Ria, and xe branded websites, along with a worldwide network of correspondent agents, consisting primarily of financial institutions in the transfer destination countries. Sending and correspondent agents each earn fees for cash collection and distribution services, which are recognized as direct operating costs at the time of sale.
The Company offers a money transfer product called Walmart-2-Walmart Money Transfer Service which allows customers to transfer money to and from Walmart stores in the U.S. Our Ria business executes the transfers with Walmart serving as both the sending agent and payout correspondent. Ria earns a lower margin from these transactions than its traditional money transfers; however, the arrangement has added a significant number of transactions to Ria's business. The agreement with Walmart establishes Ria as the only party through which Walmart will sell U.S. domestic money transfers branded with Walmart marks. The agreement is effective until April 2020. Thereafter, it will automatically renew for subsequent one year terms unless either party provides notice to the contrary. The agreement imposes certain obligations on each party, the most significant being service level requirements by Ria and money transfer compliance requirements by Walmart. Any violation of these requirements by Ria could result in an obligation to indemnify Walmart or termination of the contract by Walmart. However, the agreement allows the parties to resolve disputes by mutual agreement without termination of the agreement.
Corporate Services, Eliminations and Other
— In addition to operating in our principal operating segments described above, our “Corporate Services, Eliminations and Other” category includes non-operating activity, certain inter-segment eliminations and the cost of providing corporate and other administrative services to the operating segments, including most share-based compensation expense. These services are not directly identifiable with our reportable operating segments.
Opportunities and Challenges
Our expansion plans and opportunities are focused on eight primary areas:
|
•
|
increasing the number of ATMs and cash deposit terminals in our independent ATM networks;
|
|
•
|
increasing transactions processed on our network of owned and operated ATMs and POS devices;
|
|
•
|
signing new outsourced ATM and POS terminal management contracts;
|
|
•
|
expanding value added services and other products offered by our EFT Processing Segment, including the sale of DCC, acquiring and other prepaid card services to banks and retailers;
|
|
•
|
expanding our epay processing network and portfolio of digital content;
|
|
•
|
expanding our money transfer services, cross-currency payments products and bill payment network;
|
|
•
|
expanding our cash management solutions and foreign currency risk management services; and
|
|
•
|
developing our credit and debit card outsourcing business.
|
EFT Processing Segment
— The continued expansion and development of our EFT Processing Segment business will depend on various factors including, but not necessarily limited to, the following:
|
•
|
the impact of competition by banks and other ATM operators and service providers in our current target markets;
|
|
•
|
the demand for our ATM outsourcing services in our current target markets;
|
|
•
|
our ability to develop products or services, including value added services, to drive increases in transactions and revenues;
|
41
|
•
|
the expansion of our various business lines in markets where we operate and in new markets;
|
|
•
|
our entry into additional card acceptance and ATM management agreements with banks;
|
|
•
|
our ability to obtain required licenses in markets we intend to enter or expand services;
|
|
•
|
our ability to enter into and renew ATM network cash supply agreements with financial institutions;
|
|
•
|
the availability of financing for expansion;
|
|
•
|
our ability to efficiently install ATMs contracted under newly awarded outsourcing agreements;
|
|
•
|
our ability to renew existing contracts at profitable rates;
|
|
•
|
our ability to maintain pricing at current levels or mitigate price reductions in certain markets;
|
|
•
|
the impact of changes in rules imposed by international card organizations such as Visa and Mastercard on card transactions on ATMs, including reductions in ATM interchange fees, restrictions on the ability to apply direct access fees, the ability to offer DCC transactions on ATMs, and increases in fees charged on DCC transactions;
|
|
•
|
the impact of changes in laws and regulations affecting the profitability of our services, including regulation of DCC transactions by the E.U.;
|
|
•
|
our ability to expand and sign additional customers for the cross-border merchant processing and acquiring business; and
|
|
•
|
the continued development and implementation of our software products and their ability to interact with other leading products.
|
We consistently evaluate and add prospects to our list of potential ATM outsource customers. However, we cannot predict the increase or decrease in the number of ATMs we manage under outsourcing agreements because this depends largely on the willingness of banks to enter into outsourcing contracts with us. Due to the thorough internal reviews and extensive negotiations conducted by existing and prospective banking customers in choosing outsource vendors, the process of entering into or renewing outsourcing agreements can take several months. The process is further complicated by the legal and regulatory considerations of local countries. These agreements tend to cover large numbers of ATMs, so significant increases and decreases in our pool of managed ATMs could result from the acquisition or termination of one or more of these management contracts. Therefore, the timing of both current and new contract revenues is uncertain and unpredictable.
Software products are an integral part of our product lines, and our investment in research, development, delivery and customer support reflects our ongoing commitment to an expanded customer base.
epay Segment
— The continued expansion and development of the epay Segment business will depend on various factors, including, but not necessarily limited to, the following:
|
•
|
our ability to maintain and renew existing agreements, and to negotiate new agreements in additional markets with mobile operators, digital content providers, agent financial institutions and retailers;
|
|
•
|
our ability to use existing expertise and relationships with mobile operators, digital content providers and retailers to our advantage;
|
|
•
|
the continued use of third-party providers such as ourselves to supply electronic processing solutions for existing and additional digital content;
|
|
•
|
the development of mobile phone networks in the markets in which we do business and the increase in the number of mobile phone users;
|
|
•
|
the overall pace of growth in the prepaid mobile phone and digital content market, including consumer shifts between prepaid and postpaid services;
|
|
•
|
our market share of the retail distribution capacity;
|
|
•
|
the development of new technologies that may compete with POS distribution of prepaid mobile airtime and other products;
|
|
•
|
the level of commission that is paid to the various intermediaries in the electronic payment distribution chain;
|
|
•
|
our ability to fully recover monies collected by retailers;
|
|
•
|
our ability to add new and differentiated products in addition to those offered by mobile operators;
|
|
•
|
our ability to develop and effectively market additional value added services;
|
42
|
•
|
our ability to take advantage of cross-selling opportunities with our EFT Processing and Money Transfer Segments, including providing money transfer services through our distribution network; and
|
|
•
|
the availability of financing for further expansion.
|
In all of the markets in which we operate, we are experiencing significant competition which will impact the rate at which we may be able to grow organically. Competition among prepaid mobile airtime and electronic content distributors results in the increase of commissions paid to retailers and increases in retailer attrition rates. To grow, we must capture market share from other prepaid mobile airtime and electronic content distributors, offer a superior product offering and demonstrate the value of a global network. In certain markets in which we operate, many of the factors that may contribute to rapid growth (growth in electronic content, expansion of our network of retailers and access to products of mobile operators and other content providers) remain present.
Money Transfer Segment —
The continued expansion and development of our Money Transfer Segment business will depend on various factors, including, but not necessarily limited to, the following:
|
•
|
the continued growth in worker migration and employment opportunities;
|
|
•
|
the mitigation of economic and political factors that have had an adverse impact on money transfer volumes, such as changes in the economic sectors in which immigrants work and the developments in immigration policies in the countries in which we operate;
|
|
•
|
the continuation of the trend of increased use of electronic money transfer and bill payment services among high-income individuals, immigrant workers and the unbanked population in our markets;
|
|
•
|
our ability to maintain our agent and correspondent networks;
|
|
•
|
our ability to offer our products and services or develop new products and services at competitive prices to drive increases in transactions;
|
|
•
|
the development of new technologies that may compete with our money transfer network, and our ability to acquire, develop and implement new technologies;
|
|
•
|
the expansion of our services in markets where we operate and in new markets;
|
|
•
|
our ability to strengthen our brands;
|
|
•
|
our ability to fund working capital requirements;
|
|
•
|
our ability to recover from agents funds collected from customers and our ability to recover advances made to correspondents;
|
|
•
|
our ability to maintain compliance with the regulatory requirements of the jurisdictions in which we operate or plan to operate;
|
|
•
|
our ability to take advantage of cross-selling opportunities with our epay Segment, including providing prepaid services through our stores and agents worldwide;
|
|
•
|
our ability to leverage our banking and merchant/retailer relationships to expand money transfer corridors to Europe, Asia and Africa, including high growth corridors to Central and Eastern European countries;
|
|
•
|
the availability of financing for further expansion;
|
|
•
|
the ability to maintain banking relationships necessary for us to service our customers;
|
|
•
|
our ability to successfully expand our agent network in Europe using our payment institution licenses under the Second Payment Services Directive ("PSD2") and using our various licenses in the United States;
|
|
•
|
our ability to provide additional value-added products under the xe brand; and,
|
|
•
|
the considerations regarding the use of our various trade names within the money transfer business.
|
The accounting policies of each segment are the same as those referenced in the summary of significant accounting policies (see Note 3, Summary of Significant Accounting Policies and Practices, to the Consolidated Financial Statements).
For all segments, our continued expansion may involve additional acquisitions that could divert our resources and management time and require integration of new assets with our existing networks and services. Our ability to effectively manage our growth has required us to expand our operating systems and employee base, particularly at the management level, which has added incremental operating costs. An inability to continue to effectively manage expansion could have a material adverse
43
effect on our business, growth, financial condition or results of operations. Inadequate technology and resources would impair our ability to maintain current processing technology and efficiencies, as well as deliver new and innovative services to compete in the marketplace.
Segment Revenues and Operating Income For The Years Ended
December 31, 2018
,
2017
and
2016
|
|
Revenues
|
Operating Income (Expense)
|
||||||||||||||||||||||
|
(in thousands)
|
2018
|
2017
|
2016
|
2018
|
2017
|
2016
|
||||||||||||||||||
|
EFT Processing
|
$
|
753,651
|
|
$
|
634,559
|
|
$
|
464,254
|
|
$
|
197,245
|
|
$
|
162,897
|
|
$
|
117,156
|
|
||||||
|
epay
|
743,784
|
|
733,998
|
|
693,986
|
|
78,997
|
|
38,101
|
|
68,242
|
|
||||||||||||
|
Money Transfer
|
1,042,962
|
|
886,858
|
|
801,919
|
|
122,526
|
|
104,545
|
|
101,526
|
|
||||||||||||
|
Total
|
2,540,397
|
|
2,255,415
|
|
1,960,159
|
|
398,768
|
|
305,543
|
|
286,924
|
|
||||||||||||
|
Corporate services, eliminations and other
|
(3,768
|
)
|
(2,993
|
)
|
(1,544
|
)
|
(40,854
|
)
|
(39,546
|
)
|
(37,151
|
)
|
||||||||||||
|
Total
|
$
|
2,536,629
|
|
$
|
2,252,422
|
|
$
|
1,958,615
|
|
$
|
357,914
|
|
$
|
265,997
|
|
$
|
249,773
|
|
||||||
Summary
Our annual consolidated revenues increased by
13%
for
2018
compared to
2017
and by
15%
for
2017
compared to
2016
.
The increases in revenues for
2018
and
2017
were primarily due to an increase in the number of ATMs under management, along with an increase in demand for DCC, domestic and international surcharge and other value added services in our EFT Processing Segment, growth in the number of money transfers processed by the core Ria business, and an increase in the number of non-mobile transactions processed by our epay subsidiaries. These increases were partly offset by decreases in the number of prepaid mobile transactions processed by our epay subsidiaries. The October 2016 acquisition of YourCash contributed to the increase in number of ATMs and transactions processed in our EFT Processing Segment in 2017 and 2016.
The increases in operating income for
2018
and
2017
were primarily due to the increase in ATMs under management, along with the increase in demand for DCC, domestic and international surcharge and other value added services, the increase in the number of money transfer transactions processed, and the increase in the number of non-mobile transactions processed for epay. These increases were partly offset by a decrease in the number of prepaid mobile transactions processed. The increases in operating income for
2018
and 2017 were partially offset by charges of $7.0 million and $34.1 million for goodwill and acquired intangible assets impairments, respectively. The reduced rates charged for the Walmart-2-Walmart product beginning in the second quarter of 2017, and an increase in salaries and benefits and other costs to support growth in the Money Transfer Segment further offset the increases in operating income for 2017.
Net income attributable to Euronet for
2018
,
2017
and
2016
was
$232.9 million
, or
$4.26
per diluted share,
$156.8 million
, or
$2.85
per diluted share, and
$174.4 million
, or
$3.23
per diluted share, respectively.
Impact of changes in foreign currency exchange rates
Our revenues and local expenses are recorded in the functional currencies of our operating entities, and then are translated into U.S. dollars for reporting purposes; therefore, amounts we earn outside the U.S. are negatively impacted by a stronger U.S. dollar and positively impacted by a weaker U.S. dollar. Considering the results by country and the associated functional currency, our
2018
consolidated operating income was approximately 3% more due to changes in foreign currency exchange rates when compared to
2017
, and our 2017 consolidated operating income was also approximately 3% more due to changes in foreign currency exchange rates when compared to
2016
. If significant, in our discussion we will refer to the impact of fluctuations in foreign currency exchange rates in our comparison of operating segment results.
44
To provide further perspective on the impact of foreign currency exchange rates, the following table shows the changes in values relative to the U.S. dollar during
2018
,
2017
and
2016
, of the currencies of the countries in which we have our most significant operations:
|
|
Average Translation Rate
Year Ended December 31,
|
2018 Increase (Decrease) Percent
|
2017 Increase (Decrease) Percent
|
|||||||||||||||
|
Currency
|
2018
|
2017
|
2016
|
|||||||||||||||
|
Australian dollar
|
$
|
0.7476
|
|
$
|
0.7668
|
|
$
|
0.7435
|
|
(3
|
)%
|
3
|
%
|
|||||
|
British pound
|
$
|
1.3352
|
|
$
|
1.2886
|
|
$
|
1.3555
|
|
4
|
%
|
(5
|
)%
|
|||||
|
euro
|
$
|
1.1809
|
|
$
|
1.1297
|
|
$
|
1.1067
|
|
5
|
%
|
2
|
%
|
|||||
|
Hungarian forint
|
$
|
0.0037
|
|
$
|
0.0037
|
|
$
|
0.0036
|
|
—
|
%
|
3
|
%
|
|||||
|
Indian rupee
|
$
|
0.0147
|
|
$
|
0.0154
|
|
$
|
0.0149
|
|
(5
|
)%
|
3
|
%
|
|||||
|
Malaysian ringgit
|
$
|
0.2482
|
|
$
|
0.2328
|
|
$
|
0.2418
|
|
7
|
%
|
(4
|
)%
|
|||||
|
New Zealand dollar
|
$
|
0.6924
|
|
$
|
0.7108
|
|
$
|
0.6968
|
|
(3
|
)%
|
2
|
%
|
|||||
|
Polish zloty
|
$
|
0.2774
|
|
$
|
0.2656
|
|
$
|
0.2538
|
|
4
|
%
|
5
|
%
|
|||||
45
Comparison of Operating Results For The Years Ended
December 31, 2018
,
2017
and
2016
- By Operating Segment
EFT Processing Segment
The following table summarizes the results of operations for our EFT Processing Segment for the years ended
December 31, 2018
and
2017
:
|
|
Year Ended December 31,
|
Year-over-Year Change
|
|||||||||||||
|
(dollar amounts in thousands)
|
2018
|
2017
|
Increase (Decrease) Amount
|
Increase Percent
|
|||||||||||
|
Total revenues
|
$
|
753,651
|
|
$
|
634,559
|
|
$
|
119,092
|
|
19
|
%
|
||||
|
Operating expenses:
|
|
|
|
|
|||||||||||
|
Direct operating costs
|
366,977
|
|
318,875
|
|
48,102
|
|
15
|
%
|
|||||||
|
Salaries and benefits
|
75,791
|
|
61,683
|
|
14,108
|
|
23
|
%
|
|||||||
|
Selling, general and administrative
|
46,925
|
|
33,158
|
|
13,767
|
|
42
|
%
|
|||||||
|
Acquired intangible assets impairment
|
—
|
|
2,286
|
|
(2,286
|
)
|
n/m
|
|
|||||||
|
Depreciation and amortization
|
66,713
|
|
55,660
|
|
11,053
|
|
20
|
%
|
|||||||
|
Total operating expenses
|
556,406
|
|
471,662
|
|
84,744
|
|
18
|
%
|
|||||||
|
Operating income
|
$
|
197,245
|
|
$
|
162,897
|
|
$
|
34,348
|
|
21
|
%
|
||||
|
Transactions processed (millions)
|
2,721
|
|
2,352
|
|
369
|
|
16
|
%
|
|||||||
|
ATMs as of December 31
|
40,354
|
|
37,133
|
|
3,221
|
|
9
|
%
|
|||||||
|
Average ATMs
|
40,094
|
|
36,658
|
|
3,436
|
|
9
|
%
|
|||||||
____________________
n/m — Not meaningful.
Revenues
EFT Processing Segment total revenues for
2018
were
$753.7 million
, an increase of
$119.1 million
or
19%
as compared to
2017
. The increase in total revenues is primarily due to an increase in the number of ATMs under management in Europe. Specifically, the increase in the number of ATMs contributed to increases in the number of transactions processed, including DCC transactions, domestic and international surcharge, and foreign currency dispensing. The increases were also impacted by the recovery from a cash shortage in India due to the demonetization initiated in the fourth quarter of 2016, which carried over into the first half of 2017. In the second half of 2017, the India cash supply returned to near pre-demonetization levels. Foreign currency movements increased total revenues for
2018
by approximately
$18.5 million
as compared to
2017
.
Average monthly revenues per ATM were
$1,566
for
2018
compared to
$1,443
for
2017
. Revenues per transaction were
$0.28
for
2018
and
$0.27
for
2017
. The increases in average monthly revenues per ATM and revenues per transaction were attributable to the revenue growth from DCC, which earns higher revenues per transaction than other ATM or card based services, surcharges and the U.S. dollar weakening against key foreign currencies.
Direct operating costs
EFT Processing Segment direct operating costs were
$367.0 million
for
2018
, an increase of
$48.1 million
or
15%
as compared to
2017
. Direct operating costs in the EFT Processing Segment consist primarily of site rental fees, cash delivery costs, cash supply costs, maintenance, insurance, telecommunications, data center operations-related personnel, as well as the processing centers’ facility-related costs and other processing center-related expenses and commissions paid to retail merchants, banks and card processors involved with POS DCC transactions. The increase in direct operating costs was primarily due to the increase in the number of ATMs under management, the impact of acquisitions of two small European businesses in
2018
, and the impact of the U.S. dollar weakening against key foreign currencies.
46
Gross profit
Gross profit, which is calculated as revenues less direct operating costs, was
$386.7 million
for
2018
compared to
$315.7 million
for
2017
. The increase in gross profit was primarily due to the growth in revenues from the increases in ATMs under management, DCC transactions, domestic and international surcharge, and foreign currency dispensing. The net impact of the U.S. dollar weakening against key foreign currencies also contributed to the increase in gross profit for 2018. Gross profit as a percentage of revenues (“gross margin”) was
51.3%
and
49.7%
for
2018
and
2017
, respectively. The increase in gross margin was attributable to the increases in DCC transactions, domestic and international surcharge, and foreign currency dispensing.
Salaries and benefits
Salaries and benefits increased
$14.1 million
or
23%
for
2018
compared to
2017
. The increase in salaries and benefits was primarily attributable to higher bonus expense resulting from operating income growth and additional headcount to support an increase in the number of ATMs and POS devices under management. As a percentage of revenues, these costs increased to
10.1%
for
2018
from
9.7%
for
2017
, primarily due to higher bonus expense.
Selling, general and administrative
Selling, general and administrative expenses for
2018
were
$46.9 million
, an increase of
$13.8 million
or
42%
as compared to
2017
. As a percentage of revenues, these expenses increased to
6.2%
for
2018
from
5.2%
for
2017
. The increase was primarily due to a $6.6 million post-acquisition charge and costs to support the growth in the business.
Acquired intangible assets impairment
The Company recorded a non-cash impairment charge of $2.3 million for 2017 related to certain customer relationships as a result of the closure of the Pure Commerce office in South Korea. No impairment charges were recorded in 2018.
Depreciation and amortization
Depreciation and amortization expense increased
$11.1 million
for
2018
compared to
2017
. The increase was primarily attributable to the deployment of additional ATMs and software assets. As a percentage of revenues, depreciation and amortization expense was essentially flat at
8.9%
for
2018
and
8.8%
for
2017
.
Operating income
EFT Processing Segment operating income for
2018
was
$197.2 million
, an increase of
$34.3 million
or
21%
as compared to
2017
. Operating income for
2018
increased primarily due to higher revenues from the additional number of ATMs under management, growth in revenues earned from DCC, surcharges and other value added service transactions and the U.S. dollar weakening against key foreign currencies.
Operating income as a percentage of revenues (“operating margin”) was
26.2%
for
2018
compared to
25.7%
for
2017
. The increase in operating margin was primarily due to higher operating revenues partially offset by expenses incurred to support the increased revenues and additional ATMs under management. Operating income per transaction was essentially flat at
$0.07
for
2018
and
2017
.
47
2017
Compared to
2016
The following table summarizes the results of operations for our EFT Processing Segment for the years ended December 31,
2017
and
2016
:
|
|
Year Ended December 31,
|
Year-over-Year Change
|
||||||||||||||
|
(dollar amounts in thousands)
|
2017
|
2016
|
Increase Amount
|
Increase
Percent
|
||||||||||||
|
Total revenues
|
$
|
634,559
|
|
$
|
464,254
|
|
$
|
170,305
|
|
37
|
%
|
|||||
|
Operating expenses:
|
|
|
|
|
||||||||||||
|
Direct operating costs
|
318,875
|
|
224,793
|
|
94,082
|
|
42
|
%
|
||||||||
|
Salaries and benefits
|
61,683
|
|
51,822
|
|
9,861
|
|
19
|
%
|
||||||||
|
Selling, general and administrative
|
33,158
|
|
30,399
|
|
2,759
|
|
9
|
%
|
||||||||
|
Acquired intangible assets impairment
|
2,286
|
|
—
|
|
2,286
|
|
n/m
|
|
||||||||
|
Depreciation and amortization
|
55,660
|
|
40,084
|
|
15,576
|
|
39
|
%
|
||||||||
|
Total operating expenses
|
471,662
|
|
347,098
|
|
124,564
|
|
36
|
%
|
||||||||
|
Operating income
|
$
|
162,897
|
|
$
|
117,156
|
|
$
|
45,741
|
|
39
|
%
|
|||||
|
Transactions processed (millions)
|
2,352
|
|
1,885
|
|
467
|
|
25
|
%
|
||||||||
|
ATMs as of December 31
|
37,133
|
|
33,973
|
|
3,160
|
|
9
|
%
|
||||||||
|
Average ATMs
|
36,658
|
|
27,795
|
|
8,863
|
|
32
|
%
|
||||||||
Revenues
EFT Processing Segment total revenues for
2017
were
$634.6 million
, an increase of
$170.3 million
or
37%
as compared to
2017
. The increase in total revenues is primarily due to an increase in the number of ATMs under management in Europe. Specifically, the increase in the number of ATMs contributed to increases in the number of transactions processed, including DCC transactions, primarily in Europe. The acquisition of YourCash, completed during the fourth quarter of 2016, also contributed to the increase in total revenues for 2017. The increases were partially offset by the impact of a cash shortage in India due to the demonetization initiated in the fourth quarter of 2016. In the second half of 2017, the India cash supply was returned to near pre-demonetization levels. Foreign currency movements reduced total revenues for
2017
by approximately
$16.7 million
as compared to
2016
.
Average monthly revenues per ATM were
$1,443
for
2017
compared to
$1,392
for
2016
. The increase in average monthly revenues per ATM was primarily due to the U.S. dollar weakening against key foreign currencies. Revenues per transaction were
$0.27
for
2017
and $0.25 for
2016
. The revenue growth from DCC, which earns higher revenues per transaction than other ATM or card based services, and the U.S. dollar weakening against key foreign currencies was partly offset by the impact of the low margin ATM transactions in India.
Direct operating costs
EFT Processing Segment direct operating costs were
$318.9 million
for
2017
, an increase of
$94.1 million
or
42%
as compared to
2016
. The increase in direct operating costs was primarily due to the increase in the number of ATMs under management, the impact of our acquisition of YourCash and the impact of the U.S. dollar weakening against key foreign currencies.
Gross profit
Gross profit was
$315.7 million
for
2017
compared to
$239.5 million
for
2016
. The increase in gross profit was primarily due to the growth in revenues from the increases in ATMs under management and DCC transactions processed. Gross margin was
49.7%
and
51.6%
for
2017
and
2016
, respectively. The decrease in gross profits as a percentage of revenue was primarily due to increased operating costs due to the expansion of our ATM network, which includes fixed costs for our independent ATMs, the YourCash transactions which earn lower margins per transaction than other ATM or card-based services in Europe, along with growth in the India market where we earn lower revenue per transaction and have experienced a cash shortage in the first part in
2017
due to the demonetization initiative in the region.
Salaries and benefits
Salaries and benefits increased
$9.9 million
or
19%
for
2017
compared to
2016
. The increase in salaries and benefits was primarily attributable to additional headcount to support an increase in the number of ATMs and POS devices under management and our acquisition of YourCash. As a percentage of revenues, these costs decreased to
9.7%
for
2017
from
11.2%
48
for
2016
, primarily due to growth in revenues earned from DCC and other value added service transactions on our ATMs under management, which require minimal incremental support costs.
Selling, general and administrative
Selling, general and administrative expenses for
2017
were
$33.2 million
, an increase of
$2.8 million
or
9%
as compared to
2016
. The increase was primarily due to the impact of our acquisition of YourCash and additional support costs as a result of the increase in the number of ATMs under management. As a percentage of revenues, these expenses decreased to
5.2%
for
2017
from
6.5%
for
2016
. The decreases were primarily due to the growth in revenues from DCC and other value added service transactions on our ATMs under management, which require minimal support costs.
Acquired intangible assets impairment
The Company recorded a non-cash impairment charge of $2.3 million for 2017 related to certain customer relationships as a result of the closure of the Pure Commerce office in South Korea. No impairment charges were recorded in 2016.
Depreciation and amortization
Depreciation and amortization expense increased
$15.6 million
for
2017
compared to
2016
. The increase was primarily attributable to the deployment of additional ATMs, including more expensive cash recycling ATMs, software assets, and the amortization of ATMs and intangible assets related to the acquisition of YourCash. As a percentage of revenues, depreciation and amortization expense was essentially flat at
8.8%
for
2017
and
8.6%
for
2016
.
Operating income
EFT Processing Segment operating income for
2017
was
$162.9 million
, an increase of
$45.7 million
or
39%
as compared to
2016
. Operating income for
2017
increased primarily due to higher revenues from the additional number of ATMs under management, growth in revenues earned from DCC and other value added service transactions and the U.S. dollar weakening against key foreign currencies.
Operating margin was
25.7%
for
2017
compared to
25.2%
for
2016
. Operating income per transaction increased to
$0.07
for
2017
, from
$0.06
for
2016
. Operating margin and operating income per transaction increased slightly for 2017 when compared to 2016. This increase is primarily attributable to higher operating revenues, partially offset by lower margin ATM transactions for YourCash and in India, and higher costs incurred to support the additional ATMs under management.
49
epay Segment
The following table summarizes the results of operations for our epay Segment for the years ended
December 31, 2018
and
2017
:
|
|
Year Ended December 31,
|
Year-over-Year Change
|
|||||||||||||
|
Increase
(Decrease) Amount
|
Increase
(Decrease) Percent
|
||||||||||||||
|
(dollar amounts in thousands)
|
2018
|
2017
|
|||||||||||||
|
Total revenues
|
$
|
743,784
|
|
$
|
733,998
|
|
$
|
9,786
|
|
1
|
%
|
||||
|
Operating expenses:
|
|
|
|
|
|||||||||||
|
Direct operating costs
|
564,252
|
|
564,032
|
|
220
|
|
—
|
%
|
|||||||
|
Salaries and benefits
|
57,748
|
|
54,459
|
|
3,289
|
|
6
|
%
|
|||||||
|
Selling, general and administrative
|
35,749
|
|
36,014
|
|
(265
|
)
|
(1
|
)%
|
|||||||
|
Goodwill impairment
|
—
|
|
31,770
|
|
(31,770
|
)
|
n/m
|
|
|||||||
|
Depreciation and amortization
|
7,038
|
|
9,622
|
|
(2,584
|
)
|
(27
|
)%
|
|||||||
|
Total operating expenses
|
664,787
|
|
695,897
|
|
(31,110
|
)
|
(4
|
)%
|
|||||||
|
Operating income
|
$
|
78,997
|
|
$
|
38,101
|
|
$
|
40,896
|
|
107
|
%
|
||||
|
Transactions processed (millions)
|
1,149
|
|
1,186
|
|
(37
|
)
|
(3
|
)%
|
|||||||
____________________
n/m — Not meaningful.
Revenues
epay Segment total revenues for
2018
were
$743.8 million
, an increase of
$9.8 million
or
1%
as compared to
2017
. The increase in total revenues was primarily due to an increase in the number of non-mobile transactions processed and the net impact of the U.S. dollar weakening against key foreign currencies. The increase in total revenues was partially offset by the ASC 606 adjustment and a decrease in prepaid mobile transactions processed in the U.S., the U.K. and Australia due to competitive pressures on prepaid mobile carriers. Foreign currency movements increased total revenues by approximately
$13.8 million
as compared to
2017
.
Revenues per transaction increased to
$0.65
for
2018
from
$0.62
for
2017
. The increase in revenues per transaction was primarily driven by the increase in the number of non-mobile transactions processed, for which we generally earn higher revenues per transaction than mobile transactions.
Direct operating costs
epay Segment direct operating costs were
$564.3 million
for
2018
, an increase of
$0.2 million
as compared to
2017
. Direct operating costs in our epay Segment include the commissions we pay to retail merchants for the distribution and sale of prepaid mobile airtime and other prepaid products, expenses incurred to operate POS terminals and the cost of vouchers sold and physical gifts fulfilled. The increase in direct operating costs was primarily due to the increase in the number of non-mobile transactions processed and net impact of the U.S. dollar weakening against key foreign currencies, largely offset by the ASC 606 adjustment and the decrease in prepaid mobile transactions processed.
Gross profit
Gross profit was
$179.5 million
for
2018
compared to
$170.0 million
for
2017
. The increase in gross profit was primarily due to growth in non-mobile transactions processed, partly offset by a decrease in prepaid mobile transactions processed in certain markets. Gross margin increased to
24.1%
for
2018
from
23.2%
for
2017
, mainly due to higher gross margins realized on the non-mobile transactions.
Salaries and benefits
Salaries and benefits increased
$3.3 million
or
6%
for
2018
as compared to
2017
. The increase was primarily due to higher headcount in an effort to grow the segment. As a percentage of revenues, salaries and benefits increased slightly to
7.8%
for
2018
from
7.4%
for
2017
.
50
Selling, general and administrative
Selling, general and administrative expenses for
2018
were
$35.7 million
, a decrease of
$0.3 million
or
1%
as compared to
2017
. Selling, general and administrative expenses for 2018 decreased mainly due to cost control efforts. As a percentage of revenues, these expenses remained relatively flat at
4.8%
for
2018
and
4.9%
for
2017
.
Goodwill impairment
During the fourth quarter of 2017, the Company completed its annual goodwill impairment testing and recorded non-cash goodwill impairment charges of
$31.8 million
related to the reporting units in the Middle East, the U.S. and the U.K. No goodwill impairment charge was recorded in 2018.
Depreciation and amortization
Depreciation and amortization expense primarily represents depreciation of POS terminals we install in retail stores and amortization of acquired intangible assets. Depreciation and amortization expense decreased
$2.6 million
or
27%
in
2018
as compared to
2017
. The decrease is primarily due to certain intangible assets becoming fully amortized in 2018. As a percentage of revenues, these expenses decreased to
0.9%
for
2018
from
1.3%
for
2017
.
Operating income
epay Segment operating income for
2018
was
$79.0 million
, an increase of
$40.9 million
or
107%
as compared to
2017
. Operating margin increased to
10.6%
for
2018
from
5.2%
for
2017
. Operating income per transaction was
$0.07
for
2018
and
$0.03
for
2017
. The increases were mainly due to the goodwill impairment charged recorded in the prior year which did not recur in the current year and an increase in the portion of higher-margin non-mobile transactions.
2017
Compared to
2016
The following table summarizes the results of operations for our epay Segment for the years ended December 31,
2017
and
2016
:
|
|
Year Ended December 31,
|
Year-over-Year Change
|
|||||||||||||
|
(dollar amounts in thousands)
|
2017
|
2016
|
Increase
(Decrease) Amount
|
Increase (Decrease) Percent
|
|||||||||||
|
Total revenues
|
$
|
733,998
|
|
$
|
693,986
|
|
$
|
40,012
|
|
6
|
%
|
||||
|
Operating expenses:
|
|
|
|
|
|||||||||||
|
Direct operating costs
|
564,032
|
|
528,774
|
|
35,258
|
|
7
|
%
|
|||||||
|
Salaries and benefits
|
54,459
|
|
51,378
|
|
3,081
|
|
6
|
%
|
|||||||
|
Selling, general and administrative
|
36,014
|
|
34,517
|
|
1,497
|
|
4
|
%
|
|||||||
|
Goodwill impairment
|
31,770
|
|
—
|
|
31,770
|
|
n/m
|
|
|||||||
|
Depreciation and amortization
|
9,622
|
|
11,075
|
|
(1,453
|
)
|
(13
|
)%
|
|||||||
|
Total operating expenses
|
695,897
|
|
625,744
|
|
70,153
|
|
11
|
%
|
|||||||
|
Operating income
|
$
|
38,101
|
|
$
|
68,242
|
|
$
|
(30,141
|
)
|
(44
|
)%
|
||||
|
Transactions processed (millions)
|
1,186
|
|
1,294
|
|
(108
|
)
|
(8
|
)%
|
|||||||
____________________
n/m — Not meaningful.
51
Revenues
epay Segment total revenues for
2017
were
$734.0 million
, a decrease of
$40.0 million
or
6%
as compared to
2016
. The increase in total revenues was primarily due to an increase in the number of non-mobile transactions processed in Germany, an increase in vouchers distributed by our cadooz subsidiary following the acquisition of new customers and the net impact of the U.S. dollar weakening against key foreign currencies. Foreign currency movements increased total revenues by approximately
$14.7 million
as compared to the same period in
2016
. The increases in total revenues were partially offset by a decrease in prepaid mobile transactions processed in the U.S. and U.K. due to competitive pressures on prepaid mobile carriers and the result of high promotion driven revenues from non-mobile transactions in a particular market during the prior year which did not recur in the current year.
Revenues per transaction increased to
$0.62
for
2017
from
$0.54
for
2016
. The increase in revenues per transaction was primarily driven by the increase in the number of non-mobile transactions processed, for which we generally earn higher revenues per transaction than mobile transactions, and the net impact of the U.S. dollar weakening against key foreign currencies. The increase in revenues per transaction was also favorably impacted by the loss of a high-volume, low-margin customer in the Middle East.
Direct operating costs
epay Segment direct operating costs were
$564.0 million
for
2017
, an increase of
$35.3 million
or
7%
as compared to
2016
. The increase in direct operating costs was primarily due to the increase in vouchers distributed by our cadooz subsidiary and non-mobile transactions processed in Germany as well as the net impact of the U.S. dollar weakening against key foreign currencies.
Gross profit
Gross profit was
$170.0 million
for
2017
compared to
$165.2 million
for
2016
. The increase in gross profit was primarily due to growth in non-mobile transactions processed in Germany, partly offset by decreases in prepaid mobile transactions processed in the U.S. and promotional activities for non-mobile transactions processed in a particular market. Gross margin decreased to
23.2%
for
2017
from
23.8%
for
2016
, mainly due to lower gross margins realized on voucher distributions and the result of high promotion-driven revenues from the non-mobile transactions in a particular market during the prior year which did not recur in the current year.
52
Salaries and benefits
Salaries and benefits increased
$3.1 million
or
6%
for
2017
as compared to
2016
. The increase was primarily due to higher headcount in an effort to grow the segment. As a percentage of revenues, salaries and benefits remained flat at
7.4%
for
2017
and
2016
.
Selling, general and administrative
Selling, general and administrative expenses for
2017
were
$36.0 million
, an increase of
$1.5 million
or
4%
as compared to
2016
. Selling, general and administrative expenses for 2017 increased mainly due to promotional costs for our non-mobile products in Germany and other costs related to the settlement of disputes in certain foreign markets. As a percentage of revenues, these expenses remained relatively flat at
4.9%
for
2017
and
5.0%
for
2016
.
Goodwill impairment
During the fourth quarter of 2017, the Company completed its annual goodwill impairment testing and recorded non-cash goodwill impairment charges of $31.8 million related to the reporting units in the Middle East, the U.S. and the U.K.
Depreciation and amortization
Depreciation and amortization expense decreased
$1.5 million
or
13%
in 2017 as compared to 2016. The decrease is primarily due to certain intangible assets becoming fully amortized in 2017 and the business continuing to require fewer additional company-owned terminals. As a percentage of revenues, these expenses decreased to
1.3%
for
2017
from
1.6%
for
2016
.
Operating income
epay Segment operating income for
2017
was
$38.1 million
, a decrease of
$30.1 million
or
44%
as compared to
2016
. Operating income for
2017
decreased primarily due to the goodwill impairment charge, partly offset by an increase in gross profit from non-mobile products in Germany. Operating margin decreased to
5.2%
for
2017
from
9.8%
for
2016
. Operating income per transaction was
$0.03
for 2017 and
$0.05
for 2016. The decreases were mainly due to the goodwill impairment charged recorded. The decrease in operating income per transaction was partly offset by an increase in the portion of higher-margin non-mobile transactions.
Money Transfer Segment
The following table summarizes the results of operations for our Money Transfer Segment for the years ended
December 31, 2018
and
2017
:
|
|
Year Ended December 31,
|
Year-over-Year Change
|
|||||||||||||
|
(dollar amounts in thousands)
|
2018
|
2017
|
Increase Amount
|
Increase Percent
|
|||||||||||
|
Total revenues
|
$
|
1,042,962
|
|
$
|
886,858
|
|
$
|
156,104
|
|
18
|
%
|
||||
|
Operating expenses:
|
|
|
|
|
|||||||||||
|
Direct operating costs
|
560,930
|
|
476,322
|
|
84,608
|
|
18
|
%
|
|||||||
|
Salaries and benefits
|
194,808
|
|
168,371
|
|
26,437
|
|
16
|
%
|
|||||||
|
Selling, general and administrative
|
125,647
|
|
108,022
|
|
17,625
|
|
16
|
%
|
|||||||
|
Acquired intangible assets impairment
|
7,049
|
|
—
|
|
7,049
|
|
n/m
|
|
|||||||
|
Depreciation and amortization
|
32,002
|
|
29,598
|
|
2,404
|
|
8
|
%
|
|||||||
|
Total operating expenses
|
920,436
|
|
782,313
|
|
138,123
|
|
18
|
%
|
|||||||
|
Operating income
|
$
|
122,526
|
|
$
|
104,545
|
|
$
|
17,981
|
|
17
|
%
|
||||
|
Transactions processed (millions)
|
107.6
|
|
92.2
|
|
15.4
|
|
17
|
%
|
|||||||
____________________
n/m — Not meaningful.
53
Revenues
Money Transfer Segment total revenues were
$1,043.0 million
for
2018
, an increase of
$156.1 million
or
18%
as compared to
2017
. The increase in revenues was primarily due to increases in the number of money transfers processed, driven by growth in our U.S. and foreign agent and correspondent payout networks. Revenues per transaction was essentially flat at
$9.69
for
2018
as compared to
$9.62
for
2017
. Foreign currency movements increased total revenues for
2018
by approximately
$15.8 million
as compared to
2017
.
Direct operating costs
Money Transfer Segment direct operating costs were
$560.9 million
for
2018
, an increase of
$84.6 million
or
18%
as compared to
2017
. Direct operating costs in the Money Transfer Segment primarily consist of commissions paid to agents who originate money transfers on our behalf and correspondent agents who disburse funds to the customers’ destination beneficiaries, together with less significant costs, such as bank depository fees. The increase in direct operating costs in
2018
was primarily due to growth in the number of money transfer transactions processed in both the U.S. and foreign markets and the impact of the U.S. dollar weakening against key foreign currencies.
Gross profit
Gross profit was
$482.0 million
for
2018
compared to
$410.5 million
for
2017
. The increase in gross profit was primarily due to growth in the number of money transfer transactions processed in both the U.S. and foreign markets. Gross margins remained flat at
46.2%
for
2018
compared to
46.3%
for
2017
.
Salaries and benefits
Salaries and benefits increased
$26.4 million
or
16%
for
2018
compared to
2017
. The increase in salaries and benefits was primarily due to the expansion of our operations in foreign markets. As a percentage of revenues, salaries and benefits decreased slightly to
18.7%
for
2018
from
19.0%
for
2017
.
Selling, general and administrative
Selling, general and administrative expenses for
2018
were
$125.6 million
, an increase of
$17.6 million
or
16%
as compared to
2017
. The increase was primarily due to expenses incurred to support the growth of our money transfer services and the expansion of new products in both the U.S. and foreign markets. As a percentage of revenues, selling, general and administrative expenses decreased to
12.0%
for
2018
from
12.2%
for
2017
, primarily due to the growth rate of money transfer revenues exceeding the growth rate of support costs as we develop and promote expanded payout locations and new products.
Acquired intangible assets impairment
Acquired intangible assets impairment charge for
2018
was
$7.0 million
due to the Company's decision to re-brand the HiFX trade name to XE. There was no impairment recorded in 2017.
Depreciation and amortization
Depreciation and amortization expense increased
$2.4 million
for
2018
compared to
2017
. Depreciation and amortization primarily represents amortization of acquired intangible assets and depreciation of money transfer terminals, computers and software, leasehold improvements and office equipment. For
2018
, depreciation and amortization expense increased compared to
2017
primarily due to investments made to support the growth in the business. As a percentage of revenues, depreciation and amortization expense decreased to
3.1%
for
2018
from
3.3%
for
2017
, primarily due to certain intangible assets becoming fully amortized in 2018.
Operating income
Money Transfer Segment operating income was
$122.5 million
for
2018
, an increase of
$18.0 million
or
17%
as compared to
2017
. Operating income increased primarily due to the growth in the number of money transfers processed. Operating margin decreased to
11.7%
for
2018
from
11.8%
for
2017
as a result of impairment recorded for HiFX trade names. Operating income per transaction increased to
$1.14
for
2018
from
$1.13
for
2017
was primarily due to the growth in the number of money transfers processed which did not require similar increases in support costs.
54
2017
Compared to
2016
The following table presents the results of operations for the years ended December 31,
2017
and
2016
for the Money Transfer Segment.
|
|
Year Ended December 31,
|
Year-over-Year Change
|
|||||||||||||
|
(dollar amounts in thousands)
|
2017
|
2016
|
Increase Amount
|
Increase Percent
|
|||||||||||
|
Total revenues
|
$
|
886,858
|
|
$
|
801,919
|
|
$
|
84,939
|
|
11
|
%
|
||||
|
Operating expenses:
|
|
|
|
|
|||||||||||
|
Direct operating costs
|
476,322
|
|
422,508
|
|
53,814
|
|
13
|
%
|
|||||||
|
Salaries and benefits
|
168,371
|
|
155,471
|
|
12,900
|
|
8
|
%
|
|||||||
|
Selling, general and administrative
|
108,022
|
|
93,219
|
|
14,803
|
|
16
|
%
|
|||||||
|
Depreciation and amortization
|
29,598
|
|
29,195
|
|
403
|
|
1
|
%
|
|||||||
|
Total operating expenses
|
782,313
|
|
700,393
|
|
81,920
|
|
12
|
%
|
|||||||
|
Operating income
|
$
|
104,545
|
|
$
|
101,526
|
|
$
|
3,019
|
|
3
|
%
|
||||
|
Transactions processed (millions)
|
92.2
|
|
82.3
|
|
9.9
|
|
12
|
%
|
|||||||
Revenues
Money Transfer Segment total revenues were
$886.9 million
for
2017
, an increase of
$84.9 million
or
11%
as compared to
2016
. The increase in revenues was primarily due to increases in the number of money transfers processed, driven by growth in our U.S. and foreign agent and correspondent payout networks, and an increase in transactions in our domestic Walmart-2-Walmart money transfer service. These increases were partly offset by reduced rates for our Walmart-2-Walmart product beginning in the second quarter of 2017, the effects of the hurricanes in Texas, Florida and Puerto Rico in 2017, and a decrease in transactions processed by HiFX as a result of currency volatility from the Brexit vote during 2016 which did not recur in 2017.
Revenues per transaction decreased to
$9.62
for
2017
from
$9.74
for
2016
. The decrease was primarily due to the impact of the increase in volume from our Walmart money transfer product, which earns lower revenues per transaction than other money transfer services and reduced rates charged for that product beginning in the second quarter of 2017. In the fourth quarter of 2016, the Company took over the processing of xe money transfers from a third party and began recording the full customer fees as revenues, which partly offset the decreases in revenues per transaction.
Direct operating costs
Money Transfer Segment direct operating costs were
$476.3 million
for
2017
, an increase of
$53.8 million
or
13%
as compared to
2016
. The increase in direct operating costs in
2017
was primarily due to growth in the number of money transfer transactions processed in both the U.S. and foreign markets.
Gross profit
Gross profit was
$410.5 million
for
2017
compared to
$379.4 million
for
2016
. The increase in gross profit was primarily due to growth in the number of money transfer transactions processed in both the U.S. and foreign markets. Gross margins decreased to
46.3%
for
2017
from
47.3%
for
2016
. The decrease is primarily due to the growth of our Walmart money transfer product in the U.S., which earns a lower gross profit per transaction than other money transfer services and reduced rates charged for that product beginning in the second quarter of 2017.
Salaries and benefits
Salaries and benefits increased
$12.9 million
or
8%
for
2017
compared to
2016
. The increase in salaries and benefits was primarily due to the expansion of our operations in foreign markets, partly offset by lower bonus expense resulting from slower operating income growth. As a percentage of revenues, salaries and benefits improved to
19.0%
for
2017
from
19.4%
for
2016
. The decrease is primarily due to the lower bonus expense.
55
Selling, general and administrative
Selling, general and administrative expenses for
2017
were
$108.0 million
, an increase of
$14.8 million
or
16%
as compared to
2016
. The increase was primarily due to expenses incurred to support the growth of our money transfer services and the expansion of new products in both the U.S. and foreign markets. As a percentage of revenues, selling, general and administrative expenses increased to
12.2%
for
2017
from
11.6%
for
2016
, primarily due to the growth rate of support costs exceeding the growth rate of money transfer revenues as we develop and promote expanded payout locations and new products.
Depreciation and amortization
Depreciation and amortization expense increased
$0.4 million
for
2017
compared to
2016
. For
2017
, depreciation and amortization expense increased compared to
2016
primarily due to investments made to support the growth in the business. As a percentage of revenues, depreciation and amortization expense decreased to
3.3%
for
2017
from
3.6%
for
2016
, primarily due to certain intangible assets becoming fully amortized in 2017 and the effect of revenues earned from our Walmart money transfer product, which requires less capital investment than other money transfer products.
Operating income
Money Transfer Segment operating income was
$104.5 million
for
2017
, an increase of
$3.0 million
or
3%
as compared to
2016
. Operating income increased primarily due to the growth in the number of money transfers processed. The increase in operating income was partly offset by additional salaries and benefits and other costs incurred, reduced rates for Walmart-2-Walmart money transfer services as well as increased transactions processed by HiFX as a result of the Brexit vote in 2016, which did not recur in 2017.
Operating margin decreased to
11.8%
for
2017
from
12.7%
for
2016
and operating income per transaction decreased to
$1.13
for
2017
from
$1.23
for
2016
. Operating margin and operating income per transaction decreased primarily due to the decrease in margin realized with the renewal of the the Walmart-2-Walmart agreement and the additional salaries and benefits and other costs incurred to support the growth in the business.
Corporate Services
The components of Corporate Services' operating expenses for
2018
,
2017
and
2016
were as follows:
|
Year Ended December 31,
|
Year-over-Year Change
|
|||||||||||||||||
|
(dollar amounts in thousands)
|
2018
|
2017
|
2016
|
2018 Increase (Decrease) Percent
|
2017 (Decrease) Increase Percent
|
|||||||||||||
|
Salaries and benefits
|
$
|
32,085
|
|
$
|
26,274
|
|
$
|
29,749
|
|
22
|
%
|
(12
|
)%
|
|||||
|
Selling, general and administrative
|
8,501
|
|
13,122
|
|
7,227
|
|
(35
|
)%
|
82
|
%
|
||||||||
|
Depreciation and amortization
|
268
|
|
150
|
|
175
|
|
79
|
%
|
(14
|
)%
|
||||||||
|
Total operating expenses
|
$
|
40,854
|
|
$
|
39,546
|
|
$
|
37,151
|
|
3
|
%
|
6
|
%
|
|||||
Corporate operating expenses
Overall, operating expenses for Corporate Services increased
3%
for
2018
as compared to
2017
. The increase is primarily attributable to the increase in salaries and benefits expenses mainly attributable to an increase in incentive compensation related to the Company's performance relative to its targets, partly offset by a decrease in selling, general and administrative expense primarily due to a decrease professional services and other costs as a result of the 2017 proposed acquisition of MoneyGram International, Inc. which did not recur in 2018.
Operating expenses for Corporate Services increased
6%
for
2017
compared to
2016
. The increase is primarily attributable to the increase in selling, general and administrative expenses mainly attributable to professional services and other costs incurred in connection with the proposed acquisition of MoneyGram International, Inc., partly offset by a decrease in salaries and benefits expense primarily due to a decrease in incentive compensation related to the Company's performance relative to its targets.
56
Other Expense, Net
|
|
Year Ended December 31,
|
Year-over-Year Change
|
||||||||||||||||
|
(dollar amounts in thousands)
|
2018
|
2017
|
2016
|
2018
(Decrease)
Increase
Percent
|
2017
Increase (Decrease)
Percent
|
|||||||||||||
|
Interest income
|
$
|
1,320
|
|
$
|
2,443
|
|
$
|
1,696
|
|
(46
|
)%
|
44
|
%
|
|||||
|
Interest expense
|
(37,573
|
)
|
(32,571
|
)
|
(28,332
|
)
|
15
|
%
|
15
|
%
|
||||||||
|
(Loss) Income from unconsolidated affiliates
|
(117
|
)
|
48
|
|
—
|
|
n/m
|
|
n/m
|
|
||||||||
|
Other gains, net
|
27
|
|
118
|
|
19,956
|
|
n/m
|
|
n/m
|
|
||||||||
|
Foreign currency exchange (loss) gain, net
|
(26,655
|
)
|
20,300
|
|
(10,200
|
)
|
n/m
|
|
n/m
|
|
||||||||
|
Other expense, net
|
$
|
(62,998
|
)
|
$
|
(9,662
|
)
|
$
|
(16,880
|
)
|
n/m
|
|
(43
|
)%
|
|||||
____________________
n/m — Not meaningful.
Interest income
The Company received interest earned on a tax refund in India in 2017 which did not occur in 2018 and 2016, resulting in an increase in interest income from 2016 to 2017 and a subsequent decrease from 2017 to 2018.
Interest expense
The increase in interest expense for 2018 compared to 2017 as well as for 2017 compared to 2016, was primarily related to the additional borrowings under our credit facilities to fund the operating cash for our IAD networks.
Other gains, net
The results for 2016 included an investment gain of $19.4 million, which resulted from our membership in Visa Europe Limited ("Visa Europe") that was sold to Visa, Inc. ("Visa") on June 21, 2016. Visa closed the transaction and provided consideration to the members of Visa Europe consisting of cash consideration of approximately €12.19 billion, issued (a) 2,480,466 shares of Series B Convertible Participating Preferred Stock and (b) 3,156,823 shares of Series C Convertible Participating Preferred Stock, and agreed to make an additional cash payment of €1.12 billion on the third anniversary of closing to Visa Europe members. Our portion of the consideration consisted of cash of $11.9 million, Visa Series B Preferred Shares which are convertible into Visa common shares with an approximate value of $6.4 million, and a long-term receivable of approximately $1.1 million. The gain did not recur in 2017 and 2018.
Foreign currency exchange (loss) gain, net
Foreign currency exchange activity includes gains and losses on certain foreign currency exchange derivative contracts and the impact of remeasurement of assets and liabilities denominated in foreign currencies.
Assets and liabilities denominated in currencies other than the local currency of each of our subsidiaries give rise to foreign currency exchange gains and losses. Foreign currency exchange gains and losses that result from remeasurement of these assets and liabilities are recorded in net income. The majority of our foreign currency exchange gains or losses are due to the remeasurement of intercompany loans which are not considered a long-term investment in nature and are in a currency other than the functional currency of one of the parties to the loan. For example, we make intercompany loans based in euros from our corporate division, which is comprised of U.S. dollar functional currency entities, to certain European entities that use the euro as the functional currency. As the U.S. dollar strengthens against the euro, foreign currency exchange losses are recognized by our corporate entities because the number of euros to be received in settlement of the loans decreases in U.S. dollar terms. Conversely, in this example, in periods where the U.S. dollar weakens, our corporate entities will record foreign currency exchange gains.
We recorded a net foreign currency exchange loss of
$26.7 million
in
2018
, a gain of
$20.3 million
in
2017
and a loss of
$10.2 million
in
2016
. These realized and unrealized foreign currency exchange gains and losses primarily reflect the respective weakening and strengthening of the U.S. dollar against the currencies of the countries in which we operate.
57
Income Tax Expense
Our effective income tax rates as reported and as adjusted are calculated below:
|
Year Ended December 31,
|
||||||||||||
|
(dollar amounts in thousands)
|
2018
|
2017
|
2016
|
|||||||||
|
Income before income taxes
|
$
|
294,916
|
|
$
|
256,335
|
|
$
|
232,893
|
|
|||
|
Income tax expense
|
(62,785
|
)
|
(99,395
|
)
|
(58,795
|
)
|
||||||
|
Net income
|
$
|
232,131
|
|
$
|
156,940
|
|
$
|
174,098
|
|
|||
|
Effective income tax rate
|
21.3
|
%
|
38.8
|
%
|
25.2
|
%
|
||||||
|
Income before income taxes
|
$
|
294,916
|
|
$
|
256,335
|
|
$
|
232,893
|
|
|||
|
Adjust: Goodwill and acquired intangible assets impairment
|
(7,049
|
)
|
(34,056
|
)
|
—
|
|
||||||
|
Adjust: Other gains, net
|
27
|
|
118
|
|
19,956
|
|
||||||
|
Adjust: Foreign currency exchange (loss) gain, net
|
(26,655
|
)
|
20,300
|
|
(10,200
|
)
|
||||||
|
Income before income taxes, as adjusted
|
$
|
328,593
|
|
$
|
269,973
|
|
$
|
223,137
|
|
|||
|
Income tax expense
|
$
|
(62,785
|
)
|
$
|
(99,395
|
)
|
$
|
(58,795
|
)
|
|||
|
Adjust: Income tax benefit (expense) attributable to 2017 U.S. tax reform
|
12,262
|
|
(41,597
|
)
|
—
|
|
||||||
|
Adjust: Income tax benefit attributable to acquired intangible assets impairment
|
1,506
|
|
3,411
|
|
—
|
|
||||||
|
Adjust: Income tax (expense) attributable to other gains, net
|
—
|
|
—
|
|
(3,903
|
)
|
||||||
|
Adjust: Income tax benefit (expense) attributable to foreign currency exchange (loss) gain, net
|
8,743
|
|
(2,750
|
)
|
789
|
|
||||||
|
Income tax expense, as adjusted
|
$
|
(85,296
|
)
|
$
|
(58,459
|
)
|
$
|
(55,681
|
)
|
|||
|
Effective income tax rate, as adjusted
|
26.0
|
%
|
21.7
|
%
|
25.0
|
%
|
||||||
We calculate our effective income tax rate by dividing income tax expense by pre-tax book income. Our effective income tax rates were
21.3%
,
38.8%
and
25.2%
for the years ended December 31, 2018, 2017 and 2016, respectively. On December 22, 2017, the U.S. enacted into law what is informally called the Tax Cuts and Jobs Act of 2017 ("U.S. Tax Reform"). The effective income tax rate in 2017 includes a net provisional tax expense of $41.6 million resulting from U.S. Tax Reform. This provisional amount is subject to adjustment during the measurement period of up to one year following the December 2017 enactment of U.S. Tax Reform as provided by recent SEC guidance. In the fourth quarter of 2018, we completed our accounting for the tax effects of U.S. Tax Reform. The net provisional tax expense was decreased in the current period by approximately $12.3 million to $29.3 million. See Note 13, Income Taxes, to the Consolidated Financial Statements for further information. The effective income tax rates were also significantly influenced by the goodwill and acquired intangible assets impairment charges, other non-operating gains (losses) and the impact of foreign currency exchange gains (losses). Excluding these items from pre-tax income, as well as the related tax effects for these items, our adjusted effective income tax rates were
26.0%
,
21.7%
and
25.0%
for the years ended December 31, 2018, 2017 and 2016, respectively.
The effective income tax rate, as adjusted, for 2018 was higher than the applicable statutory income tax rate of
21%
primarily because of higher income tax rates in foreign countries where we have significant operations and the tax effects of the global intangible low-taxed income ("GILTI") provision of U.S. Tax Reform. The effective income tax rates, as adjusted, for 2017 and 2016 were lower than the applicable statutory income tax rate of
35%
primarily because of our U.S. tax loss position and the realization of deferred tax benefits in various jurisdictions. The Company had recorded significant net operating loss carryforwards in the U.S., creating related deferred tax assets. During periods when the Company generated U.S. pre-tax book income but had tax differences that continued to create tax losses, no current income tax expense was recognized. The effective income tax rate, as adjusted, for 2017 was lower than both 2018 and 2016 largely due to the realization of deferred tax benefits from the release of a $16.3 million valuation allowance against certain foreign net deferred tax assets.
We determine income tax expense based upon enacted tax laws applicable in each of the taxing jurisdictions where we conduct business. Based on our interpretation of such laws, and considering the evidence of available facts and circumstances and baseline operating forecasts, we have accrued the estimated income tax effects of certain transactions, business ventures, contractual and organizational structures, and the estimated future reversal of timing differences. Should a taxing jurisdiction change its laws or dispute our conclusions, or should management become aware of new facts or other evidence that could alter our conclusions, the resulting impact to our estimates could have a material adverse effect on our results of operations and financial condition.
58
Income before income taxes, as adjusted, income tax expense, as adjusted and effective income tax rate, as adjusted, are non-U.S. GAAP financial measures that management believes are useful for understanding why our effective income tax rates are significantly different than would be expected.
These non-U.S. GAAP measures are used by management to conduct and evaluate its business during its regular review of operating results for the periods presented.
Net (Income) Loss Attributable To Noncontrolling Interest
Net loss attributable to noncontrolling interests was
$0.7 million
for
2018
, net income of
$0.1 million
for
2017
, and a net loss of
$0.3 million
for
2016
. Noncontrolling interests represent the elimination of net income or loss attributable to the minority shareholders’ portion of the following consolidated subsidiaries that are not wholly owned:
|
Subsidiary
|
Percent
Owned
|
Segment - Country
|
||
|
Movilcarga
|
95%
|
epay - Spain
|
||
|
Euronet China
|
85%
|
EFT - China
|
||
|
Euronet Pakistan
|
70%
|
EFT - Pakistan
|
||
|
Euronet Infinitium Solutions
|
65%
|
EFT - India
|
||
Net Income Attributable to Euronet
Net income attributable to Euronet was
$232.9 million
,
$156.8 million
and
$174.4 million
for
2018
,
2017
and
2016
, respectively. Net income attributable to Euronet increased
$76.0 million
in 2018 compared to 2017. The increase in net income for 2018 was primarily due to an increase in operating income of
$91.9 million
, a decrease in income tax expense of
$36.6 million
, and an increase of net loss attributable to noncontrolling interests of $0.8 million. The increases were partly offset by an increase of
$47.0 million
in net foreign currency exchange losses, an increase in interest expense of
$5.0 million
, a decrease in interest income of $1.1 million, and a decrease in income from unconsolidated affiliates of $0.2 million.
Net income attributable to Euronet decreased $17.6 million in 2017 as compared to 2016. The decrease in net income for 2017 was primarily due to an increase in income tax expense of $40.6 million, an increase in interest expense of $4.2 million, a decrease in investment gains of $19.4 million, and a decrease in other non-operating income of $0.1 million. The decrease to net income attributable to Euronet was partly offset by an increase in operating income of $16.2 million, and an increase of $30.5 million in net foreign currency exchange gains.
Translation Adjustment
Translation gains and losses are the result of translating our foreign entities' balance sheets from local functional currency to the U.S. dollar reporting currency prior to consolidation and are recorded in comprehensive income. As required by U.S. GAAP, during this translation process, asset and liability accounts are translated at current foreign currency exchange rates and equity accounts are translated at historical rates. Historical rates represent the rates in effect when the balances in our equity accounts were originally created. By using this mix of rates to convert the balance sheet from functional currency to U.S. dollars, differences between current and historical exchange rates generate this translation adjustment.
We recorded a net loss on translation adjustments of
$56.7 million
in
2018
, a gain of
$116.4 million
in
2017
, and a loss of
$45.2 million
in
2016
. During 2018 and 2016, the U.S. dollar strengthened compared to most currencies, resulting in translation losses which were recorded in comprehensive income, whereas the U.S. dollar weakened compared to most currencies during 2017, resulting in a net translation gain.
59
Liquidity and Capital Resources
Working capital
As of
December 31, 2018
, we had working capital of
$709.2 million
, which is calculated as the difference between total current assets and total current liabilities, compared to working capital of
$482.5 million
as of
December 31, 2017
. Our ratio of current assets to current liabilities was
1.51
and
1.34
as of
December 31, 2018
and
December 31, 2017
, respectively.
We require substantial working capital to finance operations. The Money Transfer Segment funds the payout of the majority of our consumer-to-consumer money transfer services before receiving the benefit of amounts collected from customers by agents. Working capital needs increase due to weekends and banking holidays. As a result, we may report more or less working capital for the Money Transfer Segment based solely upon the day on which the reporting period ends. The epay Segment produces positive working capital, but much of it is restricted in connection with the administration of its customer collection and vendor remittance activities. In our EFT Processing Segment, we obtain a significant portion of the cash required to operate our ATMs through various cash supply arrangements, the amount of which is not recorded on Euronet's Consolidated Balance Sheets. However, in certain countries, we fund the cash required to operate our ATM network from borrowings under the revolving credit facilities and cash flows from operations. As of
December 31, 2018
, we had approximately
$461 million
of our own cash in use or designated for use in our ATM network, which is recorded in cash and cash equivalents on Euronet's Consolidated Balance Sheet.
We had cash and cash equivalents of
$1,054.4 million
as of
December 31, 2018
, of which
$844.9 million
was held outside of the U.S. and is expected to be indefinitely reinvested for continued use in foreign operations. Repatriation of these assets to the U.S. could have negative tax consequences.
The following table identifies cash and cash equivalents provided by/(used in) our operating, investing and financing activities for the years ended
December 31, 2018
,
2017
and
2016
(in thousands):
|
Year Ended December 31,
|
||||||||||||
|
Liquidity
|
2018
|
2017
|
2016
|
|||||||||
|
Cash and cash equivalents and restricted cash provided by (used in):
|
||||||||||||
|
Operating activities
|
$
|
397,233
|
|
$
|
286,276
|
|
$
|
391,524
|
|
|||
|
Investing activities
|
(132,283
|
)
|
(101,858
|
)
|
(136,313
|
)
|
||||||
|
Financing activities
|
2,024
|
|
(161,149
|
)
|
79,510
|
|
||||||
|
Effect of foreign currency exchange rate changes on cash and cash equivalents and restricted cash
|
(36,540
|
)
|
65,161
|
|
(25,463
|
)
|
||||||
|
Increase in cash and cash equivalents and restricted cash
|
$
|
230,434
|
|
$
|
88,430
|
|
$
|
309,258
|
|
|||
Operating cash flow
Cash flows provided by operating activities were
$397.2 million
for
2018
compared to
$286.3 million
for
2017
. The increase in operating cash flows was primarily due to improved operating results before the non-cash impact of impairment charges of acquired intangible assets, U.S. Tax Reform and foreign currency exchange gains, partly offset by fluctuations in working capital mainly associated with the timing of the settlement processes with content providers in the epay Segment, with correspondents in the Money Transfer Segment, and with card organizations and banks in the EFT Processing Segment.
Cash flows provided by operating activities were
$286.3 million
for
2017
compared to
$391.5 million
for
2016
. The decrease in operating cash flows was primarily due to fluctuations in working capital mainly associated with the timing of the settlement processes with content providers in the epay Segment, with correspondents in the Money Transfer Segment, and with card organizations and banks in the EFT Processing Segment, partly offset by improved operating results before the non-cash impacts of goodwill impairment charges, U.S. Tax Reform and foreign currency exchange gains.
Investing activity cash flow
Cash flows used in investing activities were
$132.3 million
for
2018
compared to
$101.9 million
for
2017
. The increase was primarily due to acquisitions and increased capital expenditures mainly related to our ATM network expansion. During 2018, we used
$12.9 million
for business acquisitions. There were no acquisitions in
2017
. Purchases of property and equipment were
$112.5 million
and
$97.2 million
for
2018
and
2017
, respectively. Cash used for software development and long-term assets totaled
$8.5 million
for
2018
and
$6.0 million
for
2017
. Other investing activities consist mainly of proceeds from the sale of property and equipment of
$1.6 million
for both
2018
and
2017
.
60
Cash flows used in investing activities were $101.9 million for 2017 compared to
$136.3 million
for 2016. The decrease was primarily due to no cash being used for acquisitions in 2017 compared to
$55.9 million
for 2016, partly offset by the proceeds of $11.9 million received in 2016 for the sale of our ownership interest in Visa Europe and increased capital expenditures related to our ATM network expansion. Purchases of property and equipment were $97.2 million and $87.4 million for 2017 and 2016, respectively. Cash used for software development and long-term assets totaled $6.0 million for 2017 and $6.2 million for 2016. Other investing activities consist mainly of proceeds from the sale of property and equipment of $1.4 million and $1.3 million for 2017 and 2016, respectively.
Financing activity cash flow
Cash flows provided by financing activities were
$2.0 million
for
2018
compared to cash flows used in financing activities of
$161.1 million
for
2017
. We generally borrow amounts under our revolving credit facility seasonally to fund our independent ATM network as well as several times each month to support the short-term cash needs of our Money Transfer Segment in order to fund the correspondent network in advance of collecting remittance amounts from the agency network. These borrowings related to the Money Transfer Segment are repaid over a very short period of time, generally within a few days. Net borrowings on debt obligations were
$170.5 million
in
2018
compared to net repayments of
$164.5 million
for
2017
. The increase in net borrowings as compared to
2017
was primarily the result of borrowing additional amounts under the revolving credit facility for ATM cash needs. Additionally, for
2018
and
2017
, we paid
$6.1 million
and
$4.9 million
, respectively, for capital lease obligations. We used
$177.9 million
and
$3.1 million
for the repurchase of shares during
2018
and
2017
, respectively. Of the
$177.9 million
repurchased shares,
$175.0 million
in value of Euronet Common Stock were under the Repurchase Program. Further, we received proceeds of
$18.6 million
and
$11.0 million
during
2018
and
2017
, respectively, for the issuance of stock in connection with our Stock Incentive Plan.
Cash flows used in financing activities were
$161.1 million
for
2017
compared to cash flows provided by financing activities of
$79.5 million
for
2016
. Net repayments on debt obligations were
$164.5 million
in
2017
compared to net borrowings of
$152.2 million
for
2016
. The increase in net repayments as compared to 2016 was primarily the result of using cash generated from operations to repay borrowings under the revolving credit facility. Additionally, for
2017
and
2016
, we paid
$4.9 million
and
$2.9 million
, respectively, for capital lease obligations. We used
$3.1 million
and
$77.4 million
for the repurchase of shares during
2017
and
2016
, respectively. Further, we received proceeds of
$11.0 million
and
$6.3 million
during
2017
and
2016
, respectively, for the issuance of stock in connection with our Stock Incentive Plan. Other financing activities provided cash of
$0.3 million
and
$1.3 million
during
2017
and
2016
, respectively.
Other sources of capital
Credit Facility
— On October 17, 2018, the Company entered into a new $1.0 billion unsecured credit agreement (the "Credit Facility") that expires on October 17, 2023. and retired a
$675 million
senior secured credit facility that would have matured on
April 9, 2019
consisting of a
$590 million
revolving credit facility, a
$10 million
India revolving credit facility and an $75 million term loan ("Term Loan A"). The Credit Facility allows for borrowings in Australian Dollars, British Pounds Sterling, Canadian Dollars, Czech Koruna, Danish Krone, Euros, Hungarian Forints, Japanese Yen, New Zealand Dollars, Norwegian Krone, Polish Zlotys, Swedish Krona, Swiss Francs, and US Dollars. The revolving credit facility contains a
$200 million
sublimit for the issuance of letters of credit, a
$50 million
sublimit for U.S. Dollar swingline loans, and a
$90 million
sublimit for certain foreign currencies swingline loans.
As of
December 31, 2018
, fees and interest on borrowings are based upon the Company's corporate credit rating (as defined in the credit agreement) and are based, in the case of letter of credit fees, on a margin, and in the case of interest, on a margin over the London InterBank Offered Rate ("LIBOR") or a margin over the base rate, as selected by us, with the applicable margin ranging from
1.125%
to
2.0%
(or
0.175%
to
1.0%
for base rate loans).
We had
$215.7 million
of borrowings and
$47.1 million
of stand-by letters of credit outstanding under the revolving credit facility as of
December 31, 2018
. The remaining
$737.2 million
under the revolving credit facility was available for borrowing. As of
December 31, 2018
, the weighted average interest rate under the revolving credit facility was
3.1%
, excluding amortization of deferred financing costs.
Convertible debt
— On October 30, 2014, we completed the sale of
$402.5 million
of Convertible Senior Notes due 2044 (“Convertible Notes”). The Convertible Notes have an interest rate of
1.5%
per annum payable semi-annually in April and October, and are convertible into shares of Euronet Common Stock at a conversion price of approximately
$72.18
per share if certain conditions are met (relating to the closing prices of Euronet common stock exceeding certain thresholds for specified periods). Holders of the Convertible Notes have the option to require us to purchase their notes at par on October 1, 2020, and have additional options to require us to purchase their notes at par on October 1, 2024, 2029, 2034, and 2039, or upon a change in control of the Company. In connection with the issuance of the Convertible Notes, we recorded
$10.7 million
in debt issuance costs, which are being amortized through October 1, 2020. $1.0 million of Convertible Notes were converted in December 2018.
61
ATM Facility
— On May 11, 2018, we entered into a short-term credit facility in the amount of $300 million for the sole purpose of providing cash for our ATM network during the tourism season. Interest was charged on this financing on an annual basis at the overnight LIBOR rate plus 1.75%. The facility expired on November 30, 2018.
Other debt obligations
— Certain of our subsidiaries have available credit lines and overdraft facilities to generally supplement short-term working capital requirements, when necessary. As of
December 31, 2018
, there was
$38.5 million
outstanding under these other obligation arrangements. Short-term debt obligations at
December 31, 2018
were primarily comprised of
$38.0 million
due in 2019 under these other obligation arrangements.
Other uses of capital
Capital expenditures and needs
— Total capital expenditures for
2018
were $119.4 million. These capital expenditures were primarily for the purchase of ATMs to expand our IAD network in Europe, the purchase and installation of ATMs in key under-penetrated markets, the purchase of POS terminals for the epay and Money Transfer Segments, and office, data center and company store computer equipment and software. Total capital expenditures for
2019
are currently estimated to be approximately $120 million to $130 million.
At current and projected cash flow levels, we anticipate that cash generated from operations, together with cash on hand and amounts available under our revolving credit facility and other existing and potential future financing will be sufficient to meet our debt, leasing, and capital expenditure obligations. If our capital resources are not sufficient to meet these obligations, we will seek to refinance our debt and/or issue additional equity under terms acceptable to us. However, we can offer no assurances that we will be able to obtain favorable terms for the refinancing of any of our debt or other obligations or for the issuance of additional equity.
Share repurchase plan
The Company's Board of Directors has authorized a stock repurchase program ("Repurchase Program"), allowing Euronet to repurchase up to
$375 million
in value or
10.0 million
shares of stock through March 31, 2020. Repurchases under the Repurchase Program may take place in the open market or in privately negotiated transactions, including derivative transactions, and may be made under a Rule 10b5-1 plan. For the year end
December 31, 2018
, the Company repurchased
2.0 million
shares under the Repurchase Program at a weighted average purchase price of
$86.10
for a total value of
$175.0 million
. No repurchases were made during 2017.
Inflation and functional currencies
Generally, the countries in which we operate have experienced low and stable inflation in recent years. Therefore, the local currency in each of these markets is the functional currency. Currently, we do not believe that inflation will have a significant effect on our results of operations or financial position. We continually review inflation and the functional currency in each of the countries where we operate.
Off Balance Sheet Arrangements
We have certain significant off balance sheet items described below, in the following section, “Contractual Obligations” and in Note 19, Commitments, to the Consolidated Financial Statements.
On occasion, we grant guarantees of the obligations of our subsidiaries and we sometimes enter into agreements with unaffiliated third parties that contain indemnification provisions, the terms of which may vary depending on the negotiated terms of each respective agreement. Our liability under such indemnification provisions may be subject to time and materiality limitations, monetary caps and other conditions and defenses. To date, we are not aware of any significant claims made by the indemnified parties or parties to whom we have provided guarantees on behalf of our subsidiaries and, accordingly, no liabilities have been recorded as of
December 31, 2018
.
62
Contractual Obligations
The following table summarizes our contractual obligations as of
December 31, 2018
:
|
Payments due by period
|
||||||||||||||||||||
|
(in thousands)
|
Total
|
Less than
1 year
|
1-3 years
|
3-5 years
|
More than
5 years
|
|||||||||||||||
|
Long-term debt obligations, including interest
|
$
|
636,573
|
|
$
|
6,023
|
|
$
|
630,550
|
|
$
|
—
|
|
$
|
—
|
|
|||||
|
Obligations under operating leases
|
311,651
|
|
80,803
|
|
114,642
|
|
68,015
|
|
48,191
|
|
||||||||||
|
Obligations under capital leases
|
14,977
|
|
6,150
|
|
7,823
|
|
1,004
|
|
—
|
|
||||||||||
|
Purchase obligations
|
25,033
|
|
16,520
|
|
4,475
|
|
2,110
|
|
1,928
|
|
||||||||||
|
Total
|
$
|
988,234
|
|
$
|
109,496
|
|
$
|
757,490
|
|
$
|
71,129
|
|
$
|
50,119
|
|
|||||
The computation of interest for debt obligations with variable interest rates reflects interest rates in effect at
December 31, 2018
and assumes no change in our revolving credit borrowings prior to the maturity date of our credit facility. For additional information on debt obligations, see Note 10, Debt Obligations, to the Consolidated Financial Statements.
For additional information on capital and operating lease obligations, see Note 12, Leases, to the Consolidated Financial Statements. Purchase obligations primarily consist of ATM maintenance and services as well as telecommunications services and professional fees.
Our total liability for uncertain tax positions under Accounting Standards Codification ("ASC") 740-10-25 and -30 was
$30.9 million
as of
December 31, 2018
. The application of ASC 740-10-25 and -30 requires significant judgment in assessing the outcome of future income tax examinations and their potential impact on the Company's estimated effective income tax rate and the value of deferred tax assets, such as those related to the Company's net operating loss carryforwards. It is reasonably possible that the balance of gross unrecognized tax benefits could significantly change within the next twelve months, as a result of the resolution of audit examinations and expirations of certain statutes of limitations and, accordingly, materially affect our consolidated financial statements. At this time, it is not possible to estimate the range of change due to the uncertainty of potential outcomes.
Critical Accounting Policies and Estimates
The preparation of financial statements in conformity with U.S. GAAP which requires management to make estimates, judgments and assumptions that affect the amounts reported in the Consolidated Financial Statements and accompanying notes. Management considers an accounting policy and estimate to be critical if it requires the use of assumptions that were uncertain at the time the estimate was made and if changes in the estimate or selection of a different estimate could have a material effect on the Company’s financial condition and results of operations. Our most critical estimates and assumptions are used for computing income taxes, allocating the purchase price to assets acquired and liabilities assumed in acquisitions, and potential impairment of long-lived assets and goodwill. We base our estimates on historical experience and on various other assumptions that are believed to be reasonable under the circumstances, the results of which form the basis for making judgments about the carrying values of assets and liabilities that are not readily apparent from other sources. Actual results could differ materially from these estimates. For a summary of all of the Company’s significant accounting policies, see Note 3, Summary of Significant Accounting Policies and Practices, to the accompanying Consolidated Financial Statements.
Accounting for income taxes
The deferred income tax effects of transactions reported in different periods for financial reporting and income tax return purposes are recorded under the asset and liability method prescribed under ASC Topic 740,
Income Taxes
(“ASC 740”). This method gives consideration to the future tax consequences of deferred income or expense items and immediately recognizes changes in income tax laws upon enactment. The statement of income effect is generally derived from changes in deferred income taxes, net of valuation allowances, on the balance sheet as measured by differences in the book and tax bases of our assets and liabilities.
63
We have significant tax loss carryforwards, and other temporary differences, which are recorded as deferred tax assets and liabilities. Deferred tax assets realizable in future periods are recorded net of a valuation allowance based on an assessment of each entity's, or group of entities', ability to generate sufficient taxable income within an appropriate period, in a specific tax jurisdiction.
In assessing the recognition of deferred tax assets, we consider whether it is more likely than not that some portion or all of the deferred tax assets will be realized. As more fully described in Note 13, Taxes, to the Consolidated Financial Statements, gross deferred tax assets were
$139.3 million
as of
December 31, 2018
, partially offset by a valuation allowance of
$21.9 million
. The ultimate realization of deferred tax assets is dependent upon the generation of future taxable income during the periods in which those temporary differences become deductible. We make judgments and estimates on the scheduled reversal of deferred tax liabilities, historical and projected future taxable income in each country in which we operate, and tax planning strategies in making this assessment.
Based upon the level of historical taxable income and current projections for future taxable income over the periods in which the deferred tax assets are deductible, we believe it is more likely than not that we will realize the benefits of these deductible differences, net of the existing valuation allowance at
December 31, 2018
. If we have a history of generating taxable income in a certain country in which we operate, and baseline forecasts project continued taxable income in this country, we will reduce the valuation allowance for those deferred tax assets that we expect to realize.
Additionally, we follow the provisions of ASC 740-10-25 and -30 to account for uncertainty in income tax positions. Applying the standard requires substantial management judgment and use of estimates in determining whether the impact of a tax position is “more likely than not” of being sustained on audit by the relevant taxing authority. We consider many factors when evaluating and estimating our tax positions, which may require periodic adjustments and which may not accurately anticipate actual outcomes. It is reasonably possible that amounts reserved for potential exposure could change significantly as a result of the conclusion of tax examinations and, accordingly, materially affect our operating results.
Business combinations
In accordance with ASC Topic 805,
Business Combinations
(“ASC 805”), we allocate the acquisition purchase price of an acquired entity to the assets acquired, including identifiable intangibles, and liabilities assumed based on their estimated fair values at the date of acquisition. Management applies various valuation methodologies to these acquired assets and assumed liabilities which often involve a significant degree of judgment, particularly when liquid markets do not exist for the particular item being valued. Examples of such items include loans, deposits, identifiable intangible assets and certain other assets and liabilities acquired or assumed in business combinations. Management uses significant estimates and assumptions to value such items, including, projected cash flows and discount rates. For larger or more complex acquisitions, we generally obtain third-party valuations to assist us in estimating fair values. The use of different valuation techniques and assumptions could change the amounts and useful lives assigned to the assets and liabilities acquired and related amortization expense. During the measurement period, which is not to exceed one year from the acquisition date, we may record adjustments to the assets acquired and liabilities assumed, with the corresponding offset to goodwill. Upon the conclusion of the measurement period, any subsequent adjustments are recorded to earnings.
Goodwill and intangible assets
In accordance with ASC Topic 350,
Intangibles - Goodwill and Other
(“ASC 350”)
,
we evaluate the carrying value of our indefinite-lived assets, including goodwill, at least annually or more frequently whenever events or changes in circumstances indicate that the asset may be impaired, or in the case of goodwill, that the fair value of the reporting unit may be less than its carrying amount. Impairment tests are performed annually during the fourth quarter and are performed at the reporting unit level. Our annual process for evaluating goodwill requires us to perform a qualitative assessment for all reporting units not subjected directly to the quantitative goodwill impairment test. The qualitative factors evaluated by the Company include: economic conditions of the local business environment, overall financial performance, sensitivity analysis from the most recent quantitative test, and other entity specific factors as deemed appropriate. If we determine a quantitative goodwill impairment test is appropriate, the test involves comparing the fair value of a reporting unit to its carrying amount, including goodwill, after any long-lived asset impairment charges. Generally, the fair value represents discounted projected future cash flows and market multiple of earnings. If the carrying amount of the reporting unit's goodwill exceeds the fair value of the goodwill, an impairment loss is recognized in an amount equal to the excess. Determining the fair value of reporting units requires significant management judgment in estimating future cash flows and assessing potential market and economic conditions. It is reasonably possible that our operations will not perform as expected, or that estimates or assumptions could change, which may result in the recording of material non-cash impairment charges during the year in which these determinations take place.
Acquired finite-lived intangible assets are amortized over their estimated useful lives. We evaluate the recoverability of our intangible assets for possible impairment whenever events or circumstances indicate that the carrying amount of such assets may not be recoverable. The evaluation is performed at the lowest level for which identifiable cash flows are largely
64
independent of the cash flows of other assets and liabilities. Recoverability of these assets is measured by a comparison of the carrying amounts to the future undiscounted cash flows the assets are expected to generate. If such review indicates that the
carrying amount of intangible assets is not recoverable, the carrying amount of such assets is reduced to fair value. In addition to the recoverability assessment, we routinely review the remaining estimated useful lives of our finite-lived intangible assets. If we reduce the estimated useful life assumption for any asset, the remaining unamortized balance would be amortized over the revised estimated useful life.
As of
December 31, 2018
, the Consolidated Balance Sheet includes goodwill of
$704.2 million
and acquired intangible assets, net of accumulated amortization, of
$114.5 million
. For the year ended December 31, 2018, no impairment of goodwill has been identified. During the fourth quarter of 2018, we recorded a
$7.0 million
non-cash impairment charge for acquired intangible assets, specifically the HiFX trade name, related to rebranding the HiFX business to xe.
Recently Issued Accounting Pronouncements
See Item 8 of Part II, "Financial Statements and Supplementary Data - Note 3 - Summary of Significant Accounting Policies and Practices.
65
Forward-Looking Statements
This document contains statements that constitute forward-looking statements within the meaning of section 27A of the Securities Act of 1933 and section 21E of the Securities Exchange Act of 1934 (“Exchange Act”). Generally, the words "believe," "expect," "anticipate," "intend," "estimate," "will" and similar expressions identify forward-looking statements. However, the absence of these words or similar expressions does not mean the statement is not forward-looking. All statements other than statements of historical facts included in this document are forward-looking statements, including, but not limited to, statements regarding the following:
|
•
|
our business plans and financing plans and requirements;
|
|
•
|
trends affecting our business plans and financing plans and requirements;
|
|
•
|
trends affecting our business;
|
|
•
|
the adequacy of capital to meet our capital requirements and expansion plans;
|
|
•
|
the assumptions underlying our business plans;
|
|
•
|
our ability to repay indebtedness;
|
|
•
|
our estimated capital expenditures;
|
|
•
|
the potential outcome of loss contingencies;
|
|
•
|
our expectations regarding the closing of any pending acquisitions;
|
|
•
|
business strategy;
|
|
•
|
government regulatory action;
|
|
•
|
the expected effects of changes in laws or accounting standards;
|
|
•
|
technological advances; and
|
|
•
|
projected costs and revenues.
|
Although we believe that the expectations reflected in these forward-looking statements are reasonable, we can give no assurance that these expectations will prove to be correct.
Investors are cautioned that any forward-looking statements are not guarantees of future performance and involve risks and uncertainties. Actual results may materially differ from those in the forward-looking statements as a result of various factors, including, but not limited to, conditions in world financial markets and general economic conditions, including the effects in Europe of the U.K.'s departure from the E.U. and economic conditions in specific countries and regions; the effects of demonetization in India; technological developments affecting the market for our products and services; our ability to successfully introduce new products and services; foreign currency exchange rate fluctuations; the effects of any breach of our computer systems or those of our customers or vendors, including our financial processing networks or those of other third parties; interruptions in any of our systems or those of our vendors or other third parties; our ability to renew existing contracts at profitable rates; changes in fees payable for transactions performed for cards bearing international logos or over switching networks such as card transactions on ATMs; Visa's announced rule change to allow our ATMs to provide DCC beginning mid-April 2019; our ability to comply with increasingly stringent regulatory requirements, including anti-money laundering, anti-terrorism, anti-bribery, consumer and data protection and GDPR or PSD2 requirements; changes in laws and regulations affecting our business, including tax and immigration laws and any laws regulating payments, including DCC transactions, changes in our relationships with, or in fees charged by, our business partners; competition; the outcome of claims and other loss contingencies affecting Euronet; and those factors referred to above and as set forth and more fully described in Part I, Item 1A — Risk Factors. Any forward-looking statements made in this Form 10-K speak only as of the date of this report. Except as required by law, we do not intend, and do not undertake, any obligation to update any forward looking statements to reflect future events or circumstances after the date of such statements.
66
Item 7A. Quantitative and Qualitative Disclosures About Market Risk
Interest rate risk
As of
December 31, 2018
, our total debt outstanding, excluding unamortized debt issuance costs, was
$634.1 million
. Of this amount,
$379.9 million
, net of debt discounts, or
60%
of our total debt obligations, relates to contingent convertible notes having a fixed coupon rate. Our $401.5 million outstanding principal amount of contingent convertible notes accrue cash interest at a rate of 1.50% of the principal amount per annum. Based on quoted market prices, as of
December 31, 2018
, the fair value of our fixed rate convertible notes was
$571.6 million
, compared to a carrying value of
$379.9 million
. Interest expense for these notes, including accretion and amortization of deferred debt issuance costs, has a weighted average interest rate of
4.7%
annually. Additionally,
$215.7 million
, or
34%
of our total debt obligations, relates to borrowings under our Credit Facility. If we were to maintain these borrowings for one year and maximize the potential borrowings available under the revolving credit facility for one year, a 1% (100 basis points) increase in the applicable interest rate would result in additional interest expense to the Company of approximately $10 million.
The remaining
$38.5 million
, or
6%
of our total debt obligations, is related to borrowings by certain subsidiaries to fund, from time to time, working capital requirements. These arrangements generally are due within one year and accrue interest at variable rates.
Additionally, as of
December 31, 2018
, we had approximately
$13.7 million
of capitalized leases with fixed payment and interest terms that expire between the years of
2019
and
2023
and bear interest at rates between
0.8%
and
13.0%
.
Our excess cash is invested in instruments with original maturities of three months or less or in certificates of deposit that may be withdrawn at any time without penalty; therefore, as investments mature and are reinvested, the amount we earn will increase or decrease with changes in the underlying short-term interest rates.
Foreign currency exchange rate risk
For the years ended
December 31, 2018
and
2017
,
72%
and
75%
of our revenues, respectively, were generated in non-U.S. dollar countries. We expect to continue generating a significant portion of our revenues in countries with currencies other than the U.S. dollar.
We are particularly vulnerable to fluctuations in exchange rates of the U.S. dollar to the currencies of countries in which we have significant operations, primarily the euro, British pound, Australian dollar, Polish zloty, Indian rupee, New Zealand dollar, Malaysian ringgit and Hungarian forint. As of
December 31, 2018
, we estimate that a 10% fluctuation in these foreign currency exchange rates would have the combined annualized effect on reported net income and working capital of approximately $112 million to $117 million. This effect is estimated by applying a 10% adjustment factor to our non-U.S. dollar results from operations, intercompany loans that generate foreign currency gains or losses and working capital balances that require translation from the respective functional currency to the U.S. dollar reporting currency.
Additionally, we have other non-current, non-U.S. dollar assets and liabilities on our balance sheet that are translated to the U.S. dollar during consolidation. These items primarily represent goodwill and intangible assets recorded in connection with acquisitions in countries other than the U.S. We estimate that a 10% fluctuation in foreign currency exchange rates would have a non-cash impact on total comprehensive income of approximately $100 million to $105 million as a result of the change in value of these items during translation to the U.S. dollar. For the fluctuations described above, a strengthening U.S. dollar produces a financial loss, while a weakening U.S. dollar produces a financial gain.
We believe this quantitative measure has inherent limitations and does not take into account any governmental actions or changes in either customer purchasing patterns or our financing or operating strategies. Because a majority of our revenues and expenses are incurred in the functional currencies of our international operating entities, the profits we earn in foreign currencies are positively impacted by a weakening of the U.S. dollar and negatively impacted by a strengthening of the U.S. dollar. Additionally, our debt obligations are primarily in U.S. dollars; therefore, as foreign currency exchange rates fluctuate, the amount available for repayment of debt will also increase or decrease.
We use derivatives to minimize our exposures related to changes in foreign currency exchange rates and to facilitate foreign currency risk management services by writing derivatives to customers. Derivatives are used to manage the overall market risk associated with foreign currency exchange rates; however, we do not perform the extensive record-keeping required to account for the derivative transactions as hedges. Due to the relatively short duration of the derivative contracts, we use the derivatives primarily as economic hedges. Since we do not designate foreign currency derivatives as hedging instruments pursuant to the accounting standards, we record gains and losses on foreign exchange derivatives in earnings in the period of change.
67
A majority of our consumer-to-consumer money transfer operations involve receiving and disbursing different currencies, in which we earn a foreign currency spread based on the difference between buying currency at wholesale exchange rates and selling the currency to consumers at retail exchange rates. We enter into foreign currency forward and cross-currency swap contracts to minimize exposure related to fluctuations in foreign currency exchange rates.
The changes in fair value related to these contracts are recorded in Foreign currency exchange (loss) gain, net on the Consolidated Statements of Income.
As of
December 31, 2018
, we had foreign currency derivative contracts outstanding with a notional value of
$251.1 million
, primarily in Australian dollars, British pounds, Canadian dollars, euros and Mexican pesos, that were not designated as hedges and mature within a few days.
For derivative instruments our HiFX and xe operations write to customers, we aggregate the foreign currency exposure arising from customer contracts, and hedge the resulting net currency risks by entering into offsetting contracts with established financial institution counterparties as part of a broader foreign currency portfolio. The changes in fair value related to the total portfolio of positions are recorded in Revenues on the Consolidated Statements of Income. As of
December 31, 2018
, we held foreign currency derivative contracts outstanding with a notional value of
$1.8 billion
, primarily in U.S. dollars, euros, British pounds, Australian dollars and New Zealand dollars, that were not designated as hedges and for which the majority mature within the next twelve months.
We use longer-term foreign currency forward contracts to mitigate risks associated with changes in foreign currency exchange
rates on certain foreign currency denominated other asset and liability positions. As of
December 31, 2018
, the Company had
foreign currency forward contracts outstanding with a notional value of
$64.3 million
, primarily in euros.
See Note 11, Derivative Instruments and Hedging Activities to our Consolidated Financial Statements for additional information.
68
Item 8. Financial Statements and Supplementary Data
|
Index to Consolidated Financial Statements
|
Page
|
69
Report of Independent Registered Public Accounting Firm
To the Stockholders and Board of Directors
Euronet Worldwide, Inc.:
Opinions on the Consolidated Financial Statements and Internal Control Over Financial Reporting
We have audited the accompanying consolidated balance sheets of Euronet Worldwide, Inc. and subsidiaries (the Company) as of December 31, 2018 and 2017, the related consolidated statements of income, comprehensive income, changes in equity, and cash flows for each of the years in the three-year period ended December 31, 2018, and the related notes (collectively, the consolidated financial statements). We also have audited the Company’s internal control over financial reporting as of December 31, 2018, based on criteria established in
Internal Control - Integrated Framework
(2013)
issued by the Committee of Sponsoring Organizations of the Treadway Commission.
In our opinion, the consolidated financial statements referred to above present fairly, in all material respects, the financial position of the Company as of December 31, 2018 and 2017, and the results of its operations and its cash flows for each of the years in the three-year period ended December 31, 2018, in conformity with U.S. generally accepted accounting principles. Also in our opinion, the Company maintained, in all material respects, effective internal control over financial reporting as of December 31, 2018, based on criteria established in
Internal Control - Integrated Framework (2013)
issued by the Committee of Sponsoring Organizations of the Treadway Commission.
Change in Accounting Principle
As discussed in Note 3 to the consolidated financial statements, the Company has changed its method of accounting for revenue recognition in 2018 due to the adoption of Accounting Standards Codification Topic 606,
Revenue from Contracts with Customers.
Basis for Opinions
The Company’s management is responsible for these consolidated financial statements, for maintaining effective internal control over financial reporting, and for its assessment of the effectiveness of internal control over financial reporting, included in the accompanying Management’s Report On Internal Control Over Financial Reporting. Our responsibility is to express an opinion on the Company’s consolidated financial statements and an opinion on the Company’s internal control over financial reporting based on our audits. We are a public accounting firm registered with the Public Company Accounting Oversight Board (United States) (PCAOB) and are required to be independent with respect to the Company in accordance with the U.S. federal securities laws and the applicable rules and regulations of the Securities and Exchange Commission and the PCAOB.
We conducted our audits in accordance with the standards of the PCAOB. Those standards require that we plan and perform the audits to obtain reasonable assurance about whether the consolidated financial statements are free of material misstatement, whether due to error or fraud, and whether effective internal control over financial reporting was maintained in all material respects.
Our audits of the consolidated financial statements included performing procedures to assess the risks of material misstatement of the consolidated financial statements, whether due to error or fraud, and performing procedures that respond to those risks. Such procedures included examining, on a test basis, evidence regarding the amounts and disclosures in the consolidated financial statements. Our audits also included evaluating the accounting principles used and significant estimates made by management, as well as evaluating the overall presentation of the consolidated financial statements. Our audit of internal control over financial reporting included obtaining an understanding of internal control over financial reporting, assessing the risk that a material weakness exists, and testing and evaluating the design and operating effectiveness of internal control based on the assessed risk. Our audits also included performing such other procedures as we considered necessary in the circumstances. We believe that our audits provide a reasonable basis for our opinions.
Definition and Limitations of Internal Control Over Financial Reporting
A company’s internal control over financial reporting is a process designed to provide reasonable assurance regarding the reliability of financial reporting and the preparation of financial statements for external purposes in accordance with generally accepted accounting principles. A company’s internal control over financial reporting includes those policies and procedures that (1) pertain to the maintenance of records that, in reasonable detail, accurately and fairly reflect the transactions and dispositions of the assets of the company; (2) provide reasonable assurance that transactions are recorded as necessary to permit preparation of financial statements in accordance with generally accepted accounting principles, and that receipts and expenditures of the company are being made only in accordance with authorizations of management and directors of the
70
company; and (3) provide reasonable assurance regarding prevention or timely detection of unauthorized acquisition, use, or disposition of the company’s assets that could have a material effect on the financial statements.
Because of its inherent limitations, internal control over financial reporting may not prevent or detect misstatements. Also, projections of any evaluation of effectiveness to future periods are subject to the risk that controls may become inadequate because of changes in conditions, or that the degree of compliance with the policies or procedures may deteriorate.
/s/ KPMG LLP
We have served as the Company's auditor since 2003.
Kansas City, Missouri
February 28, 2019
71
Consolidated Financial Statements
Euronet Worldwide, Inc. and Subsidiaries
Consolidated Balance Sheets
(in thousands, except share and per share data)
|
|
As of December 31,
|
||||||
|
2018
|
2017
|
||||||
|
ASSETS
|
|
|
|||||
|
Current assets:
|
|
|
|||||
|
Cash and cash equivalents
|
$
|
1,054,357
|
|
$
|
819,144
|
|
|
|
Restricted cash
|
76,595
|
|
81,374
|
|
|||
|
Trade accounts receivable, net of allowances for doubtful accounts of $24,287 at December 31, 2018 and $20,958 at December 31, 2017
|
693,616
|
|
744,879
|
|
|||
|
Prepaid expenses and other current assets
|
263,019
|
|
244,789
|
|
|||
|
Total current assets
|
2,087,587
|
|
1,890,186
|
|
|||
|
Property and equipment, net of accumulated depreciation of $373,180 at December 31, 2018 and $340,128 at December 31, 2017
|
291,869
|
|
268,303
|
|
|||
|
Goodwill
|
704,197
|
|
717,386
|
|
|||
|
Acquired intangible assets, net of accumulated amortization of $190,920 at December 31, 2018 and $179,142 at December 31, 2017
|
114,485
|
|
150,543
|
|
|||
|
Other assets, net of accumulated amortization of $50,821 at December 31, 2018 and $44,469 at December 31, 2017
|
123,017
|
|
113,611
|
|
|||
|
Total assets
|
$
|
3,321,155
|
|
$
|
3,140,029
|
|
|
|
LIABILITIES AND EQUITY
|
|
|
|||||
|
Current liabilities:
|
|
|
|||||
|
Trade accounts payable
|
$
|
528,913
|
|
$
|
494,841
|
|
|
|
Accrued expenses and other current liabilities
|
706,554
|
|
759,789
|
|
|||
|
Current portion of capital lease obligations
|
5,458
|
|
5,369
|
|
|||
|
Short-term debt obligations and current maturities of long-term debt obligations
|
38,017
|
|
41,288
|
|
|||
|
Income taxes payable
|
40,159
|
|
54,437
|
|
|||
|
Deferred revenue
|
59,293
|
|
51,996
|
|
|||
|
Total current liabilities
|
1,378,394
|
|
1,407,720
|
|
|||
|
Debt obligations, net of current portion
|
589,782
|
|
404,012
|
|
|||
|
Capital lease obligations, net of current portion
|
8,199
|
|
9,753
|
|
|||
|
Deferred income taxes
|
57,145
|
|
54,969
|
|
|||
|
Other long-term liabilities
|
54,793
|
|
64,097
|
|
|||
|
Total liabilities
|
2,088,313
|
|
1,940,551
|
|
|||
|
Equity:
|
|
|
|||||
|
Euronet Worldwide, Inc. stockholders’ equity:
|
|
|
|||||
|
Preferred Stock, $0.02 par value. 10,000,000 shares authorized; none issued
|
—
|
|
—
|
|
|||
|
Common Stock, $0.02 par value. 90,000,000 shares authorized; 59,897,309 issued at December 31, 2018 and 58,892,744 issued at December 31, 2017
|
1,198
|
|
1,178
|
|
|||
|
Additional paid-in capital
|
1,104,264
|
|
1,072,005
|
|
|||
|
Treasury stock, at cost, 8,077,311 shares at December 31, 2018 and 6,084,586 shares at December 31, 2017
|
(391,551
|
)
|
(217,161
|
)
|
|||
|
Retained earnings
|
669,805
|
|
436,954
|
|
|||
|
Accumulated other comprehensive loss
|
(151,043
|
)
|
(94,458
|
)
|
|||
|
Total Euronet Worldwide, Inc. stockholders’ equity
|
1,232,673
|
|
1,198,518
|
|
|||
|
Noncontrolling interests
|
169
|
|
960
|
|
|||
|
Total equity
|
1,232,842
|
|
1,199,478
|
|
|||
|
Total liabilities and equity
|
$
|
3,321,155
|
|
$
|
3,140,029
|
|
|
See accompanying notes to the Consolidated Financial Statements.
72
Euronet Worldwide, Inc. and Subsidiaries
Consolidated Statements of Income
(in thousands, except share and per share data)
|
Year Ended December 31,
|
||||||||||||
|
2018
|
2017
|
2016
|
||||||||||
|
Revenues
|
$
|
2,536,629
|
|
$
|
2,252,422
|
|
$
|
1,958,615
|
|
|||
|
Operating expenses:
|
||||||||||||
|
Direct operating costs
|
1,488,406
|
|
1,356,250
|
|
1,174,545
|
|
||||||
|
Salaries and benefits
|
360,432
|
|
310,787
|
|
288,420
|
|
||||||
|
Selling, general and administrative
|
216,807
|
|
190,302
|
|
165,348
|
|
||||||
|
Goodwill and acquired intangible assets impairment
|
7,049
|
|
34,056
|
|
—
|
|
||||||
|
Depreciation and amortization
|
106,021
|
|
95,030
|
|
80,529
|
|
||||||
|
Total operating expenses
|
2,178,715
|
|
1,986,425
|
|
1,708,842
|
|
||||||
|
Operating income
|
357,914
|
|
265,997
|
|
249,773
|
|
||||||
|
Other income (expense):
|
||||||||||||
|
Interest income
|
1,320
|
|
2,443
|
|
1,696
|
|
||||||
|
Interest expense
|
(37,573
|
)
|
(32,571
|
)
|
(28,332
|
)
|
||||||
|
(Loss) Income from unconsolidated affiliates
|
(117
|
)
|
48
|
|
—
|
|
||||||
|
Foreign currency exchange (loss) gain, net
|
(26,655
|
)
|
20,300
|
|
(10,200
|
)
|
||||||
|
Other gains, net
|
27
|
|
118
|
|
19,956
|
|
||||||
|
Other expense, net
|
(62,998
|
)
|
(9,662
|
)
|
(16,880
|
)
|
||||||
|
Income before income taxes
|
294,916
|
|
256,335
|
|
232,893
|
|
||||||
|
Income tax expense
|
(62,785
|
)
|
(99,395
|
)
|
(58,795
|
)
|
||||||
|
Net income
|
232,131
|
|
156,940
|
|
174,098
|
|
||||||
|
Less: Net loss (income) attributable to noncontrolling interests
|
720
|
|
(95
|
)
|
317
|
|
||||||
|
Net income attributable to Euronet Worldwide, Inc.
|
$
|
232,851
|
|
$
|
156,845
|
|
$
|
174,415
|
|
|||
|
Earnings per share attributable to Euronet Worldwide, Inc. stockholders:
|
||||||||||||
|
Basic
|
$
|
4.52
|
|
$
|
2.99
|
|
$
|
3.34
|
|
|||
|
Diluted
|
$
|
4.26
|
|
$
|
2.85
|
|
$
|
3.23
|
|
|||
|
Weighted average shares outstanding:
|
||||||||||||
|
Basic
|
51,487,557
|
|
52,523,272
|
|
52,276,951
|
|
||||||
|
Diluted
|
54,627,747
|
|
55,116,327
|
|
54,001,079
|
|
||||||
See accompanying notes to the Consolidated Financial Statements.
73
Euronet Worldwide, Inc. and Subsidiaries
Consolidated Statements of Comprehensive Income
(in thousands)
|
Year Ended December 31,
|
||||||||||||
|
|
2018
|
2017
|
2016
|
|||||||||
|
Net income
|
$
|
232,131
|
|
$
|
156,940
|
|
$
|
174,098
|
|
|||
|
Other comprehensive income (loss), net of tax:
|
||||||||||||
|
Translation adjustment
|
(56,656
|
)
|
116,401
|
|
(45,175
|
)
|
||||||
|
Comprehensive income
|
175,475
|
|
273,341
|
|
128,923
|
|
||||||
|
Comprehensive (income) loss attributable to noncontrolling interests
|
791
|
|
(292
|
)
|
358
|
|
||||||
|
Comprehensive income attributable to Euronet Worldwide, Inc.
|
$
|
176,266
|
|
$
|
273,049
|
|
$
|
129,281
|
|
|||
See accompanying notes to the Consolidated Financial Statements.
74
Euronet Worldwide, Inc. and Subsidiaries
Consolidated Statements of Changes in Equity
(in thousands, except share data)
|
Number of
Shares
Outstanding
|
Common
Stock
|
Additional
Paid-in
Capital
|
Treasury
Stock
|
||||||||||||
|
Balance as of December 31, 2015
|
53,031,802
|
|
$
|
1,159
|
|
$
|
1,023,254
|
|
$
|
(138,750
|
)
|
||||
|
Net income (loss)
|
|
|
|
|
|
|
|
|
|||||||
|
Other comprehensive loss
|
|
|
|
|
|
|
|
|
|||||||
|
Stock issued under employee stock plans
|
421,170
|
|
9
|
|
7,426
|
|
(1,143
|
)
|
|||||||
|
Share-based compensation
|
|
|
|
|
14,983
|
|
|
|
|||||||
|
Repurchase of shares
|
(1,149,571
|
)
|
(75,569
|
)
|
|||||||||||
|
Balance as of December 31, 2016
|
52,303,401
|
|
1,168
|
|
1,045,663
|
|
(215,462
|
)
|
|||||||
|
Net income
|
|
|
|
|
|
|
|
|
|||||||
|
Other comprehensive income
|
|
|
|
|
|
|
|
|
|||||||
|
Stock issued under employee stock plans
|
504,757
|
|
10
|
|
10,104
|
|
(1,699
|
)
|
|||||||
|
Share-based compensation
|
|
|
|
|
15,618
|
|
|
|
|||||||
|
Other
|
|
|
620
|
|
|
|
|||||||||
|
Balance as of December 31, 2017
|
52,808,158
|
|
1,178
|
|
1,072,005
|
|
(217,161
|
)
|
|||||||
|
Net income (loss)
|
|
|
|
|
|
|
|
|
|||||||
|
Other comprehensive loss
|
|
|
|
|
|
|
|
|
|||||||
|
Stock issued under employee stock plans
|
1,039,480
|
|
20
|
|
15,634
|
|
610
|
|
|||||||
|
Share-based compensation
|
|
|
|
|
16,764
|
|
|
|
|||||||
|
Repurchase of shares
|
(2,032,599
|
)
|
(175,000
|
)
|
|||||||||||
|
Other
|
4,959
|
|
(139
|
)
|
|||||||||||
|
Balance as of December 31, 2018
|
51,819,998
|
|
$
|
1,198
|
|
$
|
1,104,264
|
|
$
|
(391,551
|
)
|
||||
See accompanying notes to the Consolidated Financial Statements.
75
EURONET WORLDWIDE, INC. AND SUBSIDIARIES
Consolidated Statements of Changes in Equity (continued)
(in thousands)
|
Retained Earnings
|
Accumulated Other
Comprehensive Loss
|
Noncontrolling
Interests
|
Total
|
|||||||||||||
|
Balance as of December 31, 2015
|
$
|
104,427
|
|
$
|
(165,528
|
)
|
$
|
1,366
|
|
$
|
825,928
|
|
||||
|
Net income (loss)
|
174,415
|
|
|
|
(317
|
)
|
174,098
|
|
||||||||
|
Other comprehensive loss
|
(45,134
|
)
|
(41
|
)
|
(45,175
|
)
|
||||||||||
|
Stock issued under employee stock plans
|
|
|
|
|
6,292
|
|
||||||||||
|
Share-based compensation
|
|
|
|
|
14,983
|
|
||||||||||
|
Repurchase of shares
|
|
|
|
|
(75,569
|
)
|
||||||||||
|
Balance as of December 31, 2016
|
278,842
|
|
(210,662
|
)
|
1,008
|
|
900,557
|
|
||||||||
|
Net income
|
156,845
|
|
|
|
95
|
|
156,940
|
|
||||||||
|
Other comprehensive income
|
116,204
|
|
197
|
|
116,401
|
|
||||||||||
|
Stock issued under employee stock plans
|
|
|
|
|
8,415
|
|
||||||||||
|
Share-based compensation
|
|
|
|
|
15,618
|
|
||||||||||
|
Other
|
1,267
|
|
|
|
(340
|
)
|
1,547
|
|
||||||||
|
Balance as of December 31, 2017
|
436,954
|
|
(94,458
|
)
|
960
|
|
1,199,478
|
|
||||||||
|
Net income (loss)
|
232,851
|
|
|
|
(720
|
)
|
232,131
|
|
||||||||
|
Other comprehensive loss
|
(56,585
|
)
|
(71
|
)
|
(56,656
|
)
|
||||||||||
|
Stock issued under employee stock plans
|
|
|
16,264
|
|
||||||||||||
|
Share-based compensation
|
|
|
|
|
16,764
|
|
||||||||||
|
Repurchase of shares
|
(175,000
|
)
|
||||||||||||||
|
Other
|
|
|
|
|
|
(139
|
)
|
|||||||||
|
Balance as of December 31, 2018
|
$
|
669,805
|
|
$
|
(151,043
|
)
|
$
|
169
|
|
$
|
1,232,842
|
|
||||
See accompanying notes to the Consolidated Financial Statements.
76
Euronet Worldwide, Inc. and Subsidiaries
Consolidated Statements of Cash Flows
(in thousands)
|
|
Year Ended December 31,
|
||||||||||
|
|
2018
|
2017
|
2016
|
||||||||
|
Net income
|
$
|
232,131
|
|
$
|
156,940
|
|
$
|
174,098
|
|
||
|
Adjustments to reconcile net income to net cash provided by operating activities:
|
|
|
|||||||||
|
Depreciation and amortization
|
106,021
|
|
95,030
|
|
80,529
|
|
|||||
|
Share-based compensation
|
16,764
|
|
15,618
|
|
14,983
|
|
|||||
|
Unrealized foreign exchange loss (gain), net
|
26,655
|
|
(20,300
|
)
|
10,200
|
|
|||||
|
Non-cash impairment of goodwill and acquired intangible assets
|
7,049
|
|
34,056
|
|
—
|
|
|||||
|
Other gains
|
—
|
|
—
|
|
(19,449
|
)
|
|||||
|
Deferred income taxes
|
2,425
|
|
(10,861
|
)
|
850
|
|
|||||
|
Loss (income) from unconsolidated affiliates
|
117
|
|
(48
|
)
|
—
|
|
|||||
|
Accretion of convertible debt discount and amortization of debt issuance costs
|
14,121
|
|
13,504
|
|
12,885
|
|
|||||
|
Changes in working capital, net of amounts acquired:
|
|
|
|
||||||||
|
Income taxes payable, net
|
(13,317
|
)
|
23,183
|
|
13,935
|
|
|||||
|
Trade accounts receivable
|
26,497
|
|
(198,089
|
)
|
(87,732
|
)
|
|||||
|
Prepaid expenses and other current assets
|
(29,066
|
)
|
35,451
|
|
(75,261
|
)
|
|||||
|
Trade accounts payable
|
45,562
|
|
3,840
|
|
9,705
|
|
|||||
|
Deferred revenue
|
9,349
|
|
3,724
|
|
9,426
|
|
|||||
|
Accrued expenses and other current liabilities
|
(37,595
|
)
|
106,350
|
|
257,287
|
|
|||||
|
Changes in noncurrent assets and liabilities
|
(9,480
|
)
|
27,878
|
|
(9,932
|
)
|
|||||
|
Net cash provided by operating activities
|
397,233
|
|
286,276
|
|
391,524
|
|
|||||
|
Cash flows from investing activities:
|
|
|
|||||||||
|
Acquisitions, net of cash acquired
|
(12,854
|
)
|
—
|
|
(55,915
|
)
|
|||||
|
Purchases of property and equipment
|
(112,484
|
)
|
(97,235
|
)
|
(87,411
|
)
|
|||||
|
Purchases of other long-term assets
|
(8,528
|
)
|
(6,039
|
)
|
(6,175
|
)
|
|||||
|
Proceeds from sale of investment
|
—
|
|
—
|
|
11,900
|
|
|||||
|
Other, net
|
1,583
|
|
1,416
|
|
1,288
|
|
|||||
|
Net cash used in investing activities
|
(132,283
|
)
|
(101,858
|
)
|
(136,313
|
)
|
|||||
|
Cash flows from financing activities:
|
|
|
|||||||||
|
Proceeds from issuance of shares
|
18,608
|
|
10,990
|
|
6,292
|
|
|||||
|
Repurchase of shares
|
(177,855
|
)
|
(3,065
|
)
|
(77,360
|
)
|
|||||
|
Borrowings from revolving credit agreements
|
5,773,294
|
|
2,409,203
|
|
2,648,093
|
|
|||||
|
Repayments of revolving credit agreements
|
(5,560,089
|
)
|
(2,566,621
|
)
|
(2,495,632
|
)
|
|||||
|
Repayments of long-term debt obligations
|
(52,199
|
)
|
(8,907
|
)
|
(7,031
|
)
|
|||||
|
Repayments of capital lease obligations
|
(6,137
|
)
|
(4,883
|
)
|
(2,943
|
)
|
|||||
|
Net borrowing from short-term debt obligations
|
9,472
|
|
1,853
|
|
6,750
|
|
|||||
|
Debt issuance costs
|
(3,071
|
)
|
—
|
|
—
|
|
|||||
|
Other, net
|
1
|
|
281
|
|
1,341
|
|
|||||
|
Net cash provided by (used in ) financing activities
|
2,024
|
|
(161,149
|
)
|
79,510
|
|
|||||
|
Effect of exchange rate changes on cash and cash equivalents and restricted cash
|
(36,540
|
)
|
65,161
|
|
(25,463
|
)
|
|||||
|
Increase in cash and cash equivalents and restricted cash
|
230,434
|
|
88,430
|
|
309,258
|
|
|||||
|
Cash and cash equivalents and restricted cash at beginning of period
|
900,518
|
|
812,088
|
|
502,830
|
|
|||||
|
Cash and cash equivalents and restricted cash at end of period
|
$
|
1,130,952
|
|
$
|
900,518
|
|
$
|
812,088
|
|
||
|
Interest paid during the period
|
$
|
23,554
|
|
$
|
20,457
|
|
$
|
14,442
|
|
||
|
Income taxes paid during the period
|
$
|
84,382
|
|
$
|
48,644
|
|
$
|
43,178
|
|
||
|
Supplemental disclosure of non-cash investing and financing activities:
|
|||||||||||
|
Non-cash consideration received from sale of investment
|
$
|
—
|
|
$
|
—
|
|
$
|
7,549
|
|
||
See accompanying notes to the Consolidated Financial Statements.
77
Notes to Consolidated Financial Statements
(1) Organization
Euronet Worldwide, Inc. (the “Company” or “Euronet”) was established as a Delaware corporation on December 13, 1997 and succeeded Euronet Holding N.V. as the group holding company, which was founded and established in 1994. Euronet is a leading electronic payments provider. Euronet offers payment and transaction processing and distribution solutions to financial institutions, retailers, service providers and individual consumers. Euronet's primary product offerings include comprehensive automated teller machine (“ATM”), point-of-sale (“POS”), card outsourcing, card issuing and merchant acquiring services, electronic distribution of prepaid mobile airtime and other electronic payment products, and global money transfer services.
(2) Basis of Preparation
The consolidated financial statements have been prepared in conformity with accounting principles generally accepted in the United States (“U.S. GAAP”) and pursuant to the rules and regulations of the Securities and Exchange Commission (“SEC”). The consolidated financial statements include the accounts of Euronet and its wholly owned and majority owned subsidiaries and all significant intercompany balances and transactions have been eliminated. Euronet's investments in companies that it does not control, but has the ability to significantly influence, are accounted for under the equity method. Euronet is not involved with any variable interest entities. Results from operations related to entities acquired during the periods covered by the consolidated financial statements are reflected from the effective date of acquisition.
The preparation of the consolidated financial statements in conformity with U.S. GAAP requires that management make a number of estimates and assumptions relating to the reported amounts of assets and liabilities, the disclosure of contingent assets and liabilities and the reported amounts of revenues and expenses. Significant items subject to such estimates and assumptions include computing income taxes, contingent purchase price consideration, estimating the useful lives and potential impairment of long-lived assets and goodwill, as well as allocating the purchase price to assets acquired and liabilities assumed in acquisitions and revenue recognition. Actual results could differ from those estimates.
Seasonality
Euronet’s EFT Processing Segment experiences its heaviest demand for dynamic currency conversion services during the third quarter of the fiscal year, coinciding with the tourism season. Additionally, the EFT Processing and epay Segments are impacted by seasonality during the fourth quarter and first quarter of each year due to higher transaction levels during the holiday season and lower levels following the holiday season. Seasonality in the money transfer segment varies by region of the world. In most markets, Euronet usually experiences increased demand for money transfer services from the month of May through the fourth quarter of each year, coinciding with the increase in worker migration patterns and various holidays, and its lowest transaction levels during the first quarter of the year.
(3) Summary of Significant Accounting Policies and Practices
Foreign currencies
Assets and liabilities denominated in currencies other than the functional currency of a subsidiary are remeasured at rates of exchange on the balance sheet date. Resulting gains and losses on foreign currency transactions are included in the Consolidated Statements of Income.
The financial statements of foreign subsidiaries where the functional currency is not the U.S. dollar are translated to U.S. dollars using (i) exchange rates in effect at period end for assets and liabilities, and (ii) weighted average exchange rates during the period for revenues and expenses. Adjustments resulting from translation of such financial statements are reflected in accumulated other comprehensive income (loss) as a separate component of consolidated equity.
Cash equivalents
The Company considers all highly liquid investments, with an original maturity of three months or less, and certificates of deposit, which may be withdrawn at any time at the discretion of the Company without penalty, to be cash equivalents.
Property and equipment
Property and equipment are stated at cost, less accumulated depreciation. Property and equipment acquired in acquisitions have been recorded at estimated fair values as of the acquisition date.
78
Depreciation is generally calculated using the straight-line method over the estimated useful lives of the respective assets. Depreciation and amortization rates are generally as follows:
|
ATMs or ATM upgrades
|
5 - 7 years
|
|
Computers and software
|
3 - 5 years
|
|
POS terminals
|
3 - 5 years
|
|
Vehicles and office equipment
|
3 - 10 years
|
|
Leasehold improvements
|
Over the lesser of the lease term or estimated useful life
|
Goodwill and other intangible assets
The Company accounts for goodwill and other intangible assets in accordance with Financial Accounting Standards Board (“FASB”) Accounting Standards Codification (“ASC”) Topic 350,
Intangibles - Goodwill and Other
(“ASC 350”). ASC 350 requires that the Company test for impairment on an annual basis and whenever events or circumstances dictate. Goodwill is allocated among and evaluated for impairment at the reporting unit level, which is defined as an operating segment or one level below an operating segment.
ASC 350 provides an entity the option to first assess qualitative factors to determine whether the existence of events or circumstances leads to a determination that it is more likely than not (more than 50%) that the estimated fair value of a reporting unit is less than its carrying amount. If an entity elects to perform a qualitative assessment and determines that an impairment is more likely than not, the entity is then required to perform the existing quantitative impairment test (described below), otherwise no further analysis is required. An entity also may elect not to perform the qualitative assessment and, instead, proceed directly to the quantitative impairment test. The Company has a policy for its annual review of goodwill to perform the qualitative assessment for all reporting units not subjected directly to the quantitative impairment test.
Under the qualitative assessment, various events and circumstances (or factors) that would affect the estimated fair value of a reporting unit are identified (similar to impairment indicators). These factors are then classified by the type of impact they would have on the estimated fair value using positive, neutral, and adverse categories based on current business conditions. Furthermore, the Company considers the results of the most recent quantitative impairment test completed for a reporting unit and compares, among other factors, the weighted average cost of capital ("WACC") between the current and prior years for each reporting unit.
Under the quantitative impairment test, the evaluation of impairment involves comparing the current fair value of each reporting unit to its carrying value, including goodwill. The Company uses weighted results from the discounted cash flow model ("DCF model") and guideline public company method ("Market Approach model") to estimate the current fair value of its reporting units when testing for impairment, as management believes forecasted cash flows and EBITDA are the best indicator of such fair value. A number of significant assumptions and estimates are involved in the application of the DCF model to forecast operating cash flows, including sales volumes and gross margins, tax rates, capital spending, discount rates and working capital changes. Most of these assumptions vary significantly among the reporting units. Significant assumptions in the Market Approach model are projected EBITDA, selected market multiple, and the estimated control premium. If the carrying value of goodwill exceeds its fair value, an impairment loss equal to such excess would be recognized.
The Company completed its annual goodwill impairment test in the fourth quarter of 2018. It determined, after performing a qualitative review of each reporting unit, that it is more likely than not that the fair value of each of our reporting units exceeds the respective carrying amounts. Accordingly, there was no indication of impairment, and the quantitative goodwill impairment test was not performed.
Other Intangible Assets
-
In accordance with ASC 350, intangible assets with finite lives are amortized over their estimated useful lives. Unless otherwise noted, amortization is calculated using the straight-line method over the estimated useful lives of the assets as follows:
|
Non-compete agreements
|
2 - 5 years
|
|
Trademarks and trade names
|
2 - 20 years
|
|
Software
|
3 - 10 years
|
|
Customer relationships
|
6 - 20 years
|
79
The Company reviews its long-lived assets for impairment whenever events or changes in circumstances indicate that the carrying amount of an asset may not be recoverable. If such events or changes in circumstances are present, a loss is recognized if the carrying value of the asset is in excess of the sum of the undiscounted cash flows expected to result from the use of the asset and its eventual disposition. An impairment loss is measured as the amount by which the carrying amount of the asset exceeds the fair value of the asset. During 2018, the Company recorded a non-cash impairment charge of
$7.0 million
related to certain trade names as a result of combining HiFX into xe in order to operate the businesses under one brand name, xe. During 2017, the Company recorded a non-cash impairment charge of
$2.3 million
related to certain customer relationships as a result of the closure of the Pure Commerce office in South Korea. No impairment of long-lived assets was recorded during 2016.
See Note 8, Goodwill and Acquired Intangible Assets, Net, to the Consolidated Financial Statements for additional information regarding the impairment of goodwill and other intangible assets.
Other assets
Other assets include investments in unconsolidated affiliates, capitalized software development costs and capitalized payments for new or renewed contracts, contract renewals and customer conversion costs. Euronet capitalizes initial payments for new or renewed contracts to the extent recoverable through future operations, contractual minimums and/or penalties in the case of early termination. The Company's accounting policy is to limit the amount of capitalized costs for a given contract to the lesser of the estimated ongoing net future cash flows related to the contract or the termination fees the Company would receive in the event of early termination of the contract by the customer. ASC Topic 340,
Other Assets and Deferred Costs
(“ASC 340”) requires the deferral of incremental costs to obtain customer contracts, known as contract assets, which are then amortized to expense as part of selling, general and administrative expense over the respective periods of expected benefit. The Company completed its review of such costs and concluded that a transition adjustment was not necessary related to contract assets. However, the Company has implemented processes and controls to record such costs on an ongoing basis and will disclose them if they become material.
The Company accounts for investments in affiliates using the equity method of accounting when it has the ability to exercise significant influence over the affiliate, but does not have a controlling interest. Equity losses in affiliates are generally recognized until the Company's investment is zero. As of December 31, 2018 and 2017, the Company had no material investments in unconsolidated affiliates.
Convertible notes
The Company accounts for its convertible debt instruments that may be settled in cash upon conversion in accordance with ASC Topic 470,
Debt
(“ASC 470”), which requires the proceeds from the issuance of such convertible debt instruments to be allocated between debt and equity components so that debt is discounted to reflect the Company's nonconvertible debt borrowing rate. Further, the Company applies ASC 470-20-35-13, which requires the debt discount to be amortized over the period the convertible debt is expected to be outstanding as additional non-cash interest expense.
Noncontrolling interests
The Company accounts for noncontrolling interests in its consolidated financial statements according to ASC Topic 810,
Consolidations
(“ASC 810”), which requires noncontrolling interests to be reported as a component of equity.
Business combinations
The Company accounts for business combinations in accordance with ASC Topic 805,
Business Combinations
(“ASC 805”), which requires most identifiable assets, liabilities, noncontrolling interests and goodwill acquired in a business combination to be recorded at “full fair value” at the acquisition date. Transaction-related costs are expensed in the period incurred.
Income taxes
Income taxes are accounted for under the asset and liability method. Deferred tax assets and liabilities are recognized for the future tax consequences attributable to differences between the financial statement carrying amounts of existing assets and liabilities and their respective tax bases and operating loss and tax credit carryforwards. Deferred tax assets and liabilities are measured using enacted tax rates expected to apply to taxable income in the years in which those temporary differences are expected to be recovered or settled. The effect on deferred tax assets and liabilities of a change in tax rates is recognized in income in the period that includes the enactment date.
In accordance with ASC Topic 740,
Income Taxes
(“ASC 740”), the Company's policy is to record estimated interest and penalties related to the underpayment of income taxes as income tax expense in the Consolidated Statements of Income. See Note 13, Taxes, to the Consolidated Financial Statements for further discussion regarding these provisions.
80
Presentation of taxes collected and remitted to governmental authorities
The Company presents taxes collected and remitted to governmental authorities on a net basis in the accompanying Consolidated Statements of Income.
Fair value measurements
The Company applies the provisions of ASC Topic 820,
Fair Value Measurements
and Disclosures
(“ASC 820”), regarding fair value measurements for assets and liabilities. ASC 820 defines fair value, establishes a framework for measuring fair value and requires certain disclosures about fair value measurements. The provisions apply whenever other accounting pronouncements require or permit fair value measurements. See Note 17, Financial Instruments and Fair Value Measurements, to the Consolidated Financial Statements for the required fair value disclosures.
Accounting for derivative instruments and hedging activities
The Company accounts for derivative instruments and hedging activities in accordance with ASC Topic 815,
Derivatives and Hedging
(“ASC 815”), which requires that all derivative instruments be recognized as either assets or liabilities on the balance sheet at fair value. Primarily in the Money Transfer Segment, the Company enters into foreign currency derivative contracts, mainly forward contracts, to offset foreign currency exposure related to money transfer settlement assets and liabilities in currencies other than the U.S. dollar, derivative contracts written to its customers arising from its cross-currency money transfer services and certain assets and liability positions denominated in currencies other than the U.S. dollar. These contracts are considered derivative instruments under the provisions of ASC 815; however, the Company does not designate such instruments as hedges for accounting purposes. Accordingly, changes in the value of these contracts are recognized immediately as a component of foreign currency exchange gain (loss), net in the Consolidated Statements of Income.
Cash flows resulting from derivative instruments are included in operating activities in the Company's Consolidated Statements of Cash Flows. The Company enters into derivative instruments with highly credit-worthy financial institutions and does not use derivative instruments for trading or speculative purposes. See Note 11, Derivative Instruments and Hedging Activities, to the Consolidated Financial Statements for further discussion of derivative instruments.
Revenue recognition
The Company recognizes revenue when control of the promised goods or services is transferred to our customers, in an amount that reflects the consideration the Company expects to be entitled to in exchange for those goods or services. Sales and usage-based taxes are excluded from revenues. A description of the major components of revenue by business segment is as follows:
EFT Processing
-
Revenues in the EFT Processing Segment are primarily derived from transaction and management fees and foreign currency exchange margin from owned and outsourced ATM, POS and card processing networks and from the sale of EFT software solutions for electronic payment and transaction delivery systems, and fees or margin earned from value added services, including dynamic currency conversion and domestic and international surcharge.
Transaction-based fees include charges for cash withdrawals, debit or credit card transactions, balance inquiries, transactions not completed because the relevant card issuer does not give authorization and prepaid mobile airtime recharges. Outsourcing services are generally billed on the basis of a fixed monthly fee per ATM, plus a transaction-based fee. Transaction-based fees are recognized at the time the transactions are processed and outsourcing management fees are recognized ratably over the contract period. These fees can be variable based on transaction volume tiered discounts; however, as all tiered discounts are calculated monthly, the actual discount is recorded on a monthly basis.
Certain of the Company's non-cancelable customer contracts provide for the receipt of up-front fees from the customer and/or decreasing or increasing fee schedules over the agreement term for substantially the same level of services to be provided by the Company. The Company recognizes revenue under these contracts based on proportional performance of services over the term of the contract. This generally results in “straight-line” (i.e., consistent value per period) revenue recognition of the contracts' total cash flows, including any up-front payment received from the customer.
epay
-
Revenue generated in the epay Segment is primarily derived from commissions or processing fees associated with distribution and/or processing of prepaid mobile airtime and non-mobile products. These fees and commissions are received from mobile operators, content vendors or distributors or from retailers. In accordance with ASC 606, commissions are recognized as revenue during the period in which the Company provides the service. The portion of the commission that is paid to retailers is generally recorded as a direct operating cost. However, in circumstances where the Company is not the primary obligor in the distribution of the electronic payment products, those commissions are recorded as a reduction of revenue. In selling certain products, the Company is the primary obligor in the arrangements; accordingly, the gross sales value of the products are recorded as revenue and the purchase cost as direct operating cost. Transactions are processed through a network
81
of POS terminals and direct connections to the electronic payment systems of retailers. Transaction processing fees are recognized at the time the transactions are processed.
Money Transfer
-
In accordance with ASC 606, revenues for money transfer and other services represent a transaction fee in addition to a margin earned from purchasing currency at wholesale exchange rates and selling the currency to customers at retail exchange rates. Revenues and the associated direct operating cost are recognized at the time the transaction is processed. The Company has origination and distribution agents in place, which each earn a fee for the respective service. These fees are reflected as direct operating costs.
Share-based compensation
The Company follows the provisions of ASC Topic 718,
Compensation - Stock
Compensation
(“ASC 718”), for equity classified awards, which requires the determination of the fair value of the share-based compensation at the grant date and subsequent recognition of the related expense over the period in which the share-based compensation is earned (“requisite service period”).
The amount of future compensation expense related to awards of nonvested shares or nonvested share units (“restricted stock”) is based on the market price for Euronet Common Stock at the grant date. The grant date is the date at which all key terms and conditions of the grant have been determined and the Company becomes contingently obligated to transfer equity to the employee who renders the requisite service, generally the date at which grants are approved by the Company's Board of Directors or Compensation Committee thereof. Share-based compensation expense for awards with only service conditions is generally recognized as expense on a “straight-line” basis over the requisite service period. For awards that vest based on achieving periodic performance conditions, expense is recognized on a “graded attribution method.” The graded attribution method results in expense recognition on a straight-line basis over the requisite service period for each separately vesting portion of an award. The Company has elected to use the “with and without method” when calculating the income tax benefit associated with its share-based payment arrangements. See Note 15, Stock Plans, for further disclosure.
Recently issued accounting pronouncements
In May 2014, the Financial Accounting Standards Board ("FASB") issued Accounting Standards Update (“ASU”) 2014-09,
“Revenue from Contracts with Customers (Topic 606)”
(“Topic 606”), and subsequently modified the standard with several ASUs. The Company adopted the standard on January 1, 2018 using the modified retrospective method applied to those contracts which were not completed as of January 1, 2018. Results for reporting periods beginning after January 1, 2018 are presented under Topic 606, while prior period amounts are not adjusted and continue to be reported in accordance with historic accounting under Topic 605.
The Company completed its review of customer contracts relative to the requirements of Topic 606 and concluded that revenues from certain customer contracts in the epay Segment should be recorded differently under the principal versus agent guidance of Topic 606. With respect to those contracts, the Company concluded that it earns a commission from content providers for distributing and processing their prepaid mobile airtime and other electronic payment products, but it is not the principal for the products themselves. As a result, the impact of the change in accounting principle was a reduction of
$88.5 million
in both revenues and direct operating expenses for the year ended December 31, 2018, with no impact on reported net income.
Contract Balances
The Company records deferred revenues when cash payments are received or due in advance of its performance. The increase in the deferred revenue balance for 2018 is primarily driven by
$52.9 million
of cash payments received in the current year for which we have not yet satisfied the performance obligations, that were offset by
$45.6 million
of revenues recognized that were included in the deferred revenue balance as of December 31, 2017.
Disaggregation of Revenues
The following table presents the Company's revenues disaggregated by segment and region. The Company believes disaggregation by segment and region best depicts how the nature, amount, timing, and uncertainty of revenue and cash flows are affected by economic factors. The disaggregation of revenues by segment and region is based on management's assessment of segment performance together with allocation of financial resources, both capital and operating support costs, on a segment and regional level. Both segments and regions benefit from synergies achieved through concentration of operations and are influenced by macro-economic, regulatory and political factors in the respective segment and region. The Company recognizes foreign exchange revenues from derivative instruments in its HiFX operations in accordance with ASC Topic 815 and not ASC Topic 606. These revenues are not significant to the Company's consolidated revenues and are included in the following tables.
82
|
For the Year Ended December 31, 2018
|
|||||||||||||||
|
(in thousands)
|
EFT
Processing
|
epay
|
Money
Transfer
|
Total
|
|||||||||||
|
Europe
|
$
|
608,993
|
|
$
|
491,282
|
|
$
|
328,592
|
|
$
|
1,428,867
|
|
|||
|
North America
|
32,306
|
|
165,930
|
|
569,005
|
|
767,241
|
|
|||||||
|
Asia Pacific
|
112,294
|
|
71,242
|
|
127,057
|
|
310,593
|
|
|||||||
|
Other
|
58
|
|
15,330
|
|
18,308
|
|
33,696
|
|
|||||||
|
Eliminations
|
—
|
|
—
|
|
(3,768
|
)
|
|||||||||
|
Total
|
$
|
753,651
|
|
$
|
743,784
|
|
$
|
1,042,962
|
|
$
|
2,536,629
|
|
|||
|
For the Year Ended December 31, 2017 (1)
|
|||||||||||||||
|
(in thousands)
|
EFT
Processing
|
epay
|
Money
Transfer
|
Total
|
|||||||||||
|
Europe
|
$
|
501,161
|
|
$
|
561,232
|
|
$
|
262,280
|
|
$
|
1,324,673
|
|
|||
|
North America
|
31,469
|
|
63,148
|
|
513,868
|
|
608,485
|
|
|||||||
|
Asia Pacific
|
101,787
|
|
91,516
|
|
101,005
|
|
294,308
|
|
|||||||
|
Other
|
142
|
|
18,102
|
|
9,705
|
|
27,949
|
|
|||||||
|
Eliminations
|
—
|
|
—
|
|
—
|
|
(2,993
|
)
|
|||||||
|
Total
|
$
|
634,559
|
|
$
|
733,998
|
|
$
|
886,858
|
|
$
|
2,252,422
|
|
|||
|
(1) As noted above, prior period amounts have not been adjusted under the modified retrospective method.
|
|||||||||||||||
|
For the Year Ended December 31, 2016 (1)
|
|||||||||||||||
|
(in thousands)
|
EFT
Processing |
epay
|
Money
Transfer |
Total
|
|||||||||||
|
Europe
|
$
|
343,932
|
|
$
|
498,668
|
|
$
|
236,000
|
|
$
|
1,078,600
|
|
|||
|
North America
|
28,070
|
|
81,983
|
|
470,220
|
|
580,273
|
|
|||||||
|
Asia Pacific
|
92,252
|
|
95,524
|
|
89,787
|
|
277,563
|
|
|||||||
|
Other
|
—
|
|
17,811
|
|
5,912
|
|
23,723
|
|
|||||||
|
Eliminations
|
—
|
|
—
|
|
—
|
|
(1,544
|
)
|
|||||||
|
Total
|
$
|
464,254
|
|
$
|
693,986
|
|
$
|
801,919
|
|
$
|
1,958,615
|
|
|||
|
(1) As noted above, prior period amounts have not been adjusted under the modified retrospective method.
|
|||||||||||||||
In March 2016, the FASB issued ASU 2016-04, Recognition of Breakage for Certain Prepaid Stored-Value Products. The new standard specifies that liabilities within its scope are considered to be financial liabilities, and amends the guidance in ASC 405-20, Extinguishments of Liabilities, by directing entities to derecognize prepaid stored-value product liabilities based on expected breakage in proportion to the pattern of rights expected to be exercised by the consumer. Derecognition for breakage is permitted only to the extent that it is probable that a significant reversal of recognized breakage will not subsequently occur. The new standard is consistent with the breakage guidance in Topic 606. The Company adopted this ASU as of January 1, 2018 along with Topic 606. The adoption of this standard did not have a significant impact on the Company's consolidated financial statements and related disclosures.
In August 2016, the FASB issued an accounting standard classified under FASB ASC Topic 230,
“Statement of Cash Flows”
. This accounting standard provides guidance on eight specific cash flow issues. Subsequently, the FASB issued amendments to this accounting standard that required companies to include restricted cash and restricted cash equivalents with cash and cash equivalents when reconciling the statement of cash flows.
The Company adopted these standards as of January 1, 2018. The adoption of these accounting standards resulted in a decrease of
$5.0 million
for
2017
and an increase of
$23.3 million
for
2016
in net cash provided by operating activities. As of December 31, 2018, the Company had
$76.6 million
of restricted cash consisting of restricted cash held in trust and/or cash held on behalf of others and cash collateral on bank credit arrangements. Cash held in trust and/or cash held on behalf of others is in
83
connection with the administration of the customer collection and vendor remittance activities by certain subsidiaries within the Company’s epay and EFT Processing Segments. Amounts collected on behalf of certain mobile phone operators and/or merchants are deposited into a restricted cash account. The bank credit arrangements primarily represent cash collateral on deposit with commercial banks to cover guarantees.
In February 2016, the FASB issued ASU 2016-02,
Leases
(Topic 842)
, which will update the existing guidance on accounting for leases and require new qualitative and quantitative disclosures about the Company’s leasing activities. Topic 842 was subsequently amended by ASU No. 2018-01, Land Easement Practical Expedient for Transition to Topic 842; ASU No. 2018-10, Codification Improvements to Topic 842, Leases; ASU No. 2018-11, Targeted Improvements; and ASU No. 2018-20, Narrow Scope Improvements for Lessors. The new standard requires lessees to account for all leases on the balance sheet, except for certain short-term leases that have a maximum possible lease term of 12 months. The accounting for lessors is largely unchanged from the previous accounting guidance, except for leverage lease accounting which is not permitted for leases entered into or modified after the effective date of the new standard.
The new standard is effective for annual periods beginning after December 15, 2018 and interim periods within those annual periods, with early adoption permitted. A modified retrospective approach is required, applying the new standard to all leases existing at the date of initial application. An entity may choose to use either (1) its effective date or (2) the beginning of the earliest comparative period presented in the financial statements as its date of initial application. The Company will adopt the new standard on January 1, 2019 and use the effective date as the date of initial application. Consequently, financial information will not be updated and the disclosures required under the new standard will not be provided for dates and periods before January 1, 2019.
The new standard provides a number of optional practical expedients in transition. The Company will elect the "package of practical expedients," which permits the Company not to reassess under the new standard our prior conclusions about lease identification, lease classification and initial direct costs. The Company will also elect to combine lease and non-lease components and to include short-term leases with an initial term of 12 months or less on the balance sheet. The Company estimates approximately
$375 million
would be recognized as total right-of-use assets and total lease liabilities on its consolidated balance sheet as of January 1, 2019. Other than as disclosed, the Company does not expect the new standard to have a material impact on its results of operations or its cash flows.
In June 2016, the FASB issued ASU 2016-13,
Financial Instruments - Credit Losses (Topic 326)
, which requires entities to measure all expected credit losses for financial assets held at the reporting date based on historical experience, current conditions, and reasonable and supportable forecasts. Topic 326 was subsequently amended by ASU 2018-19. This replaces the existing incurred loss model and is applicable to the measurement of credit losses on financial assets measured at amortized cost. The Company is continuing to assess the potential impacts of the standard.
(4) Stockholders' Equity
Earnings Per Share
Basic earnings per share has been computed by dividing earnings available to common stockholders by the weighted average number of common shares outstanding during the respective period. Diluted earnings per share has been computed by dividing earnings available to common stockholders by the weighted average shares outstanding during the respective period, after adjusting for the potential dilution of options to purchase the Company's Common Stock, assumed vesting of restricted stock and the assumed conversion of the Company's convertible debt.
The following table provides the computation of diluted weighted average number of common shares outstanding:
|
|
Year Ended December 31,
|
||||||||
|
|
2018
|
2017
|
2016
|
||||||
|
Computation of diluted weighted average shares outstanding:
|
|||||||||
|
Basic weighted average shares outstanding
|
51,487,557
|
|
52,523,272
|
|
52,276,951
|
|
|||
|
Incremental shares from assumed exercise of stock options and vesting of restricted stock
|
1,499,713
|
|
1,793,375
|
|
1,705,224
|
|
|||
|
Incremental shares from assumed conversion of convertible debentures
|
1,640,477
|
|
799,680
|
|
18,904
|
|
|||
|
Diluted weighted average shares outstanding
|
54,627,747
|
|
55,116,327
|
|
54,001,079
|
|
|||
84
The table includes all stock options and restricted stock that are dilutive to the Company's weighted average common shares outstanding during the period. The calculation of diluted earnings per share excludes stock options or shares of restricted stock that are anti-dilutive to the Company's weighted average common shares outstanding for the years ended
December 31, 2018
,
2017
and
2016
of approximately
458,000
,
798,000
and
616,000
, respectively.
During
2018
,
2017
and
2016
, the Company had convertible notes outstanding that, if converted, could have a potentially dilutive effect on its Common Stock. The Company's convertible notes have settlement features requiring the Company, upon conversion, to settle the principal amount of the debt and the conversion value in excess of the principal value ("conversion premium") for cash or shares of the Company's Common Stock, at the Company's option. At issuance, the Company stated its intent to settle any conversion of these notes by paying cash for the principal value and issuing Common Stock for any conversion premium. Accordingly, the convertible notes are included in the calculation of diluted earnings per share if their inclusion is dilutive. The convertible notes would only have a dilutive effect if the market price per share of Common Stock exceeds the conversion price of
$72.18
per share and the dilutive effect increases the more the market price exceeds the conversion price. As of
December 31, 2018
, and currently, the Company maintains the intent and ability to settle any conversion as stated. As of December 31, 2018, 2017 and 2016, the stock prices exceeded the conversion price and these notes were dilutive to earnings per share. Further, as a result of the share prices increasing from $72.43 as of December 31, 2016 to $84.27 as of December 31, 2017 and to $102.38 as December 31, 2018, there were increases in dilutive shares from the assumed conversion of convertible notes. Therefore, according to ASC Topic 260,
Earnings per Share
(“ASC 260”)
,
the dilutive effect of the assumed conversion of the debentures was
1,640,477
,
799,680
and
18,904
shares for the years ended
December 31, 2018
,
2017
and
2016
, respectively. See Note 10, Debt Obligations, to the Consolidated Financial Statements for more information about the convertible notes.
Share repurchases
The Company's Board of Directors has authorized a stock repurchase program ("Repurchase Program"), allowing Euronet to repurchase up to
$375 million
in value or
10.0 million
shares of stock through March 31, 2020. Repurchases under the Repurchase Program may take place in the open market or in privately negotiated transactions, including derivative transactions, and may be made under a Rule 10b5-1 plan. For the year ended
December 31, 2018
, the Company repurchased
$175.0 million
in value of Euronet Common Stock under the Repurchase Program. No repurchases were made during 2017.
In January 2016, the Company announced that its Board of Directors authorized a stock repurchase program ("2016 Program") allowing the Company to repurchase up to
$100 million
in value or
5.0 million
shares of its common stock through December 10, 2017. For the year end December 31, 2016, the Company repurchased
1.1 million
shares at a weighted average purchase price of
$65.74
for a total value of
$75.6 million
under the 2016 Program.
Preferred Stock
The Company has the authority to issue up to 10 million shares of preferred stock, of which no shares are currently issued or outstanding.
Accumulated other comprehensive loss
As of
December 31, 2018
and
2017
, accumulated other comprehensive loss consists entirely of foreign currency translation adjustments. The Company recorded a foreign currency translation loss of
$56.7 million
, a gain of
$116.4 million
and a loss of
$45.2 million
for the years ended
December 31, 2018
,
2017
, and
2016
, respectively. There were no reclassifications of foreign currency translation into the Consolidated Statements of Income for the years ended
December 31, 2018
,
2017
, and
2016
.
Dividends
No dividends was paid on any class of the Company's stock during 2018, 2017, and 2016.
(5) Acquisitions
In accordance with ASC 805, the Company allocates the purchase price of its acquisitions to the tangible assets, liabilities and intangible assets acquired based on fair values. Any excess purchase price over those fair values is recorded as goodwill. The fair value assigned to intangible assets acquired is supported by valuations using estimates and assumptions provided by management. For certain large acquisitions, management engages an appraiser to assist in the valuation process.
The Company completed the acquisitions of two small European businesses for an immaterial amount of cash consideration, completing one acquisition in the first quarter of 2018 and completing the other acquisition in the second quarter of 2018. The acquisitions have been accounted for as business combinations in accordance with U.S. GAAP and the results of operations have been included from the respective dates of acquisition in the EFT Processing Segment. There were no acquisitions in 2017.
85
(6) Restricted Cash
The restricted cash balances as of
December 31, 2018
and
2017
were as follows:
|
As of December 31,
|
||||||||
|
(in thousands)
|
2018
|
2017
|
||||||
|
Cash held in trust and/or cash held on behalf of others
|
$
|
67,163
|
|
$
|
67,541
|
|
||
|
Collateral on bank credit arrangements and other
|
9,432
|
|
13,833
|
|
||||
|
Total
|
$
|
76,595
|
|
$
|
81,374
|
|
||
Cash held in trust and/or cash held on behalf of others is in connection with the administration of the customer collection and vendor remittance activities by certain subsidiaries within the Company's epay and EFT Processing Segments. Amounts collected on behalf of certain mobile phone operators and/or merchants are deposited into a restricted cash account. The bank credit arrangements primarily represent cash collateral on deposit with commercial banks to cover guarantees.
(7) Property and Equipment, Net
The components of property and equipment, net of accumulated depreciation and amortization as of
December 31, 2018
and
2017
are as follows:
|
As of December 31,
|
||||||||
|
(in thousands)
|
2018
|
2017
|
||||||
|
ATMs
|
$
|
378,009
|
|
$
|
329,159
|
|
||
|
POS terminals
|
36,521
|
|
41,218
|
|
||||
|
Vehicles and office equipment
|
66,117
|
|
68,231
|
|
||||
|
Computers and software
|
183,150
|
|
168,567
|
|
||||
|
Land and buildings
|
1,252
|
|
1,256
|
|
||||
|
665,049
|
|
608,431
|
|
|||||
|
Less accumulated depreciation and amortization
|
(373,180
|
)
|
(340,128
|
)
|
||||
|
Total
|
$
|
291,869
|
|
$
|
268,303
|
|
||
Depreciation and amortization expense related to property and equipment, including property and equipment recorded under capital leases, for the years ended
December 31, 2018
,
2017
and
2016
was
$75.1 million
,
$63.4 million
and
$48.5 million
, respectively.
(8) Goodwill and Acquired Intangible Assets, Net
Goodwill represents the excess of the purchase price of the acquired business over the estimated fair value of the underlying net tangible and intangible assets acquired. The following table summarizes intangible assets as of
December 31, 2018
and
2017
:
|
As of December 31, 2018
|
As of December 31, 2017
|
|||||||||||||||
|
(in thousands)
|
Gross Carrying
Amount
|
Accumulated
Amortization
|
Gross Carrying
Amount
|
Accumulated
Amortization
|
||||||||||||
|
Customer relationships
|
$
|
199,581
|
|
$
|
(133,863
|
)
|
$
|
207,133
|
|
$
|
(124,967
|
)
|
||||
|
Trademarks and trade names
|
45,233
|
|
(25,837
|
)
|
56,273
|
|
(25,768
|
)
|
||||||||
|
Software
|
58,515
|
|
(29,420
|
)
|
62,384
|
|
(25,142
|
)
|
||||||||
|
Non-compete agreements
|
2,076
|
|
(1,800
|
)
|
3,895
|
|
(3,265
|
)
|
||||||||
|
Total
|
$
|
305,405
|
|
$
|
(190,920
|
)
|
$
|
329,685
|
|
$
|
(179,142
|
)
|
||||
86
The following table summarizes the goodwill and amortizable intangible assets activity for the years ended
December 31, 2018
and
2017
:
|
(in thousands)
|
Acquired
Intangible
Assets
|
Goodwill
|
Total
Intangible
Assets
|
|||||||||
|
Balance as of January 1, 2017
|
$
|
165,331
|
|
$
|
689,713
|
|
$
|
855,044
|
|
|||
|
Increases (decreases):
|
|
|
|
|
|
|
||||||
|
Impairment
|
(2,286
|
)
|
(31,770
|
)
|
(34,056
|
)
|
||||||
|
Amortization
|
(24,527
|
)
|
—
|
|
(24,527
|
)
|
||||||
|
Other (primarily changes in foreign currency exchange rates)
|
12,025
|
|
59,443
|
|
71,468
|
|
||||||
|
Balance as of December 31, 2017
|
150,543
|
|
717,386
|
|
867,929
|
|
||||||
|
Increases (decreases):
|
|
|
|
|||||||||
|
Acquisitions
|
—
|
|
20,742
|
|
20,742
|
|
||||||
|
Impairment
|
(7,049
|
)
|
—
|
|
(7,049
|
)
|
||||||
|
Amortization
|
(22,562
|
)
|
—
|
|
(22,562
|
)
|
||||||
|
Other (primarily changes in foreign currency exchange rates)
|
(6,447
|
)
|
(33,931
|
)
|
(40,378
|
)
|
||||||
|
Balance as of December 31, 2018
|
$
|
114,485
|
|
$
|
704,197
|
|
$
|
818,682
|
|
|||
The Company performs its annual goodwill impairment test during the fourth quarter of each year. The annual goodwill impairment test completed during the fourth quarter of
2018
resulted in no impairment charges. During the fourth quarter of 2018, the Company recorded a
$7.0 million
non-cash impairment charge for acquired intangible assets, specifically the HiFX trade name, related to rebranding the HiFX business to xe.
Of the total goodwill balance of
$704.2 million
as of
December 31, 2018
,
$467.6 million
relates to the Money Transfer Segment,
$130.9 million
relates to the epay Segment and the remaining
$105.7 million
relates to the EFT Processing Segment. Amortization expense for intangible assets with finite lives was
$22.6 million
,
$24.5 million
and
$25.5 million
for the years ended
December 31, 2018
,
2017
and
2016
, respectively. Estimated annual amortization expense, before income taxes, on intangible assets with finite lives as of
December 31, 2018
, is expected to total
$20.5 million
for
2019
,
$19.7 million
for
2020
,
$18.8 million
for
2021
,
$17.8 million
for
2022
and
$13.1 million
for
2023
.
(9) Accrued Expenses and Other Current Liabilities
The balances as of
December 31, 2018
and
2017
were as follows:
|
As of December 31,
|
||||||||
|
(in thousands)
|
2018
|
2017
|
||||||
|
Money transfer settlement obligations
|
$
|
310,710
|
|
$
|
343,613
|
|
||
|
Accrued expenses
|
293,864
|
|
301,390
|
|
||||
|
Accrued amounts due to mobile operators and other content providers
|
65,878
|
|
92,291
|
|
||||
|
Derivative liabilities
|
36,102
|
|
22,495
|
|
||||
|
Total
|
$
|
706,554
|
|
$
|
759,789
|
|
||
87
(10) Debt Obligations
Debt obligations consist of the following as of
December 31, 2018
and
2017
:
|
As of December 31,
|
||||||||
|
(in thousands)
|
2018
|
2017
|
||||||
|
Credit Facility:
|
||||||||
|
Revolving credit agreements
|
$
|
215,725
|
|
$
|
3,000
|
|
||
|
Term loan, due 2019
|
—
|
|
51,094
|
|
||||
|
215,725
|
|
54,094
|
|
|||||
|
Convertible Debt:
|
||||||||
|
1.50% convertible notes, unsecured, due 2044
|
379,859
|
|
369,259
|
|
||||
|
Other obligations
|
38,513
|
|
27,763
|
|
||||
|
Total debt obligations
|
$
|
634,097
|
|
$
|
451,116
|
|
||
|
Unamortized debt issuance costs
|
(6,298
|
)
|
(5,816
|
)
|
||||
|
Carrying value of debt
|
$
|
627,799
|
|
$
|
445,300
|
|
||
|
Short-term debt obligations and current maturities of long-term debt obligations
|
(38,017
|
)
|
(41,288
|
)
|
||||
|
Long-term debt obligations
|
$
|
589,782
|
|
$
|
404,012
|
|
||
As of
December 31, 2018
, aggregate annual maturities of long-term debt are
$0.5 million
in 2019,
$401.5 million
in
2020
, none in
2021
and 2022,
$215.7 million
in 2023, and none thereafter. This maturity schedule reflects the revolving credit facility maturing in 2023 and the convertible notes maturing in 2020, coinciding with the terms of the initial put option by holders of the notes.
Credit Facility
In the early fourth quarter of 2018, the Company early retired the senior secured revolving bank credit facility (the "Credit Facility") with a syndicate of financial institutions. The Credit Facility was subsequently replaced by a new unsecured credit agreement for
$1.0 billion
that expires on October 17, 2023. Fees and interest on borrowings are based upon the Company's corporate credit rating and are based, in the case of letter of credit fees, on a margin , and in the case of interest, on a margin over London Inter-Bank Offered Rate (“LIBOR”) or a margin over the base rate, as selected by the Company, with the applicable margin ranging from
1.125%
to
2.0%
(or
0.175%
to
1.0%
for base rate loans). The new unsecured credit agreement allows for borrowings in Australian Dollars, British Pounds Sterling, Canadian Dollars, Czech Koruna, Danish Krone, Euros, Hungarian Forints, Japanese Yen, New Zealand Dollars, Norwegian Krone, Polish Zlotys, Swedish Krona, Swiss Francs, and U.S. Dollars. The revolving credit facility contains a
$200 million
sublimit for the issuance of letters of credit, a
$50 million
sublimit for U.S. Dollar swingline loans, and a
$90 million
sublimit for certain foreign currencies swingline loans.
The retired Credit Facility provided an aggregate amount of
$675 million
, consisting of a
$590 million
five-year revolving credit facility, a
$10 million
five-year India revolving credit facility and a
$75 million
five-year term loan. Fees and interest on borrowings varied based upon the Company's consolidated total leverage ratio (as defined in the amended and restated credit agreement) and were based, in the case of letter of credit fees, on a margin, and in the case of interest, on a margin over LIBOR or a margin over the base rate, as selected by the Company, with the applicable margin ranging from
1.375%
to
2.375%
(or
0.375%
to
1.375%
for base rate loans).
The base rate is the highest of (i) the Bank of America prime rate, (ii) the Federal Funds rate plus 0.50% or (iii) the Fixed LIBOR rate plus 1.00%.
The term loan was subject to scheduled quarterly amortization payments, as set forth in the amended and restated credit agreement.
The weighted average interest rates of the Company's borrowing under the unsecured credit agreement were
3.1%
as of
December 31, 2018
, and
2.9%
and
2.8%
for the retired term loan and Credit Facility, respectively, as of
December 31, 2017
.
As of
December 31, 2018
and
2017
, the Company had stand-by letters of credit/bank guarantees outstanding against the revolving credit facilities of
$47.1 million
and
$57.3 million
, respectively. Stand-by letters of credit/bank guarantees reduce the Company's borrowing capacity under the revolving credit facility and are generally used to secure trade credit and performance obligations. As of
December 31, 2018
and
2017
, the stand-by letters of credit interest charges were
1.1%
and
1.4%
per annum, respectively.
88
The unsecured credit agreement contains customary affirmative and negative covenants, events of default and financial covenants, including: (i) as of the end of each fiscal quarter ended on March 31, September 30 and December 31, a Consolidated Total Leverage Ratio not to be greater than
3.5
to1.0; (ii) as of the end of each fiscal quarter ended on June 30, a Consolidated Total Leverage Ratio not to be greater than
4.0
to1.0; provided that, not more than two times prior to the expiration date, that a Material Acquisition has been consummated, for any period of four consecutive fiscal quarters following such Material Acquisition, the Consolidated Total Leverage Ratio will be not greater than 4.0 to1.0 for fiscal quarters ended on March 31, September 30 and December 31 and not greater than 4.5 to1.0 for fiscal quarters ended on June 30; provided, further, that following such four consecutive fiscal quarters for which the maximum Consolidated Total Leverage Ratio is increased, the maximum Consolidated Total Leverage Ratio shall revert to the levels set forth in clauses (i) and (ii) above for not fewer than two fiscal quarters before a subsequent Increase Notice is delivered to the syndicate of financial institutions; and (iii) a Consolidated Interest Coverage Ratio not less than
4.0
to 1.0. Subject to meeting certain leverage ratio and liquidity requirements as contained in the unsecured credit agreement, the Company is permitted to pay dividends, repurchase common stock and repurchase subordinated debt.
The Company and certain subsidiaries have guaranteed the repayment of obligations under the credit agreement.
Convertible Debt
On October 30, 2014, the Company completed the sale of
$402.5 million
of Convertible Senior Notes due 2044 (“Convertible Notes”). The Convertible Notes have an interest rate of
1.5%
per annum payable semi-annually in April and October, and are convertible into shares of Euronet Common Stock at a conversion price of approximately
$72.18
per share if certain conditions are met (relating to the closing prices of Euronet Common Stock exceeding certain thresholds for specified periods). Holders of the Convertible Notes have the option to require the Company to purchase their notes at par on October 1, 2020, and have additional options to require the Company to purchase their notes at par on October 1, 2024, 2029, 2034, and 2039, or upon a change in control of the Company. In connection with the issuance of the Convertible Notes, the Company recorded
$10.7 million
in debt issuance costs, which are being amortized through October 1, 2020.
Holders may convert all or any portion of their Convertible Notes at their option at any time prior to October 1, 2044 only under the following circumstances: (1) during any calendar quarter (and only during such calendar quarter), if the closing sale price of the common stock for at least 20 trading days (whether or not consecutive) during a period of 30 consecutive trading days ending on the last trading day of the immediately preceding calendar quarter is greater than 130% of the conversion price on each applicable trading day; (2) during the five consecutive business day period after any ten consecutive trading day period (the measurement period) in which the trading price for the Convertible Notes for each trading day of the measurement period was less than 98% of the product of the closing sale price of the Company's common stock and the conversion rate on each such trading day; or (3) upon the occurrence of specified corporate events. If the holders exercise their option to convert, the Company is required to deliver cash or shares of the Company's Common Stock, at the Company's option, to satisfy the principal amount and the conversion premium. As of
September 30, 2018
, the conversion threshold in clause (1) of the preceding sentence had been met and the Convertible Notes became convertible at the holders' option during the fourth quarter of 2018. During the fourth quarter of 2018,
$1.0 million
principal value of Convertible Notes were converted by holders. As of December 31, 2018, the conversion threshold was met and the Convertible Notes continue to be convertible at the holders' option during the first quarter of 2019.
In accordance with ASC 470-20-30-27, proceeds from the issuance of convertible debt is allocated between debt and equity components so that debt is discounted to reflect the Company's nonconvertible debt borrowing rate. ASC 470-20-35-13 requires the debt discount to be amortized over the period the convertible debt is expected to be outstanding as additional non-cash interest expense. The allocation resulted in an increase to additional paid-in capital of
$66.1 million
.
Contractual interest expense was
$6.0 million
for each of the years ended
December 31, 2018
,
2017
and
2016
. Discount accretion was
$11.5 million
,
$11.0 million
and
$10.4 million
for the years ended
December 31, 2018
,
2017
and
2016
, respectively. As of
December 31, 2018
and
2017
, the unamortized discounts were
$21.6 million
and
$33.2 million
, respectively. The discount will be amortized through October 1, 2020. The effective interest rate was
4.7%
for the years ended
December 31, 2018
and
2017
.
Other obligations
Certain of the Company's subsidiaries have available lines of credit and overdraft credit facilities that generally provide for short-term borrowings that are used from time to time for working capital purposes. As of
December 31, 2018
and
2017
, borrowings under these arrangements were
$38.5 million
and
$27.8 million
, respectively. As of
December 31, 2018
, there was
$38.0 million
due in 2019 under these other obligation arrangements.
89
(11) Derivative Instruments and Hedging Activities
The Company is exposed to foreign currency exchange risk resulting from (i) the collection of funds or the settlement of money transfer transactions in currencies other than the U.S. dollar, (ii) derivative contracts written to its customers in connection with providing cross-currency money transfer services and (iii) certain foreign currency denominated other asset and liability positions. The Company enters into foreign currency derivative contracts, primarily foreign currency forwards and cross-currency swaps, to minimize its exposure related to fluctuations in foreign currency exchange rates. As a matter of Company policy, the derivative instruments used in these activities are economic hedges and are not designated as hedges under ASC 815
,
primarily
due to either the relatively short duration of the contract term or the effects of fluctuations in currency exchange rates are reflected concurrently in earnings for both the derivative instrument and the transaction and have an offsetting effect.
Foreign currency exchange contracts - Ria Operations and Corporate
In the United States, the Company uses short-duration foreign currency forward contracts, generally with maturities up to
14 days
, to offset the fluctuation in foreign currency exchange rates on the collection of money transfer funds between initiation of a transaction and its settlement. Due to the short duration of these contracts and the Company’s credit profile, the Company is generally not required to post collateral with respect to these foreign currency forward contracts. Most derivative contracts executed with counterparties in the U.S. are governed by an International Swaps and Derivatives Association agreement that includes standard netting arrangements; therefore, asset and liability positions from forward contracts and all other foreign exchange transactions with the same counterparty are net settled upon maturity. As of
December 31, 2018
, the Company had foreign currency forward contracts outstanding in the U.S. with a notional value of
$251.1 million
, primarily in Australian dollars, Canadian dollars, British pounds, euros and Mexican pesos.
In addition, the Company uses forward contracts, typically with maturities from a few days to less than one year, to offset
foreign exchange rate fluctuations on certain short-term borrowings that are payable in currencies other than the U.S dollar. As of
December 31, 2018
, the Company had foreign currency forward contracts outstanding with a notional value of
$64.3 million
, primarily in euros.
Foreign currency exchange contracts - HiFX Operations
HiFX, writes derivative instruments, primarily foreign currency forward contracts and cross-currency swaps, mostly with counterparties comprised of individuals and small-to-medium size businesses and derives a currency margin from this activity as part of its operations. HiFX aggregates its foreign currency exposures arising from customer contracts and hedges the resulting net currency risks by entering into offsetting contracts with established financial institution counterparties. Foreign exchange revenues from HiFX's total portfolio of positions were
$69.2 million
,
$72.5 million
and
$66.0 million
for the years ended
December 31, 2018
,
2017
and
2016
, respectively. All of the derivative contracts used in the Company' s HiFX operations are economic hedges and are not designated as hedges under ASC 815
.
The duration of these derivative contracts is generally less than one year.
The fair value of HiFX's total portfolio of positions can change significantly from period to period based on, among other factors, market movements and changes in customer contract positions. HiFX manages counterparty credit risk (the risk that counterparties will default and not make payments according to the terms of the agreements) on an individual counterparty basis. It mitigates this risk by entering into contracts with collateral posting requirements and/or by performing financial assessments prior to contract execution, conducting periodic evaluations of counterparty performance and maintaining a diverse portfolio of qualified counterparties. HiFX does not expect any significant losses from counterparty defaults.
The aggregate equivalent U.S. dollar notional amounts of foreign currency derivative customer contracts held by the Company in its HiFX operations as of
December 31, 2018
was approximately
$1.8 billion
. The significant majority of customer contracts are written in major currencies such as the euro, U.S. dollar, British pound, Australian dollar and New Zealand dollar.
90
Balance Sheet Presentation
The following table summarizes the fair value of the derivative instruments as recorded in the Consolidated Balance Sheets as of the dates below:
|
Asset Derivatives
|
Liability Derivatives
|
|||||||||||||||||||
|
Fair Value
|
Fair Value
|
|||||||||||||||||||
|
(in thousands)
|
Balance Sheet Location
|
December 31, 2018
|
December 31, 2017
|
Balance Sheet Location
|
December 31, 2018
|
December 31, 2017
|
||||||||||||||
|
Derivatives not designated as hedging instruments
|
||||||||||||||||||||
|
Foreign currency exchange contracts
|
Other current assets
|
$
|
44,637
|
|
$
|
36,574
|
|
Other current liabilities
|
$
|
(36,102
|
)
|
$
|
(22,495
|
)
|
||||||
The following tables summarize the gross and net fair value of derivative assets and liabilities as of
December 31, 2018
and
2017
(in thousands):
Offsetting of Derivative Assets
|
Gross Amounts Not Offset in the Consolidated Balance Sheet
|
||||||||||||||||||||||||
|
As of December 31, 2018
|
Gross Amounts of Recognized Assets
|
Gross Amounts Offset in the Consolidated Balance Sheet
|
Net Amounts Presented in the Consolidated Balance Sheet
|
Financial Instruments
|
Cash Collateral Received
|
Net Amounts
|
||||||||||||||||||
|
Derivatives subject to a master netting arrangement or similar agreement
|
$
|
44,637
|
|
$
|
—
|
|
$
|
44,637
|
|
$
|
(25,187
|
)
|
$
|
(9,918
|
)
|
$
|
9,532
|
|
||||||
|
As of December 31, 2017
|
||||||||||||||||||||||||
|
Derivatives subject to a master netting arrangement or similar agreement
|
$
|
36,574
|
|
$
|
—
|
|
$
|
36,574
|
|
$
|
(15,050
|
)
|
$
|
(7,603
|
)
|
$
|
13,921
|
|
||||||
Offsetting of Derivative Liabilities
|
Gross Amounts Not Offset in the Consolidated Balance Sheet
|
||||||||||||||||||||||||
|
As of December 31, 2018
|
Gross Amounts of Recognized Liabilities
|
Gross Amounts Offset in the Consolidated Balance Sheet
|
Net Amounts Presented in the Consolidated Balance Sheet
|
Financial Instruments
|
Cash Collateral Paid
|
Net Amounts
|
||||||||||||||||||
|
Derivatives subject to a master netting arrangement or similar agreement
|
$
|
(36,102
|
)
|
$
|
—
|
|
$
|
(36,102
|
)
|
$
|
25,187
|
|
$
|
2,048
|
|
$
|
(8,867
|
)
|
||||||
|
As of December 31, 2017
|
||||||||||||||||||||||||
|
Derivatives subject to a master netting arrangement or similar agreement
|
$
|
(22,495
|
)
|
$
|
—
|
|
$
|
(22,495
|
)
|
$
|
15,050
|
|
$
|
2,716
|
|
$
|
(4,729
|
)
|
||||||
91
Income Statement Presentation
The following tables summarize the location and amount of gains on derivatives in the Consolidated Statements of Income for the years ended
December 31, 2018
,
2017
and
2016
:
|
Amount of Gain Recognized in Income on Derivative Contracts (a)
|
||||||||||||||
|
Location of Gain (Loss) Recognized in Income on Derivative Contracts
|
Year Ended December 31,
|
|||||||||||||
|
(in thousands)
|
2018
|
2017
|
2016
|
|||||||||||
|
Foreign currency exchange contracts - Ria Operations
|
Foreign currency exchange gain, net
|
$
|
173
|
|
$
|
175
|
|
$
|
143
|
|
||||
(a) The Company enters into derivative contracts such as foreign currency exchange forwards and cross-currency swaps as part of its HiFX operations. These derivative contracts are excluded from this table as they are part of the broader disclosure of foreign currency exchange revenues for this business discussed above.
See Note 17, Financial Instruments and Fair Value Measurements, for the determination of the fair values of derivatives.
(12) Leases
Capital leases
The Company leases certain of its ATMs, computer equipment and vehicles under capital lease agreements that expire between the years of
2019
and
2023
and bear interest at rates between
0.8%
and
13.0%
. The lessors for these leases hold a security interest in the equipment leased under the respective capital lease agreements. Lease installments are paid on a monthly, quarterly or semi-annual basis. Certain leases contain a bargain purchase option at the conclusion of the lease period.
The gross amount of the assets and related accumulated amortization recorded within property and equipment and subject to capital leases as of
December 31, 2018
and
2017
were as follows:
|
As of December 31,
|
||||||||
|
(in thousands)
|
2018
|
2017
|
||||||
|
ATMs
|
$
|
28,370
|
|
$
|
23,969
|
|
||
|
Other
|
2,248
|
|
2,268
|
|
||||
|
Subtotal
|
30,618
|
|
26,237
|
|
||||
|
Less accumulated amortization
|
(11,731
|
)
|
(9,395
|
)
|
||||
|
Total
|
$
|
18,887
|
|
$
|
16,842
|
|
||
Non-cash financing and investing activities for the years ended
December 31, 2018
,
2017
and
2016
represented capital lease obligations of
$6.9 million
,
$7.9 million
and
$5.8 million
, respectively, incurred when the Company entered into leases primarily for new ATMs, to upgrade ATMs or for data center computer equipment.
Operating leases
The Company has non-cancelable operating leases that expire between the years of
2019
and
2033
. Certain of these leases contain renewal options and escalation provisions. The Company recognizes rent expense under the straight-line method over the term of the lease. Rent expense for the years ended
December 31, 2018
,
2017
and
2016
amounted to
$132.8 million
,
$105.0 million
and
$80.0 million
, respectively.
92
Future minimum lease payments
Future minimum lease payments under the capital leases and the non-cancelable operating leases (with initial lease terms in excess of one year) as of
December 31, 2018
are:
|
(in thousands)
|
Capital
Leases
|
Operating
Leases
|
||||||
|
Year ending December 31,
|
||||||||
|
2019
|
$
|
6,150
|
|
$
|
80,803
|
|
||
|
2020
|
4,583
|
|
65,590
|
|
||||
|
2021
|
3,240
|
|
49,052
|
|
||||
|
2022
|
944
|
|
37,823
|
|
||||
|
2023
|
60
|
|
30,192
|
|
||||
|
Thereafter
|
—
|
|
48,191
|
|
||||
|
Total minimum lease payments
|
14,977
|
|
$
|
311,651
|
|
|||
|
Less amounts representing interest
|
(1,320
|
)
|
||||||
|
Present value of net minimum capital lease payments
|
13,657
|
|
||||||
|
Less current portion of obligations under capital leases
|
(5,458
|
)
|
||||||
|
Obligations under capital leases, less current portion
|
$
|
8,199
|
|
|||||
(13) Income Taxes
Tax Cuts and Jobs Act of 2017
We calculate our provision for federal, state and international income taxes based on current tax law. On December 22, 2017, the U.S. enacted into law what is informally called the Tax Cuts and Jobs Act of 2017 ("U.S. Tax Reform"). The most significant provisions of U.S. Tax Reform are the transition tax on previously undistributed foreign earnings of foreign subsidiaries, the reduction of the U.S. corporate statutory income tax rate from 35% to 21% beginning on January 1, 2018, and new taxes on certain foreign sourced earnings.
Under the accounting rules, companies are required to recognize the effects of changes in tax laws and tax rates on deferred tax assets and liabilities in the period in which the new legislation is enacted. The SEC staff issued Staff Accounting Bulletin ("SAB") 118, which provides guidance on accounting for the tax effects of U.S. Tax Reform. SAB 118 provides a measurement period of up to one year from enactment date for companies to complete their accounting. In accordance with SAB 118, the Company recorded a net provisional tax expense of
$41.6 million
resulting from the enactment of U.S. Tax Reform. Included in the net tax expense was a current tax expense of
$28.1 million
. The remaining tax expense of
$13.5 million
was largely the required remeasurement of the Company's U.S. deferred tax assets and liabilities considering the new statutory tax rate. In the fourth quarter of 2018 the Company completed its accounting for the tax effects of U.S. Tax Reform. The net tax expense decreased by approximately
$12.3 million
to
$29.3 million
largely due to changes in the transition tax calculations. The current tax expense is
$15.0 million
and the deferred tax expense is
$14.3 million
. The Company elected to pay the transition tax over 8 years.
The Company continues to evaluate the indefinite reinvestment assertion on foreign earnings in conjunction with the tax effects of U.S. Tax Reform. This includes the tax impacts of the global intangible low-taxed income ("GILTI") provision on current foreign earnings. The FASB issued guidance that allows for either recognizing deferred taxes for temporary differences expected to reverse as GILTI in future years or recognizing such taxes as current period expenses when incurred. The Company elected to recognize the tax effects of GILTI as a current period expense.
93
The sources of income before income taxes for the years ended
December 31, 2018
,
2017
and
2016
are presented as follows:
|
Year Ended December 31,
|
||||||||||||
|
(in thousands)
|
2018
|
2017
|
2016
|
|||||||||
|
Income before taxes:
|
|
|
|
|||||||||
|
United States
|
$
|
35,467
|
|
$
|
55,117
|
|
$
|
41,804
|
|
|||
|
Foreign
|
259,449
|
|
201,218
|
|
191,089
|
|
||||||
|
Total income before income taxes
|
$
|
294,916
|
|
$
|
256,335
|
|
$
|
232,893
|
|
|||
The Company's income tax expense for the years ended
December 31, 2018
,
2017
and
2016
consisted of the following:
|
Year Ended December 31,
|
||||||||||||
|
(in thousands)
|
2018
|
2017
|
2016
|
|||||||||
|
Current tax expense (benefit):
|
|
|
|
|||||||||
|
U.S.
|
$
|
(8,711
|
)
|
$
|
29,620
|
|
$
|
(2,886
|
)
|
|||
|
Foreign
|
70,244
|
|
79,475
|
|
59,515
|
|
||||||
|
Total current
|
61,533
|
|
109,095
|
|
56,629
|
|
||||||
|
Deferred tax expense (benefit):
|
|
|
|
|
|
|
||||||
|
U.S.
|
6,871
|
|
14,056
|
|
9,908
|
|
||||||
|
Foreign
|
(5,619
|
)
|
(23,756
|
)
|
(7,742
|
)
|
||||||
|
Total deferred
|
1,252
|
|
(9,700
|
)
|
2,166
|
|
||||||
|
Total tax expense
|
$
|
62,785
|
|
$
|
99,395
|
|
$
|
58,795
|
|
|||
The following is a reconciliation of the federal statutory income tax rates of
21%
for the year ended
December 31, 2018
and
35%
for the years ended December 31,
2017
and
2016
to the effective income tax rate for the same years:
|
Year Ended December 31,
|
||||||||||||
|
(dollar amounts in thousands)
|
2018
|
2017
|
2016
|
|||||||||
|
U.S. federal income tax expense at applicable statutory rate
|
$
|
61,932
|
|
$
|
89,684
|
|
$
|
81,513
|
|
|||
|
Tax effect of:
|
|
|
|
|
|
|
||||||
|
State income tax expense (benefit) at statutory rates
|
1,680
|
|
968
|
|
1,341
|
|
||||||
|
Non-deductible expenses
|
3,457
|
|
5,648
|
|
3,482
|
|
||||||
|
Share-based compensation
|
(13,750
|
)
|
(4,845
|
)
|
(1
|
)
|
||||||
|
Other permanent differences
|
(6,141
|
)
|
8,458
|
|
(4,929
|
)
|
||||||
|
Difference between U.S. federal and foreign tax rates
|
9,843
|
|
(24,270
|
)
|
(18,432
|
)
|
||||||
|
Provision in excess of statutory rates
|
3,737
|
|
8,426
|
|
2,490
|
|
||||||
|
Change in federal and foreign valuation allowance
|
3,075
|
|
(30,224
|
)
|
(8,163
|
)
|
||||||
|
Impairment of goodwill and acquired intangibles assets
|
83
|
|
8,248
|
|
—
|
|
||||||
|
GILTI, net of tax credits
|
14,111
|
|
—
|
|
—
|
|
||||||
|
U.S. Tax Reform - transition tax and rate change
|
(12,262
|
)
|
41,597
|
|
—
|
|
||||||
|
Other
|
(2,980
|
)
|
(4,295
|
)
|
1,494
|
|
||||||
|
Total income tax expense
|
$
|
62,785
|
|
$
|
99,395
|
|
$
|
58,795
|
|
|||
|
Effective tax rate
|
21.3
|
%
|
38.8
|
%
|
25.2
|
%
|
||||||
94
The tax effect of temporary differences and carryforwards that give rise to deferred tax assets and liabilities from continuing operations are as follows:
|
As of December 31,
|
||||||||
|
(in thousands)
|
2018
|
2017
|
||||||
|
Deferred tax assets:
|
|
|
||||||
|
Tax loss carryforwards
|
$
|
32,564
|
|
$
|
25,494
|
|
||
|
Share-based compensation
|
7,395
|
|
7,244
|
|
||||
|
Accrued expenses
|
17,242
|
|
14,621
|
|
||||
|
Property and equipment
|
16,377
|
|
14,984
|
|
||||
|
Goodwill and intangible amortization
|
10,619
|
|
13,866
|
|
||||
|
Intercompany notes
|
6,913
|
|
9,596
|
|
||||
|
Accrued revenue
|
36,273
|
|
32,947
|
|
||||
|
Other
|
11,876
|
|
9,631
|
|
||||
|
Gross deferred tax assets
|
139,259
|
|
128,383
|
|
||||
|
Valuation allowance
|
(21,857
|
)
|
(20,257
|
)
|
||||
|
Net deferred tax assets
|
117,402
|
|
108,126
|
|
||||
|
Deferred tax liabilities:
|
|
|
|
|
||||
|
Intangible assets related to purchase accounting
|
(22,877
|
)
|
(29,361
|
)
|
||||
|
Goodwill and intangible amortization
|
(16,115
|
)
|
(11,537
|
)
|
||||
|
Accrued expenses
|
(28,274
|
)
|
(33,728
|
)
|
||||
|
Intercompany notes
|
(14,034
|
)
|
(7,348
|
)
|
||||
|
Accrued interest
|
(32,372
|
)
|
(27,449
|
)
|
||||
|
Capitalized research and development
|
(8,299
|
)
|
(7,020
|
)
|
||||
|
Property and equipment
|
(8,408
|
)
|
(4,717
|
)
|
||||
|
Accrued revenue
|
(4,388
|
)
|
(5,027
|
)
|
||||
|
Other
|
(5,841
|
)
|
(3,227
|
)
|
||||
|
Total deferred tax liabilities
|
(140,608
|
)
|
(129,414
|
)
|
||||
|
Net deferred tax liabilities
|
$
|
(23,206
|
)
|
$
|
(21,288
|
)
|
||
Subsequently recognized tax benefits relating to the valuation allowance for deferred tax assets as of
December 31, 2018
are expected to be allocated to income taxes in the Consolidated Statements of Income.
As of
December 31, 2018
, and
2017
, the Company's foreign tax loss carryforwards were
$109.8 million
and
$90.2 million
, respectively, and U.S. state tax loss carryforwards were
$91.8 million
and
$59.1 million
, respectively.
In assessing the Company's ability to realize deferred tax assets, management considers whether it is more likely than not that some portion or all of the deferred tax assets will not be realized. The ultimate realization of deferred tax assets is dependent upon the generation of future taxable income during the periods in which those temporary differences become deductible. Management considers the scheduled reversal of deferred tax liabilities, projected future taxable income and tax planning strategies in making this assessment. Based upon the level of historical taxable income and projections for future taxable income over the periods in which the deferred tax assets are deductible, management believes it is more likely than not the Company will only realize the benefits of these deductible differences, net of the existing valuation allowances, as of
December 31, 2018
.
95
As of
December 31, 2018
, the Company had foreign tax net operating loss carryforwards of
$109.8 million
, which will expire as follows:
|
(in thousands)
|
Gross
|
Tax Effected
|
||||||
|
Year ending December 31,
|
||||||||
|
2019
|
$
|
1,227
|
|
$
|
296
|
|
||
|
2020
|
1,926
|
|
419
|
|
||||
|
2021
|
5,931
|
|
1,361
|
|
||||
|
2022
|
1,847
|
|
418
|
|
||||
|
2023
|
3,049
|
|
699
|
|
||||
|
Thereafter
|
58,772
|
|
14,555
|
|
||||
|
Unlimited
|
37,069
|
|
8,486
|
|
||||
|
Total
|
$
|
109,821
|
|
$
|
26,234
|
|
||
In addition, the Company's state tax net operating loss carryforwards of
$91.8 million
will expire periodically from
2019
through
2038
.
While U.S. tax expense has been recognized as a result of the transition tax and GILTI provisions of U.S. Tax Reform, the Company has not provided additional deferred taxes, if any, on undistributed earnings attributable to foreign subsidiaries that have been considered to be reinvested indefinitely. Gross undistributed earnings reinvested indefinitely in foreign subsidiaries aggregated approximately
$1,478 million
as of
December 31, 2018
. Other than the transition tax and GILTI provisions of U.S. Tax Reform, no deferred tax liabilities with respect to items such as certain foreign exchange gains or losses, foreign withholding taxes or additional state taxes have been recognized and it is not practical to determine the income tax liability that would be payable if such earnings were not reinvested indefinitely.
Accounting for uncertainty in income taxes
A reconciliation of the beginning and ending amount of unrecognized tax benefits for the years ended
December 31, 2018
and
2017
is as follows:
|
Year Ended December 31,
|
||||||||
|
(in thousands)
|
2018
|
2017
|
||||||
|
Beginning balance
|
$
|
28,537
|
|
$
|
17,988
|
|
||
|
Additions based on tax positions related to the current year
|
4,787
|
|
8,364
|
|
||||
|
Additions for tax positions of prior years
|
966
|
|
3,157
|
|
||||
|
Reductions for tax positions of prior years
|
(1,705
|
)
|
—
|
|
||||
|
Settlements
|
(807
|
)
|
(321
|
)
|
||||
|
Statute of limitations expiration
|
(863
|
)
|
(651
|
)
|
||||
|
Ending balance
|
$
|
30,915
|
|
$
|
28,537
|
|
||
As of
December 31, 2018
and
2017
, approximately
$28.0 million
and
$26.7 million
, respectively, of the unrecognized tax benefits would impact the Company's provision for income taxes and effective income tax rate, if recognized. Total estimated accrued interest and penalties related to the underpayment of income taxes was
$4.4 million
and
$3.5 million
as of
December 31, 2018
and
2017
, respectively. The following income tax years remain open in the Company's major jurisdictions as of
December 31, 2018
:
|
Jurisdictions
|
Periods
|
|
U.S. (Federal)
|
2014 through 2018
|
|
Spain
|
2009 through 2018
|
|
Australia
|
2011 through 2018
|
|
U.K.
|
2009 through 2018
|
|
Germany
|
2013 through 2018
|
96
It is reasonably possible that the balance of gross unrecognized tax benefits could significantly change within the next twelve months as a result of the resolution of audit examinations and expirations of certain statutes of limitations and, accordingly, materially affect the Company's operating results. At this time, it is not possible to estimate the range of change due to the uncertainty of potential outcomes.
(14) Valuation and Qualifying Accounts
Accounts receivable balances are stated net of allowance for doubtful accounts. Historically, the Company has not experienced significant write-offs. The Company records allowances for doubtful accounts when it is probable that the accounts receivable balance will not be collected. The following table provides a summary of the allowance for doubtful accounts balances and activity for the years ended
December 31, 2018
,
2017
and
2016
:
|
Year Ended December 31,
|
||||||||||||
|
(in thousands)
|
2018
|
2017
|
2016
|
|||||||||
|
Beginning balance-allowance for doubtful accounts
|
$
|
20,958
|
|
$
|
18,369
|
|
$
|
19,140
|
|
|||
|
Additions-charged to expense
|
8,653
|
|
6,631
|
|
6,556
|
|
||||||
|
Amounts written off
|
(4,079
|
)
|
(5,944
|
)
|
(6,839
|
)
|
||||||
|
Other (primarily changes in foreign currency exchange rates)
|
(1,245
|
)
|
1,902
|
|
(488
|
)
|
||||||
|
Ending balance-allowance for doubtful accounts
|
$
|
24,287
|
|
$
|
20,958
|
|
$
|
18,369
|
|
|||
(15) Stock Plans
The Company has share-based compensation plans (“SCP”) that allow it to grant restricted shares, or options to purchase shares, of Common Stock to certain current and prospective key employees, directors and consultants of the Company. These awards generally vest over periods ranging from three to five years from the date of grant, are generally exercisable during the shorter of a ten-year term or the term of employment with the Company. With the exception of certain awards made to the Company's employees in Germany, Singapore and Malaysia, awards under the SCP are settled through the issuance of new shares under the provisions of the SCP. For Company employees in Germany, Singapore and Malaysia, certain awards are settled through the issuance of treasury shares, which also reduces the number of shares available for future issuance under the SCP. As of
December 31, 2018
, the Company has approximately
3.1 million
in total shares remaining available for issuance under the SCP.
Share-based compensation expense was
$16.8 million
,
$15.6 million
and
$15.0 million
for the years ended
December 31, 2018
,
2017
and
2016
, respectively, and was recorded in salaries and benefits expense in the accompanying Consolidated Statements of Income. The Company recorded a tax benefit of
$2.7 million
,
$2.3 million
and
$1.0 million
during the years ended
December 31, 2018
,
2017
and
2016
, respectively, for the portion of this expense that relates to foreign tax jurisdictions in which an income tax benefit is expected to be derived.
Stock options
Summary stock options activity is presented in the table below:
|
Number of
Shares
|
Weighted
Average
Exercise
Price
|
Weighted
Average
Remaining
Contractual
Term (years)
|
Aggregate
Intrinsic
Value
(thousands)
|
||||||||||
|
Balance at December 31, 2017 (2,206,415 shares exercisable)
|
3,231,493
|
|
$
|
42.42
|
|
||||||||
|
Granted
|
264,982
|
|
$
|
111.45
|
|
||||||||
|
Exercised
|
(892,344
|
)
|
$
|
19.35
|
|
||||||||
|
Forfeited/Canceled
|
(41,561
|
)
|
$
|
72.88
|
|
||||||||
|
Balance at December 31, 2018
|
2,562,570
|
|
$
|
57.10
|
|
5.9
|
$
|
118,448
|
|
||||
|
Exercisable at December 31, 2018
|
1,637,801
|
|
$
|
39.64
|
|
4.5
|
$
|
102,752
|
|
||||
|
Vested and expected to vest at December 31, 2018
|
2,203,542
|
|
$
|
49.53
|
|
5.4
|
$
|
116,461
|
|
||||
97
Options outstanding that are expected to vest are net of estimated future forfeitures. The Company received cash of
$17.1 million
,
$9.5 million
and
$4.1 million
in connection with stock options exercised in the years ended
December 31, 2018
,
2017
and
2016
, respectively. The intrinsic value of these options exercised was
$73.0 million
,
$23.2 million
and
$12.3 million
in the years ended
December 31, 2018
,
2017
and
2016
, respectively. As of
December 31, 2018
, unrecognized compensation expense related to nonvested stock options that are expected to vest totaled
$21.6 million
and will be recognized over the next
5
years, with an overall weighted-average period of
3.7
years. The following table provides the fair value of options granted under the SCP during
2018
,
2017
and
2016
, together with a description of the assumptions used to calculate the fair value using the Black-Scholes-Merton option-pricing model:
|
Year ended December 31,
|
||||||||||||
|
2018
|
2017
|
2016
|
||||||||||
|
Volatility
|
29.8
|
%
|
28.8
|
%
|
33.3
|
%
|
||||||
|
Risk-free interest rate - weighted average
|
2.8
|
%
|
2.2
|
%
|
2.0
|
%
|
||||||
|
Risk-free interest rate - range
|
(a)
|
|
(a)
|
|
1.29% to 2.01%
|
|
||||||
|
Dividend yield
|
—
|
%
|
—
|
%
|
—
|
%
|
||||||
|
Assumed forfeitures
|
8.0
|
%
|
8.0
|
%
|
8.0
|
%
|
||||||
|
Expected lives
|
5.6 years
|
|
5.5 years
|
|
5.5 years
|
|
||||||
|
Weighted-average fair value (per share)
|
$
|
37.16
|
|
$
|
28.59
|
|
$
|
25.29
|
|
|||
(a) At the date of grant, the risk fee rate for stock options awarded in 2018 and 2017 was 2.8% and 2.2%, respectively.
Restricted stock
Restricted stock awards vest based on the achievement of time-based service conditions and/or performance-based conditions. For certain awards, vesting is based on the achievement of more than one condition of an award with multiple time-based
and/or performance-based conditions.
Summary restricted stock activity is presented in the table below:
|
Number of
Shares
|
Weighted
Average Grant
Date Fair
Value Per Share
|
||||||
|
Nonvested at December 31, 2017
|
432,336
|
|
$
|
72.09
|
|
||
|
Granted
|
103,304
|
|
$
|
107.88
|
|
||
|
Vested
|
(150,339
|
)
|
$
|
62.83
|
|
||
|
Forfeited
|
(13,460
|
)
|
$
|
72.00
|
|
||
|
Nonvested at December 31, 2018
|
371,841
|
|
$
|
85.78
|
|
||
The fair value of shares vested in the years ended
December 31, 2018
,
2017
and
2016
was
$14.2 million
,
$13.1 million
and
$13.3 million
, respectively. As of
December 31, 2018
, there was
$10.9 million
of total unrecognized compensation cost related to unvested time-based restricted stock, which is expected to be recognized over a weighted-average period of
3.6
years. As of
December 31, 2018
, there was
$9.8 million
of total unrecognized compensation costs related to unvested performance-based restricted stock, which is expected to be recognized based on Company performance over a weighted-average period of
1.8
years. The weighted average grant date fair value of restricted stock granted during the years ended
December 31, 2018
,
2017
and
2016
was
$107.88
,
$91.28
and
$73.86
per share, respectively.
Employee stock purchase plan
The Company has a qualified Employee Stock Purchase Plan (the “ESPP”), which allows qualified employees (as defined by the plan documents) to participate in the purchase of rights to purchase designated shares of the Company's Common Stock at a price equal to the lower of
85%
of the closing price at the beginning or end of each quarterly offering period. The Company reserved
1,000,000
shares of Common Stock for purchase under the ESPP. Pursuant to the ESPP, during the years ended
December 31, 2018
,
2017
and
2016
, the Company issued
21,872
,
21,547
and
34,658
rights, respectively, to purchase shares of Common Stock at a weighted average price per share of
$71.08
,
$69.06
and
$59.69
, respectively. The grant date fair value of the option to purchase shares at the lower of the closing price at the beginning or end of the quarterly period, plus the actual
98
total discount provided, are recorded as compensation expense. Total compensation expense recorded was
$0.4 million
,
$0.4 million
, and
$0.5 million
for the years ended
December 31, 2018
,
2017
and
2016
, respectively. The following table provides the weighted-average fair value of the ESPP stock purchase rights during the years ended
December 31, 2018
,
2017
and
2016
and the assumptions used to calculate the fair value using the Black-Scholes-Merton option-pricing model:
|
Year Ended December 31,
|
||||||||||||
|
2018
|
2017
|
2016
|
||||||||||
|
Volatility - weighted average
|
30.1
|
%
|
18.4
|
%
|
36.3
|
%
|
||||||
|
Volatility - range
|
23.5% to 36.7%
|
|
14.6% to 27.2%
|
|
20.0% to 50.1%
|
|
||||||
|
Risk-free interest rate - weighted average
|
2.01
|
%
|
0.89
|
%
|
0.24
|
%
|
||||||
|
Risk-free interest rate - range
|
1.73% to 2.45%
|
|
0.51% to 1.39%
|
|
0.22% to 0.29%
|
|
||||||
|
Dividend yield
|
—
|
%
|
—
|
%
|
—
|
%
|
||||||
|
Expected lives
|
3 months
|
|
3 months
|
|
3 months
|
|
||||||
|
Weighted-average fair value (per share)
|
$
|
17.22
|
|
$
|
15.81
|
|
$
|
14.42
|
|
|||
(16) Business Segment Information
Euronet’s reportable operating segments have been determined in accordance with ASC Topic 280,
Segment Reporting
(“ASC 280”)
.
The Company currently operates in the following three reportable operating segments:
|
1)
|
Through the EFT Processing Segment, the Company processes transactions for a network of ATMs and POS terminals across Europe, the Middle East and Asia Pacific. The Company provides comprehensive electronic payment solutions consisting of ATM cash withdrawal services, ATM network participation, outsourced ATM and POS management solutions, credit and debit card outsourcing, dynamic currency conversion, domestic and international surcharge and other value added services. Through this segment, the Company also offers a suite of integrated electronic financial transaction software solutions for electronic payment and transaction delivery systems.
|
|
2)
|
Through the epay Segment, the Company provides distribution, processing and collection services for prepaid mobile airtime and other electronic payment products in Europe, the Middle East, Asia Pacific, the U.S. and South America.
|
|
3)
|
Through the Money Transfer Segment, the Company provides global money transfer services under the brand names, Ria, IME, HiFX, and xe. Ria and IME provide global consumer-to-consumer money transfer services through a network of sending agents, Company-owned stores and Company-owned websites, disbursing money transfers through a worldwide correspondent network. HiFX and xe offer account-to-account international payment services to high-income individuals and small-to-medium sized businesses. xe is also a provider of foreign currency exchange information. The Company also offers customers bill payment services, payment alternatives such as money orders and prepaid debit cards, comprehensive check cashing services, foreign currency exchange services and mobile top-up. The Company provides cash management solutions and foreign currency risk management services to small-to-medium sized businesses under the brand name HiFM.
|
In addition, the Company accounts for non-operating activity, share-based compensation expense, certain intersegment eliminations and the costs of providing corporate and other administrative services in its administrative division, “Corporate Services, Eliminations and Other.” These services are not directly identifiable with the Company’s reportable operating segments.
99
The following tables present the Company’s reportable segment results for the years ended
December 31, 2018
,
2017
and
2016
:
|
|
For the Year Ended December 31, 2018
|
|||||||||||||||||||
|
(in thousands)
|
EFT
Processing
|
epay
|
Money
Transfer
|
Corporate
Services,
Eliminations
and Other
|
Consolidated
|
|||||||||||||||
|
Total revenues
|
$
|
753,651
|
|
$
|
743,784
|
|
$
|
1,042,962
|
|
$
|
(3,768
|
)
|
$
|
2,536,629
|
|
|||||
|
Operating expenses:
|
|
|
|
|
|
|||||||||||||||
|
Direct operating costs
|
366,977
|
|
564,252
|
|
560,930
|
|
(3,753
|
)
|
1,488,406
|
|
||||||||||
|
Salaries and benefits
|
75,791
|
|
57,748
|
|
194,808
|
|
32,085
|
|
360,432
|
|
||||||||||
|
Selling, general and administrative
|
46,925
|
|
35,749
|
|
125,647
|
|
8,486
|
|
216,807
|
|
||||||||||
|
Acquired intangible assets impairment
|
—
|
|
—
|
|
7,049
|
|
—
|
|
7,049
|
|
||||||||||
|
Depreciation and amortization
|
66,713
|
|
7,038
|
|
32,002
|
|
268
|
|
106,021
|
|
||||||||||
|
Total operating expenses
|
556,406
|
|
664,787
|
|
920,436
|
|
37,086
|
|
2,178,715
|
|
||||||||||
|
Operating income (expense)
|
$
|
197,245
|
|
$
|
78,997
|
|
$
|
122,526
|
|
$
|
(40,854
|
)
|
$
|
357,914
|
|
|||||
|
Other income (expense)
|
||||||||||||||||||||
|
Interest income
|
1,320
|
|
||||||||||||||||||
|
Interest expense
|
(37,573
|
)
|
||||||||||||||||||
|
Loss from unconsolidated affiliates
|
(117
|
)
|
||||||||||||||||||
|
Foreign currency exchange loss, net
|
(26,655
|
)
|
||||||||||||||||||
|
Other gains, net
|
27
|
|
||||||||||||||||||
|
Total other expense, net
|
(62,998
|
)
|
||||||||||||||||||
|
Income before income taxes
|
$
|
294,916
|
|
|||||||||||||||||
|
Segment assets as of December 31, 2018
|
$
|
1,220,141
|
|
$
|
780,220
|
|
$
|
1,310,775
|
|
$
|
10,019
|
|
$
|
3,321,155
|
|
|||||
|
Property and equipment, net as of December 31, 2018
|
$
|
215,106
|
|
$
|
31,172
|
|
$
|
45,517
|
|
$
|
74
|
|
$
|
291,869
|
|
|||||
100
|
|
For the Year Ended December 31, 2017
|
|||||||||||||||||||
|
(in thousands)
|
EFT
Processing
|
epay
|
Money
Transfer
|
Corporate
Services,
Eliminations
and Other
|
Consolidated
|
|||||||||||||||
|
Total revenues
|
$
|
634,559
|
|
$
|
733,998
|
|
$
|
886,858
|
|
$
|
(2,993
|
)
|
$
|
2,252,422
|
|
|||||
|
Operating expenses:
|
|
|
|
|
|
|||||||||||||||
|
Direct operating costs
|
318,875
|
|
564,032
|
|
476,322
|
|
(2,979
|
)
|
1,356,250
|
|
||||||||||
|
Salaries and benefits
|
61,683
|
|
54,459
|
|
168,371
|
|
26,274
|
|
310,787
|
|
||||||||||
|
Selling, general and administrative
|
33,158
|
|
36,014
|
|
108,022
|
|
13,108
|
|
190,302
|
|
||||||||||
|
Goodwill and acquired intangible assets impairment
|
2,286
|
|
31,770
|
|
—
|
|
—
|
|
34,056
|
|
||||||||||
|
Depreciation and amortization
|
55,660
|
|
9,622
|
|
29,598
|
|
150
|
|
95,030
|
|
||||||||||
|
Total operating expenses
|
471,662
|
|
695,897
|
|
782,313
|
|
36,553
|
|
1,986,425
|
|
||||||||||
|
Operating income (expense)
|
$
|
162,897
|
|
$
|
38,101
|
|
$
|
104,545
|
|
$
|
(39,546
|
)
|
$
|
265,997
|
|
|||||
|
Other income (expense)
|
||||||||||||||||||||
|
Interest income
|
2,443
|
|
||||||||||||||||||
|
Interest expense
|
(32,571
|
)
|
||||||||||||||||||
|
Income from unconsolidated affiliates
|
48
|
|
||||||||||||||||||
|
Foreign currency exchange gain, net
|
20,300
|
|
||||||||||||||||||
|
Other gains, net
|
118
|
|
||||||||||||||||||
|
Total other expense, net
|
(9,662
|
)
|
||||||||||||||||||
|
Income before income taxes
|
$
|
256,335
|
|
|||||||||||||||||
|
Segment assets as of December 31, 2017
|
$
|
1,040,135
|
|
$
|
695,990
|
|
$
|
1,255,765
|
|
$
|
148,139
|
|
$
|
3,140,029
|
|
|||||
|
Property and equipment, net as of December 31, 2017
|
$
|
196,451
|
|
$
|
28,135
|
|
$
|
43,564
|
|
$
|
153
|
|
$
|
268,303
|
|
|||||
101
|
|
For the Year Ended December 31, 2016
|
|||||||||||||||||||
|
(in thousands)
|
EFT
Processing
|
epay
|
Money
Transfer
|
Corporate
Services,
Eliminations
and Other
|
Consolidated
|
|||||||||||||||
|
Total revenues
|
$
|
464,254
|
|
$
|
693,986
|
|
$
|
801,919
|
|
$
|
(1,544
|
)
|
$
|
1,958,615
|
|
|||||
|
Operating expenses:
|
|
|
|
|
|
|||||||||||||||
|
Direct operating costs
|
224,793
|
|
528,774
|
|
422,508
|
|
(1,530
|
)
|
1,174,545
|
|
||||||||||
|
Salaries and benefits
|
51,822
|
|
51,378
|
|
155,471
|
|
29,749
|
|
288,420
|
|
||||||||||
|
Selling, general and administrative
|
30,399
|
|
34,517
|
|
93,219
|
|
7,213
|
|
165,348
|
|
||||||||||
|
Depreciation and amortization
|
40,084
|
|
11,075
|
|
29,195
|
|
175
|
|
80,529
|
|
||||||||||
|
Total operating expenses
|
347,098
|
|
625,744
|
|
700,393
|
|
35,607
|
|
1,708,842
|
|
||||||||||
|
Operating income (expense)
|
$
|
117,156
|
|
$
|
68,242
|
|
$
|
101,526
|
|
$
|
(37,151
|
)
|
$
|
249,773
|
|
|||||
|
Other income (expense)
|
||||||||||||||||||||
|
Interest income
|
1,696
|
|
||||||||||||||||||
|
Interest expense
|
(28,332
|
)
|
||||||||||||||||||
|
Foreign currency exchange loss, net
|
(10,200
|
)
|
||||||||||||||||||
|
Other gains, net
|
19,956
|
|
||||||||||||||||||
|
Total other expense, net
|
(16,880
|
)
|
||||||||||||||||||
|
Income before income taxes
|
$
|
232,893
|
|
|||||||||||||||||
|
Segment assets as of December 31, 2016
|
$
|
786,166
|
|
$
|
733,514
|
|
$
|
1,136,722
|
|
$
|
56,470
|
|
$
|
2,712,872
|
|
|||||
|
Property and equipment, net as of December 31, 2016
|
$
|
139,161
|
|
$
|
23,939
|
|
$
|
38,954
|
|
$
|
91
|
|
$
|
202,145
|
|
|||||
102
Total revenues for the years ended
December 31, 2018
,
2017
and
2016
, and property and equipment and total assets as of
December 31, 2018
and
2017
, summarized by geographic location, were as follows:
|
Revenues
|
Property and Equipment, net
|
Total Assets
|
||||||||||||||||||||||||||
|
For the year ended December 31,
|
as of December 31,
|
as of December 31,
|
||||||||||||||||||||||||||
|
(in thousands)
|
2018
|
2017
|
2016
|
2018
|
2017
|
2018
|
2017
|
|||||||||||||||||||||
|
United States
|
$
|
721,977
|
|
$
|
572,383
|
|
$
|
548,877
|
|
$
|
29,499
|
|
$
|
28,465
|
|
$
|
493,428
|
|
$
|
592,187
|
|
|||||||
|
Germany
|
476,122
|
|
495,778
|
|
409,590
|
|
25,302
|
|
20,668
|
|
508,062
|
|
435,687
|
|
||||||||||||||
|
Spain
|
155,619
|
|
115,473
|
|
82,921
|
|
39,238
|
|
29,881
|
|
198,082
|
|
152,841
|
|
||||||||||||||
|
United Kingdom
|
133,132
|
|
136,977
|
|
131,826
|
|
20,525
|
|
20,104
|
|
519,918
|
|
532,421
|
|
||||||||||||||
|
Poland
|
126,513
|
|
128,672
|
|
115,269
|
|
50,359
|
|
61,636
|
|
155,821
|
|
176,766
|
|
||||||||||||||
|
Italy
|
103,691
|
|
89,276
|
|
72,591
|
|
15,238
|
|
12,078
|
|
157,314
|
|
123,218
|
|
||||||||||||||
|
India
|
92,468
|
|
82,389
|
|
75,243
|
|
19,554
|
|
13,090
|
|
89,923
|
|
82,513
|
|
||||||||||||||
|
Malaysia
|
76,380
|
|
56,287
|
|
53,787
|
|
2,802
|
|
3,161
|
|
103,043
|
|
124,522
|
|
||||||||||||||
|
France
|
75,466
|
|
56,027
|
|
43,247
|
|
1,037
|
|
1,104
|
|
76,687
|
|
65,366
|
|
||||||||||||||
|
Greece
|
71,007
|
|
71,197
|
|
44,361
|
|
11,267
|
|
10,012
|
|
58,419
|
|
62,552
|
|
||||||||||||||
|
Australia
|
58,039
|
|
77,777
|
|
77,198
|
|
2,051
|
|
2,704
|
|
61,215
|
|
76,370
|
|
||||||||||||||
|
New Zealand
|
48,881
|
|
47,091
|
|
40,890
|
|
2,718
|
|
2,574
|
|
196,869
|
|
185,459
|
|
||||||||||||||
|
Other
|
397,334
|
|
323,095
|
|
262,815
|
|
72,279
|
|
62,826
|
|
702,374
|
|
530,127
|
|
||||||||||||||
|
Total foreign
|
1,814,652
|
|
1,680,039
|
|
1,409,738
|
|
262,370
|
|
239,838
|
|
2,827,727
|
|
2,547,842
|
|
||||||||||||||
|
Total
|
$
|
2,536,629
|
|
$
|
2,252,422
|
|
$
|
1,958,615
|
|
$
|
291,869
|
|
$
|
268,303
|
|
$
|
3,321,155
|
|
$
|
3,140,029
|
|
|||||||
Revenues are attributed to countries based on location of the customer, with the exception of software sales made by the Company's software subsidiary, which are attributed to the U.S.
(17) Financial Instruments and Fair Value Measurements
Concentrations of credit risk
The Company's credit risk primarily relates to trade accounts receivable and cash and cash equivalents. The EFT Processing Segment's customer base includes the most significant international card organizations and certain banks in its markets. The epay Segment's customer base is diverse and includes several major retailers and/or distributors in markets that they operate. The Money Transfer Segment trade accounts receivable are primarily due from independent agents that collect cash from customers on the Company's behalf and generally remit the cash within one week. The Company performs ongoing evaluations of its customers' financial condition and limits the amount of credit extended, or purchases credit enhancement protection, when deemed necessary, but generally requires no collateral. See Note 14, Valuation and Qualifying Accounts, for further disclosure.
The Company invests excess cash not required for use in operations primarily in high credit quality, short-term duration securities that the Company believes bear minimal risk.
103
Fair value measurements
Fair value measurements used in the consolidated financial statements are based upon the price that would be received to sell an asset or paid to transfer a liability in an orderly transaction between market participants at the measurement date. The fair value hierarchy distinguishes between (1) market participant assumptions developed based on market data obtained from independent sources (observable inputs) and (2) an entity’s own assumptions about market participant assumptions developed based on the best information available in the circumstances (unobservable inputs). The fair value hierarchy consists of three broad levels, which gives the highest priority to unadjusted quoted prices in active markets for identical assets or liabilities (Level 1) and the lowest priority to unobservable inputs (Level 3). The three levels of the fair value hierarchy are described below:
|
•
|
Level 1 – Unadjusted quoted prices in active markets for identical assets or liabilities.
|
|
•
|
Level 2 – Valuations based on quoted prices for similar assets or liabilities, quoted prices in markets that are not active, or other inputs that are observable or can be corroborated by observable data for substantially the full term of the assets or liabilities.
|
|
•
|
Level 3 – Unobservable inputs in which little or no market activity exists, therefore requiring an entity to develop its own assumptions about the inputs that market participants would use in pricing.
|
The following table details financial assets measured and recorded at fair value on a recurring basis:
|
|
As of December 31, 2018
|
||||||||||||||||
|
(in thousands)
|
Balance Sheet Classification
|
Level 1
|
Level 2
|
Level 3
|
Total
|
||||||||||||
|
Assets
|
|||||||||||||||||
|
Foreign currency exchange contracts
|
Other current assets
|
$
|
—
|
|
$
|
44,637
|
|
$
|
—
|
|
$
|
44,637
|
|
||||
|
Liabilities
|
|||||||||||||||||
|
Foreign currency exchange contracts
|
Other current liabilities
|
$
|
—
|
|
(36,102
|
)
|
$
|
—
|
|
$
|
(36,102
|
)
|
|||||
|
|
As of December 31, 2017
|
||||||||||||||||
|
(in thousands)
|
Balance Sheet Classification
|
Level 1
|
Level 2
|
Level 3
|
Total
|
||||||||||||
|
Assets
|
|||||||||||||||||
|
Foreign currency exchange contracts
|
Other current assets
|
$
|
—
|
|
$
|
36,574
|
|
$
|
—
|
|
$
|
36,574
|
|
||||
|
Liabilities
|
|||||||||||||||||
|
Foreign currency exchange contracts
|
Other current liabilities
|
$
|
—
|
|
$
|
(22,495
|
)
|
$
|
—
|
|
$
|
(22,495
|
)
|
||||
The carrying amounts of cash and cash equivalents, trade accounts receivable, trade accounts payable and short-term debt obligations approximate fair values due to their short maturities. The carrying values of the Company’s revolving credit agreements approximate fair values because interest is based on LIBOR that resets at various intervals of less than one year. The Company estimates the fair value of the Convertible Notes using quoted prices in inactive markets for identical liabilities (Level 2). As of
December 31, 2018
and
2017
, the fair values of the Convertible Notes were
$571.6 million
and
$503.7 million
, respectively, with carrying values of
$379.9 million
and
$369.3 million
, respectively.
(18) Litigation and Contingencies
From time to time, the Company is a party to legal and regulatory proceedings arising in the ordinary course of its business. Currently, there are no legal proceedings or regulatory findings that management believes, either individually or in the aggregate, would have a material adverse effect upon the consolidated financial statements of the Company. In accordance with U.S. GAAP, the Company records a liability when it is both probable that a liability has been incurred and the amount of the loss can be reasonably estimated. These provisions are reviewed at least quarterly and adjusted to reflect the impacts of negotiations, settlements, rulings, advice of legal counsel, and other information and events pertaining to a particular case.
104
(19) Commitments
As of
December 31, 2018
, the Company had
$77.8 million
of stand-by letters of credit/bank guarantees issued on its behalf, of which
$3.9 million
are collateralized by cash deposits held by the respective issuing banks.
Under certain circumstances, the Company grants guarantees in support of obligations of subsidiaries. As of
December 31, 2018
, the Company granted off balance sheet guarantees for cash in various ATM networks amounting to
$22.9 million
over the terms of the cash supply agreements and performance guarantees amounting to approximately
$61.7 million
over the terms of the agreements with the customers.
From time to time, the Company enters into agreements with commercial counterparties that contain indemnification provisions, the terms of which may vary depending on the negotiated terms of each respective agreement. The amount of such potential obligations is generally not stated in the agreements. Euronet's liability under such indemnification provisions may be mitigated by relevant insurance coverage and may be subject to time and materiality limitations, monetary caps and other conditions and defenses. Such indemnification obligations include the following:
|
•
|
In connection with contracts with financial institutions in the EFT Processing Segment, the Company is responsible for damage to ATMs and theft of ATM network cash that, generally, is not recorded on the Company’s Consolidated Balance Sheets. As of
December 31, 2018
, the balance of cash used in the Company's ATM networks for which the Company was responsible was approximately
$523 million
. The Company maintains insurance policies to mitigate this exposure;
|
|
•
|
In connection with contracts with financial institutions in the EFT Processing Segment, the Company is responsible for losses suffered by its customers and other parties as a result of the breach of its computer systems, including in particular, losses arising from fraudulent transactions made using information stolen through its processing systems. The Company maintains insurance policies to mitigate this exposure;
|
|
•
|
In connection with the license of proprietary systems to customers, the Company provides certain warranties and infringement indemnities to the licensee, which generally warrant that such systems do not infringe on intellectual property owned by third parties and that the systems will perform in accordance with their specifications;
|
|
•
|
Euronet has entered into purchase and service agreements with vendors and consulting agreements with providers of consulting services, pursuant to which the Company has agreed to indemnify certain of such vendors and consultants, respectively, against third-party claims arising from the Company’s use of the vendor’s product or the services of the vendor or consultant;
|
|
•
|
In connection with acquisitions and dispositions of subsidiaries, operating units and business assets, the Company has entered into agreements containing indemnification provisions, which can be generally described as follows: (i) in connection with acquisitions of operating units or assets made by Euronet, the Company has agreed to indemnify the seller against third party claims made against the seller relating to the operating unit or asset and arising after the closing of the transaction, and (ii) in connection with dispositions made by Euronet, Euronet has agreed to indemnify the buyer against damages incurred by the buyer due to the buyer’s reliance on representations and warranties relating to the subject subsidiary, operating unit or business assets in the disposition agreement if such representations or warranties were untrue when made; and
|
|
•
|
Euronet has entered into agreements with certain third parties, including banks that provide fiduciary and other services to Euronet or to the Company’s benefit plans. Under such agreements, the Company has agreed to indemnify such service providers for third-party claims relating to carrying out their respective duties under such agreements.
|
The Company is also required to meet minimum capitalization and cash requirements of various regulatory authorities in the jurisdictions in which the Company has money transfer operations. The Company has obtained surety bonds in compliance with money transfer licensing requirements of the applicable governmental authorities.
To date, the Company is not aware of any significant claims made by the indemnified parties or third parties to guarantee agreements with the Company and, accordingly, no liabilities were recorded as of
December 31, 2018
or
2017
.
(20) Related Party Transactions
The Company leases an airplane from a company partially owned by Mr. Michael J. Brown, Euronet's Chief Executive Officer, President and Chairman of the Board of Directors. The airplane is leased for business use on a per flight hour basis at competitive commercial rates with no minimum usage requirement. Euronet incurred expenses of
$0.3 million
,
$0.4 million
and
$0.3 million
during the years ended
December 31, 2018
,
2017
and
2016
, respectively, for the use of this airplane.
105
In June 2014, the Company signed an ATM operating agreement with Rontec Ltd., a U.K. company in which Gerald Ronson holds a majority of the shares. Mr. Ronson is the father-in-law of Paul Althasen, one of the Company's directors. This is a commercial agreement under which the Company leases ATM sites from Rontec Ltd. at rates which it considers to be competitive commercial rates. The Company paid
$38 thousand
,
$49 thousand
and
$106 thousand
under this agreement in each of 2018, 2017 and 2016, respectively.
(21) Selected Quarterly Data (Unaudited)
|
(in thousands, except per share data)
|
First Quarter
|
Second Quarter
|
Third Quarter
|
Fourth Quarter
|
||||||||||||
|
For the Year Ended December 31, 2018
|
|
|
|
|
||||||||||||
|
Revenues
|
$
|
550,515
|
|
$
|
622,224
|
|
$
|
714,505
|
|
$
|
649,385
|
|
||||
|
Operating income
|
$
|
45,472
|
|
$
|
90,369
|
|
$
|
150,913
|
|
$
|
71,160
|
|
||||
|
Net income
|
$
|
26,344
|
|
$
|
43,636
|
|
$
|
102,257
|
|
$
|
59,894
|
|
||||
|
Net income attributable to Euronet Worldwide, Inc.
|
$
|
26,413
|
|
$
|
43,724
|
|
$
|
102,723
|
|
$
|
59,991
|
|
||||
|
Earnings per common share:
|
|
|
|
|
|
|
|
|
||||||||
|
Basic
|
$
|
0.51
|
|
$
|
0.85
|
|
$
|
2.01
|
|
$
|
1.16
|
|
||||
|
Diluted
|
$
|
0.49
|
|
$
|
0.82
|
|
$
|
1.89
|
|
$
|
1.10
|
|
||||
|
For the Year Ended December 31, 2017
|
|
|
|
|
|
|
|
|
||||||||
|
Revenues
|
$
|
473,380
|
|
$
|
536,563
|
|
$
|
637,834
|
|
$
|
604,645
|
|
||||
|
Operating income
|
$
|
41,286
|
|
$
|
66,691
|
|
$
|
116,901
|
|
$
|
41,119
|
|
||||
|
Net income (loss)
|
$
|
28,069
|
|
$
|
51,347
|
|
$
|
100,353
|
|
$
|
(22,829
|
)
|
||||
|
Net income (loss) attributable to Euronet Worldwide, Inc.
|
$
|
28,123
|
|
$
|
51,365
|
|
$
|
100,290
|
|
$
|
(22,933
|
)
|
||||
|
Earnings (loss) per common share:
|
|
|
|
|
|
|
|
|
||||||||
|
Basic
|
$
|
0.54
|
|
$
|
0.98
|
|
$
|
1.91
|
|
$
|
(0.44
|
)
|
||||
|
Diluted
|
$
|
0.51
|
|
$
|
0.93
|
|
$
|
1.80
|
|
$
|
(0.44
|
)
|
||||
106
Item 9. Changes in and Disagreements with Accountants on Accounting and Financial Disclosure
None.
Item 9A. Controls and Procedures
Evaluation of Disclosure Controls and Procedures
Our executive management, including our Chief Executive Officer and Chief Financial Officer, evaluated the effectiveness of the design and operation of our disclosure controls and procedures pursuant to Rule 13a-15(b) under the Exchange Act as of
December 31, 2018
. Based on this evaluation, our Chief Executive Officer and Chief Financial Officer have concluded that the design and operation of these disclosure controls and procedures were effective as of such date to provide reasonable assurance that information required to be disclosed in our reports under the Exchange Act is recorded, processed, summarized and reported within the time periods specified in the rules and forms of the SEC, and that such information is accumulated and communicated to our management, including our Chief Executive Officer and Chief Financial Officer, as appropriate, to allow timely decisions regarding required disclosures.
Changes in Internal Controls Over Financial Reporting
There has been no change in our internal control over financial reporting during the fourth quarter of
2018
that has materially affected, or is reasonably likely to materially affect, our internal control over financial reporting.
Management's Report On Internal Control Over Financial Reporting
To the Stockholders of Euronet Worldwide, Inc.:
Management is responsible for establishing and maintaining an effective internal control over financial reporting as this term is defined under Rule 13a-15(f) of the Securities Exchange Act of 1934 and has made organizational arrangements providing appropriate divisions of responsibility and has established communication programs aimed at assuring that its policies, procedures and principles of business conduct are understood and practiced by its employees. All internal control systems, no matter how well designed, have inherent limitations. Therefore, even those systems determined to be effective can provide only reasonable assurance with respect to financial statement preparation and presentation.
Management of Euronet Worldwide, Inc. assessed the effectiveness of the Company's internal control over financial reporting as of
December 31, 2018
. In making this assessment, it used the criteria set forth by the Committee of Sponsoring Organizations of the Treadway Commission in
Internal
Control-Integrated Framework
(2013). Based on these criteria and our assessment, we have determined that, as of
December 31, 2018
, the Company's internal control over financial reporting was effective.
The effectiveness of the Company's internal control over financial reporting as of
December 31, 2018
, has been audited by KPMG LLP, an independent registered public accounting firm, as stated in their audit report, included herein.
|
/s/ Michael J. Brown
|
|
|
Michael J. Brown
|
|
|
Chief Executive Officer
|
|
|
/s/ Rick L. Weller
|
|
|
Rick L. Weller
|
|
|
Chief Financial Officer and Chief Accounting Officer
|
|
February 28, 2019
107
Item 9B. Other Information
None.
Part III
Item 10. Directors, Executive Officers and Corporate Governance
The information under “Election of Directors,” “Section 16(a) Beneficial Ownership Reporting Compliance” and “Meetings and Committees of the Board of Directors” in the Proxy Statement for the
2019
Annual Meeting of Stockholders, which will be filed with the SEC no later than 120 days after
December 31, 2018
, is incorporated herein by reference. Information concerning our Code of Business Conduct and Ethics for our employees, including our Chief Executive Officer and Chief Financial Officer, is set forth under “Availability of Reports, Certain Committee Charters, and Other Information” in Part I of this Annual Report on Form 10-K and incorporated herein by reference. Information concerning executive officers is set forth under “Executive Officers of the Registrant” in Part I of this Annual Report on Form 10-K and incorporated herein by reference.
We intend to satisfy the requirement under Item 5.05 of Form 8-K to disclose any amendments to our Code of Business Conduct and Ethics and any waiver from a provision of our Code of Ethics by disclosing such information on a Form 8-K or on our Website at www.euronetworldwide.com under For Investors/Corporate Governance.
Item 11. Executive Compensation
The information under “Compensation Tables,” “Compensation Discussion and Analysis,” “Director Compensation,” “Report of Compensation Committee” and “Compensation Committee Interlocks and Insider Participation” in the Proxy Statement for the
2019
Annual Meeting of Stockholders, which will be filed with the SEC no later than 120 days after
December 31, 2018
, is incorporated herein by reference.
Item 12. Security Ownership of Certain Beneficial Owners and Management and Related Stockholder Matters
The information under “Beneficial Ownership of Common Stock” and “Election of Directors” in the Proxy Statement for the
2019
Annual Meeting of Stockholders, which will be filed with the SEC no later than 120 days after
December 31, 2018
, is incorporated herein by reference. The information in Part II, Item 5, "Market for Registrant's Common Equity, Related Stockholder Matters and Issuer Purchases of Equity Securities - Equity Compensation Plan Information" is incorporated herein by reference.
Item 13. Certain Relationships and Related Transactions, and Director Independence
The information under “Certain Relationships and Related Transactions and Director Independence” in the Proxy Statement for the
2019
Annual Meeting of Stockholders, which will be filed with the SEC no later than 120 days after
December 31, 2018
, is incorporated herein by reference.
Item 14. Principal Accounting Fees and Services
The information under “Audit Matters - Fees of the Company's Independent Auditors” and - "Audit Matters - Audit Committee Pre-Approval Policy" in the Proxy Statement for the
2019
Annual Meeting of Stockholders, which will be filed with the SEC no later than 120 days after
December 31, 2018
, is incorporated herein by reference.
108
Part IV
Item 15. Exhibits and Financial Statement Schedules
|
(a)
|
List of Documents Filed as Part of this Report.
|
1. Financial Statements
The Consolidated Financial Statements and accompanying notes, together with the report of KPMG LLP, appear in Part II, Item 8 - Financial Statements and Supplementary Data, of this Form 10-K.
2. Schedules
None.
3. Exhibits
The exhibits that are required to be filed or incorporated by reference herein are listed in the Exhibit Index below.
Exhibits
Exhibit Index
|
Exhibit
|
|
Description
|
|
3.1
|
||
|
3.2
|
||
|
3.3
|
||
|
3.4
|
||
|
4.1
|
||
|
4.2
|
||
|
10.1
|
||
|
10.2
|
||
109
|
10.3
|
||
|
10.4
|
||
|
10.5
|
||
|
10.6
|
||
|
10.7
|
||
|
10.8
|
||
|
10.9
|
||
|
10.10
|
||
|
10.11.1
|
||
|
10.11.2
|
||
|
10.12
|
||
|
10.13
|
||
|
10.14
|
||
110
|
10.15
|
||
|
10.16
|
||
|
10.17
|
||
|
10.18
|
||
|
21.1
|
||
|
23.1
|
||
|
31.1
|
||
|
|
|
|
|
31.2
|
||
|
|
|
|
|
32.1
|
||
|
|
|
|
|
32.2
|
||
|
|
|
|
|
101
|
The following materials from Euronet Worldwide, Inc.’s Annual Report on Form 10-K for the year ended December 31, 2018, formatted in XBRL (eXtensible Business Reporting Language): (i) Consolidated Balance Sheets at December 31, 2018 and 2017, (ii) Consolidated Statements of Income for the years ended December 31, 2018, 2017 and 2016, (iii) Consolidated Statements of Comprehensive Income for the years ended December 31, 2018, 2017 and 2016, (iv) Consolidated Statements of Changes in Equity for the years ended December 31, 2018, 2017 and 2016, (v) Consolidated Statements of Cash Flows for the years ended December 31, 2018, 2017 and 2016, and (vi) Notes to the Consolidated Financial Statements.
|
|
___________________________
|
(1)
|
Filed herewith.
|
|
(2)
|
Management contracts and compensatory plans and arrangements required to be filed as Exhibits pursuant to Item 15(a) of this report.
|
|
(3)
|
Pursuant to Item 601(b)(32) of Regulation S-K, this Exhibit is furnished rather than filed with this Form 10-K.
|
PLEASE NOTE: Pursuant to the rules and regulations of the SEC, we have filed or incorporated by reference the agreements referenced above as exhibits to this Annual Report on Form 10-K. The agreements have been filed to provide investors with information regarding their respective terms. The agreements are not intended to provide any other factual information about the Company or its business or operations. In particular, the assertions embodied in any representations, warranties and covenants contained in the agreements may be subject to qualifications with respect to knowledge and materiality different from those applicable to investors and may be qualified by information in confidential disclosure schedules not included with the exhibits. These disclosure schedules may contain information that modifies, qualifies and creates exceptions to the representations, warranties and covenants set forth in the agreements. Moreover, certain representations, warranties and covenants in the agreements may have been used for the purpose of allocating risk between the parties, rather than establishing
111
matters as facts. In addition, information concerning the subject matter of the representations, warranties and covenants may have changed after the date of the respective agreement, which subsequent information may or may not be fully reflected in the Company's public disclosures. Accordingly, investors should not rely on the representations, warranties and covenants in the agreements as characterizations of the actual state of facts about the Company or its business or operations on the date hereof.
112
Signatures
Pursuant to the requirements of Section 13 or 15(d) of the Securities Exchange Act of 1934, the registrant has duly caused this report to be signed on its behalf by the undersigned, thereunto duly authorized.
Euronet Worldwide, Inc.
Date:
February 28, 2019
|
/s/ Michael J. Brown
|
||||
|
Michael J. Brown
|
||||
|
Chairman of the Board of Directors, Chief Executive
|
||||
|
Officer, President and Director (principal executive officer)
|
||||
Pursuant to the requirements of the Securities Exchange Act of 1934, this report has been signed below by the following persons on behalf of the registrant and in the capacities and on the dates indicated.
|
Signature
|
Title
|
|
/s/ Michael J. Brown
Michael J. Brown
February 28, 2019
|
Chairman of the Board of Directors, Chief Executive Officer, President and Director (principal executive officer)
|
|
/s/ Rick L. Weller
Rick L. Weller
February 28, 2019
|
Chief Financial Officer and Chief Accounting Officer (principal financial officer and principal accounting officer)
|
|
/s/ Paul S. Althasen
Paul S. Althasen
February 28, 2019
|
Director
|
|
/s/ Andrzej Olechowski
Andrzej Olechowski
February 28, 2019
|
Director
|
|
/s/ Eriberto R. Scocimara
Eriberto R. Scocimara
February 28, 2019
|
Director
|
|
/s/ Thomas A. McDonnell
Thomas A. McDonnell
February 28, 2019
|
Director
|
|
/s/ Andrew B. Schmitt
Andrew B. Schmitt
February 28, 2019
|
Director
|
|
/s/ M. Jeannine Strandjord
M. Jeannine Strandjord
February 28, 2019
|
Director
|
|
/s/ Mark R. Callegari
Mark R. Callegari
February 28, 2019
|
Director
|
113
TABLE OF CONTENTS
Part IItem 1. BusinessItem 1A. Risk FactorsItem 1B. Unresolved Staff CommentsItem 2. PropertiesItem 3. Legal ProceedingsItem 4. Mine Safety DisclosuresPart IIItem 5. Market For Registrant S Common Equity, Related Stockholder Matters and Issuer Purchases Of Equity SecuritiesItem 6. Selected Financial DataItem 7. Management S Discussion and Analysis Of Financial Condition and Results Of OperationsItem 7A. Quantitative and Qualitative Disclosures About Market RiskItem 8. Financial Statements and Supplementary DataItem 9. Changes in and Disagreements with Accountants on Accounting and Financial DisclosureItem 9A. Controls and ProceduresItem 9B. Other InformationPart IIIItem 10. Directors, Executive Officers and Corporate GovernanceItem 11. Executive CompensationItem 12. Security Ownership Of Certain Beneficial Owners and Management and Related Stockholder MattersItem 13. Certain Relationships and Related Transactions, and Director IndependenceItem 14. Principal Accounting Fees and ServicesPart IVItem 15. Exhibits and Financial Statement Schedules