ELLINGTON FINANCIAL INC.
10-Ks and 10-Qs
|
|
|
|
|
|
|
|
|
|
|
|
|
|
|
|
|
|
|
|
|
|
|
|
|
|
|
|
|
|
|
|
|
|
|
|
|
|
|
|
|
|
|
|
|
|
|
|
|
|
|
|
|
UNITED STATES
SECURITIES AND EXCHANGE COMMISSION
WASHINGTON, D.C. 20549
FORM 10-K
|
x
|
ANNUAL REPORT PURSUANT TO SECTION 13 OR 15(d) OF THE SECURITIES EXCHANGE ACT OF 1934
|
For the year ended December 31, 2016
OR
|
¨
|
TRANSITION REPORT PURSUANT TO SECTION 13 OR 15(d) OF THE SECURITIES EXCHANGE ACT OF 1934
|
For the transition period from to
Commission file number 001-34569
Ellington Financial LLC
(Exact Name of Registrant as Specified in Its Charter)
|
Delaware
|
|
26-0489289
|
|
(State or Other Jurisdiction of Incorporation or Organization)
|
|
(I.R.S. Employer Identification No.)
|
|
53 Forest Avenue, Old Greenwich, Connecticut 06870
|
||
|
(Address of Principal Executive Office) (Zip Code)
|
||
(203) 698-1200
(Registrant's Telephone Number, Including Area Code)
Securities registered pursuant to Section 12(b) of the Act:
|
Title of each class
|
Name of each exchange on which registered
|
|
|
Common shares representing limited liability company interests, no par value
|
New York Stock Exchange
|
|
Securities registered pursuant to Section 12(g) of the Act: None
Indicate by check mark if the registrant is a well-known seasoned issuer, as defined in Rule 405 of the Securities Act. Yes
¨
No
x
Indicate by check mark if the registrant is not required to file reports pursuant to Section 13 or Section 15(d) of the Exchange Act. Yes
¨
No
x
Indicate by check mark whether the registrant (1) has filed all reports required to be filed by Section 13 or 15(d) of the Securities Exchange Act of 1934 during the preceding 12 months (or for such shorter period that the registrant was required to file such reports), and (2) has been subject to such filing requirements for the past 90 days. Yes
x
No
¨
Indicate by check mark whether the registrant has submitted electronically and posted on its corporate Website, if any, every Interactive Data File required to be submitted and posted pursuant to Rule 405 of Regulation S-T (§ 232.405 of this chapter) during the preceding 12 months (or for such shorter period that the registrant was required to submit and post such files). Yes
x
No
¨
Indicate by check mark if disclosure of delinquent filers pursuant to Item 405 of Regulation S-K (§ 232.405 of this chapter) is not contained herein, and will not be contained to the best of the registrant's knowledge, in definitive proxy or information statements incorporated by reference in Part III of this Form 10-K or any amendment to this Form 10-K.
¨
Indicate by check mark whether the registrant is a large accelerated filer, an accelerated filer, a non-accelerated filer, or a smaller reporting company. See definitions of "large accelerated filer," "accelerated filer" and "smaller reporting company" in Rule 12b-2 of the Exchange Act.
|
Large Accelerated Filer
|
¨
|
Accelerated Filer
|
x
|
|
Non-Accelerated Filer
|
¨
|
Smaller Reporting Company
|
¨
|
Indicate by check mark whether the registrant is a shell company (as defined in Rule 12b-2 of the Exchange Act). Yes
¨
No
x
As of June 30, 2016, the last business day of the Registrant's most recently completed second fiscal quarter, the aggregate market value of the registrant's common shares held by non-affiliates was $508,090,994 based on the closing price as reported by the New York Stock Exchange on that date.
Number of the registrant's common shares outstanding as of March 10, 2017: 32,242,348
DOCUMENTS INCORPORATED BY REFERENCE
Portions of the registrant's definitive Proxy Statement with respect to its 2017 Annual Meeting of Shareholders to be filed not later than 120 days after the end of the registrant's fiscal year are incorporated by reference into Part III hereof as noted therein.
The financial statements contained in Part II of this Form 10-K constitute the annual report with respect to the registrant for purposes of CFTC rule 4.22(C) (the "CFTC Annual Report").
ELLINGTON FINANCIAL LLC
INDEX
|
Item No.
|
Form 10-K Report Page
|
|
|
PART I
|
||
|
1.
|
||
|
1A.
|
||
|
1B.
|
||
|
2.
|
||
|
3.
|
||
|
4.
|
||
|
PART II
|
||
|
5.
|
||
|
6.
|
||
|
7.
|
||
|
7A.
|
||
|
8.
|
Financial Statements
and Supplementary Data
|
|
|
9.
|
||
|
9A.
|
||
|
9B.
|
||
|
PART III
|
||
|
10.
|
||
|
11.
|
||
|
12.
|
||
|
13.
|
||
|
14.
|
||
|
PART IV
|
||
|
15.
|
||
|
16.
|
Form 10-K Summary
|
|
Except where the context suggests otherwise, "EFC," "we," "us," and "our" refer to Ellington Financial LLC and its subsidiaries, including Ellington Financial Operating Partnership LLC, our operating partnership subsidiary, which we refer to as our "Operating Partnership." We conduct all of our operations and business activities through our Operating Partnership. Our "Manager" refers to Ellington Financial Management LLC, our external manager, and "Ellington" refers to Ellington Management Group, L.L.C. and its affiliated investment advisory firms, including our Manager, and "Manager Group" refers collectively to Ellington and its principals (including family trusts established by its principals) and entities in which 100% of the interests are beneficially owned by the foregoing. In certain instances, references to our Manager and services to be provided to us by our Manager may also include services provided by Ellington and its other affiliates from time to time
.
Special Note Regarding Forward-Looking Statements
When used in this Annual Report on Form 10-K, in future filings with the Securities and Exchange Commission, or the "SEC," or in press releases or other written or oral communications, statements which are not historical in nature, including those containing words such as "believe," "expect," "anticipate," "estimate," "project," "plan," "continue," "intend," "should," "would," "could," "goal," "objective," "will," "may," "seek," or similar expressions, are intended to identify "forward-looking statements" within the meaning of Section 27A of the Securities Act of 1933, as amended, or the "Securities Act," and Section 21E of the Securities Exchange Act of 1934, as amended, or the "Exchange Act," and, as such, may involve known and unknown risks, uncertainties, and assumptions.
Forward-looking statements are based on our beliefs, assumptions, and expectations of our future performance, taking into account information currently available to us. These beliefs, assumptions, and expectations are subject to risks and uncertainties and can change as a result of many possible events or factors, not all of which are known to us. If a change occurs, our business, financial condition, liquidity, and results of operations may vary materially from those expressed or implied in our forward-looking statements. The following factors are examples of those that could cause actual results to vary from our forward-looking statements: changes in interest rates and the market value of our securities; market volatility; changes in the prepayment rates on the mortgage loans underlying our Agency securities; increased rates of default and/or decreased recovery rates on our assets; our ability to borrow to finance our assets; changes in government regulations affecting our business; our ability to maintain our exclusion from registration under the Investment Company Act of 1940, as amended, or the "Investment Company Act"; and risks associated with investing in real estate assets, including changes in business conditions and the general economy. These and other risks, uncertainties and factors, including the risk factors described under Item 1A of this Annual Report on Form 10-K, could cause our actual results to differ materially from those projected or implied in any forward-looking statements we make. All forward-looking statements speak only as of the date on which they are made. New risks and uncertainties arise over time, and it is not possible to predict those events or how they may affect us. Except as required by law, we are not obligated to, and do not intend to, update or revise any forward-looking statements, whether as a result of new information, future events, or otherwise.
Our Company
Ellington Financial LLC is a specialty finance company that was formed as a Delaware limited liability company in July 2007 and commenced operations in August 2007. We acquire and manage mortgage-related, consumer-related, and other financial assets. Our primary objective is to generate attractive, risk-adjusted total returns for our shareholders by making investments that we believe compensate us appropriately for the risks associated with them. We seek to attain this objective by utilizing an opportunistic strategy. Our targeted assets currently include:
|
•
|
residential mortgage-backed securities, or "RMBS," backed by loans for which the principal and interest payments are not guaranteed by a U.S. government agency or a U.S. government-sponsored entity, collectively referred to as "non-Agency RMBS";
|
|
•
|
RMBS for which the principal and interest payments are guaranteed by a U.S. government agency or a U.S. government-sponsored entity, or "Agency RMBS";
|
|
•
|
consumer loans and asset-backed securities, or "ABS," backed by consumer loans;
|
|
•
|
commercial mortgage-backed securities, or "CMBS," commercial mortgage loans and other commercial real estate debt;
|
|
•
|
residential mortgage loans;
|
|
•
|
collateralized loan obligations, or "CLOs";
|
3
|
•
|
corporate debt and equity, including distressed debt and equity; and
|
|
•
|
mortgage-related derivatives.
|
In addition, in conjunction with our investments in residential and commercial mortgage loans, we may from time to time acquire real property. We may also opportunistically acquire and manage other types of mortgage-related and financial assets not listed above, such as mortgage servicing rights, or "MSRs," and non-mortgage-related derivatives. We also have made, and may in the future make, investments in the debt and/or equity of, other entities engaged in mortgage-related businesses, such as mortgage originators and other mortgage-related entities. In connection with investments in mortgage originators, we may also enter into flow agreements that will allow us to purchase new loans from the mortgage originators in which we invest in accordance with the parameters set forth in the applicable flow agreement.
Our Credit portfolio (as described below), which includes all of our assets other than Agency RMBS, has been the primary driver of our risk and return, and we expect that this will continue in the near to medium term. We also maintain a highly leveraged portfolio of Agency RMBS to take advantage of opportunities in that market sector and to maintain our exclusion from registration as an investment company under the Investment Company Act. Unless we acquire very substantial amounts of whole mortgage loans or there are changes to the rules and regulations applicable to us under the Investment Company Act, we expect that we will maintain a core amount of Agency RMBS.
Historically, our Credit portfolio was primarily focused on U.S. non-Agency RMBS. While we believe investment opportunities in U.S. non-Agency MBS remain, we believe other asset classes currently offer more attractive returns as well as portfolio diversification. These asset classes include consumer loans and ABS backed by consumer loans; residential and commercial mortgage loans, which can be performing, or non-performing, or sub-performing; CLOs; European non-dollar denominated investments; other mortgage-related structured investments; private debt and/or equity investments in mortgage originators and other mortgage-related entities; and corporate debt and equity. Our investments in these asset classes, together with our non-Agency mortgage-backed securities, or "MBS," and real estate owned, are collectively referred to as our Credit portfolio.
We believe that we have been organized and have operated so that we have qualified, and will continue to qualify, to be treated for U.S. federal income tax purposes as a partnership and not as an association or a publicly traded partnership taxable as a corporation.
Our Manager and Ellington
We are externally managed and advised by our Manager, an affiliate of Ellington, pursuant to a management agreement. Our Manager was formed solely to serve as our manager and does not have any other clients. In addition, our Manager currently does not have any employees and instead relies on the employees of Ellington to perform its obligations to us. Ellington is an investment management firm and registered investment advisor with a 22-year history of investing in a broad spectrum of MBS and related derivatives.
The members of our management team include Michael Vranos, founder and Chief Executive Officer of Ellington, who serves as our Co-Chief Investment Officer and a member of our Board of Directors; Laurence Penn, Vice Chairman and Chief Operating Officer of Ellington, who serves as our Chief Executive Officer and President and a member of our Board of Directors; Mark Tecotzky, a Managing Director of Ellington, who serves as our Co-Chief Investment Officer; Lisa Mumford, who serves as our Chief Financial Officer; Daniel Margolis, General Counsel of Ellington, who serves as our General Counsel; and Jason Frank, Associate General Counsel of Ellington, who serves as our Secretary. Each of these individuals is an officer of our Manager.
Our Manager is responsible for administering our business activities and day-to-day operations and, pursuant to a services agreement between our Manager and Ellington, relies on the resources of Ellington to support our operations. Ellington has well-established portfolio management resources for each of our targeted asset classes and an established infrastructure supporting those resources. Through our relationship with our Manager, we benefit from Ellington's highly analytical investment processes, broad-based deal flow, extensive relationships in the financial community, financial and capital structuring skills, investment surveillance database, and operational expertise. For example, Ellington's analytic approach to the investment process involves collection of substantial amounts of data regarding historical performance of MBS collateral and MBS market transactions. Ellington analyzes this data to identify possible relationships and trends and develops financial models used to support our investment and risk management process. In addition, throughout Ellington's 22-year investing history, it has developed strong relationships with a wide range of dealers and other market participants that provide Ellington access to a broad range of trading opportunities and market information. As a result, Ellington provides us with access to a wide variety of asset acquisition and disposition opportunities and information that assist us in making asset management decisions across our targeted asset classes, which we believe provides us with a significant competitive advantage. We also benefit from
4
Ellington's finance, accounting, operational, legal, compliance, and administrative functions.
As of December 31, 2016, Ellington employed over 160 employees and had assets under management of approximately $5.9 billion, of which approximately $4.4 billion consisted of our company, as well as Ellington Residential Mortgage REIT, a real estate investment trust for U.S. federal income tax purposes, or "REIT," listed on the New York Stock Exchange, or the "NYSE" under the ticker "EARN," and various hedge funds and other alternative investment vehicles that employ financial leverage, and approximately $1.5 billion consisted of accounts that do not employ financial leverage.
Our Strategy
We utilize an opportunistic strategy to seek to provide investors with attractive, risk-adjusted total returns by:
|
•
|
taking advantage of opportunities in the residential mortgage market by purchasing investment grade and non-investment grade non-Agency RMBS, including U.S. and non-U.S. senior and subordinated securities;
|
|
•
|
acquiring Agency RMBS on a more leveraged basis in order to take advantage of opportunities in that market sector and assist us in maintaining our exclusion from registration as an investment company under the Investment Company Act;
|
|
•
|
acquiring consumer loans and ABS backed by consumer loans;
|
|
•
|
acquiring CMBS, commercial mortgage loans, and other commercial real estate debt instruments;
|
|
•
|
acquiring residential mortgage loans, including mortgage loans that are not deemed "qualified mortgage," or "QM," loans under the rules of the Consumer Financial Protection Bureau, or "non-QM loans," and legacy (i.e., issued before the 2008 financial crisis) non-performing and re-performing residential mortgage loans, or "residential NPLs";
|
|
•
|
acquiring CLOs, with a current focus on legacy securities;
|
|
•
|
acquiring corporate debt and equity, including distressed debt and equity;
|
|
•
|
opportunistically entering into and managing a portfolio of mortgage-related and non-mortgage-related derivatives;
|
|
•
|
opportunistically acquiring and managing other mortgage-related and financial assets, such as MSRs;
|
|
•
|
opportunistically acquiring real estate, such as commercial and residential real property;
|
|
•
|
opportunistically acquiring or making debt and/or equity investments in mortgage originators and other mortgage-related entities; and
|
|
•
|
opportunistically mitigating our credit and interest rate risk by using a variety of hedging instruments.
|
Our strategy is adaptable to changing market environments, subject to compliance with the income and other tests that will allow us to continue to be treated as a partnership for U.S. federal income tax purposes and to maintain our exclusion from registration as an investment company under the Investment Company Act. As a result, although we focus on the assets described above, our acquisition and management decisions depend on prevailing market conditions and our targeted asset classes may vary over time in response to market conditions. We may engage in a high degree of trading volume as we implement our strategy. Our Manager is authorized to follow very broad investment guidelines and, as a result, we cannot predict our portfolio composition. We may change our strategy and policies without a vote of our shareholders. Moreover, although our independent directors may periodically review our investment guidelines and our portfolio, they generally do not review our proposed asset acquisitions or asset management decisions.
Our strategy is primarily focused on mortgage-related and consumer-related investments, including MBS, residential and commercial mortgage loans, consumer loans and ABS backed by consumer loans, and derivatives. We believe that Ellington's capabilities allow our Manager to identify attractive assets in these classes, value these assets, monitor and forecast the performance of these assets, and opportunistically hedge our risk with respect to these assets. Ellington's continued emphasis on and development of proprietary credit, interest rate, and prepayment models, as well as other proprietary research and analytics, underscores the importance it places on a disciplined and analytical approach to fixed income investing. We leverage these skills and resources to seek to meet our investment objectives.
With respect to MBS, Ellington's investment philosophy primarily revolves around the pursuit of value across various types of MBS and related assets. Ellington seeks investments across a wide range of MBS sectors without any restriction as to ratings, structure, or position in the capital structure. Over time and through market cycles, opportunities will present themselves in varying sectors and in varying forms. By rotating between and allocating among various sectors of the MBS markets and adjusting the extent to which it hedges, Ellington believes that it is able to capitalize on the disparities between these sectors as well as on overall trends in the marketplace, and therefore provide better and more consistent returns for its investors. Disparities between MBS sectors vary from time to time and are driven by a combination of factors. For example, as various MBS sectors fall in and out of favor, the relative yields that the market demands for those sectors may vary. In addition,
5
Ellington's performance projections for certain sectors may differ from those of other market participants and such disparities will naturally cause us, from time to time, to gravitate towards certain sectors and away from others. Disparities between MBS sectors and individual securities within such sectors may also be driven by differences in collateral performance (for example, subprime loans originated before 2005 have generally performed better than subprime loans originated between 2005 and 2007) and in the structure of particular investments (for example, in the timing of cash flows or the level of credit enhancement), and our Manager may believe that other market participants are overestimating or underestimating the value of these differences. Furthermore, we believe that risk management, including opportunistic portfolio hedging and prudent financing and liquidity management, is essential for consistent generation of attractive, risk-adjusted total returns across market cycles. Since legacy non-Agency RMBS continue to amortize and there has been a minimal level of new non-Agency RMBS issuance, we believe that there are currently fewer opportunities in this sector to generate high returns, and as a result we have rotated much of our Credit portfolio into other sectors.
We believe that our Manager is uniquely qualified to implement our strategy. Our strategy is consistent with Ellington's investment approach, which is based on its distinctive strengths in sourcing, analyzing, trading, and hedging complex MBS and other mortgage and non-mortgage related products. Furthermore, we believe that Ellington's extensive experience in buying, selling, analyzing, and structuring fixed income securities, coupled with its broad access to market information and trading flows, provides us with a steady flow of opportunities to acquire assets with favorable trade executions.
We also employ a wide variety of hedging instruments and derivative contracts. See "—Risk Management."
Our Targeted Asset Classes
Our targeted asset classes currently include:
|
Asset Class
|
Principal Assets
|
|
|
Non-Agency RMBS
|
.
|
RMBS backed by prime jumbo, Alt-A, manufactured housing, and subprime mortgages;
|
|
.
|
RMBS backed by fixed rate mortgages, Adjustable rate mortgages, or "ARMs," Option-ARMs, and Hybrid ARMs;
|
|
|
.
|
RMBS backed by first lien and second lien mortgages;
|
|
|
.
|
Investment grade and non-investment grade securities;
|
|
|
.
|
Senior and subordinated securities;
|
|
|
.
|
Interest only securities, or "IOs," principal only securities, or "POs," inverse interest only securities, or "IIOs," and inverse floaters; and
|
|
|
.
|
collateralized debt obligations, or "CDOs."
|
|
|
Agency RMBS
|
.
|
Whole pool pass-through certificates;
|
|
.
|
Partial pool pass-through certificates;
|
|
|
.
|
Agency collateralized mortgage obligations, or "CMOs," including IOs, POs and IIOs; and
|
|
|
.
|
To-Be-Announced mortgage pass-through certificates, or "TBAs."
|
|
|
Mortgage-Related Derivatives
|
.
|
Credit default swaps, or "CDS," on individual RMBS, on the ABX, CMBX and PrimeX indices and on other mortgage-related indices; and
|
|
.
|
Other mortgage-related derivatives.
|
|
|
Consumer Loans and ABS
|
.
|
Consumer loans; and
|
|
.
|
ABS backed by consumer loans.
|
|
|
CMBS and Commercial Mortgage Loans
|
.
|
CMBS; and
|
|
.
|
Commercial mortgages and other commercial real estate debt.
|
|
|
Residential Mortgage Loans
|
.
|
residential NPLs; and
|
|
.
|
non-QM loans.
|
|
6
|
CLOs
|
.
|
CLOs, with a focus on legacy securities.
|
|
Corporate Debt and Equity and Derivatives
|
.
|
Corporate debt or equity, including distressed debt and equity;
|
|
.
|
CDS on corporations or on corporate indices, or "CDX," and
|
|
|
.
|
Options or total return swaps on corporate equity or debt or on corporate equity indices.
|
|
|
Other
|
.
|
Real estate, including commercial and residential real property;
|
|
.
|
Strategic debt and/or equity investments in mortgage originators and other mortgage -related entities;
|
|
|
.
|
MSRs; and
|
|
|
.
|
Other non-mortgage-related derivatives;
|
|
The following briefly discusses the principal types of assets we purchase.
Non-Agency RMBS
We acquire non-Agency RMBS backed by prime jumbo, Alt-A, manufactured housing, and subprime residential mortgage loans. Our non-Agency RMBS holdings can include investment-grade and non-investment grade classes, including non-rated classes. We also acquire European non-dollar denominated non-Agency RMBS.
Non-Agency RMBS are generally debt obligations issued by private originators of, or investors in, residential mortgage loans. Non-Agency RMBS generally are issued as CMOs and are backed by pools of whole mortgage loans or by mortgage pass-through certificates. Non-Agency RMBS generally are securitized in senior/subordinated structures, or in excess spread/over-collateralization structures. In senior/subordinated structures, the subordinated tranches generally absorb all losses on the underlying mortgage loans before any losses are borne by the senior tranches. In excess spread/over-collateralization structures, losses are first absorbed by any existing over-collateralization, then borne by subordinated tranches and excess spread, which represents the difference between the interest payments received on the mortgage loans backing the RMBS and the interest due on the RMBS debt tranches, and finally by senior tranches and any remaining excess spread.
Agency RMBS
Our assets in this asset class consist primarily of whole pool (and to a lesser extent, partial pool) pass-through certificates, the principal and interest of which are guaranteed by a federally chartered corporation, such as the Federal National Mortgage Association, or "Fannie Mae," the Federal Home Loan Mortgage Corporation, or "Freddie Mac," or the Government National Mortgage Association, within the U.S. Department of Housing and Urban Development, or "Ginnie Mae," and which are backed by ARMs, Hybrid ARMs, or fixed rate mortgages. In addition to investing in pass-through certificates which are backed by traditional mortgages, we have also invested in Agency RMBS backed by reverse mortgages. Reverse mortgages are mortgage loans for which neither principal nor interest is due until the borrower dies, the home is sold, or other trigger events occur. Mortgage pass-through certificates are securities representing undivided interests in pools of mortgage loans secured by real property where payments of both interest and principal, plus prepaid principal, on the securities are made monthly to holders of the security, in effect "passing through" monthly payments made by the individual borrowers on the mortgage loans that underlie the securities, net of fees paid to the issuer/guarantor and servicers of the securities. Whole pool pass-through certificates are mortgage pass-through certificates that represent the entire ownership of (as opposed to merely a partial undivided interest in) a pool of mortgage loans.
TBAs
In addition to investing in specific pools of Agency RMBS, we utilize forward-settling purchases and sales of Agency RMBS where the underlying pools of mortgage loans are TBAs. Pursuant to these TBA transactions, we agree to purchase or sell, for future delivery, Agency RMBS with certain principal and interest terms and certain types of underlying collateral, but the particular Agency RMBS to be delivered is not identified until shortly before the TBA settlement date. TBAs are liquid and have quoted market prices and represent the most actively traded class of MBS. We use TBAs primarily for hedging purposes. TBA trading is based on the assumption that mortgage pools that are eligible to be delivered at TBA settlement are fungible and thus the specific mortgage pools to be delivered do not need to be explicitly identified at the time a trade is initiated.
We primarily engage in TBA transactions for purposes of managing certain risks associated with our investment
7
strategies. The principal risks that we use TBAs to mitigate are interest rate and yield spread risks. For example, we may hedge the interest rate and/or yield spread risk inherent in our long Agency RMBS by taking short positions in TBAs that are similar in character. Alternatively, we may engage in TBA transactions because we find them attractive in their own right, from a relative value perspective or otherwise.
Mortgage-Related Derivatives
We take long and short positions in various mortgage-related derivative instruments, including credit default swaps. A credit default swap is a credit derivative contract in which one party (the protection buyer) pays an ongoing periodic premium (and often an upfront payment as well) to another party (the protection seller) in return for compensation for default (or similar credit event) by a reference entity. In this case, the reference entity can be an individual MBS or an index of several MBS, such as an ABX, PrimeX, or CMBX index. Payments from the protection seller to the protection buyer typically occur if a credit event takes place. A credit event can be triggered by, among other things, the reference entity's failure to pay its principal obligations or a severe ratings downgrade of the reference entity.
Consumer Loans and ABS
We acquire U.S. consumer whole loans and ABS backed by U.S. consumer loans. Since the financial crisis, tighter bank underwriting standards have reduced credit availability to many creditworthy consumers. Non-bank lenders are filling the gap by lending to these consumers, thereby creating loans that offer investors an attractive combination of high coupon and short duration. We believe that our consumer loan investments offer attractive loss-adjusted yields and serve to enhance, as well as diversify, the sources of returns for our Credit portfolio. Our U.S. consumer loan portfolio primarily consists of unsecured loans, but also includes secured auto loans. We are currently purchasing newly originated consumer loans under flow agreements with a variety of originators, and we continue to evaluate new opportunities. We seek to purchase newly originated consumer loans from originators that have demonstrated disciplined underwriting with a significant focus on regulatory compliance and sound lending practices. Our ABS backed by U.S. consumer loans consist of retained tranches of our consumer loan securitization. Through securitization of our consumer loans, we are essentially able to achieve long-term financing for the securitized pool.
We also acquire non-dollar denominated ABS backed by European non-performing consumer loans. We believe that non-performing consumer loans in certain select markets, such as in Spain and Portugal, present attractive return profiles, and we are actively pursuing additional opportunities in these and other countries.
CMBS
We acquire CMBS, which are securities collateralized by mortgage loans on commercial properties. The majority of CMBS issued are fixed rate securities backed by fixed rate loans made to multiple borrowers on a variety of property types, though single-borrower CMBS and floating rate CMBS have also been issued. We also acquire European non-dollar denominated CMBS.
The majority of CMBS utilize senior/subordinate structures, similar to those found in non-Agency RMBS. Subordination levels vary so as to provide for one or more AAA credit ratings on the most senior classes, with less senior securities rated investment grade and non-investment grade, including a first loss component which is typically unrated. This first loss component is commonly referred to as the "B-piece," which is the most subordinated (and therefore highest yielding and riskiest) tranche of a CMBS securitization. Most of our focus within the CMBS sector has been in B-pieces, and our recent holdings have consisted almost entirely of new issue B-pieces.
In October 2014, U.S. risk retention rules, or the "U.S. Risk Retention Rules," adopted pursuant to Section 941 of the Dodd-Frank Wall Street Reform and Consumer Protection Act, or the "Dodd-Frank Act," were issued. The U.S. Risk Retention Rules require the sponsor of a debt securitization subject to such rules, in the absence of an exemption (such as the exemption described below for CMBS), to retain (directly or through a majority-owned affiliate) a 5% economic interest in the credit risk of the assets being securitized. The retained economic interest may take the form of an eligible horizontal residual interest (retention of the most subordinated tranches of the securitization), an eligible vertical interest (retention of 5% of every tranche of the securitization), or a combination thereof, in accordance with the requirements of the U.S. Risk Retention Rules. The U.S. Risk Retention Rules became effective for CMBS on December 24, 2016.
Under the U.S. Risk Retention Rules, there is a specific exemption that permits a CMBS sponsor to satisfy some or all of its risk retention requirements if, among other requirements, a third-party purchaser acquires and retains a B-piece that is an eligible horizontal residual interest in the same form, amount and manner as would be required of the sponsor. A B-piece buyer may not transfer its interest for five years following the closing of the CMBS, and, even after five years, may only transfer its interest to a different B-piece buyer satisfying the criteria applicable to initial B-piece buyers.
8
As noted above, pursuant to the eligible vertical interest retention model, CMBS sponsors may satisfy the U.S. Risk Retention Rules by retaining 5% of the face amount of every tranche of a new CMBS securitization. Under this approach, 95% of the B-piece remains tradeable in the same manner as B-pieces prior to the adoption of the U.S. Risk Retention Rules. We expect to continue buying tradeable B-pieces in this manner and will continue to evaluate opportunities created from the new U.S. Risk Retention Rules.
Commercial Mortgage Loans and Other Commercial Real Estate Debt
We acquire commercial mortgage loans, which are loans secured by liens on commercial properties, including retail, office, industrial, hotel, and multi-family properties. Loans may be fixed or floating rate and will generally range from two to ten years. Commercial real estate debt typically limits the borrower's right to freely prepay for a period of time through provisions such as prepayment fees, lockout, yield maintenance, or defeasance provisions.
First lien loans may be structured as whole loans, or alternatively bifurcated into a senior participation interest, or "A-Note," and a subordinated participation interest, or "B-Note." The rights of an A-Note or B-Note holder are typically governed by an intercreditor agreement which sets forth the respective rights and obligations of the holders, with the B-Note's entitlement to principal and interest subordinated to that of the A-Note.
A subordinate loan may be structured simply as a second mortgage, or alternatively as a mezzanine loan, which is a loan secured by the pledge of the borrower's ownership interests in the property, and therefore subordinate to any mortgage loan but senior to the borrower's equity in the property. An intercreditor agreement typically governs the rights of a second mortgage or mezzanine loan relative to a first mortgage loan, with the second mortgage loan's or mezzanine loan's entitlement to interest and principal subordinated to that of the first mortgage loan.
Commercial real estate loans may also be structured into more complicated senior/subordinate structures, including those providing for multiple B-Note or multiple mezzanine loan senior/subordinate components. A loan or a component of a loan may have only one lender, or pari passu participation interests may be issued to multiple lenders. Loans are generally privately negotiated, and so structures can vary based on the specific facts and circumstances relating to the loan, property and borrower, among other things.
We acquire commercial mortgage loans that may be non-performing, underperforming, or otherwise distressed; these are typically acquired at a discount both to their unpaid principal balances and to the value of the underlying real estate. In addition, we also opportunistically participate in the origination of "bridge" loans, which have shorter terms and higher interest rates than more traditional commercial mortgage loans. Bridge loans are typically secured by properties in transition, where the borrower is in the process of either re-developing or stabilizing operations at the property. Within both our distressed and bridge loan strategies, we focus on smaller balance loans and loan packages that are less-competitively-bid. These loans typically have balances that are less than $20 million, and are secured by real estate and, in some cases, a personal guarantee from the borrower. Properties securing these loans may include multi-family, retail, office, industrial and other commercial property types. We believe that Ellington's asset management expertise and hands-on approach allows us to tailor resolution strategies most appropriate for each individual asset, and thereby enhance expected returns.
Residential Mortgage Loans
Our residential mortgage loans include non-QM loans and residential NPLs. A non-QM loan is not necessarily high-risk, nor subprime, but is instead a loan that does not conform to the complex QM rules. For example, many non-QM loans are made to creditworthy borrowers who cannot provide traditional documentation for income, such as borrowers who are self-employed. There is also demand from certain creditworthy borrowers for loans above a 43% debt-to-income ratio limit that still meet all ability-to-repay standards. We hold an equity investment in a non-QM originator that has had a steadily increasing volume of origination, and we have purchased all of our non-QM loans from this originator. To date, the performance of our non-QM loan portfolio has been excellent, and the number of states where our origination partner is producing loans has increased according to expectations.
We remain active in the market for residential NPLs. The market for large residential NPL pools has remained highly concentrated, with the great majority having traded to only a handful of large players who typically securitize the residential NPLs that they purchase. As a result, we have continued to focus our acquisitions on smaller, less-competitively-bid, and more attractively-priced mixed legacy pools sourced from motivated sellers. We seek to optimize resolutions based on the capital structure, borrower and underlying real estate.
9
CLOs
We acquire CLOs, a form of asset-backed security collateralized by syndicated corporate loans. To date, we have primarily acquired legacy CLOs. Our current CLO holdings include mezzanine and equity interests, and are concentrated in securitizations that have exited the reinvestment period. We invest in CLOs denominated in U.S. dollars, as well as in non-dollar denominated European CLOs.
We acquire corporate debt and equity, both distressed and non-distressed, and both secured and unsecured. Our corporate debt investments currently consist primarily of syndicated bank loans to middle market companies. Distressed corporate debt instruments are typically obligations of companies that are experiencing distress or dislocation resulting from over-leveraged capital structures or other financial or operational issues. These companies may default on their obligations, or be involved in bankruptcy or restructuring proceedings. In addition to making outright purchases of distressed corporate loans, we also acquire exposure to distressed corporate loans synthetically through total return swaps. In connection with our investments in distressed corporate debt, we may also acquire the equity of reorganized corporations that have exited bankruptcy.
We take long and short positions in corporate debt and equity (including indices on corporate debt and equity) either outright in the “cash” markets, or synthetically by entering into derivative contracts such as credit default swaps, total return swaps, and options. A credit event relating to a credit default swap on an individual corporation or an index of corporate credits would typically be triggered by a corporation's bankruptcy or its failure to make a scheduled payment on a debt obligation. We take positions in the corporate debt and equity markets both for investment purposes and for hedging purposes. When used for hedging purposes, they do not necessarily serve to hedge against risks that are directly related to specific corporate entities or indices, but rather they may reflect our belief that the performance of certain entities or indices may have a reasonable degree of correlation with the performance of certain other parts of our portfolio.
A total return swap is a derivative whereby one party makes payments to the other representing the total return on a reference debt or equity security (or index of debt or equity securities) in exchange for an agreed upon ongoing periodic premium. An equity option is a derivative that gives the holder the option to buy or sell an equity security or index of securities at a predetermined price within a certain time period. The option may reference the equity of a publicly traded company or an equity index. In addition to general market risk, our derivatives on corporate debt and equity are subject to risks related to the underlying corporate entities.
Other Assets
Our other assets include real estate, including residential and commercial real property, strategic debt and/or equity investments in mortgage originators, and other non-mortgage related derivatives. We do not typically purchase real property directly; rather, our real estate ownership usually results from foreclosure activity with respect to our acquired residential and commercial loans. We have made investments in mortgage originators and other mortgage-related entities in the form of debt and/or equity and, to date, our investments represent non-controlling interests. We have also entered into flow agreements with certain of the mortgage originators in which we have invested. We have not yet acquired MSRs, but we may do so in the future.
Investment Process
Our investment process benefits from the resources and professionals of our Manager and Ellington. The process is managed by an investment and risk management committee, which includes, among others, the following three officers of our Manager: Messrs. Vranos, Penn, and Tecotzky. These officers of our Manager also serve as our Co-Chief Investment Officer; Chief Executive Officer; and Co-Chief Investment Officer, respectively. The investment and risk management committee operates under investment guidelines and meets periodically to develop a set of preferences for the composition of our portfolio. The primary focus of the investment and risk management committee, as it relates to us, is to review and approve our investment policies and our portfolio holdings and related compliance with our investment policies and guidelines. The investment and risk management committee has authority delegated by our Board of Directors to authorize transactions consistent with our investment guidelines.
Ellington has a focused investment team for each of our targeted asset classes. Each team evaluates acquisition opportunities consistent with the guidelines developed and maintained by our Manager's investment and risk management committee. Our asset acquisition process includes sourcing and screening of asset acquisition opportunities, credit analysis, due diligence, structuring, financing, and hedging, each as appropriate, to seek attractive total returns commensurate with our risk tolerance. We also screen and monitor potential assets to determine their impact on maintaining our exclusion from registration as an investment company under the Investment Company Act and our qualification as a partnership for U.S. federal income tax purposes.
10
Valuation of Assets
Our Manager's valuation process is subject to the oversight of our Manager's Valuation Committee as well as the oversight of the independent members of our Board of Directors. See Note 2 of the notes to the consolidated financial statements included in this report for a complete discussion of our valuation process.
Risk Management
Risk management is a cornerstone of Ellington's portfolio management process. Ellington's risk management infrastructure system includes "ELLiN," a proprietary portfolio management system that Ellington uses for all of its accounts, which provides real time and batch reporting to all departments at Ellington, including trading, research, risk management, finance, operations, accounting, and compliance. We benefit from Ellington's comprehensive risk management infrastructure and ongoing assessment of both portfolio and operational risks. In addition, we utilize derivatives and other hedging instruments to opportunistically hedge our credit, interest rate, and foreign currency risk.
Credit Risk Hedging
We enter into credit-hedging positions in order to protect against adverse credit events with respect to our non-Agency holdings. Throughout most of 2016, our credit hedges consisted primarily of financial instruments tied to high-yield corporate credit. However, as of the end of 2016, we had significantly reduced our hedging positions tied to high-yield corporate credit. Our credit hedging portfolio can vary significantly from period to period, and can encompass a wide variety of financial instruments, including corporate debt or equity-related instruments, RMBS or CMBS-related instruments, or instruments involving other markets. Our hedging instruments can include both “single-name” instruments (i.e., instruments referencing one underlying entity or security) and hedging instruments referencing indices. We also often opportunistically overlay our credit hedges with certain relative value long/short positions involving the same or similar instruments.
Interest Rate Hedging
We opportunistically hedge our interest rate risk by using various hedging strategies to mitigate such risks. The interest rate hedging instruments that we use and may use in the future include, without limitation:
|
•
|
TBAs;
|
|
•
|
interest rate swaps (including floating-to-fixed, fixed-to-floating, or more complex swaps such as floating-to-inverse floating, callable or non-callable);
|
|
•
|
CMOs;
|
|
•
|
U.S. Treasury securities;
|
|
•
|
swaptions, caps, floors, and other derivatives on interest rates;
|
|
•
|
futures and forward contracts; and
|
|
•
|
options on any of the foregoing.
|
In particular, from time to time we enter into short positions in interest rate swaps to offset the potential adverse effects that changes in interest rates will have on the value of certain of our assets and our financing costs. An interest rate swap is an agreement to exchange interest rate cash flows, calculated on a notional principal amount, at specified payment dates during the life of the agreement. Typically, one party pays a fixed interest rate and receives a floating interest rate and the other party pays a floating interest rate and receives a fixed interest rate. Each party's payment obligation is computed using a different interest rate. In an interest rate swap, the notional principal is generally not exchanged. We may also use interest rate-related instruments to hedge certain non-interest-related risks that we believe are correlated to interest rates. For example, to the extent that we believe that swap spreads (i.e., the difference between interest rate swap yields and U.S. Treasury yields) are correlated to credit spreads, we may take a position in swap spreads to hedge our credit spread risk. We may also opportunistically enter into swap spreads trades, or other interest rate-related trades, for speculative purposes.
Foreign Currency Hedging
To the extent we hold instruments denominated in currencies other than U.S. dollars, we may enter into transactions to offset the potential adverse effects of changes in currency exchange rates. In particular, we may use currency forward contracts and other currency-related derivatives to mitigate this risk.
Liquidity Management
As part of the risk management and liquidity management functions that our Manager performs for us, our Manager
11
computes a "cash buffer," which, at any given point in time, represents the amount of our free cash in excess of what our Manager estimates would conservatively be required, especially in times of market dislocation, to support our particular assets and liabilities at such time. Thus, rather than focusing solely on our leverage, our Manager typically seeks to maintain a positive cash buffer. However, our Manager is not required to maintain a positive cash buffer and may choose not to maintain a positive cash buffer at certain times, including, for example, if it believes there are compelling market opportunities to pursue.
Our Financing Strategies and Use of Leverage
We finance our assets with what we believe to be a prudent amount of leverage, the level of which varies from time to time based upon the particular characteristics of our portfolio, availability of financing, and market conditions. As of December 31, 2016, our debt financings consisted primarily of reverse repurchase agreements, or "reverse repos." Currently, the majority of our reverse repos are collateralized by Agency RMBS; however, we also have reverse repo borrowings that are collateralized by our non-Agency assets, which from time to time may also include reverse repos on U.S. Treasury securities. In a reverse repo, we sell an asset to a counterparty at a discounted value, or the loan amount, and simultaneously agree to repurchase the same asset from such counterparty at a specified later date at a price equal to the loan amount plus an interest factor. Despite being legally structured as sales and subsequent repurchases, reverse repos are accounted for as collateralized borrowings. During the term of a reverse repo, we generally receive the income and other payments distributed with respect to the underlying assets, and pay interest to the counterparty. While the proceeds of our reverse repo financings are often used to purchase the assets subject to the transaction, our financing arrangements do not restrict our ability to use proceeds from these arrangements to support our other liquidity needs. Our reverse repo arrangements are typically documented under the Securities Industry and Financial Markets Association's, or "SIFMA's," standard form master repurchase agreement with the ability for both parties to demand margin (i.e., to demand that the other party post additional collateral or repay a portion of the funds advanced) should the value of the underlying assets and posted collateral change. As the value of our collateral fluctuates, under most of our master repurchase agreements, we and our reverse repo counterparties are required to post additional collateral to each other from time to time as part of the normal course of our business. Our reverse repo financing counterparties generally have the right, to varying degrees, to determine the value of the underlying collateral for margining purposes, subject to the terms and conditions of our agreement with the counterparty. As of December 31, 2016, we had approximately $1.0 billion outstanding on reverse repos with twenty-one counterparties. As of December 31, 2016, in addition to debt financings in the form of reverse repos, we had securitized debt in the amount of $24.1 million. Given that we had approximately $644.8 million of equity as of December 31, 2016, our debt-to-equity ratio was 1.64 to 1. Our debt-to-equity ratio does not account for liabilities other than debt financings.
We may utilize other types of borrowings in the future, including term facilities or other more complex financing structures. We also may raise capital by issuing debt securities, preferred or common shares, warrants, or other securities.
Our use of leverage, especially in order to increase the amount of assets supported by our capital base, may have the effect of increasing losses when these assets underperform. Our investment policies require no minimum or maximum leverage and our Manager's investment and risk management committee has the discretion, without the need for further approval by our Board of Directors, to change both our overall leverage and the leverage used for individual asset classes. Because our strategy is flexible, dynamic, and opportunistic, our overall leverage will vary over time. As a result, we do not have a targeted debt-to-equity ratio.
Management Agreement
We entered into a management agreement with our Manager upon our inception in August 2007, pursuant to which our Manager provides for the day-to-day management of our operations.
The management agreement, which was most recently amended and restated effective November 3, 2015, requires our Manager to manage our assets, operations, and affairs in conformity with the policies and the investment guidelines that are approved and monitored by our Board of Directors. Our Manager is under the supervision and direction of our Board of Directors. Our Manager is responsible for:
|
•
|
the selection, purchase, and sale of assets in our portfolio;
|
|
•
|
our financing activities;
|
|
•
|
providing us with advisory services; and
|
|
•
|
providing us with a management team, inclusive of a partially dedicated Chief Financial Officer and appropriate support personnel as necessary.
|
Our Manager is responsible for our day-to-day operations and performs (or causes to be performed) such services and activities relating to the management, operation, and administration of our assets and liabilities, and business as may be
12
appropriate.
Under the management agreement, we pay our Manager a management fee quarterly in arrears, which includes a "base" component and an "incentive" component, and we reimburse certain expenses of our Manager.
Although we have not done so to date, if we invest at issuance in the equity of any CDO that is managed, structured, or originated by Ellington or one of its affiliates, or if we invest in any other investment fund or other investment for which Ellington or one of its affiliates receives management, origination, or structuring fees, the base management and incentive fees payable by us to our Manager will be reduced by (or our Manager will otherwise rebate to us) an amount equal to the applicable portion of any such related management, origination, or structuring fees.
The management agreement provides that 10% of each incentive fee payable to our Manager is to be paid in common shares, with the balance paid in cash; provided, however, that our Manager may, in its sole discretion, elect to receive a greater percentage of any incentive fee in the form of common shares by providing our Board of Directors with written notice of its election to receive a greater percentage of its incentive fee in common shares before the first day of the last calendar month in the quarter to which such incentive fee relates. Our management agreement further provides that our Manager may not elect to receive common shares as payment of its incentive fee, other than in accordance with all applicable securities exchange rules and securities laws (including prohibitions on insider trading). The number of our common shares to be received by our Manager is based on the fair market value of those common shares, which is determined based on the average of the closing prices of our common shares as reported by the NYSE during the last calendar month of the quarter to which such incentive fee relates. Common shares delivered as payment of the incentive fee are immediately vested, provided that our Manager has agreed not to sell such common shares prior to one year after the date they are issued to our Manager, provided further, however, that this transfer restriction will immediately lapse if the management agreement is terminated.
Base Management Fees, Incentive Fees, and Reimbursement of Expenses
Base Management Fees
Under the management agreement, we pay our Manager a base management fee quarterly in arrears in an amount equal to 1.50% per annum of the equity of the Operating Partnership (calculated in accordance with U.S Generally Accepted Accounting Principles, or "U.S. GAAP," as of the end of each fiscal quarter (before deductions for base management and incentive fees payable with respect to such fiscal quarter), provided that the equity of the Operating Partnership is adjusted to exclude one-time events pursuant to changes in U.S. GAAP, as well as non-cash charges after discussion between our Manager and our independent directors, and approval by a majority of our independent directors in the case of non-cash charges.
Incentive Fees
In addition to the base management fee, with respect to each fiscal quarter we pay our Manager an incentive fee equal to the excess, if any, of (i) the product of (A) 25% and (B) the excess of (1) our Adjusted Net Income (described below) for the Incentive Calculation Period (which means such fiscal quarter and the immediately preceding three fiscal quarters) over (2) the sum of the Hurdle Amounts (described below) for the Incentive Calculation Period, over (ii) the sum of the incentive fees already paid or payable for each fiscal quarter in the Incentive Calculation Period preceding such fiscal quarter.
For purposes of calculating the incentive fee, "Adjusted Net Income" for the Incentive Calculation Period means the net increase/(decrease) in equity resulting from operations of the Operating Partnership (or such equivalent U.S. GAAP measure based on the basis of presentation of our consolidated financial statements), after all base management fees but before any incentive fees for such period, and excluding any non-cash equity compensation expenses for such period, as reduced by any Loss Carryforward (as described below) as of the end of the fiscal quarter preceding the Incentive Calculation Period. Adjusted Net Income will be adjusted to exclude one-time events pursuant to changes in U.S. GAAP, as well as non-cash charges after discussion between our Manager and our independent directors and approval by a majority of our independent directors in the case of non-cash charges. For the avoidance of doubt, Adjusted Net Income includes both net investment income and net realized and unrealized gains and losses.
For purposes of calculating the incentive fee, the "Loss Carryforward" as of the end of any fiscal quarter is calculated by determining the excess, if any, of (1) the Loss Carryforward as of the end of the immediately preceding fiscal quarter over (2) the net increase in equity resulting from operations of the Operating Partnership (expressed as a positive number) or the net decrease in equity resulting from operations of the Operating Partnership (expressed as a negative number) for such fiscal quarter (or such equivalent U.S. GAAP measures as may be appropriate depending on the basis of presentation of our consolidated financial statements), as the case may be, calculated in accordance with U.S. GAAP, adjusted to exclude one-time events pursuant to changes in U.S. GAAP, as well as non-cash charges after discussion between our Manager and our independent directors and approval by a majority of our independent directors in the case of non-cash charges.
13
For purposes of calculating the incentive fee, the "Hurdle Amount" means, with respect to any fiscal quarter, the product of (i) one-fourth of the greater of (A) 9% and (B) 3% plus the 10-year U.S. Treasury rate for such fiscal quarter, (ii) the sum of (A) the weighted average gross proceeds per share of all common share and operating partnership unit, or "OP Unit," issuances since our inception and up to the end of such fiscal quarter, with each issuance weighted by both the number of shares and OP Units issued in such issuance and the number of days that such issued shares and OP Units were outstanding during such fiscal quarter, using a first-in first-out basis of accounting (i.e. attributing any share and OP Unit repurchases to the earliest issuances first) and (B) the result obtained by dividing (I) retained earnings attributable to common shares and OP Units at the beginning of such fiscal quarter by (II) the average number of common shares and OP Units outstanding for each day during such fiscal quarter, (iii) the sum of the average number of common shares, long term incentive plan units, or "LTIP Units," and OP Units outstanding for each day during such fiscal quarter. For purposes of determining the Hurdle Amount, issuances of common shares and OP Units (a) as equity incentive awards, (b) to the Manager as part of its base management fee or incentive fee and (c) to the Manager or any of its affiliates in privately negotiated transactions, are excluded from the calculation. The payment of the incentive fee will be in a combination of common shares and cash, provided that at least 10% of any quarterly payment will be made in common shares.
Reimbursement of Expenses
We do not maintain an office or employ personnel. We rely on the facilities and resources of our Manager to conduct our operations. We pay all of our direct operating expenses, except those specifically required to be borne by our Manager under the management agreement. Our Manager is responsible for all costs incident to the performance of its duties under the management agreement, including compensation of Ellington's employees and other related expenses, other than our allocable portion of the costs incurred by our Manager for certain dedicated or partially dedicated employees including, a Chief Financial Officer, one or more controllers, an in-house legal counsel, an investor relations professional, certain internal audit staff in connection with Sarbanes-Oxley compliance initiatives and other personnel performing duties for us, based on the portion of their working time and efforts spent on our matters and subject to approval of the reimbursed amounts by the Compensation Committee of the Board of Directors. In addition, other than as expressly described in the management agreement, we are not required to pay any portion of rent, telephone, utilities, office furniture, equipment, machinery, and other office, internal and overhead expenses of our Manager and its affiliates. Expense reimbursements to our Manager are made within 60 days following delivery of the expense statement by our Manager.
Term and Termination
The management agreement has a current term that expires on December 31, 2017, and will automatically renew for a one year term on each anniversary date thereafter unless notice of non-renewal is delivered by either party to the other party at least 180 days prior to the expiration of the then current term. Our independent directors review our Manager's performance annually, and the management agreement may be terminated annually upon the affirmative vote of at least two-thirds of our independent directors, or by the affirmative vote of the holders of at least a majority of the outstanding common shares, based upon unsatisfactory performance by our Manager that is materially detrimental to us or a determination by our independent directors that the fees payable to our Manager are not fair, subject to our Manager's right to prevent a fee-based termination by accepting a mutually acceptable reduction of its fees. In the event we terminate the management agreement without cause or elect not to renew the management agreement, we will be required to pay our Manager a termination fee equal to the amount of three times the sum of (i) the average annual base management fee earned by our Manager during the 24-month period immediately preceding the date of notice of termination or non-renewal, calculated as of the end of the most recently completed fiscal quarter prior to the date of notice of termination or non-renewal and (ii) the average annual incentive fee earned by our Manager during the 24-month period immediately preceding the date of notice of termination or non-renewal, calculated as of the end of the most recently completed fiscal quarter prior to the date of notice of termination or non-renewal.
We may also terminate the management agreement without payment of the termination fee with 30 days prior written notice from our Board of Directors for cause, which is defined as:
|
•
|
our Manager's continued material breach of any provision of the management agreement following a period of 30 days after written notice of such breach;
|
|
•
|
our Manager's fraud, misappropriation of funds, or embezzlement against us;
|
|
•
|
our Manager's gross negligence in performance of its duties under the management agreement;
|
|
•
|
the occurrence of certain events with respect to the bankruptcy or insolvency of our Manager, including, but not limited to, an order for relief in an involuntary bankruptcy case or our Manager authorizing or filing a voluntary bankruptcy petition;
|
|
•
|
the dissolution of our Manager; and
|
14
|
•
|
certain changes of control of our Manager, including but not limited to the departure of Mr. Vranos from senior management of Ellington, whether through resignation, retirement, withdrawal, long-term disability, death or termination of employment with or without cause or for any other reason.
|
Our Manager may terminate the management agreement effective upon 60 days prior written notice of termination to us in the event that we default in the performance or observance of any material term, condition or covenant in the management agreement and the default continues for a period of 30 days after written notice to us specifying the default and requesting that the default be remedied in such 30-day period. In the event our Manager terminates the management agreement due to our default in the performance or observance of any material term, condition, or covenant in the management agreement, we will be required to pay our Manager the termination fee. Our Manager may also terminate the management agreement in the event we become regulated as an investment company under the Investment Company Act, with such termination deemed to occur immediately prior to such event; provided, however, that in the case of such termination, if our Manager was not at fault for our becoming regulated as an investment company under the Investment Company Act, we will be required to pay a termination fee.
Conflicts of Interest; Equitable Allocation of Opportunities
Ellington manages, and expects to continue to manage, other funds, accounts, and vehicles that have strategies that are similar to, or that overlap with, our strategy, including Ellington Residential Mortgage REIT, a REIT listed on the NYSE. As of December 31, 2016, Ellington managed various funds, accounts, and other vehicles that have strategies that are similar to, or that overlap with, our strategy, that have assets under management of approximately $4.8 billion, excluding our assets but including $1.5 billion of accounts that do not employ financial leverage. Ellington makes available to our Manager all opportunities to acquire assets that it determines, in its reasonable and good faith judgment, based on our objectives, policies and strategies, and other relevant factors, are appropriate for us in accordance with Ellington's written investment allocation policy, it being understood that we might not participate in each such opportunity, but will on an overall basis equitably participate with Ellington's other accounts in all such opportunities. Ellington's Investment and Risk Management Committee and its Compliance Committee (headed by its Chief Compliance Officer) are responsible for monitoring the administration of, and facilitating compliance with, Ellington's investment allocation procedures and policies.
Because many of our targeted assets are typically available only in specified quantities and are also targeted assets for other Ellington accounts, Ellington often is not able to buy as much of any given asset as required to satisfy the needs of all its accounts. In these cases, Ellington's investment allocation procedures and policies typically allocate such assets to multiple accounts in proportion to their needs and available capital. Ellington may at times allocate opportunities on a preferential basis to accounts that are in a "start-up" or "ramp-up" phase. The policies permit departure from such proportional allocation under certain circumstances, including, for example, when such allocation would result in an inefficiently small amount of the security being purchased for an account. In that case, the policy allows for a protocol of allocating assets so that, on an overall basis, each account is treated equitably. In addition, as part of these policies, we may be excluded from specified allocations of assets for tax, regulatory, risk management, or similar reasons.
Other policies of Ellington that our Manager applies to the management of our company include controls for:
|
•
|
Cross Transactions—
defined as transactions between us or one of our subsidiaries, on the one hand, and an account (other than us or one of our subsidiaries) managed by Ellington or our Manager, on the other hand. It is Ellington's policy to engage in a cross transaction only when the transaction is in the best interests of, and is consistent with the objectives and policies of, both accounts involved in the transaction. Pursuant to the terms of the management agreement, Ellington or our Manager may enter into cross transactions where it acts both on our behalf and on behalf of the other party to the transaction. Although we believe such restrictions on our Manager's ability to engage in cross transactions on our behalf mitigate many risks, cross transactions, even at market prices, may potentially create a conflict of interest between our Manager's and our officers' duties to and interests in us and their duties to and interests in the other party. Upon written notice to our Manager, we may at any time revoke our consent to our Manager's executing cross transactions. Additionally, unless approved in advance by a majority of our independent directors or pursuant to and in accordance with a policy that has been approved by a majority of our independent directors, all cross transactions must be effected at the then-prevailing market prices. Pursuant to our Manager's current policies and procedures, assets for which there are no readily observable market prices may be purchased or sold in cross transactions (i) at prices based upon third-party bids received through auction, (ii) at the average of the highest bid and lowest offer quoted by third-party dealers, or (iii) according to another pricing methodology approved by our Manager's Chief Compliance Officer.
|
|
•
|
Principal Transactions—
defined as transactions between Ellington or our Manager (or any related party of Ellington or our Manager, which includes employees of Ellington and our Manager and their families), on the one hand, and us or one of our subsidiaries, on the other hand. Certain cross transactions may also be considered principal transactions
|
15
whenever our Manager or Ellington (or any related party of Ellington or our Manager, which includes employees of Ellington and our Manager and their families) have a substantial ownership interest in one of the transacting parties. Our Manager is only authorized to execute principal transactions with the prior approval of a majority of our independent directors and in accordance with applicable law. Such prior approval includes approval of the pricing methodology to be used, including with respect to assets for which there are no readily observable market prices.
|
•
|
Investment in other Ellington accounts—
pursuant to our management agreement, although we have not done so to date, if we invest at issuance in the equity of any CDO that is managed, structured, or originated by Ellington or one of its affiliates, or if we invest in any other investment fund or other investment for which Ellington or one of its affiliates receives management, origination, or structuring fees, the base management and incentive fees payable by us to our Manager will be reduced by an amount equal to the applicable portion (as described in the management agreement) of any such management, origination or structuring fees.
|
|
•
|
Split price executions—
pursuant to our management agreement, our Manager is authorized to combine purchase or sale orders on our behalf together with orders for other accounts managed by Ellington, our Manager or their affiliates and allocate the securities or other assets so purchased or sold, on an average price basis or other fair and consistent basis, among such accounts.
|
Our Manager is authorized to follow very broad investment guidelines. Our independent directors will periodically review our investment guidelines and our portfolio. However, our independent directors generally will not review our proposed asset acquisitions, dispositions, or other management decisions. In addition, in conducting periodic reviews, the independent directors will rely primarily on information provided to them by our Manager. Furthermore, our Manager may arrange for us to use complex strategies or to enter into complex transactions that may be difficult or impossible to unwind by the time they are reviewed by our independent directors. Our Manager has great latitude within our broad investment guidelines to determine the types of assets it may decide are proper for purchase by us. The management agreement with our Manager does not restrict the ability of its officers and employees from engaging in other business ventures of any nature, whether or not such ventures are competitive with our business. We may acquire assets from entities affiliated with our Manager, even where the assets were originated by such entities. Affiliates of our Manager may also provide services to entities in which we have invested.
Our executive officers and the officers and employees of our Manager are also officers and employees of Ellington, and we compete with other Ellington accounts for access to these individuals. We have not adopted a policy that expressly prohibits our directors, officers, security holders, or affiliates from having a direct or indirect pecuniary interest in any asset to be acquired or disposed of by us or any of our subsidiaries or in any transaction to which we or any of our subsidiaries is a party or has an interest, nor do we have a policy that expressly prohibits any such persons from engaging for their own account in business activities of the types conducted by us. However, our code of business conduct and ethics contains a conflicts of interest policy that prohibits our directors, officers, and employees, as well as employees of our Manager who provide services to us, from engaging in any transaction that involves an actual or apparent conflict of interest with us, absent approval by the Board of Directors or except as expressly set forth above or as provided in the management agreement between us and our Manager. In addition, nothing in the management agreement binds or restricts our Manager or any of its affiliates, officers, or employees from buying, selling, or trading any securities or commodities for their own accounts or for the accounts of others for whom our Manager or any of its affiliates, officers, or employees may be acting.
Competition
In acquiring our assets, we compete with mortgage REITs, specialty finance companies, savings and loan associations, banks, mortgage bankers, insurance companies, mutual funds, institutional investors, investment banking firms, financial institutions, governmental bodies, and other entities. Many of our competitors are significantly larger than us, have greater access to capital and other resources, and may have other advantages over us. Our competitors may include other investment vehicles managed by Ellington or its affiliates, including Ellington Residential Mortgage REIT. In addition to existing companies, other companies may be organized for similar purposes in the future, including companies focused on purchasing mortgage assets. A proliferation of such companies may increase the competition for equity capital and thereby adversely affect the market price of our common shares. An increase in the competition for sources of funding could adversely affect the availability and cost of financing, and thereby adversely affect the market price of our common shares. In addition, some of our competitors may have higher risk tolerances or different risk assessments, which could allow them to consider a wider variety of assets, or pay higher prices, than we can.
In the face of this competition, we have access to our Manager's and Ellington's professionals and their industry expertise, which may provide us with a competitive advantage and help us assess risks and determine appropriate pricing for certain potential assets. In addition, we believe that these relationships enable us to compete more effectively for attractive asset acquisition opportunities. However, we may not be able to achieve our business goals or expectations due to the competitive risks that we face.
16
Operating and Regulatory Structure
Tax Requirements
We believe that we have been organized and have operated so that we have qualified, and will continue to qualify, to be treated for U.S. federal income tax purposes as a partnership and not as an association or a publicly traded partnership taxable as a corporation. In general, an entity that is treated as a partnership for U.S. federal income tax purposes is not subject to U.S. federal income tax at the entity level, except that, for taxable years beginning after December 31, 2017, a partnership will be required to pay the taxes attributable to an audit assessment, unless the partnership elects to pass through the tax to its partners. Consequently, holders of our common shares will be required to take into account their allocable share of items of our income, gain, loss, deduction, and credit for our taxable year ending within or with their taxable year, regardless of whether we make cash distributions on a current basis with which to pay any resulting tax.
We believe that we are treated, and will continue to be treated, as a publicly traded partnership. Publicly traded partnerships are generally treated as partnerships for U.S. federal income tax purposes as long as they satisfy certain income and other tests on an ongoing basis. We believe that we have satisfied and will continue to satisfy these requirements and that we have been and will continue to be treated as a partnership for U.S. federal income tax purposes, and not taxable as a corporation.
We currently own several domestic and foreign subsidiaries that are treated as corporations for U.S. federal income tax purposes. Our domestic taxable corporate subsidiaries will be subject to U.S. federal, state, and local income tax on their taxable income. We anticipate that our foreign corporate subsidiaries will generally conduct their activities in such a way as not to be deemed to be engaged in a U.S. trade or business and not to be subject to U.S. federal income tax on their net income.
We also have one wholly owned subsidiary that elected to be treated as a REIT under the Internal Revenue Code of 1986, as amended, or the "Code," beginning with its 2015 taxable year. REITs are subject to a number of organizational and operational requirements, including a requirement that they currently distribute at least 90% of their annual REIT taxable income, determined excluding any net capital gains without regard to the deduction for dividends paid. Failure to qualify as a REIT in any taxable year would cause this subsidiary to be subject to U.S. federal income tax on its taxable income at regular corporate rates (and any applicable state and local taxes). Even if this subsidiary qualifies for taxation as a REIT, it may be subject to certain federal, state, local, and non-U.S. taxes on its income. For example, if it forms a taxable REIT subsidiary, or "TRS," the income generated by that subsidiary will be subject to U.S. federal, state, and local income tax.
Investment Company Act Exclusions
Most of our business is conducted through various wholly-owned and majority-owned subsidiaries in a manner such that neither we nor our subsidiaries are subject to registration under the Investment Company Act. Under Section 3(a)(1) of the Investment Company Act, a company is deemed to be an "investment company" if:
|
•
|
it is, or holds itself out as being, engaged primarily, or proposes to engage primarily, in the business of investing, reinvesting, or trading in securities (Section 3(a)(1)(A)); or
|
|
•
|
it is engaged or proposes to engage in the business of investing, reinvesting, owning, holding, or trading in securities and does own or proposes to acquire "investment securities" having a value exceeding 40% of the value of its total assets (excluding U.S. government securities and cash) on an unconsolidated basis, or "the 40% Test" (Section 3(a)(1)(C)). "Investment securities" excludes U.S. government securities and securities of majority-owned subsidiaries that are not themselves investment companies and are not relying on the exception from the definition of investment company for private funds under Section 3(c)(1) or Section 3(c)(7) of the Investment Company Act.
|
We believe we and our Operating Partnership, and a holding company subsidiary of our Operating Partnership, or the "Holding Subsidiary," will not be considered investment companies under Section 3(a)(1) of the Investment Company Act, because we and they satisfy the 40% Test and because we and they do not engage primarily (or hold ourselves or themselves out as being engaged primarily) in the business of investing, reinvesting, or trading in securities. Rather, through wholly-owned or majority-owned subsidiaries, we, our Operating Partnership, and the Holding Subsidiary are primarily engaged in the non-investment company businesses of these subsidiaries.
Our Operating Partnership currently has several subsidiaries that rely on the exclusion provided by Section 3(c)(7) of the Investment Company Act, each a "3(c)(7) subsidiary." In addition, the Holding Subsidiary currently has one 3(c)(7) subsidiary and one subsidiary that relies on the exclusion provided by Section 3(c)(5)(C) of the Investment Company Act, or a "3(c)(5)(C) subsidiary." While investments in 3(c)(7) subsidiaries are considered investment securities for the purposes of the 40% Test, investments in 3(c)(5)(C) subsidiaries are not considered investment securities for the purposes of the 40% Test, nor are investments in subsidiaries that rely on the exclusion provided by Section 3(a)(1)(C).
17
Therefore, our Operating Partnership's investments in its 3(c)(7) subsidiaries and its other investment securities cannot exceed 40% of the value of our Operating Partnership's total assets (excluding U.S. government securities and cash) on an unconsolidated basis. In addition, the Holding Subsidiary's investment in its 3(c)(7) subsidiary and its other investment securities cannot exceed 40% of the value of our Holding Subsidiary's total assets (excluding U.S. government securities and cash) on an unconsolidated basis.
Section 3(c)(5)(C) of the Investment Company Act is designed for entities primarily engaged in the business of "purchasing or otherwise acquiring mortgages and other liens on and interests in real estate." This exclusion generally requires that at least 55% of the entity's assets on an unconsolidated basis consist of qualifying real estate assets and at least 80% of the entity's assets on an unconsolidated basis consist of qualifying real estate assets or real estate-related assets. Both the 40% Test and the requirements of the Section 3(c)(5)(C) exclusion limit the types of businesses in which we may engage and the types of assets we may hold, as well as the timing of sales and purchases of assets.
On August 31, 2011, the SEC published a concept release entitled "Companies Engaged in the Business of Acquiring Mortgages and Mortgage Related Instruments" (Investment Company Act Rel. No. 29778). This release notes that the SEC is reviewing the Section 3(c)(5)(C) exclusion relied upon by companies similar to us that invest in mortgage loans and mortgage-backed securities. There can be no assurance that the laws and regulations governing the Investment Company Act status of companies similar to ours, or the guidance from the Division of Investment Management of the SEC regarding the treatment of assets as qualifying real estate assets or real estate-related assets, will not change in a manner that adversely affects our operations as a result of this review. To the extent that the SEC staff provides more specific guidance regarding any of the matters bearing upon our exclusion from the need to register under the Investment Company Act, we may be required to adjust our strategy accordingly. Any additional guidance from the SEC staff could provide additional flexibility to us, or it could further inhibit our ability to pursue the strategies that we have chosen. Furthermore, although we intend to monitor the assets of the 3(c)(5)(C) subsidiary regularly, there can be no assurance that any such subsidiary will be able to maintain this exclusion from registration. In that case, our investment in any such subsidiary would be classified as an investment security, and we might not be able to maintain our overall exclusion from registering as an investment company under the Investment Company Act.
If we or our subsidiaries were required to register as an investment company under the Investment Company Act, we would become subject to substantial regulation with respect to our capital structure (including our ability to use leverage), management, operations, transactions with affiliated persons (as defined in the Investment Company Act), and portfolio composition, including restrictions with respect to diversification and industry concentration and other matters. Compliance with the restrictions imposed by the Investment Company Act would require us to make material changes to our strategy which could materially adversely affect our business, financial condition and results of operations, and our ability to make distributions to our shareholders. Accordingly, to avoid that result, we may be required to adjust our strategy, which could limit our ability to make certain investments or require us to sell assets in a manner, at a price or at a time that we otherwise would not have chosen. This could negatively affect the value of our common shares, the sustainability of our business model and our ability to make distributions. See "Risk Factors—Maintenance of our exclusion from registration as an investment company under the Investment Company Act imposes significant limitations on our operations."
Investment Advisers Act of 1940
Both Ellington and our Manager are registered as investment advisers under the Investment Advisers Act of 1940, as amended, and are subject to the regulatory oversight of the Division of Investment Management of the SEC.
Staffing
All of our executive officers, and our partially dedicated personnel, which include our Chief Financial Officer, controllers, in-house legal counsel, investor relations professional, and internal audit staff are employees of Ellington or one or more of its affiliates. See "—Management Agreement" above.
Additional Information
A copy of this Annual Report on Form 10-K, as well as our Quarterly Reports on Form 10-Q, Current Reports on Form 8-K, and any amendments to such reports filed or furnished pursuant to Section 13(a) or 15(d) of the Exchange Act are available, free of charge, on our internet website at
www.ellingtonfinancial.com
. All of these reports are made available on our internet website as soon as reasonably practicable after they are electronically filed with or furnished to the SEC. Our Corporate Governance Guidelines and Code of Business Conduct and Ethics and the charters of the Audit, Compensation and Nominating and Corporate Governance Committees of our Board of Directors are also available at
www.ellingtonfinancial.com
and are available in print to any shareholder upon request in writing to Ellington Financial LLC, c/o Investor Relations, 53 Forest Avenue, Old Greenwich, CT 06870. The information on our website is not, and shall not be deemed to be, a part of this report
18
or incorporated into any other filing we make with the SEC.
All reports filed with the SEC may also be read and copied at the SEC's public reference room at 100 F Street, N.E., Washington, D.C. 20549. Further information regarding the operation of the public reference room may be obtained by calling 1-800-SEC-0330. In addition, all of our reports filed with or furnished to the SEC can be obtained at the SEC's website at
www.sec.gov
.
If any of the following risks occurs, our business, financial condition or results of operations could be materially and adversely affected. The risks and uncertainties described below are not the only ones we face. Additional risks and uncertainties not presently known to us, or not presently deemed material by us, may also impair our operations and performance. In connection with the forward-looking statements that appear in our periodic reports on Form 10-Q and Form 10-K, our Current Reports on Form 8-K and our other disclosure documents, you should also carefully review the cautionary statements referred to in such reports and other disclosure documents referred to under "Special Note Regarding Forward-Looking Statements."
Risks Related To Our Business
Difficult conditions in the mortgage and residential real estate markets as well as general market concerns may adversely affect the value of the assets in which we invest and such conditions may persist for the foreseeable future.
Our business is materially affected by conditions in the residential mortgage market, the residential real estate market, the financial markets, and the economy, including inflation, energy costs, unemployment, geopolitical issues, concerns over the creditworthiness of governments worldwide and the stability of the global banking system. In particular, the residential mortgage markets in the U.S. and Europe have experienced a variety of difficulties and challenging economic conditions in the recent past, including defaults, credit losses, and liquidity concerns. Certain commercial banks, investment banks, insurance companies, and mortgage-related investment vehicles incurred extensive losses from exposure to the residential mortgage market as a result of these difficulties and conditions. These factors have impacted investor perception of the risks associated with RMBS, other real estate-related securities and various other asset classes in which we may invest. As a result, values for RMBS, other real estate-related securities and various other asset classes in which we may invest have experienced, and may in the future experience, significant volatility.
In the aftermath of the financial crisis, homeowner access to residential mortgage loans has been substantially limited. Lending standards are significantly more stringent than in past periods, and access to many mortgage products has been severely curtailed or eliminated. This financing limitation has had an impact on new demand for homes, has lowered homeownership rates and impacted home price performance. There is a strong correlation between home price depreciation and mortgage loan delinquencies. Any deterioration of the mortgage market and investor perception of the risks associated with RMBS, residential mortgage loans, real estate-related securities, and various other assets that we acquire could materially adversely affect our business, financial condition and results of operations, and our ability to pay dividends to our shareholders.
The federal conservatorship of Fannie Mae and Freddie Mac and related efforts, along with any changes in laws and regulations affecting the relationship between Fannie Mae, Freddie Mac, and Ginnie Mae and the U.S. Government, may materially adversely affect our business, financial condition and results of operations, and our ability to pay dividends to our shareholders.
The payments we receive on our Agency RMBS depend upon a steady stream of payments on the underlying mortgages and such payments are guaranteed by Fannie Mae, Freddie Mac, or Ginnie Mae. Fannie Mae and Freddie Mac are government-sponsored enterprises, or "GSEs," but their guarantees are not backed by the full faith and credit of the United States. Ginnie Mae, which guarantees MBS backed by federally insured or guaranteed loans primarily consisting of loans insured by the Federal Housing Administration, or "FHA," or guaranteed by the Department of Veterans Affairs, or "VA," is part of a U.S. Government agency and its guarantees are backed by the full faith and credit of the United States.
In September 2008, in response to the deteriorating financial condition of Fannie Mae and Freddie Mac, the U.S. Government placed Fannie Mae and Freddie Mac into the conservatorship of the Federal Housing Finance Agency, or "FHFA," their federal regulator, pursuant to its powers under The Federal Housing Finance Regulatory Reform Act of 2008, a part of the Housing and Economic Recovery Act of 2008. Under this conservatorship, Fannie Mae and Freddie Mac are required to reduce the amount of mortgage loans they own or for which they provide guarantees on Agency RMBS.
Shortly after Fannie Mae and Freddie Mac were placed in federal conservatorship, the Secretary of the U.S. Treasury noted that the guarantee structure of Fannie Mae and Freddie Mac required examination and that changes in the structures of the entities were necessary to reduce risk to the financial system. The future roles of Fannie Mae and Freddie Mac could be
19
significantly reduced, and the nature of their guarantees could be considerably limited relative to historical measurements or even eliminated. The substantial financial assistance provided by the U.S. Government to Fannie Mae and Freddie Mac, especially in the course of their being placed into conservatorship and thereafter, together with the substantial financial assistance provided by the U.S. Government to the mortgage-related operations of other GSEs and government agencies, such as the FHA, VA, and Ginnie Mae, has stirred debate among many federal policymakers over the continued role of the U.S. Government in providing such financial support for the mortgage-related GSEs in particular, and for the mortgage and housing markets in general. In fact, in February 2011, the U.S. Treasury released a white paper entitled "Reforming America's Housing Finance Market" in which the U.S. Treasury outlined three possible options for reforming the U.S. Government's role in housing finance. Under each option, the role of the U.S. Government in the mortgage market would be reduced. The FHFA's "Strategic Plan for Enterprise Conservatorships," as released on February 21, 2012 and updated in May 2014, sets forth three goals for the next phase of the Fannie Mae and Freddie Mac conservatorships. These three goals are to (i) build a new infrastructure for the secondary mortgage market, (ii) gradually reduce Fannie Mae and Freddie Mac's presence in the marketplace while simplifying and shrinking their operations, and (iii) maintain foreclosure prevention activities and credit availability for new and refinanced mortgages. Since the FHFA first released its strategic plan, there have been a number of other proposals introduced, both from industry groups and by the U.S. Congress, many of which could potentially increase private capital flows to the mortgage sector while reducing taxpayer risk. To date, no definitive legislation has been enacted with respect to a possible unwinding of the GSEs or a material reduction in their roles in the U.S. mortgage market, and it is not possible at this time to predict the scope and nature of the actions that the U.S. Government will ultimately take with respect to these GSEs.
As discussed above, Fannie Mae, Freddie Mac, and Ginnie Mae could each be dissolved, and the U.S. Government could determine to stop providing liquidity support of any kind to the mortgage market. If Fannie Mae, Freddie Mac, or Ginnie Mae were eliminated, or their structures were to change radically, or the U.S. Government significantly reduced its support for any or all of them, we may be unable or significantly limited in our ability to acquire Agency RMBS, which would drastically reduce the amount and type of Agency RMBS available for purchase which, in turn, could materially adversely affect our ability to maintain our exclusion from registration as an investment company under the Investment Company Act. Moreover, any changes to the nature of the guarantees provided by, or laws affecting, Fannie Mae, Freddie Mac, and Ginnie Mae could materially adversely affect the credit quality of the guarantees, could increase the risk of loss on purchases of Agency RMBS issued by these GSEs and could have broad adverse market implications for the Agency RMBS they currently guarantee. Any action that affects the credit quality of the guarantees provided by Fannie Mae, Freddie Mac, and Ginnie Mae could materially adversely affect the value of our Agency RMBS. In addition, any market uncertainty that arises from such proposed changes could have a similar impact on us and our Agency RMBS.
In addition, we rely on our Agency RMBS as collateral for our financings under the reverse repos that we enter into. Any decline in their value, or perceived market uncertainty about their value, would make it more difficult for us to obtain financing on our Agency RMBS on acceptable terms or at all, or to maintain compliance with the terms of any financing transactions.
Mortgage loan modification programs and future legislative action may adversely affect the value of, and the returns on, our targeted assets.
The U.S. Government, through the U.S. Treasury, FHA, and the Federal Deposit Insurance Corporation, or "FDIC," commenced implementation of programs designed to provide homeowners with assistance in avoiding mortgage loan foreclosures, including the Home Affordable Refinance Program, or "HARP," which allows borrowers who are current on their mortgage payments to refinance and reduce their monthly mortgage payments at loan-to-value ratios up to 125% without new mortgage insurance. The programs may involve, among other things, the modification of mortgage loans to reduce the principal amount of the loans or the rate of interest payable on the loans, or to extend the payment terms of the loans.
Loan modification and refinance programs may adversely affect the performance of Agency and non-Agency RMBS, and residential mortgage loans. In the case of non-Agency RMBS, a significant number of loan modifications with respect to a given security, including those related to principal forgiveness and coupon reduction, could negatively impact the realized yields and cash flows on such security. Similarly, principal forgiveness and/or coupon reduction could negatively impact the performance of any residential mortgage loans we own. In addition, it is also likely that loan modifications would result in increased prepayments on some RMBS. See "—Prepayment rates can change, adversely affecting the performance of our assets," below.
The U.S. Congress and various state and local legislatures are considering, and in the future may consider, mortgage-related legislation that would affect our business, including legislation that would permit limited assignee liability for certain violations in the mortgage loan origination process, and legislation that would allow judicial modification of loan principal in the event of personal bankruptcy. We cannot predict whether or in what form Congress or the various state and local legislatures may enact legislation affecting our business or whether any such legislation will require us to change our practices
20
or make changes in our portfolio in the future. These changes, if required, could materially adversely affect our business, results of operations and financial condition, and our ability to pay dividends to our shareholders, particularly if we make such changes in response to new or amended laws, regulations or ordinances in any state where we acquire a significant portion of our mortgage loans, or if such changes result in us being held responsible for any violations in the mortgage loan origination process.
The existing loan modification programs, together with future legislative or regulatory actions, including possible amendments to the bankruptcy laws, which result in the modification of outstanding residential mortgage loans and/or changes in the requirements necessary to qualify for refinancing mortgage loans with Fannie Mae, Freddie Mac, or Ginnie Mae, may adversely affect the value of, and the returns on, our assets, which could materially adversely affect our business, financial condition and results of operations, and our ability to pay dividends to our shareholders.
The principal and interest payments on our non-Agency RMBS are not guaranteed by any entity, including any government entity or GSE, and therefore are subject to increased risks, including credit risk.
Our portfolio includes non-Agency RMBS which are backed by residential mortgage loans that do not conform to the Fannie Mae or Freddie Mac underwriting guidelines, including subprime, manufactured housing, Alt-A, and prime jumbo mortgage loans. Consequently, the principal and interest on non-Agency RMBS, unlike those on Agency RMBS, are not guaranteed by GSEs such as Fannie Mae and Freddie Mac or, in the case of Ginnie Mae, the U.S. Government.
Non-Agency RMBS are subject to many of the risks of the respective underlying mortgage loans. A residential mortgage loan is typically secured by single-family residential property and is subject to risks of delinquency and foreclosure and risk of loss. The ability of a borrower to repay a loan secured by a residential property is dependent upon the income or assets of the borrower. A number of factors, including a general economic downturn, unemployment, acts of God, terrorism, social unrest, and civil disturbances, may impair borrowers' abilities to repay their mortgage loans. In periods following home price declines, "strategic defaults" (decisions by borrowers to default on their mortgage loans despite having the ability to pay) also may become more prevalent.
In the event of defaults under mortgage loans backing any of our non-Agency RMBS, we will bear a risk of loss of principal to the extent of any deficiency between the value of the collateral and the principal and accrued interest of the mortgage loan. Additionally, in the event of the bankruptcy of a mortgage loan borrower, the mortgage loan to such borrower will be deemed to be secured only to the extent of the value of the underlying collateral at the time of bankruptcy (as determined by the bankruptcy court), and the lien securing the mortgage loan will be subject to the avoidance powers of the bankruptcy trustee or debtor-in-possession to the extent the lien is unenforceable under state law. Foreclosure of a mortgage loan can be an expensive and lengthy process which could have a substantial negative effect on our anticipated return on the foreclosed mortgage loan. If borrowers default on the mortgage loans backing our non-Agency RMBS and we are unable to recover any resulting loss through the foreclosure process, our business, financial condition and results of operations, and our ability to pay dividends to our shareholders, could be materially adversely affected.
Less stringent underwriting guidelines and the resultant potential for delinquencies or defaults on certain mortgage loans could lead to losses on many of the non-Agency RMBS we hold.
Many, if not most, of the non-Agency RMBS in which we invest are collateralized by Alt-A and subprime mortgage loans, which are mortgage loans that were originated using less stringent underwriting guidelines than those used in underwriting prime mortgage loans (mortgage loans that generally conform to Fannie Mae or Freddie Mac underwriting guidelines). These underwriting guidelines were more permissive as to borrower credit history or credit score, borrower debt-to-income ratio, loan-to-value ratio, and/or as to documentation (such as whether and to what extent borrower income was required to be disclosed or verified). In addition, even when specific underwriting guidelines were represented by loan originators as having been used in connection with the origination of mortgage loans, these guidelines were in many cases not followed as a result of aggressive lending practices, fraud (including borrower or appraisal fraud), or other factors. Mortgage loans that were underwritten pursuant to less stringent or looser underwriting guidelines, or that were poorly underwritten to their stated guidelines, have experienced, and should be expected to experience in the future, substantially higher rates of delinquencies, defaults, and foreclosures than those experienced by mortgage loans that were underwritten in a manner more consistent with Fannie Mae or Freddie Mac guidelines. Thus, because of the higher delinquency rates and losses associated with Alt-A and subprime mortgage loans, the performance of RMBS backed by Alt-A and subprime mortgage loans that we may acquire could be correspondingly adversely affected, which could adversely impact our business, financial condition and results of operations, and our ability to pay dividends to our shareholders.
21
We rely on analytical models and other data to analyze potential asset acquisition and disposition opportunities and to manage our portfolio. Such models and other data may be incorrect, misleading or incomplete, which could cause us to purchase assets that do not meet our expectations or to make asset management decisions that are not in line with our strategy.
Our Manager relies on the analytical models (both proprietary and third-party models) of Ellington and information and data supplied by third parties. These models and data may be used to value assets or potential asset acquisitions and dispositions and also in connection with our asset management activities. If Ellington's models and data prove to be incorrect, misleading, or incomplete, any decisions made in reliance thereon could expose us to potential risks. Our Manager's reliance on Ellington's models and data may induce it to purchase certain assets at prices that are too high, to sell certain other assets at prices that are too low, or to miss favorable opportunities altogether. Similarly, any hedging activities that are based on faulty models and data may prove to be unsuccessful.
Some of the risks of relying on analytical models and third-party data include the following:
|
•
|
collateral cash flows and/or liability structures may be incorrectly modeled in all or only certain scenarios, or may be modeled based on simplifying assumptions that lead to errors;
|
|
•
|
information about assets or the underlying collateral may be incorrect, incomplete, or misleading;
|
|
•
|
asset, collateral or RMBS historical performance (such as historical prepayments, defaults, cash flows, etc.) may be incorrectly reported, or subject to interpretation (e.g., different RMBS issuers may report delinquency statistics based on different definitions of what constitutes a delinquent loan); and
|
|
•
|
asset, collateral or RMBS information may be outdated, in which case the models may contain incorrect assumptions as to what has occurred since the date information was last updated.
|
Some models, such as prepayment models or default models, may be predictive in nature. The use of predictive models has inherent risks. For example, such models may incorrectly forecast future behavior, leading to potential losses. In addition, the predictive models used by our Manager may differ substantially from those models used by other market participants, with the result that valuations based on these predictive models may be substantially higher or lower for certain assets than actual market prices. Furthermore, because predictive models are usually constructed based on historical data supplied by third parties, the success of relying on such models may depend heavily on the accuracy and reliability of the supplied historical data, and, in the case of predicting performance in scenarios with little or no historical precedent (such as extreme broad-based declines in home prices, or deep economic recessions or depressions), such models must employ greater degrees of extrapolation and are therefore more speculative and of more limited reliability.
All valuation models rely on correct market data inputs. If incorrect market data is entered into even a well-founded valuation model, the resulting valuations will be incorrect. However, even if market data is input correctly, "model prices" will often differ substantially from market prices, especially for securities with complex characteristics or whose values are particularly sensitive to various factors. If our market data inputs are incorrect or our model prices differ substantially from market prices, our business, financial condition and results of operations, and our ability to pay dividends to our shareholders could be materially adversely affected.
Valuations of some of our assets are inherently uncertain, may be based on estimates, may fluctuate over short periods of time, and may differ from the values that would have been used if a ready market for these assets existed.
The values of some of the assets in our portfolio are not readily determinable. We value these assets monthly at fair value, as determined in good faith by our Manager, subject to the oversight of our Manager's valuation committee. Because such valuations are inherently uncertain, may fluctuate over short periods of time and may be based on estimates, our Manager's determinations of fair value may differ from the values that would have been used if a ready market for these assets existed or from the prices at which trades occur. Furthermore, we may not obtain third-party valuations for all of our assets. Changes in the fair value of our assets directly impact our net income through recording unrealized appreciation or depreciation of our investments and derivative instruments, and so our Manager's determination of fair value has a material impact on our net income.
While in many cases our Manager's determination of the fair value of our assets is based on valuations provided by third-party dealers and pricing services, our Manager can and does value assets based upon its judgment and such valuations may differ from those provided by third-party dealers and pricing services. Valuations of certain assets are often difficult to obtain or are unreliable. In general, dealers and pricing services heavily disclaim their valuations. Additionally, dealers may claim to furnish valuations only as an accommodation and without special compensation, and so they may disclaim any and all liability for any direct, incidental, or consequential damages arising out of any inaccuracy or incompleteness in valuations, including any act of negligence or breach of any warranty. Depending on the complexity and illiquidity of an asset, valuations of the
22
same asset can vary substantially from one dealer or pricing service to another. Higher valuations of our assets have the effect of increasing the amount of base management fees and incentive fees we pay to our Manager. Therefore, conflicts of interest exist because our Manager is involved in the determination of the fair value of our assets.
Our business, financial condition and results of operations, and our ability to pay dividends to our shareholders could be materially adversely affected if our Manager's fair value determinations of these assets were materially different from the values that would exist if a ready market existed for these assets.
We depend on third-party service providers, including mortgage servicers, for a variety of services related to our non-Agency RMBS, European assets, and whole mortgage loans and loan pools. We are, therefore, subject to the risks associated with third-party service providers.
We depend on a variety of services provided by third-party service providers related to our non-Agency RMBS, European assets, and whole mortgage loans and loan pools. We rely on the mortgage servicers who service the mortgage loans backing our non-Agency RMBS, our European assets, as well as the mortgage loans and loan pools that we own directly, to, among other things, collect principal and interest payments on the underlying mortgages and perform loss mitigation services. These mortgage servicers and other service providers to our non-Agency RMBS and our European assets, such as trustees, bond insurance providers, due diligence vendors, and custodians, may not perform in a manner that promotes our interests. In addition, legislation that has been enacted or that may be enacted in order to reduce or prevent foreclosures through, among other things, loan modifications, may reduce the value of mortgage loans backing our non-Agency RMBS or whole mortgage loans that we acquire. Mortgage servicers may be incentivized by the U.S. Government to pursue such loan modifications, as well as forbearance plans and other actions intended to prevent foreclosure, even if such loan modifications and other actions are not in the best interests of the beneficial owners of the mortgage loans. In addition to legislation that creates financial incentives for mortgage loan servicers to modify loans and take other actions that are intended to prevent foreclosures, legislation has also been adopted that creates a safe harbor from liability to creditors for servicers that undertake loan modifications and other actions that are intended to prevent foreclosures. Finally, legislation has been adopted that delays the initiation or completion of foreclosure proceedings on specified types of residential mortgage loans or otherwise limit the ability of mortgage servicers to take actions that may be essential to preserve the value of the mortgage loans underlying the mortgage servicing rights. Any such limitations are likely to cause delayed or reduced collections from mortgagors and generally increase servicing costs. As a result of these legislative actions, the mortgage loan servicers on which we rely may not perform in our best interests or up to our expectations. If our third-party service providers, including mortgage servicers, do not perform as expected, our business, financial condition and results of operations, and ability to pay dividends to our shareholders may be materially adversely affected.
We rely on mortgage servicers for our loss mitigation efforts, and we also may engage in our own loss mitigation efforts with respect to whole mortgage loans that we own directly. Such loss mitigation efforts may be unsuccessful or not cost effective.
Both default frequency and default severity of mortgage loans are highly dependent on the quality of the mortgage servicer. We depend on the loss mitigation efforts of mortgage servicers and in some cases "special servicers," which are mortgage servicers who specialize in servicing non-performing loans. If mortgage servicers are not vigilant in encouraging borrowers to make their monthly payments, the borrowers are far less likely to make those payments. In addition, for the whole mortgage loans that we own directly, we may engage in our own loss mitigation efforts over and beyond the efforts of the mortgage servicers, including more hands-on mortgage servicer oversight and management, borrower refinancing solicitations, as well as other efforts. Our and our mortgage servicers' loss mitigation efforts may be unsuccessful in limiting delinquencies, defaults, and losses, or may not be cost effective, which may materially adversely affect our business, financial condition and results of operations, and our ability to pay dividends to our shareholders.
We may be affected by deficiencies in foreclosure practices of third parties, as well as related delays in the foreclosure process.
One of the biggest risks overhanging the RMBS market has been uncertainty around the timing and ability of servicers to foreclose on defaulted loans, so that they can liquidate the underlying properties and ultimately pass the liquidation proceeds through to RMBS holders. Given the magnitude of the housing crisis, and in response to the well-publicized failures of many servicers to follow proper foreclosure procedures (such as involving "robo-signing"), mortgage servicers are being held to much higher foreclosure-related documentation standards than they previously were. However, because many mortgages have been transferred and assigned multiple times (and by means of varying assignment procedures) throughout the origination, warehouse, and securitization processes, mortgage servicers are generally having much more difficulty furnishing the requisite documentation to initiate or complete foreclosures. This leads to stalled or suspended foreclosure proceedings, and ultimately additional foreclosure-related costs. Foreclosure-related delays also tend to increase ultimate loan loss severities as a result of property deterioration, amplified legal and other costs, and other factors. Many factors delaying foreclosure, such as borrower
23
lawsuits and judicial backlog and scrutiny, are outside of a servicer's control and have delayed, and will likely continue to delay, foreclosure processing in both judicial states (where foreclosures require court involvement) and non-judicial states. The extension of foreclosure timelines also increases the inventory backlog of distressed homes on the market and creates greater uncertainty about housing prices. The concerns about deficiencies in foreclosure practices of servicers and related delays in the foreclosure process may impact our loss assumptions and affect the values of, and our returns on, our investments in RMBS and residential whole loans.
To the extent that due diligence is conducted on potential assets, such due diligence may not reveal all of the risks associated with such assets and may not reveal other weaknesses in such assets, which could lead to losses.
Before making an investment, our Manager may decide to conduct (either directly or using third parties) certain due diligence. There can be no assurance that our Manager will conduct any specific level of due diligence, or that, among other things, our Manager's due diligence processes will uncover all relevant facts or that any purchase will be successful, which could result in losses on these assets, which, in turn, could adversely affect our business, financial condition and results of operations, and our ability to pay dividends to our shareholders.
Sellers of the mortgage loans that we acquire, or that underlie the non-Agency RMBS in which we invest, may be unable to repurchase defective mortgage loans, which could have a material adverse effect on the value of our loans, or the loans held by the trust that issued the RMBS, and could cause shortfalls in the payments due on the RMBS or losses on the mortgage loans.
Sellers of mortgage loans that we acquire or that are sold to the trusts that issued the non-Agency RMBS in which we invest made various representations and warranties related to the mortgage loans sold by them to us or the trusts that issued the RMBS. If a seller fails to cure a material breach of its representations and warranties with respect to any mortgage loan in a timely manner, then we, or the trustee or the servicer of the loans, may have the right to require that the seller repurchase the defective mortgage loan (or in some cases substitute a performing mortgage loan). It is possible, however, that for financial or other reasons, the seller either may not be capable of repurchasing defective mortgage loans, or may dispute the validity of or otherwise resist its obligation to repurchase defective mortgage loans. The inability or unwillingness of a seller to repurchase defective mortgage loans from us or from a non-Agency RMBS trust in which we invest would likely cause higher rates of delinquencies, defaults, and losses for the mortgage loans we hold, or the mortgage loans backing such non-Agency RMBS, and ultimately greater losses for our investment in such assets.
Our assets include subordinated and lower-rated securities that generally have greater risk of loss than senior and higher-rated securities.
Certain securities that we acquire are deemed by rating agencies to have substantial vulnerability to default in payment of interest and/or principal. Other securities we acquire have the lowest quality ratings or are unrated. Many securities that we acquire are subordinated in cash flow priority to other more "senior" securities of the same securitization. The exposure to defaults on the underlying mortgages is severely magnified in subordinated securities. Certain subordinated securities ("first loss securities") absorb all losses from default before any other class of securities is at risk. Such securities therefore are considered to be highly speculative investments. Also, the risk of declining real estate values, in particular, is amplified in subordinated RMBS, as are the risks associated with possible changes in the market's perception of the entity issuing or guaranteeing them, or by changes in government regulations and tax policies. Accordingly, the subordinated and lower-rated (or unrated) securities in which we invest may experience significant price and performance volatility relative to more senior or higher-rated securities, and they are subject to greater risk of loss than more senior or higher-rated securities which, if realized, could materially adversely affect our business, financial condition and results of operations, and our ability to pay dividends to our shareholders.
Investments in second lien mortgage loans could subject us to increased risk of losses.
We may invest in second-lien mortgage loans or RMBS backed by such loans. If a borrower defaults on a second-lien mortgage loan or on its senior debt (
i.e.,
a first-lien loan, in the case of a residential mortgage loan), or in the event of a borrower bankruptcy, such loan will be satisfied only after all senior debt is paid in full. As a result, if we invest in second-lien mortgage loans and the borrower defaults, we may lose all or a significant part of our investment.
Prepayment rates can change, adversely affecting the performance of our assets.
The frequency at which prepayments (including both voluntary prepayments by borrowers and liquidations due to defaults and foreclosures) occur on mortgage loans, including those underlying our RMBS, is affected by a variety of factors, including the prevailing level of interest rates as well as economic, demographic, tax, social, legal, and other factors. Generally, borrowers tend to prepay their mortgages when prevailing mortgage rates fall below the interest rates on their mortgage loans.
24
Many of the mortgage loans underlying our RMBS were originated in a relatively higher interest rate environment than currently in effect and, therefore, could be prepaid if borrowers are eligible for refinancing. When borrowers prepay their mortgage loans at rates that are faster or slower than expected, it results in prepayments that are faster or slower than expected on such loans or the related RMBS. These faster or slower than expected payments may adversely affect our profitability.
We may purchase securities or loans that have a higher interest rate than the then-prevailing market interest rate. In exchange for this higher interest rate, we may pay a premium to par value to acquire the security or loan. In accordance with U.S. GAAP, we amortize this premium as an expense over the expected term of the security or loan based on our prepayment assumptions. If a security or loan is prepaid in whole or in part at a faster than expected rate, however, we must expense all or a part of the remaining unamortized portion of the premium that was paid at the time of the purchase, which will adversely affect our profitability.
We also may purchase securities or loans that have a lower interest rate than the then-prevailing market interest rate. In exchange for this lower interest rate, we may pay a discount to par value to acquire the security or loan. We accrete this discount as income over the expected term of the security or loan based on our prepayment assumptions. If a security or loan is prepaid at a slower than expected rate, however, we must accrete the remaining portion of the discount at a slower than expected rate. This will extend the expected life of investment portfolio and result in a lower than expected yield on securities and loans purchased at a discount to par.
Prepayment rates generally increase when interest rates fall and decrease when interest rates rise. Since many RMBS, especially fixed rate RMBS, will be discount securities when interest rates are high, and will be premium securities when interest rates are low, these RMBS may be adversely affected by changes in prepayments in any interest rate environment. Prepayment rates are also affected by factors not directly tied to interest rates, and are difficult to predict. Prepayments can also occur when borrowers sell their properties or when borrowers default on their mortgages and the mortgages are prepaid from the proceeds of a foreclosure sale of the underlying property and/or from the proceeds of a mortgage insurance policy or other guarantee. Fannie Mae and Freddie Mac will generally, among other conditions, purchase mortgages that are 120 days or more delinquent from the Agency RMBS pools that they have issued when the cost of guaranteed payments to security holders, including advances of interest at the security coupon rate, exceeds the cost of holding the non-performing loans in their portfolios. Consequently, prepayment rates also may be affected by conditions in the housing and financial markets, which may result in increased delinquencies on mortgage loans. Prepayment rates can also be affected by actions of the GSEs and their cost of capital, general economic conditions, and the relative interest rates on fixed and adjustable rate loans. Additionally, changes in the GSEs' decisions as to when to repurchase delinquent loans can materially impact prepayment rates on Agency RMBS.
The adverse effects of prepayments may impact us in various ways. First, particular investments may experience outright losses, as in the case of IOs and IIOs in an environment of faster actual or anticipated prepayments. Second, particular investments may underperform relative to any hedges that our Manager may have constructed for these assets, resulting in a loss to us. In particular, prepayments (at par) may limit the potential upside of many RMBS to their principal or par amounts, whereas their corresponding hedges often have the potential for unlimited loss. Furthermore, to the extent that faster prepayment rates are due to lower interest rates, the principal payments received from prepayments will tend to be reinvested in lower-yielding assets, which may reduce our income in the long run. Therefore, if actual prepayment rates differ from anticipated prepayment rates our business, financial condition and results of operations, and ability to pay dividends to our shareholders could be materially adversely affected.
Increases in interest rates could negatively affect the value of our assets and increase the risk of default on our assets.
Our fixed rate investments, especially most fixed rate mortgage loans, fixed rate MBS, and most MBS backed by fixed rate mortgage loans, decline in value when long-term interest rates increase. Even in the case of Agency RMBS, the guarantees provided by GSEs do not protect us from declines in market value caused by changes in interest rates. In the case of RMBS backed by ARMs, increases in interest rates can lead to increases in delinquencies and defaults as borrowers become less able to make their mortgage payments following interest payment resets. Additionally, an increase in short-term interest rates would increase the amount of interest owed on our reverse repo borrowings. See "—Interest rate mismatches between our assets and our borrowings may reduce our income during periods of changing interest rates, and increases in interest rates could adversely affect the value of our assets."
An increase in interest rates may cause a decrease in the issuance volumes of certain of our targeted assets, which could adversely affect our ability to acquire targeted assets that satisfy our investment objectives and to generate income and pay dividends.
Rising interest rates generally reduce the demand for mortgage loans due to the higher cost of borrowing. A reduction in the volume of mortgage loans originated may affect the volume of targeted assets available to us, which could adversely affect
25
our ability to acquire assets that satisfy our investment objectives. If rising interest rates cause us to be unable to acquire a sufficient volume of our targeted assets with a yield that is above our borrowing cost, our ability to satisfy our investment objectives and to generate income and pay dividends to our shareholders may be materially and adversely affected.
Interest rate caps on the ARMs and hybrid ARMs that back our RMBS may reduce our net interest margin during periods of rising or high interest rates.
ARMs and hybrid ARMs are typically subject to periodic and lifetime interest rate caps. Periodic interest rate caps limit the amount an interest rate can increase during any given period. Lifetime interest rate caps limit the amount an interest rate can increase through the maturity of the loan. Our borrowings typically are not subject to similar restrictions. Accordingly, in a period of rapidly increasing interest rates, our financing costs could increase without limitation while caps could limit the interest we earn on our RMBS backed by ARMs and hybrid ARMs. This problem is magnified for ARMs and hybrid ARMs that are not fully indexed because such periodic interest rate caps prevent the coupon on the security from fully reaching the specified rate in one reset. Further, some ARMs and hybrid ARMs may be subject to periodic payment caps that result in a portion of the interest being deferred and added to the principal outstanding. As a result, we may receive less cash income on RMBS backed by ARMs and hybrid ARMs than necessary to pay interest on our related borrowings. Interest rate caps on RMBS backed by ARMs and hybrid ARMs could reduce our net interest margin if interest rates were to increase beyond the level of the caps, which could materially adversely affect our business, financial condition and results of operations, and our ability to pay dividends to our shareholders.
Residential mortgage loans, including residential NPLs and non-QM loans, are subject to increased risks.
We acquire and manage residential mortgage loans. Residential mortgage loans, including residential NPLs and non-QM loans, are subject to increased risk of loss. Unlike Agency RMBS, residential mortgage loans generally are not guaranteed by the U.S. Government or any GSE, though in some cases they may benefit from private mortgage insurance. Additionally, by directly acquiring residential mortgage loans, we do not receive the structural credit enhancements that benefit senior tranches of RMBS. A residential whole mortgage loan is directly exposed to losses resulting from default. Therefore, the value of the underlying property, the creditworthiness and financial position of the borrower, and the priority and enforceability of the lien will significantly impact the value of such mortgage loan. In the event of a foreclosure, we may assume direct ownership of the underlying real estate. The liquidation proceeds upon sale of such real estate may not be sufficient to recover our cost basis in the loan, and any costs or delays involved in the foreclosure or liquidation process may increase losses.
Residential mortgage loans are also subject to property damage caused by hazards, such as earthquakes or environmental hazards, not covered by standard property insurance policies, or "special hazard risk," and to reduction in a borrower's mortgage debt by a bankruptcy court, or "bankruptcy risk." In addition, claims may be assessed against us on account of our position as a mortgage holder or property owner, including assignee liability, environmental hazards, and other liabilities. We could also be responsible for property taxes. In some cases, these liabilities may be "recourse liabilities" or may otherwise lead to losses in excess of the purchase price of the related mortgage or property.
If we subsequently resell any whole mortgage loans that we acquire, we may be required to repurchase such loans or indemnify purchasers if we breach representations and warranties.
If we subsequently resell any whole mortgage loans that we acquire, we would generally be required to make customary representations and warranties about such loans to the loan purchaser. Our residential mortgage loan sale agreements and terms of any securitizations into which we sell loans will generally require us to repurchase or substitute loans in the event we breach a representation or warranty given to the loan purchaser. In addition, we may be required to repurchase loans as a result of borrower fraud or in the event of early payment default on a mortgage loan. The remedies available to a purchaser of mortgage loans are generally broader than those available to us against an originating broker or correspondent. Repurchased loans are typically worth only a fraction of the original price. Significant repurchase activity could materially adversely affect our business, financial condition and results of operations, and our ability to pay dividends to our shareholders.
The commercial mortgage loans we acquire and the mortgage loans underlying our CMBS investments are subject to the ability of the commercial property owner to generate net income from operating the property as well as to the risks of delinquency and foreclosure.
Commercial mortgage loans are secured by multi-family or commercial property and are subject to risks of delinquency and foreclosure, and risk of loss that may be greater than similar risks associated with loans made on the security of single-family residential property. The ability of a borrower to repay a loan secured by an income-producing property typically is dependent primarily upon the successful operation of such property rather than upon the existence of independent income or assets of the borrower. If the net operating income of the property is reduced, the borrower's ability to repay the loan may be impaired. Net operating income of an income-producing property can be adversely affected by, among other things:
26
|
•
|
tenant mix;
|
|
•
|
declines in tenant income and/or changes to tenant businesses;
|
|
•
|
property management decisions;
|
|
•
|
property location, condition, and design;
|
|
•
|
new construction of competitive properties;
|
|
•
|
changes in laws that increase operating expenses or limit rents that may be charged;
|
|
•
|
changes in national, regional, or local economic conditions and/or specific industry segments, including the credit and securitization markets;
|
|
•
|
declines in regional or local real estate values;
|
|
•
|
declines in regional or local rental or occupancy rates;
|
|
•
|
increases in interest rates, real estate tax rates, and other operating expenses;
|
|
•
|
costs of remediation and liabilities associated with environmental conditions;
|
|
•
|
the potential for uninsured or underinsured property losses;
|
|
•
|
changes in governmental laws and regulations, including fiscal policies, zoning ordinances and environmental legislation, and the related costs of compliance; and
|
|
•
|
acts of God, terrorist attacks, social unrest, and civil disturbances.
|
In the event of any default under a mortgage loan held directly by us, we will bear a risk of loss to the extent of any deficiency between the value of the collateral and our cost basis in the outstanding principal and accrued interest of the mortgage loan, and any such losses could have a material adverse effect on our cash flow from operations and our ability to pay dividends to our shareholders.
In the event of the bankruptcy of a mortgage loan borrower, the mortgage loan to such borrower will be deemed to be secured only to the extent of the value of the underlying collateral at the time of bankruptcy (as determined by the bankruptcy court), and the lien securing the mortgage loan will be subject to the avoidance powers of the bankruptcy trustee or debtor-in-possession to the extent the lien is unenforceable under state law. Foreclosure of a mortgage loan can be an expensive and lengthy process, which could have a substantial negative effect on our anticipated return on the foreclosed mortgage loan.
CMBS are secured by a single commercial mortgage loan or a pool of commercial mortgage loans. Accordingly, the CMBS we invest in are subject to all of the risks of the respective underlying commercial mortgage loans.
Our investments in CMBS are at risk of loss.
Our investments in CMBS are at risk of loss. In general, losses on real estate securing a mortgage loan included in a securitization will be borne first by the owner of the property, then by the holder of a mezzanine loan or B-Note, if any, then by the "first loss" subordinated security holder (generally, the B-piece buyer) and then by the holder of a higher-rated security. In the event of losses on mortgage loans included in a securitization and the subsequent exhaustion of any applicable reserve fund, letter of credit, or classes of securities junior to those in which we invest, we may not be able to recover all of our investment in the securities we purchase. In addition, if any of the real estate underlying the securitization mortgage portfolio has been overvalued by the originator, or if real estate values subsequently decline and, as a result, less collateral is available to satisfy interest and principal payments due on the related CMBS, we may incur losses. The prices of lower credit quality securities are generally less sensitive to interest rate changes than more highly rated investments, but more sensitive to adverse economic downturns or individual issuer developments.
We may not control the special servicing of the mortgage loans included in the CMBS in which we invest and, in such cases, the special servicer may take actions that could adversely affect our interests.
With respect to the CMBS in which we invest, overall control over the special servicing of the related underlying mortgage loans will be held by a "directing certificateholder" or a "controlling class representative," which is generally appointed by the holders of the most subordinate class of CMBS in such series. In connection with the servicing of the specially serviced mortgage loans, the related special servicer may, at the direction of the directing certificateholder, take actions with respect to the specially serviced mortgage loans that could adversely affect our interests. For further discussion of the risks of our reliance on special servicers, see above "—We rely on mortgage servicers for our loss mitigation efforts, and we also may engage in our own loss mitigation efforts with respect to whole mortgage loans that we own directly. Such loss mitigation efforts may be unsuccessful or not cost effective."
27
A portion of our investments currently are, and in the future may be, in the form of non-performing and sub-performing commercial mortgage loans, or loans that may become non-performing or sub-performing, which are subject to increased risks relative to performing loans.
A portion of our investments currently are, and in the future may be, in the form of commercial whole mortgage loans, including subprime commercial mortgage loans and non-performing and sub-performing commercial mortgage loans, which are subject to increased risks of loss. Such loans may already be, or may become, non-performing or sub-performing for a variety of reasons, including because the underlying property is too highly leveraged or the borrower falls upon financial distress. Such non-performing or sub-performing loans may require a substantial amount of workout negotiations and/or restructuring, which may divert the attention of our Manager from other activities and entail, among other things, a substantial reduction in the interest rate, capitalization of interest payments, and a substantial write-down of the principal of the loan. However, even if such restructuring were successfully accomplished, a risk exists that the borrower will not be able or willing to maintain the restructured payments or refinance the restructured mortgage upon maturity. In addition, our ability to accomplish such restructuring may be limited by the tax rules governing publicly traded partnerships.
In addition, certain non-performing or sub-performing loans that we acquire may have been originated by financial institutions that are or may become insolvent, suffer from serious financial stress, or are no longer in existence. As a result, the standards by which such loans were originated, the recourse to the selling institution, and/or the standards by which such loans are being serviced or operated may be adversely affected. Further, loans on properties operating under the close supervision of a mortgage lender are, in certain circumstances, subject to certain additional potential liabilities that may exceed the value of our investment.
In the future, it is possible that we may find it necessary or desirable to foreclose on some, if not many, of the loans we acquire, and the foreclosure process may be lengthy and expensive. Borrowers or junior lenders may resist mortgage foreclosure actions by asserting numerous claims, counterclaims, and defenses against us including, without limitation, numerous lender liability claims and defenses, even when such assertions may have no basis in fact, in an effort to prolong the foreclosure action and force the lender into a modification of the loan or capital structure or a favorable buy-out of the borrower's or junior lender's position. In some states, foreclosure actions can sometimes take several years or more to litigate. At any time prior to or during the foreclosure proceedings, the borrower may file, or a junior lender may cause the borrower to file, for bankruptcy, which would have the effect of staying the foreclosure actions and further delaying the foreclosure process. Foreclosure and associated litigation may create a negative public perception of the related mortgaged property, resulting in a diminution of its value. Even if we are successful in foreclosing on a loan, the liquidation proceeds upon sale of the underlying real estate may not be sufficient to recover our cost basis in the loan, resulting in a loss to us, and the borrower and junior lenders may continue to challenge whether the foreclosure process was commercially reasonable, which could result in additional costs and potential liability. Any costs or delays involved in the effectuation of a foreclosure of the loan or a liquidation of the underlying property, or defending challenges brought after the completion of a foreclosure, will further reduce the liquidation proceeds and thus increase the loss. Any such reductions could materially and adversely affect the value we realize from the commercial loans in which we invest.
Whether or not our Manager has participated in the negotiation of the terms of any such mortgage loans, there can be no assurance as to the adequacy of the protection of the terms of the loan, including the validity or enforceability of the loan and the maintenance of the anticipated priority and perfection of the applicable security interests. Furthermore, claims may be asserted that might interfere with enforcement of our rights. In the event of a foreclosure, we may assume direct ownership of the underlying real estate. The liquidation proceeds upon sale of such real estate may not be sufficient to recover our cost basis in the loan, resulting in a loss to us.
Commercial whole mortgage loans are also subject to special hazard risk and to bankruptcy risk. In addition, claims may be assessed against us on account of our position as mortgage holder or property owner, including assignee liability, responsibility for tax payments, environmental hazards and other liabilities. In some cases, these liabilities may be "recourse liabilities" or may otherwise lead to losses in excess of the purchase price of the related mortgage or property.
Our real estate assets and our real estate-related assets (including mortgage loans and MBS) are subject to the risks associated with real property.
We own assets secured by real estate, we own real estate directly, and may acquire additional real estate directly in the future, either through direct acquisitions or upon a default of mortgage loans. Real estate assets are subject to various risks, including:
|
•
|
continued declines in the value of real estate;
|
|
•
|
acts of God, including earthquakes, floods, and other natural disasters, which may result in uninsured losses;
|
|
•
|
acts of war or terrorism, including the consequences of terrorist attacks, such as those that occurred on September 11,
|
28
2001;
|
•
|
adverse changes in national and local economic and market conditions;
|
|
•
|
changes in governmental laws and regulations, fiscal policies and zoning ordinances and the related costs of compliance with laws and regulations, fiscal policies and zoning ordinances;
|
|
•
|
costs of remediation and liabilities associated with environmental conditions such as indoor mold;
|
|
•
|
potential liabilities for other legal actions related to property ownership including tort claims; and
|
|
•
|
the potential for uninsured or under-insured property losses.
|
The occurrence of any of the foregoing or similar events may reduce our return from an affected property or asset and, consequently, materially adversely affect our business, financial condition and results of operations, and our ability to pay dividends to our shareholders.
We engage in short selling transactions, which may subject us to additional risks.
Many of our hedging transactions, and occasionally our investment transactions, are short sales. Short selling may involve selling securities that are not owned and typically borrowing the same securities for delivery to the purchaser, with an obligation to repurchase the borrowed securities at a later date. Short selling allows the investor to profit from declines in market prices to the extent such declines exceed the transaction costs and the costs of borrowing the securities. A short sale may create the risk of an unlimited loss, in that the price of the underlying security might theoretically increase without limit, thus increasing the cost of repurchasing the securities. There can be no assurance that securities sold short will be available for repurchase or borrowing. Repurchasing securities to close out a short position can itself cause the price of the securities to rise further, thereby exacerbating the loss.
We use leverage in executing our business strategy, which may adversely affect the return on our assets and may reduce cash available for distribution to our shareholders, as well as increase losses when economic conditions are unfavorable.
We use leverage to finance our investment activities and to enhance our financial returns. Most of our leverage is in the form of short-term reverse repos for our Agency and Credit portfolio assets. Other forms of leverage may include credit facilities, including term loans and revolving credit facilities.
Through the use of leverage, we may acquire positions with market exposure significantly greater than the amount of capital committed to the transaction. For example, by entering into reverse repos with advance rates, or haircut levels, of 3%, we could theoretically leverage capital allocated to Agency RMBS by a debt-to-equity ratio of as much as 33 to 1. A haircut is the percentage discount that a repo lender applies to the market value of an asset serving as collateral for a repo borrowing, for the purpose of determining whether such repo borrowing is adequately collateralized.
There is no specific limit on the amount of leverage that we may use. Leverage can enhance our potential returns but can also exacerbate losses. Even if an asset increases in value, if the asset fails to earn a return that equals or exceeds our cost of borrowing, the leverage will diminish our returns.
Leverage also increases the risk of our being forced to precipitously liquidate our assets. See below "—Our lenders and derivative counterparties may require us to post additional collateral, which may force us to liquidate assets, and if we fail to post sufficient collateral our debts may be accelerated and/or our derivative contracts terminated on unfavorable terms."
Our access to financing sources, which may not be available on favorable terms, or at all, may be limited, and this may materially adversely affect our business, financial condition and results of operations, and our ability to pay dividends to our shareholders.
We depend upon the availability of adequate capital and financing sources to fund our operations. Our lenders are primarily large global financial institutions, with exposures both to global financial markets and to more localized conditions. For example, several of our lenders are large European-based banks whose financial conditions have still not fully recovered from the 2008 financial crisis. In addition to borrowing from large banks, we borrow from smaller non-bank financial institutions as well. Whether because of a subsequent global or local financial crisis or other circumstances, if one or more of our lenders experiences severe financial difficulties, they or other lenders could become unwilling or unable to provide us with financing, could increase the costs of that financing, or could become insolvent, as was the case with Lehman Brothers in 2008. Moreover, we are currently party to short-term borrowings (in the form of reverse repos) and there can be no assurance that we will be able to replace these borrowings, or "roll" them, as they mature on a continuous basis and it may be more difficult for us to obtain debt financing on favorable terms, or at all. In addition, if regulatory capital requirements imposed on our lenders change, they may be required to limit, or increase the cost of, the financing they provide to us. In general, this could potentially
29
increase our financing costs and reduce our liquidity or require us to sell assets at an inopportune time or price. Consequently, depending on market conditions at the relevant time, we may have to rely on additional equity issuances to meet our capital and financing needs, which may be dilutive to our shareholders, or we may have to rely on less efficient forms of debt financing that consume a larger portion of our cash flow from operations, thereby reducing funds available for our operations, future business opportunities, cash dividends to our shareholders, and other purposes. We cannot assure you that we will have access to such equity or debt capital on favorable terms (including, without limitation, cost and term) at the desired times, or at all, which may cause us to curtail our asset acquisition activities and/or dispose of assets, which could materially adversely affect our business, financial condition and results of operations, and our ability to pay dividends to our shareholders.
Our securitizations may expose us to additional risks.
In order to generate additional cash for funding new investments, we have securitized, and may in the future seek to securitize, certain of our assets, especially our loan assets. Some securitizations are treated as financing transactions for U.S. GAAP, while others are treated as sales. In a typical securitization, we convey assets to a special purpose vehicle, the issuer, which then issues one or more classes of notes secured by the assets pursuant to the terms of an indenture. To the extent that we retain the most subordinated economic interests in the issuer, we would continue to be exposed to losses on the assets for as long as those retained interests remained outstanding and therefore able to absorb such losses. Furthermore, our retained interests in a securitization could be less liquid than the underlying assets themselves. Moreover, even though we might accumulate assets with a view towards possible securitization, we cannot be assured that we will be able to access the securitization market, or be able to do so under favorable terms. The inability to securitize certain segments of our portfolio, especially certain of our loan assets, could hurt our performance and our ability to grow our business.
In connection with our securitizations, we generally are required to prepare disclosure documentation for investors, including term sheets and offering memorandums, which contain information regarding the securitization generally, the notes being issued, and the assets being securitized. If our disclosure documentation for a securitization is alleged or found to contain material inaccuracies or omissions, we may be liable under federal securities laws, state securities laws or other applicable laws for damages to the investors in such securitization, we may be required to indemnify the underwriters of the securitization or other parties, or we may incur other expenses and costs in connection with disputing these allegations or settling claims. Such liabilities, expenses, and/or losses could be significant.
We may be required to make representations and warranties in connection with our securitizations regarding, among other things, certain characteristics of the assets being securitized. If any of the representations and warranties that we have made concerning the assets are alleged or found to be inaccurate, we may incur expenses disputing the allegations, and we may be obligated to repurchase certain assets, which may result in losses. Even if we previously obtained representations and warranties from loan originators or other parties from whom we originally acquired the assets, such representations and warranties may not align with those that we have made for the benefit of the securitization, or may otherwise not protect us from losses (e.g., because of a deterioration in the financial condition of the party that provided representations and warranties to us).
Interest rate mismatches between our assets and our borrowings may reduce our income during periods of changing interest rates, and increases in interest rates could adversely affect the value of our assets.
Some of our assets are fixed rate or have a fixed rate component (such as RMBS backed by hybrid ARMs). This means that the interest we earn on these assets will not vary over time based upon changes in a short-term interest rate index. Although the interest we earn on our RMBS backed by ARMs generally will adjust for changing interest rates, such interest rate adjustments may not occur as quickly as the interest rate adjustments to any related borrowings, and such interest rate adjustments will generally be subject to interest rate caps, which potentially could cause such RMBS to acquire many of the characteristics of fixed rate assets if interest rates were to rise above the cap levels. We generally fund our targeted assets with borrowings whose interest rates reset frequently, and as a result we generally have an interest rate mismatch between our assets and liabilities. While our interest rate hedges are intended to mitigate a portion of this mismatch, the use of interest rate hedges also introduces the risk of other interest rate mismatches and exposures, as will the use of other financing techniques. Additionally, to the extent cash flows from RMBS we hold are reinvested in new RMBS, the spread between the yields of the new RMBS and available borrowing rates may decline, which could reduce our net interest margin or result in losses.
Fixed income assets, including many RMBS, typically decline in value if interest rates increase. If long-term rates were to increase significantly, not only would the market value of these assets be expected to decline, but these assets could lengthen in duration because borrowers would be less likely to prepay their mortgages.
Interest rates are highly sensitive to many factors, including governmental monetary and tax policies, domestic and international economic and political considerations, and other factors beyond our control. In addition, the U.S. Federal Reserve, or the "Federal Reserve," increased the target range for the federal funds rate in December 2015, which was the first such
30
increase since 2006; it increased the target range again in December 2016, and has indicated that further interest rate increases may occur in the near future.
While we opportunistically hedge our exposure to changes in interest rates, there can be no assurance that our hedges will be successful, or that we will be able to enter into or maintain such hedges. As a result, interest rate fluctuations can cause significant losses, reductions in income, and can limit the cash available to pay dividends to our shareholders.
Our investments that are denominated in foreign currencies subject us to foreign currency risk, which may adversely affect our business, financial condition and results of operations, and our ability to pay dividends to our shareholders.
Our investments that are denominated in foreign currencies subject us to foreign currency risk arising from fluctuations in exchange rates between such foreign currencies and the U.S. dollar. While we currently attempt to hedge the vast majority of our foreign currency exposure, we may not always choose to hedge such exposure, or we may not be able to hedge such exposure. To the extent that we are exposed to foreign currency risk, changes in exchange rates of such foreign currencies to the U.S. dollar may adversely affect our business, financial condition and results of operations, and our ability to pay dividends to our shareholders.
Our lenders and derivative counterparties may require us to post additional collateral, which may force us to liquidate assets, and if we fail to post sufficient collateral our debts may be accelerated and/or our derivative contracts terminated on unfavorable terms.
Most of our reverse repo agreements and our derivative contracts allow, to varying degrees, our lenders and derivative counterparties (including clearinghouses) to determine an updated market value of our collateral and derivative contracts to reflect current market conditions. If the market value of our collateral or our derivative contracts with a particular lender or derivative counterparty declines in value, we generally will be required by the lender or derivative counterparty to provide additional collateral or repay a portion of the funds advanced on minimal notice, which is known as a margin call. Posting additional collateral will reduce our liquidity and limit our ability to leverage our assets. Additionally, in order to satisfy a margin call, we may be required to liquidate assets at a disadvantageous time, which could cause us to incur further losses and adversely affect our results of operations, financial condition, and may impair our ability to pay dividends to our shareholders. We receive margin calls from our lenders and derivative counterparties from time to time in the ordinary course of business similar to other entities in the specialty finance business. In the event we default on our obligation to satisfy these margin calls, our lenders or derivative counterparties can accelerate our indebtedness, terminate our derivative contracts (potentially on unfavorable terms requiring additional payments, including additional fees and costs), increase our borrowing rates, liquidate our collateral, and terminate our ability to borrow. In certain cases, a default on one reverse repo agreement or derivative contract (whether caused by a failure to satisfy margin calls or another event of default) can trigger "cross defaults" on other such agreements. A significant increase in margin calls could materially adversely affect our business, financial condition and results of operations, and our ability to pay dividends to our shareholders, and could increase our risk of insolvency.
Hedging against credit events, interest rate changes, and other risks may materially adversely affect our business, financial condition and results of operations, and our ability to pay dividends to our shareholders.
We opportunistically pursue various hedging strategies to seek to reduce our exposure to losses from adverse credit events, interest rate changes, foreign currency fluctuations, and other risks. Hedging against a decline in the values of our portfolio positions does not prevent losses if the values of such positions decline, or eliminate the possibility of fluctuations in the value of our portfolio. Hedging transactions generally will limit the opportunity for gain should the values of our other portfolio positions increase. Further, certain hedging transactions could result in our experiencing significant losses. Moreover, at any point in time we may choose not to hedge all or a portion of our risks, and we generally will not hedge those risks that we believe are appropriate for us to take at such time, or that we believe would be impractical or prohibitively expensive to hedge. Even if we do choose to hedge certain risks, for a variety of reasons we generally will not seek to establish a perfect correlation between our hedging instruments and the risks being hedged. Any such imperfect correlation may prevent us from achieving the intended hedge and expose us to risk of loss. Our hedging activity will vary in scope based on the composition of our portfolio, our market views, and changing market conditions, including the level and volatility of interest rates. When we do choose to hedge, hedging may fail to protect or could materially adversely affect us because, among other things:
|
•
|
our Manager may fail to correctly assess the degree of correlation between the hedging instruments and the assets being hedged;
|
|
•
|
our Manager may fail to recalculate, re-adjust, and execute hedges in an efficient and timely manner;
|
|
•
|
the hedging transactions may actually result in poorer overall performance for us than if we had not engaged in the hedging transactions;
|
|
•
|
credit hedging can be expensive, particularly when the market is forecasting future credit deterioration and when
|
31
markets are more illiquid;
|
•
|
interest rate hedging can be expensive, particularly during periods of volatile interest rates;
|
|
•
|
available hedges may not correspond directly with the risks for which protection is sought;
|
|
•
|
the durations of the hedges may not match the durations of the related assets or liabilities being hedged;
|
|
•
|
many hedges are structured as over-the-counter contracts with counterparties whose creditworthiness is not guaranteed, raising the possibility that the hedging counterparty may default on their payment obligations;
|
|
•
|
to the extent that the creditworthiness of a hedging counterparty deteriorates, it may be difficult or impossible to terminate or assign any hedging transactions with such counterparty; and
|
|
•
|
our hedging instruments are generally structured as derivative contracts and, as a result, are subject to additional risks such as those described above under "—Our lenders and derivative counterparties may require us to post additional collateral, which may force us to liquidate assets, and if we fail to post sufficient collateral our debts may be accelerated and/or our derivative contracts terminated on unfavorable terms" and below under"—Our use of derivatives may expose us to counterparty risk."
|
For these and other reasons, our hedging activity may materially adversely affect our business, financial condition and results of operations, and our ability to pay dividends to our shareholders.
Hedging instruments and other derivatives, including some credit default swaps, may not, in many cases, be traded on exchanges, or may not be guaranteed or regulated by any U.S. or foreign governmental authority and involve risks and costs that could result in material losses.
Hedging instruments and other derivatives, including certain types of credit default swaps, involve risk because they may not, in many cases, be traded on exchanges and may not be guaranteed or regulated by any U.S. or foreign governmental authorities. Consequently, for these instruments, there may be less stringent requirements with respect to record keeping and compliance with applicable statutory and commodity and other regulatory requirements and, depending on the identity of the counterparty, applicable international requirements. Our Manager is not restricted from dealing with any particular counterparty or from concentrating any or all of its transactions with one counterparty. Furthermore, our Manager has only a limited internal credit function to evaluate the creditworthiness of its counterparties, mainly relying on its experience with such counterparties and their general reputation as participants in these markets. The business failure of a hedging counterparty with whom we enter into a hedging transaction will most likely result in a default under the agreement governing the hedging arrangement. Default by a party with whom we enter into a hedging transaction, such as occurred with Lehman Brothers in 2008, may result in losses and may force us to re-initiate similar hedges with other counterparties at the then-prevailing market levels. Generally we will seek to reserve the right to terminate our hedging transactions upon a counterparty's insolvency, but absent an actual insolvency, we may not be able to terminate a hedging transaction without the consent of the hedging counterparty, and we may not be able to assign or otherwise dispose of a hedging transaction to another counterparty without the consent of both the original hedging counterparty and the potential assignee. If we terminate a hedging transaction, we may not be able to enter into a replacement contract in order to cover our risk. There can be no assurance that a liquid secondary market will exist for hedging instruments purchased or sold, and therefore we may be required to maintain any hedging position until exercise or expiration, which could adversely affect our business, financial condition and results of operations, and our ability to pay dividends to our shareholders.
The U.S. Commodity Futures Trading Commission, or "CFTC," and certain commodity exchanges have established limits referred to as speculative position limits or position limits on the maximum net long or net short position which any person or group of persons may hold or control in particular futures and options. Limits on trading in options contracts also have been established by the various options exchanges. It is possible that trading decisions may have to be modified and that positions held may have to be liquidated in order to avoid exceeding such limits. Such modification or liquidation, if required, could adversely affect our business, financial condition and results of operations, and our ability to pay dividends to our shareholders.
In addition, changes to regulations promulgated under the Dodd-Frank Act pursuant to which swaps are viewed as commodities for purposes of determining whether an entity is a "commodity pool" for purposes of the Commodity Exchange Act, as amended, have required our Manager to decide whether to limit our swap activity in order to meet certain exemptions from registration with the CFTC or to register as a "commodity pool operator" with the CFTC. Our Manager is currently registered as a "commodity pool operator" operating pursuant to an exemption under CFTC Regulation 4.12. If, in the future, we do not meet the conditions set forth in CFTC Regulation 4.12, such exemption becomes unavailable for any other reason, or our Manager pursues our derivative activities in another manner, we may need to seek another exemption from registration or we and our Manager may become subject to additional disclosure, recordkeeping, and reporting requirements, which may increase our expenses.
32
Certain of our hedging instruments are regulated by the CFTC and such regulations may adversely impact our ability to enter into such hedging instruments and cause us to incur increased costs.
We enter into interest rate swaps and CDX to hedge risks associated with our portfolio. Entities entering into such swaps are exposed to credit losses in the event of non-performance by counterparties to these transactions. Effective October 12, 2012, the CFTC issued new rules regarding such swaps under the authority granted to it pursuant to the Dodd-Frank Act.
The new rules primarily impacted our trading of these instruments in two ways. First, beginning on June 10, 2013, certain newly executed swaps, including many interest rate and credit default swaps, became subject to mandatory clearing through a central counterparty clearinghouse, or "CCP." It is the intent of the Dodd-Frank Act that, by mandating the clearing of swaps in this manner, swap counterparty risk would not become overly concentrated in any single entity, but rather would be spread and centralized among the CCP and its members. We are not a direct member of any CCP, so we must access the CCPs through a futures commission merchant, or "FCM," which acts as intermediary between us and the CCP with respect to all facets of the transaction, including the posting and receipt of required collateral. If we lost access to our FCMs or CCPs, we could potentially be unable to use interest rate swaps and credit default swaps to hedge our risks.
The second way that the new rules impact our trading of these instruments is the Swap Execution Facility, or "SEF," mandate, which came into effect on October 2, 2013, and requires that we execute most interest rate swaps and CDX on an electronic platform, rather than over the phone or in some other manner. If we were to lose access to our selected SEFs or we were otherwise unable to communicate with them, this would prevent us from being able to trade these instruments. If we were unable to execute our hedging trades in a timely manner, particularly in a volatile market environment, we may not be able to execute our strategies in the most advantageous manner.
In addition to subjecting our swap transactions to greater initial margin requirements and additional transaction fees charged by CCPs, FCMs, and SEFs, our swap transactions are now subjected to greater regulation by both the CFTC and the SEC. These additional fees, costs, margin requirements, documentation, and regulation could adversely affect our business, financial condition and results of operations, and our ability to pay dividends to our shareholders.
Additionally, for all interest rate swaps and CDX entered into prior to June 10, 2013, we were not required to clear them through a CCP and as a result these swaps are still subject to the risks of nonperformance by any of the individual counterparties with whom we entered into these transactions described above in "—Hedging instruments and other derivatives, including some credit default swaps, may not, in many cases, be traded on regulated exchanges, or may not be guaranteed or regulated by any U.S. or foreign governmental authority and involve risks and costs that could result in material losses."
Our use of derivatives may expose us to counterparty risk.
We enter into interest rate swaps and other derivatives that have not been cleared by a CCP. If a derivative counterparty cannot perform under the terms of the derivative contract, we would not receive payments due under that agreement, we may lose any unrealized gain associated with the derivative, and the hedged liability would cease to be hedged by such instrument. If a derivative counterparty becomes insolvent or files for bankruptcy, we may also be at risk for any collateral we have pledged to such counterparty to secure our obligations under derivative contracts, and we may incur significant costs in attempting to recover such collateral.
Our rights under our reverse repos are subject to the effects of the bankruptcy laws in the event of the bankruptcy or insolvency of us or our lenders.
In the event of our insolvency or bankruptcy, certain reverse repos may qualify for special treatment under the U.S. Bankruptcy Code, the effect of which, among other things, would be to allow the lender to avoid the automatic stay provisions of the U.S. Bankruptcy Code and to foreclose on and/or liquidate the collateral pledged under such agreements without delay. In the event of the insolvency or bankruptcy of a lender during the term of a reverse repo, the lender may be permitted, under applicable insolvency laws, to repudiate the contract, and our claim against the lender for damages may be treated simply as an unsecured creditor. In addition, if the lender is a broker or dealer subject to the Securities Investor Protection Act of 1970, or an insured depository institution subject to the Federal Deposit Insurance Act, our ability to exercise our rights to recover our securities under a reverse repo or to be compensated for any damages resulting from the lenders' insolvency may be further limited by those statutes. These claims would be subject to significant delay and costs to us and, if and when received, may be substantially less than the damages we actually incur.
Certain actions by the Federal Reserve could materially adversely affect our business, financial condition and results of operations, and our ability to pay dividends to our shareholders.
In September 2012, the Federal Reserve announced a third round of quantitative easing, or "QE3," which was an open-ended program designed to expand the Federal Reserve's holdings of long-term securities by purchasing, at the time, an
33
additional $40 billion of Agency RMBS per month until key economic indicators showed sufficient signs of improvement.
Since December 2013, the Federal Reserve announced and completed eight incremental reductions in its purchases of Agency RMBS and U.S. Treasury securities under its accommodative monetary policies, and concluded its QE3 asset buying program at the end of October 2014. However, the Federal Reserve continues to reinvest principal payments from its U.S. Treasury security and Agency RMBS holdings and uncertainty surrounds the Federal Reserve's timeline to curtail such reinvestment. In addition, the Federal Reserve recently increased the target range for the federal funds rate, and has indicated that further interest rate increases may occur in the near future. See above "—Increases in interest rates could negatively affect the value of our assets and increase the risk of default on our assets." Should the U.S. economy begin to deteriorate, the Federal Reserve could decide to reinstate its asset purchase program or institute other measures designed to reduce interest rates. These measures could lead to a flattening in the yield curve, increased prepayment rates (resulting from lower long-term interest rates, including mortgage rates), and a narrowing of our net interest margin.
We may change our investment strategy, investment guidelines, hedging strategy, and asset allocation, operational, and management policies without notice or shareholder consent, which may materially adversely affect our business, financial condition and results of operations, and our ability to pay dividends to our shareholders.
We may change our investment strategy, investment guidelines, hedging strategy, and asset allocation, operational, and management policies at any time without notice to or consent from our shareholders. As a result, the types or mix of, assets, liabilities, or hedging transactions in our portfolio may be different from, and possibly riskier than, the types or mix of assets, liabilities, and hedging transactions that we have historically held, or that are otherwise described in this report. A change in our strategy may increase our exposure to real estate values, interest rates, and other factors. Our Board of Directors determines our investment guidelines and our operational policies, and may amend or revise our policies, including those with respect to our acquisitions, growth, operations, indebtedness, capitalization, and dividends or approve transactions that deviate from these policies without a vote of, or notice to, our shareholders. Policy changes could materially adversely affect our business, financial condition and results of operations, and our ability to pay dividends to our shareholders.
We, Ellington, or its affiliates may be subject to adverse legislative or regulatory changes.
At any time, laws or regulations that impact our business, or the administrative interpretations of those laws or regulations, may be enacted or amended. For example, on July 21, 2010 the Dodd-Frank Act was enacted, which significantly revised many financial regulations. Certain portions of the Dodd-Frank Act were effective immediately, while other portions have become or will become effective following rulemaking and transition periods, but many of these changes could materially impact the profitability of our business or the business of our Manager or Ellington, our access to financing or capital, the value of the assets that we hold, expose us to additional costs, require changes to business practices, or adversely affect our ability to pay dividends. For example, the Dodd-Frank Act alters the regulation of commodity interests, imposes new regulation on the over-the-counter derivatives market, places restrictions on residential mortgage loan originations, and reforms the asset-backed securitization markets most notably by imposing credit requirements. While there continues to be uncertainty about the exact impact of all of these changes, we do know that we and our Manager are subject to a more complex regulatory framework, and are incurring and will in the future incur costs to comply with new requirements as well as to monitor compliance in the future.
In addition, certain U.S. and European regulations implementing credit risk retention requirements for debt securitizations may adversely affect us. The impact of these risk retention rules on the securitization market are uncertain, and such rules may prevent us from completing any future securitization transactions or from purchasing the B-pieces of CMBS securitizations. In October 2014, the U.S. Risk Retention Rules were issued. The U.S. Risk Retention Rules require the sponsor of a debt securitization subject to such rules, in the absence of an exemption, to retain (directly or through a majority-owned affiliate) a 5% economic interest in the credit risk of the assets being securitized. The retained economic interest may take the form of an eligible horizontal residual interest (retention of the most subordinated tranches of the securitization), an eligible vertical interest (retention of 5% of every tranche of the securitization), or a combination thereof, in accordance with the requirements of the U.S. Risk Retention Rules. The U.S. Risk Retention Rules became effective December 24, 2016.
Notwithstanding the foregoing, President Donald Trump has expressed support for reducing regulations governing the financial services industry, including the rules and regulations promulgated under the Dodd-Frank Act.
We cannot predict when or if any new law, regulation, or administrative interpretation, including those related to the Dodd-Frank Act, or any amendment to or repeal of any existing law, regulation, or administrative interpretation, will be adopted or promulgated or will become effective. Additionally, the adoption or implementation of any new law, regulation, or administrative interpretation, or any revisions in or repeals of these laws, regulations, or administrative interpretations, including those related to the Dodd-Frank Act, could cause us to change our portfolio, could constrain our strategy, or increase our costs. We could be adversely affected by any change in or any promulgation of new law, regulation, or administrative interpretation.
34
We or Ellington or its affiliates may be subject to regulatory inquiries or proceedings.
At any time, industry-wide or company-specific regulatory inquiries or proceedings can be initiated and we cannot predict when or if any such regulatory inquiries or proceedings will be initiated that involve us or Ellington or its affiliates, including our Manager. For example, over the years, we and Ellington and its affiliates have received, and we expect in the future that we and they may receive, inquiries and requests for documents and information from various federal, state, and foreign regulators, including those identified under the caption Item 3. Legal Proceedings.
We can give no assurances that regulatory inquiries will not result in investigations of us or Ellington or its affiliates, or in enforcement actions, fines or penalties, or the assertion of private litigation claims against us or, Ellington or its affiliates. We believe that the heightened scrutiny of the financial services industry increases the risk of additional inquiries and requests from regulatory or enforcement agencies. In the event regulatory inquiries were to result in investigations, enforcement actions, fines, penalties, or the assertion of private litigation claims against us or Ellington or its affiliates, we, or our Manager's ability to perform its obligations to us under the management agreement between us and our Manager, or Ellington's ability to perform its obligations to our Manager under the services agreement between Ellington and our Manager, could be adversely impacted, which could in turn have a material adverse effect on our business, financial condition and results of operations, and our ability to pay dividends to our shareholders.
We operate in a highly competitive market.
Our profitability depends, in large part, on our ability to acquire targeted assets at favorable prices. We compete with a number of entities when acquiring our targeted assets, including mortgage REITs, financial companies, public and private funds, commercial and investment banks, and residential and commercial finance companies. We may also compete with (i) the Federal Reserve and the U.S. Treasury to the extent they purchase assets in our targeted asset classes and (ii) companies that partner with and/or receive financing from the U.S. Government. Many of our competitors are substantially larger and have considerably more favorable access to capital and other resources than we do. Furthermore, new companies with significant amounts of capital have been formed or have raised additional capital, and may continue to be formed and raise additional capital in the future, and these companies may have objectives that overlap with ours, which may create competition for assets we wish to acquire. Some competitors may have a lower cost of funds and access to funding sources that are not available to us, such as funding from the U.S. Government. In addition, some of our competitors may have higher risk tolerances or different risk assessments, which could allow them to consider a wider variety of assets to acquire, or pay higher prices than we can. We also may have different operating constraints from those of our competitors including, among others, (i) tax-driven constraints such as those arising from maintenance of our publicly traded partnership status and the status of our REIT subsidiary as a REIT for tax purposes and in some cases to avoid adverse tax consequences to our shareholders, (ii) restraints imposed on us by our attempt to comply with certain exclusions from the definition of an "investment company" or other exemptions under the Investment Company Act and (iii) restraints and additional costs arising from our status as a public company. Furthermore, competition for assets in our targeted asset classes may lead to the price of such assets increasing, which may further limit our ability to generate desired returns. We cannot assure you that the competitive pressures we face will not have a material adverse effect on our business, financial condition and results of operations, and our ability to pay dividends to our shareholders.
We are highly dependent on information systems and system failures could significantly disrupt our business, which may, in turn, materially adversely affect our business, financial condition and results of operations, and our ability to pay dividends to our shareholders.
Our business is highly dependent on communications and information systems. Any failure or interruption of our systems or cyber-attacks or security breaches of our networks or systems could cause delays or other problems in our securities trading activities, which could materially adversely affect our business, financial condition and results of operations, and our ability to pay dividends to our shareholders. In addition, we also face the risk of operational failure, termination or capacity constraints of any of the third parties with which we do business or that facilitate our business activities, including clearing agents or other financial intermediaries we use to facilitate our securities transactions, if their respective systems experience failure, interruption, cyber-attacks, or security breaches.
Computer malware, viruses, and computer hacking and phishing attacks have become more prevalent in the financial services industry and may occur on our systems in the future. We rely heavily on our financial, accounting and other data processing systems. Although we have not detected a breach to date, financial services institutions have reported breaches of their systems, some of which have been significant. Even with all reasonable security efforts, not every breach can be prevented or even detected. It is possible that we have experienced an undetected breach, and it is likely that other financial institutions have experienced more breaches than have been detected and reported. There is no assurance that we, or the third parties that facilitate our business activities, have not or will not experience a breach. It is difficult to determine what, if any, negative impact may directly result from any specific interruption or cyber-attacks or security breaches of our networks or systems (or the networks or systems of third parties that facilitate our business activities) or any failure to maintain performance, reliability
35
and security of our technical infrastructure, but such computer malware, viruses, and computer hacking and phishing attacks may negatively affect our operations.
Lack of diversification in the number of assets we acquire would increase our dependence on relatively few individual assets.
Our management objectives and policies do not place a limit on the amount of capital used to support, or the exposure to (by any other measure), any individual asset or any group of assets with similar characteristics or risks. As a result, our portfolio may be concentrated in a small number of assets or may be otherwise undiversified, increasing the risk of loss and the magnitude of potential losses to us and our shareholders if one or more of these assets perform poorly.
For example, our portfolio of mortgage-related assets may at times be concentrated in certain property types that are subject to higher risk of foreclosure, or secured by properties concentrated in a limited number of geographic locations. To the extent that our portfolio is concentrated in any one region or type of security, downturns relating generally to such region or type of security may result in defaults on a number of our assets within a short time period, which may materially adversely affect our business, financial condition and results of operations, and our ability to pay dividends to our shareholders.
The lack of liquidity in our assets may materially adversely affect our business, financial condition and results of operations, and our ability to pay dividends to our shareholders.
We acquire assets and other instruments that are not publicly traded, including privately placed RMBS, residential and commercial mortgage loans, CLOs, consumer loans, ABS backed by consumer and commercial assets, distressed corporate debt, and other private investments. As such, these assets may be subject to legal and other restrictions on resale, transfer, pledge or other disposition, or will otherwise be less liquid than publicly traded securities. Other assets that we acquire, while publicly traded, have limited liquidity on account of their complexity, turbulent market conditions, or other factors. In addition, mortgage-related assets from time to time have experienced extended periods of illiquidity, including during times of financial stress (such as during the 2008 financial crisis), which is often the time that liquidity is most needed. Illiquid assets typically experience greater price volatility, because a ready market does not exist, and they can be more difficult to value or sell if the need arises. In addition, if we are required to liquidate all or a portion of our portfolio quickly, we may realize significantly less than the value at which we have previously recorded our assets. We may also face other restrictions on our ability to liquidate any assets for which we or our Manager has or could be attributed with material non-public information. Furthermore, assets that are illiquid are more difficult to finance, and to the extent that we finance assets that are or become illiquid, we may lose that financing or have it reduced. If we are unable to sell our assets at favorable prices or at all, it could materially adversely affect our business, financial condition and results of operations, and our ability to pay dividends to our shareholders.
We could be subject to liability for potential violations of predatory lending laws, which could materially adversely affect our business, financial condition and results of operations, and our ability to pay dividends to our shareholders.
Loan originators and servicers are required to comply with various federal, state and local laws and regulations, including anti-predatory lending laws and laws and regulations imposing certain restrictions on requirements on high cost loans. Failure of loan originators or servicers to comply with these laws, to the extent any of their loans become part of our assets, could subject us, as an assignee or purchaser of the related loans, to monetary penalties and could result in the borrowers rescinding the affected loans. Lawsuits have been brought in various states making claims against assignees or purchasers of high cost loans for violations of state law. Named defendants in these cases have included assignees or purchasers of certain types of loans we invest in. If the loans are found to have been originated in violation of predatory or abusive lending laws, we could incur losses, which could materially adversely affect our business, financial condition and results of operations, and our ability to pay dividends to our shareholders.
We may be exposed to environmental liabilities with respect to properties in which we have an interest.
In the course of our business, we may take title to real estate, and, if we do take title, we could be subject to environmental liabilities with respect to these properties. In such a circumstance, we may be held liable to a governmental entity or to third parties for property damage, personal injury, investigation, and clean-up costs incurred by these parties in connection with environmental contamination, or may be required to investigate or clean up hazardous or toxic substances, or chemical releases at a property. The costs associated with investigation or remediation activities could be substantial. In addition, the presence of hazardous substances may adversely affect an owner's ability to sell real estate or borrow using real estate as collateral. To the extent that an owner of an underlying property becomes liable for removal costs, the ability of the owner to make debt payments may be reduced, which in turn may materially adversely affect the value of the relevant mortgage-related assets held by us.
36
Consumer loans are subject to delinquency and loss, which could have a negative impact on our financial results.
We are exposed to the performance of consumer loans both through the consumer loans that we own directly, and through those consumer loans to which we are exposed indirectly through our ownership of consumer-loan-backed ABS. The ability of borrowers to repay consumer loans may be adversely affected by numerous borrower-specific factors, including unemployment, divorce, major medical expenses or personal bankruptcy. General factors, including an economic downturn, high energy costs or acts of God or terrorism, may also affect the financial stability of borrowers and impair their ability or willingness to repay their loans. Whenever any of our consumer loans defaults, we are at risk of loss to the extent of any deficiency between the liquidation value of the collateral, if any, securing the loan, and the principal and accrued interest of the loan. Many of our consumer loans are unsecured, or are secured by collateral (such as an automobile) that depreciates rapidly; as a result, these loans may be at greater risk of loss than residential real estate loans. Pursuing any remaining deficiency following a default is often difficult or impractical, especially when the borrower has a low credit score, making further substantial collection efforts unwarranted. In addition, repossessing personal property securing a consumer loan can present additional challenges, including locating and taking physical possession of the collateral. We rely on servicers who service these consumer loans, to, among other things, collect principal and interest payments on the loans and perform loss mitigation services, and these servicers may not perform in a manner that promotes our interests. Since we purchase some of our consumer loans and our consumer-loan-backed ABS at a premium to the remaining unpaid principal balance, we may incur a loss when such loans are voluntarily prepaid. There can be no guarantee that we will not suffer unexpected losses on our investments as a result of the factors set out above, which could materially adversely affect our business, financial condition and results of operations, and our ability to pay dividends to our shareholders.
Increased regulatory attention and potential regulatory action on certain areas within the consumer credit business could have a negative impact on our reputation, or cause losses on our investments in consumer loans.
Certain consumer advocacy groups, media reports, and federal and state legislators have asserted that laws and regulations should be tightened to severely limit, if not eliminate, the availability of certain consumer loan products. The consumer advocacy groups and media reports generally focus on higher cost consumer loans, which are typically made to less creditworthy borrowers, and which bear interest rates that are higher than the interest rates typically charged by lending institutions to more creditworthy consumers. These consumer advocacy groups and media reports have characterized these consumer loans as predatory or abusive. If the negative characterization of these types of loans becomes increasingly accepted by consumers, legislators or regulators, our reputation, as a purchaser of such loans, could be negatively impacted. Furthermore, if legislators or regulators take action against originators of consumer loans or provide for payment relief for borrowers, we could incur additional losses on the consumer loans we have purchased.
Our investments in distressed debt have significant risk of loss, and our efforts to protect our distressed debt investments may involve large costs and may not be successful.
Our investments in distressed debt have significant risk of loss, and our efforts to protect our distressed debt investments may involve large costs and may not be successful. We also will be subject to significant uncertainty as to when and in what manner and for what value the distressed debt in which we invest will eventually be satisfied (e.g., through liquidation of the obligor's assets, an exchange offer or plan of reorganization involving the distressed debt securities or a payment of some amount in satisfaction of the obligation). In addition, even if an exchange offer is made or plan of reorganization is adopted with respect to distressed debt we hold, there can be no assurance that the securities or other assets received by us in connection with such exchange offer or plan of reorganization will not have a lower value or income potential than may have been anticipated when the investment was made. Moreover, any securities received by us upon completion of an exchange offer or plan of reorganization may be restricted as to resale. If we participate in negotiations with respect to any exchange offer or plan of reorganization with respect to an issuer of distressed debt, we may be restricted from disposing of such securities.
We may hold the debt securities and loans of companies that are more likely to enter into bankruptcy proceedings.
We may hold the debt securities and loans of companies that are more likely to experience bankruptcy or similar financial distress, such as companies that are thinly capitalized, employ a high degree of financial leverage, are in highly competitive or risky businesses, are in a start-up phase, or are experiencing losses. The bankruptcy process has a number of significant inherent risks. Many events in a bankruptcy proceeding are the product of contested matters and adversarial proceedings and are beyond the control of the creditors. A bankruptcy filing by a company whose debt we have purchased may adversely and permanently affect such company. If the proceeding results in liquidation, the liquidation value of the company may have deteriorated significantly from what we believed to be the case at the time of our initial investment. The duration of a bankruptcy proceeding is also difficult to predict, and a creditor's return on investment can be adversely affected by delays until a plan of reorganization or liquidation ultimately becomes effective. The administrative costs in connection with a bankruptcy proceeding are frequently high and would be paid out of the debtor's estate prior to any return to creditors. Because the standards for classification of claims under bankruptcy law are vague, our influence with respect to the class of securities or
37
other obligations we own may be lost by increases in the number and amount of claims in the same class or by different classification and treatment. In the early stages of the bankruptcy process, it is often difficult to estimate the extent of, or even to identify, any contingent claims that might be made. In addition, certain claims that have priority by law (for example, claims for taxes) may be substantial, eroding the value of any recovery by holders of other securities of the bankrupt entity.
A bankruptcy court may also re-characterize our debt investment as equity, and subordinate all or a portion of our claim to that of other creditors. This could occur even if our investment had initially been structured as senior debt.
We may be subject to risks associated with syndicated loans.
Under the documentation for syndicated loans, a financial institution or other entity typically is designated as the administrative agent and/or collateral agent. This agent is granted a lien on any collateral on behalf of the other lenders and distributes payments on the indebtedness as they are received. The agent is the party responsible for administering and enforcing the loan and generally may take actions only in accordance with the instructions of a majority or two-thirds in commitments and/or principal amount of the associated indebtedness. In most cases for our syndicated loan investments, we do not expect to hold a sufficient amount of the indebtedness to be able to compel any actions by the agent. Consequently, we would only be able to direct such actions if instructions from us were made in conjunction with other holders of associated indebtedness that together with us compose the requisite percentage of the related indebtedness then entitled to take action. Conversely, if holders of the required amount of the associated indebtedness other than us desire to take certain actions, such actions may be taken even if we did not support such actions. Furthermore, if a syndicated loan is subordinated to one or more senior loans made to the applicable obligor, the ability of us to exercise such rights may be subordinated to the exercise of such rights by the senior lenders. Whenever we are unable to direct such actions, the parties taking such actions may not have interests that are aligned with us, and the actions taken may not be in our best interests.
If an investment is a syndicated revolving loan or delayed drawdown loan, other lenders may fail to satisfy their full contractual funding commitments for such loan, which could create a breach of contract, result in a lawsuit by the obligor against the lenders and adversely affect the fair market value of our investment.
There is a risk that a loan agent may become bankrupt or insolvent. Such an event would delay, and possibly impair, any enforcement actions undertaken by holders of the associated indebtedness, including attempts to realize upon the collateral securing the associated indebtedness and/or direct the agent to take actions against the related obligor or the collateral securing the associated indebtedness and actions to realize on proceeds of payments made by obligors that are in the possession or control of any other financial institution. In addition, we may be unable to remove the agent in circumstances in which removal would be in our best interests. Moreover, agented loans typically allow for the agent to resign with certain advance notice, and we may not find a replacement agent on a timely basis, or at all, in order to protect our investment.
We have made and may in the future make investments in companies that we do not control.
Some of our investments in mortgage originators and other mortgage-related entities include debt instruments and/or equity securities of companies that we do not control. Those investments will be subject to the risk that the company in which the investment is made may make business, financial or management decisions with which we do not agree or that the majority stakeholders or the management of such company may take risks or otherwise act in a manner that does not serve our interests. The entities in which we invest could be thinly capitalized, highly leveraged, dependent on a small number of key individuals, subject to regulatory concerns, or face other obstacles that could adversely affect the business and results of operations of any such entity. If any of the foregoing were to occur, our investments in these operating entities could be lost in their entirety, and our financial condition, results of operations and cash flow could suffer as a result.
Risks Related to our Relationship with our Manager and Ellington
We are dependent on our Manager and certain key personnel of Ellington that are provided to us through our Manager and may not find a suitable replacement if our Manager terminates the management agreement or such key personnel are no longer available to us.
We do not have any employees of our own. Our officers are employees of Ellington or one or more of its affiliates. We have no separate facilities and are completely reliant on our Manager, which has significant discretion as to the implementation of our operating policies and execution of our business strategies and risk management practices. We also depend on our Manager's access to the professionals and principals of Ellington as well as information and deal flow generated by Ellington. The employees of Ellington identify, evaluate, negotiate, structure, close, and monitor our portfolio. The departure of any of the senior officers of our Manager, or of a significant number of investment professionals or principals of Ellington, could have a material adverse effect on our ability to achieve our objectives. We can offer no assurance that our Manager will remain our manager or that we will continue to have access to our Manager's senior management. We are subject to the risk that our
38
Manager will terminate the management agreement or that we may deem it necessary to terminate the management agreement or prevent certain individuals from performing services for us and that no suitable replacement will be found to manage us.
The base management fee payable to our Manager is payable regardless of the performance of our portfolio, which may reduce our Manager's incentive to devote the time and effort to seeking profitable opportunities for our portfolio.
We pay our Manager substantial base management fees based on our equity capital (as defined in the management agreement) regardless of the performance of our portfolio. The base management fee takes into account the net issuance proceeds of both common and preferred share offerings. Our Manager's entitlement to non-performance-based compensation might reduce its incentive to devote the time and effort of its professionals to seeking profitable opportunities for our portfolio, which could result in a lower performance of our portfolio and materially adversely affect our business, financial condition and results of operations, and our ability to pay dividends to our shareholders.
Our Manager's incentive fee may induce our Manager to acquire certain assets, including speculative or high risk assets, or to acquire assets with increased leverage, which could increase the risk to our portfolio.
In addition to its base management fee, our Manager is entitled to receive an incentive fee based, in large part, upon our achievement of targeted levels of net income. In evaluating asset acquisition and other management strategies, the opportunity to earn an incentive fee based on net income may lead our Manager to place undue emphasis on the maximization of net income at the expense of other criteria, such as preservation of capital, maintaining liquidity, and/or management of credit risk or market risk, in order to achieve a higher incentive fee. Assets with higher yield potential are generally riskier or more speculative. This could result in increased risk to our portfolio.
Our Board of Directors has approved very broad investment guidelines for our Manager and will not approve each decision made by our Manager to acquire, dispose of, or otherwise manage an asset.
Our Manager is authorized to follow very broad guidelines in pursuing our strategy. While our Board of Directors periodically reviews our guidelines and our portfolio and asset-management decisions, it generally does not review all of our proposed acquisitions, dispositions, and other management decisions. In addition, in conducting periodic reviews, our Board of Directors relies primarily on information provided to them by our Manager. Furthermore, our Manager may arrange for us to use complex strategies or to enter into complex transactions that may be difficult or impossible to unwind by the time they are reviewed by our Board of Directors. Our Manager has great latitude within the broad guidelines in determining the types of assets it may decide are proper for us to acquire and other decisions with respect to the management of those assets. Poor decisions could have a material adverse effect on our business, financial condition and results of operations, and our ability to pay dividends to our shareholders.
We compete with Ellington's other accounts for access to Ellington.
Ellington has sponsored and/or currently manages accounts with a focus that overlaps with our investment focus, and expects to continue to do so in the future. Ellington is not restricted in any way from sponsoring or accepting capital from new accounts, even for investing in asset classes or strategies that are similar to, or overlapping with, our asset classes or strategies. Therefore, we compete for access to the benefits that our relationship with our Manager and Ellington provides us. For the same reasons, the personnel of Ellington and our Manager may be unable to dedicate a substantial portion of their time managing our assets.
We compete with other Ellington accounts for opportunities to acquire assets, which are allocated in accordance with Ellington's investment allocation policies.
Many, if not most, of our targeted assets are also targeted assets of other Ellington accounts and Ellington has no duty to allocate such opportunities in a manner that preferentially favors us. Ellington makes available to us all opportunities to acquire assets that it determines, in its reasonable and good faith judgment, based on our objectives, policies and strategies, and other relevant factors, are appropriate for us in accordance with Ellington's written investment allocation policy, it being understood that we might not participate in each such opportunity, but will on an overall basis equitably participate with Ellington's other accounts in all such opportunities.
Since many of our targeted assets are typically available only in specified quantities, Ellington often is not able to buy as much of any asset or group of assets as would be required to satisfy the needs of all of Ellington's accounts. In these cases, Ellington's investment allocation procedures and policies typically allocate such assets to multiple accounts in proportion to their needs and available capital. As part of these policies, accounts that are in a "start-up" or "ramp-up" phase may get allocations above their proportion of available capital, which could work to our disadvantage, particularly because there are no limitations surrounding Ellington's ability to create new accounts. In addition, the policies permit departure from proportional
39
allocations under certain circumstances, for example when such allocation would result in an inefficiently small amount of the security or assets being purchased for an account, which may also result in our not participating in certain allocations.
There are conflicts of interest in our relationships with our Manager and Ellington, which could result in decisions that are not in the best interests of our shareholders.
We are subject to conflicts of interest arising out of our relationship with Ellington and our Manager. Currently, all of our executive officers, and two of our directors, are employees of Ellington or one or more of its affiliates. As a result, our Manager and our officers may have conflicts between their duties to us and their duties to, and interests in, Ellington or our Manager. For example, Mr. Penn, our President and Chief Executive Officer and one of our directors, also serves as the President and Chief Executive Officer of, and as a member of the Board of Trustees of, Ellington Residential Mortgage REIT, and as Vice Chairman and Chief Operating Officer of Ellington. Ms. Mumford, our Chief Financial Officer, also serves as the Chief Financial Officer of Ellington Residential Mortgage REIT, Mr. Tecotzky, our Co-Chief Investment Officer, also serves as the Co-Chief Investment Officer of Ellington Residential Mortgage REIT, and as a Managing Director of Ellington, and Mr. Vranos, our Co-Chief Investment Officer and one of our directors, also serves as the Co-Chief Investment Officer of, and as a member of the Board of Trustees of, Ellington Residential Mortgage REIT, and as Chairman of Ellington.
We may acquire or sell assets in which Ellington or its affiliates have or may have an interest. Similarly, Ellington or its affiliates may acquire or sell assets in which we have or may have an interest. Although such acquisitions or dispositions may present conflicts of interest, we nonetheless may pursue and consummate such transactions. Additionally, we may engage in transactions directly with Ellington or its affiliates, including the purchase and sale of all or a portion of a portfolio asset. We may also, either directly or indirectly through an entity in which we invest, pay Ellington or an affiliate of Ellington to perform administrative services for us. Furthermore, if we securitize any of our assets, Ellington or an affiliate of Ellington may be required under the U.S. Risk Retention Rules to acquire and retain an economic interest in the credit risk of such assets. In connection with any of these transactions we may indemnify, alongside other Ellington affiliates, Ellington or its affiliates or third parties.
Acquisitions made for entities with similar objectives may be different from those made on our behalf. Ellington may have economic interests in, or other relationships with, others in whose obligations or securities we may acquire. In particular, such persons may make and/or hold an investment in securities that we acquire that may be pari passu, senior, or junior in ranking to our interest in the securities or in which partners, security holders, officers, directors, agents, or employees of such persons serve on boards of directors or otherwise have ongoing relationships. Each of such ownership and other relationships may result in securities laws restrictions on transactions in such securities and otherwise create conflicts of interest. In such instances, Ellington may, in its sole discretion, make recommendations and decisions regarding such securities for other entities that may be the same as or different from those made with respect to such securities and may take actions (or omit to take actions) in the context of these other economic interests or relationships the consequences of which may be adverse to our interests.
In deciding whether to issue additional debt or equity securities, we will rely in part on recommendations made by our Manager. While such decisions are subject to the approval of our Board of Directors, two of our directors are also Ellington employees. Because our Manager earns base management fees that are based on the total amount of our equity capital, and earns incentive fees that are based in part on the total net income that we are able to generate, our Manager may have an incentive to recommend that we issue additional debt or equity securities. See below "—Future offerings of debt or equity securities may adversely affect the market price of our common shares" for further discussion of the adverse impact future debt or equity offerings could have on our common shares.
The officers of our Manager and its affiliates devote as much time to us as our Manager deems appropriate; however, these officers may have conflicts in allocating their time and services among us and Ellington and its affiliates' accounts. During turbulent conditions in the mortgage industry, distress in the credit markets or other times when we will need focused support and assistance from our Manager and Ellington employees, other entities that Ellington advises or manages will likewise require greater focus and attention, placing our Manager and Ellington's resources in high demand. In such situations, we may not receive the necessary support and assistance we require or would otherwise receive if we were internally managed or if Ellington or its affiliates did not act as a manager for other entities.
We, directly or through Ellington, may obtain confidential information about the companies or securities in which we have invested or may invest. If we do possess confidential information about such companies or securities, there may be restrictions on our ability to dispose of, increase the amount of, or otherwise take action with respect to the securities of such companies. Our Manager's and Ellington's management of other accounts could create a conflict of interest to the extent our Manager or Ellington is aware of material non-public information concerning potential investment decisions. We have implemented compliance procedures and practices designed to ensure that investment decisions are not made while in
40
possession of material non-public information. We cannot assure you, however, that these procedures and practices will be effective. In addition, this conflict and these procedures and practices may limit the freedom of our Manager to make potentially profitable investments, which could have an adverse effect on our operations. These limitations imposed by access to confidential information could therefore materially adversely affect our business, financial condition and results of operations, and our ability to pay dividends to our shareholders.
As of December 31, 2016 the Manager Group owned approximately 10.9% of our outstanding common shares and other equity interests convertible into our common shares. In evaluating opportunities for us and other management strategies, this may lead our Manager to emphasize certain asset acquisition, disposition, or management objectives over others, such as balancing risk or capital preservation objectives against return objectives. This could increase the risks, or decrease the returns, of your investment.
The management agreement with our Manager was not negotiated on an arm's-length basis and may not be as favorable to us as if it had been negotiated with an unaffiliated third party and may be costly and difficult to terminate.
Our management agreement with our Manager was negotiated between related parties, and its terms, including fees payable, may not be as favorable to us as if it had been negotiated with an unaffiliated third party. Various potential and actual conflicts of interest may arise from the activities of Ellington and its affiliates by virtue of the fact that our Manager is controlled by Ellington.
Termination of our management agreement without cause, including termination for poor performance or non-renewal, is subject to several conditions which may make such a termination difficult and costly. The management agreement, which was most recently amended and restated effective November 3, 2015, has a current term that expires on December 31, 2017, and will be automatically renewed for successive one-year terms thereafter unless notice of non-renewal is delivered by either party to the other party at least 180 days prior to the expiration of the then current term. The management agreement provides that it may be terminated by us based on performance upon the affirmative vote of at least two-thirds of our independent directors, or by a vote of the holders of at least a majority of our outstanding common shares, based either upon unsatisfactory performance by our Manager that is materially detrimental to us or upon a determination by the Board of Directors that the management fee payable to our Manager is not fair, subject to our Manager's right to prevent such a termination by accepting a mutually acceptable reduction of management fees. In the event we terminate the management agreement as discussed above or elect not to renew the management agreement, we will be required to pay our Manager a termination fee equal to the amount of three times the sum of the average annual base management fee and the average annual incentive fee earned by our Manager during the 24-month period immediately preceding the date of notice of termination or non-renewal, calculated as of the end of the most recently completed fiscal quarter prior to the date of notice of termination or non-renewal. These provisions will increase the effective cost to us of terminating the management agreement, thereby adversely affecting our ability to terminate our Manager without cause.
Pursuant to the management agreement, our Manager will not assume any responsibility other than to render the services called for thereunder and will not be responsible for any action of our Board of Directors in following or declining to follow its advice or recommendations. Under the terms of the management agreement, our Manager, Ellington, and their affiliates and each of their officers, directors, members, shareholders, managers, investment and risk management committee members, employees, agents, successors and assigns, will not be liable to us for acts or omissions performed in accordance with and pursuant to the management agreement, except because of acts or omissions constituting bad faith, willful misconduct, gross negligence, or reckless disregard of their duties under the management agreement. In addition, we will indemnify our Manager, Ellington, and their affiliates and each of their officers, directors, members, shareholders, managers, investment and risk management committee members, employees, agents, successors and assigns, with respect to all liabilities, judgments, costs, charges, losses, expenses, and claims arising from acts or omissions of our Manager not constituting bad faith, willful misconduct, gross negligence, or reckless disregard of duties under the management agreement.
If our Manager ceases to be our Manager pursuant to the management agreement or one or more of our Manager's key personnel ceases to provide services to us, our lenders and our derivative counterparties may cease doing business with us.
If our Manager ceases to be our Manager, including upon non-renewal of our management agreement which has a current term that expires on December 31, 2017, or if one or more of our Manager's key personnel ceases to provide services to us, it could constitute an event of default or early termination event under many of our reverse repo or derivative transaction agreements, upon which our counterparties would have the right to terminate their agreements with us. If our Manager ceases to be our Manager for any reason, including upon the non-renewal of our management agreement and we are unable to obtain or renew financing or enter into or maintain derivative transactions, our business, financial condition and results of operations, and our ability to pay dividends to our shareholders may be materially adversely affected.
41
Our Manager's failure to identify and acquire assets that meet our asset criteria or perform its responsibilities under the management agreement could materially adversely affect our business, financial condition and results of operations, and our ability to pay dividends to our shareholders.
Our ability to achieve our objectives depends on our Manager's ability to identify and acquire assets that meet our asset criteria. Accomplishing our objectives is largely a function of our Manager's structuring of our investment process, our access to financing on acceptable terms, and general market conditions. Our shareholders do not have input into our investment decisions. All of these factors increase the uncertainty, and thus the risk, of investing in our common shares. The senior management team of our Manager has substantial responsibilities under the management agreement. In order to implement certain strategies, our Manager may need to hire, train, supervise, and manage new employees successfully. Any failure to manage our future growth effectively could have a material adverse effect on our business, financial condition and results of operations, and our ability to pay dividends to our shareholders.
We do not own the Ellington brand or trademark, but may use the brand and trademark as well as our logo pursuant to the terms of a license granted by Ellington.
Ellington has licensed the "Ellington" brand, trademark, and logo to us for so long as our Manager or another affiliate of Ellington continues to act as our Manager. We do not own the brand, trademark, or logo that we will use in our business and may be unable to protect this intellectual property against infringement from third parties. Ellington retains the right to continue using the "Ellington" brand and trademark. We will further be unable to preclude Ellington from licensing or transferring the ownership of the "Ellington" brand and trademark to third parties, some of whom may compete against us. Consequently, we will be unable to prevent any damage to goodwill that may occur as a result of the activities of Ellington or others.
Furthermore, in the event our Manager or another affiliate of Ellington ceases to act as our Manager, or in the event Ellington terminates the license, we will be required to change our name and trademark. Any of these events could disrupt our recognition in the marketplace, damage any goodwill we may have generated, and otherwise harm our business. Finally, the license is a domestic license in the United States only and does not give us any right to use the "Ellington" brand, trademark, and logo overseas even though we expect to use the brand, trademark, and logo overseas. Our use of the "Ellington" brand, trademark, and logo overseas will therefore be unlicensed and could expose us to a claim of infringement.
Risks Related to Our Common Shares
The market for our common shares may be limited, which may adversely affect the price at which our common shares trade and make it difficult to sell our common shares.
While our common shares are listed on the New York Stock Exchange, such listing does not provide any assurance as to:
|
•
|
whether the market price of our shares will reflect our actual financial performance;
|
|
•
|
the liquidity of our common shares;
|
|
•
|
the ability of any holder to sell common shares; or
|
|
•
|
the prices that may be obtained for our common shares.
|
The market price and trading volume of our common shares may be volatile.
The market price of our common shares may be highly volatile and could be subject to wide fluctuations. In addition, the trading volume in our common shares may fluctuate and cause significant price variations to occur. We cannot assure you that the market price of our common shares will not fluctuate or decline significantly in the future. Some of the factors that could negatively affect our share price or result in fluctuations in the price or trading volume of our common shares include:
|
•
|
actual or anticipated variations in our quarterly operating results or dividends;
|
|
•
|
changes in our earnings estimates, failure to meet earnings or operating results expectations of public market analysts and investors, or publication of research reports about us or the real estate specialty finance industry;
|
|
•
|
increases in market interest rates that lead purchasers of our common shares to demand a higher yield;
|
|
•
|
passage of legislation, changes in applicable law, court rulings, enforcement actions or other regulatory developments that adversely affect us or our industry;
|
|
•
|
changes in government policies or changes in timing of implementation of government policies, including with respect to Fannie Mae, Freddie Mac, and Ginnie Mae;
|
|
•
|
changes in market valuations of similar companies;
|
|
•
|
adverse market reaction to any increased indebtedness we incur in the future;
|
42
|
•
|
additions or departures of key management personnel;
|
|
•
|
actions by shareholders;
|
|
•
|
speculation in the press or investment community;
|
|
•
|
general market and economic conditions;
|
|
•
|
our operating performance and the performance of other similar companies; and
|
|
•
|
changes in accounting principles.
|
Future offerings of debt or equity securities may adversely affect the market price of our common shares.
In the future, we may attempt to increase our capital resources by making offerings of debt or additional offerings of equity securities, including commercial paper, medium-term notes, senior or subordinated notes, convertible securities, and classes of preferred shares. If we decide to issue senior securities in the future, it is likely that they will be governed by an indenture or other instrument containing covenants restricting our operating flexibility. Holders of senior securities may be granted specific rights, including the right to hold a perfected security interest in certain of our assets, the right to accelerate payments due under an indenture, rights to restrict dividend payments, and rights to require approval to sell assets. Additionally, any convertible or exchangeable securities that we issue in the future may have rights, preferences, and privileges more favorable than those of our common shares and may result in dilution of owners of our common shares. We and, indirectly, our shareholders, will bear the cost of issuing and servicing such securities. Upon liquidation, holders of our debt securities and preferred shares, and lenders with respect to other borrowings will receive a distribution of our available assets prior to the holders of our common shares. Additional equity offerings may dilute the holdings of our existing shareholders or reduce the market price of our common shares, or both. Our preferred shares, if issued, could have a preference on liquidating distributions or a preference on dividend payments that could limit our ability to make a dividend distribution to the holders of our common shares. Because our decision to issue securities in any future offering will depend on market conditions and other factors beyond our control, we cannot predict or estimate the amount, timing, or nature of our future offerings. Thus, holders of our common shares bear the risk of our future offerings reducing the market price of our common shares and diluting their share holdings in us.
Future sales of our common shares could have an adverse effect on our share price.
We cannot predict the effect, if any, of future sales of our common shares or the availability of our common shares for future sales, on the market price of our common shares. Sales of substantial amounts of our common shares, or the perception that such sales could occur, may adversely affect prevailing market prices for our common shares.
Our shareholders may not receive dividends or dividends may not grow over time.
We have not established a minimum distribution payment level and our ability to pay dividends may be adversely affected by a number of factors, including the risk factors described herein. All dividends will be declared at the discretion of our Board of Directors and will depend on our earnings, our financial condition, and other factors as our Board of Directors may deem relevant from time to time. Our Board of Directors is under no obligation or requirement to declare a dividend distribution. We cannot assure you that we will achieve results that will allow us to pay a specified level of dividends or to increase dividends from one year to the next. Among the factors that could materially adversely affect our business, financial condition and results of operations, and our ability to pay dividends to our shareholders are:
|
•
|
our inability to realize positive or attractive returns on our portfolio, whether because of defaults in our portfolio, decreases in the value of our portfolio, or otherwise;
|
|
•
|
margin calls or other expenditures that reduce our cash flow and impact our liquidity; and
|
|
•
|
increases in actual or estimated operating expenses.
|
An increase in interest rates may have an adverse effect on the market price of our shares and our ability to pay dividends to our shareholders.
One of the factors that investors may consider in deciding whether to buy or sell our common shares is our dividend rate (or expected future dividend rates) as a percentage of our common share price, relative to market interest rates. If market interest rates increase, prospective investors may demand a higher dividend rate on our common shares or seek alternative investments paying higher dividends or interest. As a result, interest rate fluctuations and capital market conditions can affect the market price of our common shares independent of the effects such conditions may have on our portfolio. For instance, if interest rates rise without an increase in our dividend rate, the market price of our common shares could decrease because potential investors may require a higher dividend yield on our common shares as market rates on interest-bearing instruments such as bonds rise. In addition, to the extent we have variable rate debt, such as our reverse repo financing, rising interest rates
43
would result in increased interest expense on this variable rate debt, thereby adversely affecting our cash flow and our ability to service our indebtedness and pay dividends to our shareholders.
Investing in our common shares involves a high degree of risk.
The assets we purchase in accordance with our objectives may result in a higher amount of risk than other alternative asset acquisition options. The assets we acquire may be highly speculative and aggressive and may be subject to a variety of risks, including credit risk, prepayment risk, interest rate risk, and market risk. As a result, an investment in our common shares may not be suitable for investors with lower risk tolerance.
Risks Related To Our Organization and Structure
Our operating agreement and management agreement contain provisions that may inhibit potential acquisition bids that shareholders may consider favorable, and the market price of our common shares may be lower as a result.
Our operating agreement contains provisions that have an anti-takeover effect and inhibit a change in our Board of Directors. These provisions include the following:
|
•
|
allowing only our Board of Directors to fill newly created directorships;
|
|
•
|
requiring advance notice for our shareholders to nominate candidates for election to our Board of Directors or to propose business to be considered by our shareholders at a meeting of shareholders;
|
|
•
|
our ability to issue additional securities, including, but not limited to, preferred shares, without approval by shareholders;
|
|
•
|
the ability of our Board of Directors to amend the operating agreement without the approval of our shareholders except under certain specified circumstances; and
|
|
•
|
limitations on the ability of shareholders to call special meetings of shareholders or to act by written consent.
|
Certain provisions of the management agreement also could make it more difficult for third parties to acquire control of us by various means, including limitations on our right to terminate the management agreement and a requirement that, under certain circumstances, we make a substantial payment to our Manager in the event of a termination.
There are ownership limits and restrictions on transferability and ownership in our operating agreement.
Our operating agreement, subject to certain exceptions, contains restrictions on the amount of our shares that a person may own and may prohibit certain entities from owning our shares. We have one subsidiary that elected to be treated as a REIT beginning with its 2015 taxable year, and we may acquire or form other entities that will elect to be REITs. Accordingly, in order to ensure that we or our REIT subsidiaries are able to satisfy the REIT ownership requirements, our operating agreement provides that (subject to certain exceptions described below) no person may own, or be deemed to own by virtue of the attribution provisions of the Code, more than 9.8% of the aggregate value or number (whichever is more restrictive) of our outstanding shares.
Any person who acquires or attempts or intends to acquire beneficial or constructive ownership of our shares that will or may violate any of the foregoing restrictions on transferability and ownership, or who is the intended transferee of our common shares which are transferred to the trust (as described below), will be required to give written notice immediately to us, or in the case of proposed or attempted transactions will be required to give at least 15 days written notice to us, and provide us with such other information as we may request in order to determine the effect of such transfer, including, without limitation, the effect on the qualification as a REIT of our REIT subsidiary and any potential REIT subsidiary we acquire or form in the future.
Our Board of Directors, in its sole discretion, may exempt any person from the foregoing restrictions. Any person seeking such an exemption must provide to our Board of Directors such representations, covenants, and undertakings as our Board of Directors may deem appropriate. Our Board of Directors may also condition any such exemption on the receipt of a ruling from the Internal Revenue Service, or "IRS," or an opinion of counsel as it deems appropriate. Our Board of Directors has granted an exemption from this limitation to Ellington and certain affiliated entities of Ellington, subject to certain conditions.
Our rights and the rights of our shareholders to take action against our directors and officers or against our Manager or Ellington are limited, which could limit your recourse in the event actions are taken that are not in your best interests.
Our operating agreement limits the liability of our directors and officers to us and our shareholders for money damages, except (i) for any breach of such person's duty of loyalty to us or our shareholders; (ii) for acts or omissions not in good faith or which involve intentional misconduct or knowing violation of law; or (iii) for any transaction from which such person derived
44
an improper benefit.
In addition, our operating agreement authorizes us to obligate our company to indemnify our present and former directors and officers (except in certain limited circumstances) for actions taken by them in those capacities to the maximum extent permitted by Delaware law if such person acted in good faith and in a manner the person reasonably believed to be in or not opposed to our best interests, and, with respect to any criminal action or proceeding, had no reasonable cause to believe the person's conduct was unlawful. We have entered into indemnification agreements with our directors and officers implementing these indemnification provisions that obligate us to indemnify them to the maximum extent permitted by Delaware law. Such indemnification includes defense costs and expenses incurred by such officers and directors.
Our management agreement with our Manager requires us to indemnify our Manager and its affiliates against any and all claims and demands arising out of claims by third parties caused by acts or omissions of our Manager and its affiliates not constituting bad faith, willful misconduct, gross negligence, or reckless disregard of our Manager's duties under the management agreement.
In light of the liability limitations contained in our operating agreements and our management agreement with our Manager, as well as our indemnification arrangements with our directors and officers and our Manager, our and our shareholders' rights to take action against our directors, officers, and Manager are limited, which could limit your recourse in the event actions are taken that are not in your best interests.
Maintenance of our exclusion from registration as an investment company under the Investment Company Act imposes significant limitations on our operations.
We have conducted and intend to continue to conduct our operations so that neither we nor any of our subsidiaries are required to register as an investment company under the Investment Company Act. Both we and our Operating Partnership are organized as holding companies and conduct our business primarily through wholly-owned subsidiaries of our Operating Partnership. Our Operating Partnership's investments in its 3(c)(7) subsidiaries and its other investment securities cannot exceed 40% of the value of our Operating Partnership's total assets (excluding U.S. government securities and cash) on an unconsolidated basis. In addition, the Holding Subsidiary's investment in its 3(c)(7) subsidiary and its other investment securities cannot exceed 40% of the value of our Holding Subsidiary's total assets (excluding U.S. government securities and cash) on an unconsolidated basis. These requirements limit the types of businesses in which we may engage and the assets we may hold. Our 3(c)(5)(C) subsidiary relies on the exclusion provided by Section 3(c)(5)(C) of the Investment Company Act. Section 3(c)(5)(C) of the Investment Company Act is designed for entities "primarily engaged in the business of purchasing or otherwise acquiring mortgages and other liens on and interests in real estate." This exclusion generally requires that at least 55% of the entity's assets on an unconsolidated basis consist of qualifying real estate assets and at least 80% of the entity's assets on an unconsolidated basis consist of qualifying real estate assets or real estate-related assets. Both the 40% Test and the requirements of the Section 3(c)(5)(C) limit the types of businesses in which we may engage and the types of assets we may hold, as well as the timing of sales and purchases of those assets.
To classify the assets held by our subsidiaries as qualifying real estate assets or real estate-related assets, we rely on no-action letters and other guidance published by the SEC staff regarding those kinds of assets, as well as upon our analyses (in consultation with outside counsel) of guidance published with respect to other types of assets. There can be no assurance that the laws and regulations governing the Investment Company Act status of companies similar to ours, or the guidance from the SEC staff regarding the treatment of assets as qualifying real estate assets or real estate-related assets, will not change in a manner that adversely affects our operations. In fact, in August 2011, the SEC published a concept release in which it asked for comments on this exclusion from registration. To the extent that the SEC staff provides more specific guidance regarding any of the matters bearing upon our exclusion from the definition of an investment company under the Investment Company Act, we may be required to adjust our strategy accordingly. Any additional guidance from the SEC staff could further inhibit our ability to pursue the strategies that we have chosen. Furthermore, although we monitor the assets of our subsidiaries regularly, there can be no assurance that our subsidiaries will be able to maintain their exclusion from registration. Any of the foregoing could require us to adjust our strategy, which could limit our ability to make certain investments or require us to sell assets in a manner, at a price or at a time that we otherwise would not have chosen. This could negatively affect the value of our common shares, the sustainability of our business model, and our ability to pay dividends to our shareholders.
If we were required to register as an investment company under the Investment Company Act, we would be subject to the restrictions imposed by the Investment Company Act, which would require us to make material changes to our strategy.
If we are deemed to be an investment company under the Investment Company Act, we would be required to materially restructure our activities or to register as an investment company under the Investment Company Act, which would have a material adverse effect on our business, financial condition, and results of operations. In connection with any such restructuring, we may be required to sell portfolio assets at a time we otherwise might not choose to do so, and we may incur
45
losses in connection with such sales. Further, our Manager may unilaterally terminate the management agreement if we become regulated as an investment company under the Investment Company Act. Further, if it were established that we were an unregistered investment company, there would be a risk that we would be subject to monetary penalties and injunctive relief in an action brought by the SEC, that we would be unable to enforce contracts with third parties and that third parties could seek to obtain rescission of transactions undertaken during the period it was established that we were an unregistered investment company.
U.S. Federal Income Tax Risks
Your investment has various U.S. federal, state, and local income tax risks.
We strongly urge you to consult your tax advisor concerning the effects of U.S. federal, state, and local income tax law on an investment in our common shares and on your individual tax situation.
If we fail to satisfy the "qualifying income exception" under the tax rules for publicly traded partnerships, all of our income will be subject to an entity-level tax, and the value of our shares could be adversely affected.
We believe that we have been and will be treated, for U.S. federal income tax purposes, as a partnership and not as an association or a publicly traded partnership taxable as a corporation. In general, if a partnership is "publicly traded" (as defined in the Code), it will be treated as a corporation for U.S. federal income tax purposes. A publicly traded partnership will, however, be treated as a partnership, and not as a corporation, for U.S. federal income tax purposes, so long as at least 90% of its gross income for each taxable year constitutes "qualifying income" within the meaning of Section 7704(d) of the Code and it would not be included in the definition of a regulated investment company, or "RIC," under Section 851(a) of the Code if it were a domestic corporation (which generally applies to entities required to register under the Investment Company Act). We refer to this exception as the "qualifying income exception." Qualifying income generally includes rents, dividends, interest, and gains from the sale or other disposition of stocks, bonds, and real property. Qualifying income also includes other income derived from the business of investing in, among other things, stocks and securities. Interest is not qualifying income if it is derived in the "conduct of a financial or insurance business" or is based, directly or indirectly, on the income or profits of any person. Our income currently consists primarily of interest income, income and gains from interest rate derivatives, credit derivatives, and other derivatives, and gains from the sale of securities (including income from the short sale of securities), all of which is generally qualifying income for purposes of the qualifying income exception. However, no assurance can be given as to the types of income we will earn in the future.
If we fail to satisfy the "qualifying income exception" described above, we would be treated as a corporation for U.S. federal income tax purposes. In that event, items of income, gain, loss, deduction, and credit would not pass through to holders of our common shares and such holders would be treated for U.S. federal (and certain state and local) income tax purposes as shareholders in a corporation. We would be required to pay income tax at regular corporate rates on all of our income. In addition, we would likely be liable for state and local income and/or franchise taxes on some or all of our income. Distributions to holders of our common shares would constitute ordinary dividend income taxable to such holders to the extent of our earnings and profits, and these distributions would not be deductible by us. Additionally, distributions paid to non-U.S. holders of our common shares would be subject to U.S. federal withholding taxes at the rate of 30% (or such lower rate provided by an applicable tax treaty). Thus, if we were treated as a corporation, such treatment would result in a material reduction in cash flow and after-tax returns for holders of our common shares and thus would result in a substantial reduction in the value of our common shares.
If certain portions of the 2016 Tax Reform Blueprint published by the Republicans on the House Ways and Means Committee were introduced as legislation and enacted in their current form, we could reconsider maintaining our status as a publicly traded partnership, we could substantially change our investment and financing strategies, and the after-tax returns for holders of our common shares could be significantly adversely impacted.
As described above, under current law, a publicly traded partnership will be treated as a partnership, and not as a corporation, for U.S. federal income tax purposes, so long as at least 90% of its gross income for each taxable year constitutes qualifying income for purposes of the qualifying income exception. On June 24, 2016, the Republicans on the House Ways and Means Committee released a blueprint of tax reform legislation (the "Tax Reform Task Force Blueprint"). Among the proposals in the Tax Reform Task Force Blueprint is a provision that creates a new 25% tax rate on business income earned by pass-through entities. It is unclear to what extent this proposed tax would apply to the taxable income of a publicly traded partnership like us. To the extent that it does apply to us, we could choose to elect to qualify as a REIT, or we could elect to be taxed as a corporation. If we were to elect to qualify as a REIT, the tax requirements applicable to REITs could force us to forego investments we might otherwise make or avoid hedging strategies in which we would otherwise engage, or, alternatively, require us to acquire such investments or engage in such strategies through a taxable subsidiary. If we did not choose to elect to qualify as a REIT under such a scenario, the proposed tax if we maintained our status as a publicly traded
46
partnership, or the corporate tax if we were to elect to be taxed as a corporation, could result in a material reduction in cash flow and after-tax returns for holders of our common shares and thus could result in a substantial reduction in the value of our common shares. Another of the proposals could prohibit the deductibility of our interest expense in excess of our interest income. Changes to the Internal Revenue Code that limit the deductibility of interest expense could increase the after-tax cost of debt financing of acquisitions which could make our use of leverage for new investments less attractive, require us to adjust our investment strategies, increase competition for investments relative to other investors with a lower cost of capital, and adversely affect our investment returns. There is a substantial lack of clarity around both the timing and the details of any of the Tax Reform Task Force Blueprint proposals and the potential impact of the proposals on an investment in us.
Holders of our common shares will be subject to U.S. federal income tax on their share of our taxable income, regardless of whether or when they receive any cash distributions from us, and may recognize income in excess of our cash distributions.
We believe that we have been and will be treated, for U.S. federal income tax purposes, as a partnership and not as an association or a publicly traded partnership taxable as a corporation. Holders of our common shares are subject to U.S. federal income taxation and, in some cases, state, local, and foreign income taxation, on their allocable share of our items of income, gain, loss, deduction, and credit, regardless of whether or when they receive cash distributions. Individuals, trusts, and estates that are U.S. holders and whose income exceeds certain thresholds are also subject to a Medicare tax on their share of our taxable income. In addition, certain of our assets may produce taxable income without corresponding distributions of cash to us or produce taxable income prior to or following the receipt of cash relating to such income or produce losses that are not currently deductible against our other income, and holders of our common shares will be required to take our taxable income from such assets into account in determining their taxable income. Regardless of how much taxable income we generate, we are not required to make distributions to our shareholders. Consequently, it is possible that the U.S. federal income tax liability of shareholders with respect to their respective allocable shares of our earnings in a particular taxable year could exceed the cash distributions we make to shareholders with respect to that taxable year, thus requiring out-of-pocket tax payments by shareholders. Furthermore, if we did not make cash distributions with respect to a taxable year, holders of our common shares could still have a tax liability attributable to their allocation of our taxable income for that taxable year.
The ability of holders of our common shares to deduct certain expenses incurred by us may be limited.
We believe that, based on the scope of our current activities, most of the expenses incurred by us and our Operating Partnership, including base management fees and incentive fees paid to our Manager, will not be treated as "miscellaneous itemized deductions" and will be deductible as ordinary trade or business expenses. We have made investments, however, including investments in partnerships, whose related expenses will be treated as miscellaneous itemized deductions. At present, we do not believe that our share of such expenses will be significant, but no assurance can be provided that we will not in the future incur significant amounts of expenses that will be treated as miscellaneous itemized deductions. In general, "miscellaneous itemized deductions" may be deducted by a holder of our common shares that is an individual, estate, or trust only to the extent that such deductions exceed, in the aggregate, 2% of such holder's adjusted gross income. There are also limitations on the deductibility of itemized deductions by individuals whose adjusted gross income exceeds a specified amount, adjusted annually for inflation. In addition, "miscellaneous itemized deductions" are also not deductible in determining the alternative minimum tax liability of a holder. Although we believe that our and our Operating Partnership's expenses generally will not be treated as "miscellaneous itemized deductions," there can be no assurance that the IRS will not successfully challenge that treatment. In that event, a holder's inability to deduct all or a portion of such expenses could result in an amount of taxable income to such holder with respect to us that exceeds the amount of cash actually distributed to such holder for the year.
Any taxes paid by our corporate subsidiaries will reduce the cash available for distribution to our shareholders
.
We currently own several domestic and foreign subsidiaries that are treated as corporations for U.S. tax purposes. In the future, we may acquire ownership of other domestic and foreign corporate subsidiaries. Our domestic taxable corporate subsidiaries will be subject to U.S. federal, state, and local income tax on their taxable income. We anticipate that our foreign corporate subsidiaries will generally conduct their activities in such a way as not to be deemed to be engaged in a U.S. trade or business and not to be subject to U.S. federal income tax on their net income. There can be no assurance, however, that our foreign corporate subsidiaries will not engage in, or be deemed by the IRS to be engaged in, activities that may cause them to be engaged in a U.S. trade or business. Moreover, there can be no assurance that as a result of any change in applicable law, treaty, rule or regulation or interpretation thereof, the activities of any of our foreign corporate subsidiaries would not become subject to U.S. federal income tax. While our foreign corporate subsidiaries are generally not expected to be subject to U.S. federal income tax on their net income, such subsidiaries may receive income that is subject to withholding taxes imposed by the United States or other countries. Even if the intended U.S. federal income tax treatment of our foreign corporate subsidiaries is respected, those entities may be subject to income, franchise or other taxes in the jurisdictions and/or the states
47
in which they are organized or operate. Any taxes paid by our corporate subsidiaries will reduce the cash available for distribution to our shareholders.
If our REIT subsidiary fails to comply with the REIT requirements, it could be subject to tax.
We have a subsidiary that elected to be treated as a REIT under the Code beginning with its 2015 taxable year, and we may acquire ownership of other REIT subsidiaries in the future. REITs are subject to a number of organizational and operational requirements, including a requirement that they currently distribute at least 90% of their annual REIT taxable income excluding net capital gains. We cannot assure you that our REIT subsidiary will be able to comply with such requirements . Failure to qualify as a REIT in any taxable year would cause this subsidiary to be subject to U.S. federal income tax (and any applicable state and local taxes) on its taxable income at regular corporate rates. Even if our REIT subsidiary qualifies as a REIT for U.S. federal income tax purposes, it will be subject to a tax equal to 100% of the net income derived from any "prohibited transactions" (i.e., gains from the sale of property held primarily for sale to customers in the ordinary course of business, or "dealer property") and may be subject to income, franchise or other taxes in the jurisdictions and/or the states in which it is organized or operates. For example, if it forms a TRS, the income generated by that subsidiary will be subject to U.S. federal, state, and local income tax. Any taxes paid by our REIT subsidiary or a TRS will reduce the cash available for distribution to our shareholders.
Tax-exempt holders of our common shares will likely recognize significant amounts of "unrelated business taxable income," which might have adverse consequences.
An organization or account (such as an individual retirement account) that is otherwise exempt from U.S. federal income tax is nonetheless subject to taxation with respect to its "unrelated business taxable income," or "UBTI." Because we have incurred and will incur "acquisition indebtedness" with respect to many of our investments, a proportionate share of a holder's income from us with respect to such investments will be treated as UBTI. Accordingly, tax-exempt holders of our common shares will likely recognize significant amounts of UBTI. For certain types of tax-exempt entities, the receipt of any UBTI might have adverse consequences. Tax-exempt holders of our common shares are strongly urged to consult their tax advisors regarding the tax consequences of owning our common shares.
There can be no assurance that the IRS will not assert successfully that some portion of our income is properly treated as effectively connected income with respect to non-U.S. holders of our common shares.
While it is expected that our method of operation will not result in the generation of significant amounts of income treated as effectively connected with the conduct of a U.S. trade or business with respect to non-U.S. holders of our common shares, there can be no assurance that the IRS will not assert successfully that some portion of our income is properly treated as effectively connected income with respect to such non-U.S. holders. Moreover, in the case of dividends paid to us by our REIT subsidiary or by other REITs in which we invest, to the extent that such dividends are attributable to gains from the sale of U.S. real property interests, such dividends will generally be treated as effectively connected income with respect to non-U.S. holders of our common shares, as will gain from our sale of stock of a REIT that has significant investments in U.S. real property. To the extent that our income is treated as effectively connected income, non-U.S. holders generally would be required to (i) file a U.S. federal income tax return for such year reporting their allocable portion, if any, of our income or loss effectively connected with such trade or business and (ii) pay U.S. federal income tax at regular U.S. tax rates on any such income. Additionally, we would be required to withhold tax at the highest applicable tax rate on a non-U.S. holder's allocable share of our effectively connected income. Non-U.S. holders that are corporations also would be required to pay branch profits tax at a 30% rate (or such lower rate provided by an applicable treaty). To the extent our income is treated as effectively connected income, it may also be treated as non-qualifying income for purposes of the qualifying income exception.
If the IRS challenges certain aspects of our Operating Partnership structure, the taxable income allocated to the holders of our common shares could be adjusted (possibly retroactively) and our ability to provide tax information on a timely basis could be negatively affected.
Since January 1, 2013, we have held all of our assets and conducted all of our operations through our Operating Partnership. Although we have made an election to adjust the basis in our assets upon a transfer of our shares under Section 754 of the Code, or a "Section 754 election," our Operating Partnership did not make and does not intend to make a Section 754 election. As a result of our Section 754 election, each holder that purchases our shares will have an initial tax basis in our assets (i.e., the membership interests in our Operating Partnership, or "OP Units") that reflects such holder's purchase price. Because our Operating Partnership did not make and will not make a Section 754 election, we believe that our Operating Partnership will not be required to make corresponding tax basis adjustments with respect to its assets. It is possible that the IRS might challenge this position, and if such challenge were upheld, any holder who purchased our shares when our diluted book value per share exceeded the holder's per share purchase price would be allocated additional income (and/or a lesser amount of loss) in an amount per share approximately equal to such excess, ignoring any offsetting allocations of operating loss and assuming
48
that our diluted book value per share at the end of the taxable year was equal to or greater than the diluted book value per share at the time of purchase. No complete assurance can be provided that the IRS will not successfully assert that the tax basis of the assets held by our Operating Partnership must be adjusted upon a purchase of our shares.
On its initial tax return, our Operating Partnership attached the election it made under Section 475(f) of the Code to mark to market for U.S. federal income tax purposes the securities it holds as a trader. We attached such an election to our initial tax return as well. Because an interest in a non-publicly traded partnership, such as our Operating Partnership, is not considered a "security" subject to the mark-to-market rules of Section 475(f) of the Code, we do not anticipate that the assets we hold directly (i.e., our OP Units) will be required to be marked to market. As noted above, we caused our Operating Partnership to attach its election to be a trader under Section 475(f) of the Code to its initial tax return. There are limited authorities under Section 475(f) of the Code as to what constitutes a trader for U.S. federal income tax purposes. Under other sections of the Code, the status of a trader in securities depends on all of the facts and circumstances, including the nature of the income derived from the taxpayer's activities, the frequency, extent and regularity of the taxpayer's securities transactions, and the taxpayer's investment intent. We believe that our Operating Partnership qualified and continues to qualify as a trader, and that we qualified as trader prior to January 1, 2013. There can be no assurance that we or our Operating Partnership have qualified or will continue to qualify as a trader in securities eligible for the mark-to-market election. We have not received, nor are we seeking, an opinion from counsel or a ruling from the IRS regarding our or our Operating Partnership's qualification as a trader. If our or our Operating Partnership's qualification for, or our application of, the mark-to-market election were successfully challenged by the IRS, in whole or in part, it could, depending on the circumstances, result in retroactive (or prospective) changes in the amount of taxable income and the tax character of taxable income recognized by us and allocated to the holders of our shares. An inability to utilize the mark-to-market election might also have an adverse effect on our ability to provide tax information to holders of our shares on a timely basis. The IRS could also challenge any conventions that we use in computing, or in allocating among holders of our shares, any gain or loss resulting from the mark-to-market election.
Our Operating Partnership is required to identify any securities that are not held in connection with the trade or business of trading securities on the day such positions are acquired. If our Operating Partnership fails to properly identify a security that is not held in connection with such trade or business, the IRS may require the Operating Partnership to recognize "mark-to-market" gains on such securities as ordinary income at the end of each taxable year, but defer recognition of any "mark-to-market" losses, to the extent they exceed gains previously recognized with respect to such security, until the security is sold. In addition, we have taken the position that our Operating Partnership's mark-to-market gain or loss in its securities held as a trader, and any gain or loss on the actual disposition of such securities, should be treated as ordinary income or loss. However, because the law is unclear as to the treatment of assets that are held for investment, and the determination of which assets are held for investment, the IRS could take the position that the mark-to-market gain or loss attributable to certain of our Operating Partnership's assets should be treated as capital gain or loss and not as ordinary gain or loss. Additionally, the IRS could take the position that the gain on securities our Operating Partnership identified as not held in connection with the trade or business of trading securities should be treated as ordinary gain rather than capital gain. In either case, we might not be able to use some or all of our losses to offset our income, which could increase the amount of taxable income allocated to the holders of our shares, without any corresponding increase in our economic income or in the distributions we make to the holders of our shares. The tax on our taxable income allocated to you may be in excess of our cash distributions to you.
The IRS may challenge our allocations of income, gain, loss, deduction and credit.
Our operating agreement provides for the allocation of income, gain, loss, deduction and credit among the holders of our common shares. The rules regarding partnership allocations are complex. If the allocations provided by our operating agreement were successfully challenged by the IRS, the redetermination of the allocations to a particular holder for U.S. federal income tax purposes could be less favorable than the allocations set forth in our operating agreement.
Complying with certain tax-related requirements may cause us to forego otherwise attractive business opportunities.
To be treated as a partnership for U.S. federal income tax purposes, and not as an association or publicly traded partnership taxable as a corporation, we must satisfy the qualifying income exception, which requires that at least 90% of our gross income each taxable year consist of interest, dividends, capital gains and other types of "qualifying income." Interest income will not be qualifying income for the qualifying income exception if it is derived from "the conduct of a financial or insurance business." This requirement limits our ability to invest directly in mortgage originators, originate loans directly, acquire loans originated by our Manager and its affiliates, or acquire loans originated by any corporate or REIT subsidiary. These rules will also limit our ability to modify distressed debt instruments. We also intend to operate so as to avoid generating a significant amount of income that is treated as effectively connected with the conduct of a U.S. trade or business with respect to non-U.S. holders. In order to comply with these requirements, we (or our subsidiaries) may be required to invest through our foreign or taxable domestic corporate subsidiaries or forego attractive business opportunities, and we have made certain investments through our taxable domestic, REIT and foreign corporate subsidiaries in order to comply with these requirements.
49
Thus, compliance with these requirements may materially adversely affect our business, financial condition and results of our operations and our ability to make distributions to our shareholders.
The IRS Schedules K-1 we will provide will be significantly more complicated than the IRS Forms 1099 provided by REITs and regular corporations, and holders of our common shares may be required to request an extension of time to file their tax returns.
Holders of our common shares are required to take into account their allocable share of items of our income, gain, loss, deduction and credit for our taxable year ending within or with their taxable year. We have agreed to use reasonable efforts to furnish holders of our common shares with tax information (including IRS Schedule K-1, which describes their allocable share of such items for our preceding taxable year) as promptly as practicable after the end of each taxable year. However, we may not be able to provide holders of our common shares with tax information on a timely basis. Because holders of our common shares will be required to report their allocable share of each item of our income, gain, loss, deduction, and credit on their tax returns, tax reporting for holders of our common shares will be significantly more complicated than for shareholders in a REIT or a regular corporation. In addition, delivery of this information to holders of our common shares will be subject to delay in the event of, among other reasons, the late receipt of any necessary tax information from an investment in which we hold an interest. It is therefore possible that, in any taxable year, holders of our common shares will need to apply for extensions of time to file their tax returns.
New IRS audit procedures could subject holders of our common shares to bear the costs of audit adjustments relating to previous tax years.
For taxable years beginning after December 31, 2017, new IRS audit procedures will apply to partnerships. These new partnership audit procedures will require partnerships to pay tax (including interest and penalties) on any adjustments to taxable income made as a result of an IRS audit. The amount of tax paid by the partnership will be determined without the benefit of partner level tax items that could otherwise reduce tax due on any adjustment. Because the audit adjustment tax is paid by the partnership, the economic burden of any such tax on us would fall on the holders of our common shares at the time that the audit adjustment tax is paid. However, a partnership may instead elect to pass through any audit adjustments to those who were partners of the partnership in the year that was audited. If we were to make this election with respect to an audit adjustment, the tax burden associated with such adjustment would fall on those who were holders of our common shares in the year that was audited. Several changes and clarifications have been proposed to these rules. No assurance can be given that the law will not change prior to the date on which the new audit procedures first apply. As a result of these new audit procedures, our shareholders could bear the cost of an audit adjustment relating to a previous tax year, including a tax year prior to when such shareholder acquired our common shares.
Our structure involves complex provisions of U.S. federal income tax law for which no clear precedent or authority may be available, and which is subject to potential change, possibly on a retroactive basis. Any such change could result in adverse consequences to the holders of our common shares.
The U.S. federal income tax treatment of holders of our common shares depends in some instances on determinations of fact and interpretations of complex provisions of U.S. federal income tax law for which no clear precedent or authority may be available. The rules dealing with U.S. federal income taxation are constantly under review by persons involved in the legislative process, the IRS and the U.S. Treasury, frequently resulting in revised interpretations of established concepts, statutory changes, revisions to regulations and other modifications and interpretations. Also, the IRS pays close attention to the proper application of tax laws to partnerships. The present U.S. federal income tax treatment of an investment in our common shares may be modified by administrative, legislative or judicial interpretation at any time, and any such action may affect investments and commitments we have previously made. In addition, as a result of the recent change in presidential administrations, there may be significant reform of the Code, including significant changes to the taxation of both business entities and individuals. There is a substantial lack of clarity around both the timing and the details of any such tax reform and the impact of any potential tax reform on an investment in us. We and holders of our common shares could be adversely affected by any such change in tax law, regulation or interpretation. Our operating agreement permits our Board of Directors to modify (subject to certain exceptions) the operating agreement from time to time, without the consent of the holders of our common shares. These modifications may address, among other things, certain changes in U.S. federal income tax regulations, legislation or interpretation. In some circumstances, such revisions could have an adverse impact on some or all of the holders of our common shares. Moreover, we intend to apply certain assumptions and conventions in an attempt to comply with applicable rules and to report income, gain, deduction, loss and credit to holders of our common shares in a manner that reflects their distributive share of our items, but these assumptions and conventions may not be in compliance with all aspects of applicable tax requirements. It is possible that the IRS will assert successfully that the conventions and assumptions we use do not satisfy the technical requirements of the Code and/or Treasury Regulations and could require that items of income, gain, deduction, loss or credit be adjusted or reallocated in a manner that adversely affects holders of our common shares.
50
None.
We do not own any properties. Our principal offices are located in leased space at 53 Forest Avenue, Old Greenwich, CT 06870. The offices of our Manager and Ellington are at the same location. As part of our management agreement, our Manager is responsible for providing offices necessary for all operations, and accordingly, all lease responsibilities belong to our Manager.
Neither we nor Ellington nor its affiliates (including our Manager) are currently subject to any legal proceedings that we or our Manager consider material. Nevertheless, we and Ellington and its affiliates operate in highly regulated markets that currently are under intense regulatory scrutiny, and we and Ellington and its affiliates have received, and we expect in the future that we and they may receive, inquiries and requests for documents and information from various federal, state and foreign regulators. For example, in January 2017, we received a subpoena from the SEC requesting documents, communications, and other information relating primarily to a loan originator and the loans originated by such originator, our analyses of such loans, the purchases and securitizations of such loans by us and by certain third parties, and the servicing of such loans. Ellington has advised us that, at the present time, it is not aware that any material legal proceeding against us or Ellington or its affiliates is contemplated in connection with any such inquiries or requests. We and Ellington cannot provide any assurance that these or any future such inquiries and requests will not result in further investigation of or the initiation of a proceeding against us or Ellington or its affiliates or that, if any such investigation or proceeding were to arise, it would not materially adversely affect us. For a discussion of certain risks to which we or Ellington or its affiliates could be exposed as a result of inquiries or requests for documents and information received by us or Ellington or its affiliates, see "Risk Factors—We or Ellington or its affiliates may be subject to regulatory inquiries or proceedings" included in Part 1A of this Annual Report on Form 10-K for the year ended December 31, 2016.
Not applicable.
Market Information
Our common shares have been listed on the New York Stock Exchange ("NYSE") under the symbol "EFC" since October 8, 2010. The following table sets forth, for the periods indicated, the high and low sales prices for our common stock:
|
Common Stock Sales Price
|
||||||||
|
High
|
Low
|
|||||||
|
2016:
|
||||||||
|
First Quarter
|
$
|
17.86
|
|
$
|
14.18
|
|
||
|
Second Quarter
|
$
|
18.20
|
|
$
|
16.53
|
|
||
|
Third Quarter
|
$
|
18.04
|
|
$
|
16.65
|
|
||
|
Fourth Quarter
|
$
|
16.78
|
|
$
|
15.31
|
|
||
|
2015:
|
||||||||
|
First Quarter
|
$
|
21.65
|
|
$
|
19.72
|
|
||
|
Second Quarter
|
$
|
20.60
|
|
$
|
18.20
|
|
||
|
Third Quarter
|
$
|
18.99
|
|
$
|
17.00
|
|
||
|
Fourth Quarter
|
$
|
18.73
|
|
$
|
16.24
|
|
||
The closing price for our common shares on March 10, 2017, was $15.70.
51
Holders of Our Common Shares
Based upon a review of a securities position listing as of March 3, 2017, we had an aggregate of 104 holders of record and holders of our common shares who are nominees for an undetermined number of beneficial owners.
Dividends
While we have historically paid dividends to holders of our common shares on a quarterly basis, the declaration of dividends to our shareholders and the amount of such dividends are at the discretion of our Board of Directors. In setting our dividends, our Board of Directors takes into account, among other things, our earnings, our financial condition, our working capital needs, and new investment opportunities. In particular, we may lower or suspend dividends when we believe it is prudent to do so for liquidity management purposes, during financial crises or extreme market dislocations, or in order to take advantage of what we deem to be extraordinary investment opportunities. Furthermore, it is possible that some of our future financing arrangements could contain provisions restricting our ability to pay dividends. In addition, our ability to pay dividends is subject to certain restrictions under the Delaware Limited Liability Company Act, or the "Delaware LLC Act." Under the Delaware LLC Act, a limited liability company generally is not permitted to pay a dividend if, after giving effect to the dividend, the liabilities of the company will exceed the value of the company's assets. Shareholders generally will be subject to U.S. federal income tax (and any applicable state and local taxes) on their respective allocable shares of our net taxable income regardless of the timing or amount of dividend we pay to our shareholders.
The following table sets forth the dividends per share we have paid, or will pay with respect to the dividends declared for the fourth quarter of 2016, to our shareholders with respect to the periods indicated.
|
Dividend Per Share
|
Record Date
|
Payment Date
|
||||
|
For the year ended December 31, 2016:
|
||||||
|
First Quarter
|
$0.50
|
June 1, 2016
|
June 15, 2016
|
|||
|
Second Quarter
|
$0.50
|
September 1, 2016
|
September 15, 2016
|
|||
|
Third Quarter
|
$0.45
|
December 1, 2016
|
December 15, 2016
|
|||
|
Fourth Quarter
|
$0.45
|
March 1, 2017
|
March 15, 2017
|
|||
|
For the year ended December 31, 2015:
|
||||||
|
First Quarter
|
$0.65
|
June 1, 2015
|
June 15, 2015
|
|||
|
Second Quarter
|
$0.65
|
September 1, 2015
|
September 15, 2015
|
|||
|
Third Quarter
|
$0.50
|
December 1, 2015
|
December 15, 2015
|
|||
|
Fourth Quarter
|
$0.50
|
March 1, 2016
|
March 15, 2016
|
|||
We cannot assure you that we will pay any future dividends to our shareholders and the dividends set forth in the table above are not intended to be indicative of the amount and timing of future dividends, if any.
We generally refer to payments made to our shareholders with respect to our common shares as "dividends" for purposes of this Annual Report on Form 10-K. For U.S. federal income tax purposes, those payments will be treated as distributions from a partnership.
Equity Compensation Plan Information
The following table sets forth information as of December 31, 2016 with respect to compensation plans under which our equity securities are authorized for issuance. We have no such plans that were not approved by security holders.
|
Plan Category
|
Number of securities to be issued upon exercise of outstanding options, warrants and rights (a)
|
Weighted-average exercise price of our outstanding options, warrants and rights (b)
|
Number of securities remaining available for future issuance under equity compensation plans (excluding securities reflected in column (a)) (c)
|
|||||
|
Equity compensation plans approved by security holders
|
469,539
|
(1)
|
N/A
|
1,307,397
|
(2)
|
|||
|
(1)
|
Represents outstanding LTIP Units, which are a separate non-voting class of limited liability company interests structured as profits interests. The LTIP Units, subject to certain forfeiture provisions, may be converted, at the election of the holder, into our common shares on a one-for-one basis. Of the 469,539 LTIP Units outstanding as of December 31, 2016, 94,539 were issued pursuant to our 2007 Incentive Plan for Individuals, and 375,000 were issued pursuant to our 2007 Incentive Plan for Entities.
|
|
(2)
|
As of December 31, 2016, a combined total of 1,307,397 common shares and LTIP Units remain available for issuance under the incentive plans. In each calendar year, the maximum limit on the number of common shares and LTIP Units issuable under both incentive plans increases by an amount equal to
|
52
6% of the difference, if any (but not less than zero) between (i) the number of common shares that are outstanding as of the last day of such calendar year and (ii) the number of common shares that are outstanding as of the last day of the immediately preceding calendar year (excluding any securities issued under the plans). The individual incentive plan requires that of the number of common shares and LTIP Units available for awards under both plans, 62,500 common shares be reserved for awards to be made to our independent directors. In no event will the aggregate number of common shares and LTIP Units issued pursuant to both incentive plans exceed 10,000,000. In the event that an award expires, or is forfeited, canceled or otherwise terminates without the issuance of common shares, such common shares subject to such award will again be available for subsequent awards, except as prohibited by law. In addition, common shares that we withhold in satisfaction of the holder's obligation to remit an exercise price or withholding taxes will be available for future awards.
Unregistered Sales of Equity Securities
Pursuant to our 2007 Individual Long-Term Incentive Plan, on December 13, 2016, we granted 13,673 LTIP Units to our partially dedicated employees. The LTIP Units are subject to forfeiture restrictions that will lapse with respect to 8,090 of the LTIP Units on December 13, 2017 and 5,583 of the LTIP Units on December 13, 2018. Once vested, the LTIP Units may be converted at the election of the holder into common shares representing limited liability interests of our company on a one-for-one basis. Such grants were exempt from the registration requirements of the Securities Act based on the exemption provided in Section 4(a)(2) of the Securities Act.
Purchases of Equity Securities
|
Total Number of Shares Purchased
|
Average Price Paid
|
Total Number of Shares Purchased as Part of Publicly Announced Plans or Programs
|
Number of Shares that May Yet be Purchased Under the Plans or Programs
|
||||||||||
|
October 1, 2016 - October 31, 2016
|
91,528
|
|
$
|
16.24
|
|
91,528
|
|
773,432
|
|
||||
|
November 1, 2016 - November 30, 2016
|
95,180
|
|
16.27
|
|
95,180
|
|
678,252
|
|
|||||
|
December 1, 2016 - December 31, 2016
|
137,649
|
|
15.95
|
|
137,649
|
|
540,603
|
|
|||||
|
Total
|
324,357
|
|
$
|
16.13
|
|
324,357
|
|
540,603
|
|
||||
On March 6, 2017, our Board of Directors approved the adoption of a share repurchase program under which the Company is authorized to repurchase up to 1.7 million common shares. The program, which is open-ended in duration, allows the Company to make repurchases from time to time on the open market or in negotiated transactions. Repurchases are at the Company's discretion, subject to applicable law, share availability, price and financial performance, among other considerations. This program superseded the similar share repurchase program that had previously been adopted on August 3, 2015, which had also authorized the repurchase of 1.7 million common shares.
53
Performance
This performance graph is furnished and shall not be deemed filed with the SEC or subject to Section 18 of the Exchange Act, nor shall it be deemed incorporated by reference in any of our filings under the Securities Act.
The following graph provides a comparison of the cumulative total return on our common shares to the cumulative total return on the Standard & Poor's 500 Composite Stock Price Index, or the "S&P 500," and the FTSE National Association of Real Estate Investment Trusts Mortgage REIT Index, or the "FTSE NAREIT MREIT." The comparison is for the period from December 31, 2011 to December 31, 2016, and assumes in each case, a $100 investment on December 31, 2011 and the reinvestment of dividends.
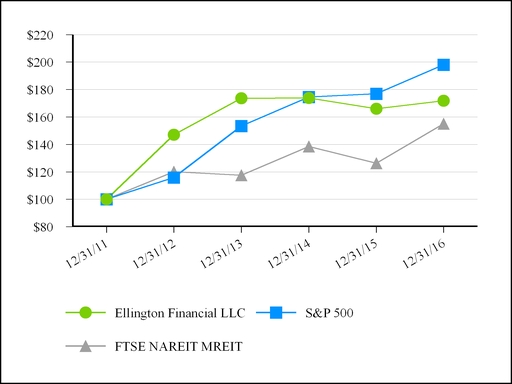
The actual cumulative total returns shown on the graph above are as follows:
|
December 31, 2011
|
December 31, 2012
|
December 31, 2013
|
December 31, 2014
|
December 31, 2015
|
December 31, 2016
|
|||||||||||||||||||
|
Ellington Financial LLC
|
$
|
100.00
|
|
$
|
146.99
|
|
$
|
173.62
|
|
$
|
173.88
|
|
$
|
165.95
|
|
$
|
171.76
|
|
||||||
|
S&P 500
|
$
|
100.00
|
|
$
|
115.99
|
|
$
|
153.45
|
|
$
|
174.54
|
|
$
|
176.94
|
|
$
|
198.09
|
|
||||||
|
FTSE NAREIT MREIT
|
$
|
100.00
|
|
$
|
120.03
|
|
$
|
117.50
|
|
$
|
138.47
|
|
$
|
126.30
|
|
$
|
155.13
|
|
||||||
The performance information above has been obtained from sources believed to be reliable, but neither its accuracy or completeness can be guaranteed. The historical information set forth above is not necessarily indicative of future performance. Accordingly, we do not make or endorse any predictions as to future share performance.
The following table presents selected consolidated financial information as of December 31, 2016, 2015, 2014, 2013, and 2012, and for the years ended December 31, 2016, 2015, 2014, 2013, and 2012. The consolidated financial information presented below as of December 31, 2016, and 2015 and for the years ended December 31, 2016, 2015, and 2014, has been derived from our audited financial statements included elsewhere in this Annual Report on Form 10-K. The consolidated financial information as of December 31, 2014, 2013, and 2012, and for the years ended December 31, 2013 and 2012, was derived from our historical audited consolidated financial statements not included in this Annual Report on Form 10-K.
Since the information presented below is only selected financial data and does not provide all of the information contained in our historical consolidated financial statements included elsewhere in this Annual Report on Form 10-K, including the related notes, you should read it in conjunction with "Item 7. Management's Discussion and Analysis of Financial Condition
54
and Results of Operations," and our historical consolidated financial statements, including the related notes to our consolidated financial statements, included in this Annual Report on Form 10-K.
|
Year Ended December 31,
|
|||||||||||||||||||
|
2016
|
2015
|
2014
|
2013
|
2012
|
|||||||||||||||
|
(In thousands except per share amounts)
|
|||||||||||||||||||
|
Investment Income:
|
|||||||||||||||||||
|
Interest income
|
$
|
74,344
|
|
$
|
101,783
|
|
$
|
93,533
|
|
$
|
85,740
|
|
$
|
63,857
|
|
||||
|
Other income
|
5,841
|
|
2,813
|
|
318
|
|
—
|
|
—
|
|
|||||||||
|
Total investment income
|
80,185
|
|
104,596
|
|
93,851
|
|
85,740
|
|
63,857
|
|
|||||||||
|
Expenses:
|
|||||||||||||||||||
|
Base management fee
|
10,065
|
|
11,493
|
|
10,751
|
|
9,115
|
|
6,835
|
|
|||||||||
|
Incentive fee
|
—
|
|
—
|
|
1,400
|
|
8,366
|
|
19,145
|
|
|||||||||
|
Interest expense
|
16,306
|
|
12,112
|
|
9,927
|
|
11,025
|
|
7,799
|
|
|||||||||
|
Other investment related expenses
|
8,070
|
|
5,612
|
|
4,689
|
|
496
|
|
—
|
|
|||||||||
|
Other operating expense
|
9,979
|
|
9,203
|
|
8,333
|
|
7,083
|
|
5,891
|
|
|||||||||
|
Total expenses
|
44,420
|
|
38,420
|
|
35,100
|
|
36,085
|
|
39,670
|
|
|||||||||
|
Net Investment Income
|
35,765
|
|
66,176
|
|
58,751
|
|
49,655
|
|
24,187
|
|
|||||||||
|
Net Realized and Unrealized Gain (Loss) on Investments, Financial Derivatives, and Foreign Currency Transactions/Translation:
|
|||||||||||||||||||
|
Net realized and change in net unrealized gain (loss) on investments
|
(5,304
|
)
|
(22,485
|
)
|
23,117
|
|
37,666
|
|
94,339
|
|
|||||||||
|
Net realized and change in net unrealized gain (loss) on financial derivatives, excluding currency forwards
|
(46,722
|
)
|
(5,598
|
)
|
(21,899
|
)
|
(7,959
|
)
|
(21,380
|
)
|
|||||||||
|
Net realized and change in net unrealized gain (loss) on financial derivatives—currency forwards
|
2,513
|
|
5,115
|
|
2,416
|
|
(38
|
)
|
—
|
|
|||||||||
|
Net foreign currency gain (loss)
|
(1,954
|
)
|
(4,779
|
)
|
(2,436
|
)
|
38
|
|
—
|
|
|||||||||
|
Net Realized and Change in Net Unrealized Gain (Loss) on Investments, Financial Derivatives, and Foreign Currency Transactions/Translation
|
(51,467
|
)
|
(27,747
|
)
|
1,198
|
|
29,707
|
|
72,959
|
|
|||||||||
|
Net Increase in Equity Resulting from Operations
|
(15,702
|
)
|
38,429
|
|
59,949
|
|
79,362
|
|
97,146
|
|
|||||||||
|
Less: Net Increase in Equity Resulting From Operations Attributable to Non-controlling Interests
|
305
|
|
340
|
|
782
|
|
838
|
|
—
|
|
|||||||||
|
Net Increase in Shareholders' Equity Resulting from Operations
|
$
|
(16,007
|
)
|
$
|
38,089
|
|
$
|
59,167
|
|
$
|
78,524
|
|
$
|
97,146
|
|
||||
|
Net Increase in Shareholders' Equity Resulting from Operations per share
|
$
|
(0.48
|
)
|
$
|
1.13
|
|
$
|
2.09
|
|
$
|
3.28
|
|
$
|
5.31
|
|
||||
|
Dividends per common share
(1)
|
$
|
1.90
|
|
$
|
2.30
|
|
$
|
2.96
|
|
$
|
3.08
|
|
$
|
3.62
|
|
||||
|
Dividends
(2)
|
$
|
63,097
|
|
$
|
78,173
|
|
$
|
88,538
|
|
$
|
80,198
|
|
$
|
72,615
|
|
||||
|
(1)
|
Dividends are declared and paid on a quarterly basis in arrears. For example, dividends for the fiscal year ended December 31, 2016 include the dividend declared on February 8, 2017 for the fourth quarter of 2016. In the case of the year ended December 31, 2012, dividend amounts also include a special dividend declared for the 2012 fiscal year.
|
55
|
As of December 31,
|
|||||||||||||||||||
|
2016
|
2015
|
2014
|
2013
|
2012
|
|||||||||||||||
|
(In thousands except per share amounts)
|
|||||||||||||||||||
|
Cash and cash equivalents
|
$
|
123,274
|
|
$
|
183,909
|
|
$
|
114,140
|
|
$
|
183,489
|
|
$
|
59,084
|
|
||||
|
Restricted cash
|
655
|
|
4,857
|
|
—
|
|
—
|
|
—
|
|
|||||||||
|
Investments at fair value
|
1,505,026
|
|
1,661,118
|
|
2,172,082
|
|
1,730,130
|
|
1,375,116
|
|
|||||||||
|
Financial derivatives–assets, at fair value
|
35,595
|
|
162,905
|
|
80,029
|
|
59,664
|
|
48,504
|
|
|||||||||
|
Repurchase agreements
|
184,819
|
|
105,700
|
|
172,001
|
|
27,962
|
|
13,650
|
|
|||||||||
|
Receivable for securities sold
|
445,112
|
|
705,748
|
|
1,237,592
|
|
883,005
|
|
626,919
|
|
|||||||||
|
Due from brokers
|
93,651
|
|
141,605
|
|
146,965
|
|
82,571
|
|
22,744
|
|
|||||||||
|
Other assets
|
25,063
|
|
25,713
|
|
22,546
|
|
8,377
|
|
6,098
|
|
|||||||||
|
Total assets
|
2,413,195
|
|
2,991,555
|
|
3,945,355
|
|
2,975,198
|
|
2,152,115
|
|
|||||||||
|
Investments sold short at fair value
|
584,896
|
|
728,747
|
|
1,291,370
|
|
845,614
|
|
622,301
|
|
|||||||||
|
Financial derivatives–liabilities, at fair value
|
18,687
|
|
60,472
|
|
66,116
|
|
44,791
|
|
15,212
|
|
|||||||||
|
Reverse repurchase agreements
|
1,033,581
|
|
1,174,189
|
|
1,669,433
|
|
1,236,166
|
|
905,718
|
|
|||||||||
|
Payable for securities purchased
|
85,168
|
|
165,365
|
|
98,747
|
|
193,047
|
|
57,333
|
|
|||||||||
|
Securitized debt
|
24,086
|
|
—
|
|
774
|
|
983
|
|
1,335
|
|
|||||||||
|
Due to brokers
|
12,780
|
|
114,797
|
|
22,224
|
|
19,762
|
|
30,954
|
|
|||||||||
|
Other liabilities
|
9,220
|
|
9,033
|
|
8,147
|
|
8,786
|
|
12,907
|
|
|||||||||
|
Total liabilities
|
1,768,418
|
|
2,252,603
|
|
3,156,811
|
|
2,349,149
|
|
1,645,760
|
|
|||||||||
|
Equity
|
644,777
|
|
738,952
|
|
788,544
|
|
626,049
|
|
506,355
|
|
|||||||||
|
Less: Non-controlling interests
|
7,116
|
|
6,903
|
|
6,389
|
|
5,648
|
|
—
|
|
|||||||||
|
Shareholders' Equity
|
$
|
637,661
|
|
$
|
732,049
|
|
$
|
782,155
|
|
$
|
620,401
|
|
$
|
506,355
|
|
||||
|
Shareholders' equity per common share
|
$
|
19.75
|
|
$
|
22.10
|
|
$
|
23.38
|
|
$
|
24.40
|
|
$
|
24.86
|
|
||||
|
Shareholders' equity per common share, diluted
|
$
|
19.46
|
|
$
|
21.80
|
|
$
|
23.09
|
|
$
|
23.99
|
|
$
|
24.38
|
|
||||
Executive Summary
We are a specialty finance company that primarily acquires and manages mortgage-related and consumer-related assets, including RMBS, residential and commercial mortgage loans, consumer loans and ABS backed by consumer loans, CMBS, real property, and mortgage-related derivatives. We also invest in corporate debt and equity, including distressed debt, CLOs, non-mortgage-related derivatives, and other financial assets, including private debt and equity investments in mortgage-related entities. We are externally managed and advised by our Manager, an affiliate of Ellington. Ellington is a registered investment adviser with a 22-year history of investing in a broad spectrum of MBS and related derivatives.
We conduct all of our operations and business activities through the Operating Partnership. As of
December 31, 2016
, we have an ownership interest of approximately 99.4% in the Operating Partnership. The interest of approximately
0.6%
not owned by us represents the interest in the Operating Partnership that is owned by an affiliate of our Manager and certain related parties, and is reflected in our financial statements as a non-controlling interest.
Our primary objective is to generate attractive, risk-adjusted total returns for our shareholders. We seek to attain this objective by utilizing an opportunistic strategy to make investments, without restriction as to ratings, structure, or position in the capital structure, that we believe compensate us appropriately for the risks associated with them rather than targeting a specific yield. Our evaluation of the potential risk-adjusted return of any potential investment typically involves weighing the potential returns of such investment under a variety of economic scenarios against the perceived likelihood of the various scenarios. Potential investments subject to greater risk (such as those with lower credit ratings and/or those with a lower position in the capital structure) will generally require a higher potential return to be attractive in comparison to investment alternatives with lower potential return and a lower degree of risk. However, at any particular point in time, depending on how
56
we perceive the market's pricing of risk both generally and across sectors, we may favor higher-risk assets or we may favor lower-risk assets, or a combination of the two in the interests of portfolio diversification or other considerations.
Through
December 31, 2016
, our Credit strategy has been the primary driver of our risk and return, and we expect that this will continue in the near- to medium-term. Our Credit strategy includes non-Agency RMBS; residential and commercial mortgage loans, which can be performing or non-performing; REO; consumer loans and ABS backed by consumer loans; CLOs; European non-dollar denominated investments; other mortgage-related structured investments; private debt and/or equity investments in mortgage originators and other mortgage-related entities; and corporate debt and equity. We believe that Ellington's capabilities allow our Manager to identify attractive assets in these classes, value these assets, monitor and forecast the performance of these assets, and opportunistically hedge our risk with respect to these assets.
We continue to maintain a highly leveraged portfolio of Agency RMBS to take advantage of opportunities in that market sector and to maintain our exclusion from registration as an investment company under the Investment Company Act. Unless we acquire very substantial amounts of whole mortgage loans or there are changes to the rules and regulations applicable to us under the Investment Company Act, we expect that we will always maintain some core amount of Agency RMBS.
We also use leverage in our Credit strategy, albeit significantly less leverage than that used in our Agency RMBS strategy. Through
December 31, 2016
, we financed our asset purchases primarily through reverse repurchase agreements, or "reverse repos," which we account for as collateralized borrowings and we expect to continue to obtain the vast majority of our financing through the use of reverse repos. In addition to financing our assets through reverse repos, in March 2016 we entered into a securitization transaction to finance certain of our commercial mortgage loans and REO which was accounted for as a collateralized borrowing. In August 2016, we entered into a securitization transaction to obtain term financing for certain of our consumer loans; we accounted for this transaction as a sale.
The strategies that we employ are intended to capitalize on opportunities in the current market environment. We intend to adjust our strategies to changing market conditions by shifting our asset allocations across various asset classes as credit and liquidity trends evolve over time. We believe that this flexibility, combined with Ellington's experience, will help us generate more consistent returns on our capital throughout changing market cycles.
As of
December 31, 2016
, outstanding borrowings under reverse repos and securitized debt were
$1.1 billion
and our debt-to-equity ratio was
1.64
to 1. Our debt-to-equity ratio does not account for liabilities other than debt financings and does not include debt associated with securitization transactions accounted for as sales. Of our total borrowings outstanding as of
December 31, 2016
, approximately 75%, or $790.3 million, relates to our Agency RMBS holdings. The remaining outstanding borrowings relate to our Credit portfolio and U.S. Treasury securities.
We opportunistically hedge our credit risk, interest rate risk, and foreign currency risk; however, at any point in time we may choose not to hedge all or a portion of these risks, and we will generally not hedge those risks that we believe are appropriate for us to take at such time, or that we believe would be impractical or prohibitively expensive to hedge.
We believe that we have been organized and have operated so that we have qualified, and will continue to qualify, to be treated for U.S. federal income tax purposes as a partnership and not as an association or a publicly traded partnership taxable as a corporation.
We also measure our book value per share and our total return on a diluted basis, assuming all convertible units were converted into common shares at their respective issuance dates. As of
December 31, 2016
, our diluted book value per share was
$19.46
as compared to $21.80 as of December 31, 2015. On a diluted basis, the Company's total return for the year ended
December 31, 2016
and 2015 was (1.79)% and 5.20%, respectively. Additionally our diluted net-asset-value-based total return was 157.36% from our inception (August 17, 2007) through
December 31, 2016
, and our annualized inception-to-date diluted net-asset-value-based total return was 10.61% as of
December 31, 2016
.
57
Trends and Recent Market Developments
Key trends and recent market developments for the U.S. mortgage market and other credit markets include the following:
|
•
|
U.S. Federal Reserve and U.S. Monetary Policy—
In December 2016, the Federal Reserve raised its target range for the federal funds rate by 0.25%, but maintained its existing policy of reinvesting principal payments from its U.S. Treasury security and Agency RMBS holdings;
|
|
•
|
Housing and Mortgage Market Statistics—
Data released by S&P Dow Jones Indices for its S&P CoreLogic Case-Shiller Indices for November showed a continuation of mid-single-digit home price appreciation nationally; meanwhile, the Freddie Mac survey 30-year mortgage rate ended the fourth quarter of 2016 at 4.32%, rising from 3.42% at the end of the third quarter of 2016;
|
|
•
|
GSE and Government Agency Developments
—The FHFA and the GSEs continued to announce program and policy changes and clarifications intended to increase mortgage credit availability;
|
|
•
|
Portfolio Overview and Outlook
—Throughout 2016, we continued to shift our Credit portfolio away from non-Agency RMBS and other securities, and towards loan assets. We also added several new borrowing facilities during the year, which should allow us to continue to grow our loan portfolios. While the assets in our Credit portfolio performed well over the course of the year, our high-yield corporate credit hedges provided a substantial drag on our results. In the latter half of the year, as we continued to reduce our non-Agency RMBS portfolio, and as we continued to observe lower correlations between many of our structured credit assets and our high-yield corporate credit hedges, we significantly reduced our high-yield corporate credit hedges. Meanwhile, our Agency RMBS portfolio performed well over the course of the year despite the challenges presented by heightened interest rate volatility.
|
Federal Reserve and U.S. Monetary Policy
On December 14, 2016, the Federal Open Market Committee, or "FOMC," announced that it would raise the target range for the federal funds rate by 0.25%, to 0.50%-0.75%. This was the first announcement of an increase in the target range for the federal funds rate since December 16, 2015. On February 1, 2017, the FOMC announced that it would maintain the target range for the federal funds rate at 0.50%-0.75%. In its February statement following the meeting, the FOMC indicated that economic activity has continued to expand at a moderate pace, and the labor market has continued to strengthen. The FOMC also stated that it expects that with gradual adjustments in the stance of monetary policy, the expansion of economic activity will continue at a moderate pace and labor market conditions will strengthen somewhat further. Additionally, the FOMC indicated that it expects economic conditions to evolve in such a way that only gradual increases in the federal funds rate will be warranted, and that the federal funds rate is likely to remain, for some time, below prevailing longer run levels. Minutes from the February meeting of the FOMC indicated that many officials expressed the view that it might be appropriate to raise the federal funds rate again fairly soon if incoming information on the labor market and inflation was in line with or stronger than their current expectations, or if the risks of overshooting the committee's maximum employment and inflation objectives increased.
Over the course of the fourth quarter, the 10-year U.S. Treasury yield increased by 85 basis points, from 1.59% as of September 30, 2016 to 2.44% as of December 30, 2016. The rise in long-term interest rates during the fourth quarter was the largest quarterly increase since the financial crisis, and one of the largest quarterly increases ever. We believe that there remains substantial risk that interest rates will increase from current levels, driven by a tightening of Federal Reserve monetary policy in response to employment and economic growth in the United States and other factors. The risk of rising interest rates reinforces the importance of our ability to hedge interest rate risk in both our Agency RMBS and Credit portfolios using a variety of tools, including TBAs, interest rate swaps, and various other instruments. Additional uncertainty surrounds the Federal Reserve's timeline to curtail its reinvestment of principal payments from its U.S. Treasury security and Agency RMBS holdings. The current pace of monthly reinvestments under this program is approximately $25 billion, thus providing significant market support.
58
Housing and Mortgage Market Statistics
The following table demonstrates the decline in residential mortgage delinquencies and foreclosure inventory on a national level, as reported by CoreLogic in its December 2016 National Foreclosure Report:
|
As of
|
||||||
|
Number of Units
(In thousands)
|
December 2016
|
September 2016
|
||||
|
Seriously Delinquent Mortgages
(1)
|
1,027
|
|
1,039
|
|
||
|
Foreclosure Inventory
|
329
|
|
341
|
|
||
|
(1)
|
Seriously Delinquent Mortgages are ninety days and over in delinquency and include foreclosures and real estate owned, or "REO," property.
|
As the above table indicates, both the number of seriously delinquent mortgages and the number of homes in foreclosure have continued to decline. This decline supports the thesis that as many homeowners have re-established equity in their homes through recovering real estate prices, they have become less likely to become delinquent and default on their mortgages.
Monthly housing starts provide another indicator of market fundamentals. The following table shows the trailing three-month average housing starts for the periods referenced:
|
As of
|
||||||
|
Number of Units
(In thousands)
|
December 2016
|
September 2016
|
||||
|
Single-family
|
834
|
|
758
|
|
||
|
Multi-family
|
406
|
|
374
|
|
||
Source: U.S. Census Bureau
As of December 2016, average single-family housing starts during the trailing three months increased by 10.0% as compared to September 2016, while multi-family housing starts increased by approximately 8.6% during the same period.
Data released by S&P Dow Jones Indices for its S&P CoreLogic Case-Shiller Indices for December 2016 showed that, on average, home prices posted a 5.6% year-over-year increase for its 20-City Composite and a 4.9% year-over-year increase for its 10-City Composite, after seasonal adjustments. Additionally, as indicated in the table above, as of December 2016, the national inventory of foreclosed homes fell to 329,000 units; this represented the sixty-second consecutive month with a year-over-year decline. As a result, there are many fewer unsold foreclosed homes hanging over the housing market than there were a year ago. We believe that near-term home price trends are more likely to be driven by fundamental factors such as economic growth, mortgage rates, and affordability, rather than by technical factors such as shadow inventory. Shadow inventory represents the number of properties that are seriously delinquent, in foreclosure, or held as REO by mortgage servicers, but not currently listed on a multiple listing service.
59
While refinancing activity overall has been slower in recent periods relative to earlier periods when mortgage rates were at comparable levels, recent trends suggest an ongoing divergence between the refinancing behavior of lower balance loans and higher balance loans. As illustrated in the figure below, the average loan size of refinance applications, especially during refinancing waves, has increased over the past several years. For example, in July 2016, at the peak of the most recent refinancing wave, the average refinance application loan size was $288,400, a 35% increase over the average refinance application loan size of $213,700 in May 2013, at the peak of the early 2013 refinancing wave.
This increase in average loan sizes of mortgage refinances is reflective of a number of changes related to borrower behavior and mortgage credit availability in recent years.
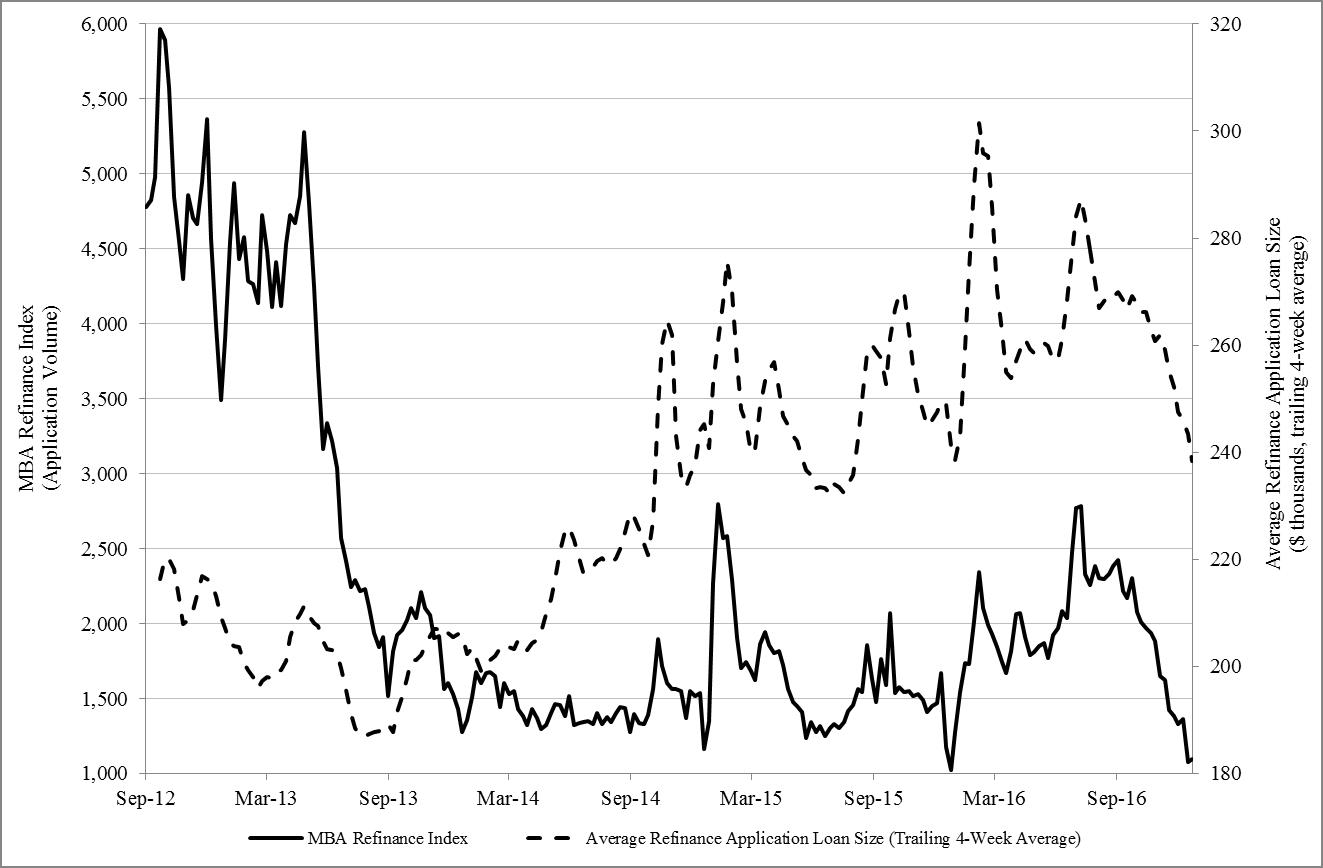
Source: Freddie Mac and Mortgage Bankers Association
As shown in the figure above, higher loan balance borrowers tend to be more reactive to refinancing incentives, especially following steep declines in rates over a short period. After swift drops in mortgage rates in October 2014, January 2015, March 2015, the first six weeks of 2016 and late June 2016, the average refinanced loan size spiked, reflecting a surge in higher loan balance borrowers reacting to the recent decline in mortgage rates. This greater prepayment sensitivity for higher loan size borrowers is well established, and is due in part to greater awareness among such borrowers about refinancing opportunities, as well as greater absolute dollar incentives to refinance relative to lower loan size borrowers.
Moreover, while overall mortgage credit availability continues to increase from the depressed levels that followed the financial crisis, credit availability for higher loan size borrowers has been particularly improving recently. In the past several years, a number of the largest lenders, including Bank of America, JP Morgan, Wells Fargo, and PNC Bank, have noticeably loosened lending standards for jumbo mortgage loans typically sought by more affluent borrowers, including lowering minimum FICO requirements and raising maximum loan-to-value, or "LTV," ratios. Affluent borrowers have also generally experienced greater improvements in their creditworthiness, thanks to rising asset prices and a strong rebound in high-end home prices, especially in wealthier cities such as New York and San Francisco. Jumbo mortgage loans have been a rare bright spot for the non-Agency mortgage origination sector in recent years, and for good reason given the excellent credit performance of jumbo mortgage loans originated since the financial crisis. Many banks are also competing more vigorously for affluent customers, in an effort to cross-sell other financial products such as investment and brokerage services. This competition has resulted in a narrowing of the spread between jumbo mortgage rates and conforming mortgage rates, further increasing the relative refinancing incentive for jumbo mortgage loans.
60
While in the past few years more affluent and higher credit score borrowers have seen the largest increase in mortgage credit availability, more recently first time homebuyers, low-income borrowers, and borrowers in low-income areas have started to benefit from an increase in high LTV mortgage lending programs targeted at these demographic groups. While recent growth is still relatively modest in these largely government-funded or non-profit-funded lending programs for less affluent borrowers, it may prefigure future expansions of credit to higher LTV borrowers.
In addition, since the financial crisis, financial reforms, including the Dodd-Frank Act, and QM mortgage rules, have dramatically increased the costs of underwriting, especially for niche products such as second lien and adjustable rate mortgages. Banks have reduced their footprint in the mortgage lending space as the scars of the financial crisis and higher capital requirements have increased the costs of doing business. More recently, market share has shifted to non-bank lenders, which do not face the same regulatory capital requirements as banks for servicing mortgages, and which possess superior technology to better assist borrowers in making more efficient refinancing decisions.
The shift in mortgage banking industry market share to more efficient non-bank lenders has contributed to the increase in aggregate prepayment speeds. For example, Quicken Loans Inc., or "Quicken," has become one of the leaders in efficient mortgage refinancing in recent years. As shown in the figure below, prepayment speeds on Quicken loans are among some of the fastest in the industry; however, Quicken may not continue to be the outlier that it used to be, as improved technology continues to be adopted by other lenders. In the figure below, we show the 3-month constant prepayment rate, or "CPR," for Freddie Mac 30-year fixed rate mortgages with original loan balances between $200,000 and $400,000, loan ages between 12 and 47 months, and with interest rates that are 50 to 100 basis points above then current market rates. While in recent years Quicken prepayment speeds were consistently as much as 10 to 20 CPR faster than those of other servicers during prepayment spikes, this differential has almost entirely evaporated in the past few months. Ultimately, technology-driven, industrywide increases in prepayment efficiency may put pressure on MBS prices and/or reduce the excess yield spread enjoyed by MBS investors.
As improved technology spreads, we believe that the lending industry will change in two important ways. First, more efficient mortgage origination should mean that some cost savings will be passed on to borrowers. Smaller-balance loans, which are disproportionately used by lower-income borrowers, should respond the most from a reduction in the fixed components of origination costs. Second, borrower prepayment behavior should become increasingly efficient, as demonstrated by the higher prepayment speeds of mortgage loans serviced by Quicken and other non-bank mortgage originators. Assessing the ongoing evolution of these industrywide changes, including studying servicer-specific trends, is of increasing importance in investing in both specified pools and TBAs.
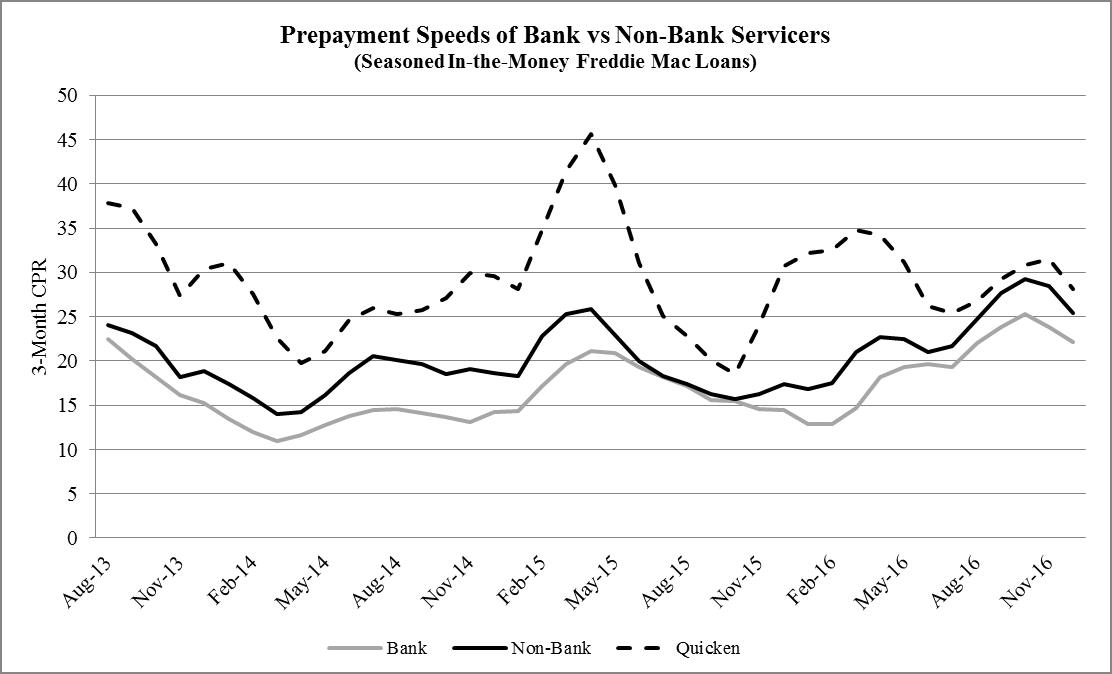
Source: Freddie Mac
61
On February 3, 2017, the U.S. Bureau of Labor Statistics, or "BLS," reported that, in January 2017, the U.S. unemployment rate was 4.8%, down from 4.9% a year earlier and at levels generally considered consistent with an economy near full employment. In light of the drop in the labor force participation rate since the financial crisis, another, perhaps more relevant, measure of labor market conditions is employment growth. The BLS also reported that non-farm payrolls rose by 227,000 in January 2017. Over the past three months, job gains have averaged 183,000 per month.
While it is difficult to quantify the relationship between employment data and the housing and mortgage markets, we believe that current levels of unemployment and job creation are generally supportive of the housing market. While the housing market is also currently supported by low mortgage rates, it faces a number of potential headwinds. These include high interest rate volatility, the constraining effects of still-tight credit standards on both housing starts and new loan originations, and the uneven pace of the recovery of the U.S. economy.
GSE/Government Agency Developments
On October 19, 2016, Ginnie Mae announced a new rule to discourage rapid streamline refinancing of loans in Ginnie Mae pools. Effective February 1, 2017, any streamline-refinanced loan that was less than six months old at the time of refinancing will automatically be ineligible for inclusion in TBA-deliverable Ginnie Mae pools. Recent developments in Ginnie
Mae pools
involving the rapid
refinancing by certain non-bank lenders
of a small number of
VA-guaranteed
loans, often originated at above market interest rates, have raised concerns about the impact of multiple, rapid refinance transactions on borrower equity and financing costs.
These rapid refinancings had been weighing on the prices of certain Ginnie Mae pools, and the new rule should help maintain investor confidence in the Ginnie Mae program.
On October 24, 2016, Fannie Mae announced details of a new "Day 1 certainty" program, available in December, to waive property inspections and provide income and employment representation and warranty relief for certain low-risk loans. The program should reduce closing costs and shorten refinance lead times, leading to a marginal increase in reactivity and prepayment speeds, as well as potentially providing more credit availability for first-time homebuyers who face the greatest paperwork challenges in documenting income and employment. A similar Freddie Mac program had been previously announced and will debut in spring 2017. The combined effect of these programs depends critically on lender take-up, although most lenders seem to be receptive to the programs.
On December 8, 2016, the FHFA announced that the initial phase, called Release 1, of the Common Securitization Platform or "CSP," had been successfully implemented on November 21, 2016. With the implementation, Freddie Mac converted to using the CSP for many of the major activities related to current single-class, fixed-rate, mortgage-backed securities. The next phase of the CSP, known as Release 2, will involve the actual issuance by Freddie Mac and Fannie Mae of a common, single mortgage-backed security, to be called the Uniform Mortgage-Backed Security, or "UMBS." The FHFA expects to announce a timeframe for the implementation of Release 2 in the first quarter of 2017. The FHFA's goal in establishing the UMBS is to create a single set of standards and a single market for GSE-issued fixed-rate mortgage loans, and thereby to create and maintain a more liquid Agency MBS market consistent with the FHFA's statutory obligation of providing for the liquidity of the national housing finance market.
On January 9, 2017, the FHA announced that it would reduce its annual mortgage insurance premiums, or "MIPs," by 25 basis points for most new mortgages with a closing/disbursement date on or after January 27, 2017; this would reestablish the insurance premiums nearly at pre-crisis levels. This announcement was largely unexpected, especially after comments made by Ed Golding, the U.S. Department of Housing and Urban Development assistant secretary, who indicated that no additional MIP cut was coming. Since 2009, the FHA has increased MIPs several times to help stabilize the health of its Mutual Mortgage Insurance Fund, which has been badly depleted by the financial crisis. However, the new administration canceled the MIP reduction on January 20, 2017 (its first day in office), citing a need for more analysis and research. The rollback of the MIP reduction indicates that the new administration may want to reevaluate the government's role in housing policy.
To date, no definitive legislation has been enacted with respect to a possible unwinding of the GSEs or a material reduction in their roles in the U.S. mortgage market. However, U.S. Treasury Secretary Steven Mnuchin has indicated that reform of the GSEs will be a priority for the new administration. There have been several proposals offered by members of Congress, including the Corker-Warner bill introduced in June 2013, the Johnson-Crapo bill introduced in March 2014, the Partnership to Strengthen Homeownership Act introduced in July 2014, and a Senate draft bill introduced in May 2015 by Senator Richard Shelby that pushes for increased credit risk transfers to private investors. To date, the GSEs have engaged predominantly in "second-loss" risk sharing transactions, where the GSEs bear losses on their mortgage pools up to a capped amount first, before private investors bear any losses. Furthermore, these risk sharing transactions to date have generally been "back-end" transactions, where the GSE seeks to offload its risk only after it has actually issued guarantees on a defined pool of mortgages. Under the Shelby bill, not only would the GSEs be required to engage in significant and increasing levels of risk sharing transactions generally, but for the first time the GSEs would be required to engage both in "first-loss" risk sharing
62
transactions and in "front-end" risk sharing transactions. Many of these proposed bills could potentially increase private capital flows to the mortgage sector while reducing taxpayer risk. Though it appears unlikely that any of these bills will be passed in their current form, features may be incorporated into future proposals.
Portfolio Overview and Outlook
General Market Overview
In the first quarter of 2016, credit-related fears stemming from depressed energy prices initially spurred a rapid equity market sell-off that spilled over to many sectors, including most credit-sensitive sectors, and also caused a flight to quality that pushed interest rates sharply lower. The response from global central banks was swift, with announcements of both increased quantitative easing programs and more dovish interest rate outlooks; this caused equity markets and many credit-sensitive sectors to rally back and at the same time kept interest rates from rebounding fully. Interest rates trended slightly higher and volatility declined for most of the second quarter, but following the United Kingdom's vote in June to leave the European Union, with the associated concerns of a negative impact on the global economy, interest rates sharply reversed course and dropped dramatically, while most credit-sensitive sectors fell. However, as had occurred earlier in the year, additional global central bank intervention quickly supplied relief to the financial markets. With yields on sovereign bonds reaching record low levels, many investors sought higher yields from other sectors, including credit-sensitive sectors.
The fourth quarter of 2016 was characterized by sharply higher interest rates and increased market volatility, especially in the aftermath of the U.S. elections in November. The election of Donald Trump to the U.S. presidency along with continued Republican control of Congress led to a surge in interest rates, as many market participants predicted that the policy goals of the new administration would lead to an acceleration in U.S. economic growth. Among the shared policy goals of the new administration and Congress are a lowering of corporate income tax rates, increased infrastructure spending, and a roll-back in regulation, such as many of the regulations included in the Dodd-Frank Act. The rise in long-term interest rates during the fourth quarter was the largest quarterly increase since the financial crisis, and one of the largest quarterly increases ever. Over the course of the fourth quarter of 2016, the 10-year U.S. Treasury yield rose 85 basis points to end the year at 2.44%, and closed as high as 2.60% on December 15th. The yield curve steepened substantially during the fourth quarter, with the 2-year U.S. Treasury yield rising 43 basis points to end the quarter at 1.19%. The 10-year and 2-year U.S. Treasury yields began 2016 at 2.27% and 1.05%, respectively.
In December 2016, for the first time since late 2015 and only the second time in over ten years, the Federal Reserve increased its target range for the federal funds rate. Following the rate increase in late 2015 and heading into 2016, most market participants had anticipated multiple target range increases for 2016, but concerns around a global economic slowdown, as well as mixed data regarding the state of the U.S. economy, led the Federal Reserve to adopt a more measured stance in 2016. The recent change in administrations now presents the Federal Reserve with conflicting considerations: an increase in inflation appears more likely, which would call for monetary tightening, but the uncertainties associated with possible large scale government policy changes may call for a more cautious approach.
For most of 2016 mortgage rates trended lower, but they surged in the fourth quarter in sympathy with overall interest rates. Ultimately, the Freddie Mac survey 30-year mortgage rate ended 2016 at 4.32%, or 0.31% higher than where it began the year. The Mortgage Bankers Association Refinance Index, which tracks the volume of mortgage loan refinancing applications, reached a one-year high on July 8, 2016 and then declined over 50%, falling back to its early-2016 levels by the end of the year.
Credit
As of December 31, 2016, our total long Credit portfolio (excluding derivatives) was $601.6 million, as compared to $600.5 million as of December 31, 2015. Over the course of the year, and continuing recent trends, we net sold non-Agency RMBS. As we have sold down our non-Agency RMBS, we continued to reallocate capital to our consumer loan strategy, our commercial mortgage strategy, and our residential mortgage loan strategy, which includes our investments in certain specialty residential mortgage originators. We also continued to opportunistically invest in CLOs and distressed corporate debt and equity.
As the case has been for some time, the fundamentals underlying non-Agency RMBS continue to be strong, led by a stable housing market. As legacy non-Agency RMBS continue to amortize, the range of expected outcomes on these assets has narrowed significantly; this trend, together with the minimal level of new RMBS issuance generally, has caused yield spreads on legacy non-Agency RMBS to compress significantly, leading us to rotate much of our Credit portfolio into higher-yielding assets. Our non-Agency RMBS portfolio, though much smaller now, performed well in 2016, benefiting from strong net interest margins, appreciation from our held positions, and net realized gains from positions sold. However, the positive effects of generally tighter spreads and profitable trading activity in our non-Agency portfolio were offset by losses on our credit hedges. While our non-Agency RMBS portfolio currently represents a much smaller portion of our total Credit portfolio than it ever
63
has, we intend to continue to opportunistically increase and decrease the size of this portfolio as market conditions vary. As of
December 31, 2016
, our investments in U.S. non-Agency RMBS totaled $102.7 million as compared to $217.82 million as of December 31, 2015.
Throughout most of 2016, our credit hedges consisted primarily of financial instruments tied to high-yield corporate credit, such as CDS on high-yield corporate bond indices, as well as tranches and options on these indices; short positions in and CDS on corporate bonds; and positions involving ETFs of high-yield corporate bonds. We opportunistically overlaid these high-yield corporate credit hedges with certain relative value long/short positions involving the same or similar instruments. Throughout 2016, global central bank monetary policy was highly accommodative, and even included central bank corporate bond buying programs, first by the European Central Bank as announced earlier in the year, and then by the Bank of England as announced in August. Throughout the year, the combination of very low or even negative yields on many high quality sovereign bonds, together with persistent central bank buying of corporate bonds, drove yields on global high quality corporate bonds to record low levels, and pushed more overseas institutional investors into the U.S. corporate bond markets, including the high-yield corporate bond market. Starting in the third quarter, in response to the significant tightening that had occurred up to that point of "cash" bond spreads to CDS spreads in the high-yield corporate bond market, we shifted many of our credit hedges from CDS on high-yield corporate bond indices to certain instruments more directly tied to the performance of "cash" high-yield corporate bonds. We also significantly scaled back our use of high-yield corporate credit hedges. For the full year, our credit hedges significantly adversely impacted our results.
In addition to using credit hedges, we also use interest rate hedges in our Credit strategy in order to protect our portfolio against the risk of rising interest rates. The interest rate hedges in our Credit strategy are principally in the form of interest rate swaps and, to a lesser extent, Eurodollar futures. For the full year, we had a modest loss on our interest rate hedges. We also use foreign currency hedges in our Credit strategy, in order to protect our assets denominated in euros and British pounds against the risk of declines in those currencies against the U.S. dollar. We had net gains on our foreign currency hedges for the full year, but these were significantly offset by net losses on foreign currency-related transactions and translation. Despite the significant recent losses in our credit hedges, we believe that our publicly traded partnership structure affords us valuable flexibility, especially with respect to our ability to adjust our exposures nimbly by hedging many forms of risk, such as credit risk, interest rate risk, and foreign currency risk.
During 2016 we continued to purchase consumer loans. Our consumer loan portfolio primarily consists of unsecured loans, but also includes auto loans. For the full year, our consumer loan portfolio was profitable excluding our high-yield corporate credit hedges, but modestly unprofitable after taking into account the effect of those credit hedges. During the fourth quarter, we concluded purchasing loans under one flow agreement where we had seen a greater persistence of default rates than we had anticipated. As of December 31, 2016, we were purchasing consumer loans under three existing flow agreements that collectively have outperformed expectations. Apart from the existing portfolio, we are in active negotiations to add a new flow agreement, and are also evaluating other opportunities in the space.
W
e expect the relative contribution of our U.S. consumer loans to increase as the portfolio continues to ramp up in volume. In August, we participated in our first widely syndicated securitization of consumer loans, contributing approximately $63 million of our consumer loan portfolio to the securitization, while retaining the most subordinated tranches. Even though the securitization is treated as a sale for accounting purposes, it essentially enables us to achieve long-term financing for the securitized pool. In addition, we continue to finance many of our remaining consumer loans through reverse repurchase agreements with a large financial institution. As of
December 31, 2016
, our investments in U.S. consumer loans and ABS backed by consumer loans totaled $111.4 million, as compared to $112.5 million as of December 31, 2015.
Over the course of 2016, CMBS spreads were volatile and generally widened. Total CMBS conduit issuance totaled $15.5 billion in the fourth quarter, up 18% from the previous quarter, reflecting a rush to finalize transactions before risk retention regulations came into effect in late December. In 2016, conduit issuance was $47.1 billion, which was a 23% decline from 2015 CMBS conduit issuance. Our CMBS portfolio continues to consist entirely of post-crisis "B-pieces." B-pieces are the most subordinated (and therefore the highest yielding and riskiest) CMBS tranches. By purchasing new issue B-pieces, we believe that we are often able to effectively "manufacture" our risk more efficiently than what is generally available in the market, and to better target the collateral profiles and structures we prefer. We added five B-pieces over the course of 2016. While CMBS spreads were volatile during 2016, our CMBS strategy was profitable for the full year, helped significantly by the positive full-year performance of our CMBX hedges. The CMBS risk retention regulations took effect on December 24, 2016, and early indications suggest that most new issuance of CMBS will follow the "eligible vertical interest" retention model, whereby securitization sponsors retain 5% of the face amount of every tranche. Under this approach, 95% of the B-piece may be sold by the sponsor and remains freely tradable in the same manner as prior to CMBS risk retention. We expect to continue to buy B-pieces in this format, and we also intend to continue to evaluate opportunities created from the new risk retention regulations. As of December 31, 2016, our U.S. CMBS bond portfolio increased to $34.6 million, as compared to $26.3 million as of December 31, 2015.
64
As of
December 31, 2016
, our portfolio of small balance commercial mortgage loans included 16 loans and one REO property with an aggregate value of $62.8 million; by comparison as of December 31, 2015 this portfolio included 25 loans and two REO properties with an aggregate value of $74.8 million. Our portfolio, including related hedges, performed well for the full year. The number and aggregate value of loans held, as well as the income generated by our loans, may fluctuate significantly from period to period, especially as loans are resolved or sold. In the first quarter, we executed a two-year financing arrangement with a large financial institution for a subset of our small balance commercial mortgage loan portfolio. During the third quarter, we both extended the facility and added more loans to the line. As of
December 31, 2016
, we had $24.1 million in borrowings outstanding under this facility. We expect to continue to emphasize purchasing distressed loans from banks and special servicers through negotiated transactions, as opposed to through widely circulated auctions where there is greater competition and less assurance that reserve prices will be reasonable. We also expect to continue to originate high-yielding "bridge" loans. We believe that opportunities will accelerate in both distressed loans and bridge loans, as many commercial mortgage loans—including many originated pre-crisis—reach their maturity but are unable to be refinanced.
For most of 2016, our activity in the European credit markets was focused more on the non-performing loan market as compared to legacy MBS and CLOs. Our European non-performing loans include non-performing consumer loans, non-performing residential mortgage loans, and non-performing commercial mortgage loans made to small and medium-sized enterprises. We believe that non-performing loans in certain select markets, such as in Spain and Portugal, will continue to present attractive opportunities, and we are actively pursuing additional opportunities in these and other countries. During the 2016, we added to our holdings of non-performing consumer loans and non-performing loans secured by real estate. Overall, excluding credit hedges, our European investments were profitable for the full year. Additionally, given the recent widening of legacy MBS and CLOs, we modestly increased our holdings in these sectors during the fourth quarter. We expect to take an opportunistic approach with respect to our participation in these markets. As of December 31, 2016, our investments in European non-dollar denominated assets totaled $75.2 million, as compared to $72.5 million as of December 31, 2015. As of December 31, 2016, our total holdings of European non-dollar denominated assets included $40.9 million in RMBS (mostly backed by non-performing loans), $8.7 million in CMBS, $22.4 million in CLOs, $3.0 million in ABS, and $0.2 million in distressed corporate debt. As of December 31, 2015, our total holdings of European non-dollar denominated assets included $37.2 million in RMBS (mostly backed by non-performing loans), $7.8 million in CMBS, $24.4 million in CLOs, $2.9 million in ABS, and $0.2 million in distressed corporate debt. These assets include
securities denominated in British pounds as well as in euros.
During 2016, the volume of our purchased non-QM loans increased significantly, and our outlook for further growth in this sector remains positive. As of
December 31, 2016
, our non-QM mortgage loans totaled $71.6 million as compared to $9.2 million as of December 31, 2015. To date, we have purchased approximately $100 million under our flow agreement, and loan performance has been excellent. During the third quarter, we executed a block sale to a third party of approximately $21 million of our non-QM loans. The primary objective of the sale was to validate our assumptions about the market for non-QM loans, and this objective was accomplished, while we also benefited from a favorable sale execution. The number of states where our origination partner is producing loans for us has increased according to expectations. We finance certain of our non-QM loans under a repo facility with a large financial institution, and are actively monitoring the securitization market for a potential issuance after we reach critical mass.
We remain active in non-performing and re-performing U.S. residential mortgage loans, or "residential NPLs," and have continued to focus our acquisitions on smaller, less-competitively-bid, and more attractively-priced mixed legacy pools sourced from motivated sellers. During 2016 we closed two purchases of mixed NPL pools, which contain a combination of performing and non-performing assets. While relatively small, our residential NPL portfolio performed very well for the full year. As of December 31, 2016, we held $14.3 million in residential NPLs and related foreclosure property, as compared to $17.0 million as of December 31, 2015. Towards the end of the third quarter, we began financing some of our residential NPLs under a new repo facility with a large financial institution. We expect that this repo facility will not only increase our return on equity in this business, but should also enable us to increase our presence in the residential NPL market.
As of December 31, 2016, our Credit portfolio also included U.S. CLOs and corporate debt and equity. Our corporate debt and equity strategies have employed a wide variety of instruments over a broad range of companies, industries and sectors. We take both long and short positions in these strategies, and use both "cash market" instruments (such as publicly traded equites, corporate bonds, and syndicated bank loans), as well as synthetic/derivative instruments (such as CDS and total return swaps). We have invested in both distressed and non-distressed companies. In some of our corporate debt and equity strategies, we seek to capitalize on dislocations and mispricings between particular instruments, such as corporate bonds and credit default swaps, involving the same underlying corporate entity. We have recently been purchasing certain syndicated bank loan assets, and are currently evaluating the possibility of securing term, non-recourse financing for these assets by securitizing them in a CLO structure.
65
Since September 2014, we have held an investment in a reverse mortgage originator. In 2016, we increased our invested capital in this originator from approximately $3.8 million to $12.5 million. Concurrently with our additional investment, another financial institution, or the "co-investor," also invested $12.5 million in the originator. With this increased capital base, this originator intends to significantly expand its footprint in the reverse mortgage origination space. In February 2017, we and the co-investor each invested an additional $5.0 million, bringing each of our and the co-investor's total investment in this originator to $17.5 million. Following this additional investment, we and the co-investor each have a remaining capital commitment to the reverse mortgage originator of $5.0 million.
Agency
As of December 31, 2016, our long Agency RMBS portfolio was $827.4 million as compared to $962.6 million as of December 31, 2015.
Consistent with past quarters, as of
December 31, 2016
, our Agency RMBS consisted principally of "specified pools." Specified pools are fixed rate Agency pools with special characteristics, such as pools containing low loan balance mortgages, pools containing mortgages backed by investor properties, pools containing mortgages originated through the government-sponsored "Making Homes Affordable" refinancing programs, and pools containing mortgages with various other characteristics. Our Agency strategy also includes RMBS which are backed by ARMs or Hybrid ARMs, and reverse mortgages; and CMOs, including IOs, POs, and IIOs. Our Agency strategy also includes interest rate hedges for our Agency RMBS, as well as certain relative value trading positions in interest rate-related and TBA-related instruments.
Over the course of most of the first three quarters of 2016, high demand from both domestic and overseas investors, bolstered prices of Agency RMBS. The relative yields and liquidity of these instruments increased what had been already high investor demand for them. However, as a result of the surge in interest rates in the fourth quarter, Agency RMBS declined substantially in price and their durations extended, exacerbating further price declines. For example, during the fourth quarter, TBA 30-year Fannie Mae 3.5s, a widely traded Agency RMBS, declined approximately three points in price, and its duration roughly doubled. Nevertheless, the price declines were relatively muted when compared to prior instances of large-scale increases in interest rates, such as those that occurred in mid-2013, or before the financial crisis. This more muted response was in large part a consequence of the progressive shift, in recent years, in ownership of Agency RMBS away from "delta-hedgers" such as the GSEs and many money managers and mortgage REITs, who have often reacted to big downswings in the market by aggressively selling Agency RMBS, and towards "buy and hold" investors such as the Federal Reserve and depository institutions.
Low mortgage rates during the first three quarters of 2016 led to increases in refinancing activity, and by late summer overall prepayment rates reached their highest levels since 2013. As mortgage rates increased over the course of the fourth quarter, Agency RMBS prepayment rates rates slowed. However, the pace of the slowdown in Agency RMBS prepayment rates during the fourth quarter was much more gradual than most sell-side research had predicted. A variety of factors helped to support prepayment activity during 2016, including the gradual loosening of mortgage credit underwriting standards relative to the immediate aftermath of the financial crisis; enhanced originator/servicer technology and infrastructure, which have streamlined the refinancing process and augmented refinancing capacity; employment in the mortgage industry, which remains at a post-financial crisis high; and increasing home prices and improvements in borrower credit profiles, both of which reflect continued improvement in the U.S. economy.
Although specified pools with prepayment protection features also experienced increases in overall prepayment speeds during most of 2016, such increases were significantly less than that of generic pools, and accounted for the relative outperformance of specified pools relative to generic pools. Specified pools with prepayment protection features include loans with low principal balances, for example. Such loans generally show much more muted prepayment responses to lower mortgage rates, as the savings from refinancing low balance loans are lower on an absolute basis, and the costs to refinance are higher relative to those savings. Our Agency RMBS portfolio, which remains concentrated in specified pools with prepayment protection features, was well insulated from the large increase in generic pool prepayment rates during the year. We believe that specified pools will continue to outperform generic pools as the presence of the Federal Reserve (which focuses its purchases on generic pools) shrinks in the Agency RMBS market and as technological advances in the mortgage origination and servicing industry have tended to have a much greater impact on non-specified pools as compared to specified pools, driving greater investor interest in specified pools relative to TBAs. We believe that this trend will continue.
Our portfolio performed well over the course of the year, despite the challenges presented by the heightened interest rate volatility. Our aggregate Agency RMBS portfolio generated interest income of $24.0 million, and—especially as compared to prior years—a relatively small portion of this interest income was offset by net realized and unrealized losses on our securities and financial derivatives portfolio. For the year ended
December 31, 2016
, we had total net realized and unrealized losses of $(0.9) million, or $(0.03) per share, on our aggregate Agency RMBS portfolio, and we had total net realized and unrealized
66
losses of $(8.2) million, or $(0.25) per share, on our hedging portfolio, including U.S. Treasury securities. Average pay-ups on our specified pools increased to 0.76% as of December 31, 2016, from 0.64% as of December 31, 2015. Pay-ups are price premiums for specified pools relative to their TBA counterparts.
We actively traded our Agency RMBS portfolio during the year in order to capitalize both on sector rotation opportunities and trading opportunities. Our portfolio turnover for the year was 69.4% (as measured by sales and excluding paydowns), and we captured net realized gains of $2.3 million, excluding interest rate hedges.
During 2016, we continued to hedge interest rate risk, primarily through the use of interest rate swaps and short positions in TBAs. In our hedging portfolio, the relative proportion (based on 10-year equivalents
1
) of short TBA positions increased year over year relative to interest rate swaps. Overall, we believe that there remains a heightened risk of substantial interest rate and mortgage prepayment volatility in the near term, thus reinforcing the importance of our ability to hedge our Agency RMBS portfolio using a variety of tools, including TBAs.
During 2016, we continued to focus our Agency RMBS purchasing activity primarily on specified pools, especially those with higher coupons. As of
December 31, 2016
, the weighted average coupon on our fixed rate specified pools was 4.0%. Our Agency RMBS portfolio continues to include a small allocation to Agency IOs, and we increased our holdings of those during the fourth quarter. Some of the IOs that we purchased were backed by seasoned Ginnie Mae pools that have demonstrated some level of "burnout." Burnout often occurs after periods of high prepayments, when the mix of loans remaining in an RMBS pool becomes more concentrated in loans that tend to prepay more slowly; burnout can reflect a variety of factors, including the behavior of individual borrowers and overall trends in the mortgage banking industry. Our Agency IOs not only contribute to our portfolio in the form of their yields, but they also inherently serve as portfolio market value hedges in a rising interest rate environment.
1
"10-year equivalents" for a group of positions represent the amount of 10-year U.S. Treasury securities that would experience a similar change in market value under a standard parallel move in interest rates.
67
We expect to continue to target specified pools that, taking into account their particular composition and based on our prepayment projections: (1) should generate attractive yields relative to other Agency RMBS and U.S. Treasury securities, (2) should have less prepayment sensitivity to government policy shocks, and/or (3) should create opportunities for trading gains once the market recognizes their value, which for newer pools may come only after several months, when actual prepayment experience can be observed. We believe that our research team, proprietary prepayment models, and extensive databases remain essential tools in our implementation of this strategy.
The following table summarizes prepayment rates for our portfolio of fixed rate specified pools (excluding those backed by reverse mortgages) for the three month periods ended December 31, 2016, September 30, 2016, June 30, 2016, March 31, 2016, and December 31, 2015.
|
Three Month Period Ended
|
|||||||||||||||
|
December 31, 2016
|
September 30, 2016
|
June 30, 2016
|
March 31, 2016
|
December 31, 2015
|
|||||||||||
|
Three Month Constant Prepayment Rates
(1)
|
15.1
|
%
|
12.2
|
%
|
10.3
|
%
|
8.9
|
%
|
8.7
|
%
|
|||||
|
(1)
|
Excludes Agency fixed rate RMBS without any prepayment history.
|
The following table provides details about the composition of our portfolio of fixed rate specified pools (excluding those backed by reverse mortgages) as of December 31, 2016 and 2015:
|
December 31, 2016
|
December 31, 2015
|
||||||||||||||||||||||||
|
Coupon
|
Current Principal
|
Fair Value
|
Weighted
Average Loan
Age (Months)
|
Current Principal
|
Fair Value
|
Weighted
Average Loan
Age (Months)
|
|||||||||||||||||||
|
(In thousands)
|
(In thousands)
|
||||||||||||||||||||||||
|
Fixed rate Agency RMBS:
|
|||||||||||||||||||||||||
|
15-year fixed rate mortgages:
|
|||||||||||||||||||||||||
|
3.00
|
|
$
|
29,821
|
|
$
|
30,652
|
|
14
|
|
$
|
21,707
|
|
$
|
22,434
|
|
12
|
|
||||||||
|
3.50
|
|
61,814
|
|
64,949
|
|
22
|
|
68,743
|
|
72,367
|
|
15
|
|
||||||||||||
|
4.00
|
|
11,702
|
|
12,439
|
|
41
|
|
13,546
|
|
14,405
|
|
33
|
|
||||||||||||
|
4.50
|
|
3,619
|
|
3,905
|
|
69
|
|
4,564
|
|
4,914
|
|
56
|
|
||||||||||||
|
Total 15-year fixed rate mortgages
|
106,956
|
|
111,945
|
|
24
|
|
108,560
|
|
114,120
|
|
19
|
|
|||||||||||||
|
20-year fixed rate mortgages:
|
|||||||||||||||||||||||||
|
4.00
|
|
2,043
|
|
2,172
|
|
38
|
|
6,114
|
|
6,558
|
|
25
|
|
||||||||||||
|
4.50
|
|
1,156
|
|
1,254
|
|
37
|
|
1,352
|
|
1,471
|
|
25
|
|
||||||||||||
|
Total 20-year fixed rate mortgages
|
3,199
|
|
3,426
|
|
38
|
|
7,466
|
|
8,029
|
|
25
|
|
|||||||||||||
|
30-year fixed rate mortgages:
|
|||||||||||||||||||||||||
|
2.50
|
|
3,513
|
|
3,414
|
|
2
|
|
—
|
|
—
|
|
—
|
|
||||||||||||
|
3.00
|
|
4,993
|
|
4,970
|
|
34
|
|
7,395
|
|
7,406
|
|
35
|
|
||||||||||||
|
3.50
|
|
99,249
|
|
102,259
|
|
15
|
|
112,219
|
|
116,168
|
|
17
|
|
||||||||||||
|
4.00
|
|
291,166
|
|
308,365
|
|
20
|
|
320,635
|
|
341,144
|
|
14
|
|
||||||||||||
|
4.50
|
|
117,697
|
|
127,382
|
|
29
|
|
171,237
|
|
186,509
|
|
17
|
|
||||||||||||
|
5.00
|
|
52,008
|
|
57,013
|
|
46
|
|
63,336
|
|
70,117
|
|
34
|
|
||||||||||||
|
5.50
|
|
3,392
|
|
3,766
|
|
97
|
|
5,402
|
|
6,012
|
|
84
|
|
||||||||||||
|
6.00
|
|
3,161
|
|
3,602
|
|
84
|
|
4,141
|
|
4,673
|
|
73
|
|
||||||||||||
|
Total 30-year fixed rate mortgages
|
575,179
|
|
610,771
|
|
24
|
|
684,365
|
|
732,029
|
|
18
|
|
|||||||||||||
|
Total fixed rate Agency RMBS
|
$
|
685,334
|
|
$
|
726,142
|
|
24
|
|
$
|
800,391
|
|
$
|
854,178
|
|
19
|
|
|||||||||
68
Our net Agency premium as a percentage of our specified pool holdings is one metric that we use to measure the overall prepayment risk of our specified pool portfolio. Net Agency premium represents the total premium (excess of market value over outstanding principal balance) on our specified pool holdings less the total premium on related net short TBA positions. The lower our net Agency premium, the less we believe that our specified pool portfolio is exposed to market-wide increases in Agency RMBS prepayments. The net short TBA position related to our specified pool holdings had a notional value of $370.6 million and a fair value of $390.3 million as of December 31, 2016, and a notional value of $392.9 million and a fair value of $420.0 million as of December 31, 2015. As of December 31, 2016 and 2015, our net Agency premium as a percentage of fair value of our specified pool holdings was approximately 3.2% and 3.4%, respectively. Excluding TBA positions used to hedge our specified pool holdings, our Agency premium as a percentage of fair value was approximately 5.7% and 6.3% as of December 31, 2016 and 2015, respectively. Our Agency premium percentage and net Agency premium percentage may fluctuate from period to period based on a variety of factors, including market factors such as interest rates and mortgage rates, and, in the case of our net Agency premium percentage, based on the degree to which we hedge prepayment risk with short TBA positions. We believe that our focus on purchasing pools with specific prepayment characteristics provides a measure of protection against prepayments.
Financing
Our weighted average cost of funds, including reverse repo and securitized debt financing for the year ended December 31, 2016 increased 45 basis points to 1.23%, from 0.78% for the year ended December 31, 2015. Over the course of 2016, borrowing costs increased for both our Credit and Agency RMBS related assets. While the rising rate of LIBOR impacted both our Agency RMBS and Credit portfolio borrowing costs, changes in the composition of our repo borrowings have also put upward pressure on the cost of funds for our Credit portfolio, in that the amount of our securities-backed borrowings continues to decline relative to our loan-backed borrowings, which carry higher borrowing costs. We expect this trend to continue in 2017 as our loan assets constitute a growing portion of our overall Credit portfolio.
During the third quarter, notwithstanding the increase in short-term interest rates, Agency repo costs remained relatively constant. As a result of changes in money market fund regulations, there was a significant investor shift away from "prime" money market funds, which under the new regulations became susceptible to daily changes in their share prices, and into "government" money market funds. Because government money market funds are among the biggest providers of Agency RMBS repo, the increased assets of these funds resulted in an increase in the supply of Agency RMBS repo financing, and therefore put downward pressure on the cost of Agency RMBS repo, largely offsetting the increase in short-term interest rates in the third quarter. Despite the impact of the investor shift from prime money market funds to government money market funds, the surge in interest rates in the fourth quarter led to an increase in our cost of repo.
Expanding and enhancing our financing arrangements for our loan portfolios remains a high priority for us. Since executing our first financing facility for small balance commercial mortgage loans in the early part of 2016, we have added facilities for non-QM mortgage loans, residential NPLs, and consumer loans. We are currently evaluating additional borrowing facilities for both our non-QM mortgage business and our consumer loan business. We may also seek to obtain long-term financing through the securitization markets in several of our loan businesses. We believe that investment opportunities remain attractive in all of our loan businesses, and as 2017 progresses we are hopeful that we will be able to meaningfully increase our leverage and portfolio size.
Under the Dodd-Frank Act, bank capital treatment of repo transactions has become more onerous, thereby making it less attractive for banks to provide certain forms of repo financing. While large banks still dominate the repo market, non-bank firms, not subject to the same regulations as large banks, are becoming more active in providing repo financing. The vast majority of our outstanding repo financing is still provided by larger banks and dealers; however, in limited amounts, we have also entered into repo agreements with smaller non-bank dealers. In general, we continue to see strong appetite and competitive terms from both types of lenders.
Our leverage ratio including reverse repo and securitized debt increased to 1.63:1, excluding U.S. Treasury securities, as of December 31, 2016, as compared to 1.59:1 as of December 31, 2015. Our leverage ratio may fluctuate period over period based on portfolio management decisions, market conditions, and the timing of security purchase and sale transactions.
Critical Accounting Policies
Our consolidated financial statements have been prepared in conformity with accounting principles generally accepted in the United States, or "U.S. GAAP," for investment companies. In June 2007, the AICPA issued Amendments to ASC 946-10 ("ASC 946-10"),
Clarification of the Scope of the Audit and Accounting Guide Investment Companies and Accounting by Parent Companies and Equity Method Investors for Investments in Investment Companies
. ASC 946-10 was effective for fiscal years beginning on or after December 15, 2007 with earlier application encouraged. After we adopted ASC 946-10, the FASB
69
issued guidance which effectively delayed indefinitely the effective date of ASC 946-10. However, this additional guidance explicitly permitted entities that early adopted ASC 946-10 before December 31, 2007 to continue to apply the provisions of ASC 946-10. We have elected to continue to apply the provisions of ASC 946-10. ASC 946-10 provides guidance for determining whether an entity is within the scope of the AICPA Audit and Accounting Guide for Investment Companies, or the "Guide." The Guide provides guidance for determining whether the specialized industry accounting principles of the Guide should be retained in the financial statements of a parent company, of an investment company or of an equity method investor in an investment company. Effective August 17, 2007, we adopted ASC 946-10 and follow its provisions which, among other things, requires that investments be reported at fair value in the financial statements. Although we conduct our operations so that we are not required to register as an investment company under the Investment Company Act, for financial reporting purposes, we have elected to continue to apply the provisions of ASC 946-10.
In June 2013, the FASB issued ASU 2013-08,
Financial Services-Investment Companies
("ASC 946"). This update modified the guidance for ASC 946 for determining whether an entity is an investment company for U.S. GAAP purposes. It requires entities that adopted Statement of Position 07-1 prior to its deferral to reassess whether they continue to meet the definition of an investment company for U.S. GAAP purposes. The guidance was effective for interim and annual reporting periods in fiscal years that began after December 15, 2013, with retrospective application; earlier application was prohibited. We have determined that we still meet the definition of an investment company under ASC 946 and, as a result, the presentation of our financial statements has not changed since the effective date of this ASU.
Certain of our critical accounting policies require us to make estimates and assumptions that affect the reported amounts of assets and liabilities at the date of the consolidated financial statements and the reported amounts of revenues and expenses during the reporting period. Actual results could differ from those estimates. We believe that all of the decisions and assessments upon which our consolidated financial statements are based were reasonable at the time made based upon information available to us at that time. We rely on the experience of our Manager and Ellington and analysis of historical and current market data in order to arrive at what we believe to be reasonable estimates. See Note 2 of the notes to the consolidated financial statements for a complete discussion of our significant accounting policies. We have identified our most critical accounting policies to be the following:
Valuation
:
For financial instruments that are traded in an "active market," the best measure of fair value is the quoted market price. However, many of our financial instruments are not traded in an active market. Therefore, management generally uses third-party valuations when available. If third-party valuations are not available, management uses other valuation techniques, such as the discounted cash flow methodology. Summary descriptions, for various categories of financial instruments, of the valuation methodologies management uses in determining fair value of our financial instruments are detailed in Note 2 of the notes to our consolidated financial statements. Management utilizes such methodologies to assign a good faith fair value (the estimated price that, in an orderly transaction at the valuation date, would be received to sell an asset, or paid to transfer a liability, as the case may be) to each such financial instrument.
See the notes to our consolidated financial statements for more information on valuation techniques used by management in the valuation of our assets and liabilities.
Purchases and Sales of Investments and Investment Income
:
Purchase and sales transactions are generally recorded on trade date. Realized and unrealized gains and losses are calculated based on identified cost. We generally amortize premiums and accrete discounts on our fixed income investments using the effective interest method.
See the notes to our consolidated financial statements for more information on the assumptions and methods that we use to amortize purchase premiums and accrete purchase discounts.
Recent Accounting Pronouncements
Refer to the notes to our consolidated financial statements for a description of relevant recent accounting pronouncements.
70
Financial Condition
The following table summarizes our investment portfolio
(1)
as of
December 31, 2016
and 2015.
|
December 31, 2016
|
December 31, 2015
|
||||||||||||||||||||||||||||||||||||||
|
(In thousands)
|
Current Principal
|
Fair Value
|
Average Price
(2)
|
Cost
|
Average Cost
(2)
|
Current Principal
|
Fair Value
|
Average Price
(2)
|
Cost
|
Average Cost
(2)
|
|||||||||||||||||||||||||||||
|
Non-Agency RMBS and Residential Mortgage Loans
|
$
|
354,219
|
|
$
|
226,543
|
|
$
|
63.96
|
|
$
|
220,321
|
|
$
|
62.20
|
|
$
|
450,262
|
|
$
|
272,117
|
|
$
|
60.44
|
|
$
|
265,855
|
|
$
|
59.04
|
|
|||||||||
|
Non-Agency CMBS and Commercial Mortgage Loans
|
200,017
|
|
100,143
|
|
50.07
|
|
111,995
|
|
55.99
|
|
169,422
|
|
98,668
|
|
58.24
|
|
103,578
|
|
61.14
|
|
|||||||||||||||||||
|
ABS and Consumer Loans
|
141,079
|
|
145,326
|
|
103.01
|
|
155,359
|
|
110.12
|
|
150,946
|
|
149,149
|
|
98.81
|
|
150,890
|
|
99.96
|
|
|||||||||||||||||||
|
Total Non-Agency MBS, Mortgage loans, and ABS and Consumer Loans
(3)
|
695,315
|
|
472,012
|
|
67.88
|
|
487,675
|
|
70.14
|
|
770,630
|
|
519,934
|
|
67.47
|
|
520,323
|
|
67.52
|
|
|||||||||||||||||||
|
Agency RMBS:
|
|||||||||||||||||||||||||||||||||||||||
|
Floating
|
10,998
|
|
11,457
|
|
104.18
|
|
11,468
|
|
104.27
|
|
15,777
|
|
16,615
|
|
105.31
|
|
16,610
|
|
105.29
|
|
|||||||||||||||||||
|
Fixed
|
685,334
|
|
726,142
|
|
105.95
|
|
727,068
|
|
106.09
|
|
800,391
|
|
854,178
|
|
106.72
|
|
850,775
|
|
106.29
|
|
|||||||||||||||||||
|
Reverse Mortgages
|
55,910
|
|
60,221
|
|
107.71
|
|
61,174
|
|
109.41
|
|
62,197
|
|
66,860
|
|
107.50
|
|
68,135
|
|
109.55
|
|
|||||||||||||||||||
|
Total Agency RMBS
(4)
|
752,242
|
|
797,820
|
|
106.06
|
|
799,710
|
|
106.31
|
|
878,365
|
|
937,653
|
|
106.75
|
|
935,520
|
|
106.51
|
|
|||||||||||||||||||
|
Total Non-Agency and Agency MBS, Mortgage loans, and ABS and Consumer Loans
(3)(4)
|
1,447,557
|
|
1,269,832
|
|
87.72
|
|
1,287,385
|
|
88.94
|
|
1,648,995
|
|
1,457,587
|
|
88.39
|
|
1,455,843
|
|
88.29
|
|
|||||||||||||||||||
|
Agency Interest Only RMBS
|
n/a
|
29,622
|
|
n/a
|
30,096
|
|
n/a
|
n/a
|
24,918
|
|
n/a
|
26,237
|
|
n/a
|
|||||||||||||||||||||||||
|
Non-Agency Interest Only and Principal Only MBS and Other
(5)
|
n/a
|
19,711
|
|
n/a
|
21,748
|
|
n/a
|
n/a
|
18,966
|
|
n/a
|
22,768
|
|
n/a
|
|||||||||||||||||||||||||
|
TBAs:
|
|||||||||||||||||||||||||||||||||||||||
|
Long
|
67,720
|
|
70,525
|
|
104.14
|
|
70,334
|
|
103.86
|
|
94,602
|
|
98,009
|
|
103.60
|
|
97,914
|
|
103.50
|
|
|||||||||||||||||||
|
Short
|
(384,155
|
)
|
(404,728
|
)
|
105.36
|
|
(404,967
|
)
|
105.42
|
|
(580,992
|
)
|
(612,777
|
)
|
105.47
|
|
(612,749
|
)
|
105.47
|
|
|||||||||||||||||||
|
Net Short TBAs
|
(316,435
|
)
|
(334,203
|
)
|
105.62
|
|
(334,633
|
)
|
105.75
|
|
(486,390
|
)
|
(514,768
|
)
|
105.83
|
|
(514,835
|
)
|
105.85
|
|
|||||||||||||||||||
|
Long U.S. Treasury Securities
|
5,620
|
|
5,419
|
|
96.43
|
|
5,635
|
|
100.27
|
|
—
|
|
—
|
|
—
|
|
—
|
|
—
|
|
|||||||||||||||||||
|
Short U.S. Treasury Securities
|
(72,871
|
)
|
(69,762
|
)
|
95.73
|
|
(69,946
|
)
|
95.99
|
|
(90,120
|
)
|
(89,489
|
)
|
99.30
|
|
(89,735
|
)
|
99.57
|
|
|||||||||||||||||||
|
Short European Sovereign Bonds
|
(61,016
|
)
|
(62,680
|
)
|
102.73
|
|
(66,800
|
)
|
109.48
|
|
(23,907
|
)
|
(24,562
|
)
|
102.74
|
|
(26,010
|
)
|
108.80
|
|
|||||||||||||||||||
|
Repurchase Agreements
|
184,819
|
|
184,819
|
|
100.00
|
|
185,205
|
|
100.21
|
|
105,702
|
|
105,700
|
|
100.00
|
|
105,329
|
|
99.65
|
|
|||||||||||||||||||
|
Long Corporate Debt
|
95,664
|
|
80,095
|
|
83.73
|
|
81,036
|
|
84.71
|
|
62,530
|
|
27,028
|
|
43.22
|
|
34,786
|
|
55.63
|
|
|||||||||||||||||||
|
Short Corporate Debt
|
(40,807
|
)
|
(39,572
|
)
|
96.97
|
|
(39,664
|
)
|
97.20
|
|
(1,120
|
)
|
(448
|
)
|
39.96
|
|
(676
|
)
|
60.34
|
|
|||||||||||||||||||
|
Non-Exchange Traded Preferred and Common Equity Investment in Mortgage-Related Entities
|
n/a
|
18,090
|
|
n/a
|
17,243
|
|
n/a
|
n/a
|
15,926
|
|
n/a
|
16,251
|
|
n/a
|
|||||||||||||||||||||||||
|
Non-Exchange Traded Corporate Equity
|
n/a
|
3,987
|
|
n/a
|
4,313
|
|
n/a
|
n/a
|
6,162
|
|
n/a
|
6,347
|
|
n/a
|
|||||||||||||||||||||||||
|
Long Common Stock
|
n/a
|
4,396
|
|
n/a
|
4,381
|
|
n/a
|
n/a
|
—
|
|
n/a
|
—
|
|
n/a
|
|||||||||||||||||||||||||
|
Short Common Stock
|
n/a
|
(8,154
|
)
|
n/a
|
(8,052
|
)
|
n/a
|
n/a
|
(1,471
|
)
|
n/a
|
(1,878
|
)
|
n/a
|
|||||||||||||||||||||||||
|
Real Estate Owned
|
n/a
|
3,349
|
|
n/a
|
3,539
|
|
n/a
|
n/a
|
12,522
|
|
n/a
|
12,254
|
|
n/a
|
|||||||||||||||||||||||||
|
Total
|
$
|
1,104,949
|
|
$
|
1,121,486
|
|
$
|
1,038,071
|
|
$
|
1,046,681
|
|
|||||||||||||||||||||||||||
71
|
(1)
|
For more detailed information about the investments in our portfolio, please refer to the Consolidated Condensed Schedule of Investments as of these dates contained in our consolidated financial statements.
|
|
(2)
|
Represents the dollar amount (not shown in thousands) per $100 of current principal of the price or cost for the security.
|
|
(3)
|
Excludes non-Agency Interest Only and Principal Only MBS and Other.
|
|
(4)
|
Excludes Agency Interest Only RMBS.
|
|
(5)
|
Other includes equity tranches of CLOs, Other private label securities, and residual-like non-Agency RMBS and ABS backed by consumer loans.
|
The following table summarizes our financial derivatives portfolio
(1)
as of
December 31, 2016
and 2015.
|
December 31, 2016
|
December 31, 2015
|
||||||||||||||
|
(In thousands)
|
Notional Value
|
Fair Value
|
Notional Value
|
Fair Value
|
|||||||||||
|
Mortgage-Related Derivatives:
|
|||||||||||||||
|
Long CDS on RMBS and CMBS Indices
|
$
|
17,228
|
|
$
|
(2,887
|
)
|
$
|
5,926
|
|
$
|
(309
|
)
|
|||
|
Short CDS on RMBS and CMBS Indices
|
(112,999
|
)
|
16,701
|
|
(95,589
|
)
|
5,354
|
|
|||||||
|
Short CDS on Individual RMBS
|
(10,134
|
)
|
5,070
|
|
(12,176
|
)
|
6,111
|
|
|||||||
|
Net Mortgage-Related Derivatives
|
(105,905
|
)
|
18,884
|
|
(101,839
|
)
|
11,156
|
|
|||||||
|
Credit Derivatives:
|
|||||||||||||||
|
Long CDS referencing Corporate Bond Indices
|
40,611
|
|
2,744
|
|
793,824
|
|
135,752
|
|
|||||||
|
Short CDS referencing Corporate Bond Indices
|
(49,306
|
)
|
(2,840
|
)
|
(1,017,121
|
)
|
(45,407
|
)
|
|||||||
|
Long CDS on Corporate Bonds
|
59,637
|
|
(1,408
|
)
|
—
|
|
—
|
|
|||||||
|
Short CDS on Corporate Bonds
|
(83,108
|
)
|
(2,886
|
)
|
(13,370
|
)
|
(673
|
)
|
|||||||
|
Purchased Put Options on CDS on Corporate Bond Indices
(2)
|
10,000
|
|
—
|
|
138,000
|
|
2,050
|
|
|||||||
|
Written Put Options on CDS on Corporate Bond Indices
(3)
|
—
|
|
—
|
|
(171,750
|
)
|
(720
|
)
|
|||||||
|
Written Call Options on CDS on Corporate Bond Indices
(4)
|
—
|
|
—
|
|
(273,100
|
)
|
(884
|
)
|
|||||||
|
Long Total Return Swaps on Corporate Equities
(5)
|
—
|
|
—
|
|
21,670
|
|
—
|
|
|||||||
|
Short Total Return Swaps on Corporate Equities
(5)
|
(42,093
|
)
|
(55
|
)
|
(4,106
|
)
|
—
|
|
|||||||
|
Long Total Return Swaps on Corporate Debt
(6)
|
5,438
|
|
(94
|
)
|
45,051
|
|
(4,577
|
)
|
|||||||
|
Interest Rate Derivatives:
|
|||||||||||||||
|
Long Interest Rate Swaps
|
376,074
|
|
(2,122
|
)
|
675,207
|
|
6,976
|
|
|||||||
|
Short Interest Rate Swaps
|
(862,535
|
)
|
5,062
|
|
(1,126,600
|
)
|
(1,967
|
)
|
|||||||
|
Long U.S. Treasury Note Futures
(7)
|
—
|
|
—
|
|
44,000
|
|
(233
|
)
|
|||||||
|
Long Eurodollar Futures
(8)
|
11,000
|
|
(8
|
)
|
23,000
|
|
17
|
|
|||||||
|
Short U.S. Treasury Note Futures
(7)
|
(7,000
|
)
|
19
|
|
—
|
|
—
|
|
|||||||
|
Short Eurodollar Futures
(8)
|
(62,000
|
)
|
(51
|
)
|
(396,000
|
)
|
(280
|
)
|
|||||||
|
Purchased Straddle Swaptions
|
—
|
|
—
|
|
8,400
|
|
(31
|
)
|
|||||||
|
Written Straddle Swaptions
|
—
|
|
—
|
|
(13,100
|
)
|
(125
|
)
|
|||||||
|
Purchased Call Equity Options
(9)
|
16
|
|
42
|
|
—
|
|
—
|
|
|||||||
|
Interest Rate Caps
|
61,908
|
|
2
|
|
—
|
|
—
|
|
|||||||
|
Purchased Put Options on U.S. Treasury Security Futures
(10)
|
—
|
|
—
|
|
3,900
|
|
61
|
|
|||||||
|
Purchased Call Options on U.S. Treasury Security Futures
(11)
|
—
|
|
—
|
|
3,900
|
|
51
|
|
|||||||
|
Total Net Interest Rate Derivatives
|
2,944
|
|
4,469
|
|
|||||||||||
|
Other Derivatives:
|
|||||||||||||||
|
Long Foreign Currency Forwards
(12)
|
—
|
|
—
|
|
2,734
|
|
(13
|
)
|
|||||||
|
Short Foreign Currency Forwards
(13)
|
(54,787
|
)
|
(456
|
)
|
(95,326
|
)
|
1,138
|
|
|||||||
|
Warrants
(14)
|
1,639
|
|
106
|
|
1,555
|
|
150
|
|
|||||||
|
Mortgage Loan Purchase Commitments
(15)
|
20,601
|
|
(31
|
)
|
7,713
|
|
(8
|
)
|
|||||||
|
Total Net Derivatives
|
$
|
16,908
|
|
$
|
102,433
|
|
|||||||||
|
(1)
|
For more detailed information about the financial derivatives in our portfolio, please refer to the Consolidated Condensed Schedule of Investments as of these dates contained in our consolidated financial statements.
|
|
(2)
|
Represents the option on our part to enter into a CDS on a corporate bond index whereby we would pay a fixed rate and receive credit protection payments.
|
72
|
(3)
|
Represents the option on the part of a counterparty to enter into a CDS on a corporate bond index whereby we would receive a fixed rate and pay credit protection payments.
|
|
(4)
|
Represents the option on the part of a counterparty to enter into a CDS on a corporate bond index whereby we would pay a fixed rate and receive credit protection payments.
|
|
(5)
|
Notional value represents number of underlying shares times the closing price of the underlying security.
|
|
(6)
|
Notional value represents outstanding principal on underlying corporate debt.
|
|
(7)
|
Notional value represents the total face amount of U.S. Treasury securities underlying all contracts held. As of December 31, 2016 a total of 70 short U.S. Treasury note futures contracts were held and as of December 31, 2015 a total of 343 long U.S. Treasury note futures contracts were held.
|
|
(8)
|
Every $1,000,000 in notional value represents one Eurodollar future contract.
|
|
(9)
|
Notional value represents the number of common shares we have the option to purchase multiplied by the strike price.
|
|
(10)
|
Represents the option on our part to enter into a futures contract with a counterparty; as of December 31, 2015 39 put options contracts were held.
|
|
(11)
|
Represents the option on our part to enter into a futures contract with a counterparty; as of December 31, 2015 39 call options contracts were held.
|
|
(12)
|
Notional value represents U.S. Dollars to be paid by us at the maturity of the forward contract.
|
|
(13)
|
Notional value represents U.S. Dollars to be received by us at the maturity of the forward contract.
|
|
(14)
|
Notional value represents number of shares that warrants are convertible into.
|
|
(15)
|
Notional value represents principal balance of mortgage loan purchase commitments. Actual loan purchases are contingent upon successful loan closings in accordance with agreed-upon parameters.
|
As of
December 31, 2016
, our Consolidated Statement of Assets, Liabilities, and Equity reflects total assets of
$2.4 billion
as compared to
$3.0 billion
as of
December 31, 2015
. Total liabilities as of
December 31, 2016
and 2015 were
$1.8 billion
and
$2.3 billion
, respectively. Our portfolios of investments, financial derivatives, and repurchase agreements included in total assets were
$1.7 billion
and $1.9 billion as of
December 31, 2016
and 2015, respectively, while our investments sold short and financial derivatives included in total liabilities were
$603.6 million
and
$789.2 million
as of
December 31, 2016
and 2015, respectively. Investments sold short consist principally of short positions in TBAs, which we primarily use to hedge the risk of rising interest rates on our investment portfolio. Typically, we hold a net short position in TBAs. The amounts of net short TBAs, as well as other hedging instruments, may fluctuate according to the size of our investment portfolio as well as according to how we view market dynamics as favoring the use of one hedging instrument or another. As of
December 31, 2016
and 2015, we had a net short TBA position of
$334.2 million
and
$514.8 million
, respectively.
TBA-related assets include TBAs and receivables for TBAs sold short, and TBA-related liabilities include TBAs sold short and payables for TBAs purchased. As of
December 31, 2016
, total assets included
$70.5 million
of TBAs as well as
$406.7 million
of receivables for securities sold relating to unsettled TBA sales. As of
December 31, 2015
, total assets included
$98.0 million
of TBAs as well as
$613.0 million
of receivables for securities sold relating to unsettled TBA sales. As of
December 31, 2016
, total liabilities included
$404.7 million
of TBAs sold short as well as
$70.3 million
of payables for securities purchased relating to unsettled TBA purchases. As of
December 31, 2015
, total liabilities included
$612.8 million
of TBAs sold short as well as
$98.0 million
of payables for securities purchased relating to unsettled TBA purchases. Open TBA purchases and sales involving the same counterparty, the same underlying deliverable Agency pass-throughs, and the same settlement date are reflected in our consolidated financial statements on a net basis.
For a more detailed discussion of our investment portfolio, see "—
Trends and Recent Market Developments—Portfolio Overview and Outlook
" above.
We use mortgage-related credit derivatives primarily to hedge credit risk in our non-Agency MBS portfolio, although we also take net long positions in certain CDS on RMBS and CMBS indices. Our CDS on individual RMBS represent "single-name" positions whereby we have synthetically purchased credit protection on specific non-Agency RMBS bonds. As there is no longer an active market for CDS on individual RMBS, our portfolio continues to run off. We also use CDS on corporate bond indices, options thereon, and various other instruments as a means to hedge credit risk, or for relative value trading purposes. As market conditions change, especially as the pricing of various credit hedging instruments changes in relation to our outlook on future credit performance, we continuously re-evaluate both the extent to which we hedge credit risk and the particular mix of instruments that we use to hedge credit risk.
We often hold long and/or short positions in corporate equities. Our short and long positions in corporate equities can serve either as portfolio hedges or as relative value opportunities. In addition, we have acquired certain of our distressed corporate loans synthetically, in the form of total return swaps. We have also implemented an interest rate derivatives trading strategy. Within this strategy, we can take long and/or short positions in various interest rate-related instruments, such as U.S. Treasury securities, interest rate swaps, futures, and options. While some of the trading positions in this strategy are intended as hedges for various exposures in our overall portfolio, we also may take speculative positions to capitalize on what we view as market inefficiencies or anomalies.
We use a variety of instruments to hedge interest rate risk in our portfolio, including non-derivative instruments such as TBAs, U.S. Treasury securities and sovereign debt instruments, and derivative instruments such as interest rate swaps, Eurodollar and U.S. Treasury futures, and options on the foregoing. The mix of instruments that we use to hedge interest rate risk may change materially from one period to the next.
73
We have also entered into foreign currency forward contracts in order to hedge risks associated with foreign currency fluctuations.
We have entered into reverse repos to finance some of our assets. As of
December 31, 2016
and 2015, indebtedness outstanding on our reverse repos was approximately
$1.0 billion
and $1.2 billion, respectively. As of
December 31, 2016
, we had total Agency RMBS financed with reverse repos of $809.2 million as compared to $971.1 million as of December 31, 2015. As of
December 31, 2016
, we had total Credit assets financed with reverse repos of $338.2 million as compared to $383.8 million as of December 31, 2015. As of
December 31, 2016
we also had total U.S. Treasury securities financed with reverse repos of $5.4 million. We did not have any U.S. Treasury securities financed with reverse repos at December 31, 2015. Outstanding indebtedness under reverse repos for Agency RMBS as of
December 31, 2016
and 2015 was $790.3 million and $933.3 million, respectively, while outstanding indebtedness under reverse repos for our Credit portfolio as of
December 31, 2016
and 2015 was $237.8 million and $240.9 million, respectively. Outstanding indebtedness under reverse repos for U.S. Treasury securities as of
December 31, 2016
was $5.4 million. We did not have any reverse repos on U.S. Treasury securities at December 31, 2015. Our reverse repos bear interest at rates that have historically moved in close relationship to LIBOR. We account for our reverse repos as collateralized borrowings. In addition to our reverse repos, as of
December 31, 2016
we had outstanding indebtedness of $24.1 million in the form of a securitized debt transaction used to finance $42.0 million of commercial loans and REO. We had no indebtedness under securitized debt transactions as of December 31, 2015. As of
December 31, 2016
and 2015 our debt-to-equity ratio was
1.64
to one and 1.59 to one, respectively. Excluding U.S. Treasury securities our debt-to-equity ratio as of
December 31, 2016
was 1.63 to one. See the discussion in "—
Liquidity and Capital Resources
" below for further information on our reverse repos.
In connection with our derivative and TBA transactions, in certain circumstances we may require that counterparties post collateral with us. When we exit a derivative or TBA transaction for which a counterparty has posted collateral, we may be required to return some or all of the related collateral to the respective counterparty. As of
December 31, 2016
and December 31, 2015, our derivative and TBA counterparties posted an aggregate value of approximately $12.8 million and $114.1 million of collateral with us, respectively. This collateral posted with us is included in Due to brokers on our Consolidated Statement of Assets, Liabilities, and Equity.
TBA Market
We generally do not settle our purchases and sales of TBAs. If, for example, we wish to maintain a short position in a particular TBA as a hedge, we may "roll" the short TBA transaction. In a hypothetical roll transaction, we might have previously entered into a contract to sell a specified amount of 30-year FNMA 4.5% TBA pass-throughs to a particular counterparty on a specified settlement date. As this settlement date approaches, because we generally do not intend to settle the sale transaction, but we wish to maintain the short position, we enter into a roll transaction whereby we purchase the same amount of 30-year FNMA 4.5% TBA pass-throughs (but not necessarily from the same counterparty) for the same specified settlement date, and we sell the same amount of 30-year FNMA 4.5% TBA pass-throughs (potentially to yet another counterparty) for a later settlement date. In this way, we have essentially "flattened out" our 30-year FNMA 4.5% TBA pass-through position for the earlier settlement date (
i.e.
, offset the original sale with a corresponding purchase), and established a new short position for the later settlement date, hence maintaining our short position. By rolling our transaction, we maintain our desired short position in 30-year FNMA 4.5% securities without settling the original sale transaction.
In the case where the counterparty from whom we purchase (or to whom we sell) for the earlier settlement date is the same as the counterparty to whom we sell (or from whom we purchase) for the later settlement date, and when the purchase and sale are transacted simultaneously, the pair of simultaneous purchase and sale transactions is often referred to as a "TBA roll" transaction.
In some instances, to avoid taking or making delivery of TBA securities, we will "pair off" an open purchase or sale transaction with an offsetting sale or purchase with the same counterparty. Alternatively, we will "assign" open transactions from counterparties from whom we have purchased to other counterparties to whom we have sold. In either case, no securities are actually delivered, but instead the net difference in trade proceeds of the offsetting transactions is calculated and a money wire representing such difference is sent to the appropriate party.
For the year ended
December 31, 2016
, as disclosed on our Consolidated Statement of Cash Flows, the aggregate TBA activity, or volume of closed transactions based on the sum of the absolute value of buy and sell transactions, was
$22.9 billion
, as compared to
$36.4 billion
for the year ended
December 31, 2015
. Our TBA activity has principally consisted of: (a) sales (respectively purchases) of TBAs as hedges in connection with purchases (respectively sales) of certain other assets (especially fixed rate Agency whole pools); (b) TBA roll transactions (as described above) effected to maintain existing TBA short positions; and (c) TBA "sector rotation" transactions whereby a short position in one TBA security is replaced with a short position in a different TBA security. Since we have actively turned over our portfolio of fixed rate Agency whole pools, the
74
volume of TBA hedging transactions has also been correspondingly high. Moreover, our fixed rate Agency whole pool portfolio is typically larger in gross size than our equity capital base, and so we tend to hold large short TBA positions relative to our equity capital base at any time. Finally, the entire amount of short TBA positions held at each monthly TBA settlement date is typically rolled to the following month, and since the amount of short TBA positions tends to be large relative to our equity capital base, TBA roll transaction volume over multi-month periods can represent a multiple of our equity capital base.
Equity
As of
December 31, 2016
, our equity decreased by approximately
$94.2 million
to
$644.8 million
from $739.0 million as of December 31, 2015. This decrease principally consisted of a net decrease in equity resulting from operations for the year ended
December 31, 2016
of
$(15.7) million
, dividends paid of
$65.1 million
, distributions to joint venture partners of approximately
$5.2 million
, and payments to repurchase common shares of
$14.0 million
, partially offset by an increase related to contributions from our non-controlling interests of approximately
$5.6 million
. Shareholders' equity, which excludes the non-controlling interests related to the minority interest in the Operating Partnership as well the minority interests of our joint venture partners, was
$637.7 million
as of
December 31, 2016
.
Results of Operations for the Years Ended
December 31, 2016
, 2015, and 2014
The table below represents the net increase (decrease) in equity resulting from operations for the years ended
December 31, 2016
, 2015, and 2014.
|
Year Ended December 31,
|
||||||||||||
|
(In thousands except per share amounts)
|
2016
|
2015
|
2014
|
|||||||||
|
Interest income
|
$
|
74,344
|
|
$
|
101,783
|
|
$
|
93,533
|
|
|||
|
Other income
|
5,841
|
|
2,813
|
|
318
|
|
||||||
|
Total investment income
|
80,185
|
|
104,596
|
|
93,851
|
|
||||||
|
Expenses:
|
||||||||||||
|
Base management fee
|
10,065
|
|
11,493
|
|
10,751
|
|
||||||
|
Incentive fee
|
—
|
|
—
|
|
1,400
|
|
||||||
|
Interest expense
|
16,306
|
|
12,112
|
|
9,927
|
|
||||||
|
Other investment related expenses
|
8,070
|
|
5,612
|
|
4,689
|
|
||||||
|
Other operating expenses
|
9,979
|
|
9,203
|
|
8,333
|
|
||||||
|
Total expenses
|
44,420
|
|
38,420
|
|
35,100
|
|
||||||
|
Net investment income
|
35,765
|
|
66,176
|
|
58,751
|
|
||||||
|
Net realized and change in net unrealized gain (loss) on investments
|
(5,304
|
)
|
(22,485
|
)
|
23,117
|
|
||||||
|
Net realized and change in net unrealized gain (loss) on financial derivatives, excluding currency forwards
|
(46,722
|
)
|
(5,598
|
)
|
(21,899
|
)
|
||||||
|
Net realized and change in net unrealized gain (loss) on financial derivatives—currency forwards
|
2,513
|
|
5,115
|
|
2,416
|
|
||||||
|
Net foreign currency gain (loss)
|
(1,954
|
)
|
(4,779
|
)
|
(2,436
|
)
|
||||||
|
Net increase (decrease) in equity resulting from operations
|
(15,702
|
)
|
38,429
|
|
59,949
|
|
||||||
|
Less: Net increase in equity resulting from operations attributable to non-controlling interests
|
305
|
|
340
|
|
782
|
|
||||||
|
Net increase (decrease) in shareholders' equity resulting from operations
|
$
|
(16,007
|
)
|
$
|
38,089
|
|
$
|
59,167
|
|
|||
|
Net increase (decrease) in shareholders' equity resulting from operations per share
|
$
|
(0.48
|
)
|
$
|
1.13
|
|
$
|
2.09
|
|
|||
Results of Operations for the Years Ended December 31, 2016 and 2015
Summary of Net Increase (Decrease) in Shareholders' Equity from Operations
For the year ended
December 31, 2016
we had a net decrease in shareholders' equity resulting from operations of
$(16.0) million
and for the year ended
December 31, 2015
we had a net increase in shareholders' equity resulting from operations of
$38.1 million
. The year-over-year reversal in our results of operations was due to an increase in our net realized and unrealized losses on our financial derivatives and a decrease in our net investment income. Lower interest income was the main component of the year-over-year change in net investment income. The decrease in interest income was primarily the result of a decrease in the size of our investment portfolio. We also employed less leverage in our Agency RMBS portfolio in 2016 as
75
compared to the same period in 2015. As our loan portfolios continue to grow, our expectation is that our interest income and leverage will increase from current levels. During the year ended
December 31, 2016
, we had significant net realized and unrealized losses on our credit hedges. Because our credit hedges were primarily in the form of short positions in financial instruments tied to high-yield corporate debt, we incurred losses as high-yield corporate credit rallied meaningfully during the year. These losses were partially offset by positive results from our securities portfolios, including non-Agency RMBS, CMBS and Agency RMBS, and from our loan portfolios, including consumer loans, small balance commercial mortgage loans and residential mortgage loans. Total return based on changes in "net asset value" or "book value" for our common shares was (1.83)% for the year ended
December 31, 2016
as compared to 5.14% for the year ended
December 31, 2015
. Total return on our common shares is calculated based on changes in net asset value per share or book value per share and assumes reinvestment of dividends.
Net Investment Income
Net investment income was
$35.8 million
for the year ended
December 31, 2016
as compared to
$66.2 million
for the year ended
December 31, 2015
. Net investment income consists of interest and other income less total expenses. The year-over-year decrease in net investment income was due to lower interest income for the year ended
December 31, 2016
as compared to the year ended
December 31, 2015
.
Interest Income
Interest income was
$74.3 million
for the year ended
December 31, 2016
as compared to
$101.8 million
for the year ended
December 31, 2015
. Interest income includes coupon payments received and accrued on our holdings, the net accretion and amortization of purchase discounts and premiums on those holdings and interest on our cash balances, including those balances held by our counterparties as collateral. For the year ended
December 31, 2016
, interest income from our Agency RMBS was
$24.0 million
, while for the year ended
December 31, 2015
, interest income was
$35.3 million
. For the year ended
December 31, 2016
, interest income from our Credit portfolio was
$48.6 million
, while for the year ended
December 31, 2015
, interest income was
$66.0 million
. The decrease in interest income was primarily due to a decline in our average portfolio holdings, as well as a decrease in the average yield of our Credit and Agency portfolios. The decrease in the average yield of our Credit portfolio was generally based on the decrease in the relative contribution from certain higher-yielding asset classes in which our positions have decreased in size.
The following table details our interest income, average holdings of interest-earning assets, and weighted average yield based on amortized cost for the years ended
December 31, 2016
and 2015:
|
Credit
(1)
|
Agency
(1)
|
Total
(1)
|
||||||||||||||||||||||||||||||
|
(In thousands)
|
Interest Income
|
Average Holdings
|
Yield
|
Interest Income
|
Average Holdings
|
Yield
|
Interest Income
|
Average Holdings
|
Yield
|
|||||||||||||||||||||||
|
Year ended
December 31, 2016
|
$
|
48,607
|
|
$
|
569,933
|
|
8.53
|
%
|
$
|
24,022
|
|
$
|
869,055
|
|
2.76
|
%
|
$
|
72,629
|
|
$
|
1,438,988
|
|
5.05
|
%
|
||||||||
|
Year ended
December 31, 2015 |
$
|
65,967
|
|
$
|
670,474
|
|
9.84
|
%
|
$
|
35,270
|
|
$
|
1,158,832
|
|
3.04
|
%
|
$
|
101,237
|
|
$
|
1,829,306
|
|
5.53
|
%
|
||||||||
|
(1)
|
Amounts exclude interest income on cash and cash equivalents (including when posted as margin) and long positions in U.S. Treasury securities. Also excludes long holdings of corporate securities that represent components of certain relative value trading strategies.
|
Base Management Fees
For the years ended
December 31, 2016
and 2015, base management fee incurred, which is based on total equity at the end of each quarter, was
$10.1 million
and
$11.5 million
, respectively. The decrease in the base management fee was due to our smaller capital base year over year.
Interest Expense
Interest expense primarily includes interest on funds borrowed under reverse repos and securitized debt, coupon interest on securities sold short, the related net accretion and amortization of purchase discounts and premiums on those short holdings, and interest on our counterparties' cash collateral held by us. We had average borrowed funds under reverse repos and securitized debt of
$1.09 billion
and
$1.41 billion
for the years ended
December 31, 2016
and 2015, respectively. Our total interest expense, inclusive of interest expense on our counterparties' cash collateral held by us, increased to
$16.3 million
for the year ended
December 31, 2016
, as compared to
$12.1 million
for the year ended
December 31, 2015
. This increase in our interest expense was in part due to the increase in the cost of repo in 2016 relative to the prior year. The cost of repo has typically moved in sympathy with movements in LIBOR rates. LIBOR rates rose as the Federal Reserve increased the target range for the federal funds in December 2015 and again in December 2016; LIBOR rates also rose with the approach of the
76
new SEC money market fund reform rules that took effect in October 2016, although in this case there was a roughly offsetting effect on the cost of some of our repo borrowings, as the new rules caused an increase in demand from government money market funds to provide Agency RMBS repo. The increase in our interest expense was also the result of a shift in the mix of our borrowings, as more of our Credit-related borrowings now relate to our growing loan portfolios, and as loans generally carry higher borrowing rates and debt issuance costs as compared to securities.
The tables below show our average borrowed funds, interest expense, average cost of funds, and average one-month and average six-month LIBOR rates under our reverse repos and securitized debt for the years ended
December 31, 2016
and 2015.
Agency Securities
|
(In thousands)
|
Average Borrowed Funds
|
Interest Expense
|
Average Cost of Funds
|
Average One-Month LIBOR
|
Average Six-Month LIBOR
|
||||||||||||
|
For the year ended December 31, 2016
|
$
|
824,020
|
|
$
|
5,936
|
|
0.72
|
%
|
0.50
|
%
|
1.06
|
%
|
|||||
|
For the year ended December 31, 2015
|
$
|
1,104,607
|
|
$
|
4,745
|
|
0.43
|
%
|
0.20
|
%
|
0.49
|
%
|
|||||
Credit Portfolio
|
(In thousands)
|
Average Borrowed Funds
|
Interest Expense
|
Average Cost of Funds
|
Average One-Month LIBOR
|
Average Six-Month LIBOR
|
||||||||||||
|
For the year ended December 31, 2016
|
$
|
247,542
|
|
$
|
7,380
|
|
2.98
|
%
|
0.50
|
%
|
1.06
|
%
|
|||||
|
For the year ended December 31, 2015
|
$
|
282,949
|
|
$
|
6,262
|
|
2.21
|
%
|
0.20
|
%
|
0.49
|
%
|
|||||
U.S. Treasury Securities
|
(In thousands)
|
Average Borrowed Funds
|
Interest Expense
|
Average Cost of Funds
|
Average One-Month LIBOR
|
Average Six-Month LIBOR
|
||||||||||||
|
For the year ended December 31, 2016
|
$
|
13,480
|
|
$
|
42
|
|
0.31
|
%
|
0.50
|
%
|
1.06
|
%
|
|||||
|
For the year ended December 31, 2015
|
$
|
23,382
|
|
$
|
4
|
|
0.01
|
%
|
0.20
|
%
|
0.49
|
%
|
|||||
Total
|
(In thousands)
|
Average Borrowed Funds
|
Interest Expense
|
Average Cost of Funds
|
Average One-Month LIBOR
|
Average Six-Month LIBOR
|
||||||||||||
|
For the year ended December 31, 2016
|
$
|
1,085,042
|
|
$
|
13,358
|
|
1.23
|
%
|
0.50
|
%
|
1.06
|
%
|
|||||
|
For the year ended December 31, 2015
|
$
|
1,410,938
|
|
$
|
11,011
|
|
0.78
|
%
|
0.20
|
%
|
0.49
|
%
|
|||||
Among other instruments, we use interest rate swaps to hedge our portfolios against the risk of rising interest rates. If we were to include as a component of our cost of funds the actual and accrued periodic payments on our interest rate swaps used to hedge our yield-bearing targeted assets, our total average cost of funds would increase to 1.46% and 1.14% for the years ended
December 31, 2016
and 2015, respectively. Our net interest margin, defined as the yield on our portfolio of yield-bearing targeted assets (See—Interest Income above), less our cost of funds (including actual and accrued periodic payments on interest rate swaps as described above) was 3.59% and 4.39% for the years ended
December 31, 2016
and 2015, respectively. These metrics do not include amortization of upfront payments associated with certain of our interest rate swaps or the costs associated with other instruments that we use to hedge interest rate risk, such as TBAs and futures.
Incentive Fees
In addition to the base management fee, our Manager is also entitled to a quarterly incentive fee if our performance (as measured by adjusted net income, as defined in the management agreement) over the relevant rolling four quarter calculation period exceeds a defined return hurdle for the period. No incentive fee was incurred for the years ended
December 31, 2016
and 2015, since on a rolling four quarter basis, our income did not exceed the prescribed hurdle amount. Because our operating results can vary materially from one period to another, incentive fee expense can also be highly variable.
77
Other Investment Related Expenses
Other investment related expenses consist of servicing fees on our mortgage and consumer loans, as well as various other expenses and fees directly related to our financial assets. For the years ended
December 31, 2016
and 2015 other investment related expenses were
$8.1 million
and
$5.6 million
, respectively. The increase was primarily due to increased servicing fees and other expenses relating to our loan portfolios, which have increased in size year over year.
Other Operating Expenses
Other operating expenses consist of professional fees, compensation expense related to our dedicated or partially dedicated personnel, administration fees, share-based LTIP expense, insurance expense, and various other operating expenses necessary to run our business. Other operating expenses exclude management and incentive fees, interest expense, and other investment related expenses. Other operating expenses for the year ended
December 31, 2016
were
$10.0 million
as compared to
$9.2 million
for the year ended
December 31, 2015
. The increase in our other operating expenses was primarily related to increased professional fees.
Net Realized and Unrealized Gains (Losses) on Investments
During the year ended
December 31, 2016
, we had net realized and unrealized losses on investments of
$(5.3) million
as compared to net realized and unrealized losses of
$(22.5) million
for the year ended
December 31, 2015
. Net realized and unrealized losses on investments of
$(5.3) million
for the year ended
December 31, 2016
resulted principally from net realized and unrealized losses on consumer loans, U.S. and European CMBS, European RMBS, TBAs, Agency RMBS, U.S. Treasury and other sovereign securities, and non-listed equity, partially offset by U.S. non-Agency RMBS, U.S. and European CLOs, residential and commercial mortgage loans and REO and corporate debt. Our net short positions in TBAs, U.S. Treasury and sovereign securities are used primarily to hedge interest rate and/or prepayment risk with respect to our investment holdings. During the year ended
December 31, 2016
, the fixed income markets experienced periods of significant volatility. Over the course of the year, yields spreads on some asset classes widened while others tightened. With regard to our consumer loans, we had write-downs with respect to loans purchased under one flow agreement where we had seen a greater persistence of default rates than anticipated. We concluded purchasing loans under this agreement. We recognized gains on the successful resolutions of our non-performing residential and commercial mortgage loans and REO.
Net realized and unrealized losses on investments of
$(22.5) million
for the year ended
December 31, 2015
resulted principally from net realized and unrealized losses on distressed corporate debt, net short TBAs, Agency RMBS, CLOs, U.S. Treasury positions and CMBS, partially offset by net realized and unrealized gains on non-Agency RMBS, residential loans, REO, small balance commercial mortgage loans, and short equity positions.
Net Realized and Unrealized Gains and (Losses) on Financial Derivatives
During the year ended
December 31, 2016
, we had net realized and unrealized losses on our financial derivatives of
$(44.2) million
as compared to net realized and unrealized losses of
$(0.5) million
for the year ended
December 31, 2015
. Our financial derivatives consist of interest rate derivatives, which we use primarily to hedge interest rate risk, and of credit derivatives and total return swaps, both of which we use primarily to hedge credit risk, but also for non-hedging purposes. Non-hedging credit derivatives and total return swaps include both long and short positions. Our derivatives also include foreign currency forwards, which we use to hedge foreign currency risk. Our interest rate derivatives are primarily in the form of net short positions in interest rate swaps, short and/or long positions in Eurodollar futures and U.S. Treasury Note futures, as well as purchased and written swaptions. We also use certain non-derivative instruments, such as TBAs, U.S. Treasury securities and sovereign debt instruments, to hedge interest rate risk. Our derivative credit hedges were primarily in the form of short positions in instruments tied to high-yield corporate credit, and credit default swaps where we have purchased credit protection on non-Agency MBS indices and individual MBS. We have also used total return swaps to take synthetic long or short positions in the equity of certain publicly traded mortgage-related or corporate entities. We have acquired certain of our distressed corporate loans synthetically, in the form of total return swaps. Net realized and unrealized losses of
$(44.2) million
on our financial derivatives for the year ended
December 31, 2016
resulted primarily from net losses on our credit hedges in the form of CDS on high yield corporate bond indices, our total return swaps, and our interest rate swaps, partially offset by net gains on our options on CDS on high yield corporate bond indices and our CDS on corporate bonds. Net foreign exchange transaction and translation losses were largely offset by net realized and unrealized gains on our foreign currency forwards. Translation and transaction losses were incurred in connection with our non-dollar denominated European assets.
Net realized and unrealized losses on our financial derivatives of
$(0.5) million
for the year ended
December 31, 2015
resulted primarily from net losses related to our interest rate swaps, total return swaps, CDS on asset-backed indices, and CDS on individual RMBS, partially offset by net realized and unrealized gains on our options on CDS indices and currency
78
forwards. Net gains on our currency forwards were largely offset by translation and transaction losses related to our non-dollar denominated European assets.
Results of Operations for the Years Ended December 31, 2015 and 2014
Summary of Net Increase in Shareholders' Equity from Operations
Our net income for the years ended December 31, 2015 and 2014 was $38.1 million and $59.2 million, respectively. The decrease in our net income year over year was primarily driven by an increase in our combined net realized and unrealized losses on our investments and financial derivatives, partially offset by an increase in our net investment income. Total return based on changes in "net asset value" or "book value" for our common shares was 5.14% for the year ended December 31, 2015 as compared to 8.77% for the year ended December 31, 2014. Total return on our common shares is calculated based on changes in net asset value per share or book value per share and assumes reinvestment of dividends.
Net Investment Income
Net investment income was $66.2 million for the year ended December 31, 2015 as compared to $58.8 million for the year ended December 31, 2014. Net investment income consists of interest and other income less total expenses. The year-over-year increase in net investment income was primarily due to higher interest income for the year ended December 31, 2015 as compared to the year ended December 31, 2014.
Interest Income
Interest income was $101.8 million for the year ended December 31, 2015 as compared to $93.5 million for the year ended December 31, 2014. Interest income includes coupon payments received and accrued on our holdings, the net accretion and amortization of purchase discounts and premiums on those holdings and interest on our cash balances, including those balances held by our counterparties as collateral. On a year-over-year basis, interest income from our Agency portfolio increased, mainly in connection with the increase in our average portfolio holdings. For the year ended December 31, 2015, interest income from our Agency RMBS was $35.3 million, while for the year ended December 31, 2014, interest income was $33.2 million. For the year ended December 31, 2015, interest income from our Credit portfolio was $66.0 million, while for the year ended December 31, 2014, interest income was $58.4 million. The increase in interest income was primarily driven by an increase in our average portfolio holdings, as well as an increase in the average yield of our Credit portfolio. The increase in the average yield of our Credit portfolio was generally based on an increase in the relative contribution from certain higher-yielding asset classes in which we have been more recently investing, such as consumer loans.
The following table details our interest income, average holdings of interest-earning assets, and weighted average yield based on amortized cost for the years ended December 31, 2015 and 2014:
|
Credit
(1)
|
Agency
(1)
|
Total
(1)
|
||||||||||||||||||||||||||||||
|
(In thousands)
|
Interest Income
|
Average Holdings
|
Yield
|
Interest Income
|
Average Holdings
|
Yield
|
Interest Income
|
Average Holdings
|
Yield
|
|||||||||||||||||||||||
|
Year ended
December 31, 2015 |
$
|
65,967
|
|
$
|
670,474
|
|
9.84
|
%
|
$
|
35,270
|
|
$
|
1,158,832
|
|
3.04
|
%
|
$
|
101,237
|
|
$
|
1,829,306
|
|
5.53
|
%
|
||||||||
|
Year ended
December 31, 2014 |
$
|
58,374
|
|
$
|
627,215
|
|
9.31
|
%
|
$
|
33,215
|
|
$
|
1,003,952
|
|
3.31
|
%
|
$
|
91,589
|
|
$
|
1,631,167
|
|
5.61
|
%
|
||||||||
|
(1)
|
Amounts exclude interest income on cash and cash equivalents (including when posted as margin) and long positions in U.S. Treasury securities.
|
Base Management Fees
For the years ended December 31, 2015 and 2014, base management fee incurred, which is based on total equity at the end of each quarter, was $11.5 million and $10.8 million, respectively. The increase in the base management fee was due to our larger capital base year over year.
Interest Expense
Interest expense includes interest on funds borrowed under reverse repos, securitized debt, coupon interest on securities sold short, the related net accretion and amortization of purchase discounts and premiums on those short holdings, and interest on our counterparties' cash collateral held by us. We had average borrowed funds under reverse repos of $1.41 billion and $1.36 billion for the years ended December 31, 2015 and 2014, respectively. Our total interest expense, inclusive of interest expense on securitized debt and on our counterparties' cash collateral held by us, increased to $12.1 million for the year ended December 31, 2015 as compared to $9.9 million for the year ended December 31, 2014. This increase was primarily due to the
79
increase in our average borrowed funds related to our larger average portfolio of Agency securities and to an overall increase in the cost of repo financing during 2015.
The tables below show our average borrowed funds, interest expense, average cost of funds, and average one-month and average six-month LIBOR rates under our reverse repos for the years ended December 31, 2015 and 2014.
Agency Securities
|
(In thousands)
|
Average Borrowed Funds
|
Interest Expense
|
Average Cost of Funds
|
Average One-Month LIBOR
|
Average Six-Month LIBOR
|
||||||||||||
|
For the year ended December 31, 2015
|
$
|
1,104,607
|
|
$
|
4,745
|
|
0.43
|
%
|
0.20
|
%
|
0.49
|
%
|
|||||
|
For the year ended December 31, 2014
|
$
|
911,168
|
|
$
|
3,282
|
|
0.36
|
%
|
0.16
|
%
|
0.33
|
%
|
|||||
Credit Portfolio
|
(In thousands)
|
Average Borrowed Funds
|
Interest Expense
|
Average Cost of Funds
|
Average One-Month LIBOR
|
Average Six-Month LIBOR
|
||||||||||||
|
For the year ended December 31, 2015
|
$
|
282,949
|
|
$
|
6,262
|
|
2.21
|
%
|
0.20
|
%
|
0.49
|
%
|
|||||
|
For the year ended December 31, 2014
|
$
|
319,852
|
|
$
|
6,312
|
|
1.97
|
%
|
0.16
|
%
|
0.33
|
%
|
|||||
U.S. Treasury Securities
|
(In thousands)
|
Average Borrowed Funds
|
Interest Expense
|
Average Cost of Funds
|
Average One-Month LIBOR
|
Average Six-Month LIBOR
|
||||||||||||
|
For the year ended December 31, 2015
|
$
|
23,382
|
|
$
|
4
|
|
0.01
|
%
|
0.20
|
%
|
0.49
|
%
|
|||||
|
For the year ended December 31, 2014
|
$
|
129,944
|
|
$
|
(192
|
)
|
(0.15
|
)%
|
0.16
|
%
|
0.33
|
%
|
|||||
Total
|
(In thousands)
|
Average Borrowed Funds
|
Interest Expense
|
Average Cost of Funds
|
Average One-Month LIBOR
|
Average Six-Month LIBOR
|
||||||||||||
|
For the year ended December 31, 2015
|
$
|
1,410,938
|
|
$
|
11,011
|
|
0.78
|
%
|
0.20
|
%
|
0.49
|
%
|
|||||
|
For the year ended December 31, 2014
|
$
|
1,360,964
|
|
$
|
9,402
|
|
0.69
|
%
|
0.16
|
%
|
0.33
|
%
|
|||||
Among other instruments, we use interest rate swaps to hedge our portfolios against the risk of rising interest rates. If we were to include as a component of our cost of funds the actual and accrued periodic payments on our interest rate swaps used to hedge our yield-bearing targeted assets, our total average cost of funds would increase to 1.14% and 1.09% for the years ended December 31, 2015 and 2014, respectively. Our net interest margin, defined as the yield on our portfolio of yield-bearing targeted assets (See—Interest Income above), less our cost of funds (including actual and accrued periodic payments on interest rate swaps as described above) was 4.39% and 4.52% for the years ended December 31, 2015 and 2014, respectively. These metrics do not include amortization of upfront payments associated with certain of our interest rate swaps or the costs associated with other instruments that we use to hedge interest rate risk, such as TBAs and futures.
Incentive Fees
In addition to the base management fee, our Manager is also entitled to a quarterly incentive fee if our performance (as measured by adjusted net income, as defined in the management agreement) over the relevant rolling four quarter calculation period exceeds a defined return hurdle for the period. Incentive fee incurred for the year ended December 31, 2014 was $1.4 million. The return hurdle for the calculation period was based on a 9% annual rate. No incentive fee was incurred for the year ended December 31, 2015, since on a rolling four quarter basis, our income did not exceed the prescribed hurdle amount. Because our operating results can vary materially from one period to another, incentive fee expense can also be highly variable.
Other Investment Related Expenses
Other investment related expenses consist of servicing fees on our mortgage and consumer loans, as well as various other expenses and fees directly related to our financial assets. For the years ended December 31, 2015 and 2014 other investment
80
related expenses were $5.6 million and $4.7 million, respectively. The increase was primarily due to increased servicing fees and other expenses relating to our loan portfolios.
Other Operating Expenses
Other operating expenses consist of professional fees, compensation expense related to our dedicated or partially dedicated personnel, administration fees, share-based LTIP expense, insurance expense, and various other operating expenses necessary to run our business. Other operating expenses exclude management and incentive fees, interest expense, and other investment related expenses. Other operating expenses for the year ended December 31, 2015 were $9.2 million as compared to $8.3 million for the year ended December 31, 2014. The increase in our other operating expenses was primarily related to increased professional fees, administration fees, and compensation expense.
Net Realized and Unrealized Gains on Investments
During the year ended December 31, 2015, we had net realized and unrealized losses on investments of $22.5 million as compared to net realized and unrealized gains of $23.1 million for the year ended December 31, 2014. Net realized and unrealized losses on investments of $22.5 million for the year ended December 31, 2015 resulted principally from net realized and unrealized losses on distressed corporate debt, net short TBAs, Agency RMBS, CLOs, U.S. Treasury positions and CMBS, partially offset by net realized and unrealized gains on non-Agency RMBS, residential loans, REO, small balance commercial mortgage loans, and short equity positions. Our net short positions in TBAs and U.S. Treasury securities are used primarily to hedge interest rate and/or prepayment risk with respect to our investment holdings. During the year ended December 31, 2015 the fixed income market was subject to significant interest rate volatility and yield spread widening, leading to overall market value declines in many sectors, especially credit-sensitive sectors.
Net realized and unrealized gains on investments of $23.1 million for the year ended December 31, 2014 resulted principally from net realized and unrealized gains on Agency pass-throughs, non-Agency RMBS and CMBS, small balance commercial mortgage loans, non-performing and sub-performing residential whole loans, government debt, and short equities, partially offset by net realized and unrealized losses on our TBAs, and to a lesser degree, our other ABS and corporate debt.
Net Realized and Unrealized Gains and Losses on Financial Derivatives
During the year ended December 31, 2015, we had net realized and unrealized losses on our financial derivatives of $0.5 million as compared to net realized and unrealized losses of $19.5 million for the year ended December 31, 2014. Our financial derivatives consist of interest rate derivatives, which we use primarily to hedge interest rate risk, and of credit derivatives and total return swaps, both of which we use primarily to hedge credit risk, but also for non-hedging purposes. Non-hedging credit derivatives and total return swaps include both long and short positions. Our derivatives also include foreign currency forwards, which we use to hedge foreign currency risk. Our interest rate derivatives are primarily in the form of net short positions in interest rate swaps, short and/or long positions in Eurodollar futures and U.S. Treasury Note futures, as well as purchased and written swaptions. We also use certain non-derivative instruments, such as TBAs, U.S. Treasury securities and sovereign debt instruments, to hedge interest rate risk. Our credit hedges are principally in the form of credit default swaps where we have purchased credit protection on non-Agency MBS indices and individual MBS, as well as CDS on corporate bond indices and options on CDS on corporate bond indices. We also use total return swaps to take synthetic long or short positions in the equity of certain publicly traded mortgage-related or real estate-related corporate entities. We acquire certain of our distressed corporate loans synthetically, in the form of total return swaps. Net realized and unrealized losses of $0.5 million on our financial derivatives for the year ended December 31, 2015 resulted primarily from net losses related to our interest rate swaps, total return swaps, CDS on asset-backed indices, and CDS on individual RMBS, partially offset by net realized and unrealized gains on our options on CDS indices and currency forwards. Net gains on our currency forwards were largely offset by translation and transaction losses related to our non-dollar denominated European assets.
Net realized and unrealized losses on our financial derivatives of $19.5 million for the year ended December 31, 2014 resulted primarily from net losses related to our interest rate swaps, partially offset by net realized and unrealized gains on futures used for hedging interest rate risk, total return swaps primarily related to our equities trading strategy, and foreign currency forwards.
Liquidity and Capital Resources
Liquidity refers to our ability to meet our cash needs, including repaying our borrowings, funding and maintaining positions in MBS and other assets, making distributions in the form of dividends, and other general business needs. Our short-term (one year or less) and long-term liquidity requirements include acquisition costs for assets we acquire, payment of our base management fee and incentive fee, compliance with margin requirements under our repurchase agreements, or "repos," reverse repos, TBAs, and financial derivative contracts, repayment of reverse repo borrowings to the extent we are unable or
81
unwilling to extend our reverse repos, payment of our general operating expenses, and payment of our quarterly dividend. Our capital resources primarily include cash on hand, cash flow from our investments (including principal and interest payments received on our investments and proceeds from the sale of investments), borrowings under reverse repos, and proceeds from equity offerings. We expect that these sources of funds will be sufficient to meet our short-term and long-term liquidity needs.
The following summarizes our reverse repos:
|
Reverse Repurchase Agreements
|
||||||||
|
(In thousands)
|
Average Borrowed Funds During
the Period
|
Borrowed Funds Outstanding at End of the Period
|
||||||
|
Year Ended December 31, 2016
|
$
|
1,067,216
|
|
$
|
1,033,581
|
|
||
|
Year Ended December 31, 2015
|
$
|
1,410,938
|
|
$
|
1,174,189
|
|
||
The following summarizes our borrowings under reverse repos by remaining maturity:
|
(In thousands)
|
December 31, 2016
|
||||||
|
Remaining Days to Maturity
|
Outstanding Borrowings
|
%
|
|||||
|
30 Days or Less
|
$
|
506,002
|
|
49.0
|
%
|
||
|
31 - 60 Days
|
222,262
|
|
21.5
|
%
|
|||
|
61 - 90 Days
|
191,487
|
|
18.5
|
%
|
|||
|
91 - 120 Days
|
18,324
|
|
1.8
|
%
|
|||
|
121 - 150 Days
|
13,037
|
|
1.2
|
%
|
|||
|
151 - 180 Days
|
31,912
|
|
3.1
|
%
|
|||
|
181 - 360 Days
|
50,557
|
|
4.9
|
%
|
|||
|
$
|
1,033,581
|
|
100.0
|
%
|
|||
Reverse repos involving underlying investments that we sold prior to
December 31, 2016
, for settlement following
December 31, 2016
, are shown using their original maturity dates even though such reverse repos may be expected to be terminated early upon settlement of the sale of the underlying investment.
The amounts borrowed under our reverse repo agreements are generally subject to the application of "haircuts." A haircut is the percentage discount that a repo lender applies to the market value of an asset serving as collateral for a repo borrowing, for the purpose of determining whether such repo borrowing is adequately collateralized. As of
December 31, 2016
, the weighted average contractual haircut applicable to the assets that serve as collateral for our outstanding repo borrowings (excluding repo borrowings related to U.S. Treasury securities) was 29.6% with respect to Credit assets, 5.3% with respect to Agency RMBS assets, and 12.5% overall. As of December 31, 2015 these respective weighted average contractual haircuts were 32.8%, 5.3%, and 13.1%.
We expect to continue to borrow funds in the form of reverse repos as well as other similar types of financings. The terms of these borrowings under our master repurchase agreements generally conform to the terms in the standard master repurchase agreement as published by the Securities Industry and Financial Markets Association as to repayment and margin requirements. In addition, each lender may require that we include supplemental terms and conditions to the standard master repurchase agreement. Typical supplemental terms and conditions include the addition of or changes to provisions relating to margin calls, net asset value requirements, cross default provisions, certain key person events, changes in corporate structure, and requirements that all controversies related to the repurchase agreement be litigated in a particular jurisdiction. These provisions may differ for each of our lenders.
As of
December 31, 2016
and 2015, we had
$1.0 billion
and $1.2 billion, respectively, of borrowings outstanding under our reverse repos. As of
December 31, 2016
, the remaining terms on our reverse repos ranged from
3
days to
320
days, with a weighted average remaining term of
56
days. As of December 31, 2015, the remaining terms on our reverse repos ranged from
4
days to
666
days, with a weighted average remaining term of
100
days. Our reverse repo borrowings were with a total of
twenty-one
counterparties as of
December 31, 2016
and eighteen counterparties as of December 31, 2015. As of
December 31, 2016
and 2015, our reverse repos, excluding those on U.S. Treasury securities, had a weighted average borrowing rate of 1.32% and
0.97%
, respectively. As of
December 31, 2016
, our reverse repos had interest rates ranging from
0.60%
to
3.76%
. As of December 31, 2015, our reverse repos had interest rates ranging from
0.37%
to
2.92%
. Investments transferred as collateral under reverse repos had an aggregate estimated fair value of
$1.2 billion
and $1.4 billion as of
December 31, 2016
and 2015,
82
respectively. The interest rates of our reverse repos have historically moved in close relationship to short-term LIBOR rates, and in some cases are explicitly indexed to short-term LIBOR rates and reset accordingly. It is expected that amounts due upon maturity of our reverse repos will be funded primarily through the roll/re-initiation of reverse repos and, if we are unable or unwilling to roll/re-initiate our reverse repos, through free cash and proceeds from the sale of securities.
In addition to our borrowings under reverse repurchase agreements, in March 2016 we entered into a securitization transaction to finance certain of our commercial mortgage loans and REO which was accounted for as a collateralized borrowing. As of
December 31, 2016
we had outstanding borrowings in the amount of
$24.1 million
in connection with this securitization which is reflected under the caption "Securitized debt" on the Consolidated Statement of Assets, Liabilities, and Equity. As of
December 31, 2016
, the fair value of commercial mortgage loans and REO collateralizing this financing was
$42.0 million
. Interest accrues on this debt at a rate of LIBOR plus 3.25% and the debt has a maturity date of September 30, 2018. See Note 7 in the notes to our consolidated financial statements for further information on the Company's securitized debt.
The following table details total outstanding borrowings, average outstanding borrowings, and the maximum outstanding borrowings at any month end for each quarter under reverse repurchase agreements for the past twelve quarters:
|
Quarter Ended
|
Borrowings Outstanding at
Quarter End
|
Average
Borrowings Outstanding
|
Maximum Borrowings Outstanding at Any Month End
|
|||||||||
|
(In thousands)
|
||||||||||||
|
December 31, 2016
|
$
|
1,033,581
|
|
$
|
989,453
|
|
$
|
1,033,581
|
|
|||
|
September 30, 2016
|
983,814
|
|
1,044,621
|
|
1,081,484
|
|
||||||
|
June 30, 2016
|
1,070,105
|
|
1,124,885
|
|
1,160,096
|
|
||||||
|
March 31, 2016
|
1,149,064
|
|
1,158,155
|
|
1,205,385
|
|
||||||
|
December 31, 2015
(1)
|
1,174,189
|
|
1,335,360
|
|
1,401,378
|
|
||||||
|
September 30, 2015
|
1,372,794
|
|
1,378,821
|
|
1,386,610
|
|
||||||
|
June 30, 2015
|
1,360,408
|
|
1,427,369
|
|
1,497,281
|
|
||||||
|
March 31, 2015
|
1,396,112
|
|
1,505,226
|
|
1,554,589
|
|
||||||
|
December 31, 2014
|
1,669,433
|
|
1,882,629
|
|
1,889,410
|
|
||||||
|
September 30, 2014
|
1,395,132
|
|
1,214,553
|
|
1,395,132
|
|
||||||
|
June 30, 2014
|
1,188,831
|
|
1,172,898
|
|
1,190,258
|
|
||||||
|
March 31, 2014
|
1,175,907
|
|
1,167,542
|
|
1,175,907
|
|
||||||
|
(1)
|
Our outstanding borrowings as of December 31, 2015 declined relative to our average borrowings outstanding for the quarter ended December 31, 2015. In light of continued and anticipated significant market volatility, during the quarter ended December 31, 2015, we net sold Agency RMBS, thereby reducing our outstanding borrowings and increasing our cash holdings in order to be more defensively positioned.
|
Amount at risk represents the excess, if any, for each counterparty of the fair value of collateral held by such counterparty over the amounts outstanding under reverse repos. The following tables reflect counterparties for which the amounts at risk relating to our reverse repos was greater than 5% of total equity December 31, 2015. There were no amounts at risk relating to our reverse repos that were greater than 5% of total equity as of December 31, 2016.
December 31, 2015:
|
Counterparty
|
Amount at Risk
|
Weighted Average Remaining Days
to Maturity
|
Percentage of Equity
|
|||||
|
(In thousands)
|
||||||||
|
CS First Boston
|
$
|
52,463
|
|
143
|
7.1%
|
|||
|
Wells Fargo Bank, N.A.
|
$
|
45,147
|
|
501
|
6.1%
|
|||
Although we typically finance most of our holdings of Agency RMBS, as of
December 31, 2016
and 2015, we held unencumbered Agency pools, on a settlement date basis, in the amount of $40.0 million and $1.6 million, respectively.
We held cash and cash equivalents of approximately
$123.3 million
and
$183.9 million
as of
December 31, 2016
and 2015, respectively.
83
On March 6, 2017, our Board of Directors approved the adoption of a share repurchase program under which we are authorized to repurchase up to 1.7 million common shares. The program, which is open-ended in duration, allows us to make repurchases from time to time on the open market or in negotiated transactions. Repurchases are at our discretion, subject to applicable law, share availability, price and our financial performance, among other considerations. This program superseded the similar share repurchase program that had previously been adopted on August 3, 2015, which had also authorized the repurchase of 1.7 million common shares.
During the year ended
December 31, 2016
we repurchased 833,784 common shares at an average price per share of $16.82 and a total cost of $14.0 million. Since August 3, 2015 and through March 10, 2017 we repurchased an aggregate of 1,211,752 common shares under both of the share repurchase programs at a total cost of $20.5 million.
We may declare dividends based on, among other things, our earnings, our financial condition, our working capital needs, and new opportunities. Dividends are declared and paid on a quarterly basis in arrears. The declaration of dividends to our shareholders and the amount of such dividends are at the discretion of our Board of Directors. During the year ended
December 31, 2016
, we paid total dividends in the amount of
$65.1 million
related to the three month periods ended December 31, 2015, March 31, 2016, June 30, 2016, and September 30, 2016. In February 2017, our Board of Directors approved a dividend related to the fourth quarter of 2016 in the amount of $0.45 per share, or approximately $14.8 million, payable on March 15, 2017 to shareholders of record as of March 1, 2017. During the year ended
December 31, 2015
, we paid total dividends in the amount of
$83.5 million
related to the three month periods ended December 31, 2014, March 31, 2015, June 30, 2015, and September 30, 2015.
The following tables set forth the dividend distributions authorized by the Board of Directors payable to shareholders and LTIP holders for the periods indicated below:
Year Ended
December 31, 2016
|
(In thousands except per share amounts)
|
Dividend Per Share
|
Dividend Amount
|
Record Date
|
Payment Date
|
||||||
|
First Quarter
|
$0.50
|
$
|
16,744
|
|
June 1, 2016
|
June 15, 2016
|
||||
|
Second Quarter
|
$0.50
|
$
|
16,640
|
|
September 1, 2016
|
September 15, 2016
|
||||
|
Third Quarter
|
$0.45
|
$
|
14,892
|
|
December 1, 2016
|
December 15, 2016
|
||||
|
Fourth Quarter
|
$0.45
|
$
|
14,821
|
|
March 1, 2017
|
March 15, 2017
|
||||
Year Ended
December 31, 2015
|
(In thousands except per share amounts)
|
Dividend Per Share
|
Dividend Amount
|
Record Date
|
Payment Date
|
||||||
|
First Quarter
|
$0.65
|
$
|
22,159
|
|
June 1, 2015
|
June 15, 2015
|
||||
|
Second Quarter
|
$0.65
|
$
|
22,144
|
|
September 1, 2015
|
September 15, 2015
|
||||
|
Third Quarter
|
$0.50
|
$
|
16,998
|
|
December 1, 2015
|
December 15, 2015
|
||||
|
Fourth Quarter
|
$0.50
|
$
|
16,872
|
|
March 1, 2016
|
March 15, 2016
|
||||
For the year ended
December 31, 2016
, our operating activities provided net cash in the amount of
$69.7 million
, and our reverse repo activity used to finance many of our investments (including repayments, in conjunction with the sales of investments, of amounts borrowed under our reverse repo agreements) used net cash of
$92.1 million
. In addition we received proceeds from the issuance of securitized debt of
$40.9 million
less repayments of
$0.3 million
. Thus our operating activities, when combined with our reverse repo and securitized debt financings, provided net cash of
$18.2 million
for the year ended
December 31, 2016
. We also used
$65.1 million
to pay dividends,
$5.2 million
for distributions to non-controlling interests (our joint venture partners), and
$14.0 million
to repurchase common shares. In addition, contributions from non-controlling interests provided cash of
$5.6 million
. As a result there was a decrease in our cash holdings of
$60.6 million
from
$183.9 million
as of December 31, 2015 to
$123.3 million
as of
December 31, 2016
.
For the year ended
December 31, 2015
, our operating activities provided net cash of
$654.2 million
, and our reverse repo activity used to finance many of our investments (including repayments, in conjunction with the sales of investments, of amounts borrowed under our reverse repo agreements) used net cash of
$495.2 million
. Thus our operating activities, when combined with our reverse repo financings, provided net cash of
$159.0 million
for the year ended
December 31, 2015
. In addition, contributions from a non-controlling interest member provided cash of
$2.2 million
. We used
$83.5 million
to pay dividends,
$1.5 million
for distributions to a non-controlling interest (our joint venture partner),
$5.6 million
to repurchase common shares, and $0.8 million for other financing activities. As a result there was an increase in our cash holdings of
$69.8 million
from
$114.1 million
as of December 31, 2014 to
$183.9 million
as of
December 31, 2015
.
84
For the year ended December 31, 2014, our operating activities used net cash of $604.2 million. Our reverse repo activity used to finance many of our investments (including repayments, in conjunction with the sales of investments, of amounts borrowed under our reverse repo agreements) provided net cash of $433.3 million. Thus our operating activities, when combined with our reverse repo financings, used net cash of $170.9 million for the year ended December 31, 2014. In addition, we received proceeds from the issuance of common shares of $188.1 million, net of offering costs, and contributions from a non-controlling interest member provided cash of $1.8 million. We used $86.4 million to pay dividends, $1.7 million for distributions to a non-controlling interest (our joint venture partner), and $0.2 million for other financing activities. As a result there was a decrease in our cash holdings of $69.3 million from $183.5 million as of December 31, 2013 to $114.1 million as of December 31, 2014.
Based on our current portfolio, amount of free cash on hand, debt-to-equity ratio, and current and anticipated availability of credit, we believe that our capital resources will be sufficient to enable us to meet anticipated short-term and long-term liquidity requirements. However, the unexpected inability to finance our Agency RMBS portfolio would create a serious short-term strain on our liquidity and would require us to liquidate much of that portfolio, which in turn would require us to restructure our portfolio to maintain our exclusion from registration as an investment company under the Investment Company Act. Steep declines in the values of our Credit assets financed using reverse repos, or in the values of our derivative contracts, would result in margin calls that would significantly reduce our free cash position. Furthermore, a substantial increase in prepayment rates on our assets financed by reverse repos could cause a temporary liquidity shortfall, because we are generally required to post margin on such assets in proportion to the amount of the announced principal paydowns before the actual receipt of the cash from such principal paydowns. If our cash resources are at any time insufficient to satisfy our liquidity requirements, we may have to sell assets or issue debt or additional equity securities.
We are not required by our investment guidelines to maintain any specific debt-to-equity ratio, and we believe that the appropriate leverage for the particular assets we hold depends on the credit quality and risk of those assets, as well as the general availability and terms of stable and reliable financing for those assets.
Contractual Obligations and Commitments
We are a party to a management agreement with our Manager. Pursuant to that agreement, our Manager is entitled to receive a base management fee, an incentive fee, reimbursement of certain expenses and, in certain circumstances, a termination fee. Such fees and expenses do not have fixed and determinable payments. For a description of the management agreement provisions, see Note 7 of the notes to our consolidated financial statements.
The following table summarizes our contractual obligations at December 31, 2016:
|
(In thousands)
|
Less than One Year
|
1-3 Years
|
3-5 Years
|
More than
Five Years
|
Total
|
|||||||||||||||
|
Reverse repurchase agreements
|
$
|
1,033,581
|
|
$
|
—
|
|
$
|
—
|
|
$
|
—
|
|
$
|
1,033,581
|
|
|||||
|
Interest expense on repurchase agreements, based on rates at December 31, 2016
(1)
|
3,086
|
|
—
|
|
—
|
|
—
|
|
3,086
|
|
||||||||||
|
Securitized debt, based on rate at December 31, 2016
|
14,136
|
|
10,978
|
|
—
|
|
—
|
|
25,114
|
|
||||||||||
|
Payable for securities purchased and financial derivatives
|
85,168
|
|
—
|
|
—
|
|
—
|
|
85,168
|
|
||||||||||
|
Capital commitment to mortgage originator
(2)
|
10,000
|
|
—
|
|
—
|
|
—
|
|
10,000
|
|
||||||||||
|
Total
|
$
|
1,145,971
|
|
$
|
10,978
|
|
$
|
—
|
|
$
|
—
|
|
$
|
1,156,949
|
|
|||||
|
(1)
|
Includes accrued interest expense on repurchase agreements at December 31, 2016 of $1.5 million which is included in Interest payable on the Consolidated Balance Sheet.
|
|
(2)
|
See Note 15 of the notes to the consolidated financial statements for details.
|
The above table excludes our open ended commitment under a flow mortgage loan purchase and sale agreement to purchase eligible residential mortgage loans, to the extent they are originated in accordance with our specifications, which we may modify in our sole discretion. As of December 31, 2016, under this contract, we had a remaining commitment to purchase at least $100.8 million in principal balance of eligible residential mortgage loans. At December 31, 2016, in connection with such flow mortgage loan purchase and sale agreement we had outstanding mortgage loan purchase commitments with a principal amount of $20.6 million, which are included in our Consolidated Financial Statements on our Consolidated Statement of Assets, Liabilities, and Equity in Financial derivatives–liabilities, at fair value. The ultimate purchase is contingent upon successful loan closings in accordance with agreed-upon parameters.
85
We enter into reverse repos with third-party broker-dealers whereby we sell securities to such broker-dealers at agreed-upon purchase prices at the initiation of the reverse repos and agree to repurchase such securities at predetermined repurchase prices and termination dates, thus providing the broker-dealers with an implied interest rate on the funds initially transferred to us by the broker-dealers. We enter into repos with third-party broker-dealers whereby we purchase securities under agreements to resell at an agreed-upon price and date. In general, we most often enter into repo transactions in order to effectively borrow securities that we can then deliver to counterparties to whom we have made short sales of the same securities. The implied interest rates on the repos and reverse repos we enter into are based upon competitive market rates at the time of initiation. Repos and reverse repos that are conducted with the same counterparty may be reported on a net basis if they meet the requirements of ASC 210-20,
Balance Sheet, Offsetting
. See "—
Liquidity and Capital Resources
" for a summary of our borrowings on reverse repos. As of
December 31, 2016
and 2015 there were no repos or reverse repos reported on a net basis on the Consolidated Statement of Assets, Liabilities, and Equity.
As of
December 31, 2016
, we had an aggregate amount at risk under our reverse repos with twenty-one counterparties of approximately $161.1 million and as of December 31, 2015, we had an aggregate amount at risk under our reverse repos with nineteen counterparties of approximately $211.4 million. Amounts at risk represent the excess, if any, for each counterparty of the fair value of collateral held by such counterparty over the amounts outstanding under reverse repos. If the amounts outstanding under repos and reverse repos with a particular counterparty are greater than the collateral held by the counterparty, there is no amount at risk for the particular counterparty. Amount at risk as of
December 31, 2016
and 2015 does not include approximately $3.1 million and $4.9 million, respectively, of net accrued interest receivable, which is defined as accrued interest on securities held as collateral less interest payable on cash borrowed.
Our derivatives are predominantly subject to bilateral collateral arrangements or clearing in accordance with the Dodd-Frank Act. We may be required to deliver or receive cash or securities as collateral upon entering into derivative transactions. Changes in the relative value of derivative transactions may require us or the counterparty to post or receive additional collateral. Entering into derivative contracts involves market risk in excess of amounts recorded on our balance sheet. In the case of cleared derivatives, the clearinghouse becomes our counterparty and the Future Commission Merchant acts as an intermediary between us and the clearinghouse with respect to all facets of the related transaction, including the posting and receipt of required collateral.
As of
December 31, 2016
, we had an aggregate amount at risk under our derivative contracts with eighteen counterparties of approximately $42.5 million. We also had $7.6 million of initial margin for cleared OTC derivatives posted to central clearinghouses as of that date. As of December 31, 2015, we had an aggregate amount at risk under our derivatives contracts with nineteen counterparties of approximately $59.7 million. We also had $28.8 million of initial margin for cleared OTC derivatives posted to central clearinghouses as of that date. Amounts at risk under our derivatives contracts represent the excess, if any, for each counterparty of the fair value of our derivative contracts plus our collateral held directly by the counterparty less the counterparty's collateral held by us. If a particular counterparty's collateral held by us is greater than the aggregate fair value of the financial derivatives plus our collateral held directly by the counterparty, there is no amount at risk for the particular counterparty.
We are party to a tri-party collateral arrangement under one of our International Swaps and Derivatives Association, or "ISDA," trading agreements whereby a third party holds collateral posted by us. Pursuant to the terms of the arrangement, the third party must follow certain pre-defined actions prior to the release of the collateral to the counterparty or to us. Due from Brokers on the Consolidated Statement of Assets, Liabilities, and Equity includes, as of
December 31, 2016
and 2015, collateral posted by us and held by a third-party custodian in the amount of approximately $0.7 million and $2.6 million, respectively.
We purchase and sell TBAs and Agency pass-through certificates on a when-issued or delayed delivery basis. The delayed delivery for these securities means that these transactions are more prone to market fluctuations between the trade date and the ultimate settlement date, and thereby are more vulnerable, especially in the absence of margining arrangements with respect to these transactions, to increasing amounts at risk with the applicable counterparties. As of
December 31, 2016
, in connection with our forward settling TBA and Agency pass-through certificates, we had an aggregate amount at risk with five counterparties of approximately $1.7 million. As of December 31, 2015, in connection with our forward settling TBA and Agency pass-through certificates, we had an aggregate amount at risk with seven counterparties of approximately $1.3 million. Amounts at risk in connection with our forward settling TBA and Agency pass-through certificates represent the excess, if any, for each counterparty of the net fair value of the forward settling securities plus our collateral held directly by the counterparty less the counterparty's collateral held by us. If a particular counterparty's collateral held by us is greater than the aggregate fair value of the forward settling securities plus our collateral held directly by the counterparty, there is no amount at risk for the particular counterparty.
See Note 15 in the notes to our consolidated financial statements for further detail on our other contractual obligations
86
and commitments.
Off-Balance Sheet Arrangements
As of
December 31, 2016
, we did not have any material relationships with unconsolidated entities or financial partnerships, such as entities often referred to as structured finance or special purpose entities, which would have been established for the purpose of facilitating off-balance sheet arrangements or other contractually narrow or limited purposes. Further, we have not guaranteed any obligations of unconsolidated entities nor do we have any commitment to provide funding to any such entities that have or are reasonably likely to have a current or future effect on our financial condition, changes in financial condition, revenues or expenses, results of operations, liquidity, capital expenditures or resources that would be material to an investor in our securities. As such, we are not materially exposed to any market, credit, liquidity, or financing risk that could arise if we had engaged in such relationships. See Note 7 of the notes to our consolidated financial statements for further detail about a multi-seller consumer loan securitization transaction we entered into in August 2016.
At
December 31, 2016
the Company had not entered into any reverse repurchase agreements for which delivery of the borrowed funds is not scheduled until after year end.
Inflation
Virtually all of our assets and liabilities are interest rate sensitive in nature. As a result, interest rates and other factors influence our performance far more so than does inflation. Changes in interest rates do not necessarily correlate with inflation rates or changes in inflation rates. Our activities and balance sheet are measured with reference to historical cost and/or fair market value without considering inflation.
The primary components of our market risk at
December 31, 2016
are related to credit risk, prepayment risk, and interest rate risk. We seek to actively manage these and other risks and to acquire and hold assets that we believe justify bearing those risks, and to maintain capital levels consistent with those risks.
Credit Risk
We are subject to credit risk in connection with many of our assets, especially non-Agency MBS, mortgage loans, and consumer loans. Credit losses on real estate loans can occur for many reasons, including, but not limited to, poor origination practices, fraud, faulty appraisals, documentation errors, poor underwriting, legal errors, poor servicing practices, weak economic conditions, decline in the value of homes, businesses or commercial properties, special hazards, earthquakes and other natural events, over-leveraging of the borrower on a property, reduction in market rents and occupancies and poor property management services, changes in legal protections for lenders, reduction in personal income, job loss, and personal events such as divorce or health problems. Property values are subject to volatility and may be affected adversely by a number of factors, including, but not limited to, national, regional, and local economic conditions (which may be adversely affected by industry slowdowns and other factors), local real estate conditions (such as an oversupply of housing), changes or continued weakness in specific industry segments, construction quality, age and design, demographic factors, and retroactive changes to building or similar codes. The ability of borrowers to repay consumer loans may be adversely affected by numerous borrower-specific factors, including unemployment, divorce, major medical expenses or personal bankruptcy. General factors, including an economic downturn, high energy costs or acts of God or terrorism, may also affect the financial stability of borrowers and impair their ability or willingness to repay their loans. Whenever any of our consumer loans defaults, we are at risk of loss to the extent of any deficiency between the liquidation value of the collateral, if any, securing the loan, and the principal and accrued interest of the loan. Many of our consumer loans are unsecured, or are secured by collateral (such as an automobile) that depreciates rapidly; as a result, these loans may be at greater risk of loss than residential real estate loans.
Similarly, we are exposed to the risk of potential credit losses on other credit-related assets in our portfolio, including distressed corporate debt, CLOs, and investments in mortgage-related entities.
For many of our investments, the two primary components of credit risk are default risk and severity risk.
Default Risk
Default risk is the risk that borrowers will fail to make principal and interest payments on mortgage loans or other debt obligations. We may attempt to mitigate our default risk by, among other things, opportunistically entering into credit default swaps and total return swaps. These instruments can reference various MBS indices, corporate bond indices, or corporate entities, such as publicly traded REITs. We often rely on third-party servicers to mitigate our default risk, but such third-party servicers may have little or no economic incentive to mitigate loan default rates.
87
Severity Risk
Severity risk is the risk of loss upon a borrower default on a mortgage loan or other debt obligation. Severity risk includes the risk of loss of value of the property or other asset securing the mortgage loan or debt obligation, as well as the risk of loss associated with taking over the property or other asset, including foreclosure costs. We often rely on third-party servicers to mitigate our severity risk, but such third-party servicers may have little or no economic incentive to mitigate loan loss severities. In the case of mortgage loans, such mitigation efforts may include loan modification programs and prompt foreclosure and property liquidation following a default.
Prepayment Risk
Prepayment risk is the risk of change, whether an increase or a decrease, in the rate at which principal is returned in respect of fixed income assets in our portfolio, including both through voluntary prepayments and through liquidations due to defaults and foreclosures. Most significantly, our portfolio is exposed to the risk of changes in prepayment rates of mortgage loans underlying our RMBS, and changes in prepayment rates of certain of our consumer loan holdings. This rate of prepayment is affected by a variety of factors, including the prevailing level of interest rates as well as economic, demographic, tax, social, legal, and other factors. Changes in prepayment rates will have varying effects on the different types of securities in our portfolio, and we attempt to take these effects into account in making asset management decisions. Additionally, increases in prepayment rates may cause us to experience losses on our interest only securities and inverse interest only securities, as those securities are extremely sensitive to prepayment rates. Prepayment rates, besides being subject to interest rates and borrower behavior, are also substantially affected by government policy and regulation. For example, the government sponsored HARP program, which was designed to encourage mortgage refinancings, continues to be a factor in prepayment risk, and could become a bigger factor if eligibility requirements are expanded or qualification processes are streamlined. Mortgage rates remain very low by historical standards, and as a result, prepayments continue to represent a meaningful risk, especially with respect to our Agency RMBS.
Interest Rate Risk
Interest rates are highly sensitive to many factors, including governmental monetary and tax policies, domestic and international economic and political considerations, and other factors beyond our control. We are subject to interest rate risk in connection with most of our assets and liabilities. For some securities in our portfolio, the coupon interest rates on, and therefore also the values of, such securities are highly sensitive to interest rate movements, such as inverse floating rate RMBS, which benefit from falling interest rates. We selectively hedge our interest rate risk by entering into interest rate swaps, TBAs, U.S. Treasury securities, Eurodollar futures, U.S. Treasury futures, and other instruments. In general, such hedging instruments are used to offset the large majority of the interest rate risk we estimate to arise from our Agency RMBS positions. Hedging instruments may also be used to offset a portion of the interest rate risk arising from certain non-Agency MBS positions.
88
The following sensitivity analysis table shows the estimated impact on the value of our portfolio segregated by certain identified categories as of
December 31, 2016
, assuming a static portfolio and immediate and parallel shifts in interest rates from current levels as indicated below.
|
(In thousands)
|
Estimated Change for a Decrease in Interest Rates by
|
Estimated Change for an Increase in Interest Rates by
|
||||||||||||||||||||||||||
|
50 Basis Points
|
100 Basis Points
|
50 Basis Points
|
100 Basis Points
|
|||||||||||||||||||||||||
|
Category of Instruments
|
Market Value
|
% of Total Equity
|
Market Value
|
% of Total Equity
|
Market Value
|
% of Total Equity
|
Market Value
|
% of Total Equity
|
||||||||||||||||||||
|
Agency RMBS
|
$
|
7,877
|
|
1.22
|
%
|
$
|
13,779
|
|
2.14
|
%
|
$
|
(9,852
|
)
|
(1.53
|
)%
|
$
|
(21,679
|
)
|
(3.36
|
)%
|
||||||||
|
Non-Agency RMBS, CMBS, Other ABS, and Mortgage Loans
|
3,596
|
|
0.56
|
%
|
8,760
|
|
1.36
|
%
|
(2,029
|
)
|
(0.31
|
)%
|
(2,491
|
)
|
(0.39
|
)%
|
||||||||||||
|
U.S. Treasury Securities, and Interest Rate Swaps, Options, and Futures
|
(9,744
|
)
|
(1.51
|
)%
|
(19,883
|
)
|
(3.08
|
)%
|
9,349
|
|
1.45
|
%
|
18,302
|
|
2.84
|
%
|
||||||||||||
|
Mortgage-Related Derivatives
|
28
|
|
—
|
%
|
44
|
|
—
|
%
|
(38
|
)
|
(0.01
|
)%
|
(88
|
)
|
(0.01
|
)%
|
||||||||||||
|
Corporate Securities and Derivatives on Corporate Securities
|
(435
|
)
|
(0.07
|
)%
|
(858
|
)
|
(0.13
|
)%
|
446
|
|
0.07
|
%
|
904
|
|
0.14
|
%
|
||||||||||||
|
Repurchase Agreements and Reverse Repurchase Agreements
|
(554
|
)
|
(0.08
|
)%
|
(1,029
|
)
|
(0.16
|
)%
|
544
|
|
0.08
|
%
|
1,089
|
|
0.17
|
%
|
||||||||||||
|
Total
|
$
|
768
|
|
0.12
|
%
|
$
|
813
|
|
0.13
|
%
|
$
|
(1,580
|
)
|
(0.25
|
)%
|
$
|
(3,963
|
)
|
(0.61
|
)%
|
||||||||
The preceding analysis does not show sensitivity to changes in interest rates for instruments for which we believe that the effect of a change in interest rates is not material to the value of the overall portfolio and/or cannot be accurately estimated. In particular, this analysis excludes certain of our holdings of corporate securities and derivatives on corporate securities, and reflects only sensitivity to U.S. interest rates.
Our analysis of interest rate risk is derived from Ellington's proprietary models as well as third-party information and analytics. Many assumptions have been made in connection with the calculations set forth in the table above and, as such, there can be no assurance that assumed events will occur or that other events will not occur that would affect the outcomes. For example, for each hypothetical immediate shift in interest rates, assumptions have been made as to the response of mortgage prepayment rates, the shape of the yield curve, and market volatilities of interest rates; each of the foregoing factors can significantly and adversely affect the fair value of our interest rate-sensitive instruments.
The above analysis utilizes assumptions and estimates based on management's judgment and experience, and relies on financial models, which are inherently imperfect; in fact, different models can produce different results for the same securities. While the table above reflects the estimated impacts of immediate parallel interest rate increases and decreases on specific categories of instruments in our portfolio, we actively trade many of the instruments in our portfolio, and therefore our current or future portfolios may have risks that differ significantly from those of our
December 31, 2016
portfolio estimated above. Moreover, the impact of changing interest rates on fair value can change significantly when interest rates change by a greater amount than the hypothetical shifts assumed above. Furthermore, our portfolio is subject to many risks other than interest rate risks, and these additional risks may or may not be correlated with changes in interest rates. For all of the foregoing reasons and others, the table above is for illustrative purposes only and actual changes in interest rates would likely cause changes in the actual fair value of our portfolio that would differ from those presented above, and such differences might be significant and adverse. See "
Management's Discussion and Analysis of Financial Condition and Results of Operations—Special Note Regarding Forward-Looking Statements.
"
89
INDEX TO CONSOLIDATED FINANCIAL STATEMENTS
|
Page
|
||
|
CONSOLIDATED FINANCIAL STATEMENTS AS OF DECEMBER 31, 2016 AND 2015, AND FOR THE YEARS ENDED DECEMBER 31, 2016, 2015, AND 2014
|
||
90
Report of Independent Registered Public Accounting Firm
To the Board of Directors and Shareholders of Ellington Financial LLC
In our opinion, the accompanying consolidated statements of assets, liabilities, and equity, including the consolidated condensed schedules of investments, and the related consolidated statements of operations, of changes in equity and of cash flows present fairly, in all material respects, the financial position of Ellington Financial LLC and its subsidiaries (the "Company") at
December 31, 2016
and December 31, 2015, and the results of their operations and their cash flows for each of the three years in the period ended December 31, 2016
in conformity with accounting principles generally accepted in the United States of America. Also in our opinion, the Company maintained, in all material respects, effective internal control over financial reporting as of December 31, 2016, based on criteria established in
Internal Control - Integrated Framework (2013)
issued by the Committee of Sponsoring Organizations of the Treadway Commission (COSO). The Company's management is responsible for these financial statements, for maintaining effective internal control over financial reporting and for its assessment of the effectiveness of internal control over financial reporting, included in Management's Report on Internal Control over Financial Reporting appearing under Item 9A. Our responsibility is to express opinions on these financial statements and on the Company's internal control over financial reporting based on our integrated audits. We conducted our audits in accordance with the standards of the Public Company Accounting Oversight Board (United States). Those standards require that we plan and perform the audits to obtain reasonable assurance about whether the financial statements are free of material misstatement and whether effective internal control over financial reporting was maintained in all material respects. Our audits of the financial statements included examining, on a test basis, evidence supporting the amounts and disclosures in the financial statements, assessing the accounting principles used and significant estimates made by management, and evaluating the overall financial statement presentation. Our audit of internal control over financial reporting included obtaining an understanding of internal control over financial reporting, assessing the risk that a material weakness exists, and testing and evaluating the design and operating effectiveness of internal control based on the assessed risk. Our audits also included performing such other procedures as we considered necessary in the circumstances. We believe that our audits provide a reasonable basis for our opinions.
A company's internal control over financial reporting is a process designed to provide reasonable assurance regarding the reliability of financial reporting and the preparation of financial statements for external purposes in accordance with generally accepted accounting principles. A company's internal control over financial reporting includes those policies and procedures that (i) pertain to the maintenance of records that, in reasonable detail, accurately and fairly reflect the transactions and dispositions of the assets of the company; (ii) provide reasonable assurance that transactions are recorded as necessary to permit preparation of financial statements in accordance with generally accepted accounting principles, and that receipts and expenditures of the company are being made only in accordance with authorizations of management and directors of the company; and (iii) provide reasonable assurance regarding prevention or timely detection of unauthorized acquisition, use, or disposition of the company's assets that could have a material effect on the financial statements.
Because of its inherent limitations, internal control over financial reporting may not prevent or detect misstatements. Also, projections of any evaluation of effectiveness to future periods are subject to the risk that controls may become inadequate because of changes in conditions, or that the degree of compliance with the policies or procedures may deteriorate.
/s/ PricewaterhouseCoopers LLP
New York, NY
March 16, 2017
91
ELLINGTON FINANCIAL LLC
CONSOLIDATED STATEMENT OF ASSETS, LIABILITIES, AND EQUITY
|
December 31,
2016 |
December 31,
2015 |
||||||
|
(In thousands except share amounts)
|
Expressed in U.S. Dollars
|
||||||
|
ASSETS
|
|||||||
|
Cash and cash equivalents
|
$
|
123,274
|
|
$
|
183,909
|
|
|
|
Restricted cash
|
655
|
|
4,857
|
|
|||
|
Investments, financial derivatives, and repurchase agreements:
|
|||||||
|
Investments, at fair value (Cost – $1,525,710 and $1,672,400)
|
1,505,026
|
|
1,661,118
|
|
|||
|
Financial derivatives–assets, at fair value (Net cost – $40,724 and $163,943)
|
35,595
|
|
162,905
|
|
|||
|
Repurchase agreements, at fair value (Cost – $185,205 and $105,329)
|
184,819
|
|
105,700
|
|
|||
|
Total investments, financial derivatives, and repurchase agreements
|
1,725,440
|
|
1,929,723
|
|
|||
|
Due from brokers
|
93,651
|
|
141,605
|
|
|||
|
Receivable for securities sold and financial derivatives
|
445,112
|
|
705,748
|
|
|||
|
Interest and principal receivable
|
21,704
|
|
20,444
|
|
|||
|
Other assets
|
3,359
|
|
5,269
|
|
|||
|
Total Assets
|
$
|
2,413,195
|
|
$
|
2,991,555
|
|
|
|
LIABILITIES
|
|||||||
|
Investments and financial derivatives:
|
|||||||
|
Investments sold short, at fair value (Proceeds – $589,429 and $731,048)
|
$
|
584,896
|
|
$
|
728,747
|
|
|
|
Financial derivatives–liabilities, at fair value (Net proceeds – $12,012 and $56,200)
|
18,687
|
|
60,472
|
|
|||
|
Total investments and financial derivatives
|
603,583
|
|
789,219
|
|
|||
|
Reverse repurchase agreements
|
1,033,581
|
|
1,174,189
|
|
|||
|
Due to brokers
|
12,780
|
|
114,797
|
|
|||
|
Payable for securities purchased and financial derivatives
|
85,168
|
|
165,365
|
|
|||
|
Securitized debt (Proceeds – $24,086 and $0)
|
24,086
|
|
—
|
|
|||
|
Accounts payable and accrued expenses
|
3,327
|
|
3,626
|
|
|||
|
Base management fee payable
|
2,416
|
|
2,773
|
|
|||
|
Interest and dividends payable
|
3,460
|
|
1,806
|
|
|||
|
Other liabilities
|
17
|
|
828
|
|
|||
|
Total Liabilities
|
1,768,418
|
|
2,252,603
|
|
|||
|
EQUITY
|
644,777
|
|
738,952
|
|
|||
|
TOTAL LIABILITIES AND EQUITY
|
$
|
2,413,195
|
|
$
|
2,991,555
|
|
|
|
Commitments and contingencies (Note 15)
|
|
|
|||||
|
ANALYSIS OF EQUITY:
|
|||||||
|
Common shares, no par value, 100,000,000 shares authorized;
|
|||||||
|
(32,294,703 and 33,126,012 shares issued and outstanding)
|
$
|
627,620
|
|
$
|
722,360
|
|
|
|
Additional paid-in capital – LTIP Units
|
10,041
|
|
9,689
|
|
|||
|
Total Shareholders' Equity
|
637,661
|
|
732,049
|
|
|||
|
Non-controlling interests
|
7,116
|
|
6,903
|
|
|||
|
Total Equity
|
$
|
644,777
|
|
$
|
738,952
|
|
|
|
PER SHARE INFORMATION:
|
|||||||
|
Common shares
|
$
|
19.75
|
|
$
|
22.10
|
|
|
See Notes to the Consolidated Financial Statements
92
ELLINGTON FINANCIAL LLC
CONSOLIDATED CONDENSED SCHEDULE OF INVESTMENTS
AT DECEMBER 31, 2016
|
Current Principal/Number of Shares
|
Description
|
Rate
|
Maturity
|
Fair Value
|
|||||||
|
(In thousands)
|
|
|
|
Expressed in U.S.
Dollars
|
|||||||
|
Cash Equivalents—Money Market Funds (13.96%) (a) (b)
|
|||||||||||
|
North America
|
|||||||||||
|
Funds
|
|||||||||||
|
50,000
|
|
BlackRock Liquidity Funds FedFund Portfolio, Institutional Class Shares
|
0.42%
|
$
|
50,000
|
|
|||||
|
40,000
|
|
Various Money Market Funds
|
0.44% - 0.45%
|
40,000
|
|
||||||
|
Total Cash Equivalents—Money Market Funds (Cost $90,000)
|
$
|
90,000
|
|
||||||||
|
Long Investments (233.42%) (a) (b) (ad)
|
||||||||||||
|
Mortgage-Backed Securities (168.25%)
|
||||||||||||
|
Agency Securities (139.27%) (c)
|
||||||||||||
|
Fixed Rate Agency Securities (134.44%)
|
||||||||||||
|
Principal and Interest - Fixed Rate Agency Securities (121.61%)
|
||||||||||||
|
North America
|
||||||||||||
|
Mortgage-related—Residential
|
||||||||||||
|
$
|
147,479
|
|
Federal National Mortgage Association Pools (30 Year)
|
4.00%
|
2/42 - 1/47
|
$
|
156,144
|
|
||||
|
121,756
|
|
Federal Home Loan Mortgage Corporation Pools (30 Year)
|
4.00%
|
8/43 - 1/47
|
128,798
|
|
||||||
|
67,681
|
|
Federal National Mortgage Association Pools (30 Year)
|
4.50%
|
10/41 - 3/46
|
73,305
|
|
||||||
|
58,682
|
|
Federal National Mortgage Association Pools (30 Year)
|
3.50%
|
3/43 - 1/47
|
60,451
|
|
||||||
|
51,402
|
|
Federal National Mortgage Association Pools (15 Year)
|
3.50%
|
3/28 - 11/31
|
54,019
|
|
||||||
|
44,796
|
|
Federal National Mortgage Association Pools (30 Year)
|
5.00%
|
10/35 - 12/44
|
49,062
|
|
||||||
|
40,722
|
|
Federal Home Loan Mortgage Corporation Pools (30 Year)
|
4.50%
|
9/43 - 9/46
|
44,010
|
|
||||||
|
25,244
|
|
Federal Home Loan Mortgage Corporation Pools (30 Year)
|
3.50%
|
1/42 - 1/47
|
25,993
|
|
||||||
|
21,855
|
|
Government National Mortgage Association Pools (30 Year)
|
4.00%
|
6/45 - 12/46
|
23,346
|
|
||||||
|
22,073
|
|
Federal National Mortgage Association Pools (15 Year)
|
3.00%
|
4/30 - 1/32
|
22,730
|
|
||||||
|
10,504
|
|
Government National Mortgage Association Pools (Other)
|
4.60%
|
12/63 - 11/64
|
11,351
|
|
||||||
|
9,968
|
|
Federal National Mortgage Association Pools (15 Year)
|
4.00%
|
6/26 - 5/31
|
10,596
|
|
||||||
|
10,120
|
|
Federal Home Loan Mortgage Corporation Pools (Other)
|
3.50%
|
2/30 - 9/46
|
10,379
|
|
||||||
|
9,219
|
|
Federal Home Loan Mortgage Corporation Pools (15 Year)
|
3.50%
|
9/28 - 9/30
|
9,686
|
|
||||||
|
6,714
|
|
Federal National Mortgage Association Pools (Other)
|
5.00%
|
9/43 - 1/44
|
7,408
|
|
||||||
|
6,568
|
|
Government National Mortgage Association Pools (30 Year)
|
4.50%
|
8/45 - 9/46
|
7,099
|
|
||||||
|
6,200
|
|
Government National Mortgage Association Pools (Other)
|
4.68%
|
11/63 - 9/64
|
6,703
|
|
||||||
|
6,231
|
|
Government National Mortgage Association Pools (30 Year)
|
3.50%
|
2/46 - 12/46
|
6,513
|
|
||||||
|
5,219
|
|
Government National Mortgage Association Pools (Other)
|
4.55%
|
1/65
|
5,648
|
|
||||||
|
4,942
|
|
Government National Mortgage Association Pools (Other)
|
4.44%
|
11/66
|
5,383
|
|
||||||
|
3,892
|
|
Government National Mortgage Association Pools (Other)
|
4.61%
|
11/64
|
4,216
|
|
||||||
|
3,619
|
|
Federal National Mortgage Association Pools (15 Year)
|
4.50%
|
4/26
|
3,905
|
|
||||||
|
3,518
|
|
Government National Mortgage Association Pools (Other)
|
4.42%
|
7/61
|
3,741
|
|
||||||
|
3,513
|
|
Government National Mortgage Association Pools (30 Year)
|
2.50%
|
10/46
|
3,414
|
|
||||||
|
3,123
|
|
Government National Mortgage Association Pools (Other)
|
4.48%
|
11/64
|
3,361
|
|
||||||
|
3,043
|
|
Government National Mortgage Association Pools (Other)
|
4.62%
|
10/64
|
3,303
|
|
||||||
|
2,896
|
|
Federal National Mortgage Association Pools (30 Year)
|
5.50%
|
10/39
|
3,216
|
|
||||||
|
2,945
|
|
Government National Mortgage Association Pools (Other)
|
4.57%
|
1/65
|
3,186
|
|
||||||
|
3,030
|
|
Federal Home Loan Mortgage Corporation Pools (15 Year)
|
3.00%
|
4/30
|
3,119
|
|
||||||
See Notes to Consolidated Financial Statements
93
ELLINGTON FINANCIAL LLC
CONSOLIDATED CONDENSED SCHEDULE OF INVESTMENTS
AT DECEMBER 31, 2016 (CONTINUED)
|
Current Principal/Notional Value
|
Description
|
Rate
|
Maturity
|
Fair Value
|
||||||||
|
(In thousands)
|
|
|
|
Expressed in U.S.
Dollars
|
||||||||
|
(continued)
|
||||||||||||
|
$
|
3,030
|
|
Federal Home Loan Mortgage Corporation Pools (Other)
|
3.00%
|
6/28 - 3/30
|
$
|
3,109
|
|
||||
|
2,726
|
|
Federal Home Loan Mortgage Corporation Pools (Other)
|
4.50%
|
5/44
|
2,968
|
|
||||||
|
2,459
|
|
Government National Mortgage Association Pools (Other)
|
4.64%
|
3/65
|
2,672
|
|
||||||
|
2,433
|
|
Government National Mortgage Association Pools (Other)
|
5.49%
|
4/60
|
2,551
|
|
||||||
|
2,195
|
|
Federal National Mortgage Association Pools (30 Year)
|
3.00%
|
1/42 - 6/45
|
2,193
|
|
||||||
|
2,043
|
|
Federal National Mortgage Association Pools (20 Year)
|
4.00%
|
12/33
|
2,172
|
|
||||||
|
1,943
|
|
Government National Mortgage Association Pools (Other)
|
4.63%
|
6/64
|
2,103
|
|
||||||
|
1,793
|
|
Federal National Mortgage Association Pools (30 Year)
|
6.00%
|
9/39 - 2/40
|
2,049
|
|
||||||
|
1,916
|
|
Government National Mortgage Association Pools (Other)
|
5.51%
|
2/60
|
2,016
|
|
||||||
|
1,734
|
|
Federal Home Loan Mortgage Corporation Pools (15 Year)
|
4.00%
|
2/29
|
1,842
|
|
||||||
|
1,675
|
|
Government National Mortgage Association Pools (Other)
|
5.57%
|
2/60
|
1,756
|
|
||||||
|
1,689
|
|
Government National Mortgage Association Pools (Other)
|
3.00%
|
5/30 - 6/30
|
1,694
|
|
||||||
|
1,369
|
|
Federal Home Loan Mortgage Corporation Pools (30 Year)
|
6.00%
|
4/39 - 5/40
|
1,553
|
|
||||||
|
1,523
|
|
Federal Home Loan Mortgage Corporation Pools (30 Year)
|
3.00%
|
7/43 - 10/45
|
1,518
|
|
||||||
|
1,275
|
|
Federal National Mortgage Association Pools (Other)
|
3.00%
|
6/43
|
1,258
|
|
||||||
|
1,156
|
|
Federal Home Loan Mortgage Corporation Pools (20 Year)
|
4.50%
|
12/33
|
1,254
|
|
||||||
|
496
|
|
Federal Home Loan Mortgage Corporation Pools (30 Year)
|
5.50%
|
8/33
|
551
|
|
||||||
|
498
|
|
Federal Home Loan Mortgage Corporation Pools (30 Year)
|
5.00%
|
7/44
|
543
|
|
||||||
|
165
|
|
Government National Mortgage Association Pools (Other)
|
3.50%
|
10/30
|
168
|
|
||||||
|
75
|
|
Federal National Mortgage Association Pools (Other)
|
4.00%
|
6/37
|
77
|
|
||||||
|
784,132
|
|
|||||||||||
|
Interest Only - Fixed Rate Agency Securities (1.89%)
|
||||||||||||
|
North America
|
||||||||||||
|
Mortgage-related—Residential
|
||||||||||||
|
26,883
|
|
Government National Mortgage Association
|
4.00%
|
2/45 - 6/45
|
4,547
|
|
||||||
|
9,820
|
|
Federal National Mortgage Association
|
4.50%
|
12/20 - 6/44
|
1,414
|
|
||||||
|
6,303
|
|
Government National Mortgage Association
|
5.50%
|
11/43
|
1,137
|
|
||||||
|
5,099
|
|
Federal Home Loan Mortgage Corporation
|
3.50%
|
12/32
|
808
|
|
||||||
|
6,695
|
|
Federal National Mortgage Association
|
5.00%
|
1/38 - 5/40
|
806
|
|
||||||
|
5,354
|
|
Federal National Mortgage Association
|
4.00%
|
5/39 - 11/43
|
648
|
|
||||||
|
3,844
|
|
Government National Mortgage Association
|
4.50%
|
2/41
|
615
|
|
||||||
|
2,661
|
|
Federal National Mortgage Association
|
6.00%
|
1/40
|
512
|
|
||||||
|
81,664
|
|
Government National Mortgage Association
|
0.26%
|
6/40
|
472
|
|
||||||
|
3,167
|
|
Federal National Mortgage Association
|
3.00%
|
9/41
|
321
|
|
||||||
|
1,123
|
|
Government National Mortgage Association
|
6.00%
|
6/38
|
263
|
|
||||||
|
1,396
|
|
Government National Mortgage Association
|
4.75%
|
7/40
|
253
|
|
||||||
|
1,201
|
|
Federal National Mortgage Association
|
5.50%
|
10/40
|
163
|
|
||||||
|
2,289
|
|
Government National Mortgage Association
|
5.00%
|
5/37
|
151
|
|
||||||
|
763
|
|
Federal Home Loan Mortgage Corporation
|
5.50%
|
1/39
|
79
|
|
||||||
|
12,189
|
|
|||||||||||
See Notes to Consolidated Financial Statements
94
ELLINGTON FINANCIAL LLC
CONSOLIDATED CONDENSED SCHEDULE OF INVESTMENTS
AT DECEMBER 31, 2016 (CONTINUED)
|
Current Principal/Notional Value
|
Description
|
Rate
|
Maturity
|
Fair Value
|
||||||||
|
(In thousands)
|
|
|
|
Expressed in U.S.
Dollars
|
||||||||
|
TBA - Fixed Rate Agency Securities (10.94%)
|
||||||||||||
|
North America
|
||||||||||||
|
Mortgage-related—Residential
|
||||||||||||
|
$
|
28,560
|
|
Federal Home Loan Mortgage Corporation (30 Year)
|
3.50%
|
1/17
|
$
|
29,247
|
|
||||
|
24,540
|
|
Government National Mortgage Association (30 Year)
|
4.00%
|
1/17
|
26,047
|
|
||||||
|
14,620
|
|
Federal National Mortgage Association (15 Year)
|
3.50%
|
1/17
|
15,231
|
|
||||||
|
70,525
|
|
|||||||||||
|
Total Fixed Rate Agency Securities (Cost $869,071)
|
866,846
|
|
||||||||||
|
Floating Rate Agency Securities (4.83%)
|
||||||||||||
|
Principal and Interest - Floating Rate Agency Securities (2.12%)
|
||||||||||||
|
North America
|
||||||||||||
|
Mortgage-related—Residential
|
||||||||||||
|
5,876
|
|
Federal National Mortgage Association Pools
|
2.55% - 5.94%
|
9/35 - 5/45
|
6,129
|
|
||||||
|
5,122
|
|
Federal Home Loan Mortgage Corporation Pools
|
3.12% - 5.97%
|
6/37 - 5/44
|
5,328
|
|
||||||
|
2,097
|
|
Government National Mortgage Association Pools
|
2.89%
|
11/64
|
2,231
|
|
||||||
|
13,688
|
|
|||||||||||
|
Interest Only - Floating Rate Agency Securities (2.71%)
|
||||||||||||
|
North America
|
||||||||||||
|
Mortgage-related—Residential
|
||||||||||||
|
228,955
|
|
Other Government National Mortgage Association
|
0.40% - 6.09%
|
5/37 - 11/64
|
13,831
|
|
||||||
|
12,928
|
|
Other Federal National Mortgage Association
|
5.39% - 6.79%
|
6/33 - 12/41
|
1,867
|
|
||||||
|
15,902
|
|
Resecuritization of Government National Mortgage Association (d)
|
3.95%
|
8/60
|
870
|
|
||||||
|
5,182
|
|
Other Federal Home Loan Mortgage Corporation
|
5.30% - 5.93%
|
3/36 - 8/39
|
865
|
|
||||||
|
17,433
|
|
|||||||||||
|
Total Floating Rate Agency Securities (Cost $31,069)
|
31,121
|
|
||||||||||
|
Total Agency Securities (Cost $900,140)
|
897,967
|
|
||||||||||
|
Private Label Securities (28.98%)
|
||||||||||||
|
Principal and Interest - Private Label Securities (28.17%)
|
||||||||||||
|
North America (20.48%)
|
||||||||||||
|
Mortgage-related—Residential
|
||||||||||||
|
233,890
|
|
Various
|
0.00% - 9.35%
|
5/19 - 9/46
|
101,737
|
|
||||||
|
Mortgage-related—Commercial
|
||||||||||||
|
119,636
|
|
Various
|
2.31% - 4.41%
|
7/45 - 12/49
|
30,334
|
|
||||||
|
Total North America (Cost $125,106)
|
132,071
|
|
||||||||||
|
Europe (7.69%)
|
||||||||||||
|
Mortgage-related—Residential
|
||||||||||||
|
63,244
|
|
Various
|
0.00% - 5.15%
|
6/25 - 3/40
|
40,898
|
|
||||||
|
Mortgage-related—Commercial
|
||||||||||||
|
9,361
|
|
Various
|
0.00% - 11.00%
|
6/17 - 2/39
|
8,680
|
|
||||||
|
Total Europe (Cost $59,311)
|
49,578
|
|
||||||||||
|
Total Principal and Interest - Private Label Securities (Cost $184,417)
|
181,649
|
|
||||||||||
See Notes to Consolidated Financial Statements
95
ELLINGTON FINANCIAL LLC
CONSOLIDATED CONDENSED SCHEDULE OF INVESTMENTS
AT DECEMBER 31, 2016 (CONTINUED)
|
Current Principal/Notional Value
|
Description
|
Rate
|
Maturity
|
Fair Value
|
||||||||
|
(In thousands)
|
|
|
|
Expressed in U.S.
Dollars
|
||||||||
|
Interest Only - Private Label Securities (0.81%)
|
||||||||||||
|
North America
|
||||||||||||
|
Mortgage-related—Residential
|
||||||||||||
|
$
|
36,498
|
|
Various
|
0.50% - 2.00%
|
6/44 - 9/47
|
$
|
973
|
|
||||
|
Mortgage-related—Commercial
|
||||||||||||
|
72,535
|
|
Various
|
1.25% - 2.71%
|
10/47 - 12/49
|
4,254
|
|
||||||
|
Total Interest Only - Private Label Securities (Cost $4,963)
|
5,227
|
|
||||||||||
|
Other Private Label Securities (0.00%)
|
||||||||||||
|
North America
|
||||||||||||
|
Mortgage-related—Residential
|
||||||||||||
|
90,639
|
|
Various
|
—%
|
6/37
|
—
|
|
||||||
|
Mortgage-related—Commercial
|
||||||||||||
|
—
|
|
Various
|
—%
|
7/45 - 12/49
|
—
|
|
||||||
|
Total Other Private Label Securities (Cost $245)
|
—
|
|
||||||||||
|
Total Private Label Securities (Cost $189,625)
|
186,876
|
|
||||||||||
|
Total Mortgage-Backed Securities (Cost $1,089,765)
|
1,084,843
|
|
||||||||||
|
Collateralized Loan Obligations (6.97%)
|
||||||||||||
|
North America (3.49%)
|
||||||||||||
|
69,917
|
|
Various
|
0.00% - 7.88%
|
11/17 - 6/24
|
22,519
|
|
||||||
|
Total North America (Cost $25,860)
|
22,519
|
|
||||||||||
|
Europe (3.48%)
|
||||||||||||
|
28,053
|
|
Various
|
0.00% - 3.84%
|
1/22 - 3/25
|
22,437
|
|
||||||
|
Total Europe (Cost $23,227)
|
22,437
|
|
||||||||||
|
Total Collateralized Loan Obligations (Cost $49,087)
|
44,956
|
|
||||||||||
|
Consumer Loans and Asset-backed Securities backed by Consumer Loans (17.76%) (e)
|
||||||||||||
|
North America (17.28%)
|
||||||||||||
|
Consumer (f) (g) (h)
|
||||||||||||
|
103,536
|
|
Various
|
5.31% - 60.28%
|
1/17 - 12/21
|
111,423
|
|
||||||
|
Total North America (Cost $120,405)
|
111,423
|
|
||||||||||
|
Europe (0.48%)
|
||||||||||||
|
Consumer
|
||||||||||||
|
3,449
|
|
Various
|
—%
|
8/24 - 3/26
|
3,049
|
|
||||||
|
Total Europe (Cost $2,133)
|
3,049
|
|
||||||||||
|
Total Consumer Loans and Asset-backed Securities backed by Consumer Loans (Cost $122,538)
|
114,472
|
|
||||||||||
See Notes to Consolidated Financial Statements
96
ELLINGTON FINANCIAL LLC
CONSOLIDATED CONDENSED SCHEDULE OF INVESTMENTS
AT DECEMBER 31, 2016 (CONTINUED)
|
Current Principal/Number of Properties
|
Rate
|
Maturity
|
Fair Value
|
|||||||||
|
(In thousands)
|
|
|
Expressed in U.S.
Dollars |
|||||||||
|
Corporate Debt (12.42%)
|
||||||||||||
|
North America (12.13%)
|
||||||||||||
|
Communications
|
||||||||||||
|
$
|
9,381
|
|
Various
|
6.75% - 9.07%
|
4/18 - 12/22
|
$
|
9,489
|
|
||||
|
Consumer
|
||||||||||||
|
22,991
|
|
Various
|
3.85% - 11.00%
|
5/17 - 5/25
|
24,187
|
|
||||||
|
Energy
|
||||||||||||
|
16,170
|
|
Various
|
6.38% - 9.63%
|
3/19 - 2/23
|
16,951
|
|
||||||
|
Industrial
|
||||||||||||
|
12,470
|
|
Various
|
3.75% - 7.75%
|
5/19 - 12/22
|
12,709
|
|
||||||
|
Mortgage-related—Residential
|
||||||||||||
|
10,500
|
|
Various
|
15.00%
|
10/19
|
9,975
|
|
||||||
|
Technology
|
||||||||||||
|
3,827
|
|
Various
|
6.13% - 7.50%
|
3/20 - 8/22
|
3,937
|
|
||||||
|
Utilities
|
||||||||||||
|
840
|
|
Various
|
7.38%
|
7/21
|
939
|
|
||||||
|
Total North America (Cost $78,482)
|
78,187
|
|
||||||||||
|
Europe (0.29%)
|
||||||||||||
|
Consumer
|
||||||||||||
|
17,618
|
|
Various
|
—%
|
12/17 - 12/18
|
380
|
|
||||||
|
Industrial
|
||||||||||||
|
1,867
|
|
Various
|
6.50%
|
3/21
|
1,528
|
|
||||||
|
Total Europe (Cost $2,554)
|
1,908
|
|
||||||||||
|
Total Corporate Debt (Cost $81,036)
|
80,095
|
|
||||||||||
|
Mortgage Loans (22.55%) (e)
|
||||||||||||
|
North America
|
||||||||||||
|
Mortgage-related—Commercial (i)
|
||||||||||||
|
71,020
|
|
Various
|
2.73% - 12.12%
|
6/17 - 10/37
|
61,129
|
|
||||||
|
Mortgage-related—Residential (k)
|
||||||||||||
|
89,658
|
|
Various
|
2.00% - 12.63%
|
4/22 - 7/57
|
84,290
|
|
||||||
|
Total Mortgage Loans (Cost $148,173)
|
145,419
|
|
||||||||||
|
Real Estate Owned (0.52%) (e) (j)
|
||||||||||||
|
North America
|
||||||||||||
|
Real estate-related
|
||||||||||||
|
9
|
|
Single-Family Houses
|
1,699
|
|
||||||||
|
1
|
|
Commercial Property
|
1,650
|
|
||||||||
|
Total Real Estate Owned (Cost $3,539)
|
3,349
|
|
||||||||||
See Notes to Consolidated Financial Statements
97
ELLINGTON FINANCIAL LLC
CONSOLIDATED CONDENSED SCHEDULE OF INVESTMENTS
AT DECEMBER 31, 2016 (CONTINUED)
|
Current Principal/Number of Shares
|
Rate
|
Maturity
|
Fair Value
|
|||||||||
|
(In thousands)
|
|
|
Expressed in U.S.
Dollars |
|||||||||
|
Private Corporate Equity Investments (4.11%)
|
||||||||||||
|
North America (4.11%)
|
||||||||||||
|
Consumer
|
||||||||||||
|
1,557
|
|
Non-Exchange Traded Corporate Equity
|
$
|
825
|
|
|||||||
|
Diversified
|
||||||||||||
|
191
|
|
Non-Exchange Traded Corporate Equity
|
3,162
|
|
||||||||
|
Financial
|
||||||||||||
|
51
|
|
Exchange Traded Equity
|
4,396
|
|
||||||||
|
Mortgage-related—Commercial
|
||||||||||||
|
n/a
|
|
Non-Controlling Interest in Mortgage-Related Private Partnership
|
3,090
|
|
||||||||
|
Mortgage-related—Residential
|
||||||||||||
|
1,838
|
|
Non-Exchange Traded Preferred Equity Investment in Mortgage Originators
|
14,325
|
|
||||||||
|
6,750
|
|
Non-Exchange Traded Equity Investment in Mortgage Originators
|
675
|
|
||||||||
|
Total North America (Cost $25,937)
|
26,473
|
|
||||||||||
|
Europe (0.00%)
|
||||||||||||
|
Consumer
|
||||||||||||
|
125
|
|
Non-Exchange Traded Corporate Equity
|
—
|
|
||||||||
|
Total Europe (Cost $0)
|
—
|
|
||||||||||
|
Total Private Corporate Equity Investments (Cost $25,937)
|
26,473
|
|
||||||||||
|
U.S. Treasury Securities (0.84%)
|
||||||||||||
|
North America
|
||||||||||||
|
Government
|
||||||||||||
|
$
|
5,620
|
|
U.S. Treasury Note
|
1.13% - 1.63%
|
5/21 - 5/26
|
5,419
|
|
|||||
|
Total U.S. Treasury Securities (Cost $5,635)
|
5,419
|
|
||||||||||
|
Total Long Investments (Cost $1,525,710)
|
$
|
1,505,026
|
|
|||||||||
See Notes to Consolidated Financial Statements
98
ELLINGTON FINANCIAL LLC
CONSOLIDATED CONDENSED SCHEDULE OF INVESTMENTS
AT DECEMBER 31, 2016 (CONTINUED)
|
Current Principal
|
Description
|
Rate
|
Maturity
|
Fair Value
|
||||||||
|
(In thousands)
|
|
|
|
Expressed in U.S.
Dollars
|
||||||||
|
Repurchase Agreements (28.66%) (a) (b) (l)
|
||||||||||||
|
$
|
46,749
|
|
JP Morgan Securities LLC
|
(1.15)%
|
1/17
|
$
|
46,749
|
|
||||
|
Collateralized by Par Value $48,133
|
||||||||||||
|
U.S. Treasury Note, Coupon 2.00%,
|
||||||||||||
|
Maturity Date 11/26
|
||||||||||||
|
14,900
|
|
JP Morgan Securities LLC
|
(0.89)%
|
1/17
|
14,900
|
|
||||||
|
Collateralized by Par Value $14,507
|
||||||||||||
|
Sovereign Government Bond, Coupon 0.25%,
|
||||||||||||
|
Maturity Date 4/18
|
||||||||||||
|
12,912
|
|
JP Morgan Securities LLC
|
(1.10)%
|
1/17
|
12,912
|
|
||||||
|
Collateralized by Par Value $12,498
|
||||||||||||
|
Sovereign Government Bond, Coupon 0.25%,
|
||||||||||||
|
Maturity Date 11/20
|
||||||||||||
|
11,324
|
|
JP Morgan Securities LLC
|
(0.30)%
|
1/17
|
11,324
|
|
||||||
|
Collateralized by Par Value $12,160
|
||||||||||||
|
U.S. Treasury Note, Coupon 1.50%,
|
||||||||||||
|
Maturity Date 8/26
|
||||||||||||
|
9,494
|
|
JP Morgan Securities LLC
|
(0.89)%
|
1/17
|
9,494
|
|
||||||
|
Collateralized by Par Value $9,176
|
||||||||||||
|
Sovereign Government Bond, Coupon 0.75%,
|
||||||||||||
|
Maturity Date 7/21
|
||||||||||||
|
9,165
|
|
JP Morgan Securities LLC
|
(0.80)%
|
1/17
|
9,165
|
|
||||||
|
Collateralized by Par Value $8,322
|
||||||||||||
|
Sovereign Government Bond, Coupon 2.75%,
|
||||||||||||
|
Maturity Date 4/19
|
||||||||||||
|
8,725
|
|
JP Morgan Securities LLC
|
(0.81)%
|
1/17
|
8,725
|
|
||||||
|
Collateralized by Par Value $8,257
|
||||||||||||
|
Sovereign Government Bond, Coupon 1.15%,
|
||||||||||||
|
Maturity Date 7/20
|
||||||||||||
|
8,447
|
|
JP Morgan Securities LLC
|
(0.95)%
|
1/17
|
8,447
|
|
||||||
|
Collateralized by Par Value $8,257
|
||||||||||||
|
Sovereign Government Bond, Coupon 0.65%,
|
||||||||||||
|
Maturity Date 11/20
|
||||||||||||
|
6,166
|
|
CILO 2016-LD1 Holdings LLC (m)
|
2.90%
|
2/17
|
6,166
|
|
||||||
|
Collateralized by Par Value $9,512
|
||||||||||||
|
Exchange-Traded Debt, Coupon 5.50%,
|
||||||||||||
|
Maturity Date 7/22
|
||||||||||||
|
5,827
|
|
RBC Capital Markets LLC
|
(0.35)%
|
1/17
|
5,827
|
|
||||||
|
Collateralized by Par Value $6,300
|
||||||||||||
|
Exchange-Traded Corporate Debt, Coupon 6.25%,
|
||||||||||||
|
Maturity Date 9/21
|
||||||||||||
|
4,691
|
|
Bank of America Securities
|
(3.00)%
|
1/17
|
4,691
|
|
||||||
|
Collateralized by Par Value $4,726
|
||||||||||||
|
U.S. Treasury Note, Coupon 1.75%,
|
||||||||||||
|
Maturity Date 11/21
|
||||||||||||
See Notes to Consolidated Financial Statements
99
ELLINGTON FINANCIAL LLC
CONSOLIDATED CONDENSED SCHEDULE OF INVESTMENTS
AT DECEMBER 31, 2016 (CONTINUED)
|
Current Principal
|
Description
|
Rate
|
Maturity
|
Fair Value
|
||||||||
|
(In thousands)
|
|
|
|
Expressed in U.S.
Dollars
|
||||||||
|
(continued)
|
||||||||||||
|
$
|
3,274
|
|
RBC Capital Markets LLC
|
0.30%
|
1/17
|
$
|
3,274
|
|
||||
|
Collateralized by Par Value $3,274
|
||||||||||||
|
Exchange-Traded Corporate Debt, Coupon 6.25%,
|
||||||||||||
|
Maturity Date 7/22
|
||||||||||||
|
3,147
|
|
RBC Capital Markets LLC
|
(1.00)%
|
1/17
|
3,147
|
|
||||||
|
Collateralized by Par Value $3,100
|
||||||||||||
|
Exchange-Traded Corporate Debt, Coupon 8.00%,
|
||||||||||||
|
Maturity Date 1/25
|
||||||||||||
|
3,125
|
|
Bank of America Securities
|
0.10%
|
1/17
|
3,125
|
|
||||||
|
Collateralized by Par Value $3,230
|
||||||||||||
|
U.S. Treasury Note, Coupon 1.13%,
|
||||||||||||
|
Maturity Date 8/21
|
||||||||||||
|
3,006
|
|
Barclays Capital Inc
|
(0.50)%
|
1/17
|
3,006
|
|
||||||
|
Collateralized by Par Value $3,050
|
||||||||||||
|
Exchange-Traded Corporate Debt, Coupon 4.00%,
|
||||||||||||
|
Maturity Date 11/21
|
||||||||||||
|
2,774
|
|
RBC Capital Markets LLC
|
(4.50)%
|
1/17
|
2,774
|
|
||||||
|
Collateralized by Par Value $3,032
|
||||||||||||
|
Exchange-Traded Corporate Debt, Coupon 4.50%,
|
||||||||||||
|
Maturity Date 4/22
|
||||||||||||
|
2,534
|
|
Societe Generale
|
(0.50)%
|
1/17
|
2,534
|
|
||||||
|
Collateralized by Par Value $2,532
|
||||||||||||
|
Exchange-Traded Corporate Debt, Coupon 4.00%,
|
||||||||||||
|
Maturity Date 11/21
|
||||||||||||
|
2,232
|
|
JP Morgan Securities LLC
|
(2.50)%
|
1/17
|
2,232
|
|
||||||
|
Collateralized by Par Value $2,090
|
||||||||||||
|
Exchange-Traded Corporate Debt, Coupon 6.25%,
|
||||||||||||
|
Maturity Date 10/22
|
||||||||||||
|
1,899
|
|
Bank of America Securities
|
0.10%
|
1/17
|
1,899
|
|
||||||
|
Collateralized by Par Value $1,968
|
||||||||||||
|
U.S. Treasury Note, Coupon 1.13%,
|
||||||||||||
|
Maturity Date 9/21
|
||||||||||||
|
1,777
|
|
Barclays Capital Inc
|
(2.25)%
|
1/17
|
1,777
|
|
||||||
|
Collateralized by Par Value $1,864
|
||||||||||||
|
Exchange-Traded Corporate Debt, Coupon 4.88%,
|
||||||||||||
|
Maturity Date 4/22
|
||||||||||||
|
1,573
|
|
RBC Capital Markets LLC
|
(1.50)%
|
1/17
|
1,573
|
|
||||||
|
Collateralized by Par Value $1,550
|
||||||||||||
|
Exchange-Traded Corporate Debt, Coupon 8.00%,
|
||||||||||||
|
Maturity Date 1/25
|
||||||||||||
|
1,503
|
|
JP Morgan Securities LLC
|
(2.50)%
|
1/17
|
1,503
|
|
||||||
|
Collateralized by Par Value $1,556
|
||||||||||||
|
Exchange-Traded Corporate Debt, Coupon 4.88%,
|
||||||||||||
|
Maturity Date 4/22
|
||||||||||||
See Notes to Consolidated Financial Statements
100
ELLINGTON FINANCIAL LLC
CONSOLIDATED CONDENSED SCHEDULE OF INVESTMENTS
AT DECEMBER 31, 2016 (CONTINUED)
|
Current Principal
|
Description
|
Rate
|
Maturity
|
Fair Value
|
||||||||
|
(In thousands)
|
|
|
|
Expressed in U.S.
Dollars
|
||||||||
|
(continued)
|
||||||||||||
|
$
|
1,435
|
|
RBC Capital Markets LLC
|
0.30%
|
1/17
|
$
|
1,435
|
|
||||
|
Collateralized by Par Value $1,560
|
||||||||||||
|
Exchange-Traded Corporate Debt, Coupon 3.88%,
|
||||||||||||
|
Maturity Date 3/23
|
||||||||||||
|
1,369
|
|
Societe Generale
|
0.35%
|
1/17
|
1,369
|
|
||||||
|
Collateralized by Par Value $1,240
|
||||||||||||
|
Exchange-Traded Corporate Debt, Coupon 9.25%,
|
||||||||||||
|
Maturity Date 7/21
|
||||||||||||
|
1,281
|
|
Bank of America Securities
|
0.25%
|
1/17
|
1,281
|
|
||||||
|
Collateralized by Par Value $1,305
|
||||||||||||
|
U.S. Treasury Note, Coupon 1.38%,
|
||||||||||||
|
Maturity Date 4/21
|
||||||||||||
|
1,214
|
|
RBC Capital Markets LLC
|
0.25%
|
1/17
|
1,214
|
|
||||||
|
Collateralized by Par Value $1,190
|
||||||||||||
|
Exchange-Traded Corporate Debt, Coupon 3.88%,
|
||||||||||||
|
Maturity Date 1/22
|
||||||||||||
|
1,147
|
|
RBC Capital Markets LLC
|
(1.75)%
|
1/17
|
1,147
|
|
||||||
|
Collateralized by Par Value $1,300
|
||||||||||||
|
Exchange-Traded Corporate Debt, Coupon 5.50%,
|
||||||||||||
|
Maturity Date 10/24
|
||||||||||||
|
1,119
|
|
RBC Capital Markets LLC
|
0.30%
|
1/17
|
1,119
|
|
||||||
|
Collateralized by Par Value $1,130
|
||||||||||||
|
Exchange-Traded Corporate Debt, Coupon 4.13%,
|
||||||||||||
|
Maturity Date 2/22
|
||||||||||||
|
975
|
|
JP Morgan Securities LLC
|
(0.65)%
|
1/17
|
975
|
|
||||||
|
Collateralized by Par Value $1,008
|
||||||||||||
|
Exchange-Traded Corporate Debt, Coupon 4.00%,
|
||||||||||||
|
Maturity Date 11/21
|
||||||||||||
|
909
|
|
Societe Generale
|
0.35%
|
1/17
|
909
|
|
||||||
|
Collateralized by Par Value $850
|
||||||||||||
|
Exchange-Traded Corporate Debt, Coupon 3.88%,
|
||||||||||||
|
Maturity Date 1/22
|
||||||||||||
|
817
|
|
JP Morgan Securities LLC
|
(0.50)%
|
1/17
|
817
|
|
||||||
|
Collateralized by Par Value $840
|
||||||||||||
|
Exchange-Traded Corporate Debt, Coupon 4.00%,
|
||||||||||||
|
Maturity Date 11/21
|
||||||||||||
|
795
|
|
RBC Capital Markets LLC
|
(2.50)%
|
1/17
|
795
|
|
||||||
|
Collateralized by Par Value $780
|
||||||||||||
|
Exchange-Traded Corporate Debt, Coupon 6.25%,
|
||||||||||||
|
Maturity Date 10/22
|
||||||||||||
|
780
|
|
JP Morgan Securities LLC
|
(2.80)%
|
1/17
|
780
|
|
||||||
|
Collateralized by Par Value $800
|
||||||||||||
|
U.S. Treasury Note, Coupon 1.25%,
|
||||||||||||
|
Maturity Date 10/21
|
||||||||||||
See Notes to Consolidated Financial Statements
101
ELLINGTON FINANCIAL LLC
CONSOLIDATED CONDENSED SCHEDULE OF INVESTMENTS
AT DECEMBER 31, 2016 (CONTINUED)
|
Current Principal
|
Description
|
Rate
|
Maturity
|
Fair Value
|
||||||||
|
(In thousands)
|
|
|
|
Expressed in U.S.
Dollars
|
||||||||
|
(continued)
|
||||||||||||
|
$
|
760
|
|
Barclays Capital Inc
|
(4.75)%
|
1/17
|
$
|
760
|
|
||||
|
Collateralized by Par Value $819
|
||||||||||||
|
Exchange-Traded Corporate Debt, Coupon 4.50%,
|
||||||||||||
|
Maturity Date 4/22
|
||||||||||||
|
674
|
|
RBC Capital Markets LLC
|
0.30%
|
1/17
|
674
|
|
||||||
|
Collateralized by Par Value $650
|
||||||||||||
|
Exchange-Traded Corporate Debt, Coupon 5.25%,
|
||||||||||||
|
Maturity Date 9/22
|
||||||||||||
|
673
|
|
RBC Capital Markets LLC
|
0.30%
|
1/17
|
673
|
|
||||||
|
Collateralized by Par Value $620
|
||||||||||||
|
Exchange-Traded Corporate Debt, Coupon 6.38%,
|
||||||||||||
|
Maturity Date 4/26
|
||||||||||||
|
671
|
|
RBC Capital Markets LLC
|
0.30%
|
1/17
|
671
|
|
||||||
|
Collateralized by Par Value $620
|
||||||||||||
|
Exchange-Traded Corporate Debt, Coupon 6.88%,
|
||||||||||||
|
Maturity Date 5/23
|
||||||||||||
|
587
|
|
JP Morgan Securities LLC
|
(1.50)%
|
1/17
|
587
|
|
||||||
|
Collateralized by Par Value $620
|
||||||||||||
|
Exchange-Traded Corporate Debt, Coupon 5.50%,
|
||||||||||||
|
Maturity Date 10/24
|
||||||||||||
|
566
|
|
JP Morgan Securities LLC
|
(0.35)%
|
1/17
|
566
|
|
||||||
|
Collateralized by Par Value $570
|
||||||||||||
|
Exchange-Traded Corporate Debt, Coupon 4.00%,
|
||||||||||||
|
Maturity Date 11/21
|
||||||||||||
|
562
|
|
Barclays Capital Inc
|
(0.10)%
|
1/17
|
562
|
|
||||||
|
Collateralized by Par Value $550
|
||||||||||||
|
Exchange-Traded Corporate Debt, Coupon 2.40%,
|
||||||||||||
|
Maturity Date 12/22
|
||||||||||||
|
545
|
|
RBC Capital Markets LLC
|
(0.38)%
|
1/17
|
545
|
|
||||||
|
Collateralized by Par Value $560
|
||||||||||||
|
Exchange-Traded Corporate Debt, Coupon 4.00%,
|
||||||||||||
|
Maturity Date 11/21
|
||||||||||||
|
543
|
|
JP Morgan Securities LLC
|
(0.35)%
|
1/17
|
543
|
|
||||||
|
Collateralized by Par Value $560
|
||||||||||||
|
Exchange-Traded Corporate Debt, Coupon 6.25%,
|
||||||||||||
|
Maturity Date 9/21
|
||||||||||||
|
533
|
|
Bank of America Securities
|
0.60%
|
1/17
|
533
|
|
||||||
|
Collateralized by Par Value $549
|
||||||||||||
|
U.S. Treasury Note, Coupon 1.13%,
|
||||||||||||
|
Maturity Date 7/21
|
||||||||||||
|
520
|
|
RBC Capital Markets LLC
|
0.30%
|
1/17
|
520
|
|
||||||
|
Collateralized by Par Value $500
|
||||||||||||
|
Exchange-Traded Corporate Debt, Coupon 5.75%,
|
||||||||||||
|
Maturity Date 10/22
|
||||||||||||
See Notes to Consolidated Financial Statements
102
ELLINGTON FINANCIAL LLC
CONSOLIDATED CONDENSED SCHEDULE OF INVESTMENTS
AT DECEMBER 31, 2016 (CONTINUED)
|
Current Principal
|
Description
|
Rate
|
Maturity
|
Fair Value
|
||||||||
|
(In thousands)
|
|
|
|
Expressed in U.S.
Dollars
|
||||||||
|
(continued)
|
||||||||||||
|
$
|
449
|
|
RBC Capital Markets LLC
|
0.30%
|
1/17
|
$
|
449
|
|
||||
|
Collateralized by Par Value $430
|
||||||||||||
|
Exchange-Traded Corporate Debt, Coupon 5.13%,
|
||||||||||||
|
Maturity Date 10/21
|
||||||||||||
|
373
|
|
RBC Capital Markets LLC
|
0.30%
|
1/17
|
373
|
|
||||||
|
Collateralized by Par Value $360
|
||||||||||||
|
Exchange-Traded Corporate Debt, Coupon 5.13%,
|
||||||||||||
|
Maturity Date 11/23
|
||||||||||||
|
278
|
|
RBC Capital Markets LLC
|
(7.00)%
|
1/17
|
278
|
|
||||||
|
Collateralized by Par Value $270
|
||||||||||||
|
Exchange-Traded Corporate Debt, Coupon 7.75%,
|
||||||||||||
|
Maturity Date 6/21
|
||||||||||||
|
Total Repurchase Agreements (Cost $185,205)
|
$
|
184,819
|
|
|||||||||
|
Investments Sold Short (-90.71%) (a) (b)
|
||||||||||||
|
TBA - Fixed Rate Agency Securities Sold Short (-62.77%) (n)
|
||||||||||||
|
North America
|
||||||||||||
|
Mortgage-related—Residential
|
||||||||||||
|
$
|
(87,767
|
)
|
Federal Home Loan Mortgage Corporation (30 year)
|
4.00%
|
1/17
|
$
|
(92,210
|
)
|
||||
|
(50,930
|
)
|
Federal National Mortgage Association (30 year)
|
4.50%
|
1/17
|
(54,748
|
)
|
||||||
|
(31,620
|
)
|
Federal National Mortgage Association (30 year)
|
5.00%
|
1/17
|
(34,426
|
)
|
||||||
|
(26,000
|
)
|
Federal National Mortgage Association (30 year)
|
4.00%
|
2/17
|
(27,295
|
)
|
||||||
|
(24,352
|
)
|
Federal National Mortgage Association (30 year)
|
3.50%
|
1/17
|
(24,960
|
)
|
||||||
|
(23,151
|
)
|
Federal Home Loan Mortgage Corporation (30 year)
|
4.50%
|
1/17
|
(24,840
|
)
|
||||||
|
(21,940
|
)
|
Government National Mortgage Association (30 year)
|
3.50%
|
1/17
|
(22,819
|
)
|
||||||
|
(20,558
|
)
|
Federal National Mortgage Association (30 year)
|
4.00%
|
1/17
|
(21,611
|
)
|
||||||
|
(20,740
|
)
|
Federal National Mortgage Association (15 year)
|
3.00%
|
1/17
|
(21,285
|
)
|
||||||
|
(15,770
|
)
|
Government National Mortgage Association (30 year)
|
4.50%
|
1/17
|
(17,058
|
)
|
||||||
|
(13,510
|
)
|
Federal Home Loan Mortgage Corporation (15 year)
|
3.00%
|
1/17
|
(13,869
|
)
|
||||||
|
(11,170
|
)
|
Federal National Mortgage Association (15 year)
|
4.00%
|
1/17
|
(11,494
|
)
|
||||||
|
(8,790
|
)
|
Federal Home Loan Mortgage Corporation (15 year)
|
3.50%
|
1/17
|
(9,169
|
)
|
||||||
|
(6,860
|
)
|
Federal National Mortgage Association (30 year)
|
5.50%
|
1/17
|
(7,622
|
)
|
||||||
|
(6,500
|
)
|
Government National Mortgage Association (30 year)
|
3.00%
|
1/17
|
(6,568
|
)
|
||||||
|
(4,612
|
)
|
Federal National Mortgage Association (30 year)
|
3.00%
|
1/17
|
(4,584
|
)
|
||||||
|
(3,155
|
)
|
Federal Home Loan Mortgage Corporation (30 year)
|
3.00%
|
1/17
|
(3,134
|
)
|
||||||
|
(2,530
|
)
|
Federal National Mortgage Association (15 year)
|
3.50%
|
2/17
|
(2,633
|
)
|
||||||
|
(2,500
|
)
|
Government National Mortgage Association (30 year)
|
3.50%
|
2/17
|
(2,597
|
)
|
||||||
|
(1,700
|
)
|
Government National Mortgage Association (30 year)
|
4.00%
|
1/17
|
(1,806
|
)
|
||||||
|
Total TBA - Fixed Rate Agency Securities Sold Short (Proceeds -$404,967)
|
(404,728
|
)
|
||||||||||
See Notes to Consolidated Financial Statements
103
ELLINGTON FINANCIAL LLC
CONSOLIDATED CONDENSED SCHEDULE OF INVESTMENTS
AT DECEMBER 31, 2016 (CONTINUED)
|
Current Principal/Number of Shares
|
Description
|
Rate
|
Maturity
|
Fair Value
|
||||||||
|
(In thousands)
|
Expressed in U.S.
Dollars
|
|||||||||||
|
Government Debt Sold Short (-20.54%)
|
||||||||||||
|
North America (-10.82%)
|
||||||||||||
|
Government
|
||||||||||||
|
$
|
(48,133
|
)
|
U.S. Treasury Note
|
2.00%
|
11/26
|
$
|
(46,287
|
)
|
||||
|
(12,160
|
)
|
U.S. Treasury Note
|
1.50%
|
8/26
|
(11,179
|
)
|
||||||
|
(4,726
|
)
|
U.S. Treasury Note
|
1.75%
|
11/21
|
(4,690
|
)
|
||||||
|
(3,230
|
)
|
U.S. Treasury Note
|
1.13%
|
8/21
|
(3,121
|
)
|
||||||
|
(1,968
|
)
|
U.S. Treasury Note
|
1.13%
|
9/21
|
(1,898
|
)
|
||||||
|
(1,305
|
)
|
U.S. Treasury Note
|
1.38%
|
4/21
|
(1,280
|
)
|
||||||
|
(800
|
)
|
U.S. Treasury Note
|
1.25%
|
10/21
|
(776
|
)
|
||||||
|
(549
|
)
|
U.S. Treasury Note
|
1.13%
|
7/21
|
(531
|
)
|
||||||
|
Total North America (Proceeds -$69,946)
|
(69,762
|
)
|
||||||||||
|
Europe (-9.72%)
|
||||||||||||
|
Government
|
||||||||||||
|
(20,754
|
)
|
European Sovereign Bond
|
0.25% - 0.65%
|
11/20
|
(21,219
|
)
|
||||||
|
(14,507
|
)
|
Spanish Sovereign Bond
|
0.25%
|
4/18
|
(14,614
|
)
|
||||||
|
(9,176
|
)
|
Spanish Sovereign Bond
|
0.75%
|
7/21
|
(9,379
|
)
|
||||||
|
(8,322
|
)
|
Spanish Sovereign Bond
|
2.75%
|
4/19
|
(8,888
|
)
|
||||||
|
(8,257
|
)
|
Spanish Sovereign Bond
|
1.15%
|
7/20
|
(8,580
|
)
|
||||||
|
Total Europe (Proceeds -$66,800)
|
(62,680
|
)
|
||||||||||
|
Total Government Debt Sold Short (Proceeds -$136,746)
|
(132,442
|
)
|
||||||||||
|
Common Stock Sold Short (-1.26%)
|
||||||||||||
|
North America
|
||||||||||||
|
Financial
|
||||||||||||
|
(207
|
)
|
Exchange Traded Equity
|
(8,154
|
)
|
||||||||
|
Total Common Stock Sold Short (Proceeds -$8,052)
|
(8,154
|
)
|
||||||||||
|
Corporate Debt Sold Short (-6.14%)
|
||||||||||||
|
North America
|
||||||||||||
|
Basic Materials
|
||||||||||||
|
(8,970
|
)
|
Various
|
3.88% - 5.13%
|
10/21 - 3/23
|
(8,717
|
)
|
||||||
|
Communications
|
||||||||||||
|
(8,750
|
)
|
Various
|
5.25% - 9.25%
|
7/21 - 9/22
|
(8,551
|
)
|
||||||
|
Consumer
|
||||||||||||
|
(8,930
|
)
|
Various
|
3.88% - 6.88%
|
1/22 - 4/26
|
(8,695
|
)
|
||||||
|
Energy
|
||||||||||||
|
(10,597
|
)
|
Various
|
2.40% - 8.00%
|
6/21 - 1/25
|
(10,041
|
)
|
||||||
|
Financial
|
||||||||||||
|
(1,130
|
)
|
Various
|
4.13%
|
2/22
|
(1,121
|
)
|
||||||
|
Utilities
|
||||||||||||
|
(2,430
|
)
|
Various
|
6.25%
|
7/22
|
(2,447
|
)
|
||||||
|
Total Corporate Debt Sold Short (Proceeds -$39,664)
|
(39,572
|
)
|
||||||||||
|
Total Investments Sold Short (Proceeds -$589,429)
|
$
|
(584,896
|
)
|
|||||||||
See Notes to Consolidated Financial Statements
104
ELLINGTON FINANCIAL LLC
CONSOLIDATED CONDENSED SCHEDULE OF INVESTMENTS
AT DECEMBER 31, 2016 (CONTINUED)
|
Primary Risk
Exposure
|
Notional Value
|
Range of
Expiration
Dates
|
Fair Value
|
||||||||
|
(In thousands)
|
Expressed in U.S.Dollars
|
||||||||||
|
Financial Derivatives–Assets (5.52%) (a) (b)
|
|||||||||||
|
Swaps (5.49%)
|
|||||||||||
|
Long Swaps:
|
|||||||||||
|
Credit Default Swaps on Corporate Bond Indices (o)
|
Credit
|
$
|
40,611
|
|
12/18 - 12/21
|
$
|
2,744
|
|
|||
|
Credit Default Swaps on Asset-Backed Indices (o)
|
Credit
|
1,202
|
|
12/37
|
12
|
|
|||||
|
Interest Rate Swaps (p)
|
Interest Rates
|
215,826
|
|
12/17 - 1/45
|
2,274
|
|
|||||
|
North America
|
|||||||||||
|
Total Return Swaps (t)
|
|||||||||||
|
Consumer
|
Credit
|
3,130
|
|
7/19
|
87
|
|
|||||
|
Utilities
|
Credit
|
685
|
|
2/20
|
68
|
|
|||||
|
Total Total Return Swaps
|
155
|
|
|||||||||
|
Credit Default Swaps on Corporate Bonds (o)
|
|||||||||||
|
Basic Materials
|
Credit
|
760
|
|
3/21
|
90
|
|
|||||
|
Consumer
|
Credit
|
8,043
|
|
3/19 - 12/21
|
973
|
|
|||||
|
Energy
|
Credit
|
4,120
|
|
3/19 - 12/21
|
7
|
|
|||||
|
Financial
|
Credit
|
1,120
|
|
12/21
|
140
|
|
|||||
|
Utilities
|
Credit
|
2,060
|
|
6/21
|
151
|
|
|||||
|
Total Credit Default Swaps on Corporate Bonds
|
1,361
|
|
|||||||||
|
Short Swaps:
|
|||||||||||
|
Credit Default Swaps on Asset-Backed Indices (q)
|
Credit
|
(112,999
|
)
|
5/46 - 9/58
|
16,701
|
|
|||||
|
Interest Rate Swaps (r)
|
Interest Rates
|
(607,499
|
)
|
4/17 - 12/45
|
5,828
|
|
|||||
|
North America
|
|||||||||||
|
Credit Default Swaps on Asset-Backed Securities (q)
|
|||||||||||
|
Mortgage-related—Residential
|
Credit
|
(7,077
|
)
|
5/35 - 12/35
|
5,326
|
|
|||||
|
Credit Default Swaps on Corporate Bonds (q)
|
|||||||||||
|
Consumer
|
Credit
|
(2,880
|
)
|
12/21
|
102
|
|
|||||
|
Communications
|
Credit
|
(1,930
|
)
|
6/21
|
30
|
|
|||||
|
Energy
|
Credit
|
(20,507
|
)
|
6/17 - 6/21
|
867
|
|
|||||
|
Total Credit Default Swaps on Corporate Bonds
|
999
|
|
|||||||||
|
Total Swaps (Net cost $40,491)
|
35,400
|
|
|||||||||
|
Futures (0.00%)
|
|||||||||||
|
Short Futures:
|
|||||||||||
|
U.S. Treasury Note Futures (ac)
|
Interest Rates
|
(7,000
|
)
|
3/17
|
19
|
|
|||||
|
Eurodollar Futures (u)
|
Interest Rates
|
(13,000
|
)
|
9/17
|
10
|
|
|||||
|
Total Futures
|
29
|
|
|||||||||
See Notes to Consolidated Financial Statements
105
ELLINGTON FINANCIAL LLC
CONSOLIDATED CONDENSED SCHEDULE OF INVESTMENTS
AT DECEMBER 31, 2016 (CONTINUED)
|
Primary Risk
Exposure
|
Notional Value
|
Range of
Expiration
Dates
|
Fair Value
|
||||||||
|
(In thousands)
|
Expressed in U.S.Dollars
|
||||||||||
|
Options (0.01%)
|
|||||||||||
|
Purchased Options:
|
|||||||||||
|
Put Options on Credit Default Swaps on Corporate Bond Indices (x)
|
Credit
|
$
|
10,000
|
|
1/17
|
$
|
—
|
|
|||
|
Interest Rate Caps (w)
|
Interest Rates
|
61,908
|
|
3/18 - 10/18
|
2
|
|
|||||
|
North America
|
|||||||||||
|
Equity Call Options (y)
|
|||||||||||
|
Consumer
|
Equity Market
|
16
|
|
4/17
|
42
|
|
|||||
|
Total Options (Cost $133)
|
44
|
|
|||||||||
|
Forwards (0.00%)
|
|||||||||||
|
Short Forwards:
|
|||||||||||
|
Currency Forwards (aa)
|
Currency
|
(6,529
|
)
|
3/17
|
16
|
|
|||||
|
Total Forwards
|
16
|
|
|||||||||
|
Warrants (0.02%)
|
|||||||||||
|
North America
|
|||||||||||
|
Warrants (v)
|
|||||||||||
|
Mortgage-related—Residential
|
Equity Market
|
1,639
|
|
106
|
|
||||||
|
Total Warrants (Cost $100)
|
106
|
|
|||||||||
|
Total Financial Derivatives–Assets (Net cost $40,724)
|
$
|
35,595
|
|
||||||||
|
Financial Derivatives–Liabilities (-2.90%) (a) (b)
|
|||||||||||
|
Swaps (-2.81%)
|
|||||||||||
|
Long Swaps:
|
|||||||||||
|
Credit Default Swaps on Asset-Backed Indices (o)
|
Credit
|
$
|
16,026
|
|
1/47 - 5/63
|
$
|
(2,899
|
)
|
|||
|
Interest Rate Swaps (p)
|
Interest Rates
|
160,248
|
|
2/19 - 1/45
|
(4,396
|
)
|
|||||
|
North America
|
|||||||||||
|
Credit Default Swaps on Corporate Bonds (o)
|
|||||||||||
|
Basic Materials
|
Credit
|
9,480
|
|
6/21 - 12/21
|
(1,107
|
)
|
|||||
|
Communications
|
Credit
|
9,990
|
|
6/21 - 12/21
|
(430
|
)
|
|||||
|
Consumer
|
Credit
|
9,736
|
|
6/21 - 12/21
|
(298
|
)
|
|||||
|
Energy
|
Credit
|
14,317
|
|
3/18 - 12/21
|
(928
|
)
|
|||||
|
Total Credit Default Swaps on Corporate Bonds
|
(2,763
|
)
|
|||||||||
|
Total Return Swaps (t)
|
|||||||||||
|
Communications
|
Credit
|
1,623
|
|
7/19
|
(249
|
)
|
|||||
|
Total Total Return Swaps
|
(249
|
)
|
|||||||||
|
Europe
|
|||||||||||
|
Credit Default Swaps on Corporate Bonds (o)
|
|||||||||||
|
Basic Materials
|
Credit
|
11
|
|
12/19
|
(6
|
)
|
|||||
See Notes to Consolidated Financial Statements
106
ELLINGTON FINANCIAL LLC
CONSOLIDATED CONDENSED SCHEDULE OF INVESTMENTS
AT DECEMBER 31, 2016 (CONTINUED)
|
Primary Risk
Exposure
|
Notional Value
|
Range of
Expiration
Dates
|
Fair Value
|
||||||||
|
(In thousands)
|
Expressed in U.S.Dollars
|
||||||||||
|
Short Swaps:
|
|||||||||||
|
Interest Rate Swaps (r)
|
Interest Rates
|
$
|
(154,836
|
)
|
8/17 - 11/45
|
$
|
(742
|
)
|
|||
|
Interest Rate Swaps (z)
|
Interest Rates
|
(100,200
|
)
|
6/17 - 6/19
|
(24
|
)
|
|||||
|
Credit Default Swaps on Corporate Bond Indices (q)
|
Credit
|
(49,306
|
)
|
12/18 - 12/21
|
(2,840
|
)
|
|||||
|
North America
|
|||||||||||
|
Credit Default Swaps on Asset-Backed Securities (q)
|
|||||||||||
|
Mortgage-related—Residential
|
Credit
|
(3,057
|
)
|
10/34 - 3/35
|
(256
|
)
|
|||||
|
Credit Default Swaps on Corporate Bonds (q)
|
|||||||||||
|
Basic Materials
|
Credit
|
(2,260
|
)
|
6/17 - 3/21
|
(93
|
)
|
|||||
|
Communications
|
Credit
|
(3,140
|
)
|
6/20
|
(44
|
)
|
|||||
|
Consumer
|
Credit
|
(30,901
|
)
|
3/19 - 12/21
|
(3,097
|
)
|
|||||
|
Energy
|
Credit
|
(5,150
|
)
|
12/17 - 12/21
|
(80
|
)
|
|||||
|
Industrial
|
Credit
|
(12,460
|
)
|
3/20 - 12/21
|
(119
|
)
|
|||||
|
Technology
|
Credit
|
(3,020
|
)
|
3/20
|
(345
|
)
|
|||||
|
Utilities
|
Credit
|
(860
|
)
|
6/21
|
(107
|
)
|
|||||
|
Total Credit Default Swaps on Corporate Bonds
|
(3,885
|
)
|
|||||||||
|
Total Return Swaps (s)
|
|||||||||||
|
Financial
|
Equity
|
(42,093
|
)
|
5/17 - 8/17
|
(55
|
)
|
|||||
|
Total Swaps (Net proceeds -$12,012)
|
(18,115
|
)
|
|||||||||
|
Futures (-0.01%)
|
|||||||||||
|
Long Futures:
|
|||||||||||
|
Eurodollar Futures (u)
|
Interest Rates
|
11,000
|
|
6/17
|
(8
|
)
|
|||||
|
Short Futures:
|
|||||||||||
|
Eurodollar Futures (u)
|
Interest Rates
|
(49,000
|
)
|
3/17 - 9/17
|
(61
|
)
|
|||||
|
Total Futures
|
(69
|
)
|
|||||||||
|
Forwards (-0.07%)
|
|||||||||||
|
Short Forwards:
|
|||||||||||
|
Currency Forwards (aa)
|
Currency
|
(48,258
|
)
|
3/17
|
(472
|
)
|
|||||
|
Total Forwards
|
(472
|
)
|
|||||||||
|
Mortgage Loan Purchase Commitments (-0.01%)
|
|||||||||||
|
North America
|
|||||||||||
|
Mortgage Loan Purchase Commitments (ab)
|
|||||||||||
|
Mortgage-related—residential
|
Interest rate
|
20,601
|
|
2/17
|
(31
|
)
|
|||||
|
Total Mortgage Loan Purchase Commitments
|
(31
|
)
|
|||||||||
|
Total Financial Derivatives–Liabilities
(Net proceeds -$12,012)
|
$
|
(18,687
|
)
|
||||||||
See Notes to Consolidated Financial Statements
107
ELLINGTON FINANCIAL LLC
CONSOLIDATED CONDENSED SCHEDULE OF INVESTMENTS
AT DECEMBER 31, 2016 (CONTINUED)
|
(a)
|
See Note 2 and Note 3 in Notes to Consolidated Financial Statements.
|
|
(b)
|
Classification percentages are based on Total Equity.
|
|
(c)
|
At
December 31, 2016
, the Company's long investments guaranteed by the Federal National Mortgage Association, the Federal Home Loan Mortgage Corporation, and the Government National Mortgage Association, represented
73.78%
,
42.13%
, and
23.36%
of equity, respectively.
|
|
(d)
|
Private trust
100%
backed by interest in Government National Mortgage Association collateralized mortgage obligation certificates.
|
|
(e)
|
Loans and real estate owned are beneficially owned by the Company through participation certificates in the various trusts that hold such investments. See Note 7 to the Notes to Consolidated Financial Statements.
|
|
(f)
|
Includes investments in participation certificates related to loans titled in the name of a related party of Ellington Management Group L.L.C. Through its participation certificates, the Company has beneficial interests in the loan cash flows, net of servicing-related fees and expenses. At
December 31, 2016
loans for which the Company has beneficial interests in the net cash flows, totaled
$7.6 million
. See Note 7 to the Notes to Consolidated Financial Statements.
|
|
(g)
|
Includes investments in participation certificates related to loans held in a trust owned by a related party of Ellington Management Group, L.L.C. Through its participation certificates, the Company participates in the cash flows of the underlying loans held by the trust. At
December 31, 2016
loans held in the related party trust for which the Company has participating interests in the cash flows, totaled
$43.2 million
. See Note 7 to the Notes to Consolidated Financial Statements.
|
|
(h)
|
Includes the Company's beneficial interest in an entity, which is co-owned by an affiliate of Ellington Management Group, L.L.C., in the amount of
$7.3 million
as of
December 31, 2016
. The entity owns subordinated notes issued by, as well as trust certificates representing ownership of, a securitization trust. See Note 7 to the Notes to Consolidated Financial Statements.
|
|
(i)
|
Includes non-performing commercial loans in the amount of
$28.6 million
whereby principal and/or interest is past due and a maturity date is not applicable.
|
|
(j)
|
Number of properties not shown in thousands, represents actual number of properties owned.
|
|
(k)
|
As of
December 31, 2016
, the Company had residential mortgage loans that were in the process of foreclosure with a fair value of
$3.2 million
.
|
|
(l)
|
In general, securities received pursuant to repurchase agreements were delivered to counterparties in short sale transactions.
|
|
(m)
|
Repurchase agreement is between the Company and CILO 2016-LD1 Holdings LLC, an entity in which the Company has a beneficial interest and is co-owned by an affiliate of Ellington Management Group, L.L.C. CILO 2016-LD1 Holdings LLC owns subordinated notes issued by, as well as trust certificates representing ownership of, a securitization trust. See Note 7 to the Notes to Consolidated Financial Statements.
|
|
(n)
|
At
December 31, 2016
, the Company's short investments guaranteed by the Federal National Mortgage Association, the Federal Home Loan Mortgage Corporation, and the Government National Mortgage Association, represented
32.67%
,
22.21%
, and
7.89%
of equity, respectively.
|
|
(o)
|
For long credit default swaps, the Company sold protection.
|
|
(p)
|
For long interest rate swap contracts, the Company pays a floating rate and receives a fixed rate.
|
|
(q)
|
For short credit default swaps, the Company purchased protection.
|
|
(r)
|
For short interest rate swap contracts, the Company pays a fixed rate and receives a floating rate.
|
|
(s)
|
Notional value represents number of underlying shares times the closing price of the underlying security.
|
|
(t)
|
Notional value represents outstanding principal balance on underlying corporate debt.
|
|
(u)
|
Every
$1,000,000
in notional value represents
one
contract.
|
|
(v)
|
Notional value represents number of shares that warrants are convertible into.
|
|
(w)
|
Notional value represents the amount on which interest payments are calculated to the extent the market interest rate exceeds the rate cap on the contract.
|
|
(x)
|
Represents the option on the part of a counterparty to enter into a credit default swap on a corporate bond index whereby the Company would receive a fixed rate and pay credit protection payments.
|
|
(y)
|
Notional value represents the number of common shares we have the option to purchase multiplied by the strike price.
|
|
(z)
|
The Company pays a floating rate and receives a floating rate.
|
|
(aa)
|
Notional value represents U.S. Dollars to be received by the Company at the maturity of the forward contract.
|
|
(ab)
|
Notional value represents principal balance of mortgage loan purchase commitments. Actual loan purchases are contingent upon successful loan closings in accordance with agreed-upon parameters.
|
|
(ac)
|
Notional value represents the total face amount of U.S. Treasury securities underlying all contracts held. As of December 31, 2016, a total of
70
contracts were held.
|
See Notes to Consolidated Financial Statements
108
ELLINGTON FINANCIAL LLC
CONSOLIDATED CONDENSED SCHEDULE OF INVESTMENTS
AT DECEMBER 31, 2016 (CONCLUDED)
|
(ad)
|
The table below shows the Company's long investment ratings from Moody's, Standard and Poor's, or Fitch, as well as the Company's long investments that were unrated but guaranteed by the Federal National Mortgage Association, the Federal Home Loan Mortgage Corporation, or the Government National Mortgage Association. Ratings tend to be a lagging credit indicator; as a result, the credit quality of the Company's long investment holdings may be lower than the credit quality implied based on the ratings listed below. In situations where an investment has a split rating, the lowest provided rating is used. The ratings descriptions include ratings qualified with a "+," "-," "1," "2," or "3."
|
|
Rating Description
|
Percent of Equity
|
||
|
Unrated but Agency-Guaranteed
|
139.27
|
%
|
|
|
Aaa/AAA/AAA
|
0.84
|
%
|
|
|
Aa/AA/AA
|
0.03
|
%
|
|
|
A/A/A
|
0.05
|
%
|
|
|
Baa/BBB/BBB
|
2.60
|
%
|
|
|
Ba/BB/BB or below
|
30.24
|
%
|
|
|
Unrated
|
60.39
|
%
|
|
See Notes to Consolidated Financial Statements
109
ELLINGTON FINANCIAL LLC
CONSOLIDATED CONDENSED SCHEDULE OF INVESTMENTS
AT DECEMBER 31, 2015
|
Current Principal/Number of Shares
|
Description
|
Rate
|
Maturity
|
Fair Value
|
|||||||
|
(In thousands)
|
|
|
|
Expressed in U.S.
Dollars
|
|||||||
|
Cash Equivalents—Money Market Funds (21.65%) (a)(b)
|
|||||||||||
|
North America
|
|||||||||||
|
Funds
|
|||||||||||
|
100,000
|
|
BlackRock Liquidity Funds TempFund Portfolio
|
0.04%
|
$
|
100,000
|
|
|||||
|
50,000
|
|
JPMorgan Prime Money Market Fund
|
0.01%
|
50,000
|
|
||||||
|
10,000
|
|
Various Money Market Funds
|
—%
|
10,000
|
|
||||||
|
Total Cash Equivalents—Money Market Funds (Cost $160,000)
|
$
|
160,000
|
|
||||||||
|
Long Investments (224.79%) (a) (b) (ac)
|
||||||||||||
|
Mortgage-Backed Securities (182.64%)
|
||||||||||||
|
Agency Securities (143.52%) (c)
|
||||||||||||
|
Fixed Rate Agency Securities (138.57%)
|
||||||||||||
|
Principal and Interest–Fixed Rate Agency Securities (124.31%)
|
||||||||||||
|
North America
|
||||||||||||
|
Mortgage-related—Residential
|
||||||||||||
|
$
|
160,391
|
|
Federal Home Loan Mortgage Corporation Pools (30 Year)
|
4.00%
|
9/42 - 8/45
|
$
|
170,500
|
|
||||
|
128,637
|
|
Federal National Mortgage Association Pools (30 Year)
|
4.00%
|
8/42 - 10/45
|
136,894
|
|
||||||
|
110,746
|
|
Federal National Mortgage Association Pools (30 Year)
|
4.50%
|
10/41 - 10/45
|
120,785
|
|
||||||
|
72,425
|
|
Federal National Mortgage Association Pools (30 Year)
|
3.50%
|
10/42 - 10/45
|
74,959
|
|
||||||
|
54,658
|
|
Federal National Mortgage Association Pools (30 Year)
|
5.00%
|
10/35 - 12/44
|
60,473
|
|
||||||
|
45,792
|
|
Federal National Mortgage Association Pools (15 Year)
|
3.50%
|
3/28 - 10/30
|
48,211
|
|
||||||
|
42,655
|
|
Federal Home Loan Mortgage Corporation Pools (30 Year)
|
4.50%
|
9/43 - 10/45
|
46,365
|
|
||||||
|
31,481
|
|
Government National Mortgage Association Pools (30 Year)
|
4.00%
|
6/45 - 10/45
|
33,620
|
|
||||||
|
29,417
|
|
Federal Home Loan Mortgage Corporation Pools (30 Year)
|
3.50%
|
1/42 - 10/45
|
30,458
|
|
||||||
|
21,705
|
|
Federal Home Loan Mortgage Corporation Pools (15 Year)
|
3.50%
|
9/28 - 9/30
|
22,848
|
|
||||||
|
15,056
|
|
Government National Mortgage Association Pools (30 Year)
|
4.50%
|
8/45 - 9/45
|
16,328
|
|
||||||
|
13,060
|
|
Federal National Mortgage Association Pools (15 Year)
|
3.00%
|
4/30 - 10/30
|
13,500
|
|
||||||
|
11,558
|
|
Federal National Mortgage Association Pools (15 Year)
|
4.00%
|
6/26 - 12/29
|
12,284
|
|
||||||
|
8,154
|
|
Government National Mortgage Association Pools (Other)
|
4.56%
|
1/65
|
8,850
|
|
||||||
|
7,799
|
|
Federal National Mortgage Association Pools (Other)
|
5.00%
|
9/43 - 1/44
|
8,680
|
|
||||||
|
8,221
|
|
Federal Home Loan Mortgage Corporation Pools (Other)
|
3.50%
|
2/30 - 6/43
|
8,508
|
|
||||||
|
6,705
|
|
Government National Mortgage Association Pools (Other)
|
4.68%
|
11/63 - 9/64
|
7,280
|
|
||||||
|
6,196
|
|
Government National Mortgage Association Pools (Other)
|
4.61%
|
6/64 - 11/64
|
6,734
|
|
||||||
|
6,041
|
|
Government National Mortgage Association Pools (Other)
|
4.59%
|
11/64
|
6,565
|
|
||||||
|
6,114
|
|
Federal National Mortgage Association Pools (20 Year)
|
4.00%
|
11/33 - 12/33
|
6,558
|
|
||||||
|
6,256
|
|
Federal National Mortgage Association Pools (30 Year)
|
3.00%
|
1/43 - 2/43
|
6,266
|
|
||||||
|
5,859
|
|
Federal Home Loan Mortgage Corporation Pools (15 Year)
|
3.00%
|
3/28 - 4/30
|
6,054
|
|
||||||
|
4,888
|
|
Government National Mortgage Association Pools (Other)
|
4.62%
|
12/63
|
5,285
|
|
||||||
|
4,713
|
|
Federal National Mortgage Association Pools (30 Year)
|
5.50%
|
10/39
|
5,248
|
|
||||||
|
4,564
|
|
Federal National Mortgage Association Pools (15 Year)
|
4.50%
|
4/26
|
4,914
|
|
||||||
|
3,764
|
|
Government National Mortgage Association Pools (Other)
|
4.50%
|
7/61
|
4,057
|
|
||||||
|
3,748
|
|
Government National Mortgage Association Pools (Other)
|
4.75%
|
1/61
|
3,877
|
|
||||||
|
3,406
|
|
Government National Mortgage Association Pools (Other)
|
4.63%
|
10/64
|
3,704
|
|
||||||
|
3,402
|
|
Government National Mortgage Association Pools (30 Year)
|
3.50%
|
4/45
|
3,551
|
|
||||||
See Notes to Consolidated Financial Statements
110
ELLINGTON FINANCIAL LLC
CONSOLIDATED CONDENSED SCHEDULE OF INVESTMENTS
AT DECEMBER 31, 2015 (CONTINUED)
|
Current Principal/Notional Value
|
Description
|
Rate
|
Maturity
|
Fair Value
|
||||||||
|
(In thousands)
|
|
Expressed in U.S.
Dollars
|
||||||||||
|
(continued)
|
||||||||||||
|
$
|
3,376
|
|
Government National Mortgage Association Pools (Other)
|
4.80%
|
2/61
|
$
|
3,504
|
|
||||
|
3,129
|
|
Government National Mortgage Association Pools (Other)
|
4.49%
|
11/64
|
3,376
|
|
||||||
|
2,966
|
|
Government National Mortgage Association Pools (Other)
|
5.49%
|
4/60
|
3,151
|
|
||||||
|
2,780
|
|
Federal Home Loan Mortgage Corporation Pools (Other)
|
4.50%
|
5/44
|
3,031
|
|
||||||
|
2,680
|
|
Government National Mortgage Association Pools (Other)
|
4.64%
|
3/65
|
2,924
|
|
||||||
|
2,788
|
|
Federal Home Loan Mortgage Corporation Pools (Other)
|
3.00%
|
6/28
|
2,880
|
|
||||||
|
2,533
|
|
Federal National Mortgage Association Pools (30 Year)
|
6.00%
|
9/39 - 2/40
|
2,866
|
|
||||||
|
2,469
|
|
Government National Mortgage Association Pools (Other)
|
5.54%
|
2/60
|
2,598
|
|
||||||
|
2,326
|
|
Government National Mortgage Association Pools (Other)
|
5.51%
|
2/60
|
2,479
|
|
||||||
|
1,988
|
|
Federal Home Loan Mortgage Corporation Pools (15 Year)
|
4.00%
|
2/29
|
2,121
|
|
||||||
|
1,608
|
|
Federal Home Loan Mortgage Corporation Pools (30 Year)
|
6.00%
|
4/39 - 5/40
|
1,807
|
|
||||||
|
1,352
|
|
Federal Home Loan Mortgage Corporation Pools (20 Year)
|
4.50%
|
12/33
|
1,471
|
|
||||||
|
1,139
|
|
Federal Home Loan Mortgage Corporation Pools (30 Year)
|
3.00%
|
7/43
|
1,140
|
|
||||||
|
879
|
|
Federal Home Loan Mortgage Corporation Pools (30 Year)
|
5.00%
|
7/44
|
964
|
|
||||||
|
689
|
|
Federal Home Loan Mortgage Corporation Pools (30 Year)
|
5.50%
|
8/33
|
764
|
|
||||||
|
126
|
|
Federal National Mortgage Association Pools (Other)
|
4.00%
|
6/37
|
130
|
|
||||||
|
918,562
|
|
|||||||||||
|
Interest Only–Fixed Rate Agency Securities (1.00%)
|
||||||||||||
|
North America
|
||||||||||||
|
Mortgage-related—Residential
|
||||||||||||
|
8,681
|
|
Government National Mortgage Association
|
5.50%
|
11/43
|
1,603
|
|
||||||
|
11,249
|
|
Federal National Mortgage Association
|
5.00%
|
1/36 - 5/40
|
1,425
|
|
||||||
|
8,889
|
|
Federal National Mortgage Association
|
4.50%
|
12/20 - 5/43
|
963
|
|
||||||
|
5,977
|
|
Federal Home Loan Mortgage Corporation
|
3.50%
|
12/32
|
869
|
|
||||||
|
4,884
|
|
Federal Home Loan Mortgage Corporation
|
5.00%
|
3/40
|
519
|
|
||||||
|
3,909
|
|
Federal National Mortgage Association
|
3.00%
|
9/41
|
421
|
|
||||||
|
2,019
|
|
Government National Mortgage Association
|
4.75%
|
7/40
|
378
|
|
||||||
|
1,544
|
|
Government National Mortgage Association
|
6.00%
|
6/38
|
330
|
|
||||||
|
3,782
|
|
Government National Mortgage Association
|
5.00%
|
5/37
|
311
|
|
||||||
|
1,651
|
|
Federal National Mortgage Association
|
5.50%
|
10/40
|
239
|
|
||||||
|
1,346
|
|
Federal National Mortgage Association
|
4.00%
|
5/39
|
219
|
|
||||||
|
1,109
|
|
Federal Home Loan Mortgage Corporation
|
5.50%
|
1/39
|
126
|
|
||||||
|
7,403
|
|
|||||||||||
|
TBA–Fixed Rate Agency Securities (13.26%)
|
||||||||||||
|
North America
|
||||||||||||
|
Mortgage-related—Residential
|
||||||||||||
|
40,262
|
|
Federal National Mortgage Association (30 Year)
|
4.00%
|
1/16
|
42,607
|
|
||||||
|
26,600
|
|
Federal Home Loan Mortgage Corporation (30 Year)
|
3.50%
|
1/16
|
27,394
|
|
||||||
|
15,040
|
|
Federal Home Loan Mortgage Corporation (30 Year)
|
3.00%
|
1/16
|
15,022
|
|
||||||
|
9,800
|
|
Federal National Mortgage Association (15 Year)
|
2.50%
|
1/16
|
9,879
|
|
||||||
|
2,200
|
|
Government National Mortgage Association (30 Year)
|
4.50%
|
1/16
|
2,364
|
|
||||||
|
700
|
|
Government National Mortgage Association (30 Year)
|
4.00%
|
1/16
|
743
|
|
||||||
|
98,009
|
|
|||||||||||
|
Total Fixed Rate Agency Securities (Cost $1,023,479)
|
1,023,974
|
|
||||||||||
See Notes to Consolidated Financial Statements
111
ELLINGTON FINANCIAL LLC
CONSOLIDATED CONDENSED SCHEDULE OF INVESTMENTS
AT DECEMBER 31, 2015 (CONTINUED)
|
Current Principal /Notional Value
|
Description
|
Rate
|
Maturity
|
Fair Value
|
||||||||
|
(In thousands)
|
|
Expressed in U.S.
Dollars
|
||||||||||
|
Floating Rate Agency Securities (4.95%)
|
||||||||||||
|
Principal and Interest–Floating Rate Agency Securities (2.58%)
|
||||||||||||
|
North America
|
||||||||||||
|
Mortgage-related—Residential
|
||||||||||||
|
$
|
9,490
|
|
Federal National Mortgage Association Pools
|
2.05% - 6.04%
|
9/35 - 5/45
|
$
|
9,990
|
|
||||
|
6,287
|
|
Federal Home Loan Mortgage Corporation Pools
|
2.61% - 5.94%
|
6/37 - 5/44
|
6,625
|
|
||||||
|
2,349
|
|
Government National Mortgage Association Pools
|
2.55%
|
11/64
|
2,476
|
|
||||||
|
19,091
|
|
|||||||||||
|
Interest Only–Floating Rate Agency Securities (2.37%)
|
||||||||||||
|
North America
|
||||||||||||
|
Mortgage-related—Residential
|
||||||||||||
|
203,125
|
|
Government National Mortgage Association
|
0.43% - 6.35%
|
11/42 - 10/63
|
12,186
|
|
||||||
|
18,517
|
|
Federal National Mortgage Association
|
5.50% - 7.13%
|
6/33 - 12/41
|
2,718
|
|
||||||
|
20,272
|
|
Resecuritization of Government National Mortgage Association (d)
|
4.31%
|
8/60
|
1,486
|
|
||||||
|
6,446
|
|
Federal Home Loan Mortgage Corporation
|
5.67% - 6.30%
|
3/36 - 8/39
|
1,125
|
|
||||||
|
17,515
|
|
|||||||||||
|
Total Floating Rate Agency Securities (Cost $36,192)
|
36,606
|
|
||||||||||
|
Total Agency Securities (Cost $1,059,671)
|
1,060,580
|
|
||||||||||
|
Private Label Securities (39.12%)
|
||||||||||||
|
Principal and Interest–Private Label Securities (38.20%)
|
||||||||||||
|
North America (32.11%)
|
||||||||||||
|
Mortgage-related—Residential
|
||||||||||||
|
380,261
|
|
Various
|
0.00% - 9.35%
|
5/19 - 9/46
|
212,869
|
|
||||||
|
Mortgage-related—Commercial
|
||||||||||||
|
84,045
|
|
Various
|
3.00% - 4.40%
|
7/45 - 2/48
|
24,456
|
|
||||||
|
Total North America (Cost $229,780)
|
237,325
|
|
||||||||||
|
Europe (6.09%)
|
||||||||||||
|
Mortgage-related—Residential
|
||||||||||||
|
50,851
|
|
Various
|
0.00% - 5.32%
|
6/25 - 3/50
|
37,164
|
|
||||||
|
Mortgage-related—Commercial
|
||||||||||||
|
7,821
|
|
Various
|
0.00% - 11.00%
|
6/17 - 6/19
|
7,812
|
|
||||||
|
Total Europe (Cost $50,695)
|
44,976
|
|
||||||||||
|
Total Principal and Interest–Private Label Securities (Cost $280,475)
|
282,301
|
|
||||||||||
|
Principal Only–Private Label Securities (0.51%)
|
||||||||||||
|
North America
|
||||||||||||
|
Mortgage-related—Residential
|
||||||||||||
|
5,800
|
|
Various
|
—%
|
8/30
|
3,749
|
|
||||||
|
Total Principal Only–Private Label Securities (Cost $3,024)
|
3,749
|
|
||||||||||
See Notes to Consolidated Financial Statements
112
ELLINGTON FINANCIAL LLC
CONSOLIDATED CONDENSED SCHEDULE OF INVESTMENTS
AT DECEMBER 31, 2015 (CONTINUED)
|
Current Principal /Notional Value
|
Description
|
Rate
|
Maturity
|
Fair Value
|
||||||||
|
(In thousands)
|
|
Expressed in U.S.
Dollars
|
||||||||||
|
Interest Only–Private Label Securities (0.41%)
|
||||||||||||
|
North America
|
||||||||||||
|
Mortgage-related—Residential
|
||||||||||||
|
$
|
41,097
|
|
Various
|
0.50% - 2.00%
|
6/44 - 9/47
|
$
|
1,135
|
|
||||
|
Mortgage-related—Commercial
|
||||||||||||
|
27,254
|
|
Various
|
1.43% - 1.57%
|
10/47 - 2/48
|
1,877
|
|
||||||
|
Total Interest Only–Private Label Securities (Cost $2,110)
|
3,012
|
|
||||||||||
|
Other Private Label Securities (0.00%)
|
||||||||||||
|
North America
|
||||||||||||
|
Mortgage-related—Residential
|
||||||||||||
|
100,882
|
|
Various
|
—%
|
6/37
|
—
|
|
||||||
|
Mortgage-related—Commercial
|
||||||||||||
|
—
|
|
Various
|
—%
|
7/45 - 2/48
|
—
|
|
||||||
|
Total Other Private Label Securities (Cost $273)
|
—
|
|
||||||||||
|
Total Private Label Securities (Cost $285,882)
|
289,062
|
|
||||||||||
|
Total Mortgage-Backed Securities (Cost $1,345,553)
|
1,349,642
|
|
||||||||||
|
Collateralized Loan Obligations (6.22%)
|
||||||||||||
|
North America (2.86%)
|
||||||||||||
|
67,640
|
|
Various
|
0.00% - 9.15%
|
5/16 - 9/68
|
21,120
|
|
||||||
|
Total North America (Cost $26,341)
|
21,120
|
|
||||||||||
|
Europe (3.36%)
|
||||||||||||
|
35,472
|
|
Various
|
0.00% - 4.43%
|
1/22 - 12/56
|
24,854
|
|
||||||
|
Total Europe (Cost $26,235)
|
24,854
|
|
||||||||||
|
Total Collateralized Loan Obligations (Cost $52,576)
|
45,974
|
|
||||||||||
|
Consumer Loans and Asset-backed Securities backed by Consumer Loans (15.61%) (e)
|
||||||||||||
|
North America (15.22%)
|
||||||||||||
|
Consumer (f)
|
||||||||||||
|
109,763
|
|
Various
|
5.50% - 49.00%
|
1/16 - 12/20
|
112,471
|
|
||||||
|
Total North America (Cost $112,840)
|
112,471
|
|
||||||||||
|
Europe (0.39%)
|
||||||||||||
|
Consumer
|
||||||||||||
|
2,163
|
|
Various
|
—%
|
8/24
|
2,905
|
|
||||||
|
Total Europe (Cost $2,784)
|
2,905
|
|
||||||||||
|
Total Consumer Loans and Asset-backed Securities backed by Consumer Loans (Cost $115,624)
|
115,376
|
|
||||||||||
See Notes to Consolidated Financial Statements
113
ELLINGTON FINANCIAL LLC
CONSOLIDATED CONDENSED SCHEDULE OF INVESTMENTS
AT DECEMBER 31, 2015 (CONTINUED)
|
Current Principal/Number of Properties
|
Description
|
Rate
|
Maturity
|
Fair Value
|
||||||||
|
(In thousands)
|
|
Expressed in U.S.
Dollars
|
||||||||||
|
Corporate Debt (3.66%)
|
||||||||||||
|
North America (2.50%)
|
||||||||||||
|
Basic Materials
|
||||||||||||
|
$
|
5,720
|
|
Various
|
11.75%
|
1/19
|
$
|
889
|
|
||||
|
Consumer
|
||||||||||||
|
3,985
|
|
Various
|
0.00% - 10.00%
|
5/20 - 7/20
|
1,282
|
|
||||||
|
Energy
|
||||||||||||
|
14,193
|
|
Various
|
6.50% - 12.25%
|
9/18 - 2/20
|
2,459
|
|
||||||
|
Financial
|
||||||||||||
|
54
|
|
Various
|
10.25%
|
8/23
|
52
|
|
||||||
|
Mortgage-related—Residential
|
||||||||||||
|
14,250
|
|
Various
|
15.00%-20.00%
|
12/17 - 10/19
|
13,770
|
|
||||||
|
Total North America (Cost $25,815)
|
18,452
|
|
||||||||||
|
Europe (1.16%)
|
||||||||||||
|
Communications
|
||||||||||||
|
7,885
|
|
Various
|
14.00%
|
10/18
|
8,083
|
|
||||||
|
Consumer
|
||||||||||||
|
16,443
|
|
Various
|
—%
|
12/16
|
493
|
|
||||||
|
Total Europe (Cost $8,971)
|
8,576
|
|
||||||||||
|
Total Corporate Debt (Cost $34,786)
|
27,028
|
|
||||||||||
|
Mortgage Loans (11.97%) (e)
|
||||||||||||
|
North America
|
||||||||||||
|
Mortgage-related—Commercial (g)
|
||||||||||||
|
77,556
|
|
Various
|
2.54% - 12.00%
|
4/16 - 7/45
|
66,399
|
|
||||||
|
Mortgage-related—Residential (i)
|
||||||||||||
|
30,267
|
|
Various
|
1.00% - 13.50%
|
7/21 - 9/55
|
22,089
|
|
||||||
|
Total Mortgage Loans (Cost $89,009)
|
88,488
|
|
||||||||||
|
Real Estate Owned (1.70%) (e) (h)
|
||||||||||||
|
North America
|
||||||||||||
|
Real estate-related
|
||||||||||||
|
28
|
|
Single-Family Houses
|
4,090
|
|
||||||||
|
2
|
|
Commercial Property
|
8,432
|
|
||||||||
|
Total Real Estate Owned (Cost $12,254)
|
12,522
|
|
||||||||||
See Notes to Consolidated Financial Statements
114
ELLINGTON FINANCIAL LLC
CONSOLIDATED CONDENSED SCHEDULE OF INVESTMENTS
AT DECEMBER 31, 2015 (CONTINUED)
|
Current Principal/Number of Shares
|
Description
|
Rate
|
Maturity
|
Fair Value
|
||||||||
|
(In thousands)
|
|
Expressed in U.S.
Dollars
|
||||||||||
|
Private Corporate Equity Investments (2.99%)
|
||||||||||||
|
North America (2.99%)
|
||||||||||||
|
Consumer
|
||||||||||||
|
$
|
1,592
|
|
Non-Exchange Traded Corporate Equity
|
$
|
3,032
|
|
||||||
|
Diversified
|
||||||||||||
|
160
|
|
Non-Exchange Traded Corporate Equity
|
2,389
|
|
||||||||
|
Mortgage-related—Commercial
|
||||||||||||
|
8,171
|
|
Non-Exchange Traded Preferred Equity Investment in Commercial Mortgage-Related Private Partnership
|
7,687
|
|
||||||||
|
n/a
|
|
Non-Controlling Interest in Mortgage-Related Private Partnership
|
2,871
|
|
||||||||
|
Mortgage-related—Residential
|
||||||||||||
|
9,482
|
|
Non-Exchange Traded Preferred Equity Investment in Mortgage Originators
|
4,325
|
|
||||||||
|
7,479
|
|
Non-Exchange Traded Equity Investment in Mortgage Originators
|
1,043
|
|
||||||||
|
Technology
|
||||||||||||
|
99
|
|
Non-Exchange Traded Corporate Equity
|
741
|
|
||||||||
|
Total North America (Cost $22,598)
|
22,088
|
|
||||||||||
|
Europe (0.00%)
|
||||||||||||
|
Consumer
|
||||||||||||
|
125
|
|
Non-Exchange Traded Corporate Equity
|
—
|
|
||||||||
|
Total Europe (Cost $0)
|
—
|
|
||||||||||
|
Private Corporate Equity Investments (Cost $22,598)
|
22,088
|
|
||||||||||
|
Total Long Investments (Cost $1,672,400)
|
$
|
1,661,118
|
|
|||||||||
See Notes to Consolidated Financial Statements
115
ELLINGTON FINANCIAL LLC
CONSOLIDATED CONDENSED SCHEDULE OF INVESTMENTS
AT DECEMBER 31, 2015 (CONTINUED)
|
Current Principal
|
Description
|
Rate
|
Maturity
|
Fair Value
|
||||||||
|
(In thousands)
|
|
Expressed in U.S.
Dollars
|
||||||||||
|
Repurchase Agreements (14.30%) (a) (b) (j)
|
||||||||||||
|
$
|
19,472
|
|
Bank of America Securities
|
(0.25)%
|
1/16
|
$
|
19,472
|
|
||||
|
Collateralized by Par Value $19,570
|
||||||||||||
|
U.S. Treasury Note, Coupon 1.63%,
|
||||||||||||
|
Maturity Date 11/20
|
||||||||||||
|
15,296
|
|
Barclays Capital Inc.
|
(0.48)%
|
1/16
|
15,295
|
|
||||||
|
Collateralized by Par Value $14,941
|
||||||||||||
|
Sovereign Government Bond, Coupon 0.25%,
|
||||||||||||
|
Maturity Date 4/18
|
||||||||||||
|
14,756
|
|
Bank of America Securities
|
0.35%
|
1/16
|
14,756
|
|
||||||
|
Collateralized by Par Value $15,000
|
||||||||||||
|
U.S. Treasury Note, Coupon 2.00%,
|
||||||||||||
|
Maturity Date 2/25
|
||||||||||||
|
13,200
|
|
Deutsche Bank Securities
|
(1.00)%
|
1/16
|
13,200
|
|
||||||
|
Collateralized by Par Value $13,200
|
||||||||||||
|
U.S. Treasury Note, Coupon 2.25%,
|
||||||||||||
|
Maturity Date 11/25
|
||||||||||||
|
8,240
|
|
Bank of America Securities
|
0.40%
|
1/16
|
8,240
|
|
||||||
|
Collateralized by Par Value $8,250
|
||||||||||||
|
U.S. Treasury Note, Coupon 1.75%,
|
||||||||||||
|
Maturity Date 12/20
|
||||||||||||
|
7,905
|
|
Barclays Capital Inc.
|
(0.48)%
|
1/16
|
7,905
|
|
||||||
|
Collateralized by Par Value $7,050
|
||||||||||||
|
Sovereign Government Bond, Coupon 2.75%,
|
||||||||||||
|
Maturity Date 4/19
|
||||||||||||
|
5,000
|
|
Bank of America Securities
|
0.30%
|
1/16
|
5,000
|
|
||||||
|
Collateralized by Par Value $5,000
|
||||||||||||
|
U.S. Treasury Note, Coupon 1.25%,
|
||||||||||||
|
Maturity Date 10/18
|
||||||||||||
|
3,980
|
|
Bank of America Securities
|
0.40%
|
1/16
|
3,980
|
|
||||||
|
Collateralized by Par Value $4,000
|
||||||||||||
|
U.S. Treasury Note, Coupon 1.63%,
|
||||||||||||
|
Maturity Date 6/20
|
||||||||||||
|
3,965
|
|
Bank of America Securities
|
0.40%
|
1/16
|
3,965
|
|
||||||
|
Collateralized by Par Value $4,000
|
||||||||||||
|
U.S. Treasury Note, Coupon 1.50%,
|
||||||||||||
|
Maturity Date 5/20
|
||||||||||||
|
3,960
|
|
Bank of America Securities
|
0.40%
|
1/16
|
3,960
|
|
||||||
|
Collateralized by Par Value $4,000
|
||||||||||||
|
U.S. Treasury Note, Coupon 1.38%,
|
||||||||||||
|
Maturity Date 3/20
|
||||||||||||
See Notes to Consolidated Financial Statements
116
ELLINGTON FINANCIAL LLC
CONSOLIDATED CONDENSED SCHEDULE OF INVESTMENTS
AT DECEMBER 31, 2015 (CONTINUED)
|
Current Principal
|
Description
|
Rate
|
Maturity
|
Fair Value
|
||||||||
|
(In thousands)
|
|
Expressed in U.S.
Dollars
|
||||||||||
|
(continued)
|
||||||||||||
|
$
|
3,204
|
|
Bank of America Securities
|
0.40%
|
1/16
|
$
|
3,204
|
|
||||
|
Collateralized by Par Value $3,200
|
||||||||||||
|
U.S. Treasury Note, Coupon 2.25%,
|
||||||||||||
|
Maturity Date 11/24
|
||||||||||||
|
2,008
|
|
Bank of America Securities
|
0.35%
|
1/16
|
2,008
|
|
||||||
|
Collateralized by Par Value $2,000
|
||||||||||||
|
U.S. Treasury Note, Coupon 2.00%,
|
||||||||||||
|
Maturity Date 7/22
|
||||||||||||
|
1,985
|
|
RBC Capital Markets LLC
|
0.38%
|
1/16
|
1,985
|
|
||||||
|
Collateralized by Par Value $1,916
|
||||||||||||
|
Sovereign Government Bond, Coupon 4.00%,
|
||||||||||||
|
Maturity Date 9/16
|
||||||||||||
|
1,978
|
|
Bank of America Securities
|
0.25%
|
1/16
|
1,977
|
|
||||||
|
Collateralized by Par Value $2,000
|
||||||||||||
|
U.S. Treasury Note, Coupon 1.25%,
|
||||||||||||
|
Maturity Date 1/20
|
||||||||||||
|
417
|
|
CS First Boston
|
(3.25)%
|
1/16
|
417
|
|
||||||
|
Collateralized by Par Value $560
|
||||||||||||
|
Exchange Traded Corporate Debt, Coupon 10.00%,
|
||||||||||||
|
Maturity Date 6/20
|
||||||||||||
|
336
|
|
RBC Capital Markets LLC
|
(0.75)%
|
1/16
|
336
|
|
||||||
|
Collateralized by Par Value $560
|
||||||||||||
|
Exchange Traded Corporate Debt, Coupon 11.00%,
|
||||||||||||
|
Maturity Date 3/20
|
||||||||||||
|
Total Repurchase Agreements (Cost $105,329)
|
$
|
105,700
|
|
|||||||||
See Notes to Consolidated Financial Statements
117
ELLINGTON FINANCIAL LLC
CONSOLIDATED CONDENSED SCHEDULE OF INVESTMENTS
AT DECEMBER 31, 2015 (CONTINUED)
|
Current Principal/Number of Shares
|
Description
|
Rate
|
Maturity
|
Fair Value
|
||||||||
|
(In thousands)
|
Expressed in U.S.
Dollars
|
|||||||||||
|
Investments Sold Short (-98.62%) (a) (b)
|
||||||||||||
|
TBA–Fixed Rate Agency Securities Sold Short (-82.93%) (k)
|
||||||||||||
|
North America
|
||||||||||||
|
Government
|
||||||||||||
|
$
|
(110,327
|
)
|
Federal Home Loan Mortgage Corporation (30 year)
|
4.00%
|
1/16
|
$
|
(116,593
|
)
|
||||
|
(79,210
|
)
|
Federal National Mortgage Association (30 year)
|
4.50%
|
1/16
|
(85,553
|
)
|
||||||
|
(69,760
|
)
|
Federal National Mortgage Association (15 year)
|
3.50%
|
1/16
|
(73,054
|
)
|
||||||
|
(51,970
|
)
|
Federal National Mortgage Association (30 year)
|
5.00%
|
1/16
|
(57,214
|
)
|
||||||
|
(48,200
|
)
|
Federal National Mortgage Association (30 year)
|
4.00%
|
2/16
|
(50,911
|
)
|
||||||
|
(43,842
|
)
|
Federal National Mortgage Association (30 year)
|
3.50%
|
1/16
|
(45,233
|
)
|
||||||
|
(37,140
|
)
|
Federal National Mortgage Association (15 year)
|
3.00%
|
1/16
|
(38,264
|
)
|
||||||
|
(21,881
|
)
|
Federal Home Loan Mortgage Corporation (30 year)
|
4.50%
|
1/16
|
(23,577
|
)
|
||||||
|
(23,600
|
)
|
Federal National Mortgage Association (30 year)
|
3.00%
|
2/16
|
(23,555
|
)
|
||||||
|
(17,600
|
)
|
Federal National Mortgage Association (30 year)
|
3.50%
|
2/16
|
(18,120
|
)
|
||||||
|
(16,510
|
)
|
Federal Home Loan Mortgage Corporation (15 year)
|
3.00%
|
1/16
|
(17,018
|
)
|
||||||
|
(13,980
|
)
|
Federal Home Loan Mortgage Corporation (15 year)
|
3.50%
|
1/16
|
(14,618
|
)
|
||||||
|
(13,742
|
)
|
Federal National Mortgage Association (30 year)
|
3.00%
|
1/16
|
(13,743
|
)
|
||||||
|
(11,170
|
)
|
Federal National Mortgage Association (15 year)
|
4.00%
|
1/16
|
(11,629
|
)
|
||||||
|
(10,150
|
)
|
Government National Mortgage Association (30 year)
|
4.00%
|
1/16
|
(10,782
|
)
|
||||||
|
(6,860
|
)
|
Federal National Mortgage Association (30 year)
|
5.50%
|
1/16
|
(7,646
|
)
|
||||||
|
(5,050
|
)
|
Government National Mortgage Association (30 year)
|
3.50%
|
1/16
|
(5,267
|
)
|
||||||
|
Total TBA–Fixed Rate Agency Securities Sold Short
(Proceeds -$612,749)
|
(612,777
|
)
|
||||||||||
|
Government Debt Sold Short (-15.43%)
|
||||||||||||
|
North America (-12.11%)
|
||||||||||||
|
Government
|
||||||||||||
|
(90,120
|
)
|
U.S. Treasury Note
|
1.25% - 2.25%
|
10/18 - 8/25
|
(89,489
|
)
|
||||||
|
Total North America (Proceeds -$89,735)
|
(89,489
|
)
|
||||||||||
|
Europe (-3.32%)
|
||||||||||||
|
Government
|
||||||||||||
|
(23,907
|
)
|
European Sovereign Bond
|
0.25% - 4.00%
|
9/16 - 4/19
|
(24,562
|
)
|
||||||
|
Total Europe (Proceeds -$26,010)
|
(24,562
|
)
|
||||||||||
|
Total Government Debt Sold Short (Proceeds -$115,745)
|
(114,051
|
)
|
||||||||||
|
Corporate Debt Sold Short (-0.06%)
|
||||||||||||
|
North America
|
||||||||||||
|
Energy
|
||||||||||||
|
(1,120
|
)
|
Various
|
10.00% - 11.00%
|
3/20 - 6/20
|
(448
|
)
|
||||||
|
Total Corporate Debt Sold Short (Proceeds -$676)
|
(448
|
)
|
||||||||||
|
Common Stock Sold Short (-0.20%)
|
||||||||||||
|
North America
|
||||||||||||
|
Energy
|
||||||||||||
|
(306
|
)
|
Exchange Traded Equity
|
(1,471
|
)
|
||||||||
|
Total Common Stock Sold Short (Proceeds -$1,878)
|
(1,471
|
)
|
||||||||||
|
Total Investments Sold Short (Proceeds -$731,048)
|
$
|
(728,747
|
)
|
|||||||||
See Notes to Consolidated Financial Statements
118
ELLINGTON FINANCIAL LLC
CONSOLIDATED CONDENSED SCHEDULE OF INVESTMENTS
AT DECEMBER 31, 2015 (CONTINUED)
|
Primary Risk
Exposure
|
Notional
Value
|
Range of
Expiration
Dates
|
Fair Value
|
||||||||
|
(In thousands)
|
Expressed in U.S.
Dollars
|
||||||||||
|
Financial Derivatives–Assets (22.05%) (a) (b)
|
|||||||||||
|
Swaps (21.58%) (ad)
|
|||||||||||
|
Long Swaps:
|
|||||||||||
|
Credit Default Swaps on Corporate Bond Indices (l)
|
|||||||||||
|
CDX.NA.HY 25 35-100
|
Credit
|
$
|
442,140
|
|
12/20
|
$
|
81,758
|
|
|||
|
ITRX EUR XOVER 24 5Y 35-100
|
Credit
|
229,954
|
|
12/20
|
46,716
|
|
|||||
|
Other
|
Credit
|
121,730
|
|
6/18 - 6/20
|
7,278
|
|
|||||
|
Total Credit Default Swaps on Corporate Bond Indices
|
135,752
|
|
|||||||||
|
Interest Rate Swaps (m)
|
Interest Rates
|
545,232
|
|
12/16 - 12/45
|
7,254
|
|
|||||
|
Credit Default Swaps on Asset-Backed Indices (l)
|
Credit
|
1,468
|
|
12/37
|
56
|
|
|||||
|
North America
|
|||||||||||
|
Total Return Swaps
|
|||||||||||
|
Communications (q)
|
Credit
|
3,836
|
|
3/16 - 12/16
|
49
|
|
|||||
|
Consumer (q)
|
Credit
|
4,880
|
|
3/16 - 1/17
|
31
|
|
|||||
|
Energy (q)
|
Credit
|
729
|
|
10/16
|
5
|
|
|||||
|
Total Total Return Swaps
|
85
|
|
|||||||||
|
Short Swaps:
|
|||||||||||
|
Credit Default Swaps on Asset-Backed Indices (n)
|
Credit
|
(95,589
|
)
|
5/46 - 5/63
|
5,354
|
|
|||||
|
Credit Default Swaps on Corporate Bond Indices (n)
|
Credit
|
(15,208
|
)
|
12/17 - 12/19
|
1,891
|
|
|||||
|
Interest Rate Swaps (o)
|
Interest Rates
|
(608,365
|
)
|
12/16 - 12/45
|
2,689
|
|
|||||
|
North America
|
|||||||||||
|
Credit Default Swaps on Asset-Backed Securities (n)
|
|||||||||||
|
Mortgage-related—residential
|
Credit
|
(8,967
|
)
|
9/34 - 12/35
|
6,332
|
|
|||||
|
Credit Default Swaps on Corporate Bonds (n)
|
|||||||||||
|
Consumer
|
Credit
|
(590
|
)
|
12/19
|
10
|
|
|||||
|
Total Swaps (Net cost $161,193)
|
159,423
|
|
|||||||||
|
Futures (0.01%)
|
|||||||||||
|
Long Futures:
|
|||||||||||
|
U.S. Treasury Note Futures (s)
|
Interest Rates
|
6,300
|
|
3/16
|
2
|
|
|||||
|
Eurodollar Futures (r)
|
Interest Rates
|
23,000
|
|
6/17
|
17
|
|
|||||
|
Short Futures:
|
|||||||||||
|
Eurodollar Futures (r)
|
Interest Rates
|
(90,000
|
)
|
12/16
|
13
|
|
|||||
|
Total Futures
|
32
|
|
|||||||||
|
Options (0.29%)
|
|||||||||||
|
Purchased Options:
|
|||||||||||
|
Put Options on Credit Default Swaps on Corporate Bond Indices (v)
|
Credit
|
138,000
|
|
3/16
|
2,050
|
|
|||||
|
Call Options on U.S. Treasury Futures (t)
|
Interest Rates
|
3,900
|
|
2/16
|
51
|
|
|||||
|
Put Options on U.S. Treasury Futures (t)
|
Interest Rates
|
3,900
|
|
2/16
|
61
|
|
|||||
|
Total Options (Cost $2,600)
|
2,162
|
|
|||||||||
|
Forwards (0.15%)
|
|||||||||||
|
Short Forwards
|
|||||||||||
|
Currency Forwards (ab)
|
Currency
|
(95,326
|
)
|
3/16
|
1,138
|
|
|||||
|
Total Forwards
|
1,138
|
|
|||||||||
See Notes to Consolidated Financial Statements
119
ELLINGTON FINANCIAL LLC
CONSOLIDATED CONDENSED SCHEDULE OF INVESTMENTS
AT DECEMBER 31, 2015 (CONTINUED)
|
Primary Risk
Exposure |
Notional
Value |
Range of
Expiration Dates |
Fair Value
|
||||||||
|
(In thousands)
|
|
|
|
Expressed in U.S.
Dollars |
|||||||
|
Warrants (0.02%)
|
|||||||||||
|
North America
|
|||||||||||
|
Warrants (u)
|
|||||||||||
|
Mortgage-related—residential
|
Equity Market
|
$
|
1,555
|
|
$
|
150
|
|
||||
|
Total Warrants (Cost $150)
|
150
|
|
|||||||||
|
Total Financial Derivatives–Assets (Net cost $163,943)
|
$
|
162,905
|
|
||||||||
|
Financial Derivatives–Liabilities (-8.18%) (a) (b)
|
|||||||||||
|
Swaps (-7.87%) (ad)
|
|||||||||||
|
Long Swaps:
|
|||||||||||
|
Credit Default Swaps on Asset-Backed Indices (l)
|
Credit
|
4,458
|
|
10/52 - 5/63
|
$
|
(365
|
)
|
||||
|
Interest Rate Swaps (m)
|
Interest Rates
|
129,975
|
|
10/16 - 12/45
|
(278
|
)
|
|||||
|
North America
|
|||||||||||
|
Total Return Swaps
|
|||||||||||
|
Basic Materials (q)
|
Credit
|
6,477
|
|
3/16
|
(822
|
)
|
|||||
|
Communications (q)
|
Credit
|
11,009
|
|
3/16 - 8/16
|
(2,581
|
)
|
|||||
|
Consumer (q)
|
Credit
|
4,983
|
|
6/16 - 8/16
|
(143
|
)
|
|||||
|
Diversified (q)
|
Credit
|
2,765
|
|
3/16
|
(171
|
)
|
|||||
|
Energy (q)
|
Credit
|
4,076
|
|
4/16 - 8/16
|
(812
|
)
|
|||||
|
Energy (p)
|
Equity Market
|
35
|
|
7/17
|
—
|
|
|||||
|
Financial (q)
|
Credit
|
2,646
|
|
9/16
|
(10
|
)
|
|||||
|
Financial (p)
|
Equity Market
|
21,635
|
|
11/16
|
—
|
|
|||||
|
Industrial (q)
|
Credit
|
1,000
|
|
3/16
|
(39
|
)
|
|||||
|
Technology (q)
|
Credit
|
2,650
|
|
1/17
|
(84
|
)
|
|||||
|
Total Total Return Swaps
|
(4,662
|
)
|
|||||||||
|
Short Swaps:
|
|||||||||||
|
Interest Rate Swaps (o)
|
Interest Rates
|
(518,235
|
)
|
1/16 - 1/46
|
(4,656
|
)
|
|||||
|
Credit Default Swaps on Corporate Bond Indices (n)
|
Credit
|
(1,001,913
|
)
|
12/16 - 12/20
|
(47,298
|
)
|
|||||
|
North America
|
|||||||||||
|
Credit Default Swaps on Asset-Backed Securities (n)
|
|||||||||||
|
Mortgage-related—residential
|
Credit
|
(3,209
|
)
|
10/34 - 3/35
|
(221
|
)
|
|||||
|
Credit Default Swaps on Corporate Bonds (n)
|
|||||||||||
|
Consumer
|
Credit
|
(8,780
|
)
|
9/19 - 12/20
|
(584
|
)
|
|||||
|
Financial
|
Credit
|
(4,000
|
)
|
3/20
|
(99
|
)
|
|||||
|
Total Credit Default Swaps on Corporate Bonds
|
(683
|
)
|
|||||||||
|
Total Return Swaps
|
|||||||||||
|
Energy (p)
|
Equity Market
|
(58
|
)
|
7/17
|
—
|
|
|||||
|
Financial (p)
|
Equity Market
|
(4,048
|
)
|
3/17
|
—
|
|
|||||
|
Total Total Return Swaps
|
—
|
|
|||||||||
|
Total Swaps (Net proceeds -$53,679)
|
(58,163
|
)
|
|||||||||
See Notes to Consolidated Financial Statements
120
ELLINGTON FINANCIAL LLC
CONSOLIDATED CONDENSED SCHEDULE OF INVESTMENTS
AT DECEMBER 31, 2015 (CONTINUED)
|
Primary Risk
Exposure |
Notional
Value |
Range of
Expiration Dates |
Fair Value
|
||||||||
|
(In thousands)
|
|
|
|
Expressed in U.S.
Dollars |
|||||||
|
Futures (-0.07%)
|
|||||||||||
|
Long Futures:
|
|||||||||||
|
U.S. Treasury Note Futures (s)
|
Interest Rates
|
$
|
37,700
|
|
3/16
|
$
|
(235
|
)
|
|||
|
Short Futures:
|
|||||||||||
|
Eurodollar Futures (r)
|
Interest Rates
|
(306,000
|
)
|
3/16 - 9/17
|
(293
|
)
|
|||||
|
Total Futures
|
(528
|
)
|
|||||||||
|
Options (-0.24%)
|
|||||||||||
|
Purchased Options:
|
|||||||||||
|
Straddle Swaption (y)
|
Interest Rates
|
8,400
|
|
11/18
|
(31
|
)
|
|||||
|
Written Options:
|
|||||||||||
|
Call Options on Credit Default Swaps on Corporate Bond Indices (w)
|
Credit
|
(273,100
|
)
|
1/16 - 2/16
|
(884
|
)
|
|||||
|
Put Options on Credit Default Swaps on Corporate Bond Indices (x)
|
Credit
|
(171,750
|
)
|
2/16 - 3/16
|
(720
|
)
|
|||||
|
Straddle Swaption (y)
|
Interest Rates
|
(13,100
|
)
|
1/16 - 6/16
|
(125
|
)
|
|||||
|
Total Options (Proceeds -$2,521)
|
(1,760
|
)
|
|||||||||
|
Forwards (0.00%)
|
|||||||||||
|
Long Forwards:
|
|||||||||||
|
Currency Forwards (aa)
|
Currency
|
2,734
|
|
3/16
|
(13
|
)
|
|||||
|
Total Forwards
|
(13
|
)
|
|||||||||
|
Mortgage Loan Purchase Commitments (0.00%)
|
|||||||||||
|
North America
|
|||||||||||
|
Mortgage Loan Purchase Commitments (z)
|
|||||||||||
|
Mortgage-related—residential
|
Interest Rates
|
7,713
|
|
1/16 - 2/16
|
(8
|
)
|
|||||
|
Total Mortgage Loan Purchase Commitments
|
(8
|
)
|
|||||||||
|
Total Financial Derivatives–Liabilities
(Net proceeds -$56,200)
|
$
|
(60,472
|
)
|
||||||||
See Notes to Consolidated Financial Statements
121
ELLINGTON FINANCIAL LLC
CONSOLIDATED CONDENSED SCHEDULE OF INVESTMENTS
AT DECEMBER 31, 2015 (CONCLUDED)
|
(a)
|
See Note 2 and Note 3 in Notes to Consolidated Financial Statements.
|
|
(b)
|
Classification percentages are based on Total Equity.
|
|
(c)
|
At December 31, 2015, the Company's long investments guaranteed by the Federal National Mortgage Association, the Federal Home Loan Mortgage Corporation, and the Government National Mortgage Association, represented
77.17%
,
47.44%
, and
18.91%
of equity, respectively.
|
|
(d)
|
Private trust
100%
backed by interest in Government National Mortgage Association collateralized mortgage obligation certificates.
|
|
(e)
|
Loans and real estate owned are beneficially owned by the Company through participation certificates in the various trusts that hold such investments.
|
|
(f)
|
Includes investments in participation certificates related to loans held in a trust owned by a related party of Ellington Financial Management LLC. Through its participation certificates, the Company has beneficial interests in the cash flows of the underlying loans held by the trust. At December 31, 2015 loans held in the related party trust for which the Company has beneficial interests in the residual cash flows, totaled
$3.8 million
.
|
|
(g)
|
Includes non-performing commercial loans in the amount of
$22.6 million
whereby principal and/or interest is past due and a maturity date is not applicable.
|
|
(h)
|
Number of properties not shown in thousands, represents actual number of properties owned.
|
|
(i)
|
As of December 31, 2015, the Company had residential mortgage loans that were in the process of foreclosure with a fair value of
$5.9 million
.
|
|
(j)
|
In general, securities received pursuant to repurchase agreements were delivered to counterparties in short sale transactions.
|
|
(k)
|
At December 31, 2015, the Company's short investments guaranteed by the Federal National Mortgage Association, the Federal Home Loan Mortgage Corporation, and the Government National Mortgage Association, represented
57.51%
,
23.25%
, and
2.17%
of equity, respectively.
|
|
(l)
|
For long credit default swaps, the Company sold protection.
|
|
(m)
|
For long interest rate swap contracts, the Company pays a floating rate and receives a fixed rate.
|
|
(n)
|
For short credit default swaps, the Company purchased protection.
|
|
(o)
|
For short interest rate swap contracts, the Company pays a fixed rate and receives a floating rate.
|
|
(p)
|
Notional value represents number of underlying shares times the closing price of the underlying security.
|
|
(q)
|
Notional value represents outstanding principal balance on underlying corporate debt.
|
|
(r)
|
Every
$1,000,000
in notional value represents
one
contract.
|
|
(s)
|
Notional value represents the total face amount of U.S. Treasury Notes underlying all contracts held; as of December 31, 2015,
343
long futures contracts were held.
|
|
(t)
|
Represents the option on the part of the Company to enter into a futures contract with a counterparty; as of December 31, 2015,
39
put options and
39
call options contracts were held.
|
|
(u)
|
Notional value represents number of shares that warrants are convertible into.
|
|
(v)
|
Represents the option on the part of the Company to enter into a credit default swap on a corporate bond index whereby the Company would pay a fixed rate and receive credit protection payments.
|
|
(w)
|
Represents the option on the part of a counterparty to enter into a credit default swap on a corporate bond index whereby the Company would pay a fixed rate and receive credit protection payments.
|
|
(x)
|
Represents the option on the part of a counterparty to enter into a credit default swap on a corporate bond index whereby the Company would receive a fixed rate and pay credit protection payments.
|
|
(y)
|
Represents the combination of a written payer swaption and a written receiver swaption on the same underlying swap.
|
|
(z)
|
Notional value represents principal balance of mortgage loan purchase commitments. Actual loan purchases are contingent upon successful loan closings in accordance with agreed-upon parameters.
|
|
(aa)
|
Notional value represents U.S. Dollars to be paid by the Company at the maturity of the forward contract.
|
|
(ab)
|
Notional value represents U.S. Dollars to be received by the Company at the maturity of the forward contract.
|
|
(ac)
|
The table below shows the ratings on the Company's long investments from Moody's, Standard and Poor's, or Fitch, as well as the Company's long investments that were unrated but guaranteed by the Federal National Mortgage Association, the Federal Home Loan Mortgage Corporation, or the Government National Mortgage Association. Ratings tend to be a lagging credit indicator; as a result, the credit quality of the Company's long investment holdings may be lower than the credit quality implied based on the ratings listed below. In situations where an investment has a split rating, the lowest provided rating is used. The ratings descriptions include ratings qualified with a "+," "-," "1," "2," or "3."
|
|
Rating Description
|
Percent of Equity
|
||
|
Unrated but Agency-Guaranteed
|
143.52
|
%
|
|
|
A/A/A
|
0.32
|
%
|
|
|
Baa/BBB/BBB
|
1.07
|
%
|
|
|
Ba/BB/BB or below
|
34.89
|
%
|
|
|
Unrated
|
44.99
|
%
|
|
(ad)
The following table shows the Company's swap assets and liabilities by dealer as a percentage of Total Equity:
|
Dealer/Parent Company
|
Asset/Liability
|
Percent of Equity
|
|||
|
Affiliates of Bank of America
|
Financial derivatives—asset
|
6.01
|
%
|
||
|
Affiliates of JP Morgan
|
Financial derivatives—liability
|
(6.32
|
)%
|
||
See Notes to Consolidated Financial Statements
122
ELLINGTON FINANCIAL LLC
CONSOLIDATED STATEMENT OF OPERATIONS
|
Year Ended
December 31, 2016 |
Year Ended
December 31, 2015 |
Year Ended
December 31, 2014 |
||||||||||
|
(In thousands except per share amounts)
|
Expressed in U.S. Dollars
|
|||||||||||
|
INVESTMENT INCOME
|
||||||||||||
|
Interest income
|
$
|
74,344
|
|
$
|
101,783
|
|
$
|
93,533
|
|
|||
|
Other income
|
5,841
|
|
2,813
|
|
318
|
|
||||||
|
Total investment income
|
80,185
|
|
104,596
|
|
93,851
|
|
||||||
|
EXPENSES
|
||||||||||||
|
Base management fee
|
10,065
|
|
11,493
|
|
10,751
|
|
||||||
|
Incentive fee
|
—
|
|
—
|
|
1,400
|
|
||||||
|
Interest expense
|
16,306
|
|
12,112
|
|
9,927
|
|
||||||
|
Other investment related expenses
|
8,070
|
|
5,612
|
|
4,689
|
|
||||||
|
Professional fees
|
3,474
|
|
3,129
|
|
2,795
|
|
||||||
|
Administration fees
|
1,123
|
|
1,355
|
|
1,231
|
|
||||||
|
Compensation expense
|
2,096
|
|
1,508
|
|
1,182
|
|
||||||
|
Insurance expense
|
597
|
|
641
|
|
734
|
|
||||||
|
Directors' fees and expenses
|
267
|
|
259
|
|
271
|
|
||||||
|
Share-based LTIP expense
|
400
|
|
393
|
|
267
|
|
||||||
|
Other expenses
|
2,022
|
|
1,918
|
|
1,853
|
|
||||||
|
Total expenses
|
44,420
|
|
38,420
|
|
35,100
|
|
||||||
|
NET INVESTMENT INCOME
|
35,765
|
|
66,176
|
|
58,751
|
|
||||||
|
NET REALIZED AND CHANGE IN NET UNREALIZED GAIN (LOSS) ON INVESTMENTS, FINANCIAL DERIVATIVES, AND FOREIGN CURRENCY TRANSACTIONS/TRANSLATION
|
||||||||||||
|
Net realized gain (loss) on:
|
||||||||||||
|
Investments
|
2,729
|
|
34,384
|
|
16,859
|
|
||||||
|
Financial derivatives, excluding currency forwards
|
(40,758
|
)
|
(15,096
|
)
|
(12,841
|
)
|
||||||
|
Financial derivatives—currency forwards
|
4,093
|
|
4,738
|
|
1,630
|
|
||||||
|
Foreign currency transactions
|
(5,597
|
)
|
(3,073
|
)
|
(1,486
|
)
|
||||||
|
(39,533
|
)
|
20,953
|
|
4,162
|
|
|||||||
|
Change in net unrealized gain (loss) on:
|
||||||||||||
|
Investments
|
(8,033
|
)
|
(56,869
|
)
|
6,258
|
|
||||||
|
Financial derivatives, excluding currency forwards
|
(5,964
|
)
|
9,498
|
|
(9,058
|
)
|
||||||
|
Financial derivatives—currency forwards
|
(1,580
|
)
|
377
|
|
786
|
|
||||||
|
Foreign currency translation
|
3,643
|
|
(1,706
|
)
|
(950
|
)
|
||||||
|
(11,934
|
)
|
(48,700
|
)
|
(2,964
|
)
|
|||||||
|
NET REALIZED AND CHANGE IN NET UNREALIZED GAIN (LOSS) ON INVESTMENTS, FINANCIAL DERIVATIVES, AND FOREIGN CURRENCY TRANSACTIONS/TRANSLATION
|
(51,467
|
)
|
(27,747
|
)
|
1,198
|
|
||||||
|
NET INCREASE (DECREASE) IN EQUITY RESULTING FROM OPERATIONS
|
(15,702
|
)
|
38,429
|
|
59,949
|
|
||||||
|
LESS: NET INCREASE IN EQUITY RESULTING FROM OPERATIONS ATTRIBUTABLE TO NON-CONTROLLING INTERESTS
|
305
|
|
340
|
|
782
|
|
||||||
|
NET INCREASE (DECREASE) IN SHAREHOLDERS' EQUITY RESULTING FROM OPERATIONS
|
$
|
(16,007
|
)
|
$
|
38,089
|
|
$
|
59,167
|
|
|||
|
NET INCREASE (DECREASE) IN SHAREHOLDERS' EQUITY RESULTING FROM OPERATIONS PER SHARE:
|
||||||||||||
|
Basic and Diluted
|
$
|
(0.48
|
)
|
$
|
1.13
|
|
$
|
2.09
|
|
|||
See Notes to Consolidated Financial Statements
123
ELLINGTON FINANCIAL LLC
CONSOLIDATED STATEMENT OF CHANGES IN EQUITY
|
Year Ended
December 31, 2016
|
Year Ended
December 31, 2015 |
Year Ended
December 31, 2014 |
||||||||||||||||||||||||||||||||||
|
Shareholders' Equity
|
Non-controlling Interest
|
Total Equity
|
Shareholders' Equity
|
Non-controlling Interest
|
Total Equity
|
Shareholders' Equity
|
Non-controlling Interest
|
Total Equity
|
||||||||||||||||||||||||||||
|
(In thousands)
|
Expressed in U.S. Dollars
|
|||||||||||||||||||||||||||||||||||
|
BEGINNING EQUITY
(12/31/2015, 12/31/2014, and 12/31/2013, respectively) |
$
|
732,049
|
|
$
|
6,903
|
|
$
|
738,952
|
|
$
|
782,155
|
|
$
|
6,389
|
|
$
|
788,544
|
|
$
|
620,401
|
|
$
|
5,648
|
|
$
|
626,049
|
|
|||||||||
|
CHANGE IN EQUITY RESULTING FROM OPERATIONS
|
||||||||||||||||||||||||||||||||||||
|
Net investment income
|
35,765
|
|
66,176
|
|
58,751
|
|
||||||||||||||||||||||||||||||
|
Net realized gain (loss) on investments, financial derivatives, and foreign currency transactions
|
(39,533
|
)
|
20,953
|
|
4,162
|
|
||||||||||||||||||||||||||||||
|
Change in net unrealized gain (loss) on investments, financial derivatives, and foreign currency translation
|
(11,934
|
)
|
(48,700
|
)
|
(2,964
|
)
|
||||||||||||||||||||||||||||||
|
Net increase (decrease) in equity resulting from operations
|
(16,007
|
)
|
305
|
|
(15,702
|
)
|
38,089
|
|
340
|
|
38,429
|
|
59,167
|
|
782
|
|
59,949
|
|
||||||||||||||||||
|
CHANGE IN EQUITY RESULTING FROM TRANSACTIONS
|
||||||||||||||||||||||||||||||||||||
|
Proceeds from the issuance of shares
(1)
|
—
|
|
—
|
|
—
|
|
—
|
|
188,400
|
|
188,400
|
|
||||||||||||||||||||||||
|
Shares issued in connection with incentive fee payment
|
—
|
|
—
|
|
—
|
|
—
|
|
449
|
|
449
|
|
||||||||||||||||||||||||
|
Contributions from non-controlling interests
|
5,552
|
|
5,552
|
|
2,153
|
|
2,153
|
|
1,793
|
|
1,793
|
|
||||||||||||||||||||||||
|
Dividends
(2)
|
(64,735
|
)
|
(413
|
)
|
(65,148
|
)
|
(82,940
|
)
|
(520
|
)
|
(83,460
|
)
|
(85,796
|
)
|
(653
|
)
|
(86,449
|
)
|
||||||||||||||||||
|
Distributions to non-controlling interests
|
(5,249
|
)
|
(5,249
|
)
|
(1,468
|
)
|
(1,468
|
)
|
(1,667
|
)
|
(1,667
|
)
|
||||||||||||||||||||||||
|
Adjustment to non-controlling interest
|
(15
|
)
|
15
|
|
—
|
|
(6
|
)
|
6
|
|
—
|
|
(484
|
)
|
484
|
|
—
|
|
||||||||||||||||||
|
Offering costs
|
—
|
|
—
|
|
—
|
|
—
|
|
(247
|
)
|
(247
|
)
|
||||||||||||||||||||||||
|
Shares repurchased
|
(14,028
|
)
|
(14,028
|
)
|
(5,639
|
)
|
(5,639
|
)
|
—
|
|
—
|
|
||||||||||||||||||||||||
|
Share-based LTIP awards
|
397
|
|
3
|
|
400
|
|
390
|
|
3
|
|
393
|
|
265
|
|
2
|
|
267
|
|
||||||||||||||||||
|
Net increase (decrease) in equity from transactions
|
(78,381
|
)
|
(92
|
)
|
(78,473
|
)
|
(88,195
|
)
|
174
|
|
(88,021
|
)
|
102,587
|
|
(41
|
)
|
102,546
|
|
||||||||||||||||||
|
Net increase (decrease) in equity
|
(94,388
|
)
|
213
|
|
(94,175
|
)
|
(50,106
|
)
|
514
|
|
(49,592
|
)
|
161,754
|
|
741
|
|
162,495
|
|
||||||||||||||||||
|
ENDING EQUITY
(12/31/2016, 12/31/2015, and 12/31/2014, respectively) |
$
|
637,661
|
|
$
|
7,116
|
|
$
|
644,777
|
|
$
|
732,049
|
|
$
|
6,903
|
|
$
|
738,952
|
|
$
|
782,155
|
|
$
|
6,389
|
|
$
|
788,544
|
|
|||||||||
|
(1)
|
For the year ended December 31, 2014 proceeds from the issuance of shares is net of an underwriters' discount of $3.0 million.
|
|
(2)
|
For the years ended December 31, 2016, 2015, and 2014, dividends totaling $1.95, $2.45, and $3.08, respectively, per common share and convertible unit outstanding, were declared and paid.
|
See Notes to Consolidated Financial Statements
124
ELLINGTON FINANCIAL LLC
|
Year Ended December 31,
|
|||||||||||
|
2016
|
2015
|
2014
|
|||||||||
|
(In thousands)
|
Expressed in U.S. Dollars
|
||||||||||
|
INCREASE (DECREASE) IN CASH AND CASH EQUIVALENTS:
|
|||||||||||
|
NET INCREASE (DECREASE) IN EQUITY RESULTING FROM OPERATIONS
|
$
|
(15,702
|
)
|
$
|
38,429
|
|
$
|
59,949
|
|
||
|
Cash flows provided by (used in) operating activities:
|
|||||||||||
|
Reconciliation of the net increase (decrease) in equity resulting from operations to net cash provided by (used in) operating activities:
|
|||||||||||
|
Net realized (gain) loss on investments, financial derivatives, and foreign currency transactions
|
35,498
|
|
(23,454
|
)
|
(6,008
|
)
|
|||||
|
Change in net unrealized (gain) loss on investments and financial derivatives, and foreign currency translation
|
13,664
|
|
48,649
|
|
3,564
|
|
|||||
|
Amortization of premiums and accretion of discounts (net)
|
24,573
|
|
21,815
|
|
(9,131
|
)
|
|||||
|
Purchase of investments
|
(2,246,552
|
)
|
(3,381,699
|
)
|
(5,298,446
|
)
|
|||||
|
Proceeds from disposition of investments
|
2,032,219
|
|
3,570,304
|
|
4,755,862
|
|
|||||
|
Proceeds from principal payments of investments
|
276,880
|
|
284,166
|
|
186,094
|
|
|||||
|
Proceeds from investments sold short
|
1,430,898
|
|
1,461,459
|
|
1,606,561
|
|
|||||
|
Repurchase of investments sold short
|
(1,573,705
|
)
|
(2,031,578
|
)
|
(1,215,239
|
)
|
|||||
|
Payments on financial derivatives
(1)
|
(354,814
|
)
|
(505,956
|
)
|
(191,469
|
)
|
|||||
|
Proceeds from financial derivatives
(1)
|
394,038
|
|
416,103
|
|
173,013
|
|
|||||
|
Shares issued in connection with incentive fee payment
|
—
|
|
—
|
|
449
|
|
|||||
|
Share-based LTIP expense
|
400
|
|
393
|
|
267
|
|
|||||
|
Repurchase agreements
|
(79,119
|
)
|
66,301
|
|
(144,039
|
)
|
|||||
|
(Increase) decrease in assets:
|
|||||||||||
|
Receivable for securities sold and financial derivatives
|
260,636
|
|
531,844
|
|
(354,587
|
)
|
|||||
|
Due from brokers
|
47,954
|
|
5,360
|
|
(64,394
|
)
|
|||||
|
Interest and principal receivable
|
(1,260
|
)
|
167
|
|
(13,780
|
)
|
|||||
|
Restricted cash
|
4,202
|
|
(4,857
|
)
|
—
|
|
|||||
|
Other assets
|
1,910
|
|
(3,295
|
)
|
(565
|
)
|
|||||
|
Increase (decrease) in liabilities:
|
|||||||||||
|
Due to brokers
|
(102,017
|
)
|
92,573
|
|
2,462
|
|
|||||
|
Payable for securities purchased and financial derivatives
|
(80,197
|
)
|
66,618
|
|
(94,300
|
)
|
|||||
|
Accounts payable and accrued expenses
|
(299
|
)
|
846
|
|
1,205
|
|
|||||
|
Incentive fee payable
|
—
|
|
—
|
|
(3,091
|
)
|
|||||
|
Other liabilities
|
(811
|
)
|
828
|
|
—
|
|
|||||
|
Interest and dividends payable
|
1,654
|
|
(580
|
)
|
865
|
|
|||||
|
Base management fee payable
|
(357
|
)
|
(190
|
)
|
599
|
|
|||||
|
Net cash provided by (used in) operating activities
|
69,693
|
|
654,246
|
|
(604,159
|
)
|
|||||
See Notes to Consolidated Financial Statements
125
|
ELLINGTON FINANCIAL LLC
|
|||||||||||
|
CONSOLIDATED STATEMENT OF CASH FLOWS (CONTINUED)
|
|||||||||||
|
Year Ended December 31,
|
|||||||||||
|
2016
|
2015
|
2014
|
|||||||||
|
(In thousands)
|
Expressed in U.S. Dollars
|
||||||||||
|
Cash flows provided by (used in) financing activities:
|
|||||||||||
|
Proceeds from the issuance of shares
|
$
|
—
|
|
$
|
—
|
|
$
|
188,400
|
|
||
|
Contributions from non-controlling interests
|
5,552
|
|
2,153
|
|
1,793
|
|
|||||
|
Shares repurchased
|
(14,028
|
)
|
(5,639
|
)
|
—
|
|
|||||
|
Offering costs paid
|
—
|
|
(56
|
)
|
(288
|
)
|
|||||
|
Dividends paid
|
(65,148
|
)
|
(83,460
|
)
|
(86,449
|
)
|
|||||
|
Distributions to non-controlling interests
|
(5,249
|
)
|
(1,468
|
)
|
(1,667
|
)
|
|||||
|
Proceeds from issuance of securitized debt
|
40,921
|
|
—
|
|
—
|
|
|||||
|
Principal payments on securitized debt
|
(295
|
)
|
(763
|
)
|
(246
|
)
|
|||||
|
Borrowings under reverse repurchase agreements
|
5,762,742
|
|
9,758,474
|
|
23,414,375
|
|
|||||
|
Repayments of reverse repurchase agreements
|
(5,854,823
|
)
|
(10,253,718
|
)
|
(22,981,108
|
)
|
|||||
|
Net cash provided by (used in) financing activities
|
(130,328
|
)
|
(584,477
|
)
|
534,810
|
|
|||||
|
NET INCREASE (DECREASE) IN CASH AND CASH EQUIVALENTS
|
(60,635
|
)
|
69,769
|
|
(69,349
|
)
|
|||||
|
CASH AND CASH EQUIVALENTS, BEGINNING OF PERIOD
|
183,909
|
|
114,140
|
|
183,489
|
|
|||||
|
CASH AND CASH EQUIVALENTS, END OF PERIOD
|
$
|
123,274
|
|
$
|
183,909
|
|
$
|
114,140
|
|
||
|
Supplemental disclosure of cash flow information:
|
|||||||||||
|
Interest paid
|
$
|
15,296
|
|
$
|
12,112
|
|
$
|
9,544
|
|
||
|
Shares issued in connection with incentive fee payment (non-cash)
|
—
|
|
—
|
|
449
|
|
|||||
|
Share-based LTIP awards (non-cash)
|
400
|
|
393
|
|
267
|
|
|||||
|
Aggregate TBA trade activity (buys + sells) (non-cash)
|
22,923,388
|
|
36,357,456
|
|
30,136,820
|
|
|||||
|
Purchase of investments (non-cash)
|
(44,914
|
)
|
—
|
|
—
|
|
|||||
|
Proceeds from principal payments of investments (non-cash)
|
10,365
|
|
—
|
|
—
|
|
|||||
|
Proceeds from the disposition of investments (non-cash)
|
96,131
|
|
—
|
|
—
|
|
|||||
|
Payments on financial derivatives (non-cash)
|
(4,000
|
)
|
—
|
|
—
|
|
|||||
|
Proceeds from financial derivatives (non-cash)
|
7,486
|
|
—
|
|
—
|
|
|||||
|
Proceeds from issuance of securitized debt (non-cash)
|
13,088
|
|
—
|
|
—
|
|
|||||
|
Principal payments on securitized debt (non-cash)
|
(29,629
|
)
|
—
|
|
—
|
|
|||||
|
Repayments of reverse repurchase agreements (non-cash)
|
(48,527
|
)
|
—
|
|
—
|
|
|||||
|
(1)
|
Conformed to current period presentation.
|
See Notes to Consolidated Financial Statements
126
ELLINGTON FINANCIAL LLC
NOTES TO CONSOLIDATED FINANCIAL STATEMENTS
December 31, 2016
1. Organization and Investment Objective
Ellington Financial LLC was formed as a Delaware limited liability company on July 9, 2007 and commenced operations on August 17, 2007. Ellington Financial Operating Partnership LLC (the "Operating Partnership"), a
99.4%
owned consolidated subsidiary of Ellington Financial LLC, was formed as a Delaware limited liability company on December 14, 2012 and commenced operations on January 1, 2013. All of the Company's operations and business activities are conducted through the Operating Partnership. Ellington Financial LLC, the Operating Partnership, and their consolidated subsidiaries are hereafter collectively referred to as the "Company." All intercompany accounts are eliminated in consolidation.
The Company is a specialty finance company that primarily acquires and manages mortgage-related and consumer-related assets, including residential mortgage-backed securities, or "RMBS," residential and commercial mortgage loans, consumer loans and asset-backed securities, or "ABS," backed by consumer loans, commercial mortgage-backed securities, or "CMBS," real property, and mortgage-related derivatives. The Company also invests in corporate debt and equity, including distressed debt, collateralized loan obligations, or "CLOs," non-mortgage-related derivatives and other financial assets, including private debt and equity investments in mortgage-related entities.
Ellington Financial Management LLC ("EFM" or the "Manager") is an SEC-registered investment adviser and a registered commodity pool operator that serves as the Manager to the Company pursuant to the terms of its sixth amended and restated management agreement (the "Management Agreement"). EFM is an affiliate of Ellington Management Group, L.L.C., ("Ellington") an investment management firm that is registered as both an investment adviser and a commodity pool operator. In accordance with the terms of the Management Agreement, the Manager implements the investment strategy and manages the business and operations on a day-to-day basis for the Company and performs certain services for the Company, subject to oversight by the Company's Board of Directors ("Board of Directors").
2. Significant Accounting Policies
(A) Basis of Presentation:
The Company's consolidated financial statements have been prepared in conformity with generally accepted accounting principles in the United States of America, or "U.S. GAAP," for investment companies, ASC 946,
Financial Services—Investment Companies
("ASC 946"). The Company has determined that it meets the definition of an investment company under ASC 946
.
ASC 946 requires, among other things, that investments be reported at fair value in the financial statements. Additionally under ASC 946 the Company generally will not consolidate its interest in any company other than in its subsidiaries that qualify as investment companies under ASC 946. The consolidated financial statements include the accounts of the Company, the Operating Partnership, and its subsidiaries. All intercompany balances and transactions have been eliminated. The preparation of consolidated financial statements in conformity with U.S. GAAP requires management to make estimates and assumptions that affect the reported amounts of assets and liabilities at the date of the consolidated financial statements and the reported amounts of revenues and expenses during the reporting period. Actual results could differ from those estimates.
(B) Valuation:
The Company applies ASC 820-10,
Fair Value Measurement
("ASC 820-10"), to its holdings of financial instruments. ASC 820-10 establishes a three-level valuation hierarchy for disclosure of fair value measurements. The valuation hierarchy is based upon the observability of inputs to the valuation of an asset or liability as of the measurement date. The three levels are defined as follows:
|
•
|
Level 1—inputs to the valuation methodology are observable and reflect quoted prices (unadjusted) for identical assets or liabilities in active markets. Currently, the types of financial instruments the Company generally includes in this category are listed equities, exchange-traded derivatives, and cash equivalents;
|
|
•
|
Level 2—inputs to the valuation methodology other than quoted prices included in Level 1 are observable for the asset or liability, either directly or indirectly. Currently, the types of financial instruments that the Company generally includes in this category are Agency RMBS, non-Agency mortgage-backed securities determined to have sufficiently observable market data, U.S. Treasury securities and sovereign debt, certain corporate debt, commonly traded derivatives, such as interest rate swaps and foreign currency forwards, and certain other over-the-counter derivatives; and
|
|
•
|
Level 3—inputs to the valuation methodology are unobservable and significant to the fair value measurement. The types of financial instruments that the Company generally includes in this category are RMBS, CMBS, ABS, credit default swaps, or "CDS," on individual ABS, distressed corporate debt, and total return swaps on distressed corporate debt, in each case where there is less price transparency. Also included in this category are residential and commercial mortgage loans, consumer loans, non-listed equities, and private corporate debt and equity investments.
|
127
For certain financial instruments, the various inputs that management uses to measure fair value for such financial instrument may fall into different levels of the fair value hierarchy. In such cases, the determination of which category within the fair value hierarchy is appropriate for such financial instrument is based on the lowest level of input that is significant to the fair value measurement. ASC 820 prioritizes the various inputs that management uses to measure fair value with the highest priority to inputs that are observable and reflect quoted prices (unadjusted) for identical assets or liabilities in active markets (Level 1) and the lowest priority to inputs that are unobservable and significant to the fair value measurement (Level 3). The assessment of the significance of a particular input to the fair value measurement in its entirety requires judgment and considers factors specific to the financial instrument. The Company may use valuation techniques consistent with the market and income approaches to measure the fair value of its assets and liabilities. The market approach uses third-party valuations and information obtained from market transactions involving identical or similar assets or liabilities. The income approach uses projections of the future economic benefit of an instrument to determine its fair value, such as in the discounted cash flow methodology. The inputs or methodology used for valuing financial instruments are not necessarily an indication of the risk associated with investing in these financial instruments. Transfers between levels of the fair value hierarchy are assumed to occur at the end of the reporting period.
Summary Valuation Techniques
For financial instruments that are traded in an "active market," the best measure of fair value is the quoted market price. However, many of the Company's financial instruments are not traded in an active market. Therefore, management generally uses third-party valuations when available. If third-party valuations are not available, management uses other valuation techniques, such as the discounted cash flow methodology. The following are summary descriptions, for various categories of financial instruments, of the valuation methodologies management uses in determining fair value of the Company's financial instruments in such categories. Management utilizes such methodologies to assign a good faith fair value (the estimated price that, in an orderly transaction at the valuation date, would be received to sell an asset, or paid to transfer a liability, as the case may be) to each such financial instrument.
For mortgage-backed securities, or "MBS," including To Be Announced MBS, or "TBAs," CLOs, and distressed and non-distressed corporate debt and equity, management seeks to obtain at least one third-party valuation, and often obtains multiple valuations when available. Management has been able to obtain third-party valuations on the vast majority of these instruments and expects to continue to solicit third-party valuations in the future. Management generally values each financial instrument at the average of third-party valuations received and not rejected as described below. Third-party valuations are not binding, and while management generally does not adjust the valuations it receives, management may challenge or reject a valuation when, based on its validation criteria, management determines that such valuation is unreasonable or erroneous. Furthermore, based on its validation criteria, management may determine that the average of the third-party valuations received for a given instrument does not result in what management believes to be the fair value of such instrument, and in such circumstances management may override this average with its own good faith valuation. The validation criteria may take into account output from management's own models, recent trading activity in the same or similar instruments, and valuations received from third parties. The use of proprietary models requires the use of a significant amount of judgment and the application of various assumptions including, but not limited to, assumptions concerning future prepayment rates and default rates. Valuations for fixed rate MBS pass-throughs issued by a U.S. government agency or government-sponsored enterprise are typically based on observable pay-up data (pay-ups are price premiums for specified categories of fixed rate pools relative to their TBA counterparts) or models that use observable market data, such as interest rates and historical prepayment speeds, and are validated against third-party valuations. Given their relatively high level of price transparency, Agency RMBS pass-throughs are typically designated as Level 2 assets, although Agency interest only and inverse interest only RMBS are currently designated as Level 3 assets since they generally have less price transparency. Non-Agency MBS and CLOs are generally classified as either Level 2 or Level 3 based on analysis of available market data such as recent trades and executable bids. The Company's investments in distressed corporate debt are in the form of loans as well as total return swaps on loans. Valuations are typically based on prices of the underlying loans received from widely used third-party pricing services. These investments as well as related non-listed equity investments are generally designated as Level 3 assets. Investments in non-distressed corporate bonds are generally also valued based on prices received from third-party pricing services, and many of these bonds, because they are very liquid with readily observable data, are classified as Level 2 holdings. Furthermore, the methodology used by the third-party valuation providers is reviewed at least annually by management, so as to ascertain whether such providers are utilizing observable market data to determine the valuations that they provide.
For residential and commercial mortgage loans, consumer loans, and real estate owned properties, or "REO," management determines fair value by taking into account both external pricing data, when available, and internal pricing models. Non-performing mortgage loans and REO are typically valued based on management's estimates of the value of the underlying real estate, using various information including general economic data, broker price opinions, or "BPOs," recent sales, property appraisals, and bids. Performing mortgage loans and consumer loans are typically valued using discounted cash flows based on market assumptions and mortgage loans that are not deemed "qualified mortgage," or "QM," loans under the
128
rules of the Consumer Financial Protection Bureau, or "non-QM loans," are valued using matrix pricing. Cash flow assumptions typically include projected default and prepayment rates and loss severities, and may include adjustments based on appraisals and BPOs. Mortgage and consumer loans and REO properties are classified as Level 3 assets.
For financial derivatives with greater price transparency, such as CDS on asset-backed indices, CDS on corporate indices, certain options on the foregoing, and total return swaps on publicly traded equities, market-standard pricing sources are used to obtain valuations; these financial derivatives are generally designated as Level 2 instruments. Interest rate swaps, swaptions, and foreign currency forwards are typically valued based on internal models that use observable market data, including applicable interest rates and foreign currency rates in effect as of the measurement date; the model-generated valuations are then typically compared to counterparty valuations for reasonableness. These financial derivatives are also generally designated as Level 2 instruments. Financial derivatives with less price transparency, such as CDS on individual ABS, are generally valued based on internal models, and are typically designated as Level 3 instruments. In the case of CDS on individual ABS, the valuation process typically starts with an estimation of the value of the underlying ABS. In valuing its derivatives, the Company also considers the creditworthiness of both the Company and its counterparties, along with collateral provisions contained in each derivative agreement.
Investments in private operating entities, such as mortgage originators, are valued based on available metrics, such as relevant market multiples and comparable company valuations, company specific-financial data including actual and projected results and independent third party valuation estimates. These investments are designated as Level 3 assets.
The Company's repurchase agreements are carried at fair value based on their contractual amounts as the debt is short-term in nature. The Company's reverse repurchase agreements are carried at cost, which approximates fair value. Repurchase and reverse repurchase agreements are classified as Level 2 assets and liabilities based on the adequacy of the collateral and their short term nature.
The Company's valuation process, including the application of validation criteria, is overseen by the Manager's Valuation Committee ("Valuation Committee"). The Valuation Committee includes senior level executives from various departments within the Manager, and each quarter, the Valuation Committee reviews and approves the valuations of the Company's investments. The valuation process also includes a monthly review by the Company's third-party administrator. The goal of this review is to replicate various aspects of the Company's valuation process based on the Company's documented procedures.
Because of the inherent uncertainty of valuation, the estimated fair value of the Company's financial instruments may differ significantly from the values that would have been used had a ready market for the financial instruments existed, and the differences could be material to the Company's consolidated financial statements.
(C) Purchase and Sales of Investments and Investment Income:
Purchases and sales of investments are generally recorded on trade date, and realized and unrealized gains and losses are calculated based on identified cost. The Company amortizes premiums and accretes discounts on its debt investments. Coupon interest income on fixed income investments is generally accrued based on the outstanding principal balance or notional value and the current coupon interest rate.
For Agency RMBS and debt securities that are deemed to be of high credit quality at the time of purchase, premiums and discounts are amortized into interest income over the life of such securities using the effective interest method. For securities whose cash flows vary depending on prepayments, an effective yield retroactive to the time of purchase is periodically recomputed based on actual prepayments and changes in projected prepayment activity, and a catch-up adjustment is made to amortization to reflect the cumulative impact of the change in effective yield.
For debt securities (including non-Agency MBS) that are deemed not to be of high credit quality at the time of purchase, interest income is recognized based on the effective interest method. For purposes of determining the effective interest rate, management estimates the future expected cash flows of its investment holdings based on assumptions including, but not limited to, assumptions for future prepayment rates, default rates, and loss severities (each of which may in turn incorporate various macro-economic assumptions, such as future housing prices). These assumptions are re-evaluated not less than quarterly. Principal write-offs are generally treated as realized losses. Changes in projected cash flows, as applied to the current amortized cost of the security, may result in a prospective change in the yield/interest income recognized on such securities.
For each loan purchased with the expectation that both interest and principal will be paid in full, the Company generally amortizes or accretes any premium or discount over the life of the loan utilizing the effective interest method. However, on at least a quarterly basis based on current information and events, the Company re-assesses the collectability of interest and principal, and designates a loan as impaired either when any payments have become
90
or more days past due, or when, in the opinion of management, it is probable that the Company will be unable to collect either interest or principal in full. Once a loan is designated as impaired, as long as principal is still expected to be collectable in full, interest payments are recorded as interest income only when received (i.e., under the cash basis method); accruals of interest income are only resumed when the
129
loan becomes contractually current and performance is demonstrated to be resumed. However, if principal is not expected to be collectable in full, the cost recovery method is used (i.e., no interest income is recognized, and all payments received—whether contractually interest or principal—are applied to cost).
For each loan purchased with evidence of credit deterioration since origination and the expectation that either principal or interest will not be paid in full, interest income is generally recognized using the effective interest method for as long as the cash flows can be reasonably estimated. Here, instead of amortizing the purchase discount (i.e., the excess of the unpaid principal balance over the purchase price) over the life of the loan, the Company effectively amortizes the accretable yield (i.e., the excess of the Company's estimate of the total cash flows to be collected over the life of the loan over the purchase price). Not less than quarterly, the Company updates its estimate of the cash flows expected to be collected over the life of the loan, and revised yields are prospectively applied. To the extent that cash flows cannot be reasonably estimated, these loans are generally accounted for under the cost recovery method.
For certain groups of consumer loans that the Company considers as having sufficiently homogeneous characteristics, the Company aggregates such loans into pools, and accounts for each such pool as a single asset. The pool is then treated analogously to a debt security deemed not to be of high credit quality, in that (i) the aggregate premium or discount for the pool is amortized or accreted into interest income based on the pool's effective interest rate; (ii) the effective interest rate is determined based on the net expected cash flows of the pool, taking into account estimates of prepayments, defaults, and loss severities; and (iii) estimates are updated not less than quarterly and revised yields are prospectively applied.
In estimating future cash flows on the Company's debt investments, there are a number of assumptions that will be subject to significant uncertainties and contingencies, including, in the case of MBS, assumptions relating to prepayment rates, default rates, loan loss severities, and loan repurchases. These estimates require the use of a significant amount of judgment.
The Company receives dividend income on certain of its equity investments and rental income on certain of its REO properties. These items of income are included on the Consolidated Statement of Operations under the heading, "Other income."
(D) Cash and Cash Equivalents:
Cash and cash equivalents include cash and short term investments with original maturities of three months or less at the date of acquisition. Cash and cash equivalents typically include amounts held in an interest bearing overnight account and amounts held in money market funds, and these balances generally exceed insured limits. The Company holds its cash at institutions that it believes to be highly creditworthy. Restricted cash represents cash that the Company can use only for specific purposes. The Company's investments in money market funds are included in the Consolidated Condensed Schedule of Investments. See Note 13 for further discussion of restricted cash balances.
(E) Financial Derivatives:
The Company enters into various types of financial derivatives. The Company's financial derivatives are predominantly subject to bilateral collateral arrangements or clearing in accordance with the Dodd-Frank Wall Street Reform and Consumer Protection Act of 2010. The Company may be required to deliver or receive cash or securities as collateral upon entering into derivative transactions. In addition, changes in the relative value of derivative transactions may require the Company or the counterparty to post or receive additional collateral. In the case of cleared derivatives, the clearinghouse becomes the Company's counterparty and a futures commission merchant acts as an intermediary between the Company and the clearinghouse with respect to all facets of the related transaction, including the posting and receipt of required collateral. Cash collateral received by the Company is reflected on the Consolidated Statement of Assets, Liabilities, and Equity as "Due to Brokers." Conversely, cash collateral posted by the Company is reflected as "Due from Brokers" on the Consolidated Statement of Assets, Liabilities, and Equity. The major types of derivatives utilized by the Company are swaps, futures, options, and forwards.
Swaps:
The Company may enter into various types of swaps, including interest rate swaps, credit default swaps, and total return swaps. The primary risk associated with the Company's interest rate swap activity is interest rate risk. The primary risk associated with the Company's credit default swaps is credit risk and the primary risks associated with the Company's total return swap activity are equity market risk and credit risk.
The Company is subject to interest rate risk exposure in the normal course of pursuing its investment objectives. Primarily to help mitigate interest rate risk, the Company enters into interest rate swaps. Interest rate swaps are contractual agreements whereby one party pays a floating interest rate on a notional principal amount and receives a fixed rate payment on the same notional principal, or vice versa, for a fixed period of time. Interest rate swaps change in value with movements in interest rates.
The Company enters into credit default swaps. A credit default swap is a contract under which one party agrees to compensate another party for the financial loss associated with the occurrence of a "credit event" in relation to a "reference amount" or notional value of a credit obligation (usually a bond, loan, or a basket of bonds or loans). The definition of a credit
130
event may vary from contract to contract. A credit event may occur (i) when the underlying reference asset(s) fails to make scheduled principal or interest payments to its holders, (ii) with respect to credit default swaps referencing mortgage/asset-backed securities and indices, when the underlying reference obligation is downgraded below a certain rating level, or (iii) with respect to credit default swaps referencing corporate entities and indices, upon the bankruptcy of the underlying reference obligor. The Company typically writes (sells) protection to take a "long" position or purchases (buys) protection to take a "short" position with respect to underlying reference assets or to hedge exposure to other investment holdings.
The Company enters into total return swaps in order to take a "long" or "short" position with respect to an underlying reference asset. The Company is subject to market price volatility of the underlying reference asset. A total return swap involves commitments to pay interest in exchange for a market-linked return based on a notional value. To the extent that the total return of the corporate debt, security, group of securities or index underlying the transaction exceeds or falls short of the offsetting interest obligation, the Company will receive a payment from or make a payment to the counterparty.
Swaps change in value with movements in interest rates, credit quality, or total return of the reference securities. During the term of swap contracts, changes in value are recognized as unrealized gains or losses. When a contract is terminated, the Company realizes a gain or loss equal to the difference between the proceeds from (or cost of) the closing transaction and the Company's basis in the contract, if any. Periodic payments or receipts required by swap agreements are recorded as unrealized gains or losses when accrued and realized gains or losses when received or paid. Upfront payments paid and/or received by the Company to open swap contracts are recorded as an asset and/or liability on the Consolidated Statement of Assets, Liabilities, and Equity and are recorded as a realized gain or loss on the termination date.
Futures Contracts:
A futures contract is an exchange-traded agreement to buy or sell an asset for a set price on a future date. The Company enters into Eurodollar and/or U.S. Treasury security futures contracts to hedge its interest rate risk. The Company may also enter into various other futures contracts, including equity index futures. Initial margin deposits are made upon entering into futures contracts and can generally be either in the form of cash or securities. During the period the futures contract is open, changes in the value of the contract are recognized as unrealized gains or losses by marking-to-market to reflect the current market value of the contract. Variation margin payments are made or received periodically, depending upon whether unrealized losses or gains are incurred. When the contract is closed, the Company records a realized gain or loss equal to the difference between the proceeds of the closing transaction and the Company's basis in the contract.
Options:
The Company may purchase or write put or call options contracts or enter into swaptions. The Company enters into options contracts typically to help mitigate overall market, credit, or interest rate risk depending on the type of options contract. However, the Company also enters into options contracts from time to time for speculative purposes. When the Company purchases an options contract, the option asset is initially recorded at an amount equal to the premium paid, if any, and is subsequently marked-to-market. Premiums paid for purchasing options contracts that expire unexercised are recognized on the expiration date as realized losses. If an options contract is exercised, the premium paid is subtracted from the proceeds of the sale or added to the cost of the purchase to determine whether the Company has realized a gain or loss on the related transaction. When the Company writes an options contract, the option liability is initially recorded at an amount equal to the premium received, if any, and is subsequently marked-to-market. Premiums received for writing options contracts that expire unexercised are recognized on the expiration date as realized gains. If an options contract is exercised, the premium received is subtracted from the cost of the purchase or added to the proceeds of the sale to determine whether the Company has realized a gain or loss on the related investment transaction. When the Company enters into a closing transaction, the Company will realize a gain or loss depending upon whether the amount from the closing transaction is greater or less than the premiums paid or received. The Company may also enter into options contracts that contain forward-settling premiums. In this case, no money is exchanged upfront. Instead the agreed-upon premium is paid by the buyer upon expiration of the option, regardless of whether or not the option is exercised.
Forward Currency Contracts:
A forward currency contract is an agreement between two parties to purchase or sell a specific quantity of currency with the delivery and settlement at a specific future date and exchange rate. During the period the forward currency contract is open, changes in the value of the contract are recognized as unrealized gains or losses. When the contract is settled, the Company records a realized gain or loss equal to the difference between the proceeds of the closing transaction and the Company's basis in the contract.
Commitments to Purchase Residential Mortgage Loans:
The Company has entered into forward purchase commitments under flow agreements, whereby the Company commits to purchasing the loans based on pre-defined underwriting guidelines and at stated interest rates. Actual loan purchases are contingent upon successful loan closings. These commitments to purchase mortgage loans are classified as derivatives on the Company's Consolidated Statement of Assets, Liabilities, and Equity and are, therefore, recorded as assets or liabilities measured at fair value. Until the purchase commitment expires or the underlying loan closes, changes in the estimated fair value of such commitments are recognized as unrealized gains or losses in the Consolidated Statement of Operations.
131
Financial derivatives disclosed on the Consolidated Condensed Schedule of Investments include: credit default swaps on asset-backed securities, credit default swaps on asset-backed indices, credit default swaps on corporate bond indices, credit default swaps on corporate bonds, interest rate swaps, total return swaps, futures contracts, foreign currency forwards, options contracts, warrants, and mortgage loan purchase commitments.
Financial derivative assets are included in Financial derivatives—assets, at fair value on the Consolidated Statement of Assets, Liabilities, and Equity. Financial derivative liabilities are included in Financial derivatives—liabilities, at fair value on the Consolidated Statement of Assets, Liabilities, and Equity. In addition, financial derivative contracts are summarized by type on the Consolidated Condensed Schedule of Investments.
(F) Investments Sold Short:
When the Company sells securities short, it typically satisfies its security delivery settlement obligation by obtaining the security sold short from the same or a different counterparty. The Company generally is required to deliver cash or securities as collateral to the counterparty for the Company's obligation to return the borrowed security. The amount by which the market value of the obligation falls short of or exceeds the proceeds from the short sale is treated as an unrealized gain or loss, respectively. A realized gain or loss will be recognized upon the termination of a short sale if the market price is less or greater than the proceeds originally received.
(G) Reverse Repurchase Agreements:
The Company enters into reverse repurchase agreements with third-party broker-dealers whereby it sells securities under agreements to be repurchased at an agreed-upon price and date. The Company accounts for reverse repurchase agreements as collateralized borrowings, with the initial sale price representing the amount borrowed, and with the future repurchase price consisting of the amount borrowed plus interest, at the implied interest rate of the reverse repurchase agreement, on the amount borrowed over the term of the reverse repurchase agreement. The interest rate on a reverse repurchase agreement is based on competitive rates (or competitive market spreads, in the case of agreements with floating interest rates) at the time such agreement is entered into. When the Company enters into a reverse repurchase agreement, the lender establishes and maintains an account containing cash and/or securities having a value not less than the repurchase price, including accrued interest, of the reverse repurchase agreement. Reverse repurchase agreements are carried at their contractual amounts, which approximate fair value as the debt is short-term in nature.
(H) Repurchase Agreements:
The Company enters into repurchase agreement transactions whereby it purchases securities under agreements to resell at an agreed-upon price and date. In general, securities received pursuant to repurchase agreements are delivered to counterparties of short sale transactions. The interest rate on a repurchase agreement is based on competitive rates (or competitive market spreads, in the case of agreements with floating interest rates) at the time such agreement is entered into. Assets held pursuant to repurchase agreements are reflected as assets on the Consolidated Statement of Assets, Liabilities, and Equity. Repurchase agreements are carried at fair value based on their contractual amounts as the debt is short-term in nature.
Repurchase and reverse repurchase agreements that are conducted with the same counterparty may be reported on a net basis if they meet the requirements of ASC 210-20,
Balance Sheet Offsetting
. There are no repurchase and reverse repurchase agreements reported on a net basis in the Company's consolidated financial statements.
(I) Transfers of Financial Assets:
The Company enters into transactions whereby it transfers financial assets to third parties. Upon such a transfer of financial assets, the Company will sometimes retain or acquire interests in the related assets. The Company evaluates transferred assets pursuant to ASC 860-10,
Transfers of Financial Assets
, or "ASC 860-10," which requires that a determination be made as to whether a transferor has surrendered control over transferred financial assets. That determination must consider the transferor's continuing involvement in the transferred financial asset, including all arrangements or agreements made contemporaneously with, or in contemplation of, the transfer, even if they were not entered into at the time of the transfer. When a transfer of financial assets does not qualify as a sale, ASC 860-10 requires the transfer to be accounted for as a secured borrowing with a pledge of collateral. ASC 860-10 is a standard that requires the Company to exercise significant judgment in determining whether a transaction should be recorded as a "sale" or a "financing."
(J) When-Issued/Delayed Delivery Securities:
The Company may purchase or sell securities on a when-issued or delayed delivery basis. Securities purchased or sold on a when-issued basis are traded for delivery beyond the normal settlement date at a stated price or yield, and no income accrues to the purchaser prior to settlement. Purchasing or selling securities on a when-issued or delayed delivery basis involves the risk that the market price or yield at the time of settlement may be lower or higher than the agreed-upon price or yield, in which case a realized loss may be incurred.
The Company transacts in the forward settling TBA market. The Company typically does not take delivery of TBAs, but rather settles the associated receivable and payable with its trading counterparties on a net basis. Transactions with the same counterparty for the same TBA that result in a reduction of the position are treated as extinguished. The market value of the securities that the Company is required to purchase pursuant to a TBA transaction may decline below the agreed-upon purchase price. Conversely, the market value of the securities that the Company is required to sell pursuant to a TBA transaction may
132
increase above the agreed upon sale price. As part of its TBA activities, the Company may "roll" its TBA positions, whereby the Company may sell (buy) securities for delivery (receipt) in an earlier month and simultaneously contract to repurchase (sell) similar, but not identical, securities at an agreed-upon price on a fixed date in a later month (with the later-month price typically lower than the earlier-month price). The Company accounts for its TBA transactions (including those related to TBA rolls) as purchases and sales.
(K) REO:
When the Company obtains possession of real property in connection with a foreclosure or similar action, the Company de-recognizes the associated mortgage loan according to ASU 2014-04,
Reclassification of Residential Real Estate Collateralized Consumer Mortgage Loans upon Foreclosure
("ASU 2014-04"). Under the provisions of ASU 2014-04, the Company is deemed to have received physical possession of real estate property collateralizing a mortgage loan when it obtains legal title to the property upon completion of a foreclosure or when the borrower conveys all interest in the property to it through a deed in lieu of foreclosure or similar legal agreement. The Company holds all REO at fair value.
(L) Investments in Operating Entities:
The Company has made and may in the future make non-controlling investments in operating entities such as mortgage originators. Investments in such operating entities may be in the form of preferred and/or common equity, debt, or some other form of investment. The Company carries its investments in such entities at fair value. In cases where the operating entity provides services to the Company, the Company is required to use the equity method of accounting.
(M) Offering Costs/Underwriters' Discount:
Offering costs and underwriters' discount are charged against shareholders' equity. Offering costs typically include legal, accounting, printing, and other fees associated with the cost of raising capital.
(N) Expenses:
Expenses are recognized as incurred on the Consolidated Statement of Operations.
(O) Other Investment Related Expenses:
Other investment related expenses consist of expenses directly related to specific financial instruments. Such expenses generally include dividend expense on common stock sold short, servicing fees and corporate and escrow advances on mortgage and consumer loans, and various other expenses and fees related directly to the Company's financial instruments. Other investment related expenses are generally recognized as incurred on the Consolidated Statement of Operations; dividend expense on common stock sold short is recognized on the ex-dividend date.
(P) LTIP Units:
Long term incentive plan units ("LTIP Units") have been issued to the Company's dedicated or partially dedicated personnel and independent directors as well as the Manager. Costs associated with LTIP Units issued to dedicated or partially dedicated personnel, or to independent directors, are measured as of the grant date based on the closing stock price on the New York Stock Exchange and are amortized over the vesting period in accordance with ASC 718-10,
Compensation—Stock Compensation
. The vesting periods for LTIP Units issued under the Ellington Incentive Plan for Individuals (the "Individual LTIP") are typically
one year
for independent directors, and are typically
one year
to
two
years for dedicated or partially dedicated personnel.
(Q)
Non-controlling interests
: Non-controlling interests include the interest in the Operating Partnership owned by an affiliate of the Manager and certain related parties and consist of units convertible into the Company's common shares. Non-controlling interests also include the interests of joint venture partners in certain of our consolidated subsidiaries. The joint venture partners' interests do not consist of units convertible into the Company's common shares. The Company adjusts the non-controlling interests owned by an affiliate of the Manager and certain related parties to align their carrying value with the share of total outstanding operating partnership units ("OP Units") issued by the Operating Partnership to the non-controlling interest. Any such adjustments are reflected in "Adjustment to non-controlling interest" on the Consolidated Statement of Changes in Equity. See Note 9 for further discussion of non-controlling interests.
(R) Dividends:
Dividends payable by the Company are recorded on the ex-dividend date. Dividends are typically declared and paid on a quarterly basis in arrears.
(S) Shares Repurchased:
Common shares that are repurchased by the Company subsequent to issuance are immediately retired upon settlement and decrease the total number of shares outstanding and issued.
(T) Earnings Per Share ("EPS"):
Basic EPS is computed using the two class method by dividing net increase (decrease) in shareholders' equity resulting from operations after adjusting for the impact of LTIP Units which are participating securities, by the weighted average number of common shares outstanding calculated including LTIP Units. Because the Company's LTIP Units are participating securities, they are included in the calculation of basic and diluted EPS. OP Units relating to a non-controlling interest are also participating securities and, accordingly, are included in the calculation of both basic and diluted EPS.
133
(U) Foreign Currency:
Assets and liabilities denominated in foreign currencies are translated into U.S. dollars at current exchange rates at the following dates: (i) assets, liabilities, and unrealized gains/losses—at the valuation date; and (ii) income, expenses, and realized gains/losses—at the accrual/transaction date. The Company isolates the portion of realized and change in unrealized gain (loss) resulting from changes in foreign currency exchange rates on investments and financial derivatives from the fluctuations arising from changes in fair value of investments and financial derivatives held. Changes in realized and change in unrealized gain (loss) due to foreign currency are included in Foreign currency transactions and Foreign currency translation, respectively, on the Consolidated Statement of Operations.
(V) Income Taxes:
The Company has been and continues to expect to be treated as a partnership for U.S. federal income tax purposes. Certain of the Company's subsidiaries are not consolidated for U.S. federal income tax purposes, but are also treated as partnerships. In general, partnerships are not subject to entity-level tax on their income, but the income of a partnership is taxable to its owners on a flow-through basis. In addition, certain subsidiaries of the Company have elected to be treated as corporations for U.S. federal income tax purposes, and one has elected to be taxed as a real estate investment trust, or "REIT," beginning with the tax year ending December 31, 2015.
The Company follows the authoritative guidance on accounting for and disclosure of uncertainty on tax positions, which requires management to determine whether a tax position of the Company is more likely than not to be sustained upon examination by the applicable taxing authority, including resolution of any related appeals or litigation processes, based on the technical merits of the position. For uncertain tax positions, the tax benefit to be recognized is measured as the largest amount of benefit that is greater than 50% likely of being realized upon ultimate settlement. The Company did not have any additions to unrecognized tax benefits resulting from tax positions related either to the current period or to 2015, 2014, or 2013 (its open tax years), and no reductions resulting from tax positions of prior years or due to settlements, and thus had no unrecognized tax benefits or reductions since inception. The Company does not expect any change in unrecognized tax benefits within the next fiscal year. There were no amounts accrued for tax penalties or interest as of or during the periods presented in these consolidated financial statements.
The Company may take positions with respect to certain tax issues which depend on legal interpretation of facts or applicable tax regulations. Should the relevant tax regulators successfully challenge any of such positions, the Company might be found to have a tax liability that has not been recorded in the accompanying consolidated financial statements. Also, management's conclusions regarding ASC 740-10 may be subject to review and adjustment at a later date based on factors including, but not limited to, further implementation guidance from the Financial Accounting Standards Board, or "FASB," and ongoing analyses of tax laws, regulations and interpretations thereof.
(W) Recent Accounting Pronouncements:
In August 2014, the FASB issued ASU 2014-15,
Disclosure of Uncertainties about an Entity's Ability to Continue as a Going Concern
("ASU 2014-15"). ASU 2014-15 requires management to perform interim and annual assessments of an entity's ability to continue as a going concern and to provide disclosure if events or conditions arise that would place substantial doubt on the entity's ability to continue as a going concern. ASU 2014-15 is effective for the annual period ending after December 15, 2016, and subsequent interim and annual periods with early adoption permitted. The adoption of ASU 2014-15 did not have a material impact on the Company's consolidated financial statements.
In February 2015, the FASB issued ASU 2015-02,
Amendments to the Consolidation Analysis
("ASU 2015-02"). This amends ASC 810,
Consolidation
(ASC "810"), to improve targeted areas of consolidation guidance by simplifying the requirements of consolidation and placing more emphasis on risk of loss when determining a controlling financial interest. ASU 2015-02 is effective for annual and interim periods beginning after December 15, 2015, with early adoption permitted. The adoption of ASU 2015-02 did not have a material impact on the Company's consolidated financial statements.
134
3. Valuation
The table below reflects the value of the Company's Level 1, Level 2, and Level 3 financial instruments at
December 31, 2016
:
|
Description
|
Level 1
|
Level 2
|
Level 3
|
Total
|
||||||||||||
|
Assets:
|
(In thousands)
|
|||||||||||||||
|
Cash equivalents
|
$
|
90,000
|
|
$
|
—
|
|
$
|
—
|
|
$
|
90,000
|
|
||||
|
Investments, at fair value-
|
||||||||||||||||
|
Agency residential mortgage-backed securities
|
$
|
—
|
|
$
|
868,345
|
|
$
|
29,622
|
|
$
|
897,967
|
|
||||
|
U.S. Treasury securities
|
—
|
|
5,419
|
|
—
|
|
5,419
|
|
||||||||
|
Private label residential mortgage-backed securities
|
—
|
|
53,525
|
|
90,083
|
|
143,608
|
|
||||||||
|
Private label commercial mortgage-backed securities
|
—
|
|
—
|
|
43,268
|
|
43,268
|
|
||||||||
|
Commercial mortgage loans
|
—
|
|
—
|
|
61,129
|
|
61,129
|
|
||||||||
|
Residential mortgage loans
|
—
|
|
—
|
|
84,290
|
|
84,290
|
|
||||||||
|
Collateralized loan obligations
|
—
|
|
—
|
|
44,956
|
|
44,956
|
|
||||||||
|
Consumer loans and asset-backed securities backed by consumer loans
|
—
|
|
—
|
|
114,472
|
|
114,472
|
|
||||||||
|
Corporate debt
|
—
|
|
55,091
|
|
25,004
|
|
80,095
|
|
||||||||
|
Real estate owned
|
—
|
|
—
|
|
3,349
|
|
3,349
|
|
||||||||
|
Private corporate equity investments
|
4,396
|
|
—
|
|
22,077
|
|
26,473
|
|
||||||||
|
Total investments, at fair value
|
4,396
|
|
982,380
|
|
518,250
|
|
1,505,026
|
|
||||||||
|
Financial derivatives–assets, at fair value-
|
||||||||||||||||
|
Credit default swaps on asset-backed securities
|
—
|
|
—
|
|
5,326
|
|
5,326
|
|
||||||||
|
Credit default swaps on corporate bond indices
|
—
|
|
2,744
|
|
—
|
|
2,744
|
|
||||||||
|
Credit default swaps on corporate bonds
|
—
|
|
2,360
|
|
—
|
|
2,360
|
|
||||||||
|
Credit default swaps on asset-backed indices
|
—
|
|
16,713
|
|
—
|
|
16,713
|
|
||||||||
|
Interest rate swaps
|
—
|
|
8,102
|
|
—
|
|
8,102
|
|
||||||||
|
Total return swaps
|
—
|
|
—
|
|
155
|
|
155
|
|
||||||||
|
Options
|
42
|
|
2
|
|
—
|
|
44
|
|
||||||||
|
Futures
|
29
|
|
—
|
|
—
|
|
29
|
|
||||||||
|
Forwards
|
—
|
|
16
|
|
—
|
|
16
|
|
||||||||
|
Warrants
|
—
|
|
—
|
|
106
|
|
106
|
|
||||||||
|
Total financial derivatives–assets, at fair value
|
71
|
|
29,937
|
|
5,587
|
|
35,595
|
|
||||||||
|
Repurchase agreements
|
—
|
|
184,819
|
|
—
|
|
184,819
|
|
||||||||
|
Total investments and financial derivatives–assets, at fair value and repurchase agreements
|
$
|
4,467
|
|
$
|
1,197,136
|
|
$
|
523,837
|
|
$
|
1,725,440
|
|
||||
|
Liabilities:
|
||||||||||||||||
|
Investments sold short, at fair value-
|
||||||||||||||||
|
Agency residential mortgage-backed securities
|
$
|
—
|
|
$
|
(404,728
|
)
|
$
|
—
|
|
$
|
(404,728
|
)
|
||||
|
Government debt
|
—
|
|
(132,442
|
)
|
—
|
|
(132,442
|
)
|
||||||||
|
Corporate debt
|
—
|
|
(39,572
|
)
|
—
|
|
(39,572
|
)
|
||||||||
|
Common stock
|
(8,154
|
)
|
—
|
|
—
|
|
(8,154
|
)
|
||||||||
|
Total investments sold short, at fair value
|
(8,154
|
)
|
(576,742
|
)
|
—
|
|
(584,896
|
)
|
||||||||
|
Financial derivatives–liabilities, at fair value-
|
||||||||||||||||
|
Credit default swaps on corporate bond indices
|
—
|
|
(2,840
|
)
|
—
|
|
(2,840
|
)
|
||||||||
|
Credit default swaps on corporate bonds
|
—
|
|
(6,654
|
)
|
—
|
|
(6,654
|
)
|
||||||||
|
Credit default swaps on asset-backed indices
|
—
|
|
(2,899
|
)
|
—
|
|
(2,899
|
)
|
||||||||
|
Credit default swaps on asset-backed securities
|
—
|
|
—
|
|
(256
|
)
|
(256
|
)
|
||||||||
135
|
Description
|
Level 1
|
Level 2
|
Level 3
|
Total
|
||||||||||||
|
(continued)
|
(In thousands)
|
|||||||||||||||
|
Interest rate swaps
|
$
|
—
|
|
$
|
(5,162
|
)
|
$
|
—
|
|
$
|
(5,162
|
)
|
||||
|
Total return swaps
|
—
|
|
(55
|
)
|
(249
|
)
|
(304
|
)
|
||||||||
|
Options
|
—
|
|
—
|
|
—
|
|
—
|
|
||||||||
|
Futures
|
(69
|
)
|
—
|
|
—
|
|
(69
|
)
|
||||||||
|
Forwards
|
—
|
|
(472
|
)
|
—
|
|
(472
|
)
|
||||||||
|
Mortgage loan purchase commitments
|
—
|
|
(31
|
)
|
—
|
|
(31
|
)
|
||||||||
|
Total financial derivatives–liabilities, at fair value
|
(69
|
)
|
(18,113
|
)
|
(505
|
)
|
(18,687
|
)
|
||||||||
|
Total investments sold short and financial derivatives–liabilities, at fair value
|
$
|
(8,223
|
)
|
$
|
(594,855
|
)
|
$
|
(505
|
)
|
$
|
(603,583
|
)
|
||||
The following table identifies the significant unobservable inputs that affect the valuation of the Company's Level 3 assets and liabilities as of
December 31, 2016
:
|
Fair Value
|
Valuation
Technique
|
Unobservable Input
|
Range
|
Weighted
Average
|
||||||||||||||||
|
Description
|
Min
|
Max
|
||||||||||||||||||
|
(In thousands)
|
||||||||||||||||||||
|
Private label residential mortgage-backed securities
|
$
|
47,024
|
|
Market Quotes
|
Non Binding Third-Party Valuation
|
$
|
2.00
|
|
$
|
101.02
|
|
$
|
67.51
|
|
||||||
|
Collateralized loan obligations
|
37,517
|
|
Market Quotes
|
Non Binding Third-Party Valuation
|
9.42
|
|
100.25
|
|
83.36
|
|
||||||||||
|
Corporate debt and non-exchange traded corporate equity
|
19,017
|
|
Market Quotes
|
Non Binding Third-Party Valuation
|
1.88
|
|
102.25
|
|
87.14
|
|
||||||||||
|
Private label commercial mortgage-backed securities
|
27,283
|
|
Market Quotes
|
Non Binding Third-Party Valuation
|
5.17
|
|
77.75
|
|
40.88
|
|
||||||||||
|
Agency interest only residential mortgage-backed securities
|
23,322
|
|
Market Quotes
|
Non Binding Third-Party Valuation
|
2.47
|
|
20.17
|
|
11.65
|
|
||||||||||
|
Total return swaps
|
(94
|
)
|
Market Quotes
|
Non Binding Third-Party Valuation
(1)
|
98.25
|
|
99.50
|
|
98.77
|
|
||||||||||
|
Private label residential mortgage-backed securities
|
43,059
|
|
Discounted Cash Flows
|
Yield
|
0.6
|
%
|
20.5
|
%
|
11.0
|
%
|
||||||||||
|
Projected Collateral Prepayments
|
0.0
|
%
|
81.0
|
%
|
10.0
|
%
|
||||||||||||||
|
Projected Collateral Losses
|
1.4
|
%
|
51.2
|
%
|
41.4
|
%
|
||||||||||||||
|
Projected Collateral Recoveries
|
0.4
|
%
|
53.6
|
%
|
41.2
|
%
|
||||||||||||||
|
Projected Collateral Scheduled Amortization
|
0.0
|
%
|
90.7
|
%
|
7.4
|
%
|
||||||||||||||
|
100.0
|
%
|
|||||||||||||||||||
|
Private label commercial mortgage-backed securities
|
15,985
|
|
Discounted Cash Flows
|
Yield
|
8.8
|
%
|
57.0
|
%
|
23.6
|
%
|
||||||||||
|
Projected Collateral Losses
|
0.1
|
%
|
5.3
|
%
|
2.2
|
%
|
||||||||||||||
|
Projected Collateral Recoveries
|
0.9
|
%
|
20.5
|
%
|
10.7
|
%
|
||||||||||||||
|
Projected Collateral Scheduled Amortization
|
77.8
|
%
|
99.0
|
%
|
87.1
|
%
|
||||||||||||||
|
100.0
|
%
|
|||||||||||||||||||
|
Corporate debt and warrants
|
10,080
|
|
Discounted Cash Flows
|
Yield
|
19.7
|
%
|
19.7
|
%
|
19.7
|
%
|
||||||||||
136
|
(continued)
|
Fair Value
|
Valuation
Technique
|
Unobservable Input
|
Range
|
Weighted
Average
|
|||||||||||||||
|
Description
|
Min
|
Max
|
||||||||||||||||||
|
(In thousands)
|
||||||||||||||||||||
|
Collateralized loan obligations
|
$
|
7,439
|
|
Discounted Cash Flows
|
Yield
|
11.2
|
%
|
50.3
|
%
|
20.5
|
%
|
|||||||||
|
Projected Collateral Prepayments
|
11.4
|
%
|
55.2
|
%
|
45.5
|
%
|
||||||||||||||
|
Projected Collateral Losses
|
4.5
|
%
|
28.3
|
%
|
10.7
|
%
|
||||||||||||||
|
Projected Collateral Recoveries
|
1.5
|
%
|
27.2
|
%
|
8.6
|
%
|
||||||||||||||
|
Projected Collateral Scheduled Amortization
|
29.8
|
%
|
51.5
|
%
|
35.2
|
%
|
||||||||||||||
|
100.0
|
%
|
|||||||||||||||||||
|
Consumer loans and asset-backed securities backed by consumer loans
|
114,472
|
|
Discounted Cash Flows
|
Yield
|
8.5
|
%
|
25.0
|
%
|
10.9
|
%
|
||||||||||
|
Projected Collateral Prepayments
|
0.0
|
%
|
45.4
|
%
|
25.6
|
%
|
||||||||||||||
|
Projected Collateral Losses
|
3.3
|
%
|
97.4
|
%
|
9.9
|
%
|
||||||||||||||
|
Projected Collateral Scheduled Amortization
|
0.0
|
%
|
87.7
|
%
|
64.5
|
%
|
||||||||||||||
|
100.0
|
%
|
|||||||||||||||||||
|
Performing commercial mortgage loans
|
32,557
|
|
Discounted Cash Flows
|
Yield
|
8.0
|
%
|
17.2
|
%
|
11.6
|
%
|
||||||||||
|
Non-performing commercial mortgage loans and commercial real estate owned
|
30,222
|
|
Discounted Cash Flows
|
Yield
|
10.2
|
%
|
27.8
|
%
|
16.3
|
%
|
||||||||||
|
Months to Resolution
|
3.0
|
|
39.1
|
|
19.5
|
|
||||||||||||||
|
Performing residential mortgage loans
|
78,576
|
|
Discounted Cash Flows
|
Yield
|
5.0
|
%
|
13.5
|
%
|
6.6
|
%
|
||||||||||
|
Non-performing residential mortgage loans and residential real estate owned
|
7,413
|
|
Discounted Cash Flows
|
Yield
|
5.8
|
%
|
39.9
|
%
|
9.7
|
%
|
||||||||||
|
Months to Resolution
|
1.8
|
|
162.9
|
|
41.9
|
|
||||||||||||||
|
Credit default swaps on asset-backed securities
|
5,070
|
|
Net Discounted Cash Flows
|
Projected Collateral Prepayments
|
19.3
|
%
|
29.8
|
%
|
22.7
|
%
|
||||||||||
|
Projected Collateral Losses
|
15.3
|
%
|
27.6
|
%
|
22.2
|
%
|
||||||||||||||
|
Projected Collateral Recoveries
|
4.7
|
%
|
15.3
|
%
|
8.7
|
%
|
||||||||||||||
|
Projected Collateral Scheduled Amortization
|
43.2
|
%
|
50.2
|
%
|
46.4
|
%
|
||||||||||||||
|
100.0
|
%
|
|||||||||||||||||||
|
Non-exchange traded equity investments in commercial mortgage-related private partnerships
|
3,090
|
|
Discounted Cash Flows
|
Yield
|
16.5
|
%
|
16.5
|
%
|
16.5
|
%
|
||||||||||
|
Expected Holding Period (Months)
|
2.9
|
|
2.9
|
|
2.9
|
|
||||||||||||||
|
Agency interest only residential mortgage-backed securities
|
6,300
|
|
Option Adjusted Spread ("OAS")
|
LIBOR OAS
(2)
|
142
|
|
2,831
|
|
568
|
|
||||||||||
|
Projected Collateral Prepayments
|
0.0
|
%
|
100.0
|
%
|
62.6
|
%
|
||||||||||||||
|
Projected Collateral Losses
|
0.0
|
%
|
15.7
|
%
|
1.0
|
%
|
||||||||||||||
|
Projected Collateral Scheduled Amortization
|
0.0
|
%
|
88.1
|
%
|
36.4
|
%
|
||||||||||||||
|
100.0
|
%
|
|||||||||||||||||||
|
Non-exchange traded preferred and common equity investment in mortgage-related entity
|
2,500
|
|
Enterprise Value
|
Equity Multiple
(3)
|
1.3x
|
1.3x
|
1.3x
|
|||||||||||||
|
Non-exchange traded preferred equity investment in mortgage-related entity
|
12,500
|
|
Recent Transactions
|
Transaction Price
|
N/A
|
N/A
|
N/A
|
|||||||||||||
|
(1)
|
Represents valuations on underlying assets.
|
|
(2)
|
Shown in basis points.
|
|
(3)
|
Represent an estimation of where market participants might value an enterprise.
|
137
Third-party non-binding valuations are validated by comparing such valuations to internally generated prices based on the Company's models and to recent trading activity in the same or similar instruments.
For those instruments valued using discounted and net discounted cash flows, collateral prepayments, losses, recoveries, and scheduled amortization are projected over the remaining life of the collateral and expressed as a percentage of the collateral's current principal balance. Averages are weighted based on the fair value of the related instrument. In the case of credit default swaps on asset-backed securities, averages are weighted based on each instrument's bond equivalent value. Bond equivalent value represents the investment amount of a corresponding position in the reference obligation, calculated as the difference between the outstanding principal balance of the underlying reference obligation and the fair value, inclusive of accrued interest, of the derivative contract. For those assets valued using the LIBOR Option Adjusted Spread ("OAS") valuation methodology, cash flows are projected using the Company's models over multiple interest rate scenarios, and these projected cash flows are then discounted using the LIBOR rates implied by each interest rate scenario. The LIBOR OAS of an asset is then computed as the unique constant yield spread that, when added to all LIBOR rates in each interest rate scenario generated by the model, will equate (a) the expected present value of the projected asset cash flows over all model scenarios to (b) the actual current market price of the asset. LIBOR OAS is therefore model-dependent. Generally speaking, LIBOR OAS measures the additional yield spread over LIBOR that an asset provides at its current market price after taking into account any interest rate options embedded in the asset. The Company considers the expected timeline to resolution in the determination of fair value for its non-performing commercial and residential loans.
Material changes in any of the inputs above in isolation could result in a significant change to reported fair value measurements. Additionally, fair value measurements are impacted by the interrelationships of these inputs. For example, for instruments subject to prepayments and credit losses, such as non-Agency RMBS and consumer loans and ABS backed by consumer loans, a higher expectation of collateral prepayments will generally be accompanied by a lower expectation of collateral losses. Conversely, higher losses will generally be accompanied by lower prepayments. Because the Company's credit default swaps on asset-backed security holdings represent credit default swap contracts whereby the Company has purchased credit protection, such credit default swaps on asset-backed securities generally have the directionally opposite sensitivity to prepayments, losses, and recoveries as compared to the Company's long securities holdings. Prepayments do not represent a significant input for the Company's commercial mortgage-backed securities and commercial mortgage loans. Losses and recoveries do not represent a significant input for the Company's Agency RMBS interest only securities, given the guarantee of the issuing government agency or government-sponsored enterprise.
The table below reflects the value of the Company's Level 1, Level 2, and Level 3 financial instruments at
December 31, 2015
:
|
Description
|
Level 1
|
Level 2
|
Level 3
|
Total
|
||||||||||||
|
Assets:
|
(In thousands)
|
|||||||||||||||
|
Cash equivalents
|
$
|
160,000
|
|
$
|
—
|
|
$
|
—
|
|
$
|
160,000
|
|
||||
|
Investments, at fair value-
|
||||||||||||||||
|
Agency residential mortgage-backed securities
|
$
|
—
|
|
$
|
1,035,662
|
|
$
|
24,918
|
|
$
|
1,060,580
|
|
||||
|
Private label residential mortgage-backed securities
|
—
|
|
138,482
|
|
116,435
|
|
254,917
|
|
||||||||
|
Private label commercial mortgage-backed securities
|
—
|
|
—
|
|
34,145
|
|
34,145
|
|
||||||||
|
Commercial mortgage loans
|
—
|
|
—
|
|
66,399
|
|
66,399
|
|
||||||||
|
Residential mortgage loans
|
—
|
|
—
|
|
22,089
|
|
22,089
|
|
||||||||
|
Collateralized loan obligations
|
—
|
|
—
|
|
45,974
|
|
45,974
|
|
||||||||
|
Consumer loans and asset-backed securities backed by consumer loans
|
—
|
|
—
|
|
115,376
|
|
115,376
|
|
||||||||
|
Corporate debt
|
—
|
|
—
|
|
27,028
|
|
27,028
|
|
||||||||
|
Real estate owned
|
—
|
|
—
|
|
12,522
|
|
12,522
|
|
||||||||
|
Private corporate equity investments
|
—
|
|
—
|
|
22,088
|
|
22,088
|
|
||||||||
|
Total investments, at fair value
|
—
|
|
1,174,144
|
|
486,974
|
|
1,661,118
|
|
||||||||
138
|
Description
|
Level 1
|
Level 2
|
Level 3
|
Total
|
||||||||||||
|
(continued)
|
(In thousands)
|
|||||||||||||||
|
Financial derivatives–assets, at fair value-
|
||||||||||||||||
|
Credit default swaps on asset-backed securities
|
$
|
—
|
|
$
|
—
|
|
$
|
6,332
|
|
$
|
6,332
|
|
||||
|
Credit default swaps on corporate bond indices
|
—
|
|
137,643
|
|
—
|
|
137,643
|
|
||||||||
|
Credit default swaps on corporate bonds
|
—
|
|
10
|
|
—
|
|
10
|
|
||||||||
|
Credit default swaps on asset-backed indices
|
—
|
|
5,410
|
|
—
|
|
5,410
|
|
||||||||
|
Interest rate swaps
|
—
|
|
9,943
|
|
—
|
|
9,943
|
|
||||||||
|
Total return swaps
|
—
|
|
—
|
|
85
|
|
85
|
|
||||||||
|
Options
|
112
|
|
2,050
|
|
—
|
|
2,162
|
|
||||||||
|
Futures
|
32
|
|
—
|
|
—
|
|
32
|
|
||||||||
|
Forwards
|
—
|
|
1,138
|
|
—
|
|
1,138
|
|
||||||||
|
Warrants
|
—
|
|
—
|
|
150
|
|
150
|
|
||||||||
|
Total financial derivatives–assets, at fair value
|
144
|
|
156,194
|
|
6,567
|
|
162,905
|
|
||||||||
|
Repurchase agreements
|
—
|
|
105,700
|
|
—
|
|
105,700
|
|
||||||||
|
Total investments and financial derivatives–assets, at fair value and repurchase agreements
|
$
|
144
|
|
$
|
1,436,038
|
|
$
|
493,541
|
|
$
|
1,929,723
|
|
||||
|
Liabilities:
|
||||||||||||||||
|
Investments sold short, at fair value-
|
||||||||||||||||
|
Agency residential mortgage-backed securities
|
$
|
—
|
|
$
|
(612,777
|
)
|
$
|
—
|
|
$
|
(612,777
|
)
|
||||
|
Government debt
|
—
|
|
(114,051
|
)
|
—
|
|
(114,051
|
)
|
||||||||
|
Corporate debt
|
—
|
|
—
|
|
(448
|
)
|
(448
|
)
|
||||||||
|
Common stock
|
(1,471
|
)
|
—
|
|
—
|
|
(1,471
|
)
|
||||||||
|
Total investments sold short, at fair value
|
(1,471
|
)
|
(726,828
|
)
|
(448
|
)
|
(728,747
|
)
|
||||||||
|
Financial derivatives–liabilities, at fair value-
|
||||||||||||||||
|
Credit default swaps on corporate bond indices
|
—
|
|
(47,298
|
)
|
—
|
|
(47,298
|
)
|
||||||||
|
Credit default swaps on corporate bonds
|
—
|
|
(683
|
)
|
—
|
|
(683
|
)
|
||||||||
|
Credit default swaps on asset-backed indices
|
—
|
|
(365
|
)
|
—
|
|
(365
|
)
|
||||||||
|
Credit default swaps on asset-backed securities
|
—
|
|
—
|
|
(221
|
)
|
(221
|
)
|
||||||||
|
Interest rate swaps
|
—
|
|
(4,934
|
)
|
—
|
|
(4,934
|
)
|
||||||||
|
Total return swaps
|
—
|
|
—
|
|
(4,662
|
)
|
(4,662
|
)
|
||||||||
|
Options
|
—
|
|
(1,760
|
)
|
—
|
|
(1,760
|
)
|
||||||||
|
Futures
|
(528
|
)
|
—
|
|
—
|
|
(528
|
)
|
||||||||
|
Forwards
|
—
|
|
(13
|
)
|
—
|
|
(13
|
)
|
||||||||
|
Mortgage loan purchase commitments
|
—
|
|
(8
|
)
|
—
|
|
(8
|
)
|
||||||||
|
Total financial derivatives–liabilities, at fair value
|
(528
|
)
|
(55,061
|
)
|
(4,883
|
)
|
(60,472
|
)
|
||||||||
|
Guarantees
(1)
|
—
|
|
—
|
|
(828
|
)
|
(828
|
)
|
||||||||
|
Total investments sold short, financial derivatives–liabilities, and guarantees, at fair value
|
$
|
(1,999
|
)
|
$
|
(781,889
|
)
|
$
|
(6,159
|
)
|
$
|
(790,047
|
)
|
||||
|
(1)
|
Included in Other liabilities on the Consolidated Statement of Assets, Liabilities, and Equity.
|
139
The following table identifies the significant unobservable inputs that affect the valuation of the Company's Level 3 assets and liabilities as of December 31, 2015:
|
Fair Value
|
Valuation
Technique
|
Unobservable Input
|
Range
|
Weighted
Average
|
||||||||||||||||
|
Description
|
Min
|
Max
|
||||||||||||||||||
|
(In thousands)
|
||||||||||||||||||||
|
Private label residential mortgage-backed securities
|
$
|
89,549
|
|
Market Quotes
|
Non Binding Third-Party Valuation
|
$
|
1.81
|
|
$
|
151.86
|
|
$
|
68.47
|
|
||||||
|
Collateralized loan obligations
|
41,978
|
|
Market Quotes
|
Non Binding Third-Party Valuation
|
13.00
|
|
102.00
|
|
84.84
|
|
||||||||||
|
Corporate debt and non-exchange traded corporate equity
|
18,972
|
|
Market Quotes
|
Non Binding Third-Party Valuation
|
3.00
|
|
200.00
|
|
77.85
|
|
||||||||||
|
Private label commercial mortgage-backed securities
|
20,365
|
|
Market Quotes
|
Non Binding Third-Party Valuation
|
6.07
|
|
73.20
|
|
41.28
|
|
||||||||||
|
Agency interest only residential mortgage-backed securities
|
21,067
|
|
Market Quotes
|
Non Binding Third-Party Valuation
|
2.97
|
|
22.41
|
|
11.08
|
|
||||||||||
|
Total return swaps
|
(4,577
|
)
|
Market Quotes
|
Non Binding Third-Party Valuation (1)
|
36.38
|
|
99.88
|
|
56.38
|
|
||||||||||
|
Private label residential mortgage-backed securities
|
26,886
|
|
Discounted Cash Flows
|
Yield
|
3.4
|
%
|
27.1
|
%
|
19.9
|
%
|
||||||||||
|
Projected Collateral Prepayments
|
5.4
|
%
|
74.6
|
%
|
46.3
|
%
|
||||||||||||||
|
Projected Collateral Losses
|
2.9
|
%
|
24.5
|
%
|
11.4
|
%
|
||||||||||||||
|
Projected Collateral Recoveries
|
0.3
|
%
|
13.0
|
%
|
8.0
|
%
|
||||||||||||||
|
Projected Collateral Scheduled Amortization
|
8.6
|
%
|
88.6
|
%
|
34.3
|
%
|
||||||||||||||
|
100.0
|
%
|
|||||||||||||||||||
|
Private label commercial mortgage-backed securities
|
13,780
|
|
Discounted Cash Flows
|
Yield
|
19.2
|
%
|
25.0
|
%
|
22.1
|
%
|
||||||||||
|
Projected Collateral Losses
|
0.7
|
%
|
2.3
|
%
|
1.6
|
%
|
||||||||||||||
|
Projected Collateral Recoveries
|
1.5
|
%
|
14.3
|
%
|
8.4
|
%
|
||||||||||||||
|
Projected Collateral Scheduled Amortization
|
83.4
|
%
|
97.6
|
%
|
90.0
|
%
|
||||||||||||||
|
100.0
|
%
|
|||||||||||||||||||
|
Corporate debt and warrants
|
13,920
|
|
Discounted Cash Flows
|
Yield
|
15.0
|
%
|
20.0
|
%
|
16.2
|
%
|
||||||||||
|
Collateralized loan obligations
|
3,996
|
|
Discounted Cash Flows
|
Yield
|
8.3
|
%
|
20.6
|
%
|
13.5
|
%
|
||||||||||
|
Projected Collateral Prepayments
|
31.9
|
%
|
52.3
|
%
|
41.1
|
%
|
||||||||||||||
|
Projected Collateral Losses
|
2.6
|
%
|
17.3
|
%
|
12.9
|
%
|
||||||||||||||
|
Projected Collateral Recoveries
|
2.3
|
%
|
15.5
|
%
|
10.1
|
%
|
||||||||||||||
|
Projected Collateral Scheduled Amortization
|
33.3
|
%
|
51.5
|
%
|
35.9
|
%
|
||||||||||||||
|
100.0
|
%
|
|||||||||||||||||||
|
Consumer loans and asset-backed securities backed by consumer loans
(2)
|
115,376
|
|
Discounted Cash Flows
|
Yield
|
9.0
|
%
|
15.0
|
%
|
10.4
|
%
|
||||||||||
|
Projected Collateral Prepayments
|
0.0
|
%
|
40.9
|
%
|
30.9
|
%
|
||||||||||||||
|
Projected Collateral Losses
|
1.0
|
%
|
33.8
|
%
|
7.3
|
%
|
||||||||||||||
|
Projected Collateral Scheduled Amortization
|
57.3
|
%
|
80.8
|
%
|
61.8
|
%
|
||||||||||||||
|
100.0
|
%
|
|||||||||||||||||||
|
Performing commercial mortgage loans
|
43,847
|
|
Discounted Cash Flows
|
Yield
|
9.8
|
%
|
17.6
|
%
|
11.9
|
%
|
||||||||||
140
|
(continued)
|
Fair Value
|
Valuation
Technique
|
Unobservable Input
|
Range
|
Weighted
Average
|
|||||||||||||||
|
Description
|
Min
|
Max
|
||||||||||||||||||
|
(In thousands)
|
||||||||||||||||||||
|
Non-performing commercial mortgage loans and commercial real estate owned
|
$
|
30,984
|
|
Discounted Cash Flows
|
Yield
|
10.2
|
%
|
19.4
|
%
|
13.7
|
%
|
|||||||||
|
Months to Resolution
|
4.0
|
|
24.0
|
|
9.3
|
|
||||||||||||||
|
Performing residential mortgage loans
|
13,848
|
|
Discounted Cash Flows
|
Yield
|
5.5
|
%
|
8.0
|
%
|
6.5
|
%
|
||||||||||
|
Non-performing residential mortgage loans and residential real estate owned
|
12,331
|
|
Discounted Cash Flows
|
Yield
|
5.7
|
%
|
7.9
|
%
|
7.3
|
%
|
||||||||||
|
Months to Resolution
|
3.4
|
|
113.6
|
|
20.6
|
|
||||||||||||||
|
Credit default swaps on asset-backed securities
|
6,111
|
|
Net Discounted Cash Flows
|
Projected Collateral Prepayments
|
26.6
|
%
|
44.1
|
%
|
32.6
|
%
|
||||||||||
|
Projected Collateral Losses
|
15.0
|
%
|
33.7
|
%
|
26.5
|
%
|
||||||||||||||
|
Projected Collateral Recoveries
|
6.8
|
%
|
16.9
|
%
|
12.0
|
%
|
||||||||||||||
|
Projected Collateral Scheduled Amortization
|
24.5
|
%
|
33.1
|
%
|
28.9
|
%
|
||||||||||||||
|
100.0
|
%
|
|||||||||||||||||||
|
Non-exchange traded preferred equity investment in commercial mortgage-related private partnership
|
10,558
|
|
Discounted Cash Flows
|
Yield
|
14.0
|
%
|
16.5
|
%
|
14.7
|
%
|
||||||||||
|
Expected Holding Period (Months)
|
14.3
|
|
27.0
|
|
23.5
|
|
||||||||||||||
|
Agency interest only residential mortgage-backed securities
|
3,851
|
|
Option Adjusted Spread ("OAS")
|
LIBOR OAS
(2)
|
441
|
|
1,672
|
|
622
|
|
||||||||||
|
Projected Collateral Prepayments
|
18.0
|
%
|
100.0
|
%
|
70.4
|
%
|
||||||||||||||
|
Projected Collateral Scheduled Amortization
|
0.0
|
%
|
82.0
|
%
|
29.6
|
%
|
||||||||||||||
|
100.0
|
%
|
|||||||||||||||||||
|
Non-exchange traded preferred and common equity investment in mortgage-related entities
|
2,738
|
|
Enterprise Value
|
Equity Multiple
(3)
|
2.7x
|
|
2.7x
|
|
2.7x
|
|
||||||||||
|
Non-exchange traded preferred and common equity investment in mortgage-related entities
|
2,630
|
|
Recent Transactions
|
Transaction Price
|
N/A
|
|
N/A
|
|
N/A
|
|
||||||||||
|
Guarantees
|
(828
|
)
|
Cash Flows
|
Expected Cash Flows
(4)
|
N/A
|
|
N/A
|
|
N/A
|
|
||||||||||
|
(1)
|
Represents valuations on underlying assets.
|
|
(2)
|
Shown in basis points.
|
|
(3)
|
Represent an estimation of where market participants might value an enterprise.
|
|
(4)
|
Represents transactions with a remaining term of less than one year.
|
Third-party non-binding valuations are validated by comparing such valuations to internally generated prices based on the Company's models and to recent trading activity in the same or similar instruments.
For those instruments valued using discounted and net discounted cash flows, collateral prepayments, losses, recoveries, and scheduled amortization are projected over the remaining life of the collateral and expressed as a percentage of the collateral's current principal balance. Averages are weighted based on the fair value of the related instrument. In the case of credit default swaps on asset-backed securities, averages are weighted based on each instrument's bond equivalent value. Bond equivalent value represents the investment amount of a corresponding position in the reference obligation, calculated as the difference between the outstanding principal balance of the underlying reference obligation and the fair value, inclusive of accrued interest, of the derivative contract. For those assets valued using the LIBOR Option Adjusted Spread valuation methodology, cash flows are projected using the Company's models over multiple interest rate scenarios, and these projected cash flows are then discounted using the LIBOR rates implied by each interest rate scenario. The LIBOR OAS of an asset is then computed as the unique constant yield spread that, when added to all LIBOR rates in each interest rate scenario generated by the model, will equate (a) the expected present value of the projected asset cash flows over all model scenarios to (b) the actual current market price of the asset. LIBOR OAS is therefore model-dependent. Generally speaking, LIBOR OAS measures the additional yield spread over LIBOR that an asset provides at its current market price after taking into account any interest rate options embedded in the asset.
141
Material changes in any of the inputs above in isolation could result in a significant change to reported fair value measurements. Additionally, fair value measurements are impacted by the interrelationships of these inputs. For example, a higher expectation of collateral prepayments will generally be accompanied by a lower expectation of collateral losses. Conversely, higher losses will generally be accompanied by lower prepayments. Because the Company's credit default swaps on asset-backed security holdings represent credit default swap contracts whereby the Company has purchased credit protection, such default swaps on asset-backed securities generally have the directionally opposite sensitivity to prepayments, losses, and recoveries as compared to the Company's long securities holdings. Prepayments do not represent a significant input for the Company's commercial mortgage-backed securities and commercial mortgage loans. Losses and recoveries do not represent a significant input for the Company's Agency RMBS interest only securities, given the guarantee of the issuing government agency or government-sponsored enterprise.
The tables below include a roll-forward of the Company's financial instruments for the years ended
December 31, 2016
,
2015
, and 2014 (including the change in fair value), for financial instruments classified by the Company within Level 3 of the valuation hierarchy.
Level 3—Fair Value Measurement Using Significant Unobservable Inputs:
Year Ended
December 31, 2016
|
(In thousands)
|
Ending
Balance as of December 31, 2015 |
Accreted
Discounts /
(Amortized
Premiums)
|
Net Realized
Gain/
(Loss)
|
Change in Net
Unrealized
Gain/(Loss)
|
Purchases/
Payments |
Sales/
Issuances |
Transfers Into Level 3
|
Transfers Out of Level 3
|
Ending
Balance as of
December 31, 2016
|
||||||||||||||||||||||||||
|
Assets:
|
|||||||||||||||||||||||||||||||||||
|
Investments, at fair value-
|
|||||||||||||||||||||||||||||||||||
|
Agency residential mortgage-backed securities
|
$
|
24,918
|
|
$
|
(7,998
|
)
|
$
|
(536
|
)
|
$
|
845
|
|
$
|
12,665
|
|
$
|
(272
|
)
|
$
|
—
|
|
$
|
—
|
|
$
|
29,622
|
|
||||||||
|
Private label residential mortgage-backed securities
|
116,435
|
|
1,896
|
|
(2,748
|
)
|
3,972
|
|
30,065
|
|
(55,407
|
)
|
10,041
|
|
(14,171
|
)
|
90,083
|
|
|||||||||||||||||
|
Private label commercial mortgage-backed securities
|
34,145
|
|
1,627
|
|
1,008
|
|
(6,081
|
)
|
24,488
|
|
(11,919
|
)
|
—
|
|
—
|
|
43,268
|
|
|||||||||||||||||
|
Commercial mortgage loans
|
66,399
|
|
2,463
|
|
1,920
|
|
(1,434
|
)
|
39,684
|
|
(47,903
|
)
|
—
|
|
—
|
|
61,129
|
|
|||||||||||||||||
|
Residential mortgage loans
|
22,089
|
|
467
|
|
774
|
|
(800
|
)
|
102,224
|
|
(40,464
|
)
|
—
|
|
—
|
|
84,290
|
|
|||||||||||||||||
|
Collateralized loan obligations
|
45,974
|
|
(3,829
|
)
|
71
|
|
2,471
|
|
27,862
|
|
(27,593
|
)
|
—
|
|
—
|
|
44,956
|
|
|||||||||||||||||
|
Consumer loans and asset-backed securities backed by consumer loans
|
115,376
|
|
(10,668
|
)
|
(164
|
)
|
(7,818
|
)
|
174,664
|
|
(156,918
|
)
|
—
|
|
—
|
|
114,472
|
|
|||||||||||||||||
|
Corporate debt
|
27,028
|
|
(60
|
)
|
(8,326
|
)
|
6,864
|
|
26,851
|
|
(27,353
|
)
|
—
|
|
—
|
|
25,004
|
|
|||||||||||||||||
|
Real estate owned
|
12,522
|
|
—
|
|
2,256
|
|
(458
|
)
|
17,526
|
|
(28,497
|
)
|
—
|
|
—
|
|
3,349
|
|
|||||||||||||||||
|
Private corporate equity investments
|
22,088
|
|
—
|
|
(144
|
)
|
1,032
|
|
24,117
|
|
(25,016
|
)
|
—
|
|
—
|
|
22,077
|
|
|||||||||||||||||
|
Total investments, at fair value
|
486,974
|
|
(16,102
|
)
|
(5,889
|
)
|
(1,407
|
)
|
480,146
|
|
(421,342
|
)
|
10,041
|
|
(14,171
|
)
|
518,250
|
|
|||||||||||||||||
|
Financial derivatives–assets, at fair value-
|
|||||||||||||||||||||||||||||||||||
|
Credit default swaps on asset-backed securities
|
6,332
|
|
—
|
|
1,042
|
|
(667
|
)
|
148
|
|
(1,529
|
)
|
—
|
|
—
|
|
5,326
|
|
|||||||||||||||||
|
Total return swaps
|
85
|
|
—
|
|
3,070
|
|
70
|
|
57
|
|
(3,127
|
)
|
—
|
|
—
|
|
155
|
|
|||||||||||||||||
|
Warrants
|
150
|
|
—
|
|
(50
|
)
|
6
|
|
7,486
|
|
(7,486
|
)
|
—
|
|
—
|
|
106
|
|
|||||||||||||||||
|
Total financial derivatives– assets, at fair value
|
6,567
|
|
—
|
|
4,062
|
|
(591
|
)
|
7,691
|
|
(12,142
|
)
|
—
|
|
—
|
|
5,587
|
|
|||||||||||||||||
|
Total investments and financial derivatives–assets, at fair value
|
$
|
493,541
|
|
$
|
(16,102
|
)
|
$
|
(1,827
|
)
|
$
|
(1,998
|
)
|
$
|
487,837
|
|
$
|
(433,484
|
)
|
$
|
10,041
|
|
$
|
(14,171
|
)
|
$
|
523,837
|
|
||||||||
|
Liabilities:
|
|||||||||||||||||||||||||||||||||||
|
Investments sold short, at fair value
|
|||||||||||||||||||||||||||||||||||
|
Corporate debt
|
$
|
(448
|
)
|
$
|
(1
|
)
|
$
|
362
|
|
$
|
(228
|
)
|
$
|
315
|
|
$
|
—
|
|
$
|
—
|
|
$
|
—
|
|
$
|
—
|
|
||||||||
|
Total investments sold short, at fair value
|
(448
|
)
|
(1
|
)
|
362
|
|
(228
|
)
|
315
|
|
—
|
|
—
|
|
—
|
|
—
|
|
|||||||||||||||||
142
|
(In thousands)
|
Ending
Balance as of December 31, 2015 |
Accreted
Discounts / (Amortized Premiums) |
Net Realized
Gain/ (Loss) |
Change in Net
Unrealized Gain/(Loss) |
Purchases/
Payments |
Sales/
Issuances |
Transfers Into Level 3
|
Transfers Out of Level 3
|
Ending
Balance as of December 31, 2016 |
||||||||||||||||||||||||||
|
(continued)
|
|||||||||||||||||||||||||||||||||||
|
Financial derivatives–liabilities, at fair value-
|
|||||||||||||||||||||||||||||||||||
|
Credit default swaps on asset-backed securities
|
$
|
(221
|
)
|
$
|
—
|
|
$
|
(323
|
)
|
$
|
(36
|
)
|
$
|
324
|
|
$
|
—
|
|
$
|
—
|
|
$
|
—
|
|
$
|
(256
|
)
|
||||||||
|
Total return swaps
|
(4,662
|
)
|
—
|
|
(7,534
|
)
|
4,413
|
|
8,214
|
|
(680
|
)
|
—
|
|
—
|
|
(249
|
)
|
|||||||||||||||||
|
Total financial derivatives– liabilities, at fair value
|
(4,883
|
)
|
—
|
|
(7,857
|
)
|
4,377
|
|
8,538
|
|
(680
|
)
|
—
|
|
—
|
|
(505
|
)
|
|||||||||||||||||
|
Guarantees:
|
|||||||||||||||||||||||||||||||||||
|
Guarantees
|
(828
|
)
|
—
|
|
—
|
|
828
|
|
—
|
|
—
|
|
—
|
|
—
|
|
—
|
|
|||||||||||||||||
|
Total guarantees
|
(828
|
)
|
—
|
|
—
|
|
828
|
|
—
|
|
—
|
|
—
|
|
—
|
|
—
|
|
|||||||||||||||||
|
Total investments sold short, financial derivatives– liabilities, and guarantees, at fair value
|
$
|
(6,159
|
)
|
$
|
(1
|
)
|
$
|
(7,495
|
)
|
$
|
4,977
|
|
$
|
8,853
|
|
$
|
(680
|
)
|
$
|
—
|
|
$
|
—
|
|
$
|
(505
|
)
|
||||||||
All amounts of net realized and change in net unrealized gain (loss) in the table above are reflected in the accompanying Consolidated Statement of Operations. The table above incorporates changes in net unrealized gain (loss) for both Level 3 financial instruments held by the Company at
December 31, 2016
, as well as Level 3 financial instruments disposed of by the Company during the year ended
December 31, 2016
. For Level 3 financial instruments held by the Company at
December 31, 2016
, change in net unrealized gain (loss) of
$(14.7) million
,
$(0.8) million
, and
$(0.2) million
for the year ended
December 31, 2016
relate to investments, financial derivatives–assets, and financial derivatives–liabilities, respectively.
During the year ended
December 31, 2016
, the Company transferred
$14.2 million
of non-Agency RMBS from Level 3 to Level 2. These assets were transferred from Level 3 to Level 2 based on an increased volume of observed trading of these and/or similar assets. This increase in observed trading activity has led to greater price transparency for these assets, thereby making a Level 2 designation appropriate in the Company's view. However, changes in the volume of observable inputs for these assets, such as a decrease in the volume of observed trading, could impact price transparency, and thereby cause a change in the level designation for these assets in future periods.
In addition, during the year ended
December 31, 2016
, the Company transferred
$10.0 million
of non-Agency RMBS from Level 2 to Level 3. Since December 31, 2015, these securities have exhibited indications of a reduced level of price transparency. Examples of such indications include wider spreads relative to similar securities and a reduction in observable transactions involving these and similar securities. Changes in these indications could impact price transparency, and thereby cause a change in the level designation in future periods.
There were no transfers of financial instruments between Level 1 and Level 2 during the year ended
December 31, 2016
.
143
Year Ended December 31, 2015
|
(In thousands)
|
Ending
Balance as of December 31, 2014 |
Accreted
Discounts /
(Amortized
Premiums)
|
Net Realized
Gain/
(Loss)
|
Change in
Net
Unrealized
Gain/(Loss)
|
Purchases/
Payments
|
Sales/
Issuances
|
Transfers Into Level 3
|
Transfers Out of Level 3
|
Ending
Balance as of December 31, 2015 |
||||||||||||||||||||||||||
|
Assets:
|
|||||||||||||||||||||||||||||||||||
|
Investments, at fair value-
|
|||||||||||||||||||||||||||||||||||
|
Agency residential mortgage-backed securities
|
$
|
31,385
|
|
$
|
(8,355
|
)
|
$
|
223
|
|
$
|
81
|
|
$
|
6,977
|
|
$
|
(5,393
|
)
|
$
|
—
|
|
$
|
—
|
|
$
|
24,918
|
|
||||||||
|
Private label residential mortgage-backed securities
|
274,369
|
|
8,593
|
|
20,648
|
|
(16,429
|
)
|
62,994
|
|
(191,902
|
)
|
6,687
|
|
(48,525
|
)
|
116,435
|
|
|||||||||||||||||
|
Private label commercial mortgage-backed securities
|
53,311
|
|
3,076
|
|
2,000
|
|
(4,183
|
)
|
21,382
|
|
(41,441
|
)
|
—
|
|
—
|
|
34,145
|
|
|||||||||||||||||
|
Commercial mortgage loans
|
28,309
|
|
1,895
|
|
1,114
|
|
(142
|
)
|
69,778
|
|
(34,555
|
)
|
—
|
|
—
|
|
66,399
|
|
|||||||||||||||||
|
Residential mortgage loans
|
27,482
|
|
1,363
|
|
2,372
|
|
(505
|
)
|
19,555
|
|
(28,178
|
)
|
—
|
|
—
|
|
22,089
|
|
|||||||||||||||||
|
Collateralized loan obligations
|
121,994
|
|
(21,110
|
)
|
46
|
|
(4,033
|
)
|
59,102
|
|
(110,025
|
)
|
—
|
|
—
|
|
45,974
|
|
|||||||||||||||||
|
Consumer loans and asset-backed securities backed by consumer loans
|
24,294
|
|
(6,197
|
)
|
—
|
|
283
|
|
139,373
|
|
(42,377
|
)
|
—
|
|
—
|
|
115,376
|
|
|||||||||||||||||
|
Corporate debt
|
42,708
|
|
60
|
|
(4,028
|
)
|
(6,882
|
)
|
28,942
|
|
(33,772
|
)
|
—
|
|
—
|
|
27,028
|
|
|||||||||||||||||
|
Real estate owned
|
8,635
|
|
—
|
|
1,168
|
|
381
|
|
14,155
|
|
(11,817
|
)
|
—
|
|
—
|
|
12,522
|
|
|||||||||||||||||
|
Private corporate equity investments
|
14,512
|
|
—
|
|
116
|
|
(306
|
)
|
8,347
|
|
(581
|
)
|
—
|
|
—
|
|
22,088
|
|
|||||||||||||||||
|
Total investments, at fair value
|
626,999
|
|
(20,675
|
)
|
23,659
|
|
(31,735
|
)
|
430,605
|
|
(500,041
|
)
|
6,687
|
|
(48,525
|
)
|
486,974
|
|
|||||||||||||||||
|
Financial derivatives–assets, at fair value-
|
|||||||||||||||||||||||||||||||||||
|
Credit default swaps on asset-backed securities
|
$
|
11,387
|
|
$
|
—
|
|
$
|
(2,964
|
)
|
$
|
2,098
|
|
$
|
28
|
|
$
|
(4,217
|
)
|
$
|
—
|
|
$
|
—
|
|
$
|
6,332
|
|
||||||||
|
Total return swaps
|
—
|
|
—
|
|
113
|
|
85
|
|
—
|
|
(113
|
)
|
—
|
|
—
|
|
85
|
|
|||||||||||||||||
|
Warrants
|
100
|
|
—
|
|
—
|
|
—
|
|
50
|
|
—
|
|
—
|
|
—
|
|
150
|
|
|||||||||||||||||
|
Total financial derivatives– assets, at fair value
|
11,487
|
|
—
|
|
(2,851
|
)
|
2,183
|
|
78
|
|
(4,330
|
)
|
—
|
|
—
|
|
6,567
|
|
|||||||||||||||||
|
Total investments and financial derivatives–assets, at fair value
|
$
|
638,486
|
|
$
|
(20,675
|
)
|
$
|
20,808
|
|
$
|
(29,552
|
)
|
$
|
430,683
|
|
$
|
(504,371
|
)
|
$
|
6,687
|
|
$
|
(48,525
|
)
|
$
|
493,541
|
|
||||||||
|
Liabilities:
|
|||||||||||||||||||||||||||||||||||
|
Investments sold short, at fair value
|
|||||||||||||||||||||||||||||||||||
|
Corporate debt
|
$
|
—
|
|
$
|
(2
|
)
|
$
|
197
|
|
$
|
228
|
|
$
|
1,372
|
|
$
|
(2,243
|
)
|
$
|
—
|
|
$
|
—
|
|
$
|
(448
|
)
|
||||||||
|
Total investments sold short, at fair value
|
—
|
|
(2
|
)
|
197
|
|
228
|
|
1,372
|
|
(2,243
|
)
|
—
|
|
—
|
|
(448
|
)
|
|||||||||||||||||
|
Financial derivatives– liabilities, at fair value-
|
|||||||||||||||||||||||||||||||||||
|
Credit default swaps on asset-backed securities
|
$
|
(239
|
)
|
$
|
—
|
|
$
|
(102
|
)
|
$
|
35
|
|
$
|
—
|
|
$
|
85
|
|
$
|
—
|
|
$
|
—
|
|
$
|
(221
|
)
|
||||||||
|
Total return swaps
|
—
|
|
—
|
|
2,516
|
|
(4,662
|
)
|
14
|
|
(2,530
|
)
|
—
|
|
—
|
|
(4,662
|
)
|
|||||||||||||||||
|
Total financial derivatives– liabilities, at fair value
|
(239
|
)
|
—
|
|
2,414
|
|
(4,627
|
)
|
14
|
|
(2,445
|
)
|
—
|
|
—
|
|
(4,883
|
)
|
|||||||||||||||||
|
Securitized debt:
|
|||||||||||||||||||||||||||||||||||
|
Securitized debt
|
(774
|
)
|
(15
|
)
|
—
|
|
26
|
|
763
|
|
—
|
|
—
|
|
—
|
|
—
|
|
|||||||||||||||||
|
Total securitized debt
|
(774
|
)
|
(15
|
)
|
—
|
|
26
|
|
763
|
|
—
|
|
—
|
|
—
|
|
—
|
|
|||||||||||||||||
|
Guarantees:
|
|||||||||||||||||||||||||||||||||||
|
Guarantees
|
—
|
|
—
|
|
—
|
|
(828
|
)
|
—
|
|
—
|
|
—
|
|
—
|
|
(828
|
)
|
|||||||||||||||||
|
Total guarantees
|
—
|
|
—
|
|
—
|
|
(828
|
)
|
—
|
|
—
|
|
—
|
|
—
|
|
(828
|
)
|
|||||||||||||||||
|
Total financial derivatives– liabilities and securitized debt, at fair value
|
$
|
(1,013
|
)
|
$
|
(17
|
)
|
$
|
2,611
|
|
$
|
(5,201
|
)
|
$
|
2,149
|
|
$
|
(4,688
|
)
|
$
|
—
|
|
$
|
—
|
|
$
|
(6,159
|
)
|
||||||||
144
All amounts of net realized and change in net unrealized gain (loss) in the table above are reflected in the accompanying Consolidated Statement of Operations. The table above incorporates changes in net unrealized gain (loss) for both Level 3 financial instruments held by the Company at
December 31, 2015
, as well as Level 3 financial instruments disposed of by the Company during the year ended
December 31, 2015
. For Level 3 financial instruments held by the Company at
December 31, 2015
, change in net unrealized gain (loss) of
$(20.7) million
,
$7 thousand
,
$(4.6) million
, and
$(0.8) million
, for the year ended
December 31, 2015
relate to investments, financial derivatives–assets, financial derivatives–liabilities, and guarantees, respectively.
During the year ended
December 31, 2015
, the Company transferred
$48.5 million
of non-Agency RMBS from Level 3 to Level 2. These assets were transferred from Level 3 to Level 2 based on an increased volume of observed trading of these and/or similar assets. This increase in observed trading activity has led to greater price transparency for these assets, thereby making a Level 2 designation appropriate in the Company's view. However, changes in the volume of observable inputs for these assets, such as a decrease in the volume of observed trading, could impact price transparency, and thereby cause a change in the level designation for these assets in future periods.
In addition, during the year ended
December 31, 2015
, the Company transferred
$6.7 million
of non-Agency RMBS from Level 2 to Level 3. Following December 2014, these securities have exhibited indications of a reduced level of price transparency. Examples of such indications include wider spreads relative to similar securities and a reduction in observable transactions involving these and similar securities. Changes in these indications could impact price transparency, and thereby cause a change in the level designation in future periods.
There were no transfers of financial instruments between Level 1 and Level 2 during the year ended
December 31, 2015
.
Year Ended December 31, 2014
|
(In thousands)
|
Ending
Balance as of December 31, 2013 |
Accreted
Discounts /
(Amortized
Premiums)
|
Net Realized
Gain/
(Loss)
|
Change in
Net
Unrealized
Gain/(Loss)
|
Purchases/
Payments
|
Sales/
Issuances
|
Transfers Into Level 3
|
Transfers Out of Level 3
|
Ending
Balance as of December 31, 2014
|
||||||||||||||||||||||||||
|
Assets:
|
|||||||||||||||||||||||||||||||||||
|
Investments, at fair value-
|
|||||||||||||||||||||||||||||||||||
|
Agency residential mortgage-backed securities
|
$
|
40,504
|
|
$
|
(8,738
|
)
|
$
|
1,404
|
|
$
|
(2,078
|
)
|
$
|
8,448
|
|
$
|
(8,155
|
)
|
$
|
—
|
|
$
|
—
|
|
$
|
31,385
|
|
||||||||
|
Private label residential mortgage-backed securities
|
580,772
|
|
20,544
|
|
38,600
|
|
(18,406
|
)
|
382,956
|
|
(445,349
|
)
|
—
|
|
(284,748
|
)
|
274,369
|
|
|||||||||||||||||
|
Private label commercial mortgage-backed securities
|
32,994
|
|
1,328
|
|
7,055
|
|
(357
|
)
|
116,128
|
|
(103,837
|
)
|
—
|
|
—
|
|
53,311
|
|
|||||||||||||||||
|
Commercial mortgage loans
|
23,887
|
|
2,739
|
|
3,156
|
|
(632
|
)
|
41,856
|
|
(42,697
|
)
|
—
|
|
—
|
|
28,309
|
|
|||||||||||||||||
|
Residential mortgage loans
|
24,062
|
|
1,267
|
|
1,424
|
|
84
|
|
14,863
|
|
(14,218
|
)
|
—
|
|
—
|
|
27,482
|
|
|||||||||||||||||
|
Collateralized loan obligations
|
38,069
|
|
(2,577
|
)
|
342
|
|
(1,879
|
)
|
118,607
|
|
(30,568
|
)
|
—
|
|
—
|
|
121,994
|
|
|||||||||||||||||
|
Consumer loans and asset-backed securities backed by consumer loans
|
—
|
|
(1,184
|
)
|
—
|
|
(530
|
)
|
29,402
|
|
(3,394
|
)
|
—
|
|
—
|
|
24,294
|
|
|||||||||||||||||
|
Corporate debt
|
—
|
|
(70
|
)
|
—
|
|
(877
|
)
|
43,808
|
|
(153
|
)
|
—
|
|
—
|
|
42,708
|
|
|||||||||||||||||
|
Real estate owned
|
—
|
|
—
|
|
172
|
|
(113
|
)
|
11,247
|
|
(2,671
|
)
|
—
|
|
—
|
|
8,635
|
|
|||||||||||||||||
|
Private corporate equity investments
|
—
|
|
—
|
|
—
|
|
(205
|
)
|
14,717
|
|
—
|
|
—
|
|
—
|
|
14,512
|
|
|||||||||||||||||
|
Total investments, at fair value
|
740,288
|
|
13,309
|
|
52,153
|
|
(24,993
|
)
|
782,032
|
|
(651,042
|
)
|
—
|
|
(284,748
|
)
|
626,999
|
|
|||||||||||||||||
|
Financial derivatives–assets, at fair value-
|
|||||||||||||||||||||||||||||||||||
|
Credit default swaps on asset-backed securities
|
$
|
16,646
|
|
$
|
—
|
|
$
|
(4,596
|
)
|
$
|
4,547
|
|
$
|
464
|
|
$
|
(5,674
|
)
|
$
|
—
|
|
$
|
—
|
|
$
|
11,387
|
|
||||||||
|
Warrants
|
—
|
|
—
|
|
—
|
|
—
|
|
100
|
|
—
|
|
—
|
|
—
|
|
100
|
|
|||||||||||||||||
|
Total financial derivatives– assets, at fair value
|
16,646
|
|
—
|
|
(4,596
|
)
|
4,547
|
|
564
|
|
(5,674
|
)
|
—
|
|
—
|
|
11,487
|
|
|||||||||||||||||
|
Total investments and financial derivatives–assets, at fair value
|
$
|
756,934
|
|
$
|
13,309
|
|
$
|
47,557
|
|
$
|
(20,446
|
)
|
$
|
782,596
|
|
$
|
(656,716
|
)
|
$
|
—
|
|
$
|
(284,748
|
)
|
$
|
638,486
|
|
||||||||
145
|
(In thousands)
|
Ending
Balance as of December 31, 2013 |
Accreted
Discounts /
(Amortized
Premiums)
|
Net Realized
Gain/
(Loss)
|
Change in
Net
Unrealized
Gain/(Loss)
|
Purchases/
Payments
|
Sales/
Issuances
|
Transfers Into Level 3
|
Transfers Out of Level 3
|
Ending
Balance as of December 31, 2014
|
||||||||||||||||||||||||||
|
(continued)
|
|||||||||||||||||||||||||||||||||||
|
Liabilities:
|
|||||||||||||||||||||||||||||||||||
|
Financial derivatives– liabilities, at fair value-
|
|||||||||||||||||||||||||||||||||||
|
Credit default swaps on asset-backed securities
|
$
|
(350
|
)
|
$
|
—
|
|
$
|
(78
|
)
|
$
|
111
|
|
$
|
—
|
|
$
|
78
|
|
$
|
—
|
|
$
|
—
|
|
$
|
(239
|
)
|
||||||||
|
Total financial derivatives– liabilities, at fair value
|
(350
|
)
|
—
|
|
(78
|
)
|
111
|
|
—
|
|
78
|
|
—
|
|
—
|
|
(239
|
)
|
|||||||||||||||||
|
Securitized debt:
|
|||||||||||||||||||||||||||||||||||
|
Securitized debt
|
(983
|
)
|
(15
|
)
|
—
|
|
(22
|
)
|
246
|
|
—
|
|
—
|
|
—
|
|
(774
|
)
|
|||||||||||||||||
|
Total securitized debt
|
(983
|
)
|
(15
|
)
|
—
|
|
(22
|
)
|
246
|
|
—
|
|
—
|
|
—
|
|
(774
|
)
|
|||||||||||||||||
|
Total financial derivatives– liabilities and securitized debt, at fair value
|
$
|
(1,333
|
)
|
$
|
(15
|
)
|
$
|
(78
|
)
|
$
|
89
|
|
$
|
246
|
|
$
|
78
|
|
$
|
—
|
|
$
|
—
|
|
$
|
(1,013
|
)
|
||||||||
All amounts of net realized and change in net unrealized gain (loss) in the table above are reflected in the accompanying Consolidated Statement of Operations. The table above incorporates changes in net unrealized gain (loss) for both Level 3 financial instruments held by the Company at December 31, 2014, as well as Level 3 financial instruments disposed of by the Company during the year ended December 31, 2014. For Level 3 financial instruments held by the Company at December 31, 2014, change in net unrealized gain (loss) of
$6.3 million
,
$(1.6) million
,
$(0.1) million
, and
$(22) thousand
for the year ended December 31, 2014 relate to investments, financial derivatives–assets, financial derivatives–liabilities, and securitized debt, respectively.
For the year ended December 31, 2014, the Company transferred $284.7 million of non-Agency RMBS from Level 3 to Level 2. The decision to transfer these assets from Level 3 to Level 2 was based on observed market developments, including an increased volume of buying and selling of these and/or similar assets, greater consensus among market participants on price based on market quotes, and generally tighter credit spreads driven by improved performance in the underlying collateral as well as increased demand from investors seeking higher yielding assets. These factors have led to greater price transparency for these assets, thereby making a Level 2 designation appropriate in the Company's view. However, changes in observed market developments could impact future price transparency, and thereby cause a change in the level designation in subsequent periods.
There were no transfers of financial instruments between Level 1 and Level 2 during the year ended December 31, 2014.
4. To Be Announced RMBS
In addition to investing in pools of Agency RMBS, the Company transacts in the forward settling TBA market. Pursuant to these TBA transactions, the Company agrees to purchase or sell, for future delivery, Agency RMBS with certain principal and interest terms and certain types of underlying collateral, but the particular Agency RMBS to be delivered is not identified until shortly before the TBA settlement date. TBAs are liquid and have quoted market prices and represent the most actively traded class of MBS. The Company accounts for its TBAs as purchase and sales and uses TBAs primarily for hedging purposes, typically in the form of short positions. However, the Company may also invest in TBAs for speculative purposes, including holding long positions. Overall, the Company typically holds a net short position.
The Company does not generally take delivery of TBAs; rather, it settles the associated receivable and payable with its trading counterparties on a net basis. Transactions with the same counterparty for the same TBA that result in a reduction of the position are treated as extinguished. The fair value of the Company's positions in long TBA contracts are reflected on the Consolidated Condensed Schedule of Investments under TBA–Fixed Rate Agency Securities and the fair value of the Company's positions in TBA contracts sold short are reflected on the Consolidated Condensed Schedule of Investments under TBA–Fixed Rate Agency Securities Sold Short. The payables and receivables related to the Company's TBA securities are included on the Consolidated Statement of Assets, Liabilities, and Equity in Payable for securities purchased and Receivable for securities sold, respectively.
146
The below table details TBA assets, liabilities, and the respective related payables and receivables as of
December 31, 2016
and 2015:
|
As of
|
||||||||
|
December 31, 2016
|
December 31, 2015
|
|||||||
|
Assets:
|
(In thousands)
|
|||||||
|
TBA securities, at fair value (Current principal: $67,720 and $94,602, respectively)
|
$
|
70,525
|
|
$
|
98,009
|
|
||
|
Receivable for securities sold relating to unsettled TBA sales
|
406,708
|
|
613,023
|
|
||||
|
Liabilities:
|
||||||||
|
TBA securities sold short, at fair value (Current principal: -$384,155 and -$580,992, respectively)
|
$
|
(404,728
|
)
|
$
|
(612,777
|
)
|
||
|
Payable for securities purchased relating to unsettled TBA purchases
|
(70,347
|
)
|
(98,049
|
)
|
||||
|
Net short TBA securities, at fair value
|
(334,203
|
)
|
(514,768
|
)
|
||||
5. Financial Derivatives
Gains and losses on the Company's derivative contracts for the years ended
December 31, 2016
, 2015, and 2014 are summarized in the tables below:
Year Ended
December 31, 2016
:
|
Year Ended December 31, 2016
|
||||||||||
|
Derivative Type
|
Primary Risk
Exposure
|
Net Realized
Gain/(Loss)
(1)
|
Change in Net Unrealized Gain/(Loss)
(2)
|
|||||||
|
(In thousands)
|
||||||||||
|
Credit default swaps on asset-backed securities
|
Credit
|
$
|
719
|
|
$
|
(703
|
)
|
|||
|
Credit default swaps on asset-backed indices
|
Credit
|
3,935
|
|
(3,349
|
)
|
|||||
|
Credit default swaps on corporate bond indices
|
Credit
|
(36,195
|
)
|
(4,044
|
)
|
|||||
|
Credit default swaps on corporate bonds
|
Credit
|
(14
|
)
|
712
|
|
|||||
|
Total return swaps
|
Equity Market/Credit
|
(12,987
|
)
|
4,427
|
|
|||||
|
Interest rate swaps
|
Interest Rates
|
(2,912
|
)
|
(1,983
|
)
|
|||||
|
Futures
|
Interest Rates/Equity Market
|
(84
|
)
|
456
|
|
|||||
|
Forwards
|
Currency
|
4,093
|
|
(1,580
|
)
|
|||||
|
Warrants
|
Equity Market
|
(50
|
)
|
6
|
|
|||||
|
Mortgage loan purchase commitments
|
Interest Rates
|
—
|
|
(23
|
)
|
|||||
|
Options
|
Credit/
Interest Rates/Equity Market |
7,174
|
|
(413
|
)
|
|||||
|
Total
|
$
|
(36,321
|
)
|
$
|
(6,494
|
)
|
||||
|
(1)
|
Includes gain/(loss) on foreign currency transactions on derivatives in the amount of
$0.3 million
, which is included on the Consolidated Statement of Operations in Realized gain (loss) on foreign currency transactions.
|
|
(2)
|
Includes foreign currency translation on derivatives in the amount of
$1.1 million
, which is included on the Consolidated Statement of Operations in Change in net unrealized gain (loss) on foreign currency translation.
|
147
Year Ended
December 31, 2015
(1)
:
|
Year Ended December 31, 2015
|
||||||||||
|
Derivative Type
|
Primary Risk
Exposure
|
Net Realized
Gain/(Loss)
(2)
|
Change in Net Unrealized Gain/(Loss)
(3)
|
|||||||
|
(In thousands)
|
||||||||||
|
Credit default swaps on asset-backed securities
|
Credit
|
$
|
(3,066
|
)
|
$
|
2,133
|
|
|||
|
Credit default swaps on asset-backed indices
|
Credit
|
(714
|
)
|
(285
|
)
|
|||||
|
Credit default swaps on corporate bond indices
|
Credit
|
(8,059
|
)
|
7,503
|
|
|||||
|
Credit default swaps on corporate bonds
|
Credit
|
(1,005
|
)
|
694
|
|
|||||
|
Total return swaps
|
Equity Market/Credit
|
1,838
|
|
(4,564
|
)
|
|||||
|
Interest rate swaps
(4)
|
Interest Rates
|
(9,603
|
)
|
1,983
|
|
|||||
|
Futures
|
Interest Rates/Equity Market
|
708
|
|
(676
|
)
|
|||||
|
Forwards
|
Currency
|
4,738
|
|
377
|
|
|||||
|
Mortgage loan purchase commitments
|
Interest Rates
|
—
|
|
(8
|
)
|
|||||
|
Options
|
Credit/
Interest Rates/Equity Market |
5,048
|
|
1,623
|
|
|||||
|
Total
|
$
|
(10,115
|
)
|
$
|
8,780
|
|
||||
|
(1)
|
Conformed to current period presentation.
|
|
(2)
|
Includes foreign currency translation on derivatives in the amount of
$0.2 million
, which is included on the Consolidated Statement of Operations in Realized gain (loss) on foreign currency transactions.
|
|
(3)
|
Includes foreign currency translation on derivatives in the amount of
$(1.1) million
, which is included on the Consolidated Statement of Operations in Change in net unrealized gain (loss) on foreign currency translation.
|
|
(4)
|
Includes a
$1.5 million
reimbursement from a third party.
|
Year Ended
December 31, 2014
(1)
:
|
Year Ended December 31, 2014
|
||||||||||
|
Derivative Type
|
Primary Risk
Exposure
|
Net Realized
Gain/(Loss)
|
Change in Net Unrealized Gain/(Loss)
|
|||||||
|
(In thousands)
|
||||||||||
|
Credit default swaps on asset-backed securities
|
Credit
|
$
|
(4,674
|
)
|
$
|
4,658
|
|
|||
|
Credit default swaps on asset-backed indices
|
Credit
|
(1,551
|
)
|
316
|
|
|||||
|
Credit default swaps on corporate bond indices
|
Credit
|
(4,304
|
)
|
4,337
|
|
|||||
|
Credit default swaps on corporate bonds
|
Credit
|
270
|
|
(782
|
)
|
|||||
|
Total return swaps
|
Equity Market
|
7,304
|
|
49
|
|
|||||
|
Interest rate swaps
|
Interest Rates
|
(13,329
|
)
|
(19,217
|
)
|
|||||
|
Futures
|
Interest Rates/Equity Market
|
4,589
|
|
2,552
|
|
|||||
|
Forwards
|
Currency
|
1,630
|
|
786
|
|
|||||
|
Options
|
Credit/
Interest Rates/Equity Market |
(1,146
|
)
|
(971
|
)
|
|||||
|
Total
|
$
|
(11,211
|
)
|
$
|
(8,272
|
)
|
||||
|
(1)
|
Conformed to current period presentation.
|
148
The tables below detail the average notional values of the Company's financial derivatives, using absolute value of month end notional values, for the years ended
December 31, 2016
and 2015:
|
Derivative Type
|
Year Ended
December 31, 2016 |
Year Ended
December 31, 2015 |
||||||
|
(In thousands)
|
||||||||
|
Interest rate swaps
|
$
|
1,731,368
|
|
$
|
2,463,892
|
|
||
|
Credit default swaps
|
1,586,923
|
|
1,080,772
|
|
||||
|
Total return swaps
|
113,628
|
|
112,641
|
|
||||
|
Futures
|
371,900
|
|
880,682
|
|
||||
|
Options
|
357,260
|
|
865,600
|
|
||||
|
Forwards
|
80,513
|
|
107,448
|
|
||||
|
Warrants
|
1,640
|
|
1,554
|
|
||||
|
Mortgage loan purchase commitments
|
6,143
|
|
2,093
|
|
||||
From time to time the Company enters into credit derivative contracts for which the Company sells credit protection ("written credit derivatives"). As of
December 31, 2016
and 2015, all of the Company's open written credit derivatives were credit default swaps on either mortgage/asset-backed indices (ABX and CMBX indices) or corporate bond indices (CDX), collectively referred to as credit indices, or on individual corporate bonds, for which the Company receives periodic payments at fixed rates from credit protection buyers, and is obligated to make payments to the credit protection buyer upon the occurrence of a "credit event" with respect to underlying reference assets.
Written credit derivatives held by the Company at
December 31, 2016
and 2015, are summarized below:
|
Credit Derivatives
|
December 31, 2016
|
December 31, 2015
|
||||||
|
(In thousands)
|
||||||||
|
Fair Value of Written Credit Derivatives, Net
|
$
|
(1,551
|
)
|
$
|
135,443
|
|
||
|
Fair Value of Purchased Credit Derivatives Offsetting Written Credit Derivatives with Third Parties
(1)
|
$
|
4,552
|
|
$
|
(369
|
)
|
||
|
Notional Value of Written Credit Derivatives
(2)
|
$
|
117,476
|
|
$
|
(799,750
|
)
|
||
|
Notional Value of Purchased Credit Derivatives Offsetting Written Credit Derivatives with Third Parties
(1)
|
$
|
68,357
|
|
$
|
17,322
|
|
||
|
(1)
|
Offsetting transactions with third parties include purchased credit derivatives which have the same reference obligation.
|
|
(2)
|
The notional value is the maximum amount that a seller of credit protection would be obligated to pay, and a buyer of credit protection would receive upon occurrence of a "credit event." Movements in the value of credit default swap transactions may require the Company or the counterparty to post or receive collateral. Amounts due or owed under credit derivative contracts with an International Swaps and Derivatives Association, or "ISDA," counterparty may be offset against amounts due or owed on other credit derivative contracts with the same ISDA counterparty. As a result, the notional value of written credit derivatives involving a particular underlying reference asset or index has been reduced (but not below zero) by the notional value of any contracts where the Company has purchased credit protection on the same reference asset or index with the same ISDA counterparty.
|
A credit default swap on a credit index or a corporate bond typically terminates at the stated maturity date in the case of corporate indices or bonds, or, in the case of ABX and CMBX indices, the date that all of the reference assets underlying the index are paid off in full, retired, or otherwise cease to exist. Implied credit spreads may be used to determine the market value of such contracts and are reflective of the cost of buying/selling credit protection. Higher spreads would indicate a greater likelihood that a seller will be obligated to perform (
i.e.
, make payment) under the contract. In situations where the credit quality of the underlying reference assets has deteriorated, the percentage of notional values that would be paid up front to enter into a new such contract ("points up front") is frequently used as an indication of credit risk. Credit protection sellers entering the market in such situations would expect to be paid points up front corresponding to the approximate fair value of the contract. For the Company's written credit derivatives that were outstanding at
December 31, 2016
, implied credit spreads on such contracts ranged between 68.5 and 14,344.6 basis points. For the Company's written credit derivatives that were outstanding at December 31, 2015, implied credit spreads on such contracts ranged between 19.5 and 4,628.7 basis points. Total net up-front payments (paid) or received relating to written credit derivatives outstanding at
December 31, 2016
and 2015 were
$(3.3) million
and
$137.8 million
, respectively.
149
6. Borrowings under Reverse Repurchase Agreements and Securitized Debt
Reverse Repurchase Agreements
The Company enters into reverse repurchase agreements. A reverse repurchase agreement involves the sale of an asset to a counterparty together with a simultaneous agreement to repurchase the transferred asset or similar asset from such counterparty at a future date. The Company accounts for its reverse repurchase agreements as collateralized borrowings, with the transferred assets effectively serving as collateral for the related borrowing. The Company's reverse repurchase agreements typically range in term from
30
to
180
days, although the Company also has reverse repurchase agreements that provide for longer or shorter terms. The principal economic terms of each reverse repurchase agreement—such as loan amount, interest rate, and maturity date—are typically negotiated on a transaction-by-transaction basis. Other terms and conditions, such as those relating to events of default, are typically governed under the Company's master repurchase agreements. Absent an event of default, the Company maintains beneficial ownership of the transferred securities during the term of the reverse repurchase agreement and receives the related principal and interest payments. Interest rates on these borrowings are generally fixed based on prevailing rates corresponding to the terms of the borrowings, and for most reverse repurchase agreements, interest is generally paid at the termination of the reverse repurchase agreement, at which time the Company may enter into a new reverse repurchase agreement at prevailing market rates with the same counterparty, repay that counterparty and possibly negotiate financing terms with a different counterparty, or choose to no longer finance the related asset. Some reverse repurchase agreements provide for periodic payments of interest, such as monthly payments. In response to a decline in the fair value of the transferred securities, whether as a result of changes in market conditions, security paydowns, or other factors, reverse repurchase agreement counterparties will typically make a margin call, whereby the Company will be required to post additional securities and/or cash as collateral with the counterparty in order to re-establish the agreed-upon collateralization requirements. In the event of increases in fair value of the transferred securities, the Company can generally require the counterparty to post collateral with it in the form of cash or securities. The Company is generally permitted to sell or re-pledge any securities posted by the counterparty as collateral; however, upon termination of the reverse repurchase agreement, or other circumstance in which the counterparty is no longer required to post such margin, the Company must return to the counterparty the same security that had been posted. The contractual amount (loan amount) of the Company's reverse repurchase agreements approximates their fair value, as the debt is short-term in nature.
At any given time, the Company seeks to have its outstanding borrowings under reverse repurchase agreements with several different counterparties in order to reduce the exposure to any single counterparty. The Company had outstanding borrowings under reverse repurchase agreements with
twenty-one
counterparties as of
December 31, 2016
and
eighteen
counterparties as of December 31, 2015.
At
December 31, 2016
, there was no counterparty that held 15% or more of the Company's outstanding reverse repurchase agreements. At December 31, 2015, approximately
15%
of open reverse repurchase agreements were with
one
counterparty. As of
December 31, 2016
remaining days to maturity on the Company's open reverse repurchase agreements ranged from
3 days
to
320
days and from
4
days to
666
days as of December 31, 2015. Interest rates on the Company's open reverse repurchase agreements ranged from
0.60%
to
3.76%
as of
December 31, 2016
and from
0.37%
to
2.92%
as of December 31, 2015.
The following table details the Company's outstanding borrowings under reverse repurchase agreements for Agency RMBS and Credit assets, which include non-Agency MBS, CLOs, consumer loans, corporate debt, residential mortgage loans, and U.S. Treasury securities, by remaining maturity as of
December 31, 2016
and 2015:
150
|
(In thousands)
|
December 31, 2016
|
December 31, 2015
|
||||||||||||||||||
|
Weighted Average
|
Weighted Average
|
|||||||||||||||||||
|
Remaining Maturity
|
Outstanding
Borrowings
|
Interest Rate
|
Remaining Days to Maturity
|
Outstanding Borrowings
|
Interest Rate
|
Remaining Days to Maturity
|
||||||||||||||
|
Agency RMBS:
|
||||||||||||||||||||
|
30 Days or Less
|
$
|
405,725
|
|
0.83
|
%
|
18
|
|
$
|
295,277
|
|
0.54
|
%
|
14
|
|
||||||
|
31-60 Days
|
195,288
|
|
0.94
|
%
|
45
|
|
203,144
|
|
0.54
|
%
|
44
|
|
||||||||
|
61-90 Days
|
149,965
|
|
0.97
|
%
|
74
|
|
239,431
|
|
0.68
|
%
|
74
|
|
||||||||
|
91-120 Days
|
8,240
|
|
0.83
|
%
|
102
|
|
193,962
|
|
0.56
|
%
|
106
|
|
||||||||
|
121-150 Days
|
11,798
|
|
0.96
|
%
|
131
|
|
—
|
|
—
|
%
|
—
|
|
||||||||
|
151-180 Days
|
19,296
|
|
1.05
|
%
|
164
|
|
1,506
|
|
1.57
|
%
|
175
|
|
||||||||
|
Total Agency RMBS
|
790,312
|
|
0.89
|
%
|
41
|
|
933,320
|
|
0.58
|
%
|
56
|
|
||||||||
|
Credit:
|
||||||||||||||||||||
|
30 Days or Less
|
94,849
|
|
2.55
|
%
|
16
|
|
14,674
|
|
1.94
|
%
|
17
|
|
||||||||
|
31-60 Days
|
26,974
|
|
2.36
|
%
|
47
|
|
26,419
|
|
1.87
|
%
|
39
|
|
||||||||
|
61-90 Days
|
41,522
|
|
2.43
|
%
|
77
|
|
82,292
|
|
2.46
|
%
|
67
|
|
||||||||
|
91-120 Days
|
10,084
|
|
2.91
|
%
|
97
|
|
—
|
|
—
|
%
|
—
|
|
||||||||
|
121-150 Days
|
1,239
|
|
2.73
|
%
|
124
|
|
—
|
|
—
|
%
|
—
|
|
||||||||
|
151-180 Days
|
12,616
|
|
3.17
|
%
|
165
|
|
24,193
|
|
2.62
|
%
|
164
|
|
||||||||
|
181-360 Days
|
50,557
|
|
3.46
|
%
|
316
|
|
23,877
|
|
2.80
|
%
|
346
|
|
||||||||
|
>360 Days
|
—
|
|
—
|
%
|
—
|
|
69,414
|
|
2.51
|
%
|
666
|
|
||||||||
|
Total Credit Assets
|
237,841
|
|
2.75
|
%
|
105
|
|
240,869
|
|
2.47
|
%
|
272
|
|
||||||||
|
U.S. Treasury Securities:
|
||||||||||||||||||||
|
30 Days or Less
|
5,428
|
|
0.91
|
%
|
4
|
|
—
|
|
—
|
%
|
—
|
|
||||||||
|
Total U.S. Treasury Securities
|
5,428
|
|
0.91
|
%
|
4
|
|
—
|
|
—
|
%
|
—
|
|
||||||||
|
Total
|
$
|
1,033,581
|
|
1.32
|
%
|
56
|
|
$
|
1,174,189
|
|
0.97
|
%
|
100
|
|
||||||
Reverse repurchase agreements involving underlying investments that the Company sold prior to year end, for settlement following year end, are shown using their original maturity dates even though such reverse repurchase agreements may be expected to be terminated early upon settlement of the sale of the underlying investment. Not included above are reverse repurchase agreements that the Company may have entered into prior to year end for which delivery of the borrowed funds is not scheduled until after year end in the amount of
$4.4 million
as of December 31, 2015.
As of
December 31, 2016
and December 31, 2015, the fair value of investments transferred as collateral under outstanding borrowings under reverse repurchase agreements was
$1.15 billion
and
$1.35 billion
, respectively. Collateral transferred under outstanding borrowings as of
December 31, 2016
include investments in the amount of
$33.4 million
that were sold prior to year end but for which such sale had not yet settled. In addition the Company posted net cash collateral of
$39.2 million
and additional securities with a fair value of
$2.7 million
as of
December 31, 2016
to its counterparties. Collateral transferred under outstanding borrowings as of December 31, 2015 include investments in the amount of
$16.8 million
that were sold prior to year end but for which such sale had not yet settled. In addition, the Company posted net cash collateral of
$25.5 million
and additional securities with a fair value of
$5.1 million
as of December 31, 2015 as a result of margin calls from various counterparties.
As of December 31, 2016 and 2015 there were no counterparties for which the amounts at risk relating to our repurchase agreements was greater than
10%
of total equity.
Securitized Debt
In addition to its borrowings under reverse repurchase agreements, the Company has entered into securitization transactions to finance certain of its commercial mortgage loans and REO which are accounted for as collateralized borrowings. As of
December 31, 2016
, the Company had outstanding borrowings in the amount of
$24.1 million
in connection with one such securitization which is reflected under the caption Securitized debt, on the Company's Consolidated Statement of Assets, Liabilities, and Equity. As of
December 31, 2016
, the fair value of commercial mortgage loans and REO collateralizing this financing was
$42.0 million
. Interest accrues at a rate of LIBOR plus
3.25%
and the debt has a maturity date of September
151
30, 2018. The Company did not have any outstanding borrowings classified as Securitized debt as of December 31, 2015. See Note 7, Related Party Transactions, for further information on the Company's securitized debt.
7. Related Party Transactions
The Company is party to a Management Agreement (which may be amended from time to time), pursuant to which the Manager manages the assets, operations, and affairs of the Company, in consideration of which the Company pays the Manager management and incentive fees. Effective November 3, 2015, the Board of Directors approved a Sixth Amended and Restated Management Agreement, between the Company and the Manager. The descriptions of the Base Management Fees and Incentive Fees are detailed below.
Base Management Fees
The Operating Partnership pays the Manager
1.50%
per annum of total equity of the Operating Partnership calculated in accordance with U.S. GAAP as of the end of each fiscal quarter (before deductions for base management fees and incentive fees payable with respect to such fiscal quarter), provided that total equity is adjusted to exclude one-time events pursuant to changes in U.S. GAAP, as well as non-cash charges after discussion between the Manager and the Company's independent directors, and approval by a majority of the Company's independent directors in the case of non-cash charges.
Summary information
— For the years ended
December 31, 2016
, 2015, and 2014, the total base management fee incurred was
$10.1 million
,
$11.5 million
, and
$10.8 million
, respectively.
Incentive Fees
The Manager is entitled to receive a quarterly incentive fee equal to the positive excess, if any, of (i) the product of (A)
25%
and (B) the excess of (1) Adjusted Net Income (described below) for the Incentive Calculation Period (which means such fiscal quarter and the immediately preceding three fiscal quarters) over (2) the sum of the Hurdle Amounts (described below) for the Incentive Calculation Period, over (ii) the sum of the incentive fees already paid or payable for each fiscal quarter in the Incentive Calculation Period preceding such fiscal quarter.
For purposes of calculating the incentive fee, "Adjusted Net Income" for the Incentive Calculation Period means the net increase in equity from operations of the Operating Partnership, after all base management fees but before any incentive fees for such period, and excluding any non-cash equity compensation expenses for such period, as reduced by any Loss Carryforward (as described below) as of the end of the fiscal quarter preceding the Incentive Calculation Period.
For purposes of calculating the incentive fee, the "Loss Carryforward" as of the end of any fiscal quarter is calculated by determining the excess, if any, of (1) the Loss Carryforward as of the end of the immediately preceding fiscal quarter over (2) the Company's net increase in equity from operations (expressed as a positive number) or net decrease in equity from operations (expressed as a negative number) of the Operating Partnership for such fiscal quarter. As of
December 31, 2016
there was a Loss Carryforward of
$15.7 million
.
For purposes of calculating the incentive fee, the "Hurdle Amount" means, with respect to any fiscal quarter, the product of (i) one-fourth of the greater of (A)
9%
and (B)
3%
plus the 10-year U.S. Treasury rate for such fiscal quarter, (ii) the sum of (A) the weighted average gross proceeds per share of all common share and OP Unit issuances since inception of the Company and up to the end of such fiscal quarter, with each issuance weighted by both the number of shares and OP Units issued in such issuance and the number of days that such issued shares and OP Units were outstanding during such fiscal quarter, using a first-in first-out basis of accounting (
i.e.
attributing any share and OP Unit repurchases to the earliest issuances first) and (B) the result obtained by dividing (I) retained earnings attributable to common shares and OP Units at the beginning of such fiscal quarter by (II) the average number of common shares and OP Units outstanding for each day during such fiscal quarter, (iii) the sum of the average number of common shares, LTIP Units, and OP Units outstanding for each day during such fiscal quarter. For purposes of determining the Hurdle Amount, issuances of common shares and OP Units (a) as equity incentive awards, (b) to the Manager as part of its base management fee or incentive fee and (c) to the Manager or any of its affiliates in privately negotiated transactions, are excluded from the calculation. The payment of the incentive fee will be in a combination of common shares and cash, provided that at least
10%
of any quarterly payment will be made in common shares.
Summary information
—The Company did not incur any expense for incentive fees for either of the years ended
December 31, 2016
and 2015, since on a rolling four quarter basis, the Company's income did not exceed the prescribed hurdle amount. Incentive fee expense incurred for the year ended December 31, 2014 was
$1.4 million
.
152
Termination Fees
The Management Agreement requires the Company to pay a termination fee to the Manager in the event of (1) the Company's termination or non-renewal of the Management Agreement without cause or (2) the Company's termination of the Management Agreement based on unsatisfactory performance by the Manager that is materially detrimental to the Company (3) the Manager's termination of the Management Agreement upon a default by the Company in the performance of any material term of the Management Agreement. Such termination fee will be equal to the amount of three times the sum of (i) the average annual Quarterly Base Management Fee Amounts paid or payable with respect to the two 12-month periods ending on the last day of the latest fiscal quarter completed on or prior to the date of the notice of termination or non-renewal and (ii) the average annual Quarterly Incentive Fee Amounts paid or payable with respect to the two 12-month periods ending on the last day of the latest fiscal quarter completed on or prior to the date of the notice of termination or non-renewal.
Expense Reimbursement
Under the terms of the Management Agreement the Company is required to reimburse the Manager for operating expenses related to the Company that are incurred by the Manager, including expenses relating to legal, accounting, due diligence, other services, and all other costs and expenses. The Company's reimbursement obligation is not subject to any dollar limitation. Expenses will be reimbursed in cash within
60 days
following delivery of the expense statement by the Manager; provided, however, that such reimbursement may be offset by the Manager against amounts due to the Company from the Manager. The Company will not reimburse the Manager for the salaries and other compensation of the Manager's personnel except that the Company will be responsible for expenses incurred by the Manager in employing certain dedicated or partially dedicated personnel as further described below.
The Company reimburses the Manager for the allocable share of the compensation, including, without limitation, wages, salaries, and employee benefits paid or reimbursed, as approved by the Compensation Committee of the Board of Directors to certain dedicated or partially dedicated personnel who spend all or a portion of their time managing the Company's affairs, based upon the percentage of time devoted by such personnel to the Company's affairs. In their capacities as officers or personnel of the Manager or its affiliates, such personnel will devote such portion of their time to the Company's affairs as is necessary to enable the Company to operate its business.
For the years ended
December 31, 2016
, 2015, and 2014, the Company reimbursed the Manager
$6.5 million
,
$5.1 million
, and
$4.8 million
, respectively, for previously incurred operating and compensation expenses.
Equity Investments in Certain Mortgage Originators
As of
December 31, 2016
, the mortgage originators in which the Company holds an equity investment represent related parties. Transactions that have been entered into with these related party mortgage originators are summarized below.
In March 2015, the Company entered into a flow mortgage loan purchase and sale agreement with a mortgage originator in which the Company holds an investment in preferred and common stock, whereby the Company has committed to purchase eligible residential mortgage loans. See Note 15, Commitments and Contingencies, for further information on such flow agreement. The Company has also provided a
$5.0 million
line of credit to the mortgage originator. Under the terms of this line of credit, the Company has agreed to make advances to the mortgage originator solely for the purpose of funding residential mortgage loans designated for sale to the Company. To the extent the advances are drawn by the mortgage originator, it must pay interest, equal to
10.00%
, on the unpaid amount of each advance from the date the advance is made until such advance is paid in full. The mortgage originator is required to repay advances made in full no later than two business days following the date the Company purchases the loans from the mortgage originator. As of
December 31, 2016
, there were
$2.2 million
in advances outstanding.
In connection with another mortgage originator in which the Company holds an equity interest, the Company has entered into agreements whereby it guarantees the performance of such mortgage originator under a third-party warehouse facility and a third-party master repurchase agreement. The Company also has funded and caused a letter of credit to be issued by a bank for the benefit of this mortgage originator, in order to assist it in complying with its state licensing requirements. See Note 15, Commitments and Contingencies, for further information on the Company's guarantees of the third-party borrowing arrangements, as well as other obligations of the Company with respect to this mortgage originator.
Consumer and Residential Loan Transactions through Affiliates
The Company has investments in participation certificates related to consumer loans titled in the name of a related party of Ellington. Through its participation certificates, the Company has beneficial interests in the loan cash flows, net of servicing-related fees and expenses. The total fair value of the Company's beneficial interests in the net cash flows, was
$7.6 million
and
153
$3.8 million
as of
December 31, 2016
and 2015, respectively, and is included on the Company's Consolidated Condensed Schedule of Investments in Consumer Loans and Asset-backed Securities backed by Consumer Loans.
The Company purchases certain of its consumer loans through an affiliate, or the "Purchasing Entity." The Purchasing Entity has entered into purchase agreements, open-ended in duration, with third party consumer loan originators whereby it has agreed to purchase eligible consumer loans. The amount of loans purchased under these purchase agreements is dependent on, among other factors, the amount of loans originated in any given period by the selling originators. The Company and other affiliates of Ellington have entered into agreements with the Purchasing Entity whereby the Company and each of the affiliates have agreed to purchase their allocated portion (subject to monthly determination based on available capital and other factors) of the eligible loans acquired by the Purchasing Entity under each purchase agreement. The Company and other affiliates acquire beneficial interests in the loans from the Purchasing Entity immediately upon purchase by the Purchasing Entity at the price paid by the Purchasing Entity. During the year ended December 31, 2016, the Company purchased loans under these agreements with an aggregate principal balance of
$46.3 million
. As of December 31, 2016, the estimated remaining contingent purchase obligations of the Company under these purchase agreements was approximately
$260 million
in principal balance.
The Company has investments in participation certificates related to consumer loans held in trusts owned by another related party of Ellington. Through its participation certificates, the Company participates in the cash flows of the underlying loans held by each trust. The total amount of consumer loans held in the related party trusts, for which the Company has participating interests in the net cash flows, was
$43.2 million
as of
December 31, 2016
, and is included on the Company's Consolidated Condensed Schedule of Investments in Consumer Loans and Asset-backed Securities backed by Consumer Loans.
The Company has investments in participation certificates related to residential mortgage loans and REO held in a trust owned by another related party of Ellington. Through its participation certificates, the Company participates in the cash flows of the underlying loans held by such trust. The total amount of residential mortgage loans and REO held in the related party trust, for which the Company has participating interests in the net cash flows, was
$86.0 million
as of
December 31, 2016
, and is included on the Company's Consolidated Condensed Schedule of Investments in Mortgage Loans as well as Real Estate Owned.
Participation in Multi-Borrower Financing Facility
The Company is a co-participant in an agreement with certain other entities managed by Ellington, or the "affiliated entities," in order to facilitate the financing of certain small balance commercial mortgage loans and REO owned by the Company and the affiliated entities, respectively (the "SBC Assets"). In connection with this financing, each of the Company and the affiliated entities transferred their respective SBC Assets to a jointly owned entity, which in turn transferred these assets to a securitization trust. As of
December 31, 2016
, the trust has outstanding issued debt to a large financial institution in the amount of
$62.1 million
which amortizes over a period ending in September 2018. While the Company's SBC Assets were transferred to the securitization trust, the Company's SBC Assets and the related debt have not been derecognized for financial reporting purposes, in accordance with ASC 860-10, because the Company continues to retain the risks and rewards of ownership of its SBC Assets. The Company's portion of the total debt outstanding as of
December 31, 2016
was
$24.1 million
and is reflected under the caption Securitized debt on the Company's Consolidated Statement of Assets, Liabilities, and Equity. To the extent there is a default under the financing arrangement, such as the insolvency of either the Company or the affiliated entities, the assets of the non-defaulting party could be used to satisfy outstanding obligations under the financing arrangement. As of
December 31, 2016
, each of the affiliated entities was solvent.
Participation in Multi-Seller Consumer Loan Securitization
The Company participated in an August 2016 securitization transaction whereby the Company, together with another entity managed by Ellington (the "co-participant"), sold consumer loans with an aggregate unpaid principal balance of approximately
$124 million
to a newly formed special purpose entity ("the Issuer"). Of the $124 million in loans sold to the Issuer, the Company's share was
51%
while the co-participant's share was
49%
. The transfer was accounted for as a sale in accordance with ASC 860-10. Pursuant to the securitization, the Issuer issued senior and subordinated notes in the principal amount of
$87 million
and
$18.7 million
, respectively. Trust certificates representing beneficial ownership of the Issuer were also issued. In connection with the transaction, and through a jointly owned newly formed entity (the "Acquiror"), the Company and the co-participant acquired all of the subordinated notes as well as the trust certificates in the Issuer. The Company and the co-participant acquired
51%
and
49%
, respectively, of the interest in the Acquiror. The Company's interest in the Acquiror is accounted for as a beneficial interest.
The notes and trust certificates issued by the Issuer are backed by the cash flows from the underlying consumer loans. The Company has no obligation to repurchase or replace securitized loans that subsequently become delinquent or are otherwise in default. However, if there are breaches of representations and warranties, the Company could, under certain circumstances be
154
required to purchase or replace securitized loans. Cash flows collected on the underlying consumer loans are distributed to service providers, noteholders and trust certificate holders in accordance with the contractual priority of payments. Before the senior notes have been fully repaid, most of these cash inflows are applied first to service the loans, administer the Issuer, and repay the senior notes. After the senior notes have been fully repaid, most of these cash inflows are applied first to service the loans, administer the Issuer, and then to repay the subordinated notes. In any given period, and subject to the level of available cash flow, the trust certificates may receive payments. In addition, another affiliate of Ellington (the "Administrator"), acts as the administrator for the securitization and is paid a monthly fee for its services.
The Issuer is deemed to be a variable interest entity, or "VIE." A VIE is an entity having either total at-risk equity that is insufficient to finance its activities without additional subordinated financial support, or whose at-risk equity holders lack the ability to control the entity's activities. Variable interests are investments or other interests in a VIE that will absorb portions of such VIE's expected losses or receive portions of the VIE's expected residual returns. Expected residual returns represent the expected positive variability in the fair value of a VIE's net assets. Because the Company holds a variable interest in the Issuer, and as the Issuer is deemed to be a VIE, the Company is required to evaluate its interest in the Issuer under ASC 810,
Consolidation
. Under the VIE model, the party that is deemed to be the primary beneficiary is required to consolidate the VIE. The primary beneficiary is defined as the party that has the power to direct the entity's most significant economic activities and the ability to participate in the entity's economics. While the Company retains credit risk in the securitization because the Company's beneficial interests include the most subordinated interests in the securitized assets, which are the first to absorb credit losses on those assets, the Company does not retain the power to direct the activities of the Issuer that most significantly impact the Issuer's economic performance. As a result, the Company determined that neither the Company nor the Acquiror is the primary beneficiary of the Issuer, and therefore the Company has not consolidated the Issuer.
In December 2016, in order to facilitate the financing of the Company's share of the subordinated note held by the Acquiror, the Company entered into a repurchase agreement with the Acquiror (the "Acquiror Repurchase Agreement") whereby the Company's share of the subordinated note held by the Acquiror was transferred to the Company as collateral under the Acquiror Repurchase Agreement. The Company then re-hypothecated this collateral to a third-party lending institution pursuant to a reverse repurchase agreement (the "Reverse Agreement"). The Acquiror Repurchase Agreement is included on the Company's Consolidated Statement of Assets, Liabilities and Equity under the caption, Repurchase Agreements, at fair value and on its Consolidated Condensed Schedule of Investments. The Company's obligation under the Reverse Agreement is included on its Consolidated Statement of Assets, Liabilities and Equity under the caption, Reverse repurchase agreements. As of December 31, 2016 the outstanding amounts under the Acquiror Repurchase Agreement and the Reverse Agreement were each
$6.2 million
and the fair value of the related collateral was
$9.5 million
.
8. Long-Term Incentive Plan Units
Units held pursuant to the Individual LTIPs are generally exercisable by the holder at any time after vesting. Each unit is convertible into one common share. Costs associated with the Individual LTIPs are measured as of the grant date and expensed ratably over the vesting period. Total expense associated with Individual LTIPs for the years ended
December 31, 2016
, 2015, and 2014 was
$0.4 million
,
$0.4 million
, and
$0.3 million
, respectively.
The below table details on the Company's unvested LTIP Units as of
December 31, 2016
:
|
Grant Recipient
|
Number of LTIP Units Granted
|
Grant Date
|
Vesting Date
(1)
|
||||
|
Independent directors:
|
|||||||
|
8,403
|
|
September 13, 2016
|
September 12, 2017
|
||||
|
Partially dedicated employees:
|
|||||||
|
8,090
|
|
December 13, 2016
|
December 13, 2017
|
||||
|
5,583
|
|
December 13, 2016
|
December 13, 2018
|
||||
|
5,949
|
|
December 15, 2015
|
December 15, 2017
|
||||
|
686
|
|
December 15, 2015
|
December 31, 2017
|
||||
|
Total unvested LTIP Units at December 31, 2016
|
28,711
|
|
|||||
|
(1)
|
Date at which such LTIP Units will vest and become non-forfeitable.
|
155
The following table summarizes issuance and exercise activity of the Company's LTIP Units for the years ended
December 31, 2016
, 2015, and 2014:
|
Year Ended
December 31, 2016 |
Year Ended
December 31, 2015 |
Year Ended
December 31, 2014 |
||||||||||||||||||||||||
|
Manager
|
Director/
Employee
|
Total
|
Manager
|
Director/
Employee
|
Total
|
Manager
|
Director/
Employee
|
Total
|
||||||||||||||||||
|
LTIP Units Outstanding (12/31/2015, 12/31/14, and 12/31/2013, respectively)
|
375,000
|
|
74,938
|
|
449,938
|
|
375,000
|
|
54,314
|
|
429,314
|
|
375,000
|
|
36,052
|
|
411,052
|
|
||||||||
|
Granted
|
—
|
|
22,076
|
|
22,076
|
|
—
|
|
22,571
|
|
22,571
|
|
—
|
|
20,084
|
|
20,084
|
|
||||||||
|
Exercised
|
—
|
|
(2,475
|
)
|
(2,475
|
)
|
—
|
|
(1,947
|
)
|
(1,947
|
)
|
—
|
|
(1,822
|
)
|
(1,822
|
)
|
||||||||
|
LTIP Units Outstanding (12/31/2016, 12/31/2015, and 12/31/2014, respectively)
|
375,000
|
|
94,539
|
|
469,539
|
|
375,000
|
|
74,938
|
|
449,938
|
|
375,000
|
|
54,314
|
|
429,314
|
|
||||||||
|
LTIP Units Vested and Outstanding (12/31/2016, 12/31/2015, and 12/31/2014, respectively)
|
375,000
|
|
65,828
|
|
440,828
|
|
375,000
|
|
46,120
|
|
421,120
|
|
375,000
|
|
29,859
|
|
404,859
|
|
||||||||
As of December 31, 2016, there were an aggregate of
1,307,397
common shares underlying awards, including LTIP Units, available for future issuance under the Company's 2007 Incentive Plan for Individuals and 2007 Incentive Plan for Entities.
9. Non-controlling Interests
Operating Partnership
Non-controlling interests include the interest in the Operating Partnership owned by an affiliate of the Manager and certain related parties. On January 1, 2013,
212,000
OP Units were purchased by the initial non-controlling interest member. Income allocated to the non-controlling interest is based on the non-controlling interest owners' ownership percentage of the Operating Partnership during the quarter, calculated using a daily weighted average of all common shares and convertible units outstanding during the quarter. Holders of OP Units are entitled to receive the same distributions that holders of common shares receive, and OP Units are convertible into common shares on a one-for-one basis, subject to specified limitations. OP Units are non-voting with respect to matters as to which common shareholders are entitled to vote. As of
December 31, 2016
, non-controlling interest related to the outstanding
212,000
OP Units represented an interest of approximately
0.6%
in the Operating Partnership.
Joint Venture Interests
Non-controlling interests also include the interests of joint venture partners in various consolidated subsidiaries of the Company. These subsidiaries hold the Company's investments in certain commercial mortgage loans and REO. These joint venture partners participate in these subsidiaries on a pari passu basis with the Company at a predetermined percentage, and therefore participate in all income, expense, gains and losses of such subsidiaries. These joint venture partners make capital contributions to the subsidiaries as new approved investments are purchased by the subsidiaries, and are generally entitled to distributions when investments are sold or otherwise disposed of. As of
December 31, 2016
and 2015 these joint venture partners' interests in subsidiaries of the Company were
$3.0 million
and
$2.3 million
, respectively.
These joint venture partners' interests are not convertible into common shares of the Company or OP Units, nor are these joint venture partners entitled to receive distributions that holders of common shares of the Company receive.
10. Common Share Capitalization
During the years ended
December 31, 2016
, 2015, and 2014, the Board of Directors authorized dividends totaling
$1.95
per share,
$2.45
per share, and
$3.08
per share, respectively. Total dividends paid during the years ended
December 31, 2016
, 2015, and 2014 were
$65.1 million
,
$83.5 million
, and
$86.4 million
, respectively.
156
The following table summarizes issuance, repurchase and other activity with respect to the Company's common shares for the years ended
December 31, 2016
, 2015, and 2014:
|
Year Ended December 31, 2016
|
Year Ended December 31, 2015
|
Year Ended December 31, 2014
|
|||||||
|
Common Shares Outstanding
(12/31/2015, 12/31/2014, and 12/31/2013, respectively)
|
33,126,012
|
|
33,449,678
|
|
25,428,186
|
|
|||
|
Share Activity:
|
|||||||||
|
Shares issued
|
—
|
|
—
|
|
8,000,000
|
|
|||
|
Shares repurchased
|
(833,784
|
)
|
(325,613
|
)
|
—
|
|
|||
|
Shares issued in connection with incentive fee payment
|
—
|
|
—
|
|
19,670
|
|
|||
|
Director LTIP Units exercised
|
2,475
|
|
1,947
|
|
1,822
|
|
|||
|
Common Shares Outstanding
(12/31/2016, 12/31/2015, and 12/31/2014, respectively)
|
32,294,703
|
|
33,126,012
|
|
33,449,678
|
|
|||
If all LTIP and OP Units that have been previously issued were to become fully vested and exchanged for common shares as of
December 31, 2016
, 2015, and 2014, the Company's issued and outstanding common shares would increase to
32,976,242
,
33,787,950
, and
34,090,992
shares, respectively.
On August 3, 2015, the Company's Board of Directors approved the adoption of a share repurchase program under which the Company is authorized to repurchase up to
1.7 million
common shares. The program, which is open-ended in duration, allows the Company to make repurchases from time to time on the open market or in negotiated transactions, including under Rule 10b5-1 plans. Repurchases are at the Company's discretion, subject to applicable law, share availability, price and its financial performance, among other considerations. This program supersedes the program that was previously adopted on August 4, 2011. During the year ended
December 31, 2016
, the Company repurchased
833,784
shares at an average price per share of
$16.82
and a total cost of
$14.0 million
.
157
11. Earnings Per Share
The components of the computation of basic and diluted EPS were as follows:
|
Year Ended December 31,
|
||||||||||||
|
2016
|
2015
|
2014
|
||||||||||
|
(In thousands except share amounts)
|
||||||||||||
|
Net increase (decrease) in shareholders' equity resulting from operations
|
$
|
(16,007
|
)
|
$
|
38,089
|
|
$
|
59,167
|
|
|||
|
Add: Net (decrease) increase in equity resulting from operations attributable to the participating non-controlling interest
(1)
|
(101
|
)
|
239
|
|
472
|
|
||||||
|
Net increase (decrease) in equity resulting from operations related to common shares, LTIP unit holders, and participating non-controlling interest
|
(16,108
|
)
|
38,328
|
|
59,639
|
|
||||||
|
Net increase (decrease) in shareholders' equity resulting from operations available to common share and LTIP unit holders:
|
||||||||||||
|
Net increase (decrease) in shareholders' equity resulting from operations– common shares
|
(15,789
|
)
|
37,604
|
|
58,306
|
|
||||||
|
Net increase (decrease) in shareholders' equity resulting from operations– LTIP Units
|
(218
|
)
|
485
|
|
861
|
|
||||||
|
Dividends Paid
(2)
:
|
||||||||||||
|
Common shareholders
|
(63,855
|
)
|
(81,886
|
)
|
(84,527
|
)
|
||||||
|
LTIP unit holders
|
(880
|
)
|
(1,054
|
)
|
(1,269
|
)
|
||||||
|
Non-controlling interest
|
(413
|
)
|
(520
|
)
|
(653
|
)
|
||||||
|
Total dividends paid to common shareholders, LTIP unit holders, and non-controlling interest
|
(65,148
|
)
|
(83,460
|
)
|
(86,449
|
)
|
||||||
|
Undistributed (Distributed in excess of) earnings:
|
||||||||||||
|
Common shareholders
|
(79,644
|
)
|
(44,282
|
)
|
(26,221
|
)
|
||||||
|
LTIP unit holders
|
(1,098
|
)
|
(569
|
)
|
(408
|
)
|
||||||
|
Non-controlling interest
|
(514
|
)
|
(281
|
)
|
(181
|
)
|
||||||
|
Total undistributed (distributed in excess of) earnings attributable to common shareholders, LTIP unit holders, and non-controlling interest
|
$
|
(81,256
|
)
|
$
|
(45,132
|
)
|
$
|
(26,810
|
)
|
|||
|
Weighted average shares outstanding (basic and diluted):
|
||||||||||||
|
Weighted average common shares outstanding
|
32,758,050
|
|
33,422,053
|
|
27,962,304
|
|
||||||
|
Weighted average participating LTIP Units
|
452,436
|
|
431,640
|
|
413,105
|
|
||||||
|
Weighted average non-controlling interest units
|
212,000
|
|
212,000
|
|
212,000
|
|
||||||
|
Basic earnings per common share:
|
||||||||||||
|
Distributed
|
$
|
1.95
|
|
$
|
2.45
|
|
$
|
3.08
|
|
|||
|
Undistributed (Distributed in excess of)
|
(2.43
|
)
|
(1.32
|
)
|
(0.99
|
)
|
||||||
|
$
|
(0.48
|
)
|
$
|
1.13
|
|
$
|
2.09
|
|
||||
|
Diluted earnings per common share:
|
||||||||||||
|
Distributed
|
$
|
1.95
|
|
$
|
2.45
|
|
$
|
3.08
|
|
|||
|
Undistributed (Distributed in excess of)
|
(2.43
|
)
|
(1.32
|
)
|
(0.99
|
)
|
||||||
|
$
|
(0.48
|
)
|
$
|
1.13
|
|
$
|
2.09
|
|
||||
|
(1)
|
For the years ended
December 31, 2016
, 2015, and 2014, excludes net increase in equity resulting from operations of
$0.4 million
,
$0.1 million
and
$0.3 million
, respectively attributable to joint venture partners, which have non-participating interests as described in Note 9.
|
|
(2)
|
The Company pays quarterly dividends in arrears, so a portion of the dividends paid in each calendar year relate to the prior year's earnings.
|
158
12. Counterparty Risk
As of
December 31, 2016
, investments with an aggregate value of approximately
$1.15 billion
were held with dealers as collateral for various reverse repurchase agreements. The investments held as collateral include securities in the amount of
$33.4 million
that were sold prior to year end but for which such sale had not yet settled as of
December 31, 2016
. At December 31, 2016 no single counterparty held more than 15% of the total amount held with dealers as collateral for various reverse repurchase agreements. In addition to the below, unencumbered investments, on a settlement date basis, of approximately
$119.6 million
were held in custody at the Bank of New York Mellon Corporation.
The following table details the percentage of collateral amounts held by dealers who hold greater than
15%
of the Company's Due from Brokers, included as of
December 31, 2016
:
|
Dealer
|
% of Total Due
from Brokers
|
|
|
Morgan Stanley
|
18%
|
|
The following table details the percentage of amounts held by dealers who hold greater than
15%
of the Company's Receivable for securities sold as of
December 31, 2016
:
|
Dealer
|
% of Total Receivable
for Securities Sold
|
|
|
Bank of America Securities
|
25%
|
|
|
Barclays Capital Inc.
|
21%
|
|
In addition, the Company held cash and cash equivalents of
$123.3 million
and
$183.9 million
as of
December 31, 2016
and 2015, respectively. The below table details the concentration of cash and cash equivalents held by each counterparty:
|
As of
|
||||
|
Counterparty
|
December 31, 2016
|
December 31, 2015
|
||
|
BlackRock Liquidity Funds FedFund Portfolio
|
41%
|
—%
|
||
|
Bank of New York Mellon Corporation
|
27%
|
13%
|
||
|
Goldman Sachs Financial Square Funds - Government Fund
|
16%
|
—%
|
||
|
Morgan Stanley Institutional Liquidity Fund - Government Portfolio
|
16%
|
—%
|
||
|
BlackRock Liquidity Funds TempFund Portfolio
|
—%
|
54%
|
||
|
JPMorgan Prime Money Market Fund
|
—%
|
27%
|
||
|
JPMorgan U.S. Treasury Plus Money Market Fund
|
—%
|
6%
|
||
13. Restricted Cash
The Company is required to maintain certain cash balances with counterparties and/or unrelated third parties for various activities and transactions.
In connection with the line of credit provided by the Company to one of the mortgage originators in which it has invested, as described in Note 7, Related Party Transactions, the Company had placed cash into a restricted account in the Company's name, which was available to be drawn upon by the mortgage originator as needed to fund the origination of residential mortgage loans designated for sale to the Company. As of December 31, 2016 this account is no longer restricted.
In connection with the letter of credit with another mortgage originator, as described in Note 7, Related Party Transactions, funds have been deposited into an account for the benefit of the mortgage originator.
The Company is required to maintain a specific cash balance in a segregated account pursuant to a flow consumer loan purchase and sale agreement.
The Company is also required to maintain specific minimum cash balances in connection with certain regulated subsidiaries, including its subsidiary that holds various state mortgage origination licenses.
159
The below table details the Company's restricted cash balances included in Restricted cash on the Consolidated Statement of Assets, Liabilities, and Equity as of
December 31, 2016
and 2015.
|
December 31, 2016
|
December 31, 2015
|
|||||||
|
(In thousands)
|
||||||||
|
Restricted cash balance related to:
|
||||||||
|
Minimum account balance required for regulatory purposes
|
$
|
250
|
|
$
|
500
|
|
||
|
Letter of credit
|
230
|
|
230
|
|
||||
|
Flow consumer loan purchase and sale agreement
|
175
|
|
3,700
|
|
||||
|
Line of credit
|
—
|
|
427
|
|
||||
|
Total
|
$
|
655
|
|
$
|
4,857
|
|
||
14. Offsetting of Assets and Liabilities
The Company records financial instruments at fair value as described in Note 2. All financial instruments are recorded on a gross basis on the Consolidated Statement of Assets, Liabilities, and Equity. In connection with the vast majority of its derivative, repurchase and reverse repurchase agreements, and the related trading agreements, the Company and its counterparties are required to pledge collateral. Cash or other collateral is exchanged as required with each of the Company's counterparties in connection with open derivative positions, and repurchase and reverse repurchase agreements.
The following tables present information about certain assets and liabilities representing financial instruments as of
December 31, 2016
and 2015. The Company has not entered into master netting agreements with any of its counterparties. Certain of the Company's repurchase and reverse repurchase agreements and financial derivative transactions are governed by underlying agreements that generally provide a right of offset in the event of default or in the event of a bankruptcy of either party to the transaction.
December 31, 2016
:
|
Description
|
Amount of Assets (Liabilities) Presented in the Consolidated Statements of Assets, Liabilities, and Equity
(1)
|
Financial Instruments Available for Offset
|
Financial Instruments Transferred or Pledged as Collateral
(2)(3)
|
Cash Collateral (Received) Pledged
(2)(3)
|
Net Amount
|
|||||||||||||||
|
(In thousands)
|
||||||||||||||||||||
|
Assets
|
||||||||||||||||||||
|
Financial derivatives–assets
|
$
|
35,595
|
|
$
|
(15,082
|
)
|
$
|
—
|
|
$
|
(7,933
|
)
|
$
|
12,580
|
|
|||||
|
Repurchase agreements
|
184,819
|
|
(184,819
|
)
|
—
|
|
—
|
|
—
|
|
||||||||||
|
Liabilities
|
|
|||||||||||||||||||
|
Financial derivatives–liabilities
|
(18,687
|
)
|
15,082
|
|
—
|
|
3,574
|
|
(31
|
)
|
||||||||||
|
Reverse repurchase agreements
|
(1,033,581
|
)
|
184,819
|
|
809,573
|
|
39,189
|
|
—
|
|
||||||||||
December 31, 2015:
|
Description
|
Amount of Assets (Liabilities) Presented in the Consolidated Statements of Assets, Liabilities, and Equity
(1)
|
Financial Instruments Available for Offset
|
Financial Instruments Transferred or Pledged as Collateral
(2)(3)
|
Cash Collateral (Received) Pledged
(2)(3)
|
Net Amount
|
|||||||||||||||
|
(In thousands)
|
||||||||||||||||||||
|
Assets
|
||||||||||||||||||||
|
Financial derivatives–assets
|
$
|
162,905
|
|
$
|
(18,644
|
)
|
$
|
—
|
|
$
|
(105,202
|
)
|
$
|
39,059
|
|
|||||
|
Repurchase agreements
|
105,700
|
|
(105,700
|
)
|
—
|
|
—
|
|
—
|
|
||||||||||
|
Liabilities
|
||||||||||||||||||||
|
Financial derivatives–liabilities
|
(60,472
|
)
|
18,644
|
|
—
|
|
41,699
|
|
(129
|
)
|
||||||||||
|
Reverse repurchase agreements
|
(1,174,189
|
)
|
105,700
|
|
1,042,947
|
|
25,542
|
|
—
|
|
||||||||||
|
(1)
|
In the Company's Consolidated Statement of Assets, Liabilities, and Equity, all balances associated with repurchase agreements, reverse repurchase agreements, and financial derivatives are presented on a gross basis.
|
160
|
(2)
|
For the purpose of this presentation, for each row the total amount of financial instruments transferred or pledged and cash collateral (received) or pledged may not exceed the applicable gross amount of assets or (liabilities) as presented here. Therefore, the Company has reduced the amount of financial instruments transferred or pledged as collateral related to the Company's reverse repurchase agreements and cash collateral pledged on the Company's financial derivative liabilities. Total financial instruments transferred or pledged as collateral on the Company's reverse repurchase agreements as of
December 31, 2016
and 2015 were
$1.16 billion
and
$1.36 billion
, respectively. As of
December 31, 2016
and 2015, total cash collateral on financial derivative assets excludes excess net cash collateral pledged of
$14.9 million
and
$4.1 million
, respectively. As of
December 31, 2016
and 2015, total cash collateral on financial derivative liabilities excludes excess cash collateral pledged of
$14.8 million
and
$45.8 million
, respectively.
|
|
(3)
|
When collateral is pledged to or pledged by a counterparty, it is often pledged or posted with respect to all positions with such counterparty, and in such cases such collateral cannot be specifically identified as relating to a specific asset or liability. As a result, in preparing the above tables, the Company has made assumptions in allocating pledged or posted collateral among the various rows.
|
15. Commitments and Contingencies
The Company provides current directors and officers with a limited indemnification against liabilities arising in connection with the performance of their duties to the Company.
In the normal course of business the Company may also enter into contracts that contain a variety of representations, warranties, and general indemnifications. The Company's maximum exposure under these arrangements, including future claims that may be made against the Company that have not yet occurred, is unknown. The Company has not incurred any costs to defend lawsuits or settle claims related to these indemnification agreements. The Company has no liabilities recorded for these agreements as of
December 31, 2016
and 2015.
In August 2015 the Company entered into participation and guarantee agreements whereby: (i) the Company purchased a
$10 million
participation interest in a borrowing facility structured as a repurchase agreement, or "Repo Facility," between two parties unrelated to the Company, and (ii) the Company guarantees the borrower's payment obligations under the Repo Facility. The borrower may borrow up to
$200 million
under the Repo Facility, which is collateralized by residential mortgage loans which are required to be (1) eligible for guarantee by the Federal National Mortgage Association or the Federal Home Loan Mortgage Corporation, or (2) eligible for insurance by the Federal Housing Administration, or the U.S. Department of Veterans Affairs. To the extent the borrower performs under the Repo Facility over the term of the participation and guarantee agreements, the Company will be reimbursed in full its
$10 million
participation interest. Should the borrower default under the Repo Facility, the Company would be required to post to the lender an additional
5%
of the then-outstanding amount borrowed under the Repo Facility and should the lender then exercise its rights under the guarantee, the Company could be required to purchase the mortgage loan collateral at a price equal to the aggregate amount borrowed under the Repo Facility, inclusive of accrued interest and any outstanding unused facility fees. In this case, the Company would have full recourse to the borrower to the extent of any deficit between the value of the mortgage loan collateral and the price paid by the Company for such collateral. The Company has the option, but not the obligation, to finance a specified portion of such purchase with the lender for up to
six months
via a pre-negotiated, committed repurchase facility. As a result of these agreements, the Company's risk is a function of the ongoing creditworthiness of the borrower and market value of the mortgage loan collateral in relation to the amount owed by the borrower under the Repo Facility. For its participation in this arrangement, the Company is paid monthly and quarterly fees based on the amount utilized under the Repo Facility. Fees received are included in "Other Income" on the Company's Consolidated Statement of Operations. The participation interest in the amount of
$10 million
is included in "Due from broker" on the Company's Consolidated Statement of Assets, Liabilities, and Equity. The Company's obligation under this arrangement is deemed to be a guaranty under ASC 460-10,
Guarantees
, and is carried at fair value and included in "Other Liabilities," on the Consolidated Statement of Assets, Liabilities, and Equity.
As of
December 31, 2016
the borrower utilized approximately
$173.5 million
under the Repo Facility and is performing on its obligations under such facility. The original agreement expired in August 2016. Following the expiration, the parties to the arrangement have agreed to several extensions with the most recent extension terminating in February 2017.
Commitments and Contingencies Related to Investments in Mortgage Originators
In connection with certain of its investments in mortgage originators, the Company has outstanding commitments and contingencies as described below.
In connection with its equity interest in a mortgage originator, as described in Note 7, Related Party Transactions, the Company has entered into agreements whereby it guarantees the performance of the mortgage originator under a warehouse facility and a master repurchase agreement. As of
December 31, 2016
, the Company's maximum aggregate guarantees were
$125.0 million
. The Company's obligations under these arrangements are deemed to be guarantees under ASC 460-10, Guarantees, and are carried at fair value and included in Other Liabilities on the Consolidated Statement of Assets, Liabilities, and Equity. As of December 31, 2016, the Company and its co-investor each had a commitment to invest an additional
$10 million
in this mortgage originator.
As described in Note 7, Related Party Transactions, the Company entered into a flow mortgage loan purchase and sale
161
agreement with another mortgage originator whereby the Company has committed to purchase eligible residential mortgage loans, to the extent they are originated in accordance with the Company's specifications, which it may modify in its sole discretion, in an amount of at least
$200 million
. The Company may opt to increase the amount purchased in its sole discretion based on its evaluation of mortgage loans previously purchased as well as market conditions. As of
December 31, 2016
, the Company purchased loans under this agreement in the amount of
$99.2 million
and it has outstanding mortgage loan purchase commitments of
$20.6 million
, which are contingent upon successful loan closings in accordance with agreed-upon parameters.
16. Financial Highlights
Results of Operations for a Share Outstanding Throughout the Periods:
|
Year Ended December 31, 2016
|
Year Ended December 31, 2015
|
Year Ended December 31, 2014
|
||||||||||
|
Beginning Shareholders' Equity Per Share (12/31/2015, 12/31/2014, and 12/31/2013, respectively)
|
$
|
22.10
|
|
$
|
23.38
|
|
$
|
24.40
|
|
|||
|
Net Investment Income
|
1.09
|
|
1.98
|
|
2.10
|
|
||||||
|
Net Realized/Unrealized Gains (Losses)
|
(1.57
|
)
|
(0.83
|
)
|
0.04
|
|
||||||
|
Results of Operations Attributable to Equity
|
(0.48
|
)
|
1.15
|
|
2.14
|
|
||||||
|
Less: Results of Operations Attributable to Non-controlling Interests
|
(0.01
|
)
|
(0.01
|
)
|
(0.03
|
)
|
||||||
|
Results of Operations Attributable to Shareholders' Equity
(1)
|
(0.49
|
)
|
1.14
|
|
2.11
|
|
||||||
|
Dividends Paid to Common Shareholders
|
(1.95
|
)
|
(2.45
|
)
|
(3.08
|
)
|
||||||
|
Weighted Average Share Impact on Dividends Paid
(2)
|
(0.04
|
)
|
(0.05
|
)
|
(0.01
|
)
|
||||||
|
Accretive (Dilutive) Effect of Share Issuances (Net of Offering Costs), Share Repurchases, and Adjustments to Non-controlling Interest
|
0.13
|
|
0.08
|
|
(0.04
|
)
|
||||||
|
Ending Shareholders' Equity Per Share (12/31/2016, 12/31/2015, and 12/31/2014, respectively)
(3)
|
$
|
19.75
|
|
$
|
22.10
|
|
$
|
23.38
|
|
|||
|
Shares Outstanding, end of period
|
32,294,703
|
|
33,126,012
|
|
33,449,678
|
|
||||||
|
(1)
|
Calculated based on average common shares outstanding and can differ from the calculation for EPS (See Note 11).
|
|
(2)
|
Per share impact on dividends paid relating to share issuances/repurchases during the period as well as dividends paid to LTIP and OP Unit holders.
|
|
(3)
|
If all LTIP Units and OP Units previously issued were vested and exchanged for common shares as of
December 31, 2016
, 2015, and 2014, shareholders' equity per share would be $19.46, $21.80, and $23.09, respectively.
|
Total Return:
The Company calculates its total return two ways, one based on its reported net asset value and the other based on its publicly traded share price.
The following table illustrates the Company's total return for the periods presented based on net asset value:
Net Asset Value Based Total Return for a Shareholder:
(1)
|
Year Ended December 31, 2016
|
Year Ended December 31, 2015
|
Year Ended December 31, 2014
|
||||
|
Total Return
|
(1.83)%
|
5.14%
|
8.77%
|
|||
|
(1)
|
Total return is calculated assuming reinvestment of distributions at shareholders' equity per share during the period.
|
Market Based Total Return for a Shareholder:
For the years ended
December 31, 2016
, 2015, and 2014, the Company's market based total return based on the closing price as reported by the New York Stock Exchange was
3.50%
,
(4.56)%
, and
0.15%
, respectively. Calculation of market based total return assumes the reinvestment of dividends at the closing price as reported by the New York Stock Exchange as of the ex-date.
162
Net Investment Income Ratio to Average Equity:
(1)
|
Year Ended December 31, 2016
|
Year Ended December 31, 2015
|
Year Ended December 31, 2014
|
||||
|
Net Investment Income
(2)
|
5.22%
|
8.59%
|
8.62%
|
|||
|
(1)
|
Average equity is calculated using month end values.
|
|
(2)
|
Includes incentive fee in calculation which can vary substantially over periods.
|
Expense Ratios to Average Equity:
(1)
|
Year Ended December 31, 2016
|
Year Ended December 31, 2015
|
Year Ended December 31, 2014
|
||||
|
Operating expenses, before interest expense and other investment related expenses
|
(2.93)%
|
(2.69)%
|
(2.80)%
|
|||
|
Incentive fee
|
—%
|
—%
|
(0.21)%
|
|||
|
Interest expense and other investment related expenses
|
(3.56)%
|
(2.30)%
|
(2.14)%
|
|||
|
Total Expenses
|
(6.49)%
|
(4.99)%
|
(5.15)%
|
|||
|
(1)
|
Average equity is calculated using month end values.
|
163
17. Condensed Quarterly Financial Data (Unaudited)
Detailed below is unaudited quarterly financial data for the years ended December 31, 2016 and 2015.
|
Three Month Period Ended
|
|||||||||||||||
|
March 31, 2016
|
June 30, 2016
|
September 30, 2016
|
December 31, 2016
|
||||||||||||
|
(In thousands except per share amounts)
|
|||||||||||||||
|
INVESTMENT INCOME
|
|||||||||||||||
|
Interest income
|
$
|
20,427
|
|
$
|
18,990
|
|
$
|
16,662
|
|
$
|
18,265
|
|
|||
|
Other income
|
1,668
|
|
1,024
|
|
807
|
|
2,342
|
|
|||||||
|
Total investment income
|
22,095
|
|
20,014
|
|
17,469
|
|
20,607
|
|
|||||||
|
EXPENSES
|
|||||||||||||||
|
Base management fee
|
2,611
|
|
2,553
|
|
2,485
|
|
2,416
|
|
|||||||
|
Interest expense
|
3,468
|
|
4,234
|
|
4,143
|
|
4,461
|
|
|||||||
|
Other investment related expenses
|
1,749
|
|
2,191
|
|
2,068
|
|
2,062
|
|
|||||||
|
Other operating expenses
|
2,445
|
|
2,515
|
|
2,379
|
|
2,640
|
|
|||||||
|
Total expenses
|
10,273
|
|
11,493
|
|
11,075
|
|
11,579
|
|
|||||||
|
NET INVESTMENT INCOME
|
11,822
|
|
8,521
|
|
6,394
|
|
9,028
|
|
|||||||
|
NET REALIZED AND CHANGE IN NET UNREALIZED GAIN (LOSS) ON INVESTMENTS, FINANCIAL DERIVATIVES, AND FOREIGN CURRENCY TRANSACTIONS/TRANSLATION
|
|||||||||||||||
|
Net realized gain (loss) on investments, financial derivatives, and foreign currency transactions
|
(11,940
|
)
|
(2,331
|
)
|
(23,020
|
)
|
(2,242
|
)
|
|||||||
|
Change in net unrealized gain (loss) on investments, financial derivatives, and foreign currency translation
|
(23,068
|
)
|
(1,188
|
)
|
17,176
|
|
(4,854
|
)
|
|||||||
|
NET REALIZED AND UNREALIZED GAIN (LOSS) ON INVESTMENTS, FINANCIAL DERIVATIVES, AND FOREIGN CURRENCY
|
(35,008
|
)
|
(3,519
|
)
|
(5,844
|
)
|
(7,096
|
)
|
|||||||
|
NET INCREASE (DECREASE) IN EQUITY RESULTING FROM OPERATIONS
|
(23,186
|
)
|
5,002
|
|
550
|
|
1,932
|
|
|||||||
|
LESS: NET INCREASE IN EQUITY RESULTING FROM OPERATIONS ATTRIBUTABLE TO NON-CONTROLLING INTERESTS
|
14
|
|
17
|
|
34
|
|
240
|
|
|||||||
|
NET INCREASE (DECREASE) IN SHAREHOLDERS' EQUITY RESULTING FROM OPERATIONS
|
$
|
(23,200
|
)
|
$
|
4,985
|
|
$
|
516
|
|
$
|
1,692
|
|
|||
|
NET INCREASE (DECREASE) IN SHAREHOLDERS' EQUITY RESULTING FROM OPERATIONS PER SHARE:
|
|||||||||||||||
|
Basic and Diluted
|
$
|
(0.69
|
)
|
$
|
0.15
|
|
$
|
0.02
|
|
$
|
0.05
|
|
|||
164
|
Three Month Period Ended
|
|||||||||||||||
|
March 31, 2015
|
June 30, 2015
|
September 30, 2015
|
December 31, 2015
|
||||||||||||
|
(In thousands except per share amounts)
|
|||||||||||||||
|
INVESTMENT INCOME
|
|||||||||||||||
|
Interest income
|
$
|
26,513
|
|
$
|
25,739
|
|
$
|
26,440
|
|
$
|
23,091
|
|
|||
|
Other income
|
293
|
|
1,023
|
|
565
|
|
932
|
|
|||||||
|
Total investment income
|
26,806
|
|
26,762
|
|
27,005
|
|
24,023
|
|
|||||||
|
EXPENSES
|
|||||||||||||||
|
Base management fee
|
2,952
|
|
2,920
|
|
2,849
|
|
2,772
|
|
|||||||
|
Interest expense
|
2,986
|
|
2,867
|
|
3,073
|
|
3,186
|
|
|||||||
|
Other investment related expenses
|
1,202
|
|
1,163
|
|
1,473
|
|
1,774
|
|
|||||||
|
Other operating expenses
|
2,199
|
|
2,082
|
|
2,087
|
|
2,835
|
|
|||||||
|
Total expenses
|
9,339
|
|
9,032
|
|
9,482
|
|
10,567
|
|
|||||||
|
NET INVESTMENT INCOME
|
17,467
|
|
17,730
|
|
17,523
|
|
13,456
|
|
|||||||
|
NET REALIZED AND CHANGE IN NET UNREALIZED GAIN (LOSS) ON INVESTMENTS, FINANCIAL DERIVATIVES, AND FOREIGN CURRENCY TRANSACTIONS/TRANSLATION
|
|||||||||||||||
|
Net realized gain (loss) on investments, financial derivatives, and foreign currency transactions
|
10,429
|
|
761
|
|
8,280
|
|
1,483
|
|
|||||||
|
Change in net unrealized gain (loss) on investments, financial derivatives, and foreign currency translation
|
(8,479
|
)
|
(5,268
|
)
|
(21,876
|
)
|
(13,077
|
)
|
|||||||
|
NET REALIZED AND UNREALIZED GAIN (LOSS) ON INVESTMENTS, FINANCIAL DERIVATIVES, AND FOREIGN CURRENCY
|
1,950
|
|
(4,507
|
)
|
(13,596
|
)
|
(11,594
|
)
|
|||||||
|
NET INCREASE IN EQUITY RESULTING FROM OPERATIONS
|
19,417
|
|
13,223
|
|
3,927
|
|
1,862
|
|
|||||||
|
LESS: NET INCREASE IN EQUITY RESULTING FROM OPERATIONS ATTRIBUTABLE TO NON-CONTROLLING INTERESTS
|
156
|
|
71
|
|
31
|
|
82
|
|
|||||||
|
NET INCREASE IN SHAREHOLDERS' EQUITY RESULTING FROM OPERATIONS
|
$
|
19,261
|
|
$
|
13,152
|
|
$
|
3,896
|
|
$
|
1,780
|
|
|||
|
NET INCREASE IN SHAREHOLDERS' EQUITY RESULTING FROM OPERATIONS PER SHARE:
|
|||||||||||||||
|
Basic and Diluted
|
$
|
0.57
|
|
$
|
0.39
|
|
$
|
0.12
|
|
$
|
0.05
|
|
|||
18. Subsequent Events
On February 8, 2016, the Company's Board of Directors approved a dividend for the fourth quarter of 2016 in the amount of
$0.45
per share payable on March 15, 2017 to shareholders of record as of March 1, 2017.
165
None.
Disclosure Controls and Procedures
We maintain disclosure controls and procedures that are designed to ensure that information required to be disclosed in the reports that we file or submit under the Securities Exchange Act of 1934, as amended, is recorded, processed, summarized and reported within the time periods specified in the rules and forms of the SEC, and that such information is accumulated and communicated to our management as appropriate to allow timely decisions regarding required disclosures. An evaluation was performed under the supervision and with the participation of our management, including our Chief Executive Officer and Chief Financial Officer, of the effectiveness of our disclosure controls and procedures (as defined in Rules 13a-15(e) and 15d-15(e) under the Securities Exchange Act of 1934, as amended) as of
December 31, 2016
. Based upon that evaluation, our Chief Executive Officer and Chief Financial Officer concluded that our disclosure controls and procedures were effective as of
December 31, 2016
.
Internal Control Over Financial Reporting
There have been no changes in our internal control over financial reporting that occurred during the three month period ended
December 31, 2016
that have materially affected, or are reasonably likely to materially affect, our internal control over financial reporting.
Management's Report on Internal Control over Financial Reporting
Management is responsible for establishing and maintaining adequate internal control over financial reporting (as defined in 13a-15(f) and 15d-15(f) of the Exchange Act). Our internal control over financial reporting is designed to provide reasonable assurance regarding the reliability of financial reporting and the preparation of financial statements for external purposes in accordance with U.S. GAAP. Our internal control over financial reporting includes policies and procedures that (1) pertain to the maintenance of records that, in reasonable detail, accurately and fairly reflect the transactions and dispositions of our assets; (2) provide reasonable assurance that transactions are recorded as necessary to permit preparation of financial statements in accordance with U.S. GAAP, and that receipts and expenditures are being made only in accordance with authorizations of our management and directors; and (3) provide reasonable assurance regarding prevention or timely detection of unauthorized acquisition, use, or disposition of assets that could have a material effect on our financial statements.
Because of its inherent limitations, internal control over financial reporting may not prevent or detect misstatements. Also, projections of any evaluation of effectiveness to future periods are subject to the risk that controls may become inadequate because of changes in conditions, or that the degree of compliance with the policies or procedures may deteriorate.
Under the supervision and with the participation of our management, including our Chief Executive Officer and our Chief Financial Officer, we evaluated the effectiveness of our internal control over financial reporting using the criteria set forth in the 2013 Internal Control-Integrated Framework issued by the Committee of Sponsoring Organizations of the Treadway Commission (COSO). Based on our assessment and those criteria, our management concluded that our internal control over financial reporting was effective as of December 31, 2016.
The Company's independent registered public accounting firm, PricewaterhouseCoopers LLP, has issued an attestation report on the Company's internal control over financial reporting. This report appears on page 91 of this Annual Report on Form 10-K.
Not applicable.
The information required by Item 10 is incorporated by reference to information to be included in our definitive Proxy Statement for our 2017 annual shareholders' meeting.
Our Board of Directors has established a Code of Business Conduct and Ethics that applies to our officers and directors and to our Manager's and certain of its affiliates' officers, directors and employees when such individuals are acting for us or on our behalf which is available on our website at
www.ellingtonfinancial.com
. Any waiver of our Code of Business Conduct and
166
Ethics of our executive officers or directors may be made only by our Board or one of its committees.
We intend to satisfy the disclosure requirement under Item 5.05 of Form 8-K relating to amendments to or waivers from any provision of our Code of Business Conduct and Ethics applicable to our principal executive officer, principal financial officer, principal accounting officer or controller or persons performing similar functions and that relates to any element of the code of ethics definition enumerated in Item 406(b) of Regulation S-K by posting such information on our website at
www.ellingtonfinancial.com
under the, "For Our Shareholders—Corporate Governance" section of the website.
The information required by Item 11 is incorporated by reference to information to be included in our definitive Proxy Statement for our 2017 annual shareholders' meeting.
The information required by Item 12 is incorporated by reference to information to be included in our definitive Proxy Statement for our 2017 annual shareholders' meeting.
The information required by Item 13 is incorporated by reference to information to be included in our definitive Proxy Statement for our 2017 annual shareholders' meeting.
The information required by Item 14 is incorporated by reference to information to be included in our definitive Proxy Statement for our 2017 annual shareholders' meeting.
(a) Documents filed as part of this report:
1. Financial Statements.
See Index to consolidated financial statements, included in Part II, Item 8 of this Annual Report on Form 10-K.
2. Schedules to Financial Statements:
All financial statement schedules not included have been omitted because they are either inapplicable or the information required is provided in our Financial Statements and Notes thereto, included in Part II, Item 8, of this Annual Report on Form 10-K.
167
|
Exhibit
|
|
Description
|
|
3.1
|
|
Second Amended and Restated Operating Agreement of Ellington Financial LLC (incorporated by reference to the registration statement on Form S-11 (No. 333-160562), filed on July 14, 2009, as amended).
|
|
3.2
|
|
First Amendment to Second Amended and Restated Operating Agreement of Ellington Financial LLC (incorporated by reference to the quarterly report on Form 10-Q for the quarterly period ended June 30, 2011).
|
|
4.1
|
|
Form of Common Share Certificate of Ellington Financial LLC (incorporated by reference to the registration statement on Form S-11 (No. 333-160562), filed on July 14, 2009, as amended).
|
|
10.1
|
Sixth Amended and Restated Management Agreement, by and between the Company, Ellington Financial Operating Partnership LLC and Ellington Financial Management LLC, dated as of November 3, 2015 (incorporated by reference to the Quarterly Report on Form 10-Q for the quarter ended September 30, 2015).
|
|
|
10.2
|
Operating Agreement of Ellington Financial Operating Partnership LLC, by and between the Company, Ellington Financial Operating Partnership LLC and EMG Holdings, L.P., dated as of January 1, 2013 (incorporated by reference to the Annual Report on Form 10-K for the fiscal year ended December 31, 2012)
|
|
|
10.3†
|
2007 Incentive Plan for Individuals (incorporated by reference to the registration statement on Form S-11 (No. 333-160562), filed July 14, 2009, as amended)
|
|
|
10.4†
|
2007 Incentive Plan for Entities (incorporated by reference to the registration statement on Form S-11 (No. 333-160562), filed July 14, 2009, as amended)
|
|
|
10.5†
|
Form of LTIP Unit Award Agreement for Directors (incorporated by reference to the Annual Report on Form 10-K for the fiscal year ended December 31, 2011)
|
|
|
10.6†
|
Form of LTIP Unit Award Agreement for Individuals (incorporated by reference to the Annual Report on Form 10-K for the fiscal year ended December 31, 2011)
|
|
|
10.7
|
Form of Indemnity Agreement (incorporated by reference to the registration statement on Form S-11 (No. 333-160562), filed on July 14, 2009, as amended)
|
|
|
12.1
|
Statement re: Computation of Ratio of Earnings to Fixed Charges and of Earnings to Combined Fixed Charges and Preferred Stock Dividends
|
|
|
21.1
|
List of Subsidiaries
|
|
|
23.1
|
Consent of the Independent Registered Public Accounting Firm
|
|
|
24.1
|
Power of Attorney (included on Signature Page)
|
|
|
31.1
|
|
Certification of Chief Executive Officer pursuant to Section 302 of the Sarbanes – Oxley Act of 2002
|
|
31.2
|
|
Certification of Chief Financial Officer pursuant to Section 302 of the Sarbanes – Oxley Act of 2002
|
|
32.1*
|
|
Certification of Chief Executive Officer pursuant to 18 U.S.C. Section 1350, as adopted pursuant to Section 906 of the Sarbanes – Oxley Act of 2002
|
|
32.2*
|
|
Certification of Chief Financial Officer pursuant to 18 U.S.C. Section 1350, as adopted pursuant to Section 906 of the Sarbanes – Oxley Act of 2002
|
|
101
|
|
The following financial information from Ellington Financial LLC's Annual Report on Form 10-K for the year ended December 31, 2016, formatted in XBRL (Extensible Business Reporting Language): (i) Consolidated Statement of Assets, Liabilities, and Equity, (ii) Consolidated Statement of Operations, (iii) Consolidated Statements of Changes in Equity, (iv) Consolidated Statements of Cash Flows and (v) Notes to Consolidated Financial Statements.
|
|
*
|
Furnished herewith. These certifications are not deemed "filed" for purposes of Section 18 of the Securities Exchange Act of 1934, as amended.
|
|
†
|
Compensatory plan or arrangement.
|
None.
168
SIGNATURES
Pursuant to the requirements of Section 13 or 15(d) of the Securities Exchange Act of 1934, the registrant has duly caused this report to be signed on its behalf by the undersigned, thereunto duly authorized.
For purposes of CFTC Rule 4.22(h), to the best of the knowledge and belief of the undersigned, the information contained in the CFTC
Annual Report set forth herein is accurate and complete.
|
|
ELLINGTON FINANCIAL LLC.
|
|||
|
Date:
|
March 16, 2017
|
|
By:
|
/s/ L
AURENCE
P
ENN
|
|
|
Laurence Penn
Chief Executive Officer
(Principal Executive Officer)
|
|||
POWER OF ATTORNEY
KNOW ALL MEN BY THESE PRESENTS, that we, the undersigned officers and directors of Ellington Financial LLC, hereby severally constitute Laurence Penn, Daniel Margolis, Jason Frank and Lisa Mumford, and each of them singly, our true and lawful attorneys with full power to them, and each of them singly, to sign for us and in our names in the capacities indicated below, the Annual Report on Form 10-K filed herewith and any and all amendments to said Annual Report on Form 10-K, and generally to do all such things in our names and in our capacities as officers and directors to enable Ellington Financial LLC to comply with the provisions of the Securities Exchange Act of 1934, as amended, and all requirements of the SEC, hereby ratifying and confirming our signatures as they may be signed by our said attorneys, or any of them, to said Annual Report on Form 10-K and any and all amendments thereto.
Pursuant to the requirements of the Securities Exchange Act of 1934, this report has been signed below by the following persons on behalf of the registrant and in the capacities and dates indicated.
|
Signature
|
Title
|
Date
|
||
|
/s/ L
AURENCE
P
ENN
|
Chief Executive Officer, President and Director
(Principal Executive Officer)
|
March 16, 2017
|
||
|
L
AURENCE
P
ENN
|
||||
|
/s/ L
ISA
M
UMFORD
|
Chief Financial Officer
(Principal Financial and Accounting Officer)
|
March 16, 2017
|
||
|
LISA MUMFORD
|
||||
|
/s/ M
ICHAEL
W.
V
RANOS
|
Director
|
March 16, 2017
|
||
|
M
ICHAEL
W. V
RANOS
|
||||
|
/s/ T
HOMAS
F. R
OBARDS
|
Chairman of the Board
|
March 16, 2017
|
||
|
THOMAS F. ROBARDS
|
||||
|
/s/ R
ONALD
I. S
IMON
P
H.
D
|
Director
|
March 16, 2017
|
||
|
RONALD I. SIMON P
H
.D
|
||||
|
/s/ E
DWARD
R
ESENDEZ
|
Director
|
March 16, 2017
|
||
|
E
DWARD
R
ESENDEZ
|
||||
169
EXHIBIT INDEX
|
Exhibit
|
|
Description
|
|
3.1
|
|
Second Amended and Restated Operating Agreement of Ellington Financial LLC (incorporated by reference to the registration statement on Form S-11 (No. 333-160562), filed on July 14, 2009, as amended).
|
|
3.2
|
|
First Amendment to Second Amended and Restated Operating Agreement of Ellington Financial LLC (incorporated by reference to the quarterly report on Form 10-Q for the quarterly period ended June 30, 2011).
|
|
4.1
|
|
Form of Common Share Certificate of Ellington Financial LLC (incorporated by reference to the registration statement on Form S-11 (No. 333-160562), filed on July 14, 2009, as amended).
|
|
10.1
|
Sixth Amended and Restated Management Agreement, by and between the Company, Ellington Financial Operating Partnership LLC and Ellington Financial Management LLC, dated as of November 3, 2015 (incorporated by reference to the Quarterly Report on Form 10-Q for the quarter ended September 30, 2015).
|
|
|
10.2
|
Operating Agreement of Ellington Financial Operating Partnership LLC, by and between the Company, Ellington Financial Operating Partnership LLC and EMG Holdings, L.P., dated as of January 1, 2013 (incorporated by reference to the Annual Report on Form 10-K for the fiscal year ended December 31, 2012)
|
|
|
10.3†
|
2007 Incentive Plan for Individuals (incorporated by reference to the registration statement on Form S-11 (No. 333-160562), filed July 14, 2009, as amended)
|
|
|
10.4†
|
2007 Incentive Plan for Entities (incorporated by reference to the registration statement on Form S-11 (No. 333-160562), filed July 14, 2009, as amended)
|
|
|
10.5†
|
Form of LTIP Unit Award Agreement for Directors (incorporated by reference to the Annual Report on Form 10-K for the fiscal year ended December 31, 2011)
|
|
|
10.6†
|
Form of LTIP Unit Award Agreement for Individuals (incorporated by reference to the Annual Report on Form 10-K for the fiscal year ended December 31, 2011)
|
|
|
10.7
|
Form of Indemnity Agreement (incorporated by reference to the registration statement on Form S-11 (No. 333-160562), filed on July 14, 2009, as amended)
|
|
|
12.1
|
Statement re: Computation of Ratio of Earnings to Fixed Charges and of Earnings to Combined Fixed Charges and Preferred Stock Dividends
|
|
|
21.1
|
List of Subsidiaries
|
|
|
23.1
|
Consent of the Independent Registered Public Accounting Firm
|
|
|
24.1
|
Power of Attorney (included on Signature Page)
|
|
|
31.1
|
|
Certification of Chief Executive Officer pursuant to Section 302 of the Sarbanes – Oxley Act of 2002
|
|
31.2
|
|
Certification of Chief Financial Officer pursuant to Section 302 of the Sarbanes – Oxley Act of 2002
|
|
32.1*
|
|
Certification of Chief Executive Officer pursuant to 18 U.S.C. Section 1350, as adopted pursuant to Section 906 of the Sarbanes – Oxley Act of 2002
|
|
32.2*
|
|
Certification of Chief Financial Officer pursuant to 18 U.S.C. Section 1350, as adopted pursuant to Section 906 of the Sarbanes – Oxley Act of 2002
|
|
101
|
|
The following financial information from Ellington Financial LLC's Annual Report on Form 10-K for the year ended December 31, 2016, formatted in XBRL (Extensible Business Reporting Language): (i) Consolidated Statement of Assets, Liabilities, and Equity, (ii) Consolidated Statement of Operations, (iii) Consolidated Statements of Changes in Equity, (iv) Consolidated Statements of Cash Flows and (v) Notes to Consolidated Financial Statements.
|
|
*
|
Furnished herewith. These certifications are not deemed "filed" for purposes of Section 18 of the Securities Exchange Act of 1934, as amended.
|
|
†
|
Compensatory plan or arrangement.
|
170
TABLE OF CONTENTS
Part IItem 1. BusinessItem 1A. Risk FactorsItem 1B. Unresolved Staff CommentsItem 2. PropertiesItem 3. Legal ProceedingsItem 4. Mine Safety DisclosuresPart IIItem 5. Market For Registrant's Common Equity, Related Shareholder Matters, and Issuer Purchases Of Equity SecuritiesItem 6. Selected Financial DataItem 7. Management's Discussion and Analysis Of Financial Condition and Results Of OperationsItem 7A. Quantitative and Qualitative Disclosures About Market RiskItem 8. Financial Statements and Supplementary DataItem 9. Changes in and Disagreements with Accountants on Accounting and Financial DisclosuresItem 9A. Controls and ProceduresItem 9B. Other InformationPart IIIItem 10. Directors, Executive Officers and Corporate GovernanceItem 11. Executive CompensationItem 12. Security Ownership Of Certain Beneficial Owners and Management and Related Shareholder MattersItem 13. Certain Relationships and Related Transactions, and Director IndependenceItem 14. Principal Accounting Fees and ServicesPart IVItem 15. Exhibits and Financial Statement SchedulesItem 16. Form 10-k Summary