ELLINGTON FINANCIAL INC.
10-Ks and 10-Qs
|
|
|
|
|
|
|
|
|
|
|
|
|
|
|
|
|
|
|
|
|
|
|
|
|
|
|
|
|
|
|
|
|
|
|
|
|
|
|
|
|
|
|
|
|
|
|
|
|
|
|
|
|
UNITED STATES
SECURITIES AND EXCHANGE COMMISSION
WASHINGTON, D.C. 20549
FORM 10-Q
|
x
|
QUARTERLY REPORT PURSUANT TO SECTION 13 OR 15(d) OF THE SECURITIES EXCHANGE ACT OF 1934
|
For the quarterly period ended
June 30, 2016
OR
|
¨
|
TRANSITION REPORT PURSUANT TO SECTION 13 OR 15(d) OF THE SECURITIES EXCHANGE ACT OF 1934
|
For the transition period from to
Commission file number 001-34569
Ellington Financial LLC
(Exact Name of Registrant as Specified in Its Charter)
|
Delaware
|
|
26-0489289
|
|
(State or Other Jurisdiction of Incorporation or Organization)
|
|
(I.R.S. Employer Identification No.)
|
|
53 Forest Avenue, Old Greenwich, Connecticut 06870
|
||
|
(Address of Principal Executive Office) (Zip Code)
|
||
(203) 698-1200
(Registrant's Telephone Number, Including Area Code)
Indicate by check mark whether the registrant (1) has filed all reports required to be filed by Section 13 or 15(d) of the Securities Exchange Act of 1934 during the preceding 12 months (or for such shorter period that the registrant was required to file such reports), and (2) has been subject to such filing requirements for the past 90 days. Yes
x
No
¨
Indicate by check mark whether the registrant has submitted electronically and posted on its corporate Web site, if any, every Interactive Data File required to be submitted and posted pursuant to Rule 405 of Regulation S-T (§ 232.405 of this chapter) during the preceding 12 months (or for such shorter period that the registrant was required to submit and post such files). Yes
x
No
¨
Indicate by check mark whether the registrant is a large accelerated filer, an accelerated filer, a non-accelerated filer, or a smaller reporting company. See definitions of "large accelerated filer," "accelerated filer" and "smaller reporting company" in Rule 12b-2 of the Exchange Act.
|
Large Accelerated Filer
|
¨
|
Accelerated Filer
|
x
|
|
Non-Accelerated Filer
(Do not check if a smaller reporting company)
|
¨
|
Smaller Reporting Company
|
¨
|
Indicate by check mark whether the registrant is a shell company (as defined in Rule 12b-2 of the Exchange Act). Yes
¨
No
x
Indicate the number of shares outstanding of each of the issuer's classes of common stock, as of the latest practicable date.
|
Class
|
Outstanding at July 29, 2016
|
|
|
Common Shares Representing Limited Liability Company Interests, no par value
|
32,647,733
|
|
ELLINGTON FINANCIAL LLC
INDEX
|
Part I. Financial Information
|
||
|
Part II. Other Information
|
||
ELLINGTON FINANCIAL LLC
(UNAUDITED)
|
June 30,
2016 |
December 31,
2015 |
||||||
|
(In thousands except share amounts)
|
Expressed in U.S. Dollars
|
||||||
|
ASSETS
|
|||||||
|
Cash and cash equivalents
|
$
|
140,358
|
|
$
|
183,909
|
|
|
|
Restricted cash
|
3,905
|
|
4,857
|
|
|||
|
Investments, financial derivatives, and repurchase agreements:
|
|||||||
|
Investments, at fair value (Cost – $1,590,345 and $1,672,400)
|
1,582,165
|
|
1,661,118
|
|
|||
|
Financial derivatives–assets, at fair value (Net cost – $149,985 and $163,943)
|
152,628
|
|
162,905
|
|
|||
|
Repurchase agreements, at fair value (Cost – $116,985 and $105,329)
|
116,003
|
|
105,700
|
|
|||
|
Total investments, financial derivatives, and repurchase agreements
|
1,850,796
|
|
1,929,723
|
|
|||
|
Due from brokers
|
199,125
|
|
141,605
|
|
|||
|
Receivable for securities sold and financial derivatives
|
536,936
|
|
705,748
|
|
|||
|
Interest and principal receivable
|
19,085
|
|
20,444
|
|
|||
|
Other assets
|
2,886
|
|
5,269
|
|
|||
|
Total Assets
|
$
|
2,753,091
|
|
$
|
2,991,555
|
|
|
|
LIABILITIES
|
|||||||
|
Investments and financial derivatives:
|
|||||||
|
Investments sold short, at fair value (Proceeds – $613,756 and $731,048)
|
$
|
616,337
|
|
$
|
728,747
|
|
|
|
Financial derivatives–liabilities, at fair value (Net proceeds – $43,032 and $56,200)
|
74,098
|
|
60,472
|
|
|||
|
Total investments and financial derivatives
|
690,435
|
|
789,219
|
|
|||
|
Reverse repurchase agreements
|
1,070,105
|
|
1,174,189
|
|
|||
|
Due to brokers
|
94,715
|
|
114,797
|
|
|||
|
Payable for securities purchased and financial derivatives
|
197,164
|
|
165,365
|
|
|||
|
Securitized debt (Proceeds – $13,034 and $0)
|
13,034
|
|
—
|
|
|||
|
Accounts payable and accrued expenses
|
3,055
|
|
3,626
|
|
|||
|
Base management fee payable
|
2,553
|
|
2,773
|
|
|||
|
Interest and dividends payable
|
2,523
|
|
1,806
|
|
|||
|
Other liabilities
|
324
|
|
828
|
|
|||
|
Total Liabilities
|
2,073,908
|
|
2,252,603
|
|
|||
|
EQUITY
|
679,183
|
|
738,952
|
|
|||
|
TOTAL LIABILITIES AND EQUITY
|
$
|
2,753,091
|
|
$
|
2,991,555
|
|
|
|
Commitments and contingencies (Note 15)
|
|
|
|||||
|
ANALYSIS OF EQUITY:
|
|||||||
|
Common shares, no par value, 100,000,000 shares authorized;
|
|||||||
|
(32,743,356 and 33,126,012 shares issued and outstanding)
|
$
|
664,109
|
|
$
|
722,360
|
|
|
|
Additional paid-in capital – LTIP units
|
9,886
|
|
9,689
|
|
|||
|
Total Shareholders' Equity
|
673,995
|
|
732,049
|
|
|||
|
Non-controlling interests
|
5,188
|
|
6,903
|
|
|||
|
Total Equity
|
$
|
679,183
|
|
$
|
738,952
|
|
|
|
PER SHARE INFORMATION:
|
|||||||
|
Common shares
|
$
|
20.58
|
|
$
|
22.10
|
|
|
3
ELLINGTON FINANCIAL LLC
CONSOLIDATED CONDENSED SCHEDULE OF INVESTMENTS
AT JUNE 30, 2016
(UNAUDITED)
|
Current Principal
|
Description
|
Rate
|
Maturity
|
Fair Value
|
||||||||
|
(In thousands)
|
|
|
|
Expressed in U.S.
Dollars
|
||||||||
|
Long Investments (232.95%) (a) (b) (y)
|
||||||||||||
|
Mortgage-Backed Securities (182.22%)
|
||||||||||||
|
Agency Securities (148.90%) (c)
|
||||||||||||
|
Fixed Rate Agency Securities (144.08%)
|
||||||||||||
|
Principal and Interest - Fixed Rate Agency Securities (119.52%)
|
||||||||||||
|
North America
|
||||||||||||
|
Mortgage-related—Residential
|
||||||||||||
|
$
|
140,941
|
|
Federal National Mortgage Association Pools (30 Year)
|
4.00%
|
8/42 - 4/46
|
$
|
152,702
|
|
||||
|
122,292
|
|
Federal Home Loan Mortgage Corporation Pools (30 Year)
|
4.00%
|
8/43 - 5/46
|
132,469
|
|
||||||
|
88,182
|
|
Federal National Mortgage Association Pools (30 Year)
|
4.50%
|
10/41 - 3/46
|
97,387
|
|
||||||
|
63,182
|
|
Federal National Mortgage Association Pools (30 Year)
|
3.50%
|
3/43 - 5/46
|
67,319
|
|
||||||
|
54,356
|
|
Federal National Mortgage Association Pools (15 Year)
|
3.50%
|
3/28 - 4/31
|
58,139
|
|
||||||
|
49,365
|
|
Federal National Mortgage Association Pools (30 Year)
|
5.00%
|
10/35 - 12/44
|
55,213
|
|
||||||
|
38,545
|
|
Federal Home Loan Mortgage Corporation Pools (30 Year)
|
4.50%
|
9/43 - 3/46
|
42,508
|
|
||||||
|
26,408
|
|
Federal Home Loan Mortgage Corporation Pools (30 Year)
|
3.50%
|
1/42 - 10/45
|
28,201
|
|
||||||
|
12,367
|
|
Federal National Mortgage Association Pools (15 Year)
|
3.00%
|
4/30 - 10/30
|
13,035
|
|
||||||
|
11,317
|
|
Federal National Mortgage Association Pools (15 Year)
|
4.00%
|
6/26 - 5/31
|
12,225
|
|
||||||
|
10,023
|
|
Federal Home Loan Mortgage Corporation Pools (15 Year)
|
3.50%
|
9/28 - 9/30
|
10,700
|
|
||||||
|
9,113
|
|
Government National Mortgage Association Pools (30 Year)
|
4.50%
|
8/45 - 9/45
|
10,023
|
|
||||||
|
9,331
|
|
Federal Home Loan Mortgage Corporation Pools (Other)
|
3.50%
|
2/30 - 3/46
|
9,882
|
|
||||||
|
8,293
|
|
Government National Mortgage Association Pools (Other)
|
4.56%
|
1/65
|
9,411
|
|
||||||
|
7,299
|
|
Federal National Mortgage Association Pools (Other)
|
5.00%
|
9/43 - 1/44
|
8,204
|
|
||||||
|
6,654
|
|
Government National Mortgage Association Pools (Other)
|
4.68%
|
11/63 - 9/64
|
7,518
|
|
||||||
|
6,181
|
|
Government National Mortgage Association Pools (Other)
|
4.59%
|
11/64
|
7,022
|
|
||||||
|
6,090
|
|
Government National Mortgage Association Pools (Other)
|
4.61%
|
6/64 - 11/64
|
6,904
|
|
||||||
|
5,667
|
|
Government National Mortgage Association Pools (30 Year)
|
4.00%
|
6/45 - 3/46
|
6,144
|
|
||||||
|
5,536
|
|
Government National Mortgage Association Pools (30 Year)
|
3.50%
|
2/46
|
5,913
|
|
||||||
|
5,500
|
|
Federal National Mortgage Association Pools (30 Year)
|
3.00%
|
1/42 - 6/45
|
5,722
|
|
||||||
|
4,408
|
|
Government National Mortgage Association Pools (Other)
|
4.62%
|
12/63
|
4,956
|
|
||||||
|
4,130
|
|
Federal National Mortgage Association Pools (30 Year)
|
5.50%
|
10/39
|
4,642
|
|
||||||
|
3,927
|
|
Federal National Mortgage Association Pools (15 Year)
|
4.50%
|
4/26
|
4,227
|
|
||||||
|
3,786
|
|
Government National Mortgage Association Pools (Other)
|
4.50%
|
7/61
|
4,145
|
|
||||||
|
3,340
|
|
Government National Mortgage Association Pools (Other)
|
4.63%
|
10/64
|
3,804
|
|
||||||
|
3,117
|
|
Government National Mortgage Association Pools (Other)
|
4.49%
|
11/64
|
3,511
|
|
||||||
|
3,205
|
|
Federal Home Loan Mortgage Corporation Pools (15 Year)
|
3.00%
|
4/30
|
3,374
|
|
||||||
|
3,141
|
|
Government National Mortgage Association Pools (Other)
|
4.75%
|
1/61
|
3,238
|
|
||||||
|
3,125
|
|
Government National Mortgage Association Pools (Other)
|
4.80%
|
2/61
|
3,228
|
|
||||||
|
2,752
|
|
Federal Home Loan Mortgage Corporation Pools (Other)
|
4.50%
|
5/44
|
3,040
|
|
||||||
|
2,828
|
|
Government National Mortgage Association Pools (Other)
|
5.49%
|
4/60
|
3,009
|
|
||||||
|
2,499
|
|
Government National Mortgage Association Pools (Other)
|
4.64%
|
3/65
|
2,851
|
|
||||||
|
2,639
|
|
Federal Home Loan Mortgage Corporation Pools (Other)
|
3.00%
|
6/28
|
2,774
|
|
||||||
|
2,362
|
|
Federal National Mortgage Association Pools (30 Year)
|
6.00%
|
9/39 - 2/40
|
2,710
|
|
||||||
See Notes to Consolidated Financial Statements
4
ELLINGTON FINANCIAL LLC
CONSOLIDATED CONDENSED SCHEDULE OF INVESTMENTS
AT JUNE 30, 2016 (CONTINUED)
(UNAUDITED)
|
Current Principal/Notional Value
|
Description
|
Rate
|
Maturity
|
Fair Value
|
||||||||
|
(In thousands)
|
|
|
|
Expressed in U.S.
Dollars
|
||||||||
|
(continued)
|
||||||||||||
|
$
|
2,405
|
|
Federal National Mortgage Association Pools (20 Year)
|
4.00%
|
12/33
|
$
|
2,612
|
|
||||
|
2,105
|
|
Government National Mortgage Association Pools (Other)
|
5.54%
|
2/60
|
2,223
|
|
||||||
|
2,048
|
|
Government National Mortgage Association Pools (Other)
|
5.51%
|
2/60
|
2,193
|
|
||||||
|
1,932
|
|
Federal Home Loan Mortgage Corporation Pools (15 Year)
|
4.00%
|
2/29
|
2,085
|
|
||||||
|
1,765
|
|
Federal Home Loan Mortgage Corporation Pools (30 Year)
|
3.00%
|
7/43 - 10/45
|
1,834
|
|
||||||
|
1,494
|
|
Federal Home Loan Mortgage Corporation Pools (30 Year)
|
6.00%
|
4/39 - 5/40
|
1,708
|
|
||||||
|
1,264
|
|
Federal Home Loan Mortgage Corporation Pools (20 Year)
|
4.50%
|
12/33
|
1,395
|
|
||||||
|
694
|
|
Federal Home Loan Mortgage Corporation Pools (30 Year)
|
5.00%
|
7/44
|
769
|
|
||||||
|
634
|
|
Federal Home Loan Mortgage Corporation Pools (30 Year)
|
5.50%
|
8/33
|
709
|
|
||||||
|
101
|
|
Federal National Mortgage Association Pools (Other)
|
4.00%
|
6/37
|
106
|
|
||||||
|
811,784
|
|
|||||||||||
|
Interest Only - Fixed Rate Agency Securities (0.76%)
|
||||||||||||
|
North America
|
||||||||||||
|
Mortgage-related—Residential
|
||||||||||||
|
7,427
|
|
Government National Mortgage Association
|
5.50%
|
11/43
|
1,199
|
|
||||||
|
9,235
|
|
Federal National Mortgage Association
|
5.00%
|
1/38 - 5/40
|
899
|
|
||||||
|
5,548
|
|
Federal Home Loan Mortgage Corporation
|
3.50%
|
12/32
|
790
|
|
||||||
|
6,866
|
|
Federal National Mortgage Association
|
4.50%
|
12/20 - 5/43
|
584
|
|
||||||
|
3,929
|
|
Federal Home Loan Mortgage Corporation
|
5.00%
|
3/40
|
313
|
|
||||||
|
3,559
|
|
Federal National Mortgage Association
|
3.00%
|
9/41
|
289
|
|
||||||
|
1,249
|
|
Government National Mortgage Association
|
6.00%
|
6/38
|
274
|
|
||||||
|
1,694
|
|
Government National Mortgage Association
|
4.75%
|
7/40
|
237
|
|
||||||
|
1,417
|
|
Federal National Mortgage Association
|
5.50%
|
10/40
|
175
|
|
||||||
|
3,011
|
|
Government National Mortgage Association
|
5.00%
|
5/37
|
158
|
|
||||||
|
1,175
|
|
Federal National Mortgage Association
|
4.00%
|
5/39
|
156
|
|
||||||
|
937
|
|
Federal Home Loan Mortgage Corporation
|
5.50%
|
1/39
|
85
|
|
||||||
|
5,159
|
|
|||||||||||
|
TBA - Fixed Rate Agency Securities (23.80%)
|
||||||||||||
|
North America
|
||||||||||||
|
Mortgage-related—Residential
|
||||||||||||
|
60,330
|
|
Government National Mortgage Association (30 Year)
|
4.00%
|
7/16 - 8/16
|
64,754
|
|
||||||
|
47,238
|
|
Federal National Mortgage Association (30 Year)
|
3.00%
|
7/16
|
49,013
|
|
||||||
|
30,000
|
|
Federal Home Loan Mortgage Corporation (30 Year)
|
3.50%
|
7/16
|
31,629
|
|
||||||
|
14,460
|
|
Federal National Mortgage Association (15 Year)
|
3.00%
|
7/16
|
15,160
|
|
||||||
|
990
|
|
Government National Mortgage Association (30 Year)
|
4.50%
|
7/16
|
1,063
|
|
||||||
|
161,619
|
|
|||||||||||
|
Total Fixed Rate Agency Securities (Cost $964,068)
|
978,562
|
|
||||||||||
See Notes to Consolidated Financial Statements
5
ELLINGTON FINANCIAL LLC
CONSOLIDATED CONDENSED SCHEDULE OF INVESTMENTS
AT JUNE 30, 2016 (CONTINUED)
(UNAUDITED)
|
Current Principal/Notional Value
|
Description
|
Rate
|
Maturity
|
Fair Value
|
||||||||
|
(In thousands)
|
|
|
|
Expressed in U.S.
Dollars
|
||||||||
|
Floating Rate Agency Securities (4.82%)
|
||||||||||||
|
Principal and Interest - Floating Rate Agency Securities (2.56%)
|
||||||||||||
|
North America
|
||||||||||||
|
Mortgage-related—Residential
|
||||||||||||
|
$
|
8,646
|
|
Federal National Mortgage Association Pools
|
2.43% - 6.04%
|
11/34 - 5/45
|
$
|
9,112
|
|
||||
|
5,638
|
|
Federal Home Loan Mortgage Corporation Pools
|
2.61% - 5.94%
|
6/37 - 5/44
|
5,968
|
|
||||||
|
2,199
|
|
Government National Mortgage Association Pools
|
2.80%
|
11/64
|
2,345
|
|
||||||
|
17,425
|
|
|||||||||||
|
Interest Only - Floating Rate Agency Securities (2.26%)
|
||||||||||||
|
North America
|
||||||||||||
|
Mortgage-related—Residential
|
||||||||||||
|
193,766
|
|
Government National Mortgage Association
|
0.43% - 6.30%
|
11/42 - 10/63
|
10,634
|
|
||||||
|
16,238
|
|
Federal National Mortgage Association
|
5.50% - 7.10%
|
6/33 - 12/41
|
2,264
|
|
||||||
|
18,185
|
|
Resecuritization of Government National Mortgage Association (d)
|
4.05%
|
8/60
|
1,358
|
|
||||||
|
5,809
|
|
Federal Home Loan Mortgage Corporation
|
5.56% - 6.19%
|
3/36 - 8/39
|
1,091
|
|
||||||
|
15,347
|
|
|||||||||||
|
Total Floating Rate Agency Securities (Cost $31,735)
|
32,772
|
|
||||||||||
|
Total Agency Securities (Cost $995,803)
|
1,011,334
|
|
||||||||||
|
Private Label Securities (33.32%)
|
||||||||||||
|
Principal and Interest - Private Label Securities (32.20%)
|
||||||||||||
|
North America (25.28%)
|
||||||||||||
|
Mortgage-related—Residential
|
||||||||||||
|
291,703
|
|
Various
|
0.00% - 9.35%
|
5/19 - 9/46
|
147,500
|
|
||||||
|
Mortgage-related—Commercial
|
||||||||||||
|
95,731
|
|
Various
|
3.00% - 4.56%
|
7/45 - 3/49
|
24,169
|
|
||||||
|
Total North America (Cost $168,411)
|
171,669
|
|
||||||||||
|
Europe (6.92%)
|
||||||||||||
|
Mortgage-related—Residential
|
||||||||||||
|
60,455
|
|
Various
|
0.00% - 5.34%
|
6/25 - 3/50
|
39,092
|
|
||||||
|
Mortgage-related—Commercial
|
||||||||||||
|
7,999
|
|
Various
|
0.00% - 11.00%
|
6/17 - 6/19
|
7,933
|
|
||||||
|
Total Europe (Cost $56,943)
|
47,025
|
|
||||||||||
|
Total Principal and Interest - Private Label Securities (Cost $225,354)
|
218,694
|
|
||||||||||
|
Principal Only - Private Label Securities (0.54%)
|
||||||||||||
|
North America
|
||||||||||||
|
Mortgage-related—Residential
|
||||||||||||
|
5,510
|
|
Various
|
—%
|
8/30
|
3,649
|
|
||||||
|
Total Principal Only - Private Label Securities (Cost $2,885)
|
3,649
|
|
||||||||||
See Notes to Consolidated Financial Statements
6
ELLINGTON FINANCIAL LLC
CONSOLIDATED CONDENSED SCHEDULE OF INVESTMENTS
AT JUNE 30, 2016 (CONTINUED)
(UNAUDITED)
|
Current Principal/Notional Value
|
Description
|
Rate
|
Maturity
|
Fair Value
|
||||||||
|
(In thousands)
|
|
|
|
Expressed in U.S.
Dollars
|
||||||||
|
Interest Only - Private Label Securities (0.58%)
|
||||||||||||
|
North America
|
||||||||||||
|
Mortgage-related—Residential
|
||||||||||||
|
$
|
38,118
|
|
Various
|
0.50% - 2.00%
|
6/44 - 9/47
|
$
|
1,101
|
|
||||
|
Mortgage-related—Commercial
|
||||||||||||
|
49,918
|
|
Various
|
1.25% - 1.60%
|
10/47 - 3/49
|
2,840
|
|
||||||
|
Total Interest Only - Private Label Securities (Cost $3,382)
|
3,941
|
|
||||||||||
|
Other Private Label Securities (0.00%)
|
||||||||||||
|
North America
|
||||||||||||
|
Mortgage-related—Residential
|
||||||||||||
|
95,607
|
|
Various
|
—%
|
6/37
|
—
|
|
||||||
|
Mortgage-related—Commercial
|
||||||||||||
|
—
|
|
Various
|
—%
|
7/45 - 3/49
|
—
|
|
||||||
|
Total Other Private Label Securities (Cost $259)
|
—
|
|
||||||||||
|
Total Private Label Securities (Cost $231,880)
|
226,284
|
|
||||||||||
|
Total Mortgage-Backed Securities (Cost $1,227,683)
|
1,237,618
|
|
||||||||||
|
Collateralized Loan Obligations (4.87%)
|
||||||||||||
|
North America (2.25%)
|
||||||||||||
|
63,133
|
|
Various
|
0.00% - 9.15%
|
5/17 - 1/24
|
15,312
|
|
||||||
|
Total North America (Cost $20,626)
|
15,312
|
|
||||||||||
|
Europe (2.62%)
|
||||||||||||
|
26,886
|
|
Various
|
0.00% - 9.37%
|
1/22 - 3/25
|
17,797
|
|
||||||
|
Total Europe (Cost $18,668)
|
17,797
|
|
||||||||||
|
Total Collateralized Loan Obligations (Cost $39,294)
|
33,109
|
|
||||||||||
|
Consumer Loans and Asset-backed Securities backed by Consumer Loans (22.73%) (e)
|
||||||||||||
|
North America (22.37%)
|
||||||||||||
|
Consumer (f)
|
||||||||||||
|
150,751
|
|
Various
|
5.44% - 59.39%
|
7/16 - 6/21
|
151,937
|
|
||||||
|
Total North America (Cost $153,581)
|
151,937
|
|
||||||||||
|
Europe (0.36%)
|
||||||||||||
|
Consumer
|
||||||||||||
|
1,141
|
|
Various
|
—%
|
8/24
|
2,458
|
|
||||||
|
Total Europe (Cost $1,611)
|
2,458
|
|
||||||||||
|
Total Consumer Loans and Asset-backed Securities backed by Consumer Loans (Cost $155,192)
|
154,395
|
|
||||||||||
See Notes to Consolidated Financial Statements
7
ELLINGTON FINANCIAL LLC
CONSOLIDATED CONDENSED SCHEDULE OF INVESTMENTS
AT JUNE 30, 2016 (CONTINUED)
(UNAUDITED)
|
Current Principal/Number of Properties
|
Description
|
Rate
|
Maturity
|
Fair Value
|
||||||||
|
(In thousands)
|
|
|
|
Expressed in U.S.
Dollars
|
||||||||
|
Corporate Debt (5.45%)
|
||||||||||||
|
North America (4.21%)
|
||||||||||||
|
Basic Materials
|
||||||||||||
|
$
|
5,720
|
|
Various
|
11.75%
|
1/19
|
$
|
977
|
|
||||
|
Consumer
|
||||||||||||
|
10,695
|
|
Various
|
0.00% - 7.25%
|
6/18 - 11/22
|
8,164
|
|
||||||
|
Energy
|
||||||||||||
|
17,906
|
|
Various
|
0.00% - 10.75%
|
9/18 - 9/21
|
6,741
|
|
||||||
|
Financial
|
||||||||||||
|
54
|
|
Various
|
10.25%
|
8/23
|
51
|
|
||||||
|
Mortgage-related—Residential
|
||||||||||||
|
14,179
|
|
Various
|
0.00% - 15.00%
|
12/17 - 10/19
|
10,343
|
|
||||||
|
Technology
|
||||||||||||
|
2,200
|
|
Various
|
5.13%
|
3/20
|
2,312
|
|
||||||
|
Total North America (Cost $38,635)
|
28,588
|
|
||||||||||
|
Europe (1.24%)
|
||||||||||||
|
Communications
|
||||||||||||
|
7,454
|
|
Various
|
14.00%
|
10/18
|
7,888
|
|
||||||
|
Consumer
|
||||||||||||
|
17,422
|
|
Various
|
—%
|
12/16
|
498
|
|
||||||
|
Total Europe (Cost $8,199)
|
8,386
|
|
||||||||||
|
Total Corporate Debt (Cost $46,834)
|
36,974
|
|
||||||||||
|
Mortgage Loans (14.15%) (e)
|
||||||||||||
|
North America
|
||||||||||||
|
Mortgage-related—Commercial (g)
|
||||||||||||
|
58,082
|
|
Various
|
2.73% - 11.00%
|
8/16 - 7/45
|
49,466
|
|
||||||
|
Mortgage-related—Residential (i)
|
||||||||||||
|
50,228
|
|
Various
|
0.00% - 12.63%
|
4/22 - 2/56
|
46,649
|
|
||||||
|
Total Mortgage Loans (Cost $96,285)
|
96,115
|
|
||||||||||
|
Real Estate Owned (0.61%) (e) (h)
|
||||||||||||
|
North America
|
||||||||||||
|
Real estate-related
|
||||||||||||
|
14
|
|
Single-Family Houses
|
2,321
|
|
||||||||
|
1
|
|
Commercial Property
|
1,841
|
|
||||||||
|
Total Real Estate Owned (Cost $4,225)
|
4,162
|
|
||||||||||
See Notes to Consolidated Financial Statements
8
ELLINGTON FINANCIAL LLC
CONSOLIDATED CONDENSED SCHEDULE OF INVESTMENTS
AT JUNE 30, 2016 (CONTINUED)
(UNAUDITED)
|
Current Principal/Number of Shares
|
Description
|
Rate
|
Maturity
|
Fair Value
|
||||||||
|
(In thousands)
|
|
|
|
Expressed in U.S.
Dollars
|
||||||||
|
Private Corporate Equity Investments (2.86%)
|
||||||||||||
|
North America (2.86%)
|
||||||||||||
|
Consumer
|
||||||||||||
|
$
|
1,663
|
|
Non-Exchange Traded Corporate Equity
|
$
|
6,675
|
|
||||||
|
Diversified
|
||||||||||||
|
200
|
|
Non-Exchange Traded Corporate Equity
|
3,650
|
|
||||||||
|
Mortgage-related—Commercial
|
||||||||||||
|
n/a
|
|
Non-Controlling Interest in Mortgage-Related Private Partnership
|
2,972
|
|
||||||||
|
Mortgage-related—Residential
|
||||||||||||
|
12,545
|
|
Non-Exchange Traded Preferred Equity Investment in Mortgage Originators
|
4,700
|
|
||||||||
|
7,478
|
|
Non-Exchange Traded Equity Investment in Mortgage Originators
|
853
|
|
||||||||
|
Technology
|
||||||||||||
|
99
|
|
Non-Exchange Traded Corporate Equity
|
568
|
|
||||||||
|
Total North America (Cost $20,460)
|
19,418
|
|
||||||||||
|
Europe (0.00%)
|
||||||||||||
|
Consumer
|
||||||||||||
|
139
|
|
Non-Exchange Traded Corporate Equity
|
—
|
|
||||||||
|
Total Europe (Cost $0)
|
—
|
|
||||||||||
|
Total Private Corporate Equity Investments (Cost $20,460)
|
19,418
|
|
||||||||||
|
U.S. Treasury Securities (0.06%)
|
||||||||||||
|
North America
|
||||||||||||
|
Government
|
||||||||||||
|
371
|
|
U.S. Treasury Note
|
1.13% - 1.25%
|
3/21 - 6/21
|
374
|
|
||||||
|
Total U.S. Treasury Securities (Cost $372)
|
374
|
|
||||||||||
|
Total Long Investments (Cost $1,590,345)
|
$
|
1,582,165
|
|
|||||||||
See Notes to Consolidated Financial Statements
9
ELLINGTON FINANCIAL LLC
CONSOLIDATED CONDENSED SCHEDULE OF INVESTMENTS
AT JUNE 30, 2016 (CONTINUED)
(UNAUDITED)
|
Current Principal
|
Description
|
Rate
|
Maturity
|
Fair Value
|
||||||||
|
(In thousands)
|
|
|
|
Expressed in U.S.
Dollars
|
||||||||
|
Repurchase Agreements (17.08%) (a) (b) (j)
|
||||||||||||
|
$
|
19,363
|
|
Bank of America Securities
|
0.45%
|
7/16
|
$
|
19,363
|
|
||||
|
Collateralized by Par Value $19,030
|
||||||||||||
|
U.S. Treasury Note, Coupon 1.38%,
|
||||||||||||
|
Maturity Date 5/21
|
||||||||||||
|
15,537
|
|
Deutsche Bank Securities
|
(0.50)%
|
7/16
|
15,537
|
|
||||||
|
Collateralized by Par Value $15,280
|
||||||||||||
|
Sovereign Government Bond, Coupon 0.25%,
|
||||||||||||
|
Maturity Date 4/18
|
||||||||||||
|
13,618
|
|
JP Morgan Securities
|
(0.54)%
|
7/16
|
13,618
|
|
||||||
|
Collateralized by Par Value $13,164
|
||||||||||||
|
Sovereign Government Bond, Coupon 0.25%,
|
||||||||||||
|
Maturity Date 11/20
|
||||||||||||
|
9,292
|
|
JP Morgan Securities
|
(0.63)%
|
7/16
|
9,292
|
|
||||||
|
Collateralized by Par Value $8,697
|
||||||||||||
|
Sovereign Government Bond, Coupon 1.15%,
|
||||||||||||
|
Maturity Date 7/20
|
||||||||||||
|
9,025
|
|
JP Morgan Securities
|
(0.47)%
|
7/16
|
9,025
|
|
||||||
|
Collateralized by Par Value $8,697
|
||||||||||||
|
Sovereign Government Bond, Coupon 0.65%,
|
||||||||||||
|
Maturity Date 11/20
|
||||||||||||
|
7,954
|
|
JP Morgan Securities
|
(0.47)%
|
7/16
|
7,954
|
|
||||||
|
Collateralized by Par Value $7,210
|
||||||||||||
|
Sovereign Government Bond, Coupon 2.75%,
|
||||||||||||
|
Maturity Date 4/19
|
||||||||||||
|
5,075
|
|
Bank of America Securities
|
0.45%
|
7/16
|
5,075
|
|
||||||
|
Collateralized by Par Value $5,000
|
||||||||||||
|
U.S. Treasury Note, Coupon 1.25%,
|
||||||||||||
|
Maturity Date 10/18
|
||||||||||||
|
4,140
|
|
Bank of America Securities
|
0.45%
|
7/16
|
4,140
|
|
||||||
|
Collateralized by Par Value $4,000
|
||||||||||||
|
U.S. Treasury Note, Coupon 1.63%,
|
||||||||||||
|
Maturity Date 6/20
|
||||||||||||
|
4,090
|
|
Bank of America Securities
|
0.45%
|
7/16
|
4,090
|
|
||||||
|
Collateralized by Par Value $4,000
|
||||||||||||
|
U.S. Treasury Note, Coupon 1.50%,
|
||||||||||||
|
Maturity Date 5/20
|
||||||||||||
|
3,684
|
|
Bank of America Securities
|
0.45%
|
7/16
|
3,684
|
|
||||||
|
Collateralized by Par Value $3,621
|
||||||||||||
|
U.S. Treasury Note, Coupon 1.38%,
|
||||||||||||
|
Maturity Date 4/21
|
||||||||||||
|
3,498
|
|
Bank of America Securities
|
0.45%
|
7/16
|
3,498
|
|
||||||
|
Collateralized by Par Value $3,400
|
||||||||||||
|
U.S. Treasury Note, Coupon 1.63%,
|
||||||||||||
|
Maturity Date 11/20
|
||||||||||||
See Notes to Consolidated Financial Statements
10
ELLINGTON FINANCIAL LLC
CONSOLIDATED CONDENSED SCHEDULE OF INVESTMENTS
AT JUNE 30, 2016 (CONTINUED)
(UNAUDITED)
|
Current Principal
|
Description
|
Rate
|
Maturity
|
Fair Value
|
||||||||
|
(In thousands)
|
|
|
|
Expressed in U.S.
Dollars
|
||||||||
|
(continued)
|
||||||||||||
|
$
|
3,416
|
|
Bank of America Securities
|
0.45%
|
7/16
|
$
|
3,416
|
|
||||
|
Collateralized by Par Value $3,200
|
||||||||||||
|
U.S. Treasury Note, Coupon 2.25%,
|
||||||||||||
|
Maturity Date 11/24
|
||||||||||||
|
2,107
|
|
Bank of America Securities
|
0.45%
|
7/16
|
2,107
|
|
||||||
|
Collateralized by Par Value $2,000
|
||||||||||||
|
U.S. Treasury Note, Coupon 2.00%,
|
||||||||||||
|
Maturity Date 7/22
|
||||||||||||
|
2,037
|
|
Bank of America Securities
|
0.45%
|
7/16
|
2,037
|
|
||||||
|
Collateralized by Par Value $2,000
|
||||||||||||
|
U.S. Treasury Note, Coupon 1.25%,
|
||||||||||||
|
Maturity Date 1/20
|
||||||||||||
|
1,788
|
|
Barclays Capital Inc.
|
0.40%
|
7/16
|
1,788
|
|
||||||
|
Collateralized by Par Value $1,738
|
||||||||||||
|
Sovereign Government Bond, Coupon 4.00%,
|
||||||||||||
|
Maturity Date 9/16
|
||||||||||||
|
1,781
|
|
RBC Capital Markets LLC
|
(2.25)%
|
7/16
|
1,781
|
|
||||||
|
Collateralized by Par Value $2,248
|
||||||||||||
|
Exchange Traded Corporate Debt, Coupon 4.50%,
|
||||||||||||
|
Maturity Date 4/22
|
||||||||||||
|
1,285
|
|
Bank of America Securities
|
0.45%
|
7/16
|
1,285
|
|
||||||
|
Collateralized by Par Value $1,280
|
||||||||||||
|
U.S. Treasury Note, Coupon 1.13%,
|
||||||||||||
|
Maturity Date 6/21
|
||||||||||||
|
1,158
|
|
RBC Capital Markets LLC
|
(0.40)%
|
7/16
|
1,158
|
|
||||||
|
Collateralized by Par Value $1,350
|
||||||||||||
|
Exchange Traded Corporate Debt 3.55%,
|
||||||||||||
|
Maturity Date 3/22
|
||||||||||||
|
1,037
|
|
RBC Capital Markets LLC
|
(2.00)%
|
7/16
|
1,037
|
|
||||||
|
Collateralized by Par Value $1,080
|
||||||||||||
|
Exchange Traded Corporate Debt, Coupon 7.75%,
|
||||||||||||
|
Maturity Date 6/21
|
||||||||||||
|
940
|
|
Barclays Capital Inc.
|
(4.75)%
|
7/16
|
940
|
|
||||||
|
Collateralized by Par Value $1,049
|
||||||||||||
|
Exchange Traded Corporate Debt, Coupon 4.50%,
|
||||||||||||
|
Maturity Date 4/22
|
||||||||||||
|
913
|
|
JP Morgan Securities
|
(5.38)%
|
7/16
|
913
|
|
||||||
|
Collateralized by Par Value $1,049
|
||||||||||||
|
Exchange Traded Corporate Debt, Coupon 4.50%,
|
||||||||||||
|
Maturity Date 4/22
|
||||||||||||
|
904
|
|
RBC Capital Markets LLC
|
0.05%
|
7/16
|
904
|
|
||||||
|
Collateralized by Par Value $820
|
||||||||||||
|
Exchange Traded Corporate Debt, Coupon 3.90%,
|
||||||||||||
|
Maturity Date 5/21
|
||||||||||||
See Notes to Consolidated Financial Statements
11
ELLINGTON FINANCIAL LLC
CONSOLIDATED CONDENSED SCHEDULE OF INVESTMENTS
AT JUNE 30, 2016 (CONTINUED)
(UNAUDITED)
|
Current Principal
|
Description
|
Rate
|
Maturity
|
Fair Value
|
||||||||
|
(In thousands)
|
|
|
|
Expressed in U.S.
Dollars
|
||||||||
|
(continued)
|
||||||||||||
|
$
|
637
|
|
CS First Boston
|
—%
|
7/16
|
$
|
637
|
|
||||
|
Collateralized by Par Value $572
|
||||||||||||
|
Exchange Traded Corporate Debt, Coupon 3.90%,
|
||||||||||||
|
Maturity Date 5/21
|
||||||||||||
|
570
|
|
CS First Boston
|
(3.50)%
|
7/16
|
570
|
|
||||||
|
Collateralized by Par Value $540
|
||||||||||||
|
Exchange Traded Corporate Debt, Coupon 6.25%,
|
||||||||||||
|
Maturity Date 10/22
|
||||||||||||
|
557
|
|
Barclays Capital Inc.
|
(2.50)%
|
7/16
|
557
|
|
||||||
|
Collateralized by Par Value $540
|
||||||||||||
|
Exchange Traded Corporate Debt, Coupon 7.75%,
|
||||||||||||
|
Maturity Date 6/21
|
||||||||||||
|
542
|
|
RBC Capital Markets LLC
|
(3.25)%
|
7/16
|
542
|
|
||||||
|
Collateralized by Par Value $550
|
||||||||||||
|
Exchange Traded Corporate Debt, Coupon 6.25%,
|
||||||||||||
|
Maturity Date 10/22
|
||||||||||||
|
428
|
|
JP Morgan Securities
|
0.65%
|
7/16
|
428
|
|
||||||
|
Collateralized by Par Value $417
|
||||||||||||
|
U.S. Treasury Note, Coupon 1.38%,
|
||||||||||||
|
Maturity Date 3/20
|
||||||||||||
|
363
|
|
Bank of America Securities
|
0.45%
|
7/16
|
363
|
|
||||||
|
Collateralized by Par Value $360
|
||||||||||||
|
U.S. Treasury Note, Coupon 1.13%,
|
||||||||||||
|
Maturity Date 2/21
|
||||||||||||
|
264
|
|
RBC Capital Markets LLC
|
(0.25)%
|
7/16
|
264
|
|
||||||
|
Collateralized by Par Value $285
|
||||||||||||
|
Exchange Traded Corporate Debt, Coupon 5.13%,
|
||||||||||||
|
Maturity Date 6/22
|
||||||||||||
|
Total Repurchase Agreements (Cost $116,985)
|
$
|
116,003
|
|
|||||||||
|
Investments Sold Short (-90.75%) (a) (b)
|
||||||||||||
|
TBA - Fixed Rate Agency Securities Sold Short (-71.87%) (k)
|
||||||||||||
|
North America
|
||||||||||||
|
Mortgage-related—Residential
|
||||||||||||
|
$
|
(69,000
|
)
|
Federal Home Loan Mortgage Corporation (30 year)
|
4.00%
|
8/16
|
$
|
(73,808
|
)
|
||||
|
(51,350
|
)
|
Federal National Mortgage Association (15 year)
|
3.50%
|
7/16 - 8/16
|
(54,379
|
)
|
||||||
|
(47,430
|
)
|
Federal National Mortgage Association (30 year)
|
4.50%
|
7/16 - 8/16
|
(51,763
|
)
|
||||||
|
(43,082
|
)
|
Federal National Mortgage Association (30 year)
|
3.50%
|
7/16
|
(45,450
|
)
|
||||||
|
(37,620
|
)
|
Federal National Mortgage Association (30 year)
|
5.00%
|
8/16
|
(41,776
|
)
|
||||||
|
(36,155
|
)
|
Federal Home Loan Mortgage Corporation (30 year)
|
3.00%
|
7/16
|
(37,471
|
)
|
||||||
|
(33,000
|
)
|
Federal National Mortgage Association (30 year)
|
4.00%
|
8/16
|
(35,355
|
)
|
||||||
|
(25,528
|
)
|
Federal National Mortgage Association (30 year)
|
4.00%
|
7/16
|
(27,372
|
)
|
||||||
|
(20,951
|
)
|
Federal Home Loan Mortgage Corporation (30 year)
|
4.50%
|
8/16
|
(22,843
|
)
|
||||||
|
(19,680
|
)
|
Government National Mortgage Association (30 year)
|
4.50%
|
7/16 - 8/16
|
(21,658
|
)
|
||||||
|
(19,770
|
)
|
Government National Mortgage Association (30 year)
|
3.50%
|
7/16
|
(20,994
|
)
|
||||||
See Notes to Consolidated Financial Statements
12
ELLINGTON FINANCIAL LLC
CONSOLIDATED CONDENSED SCHEDULE OF INVESTMENTS
AT JUNE 30, 2016 (CONTINUED)
(UNAUDITED)
|
Current Principal/Number of Shares
|
Description
|
Rate
|
Maturity
|
Fair Value
|
||||||||
|
(In thousands)
|
Expressed in U.S.
Dollars
|
|||||||||||
|
(continued)
|
||||||||||||
|
$
|
(13,510
|
)
|
Federal Home Loan Mortgage Corporation (15 year)
|
3.00%
|
7/16
|
$
|
(14,175
|
)
|
||||
|
(11,170
|
)
|
Federal National Mortgage Association (15 year)
|
4.00%
|
7/16
|
(11,593
|
)
|
||||||
|
(9,617
|
)
|
Federal Home Loan Mortgage Corporation (30 year)
|
4.00%
|
7/16
|
(10,295
|
)
|
||||||
|
(8,790
|
)
|
Federal Home Loan Mortgage Corporation (15 year)
|
3.50%
|
7/16
|
(9,314
|
)
|
||||||
|
(6,860
|
)
|
Federal National Mortgage Association (30 year)
|
5.50%
|
7/16
|
(7,712
|
)
|
||||||
|
(2,100
|
)
|
Government National Mortgage Association (30 year)
|
3.00%
|
7/16
|
(2,193
|
)
|
||||||
|
Total TBA - Fixed Rate Agency Securities Sold Short (Proceeds -$486,569)
|
(488,151
|
)
|
||||||||||
|
Government Debt Sold Short (-12.86%)
|
||||||||||||
|
North America (-4.54%)
|
||||||||||||
|
Government
|
||||||||||||
|
(30,028
|
)
|
U.S. Treasury Note
|
1.13% - 2.25%
|
10/18 - 11/24
|
(30,856
|
)
|
||||||
|
Total North America (Proceeds -$30,101)
|
(30,856
|
)
|
||||||||||
|
Europe (-8.32%)
|
||||||||||||
|
Government
|
||||||||||||
|
(54,785
|
)
|
European Sovereign Bonds
|
0.25% - 4.00%
|
9/16 - 11/20
|
(56,470
|
)
|
||||||
|
Total Europe (Proceeds -$57,455)
|
(56,470
|
)
|
||||||||||
|
Total Government Debt Sold Short (Proceeds -$87,556)
|
(87,326
|
)
|
||||||||||
|
Common Stock Sold Short (-4.55%)
|
||||||||||||
|
North America
|
||||||||||||
|
Energy
|
||||||||||||
|
(170
|
)
|
Exchange Traded Equity
|
(2,070
|
)
|
||||||||
|
Financial
|
||||||||||||
|
(612
|
)
|
Publicly Traded Real Estate Investment Trusts
|
(5,987
|
)
|
||||||||
|
(270
|
)
|
Exchange Traded Equity
|
(22,856
|
)
|
||||||||
|
Total Common Stock Sold Short (Proceeds -$30,015)
|
(30,913
|
)
|
||||||||||
|
Corporate Debt Sold Short (-1.47%)
|
||||||||||||
|
North America
|
||||||||||||
|
Basic Materials
|
||||||||||||
|
(2,700
|
)
|
Various
|
3.55%
|
3/22
|
(2,386
|
)
|
||||||
|
Consumer
|
||||||||||||
|
(1,375
|
)
|
Various
|
5.13% - 6.25%
|
6/22 - 10/22
|
(1,399
|
)
|
||||||
|
Energy
|
||||||||||||
|
(5,187
|
)
|
Various
|
4.50% - 7.75%
|
6/21 - 4/22
|
(4,621
|
)
|
||||||
|
Industrial
|
||||||||||||
|
(1,392
|
)
|
Various
|
3.90%
|
5/21
|
(1,541
|
)
|
||||||
|
Total Corporate Debt Sold Short (Proceeds -$9,616)
|
(9,947
|
)
|
||||||||||
|
Total Investments Sold Short (Proceeds -$613,756)
|
$
|
(616,337
|
)
|
|||||||||
See Notes to Consolidated Financial Statements
13
ELLINGTON FINANCIAL LLC
CONSOLIDATED CONDENSED SCHEDULE OF INVESTMENTS
AT JUNE 30, 2016 (CONTINUED)
(UNAUDITED)
|
Primary Risk
Exposure
|
Notional Value
|
Range of
Expiration
Dates
|
Fair Value
|
||||||||
|
(In thousands)
|
Expressed in U.S.Dollars
|
||||||||||
|
Financial Derivatives–Assets (22.47%) (a) (b)
|
|||||||||||
|
Swaps (22.22%) (z)
|
|||||||||||
|
Long Swaps:
|
|||||||||||
|
Credit Default Swaps on Corporate Bond Indices (l)
|
|||||||||||
|
CDX.NA.HY 25 35-100
|
Credit
|
$
|
399,212
|
|
12/20
|
$
|
73,594
|
|
|||
|
Other
|
Credit
|
297,148
|
|
6/18 - 6/21
|
27,293
|
|
|||||
|
Total Credit Default Swaps on Corporate Bond Indices
|
100,887
|
|
|||||||||
|
Credit Default Swaps on Asset-Backed Indices (l)
|
Credit
|
1,340
|
|
12/37
|
51
|
|
|||||
|
Interest Rate Swaps (m)
|
Interest Rates
|
524,260
|
|
12/16 - 6/46
|
13,931
|
|
|||||
|
North America
|
|||||||||||
|
Total Return Swaps (q)
|
|||||||||||
|
Communications
|
Credit
|
6,733
|
|
2/17 - 4/17
|
89
|
|
|||||
|
Consumer
|
Credit
|
3,465
|
|
2/17 - 3/17
|
199
|
|
|||||
|
Industrial
|
Credit
|
3,710
|
|
2/17 - 3/17
|
357
|
|
|||||
|
Utilities
|
Credit
|
2,330
|
|
2/17
|
179
|
|
|||||
|
Total Total Return Swaps
|
824
|
|
|||||||||
|
Credit Default Swaps on Corporate Bonds (l)
|
|||||||||||
|
Communications
|
Credit
|
1,300
|
|
6/21
|
71
|
|
|||||
|
Consumer
|
Credit
|
1,535
|
|
6/21
|
34
|
|
|||||
|
Industrial
|
Credit
|
1,463
|
|
12/20 - 6/21
|
17
|
|
|||||
|
Total Credit Default Swaps on Corporate Bonds
|
122
|
|
|||||||||
|
Short Swaps:
|
|||||||||||
|
Credit Default Swaps on Asset-Backed Indices (n)
|
Credit
|
(140,273
|
)
|
5/46 - 5/63
|
24,565
|
|
|||||
|
Credit Default Swaps on Corporate Bond Indices (n)
|
Credit
|
(63,527
|
)
|
12/17 - 6/21
|
4,024
|
|
|||||
|
North America
|
|||||||||||
|
Credit Default Swaps on Asset-Backed Securities (n)
|
|||||||||||
|
Mortgage-related—Residential
|
Credit
|
(8,213
|
)
|
5/35 - 12/35
|
6,068
|
|
|||||
|
Credit Default Swaps on Corporate Bonds (n)
|
|||||||||||
|
Energy
|
Credit
|
(7,290
|
)
|
6/17 - 6/21
|
461
|
|
|||||
|
Total Credit Default Swaps on Corporate Bonds
|
461
|
|
|||||||||
|
Total Swaps (Net cost $149,884)
|
150,933
|
|
|||||||||
|
Futures (0.00%)
|
|||||||||||
|
Long Futures:
|
|||||||||||
|
U.S. Treasury Note Futures (s)
|
Interest Rates
|
2,000
|
|
9/16
|
2
|
|
|||||
|
Eurodollar Futures (r)
|
Interest Rates
|
11,000
|
|
6/17
|
4
|
|
|||||
|
Short Futures:
|
|||||||||||
|
U.S. Treasury Note Futures (s)
|
Interest Rates
|
(100
|
)
|
9/16
|
—
|
|
|||||
|
U.S. Treasury Bond Futures (s)
|
Interest Rates
|
(100
|
)
|
9/16
|
2
|
|
|||||
|
Total Futures
|
8
|
|
|||||||||
See Notes to Consolidated Financial Statements
14
ELLINGTON FINANCIAL LLC
CONSOLIDATED CONDENSED SCHEDULE OF INVESTMENTS
AT JUNE 30, 2016 (CONTINUED)
(UNAUDITED)
|
Primary Risk
Exposure
|
Notional Value
|
Range of
Expiration
Dates
|
Fair Value
|
||||||||
|
(In thousands)
|
Expressed in U.S.Dollars
|
||||||||||
|
Options (0.00%)
|
|||||||||||
|
Purchased Options:
|
|||||||||||
|
Interest Rate Caps (u)
|
Interest Rates
|
$
|
23,200
|
|
3/18
|
$
|
1
|
|
|||
|
Total Options (Cost $1)
|
1
|
|
|||||||||
|
Forwards (0.23%)
|
|||||||||||
|
Short Forwards:
|
|||||||||||
|
Currency Forwards (x)
|
Currency
|
(74,782
|
)
|
9/16
|
1,578
|
|
|||||
|
Total Forwards
|
1,578
|
|
|||||||||
|
Warrants (0.02%)
|
|||||||||||
|
North America
|
|||||||||||
|
Warrants (t)
|
|||||||||||
|
Mortgage-related—Residential
|
Equity Market
|
1,554
|
|
100
|
|
||||||
|
Total Warrants (Cost $100)
|
100
|
|
|||||||||
|
Mortgage Loan Purchase Commitments (0.00%)
|
|||||||||||
|
North America
|
|||||||||||
|
Mortgage Loan Purchase Commitments (w)
|
|||||||||||
|
Mortgage-related—residential
|
Interest Rates
|
2,330
|
|
7/16
|
8
|
|
|||||
|
Total Mortgage Loan Purchase Commitments
|
8
|
|
|||||||||
|
Total Financial Derivatives–Assets (Net cost $149,985)
|
$
|
152,628
|
|
||||||||
|
Financial Derivatives–Liabilities (-10.91%) (a) (b)
|
|||||||||||
|
Swaps (-10.82%) (z)
|
|||||||||||
|
Long Swaps:
|
|||||||||||
|
Credit Default Swaps on Asset-Backed Indices (l)
|
Credit
|
31,413
|
|
1/47 - 9/58
|
$
|
(5,868
|
)
|
||||
|
Interest Rate Swaps (m)
|
Interest Rates
|
3,564
|
|
10/16 - 7/46
|
(2
|
)
|
|||||
|
North America
|
|||||||||||
|
Credit Default Swaps on Corporate Bonds (l)
|
|||||||||||
|
Basic Materials
|
Credit
|
2,700
|
|
6/21
|
(492
|
)
|
|||||
|
Energy
|
Credit
|
5,447
|
|
6/21
|
(1,387
|
)
|
|||||
|
Total Credit Default Swaps on Corporate Bonds
|
(1,879
|
)
|
|||||||||
|
Total Return Swaps
|
|||||||||||
|
Basic Materials (q)
|
Credit
|
6,638
|
|
2/17 - 3/17
|
(320
|
)
|
|||||
|
Communications (q)
|
Credit
|
2,295
|
|
2/17
|
(260
|
)
|
|||||
|
Consumer (q)
|
Credit
|
2,104
|
|
2/17
|
(434
|
)
|
|||||
|
Financial (q)
|
Credit
|
2,086
|
|
2/17
|
(2
|
)
|
|||||
|
Total Total Return Swaps
|
(1,016
|
)
|
|||||||||
|
Europe
|
|||||||||||
|
Credit Default Swaps on Corporate Bonds (l)
|
|||||||||||
|
Basic Materials
|
Credit
|
12
|
|
12/19
|
(6
|
)
|
|||||
See Notes to Consolidated Financial Statements
15
ELLINGTON FINANCIAL LLC
CONSOLIDATED CONDENSED SCHEDULE OF INVESTMENTS
AT JUNE 30, 2016 (CONTINUED)
(UNAUDITED)
|
Primary Risk
Exposure
|
Notional Value
|
Range of
Expiration
Dates
|
Fair Value
|
||||||||
|
(In thousands)
|
Expressed in U.S.Dollars
|
||||||||||
|
Short Swaps:
|
|||||||||||
|
Interest Rate Swaps (o)
|
Interest Rates
|
$
|
(949,730
|
)
|
9/16 - 7/46
|
$
|
(22,856
|
)
|
|||
|
Credit Default Swaps on Corporate Bond Indices (n)
|
Credit
|
(985,654
|
)
|
12/16 - 6/21
|
(39,797
|
)
|
|||||
|
North America
|
|||||||||||
|
Credit Default Swaps on Asset-Backed Securities (n)
|
|||||||||||
|
Mortgage-related—Residential
|
Credit
|
(3,159
|
)
|
10/34 - 3/35
|
(234
|
)
|
|||||
|
Credit Default Swaps on Corporate Bonds (n)
|
|||||||||||
|
Basic Materials
|
Credit
|
(2,990
|
)
|
6/17
|
(1
|
)
|
|||||
|
Communications
|
Credit
|
(1,300
|
)
|
6/21
|
(71
|
)
|
|||||
|
Consumer
|
Credit
|
(14,580
|
)
|
6/18 - 6/21
|
(1,509
|
)
|
|||||
|
Technology
|
Credit
|
(2,200
|
)
|
3/20
|
(256
|
)
|
|||||
|
Total Credit Default Swaps on Corporate Bonds
|
(1,837
|
)
|
|||||||||
|
Total Return Swaps (p)
|
|||||||||||
|
Financial
|
Equity Market
|
(78,839
|
)
|
2/17 - 10/19
|
(2
|
)
|
|||||
|
Total Swaps (Net proceeds -$42,107)
|
(73,497
|
)
|
|||||||||
|
Futures (-0.05%)
|
|||||||||||
|
Short Futures:
|
|||||||||||
|
U.S. Treasury Note Futures (s)
|
Interest Rates
|
(1,400
|
)
|
9/16
|
(5
|
)
|
|||||
|
Eurodollar Futures (r)
|
Interest Rates
|
(266,000
|
)
|
9/16 - 9/17
|
(353
|
)
|
|||||
|
Total Futures
|
(358
|
)
|
|||||||||
|
Options (-0.04%)
|
|||||||||||
|
Purchased Options:
|
|||||||||||
|
Written Options:
|
|||||||||||
|
Put Options on Credit Default Swaps on Corporate Bond Indices (v)
|
Credit
|
(155,500
|
)
|
7/16 - 9/16
|
(243
|
)
|
|||||
|
Total Options (Proceeds -$925)
|
(243
|
)
|
|||||||||
|
Total Financial Derivatives–Liabilities
(Net proceeds -$43,032)
|
$
|
(74,098
|
)
|
||||||||
See Notes to Consolidated Financial Statements
16
ELLINGTON FINANCIAL LLC
CONSOLIDATED CONDENSED SCHEDULE OF INVESTMENTS
AT JUNE 30, 2016 (CONCLUDED)
(UNAUDITED)
|
(a)
|
See Note 2 and Note 3 in Notes to Consolidated Financial Statements.
|
|
(b)
|
Classification percentages are based on Total Equity.
|
|
(c)
|
At
June 30, 2016
, the Company's long investments guaranteed by the Federal National Mortgage Association, the Federal Home Loan Mortgage Corporation, and the Government National Mortgage Association, represented
82.73%
,
41.42%
, and
24.75%
of equity, respectively.
|
|
(d)
|
Private trust
100%
backed by interest in Government National Mortgage Association collateralized mortgage obligation certificates.
|
|
(e)
|
Loans and real estate owned are beneficially owned by the Company through participation certificates in the various trusts that hold such investments.
|
|
(f)
|
Includes investments in participation certificates related to loans held in a trust owned by a related party of Ellington Financial Management LLC. Through its participation certificates, the Company has beneficial interests in the cash flows of the underlying loans held by the trust. At
June 30, 2016
loans held in the related party trust for which the Company has beneficial interests in the residual cash flows, totaled
$6.0 million
.
|
|
(g)
|
Includes non-performing commercial loans in the amount of
$23.7 million
whereby principal and/or interest is past due and a maturity date is not applicable.
|
|
(h)
|
Number of properties not shown in thousands, represents actual number of properties owned.
|
|
(i)
|
As of
June 30, 2016
, the Company had residential mortgage loans that were in the process of foreclosure with a fair value of
$4.3 million
.
|
|
(j)
|
In general, securities received pursuant to repurchase agreements were delivered to counterparties in short sale transactions.
|
|
(k)
|
At
June 30, 2016
, the Company's short investments guaranteed by the Federal National Mortgage Association, the Federal Home Loan Mortgage Corporation, and the Government National Mortgage Association, represented
40.55%
,
24.72%
, and
6.60%
of equity, respectively.
|
|
(l)
|
For long credit default swaps, the Company sold protection.
|
|
(m)
|
For long interest rate swap contracts, the Company pays a floating rate and receives a fixed rate.
|
|
(n)
|
For short credit default swaps, the Company purchased protection.
|
|
(o)
|
For short interest rate swap contracts, the Company pays a fixed rate and receives a floating rate.
|
|
(p)
|
Notional value represents number of underlying shares times the closing price of the underlying security.
|
|
(q)
|
Notional value represents outstanding principal balance on underlying corporate debt.
|
|
(r)
|
Every
$1,000,000
in notional value represents
one
contract.
|
|
(s)
|
Notional value represents the total face amount of U.S. Treasury securities underlying all contracts held; as of
June 30, 2016
,
16
long contracts and
16
short contracts were held.
|
|
(t)
|
Notional value represents number of warrants.
|
|
(u)
|
Notional value represents the amount on which interest payments are calculated to the extent the market interest rate exceeds the rate cap on the contract.
|
|
(v)
|
Represents the option on the part of a counterparty to enter into a credit default swap on a corporate bond index whereby the Company would receive a fixed rate and pay credit protection payments.
|
|
(w)
|
Notional value represents principal balance of mortgage loan purchase commitments. Actual loan purchases are contingent upon successful loan closings in accordance with agreed-upon parameters.
|
|
(x)
|
Notional value represents U.S. Dollars to be received by the Company at the maturity of the forward contract.
|
|
(y)
|
The table below shows the Company's long investment ratings from Moody's, Standard and Poor's, or Fitch, as well as the Company's long investments that were unrated but guaranteed by the Federal National Mortgage Association, the Federal Home Loan Mortgage Corporation, or the Government National Mortgage Association. Ratings tend to be a lagging credit indicator; as a result, the credit quality of the Company's long investment holdings may be lower than the credit quality implied based on the ratings listed below. In situations where an investment has a split rating, the lowest provided rating is used. The ratings descriptions include ratings qualified with a "+," "-," "1," "2," or "3."
|
|
Rating Description
|
Percent of Equity
|
||
|
Unrated but Agency-Guaranteed
|
148.90
|
%
|
|
|
Aaa/AAA/AAA
|
0.06
|
%
|
|
|
A/A/A
|
0.09
|
%
|
|
|
Baa/BBB/BBB
|
1.79
|
%
|
|
|
Ba/BB/BB or below
|
27.95
|
%
|
|
|
Unrated
|
54.16
|
%
|
|
|
(z)
|
The following table shows the Company's swap assets and liabilities by dealer as a percentage of Total Equity:
|
|
Dealer/Parent Company
|
Asset/Liability
|
Percent of Equity
|
|||
|
Affiliates of Bank of America
|
Financial derivatives—asset
|
7.25
|
%
|
||
|
Affiliates of JP Morgan
|
Financial derivatives—asset
|
5.57
|
%
|
||
|
Affiliates of JP Morgan
|
Financial derivatives—liability
|
(7.42
|
)%
|
||
See Notes to Consolidated Financial Statements
17
ELLINGTON FINANCIAL LLC
CONSOLIDATED CONDENSED SCHEDULE OF INVESTMENTS
AT DECEMBER 31, 2015
(UNAUDITED)
|
Current Principal
|
Description
|
Rate
|
Maturity
|
Fair Value
|
||||||||
|
(In thousands)
|
Expressed in U.S. Dollars
|
|||||||||||
|
Long Investments (224.79%) (a) (b) (ac)
|
||||||||||||
|
Mortgage-Backed Securities (182.64%)
|
||||||||||||
|
Agency Securities (143.52%) (c)
|
||||||||||||
|
Fixed Rate Agency Securities (138.57%)
|
||||||||||||
|
Principal and Interest–Fixed Rate Agency Securities (124.31%)
|
||||||||||||
|
North America
|
||||||||||||
|
Mortgage-related—Residential
|
||||||||||||
|
$
|
160,391
|
|
Federal Home Loan Mortgage Corporation Pools (30 Year)
|
4.00%
|
9/42 - 8/45
|
$
|
170,500
|
|
||||
|
128,637
|
|
Federal National Mortgage Association Pools (30 Year)
|
4.00%
|
8/42 - 10/45
|
136,894
|
|
||||||
|
110,746
|
|
Federal National Mortgage Association Pools (30 Year)
|
4.50%
|
10/41 - 10/45
|
120,785
|
|
||||||
|
72,425
|
|
Federal National Mortgage Association Pools (30 Year)
|
3.50%
|
10/42 - 10/45
|
74,959
|
|
||||||
|
54,658
|
|
Federal National Mortgage Association Pools (30 Year)
|
5.00%
|
10/35 - 12/44
|
60,473
|
|
||||||
|
45,792
|
|
Federal National Mortgage Association Pools (15 Year)
|
3.50%
|
3/28 - 10/30
|
48,211
|
|
||||||
|
42,655
|
|
Federal Home Loan Mortgage Corporation Pools (30 Year)
|
4.50%
|
9/43 - 10/45
|
46,365
|
|
||||||
|
31,481
|
|
Government National Mortgage Association Pools (30 Year)
|
4.00%
|
6/45 - 10/45
|
33,620
|
|
||||||
|
29,417
|
|
Federal Home Loan Mortgage Corporation Pools (30 Year)
|
3.50%
|
1/42 - 10/45
|
30,458
|
|
||||||
|
21,705
|
|
Federal Home Loan Mortgage Corporation Pools (15 Year)
|
3.50%
|
9/28 - 9/30
|
22,848
|
|
||||||
|
15,056
|
|
Government National Mortgage Association Pools (30 Year)
|
4.50%
|
8/45 - 9/45
|
16,328
|
|
||||||
|
13,060
|
|
Federal National Mortgage Association Pools (15 Year)
|
3.00%
|
4/30 - 10/30
|
13,500
|
|
||||||
|
11,558
|
|
Federal National Mortgage Association Pools (15 Year)
|
4.00%
|
6/26 - 12/29
|
12,284
|
|
||||||
|
8,154
|
|
Government National Mortgage Association Pools (Other)
|
4.56%
|
1/65
|
8,850
|
|
||||||
|
7,799
|
|
Federal National Mortgage Association Pools (Other)
|
5.00%
|
9/43 - 1/44
|
8,680
|
|
||||||
|
8,221
|
|
Federal Home Loan Mortgage Corporation Pools (Other)
|
3.50%
|
2/30 - 6/43
|
8,508
|
|
||||||
|
6,705
|
|
Government National Mortgage Association Pools (Other)
|
4.68%
|
11/63 - 9/64
|
7,280
|
|
||||||
|
6,196
|
|
Government National Mortgage Association Pools (Other)
|
4.61%
|
6/64 - 11/64
|
6,734
|
|
||||||
|
6,041
|
|
Government National Mortgage Association Pools (Other)
|
4.59%
|
11/64
|
6,565
|
|
||||||
|
6,114
|
|
Federal National Mortgage Association Pools (20 Year)
|
4.00%
|
11/33 - 12/33
|
6,558
|
|
||||||
|
6,256
|
|
Federal National Mortgage Association Pools (30 Year)
|
3.00%
|
1/43 - 2/43
|
6,266
|
|
||||||
|
5,859
|
|
Federal Home Loan Mortgage Corporation Pools (15 Year)
|
3.00%
|
3/28 - 4/30
|
6,054
|
|
||||||
|
4,888
|
|
Government National Mortgage Association Pools (Other)
|
4.62%
|
12/63
|
5,285
|
|
||||||
|
4,713
|
|
Federal National Mortgage Association Pools (30 Year)
|
5.50%
|
10/39
|
5,248
|
|
||||||
|
4,564
|
|
Federal National Mortgage Association Pools (15 Year)
|
4.50%
|
4/26
|
4,914
|
|
||||||
|
3,764
|
|
Government National Mortgage Association Pools (Other)
|
4.50%
|
7/61
|
4,057
|
|
||||||
|
3,748
|
|
Government National Mortgage Association Pools (Other)
|
4.75%
|
1/61
|
3,877
|
|
||||||
|
3,406
|
|
Government National Mortgage Association Pools (Other)
|
4.63%
|
10/64
|
3,704
|
|
||||||
|
3,402
|
|
Government National Mortgage Association Pools (30 Year)
|
3.50%
|
4/45
|
3,551
|
|
||||||
|
3,376
|
|
Government National Mortgage Association Pools (Other)
|
4.80%
|
2/61
|
3,504
|
|
||||||
|
3,129
|
|
Government National Mortgage Association Pools (Other)
|
4.49%
|
11/64
|
3,376
|
|
||||||
|
2,966
|
|
Government National Mortgage Association Pools (Other)
|
5.49%
|
4/60
|
3,151
|
|
||||||
|
2,780
|
|
Federal Home Loan Mortgage Corporation Pools (Other)
|
4.50%
|
5/44
|
3,031
|
|
||||||
|
2,680
|
|
Government National Mortgage Association Pools (Other)
|
4.64%
|
3/65
|
2,924
|
|
||||||
|
2,788
|
|
Federal Home Loan Mortgage Corporation Pools (Other)
|
3.00%
|
6/28
|
2,880
|
|
||||||
|
2,533
|
|
Federal National Mortgage Association Pools (30 Year)
|
6.00%
|
9/39 - 2/40
|
2,866
|
|
||||||
|
2,469
|
|
Government National Mortgage Association Pools (Other)
|
5.54%
|
2/60
|
2,598
|
|
||||||
See Notes to Consolidated Financial Statements
18
ELLINGTON FINANCIAL LLC
CONSOLIDATED CONDENSED SCHEDULE OF INVESTMENTS
AT DECEMBER 31, 2015 (CONTINUED)
(UNAUDITED)
|
Current Principal/Notional Value
|
Description
|
Rate
|
Maturity
|
Fair Value
|
||||||||
|
(In thousands)
|
|
Expressed in U.S.
Dollars
|
||||||||||
|
(continued)
|
||||||||||||
|
$
|
2,326
|
|
Government National Mortgage Association Pools (Other)
|
5.51%
|
2/60
|
$
|
2,479
|
|
||||
|
1,988
|
|
Federal Home Loan Mortgage Corporation Pools (15 Year)
|
4.00%
|
2/29
|
2,121
|
|
||||||
|
1,608
|
|
Federal Home Loan Mortgage Corporation Pools (30 Year)
|
6.00%
|
4/39 - 5/40
|
1,807
|
|
||||||
|
1,352
|
|
Federal Home Loan Mortgage Corporation Pools (20 Year)
|
4.50%
|
12/33
|
1,471
|
|
||||||
|
1,139
|
|
Federal Home Loan Mortgage Corporation Pools (30 Year)
|
3.00%
|
7/43
|
1,140
|
|
||||||
|
879
|
|
Federal Home Loan Mortgage Corporation Pools (30 Year)
|
5.00%
|
7/44
|
964
|
|
||||||
|
689
|
|
Federal Home Loan Mortgage Corporation Pools (30 Year)
|
5.50%
|
8/33
|
764
|
|
||||||
|
126
|
|
Federal National Mortgage Association Pools (Other)
|
4.00%
|
6/37
|
130
|
|
||||||
|
918,562
|
|
|||||||||||
|
Interest Only–Fixed Rate Agency Securities (1.00%)
|
||||||||||||
|
North America
|
||||||||||||
|
Mortgage-related—Residential
|
||||||||||||
|
8,681
|
|
Government National Mortgage Association
|
5.50%
|
11/43
|
1,603
|
|
||||||
|
11,249
|
|
Federal National Mortgage Association
|
5.00%
|
1/36 - 5/40
|
1,425
|
|
||||||
|
8,889
|
|
Federal National Mortgage Association
|
4.50%
|
12/20 - 5/43
|
963
|
|
||||||
|
5,977
|
|
Federal Home Loan Mortgage Corporation
|
3.50%
|
12/32
|
869
|
|
||||||
|
4,884
|
|
Federal Home Loan Mortgage Corporation
|
5.00%
|
3/40
|
519
|
|
||||||
|
3,909
|
|
Federal National Mortgage Association
|
3.00%
|
9/41
|
421
|
|
||||||
|
2,019
|
|
Government National Mortgage Association
|
4.75%
|
7/40
|
378
|
|
||||||
|
1,544
|
|
Government National Mortgage Association
|
6.00%
|
6/38
|
330
|
|
||||||
|
3,782
|
|
Government National Mortgage Association
|
5.00%
|
5/37
|
311
|
|
||||||
|
1,651
|
|
Federal National Mortgage Association
|
5.50%
|
10/40
|
239
|
|
||||||
|
1,346
|
|
Federal National Mortgage Association
|
4.00%
|
5/39
|
219
|
|
||||||
|
1,109
|
|
Federal Home Loan Mortgage Corporation
|
5.50%
|
1/39
|
126
|
|
||||||
|
7,403
|
|
|||||||||||
|
TBA–Fixed Rate Agency Securities (13.26%)
|
||||||||||||
|
North America
|
||||||||||||
|
Mortgage-related—Residential
|
||||||||||||
|
40,262
|
|
Federal National Mortgage Association (30 Year)
|
4.00%
|
1/16
|
42,607
|
|
||||||
|
26,600
|
|
Federal Home Loan Mortgage Corporation (30 Year)
|
3.50%
|
1/16
|
27,394
|
|
||||||
|
15,040
|
|
Federal Home Loan Mortgage Corporation (30 Year)
|
3.00%
|
1/16
|
15,022
|
|
||||||
|
9,800
|
|
Federal National Mortgage Association (15 Year)
|
2.50%
|
1/16
|
9,879
|
|
||||||
|
2,200
|
|
Government National Mortgage Association (30 Year)
|
4.50%
|
1/16
|
2,364
|
|
||||||
|
700
|
|
Government National Mortgage Association (30 Year)
|
4.00%
|
1/16
|
743
|
|
||||||
|
98,009
|
|
|||||||||||
|
Total Fixed Rate Agency Securities (Cost $1,023,479)
|
1,023,974
|
|
||||||||||
|
Floating Rate Agency Securities (4.95%)
|
||||||||||||
See Notes to Consolidated Financial Statements
19
ELLINGTON FINANCIAL LLC
CONSOLIDATED CONDENSED SCHEDULE OF INVESTMENTS
AT DECEMBER 31, 2015 (CONTINUED)
(UNAUDITED)
|
Current Principal /Notional Value
|
Description
|
Rate
|
Maturity
|
Fair Value
|
||||||||
|
(In thousands)
|
|
Expressed in U.S.
Dollars
|
||||||||||
|
Principal and Interest–Floating Rate Agency Securities (2.58%)
|
||||||||||||
|
North America
|
||||||||||||
|
Mortgage-related—Residential
|
||||||||||||
|
$
|
9,490
|
|
Federal National Mortgage Association Pools
|
2.05% - 6.04%
|
9/35 - 5/45
|
$
|
9,990
|
|
||||
|
6,287
|
|
Federal Home Loan Mortgage Corporation Pools
|
2.61% - 5.94%
|
6/37 - 5/44
|
6,625
|
|
||||||
|
2,349
|
|
Government National Mortgage Association Pools
|
2.55%
|
11/64
|
2,476
|
|
||||||
|
19,091
|
|
|||||||||||
|
Interest Only–Floating Rate Agency Securities (2.37%)
|
||||||||||||
|
North America
|
||||||||||||
|
Mortgage-related—Residential
|
||||||||||||
|
203,125
|
|
Government National Mortgage Association
|
0.43% - 6.35%
|
11/42 - 10/63
|
12,186
|
|
||||||
|
18,517
|
|
Federal National Mortgage Association
|
5.50% - 7.13%
|
6/33 - 12/41
|
2,718
|
|
||||||
|
20,272
|
|
Resecuritization of Government National Mortgage Association (d)
|
4.31%
|
8/60
|
1,486
|
|
||||||
|
6,446
|
|
Federal Home Loan Mortgage Corporation
|
5.67% - 6.30%
|
3/36 - 8/39
|
1,125
|
|
||||||
|
17,515
|
|
|||||||||||
|
Total Floating Rate Agency Securities (Cost $36,192)
|
36,606
|
|
||||||||||
|
Total Agency Securities (Cost $1,059,671)
|
1,060,580
|
|
||||||||||
|
Private Label Securities (39.12%)
|
||||||||||||
|
Principal and Interest–Private Label Securities (38.20%)
|
||||||||||||
|
North America (32.11%)
|
||||||||||||
|
Mortgage-related—Residential
|
||||||||||||
|
380,261
|
|
Various
|
0.00% - 9.35%
|
5/19 - 9/46
|
212,869
|
|
||||||
|
Mortgage-related—Commercial
|
||||||||||||
|
84,045
|
|
Various
|
3.00% - 4.40%
|
7/45 - 2/48
|
24,456
|
|
||||||
|
Total North America (Cost $229,780)
|
237,325
|
|
||||||||||
|
Europe (6.09%)
|
||||||||||||
|
Mortgage-related—Residential
|
||||||||||||
|
50,851
|
|
Various
|
0.00% - 5.32%
|
6/25 - 3/50
|
37,164
|
|
||||||
|
Mortgage-related—Commercial
|
||||||||||||
|
7,821
|
|
Various
|
0.00% - 11.00%
|
6/17 - 6/19
|
7,812
|
|
||||||
|
Total Europe (Cost $50,695)
|
44,976
|
|
||||||||||
|
Total Principal and Interest–Private Label Securities (Cost $280,475)
|
282,301
|
|
||||||||||
|
Principal Only–Private Label Securities (0.51%)
|
||||||||||||
|
North America
|
||||||||||||
|
Mortgage-related—Residential
|
||||||||||||
|
5,800
|
|
Various
|
—%
|
8/30
|
3,749
|
|
||||||
|
Total Principal Only–Private Label Securities (Cost $3,024)
|
3,749
|
|
||||||||||
See Notes to Consolidated Financial Statements
20
ELLINGTON FINANCIAL LLC
CONSOLIDATED CONDENSED SCHEDULE OF INVESTMENTS
AT DECEMBER 31, 2015 (CONTINUED)
(UNAUDITED)
|
Current Principal /Notional Value
|
Description
|
Rate
|
Maturity
|
Fair Value
|
||||||||
|
(In thousands)
|
|
Expressed in U.S.
Dollars
|
||||||||||
|
Interest Only–Private Label Securities (0.41%)
|
||||||||||||
|
North America
|
||||||||||||
|
Mortgage-related—Residential
|
||||||||||||
|
$
|
41,097
|
|
Various
|
0.50% - 2.00%
|
6/44 - 9/47
|
$
|
1,135
|
|
||||
|
Mortgage-related—Commercial
|
||||||||||||
|
27,254
|
|
Various
|
1.43% - 1.57%
|
10/47 - 2/48
|
1,877
|
|
||||||
|
Total Interest Only–Private Label Securities (Cost $2,110)
|
3,012
|
|
||||||||||
|
Other Private Label Securities (0.00%)
|
||||||||||||
|
North America
|
||||||||||||
|
Mortgage-related—Residential
|
||||||||||||
|
100,882
|
|
Various
|
—%
|
6/37
|
—
|
|
||||||
|
Mortgage-related—Commercial
|
||||||||||||
|
—
|
|
Various
|
—%
|
7/45 - 2/48
|
—
|
|
||||||
|
Total Other Private Label Securities (Cost $273)
|
—
|
|
||||||||||
|
Total Private Label Securities (Cost $285,882)
|
289,062
|
|
||||||||||
|
Total Mortgage-Backed Securities (Cost $1,345,553)
|
1,349,642
|
|
||||||||||
|
Collateralized Loan Obligations (6.22%)
|
||||||||||||
|
North America (2.86%)
|
||||||||||||
|
67,640
|
|
Various
|
0.00% - 9.15%
|
5/16 - 9/68
|
21,120
|
|
||||||
|
Total North America (Cost $26,341)
|
21,120
|
|
||||||||||
|
Europe (3.36%)
|
||||||||||||
|
35,472
|
|
Various
|
0.00% - 4.43%
|
1/22 - 12/56
|
24,854
|
|
||||||
|
Total Europe (Cost $26,235)
|
24,854
|
|
||||||||||
|
Total Collateralized Loan Obligations (Cost $52,576)
|
45,974
|
|
||||||||||
|
Consumer Loans and Asset-backed Securities backed by Consumer Loans (15.61%) (e)
|
||||||||||||
|
North America (15.22%)
|
||||||||||||
|
Consumer (f)
|
||||||||||||
|
109,763
|
|
Various
|
5.50% - 49.00%
|
1/16 - 12/20
|
112,471
|
|
||||||
|
Total North America (Cost $112,840)
|
112,471
|
|
||||||||||
|
Europe (0.39%)
|
||||||||||||
|
Consumer
|
||||||||||||
|
2,163
|
|
Various
|
—%
|
8/24
|
2,905
|
|
||||||
|
Total Europe (Cost $2,784)
|
2,905
|
|
||||||||||
|
Total Consumer Loans and Asset-backed Securities backed by Consumer Loans (Cost $115,624)
|
115,376
|
|
||||||||||
See Notes to Consolidated Financial Statements
21
ELLINGTON FINANCIAL LLC
CONSOLIDATED CONDENSED SCHEDULE OF INVESTMENTS
AT DECEMBER 31, 2015 (CONTINUED)
(UNAUDITED)
|
Current Principal/Number of Properties
|
Description
|
Rate
|
Maturity
|
Fair Value
|
||||||||
|
(In thousands)
|
|
Expressed in U.S.
Dollars
|
||||||||||
|
Corporate Debt (3.66%)
|
||||||||||||
|
North America (2.50%)
|
||||||||||||
|
Basic Materials
|
||||||||||||
|
$
|
5,720
|
|
Various
|
11.75%
|
1/19
|
$
|
889
|
|
||||
|
Consumer
|
||||||||||||
|
3,985
|
|
Various
|
0.00% - 10.00%
|
5/20 - 7/20
|
1,282
|
|
||||||
|
Energy
|
||||||||||||
|
14,193
|
|
Various
|
6.50% - 12.25%
|
9/18 - 2/20
|
2,459
|
|
||||||
|
Financial
|
||||||||||||
|
54
|
|
Various
|
10.25%
|
8/23
|
52
|
|
||||||
|
Mortgage-related—Residential
|
||||||||||||
|
14,250
|
|
Various
|
15.00%-20.00%
|
12/17 - 10/19
|
13,770
|
|
||||||
|
Total North America (Cost $25,815)
|
18,452
|
|
||||||||||
|
Europe (1.16%)
|
||||||||||||
|
Communications
|
||||||||||||
|
7,885
|
|
Various
|
14.00%
|
10/18
|
8,083
|
|
||||||
|
Consumer
|
||||||||||||
|
16,443
|
|
Various
|
—%
|
12/16
|
493
|
|
||||||
|
Total Europe (Cost $8,971)
|
8,576
|
|
||||||||||
|
Total Corporate Debt (Cost $34,786)
|
27,028
|
|
||||||||||
|
Mortgage Loans (11.97%) (e)
|
||||||||||||
|
North America
|
||||||||||||
|
Mortgage-related—Commercial (g)
|
||||||||||||
|
77,556
|
|
Various
|
2.54% - 12.00%
|
4/16 - 7/45
|
66,399
|
|
||||||
|
Mortgage-related—Residential (i)
|
||||||||||||
|
30,267
|
|
Various
|
1.00% - 13.50%
|
7/21 - 9/55
|
22,089
|
|
||||||
|
Total Mortgage Loans (Cost $89,009)
|
88,488
|
|
||||||||||
|
Real Estate Owned (1.70%) (e) (h)
|
||||||||||||
|
North America
|
||||||||||||
|
Real estate-related
|
||||||||||||
|
28
|
|
Single-Family Houses
|
4,090
|
|
||||||||
|
2
|
|
Commercial Property
|
8,432
|
|
||||||||
|
Total Real Estate Owned (Cost $12,254)
|
12,522
|
|
||||||||||
See Notes to Consolidated Financial Statements
22
ELLINGTON FINANCIAL LLC
CONSOLIDATED CONDENSED SCHEDULE OF INVESTMENTS
AT DECEMBER 31, 2015 (CONTINUED)
(UNAUDITED)
|
Current Principal/Number of Shares
|
Description
|
Rate
|
Maturity
|
Fair Value
|
||||||||
|
(In thousands)
|
|
Expressed in U.S.
Dollars
|
||||||||||
|
Private Corporate Equity Investments (2.99%)
|
||||||||||||
|
North America (2.99%)
|
||||||||||||
|
Consumer
|
||||||||||||
|
1,592
|
|
Non-Exchange Traded Corporate Equity
|
$
|
3,032
|
|
|||||||
|
Diversified
|
||||||||||||
|
160
|
|
Non-Exchange Traded Corporate Equity
|
2,389
|
|
||||||||
|
Mortgage-related—Commercial
|
||||||||||||
|
8,171
|
|
Non-Exchange Traded Preferred Equity Investment in Commercial Mortgage-Related Private Partnership
|
7,687
|
|
||||||||
|
n/a
|
|
Non-Controlling Interest in Mortgage-Related Private Partnership
|
2,871
|
|
||||||||
|
Mortgage-related—Residential
|
||||||||||||
|
9,482
|
|
Non-Exchange Traded Preferred Equity Investment in Mortgage Originators
|
4,325
|
|
||||||||
|
7,479
|
|
Non-Exchange Traded Equity Investment in Mortgage Originators
|
1,043
|
|
||||||||
|
Technology
|
||||||||||||
|
99
|
|
Non-Exchange Traded Corporate Equity
|
741
|
|
||||||||
|
Total North America (Cost $22,598)
|
22,088
|
|
||||||||||
|
Europe (0.00%)
|
||||||||||||
|
Consumer
|
||||||||||||
|
125
|
|
Non-Exchange Traded Corporate Equity
|
—
|
|
||||||||
|
Total Europe (Cost $0)
|
—
|
|
||||||||||
|
Private Corporate Equity Investments (Cost $22,598)
|
22,088
|
|
||||||||||
|
Total Long Investments (Cost $1,672,400)
|
$
|
1,661,118
|
|
|||||||||
See Notes to Consolidated Financial Statements
23
ELLINGTON FINANCIAL LLC
CONSOLIDATED CONDENSED SCHEDULE OF INVESTMENTS
AT DECEMBER 31, 2015 (CONTINUED)
(UNAUDITED)
|
Current Principal
|
Description
|
Rate
|
Maturity
|
Fair Value
|
||||||||
|
(In thousands)
|
|
Expressed in U.S.
Dollars
|
||||||||||
|
Repurchase Agreements (14.30%) (a) (b) (j)
|
||||||||||||
|
$
|
19,472
|
|
Bank of America Securities
|
(0.25)%
|
1/16
|
$
|
19,472
|
|
||||
|
Collateralized by Par Value $19,570
|
||||||||||||
|
U.S. Treasury Note, Coupon 1.63%,
|
||||||||||||
|
Maturity Date 11/20
|
||||||||||||
|
15,296
|
|
Barclays Capital Inc.
|
(0.48)%
|
1/16
|
15,295
|
|
||||||
|
Collateralized by Par Value $14,941
|
||||||||||||
|
Sovereign Government Bond, Coupon 0.25%,
|
||||||||||||
|
Maturity Date 4/18
|
||||||||||||
|
14,756
|
|
Bank of America Securities
|
0.35%
|
1/16
|
14,756
|
|
||||||
|
Collateralized by Par Value $15,000
|
||||||||||||
|
U.S. Treasury Note, Coupon 2.00%,
|
||||||||||||
|
Maturity Date 2/25
|
||||||||||||
|
13,200
|
|
Deutsche Bank Securities
|
(1.00)%
|
1/16
|
13,200
|
|
||||||
|
Collateralized by Par Value $13,200
|
||||||||||||
|
U.S. Treasury Note, Coupon 2.25%,
|
||||||||||||
|
Maturity Date 11/25
|
||||||||||||
|
8,240
|
|
Bank of America Securities
|
0.40%
|
1/16
|
8,240
|
|
||||||
|
Collateralized by Par Value $8,250
|
||||||||||||
|
U.S. Treasury Note, Coupon 1.75%,
|
||||||||||||
|
Maturity Date 12/20
|
||||||||||||
|
7,905
|
|
Barclays Capital Inc.
|
(0.48)%
|
1/16
|
7,905
|
|
||||||
|
Collateralized by Par Value $7,050
|
||||||||||||
|
Sovereign Government Bond, Coupon 2.75%,
|
||||||||||||
|
Maturity Date 4/19
|
||||||||||||
|
5,000
|
|
Bank of America Securities
|
0.30%
|
1/16
|
5,000
|
|
||||||
|
Collateralized by Par Value $5,000
|
||||||||||||
|
U.S. Treasury Note, Coupon 1.25%,
|
||||||||||||
|
Maturity Date 10/18
|
||||||||||||
|
3,980
|
|
Bank of America Securities
|
0.40%
|
1/16
|
3,980
|
|
||||||
|
Collateralized by Par Value $4,000
|
||||||||||||
|
U.S. Treasury Note, Coupon 1.63%,
|
||||||||||||
|
Maturity Date 6/20
|
||||||||||||
|
3,965
|
|
Bank of America Securities
|
0.40%
|
1/16
|
3,965
|
|
||||||
|
Collateralized by Par Value $4,000
|
||||||||||||
|
U.S. Treasury Note, Coupon 1.50%,
|
||||||||||||
|
Maturity Date 5/20
|
||||||||||||
|
3,960
|
|
Bank of America Securities
|
0.40%
|
1/16
|
3,960
|
|
||||||
|
Collateralized by Par Value $4,000
|
||||||||||||
|
U.S. Treasury Note, Coupon 1.38%,
|
||||||||||||
|
Maturity Date 3/20
|
||||||||||||
See Notes to Consolidated Financial Statements
24
ELLINGTON FINANCIAL LLC
CONSOLIDATED CONDENSED SCHEDULE OF INVESTMENTS
AT DECEMBER 31, 2015 (CONTINUED)
(UNAUDITED)
|
Current Principal
|
Description
|
Rate
|
Maturity
|
Fair Value
|
||||||||
|
(In thousands)
|
|
Expressed in U.S.
Dollars
|
||||||||||
|
(continued)
|
||||||||||||
|
$
|
3,204
|
|
Bank of America Securities
|
0.40%
|
1/16
|
$
|
3,204
|
|
||||
|
Collateralized by Par Value $3,200
|
||||||||||||
|
U.S. Treasury Note, Coupon 2.25%,
|
||||||||||||
|
Maturity Date 11/24
|
||||||||||||
|
2,008
|
|
Bank of America Securities
|
0.35%
|
1/16
|
2,008
|
|
||||||
|
Collateralized by Par Value $2,000
|
||||||||||||
|
U.S. Treasury Note, Coupon 2.00%,
|
||||||||||||
|
Maturity Date 7/22
|
||||||||||||
|
1,985
|
|
RBC Capital Markets LLC
|
0.38%
|
1/16
|
1,985
|
|
||||||
|
Collateralized by Par Value $1,916
|
||||||||||||
|
Sovereign Government Bond, Coupon 4.00%,
|
||||||||||||
|
Maturity Date 9/16
|
||||||||||||
|
1,978
|
|
Bank of America Securities
|
0.25%
|
1/16
|
1,977
|
|
||||||
|
Collateralized by Par Value $2,000
|
||||||||||||
|
U.S. Treasury Note, Coupon 1.25%,
|
||||||||||||
|
Maturity Date 1/20
|
||||||||||||
|
417
|
|
CS First Boston
|
(3.25)%
|
1/16
|
417
|
|
||||||
|
Collateralized by Par Value $560
|
||||||||||||
|
Exchange Traded Corporate Debt, Coupon 10.00%,
|
||||||||||||
|
Maturity Date 6/20
|
||||||||||||
|
336
|
|
RBC Capital Markets LLC
|
(0.75)%
|
1/16
|
336
|
|
||||||
|
Collateralized by Par Value $560
|
||||||||||||
|
Exchange Traded Corporate Debt, Coupon 11.00%,
|
||||||||||||
|
Maturity Date 3/20
|
||||||||||||
|
Total Repurchase Agreements (Cost $105,329)
|
$
|
105,700
|
|
|||||||||
See Notes to Consolidated Financial Statements
25
ELLINGTON FINANCIAL LLC
CONSOLIDATED CONDENSED SCHEDULE OF INVESTMENTS
AT DECEMBER 31, 2015 (CONTINUED)
(UNAUDITED)
|
Current Principal/Number of Shares
|
Description
|
Rate
|
Maturity
|
Fair Value
|
||||||||
|
(In thousands)
|
Expressed in U.S.
Dollars
|
|||||||||||
|
Investments Sold Short (-98.62%) (a) (b)
|
||||||||||||
|
TBA–Fixed Rate Agency Securities Sold Short (-82.93%) (k)
|
||||||||||||
|
North America
|
||||||||||||
|
Government
|
||||||||||||
|
$
|
(110,327
|
)
|
Federal Home Loan Mortgage Corporation (30 year)
|
4.00%
|
1/16
|
$
|
(116,593
|
)
|
||||
|
(79,210
|
)
|
Federal National Mortgage Association (30 year)
|
4.50%
|
1/16
|
(85,553
|
)
|
||||||
|
(69,760
|
)
|
Federal National Mortgage Association (15 year)
|
3.50%
|
1/16
|
(73,054
|
)
|
||||||
|
(51,970
|
)
|
Federal National Mortgage Association (30 year)
|
5.00%
|
1/16
|
(57,214
|
)
|
||||||
|
(48,200
|
)
|
Federal National Mortgage Association (30 year)
|
4.00%
|
2/16
|
(50,911
|
)
|
||||||
|
(43,842
|
)
|
Federal National Mortgage Association (30 year)
|
3.50%
|
1/16
|
(45,233
|
)
|
||||||
|
(37,140
|
)
|
Federal National Mortgage Association (15 year)
|
3.00%
|
1/16
|
(38,264
|
)
|
||||||
|
(21,881
|
)
|
Federal Home Loan Mortgage Corporation (30 year)
|
4.50%
|
1/16
|
(23,577
|
)
|
||||||
|
(23,600
|
)
|
Federal National Mortgage Association (30 year)
|
3.00%
|
2/16
|
(23,555
|
)
|
||||||
|
(17,600
|
)
|
Federal National Mortgage Association (30 year)
|
3.50%
|
2/16
|
(18,120
|
)
|
||||||
|
(16,510
|
)
|
Federal Home Loan Mortgage Corporation (15 year)
|
3.00%
|
1/16
|
(17,018
|
)
|
||||||
|
(13,980
|
)
|
Federal Home Loan Mortgage Corporation (15 year)
|
3.50%
|
1/16
|
(14,618
|
)
|
||||||
|
(13,742
|
)
|
Federal National Mortgage Association (30 year)
|
3.00%
|
1/16
|
(13,743
|
)
|
||||||
|
(11,170
|
)
|
Federal National Mortgage Association (15 year)
|
4.00%
|
1/16
|
(11,629
|
)
|
||||||
|
(10,150
|
)
|
Government National Mortgage Association (30 year)
|
4.00%
|
1/16
|
(10,782
|
)
|
||||||
|
(6,860
|
)
|
Federal National Mortgage Association (30 year)
|
5.50%
|
1/16
|
(7,646
|
)
|
||||||
|
(5,050
|
)
|
Government National Mortgage Association (30 year)
|
3.50%
|
1/16
|
(5,267
|
)
|
||||||
|
Total TBA–Fixed Rate Agency Securities Sold Short
(Proceeds -$612,749)
|
(612,777
|
)
|
||||||||||
|
Government Debt Sold Short (-15.43%)
|
||||||||||||
|
North America (-12.11%)
|
||||||||||||
|
Government
|
||||||||||||
|
(90,120
|
)
|
U.S. Treasury Note
|
1.25% - 2.25%
|
10/18 - 8/25
|
(89,489
|
)
|
||||||
|
Total North America (Proceeds -$89,735)
|
(89,489
|
)
|
||||||||||
|
Europe (-3.32%)
|
||||||||||||
|
Government
|
||||||||||||
|
(23,907
|
)
|
European Sovereign Bond
|
0.25% - 4.00%
|
9/16 - 4/19
|
(24,562
|
)
|
||||||
|
Total Europe (Proceeds -$26,010)
|
(24,562
|
)
|
||||||||||
|
Total Government Debt Sold Short (Proceeds -$115,745)
|
(114,051
|
)
|
||||||||||
|
Corporate Debt Sold Short (-0.06%)
|
||||||||||||
|
North America
|
||||||||||||
|
Energy
|
||||||||||||
|
(1,120
|
)
|
Various
|
10.00% - 11.00%
|
3/20 - 6/20
|
(448
|
)
|
||||||
|
Total Corporate Debt Sold Short (Proceeds -$676)
|
(448
|
)
|
||||||||||
|
Common Stock Sold Short (-0.20%)
|
||||||||||||
|
North America
|
||||||||||||
|
Energy
|
||||||||||||
|
(306
|
)
|
Exchange Traded Equity
|
(1,471
|
)
|
||||||||
|
Total Common Stock Sold Short (Proceeds -$1,878)
|
(1,471
|
)
|
||||||||||
|
Total Investments Sold Short (Proceeds -$731,048)
|
$
|
(728,747
|
)
|
|||||||||
See Notes to Consolidated Financial Statements
26
ELLINGTON FINANCIAL LLC
CONSOLIDATED CONDENSED SCHEDULE OF INVESTMENTS
AT DECEMBER 31, 2015 (CONTINUED)
(UNAUDITED)
|
Primary Risk
Exposure
|
Notional
Value
|
Range of
Expiration
Dates
|
Fair Value
|
||||||||
|
(In thousands)
|
Expressed in U.S.
Dollars
|
||||||||||
|
Financial Derivatives–Assets (22.05%) (a) (b)
|
|||||||||||
|
Swaps (21.58%) (ad)
|
|||||||||||
|
Long Swaps:
|
|||||||||||
|
Credit Default Swaps on Corporate Bond Indices (l)
|
Credit
|
||||||||||
|
CDX.NA.HY 25 35-100
|
$
|
442,140
|
|
12/20
|
$
|
81,758
|
|
||||
|
ITRX EUR XOVER 24 5Y 35-100
|
229,954
|
|
12/20
|
46,716
|
|
||||||
|
Other
|
121,730
|
|
6/18 - 6/20
|
7,278
|
|
||||||
|
Total Credit Default Swaps on Corporate Bond Indices
|
135,752
|
|
|||||||||
|
Interest Rate Swaps (m)
|
Interest Rates
|
545,232
|
|
12/16 - 12/45
|
7,254
|
|
|||||
|
Credit Default Swaps on Asset-Backed Indices (l)
|
Credit
|
1,468
|
|
12/37
|
56
|
|
|||||
|
North America
|
|||||||||||
|
Total Return Swaps
|
|||||||||||
|
Communications (q)
|
Credit
|
3,836
|
|
3/16 - 12/16
|
49
|
|
|||||
|
Consumer (q)
|
Credit
|
4,880
|
|
3/16 - 1/17
|
31
|
|
|||||
|
Energy (q)
|
Credit
|
729
|
|
10/16
|
5
|
|
|||||
|
Total Total Return Swaps
|
85
|
|
|||||||||
|
Short Swaps:
|
|||||||||||
|
Credit Default Swaps on Asset-Backed Indices (n)
|
Credit
|
(95,589
|
)
|
5/46 - 5/63
|
5,354
|
|
|||||
|
Credit Default Swaps on Corporate Bond Indices (n)
|
Credit
|
(15,208
|
)
|
12/17 - 12/19
|
1,891
|
|
|||||
|
Interest Rate Swaps (o)
|
Interest Rates
|
(608,365
|
)
|
12/16 - 12/45
|
2,689
|
|
|||||
|
North America
|
|||||||||||
|
Credit Default Swaps on Asset-Backed Securities (n)
|
|||||||||||
|
Mortgage-related—residential
|
Credit
|
(8,967
|
)
|
9/34 - 12/35
|
6,332
|
|
|||||
|
Credit Default Swaps on Corporate Bonds (n)
|
|||||||||||
|
Consumer
|
Credit
|
(590
|
)
|
12/19
|
10
|
|
|||||
|
Total Swaps (Net cost $161,193)
|
159,423
|
|
|||||||||
|
Futures (0.01%)
|
|||||||||||
|
Long Futures:
|
|||||||||||
|
U.S. Treasury Note Futures (s)
|
Interest Rates
|
6,300
|
|
3/16
|
2
|
|
|||||
|
Eurodollar Futures (r)
|
Interest Rates
|
23,000
|
|
6/17
|
17
|
|
|||||
|
Short Futures:
|
|||||||||||
|
Eurodollar Futures (r)
|
Interest Rates
|
(90,000
|
)
|
12/16
|
13
|
|
|||||
|
Total Futures
|
32
|
|
|||||||||
|
Options (0.29%)
|
|||||||||||
|
Purchased Options:
|
|||||||||||
|
Put Options on Credit Default Swaps on Corporate Bond Indices (v)
|
Credit
|
138,000
|
|
3/16
|
2,050
|
|
|||||
|
Call Options on U.S. Treasury Futures (t)
|
Interest Rates
|
3,900
|
|
2/16
|
51
|
|
|||||
|
Put Options on U.S. Treasury Futures (t)
|
Interest Rates
|
3,900
|
|
2/16
|
61
|
|
|||||
|
Total Options (Cost $2,600)
|
2,162
|
|
|||||||||
|
Forwards (0.15%)
|
|||||||||||
|
Short Forwards
|
|||||||||||
|
Currency Forwards (ab)
|
Currency
|
(95,326
|
)
|
3/16
|
1,138
|
|
|||||
|
Total Forwards
|
1,138
|
|
|||||||||
See Notes to Consolidated Financial Statements
27
ELLINGTON FINANCIAL LLC
CONSOLIDATED CONDENSED SCHEDULE OF INVESTMENTS
AT DECEMBER 31, 2015 (CONTINUED)
(UNAUDITED)
|
Primary Risk
Exposure |
Notional
Value |
Range of
Expiration Dates |
Fair Value
|
||||||||
|
(In thousands)
|
|
|
|
Expressed in U.S.
Dollars |
|||||||
|
Warrants (0.02%)
|
|||||||||||
|
North America
|
|||||||||||
|
Warrants (u)
|
|||||||||||
|
Mortgage-related—residential
|
Equity Market
|
$
|
1,555
|
|
$
|
150
|
|
||||
|
Total Warrants (Cost $150)
|
150
|
|
|||||||||
|
Total Financial Derivatives–Assets (Net cost $163,943)
|
$
|
162,905
|
|
||||||||
|
Financial Derivatives–Liabilities (-8.18%) (a) (b)
|
|||||||||||
|
Swaps (-7.87%) (ad)
|
|||||||||||
|
Long Swaps:
|
|||||||||||
|
Credit Default Swaps on Asset-Backed Indices (l)
|
Credit
|
4,458
|
|
10/52 - 5/63
|
$
|
(365
|
)
|
||||
|
Interest Rate Swaps (m)
|
Interest Rates
|
129,975
|
|
10/16 - 12/45
|
(278
|
)
|
|||||
|
North America
|
|||||||||||
|
Total Return Swaps
|
|||||||||||
|
Basic Materials (q)
|
Credit
|
6,477
|
|
3/16
|
(822
|
)
|
|||||
|
Communications (q)
|
Credit
|
11,009
|
|
3/16 - 8/16
|
(2,581
|
)
|
|||||
|
Consumer (q)
|
Credit
|
4,983
|
|
6/16 - 8/16
|
(143
|
)
|
|||||
|
Diversified (q)
|
Credit
|
2,765
|
|
3/16
|
(171
|
)
|
|||||
|
Energy (q)
|
Credit
|
4,076
|
|
4/16 - 8/16
|
(812
|
)
|
|||||
|
Energy (p)
|
Equity Market
|
35
|
|
7/17
|
—
|
|
|||||
|
Financial (q)
|
Credit
|
2,646
|
|
9/16
|
(10
|
)
|
|||||
|
Financial (p)
|
Equity Market
|
21,635
|
|
11/16
|
—
|
|
|||||
|
Industrial (q)
|
Credit
|
1,000
|
|
3/16
|
(39
|
)
|
|||||
|
Technology (q)
|
Credit
|
2,650
|
|
1/17
|
(84
|
)
|
|||||
|
Total Total Return Swaps
|
(4,662
|
)
|
|||||||||
|
Short Swaps:
|
|||||||||||
|
Interest Rate Swaps (o)
|
Interest Rates
|
(518,235
|
)
|
1/16 - 1/46
|
(4,656
|
)
|
|||||
|
Credit Default Swaps on Corporate Bond Indices (n)
|
Credit
|
(1,001,913
|
)
|
12/16 - 12/20
|
(47,298
|
)
|
|||||
|
North America
|
|||||||||||
|
Credit Default Swaps on Asset-Backed Securities (n)
|
|||||||||||
|
Mortgage-related—residential
|
Credit
|
(3,209
|
)
|
10/34 - 3/35
|
(221
|
)
|
|||||
|
Credit Default Swaps on Corporate Bonds (n)
|
|||||||||||
|
Consumer
|
Credit
|
(8,780
|
)
|
9/19 - 12/20
|
(584
|
)
|
|||||
|
Financial
|
Credit
|
(4,000
|
)
|
3/20
|
(99
|
)
|
|||||
|
Total Credit Default Swaps on Corporate Bonds
|
(683
|
)
|
|||||||||
|
Total Return Swaps
|
|||||||||||
|
Energy (p)
|
Equity Market
|
(58
|
)
|
7/17
|
—
|
|
|||||
|
Financial (p)
|
Equity Market
|
(4,048
|
)
|
3/17
|
—
|
|
|||||
|
Total Total Return Swaps
|
—
|
|
|||||||||
|
Total Swaps (Net proceeds -$53,679)
|
(58,163
|
)
|
|||||||||
See Notes to Consolidated Financial Statements
28
ELLINGTON FINANCIAL LLC
CONSOLIDATED CONDENSED SCHEDULE OF INVESTMENTS
AT DECEMBER 31, 2015 (CONTINUED)
(UNAUDITED)
|
Primary Risk
Exposure |
Notional
Value |
Range of
Expiration Dates |
Fair Value
|
||||||||
|
(In thousands)
|
|
|
|
Expressed in U.S.
Dollars |
|||||||
|
Futures (-0.07%)
|
|||||||||||
|
Long Futures:
|
|||||||||||
|
U.S. Treasury Note Futures (s)
|
Interest Rates
|
$
|
37,700
|
|
3/16
|
$
|
(235
|
)
|
|||
|
Short Futures:
|
|||||||||||
|
Eurodollar Futures (r)
|
Interest Rates
|
(306,000
|
)
|
3/16 - 9/17
|
(293
|
)
|
|||||
|
Total Futures
|
(528
|
)
|
|||||||||
|
Options (-0.24%)
|
|||||||||||
|
Purchased Options:
|
|||||||||||
|
Straddle Swaption (y)
|
Interest Rates
|
8,400
|
|
11/18
|
(31
|
)
|
|||||
|
Written Options:
|
|||||||||||
|
Call Options on Credit Default Swaps on Corporate Bond Indices (w)
|
Credit
|
(273,100
|
)
|
1/16 - 2/16
|
(884
|
)
|
|||||
|
Put Options on Credit Default Swaps on Corporate Bond Indices (x)
|
Credit
|
(171,750
|
)
|
2/16 - 3/16
|
(720
|
)
|
|||||
|
Straddle Swaption (y)
|
Interest Rates
|
(13,100
|
)
|
1/16 - 6/16
|
(125
|
)
|
|||||
|
Total Options (Proceeds -$2,521)
|
(1,760
|
)
|
|||||||||
|
Forwards (0.00%)
|
|||||||||||
|
Long Forwards:
|
|||||||||||
|
Currency Forwards (aa)
|
Currency
|
2,734
|
|
3/16
|
(13
|
)
|
|||||
|
Total Forwards
|
(13
|
)
|
|||||||||
|
Mortgage Loan Purchase Commitments (0.00%)
|
|||||||||||
|
North America
|
|||||||||||
|
Mortgage Loan Purchase Commitments (z)
|
|||||||||||
|
Mortgage-related—residential
|
Interest Rates
|
7,713
|
|
1/16 - 2/16
|
(8
|
)
|
|||||
|
Total Mortgage Loan Purchase Commitments
|
(8
|
)
|
|||||||||
|
Total Financial Derivatives–Liabilities
(Net proceeds -$56,200)
|
$
|
(60,472
|
)
|
||||||||
See Notes to Consolidated Financial Statements
29
ELLINGTON FINANCIAL LLC
CONSOLIDATED CONDENSED SCHEDULE OF INVESTMENTS
AT DECEMBER 31, 2015 (CONCLUDED)
(UNAUDITED)
|
(a)
|
See Note 2 and Note 3 in Notes to Consolidated Financial Statements.
|
|
(b)
|
Classification percentages are based on Total Equity.
|
|
(c)
|
At December 31, 2015, the Company's long investments guaranteed by the Federal National Mortgage Association, the Federal Home Loan Mortgage Corporation, and the Government National Mortgage Association, represented
77.17%
,
47.44%
, and
18.91%
of equity, respectively.
|
|
(d)
|
Private trust
100%
backed by interest in Government National Mortgage Association collateralized mortgage obligation certificates.
|
|
(e)
|
Loans and real estate owned are beneficially owned by the Company through participation certificates in the various trusts that hold such investments.
|
|
(f)
|
Includes investments in participation certificates related to loans held in a trust owned by a related party of Ellington Financial Management LLC. Through its participation certificates, the Company has beneficial interests in the cash flows of the underlying loans held by the trust. At December 31, 2015 loans held in the related party trust for which the Company has beneficial interests in the residual cash flows, totaled
$3.8 million
.
|
|
(g)
|
Includes non-performing commercial loans in the amount of
$22.6 million
whereby principal and/or interest is past due and a maturity date is not applicable.
|
|
(h)
|
Number of properties not shown in thousands, represents actual number of properties owned.
|
|
(i)
|
As of December 31, 2015, the Company had residential mortgage loans that were in the process of foreclosure with a fair value of
$5.9 million
.
|
|
(j)
|
In general, securities received pursuant to repurchase agreements were delivered to counterparties in short sale transactions.
|
|
(k)
|
At December 31, 2015, the Company's short investments guaranteed by the Federal National Mortgage Association, the Federal Home Loan Mortgage Corporation, and the Government National Mortgage Association, represented
57.51%
,
23.25%
, and
2.17%
of equity, respectively.
|
|
(l)
|
For long credit default swaps, the Company sold protection.
|
|
(m)
|
For long interest rate swap contracts, the Company pays a floating rate and receives a fixed rate.
|
|
(n)
|
For short credit default swaps, the Company purchased protection.
|
|
(o)
|
For short interest rate swap contracts, the Company pays a fixed rate and receives a floating rate.
|
|
(p)
|
Notional value represents number of underlying shares times the closing price of the underlying security.
|
|
(q)
|
Notional value represents outstanding principal balance on underlying corporate debt.
|
|
(r)
|
Every
$1,000,000
in notional value represents
one
contract.
|
|
(s)
|
Notional value represents the total face amount of U.S. Treasury Notes underlying all contracts held; as of December 31, 2015,
343
long futures contracts were held.
|
|
(t)
|
Represents the option on the part of the Company to enter into a futures contract with a counterparty; as of December 31, 2015,
39
put options and
39
call options contracts were held.
|
|
(u)
|
Notional value represents number of warrants.
|
|
(v)
|
Represents the option on the part of the Company to enter into a credit default swap on a corporate bond index whereby the Company would pay a fixed rate and receive credit protection payments.
|
|
(w)
|
Represents the option on the part of a counterparty to enter into a credit default swap on a corporate bond index whereby the Company would pay a fixed rate and receive credit protection payments.
|
|
(x)
|
Represents the option on the part of a counterparty to enter into a credit default swap on a corporate bond index whereby the Company would receive a fixed rate and pay credit protection payments.
|
|
(y)
|
Represents the combination of a written payer swaption and a written receiver swaption on the same underlying swap.
|
|
(z)
|
Notional value represents principal balance of mortgage loan purchase commitments. Actual loan purchases are contingent upon successful loan closings in accordance with agreed-upon parameters.
|
|
(aa)
|
Notional value represents U.S. Dollars to be paid by the Company at the maturity of the forward contract.
|
|
(ab)
|
Notional value represents U.S. Dollars to be received by the Company at the maturity of the forward contract.
|
|
(ac)
|
The table below shows the ratings on the Company's long investments from Moody's, Standard and Poor's, or Fitch, as well as the Company's long investments that were unrated but guaranteed by the Federal National Mortgage Association, the Federal Home Loan Mortgage Corporation, or the Government National Mortgage Association. Ratings tend to be a lagging credit indicator; as a result, the credit quality of the Company's long investment holdings may be lower than the credit quality implied based on the ratings listed below. In situations where an investment has a split rating, the lowest provided rating is used. The ratings descriptions include ratings qualified with a "+," "-," "1," "2," or "3."
|
|
Rating Description
|
Percent of Equity
|
||
|
Unrated but Agency-Guaranteed
|
143.52
|
%
|
|
|
A/A/A
|
0.32
|
%
|
|
|
Baa/BBB/BBB
|
1.07
|
%
|
|
|
Ba/BB/BB or below
|
34.89
|
%
|
|
|
Unrated
|
44.99
|
%
|
|
(ad)
The following table shows the Company's swap assets and liabilities by dealer as a percentage of Total Equity:
|
Dealer/Parent Company
|
Asset/Liability
|
Percent of Equity
|
|||
|
Affiliates of Bank of America
|
Financial derivatives—asset
|
6.01
|
%
|
||
|
Affiliates of JP Morgan
|
Financial derivatives—liability
|
(6.32
|
)%
|
||
See Notes to Consolidated Financial Statements
30
ELLINGTON FINANCIAL LLC
(UNAUDITED)
|
Three Month Period Ended
June 30, 2016 |
Three Month Period Ended
June 30, 2015 |
Six Month Period Ended
June 30, 2016 |
Six Month Period Ended
June 30, 2015 |
|||||||||||||
|
(In thousands except per share amounts)
|
Expressed in U.S. Dollars
|
|||||||||||||||
|
INVESTMENT INCOME
|
||||||||||||||||
|
Interest income
|
$
|
18,990
|
|
$
|
25,739
|
|
$
|
39,417
|
|
$
|
52,252
|
|
||||
|
Other income
|
1,024
|
|
1,023
|
|
2,692
|
|
1,316
|
|
||||||||
|
Total investment income
|
20,014
|
|
26,762
|
|
42,109
|
|
53,568
|
|
||||||||
|
EXPENSES
|
||||||||||||||||
|
Base management fee
|
2,553
|
|
2,920
|
|
5,164
|
|
5,872
|
|
||||||||
|
Interest expense
|
4,234
|
|
2,867
|
|
7,702
|
|
5,853
|
|
||||||||
|
Other investment related expenses
|
2,191
|
|
1,163
|
|
3,938
|
|
2,365
|
|
||||||||
|
Professional fees
|
834
|
|
631
|
|
1,690
|
|
1,347
|
|
||||||||
|
Administration fees
|
312
|
|
346
|
|
653
|
|
685
|
|
||||||||
|
Compensation expense
|
612
|
|
312
|
|
1,132
|
|
679
|
|
||||||||
|
Insurance expense
|
150
|
|
143
|
|
307
|
|
320
|
|
||||||||
|
Directors' fees and expenses
|
73
|
|
59
|
|
138
|
|
133
|
|
||||||||
|
Share-based LTIP expense
|
99
|
|
98
|
|
199
|
|
196
|
|
||||||||
|
Other expenses
|
435
|
|
493
|
|
843
|
|
921
|
|
||||||||
|
Total expenses
|
11,493
|
|
9,032
|
|
21,766
|
|
18,371
|
|
||||||||
|
NET INVESTMENT INCOME
|
8,521
|
|
17,730
|
|
20,343
|
|
35,197
|
|
||||||||
|
NET REALIZED AND CHANGE IN NET UNREALIZED GAIN (LOSS) ON INVESTMENTS, FINANCIAL DERIVATIVES, AND FOREIGN CURRENCY TRANSACTIONS/TRANSLATION
|
||||||||||||||||
|
Net realized gain (loss) on:
|
||||||||||||||||
|
Investments
|
1,226
|
|
14,045
|
|
(748
|
)
|
23,779
|
|
||||||||
|
Financial derivatives, excluding currency forwards
|
(2,231
|
)
|
(9,693
|
)
|
(12,285
|
)
|
(15,527
|
)
|
||||||||
|
Financial derivatives—currency forwards
|
(972
|
)
|
(4,320
|
)
|
(1,305
|
)
|
1,476
|
|
||||||||
|
Foreign currency transactions
|
(354
|
)
|
729
|
|
66
|
|
1,462
|
|
||||||||
|
(2,331
|
)
|
761
|
|
(14,272
|
)
|
11,190
|
|
|||||||||
|
Change in net unrealized gain (loss) on:
|
||||||||||||||||
|
Investments
|
3,386
|
|
(19,875
|
)
|
(1,016
|
)
|
(19,182
|
)
|
||||||||
|
Financial derivatives, excluding currency forwards
|
(5,773
|
)
|
10,944
|
|
(24,611
|
)
|
8,300
|
|
||||||||
|
Financial derivatives—currency forwards
|
3,500
|
|
1,704
|
|
454
|
|
239
|
|
||||||||
|
Foreign currency translation
|
(2,301
|
)
|
1,959
|
|
918
|
|
(3,104
|
)
|
||||||||
|
(1,188
|
)
|
(5,268
|
)
|
(24,255
|
)
|
(13,747
|
)
|
|||||||||
|
NET REALIZED AND CHANGE IN NET UNREALIZED GAIN (LOSS) ON INVESTMENTS, FINANCIAL DERIVATIVES, AND FOREIGN CURRENCY TRANSACTIONS/TRANSLATION
|
(3,519
|
)
|
(4,507
|
)
|
(38,527
|
)
|
(2,557
|
)
|
||||||||
|
NET INCREASE (DECREASE) IN EQUITY RESULTING FROM OPERATIONS
|
5,002
|
|
13,223
|
|
(18,184
|
)
|
32,640
|
|
||||||||
|
LESS: NET INCREASE IN EQUITY RESULTING FROM OPERATIONS ATTRIBUTABLE TO NON-CONTROLLING INTERESTS
|
17
|
|
71
|
|
31
|
|
227
|
|
||||||||
|
NET INCREASE (DECREASE) IN SHAREHOLDERS' EQUITY RESULTING FROM OPERATIONS
|
$
|
4,985
|
|
$
|
13,152
|
|
$
|
(18,215
|
)
|
$
|
32,413
|
|
||||
|
NET INCREASE (DECREASE) IN SHAREHOLDERS' EQUITY RESULTING FROM OPERATIONS PER SHARE:
|
||||||||||||||||
|
Basic and Diluted
|
$
|
0.15
|
|
$
|
0.39
|
|
$
|
(0.54
|
)
|
$
|
0.96
|
|
||||
See Notes to Consolidated Financial Statements
31
ELLINGTON FINANCIAL LLC
CONSOLIDATED STATEMENT OF CHANGES IN EQUITY
(UNAUDITIED)
|
Six Month Period Ended
June 30, 2016
|
Six Month Period Ended
June 30, 2015
|
|||||||||||||||||||||||
|
Shareholders' Equity
|
Non-controlling Interest
|
Total Equity
|
Shareholders' Equity
|
Non-controlling Interest
|
Total Equity
|
|||||||||||||||||||
|
(In thousands)
|
Expressed in U.S. Dollars
|
|||||||||||||||||||||||
|
BEGINNING EQUITY
(12/31/2015 and 12/31/2014, respectively) |
$
|
732,049
|
|
$
|
6,903
|
|
$
|
738,952
|
|
$
|
782,155
|
|
$
|
6,389
|
|
$
|
788,544
|
|
||||||
|
CHANGE IN EQUITY RESULTING FROM OPERATIONS
|
||||||||||||||||||||||||
|
Net investment income
|
20,343
|
|
35,197
|
|
||||||||||||||||||||
|
Net realized gain (loss) on investments, financial derivatives, and foreign currency transactions
|
(14,272
|
)
|
11,190
|
|
||||||||||||||||||||
|
Change in net unrealized gain (loss) on investments, financial derivatives, and foreign currency translation
|
(24,255
|
)
|
(13,747
|
)
|
||||||||||||||||||||
|
Net increase (decrease) in equity resulting from operations
|
(18,215
|
)
|
31
|
|
(18,184
|
)
|
32,413
|
|
227
|
|
32,640
|
|
||||||||||||
|
CHANGE IN EQUITY RESULTING FROM TRANSACTIONS
|
||||||||||||||||||||||||
|
Contributions from non-controlling interests
|
684
|
|
684
|
|
1,430
|
|
1,430
|
|
||||||||||||||||
|
Dividends
(1)
|
(33,404
|
)
|
(212
|
)
|
(33,616
|
)
|
(44,044
|
)
|
(274
|
)
|
(44,318
|
)
|
||||||||||||
|
Distributions to non-controlling interests
|
(2,228
|
)
|
(2,228
|
)
|
(1,410
|
)
|
(1,410
|
)
|
||||||||||||||||
|
Adjustment to non-controlling interest
|
(9
|
)
|
9
|
|
—
|
|
—
|
|
—
|
|
—
|
|
||||||||||||
|
Shares repurchased
|
(6,624
|
)
|
(6,624
|
)
|
—
|
|
—
|
|
||||||||||||||||
|
Share-based LTIP awards
|
198
|
|
1
|
|
199
|
|
195
|
|
1
|
|
196
|
|
||||||||||||
|
Net increase (decrease) in equity from transactions
|
(39,839
|
)
|
(1,746
|
)
|
(41,585
|
)
|
(43,849
|
)
|
(253
|
)
|
(44,102
|
)
|
||||||||||||
|
Net increase (decrease) in equity
|
(58,054
|
)
|
(1,715
|
)
|
(59,769
|
)
|
(11,436
|
)
|
(26
|
)
|
(11,462
|
)
|
||||||||||||
|
ENDING EQUITY
(6/30/2016 and 6/30/2015, respectively) |
$
|
673,995
|
|
$
|
5,188
|
|
$
|
679,183
|
|
$
|
770,719
|
|
$
|
6,363
|
|
$
|
777,082
|
|
||||||
|
(1)
|
For the six month periods ended June 30, 2016 and 2015, dividends totaling $1.00 and $1.30, respectively, per common share and convertible unit outstanding, were declared and paid.
|
See Notes to Consolidated Financial Statements
32
ELLINGTON FINANCIAL LLC
(UNAUDITED)
|
Six Month Period Ended
June 30, |
|||||||
|
2016
|
2015
|
||||||
|
(In thousands)
|
Expressed in U.S. Dollars
|
||||||
|
INCREASE (DECREASE) IN CASH AND CASH EQUIVALENTS:
|
|||||||
|
NET INCREASE (DECREASE) IN EQUITY RESULTING FROM OPERATIONS
|
$
|
(18,184
|
)
|
$
|
32,640
|
|
|
|
Cash flows provided by (used in) operating activities:
|
|||||||
|
Reconciliation of the net increase (decrease) in equity resulting from operations to net cash provided by (used in) operating activities:
|
|||||||
|
Net realized (gain) loss on investments, financial derivatives, and foreign currency transactions
|
14,322
|
|
(11,150
|
)
|
|||
|
Change in net unrealized (gain) loss on investments and financial derivatives, and foreign currency translation
|
24,894
|
|
12,653
|
|
|||
|
Amortization of premiums and accretion of discounts (net)
|
10,333
|
|
3,715
|
|
|||
|
Purchase of investments
|
(1,299,234
|
)
|
(1,886,733
|
)
|
|||
|
Proceeds from disposition of investments
|
1,264,889
|
|
2,037,393
|
|
|||
|
Proceeds from principal payments of investments
|
120,017
|
|
151,590
|
|
|||
|
Proceeds from investments sold short
|
773,556
|
|
1,502,793
|
|
|||
|
Repurchase of investments sold short
|
(905,408
|
)
|
(1,610,784
|
)
|
|||
|
Payments on financial derivatives
(1)
|
(168,054
|
)
|
(201,600
|
)
|
|||
|
Proceeds from financial derivatives
(1)
|
155,132
|
|
163,764
|
|
|||
|
Share-based LTIP expense
|
199
|
|
196
|
|
|||
|
(Increase) decrease in assets:
|
|||||||
|
Repurchase agreements
|
(10,303
|
)
|
118,213
|
|
|||
|
Receivable for securities sold and financial derivatives
|
168,812
|
|
39,979
|
|
|||
|
Due from brokers
|
(57,520
|
)
|
24,710
|
|
|||
|
Interest and principal receivable
|
1,359
|
|
8,515
|
|
|||
|
Restricted cash
|
952
|
|
—
|
|
|||
|
Other assets
|
2,383
|
|
(1,396
|
)
|
|||
|
Increase (decrease) in liabilities:
|
|||||||
|
Due to brokers
|
(20,082
|
)
|
14,449
|
|
|||
|
Payable for securities purchased and financial derivatives
|
31,799
|
|
(35,547
|
)
|
|||
|
Accounts payable and accrued expenses
|
(571
|
)
|
(105
|
)
|
|||
|
Other liabilities
|
(504
|
)
|
13
|
|
|||
|
Interest and dividends payable
|
717
|
|
(93
|
)
|
|||
|
Base management fee payable
|
(220
|
)
|
(44
|
)
|
|||
|
Net cash provided by (used in) operating activities
|
89,284
|
|
363,171
|
|
|||
See Notes to Consolidated Financial Statements
33
|
ELLINGTON FINANCIAL LLC
|
|||||||
|
CONSOLIDATED STATEMENT OF CASH FLOWS (CONTINUED)
|
|||||||
|
(UNAUDITED)
|
|||||||
|
Six Month Period Ended
June 30, |
|||||||
|
2016
|
2015
|
||||||
|
(In thousands)
|
Expressed in U.S. Dollars
|
||||||
|
Cash flows provided by (used in) financing activities:
|
|||||||
|
Contributions from non-controlling interests
|
$
|
684
|
|
$
|
1,430
|
|
|
|
Shares repurchased
|
(6,624
|
)
|
—
|
|
|||
|
Offering costs paid
|
—
|
|
(30
|
)
|
|||
|
Dividends paid
|
(33,616
|
)
|
(44,318
|
)
|
|||
|
Distributions to non-controlling interests
|
(2,228
|
)
|
(1,410
|
)
|
|||
|
Proceeds from issuance of securitized debt
|
23,238
|
|
—
|
|
|||
|
Principal payments on securitized debt
|
(10,205
|
)
|
(102
|
)
|
|||
|
Borrowings under reverse repurchase agreements
|
3,220,229
|
|
5,388,655
|
|
|||
|
Repayments of reverse repurchase agreements
|
(3,324,313
|
)
|
(5,697,680
|
)
|
|||
|
Net cash provided by (used in) financing activities
|
(132,835
|
)
|
(353,455
|
)
|
|||
|
NET INCREASE (DECREASE) IN CASH AND CASH EQUIVALENTS
|
(43,551
|
)
|
9,716
|
|
|||
|
CASH AND CASH EQUIVALENTS, BEGINNING OF PERIOD
|
183,909
|
|
114,140
|
|
|||
|
CASH AND CASH EQUIVALENTS, END OF PERIOD
|
$
|
140,358
|
|
$
|
123,856
|
|
|
|
Supplemental disclosure of cash flow information:
|
|||||||
|
Interest paid
|
$
|
7,442
|
|
$
|
6,119
|
|
|
|
Share-based LTIP awards (non-cash)
|
$
|
199
|
|
$
|
196
|
|
|
|
Aggregate TBA trade activity (buys + sells) (non-cash)
|
$
|
11,246,156
|
|
$
|
17,246,523
|
|
|
|
(1)
|
Conformed to current period presentation.
|
See Notes to Consolidated Financial Statements
34
ELLINGTON FINANCIAL LLC
NOTES TO CONSOLIDATED FINANCIAL STATEMENTS
June 30, 2016
(UNAUDITED)
1. Organization and Investment Objective
Ellington Financial LLC was formed as a Delaware limited liability company on July 9, 2007 and commenced operations on August 17, 2007. Ellington Financial Operating Partnership LLC (the "Operating Partnership"), a
99.4%
owned consolidated subsidiary of Ellington Financial LLC, was formed as a Delaware limited liability company on December 14, 2012 and commenced operations on January 1, 2013. All of the Company's operations and business activities are conducted through the Operating Partnership. Ellington Financial LLC, the Operating Partnership, and their consolidated subsidiaries are hereafter collectively referred to as the "Company." All intercompany accounts are eliminated in consolidation.
The Company is a specialty finance company that primarily acquires and manages mortgage-related assets, including residential mortgage-backed securities, or "RMBS," residential mortgage loans, commercial mortgage-backed securities, or "CMBS," commercial mortgage loans and other commercial real estate debt, real property, and mortgage-related derivatives. The Company also invests in corporate debt and equity securities, collateralized loan obligations, or "CLOs," consumer loans and asset-backed securities, or "ABS," backed by consumer and commercial assets, non-mortgage-related derivatives and other financial assets, including private debt and equity investments in mortgage-related entities.
Ellington Financial Management LLC ("EFM" or the "Manager") is an SEC-registered investment adviser and a registered commodity pool operator that serves as the Manager to the Company pursuant to the terms of its sixth amended and restated management agreement (the "Management Agreement"). EFM is an affiliate of Ellington Management Group, L.L.C., an investment management firm that is registered as both an investment adviser and a commodity pool operator. In accordance with the terms of the Management Agreement, the Manager implements the investment strategy and manages the business and operations on a day-to-day basis for the Company and performs certain services for the Company, subject to oversight by the Company's Board of Directors ("Board of Directors").
2. Significant Accounting Policies
(A) Basis of Presentation:
The Company's unaudited interim consolidated financial statements have been prepared in conformity with generally accepted accounting principles in the United States of America, or "U.S. GAAP," for investment companies, ASC 946,
Financial Services—Investment Companies
("ASC 946"). The Company has determined that it meets the definition of an investment company under ASC 946
.
ASC 946 requires, among other things, that investments be reported at fair value in the financial statements. Additionally under ASC 946 the Company generally will not consolidate its interest in any company other than in its subsidiaries that qualify as investment companies under ASC 946. The consolidated financial statements include the accounts of the Company, the Operating Partnership, and its subsidiaries. All intercompany balances and transactions have been eliminated. The preparation of consolidated financial statements in conformity with U.S. GAAP requires management to make estimates and assumptions that affect the reported amounts of assets and liabilities at the date of the consolidated financial statements and the reported amounts of revenues and expenses during the reporting period. Actual results could differ from those estimates. In management's opinion, all material adjustments, considered necessary for a fair presentation of the Company's interim consolidated financial statements have been included and are only of a normal recurring nature. Interim results are not necessarily indicative of the results that may be expected for the entire fiscal year. The information included in this Quarterly Report on Form 10-Q should be read in conjunction with the Company's Annual Report on Form 10-K for the year ended December 31, 2015.
(B) Valuation:
The Company applies ASC 820-10,
Fair Value Measurement and Disclosures
("ASC 820-10"), to its holdings of financial instruments. ASC 820-10 establishes a three-level valuation hierarchy for disclosure of fair value measurements. The valuation hierarchy is based upon the observability of inputs to the valuation of an asset or liability as of the measurement date. The three levels are defined as follows:
|
•
|
Level 1—inputs to the valuation methodology are observable and reflect quoted prices (unadjusted) for identical assets or liabilities in active markets. Currently, the types of financial instruments the Company generally includes in this category are listed equities, exchange-traded derivatives, and cash equivalents;
|
|
•
|
Level 2—inputs to the valuation methodology other than quoted prices included in Level 1 are observable for the asset or liability, either directly or indirectly. Currently, the types of financial instruments that the Company generally includes in this category are Agency RMBS, non-Agency mortgage-backed securities determined to have sufficiently observable market data, U.S. Treasury securities and certain sovereign debt, commonly traded derivatives, such as interest rate swaps and foreign currency forwards, and certain other over-the-counter derivatives; and
|
35
|
•
|
Level 3—inputs to the valuation methodology are unobservable and significant to the fair value measurement. The types of financial instruments that the Company generally includes in this category are RMBS, CMBS, ABS, credit default swaps, or "CDS," on individual ABS, distressed corporate debt, and total return swaps on distressed corporate debt, in each case where there is less price transparency. Also included in this category are residential and commercial mortgage loans, consumer loans, non-listed equities, and private corporate debt and equity investments.
|
For certain financial instruments, the various inputs that management uses to measure fair value for such financial instrument may fall into different levels of the fair value hierarchy. In such cases, the determination of which category within the fair value hierarchy is appropriate for such financial instrument is based on the lowest level of input that is significant to the fair value measurement. ASC 820 prioritizes the various inputs that management uses to measure fair value with the highest priority to inputs that are observable and reflect quoted prices (unadjusted) for identical assets or liabilities in active markets (Level 1) and the lowest priority to inputs that are unobservable and significant to the fair value measurement (Level 3). The assessment of the significance of a particular input to the fair value measurement in its entirety requires judgment and considers factors specific to the financial instrument. The Company may use valuation techniques consistent with the market and income approaches to measure the fair value of its assets and liabilities. The market approach uses third-party valuations and information obtained from market transactions involving identical or similar assets or liabilities. The income approach uses projections of the future economic benefit of an instrument to determine its fair value, such as in the discounted cash flow methodology. The inputs or methodology used for valuing financial instruments are not necessarily an indication of the risk associated with investing in these financial instruments. Transfers between levels of the fair value hierarchy are assumed to occur at the end of the reporting period.
Summary Valuation Techniques
For financial instruments that are traded in an "active market," the best measure of fair value is the quoted market price. However, many of the Company's financial instruments are not traded in an active market. Therefore, management generally uses third-party valuations when available. If third-party valuations are not available, management uses other valuation techniques, such as the discounted cash flow methodology. The following are summary descriptions, for various categories of financial instruments, of the valuation methodologies management uses in determining fair value of the Company's financial instruments in such categories. Management utilizes such methodologies to assign a good faith fair value (the estimated price that, in an orderly transaction at the valuation date, would be received to sell an asset, or paid to transfer a liability, as the case may be) to each such financial instrument.
For mortgage-backed securities, or "MBS," including To Be Announced MBS, or "TBAs," CLOs, and distressed and non-distressed corporate debt and equity, management seeks to obtain at least one third-party valuation, and often obtains multiple valuations when available. Management has been able to obtain third-party valuations on the vast majority of these instruments and expects to continue to solicit third-party valuations in the future. Management generally values each financial instrument at the average of third-party valuations received and not rejected as described below. Third-party valuations are not binding, and while management generally does not adjust the valuations it receives, management may challenge or reject a valuation when, based on its validation criteria, management determines that such valuation is unreasonable or erroneous. Furthermore, based on its validation criteria, management may determine that the average of the third-party valuations received for a given instrument does not result in what management believes to be the fair value of such instrument, and in such circumstances management may override this average with its own good faith valuation. The validation criteria may take into account output from management's own models, recent trading activity in the same or similar instruments, and valuations received from third parties. The use of proprietary models requires the use of a significant amount of judgment and the application of various assumptions including, but not limited to, assumptions concerning future prepayment rates and default rates. Valuations for fixed rate MBS pass-throughs issued by a U.S. government agency or government-sponsored enterprise are typically based on observable pay-up data (pay-ups are price premiums for specified categories of fixed rate pools relative to their TBA counterparts) or models that use observable market data, such as interest rates and historical prepayment speeds, and are validated against third-party valuations. Given their relatively high level of price transparency, Agency RMBS pass-throughs are typically designated as Level 2 assets, although Agency interest only and inverse interest only RMBS are currently designated as Level 3 assets since they generally have less price transparency. Non-Agency MBS and CLOs are generally classified as either Level 2 or Level 3 based on analysis of available market data such as recent trades and executable bids. The Company's investments in distressed corporate debt are in the form of loans as well as total return swaps on loans. Valuations are typically based on prices of the underlying loans received from widely used third-party pricing services. These investments as well as related non-listed equity investments are generally designated as Level 3 assets. Furthermore, the methodology used by the third-party valuation providers is reviewed at least annually by management, so as to ascertain whether such providers are utilizing observable market data to determine the valuations that they provide.
For residential and commercial mortgage loans, consumer loans, and real estate owned properties, or "REO," management determines fair value by taking into account both external pricing data, when available, and internal pricing
36
models. Non-performing mortgage loans and REO are typically valued based on management's estimates of the value of the underlying real estate, using various information including general economic data, broker price opinions, or "BPOs," recent sales, property appraisals, and bids. Performing mortgage loans and consumer loans are typically valued using discounted cash flows based on market assumptions and non-QM residential mortgage loans are valued using matrix pricing. Cash flow assumptions typically include projected default and prepayment rates and loss severities, and may include adjustments based on appraisals and BPOs. Mortgage and consumer loans and REO properties are classified as Level 3 assets.
For financial derivatives with greater price transparency, such as CDS on asset-backed indices, CDS on corporate indices, certain options on the foregoing, and total return swaps on publicly-traded equities, market-standard pricing sources are used to obtain valuations; these financial derivatives are generally designated as Level 2 instruments. Interest rate swaps, swaptions, and foreign currency forwards are typically valued based on internal models that use observable market data, including applicable interest rates and foreign currency rates in effect as of the measurement date; the model-generated valuations are then typically compared to counterparty valuations for reasonableness. These financial derivatives are also generally designated as Level 2 instruments. Financial derivatives with less price transparency, such as CDS on individual ABS, are generally valued based on internal models, and are typically designated as Level 3 instruments. In the case of CDS on individual ABS, the valuation process typically starts with an estimation of the value of the underlying ABS. In valuing its derivatives, the Company also considers the creditworthiness of both the Company and its counterparties, along with collateral provisions contained in each derivative agreement.
Investments in private operating entities, such as mortgage originators, are valued based on available metrics, such as relevant market multiples and comparable company valuations, and company specific-financial data including actual and projected results. These investments are designated as Level 3 assets.
The Company's repurchase agreements are carried at fair value based on their contractual amounts as the debt is short-term in nature. The Company's reverse repurchase agreements are carried at cost, which approximates fair value. Repurchase and reverse repurchase agreements are classified as Level 2 assets and liabilities based on the adequacy of the collateral and their short term nature.
The Company's valuation process, including the application of validation criteria, is overseen by the Manager's Valuation Committee ("Valuation Committee"). The Valuation Committee includes senior level executives from various departments within the Manager, and each quarter, the Valuation Committee reviews and approves the valuations of the Company's investments. The valuation process also includes a monthly review by the Company's third-party administrator. The goal of this review is to replicate various aspects of the Company's valuation process based on the Company's documented procedures.
Because of the inherent uncertainty of valuation, the estimated fair value of the Company's financial instruments may differ significantly from the values that would have been used had a ready market for the financial instruments existed, and the differences could be material to the Company's consolidated financial statements.
(C) Purchase and Sales of Investments and Investment Income:
Purchases and sales of investments are generally recorded on trade date, and realized and unrealized gains and losses are calculated based on identified cost. The Company amortizes premiums and accretes discounts on its debt investments. Coupon interest income on fixed income investments is generally accrued based on the outstanding principal balance or notional amount and the current coupon interest rate.
For Agency RMBS and debt securities that are deemed to be of high credit quality at the time of purchase, premiums and discounts are amortized into interest income over the life of such securities using the effective interest method. For securities whose cash flows vary depending on prepayments, an effective yield retroactive to the time of purchase is periodically recomputed based on actual prepayments and changes in projected prepayment activity, and a catch-up adjustment is made to amortization to reflect the cumulative impact of the change in effective yield.
For debt securities (including non-Agency MBS) that are deemed not to be of high credit quality at the time of purchase, interest income is recognized based on the effective interest method. For purposes of determining the effective interest rate, management estimates the future expected cash flows of its investment holdings based on assumptions including, but not limited to, assumptions for future prepayment rates, default rates, and loss severities (each of which may in turn incorporate various macro-economic assumptions, such as future housing prices). These assumptions are re-evaluated not less than quarterly. Principal write-offs are generally treated as realized losses. Changes in projected cash flows, as applied to the current amortized cost of the security, may result in a prospective change in the yield/interest income recognized on such securities.
For each loan purchased with the expectation that both interest and principal will be paid in full, the Company generally amortizes or accretes any premium or discount over the life of the loan utilizing the effective interest method. However, on at least a quarterly basis based on current information and events, the Company re-assesses the collectability of interest and principal, and designates a loan as impaired either when any payments have become
90
or more days past due, or when, in the
37
opinion of management, it is probable that the Company will be unable to collect either interest or principal in full. Once a loan is designated as impaired, as long as principal is still expected to be collectable in full, interest payments are recorded as interest income only when received (i.e., under the cash basis method); accruals of interest income are only resumed when the loan becomes contractually current and performance is demonstrated to be resumed. However, if principal is not expected to be collectable in full, the cost recovery method is used (i.e., no interest income is recognized, and all payments received—whether contractually interest or principal—are applied to cost).
For each loan purchased with evidence of credit deterioration since origination and the expectation that either principal or interest will not be paid in full, interest income is generally recognized using the effective interest method for as long as the cash flows can be reasonably estimated. Here, instead of amortizing the purchase discount (i.e., the excess of the unpaid principal balance over the purchase price) over the life of the loan, the Company effectively amortizes the accretable yield (i.e., the excess of the Company's estimate of the total cash flows to be collected over the life of the loan over the purchase price). Not less than quarterly, the Company updates its estimate of the cash flows expected to be collected over the life of the loan, and revised yields are prospectively applied. To the extent that cash flows cannot be reasonably estimated, these loans are generally accounted for under the cost recovery method.
For certain groups of consumer loans that the Company considers as having sufficiently homogeneous characteristics, the Company aggregates such loans into pools, and accounts for each such pool as a single asset. The pool is then treated analogously to a debt security deemed not to be of high credit quality, in that (i) the aggregate premium or discount for the pool is amortized or accreted into interest income based on the pool's effective interest rate; (ii) the effective interest rate is determined based on the net expected cash flows of the pool, taking into account estimates of prepayments, defaults, and loss severities; and (iii) estimates are updated not less than quarterly and revised yields are prospectively applied.
In estimating future cash flows on the Company's debt investments, there are a number of assumptions that will be subject to significant uncertainties and contingencies, including, in the case of MBS, assumptions relating to prepayment rates, default rates, loan loss severities, and loan repurchases. These estimates require the use of a significant amount of judgment.
The Company receives dividend income on certain of its equity investments and rental income on certain of its REO properties. These items of income are included on the Consolidated Statement of Operations under the heading, "Other income."
(D) Cash and Cash Equivalents:
Cash and cash equivalents include cash and short term investments with original maturities of three months or less at the date of acquisition. Cash and cash equivalents typically include amounts held in an interest bearing overnight account and amounts held in money market funds, and these balances generally exceed insured limits. The Company holds its cash at institutions that it believes to be highly creditworthy. Restricted cash represents cash that the Company can use only for specific purposes. See Note 13 for further discussion of restricted cash balances.
(E) Financial Derivatives:
The Company enters into various types of financial derivatives. The Company's financial derivatives are predominantly subject to bilateral collateral arrangements or clearing in accordance with the Dodd-Frank Wall Street Reform and Consumer Protection Act of 2010. The Company may be required to deliver or receive cash or securities as collateral upon entering into derivative transactions. In addition, changes in the relative value of derivative transactions may require the Company or the counterparty to post or receive additional collateral. In the case of cleared derivatives, the clearinghouse becomes the Company's counterparty and a futures commission merchant acts as an intermediary between the Company and the clearinghouse with respect to all facets of the related transaction, including the posting and receipt of required collateral. Cash collateral received by the Company is reflected on the Consolidated Statement of Assets, Liabilities, and Equity as "Due to Brokers." Conversely, cash collateral posted by the Company is reflected as "Due from Brokers" on the Consolidated Statement of Assets, Liabilities, and Equity. The major types of derivatives utilized by the Company are swaps, futures, options, and forwards.
Swaps:
The Company may enter into various types of swaps, including interest rate swaps, credit default swaps, and total return swaps. The primary risk associated with the Company's interest rate swap activity is interest rate risk. The primary risk associated with the Company's credit default swaps is credit risk and the primary risks associated with the Company's total return swap activity are equity market risk and credit risk.
The Company is subject to interest rate risk exposure in the normal course of pursuing its investment objectives. Primarily to help mitigate interest rate risk, the Company enters into interest rate swaps. Interest rate swaps are contractual agreements whereby one party pays a floating interest rate on a notional principal amount and receives a fixed rate payment on the same notional principal, or vice versa, for a fixed period of time. Interest rate swaps change in value with movements in interest rates.
38
The Company enters into credit default swaps. A credit default swap is a contract under which one party agrees to compensate another party for the financial loss associated with the occurrence of a "credit event" in relation to a "reference amount" or notional value of a credit obligation (usually a bond, loan, or a basket of bonds or loans). The definition of a credit event may vary from contract to contract. A credit event may occur (i) when the underlying reference asset(s) fails to make scheduled principal or interest payments to its holders, (ii) with respect to credit default swaps referencing mortgage/asset-backed securities and indices, when the underlying reference obligation is downgraded below a certain rating level, or (iii) with respect to credit default swaps referencing corporate entities and indices, upon the bankruptcy of the underlying reference obligor. The Company typically writes (sells) protection to take a "long" position or purchases (buys) protection to take a "short" position with respect to underlying reference assets or to hedge exposure to other investment holdings.
The Company enters into total return swaps in order to take a "long" or "short" position with respect to an underlying reference asset. The Company is subject to market price volatility of the underlying reference asset. A total return swap involves commitments to pay interest in exchange for a market-linked return based on a notional value. To the extent that the total return of the corporate debt, security, group of securities or index underlying the transaction exceeds or falls short of the offsetting interest obligation, the Company will receive a payment from or make a payment to the counterparty.
Swaps change in value with movements in interest rates, credit quality, or total return of the reference securities. During the term of swap contracts, changes in value are recognized as unrealized gains or losses. When a contract is terminated, the Company realizes a gain or loss equal to the difference between the proceeds from (or cost of) the closing transaction and the Company's basis in the contract, if any. Periodic payments or receipts required by swap agreements are recorded as unrealized gains or losses when accrued and realized gains or losses when received or paid. Upfront payments paid and/or received by the Company to open swap contracts are recorded as an asset and/or liability on the Consolidated Statement of Assets, Liabilities, and Equity and are recorded as a realized gain or loss on the termination date.
Futures Contracts:
A futures contract is an exchange-traded agreement to buy or sell an asset for a set price on a future date. The Company enters into Eurodollar and/or U.S. Treasury security futures contracts to hedge its interest rate risk. The Company may also enter into various other futures contracts, including equity index futures. Initial margin deposits are made upon entering into futures contracts and can generally be either in the form of cash or securities. During the period the futures contract is open, changes in the value of the contract are recognized as unrealized gains or losses by marking-to-market to reflect the current market value of the contract. Variation margin payments are made or received periodically, depending upon whether unrealized losses or gains are incurred. When the contract is closed, the Company records a realized gain or loss equal to the difference between the proceeds of the closing transaction and the Company's basis in the contract.
Options:
The Company may purchase or write put or call options contracts or enter into swaptions. The Company enters into options contracts typically to help mitigate overall market, credit, or interest rate risk depending on the type of options contract. However, the Company also enters into options contracts from time to time for speculative purposes. When the Company purchases an options contract, the option asset is initially recorded at an amount equal to the premium paid, if any, and is subsequently marked-to-market. Premiums paid for purchasing options contracts that expire unexercised are recognized on the expiration date as realized losses. If an options contract is exercised, the premium paid is subtracted from the proceeds of the sale or added to the cost of the purchase to determine whether the Company has realized a gain or loss on the related transaction. When the Company writes an options contract, the option liability is initially recorded at an amount equal to the premium received, if any, and is subsequently marked-to-market. Premiums received for writing options contracts that expire unexercised are recognized on the expiration date as realized gains. If an options contract is exercised, the premium received is subtracted from the cost of the purchase or added to the proceeds of the sale to determine whether the Company has realized a gain or loss on the related investment transaction. When the Company enters into a closing transaction, the Company will realize a gain or loss depending upon whether the amount from the closing transaction is greater or less than the premiums paid or received. The Company may also enter into options contracts that contain forward-settling premiums. In this case, no money is exchanged upfront. Instead the agreed-upon premium is paid by the buyer upon expiration of the option, regardless of whether or not the option is exercised.
Forward Currency Contracts:
A forward currency contract is an agreement between two parties to purchase or sell a specific quantity of currency with the delivery and settlement at a specific future date and exchange rate. During the period the forward currency contract is open, changes in the value of the contract are recognized as unrealized gains or losses. When the contract is settled, the Company records a realized gain or loss equal to the difference between the proceeds of the closing transaction and the Company's basis in the contract.
Commitments to Purchase Residential Mortgage Loans:
The Company enters into forward purchase commitments under flow agreements, whereby the Company commits to purchasing the loans based on pre-defined underwriting guidelines and at stated interest rates. Actual loan purchases are contingent upon successful loan closings. These commitments to purchase mortgage loans are classified as derivatives on the Company's Consolidated Statement of Assets, Liabilities, and Equity and
39
are, therefore, recorded as assets or liabilities measured at fair value. Until the purchase commitment expires or the underlying loan closes, changes in the estimated fair value of such commitments are recognized as unrealized gains or losses in the Consolidated Statement of Operations.
Financial derivatives disclosed on the Consolidated Condensed Schedule of Investments include: credit default swaps on asset-backed securities, credit default swaps on asset-backed indices, credit default swaps on corporate bond indices, credit default swaps on corporate bonds, interest rate swaps, total return swaps, futures contracts, foreign currency forwards, options contracts, warrants, and mortgage loan purchase commitments.
Financial derivative assets are included in Financial derivatives—assets, at fair value on the Consolidated Statement of Assets, Liabilities, and Equity. Financial derivative liabilities are included in Financial derivatives—liabilities, at fair value on the Consolidated Statement of Assets, Liabilities, and Equity. In addition, financial derivative contracts are summarized by type on the Consolidated Condensed Schedule of Investments.
(F) Investments Sold Short:
When the Company sells securities short, it typically satisfies its security delivery settlement obligation by obtaining the security sold short from the same or a different counterparty. The Company generally is required to deliver cash or securities as collateral to the counterparty for the Company's obligation to return the borrowed security. The amount by which the market value of the obligation falls short of or exceeds the proceeds from the short sale is treated as an unrealized gain or loss, respectively. A realized gain or loss will be recognized upon the termination of a short sale if the market price is less or greater than the proceeds originally received.
(G) Reverse Repurchase Agreements:
The Company enters into reverse repurchase agreements with third-party broker-dealers whereby it sells securities under agreements to be repurchased at an agreed-upon price and date. The Company accounts for reverse repurchase agreements as collateralized borrowings, with the initial sale price representing the amount borrowed, and with the future repurchase price consisting of the amount borrowed plus interest, at the implied interest rate of the reverse repurchase agreement, on the amount borrowed over the term of the reverse repurchase agreement. The interest rate on a reverse repurchase agreement is based on competitive rates (or competitive market spreads, in the case of agreements with floating interest rates) at the time such agreement is entered into. When the Company enters into a reverse repurchase agreement, the lender establishes and maintains an account containing cash and/or securities having a value not less than the repurchase price, including accrued interest, of the reverse repurchase agreement. Reverse repurchase agreements are carried at their contractual amounts, which approximate fair value as the debt is short-term in nature.
(H) Repurchase Agreements:
The Company enters into repurchase agreement transactions with third-party broker-dealers whereby it purchases securities under agreements to resell at an agreed-upon price and date. In general, securities received pursuant to repurchase agreements are delivered to counterparties of short sale transactions. The interest rate on a repurchase agreement is based on competitive rates (or competitive market spreads, in the case of agreements with floating interest rates) at the time such agreement is entered into. Assets held pursuant to repurchase agreements are reflected as assets on the Consolidated Statement of Assets, Liabilities, and Equity. Repurchase agreements are carried at fair value based on their contractual amounts as the debt is short-term in nature.
Repurchase and reverse repurchase agreements that are conducted with the same counterparty may be reported on a net basis if they meet the requirements of ASC 210-20,
Balance Sheet Offsetting
.
(I) Securitized Debt:
The Company entered into a securitization transaction in March 2016 to finance certain of its commercial mortgage loans and REO which was accounted for as a collateralized borrowing. The assets contributed to the securitization were not derecognized but rather, the liability issued by the securitization was recorded to reflect the financing of the securitized assets. Debt issuance costs associated with the securitized debt are amortized over the life of the securitized debt and included in interest expense.
(J) When-Issued/Delayed Delivery Securities:
The Company may purchase or sell securities on a when-issued or delayed delivery basis. Securities purchased or sold on a when-issued basis are traded for delivery beyond the normal settlement date at a stated price or yield, and no income accrues to the purchaser prior to settlement. Purchasing or selling securities on a when-issued or delayed delivery basis involves the risk that the market price or yield at the time of settlement may be lower or higher than the agreed-upon price or yield, in which case a realized loss may be incurred.
The Company transacts in the forward settling TBA market. The Company typically does not take delivery of TBAs, but rather settles the associated receivable and payable with its trading counterparties on a net basis. Transactions with the same counterparty for the same TBA that result in a reduction of the position are treated as extinguished. The market value of the securities that the Company is required to purchase pursuant to a TBA transaction may decline below the agreed-upon purchase price. Conversely, the market value of the securities that the Company is required to sell pursuant to a TBA transaction may increase above the agreed upon sale price. As part of its TBA activities, the Company may "roll" its TBA positions, whereby
40
the Company may sell (buy) securities for delivery (receipt) in an earlier month and simultaneously contract to repurchase (sell) similar, but not identical, securities at an agreed-upon price on a fixed date in a later month (with the later-month price typically lower than the earlier-month price). The Company accounts for its TBA transactions (including those related to TBA rolls) as purchases and sales.
(K) REO:
When the Company obtains possession of real property in connection with a foreclosure or similar action, the Company de-recognizes the associated mortgage loan according to ASU 2014-04,
Reclassification of Residential Real Estate Collateralized Consumer Mortgage Loans upon Foreclosure
("ASU 2014-04"). Under the provisions of ASU 2014-04, the Company is deemed to have received physical possession of real estate property collateralizing a mortgage loan when it obtains legal title to the property upon completion of a foreclosure or when the borrower conveys all interest in the property to it through a deed in lieu of foreclosure or similar legal agreement. The Company holds all REO at fair value.
(L) Investments in Operating Entities:
The Company has made and may in the future make non-controlling investments in operating entities such as mortgage originators. Investments in such operating entities may be in the form of preferred and/or common equity, debt, or some other form of investment. The Company carries its investments in such entities at fair value. The impact of these investments and their results of operations are immaterial to the Company's financial condition and results of operations. In such cases the Company has applied the equity method of accounting to such equity investments and has elected to fair value such investments under the fair value option within ASC 825.
(M) Offering Costs/Underwriters' Discount:
Offering costs and underwriters' discount are charged against shareholders' equity. Offering costs typically include legal, accounting, printing, and other fees associated with the cost of raising capital.
(N) Expenses:
Expenses are recognized as incurred on the Consolidated Statement of Operations.
(O) Other Investment Related Expenses:
Other investment related expenses consist of expenses directly related to specific financial instruments. Such expenses generally include dividend expense on common stock sold short, servicing fees and corporate and escrow advances on mortgage and consumer loans, and various other expenses and fees related directly to the Company's financial instruments. Other investment related expenses are generally recognized as incurred on the Consolidated Statement of Operations; dividend expense on common stock sold short is recognized on the ex-dividend date.
(P) LTIP Units:
Long term incentive plan units ("LTIP units") have been issued to the Company's dedicated or partially dedicated personnel and independent directors as well as the Manager. Costs associated with LTIP units issued to dedicated or partially dedicated personnel, or to independent directors, are measured as of the grant date based on the closing stock price on the New York Stock Exchange and are amortized over the vesting period in accordance with ASC 718-10,
Compensation—Stock Compensation
. The vesting periods for LTIP units issued under the Ellington Incentive Plan for Individuals (the "Individual LTIP") are typically
one year
for independent directors, and are typically
one year
to
two
years for dedicated or partially dedicated personnel.
(Q)
Non-controlling interests
: Non-controlling interests include the interest in the Operating Partnership owned by an affiliate of the Manager and certain related parties and consist of units convertible into the Company's common shares. Non-controlling interests also include the interests of joint venture partners in certain of our consolidated subsidiaries. The joint venture partners' interests do not consist of units convertible into the Company's common shares. The Company adjusts the non-controlling interests owned by an affiliate of the Manager and certain related parties to align their carrying value with the share of total outstanding operating partnership units ("OP Units") issued by the Operating Partnership to the non-controlling interest. Any such adjustments are reflected in "Adjustment to non-controlling interest" on the Consolidated Statement of Changes in Equity. See Note 9 for further discussion of non-controlling interests.
(R) Dividends:
Dividends payable by the Company are recorded on the ex-dividend date. Dividends are typically declared and paid on a quarterly basis in arrears.
(S) Shares Repurchased:
Common shares that are repurchased by the Company subsequent to issuance are immediately retired upon settlement and decrease the total number of shares outstanding and issued.
(T) Earnings Per Share ("EPS"):
Basic EPS is computed using the two class method by dividing net increase (decrease) in shareholders' equity resulting from operations after adjusting for the impact of LTIP units which are participating securities, by the weighted average number of common shares outstanding calculated including LTIP units. Because the Company's LTIP units are participating securities, they are included in the calculation of basic and diluted EPS. OP Units relating to a non-controlling interest are also participating securities and, accordingly, are included in the calculation of both basic and diluted EPS.
41
(U) Foreign Currency:
Assets and liabilities denominated in foreign currencies are translated into U.S. dollars at current exchange rates at the following dates: (i) assets, liabilities, and unrealized gains/losses—at the valuation date; and (ii) income, expenses, and realized gains/losses—at the accrual/transaction date. The Company isolates the portion of realized and change in unrealized gain (loss) resulting from changes in foreign currency exchange rates on investments and financial derivatives from the fluctuations arising from changes in fair value of investments and financial derivatives held. Changes in realized and change in unrealized gain (loss) due to foreign currency are included in Foreign currency transactions and Foreign currency translation, respectively, on the Consolidated Statement of Operations.
(V) Income Taxes:
The Company has been and continues to expect to be treated as a partnership for U.S. federal income tax purposes. Certain of the Company's subsidiaries are not consolidated for U.S. federal income tax purposes, but are also treated as partnerships. In general, partnerships are not subject to entity-level tax on their income, but the income of a partnership is taxable to its owners on a flow-through basis. In addition, certain subsidiaries of the Company have elected to be treated as corporations for U.S. federal income tax purposes, and one intends to elect to be taxed as a real estate investment trust, or "REIT", beginning with the tax year ending December 31, 2015. Upon this entity's filing of its 2015 tax return in the fall of 2016, it will formally make the election to be taxed as a REIT.
The Company follows the provisions of ASC 740-10,
Income Taxes
("ASC 740-10"), which requires management to determine whether a tax position of the Company is more likely than not to be sustained upon examination by the applicable taxing authority, including resolution of any related appeals, based on the technical merits of the position. The Company did not have any additions to unrecognized tax benefits resulting from tax positions related either to the current period or to 2015, 2014, 2013, or 2012 (its open tax years), and no reductions resulting from tax positions of prior years or due to settlements, and thus had no unrecognized tax benefits or reductions since inception. The Company does not expect any change in unrecognized tax benefits within the next fiscal year. There were no amounts accrued for tax penalties or interest as of or during the periods presented in these consolidated financial statements.
The Company may take positions with respect to certain tax issues which depend on legal interpretation of facts or applicable tax regulations. Should the relevant tax regulators successfully challenge any of such positions, the Company might be found to have a tax liability that has not been recorded in the accompanying consolidated financial statements. Also, management's conclusions regarding ASC 740-10 may be subject to review and adjustment at a later date based on factors including, but not limited to, further implementation guidance from the Financial Accounting Standards Board, or "FASB," and ongoing analyses of tax laws, regulations and interpretations thereof.
(W) Recent Accounting Pronouncements:
In August 2014, the FASB issued ASU 2014-15,
Disclosure of Uncertainties about an Entity's Ability to Continue as a Going Concern
("ASU 2014-15"). ASU 2014-15 requires management to perform interim and annual assessments of an entity's ability to continue as a going concern and to provide disclosure if events or conditions arise that would place substantial doubt on the entity's ability to continue as a going concern. ASU 2014-15 is effective for the annual period ending after December 15, 2016, and subsequent interim and annual periods with early adoption permitted. The adoption of ASU 2014-15 is not expected to have a material impact on the Company's consolidated financial statements.
In February 2015, the FASB issued ASU 2015-02,
Amendments to the Consolidation Analysis
("ASU 2015-02"). This amends ASC 810,
Consolidation
(ASC "810"), to improve targeted areas of consolidation guidance by simplifying the requirements of consolidation and placing more emphasis on risk of loss when determining a controlling financial interest. ASU 2015-02 is effective for annual and interim periods beginning after December 15, 2015, with early adoption permitted. The adoption of ASU 2015-02 did not have a material impact on the Company's consolidated financial statements.
42
3. Valuation
The table below reflects the value of the Company's Level 1, Level 2, and Level 3 financial instruments at
June 30, 2016
:
|
Description
|
Level 1
|
Level 2
|
Level 3
|
Total
|
||||||||||||
|
Assets:
|
(In thousands)
|
|||||||||||||||
|
Cash equivalents
|
$
|
50,000
|
|
$
|
—
|
|
$
|
—
|
|
$
|
50,000
|
|
||||
|
Investments, at fair value-
|
||||||||||||||||
|
Agency residential mortgage-backed securities
|
$
|
—
|
|
$
|
990,828
|
|
$
|
20,506
|
|
$
|
1,011,334
|
|
||||
|
U.S. Treasury securities
|
—
|
|
374
|
|
—
|
|
374
|
|
||||||||
|
Private label residential mortgage-backed securities
|
—
|
|
78,831
|
|
112,511
|
|
191,342
|
|
||||||||
|
Private label commercial mortgage-backed securities
|
—
|
|
—
|
|
34,942
|
|
34,942
|
|
||||||||
|
Commercial mortgage loans
|
—
|
|
—
|
|
49,466
|
|
49,466
|
|
||||||||
|
Residential mortgage loans
|
—
|
|
—
|
|
46,649
|
|
46,649
|
|
||||||||
|
Collateralized loan obligations
|
—
|
|
—
|
|
33,109
|
|
33,109
|
|
||||||||
|
Consumer loans and asset-backed securities backed by consumer loans
|
—
|
|
—
|
|
154,395
|
|
154,395
|
|
||||||||
|
Corporate debt
|
—
|
|
—
|
|
36,974
|
|
36,974
|
|
||||||||
|
Real estate owned
|
—
|
|
—
|
|
4,162
|
|
4,162
|
|
||||||||
|
Private corporate equity investments
|
—
|
|
—
|
|
19,418
|
|
19,418
|
|
||||||||
|
Total investments, at fair value
|
—
|
|
1,070,033
|
|
512,132
|
|
1,582,165
|
|
||||||||
|
Financial derivatives–assets, at fair value-
|
||||||||||||||||
|
Credit default swaps on asset-backed securities
|
—
|
|
—
|
|
6,068
|
|
6,068
|
|
||||||||
|
Credit default swaps on corporate bond indices
|
—
|
|
104,911
|
|
—
|
|
104,911
|
|
||||||||
|
Credit default swaps on corporate bonds
|
—
|
|
583
|
|
—
|
|
583
|
|
||||||||
|
Credit default swaps on asset-backed indices
|
—
|
|
24,616
|
|
—
|
|
24,616
|
|
||||||||
|
Interest rate swaps
|
—
|
|
13,931
|
|
—
|
|
13,931
|
|
||||||||
|
Total return swaps
|
—
|
|
—
|
|
824
|
|
824
|
|
||||||||
|
Options
|
—
|
|
1
|
|
—
|
|
1
|
|
||||||||
|
Forwards
|
—
|
|
1,578
|
|
—
|
|
1,578
|
|
||||||||
|
Futures
|
8
|
|
—
|
|
—
|
|
8
|
|
||||||||
|
Warrants
|
—
|
|
—
|
|
100
|
|
100
|
|
||||||||
|
Mortgage loan purchase commitments
|
—
|
|
8
|
|
—
|
|
8
|
|
||||||||
|
Total financial derivatives–assets, at fair value
|
8
|
|
145,628
|
|
6,992
|
|
152,628
|
|
||||||||
|
Repurchase agreements
|
—
|
|
116,003
|
|
—
|
|
116,003
|
|
||||||||
|
Total investments and financial derivatives–assets, at fair value and repurchase agreements
|
$
|
8
|
|
$
|
1,331,664
|
|
$
|
519,124
|
|
$
|
1,850,796
|
|
||||
|
Liabilities:
|
||||||||||||||||
|
Investments sold short, at fair value-
|
||||||||||||||||
|
Agency residential mortgage-backed securities
|
$
|
—
|
|
$
|
(488,151
|
)
|
$
|
—
|
|
$
|
(488,151
|
)
|
||||
|
Government debt
|
—
|
|
(87,326
|
)
|
—
|
|
(87,326
|
)
|
||||||||
|
Corporate debt
|
—
|
|
—
|
|
(9,947
|
)
|
(9,947
|
)
|
||||||||
|
Common stock
|
(30,913
|
)
|
—
|
|
—
|
|
(30,913
|
)
|
||||||||
|
Total investments sold short, at fair value
|
(30,913
|
)
|
(575,477
|
)
|
(9,947
|
)
|
(616,337
|
)
|
||||||||
|
Financial derivatives–liabilities, at fair value-
|
||||||||||||||||
|
Credit default swaps on corporate bond indices
|
—
|
|
(39,797
|
)
|
—
|
|
(39,797
|
)
|
||||||||
|
Credit default swaps on corporate bonds
|
—
|
|
(3,722
|
)
|
—
|
|
(3,722
|
)
|
||||||||
|
Credit default swaps on asset-backed indices
|
—
|
|
(5,868
|
)
|
—
|
|
(5,868
|
)
|
||||||||
|
Credit default swaps on asset-backed securities
|
—
|
|
—
|
|
(234
|
)
|
(234
|
)
|
||||||||
43
|
Description
|
Level 1
|
Level 2
|
Level 3
|
Total
|
||||||||||||
|
(continued)
|
(In thousands)
|
|||||||||||||||
|
Interest rate swaps
|
$
|
—
|
|
$
|
(22,858
|
)
|
$
|
—
|
|
$
|
(22,858
|
)
|
||||
|
Total return swaps
|
—
|
|
(2
|
)
|
(1,016
|
)
|
(1,018
|
)
|
||||||||
|
Options
|
—
|
|
(243
|
)
|
—
|
|
(243
|
)
|
||||||||
|
Futures
|
(358
|
)
|
—
|
|
—
|
|
(358
|
)
|
||||||||
|
Total financial derivatives–liabilities, at fair value
|
(358
|
)
|
(72,490
|
)
|
(1,250
|
)
|
(74,098
|
)
|
||||||||
|
Guarantees
(1)
|
—
|
|
—
|
|
(312
|
)
|
(312
|
)
|
||||||||
|
Total investments sold short, financial derivatives–liabilities, and guarantees, at fair value
|
$
|
(31,271
|
)
|
$
|
(647,967
|
)
|
$
|
(11,509
|
)
|
$
|
(690,747
|
)
|
||||
|
(1)
|
Included in Other liabilities on the Consolidated Statement of Assets, Liabilities, and Equity.
|
There were
no
transfers of financial instruments between Level 1 and Level 2 during the six month period ended
June 30, 2016
.
The following table identifies the significant unobservable inputs that affect the valuation of the Company's Level 3 assets and liabilities as of
June 30, 2016
:
|
Fair Value
|
Valuation
Technique
|
Unobservable Input
|
Range
|
Weighted
Average
|
|||||||||||||||
|
Description
|
Min
|
Max
|
|||||||||||||||||
|
(In thousands)
|
|||||||||||||||||||
|
Private label residential mortgage-backed securities
|
$
|
74,172
|
|
Market Quotes
|
Non Binding Third-Party Valuation
|
$
|
2.03
|
|
$
|
181.56
|
|
$
|
69.18
|
|
|||||
|
Collateralized loan obligations
|
28,262
|
|
Market Quotes
|
Non Binding Third-Party Valuation
|
23.00
|
|
101.75
|
|
80.78
|
|
|||||||||
|
Corporate debt and non-exchange traded corporate equity
|
27,576
|
|
Market Quotes
|
Non Binding Third-Party Valuation
|
2.86
|
|
112.64
|
|
78.18
|
|
|||||||||
|
Private label commercial mortgage-backed securities
|
16,454
|
|
Market Quotes
|
Non Binding Third-Party Valuation
|
5.32
|
|
69.06
|
|
35.30
|
|
|||||||||
|
Agency interest only residential mortgage-backed securities
|
16,993
|
|
Market Quotes
|
Non Binding Third-Party Valuation
|
2.72
|
|
23.01
|
|
9.83
|
|
|||||||||
|
Total return swaps
|
(192
|
)
|
Market Quotes
|
Non Binding Third-Party Valuation
(1)
|
13.61
|
|
98.00
|
|
90.45
|
|
|||||||||
|
Private label residential mortgage-backed securities
|
38,339
|
|
Discounted Cash Flows
|
Yield
|
3.1
|
%
|
14.6
|
%
|
10.9
|
%
|
|||||||||
|
Projected Collateral Prepayments
|
0.0
|
%
|
74.7
|
%
|
12.3
|
%
|
|||||||||||||
|
Projected Collateral Losses
|
1.3
|
%
|
48.7
|
%
|
34.9
|
%
|
|||||||||||||
|
Projected Collateral Recoveries
|
0.0
|
%
|
53.1
|
%
|
35.9
|
%
|
|||||||||||||
|
Projected Collateral Scheduled Amortization
|
0.0
|
%
|
85.6
|
%
|
16.9
|
%
|
|||||||||||||
|
100.0
|
%
|
||||||||||||||||||
|
Private label commercial mortgage-backed securities
|
18,488
|
|
Discounted Cash Flows
|
Yield
|
11.6
|
%
|
32.8
|
%
|
22.9
|
%
|
|||||||||
|
Projected Collateral Losses
|
0.8
|
%
|
3.6
|
%
|
1.8
|
%
|
|||||||||||||
|
Projected Collateral Recoveries
|
4.4
|
%
|
15.0
|
%
|
7.3
|
%
|
|||||||||||||
|
Projected Collateral Scheduled Amortization
|
83.1
|
%
|
94.8
|
%
|
90.9
|
%
|
|||||||||||||
|
100.0
|
%
|
||||||||||||||||||
|
Corporate debt and warrants
|
10,444
|
|
Discounted Cash Flows
|
Yield
|
0.0
|
%
|
16.9
|
%
|
16.3
|
%
|
|||||||||
44
|
(continued)
|
Fair Value
|
Valuation
Technique
|
Unobservable Input
|
Range
|
Weighted
Average
|
||||||||||||||
|
Description
|
Min
|
Max
|
|||||||||||||||||
|
(In thousands)
|
|||||||||||||||||||
|
Collateralized loan obligations
|
$
|
4,847
|
|
Discounted Cash Flows
|
Yield
|
10.1
|
%
|
42.3
|
%
|
17.1
|
%
|
||||||||
|
Projected Collateral Prepayments
|
41.0
|
%
|
62.2
|
%
|
55.5
|
%
|
|||||||||||||
|
Projected Collateral Losses
|
2.6
|
%
|
12.1
|
%
|
6.5
|
%
|
|||||||||||||
|
Projected Collateral Recoveries
|
1.4
|
%
|
6.5
|
%
|
4.0
|
%
|
|||||||||||||
|
Projected Collateral Scheduled Amortization
|
30.0
|
%
|
51.4
|
%
|
34.0
|
%
|
|||||||||||||
|
100.0
|
%
|
||||||||||||||||||
|
Consumer loans and asset-backed securities backed by consumer loans
|
154,395
|
|
Discounted Cash Flows
|
Yield
|
9.0
|
%
|
25.0
|
%
|
10.3
|
%
|
|||||||||
|
Projected Collateral Prepayments
|
0.0
|
%
|
45.6
|
%
|
39.1
|
%
|
|||||||||||||
|
Projected Collateral Losses
|
0.9
|
%
|
96.9
|
%
|
7.9
|
%
|
|||||||||||||
|
Projected Collateral Scheduled Amortization
|
0.0
|
%
|
83.9
|
%
|
53.0
|
%
|
|||||||||||||
|
100.0
|
%
|
||||||||||||||||||
|
Performing commercial mortgage loans
|
25,795
|
|
Discounted Cash Flows
|
Yield
|
10.4
|
%
|
17.9
|
%
|
11.8
|
%
|
|||||||||
|
Non-performing commercial mortgage loans
|
23,671
|
|
Discounted Cash Flows
|
Yield
|
10.2
|
%
|
18.4
|
%
|
14.2
|
%
|
|||||||||
|
Months to Resolution
|
6.0
|
|
39.0
|
|
20.8
|
|
|||||||||||||
|
Performing residential mortgage loans
|
41,324
|
|
Discounted Cash Flows
|
Yield
|
5.0
|
%
|
13.1
|
%
|
6.5
|
%
|
|||||||||
|
Non-performing residential mortgage loans and residential real estate owned
|
7,646
|
|
Discounted Cash Flows
|
Yield
|
5.7
|
%
|
60.6
|
%
|
10.4
|
%
|
|||||||||
|
Months to Resolution
|
1.9
|
|
112.9
|
|
25.9
|
|
|||||||||||||
|
Credit default swaps on asset-backed securities
|
5,834
|
|
Net Discounted Cash Flows
|
Projected Collateral Prepayments
|
27.4
|
%
|
40.2
|
%
|
34.0
|
%
|
|||||||||
|
Projected Collateral Losses
|
17.7
|
%
|
33.2
|
%
|
26.6
|
%
|
|||||||||||||
|
Projected Collateral Recoveries
|
7.1
|
%
|
14.1
|
%
|
10.8
|
%
|
|||||||||||||
|
Projected Collateral Scheduled Amortization
|
23.4
|
%
|
32.2
|
%
|
28.6
|
%
|
|||||||||||||
|
100.0
|
%
|
||||||||||||||||||
|
Non-exchange traded equity investments in commercial mortgage-related private partnerships
|
2,972
|
|
Discounted Cash Flows
|
Yield
|
16.5
|
%
|
16.5
|
%
|
16.5
|
%
|
|||||||||
|
Expected Holding Period (Months)
|
8.7
|
|
8.7
|
|
8.7
|
|
|||||||||||||
|
Agency interest only residential mortgage-backed securities
|
3,513
|
|
Option Adjusted Spread ("OAS")
|
LIBOR OAS
(2)
|
118
|
|
1,818
|
|
468
|
|
|||||||||
|
Projected Collateral Prepayments
|
20.4
|
%
|
100.0
|
%
|
69.6
|
%
|
|||||||||||||
|
Projected Collateral Scheduled Amortization
|
0.0
|
%
|
79.6
|
%
|
30.4
|
%
|
|||||||||||||
|
100.0
|
%
|
||||||||||||||||||
|
Non-exchange traded preferred and common equity investment in mortgage-related entities
|
3,053
|
|
Enterprise Value
|
Equity Multiple
(3)
|
2.3x
|
2.3x
|
2.3x
|
||||||||||||
|
Commercial real estate owned
|
1,841
|
|
Recent Transactions
|
Contract Price
|
96.77
|
96.77
|
96.77
|
||||||||||||
|
Non-exchange traded preferred and common equity investment in mortgage-related entities
|
2,500
|
|
Recent Transactions
|
Transaction Price
|
N/A
|
N/A
|
N/A
|
||||||||||||
|
Guarantees
|
(312
|
)
|
Cash Flows
|
Expected Cash Flows
(4)
|
N/A
|
N/A
|
N/A
|
||||||||||||
|
(1)
|
Represents valuations on underlying assets.
|
|
(2)
|
Shown in basis points.
|
45
|
(3)
|
Represent an estimation of where market participants might value an enterprise.
|
|
(4)
|
Represents transactions with a remaining term of less than one year.
|
Third-party non-binding valuations are validated by comparing such valuations to internally generated prices based on the Company's models and to recent trading activity in the same or similar instruments.
For those instruments valued using discounted and net discounted cash flows, collateral prepayments, losses, recoveries, and scheduled amortization are projected over the remaining life of the collateral and expressed as a percentage of the collateral's current principal balance. Averages are weighted based on the fair value of the related instrument. In the case of credit default swaps on asset-backed securities, averages are weighted based on each instrument's bond equivalent value. Bond equivalent value represents the investment amount of a corresponding position in the reference obligation, calculated as the difference between the outstanding principal balance of the underlying reference obligation and the fair value, inclusive of accrued interest, of the derivative contract. For those assets valued using the LIBOR Option Adjusted Spread ("OAS") valuation methodology, cash flows are projected using the Company's models over multiple interest rate scenarios, and these projected cash flows are then discounted using the LIBOR rates implied by each interest rate scenario. The LIBOR OAS of an asset is then computed as the unique constant yield spread that, when added to all LIBOR rates in each interest rate scenario generated by the model, will equate (a) the expected present value of the projected asset cash flows over all model scenarios to (b) the actual current market price of the asset. LIBOR OAS is therefore model-dependent. Generally speaking, LIBOR OAS measures the additional yield spread over LIBOR that an asset provides at its current market price after taking into account any interest rate options embedded in the asset. The Company considers the expected timeline to resolution in the determination of fair value for its non-performing commercial and residential loans.
Material changes in any of the inputs above in isolation could result in a significant change to reported fair value measurements. Additionally, fair value measurements are impacted by the interrelationships of these inputs. For example, for instruments subject to prepayments and credit losses, such as non-Agency RMBS and consumer loans and ABS backed by consumer loans, a higher expectation of collateral prepayments will generally be accompanied by a lower expectation of collateral losses. Conversely, higher losses will generally be accompanied by lower prepayments. Because the Company's credit default swaps on asset-backed security holdings represent credit default swap contracts whereby the Company has purchased credit protection, such credit default swaps on asset-backed securities generally have the directionally opposite sensitivity to prepayments, losses, and recoveries as compared to the Company's long securities holdings. Prepayments do not represent a significant input for the Company's commercial mortgage-backed securities and commercial mortgage loans. Losses and recoveries do not represent a significant input for the Company's Agency RMBS interest only securities, given the guarantee of the issuing government agency or government-sponsored enterprise.
The table below reflects the value of the Company's Level 1, Level 2, and Level 3 financial instruments at
December 31, 2015
:
|
Description
|
Level 1
|
Level 2
|
Level 3
|
Total
|
||||||||||||
|
Assets:
|
(In thousands)
|
|||||||||||||||
|
Cash equivalents
|
$
|
160,000
|
|
$
|
—
|
|
$
|
—
|
|
$
|
160,000
|
|
||||
|
Investments, at fair value-
|
||||||||||||||||
|
Agency residential mortgage-backed securities
|
$
|
—
|
|
$
|
1,035,662
|
|
$
|
24,918
|
|
$
|
1,060,580
|
|
||||
|
Private label residential mortgage-backed securities
|
—
|
|
138,482
|
|
116,435
|
|
254,917
|
|
||||||||
|
Private label commercial mortgage-backed securities
|
—
|
|
—
|
|
34,145
|
|
34,145
|
|
||||||||
|
Commercial mortgage loans
|
—
|
|
—
|
|
66,399
|
|
66,399
|
|
||||||||
|
Residential mortgage loans
|
—
|
|
—
|
|
22,089
|
|
22,089
|
|
||||||||
|
Collateralized loan obligations
|
—
|
|
—
|
|
45,974
|
|
45,974
|
|
||||||||
|
Consumer loans and asset-backed securities backed by consumer loans
|
—
|
|
—
|
|
115,376
|
|
115,376
|
|
||||||||
|
Corporate debt
|
—
|
|
—
|
|
27,028
|
|
27,028
|
|
||||||||
|
Real estate owned
|
—
|
|
—
|
|
12,522
|
|
12,522
|
|
||||||||
|
Private corporate equity investments
|
—
|
|
—
|
|
22,088
|
|
22,088
|
|
||||||||
|
Total investments, at fair value
|
—
|
|
1,174,144
|
|
486,974
|
|
1,661,118
|
|
||||||||
46
|
Description
|
Level 1
|
Level 2
|
Level 3
|
Total
|
||||||||||||
|
(continued)
|
(In thousands)
|
|||||||||||||||
|
Financial derivatives–assets, at fair value-
|
||||||||||||||||
|
Credit default swaps on asset-backed securities
|
$
|
—
|
|
$
|
—
|
|
$
|
6,332
|
|
$
|
6,332
|
|
||||
|
Credit default swaps on corporate bond indices
|
—
|
|
137,643
|
|
—
|
|
137,643
|
|
||||||||
|
Credit default swaps on corporate bonds
|
—
|
|
10
|
|
—
|
|
10
|
|
||||||||
|
Credit default swaps on asset-backed indices
|
—
|
|
5,410
|
|
—
|
|
5,410
|
|
||||||||
|
Interest rate swaps
|
—
|
|
9,943
|
|
—
|
|
9,943
|
|
||||||||
|
Total return swaps
|
—
|
|
—
|
|
85
|
|
85
|
|
||||||||
|
Options
|
112
|
|
2,050
|
|
—
|
|
2,162
|
|
||||||||
|
Futures
|
32
|
|
—
|
|
—
|
|
32
|
|
||||||||
|
Forwards
|
—
|
|
1,138
|
|
—
|
|
1,138
|
|
||||||||
|
Warrants
|
—
|
|
—
|
|
150
|
|
150
|
|
||||||||
|
Total financial derivatives–assets, at fair value
|
144
|
|
156,194
|
|
6,567
|
|
162,905
|
|
||||||||
|
Repurchase agreements
|
—
|
|
105,700
|
|
—
|
|
105,700
|
|
||||||||
|
Total investments and financial derivatives–assets, at fair value and repurchase agreements
|
$
|
144
|
|
$
|
1,436,038
|
|
$
|
493,541
|
|
$
|
1,929,723
|
|
||||
|
Liabilities:
|
||||||||||||||||
|
Investments sold short, at fair value-
|
||||||||||||||||
|
Agency residential mortgage-backed securities
|
$
|
—
|
|
$
|
(612,777
|
)
|
$
|
—
|
|
$
|
(612,777
|
)
|
||||
|
Government debt
|
—
|
|
(114,051
|
)
|
—
|
|
(114,051
|
)
|
||||||||
|
Corporate debt
|
—
|
|
—
|
|
(448
|
)
|
(448
|
)
|
||||||||
|
Common stock
|
(1,471
|
)
|
—
|
|
—
|
|
(1,471
|
)
|
||||||||
|
Total investments sold short, at fair value
|
(1,471
|
)
|
(726,828
|
)
|
(448
|
)
|
(728,747
|
)
|
||||||||
|
Financial derivatives–liabilities, at fair value-
|
||||||||||||||||
|
Credit default swaps on corporate bond indices
|
—
|
|
(47,298
|
)
|
—
|
|
(47,298
|
)
|
||||||||
|
Credit default swaps on corporate bonds
|
—
|
|
(683
|
)
|
—
|
|
(683
|
)
|
||||||||
|
Credit default swaps on asset-backed indices
|
—
|
|
(365
|
)
|
—
|
|
(365
|
)
|
||||||||
|
Credit default swaps on asset-backed securities
|
—
|
|
—
|
|
(221
|
)
|
(221
|
)
|
||||||||
|
Interest rate swaps
|
—
|
|
(4,934
|
)
|
—
|
|
(4,934
|
)
|
||||||||
|
Total return swaps
|
—
|
|
—
|
|
(4,662
|
)
|
(4,662
|
)
|
||||||||
|
Options
|
—
|
|
(1,760
|
)
|
—
|
|
(1,760
|
)
|
||||||||
|
Futures
|
(528
|
)
|
—
|
|
—
|
|
(528
|
)
|
||||||||
|
Forwards
|
—
|
|
(13
|
)
|
—
|
|
(13
|
)
|
||||||||
|
Mortgage loan purchase commitments
|
—
|
|
(8
|
)
|
—
|
|
(8
|
)
|
||||||||
|
Total financial derivatives–liabilities, at fair value
|
(528
|
)
|
(55,061
|
)
|
(4,883
|
)
|
(60,472
|
)
|
||||||||
|
Guarantees
(1)
|
—
|
|
—
|
|
(828
|
)
|
(828
|
)
|
||||||||
|
Total investments sold short, financial derivatives–liabilities, and guarantees, at fair value
|
$
|
(1,999
|
)
|
$
|
(781,889
|
)
|
$
|
(6,159
|
)
|
$
|
(790,047
|
)
|
||||
|
(1)
|
Included in Other liabilities on the Consolidated Statement of Assets, Liabilities, and Equity.
|
There were
no
transfers of financial instruments between Level 1 and Level 2 during the year ended
December 31, 2015
.
47
The following table identifies the significant unobservable inputs that affect the valuation of the Company's Level 3 assets and liabilities as of December 31, 2015:
|
Fair Value
|
Valuation
Technique
|
Unobservable Input
|
Range
|
Weighted
Average
|
|||||||||||||||
|
Description
|
Min
|
Max
|
|||||||||||||||||
|
(In thousands)
|
|||||||||||||||||||
|
Private label residential mortgage-backed securities
|
$
|
89,549
|
|
Market Quotes
|
Non Binding Third-Party Valuation
|
$
|
1.81
|
|
$
|
151.86
|
|
$
|
68.47
|
|
|||||
|
Collateralized loan obligations
|
41,978
|
|
Market Quotes
|
Non Binding Third-Party Valuation
|
13.00
|
|
102.00
|
|
84.84
|
|
|||||||||
|
Corporate debt and non-exchange traded corporate equity
|
18,972
|
|
Market Quotes
|
Non Binding Third-Party Valuation
|
3.00
|
|
200.00
|
|
77.85
|
|
|||||||||
|
Private label commercial mortgage-backed securities
|
20,365
|
|
Market Quotes
|
Non Binding Third-Party Valuation
|
6.07
|
|
73.20
|
|
41.28
|
|
|||||||||
|
Agency interest only residential mortgage-backed securities
|
21,067
|
|
Market Quotes
|
Non Binding Third-Party Valuation
|
2.97
|
|
22.41
|
|
11.08
|
|
|||||||||
|
Total return swaps
|
(4,577
|
)
|
Market Quotes
|
Non Binding Third-Party Valuation (1)
|
36.38
|
|
99.88
|
|
56.38
|
|
|||||||||
|
Private label residential mortgage-backed securities
|
26,886
|
|
Discounted Cash Flows
|
Yield
|
3.4
|
%
|
27.1
|
%
|
19.9
|
%
|
|||||||||
|
Projected Collateral Prepayments
|
5.4
|
%
|
74.6
|
%
|
46.3
|
%
|
|||||||||||||
|
Projected Collateral Losses
|
2.9
|
%
|
24.5
|
%
|
11.4
|
%
|
|||||||||||||
|
Projected Collateral Recoveries
|
0.3
|
%
|
13.0
|
%
|
8.0
|
%
|
|||||||||||||
|
Projected Collateral Scheduled Amortization
|
8.6
|
%
|
88.6
|
%
|
34.3
|
%
|
|||||||||||||
|
100.0
|
%
|
||||||||||||||||||
|
Private label commercial mortgage-backed securities
|
13,780
|
|
Discounted Cash Flows
|
Yield
|
19.2
|
%
|
25.0
|
%
|
22.1
|
%
|
|||||||||
|
Projected Collateral Losses
|
0.7
|
%
|
2.3
|
%
|
1.6
|
%
|
|||||||||||||
|
Projected Collateral Recoveries
|
1.5
|
%
|
14.3
|
%
|
8.4
|
%
|
|||||||||||||
|
Projected Collateral Scheduled Amortization
|
83.4
|
%
|
97.6
|
%
|
90.0
|
%
|
|||||||||||||
|
100.0
|
%
|
||||||||||||||||||
|
Corporate debt and warrants
|
13,920
|
|
Discounted Cash Flows
|
Yield
|
15.0
|
%
|
20.0
|
%
|
16.2
|
%
|
|||||||||
|
Collateralized loan obligations
|
3,996
|
|
Discounted Cash Flows
|
Yield
|
8.3
|
%
|
20.6
|
%
|
13.5
|
%
|
|||||||||
|
Projected Collateral Prepayments
|
31.9
|
%
|
52.3
|
%
|
41.1
|
%
|
|||||||||||||
|
Projected Collateral Losses
|
2.6
|
%
|
17.3
|
%
|
12.9
|
%
|
|||||||||||||
|
Projected Collateral Recoveries
|
2.3
|
%
|
15.5
|
%
|
10.1
|
%
|
|||||||||||||
|
Projected Collateral Scheduled Amortization
|
33.3
|
%
|
51.5
|
%
|
35.9
|
%
|
|||||||||||||
|
100.0
|
%
|
||||||||||||||||||
|
Consumer loans and asset-backed securities backed by consumer loans
(2)
|
115,376
|
|
Discounted Cash Flows
|
Yield
|
9.0
|
%
|
15.0
|
%
|
10.4
|
%
|
|||||||||
|
Projected Collateral Prepayments
|
0.0
|
%
|
40.9
|
%
|
30.9
|
%
|
|||||||||||||
|
Projected Collateral Losses
|
1.0
|
%
|
33.8
|
%
|
7.3
|
%
|
|||||||||||||
|
Projected Collateral Scheduled Amortization
|
57.3
|
%
|
80.8
|
%
|
61.8
|
%
|
|||||||||||||
|
100.0
|
%
|
||||||||||||||||||
|
Performing commercial mortgage loans
|
43,847
|
|
Discounted Cash Flows
|
Yield
|
9.8
|
%
|
17.6
|
%
|
11.9
|
%
|
|||||||||
48
|
(continued)
|
Fair Value
|
Valuation
Technique
|
Unobservable Input
|
Range
|
Weighted
Average
|
||||||||||||||
|
Description
|
Min
|
Max
|
|||||||||||||||||
|
(In thousands)
|
|||||||||||||||||||
|
Non-performing commercial mortgage loans and commercial real estate owned
|
$
|
30,984
|
|
Discounted Cash Flows
|
Yield
|
10.2
|
%
|
19.4
|
%
|
13.7
|
%
|
||||||||
|
Months to Resolution
|
4.0
|
|
24.0
|
|
9.3
|
|
|||||||||||||
|
Performing residential mortgage loans
|
13,848
|
|
Discounted Cash Flows
|
Yield
|
5.5
|
%
|
8.0
|
%
|
6.5
|
%
|
|||||||||
|
Non-performing residential mortgage loans and residential real estate owned
|
12,331
|
|
Discounted Cash Flows
|
Yield
|
5.7
|
%
|
7.9
|
%
|
7.3
|
%
|
|||||||||
|
Months to Resolution
|
3.4
|
|
113.6
|
|
20.6
|
|
|||||||||||||
|
Credit default swaps on asset-backed securities
|
6,111
|
|
Net Discounted Cash Flows
|
Projected Collateral Prepayments
|
26.6
|
%
|
44.1
|
%
|
32.6
|
%
|
|||||||||
|
Projected Collateral Losses
|
15.0
|
%
|
33.7
|
%
|
26.5
|
%
|
|||||||||||||
|
Projected Collateral Recoveries
|
6.8
|
%
|
16.9
|
%
|
12.0
|
%
|
|||||||||||||
|
Projected Collateral Scheduled Amortization
|
24.5
|
%
|
33.1
|
%
|
28.9
|
%
|
|||||||||||||
|
100.0
|
%
|
||||||||||||||||||
|
Non-exchange traded preferred equity investment in commercial mortgage-related private partnership
|
10,558
|
|
Discounted Cash Flows
|
Yield
|
14.0
|
%
|
16.5
|
%
|
14.7
|
%
|
|||||||||
|
Expected Holding Period (Months)
|
14.3
|
|
27.0
|
|
23.5
|
|
|||||||||||||
|
Agency interest only residential mortgage-backed securities
|
3,851
|
|
Option Adjusted Spread ("OAS")
|
LIBOR OAS
(2)
|
441
|
|
1,672
|
|
622
|
|
|||||||||
|
Projected Collateral Prepayments
|
18.0
|
%
|
100.0
|
%
|
70.4
|
%
|
|||||||||||||
|
Projected Collateral Scheduled Amortization
|
0.0
|
%
|
82.0
|
%
|
29.6
|
%
|
|||||||||||||
|
100.0
|
%
|
||||||||||||||||||
|
Non-exchange traded preferred and common equity investment in mortgage-related entities
|
2,738
|
|
Enterprise Value
|
Equity Multiple
(3)
|
2.7x
|
|
2.7x
|
|
2.7x
|
|
|||||||||
|
Non-exchange traded preferred and common equity investment in mortgage-related entities
|
2,630
|
|
Recent Transactions
|
Transaction Price
|
N/A
|
|
N/A
|
|
N/A
|
|
|||||||||
|
Guarantees
|
(828
|
)
|
Cash Flows
|
Expected Cash Flows
(4)
|
N/A
|
|
N/A
|
|
N/A
|
|
|||||||||
|
(1)
|
Represents valuations on underlying assets.
|
|
(2)
|
Shown in basis points.
|
|
(3)
|
Represent an estimation of where market participants might value an enterprise.
|
|
(4)
|
Represents transactions with a remaining term of less than one year.
|
Third-party non-binding valuations are validated by comparing such valuations to internally generated prices based on the Company's models and to recent trading activity in the same or similar instruments.
For those instruments valued using discounted and net discounted cash flows, collateral prepayments, losses, recoveries, and scheduled amortization are projected over the remaining life of the collateral and expressed as a percentage of the collateral's current principal balance. Averages are weighted based on the fair value of the related instrument. In the case of credit default swaps on asset-backed securities, averages are weighted based on each instrument's bond equivalent value. Bond equivalent value represents the investment amount of a corresponding position in the reference obligation, calculated as the difference between the outstanding principal balance of the underlying reference obligation and the fair value, inclusive of accrued interest, of the derivative contract. For those assets valued using the LIBOR Option Adjusted Spread valuation methodology, cash flows are projected using the Company's models over multiple interest rate scenarios, and these projected cash flows are then discounted using the LIBOR rates implied by each interest rate scenario. The LIBOR OAS of an asset is then computed as the unique constant yield spread that, when added to all LIBOR rates in each interest rate scenario generated by the model, will equate (a) the expected present value of the projected asset cash flows over all model scenarios to (b) the actual current market price of the asset. LIBOR OAS is therefore model-dependent. Generally speaking, LIBOR OAS measures the additional yield spread over LIBOR that an asset provides at its current market price after taking into account any interest rate options embedded in the asset.
49
Material changes in any of the inputs above in isolation could result in a significant change to reported fair value measurements. Additionally, fair value measurements are impacted by the interrelationships of these inputs. For example, a higher expectation of collateral prepayments will generally be accompanied by a lower expectation of collateral losses. Conversely, higher losses will generally be accompanied by lower prepayments. Because the Company's credit default swaps on asset-backed security holdings represent credit default swap contracts whereby the Company has purchased credit protection, such default swaps on asset-backed securities generally have the directionally opposite sensitivity to prepayments, losses, and recoveries as compared to the Company's long securities holdings. Prepayments do not represent a significant input for the Company's commercial mortgage-backed securities and commercial mortgage loans. Losses and recoveries do not represent a significant input for the Company's Agency RMBS interest only securities, given the guarantee of the issuing government agency or government-sponsored enterprise.
The tables below include a roll-forward of the Company's financial instruments for the three and six month periods ended
June 30, 2016
and
2015
(including the change in fair value), for financial instruments classified by the Company within Level 3 of the valuation hierarchy.
Level 3—Fair Value Measurement Using Significant Unobservable Inputs:
Three Month Period Ended
June 30, 2016
|
(In thousands)
|
Ending
Balance as of March 31, 2016 |
Accreted
Discounts /
(Amortized
Premiums)
|
Net Realized
Gain/
(Loss)
|
Change in Net
Unrealized
Gain/(Loss)
|
Purchases/
Payments |
Sales/
Issuances |
Transfers Into Level 3
|
Transfers Out of Level 3
|
Ending
Balance as of
June 30, 2016
|
||||||||||||||||||||||||||
|
Assets:
|
|||||||||||||||||||||||||||||||||||
|
Investments, at fair value-
|
|||||||||||||||||||||||||||||||||||
|
Agency residential mortgage-backed securities
|
$
|
22,306
|
|
$
|
(1,888
|
)
|
$
|
(82
|
)
|
$
|
(133
|
)
|
$
|
303
|
|
$
|
—
|
|
$
|
—
|
|
$
|
—
|
|
$
|
20,506
|
|
||||||||
|
Private label residential mortgage-backed securities
|
113,382
|
|
1,109
|
|
(290
|
)
|
(1,310
|
)
|
1,687
|
|
(6,100
|
)
|
12,823
|
|
(8,790
|
)
|
112,511
|
|
|||||||||||||||||
|
Private label commercial mortgage-backed securities
|
35,350
|
|
431
|
|
—
|
|
(839
|
)
|
—
|
|
—
|
|
—
|
|
—
|
|
34,942
|
|
|||||||||||||||||
|
Commercial mortgage loans
|
56,365
|
|
727
|
|
(1
|
)
|
(671
|
)
|
—
|
|
(6,954
|
)
|
—
|
|
—
|
|
49,466
|
|
|||||||||||||||||
|
Residential mortgage loans
|
35,580
|
|
141
|
|
757
|
|
(147
|
)
|
17,101
|
|
(6,783
|
)
|
—
|
|
—
|
|
46,649
|
|
|||||||||||||||||
|
Collateralized loan obligations
|
34,415
|
|
(1,942
|
)
|
(279
|
)
|
145
|
|
1,178
|
|
(408
|
)
|
—
|
|
—
|
|
33,109
|
|
|||||||||||||||||
|
Consumer loans and asset-backed securities backed by consumer loans
|
143,854
|
|
(2,713
|
)
|
6
|
|
(655
|
)
|
37,046
|
|
(23,143
|
)
|
—
|
|
—
|
|
154,395
|
|
|||||||||||||||||
|
Corporate debt
|
24,552
|
|
(160
|
)
|
275
|
|
1,874
|
|
49,353
|
|
(38,920
|
)
|
—
|
|
—
|
|
36,974
|
|
|||||||||||||||||
|
Real estate owned
|
21,843
|
|
—
|
|
1,978
|
|
(1,750
|
)
|
884
|
|
(18,793
|
)
|
—
|
|
—
|
|
4,162
|
|
|||||||||||||||||
|
Private corporate equity investments
|
24,599
|
|
—
|
|
101
|
|
697
|
|
2,590
|
|
(8,569
|
)
|
—
|
|
—
|
|
19,418
|
|
|||||||||||||||||
|
Total investments, at fair value
|
512,246
|
|
(4,295
|
)
|
2,465
|
|
(2,789
|
)
|
110,142
|
|
(109,670
|
)
|
12,823
|
|
(8,790
|
)
|
512,132
|
|
|||||||||||||||||
|
Financial derivatives–assets, at fair value-
|
|||||||||||||||||||||||||||||||||||
|
Credit default swaps on asset-backed securities
|
6,227
|
|
—
|
|
373
|
|
(149
|
)
|
(24
|
)
|
(359
|
)
|
—
|
|
—
|
|
6,068
|
|
|||||||||||||||||
|
Total return swaps
|
1,074
|
|
—
|
|
3,412
|
|
(250
|
)
|
(3,146
|
)
|
(266
|
)
|
—
|
|
—
|
|
824
|
|
|||||||||||||||||
|
Warrants
|
100
|
|
—
|
|
—
|
|
—
|
|
—
|
|
—
|
|
—
|
|
—
|
|
100
|
|
|||||||||||||||||
|
Total financial derivatives– assets, at fair value
|
7,401
|
|
—
|
|
3,785
|
|
(399
|
)
|
(3,170
|
)
|
(625
|
)
|
—
|
|
—
|
|
6,992
|
|
|||||||||||||||||
|
Total investments and financial derivatives–assets, at fair value
|
$
|
519,647
|
|
$
|
(4,295
|
)
|
$
|
6,250
|
|
$
|
(3,188
|
)
|
$
|
106,972
|
|
$
|
(110,295
|
)
|
$
|
12,823
|
|
$
|
(8,790
|
)
|
$
|
519,124
|
|
||||||||
|
Liabilities:
|
|||||||||||||||||||||||||||||||||||
|
Investments sold short, at fair value
|
|||||||||||||||||||||||||||||||||||
|
Corporate debt
|
$
|
(3,029
|
)
|
$
|
(9
|
)
|
$
|
171
|
|
$
|
(309
|
)
|
$
|
10,368
|
|
$
|
(17,139
|
)
|
$
|
—
|
|
$
|
—
|
|
$
|
(9,947
|
)
|
||||||||
|
Total investments sold short, at fair value
|
(3,029
|
)
|
(9
|
)
|
171
|
|
(309
|
)
|
10,368
|
|
(17,139
|
)
|
—
|
|
—
|
|
(9,947
|
)
|
|||||||||||||||||
50
|
(In thousands)
|
Ending
Balance as of March 31, 2016 |
Accreted
Discounts / (Amortized Premiums) |
Net Realized
Gain/ (Loss) |
Change in Net
Unrealized Gain/(Loss) |
Purchases/
Payments |
Sales/
Issuances |
Transfers Into Level 3
|
Transfers Out of Level 3
|
Ending
Balance as of June 30, 2016 |
||||||||||||||||||||||||||
|
(continued)
|
|||||||||||||||||||||||||||||||||||
|
Financial derivatives–liabilities, at fair value-
|
|||||||||||||||||||||||||||||||||||
|
Credit default swaps on asset-backed securities
|
$
|
(220
|
)
|
$
|
—
|
|
$
|
(63
|
)
|
$
|
24
|
|
$
|
—
|
|
$
|
25
|
|
$
|
—
|
|
$
|
—
|
|
$
|
(234
|
)
|
||||||||
|
Total return swaps
|
(675
|
)
|
—
|
|
(2,115
|
)
|
(342
|
)
|
2,348
|
|
(232
|
)
|
—
|
|
—
|
|
(1,016
|
)
|
|||||||||||||||||
|
Total financial derivatives– liabilities, at fair value
|
(895
|
)
|
—
|
|
(2,178
|
)
|
(318
|
)
|
2,348
|
|
(207
|
)
|
—
|
|
—
|
|
(1,250
|
)
|
|||||||||||||||||
|
Guarantees:
|
|||||||||||||||||||||||||||||||||||
|
Guarantees
|
(616
|
)
|
—
|
|
—
|
|
304
|
|
—
|
|
—
|
|
—
|
|
—
|
|
(312
|
)
|
|||||||||||||||||
|
Total guarantees
|
(616
|
)
|
—
|
|
—
|
|
304
|
|
—
|
|
—
|
|
—
|
|
—
|
|
(312
|
)
|
|||||||||||||||||
|
Total investments sold short, financial derivatives– liabilities, and guarantees, at fair value
|
$
|
(4,540
|
)
|
$
|
(9
|
)
|
$
|
(2,007
|
)
|
$
|
(323
|
)
|
$
|
12,716
|
|
$
|
(17,346
|
)
|
$
|
—
|
|
$
|
—
|
|
$
|
(11,509
|
)
|
||||||||
All amounts of net realized and change in net unrealized gain (loss) in the table above are reflected in the accompanying Consolidated Statement of Operations. The table above incorporates changes in net unrealized gain (loss) for both Level 3 financial instruments held by the Company at
June 30, 2016
, as well as Level 3 financial instruments disposed of by the Company during the three month period ended
June 30, 2016
. For Level 3 financial instruments held by the Company at
June 30, 2016
, change in net unrealized gain (loss) of
$(2.2) million
,
$(0.03) million
,
$0.3 million
,
$(0.6) million
, and
$0.3 million
, for the three month period ended
June 30, 2016
relate to investments, investments sold short, financial derivatives–assets, financial derivatives–liabilities, and guarantees, respectively.
As of
June 30, 2016
, the Company transferred
$8.8 million
of non-Agency RMBS from Level 3 to Level 2. These assets were transferred from Level 3 to Level 2 based on an increased volume of observed trading of these and similar assets. This increase in observed trading activity has led to greater price transparency for these assets, thereby making a Level 2 designation appropriate in the Company's view. However, changes in the volume of observable inputs for these assets, such as a decrease in the volume of observed trading, could impact price transparency, and thereby cause a change in the level designation for these assets in future periods.
In addition, as of
June 30, 2016
, the Company transferred
$12.8 million
of non-Agency RMBS from Level 2 to Level 3. Since March 31, 2016, these securities have exhibited indications of a reduced level of price transparency. Examples of such indications include wider spreads relative to similar securities and a reduction in observable transactions involving these and similar securities. Changes in these indications could impact price transparency, and thereby cause a change in the level designation in future periods.
51
Three Month Period Ended
June 30, 2015
|
(In thousands)
|
Ending
Balance as of March 31, 2015 |
Accreted
Discounts /
(Amortized
Premiums)
|
Net Realized
Gain/
(Loss)
|
Change in Net
Unrealized
Gain/(Loss)
|
Purchases/
Payments
|
Sales/
Issuances
|
Transfers Into Level 3
|
Transfers Out of Level 3
|
Ending
Balance as of
June 30, 2015
|
||||||||||||||||||||||||||
|
Assets:
|
|||||||||||||||||||||||||||||||||||
|
Investments, at fair value-
|
|||||||||||||||||||||||||||||||||||
|
Agency residential mortgage-backed securities
|
$
|
26,335
|
|
$
|
(1,941
|
)
|
$
|
—
|
|
$
|
1,604
|
|
$
|
6,317
|
|
$
|
(1,930
|
)
|
$
|
—
|
|
$
|
—
|
|
$
|
30,385
|
|
||||||||
|
Private label residential mortgage-backed securities
|
169,371
|
|
1,824
|
|
4,423
|
|
(40
|
)
|
40,761
|
|
(55,420
|
)
|
20,165
|
|
(21,038
|
)
|
160,046
|
|
|||||||||||||||||
|
Private label commercial mortgage-backed securities
|
52,214
|
|
556
|
|
(91
|
)
|
(792
|
)
|
4,538
|
|
(6,591
|
)
|
—
|
|
—
|
|
49,834
|
|
|||||||||||||||||
|
Commercial mortgage loans
|
38,918
|
|
736
|
|
—
|
|
(637
|
)
|
26,519
|
|
(10,226
|
)
|
—
|
|
—
|
|
55,310
|
|
|||||||||||||||||
|
Residential mortgage loans
|
30,845
|
|
405
|
|
1,422
|
|
(215
|
)
|
3,782
|
|
(15,310
|
)
|
—
|
|
—
|
|
20,929
|
|
|||||||||||||||||
|
Collateralized loan obligations
|
88,847
|
|
149
|
|
(819
|
)
|
252
|
|
39,110
|
|
(29,151
|
)
|
—
|
|
—
|
|
98,388
|
|
|||||||||||||||||
|
Consumer loans and asset-backed securities backed by consumer loans
|
34,773
|
|
(1,701
|
)
|
—
|
|
225
|
|
25,082
|
|
(5,922
|
)
|
—
|
|
—
|
|
52,457
|
|
|||||||||||||||||
|
Corporate debt
|
31,836
|
|
16
|
|
(78
|
)
|
(1,809
|
)
|
1,025
|
|
(4,712
|
)
|
—
|
|
—
|
|
26,278
|
|
|||||||||||||||||
|
Real estate owned
|
9,070
|
|
—
|
|
164
|
|
(10
|
)
|
2,774
|
|
(2,496
|
)
|
—
|
|
—
|
|
9,502
|
|
|||||||||||||||||
|
Private corporate equity investments
|
21,300
|
|
—
|
|
115
|
|
268
|
|
1,116
|
|
(450
|
)
|
—
|
|
—
|
|
22,349
|
|
|||||||||||||||||
|
Total investments, at fair value
|
503,509
|
|
44
|
|
5,136
|
|
(1,154
|
)
|
151,024
|
|
(132,208
|
)
|
20,165
|
|
(21,038
|
)
|
525,478
|
|
|||||||||||||||||
|
Financial derivatives–assets, at fair value-
|
|||||||||||||||||||||||||||||||||||
|
Credit default swaps on asset-backed securities
|
10,809
|
|
—
|
|
(1,563
|
)
|
1,056
|
|
3
|
|
(856
|
)
|
—
|
|
—
|
|
9,449
|
|
|||||||||||||||||
|
Total return swaps
|
118
|
|
—
|
|
285
|
|
130
|
|
21
|
|
(307
|
)
|
—
|
|
—
|
|
247
|
|
|||||||||||||||||
|
Warrants
|
100
|
|
—
|
|
—
|
|
—
|
|
—
|
|
—
|
|
—
|
|
—
|
|
100
|
|
|||||||||||||||||
|
Total financial derivatives– assets, at fair value
|
11,027
|
|
—
|
|
(1,278
|
)
|
1,186
|
|
24
|
|
(1,163
|
)
|
—
|
|
—
|
|
9,796
|
|
|||||||||||||||||
|
Total investments and financial derivatives–assets, at fair value
|
$
|
514,536
|
|
$
|
44
|
|
$
|
3,858
|
|
$
|
32
|
|
$
|
151,048
|
|
$
|
(133,371
|
)
|
$
|
20,165
|
|
$
|
(21,038
|
)
|
$
|
535,274
|
|
||||||||
|
Liabilities:
|
|||||||||||||||||||||||||||||||||||
|
Financial derivatives–liabilities, at fair value-
|
|||||||||||||||||||||||||||||||||||
|
Credit default swaps on asset-backed securities
|
$
|
(239
|
)
|
$
|
—
|
|
$
|
(23
|
)
|
$
|
(41
|
)
|
$
|
—
|
|
$
|
23
|
|
$
|
—
|
|
$
|
—
|
|
$
|
(280
|
)
|
||||||||
|
Total return swaps
|
(307
|
)
|
—
|
|
353
|
|
(1,596
|
)
|
(353
|
)
|
—
|
|
—
|
|
—
|
|
(1,903
|
)
|
|||||||||||||||||
|
Total financial derivatives– liabilities, at fair value
|
(546
|
)
|
—
|
|
330
|
|
(1,637
|
)
|
(353
|
)
|
23
|
|
—
|
|
—
|
|
(2,183
|
)
|
|||||||||||||||||
|
Securitized debt:
|
|||||||||||||||||||||||||||||||||||
|
Securitized debt
|
(669
|
)
|
—
|
|
—
|
|
1
|
|
13
|
|
—
|
|
—
|
|
—
|
|
(655
|
)
|
|||||||||||||||||
|
Total securitized debt
|
(669
|
)
|
—
|
|
—
|
|
1
|
|
13
|
|
—
|
|
—
|
|
—
|
|
(655
|
)
|
|||||||||||||||||
|
Total financial derivatives– liabilities and securitized debt, at fair value
|
$
|
(1,215
|
)
|
$
|
—
|
|
$
|
330
|
|
$
|
(1,636
|
)
|
$
|
(340
|
)
|
$
|
23
|
|
$
|
—
|
|
$
|
—
|
|
$
|
(2,838
|
)
|
||||||||
All amounts of net realized and change in net unrealized gain (loss) in the table above are reflected in the accompanying Consolidated Statement of Operations. The table above incorporates changes in net unrealized gain (loss) for both Level 3 financial instruments held by the Company at
June 30, 2015
, as well as Level 3 financial instruments disposed of by the Company during the three month period ended
June 30, 2015
. For Level 3 financial instruments held by the Company at
June 30, 2015
, change in net unrealized gain (loss) of
$(0.6) million
,
$1.2 million
,
$(1.7) million
, and
$1 thousand
, for the three month period ended
June 30, 2015
relate to investments, financial derivatives–assets, financial derivatives–liabilities, and securitized debt, respectively.
As of
June 30, 2015
, the Company transferred
$21.0 million
of non-Agency RMBS from Level 3 to Level 2. These assets were transferred from Level 3 to Level 2 based on an increased volume of observed trading of these and similar assets. This
52
increase in observed trading activity has led to greater price transparency for these assets, thereby making a Level 2 designation appropriate in the Company's view. However, changes in the volume of observable inputs for these assets, such as a decrease in the volume of observed trading, could impact price transparency, and thereby cause a change in the level designation for these assets in future periods.
In addition, as of
June 30, 2015
, the Company transferred
$20.2 million
of non-Agency RMBS from Level 2 to Level 3. These securities have exhibited indications of a reduced level of price transparency. Examples of such indications include wider spreads relative to similar securities and a reduction in observable transactions involving these and similar securities. Changes in these indications could impact price transparency, and thereby cause a change in the level designation in future periods.
Six Month Period Ended
June 30, 2016
|
(In thousands)
|
Ending
Balance as of December 31, 2015 |
Accreted
Discounts /
(Amortized
Premiums)
|
Net Realized
Gain/
(Loss)
|
Change in Net
Unrealized
Gain/(Loss)
|
Purchases/
Payments |
Sales/
Issuances |
Transfers Into Level 3
|
Transfers Out of Level 3
|
Ending
Balance as of
June 30, 2016
|
||||||||||||||||||||||||||
|
Assets:
|
|||||||||||||||||||||||||||||||||||
|
Investments, at fair value-
|
|||||||||||||||||||||||||||||||||||
|
Agency residential mortgage-backed securities
|
$
|
24,918
|
|
$
|
(3,945
|
)
|
$
|
(90
|
)
|
$
|
(679
|
)
|
$
|
302
|
|
$
|
—
|
|
$
|
—
|
|
$
|
—
|
|
$
|
20,506
|
|
||||||||
|
Private label residential mortgage-backed securities
|
116,435
|
|
1,517
|
|
(283
|
)
|
(2,370
|
)
|
7,419
|
|
(12,461
|
)
|
11,261
|
|
(9,007
|
)
|
112,511
|
|
|||||||||||||||||
|
Private label commercial mortgage-backed securities
|
34,145
|
|
886
|
|
322
|
|
(3,840
|
)
|
7,844
|
|
(4,415
|
)
|
—
|
|
—
|
|
34,942
|
|
|||||||||||||||||
|
Commercial mortgage loans
|
66,399
|
|
1,272
|
|
182
|
|
223
|
|
13,424
|
|
(32,034
|
)
|
—
|
|
—
|
|
49,466
|
|
|||||||||||||||||
|
Residential mortgage loans
|
22,089
|
|
248
|
|
865
|
|
127
|
|
32,066
|
|
(8,746
|
)
|
—
|
|
—
|
|
46,649
|
|
|||||||||||||||||
|
Collateralized loan obligations
|
45,974
|
|
(2,869
|
)
|
801
|
|
417
|
|
1,178
|
|
(12,392
|
)
|
—
|
|
—
|
|
33,109
|
|
|||||||||||||||||
|
Consumer loans and asset-backed securities backed by consumer loans
|
115,376
|
|
(5,596
|
)
|
6
|
|
(549
|
)
|
88,956
|
|
(43,798
|
)
|
—
|
|
—
|
|
154,395
|
|
|||||||||||||||||
|
Corporate debt
|
27,028
|
|
(46
|
)
|
255
|
|
(2,102
|
)
|
52,320
|
|
(40,481
|
)
|
—
|
|
—
|
|
36,974
|
|
|||||||||||||||||
|
Real estate owned
|
12,522
|
|
—
|
|
2,238
|
|
(331
|
)
|
10,672
|
|
(20,939
|
)
|
—
|
|
—
|
|
4,162
|
|
|||||||||||||||||
|
Private corporate equity investments
|
22,088
|
|
—
|
|
(29
|
)
|
(531
|
)
|
6,517
|
|
(8,627
|
)
|
—
|
|
—
|
|
19,418
|
|
|||||||||||||||||
|
Total investments, at fair value
|
486,974
|
|
(8,533
|
)
|
4,267
|
|
(9,635
|
)
|
220,698
|
|
(183,893
|
)
|
11,261
|
|
(9,007
|
)
|
512,132
|
|
|||||||||||||||||
|
Financial derivatives–assets, at fair value-
|
|||||||||||||||||||||||||||||||||||
|
Credit default swaps on asset-backed securities
|
6,332
|
|
—
|
|
464
|
|
(255
|
)
|
12
|
|
(485
|
)
|
—
|
|
—
|
|
6,068
|
|
|||||||||||||||||
|
Total return swaps
|
85
|
|
—
|
|
(103
|
)
|
739
|
|
423
|
|
(320
|
)
|
—
|
|
—
|
|
824
|
|
|||||||||||||||||
|
Warrants
|
150
|
|
—
|
|
(50
|
)
|
—
|
|
—
|
|
—
|
|
—
|
|
—
|
|
100
|
|
|||||||||||||||||
|
Total financial derivatives– assets, at fair value
|
6,567
|
|
—
|
|
311
|
|
484
|
|
435
|
|
(805
|
)
|
—
|
|
—
|
|
6,992
|
|
|||||||||||||||||
|
Total investments and financial derivatives–assets, at fair value
|
$
|
493,541
|
|
$
|
(8,533
|
)
|
$
|
4,578
|
|
$
|
(9,151
|
)
|
$
|
221,133
|
|
$
|
(184,698
|
)
|
$
|
11,261
|
|
$
|
(9,007
|
)
|
$
|
519,124
|
|
||||||||
|
Liabilities:
|
|||||||||||||||||||||||||||||||||||
|
Investments sold short, at fair value
|
|||||||||||||||||||||||||||||||||||
|
Corporate debt
|
$
|
(448
|
)
|
$
|
(8
|
)
|
$
|
531
|
|
$
|
(558
|
)
|
$
|
11,255
|
|
$
|
(20,719
|
)
|
$
|
—
|
|
$
|
—
|
|
$
|
(9,947
|
)
|
||||||||
|
Total investments sold short, at fair value
|
(448
|
)
|
(8
|
)
|
531
|
|
(558
|
)
|
11,255
|
|
(20,719
|
)
|
—
|
|
—
|
|
(9,947
|
)
|
|||||||||||||||||
53
|
(In thousands)
|
Ending
Balance as of December 31, 2015 |
Accreted
Discounts / (Amortized Premiums) |
Net Realized
Gain/ (Loss) |
Change in Net
Unrealized Gain/(Loss) |
Purchases/
Payments |
Sales/
Issuances |
Transfers Into Level 3
|
Transfers Out of Level 3
|
Ending
Balance as of June 30, 2016 |
||||||||||||||||||||||||||
|
(continued)
|
|||||||||||||||||||||||||||||||||||
|
Financial derivatives–liabilities, at fair value-
|
|||||||||||||||||||||||||||||||||||
|
Credit default swaps on asset-backed securities
|
$
|
(221
|
)
|
$
|
—
|
|
$
|
(79
|
)
|
$
|
24
|
|
$
|
—
|
|
$
|
42
|
|
$
|
—
|
|
$
|
—
|
|
$
|
(234
|
)
|
||||||||
|
Total return swaps
|
(4,662
|
)
|
—
|
|
(4,365
|
)
|
3,646
|
|
4,686
|
|
(321
|
)
|
—
|
|
—
|
|
(1,016
|
)
|
|||||||||||||||||
|
Total financial derivatives– liabilities, at fair value
|
(4,883
|
)
|
—
|
|
(4,444
|
)
|
3,670
|
|
4,686
|
|
(279
|
)
|
—
|
|
—
|
|
(1,250
|
)
|
|||||||||||||||||
|
Guarantees:
|
|||||||||||||||||||||||||||||||||||
|
Guarantees
|
(828
|
)
|
—
|
|
—
|
|
516
|
|
—
|
|
—
|
|
—
|
|
—
|
|
(312
|
)
|
|||||||||||||||||
|
Total guarantees
|
(828
|
)
|
—
|
|
—
|
|
516
|
|
—
|
|
—
|
|
—
|
|
—
|
|
(312
|
)
|
|||||||||||||||||
|
Total investments sold short, financial derivatives– liabilities, and guarantees, at fair value
|
$
|
(6,159
|
)
|
$
|
(8
|
)
|
$
|
(3,913
|
)
|
$
|
3,628
|
|
$
|
15,941
|
|
$
|
(20,998
|
)
|
$
|
—
|
|
$
|
—
|
|
$
|
(11,509
|
)
|
||||||||
All amounts of net realized and change in net unrealized gain (loss) in the table above are reflected in the accompanying Consolidated Statement of Operations. The table above incorporates changes in net unrealized gain (loss) for both Level 3 financial instruments held by the Company at
June 30, 2016
, as well as Level 3 financial instruments disposed of by the Company during the six month period ended
June 30, 2016
. For Level 3 financial instruments held by the Company at
June 30, 2016
, change in net unrealized gain (loss) of
$(10.9) million
,
$(0.04) million
,
$0.9 million
,
$(0.1) million
, and
$0.5 million
, for the six month period ended
June 30, 2016
relate to investments, investments sold short, financial derivatives–assets, financial derivatives–liabilities, and guarantees, respectively.
As of
June 30, 2016
, the Company transferred
$9.0 million
of non-Agency RMBS from Level 3 to Level 2. These assets were transferred from Level 3 to Level 2 based on an increased volume of observed trading of these and similar assets. This increase in observed trading activity has led to greater price transparency for these assets, thereby making a Level 2 designation appropriate in the Company's view. However, changes in the volume of observable inputs for these assets, such as a decrease in the volume of observed trading, could impact price transparency, and thereby cause a change in the level designation for these assets in future periods.
In addition, as of
June 30, 2016
, the Company transferred
$11.3 million
of non-Agency RMBS from Level 2 to Level 3. Since December 31, 2015, these securities have exhibited indications of a reduced level of price transparency. Examples of such indications include wider spreads relative to similar securities and a reduction in observable transactions involving these and similar securities. Changes in these indications could impact price transparency, and thereby cause a change in the level designation in future periods.
54
Six Month Period Ended
June 30, 2015
|
(In thousands)
|
Ending
Balance as of December 31, 2014 |
Accreted
Discounts /
(Amortized
Premiums)
|
Net Realized
Gain/
(Loss)
|
Change in
Net
Unrealized
Gain/(Loss)
|
Purchases/
Payments
|
Sales/
Issuances
|
Transfers Into Level 3
|
Transfers Out of Level 3
|
Ending
Balance as of June 30, 2015 |
||||||||||||||||||||||||||
|
Assets:
|
|||||||||||||||||||||||||||||||||||
|
Investments, at fair value-
|
|||||||||||||||||||||||||||||||||||
|
Agency residential mortgage-backed securities
|
$
|
31,385
|
|
$
|
(3,947
|
)
|
$
|
472
|
|
$
|
1,508
|
|
$
|
7,506
|
|
$
|
(6,539
|
)
|
$
|
—
|
|
$
|
—
|
|
$
|
30,385
|
|
||||||||
|
Private label residential mortgage-backed securities
|
274,369
|
|
4,692
|
|
11,397
|
|
(3,889
|
)
|
58,464
|
|
(113,848
|
)
|
6,490
|
|
(77,629
|
)
|
160,046
|
|
|||||||||||||||||
|
Private label commercial mortgage-backed securities
|
53,311
|
|
1,928
|
|
523
|
|
(2,692
|
)
|
20,132
|
|
(23,368
|
)
|
—
|
|
—
|
|
49,834
|
|
|||||||||||||||||
|
Commercial mortgage loans
|
28,309
|
|
1,275
|
|
—
|
|
(620
|
)
|
50,810
|
|
(24,464
|
)
|
—
|
|
—
|
|
55,310
|
|
|||||||||||||||||
|
Residential mortgage loans
|
27,482
|
|
848
|
|
1,664
|
|
(70
|
)
|
9,758
|
|
(18,753
|
)
|
—
|
|
—
|
|
20,929
|
|
|||||||||||||||||
|
Collateralized loan obligations
|
123,338
|
|
(4,473
|
)
|
(48
|
)
|
(1,453
|
)
|
49,587
|
|
(68,563
|
)
|
—
|
|
—
|
|
98,388
|
|
|||||||||||||||||
|
Consumer loans and asset-backed securities backed by consumer loans
|
22,950
|
|
(3,419
|
)
|
—
|
|
776
|
|
41,139
|
|
(8,989
|
)
|
—
|
|
—
|
|
52,457
|
|
|||||||||||||||||
|
Corporate debt
|
42,708
|
|
47
|
|
108
|
|
(2,390
|
)
|
12,630
|
|
(26,825
|
)
|
—
|
|
—
|
|
26,278
|
|
|||||||||||||||||
|
Real estate owned
|
8,635
|
|
—
|
|
248
|
|
527
|
|
5,245
|
|
(5,153
|
)
|
—
|
|
—
|
|
9,502
|
|
|||||||||||||||||
|
Private corporate equity investments
|
14,512
|
|
—
|
|
116
|
|
498
|
|
7,688
|
|
(465
|
)
|
—
|
|
—
|
|
22,349
|
|
|||||||||||||||||
|
Total investments, at fair value
|
626,999
|
|
(3,049
|
)
|
14,480
|
|
(7,805
|
)
|
262,959
|
|
(296,967
|
)
|
6,490
|
|
(77,629
|
)
|
525,478
|
|
|||||||||||||||||
|
Financial derivatives–assets, at fair value-
|
|||||||||||||||||||||||||||||||||||
|
Credit default swaps on asset-backed securities
|
$
|
11,387
|
|
$
|
—
|
|
$
|
(1,162
|
)
|
$
|
701
|
|
$
|
25
|
|
$
|
(1,502
|
)
|
$
|
—
|
|
$
|
—
|
|
$
|
9,449
|
|
||||||||
|
Total return swaps
|
—
|
|
—
|
|
285
|
|
248
|
|
21
|
|
(307
|
)
|
—
|
|
—
|
|
247
|
|
|||||||||||||||||
|
Warrants
|
100
|
|
—
|
|
—
|
|
—
|
|
—
|
|
—
|
|
—
|
|
—
|
|
100
|
|
|||||||||||||||||
|
Total financial derivatives– assets, at fair value
|
11,487
|
|
—
|
|
(877
|
)
|
949
|
|
46
|
|
(1,809
|
)
|
—
|
|
—
|
|
9,796
|
|
|||||||||||||||||
|
Total investments and financial derivatives–assets, at fair value
|
$
|
638,486
|
|
$
|
(3,049
|
)
|
$
|
13,603
|
|
$
|
(6,856
|
)
|
$
|
263,005
|
|
$
|
(298,776
|
)
|
$
|
6,490
|
|
$
|
(77,629
|
)
|
$
|
535,274
|
|
||||||||
|
Liabilities:
|
|||||||||||||||||||||||||||||||||||
|
Financial derivatives– liabilities, at fair value-
|
|||||||||||||||||||||||||||||||||||
|
Credit default swaps on asset-backed securities
|
$
|
(239
|
)
|
$
|
—
|
|
$
|
(42
|
)
|
$
|
(41
|
)
|
$
|
—
|
|
$
|
42
|
|
$
|
—
|
|
$
|
—
|
|
$
|
(280
|
)
|
||||||||
|
Total return swaps
|
—
|
|
—
|
|
353
|
|
(1,903
|
)
|
(353
|
)
|
—
|
|
—
|
|
—
|
|
(1,903
|
)
|
|||||||||||||||||
|
Total financial derivatives– liabilities, at fair value
|
(239
|
)
|
—
|
|
311
|
|
(1,944
|
)
|
(353
|
)
|
42
|
|
—
|
|
—
|
|
(2,183
|
)
|
|||||||||||||||||
|
Securitized debt:
|
|||||||||||||||||||||||||||||||||||
|
Securitized debt
|
(774
|
)
|
(2
|
)
|
—
|
|
20
|
|
101
|
|
—
|
|
—
|
|
—
|
|
(655
|
)
|
|||||||||||||||||
|
Total securitized debt
|
(774
|
)
|
(2
|
)
|
—
|
|
20
|
|
101
|
|
—
|
|
—
|
|
—
|
|
(655
|
)
|
|||||||||||||||||
|
Total financial derivatives– liabilities and securitized debt, at fair value
|
$
|
(1,013
|
)
|
$
|
(2
|
)
|
$
|
311
|
|
$
|
(1,924
|
)
|
$
|
(252
|
)
|
$
|
42
|
|
$
|
—
|
|
$
|
—
|
|
$
|
(2,838
|
)
|
||||||||
All amounts of net realized and change in net unrealized gain (loss) in the table above are reflected in the accompanying Consolidated Statement of Operations. The table above incorporates changes in net unrealized gain (loss) for both Level 3 financial instruments held by the Company at
June 30, 2015
, as well as Level 3 financial instruments disposed of by the Company during the six month period ended
June 30, 2015
. For Level 3 financial instruments held by the Company at
June 30, 2015
, change in net unrealized gain (loss) of
$(1.0) million
,
$1.0 million
,
$(1.9) million
, and
$0.02 million
for the six month period ended
June 30, 2015
relate to investments, financial derivatives–assets, financial derivatives–liabilities, and securitized debt, respectively.
As of
June 30, 2015
, the Company transferred
$77.6 million
of non-Agency RMBS from Level 3 to Level 2. These assets were transferred from Level 3 to Level 2 based on an increased volume of observed trading of these and similar assets. This
55
increase in observed trading activity has led to greater price transparency for these assets, thereby making a Level 2 designation appropriate in the Company's view. However, changes in the volume of observable inputs for these assets, such as a decrease in the volume of observed trading, could impact price transparency, and thereby cause a change in the level designation for these assets in future periods.
In addition, as of
June 30, 2015
, the Company transferred
$6.5 million
of non-Agency RMBS from Level 2 to Level 3. Following December 2014, these securities have exhibited indications of a reduced level of price transparency. Examples of such indications include wider spreads relative to similar securities and a reduction in observable transactions involving these and similar securities. Changes in these indications could impact price transparency, and thereby cause a change in the level designation in future periods.
4. To Be Announced RMBS
In addition to investing in pools of Agency RMBS, the Company transacts in the forward settling TBA market. Pursuant to these TBA transactions, the Company agrees to purchase or sell, for future delivery, Agency RMBS with certain principal and interest terms and certain types of underlying collateral, but the particular Agency RMBS to be delivered is not identified until shortly before the TBA settlement date. TBAs are liquid and have quoted market prices and represent the most actively traded class of MBS. The Company accounts for its TBAs as purchase and sales and uses TBAs primarily for hedging purposes, typically in the form of short positions. However, the Company may also invest in TBAs for speculative purposes, including holding long positions. Overall, the Company typically holds a net short position.
The Company does not generally take delivery of TBAs; rather, it settles the associated receivable and payable with its trading counterparties on a net basis. Transactions with the same counterparty for the same TBA that result in a reduction of the position are treated as extinguished. The fair value of the Company's positions in long TBA contracts are reflected on the Consolidated Condensed Schedule of Investments under TBA–Fixed Rate Agency Securities and the fair value of the Company's positions in TBA contracts sold short are reflected on the Consolidated Condensed Schedule of Investments under TBA–Fixed Rate Agency Securities Sold Short. The payables and receivables related to the Company's TBA securities are included on the Consolidated Statement of Assets, Liabilities, and Equity in Payable for securities purchased and Receivable for securities sold, respectively.
The below table details TBA assets, liabilities, and the respective related payables and receivables as of
June 30, 2016
and December 31, 2015:
|
As of
|
||||||||
|
June 30, 2016
|
December 31, 2015
|
|||||||
|
Assets:
|
(In thousands)
|
|||||||
|
TBA securities, at fair value (Current principal: $153,018 and $94,602, respectively)
|
$
|
161,619
|
|
$
|
98,009
|
|
||
|
Receivable for securities sold relating to unsettled TBA sales
|
486,668
|
|
613,023
|
|
||||
|
Liabilities:
|
||||||||
|
TBA securities sold short, at fair value (Current principal: -$455,613 and -$580,992, respectively)
|
$
|
(488,151
|
)
|
$
|
(612,777
|
)
|
||
|
Payable for securities purchased relating to unsettled TBA purchases
|
(161,563
|
)
|
(98,049
|
)
|
||||
|
Net short TBA securities, at fair value
|
(326,532
|
)
|
(514,768
|
)
|
||||
56
5. Financial Derivatives
Gains and losses on the Company's derivative contracts for the three and six month periods ended
June 30, 2016
and 2015 are summarized in the tables below:
Three and Six Month Periods Ended
June 30, 2016
:
|
Three Month Period Ended June 30, 2016
|
Six Month Period Ended June 30, 2016
|
|||||||||||||||||
|
Derivative Type
|
Primary Risk
Exposure
|
Net Realized
Gain/(Loss)
(1)
|
Change in Net Unrealized Gain/(Loss)
(2)
|
Net Realized
Gain/(Loss)
(1)
|
Change in Net Unrealized Gain/(Loss)
(2)
|
|||||||||||||
|
(In thousands)
|
||||||||||||||||||
|
Credit default swaps on asset-backed securities
|
Credit
|
$
|
310
|
|
$
|
(125
|
)
|
$
|
385
|
|
$
|
(231
|
)
|
|||||
|
Credit default swaps on asset-backed indices
|
Credit
|
222
|
|
2,685
|
|
2,808
|
|
1,755
|
|
|||||||||
|
Credit default swaps on corporate bond indices
|
Credit
|
(5,911
|
)
|
(7,434
|
)
|
(13,010
|
)
|
(17,831
|
)
|
|||||||||
|
Credit default swaps on corporate bonds
|
Credit
|
154
|
|
(62
|
)
|
126
|
|
61
|
|
|||||||||
|
Total return swaps
|
Equity Market/Credit
|
(1,248
|
)
|
(465
|
)
|
(6,914
|
)
|
4,382
|
|
|||||||||
|
Interest rate swaps
|
Interest Rates
|
2,434
|
|
(6,273
|
)
|
(1,349
|
)
|
(12,217
|
)
|
|||||||||
|
Futures
|
Interest Rates/Equity Market
|
(201
|
)
|
20
|
|
(736
|
)
|
146
|
|
|||||||||
|
Forwards
|
Currency
|
(972
|
)
|
3,500
|
|
(1,305
|
)
|
454
|
|
|||||||||
|
Warrants
|
Credit
|
—
|
|
—
|
|
(50
|
)
|
—
|
|
|||||||||
|
Mortgage loan purchase commitments
|
Interest Rates
|
—
|
|
(35
|
)
|
—
|
|
8
|
|
|||||||||
|
Options
|
Credit/
Interest Rates |
1,857
|
|
5,384
|
|
6,331
|
|
360
|
|
|||||||||
|
Total
|
$
|
(3,355
|
)
|
$
|
(2,805
|
)
|
$
|
(13,714
|
)
|
$
|
(23,113
|
)
|
||||||
|
(1)
|
Includes gain/(loss) on foreign currency transactions on derivatives in the amount of
$(150) thousand
and
$(532) thousand
, for the three and six month periods ended
June 30, 2016
, which is included on the Consolidated Statement of Operations in Realized gain (loss) on foreign currency transactions.
|
|
(2)
|
Includes foreign currency translation on derivatives in the amount of
$(122) thousand
and
$1.0 million
, for the three and six month periods ended
June 30, 2016
, which is included on the Consolidated Statement of Operations in Change in net unrealized gain (loss) on foreign currency translation.
|
57
Three and Six Month Periods Ended
June 30, 2015
(1)
:
|
Three Month Period Ended June 30, 2015
|
Six Month Period Ended
June 30, 2015 |
|||||||||||||||||
|
Derivative Type
|
Primary Risk
Exposure
|
Net Realized Gain/(Loss)
|
Change in Net Unrealized Gain/(Loss)
(2)
|
Net Realized Gain/(Loss)
|
Change in Net Unrealized Gain/(Loss)
(2)
|
|||||||||||||
|
(In thousands)
|
||||||||||||||||||
|
Credit default swaps on asset-backed securities
|
Credit
|
$
|
(1,586
|
)
|
$
|
1,015
|
|
$
|
(1,204
|
)
|
$
|
660
|
|
|||||
|
Credit default swaps on asset-backed indices
|
Credit
|
(644
|
)
|
590
|
|
(273
|
)
|
(456
|
)
|
|||||||||
|
Credit default swaps on corporate bond indices
|
Credit
|
(871
|
)
|
2,500
|
|
(1,760
|
)
|
671
|
|
|||||||||
|
Credit default swaps on corporate bonds
|
Credit
|
(271
|
)
|
292
|
|
(939
|
)
|
777
|
|
|||||||||
|
Total return swaps
|
Equity Market/Credit
|
(3,917
|
)
|
(1,464
|
)
|
(2,565
|
)
|
(1,657
|
)
|
|||||||||
|
Interest rate swaps
(3)
|
Interest Rates
|
(3,210
|
)
|
8,464
|
|
(8,948
|
)
|
5,797
|
|
|||||||||
|
Futures
|
Interest Rates/Equity Market
|
101
|
|
(990
|
)
|
2,467
|
|
(577
|
)
|
|||||||||
|
Forwards
|
Currency
|
(4,320
|
)
|
1,704
|
|
1,476
|
|
239
|
|
|||||||||
|
Options
|
Credit/
Interest Rates |
705
|
|
1,438
|
|
(2,305
|
)
|
2,946
|
|
|||||||||
|
Total
|
$
|
(14,013
|
)
|
$
|
13,549
|
|
$
|
(14,051
|
)
|
$
|
8,400
|
|
||||||
|
(1)
|
Conformed to current period presentation.
|
|
(2)
|
Includes foreign currency translation on derivatives in the amount of
$0.9 million
and
$0.1 million
, for the three and six month periods ended June 30, 2015, respectively, which is included on the Consolidated Statement of Operations in Change in net unrealized gain (loss) on foreign currency translation.
|
|
(3)
|
Includes a
$1.5 million
reimbursement from a third party.
|
58
The tables below detail the average notional values of the Company's financial derivatives, using absolute value of month end notional values, for the six month period ended
June 30, 2016
and the year ended December 31, 2015:
|
Derivative Type
|
Six Month
Period Ended
June 30, 2016
|
Year Ended
December 31, 2015 |
||||||
|
(In thousands)
|
||||||||
|
Interest rate swaps
|
$
|
1,948,286
|
|
$
|
2,463,892
|
|
||
|
Credit default swaps
|
2,168,110
|
|
1,080,772
|
|
||||
|
Total return swaps
|
112,441
|
|
112,641
|
|
||||
|
Futures
|
521,057
|
|
880,682
|
|
||||
|
Options
|
591,422
|
|
865,600
|
|
||||
|
Forwards
|
91,825
|
|
107,448
|
|
||||
|
Warrants
|
1,555
|
|
1,554
|
|
||||
|
Mortgage loan purchase commitments
|
8,013
|
|
2,093
|
|
||||
From time to time the Company enters into credit derivative contracts for which the Company sells credit protection ("written credit derivatives"). As of
June 30, 2016
and December 31, 2015, all of the Company's open written credit derivatives were credit default swaps on either mortgage/asset-backed indices (ABX and CMBX indices) or corporate bond indices (CDX), collectively referred to as credit indices, or on individual corporate bonds, for which the Company receives periodic payments at fixed rates from credit protection buyers, and is obligated to make payments to the credit protection buyer upon the occurrence of a "credit event" with respect to underlying reference assets.
Written credit derivatives held by the Company at
June 30, 2016
and December 31, 2015, are summarized below:
|
Credit Derivatives
|
Amount at
June 30, 2016
|
Amount at
December 31, 2015 |
||||||
|
(In thousands)
|
||||||||
|
Fair Value of Written Credit Derivatives, Net
|
$
|
93,307
|
|
$
|
135,443
|
|
||
|
Fair Value of Purchased Credit Derivatives Offsetting Written Credit Derivatives with Third Parties
(1)
|
$
|
(902
|
)
|
$
|
(369
|
)
|
||
|
Notional Amount of Written Credit Derivatives
(2)
|
$
|
(741,569
|
)
|
$
|
(799,750
|
)
|
||
|
Notional Amount of Purchased Credit Derivatives Offsetting Written Credit Derivatives with Third Parties
(1)
|
$
|
16,132
|
|
$
|
17,322
|
|
||
|
(1)
|
Offsetting transactions with third parties include purchased credit derivatives which have the same reference obligation.
|
|
(2)
|
The notional value is the maximum amount that a seller of credit protection would be obligated to pay, and a buyer of credit protection would receive upon occurrence of a "credit event." Movements in the value of credit default swap transactions may require the Company or the counterparty to post or receive collateral. Amounts due or owed under credit derivative contracts with an International Swaps and Derivatives Association, or "ISDA," counterparty may be offset against amounts due or owed on other credit derivative contracts with the same ISDA counterparty. As a result, the notional amount of written credit derivatives involving a particular underlying reference asset or index has been reduced (but not below zero) by the notional amount of any contracts where the Company has purchased credit protection on the same reference asset or index with the same ISDA counterparty.
|
A credit default swap on a credit index or a corporate bond typically terminates at the stated maturity date in the case of corporate indices or bonds, or, in the case of ABX and CMBX indices, the date that all of the reference assets underlying the index are paid off in full, retired, or otherwise cease to exist. Implied credit spreads may be used to determine the market value of such contracts and are reflective of the cost of buying/selling credit protection. Higher spreads would indicate a greater likelihood that a seller will be obligated to perform (
i.e.
, make payment) under the contract. In situations where the credit quality of the underlying reference assets has deteriorated, the percentage of notional values paid up front ("points up front") is frequently used as an indication of credit risk. Credit protection sellers entering the market would expect to be paid points up front corresponding to the approximate fair value of the contract. For the Company's written credit derivatives that were outstanding at June 30, 2016, implied credit spreads on such contracts ranged between 24.0 and 3,583.1 basis points. For the Company's written credit derivatives that were outstanding at December 31, 2015, implied credit spreads on such contracts ranged between 19.5 and 4,628.7 basis points. Total net up-front payments received relating to written credit derivatives outstanding at
June 30, 2016
and December 31, 2015 were
$97.9 million
and
$137.8 million
, respectively.
59
6. Borrowings under Reverse Repurchase Agreements and Securitized Debt
Reverse Repurchase Agreements
The Company enters into reverse repurchase agreements. A reverse repurchase agreement involves the sale of an asset to a counterparty together with a simultaneous agreement to repurchase the transferred asset or similar asset from such counterparty at a future date. The Company accounts for its reverse repurchase agreements as collateralized borrowings, with the transferred assets effectively serving as collateral for the related borrowing. The Company's reverse repurchase agreements typically range in term from
30
to
180
days, although the Company also has reverse repurchase agreements that provide for longer or shorter terms. The principal economic terms of each reverse repurchase agreement—such as loan amount, interest rate, and maturity date—are typically negotiated on a transaction-by-transaction basis. Other terms and conditions, such as those relating to events of default, are typically governed under the Company's master repurchase agreements. Absent an event of default, the Company maintains beneficial ownership of the transferred securities during the term of the reverse repurchase agreement and receives the related principal and interest payments. Interest rates on these borrowings are generally fixed based on prevailing rates corresponding to the terms of the borrowings, and for most reverse repurchase agreements, interest is generally paid at the termination of the reverse repurchase agreement, at which time the Company may enter into a new reverse repurchase agreement at prevailing market rates with the same counterparty, repay that counterparty and possibly negotiate financing terms with a different counterparty, or choose to no longer finance the related asset. Some reverse repurchase agreements provide for periodic payments of interest, such as monthly payments. In response to a decline in the fair value of the transferred securities, whether as a result of changes in market conditions, security paydowns, or other factors, reverse repurchase agreement counterparties will typically make a margin call, whereby the Company will be required to post additional securities and/or cash as collateral with the counterparty in order to re-establish the agreed-upon collateralization requirements. In the event of increases in fair value of the transferred securities, the Company can generally require the counterparty to post collateral with it in the form of cash or securities. The Company is generally permitted to sell or re-pledge any securities posted by the counterparty as collateral; however, upon termination of the reverse repurchase agreement, or other circumstance in which the counterparty is no longer required to post such margin, the Company must return to the counterparty the same security that had been posted. The contractual amount (loan amount) of the Company's reverse repurchase agreements approximates their fair value, as the debt is short-term in nature.
At any given time, the Company seeks to have its outstanding borrowings under reverse repurchase agreements with several different counterparties in order to reduce the exposure to any single counterparty. The Company had outstanding borrowings under reverse repurchase agreements with
twenty
counterparties as of
June 30, 2016
and
eighteen
counterparties as of December 31, 2015.
At
June 30, 2016
, approximately
17%
of open reverse repurchase agreements were with
one
counterparty. At December 31, 2015, approximately
15%
of open reverse repurchase agreements were with
one
counterparty. As of
June 30, 2016
remaining days to maturity on the Company's open reverse repurchase agreements ranged from
1 day
to
484
days and from
4
days to
666
days as of December 31, 2015. Interest rates on the Company's open reverse repurchase agreements ranged from
0.57%
to
3.46%
as of
June 30, 2016
and from
0.37%
to
2.92%
as of December 31, 2015.
60
The following table details the Company's outstanding borrowings under reverse repurchase agreements for Agency RMBS and Credit assets, which include non-Agency MBS, CLOs, consumer loans, corporate debt, residential mortgage loans, and U.S. Treasury securities, by remaining maturity as of
June 30, 2016
and December 31, 2015:
|
(In thousands)
|
June 30, 2016
|
December 31, 2015
|
||||||||||||||||||
|
Weighted Average
|
Weighted Average
|
|||||||||||||||||||
|
Remaining Maturity
|
Outstanding
Borrowings
|
Interest Rate
|
Remaining Days to Maturity
|
Outstanding Borrowings
|
Interest Rate
|
Remaining Days to Maturity
|
||||||||||||||
|
Agency RMBS:
|
||||||||||||||||||||
|
30 Days or Less
|
$
|
361,738
|
|
0.69
|
%
|
15
|
|
$
|
295,277
|
|
0.54
|
%
|
14
|
|
||||||
|
31-60 Days
|
254,400
|
|
0.69
|
%
|
43
|
|
203,144
|
|
0.54
|
%
|
44
|
|
||||||||
|
61-90 Days
|
199,636
|
|
0.72
|
%
|
78
|
|
239,431
|
|
0.68
|
%
|
74
|
|
||||||||
|
91-120 Days
|
—
|
|
—
|
%
|
—
|
|
193,962
|
|
0.56
|
%
|
106
|
|
||||||||
|
151-180 Days
|
—
|
|
—
|
%
|
—
|
|
1,506
|
|
1.57
|
%
|
175
|
|
||||||||
|
Total Agency RMBS
|
815,774
|
|
0.70
|
%
|
39
|
|
933,320
|
|
0.58
|
%
|
56
|
|
||||||||
|
Credit:
|
||||||||||||||||||||
|
30 Days or Less
|
19,109
|
|
1.26
|
%
|
4
|
|
14,674
|
|
1.94
|
%
|
17
|
|
||||||||
|
31-60 Days
|
18,186
|
|
1.90
|
%
|
49
|
|
26,419
|
|
1.87
|
%
|
39
|
|
||||||||
|
61-90 Days
|
72,843
|
|
2.77
|
%
|
68
|
|
82,292
|
|
2.46
|
%
|
67
|
|
||||||||
|
91-120 Days
|
4,518
|
|
2.27
|
%
|
98
|
|
—
|
|
—
|
%
|
—
|
|
||||||||
|
121-150 Days
|
9,669
|
|
2.60
|
%
|
126
|
|
—
|
|
—
|
%
|
—
|
|
||||||||
|
151-180 Days
|
12,021
|
|
2.92
|
%
|
167
|
|
24,193
|
|
2.62
|
%
|
164
|
|
||||||||
|
181-360 Days
|
85,671
|
|
3.10
|
%
|
307
|
|
23,877
|
|
2.80
|
%
|
346
|
|
||||||||
|
>360 Days
|
32,171
|
|
2.72
|
%
|
484
|
|
69,414
|
|
2.51
|
%
|
666
|
|
||||||||
|
Total Credit Assets
|
254,188
|
|
2.72
|
%
|
204
|
|
240,869
|
|
2.47
|
%
|
272
|
|
||||||||
|
U.S. Treasury Securities:
|
||||||||||||||||||||
|
30 Days or Less
|
143
|
|
0.80
|
%
|
1
|
|
—
|
|
—
|
%
|
—
|
|
||||||||
|
Total U.S. Treasury Securities
|
143
|
|
0.80
|
%
|
1
|
|
—
|
|
—
|
%
|
—
|
|
||||||||
|
Total
|
$
|
1,070,105
|
|
1.18
|
%
|
78
|
|
$
|
1,174,189
|
|
0.97
|
%
|
100
|
|
||||||
Reverse repurchase agreements involving underlying investments that the Company sold prior to period end, for settlement following period end, are shown using their original maturity dates even though such reverse repurchase agreements may be expected to be terminated early upon settlement of the sale of the underlying investment. Not included above are reverse repurchase agreements that the Company may have entered into prior to period end for which delivery of the borrowed funds is not scheduled until after period end in the amount of
$143 thousand
and
$4.4 million
as of
June 30, 2016
and December 31, 2015, respectively.
As of
June 30, 2016
and December 31, 2015, the fair value of investments transferred as collateral under outstanding borrowings under reverse repurchase agreements was
$1.24 billion
and
$1.35 billion
, respectively. Collateral transferred under outstanding borrowings as of
June 30, 2016
include investments in the amount of
$21.8 million
that were sold prior to period end but for which such sale had not yet settled. In addition the Company posted net cash collateral of
$35.4 million
and additional securities with a fair value of
$6.0 million
as of
June 30, 2016
to its counterparties. Collateral transferred under outstanding borrowings as of December 31, 2015 include investments in the amount of
$16.8 million
that were sold prior to period end but for which such sale had not yet settled. In addition, the Company posted net cash collateral of
$25.5 million
and additional securities with a fair value of
$5.1 million
as of December 31, 2015 as a result of margin calls from various counterparties.
Securitized Debt
In addition to its borrowings under reverse repurchase agreements, the Company has entered into a securitization transaction to finance certain of its commercial mortgage loans and REO which was accounted for as a collateralized borrowing. As of
June 30, 2016
, the Company had outstanding borrowings in the amount of
$13.0 million
in connection with this securitization which is reflected under the caption "Securitized debt," on the Company's Consolidated Statement of Assets, Liabilities, and Equity. The Company did not have any outstanding borrowings classified as Securitized debt as of December 31, 2015. As of
June 30, 2016
, the fair value of commercial mortgage loans and REO collateralizing this financing was
$29.0
61
million
. Interest accrues at a rate of LIBOR plus
3.25%
and the debt has a maturity date of March 16, 2018. See Note 7 for further information on the Company's securitized debt.
7. Related Party Transactions
The Company is party to a Management Agreement (which may be amended from time to time), pursuant to which the Manager manages the assets, operations, and affairs of the Company, in consideration of which the Company pays the Manager management and incentive fees. Effective November 3, 2015, the Board of Directors approved a Sixth Amended and Restated Management Agreement, between the Company and the Manager. The descriptions of the Base Management Fees and Incentive Fees are detailed below.
Base Management Fees
The Operating Partnership pays the Manager
1.50%
per annum of total equity of the Operating Partnership calculated in accordance with U.S. GAAP as of the end of each fiscal quarter (before deductions for base management fees and incentive fees payable with respect to such fiscal quarter), provided that total equity is adjusted to exclude one-time events pursuant to changes in U.S. GAAP, as well as non-cash charges after discussion between the Manager and the Company's independent directors, and approval by a majority of the Company's independent directors in the case of non-cash charges.
Summary information
—For the three month periods ended
June 30, 2016
and 2015, the total base management fee incurred was
$2.6 million
and
$2.9 million
, respectively. For the six month periods ended
June 30, 2016
and 2015, the total base management fee incurred was
$5.2 million
and
$5.9 million
, respectively.
Incentive Fees
The Manager is entitled to receive a quarterly incentive fee equal to the positive excess, if any, of (i) the product of (A)
25%
and (B) the excess of (1) Adjusted Net Income (described below) for the Incentive Calculation Period (which means such fiscal quarter and the immediately preceding three fiscal quarters) over (2) the sum of the Hurdle Amounts (described below) for the Incentive Calculation Period, over (ii) the sum of the incentive fees already paid or payable for each fiscal quarter in the Incentive Calculation Period preceding such fiscal quarter.
For purposes of calculating the incentive fee, "Adjusted Net Income" for the Incentive Calculation Period means the net increase in equity from operations of the Operating Partnership, after all base management fees but before any incentive fees for such period, and excluding any non-cash equity compensation expenses for such period, as reduced by any Loss Carryforward (as described below) as of the end of the fiscal quarter preceding the Incentive Calculation Period.
For purposes of calculating the incentive fee, the "Loss Carryforward" as of the end of any fiscal quarter is calculated by determining the excess, if any, of (1) the Loss Carryforward as of the end of the immediately preceding fiscal quarter over (2) the Company's net increase in equity from operations (expressed as a positive number) or net decrease in equity from operations (expressed as a negative number) of the Operating Partnership for such fiscal quarter. As of
June 30, 2016
there was a Loss Carryforward of
$18.1 million
.
For purposes of calculating the incentive fee, the "Hurdle Amount" means, with respect to any fiscal quarter, the product of (i) one-fourth of the greater of (A)
9%
and (B)
3%
plus the 10-year U.S. Treasury rate for such fiscal quarter, (ii) the sum of (A) the weighted average gross proceeds per share of all common share and OP Unit issuances since inception of the Company and up to the end of such fiscal quarter, with each issuance weighted by both the number of shares and OP Units issued in such issuance and the number of days that such issued shares and OP Units were outstanding during such fiscal quarter, using a first-in first-out basis of accounting (
i.e.
attributing any share and OP Unit repurchases to the earliest issuances first) and (B) the result obtained by dividing (I) retained earnings attributable to common shares and OP Units at the beginning of such fiscal quarter by (II) the average number of common shares and OP Units outstanding for each day during such fiscal quarter, (iii) the sum of the average number of common shares, LTIP Units, and OP Units outstanding for each day during such fiscal quarter. For purposes of determining the Hurdle Amount, issuances of common shares and OP Units (a) as equity incentive awards, (b) to the Manager as part of its base management fee or incentive fee and (c) to the Manager or any of its affiliates in privately negotiated transactions, are excluded from the calculation. The payment of the incentive fee will be in a combination of common shares and cash, provided that at least
10%
of any quarterly payment will be made in common shares.
Summary information
—The Company did not incur any expense for incentive fees for either of the three or six month periods ended
June 30, 2016
and 2015, since on a rolling four quarter basis, the Company's income did not exceed the prescribed hurdle amount.
62
Termination Fees
The Management Agreement requires the Company to pay a termination fee to the Manager in the event of (1) the Company's termination or non-renewal of the Management Agreement without cause or (2) the Company's termination of the Management Agreement based on unsatisfactory performance by the Manager that is materially detrimental to the Company (3) the Manager's termination of the Management Agreement upon a default by the Company in the performance of any material term of the Management Agreement. Such termination fee will be equal to the amount of three times the sum of (i) the average annual Quarterly Base Management Fee Amounts paid or payable with respect to the two 12-month periods ending on the last day of the latest fiscal quarter completed on or prior to the date of the notice of termination or non-renewal and (ii) the average annual Quarterly Incentive Fee Amounts paid or payable with respect to the two 12-month periods ending on the last day of the latest fiscal quarter completed on or prior to the date of the notice of termination or non-renewal.
Expense Reimbursement
Under the terms of the Management Agreement the Company is required to reimburse the Manager for operating expenses related to the Company that are incurred by the Manager, including expenses relating to legal, accounting, due diligence, other services, and all other costs and expenses. The Company's reimbursement obligation is not subject to any dollar limitation. Expenses will be reimbursed in cash within
60 days
following delivery of the expense statement by the Manager; provided, however, that such reimbursement may be offset by the Manager against amounts due to the Company from the Manager. The Company will not reimburse the Manager for the salaries and other compensation of the Manager's personnel except that the Company will be responsible for expenses incurred by the Manager in employing certain dedicated or partially dedicated personnel as further described below.
The Company reimburses the Manager for the allocable share of the compensation, including, without limitation, wages, salaries, and employee benefits paid or reimbursed, as approved by the Compensation Committee of the Board of Directors to certain dedicated or partially dedicated personnel who spend all or a portion of their time managing the Company's affairs, based upon the percentage of time devoted by such personnel to the Company's affairs. In their capacities as officers or personnel of the Manager or its affiliates, such personnel will devote such portion of their time to the Company's affairs as is necessary to enable the Company to operate its business.
For the six month periods ended
June 30, 2016
and 2015, the Company reimbursed the Manager
$3.4 million
and
$2.0 million
, respectively, for previously incurred operating and compensation expenses.
Equity Investments in Certain Mortgage Originators
The Company has non-controlling investments in the form of debt and equity in various mortgage originators. As of
June 30, 2016
, of the mortgage originators that the Company has invested in,
two
represent related parties. Transactions that have been entered into with these related party mortgage originators are summarized below.
In March 2015, the Company made an initial investment in a mortgage originator in the form of preferred and common stock. In addition, the Company entered into a flow mortgage loan purchase and sale agreement with the mortgage originator whereby the Company has committed to purchase eligible residential mortgage loans. See Note 15, Commitments and Contingencies, for further information on such flow agreement. The Company has also entered into a
$3.0 million
loan agreement for a warehouse facility with the mortgage originator. Under the terms of the facility, the Company has agreed to make advances to the mortgage originator solely for the purpose of funding residential mortgage loans designated for sale to the Company. To the extent the advances are drawn by the mortgage originator, it must pay interest, equal to LIBOR plus
5.00%
, on the unpaid amount of each advance from the date the advance is made until such advance is paid in full. The mortgage originator is required to repay advances made in full no later than two business days following the date the Company purchases the loans from the mortgage originator. As of
June 30, 2016
, there were
$0.6 million
in advances outstanding.
In connection with its equity interest in another mortgage originator, the Company has entered into an agreement whereby it guarantees the performance of the mortgage originator under a third-party warehouse facility. The Company also has funded and caused a letter of credit to be issued by a bank for the benefit of this mortgage originator, in order to assist it in complying with its state licensing requirements. See Note 15, Commitments and Contingencies for further information on the Company's guarantee of the third party warehouse facility for the benefit of the mortgage originator.
63
Investment in Affiliate
The Company has investments in participation certificates related to consumer loans held in a trust owned by a related party of the Manager. Through its participation certificates, the Company has beneficial interests in the cash flows of the underlying loans held by such trust. The Company's investment in participation certificates in the amount of
$6.0 million
and
$3.8 million
as of
June 30, 2016
and December 31, 2015, respectively, is included on the Company's Consolidated Condensed Schedule of Investments in Consumer Loans and Asset-backed Securities backed by Consumer Loans.
Participation in Multi-Borrower Financing Facility
The Company is a co-participant in an agreement with another entity managed by an affiliate of Ellington, or the "affiliated entity," in order to facilitate the financing of certain small balance commercial mortgage loans and REO owned by the Company and the affiliated entity, respectively (the "SBC Assets"). In connection with this financing, each of the Company and the affiliated entity transferred their respective SBC Assets to a jointly owned entity, which in turn transferred these assets to a securitization trust. In March 2016, the securitization trust issued
$37.5 million
in debt, collateralized by the SBC Assets, to a large financial institution. While the Company's SBC Assets were transferred to the securitization trust, the Company's SBC Assets and the related debt have not been derecognized for financial reporting purposes, because the Company continues to retain the risks and rewards of ownership of its SBC Assets. The debt issued by the trust amortizes over its original term of
two years
, and the Company's portion of this debt at issuance was
$23.2 million
. As of
June 30, 2016
, the outstanding debt of the trust was
$27.3 million
and the Company's portion was
$13.0 million
and is reflected under the caption "Securitized debt," on the Company's Consolidated Statement of Assets, Liabilities, and Equity. To the extent there is a default under the financing arrangement, such as the insolvency of either the Company or the affiliated entity, the assets of the non-defaulting party could be used to satisfy outstanding obligations under the financing arrangement. As of
June 30, 2016
, the affiliated entity was solvent.
8. Long-Term Incentive Plan Units
Units held pursuant to the Individual LTIPs are generally exercisable by the holder at any time after vesting. Each unit is convertible into one common share. Costs associated with the Individual LTIPs are measured as of the grant date and expensed ratably over the vesting period. Total expense associated with Individual LTIPs for both the three month periods ended
June 30, 2016
and 2015 was
$0.1 million
. Total expense associated with Individual LTIPs for both the six month periods ended
June 30, 2016
and 2015 was
$0.2 million
.
The below table details on the Company's unvested LTIP units:
|
Grant Recipient
|
Number of LTIP units Granted
|
Grant Date
|
Vesting Date
(1)
|
||||
|
Independent directors:
|
|||||||
|
7,425
|
|
September 15, 2015
|
September 14, 2016
|
||||
|
Partially dedicated employees:
|
|||||||
|
7,822
|
|
December 15, 2015
|
December 15, 2016
|
||||
|
689
|
|
December 15, 2015
|
December 31, 2016
|
||||
|
5,949
|
|
December 15, 2015
|
December 15, 2017
|
||||
|
686
|
|
December 15, 2015
|
December 31, 2017
|
||||
|
6,247
|
|
December 11, 2014
|
December 11, 2016
|
||||
|
Total unvested LTIP units at June 30, 2016
|
28,818
|
|
|||||
|
(1)
|
Date at which such LTIP units will vest and become non-forfeitable.
|
64
The following table summarizes issuance and exercise activity of the Company's LTIP units for the three month periods ended
June 30, 2016
and 2015:
|
Three Month Period Ended
June 30, 2016
|
Three Month Period Ended
June 30, 2015 |
||||||||||||||||
|
Manager
|
Director/
Employee
|
Total
|
Manager
|
Director/
Employee
|
Total
|
||||||||||||
|
LTIP Units Outstanding (3/31/2016 and 3/31/2015, respectively)
|
375,000
|
|
74,938
|
|
449,938
|
|
375,000
|
|
54,314
|
|
429,314
|
|
|||||
|
Granted
|
—
|
|
—
|
|
—
|
|
—
|
|
—
|
|
—
|
|
|||||
|
Exercised
|
—
|
|
—
|
|
—
|
|
—
|
|
—
|
|
—
|
|
|||||
|
LTIP Units Outstanding (6/30/2016 and 6/30/2015, respectively)
|
375,000
|
|
74,938
|
|
449,938
|
|
375,000
|
|
54,314
|
|
429,314
|
|
|||||
|
LTIP Units Vested and Outstanding (6/30/2016 and 6/30/2015, respectively)
|
375,000
|
|
46,120
|
|
421,120
|
|
375,000
|
|
29,859
|
|
404,859
|
|
|||||
The following table summarizes issuance and exercise activity of the Company's LTIP units for the six month periods ended
June 30, 2016
and 2015:
|
Six Month Period Ended
June 30, 2016
|
Six Month Period Ended
June 30, 2015 |
||||||||||||||||
|
Manager
|
Director/
Employee
|
Total
|
Manager
|
Director/
Employee
|
Total
|
||||||||||||
|
LTIP Units Outstanding (12/31/2015 and 12/31/2014, respectively)
|
375,000
|
|
74,938
|
|
449,938
|
|
375,000
|
|
54,314
|
|
429,314
|
|
|||||
|
Granted
|
—
|
|
—
|
|
—
|
|
—
|
|
—
|
|
—
|
|
|||||
|
Exercised
|
—
|
|
—
|
|
—
|
|
—
|
|
—
|
|
—
|
|
|||||
|
LTIP Units Outstanding (6/30/2016 and 6/30/2015, respectively)
|
375,000
|
|
74,938
|
|
449,938
|
|
375,000
|
|
54,314
|
|
429,314
|
|
|||||
|
LTIP Units Vested and Outstanding (6/30/2016 and 6/30/2015, respectively)
|
375,000
|
|
46,120
|
|
421,120
|
|
375,000
|
|
29,859
|
|
404,859
|
|
|||||
9. Non-controlling Interests
Operating Partnership
Non-controlling interests include the interest in the Operating Partnership owned by an affiliate of the Manager and certain related parties. On January 1, 2013,
212,000
OP Units were issued to the initial non-controlling interest member. Income allocated to the non-controlling interest is based on the non-controlling interest owners' ownership percentage of the Operating Partnership during the quarter, calculated using a daily weighted average of all common shares and convertible units outstanding during the quarter. Holders of OP Units are entitled to receive the same distributions that holders of common shares receive, and OP Units are convertible into common shares on a one-for-one basis, subject to specified limitations. OP Units are non-voting with respect to matters as to which common shareholders are entitled to vote. As of
June 30, 2016
, non-controlling interest related to the outstanding
212,000
OP Units represented an interest of approximately
0.6%
in the Operating Partnership.
Joint Venture Interests
Non-controlling interests also include the interests of joint venture partners in various consolidated subsidiaries of the Company. These subsidiaries hold the Company's investments in certain commercial mortgage loans and REO. These joint venture partners participate in these subsidiaries on a pari passu basis with the Company at a predetermined percentage, and therefore participate in all income, expense, gains and losses of such subsidiaries. These joint venture partners make capital contributions to the subsidiaries as new approved investments are purchased by the subsidiaries, and are generally entitled to distributions when investments are sold or otherwise disposed of. As of
June 30, 2016
these joint venture partners' interests in subsidiaries of the Company were
$0.8 million
, representing an approximately
5%
interest in such subsidiaries.
These joint venture partners' interests are not convertible into common shares of the Company or OP Units, nor are these joint venture partners entitled to receive distributions that holders of common shares of the Company receive.
65
10. Common Share Capitalization
During the three month periods ended
June 30, 2016
and 2015, the Board of Directors authorized dividends totaling
$0.50
per share and
$0.65
per share, respectively. Total dividends paid during the three month periods ended June 30, 2016 and 2015 were
$16.7 million
and
$22.2 million
, respectively. During the six month periods ended
June 30, 2016
and 2015, the Board of Directors authorized dividends totaling
$1.00
per share and
$1.30
per share, respectively. Total dividends paid during the six month periods ended
June 30, 2016
and 2015 were
$33.6 million
and
$44.3 million
, respectively.
The following table summarizes issuance, repurchase and other activity with respect to the Company's common shares for the three and six month periods ended
June 30, 2016
and 2015:
|
Three Month Period Ended June 30, 2016
|
Three Month Period Ended June 30, 2015
|
Six Month Period Ended June 30, 2016
|
Six Month Period Ended June 30, 2015
|
|||||||||
|
Common Shares Outstanding
(3/31/2016, 3/31/2015, 12/31/2015, and 12/31/2014, respectively)
|
32,962,979
|
|
33,449,678
|
|
33,126,012
|
|
33,449,678
|
|
||||
|
Share Activity:
|
||||||||||||
|
Shares repurchased
|
(219,623
|
)
|
—
|
|
(382,656
|
)
|
—
|
|
||||
|
Common Shares Outstanding
(6/30/2016, 6/30/2015, 6/30/2016, and 6/30/2015, respectively)
|
32,743,356
|
|
33,449,678
|
|
32,743,356
|
|
33,449,678
|
|
||||
If all LTIP and OP Units that have been previously issued were to become fully vested and exchanged for common shares as of
June 30, 2016
and 2015, the Company's issued and outstanding common shares would increase to
33,405,294
and
34,090,992
shares, respectively.
On August 3, 2015, the Company's Board of Directors approved the adoption of a share repurchase program under which the Company is authorized to repurchase up to
1.7 million
common shares. The program, which is open-ended in duration, allows the Company to make repurchases from time to time on the open market or in negotiated transactions, including under Rule 10b5-1 plans. Repurchases are at the Company's discretion, subject to applicable law, share availability, price and our financial performance, among other considerations. This program supersedes the program that was previously adopted on August 4, 2011. During the three month period ended
June 30, 2016
, the Company repurchased
219,623
shares at an average price per share of
$17.26
and a total cost of
$3.8 million
. During the six month period ended
June 30, 2016
, the Company repurchased
382,656
shares at an average price per share of
$17.31
and a total cost of
$6.6 million
.
66
11. Earnings Per Share
The components of the computation of basic and diluted EPS were as follows:
|
Three Month Period Ended June 30,
|
Six Month Period Ended June 30,
|
|||||||||||||||
|
2016
|
2015
|
2016
|
2015
|
|||||||||||||
|
(In thousands except share amounts)
|
||||||||||||||||
|
Net increase (decrease) in shareholders' equity resulting from operations
|
$
|
4,985
|
|
$
|
13,152
|
|
$
|
(18,215
|
)
|
$
|
32,413
|
|
||||
|
Add: Net (decrease) increase in equity resulting from operations attributable to the participating non-controlling interest
(1)
|
32
|
|
82
|
|
(115
|
)
|
202
|
|
||||||||
|
Net increase (decrease) in equity resulting from operations related to common shares, LTIP unit holders, and participating non-controlling interest
|
5,017
|
|
13,234
|
|
(18,330
|
)
|
32,615
|
|
||||||||
|
Net increase (decrease) in shareholders' equity resulting from operations available to common share and LTIP unit holders:
|
||||||||||||||||
|
Net increase (decrease) in shareholders' equity resulting from operations– common shares
|
4,918
|
|
12,985
|
|
(17,970
|
)
|
32,002
|
|
||||||||
|
Net increase (decrease) in shareholders' equity resulting from operations– LTIP units
|
67
|
|
167
|
|
(245
|
)
|
411
|
|
||||||||
|
Dividends Paid
(2)
:
|
||||||||||||||||
|
Common shareholders
|
(16,413
|
)
|
(21,742
|
)
|
(32,954
|
)
|
(43,486
|
)
|
||||||||
|
LTIP unit holders
|
(225
|
)
|
(279
|
)
|
(450
|
)
|
(558
|
)
|
||||||||
|
Non-controlling interest
|
(106
|
)
|
(138
|
)
|
(212
|
)
|
(274
|
)
|
||||||||
|
Total dividends paid to common shareholders, LTIP unit holders, and non-controlling interest
|
(16,744
|
)
|
(22,159
|
)
|
(33,616
|
)
|
(44,318
|
)
|
||||||||
|
Undistributed (Distributed in excess of) earnings:
|
||||||||||||||||
|
Common shareholders
|
(11,495
|
)
|
(8,757
|
)
|
(50,924
|
)
|
(11,484
|
)
|
||||||||
|
LTIP unit holders
|
(158
|
)
|
(112
|
)
|
(695
|
)
|
(147
|
)
|
||||||||
|
Non-controlling interest
|
(74
|
)
|
(56
|
)
|
(327
|
)
|
(72
|
)
|
||||||||
|
Total undistributed (distributed in excess of) earnings attributable to common shareholders, LTIP unit holders, and non-controlling interest
|
$
|
(11,727
|
)
|
$
|
(8,925
|
)
|
$
|
(51,946
|
)
|
$
|
(11,703
|
)
|
||||
|
Weighted average shares outstanding (basic and diluted):
|
||||||||||||||||
|
Weighted average common shares outstanding
|
32,840,429
|
|
33,449,678
|
|
32,962,056
|
|
33,449,678
|
|
||||||||
|
Weighted average participating LTIP units
|
449,938
|
|
429,314
|
|
449,938
|
|
429,314
|
|
||||||||
|
Weighted average non-controlling interest units
|
212,000
|
|
212,000
|
|
212,000
|
|
212,000
|
|
||||||||
|
Basic earnings per common share:
|
||||||||||||||||
|
Distributed
|
$
|
0.50
|
|
$
|
0.65
|
|
$
|
1.00
|
|
$
|
1.30
|
|
||||
|
Undistributed (Distributed in excess of)
|
(0.35
|
)
|
(0.26
|
)
|
(1.54
|
)
|
(0.34
|
)
|
||||||||
|
$
|
0.15
|
|
$
|
0.39
|
|
$
|
(0.54
|
)
|
$
|
0.96
|
|
|||||
|
Diluted earnings per common share:
|
||||||||||||||||
|
Distributed
|
$
|
0.50
|
|
$
|
0.65
|
|
$
|
1.00
|
|
$
|
1.30
|
|
||||
|
Undistributed (Distributed in excess of)
|
(0.35
|
)
|
(0.26
|
)
|
(1.54
|
)
|
(0.34
|
)
|
||||||||
|
$
|
0.15
|
|
$
|
0.39
|
|
$
|
(0.54
|
)
|
$
|
0.96
|
|
|||||
|
(1)
|
For the three month periods ended
June 30, 2016
and 2015, excludes net increase in equity resulting from operations of
$(0.1) million
and
$(11) thousand
, respectively attributable to joint venture partners, which have non-participating interests as described in Note 9. For the six month periods ended
June 30, 2016
and 2015, excludes net increase in equity resulting from operations of
$0.1 million
and
$25 thousand
, respectively attributable to joint venture partners, which have non-participating interests as described in Note 9.
|
|
(2)
|
The Company pays quarterly dividends in arrears, so a portion of the dividends paid in each calendar year relate to the prior year's earnings.
|
67
12. Counterparty Risk
As of
June 30, 2016
, investments with an aggregate value of approximately
$1.24 billion
were held with dealers as collateral for various reverse repurchase agreements. The investments held as collateral include securities in the amount of
$21.8 million
that were sold prior to period end but for which such sale had not yet settled as of
June 30, 2016
.
The following table details the percentage of such collateral held by counterparties who hold greater than
15%
of the aggregate
$1.24 billion
in collateral for various reverse repurchase agreements as of
June 30, 2016
. In addition to the below, unencumbered investments, on a settlement date basis, of approximately
$84.2 million
were held in custody at the Bank of New York Mellon Corporation.
|
Dealer
|
% of Total
Collateral on
Reverse Repurchase
Agreements
|
|
|
Royal Bank of Canada
|
16%
|
|
The following table details the percentage of collateral amounts held by dealers who hold greater than
15%
of the Company's Due from Brokers, included as of
June 30, 2016
:
|
Dealer
|
% of Total Due
from Brokers
|
|
|
Morgan Stanley
|
35%
|
|
|
J.P. Morgan Securities Inc.
|
25%
|
|
The following table details the percentage of amounts held by dealers who hold greater than
15%
of the Company's Receivable for securities sold as of
June 30, 2016
:
|
Dealer
|
% of Total Receivable
for Securities Sold
|
|
|
Barclays Capital Inc.
|
26%
|
|
|
CS First Boston
|
23%
|
|
In addition, the Company held cash and cash equivalents of
$140.4 million
and
$183.9 million
as of
June 30, 2016
and December 31, 2015, respectively. The below table details the concentration of cash and cash equivalents held by each counterparty:
|
As of
|
||||
|
Counterparty
|
June 30, 2016
|
December 31, 2015
|
||
|
Bank of New York Mellon Corporation
|
62%
|
13%
|
||
|
BlackRock Liquidity TempFund
|
36%
|
54%
|
||
|
US Bank
|
2%
|
—%
|
||
|
J.P. Morgan US Dollar Liquidity Fund
|
—%
|
27%
|
||
|
J.P. Morgan US Treasury Plus Premier Fund
|
—%
|
6%
|
||
13. Restricted Cash
The Company is required to maintain certain cash balances with counterparties and/or unrelated third parties for various activities and transactions.
In connection with the warehouse facility provided by the Company to one of the mortgage originators in which it has invested, as described in Note 7, Related Party Transactions, the Company has placed cash into a restricted account in the Company's name, which is available to be drawn upon by the mortgage originator as needed to fund the origination of residential mortgage loans designated for sale to the Company.
In connection with the letter of credit with another mortgage originator, as described in Note 7, Related Party Transactions, funds have been deposited into an account for the benefit of the mortgage originator.
The Company is required to maintain a specific cash balance in a segregated account pursuant to a flow consumer loan purchase and sale agreement.
The Company is also required to maintain specific minimum cash balances in connection with certain regulated subsidiaries, including its insurance captive subsidiary as well as its subsidiary that holds various state mortgage origination licenses.
68
The below table details the Company's restricted cash balances included in Restricted cash on the Consolidated Statement of Assets, Liabilities, and Equity as of
June 30, 2016
and December 31, 2015.
|
June 30, 2016
|
December 31, 2015
|
|||||||
|
(In thousands)
|
||||||||
|
Restricted cash balance related to:
|
||||||||
|
Warehouse facility
|
$
|
2,420
|
|
$
|
427
|
|
||
|
Letter of credit
|
230
|
|
230
|
|
||||
|
Flow consumer loan purchase and sale agreement
|
750
|
|
3,700
|
|
||||
|
Minimum account balance required for regulatory purposes
|
505
|
|
500
|
|
||||
|
Total
|
$
|
3,905
|
|
$
|
4,857
|
|
||
14. Offsetting of Assets and Liabilities
The Company records financial instruments at fair value as described in Note 2. All financial instruments are recorded on a gross basis on the Condensed Statement of Assets, Liabilities, and Equity. In connection with the vast majority of its derivative, repurchase and reverse repurchase agreements, and the related trading agreements, the Company and its counterparties are required to pledge collateral. Cash or other collateral is exchanged as required with each of the Company's counterparties in connection with open derivative positions, repurchase agreements, and reverse repurchase agreements.
The following tables present information about certain assets and liabilities representing financial instruments as of
June 30, 2016
and December 31, 2015. The Company has not entered into master netting agreements with any of its counterparties. Certain of the Company's repurchase and reverse repurchase agreements and financial derivative transactions are governed by underlying agreements that generally provide a right of offset in the event of default or in the event of a bankruptcy of either party to the transaction.
June 30, 2016
:
|
Description
|
Gross Amounts of Assets (Liabilities) in the Consolidated Statement of Assets, Liabilities, and Equity
|
Gross Amounts Offset in the Consolidated Statement of Assets, Liabilities, and Equity
|
Amount of Assets (Liabilities) Presented in the Consolidated Statements of Assets, Liabilities, and Equity
(1)
|
Financial Instruments Available for Offset
|
Financial Instruments Transferred or Pledged as Collateral
(2)(3)
|
Cash Collateral (Received) Pledged
(2)(3)
|
Net Amount
|
|||||||||||||||||||||
|
(In thousands)
|
||||||||||||||||||||||||||||
|
Assets
|
||||||||||||||||||||||||||||
|
Financial derivatives–assets
|
$
|
152,628
|
|
$
|
—
|
|
$
|
152,628
|
|
$
|
(37,919
|
)
|
$
|
—
|
|
$
|
(75,676
|
)
|
$
|
39,033
|
|
|||||||
|
Repurchase agreements
|
129,993
|
|
(13,990
|
)
|
116,003
|
|
(116,003
|
)
|
—
|
|
—
|
|
—
|
|
||||||||||||||
|
Liabilities
|
|
|||||||||||||||||||||||||||
|
Financial derivatives–liabilities
|
(74,098
|
)
|
—
|
|
(74,098
|
)
|
37,919
|
|
—
|
|
36,179
|
|
—
|
|
||||||||||||||
|
Reverse repurchase agreements
|
(1,083,940
|
)
|
13,835
|
|
(1,070,105
|
)
|
116,003
|
|
950,974
|
|
3,128
|
|
—
|
|
||||||||||||||
69
December 31, 2015:
|
Description
|
Amount of Assets (Liabilities) Presented in the Consolidated Statements of Assets, Liabilities, and Equity
(1)
|
Financial Instruments Available for Offset
|
Financial Instruments Transferred or Pledged as Collateral
(2)(3)
|
Cash Collateral (Received) Pledged
(2)(3)
|
Net Amount
|
|||||||||||||||
|
(In thousands)
|
||||||||||||||||||||
|
Assets
|
||||||||||||||||||||
|
Financial derivatives–assets
|
$
|
162,905
|
|
$
|
(18,644
|
)
|
$
|
—
|
|
$
|
(105,202
|
)
|
$
|
39,059
|
|
|||||
|
Repurchase agreements
|
105,700
|
|
(105,700
|
)
|
—
|
|
—
|
|
—
|
|
||||||||||
|
Liabilities
|
||||||||||||||||||||
|
Financial derivatives–liabilities
|
(60,472
|
)
|
18,644
|
|
—
|
|
41,699
|
|
(129
|
)
|
||||||||||
|
Reverse repurchase agreements
|
(1,174,189
|
)
|
105,700
|
|
1,042,947
|
|
25,542
|
|
—
|
|
||||||||||
|
(1)
|
In the Company's Consolidated Statement of Assets, Liabilities, and Equity, all balances associated with repurchase agreements, reverse repurchase agreements, and financial derivatives are presented on a gross basis.
|
|
(2)
|
For the purpose of this presentation, for each row the total amount of financial instruments transferred or pledged and cash collateral (received) or pledged may not exceed the applicable gross amount of assets or (liabilities) as presented here. Therefore, the Company has reduced the amount of financial instruments transferred or pledged as collateral related to the Company's reverse repurchase agreements and cash collateral pledged on the Company's financial derivative liabilities. Total financial instruments transferred or pledged as collateral on the Company's reverse repurchase agreements as of
June 30, 2016
and December 31, 2015 were
$1.24 billion
and
$1.36 billion
, respectively. As of
June 30, 2016
and December 31, 2015, total cash collateral on financial derivative assets excludes excess net cash collateral pledged of
$11.4 million
and
$4.1 million
, respectively. As of
June 30, 2016
and December 31, 2015, total cash collateral on financial derivative liabilities excludes excess cash collateral pledged of
$38.6 million
and
$45.8 million
, respectively.
|
|
(3)
|
When collateral is pledged to or pledged by a counterparty, it is often pledged or posted with respect to all positions with such counterparty, and in such cases such collateral cannot be specifically identified as relating to a specific asset or liability. As a result, in preparing the above tables, the Company has made assumptions in allocating pledged or posted collateral among the various rows.
|
15. Commitments and Contingencies
The Company provides current directors and officers with a limited indemnification against liabilities arising in connection with the performance of their duties to the Company.
In the normal course of business the Company may also enter into contracts that contain a variety of representations, warranties, and general indemnifications. The Company's maximum exposure under these arrangements, including future claims that may be made against the Company that have not yet occurred, is unknown. The Company has not incurred any costs to defend lawsuits or settle claims related to these indemnification agreements. The Company has no liabilities recorded for these agreements as of
June 30, 2016
and December 31, 2015.
The Company has entered into a purchase agreement whereby it has committed to purchase newly issued consumer loans originated by a third party over a term that was extended in November 2015 and expires in November 2016. As of
June 30, 2016
, the Company's remaining purchase commitment in connection with the purchase agreement is
$11.1 million
in total principal balance.
The Company has entered into a flow consumer loan purchase and sale agreement, open-ended in duration, with a third party whereby the Company has committed to purchase up to
$100 million
of eligible consumer loans. As of
June 30, 2016
, the Company has purchased
$89.1 million
in eligible consumer loans under this agreement.
In January 2016, the Company entered into a purchase agreement, open-ended in duration, with a third party whereby it has committed to purchase
$375 million
of principal balance of eligible consumer loans. As of
June 30, 2016
, the Company has purchased
$5.1 million
of principal balance in eligible consumer loans under the agreement.
In August 2015 the Company entered into participation and guarantee agreements, with terms expiring in August 2016, whereby: (i) the Company purchased a
$10 million
participation interest in a borrowing facility structured as a repurchase agreement, or "Repo Facility," between two parties unrelated to the Company, and (ii) the Company guarantees the borrower's payment obligations under the Repo Facility. The borrower may borrow up to
$200 million
under the Repo Facility, which is collateralized by residential mortgage loans which are required to be (1) eligible for guarantee by the Federal National Mortgage Association or the Federal Home Loan Mortgage Corporation, or (2) eligible for insurance by the Federal Housing Administration, or the U.S. Department of Veterans Affairs. To the extent the borrower performs under the Repo Facility over the term of the participation and guarantee agreements, the Company will be reimbursed in full its
$10 million
participation interest. Should the borrower default under the Repo Facility, the Company would be required to post to the lender an additional
5%
of the then-outstanding amount borrowed under the Repo Facility and should the lender then exercise its rights under the guarantee, the Company could be required to purchase the mortgage loan collateral at a price equal to the aggregate
70
amount borrowed under the Repo Facility, inclusive of accrued interest and any outstanding unused facility fees. In this case, the Company would have full recourse to the borrower to the extent of any deficit between the value of the mortgage loan collateral and the price paid by the Company for such collateral. The Company has the option, but not the obligation, to finance a specified portion of such purchase with the lender for up to
six months
via a pre-negotiated, committed repurchase facility. As a result of these agreements, the Company's risk is a function of the ongoing creditworthiness of the borrower and market value of the mortgage loan collateral in relation to the amount owed by the borrower under the Repo Facility. For its participation in this arrangement, the Company is paid monthly and quarterly fees based on the amount utilized under the Repo Facility. Fees received are included in "Other Income" on the Company's Consolidated Statement of Operations. The participation interest in the amount of
$10 million
is included in "Due from broker" on the Company's Consolidated Statement of Assets, Liabilities, and Equity. The Company's obligation under this arrangement is deemed to be a guaranty under ASC 460-10, Guarantees, and is carried at fair value and included in "Other Liabilities," on the Consolidated Statement of Assets, Liabilities, and Equity.
As of
June 30, 2016
the borrower utilized approximately
$196.6 million
under the Repo Facility and is performing on its obligations under such facility. The Company is considering renewing its participation in, and guarantee of, the Repo Facility upon its expiration.
Commitments and Contingencies Related to Investments in Mortgage Originators
As of
June 30, 2016
, the Company had non-controlling investments in multiple mortgage originators. In connection with certain of its investments in such mortgage originators, the Company has outstanding commitments and contingencies as described below.
In connection with its equity interest in a mortgage originator, as described in Note 7, Related Party Transactions, the Company has entered into an agreement whereby it guarantees the performance of the mortgage originator under a warehouse facility. As of
June 30, 2016
, the Company's maximum guarantee was
$12.5 million
. The Company's obligation under this arrangement is deemed to be a guaranty under ASC 460-10, Guarantees, and is carried at fair value and included in "Other Liabilities," on the Consolidated Statement of Assets, Liabilities, and Equity.
In March 2015, the Company made an initial investment in another mortgage originator in the form of preferred and common stock. As described in Note 7, Related Party Transactions, the Company entered into a flow mortgage loan purchase and sale agreement with the mortgage originator whereby the Company has committed to purchase eligible residential mortgage loans, to the extent they are originated in accordance with the Company's specifications, which it may modify in its sole discretion, in an amount of at least
$200 million
. The Company may opt to increase the amount purchased in its sole discretion based on its evaluation of mortgage loans previously purchased as well as market conditions. As of
June 30, 2016
, the Company purchased loans under this agreement in the amount of
$40.6 million
.
16. Financial Highlights
Results of Operations for a Share Outstanding Throughout the Periods:
|
Three Month Period Ended June 30, 2016
|
Three Month Period Ended June 30, 2015
|
Six Month Period Ended June 30, 2016
|
Six Month Period Ended June 30, 2015
|
|||||||||||||
|
Beginning Shareholders' Equity Per Share (3/31/2016, 3/31/2015, 12/31/2015, and 12/31/2014, respectively)
|
$
|
20.91
|
|
$
|
23.30
|
|
$
|
22.10
|
|
$
|
23.38
|
|
||||
|
Net Investment Income
|
0.26
|
|
0.53
|
|
0.62
|
|
1.05
|
|
||||||||
|
Net Realized/Unrealized Gains (Losses)
|
(0.11
|
)
|
(0.13
|
)
|
(1.17
|
)
|
(0.07
|
)
|
||||||||
|
Results of Operations Attributable to Equity
|
0.15
|
|
0.40
|
|
(0.55
|
)
|
0.98
|
|
||||||||
|
Less: Results of Operations Attributable to Non-controlling Interests
|
—
|
|
—
|
|
—
|
|
(0.01
|
)
|
||||||||
|
Results of Operations Attributable to Shareholders' Equity
(1)
|
0.15
|
|
0.40
|
|
(0.55
|
)
|
0.97
|
|
||||||||
|
Dividends Paid to Common Shareholders
|
(0.50
|
)
|
(0.65
|
)
|
(1.00
|
)
|
(1.30
|
)
|
||||||||
|
Weighted Average Share Impact on Dividends Paid
(2)
|
(0.01
|
)
|
(0.01
|
)
|
(0.02
|
)
|
(0.01
|
)
|
||||||||
|
Accretive (Dilutive) Effect of Share Issuances (Net of Offering Costs), Share Repurchases, and Adjustments to Non-controlling Interest
|
0.03
|
|
—
|
|
0.05
|
|
—
|
|
||||||||
|
Ending Shareholders' Equity Per Share (6/30/2016, 6/30/2015, 6/30/2016, and 6/30/2015, respectively)
(3)
|
$
|
20.58
|
|
$
|
23.04
|
|
$
|
20.58
|
|
$
|
23.04
|
|
||||
|
Shares Outstanding, end of period
|
32,743,356
|
|
33,449,678
|
|
32,743,356
|
|
33,449,678
|
|
||||||||
71
|
(1)
|
Calculated based on average common shares outstanding and can differ from the calculation for EPS (See Note 11).
|
|
(2)
|
Per share impact on dividends paid relating to share issuances/repurchases during the period as well as dividends paid to LTIP and OP Unit holders.
|
|
(3)
|
If all LTIP units and OP Units previously issued were vested and exchanged for common shares as of
June 30, 2016
and 2015, shareholders' equity per share would be $20.31 and $22.75, respectively.
|
Total Return:
The Company calculates its total return two ways, one based on its reported net asset value and the other based on its publicly-traded share price.
The following table illustrates the Company's total return for the periods presented based on net asset value:
Net Asset Value Based Total Return for a Shareholder:
(1)
|
Three Month Period Ended June 30, 2016
|
Three Month Period Ended June 30, 2015
|
Six Month Period Ended June 30, 2016
|
Six Month Period Ended June 30, 2015
|
|||||
|
Total Return
|
0.82%
|
1.67%
|
(2.38)%
|
4.18%
|
||||
|
(1)
|
Total return is calculated assuming reinvestment of distributions at shareholders' equity per share during the period.
|
Market Based Total Return for a Shareholder:
For the three month periods ended
June 30, 2016
and 2015, the Company's market based total return based on the closing price as reported by the New York Stock Exchange was
1.15%
and
(3.98)%
, respectively. For the six month periods ended
June 30, 2016
and 2015, the Company's market based total return based on the closing price as reported by the New York Stock Exchange was
8.00%
and
(1.14)%
, respectively. Calculation of market based total return assumes the reinvestment of dividends at the closing price as reported by the New York Stock Exchange as of the ex-date.
Net Investment Income Ratio to Average Equity:
(1)
|
Three Month Period Ended June 30, 2016
|
Three Month Period Ended June 30, 2015
|
Six Month Period Ended June 30, 2016
|
Six Month Period Ended June 30, 2015
|
|||||
|
Net Investment Income
(2)
|
4.98%
|
8.99%
|
5.79%
|
9.00%
|
||||
|
(1)
|
Average equity is calculated using month end values.
|
|
(2)
|
Includes all items of income and expense on an annualized basis.
|
Expense Ratios to Average Equity:
(1)(2)
|
Three Month Period Ended June 30, 2016
|
Three Month Period Ended June 30, 2015
|
Six Month Period Ended June 30, 2016
|
Six Month Period Ended June 30, 2015
|
|||||
|
Operating expenses, before interest expense and other investment related expenses
|
(2.96)%
|
(2.54)%
|
(2.88)%
|
(2.60)%
|
||||
|
Interest expense and other investment related expenses
|
(3.76)%
|
(2.04)%
|
(3.31)%
|
(2.10)%
|
||||
|
Total Expenses
|
(6.72)%
|
(4.58)%
|
(6.19)%
|
(4.70)%
|
||||
|
(1)
|
Average equity is calculated using month end values.
|
|
(2)
|
Includes all items of income and expense on an annualized basis.
|
17. Subsequent Events
On August 1, 2016, the Company's Board of Directors approved a dividend for the second quarter of 2016 in the amount of
$0.50
per share payable on September 15, 2016 to shareholders of record as of September 1, 2016.
72
In this Quarterly Report on Form 10-Q, except where the context suggests otherwise, "EFC," "we," "us," and "our" refer to Ellington Financial LLC and its subsidiaries, our "Manager" refers to Ellington Financial Management LLC, our external manager, and "Ellington" refers to Ellington Management Group, L.L.C. and its affiliated investment advisory firms.
SPECIAL NOTE REGARDING FORWARD-LOOKING STATEMENTS
When used in this Quarterly Report on Form 10-Q, in future filings with the Securities and Exchange Commission ("SEC") or in press releases or other written or oral communications issued or made by us, statements which are not historical in nature, including those containing words such as "believe," "expect," "anticipate," "estimate," "project," "plan," "continue," "intend," "should," "would," "could," "goal," "objective," "will," "may," "seek," or similar expressions, are intended to identify "forward-looking statements" within the meaning of Section 27A of the Securities Act of 1933, as amended, and Section 21E of the Securities Exchange Act of 1934, as amended, and, as such, may involve known and unknown risks, uncertainties, and assumptions.
Forward-looking statements are based on our beliefs, assumptions, and expectations of our future performance, taking into account all information currently available to us. These beliefs, assumptions, and expectations are subject to risks and uncertainties and can change as a result of many possible events or factors, not all of which are known to us. If a change occurs, our business, financial condition, liquidity, and results of operations may vary materially from those expressed or implied in our forward-looking statements. The following factors are examples of those that could cause actual results to vary from our forward-looking statements: changes in interest rates and the market value of our securities; market volatility; changes in the prepayment rates on the mortgage loans underlying our agency securities; increased rates of default and/or decreased recovery rates on our assets; the availability and costs of financing to fund our assets; changes in government regulations affecting our business; our ability to maintain our exclusion from registration under the Investment Company Act of 1940, as amended (the "Investment Company Act"); and risks associated with investing in real estate assets, including changes in business conditions and the general economy. These and other risks, uncertainties and factors, including the risk factors described under Item 1A of our Annual Report on Form 10-K for the fiscal year ended December 31, 2015 as filed with the SEC, could cause our actual results to differ materially from those projected or implied in any forward-looking statements we make. All forward-looking statements speak only as of the date on which they are made. New risks and uncertainties arise over time and it is not possible to predict those events or how they may affect us. Except as required by law, we are not obligated to, and do not intend to, update or revise any forward-looking statements, whether as a result of new information, future events, or otherwise.
Executive Summary
We are a specialty finance company that primarily acquires and manages mortgage-related assets, including residential mortgage-backed securities, or "RMBS," residential mortgage loans, commercial mortgage-backed securities, or "CMBS," commercial mortgage loans and other commercial real estate debt, real property, and mortgage-related derivatives. We also invest in corporate debt and equity securities, collateralized loan obligations, or "CLOs," consumer loans and asset-backed securities, or "ABS," backed by consumer and commercial assets, non-mortgage-related derivatives, and other financial assets, including private debt and equity investments in mortgage-related entities. We are externally managed and advised by our Manager, an affiliate of Ellington. Ellington is a registered investment adviser with a 21-year history of investing in a broad spectrum of mortgage-backed securities, or "MBS," and related derivatives.
We conduct all of our operations and business activities through Ellington Financial Operating Partnership LLC, or the "Operating Partnership." As of
June 30, 2016
, we have an ownership interest of approximately 99.4% in the Operating Partnership. The interest of approximately
0.6%
not owned by us represents the interest in the Operating Partnership that is owned by an affiliate of our Manager and certain related parties, and is reflected in our financial statements as a non-controlling interest.
Our primary objective is to generate attractive, risk-adjusted total returns for our shareholders. We seek to attain this objective by utilizing an opportunistic strategy to make investments, without restriction as to ratings, structure, or position in the capital structure, that we believe compensate us appropriately for the risks associated with them rather than targeting a specific yield. Our evaluation of the potential risk-adjusted return of any potential investment typically involves weighing the potential returns of such investment under a variety of economic scenarios against the perceived likelihood of the various scenarios. Potential investments subject to greater risk (such as those with lower credit ratings and/or those with a lower position in the capital structure) will generally require a higher potential return to be attractive in comparison to investment alternatives with lower potential return and a lower degree of risk. However, at any particular point in time, depending on how we perceive the market's pricing of risk both generally and across sectors, we may favor higher-risk assets or we may favor lower-risk assets, or a combination of the two in the interests of portfolio diversification or other considerations.
73
Through
June 30, 2016
, our Credit strategy has been the primary driver of our risk and return, and we expect that this will continue in the near- to medium-term. However, while we believe opportunities in U.S. non-Agency MBS remain, we believe other asset classes offer attractive returns as well as asset diversification. These asset classes include residential and commercial mortgage loans, which can be performing, non-performing, or sub-performing; CLOs; European non-dollar denominated investments; other mortgage-related structured investments; consumer loans and ABS backed by consumer loans; private debt and/or equity investments in mortgage originators and other mortgage-related entities; and distressed corporate debt. Our investments in these asset classes, together with our non-Agency MBS and real estate owned, are collectively referred to as our Credit portfolio. We believe that Ellington's proprietary research and analytics allow our Manager to identify attractive assets in these classes, value these assets, monitor and forecast the performance of these assets, and opportunistically hedge our risk with respect to these assets.
We continue to maintain a highly leveraged portfolio of Agency RMBS to take advantage of opportunities in that market sector and to maintain our exclusion from registration as an investment company under the Investment Company Act. Unless we acquire very substantial amounts of whole mortgage loans or there are changes to the rules and regulations applicable to us under the Investment Company Act, we expect that we will always maintain some core amount of Agency RMBS.
We also use leverage in our Credit strategy, albeit significantly less leverage than that used in our Agency RMBS strategy. Through
June 30, 2016
, we financed our asset purchases primarily through reverse repurchase agreements, or "reverse repos," which we account for as collateralized borrowings and we expect to continue to obtain the vast majority of our financing through the use of reverse repos. In addition to financing our assets through reverse repos, in March 2016 we entered into a securitization transaction to finance certain of our commercial mortgage loans and REO which was accounted for as a collateralized borrowing.
The strategies that we employ are intended to capitalize on opportunities in the current market environment. We intend to adjust our strategies to changing market conditions by shifting our asset allocations across various asset classes as credit and liquidity trends evolve over time. We believe that this flexibility, combined with Ellington's experience, will help us generate more consistent returns on our capital throughout changing market cycles.
As of
June 30, 2016
, outstanding borrowings under reverse repos and securitized debt were
$1.1 billion
and our debt-to-equity ratio was
1.59
to 1. Our debt-to-equity ratio does not account for liabilities other than debt financings. Of our total borrowings outstanding as of
June 30, 2016
, approximately 75.3%, or $815.8 million, relates to our Agency RMBS holdings. The remaining outstanding borrowings relate to our non-Agency MBS, CLOs, consumer loans, corporate debt, residential mortgage loans, commercial mortgage loans and REO, and U.S. Treasury securities.
We opportunistically hedge our credit risk, interest rate risk, and foreign currency risk; however, at any point in time we may choose not to hedge all or a portion of these risks, and we will generally not hedge those risks that we believe are appropriate for us to take at such time, or that we believe would be impractical or prohibitively expensive to hedge.
We believe that we have been organized and have operated so that we have qualified, and will continue to qualify, to be treated for U.S. federal income tax purposes as a partnership and not as an association or a publicly traded partnership taxable as a corporation.
We also measure our book value per share and our total return on a diluted basis, assuming all convertible units were converted into common shares at their respective issuance dates. As of
June 30, 2016
, our diluted book value per share was
$20.31
as compared to $20.63 as of March 31, 2016 and $21.80 as of December 31, 2015. On a diluted basis, the Company's total return for the three and six month periods ended
June 30, 2016
was 0.84% and (2.33)%, respectively. Additionally our diluted net-asset-value-based total return was 155.95% from our inception (August 17, 2007) through
June 30, 2016
, and our annualized inception-to-date diluted net-asset-value-based total return was 11.17% as of
June 30, 2016
.
Trends and Recent Market Developments
Key trends and recent market developments for the U.S. mortgage market and other credit markets include the following:
|
•
|
U.S. Federal Reserve and U.S. Monetary Policy—
In July 2016, the U.S. Federal Reserve, or "Federal Reserve," maintained its target range for the federal funds rate and its existing policy of reinvesting principal payments from its U.S. Treasury security and Agency RMBS holdings;
|
|
•
|
Housing and Mortgage Market Statistics—
Data released by S&P Dow Jones Indices for its S&P CoreLogic Case-Shiller Indices for May showed a continuation of mid-single-digit home price appreciation nationally; meanwhile, the Freddie Mac survey 30-year mortgage rate ended the second quarter of 2016 at 3.48%, down from 3.71% at the end of the first quarter of 2016;
|
74
|
•
|
Government Sponsored Enterprise, or "GSE," and Government Agency Developments
—The Federal Housing Finance Agency, or "FHFA," and the GSEs continued to announce program and policy changes and clarifications intended to increase mortgage credit availability;
|
|
•
|
Portfolio Overview and Outlook
—The vote by the United Kingdom to leave the European Union, also known as the "Brexit" vote, caused substantial volatility throughout global markets, especially during the month of June. Yield spreads on most credit-sensitive assets initially widened after the Brexit vote, but then tightened following the quick coordinated accommodative posture taken by a number of major central banks. Some credit-sensitive sectors, such as non-Agency RMBS and U.S. high-yield corporate credit, generally ended the quarter tighter than where they had started the quarter, while others, such as CMBS, ended the quarter wider. Over the course of the quarter, yield spreads on Agency RMBS were relatively stable in relation to interest rate swaps and U.S. Treasury securities.
|
Federal Reserve and U.S. Monetary Policy
On July 27, 2016, the Federal Open Market Committee, or "FOMC," announced that it would maintain the target range for the federal funds rate at 0.25% to 0.50%. In its July statement following the meeting, the FOMC emphasized that there has been recent strengthening in the labor market, as indicated by strong job gains in June following weak growth in May. The FOMC also stated that economic activity has continued to expand at a moderate rate, and they expect that with gradual adjustments in the stance of monetary policy, the expansion of economic activity and the strengthening of the labor market will continue. Additionally, the FOMC indicated that it expects economic conditions to evolve in such a way that only gradual increases in the federal funds rate will be warranted, and that the federal funds rate is likely to remain, for some time, below prevailing longer run levels.
Over the course of the second quarter, the 10-year U.S. Treasury yield fell by 30 basis points, from 1.77% as of March 31, 2016 to 1.47% as of June 30, 2016. Despite this, we believe that there remains substantial risk that interest rates will increase from current levels, driven by a tightening of Federal Reserve monetary policy in response to employment and economic growth in the United States and other factors. The risk of rising interest rates reinforces the importance of our ability to hedge interest rate risk in both our Agency RMBS and Credit portfolios using a variety of tools, including forward-settling To-Be-Announced Agency pass-through certificates, or "TBAs," interest rate swaps, and various other instruments. Additional uncertainty surrounds the Federal Reserve's timeline to curtail its reinvestment of principal payments from its U.S. Treasury security and Agency RMBS holdings. The current pace of monthly reinvestments under this program is approximately $36 billion, thus providing significant market support.
Housing and Mortgage Market Statistics
The following table demonstrates the decline in residential mortgage delinquencies and foreclosure inventory on a national level, as reported by CoreLogic in its April and May 2016 National Foreclosure Reports:
|
As of
|
|||||||||
|
Number of Units
(In thousands)
|
May 2016
|
February 2016
|
May 2015
|
||||||
|
Seriously Delinquent Mortgages
(1)
|
1,113
|
|
1,226
|
|
1,419
|
|
|||
|
Foreclosure Inventory
|
390
|
|
439
|
|
517
|
|
|||
|
(1)
|
Seriously Delinquent Mortgages are ninety days and over in delinquency and include foreclosures and real estate owned, or "REO," property.
|
As the above table indicates, both the number of seriously delinquent mortgages and the number of homes in foreclosure have declined significantly over the past year. This decline supports the thesis that as many homeowners have re-established equity in their homes through recovering real estate prices, they have become less likely to become delinquent and default on their mortgages.
Monthly housing starts provide another indicator of housing market fundamentals. The following table shows the trailing three-month average housing starts for the periods referenced:
|
As of
|
||||||
|
Number of Units
(In thousands)
|
June 2016
|
March 2016
|
||||
|
Single-family
|
762
|
|
790
|
|
||
|
Multi-family
|
385
|
|
348
|
|
||
Source: U.S. Census Bureau
As of June 2016, average single-family housing starts during the trailing three months decreased by 3.7% as compared to March 2016, while multi-family housing starts increased by approximately 9.7% during the same period.
75
Through the second quarter of 2016, mid-single-digit home price appreciation continued, albeit at a somewhat more modest pace. Data released by S&P Dow Jones Indices for its S&P CoreLogic Case-Shiller Indices for May 2016 showed that, on average, home prices posted a 5.2% year-over-year increase for its 20-City Composite and a 4.4% year-over-year increase for its 10-City Composite, after seasonal adjustments. While overall home price gains year-over-year remain stable in the mid-single-digit range, higher priced homes in some larger cities, such as San Francisco and Miami, have experienced marked slowdowns in home price appreciation in recent months. Additionally, as indicated in the table above, as of May 2016, the national inventory of foreclosed homes fell to 390,000 units, a 24.5% decline when compared to May 2015; this represented the fifty-fifth consecutive month with a year-over-year decline and the lowest level since October 2007. As a result, there are many fewer unsold foreclosed homes hanging over the housing market than there were a year ago. We believe that near-term home price trends are more likely to be driven by fundamental factors such as economic growth, mortgage rates, and affordability, rather than by technical factors such as shadow inventory. Shadow inventory represents the number of properties that are seriously delinquent, in foreclosure, or held as REO by mortgage servicers, but not currently listed on a multiple listing service.
While refinancing activity overall has been slower in recent periods relative to earlier periods when mortgage rates were at comparable levels, recent trends suggest an ongoing divergence between the refinancing behavior of lower balance loans and higher balance loans. As illustrated in the figure below, the average loan size of refinance applications has increased over the past three years, with a 31.6% increase from March 2013 through June 2016.
This steady increase in average loan sizes of mortgage refinances is reflective of a number of changes related to borrower behavior and mortgage credit availability in recent years.
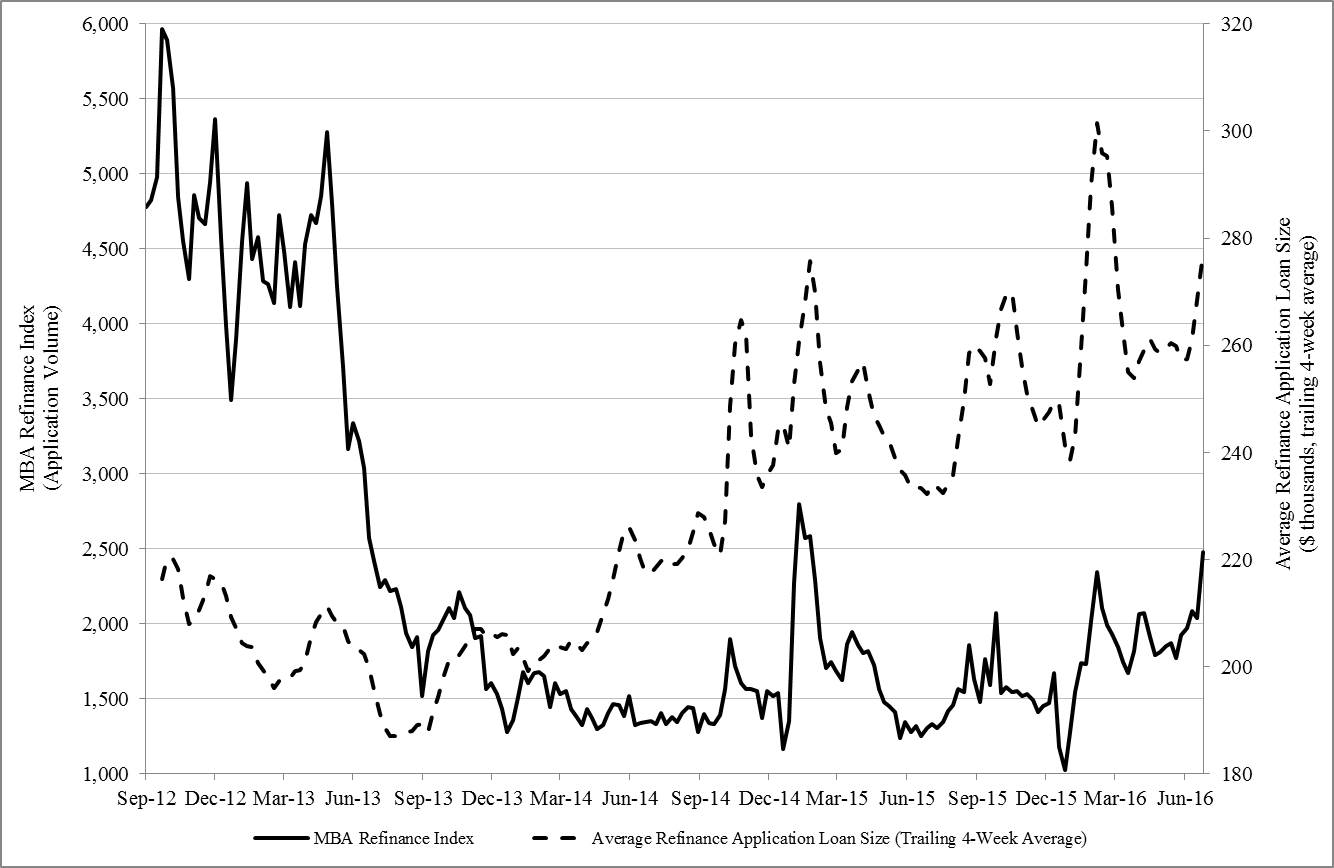
As shown in the figure above, higher loan balance borrowers tend to be more reactive to refinancing incentives, especially following steep declines in rates over a short period. After swift drops in mortgage rates in October 2014, January 2015, March 2015, the first six weeks of 2016, and June 2016, the average refinanced loan size spiked, reflecting a surge in higher loan balance borrowers reacting to the recent decline in mortgage rates. This greater prepayment sensitivity for higher loan size borrowers is well established, and is due in part to greater awareness among such borrowers about refinancing opportunities, as well as greater absolute dollar incentives to refinance relative to lower loan size borrowers.
76
Moreover, while overall mortgage credit availability continues to increase from the depressed levels that followed the financial crisis, credit availability for higher loan size borrowers has been particularly improving recently. In the past several years, a number of the largest lenders, including Bank of America, JP Morgan, Wells Fargo, and PNC Bank, have noticeably loosened lending standards for jumbo mortgage loans typically sought by more affluent borrowers, including lowering minimum FICO requirements and raising maximum LTVs. Affluent borrowers have also generally experienced greater improvements in their creditworthiness, thanks to rising asset prices and a strong rebound in high-end home prices, especially in wealthier cities such as New York and San Francisco. Jumbo mortgage loans have been a rare bright spot for the non-Agency mortgage origination sector in recent years, and for good reason given the excellent credit performance of jumbo mortgage loans originated since the financial crisis. Many banks are also competing more vigorously for affluent customers, in an effort to cross-sell other financial products such as investment and brokerage services. This competition has resulted in a narrowing of the spread between jumbo mortgage rates and conforming mortgage rates, further increasing the relative refinancing incentive for jumbo mortgage loans.
While in the past few years more affluent and higher credit score borrowers have seen the largest increase in mortgage credit availability, more recently first time homebuyers, low-income borrowers, and borrowers in low income areas have started to benefit from an increase in high LTV mortgage lending programs targeted at these demographic groups. While recent growth is still relatively modest in these largely government-funded or non-profit-funded lending programs for less affluent borrowers, it may prefigure future expansions of credit to higher LTV borrowers.
In addition, since the financial crisis, financial reforms, including the Dodd-Frank Wall Street Reform and Consumer Protection Act, or "Dodd-Frank Act," and qualified mortgage, or "QM," mortgage guidelines, have dramatically increased the costs of underwriting, especially for niche products such as second lien and adjustable rate mortgages. Banks have reduced their footprint in the mortgage lending space as the effects of the financial crisis and higher capital requirements have increased the costs of doing business. More recently, market share has been gravitating to non-bank lenders, which do not face the same regulatory capital requirements as banks for servicing mortgages, and which possess superior technology to better assist borrowers in making more efficient refinancing decisions.
One of these companies, Quicken Loans Inc., or "Quicken," has become a leader in efficient mortgage origination in recent years. As shown in the figure below, prepayment speeds on Quicken loans are among the fastest in the industry. As improved technology spreads throughout the lending industry, we believe that the lending industry will change in a number of important ways. First, more efficient mortgage origination should mean that some cost savings will be passed on to borrowers. Smaller balance loans, which are disproportionately used by lower income borrowers, should benefit the most from a reduction in the fixed components of origination costs. Second, borrowers should start to prepay more efficiently, as demonstrated by the higher prepay speeds of mortgage loans serviced by Quicken, which reportedly uses proprietary algorithms to target borrowers who are more likely to refinance, and is particularly quick at contacting borrowers about refinancing incentives when mortgage rates drop enough to make refinancing potentially attractive. A technology-driven, broad-based increase in prepayment efficiency may put pressure on MBS prices and/or reduce the excess spread enjoyed by MBS investors. In the figure below, we show the 3-month constant prepayment rate, or "CPR," for Freddie Mac 30-year fixed rate mortgages with original loan balances between $200,000 and $400,000, loan ages between 12 and 47 months, and with interest rates that are 50–100 basis points above then current market rates.
77
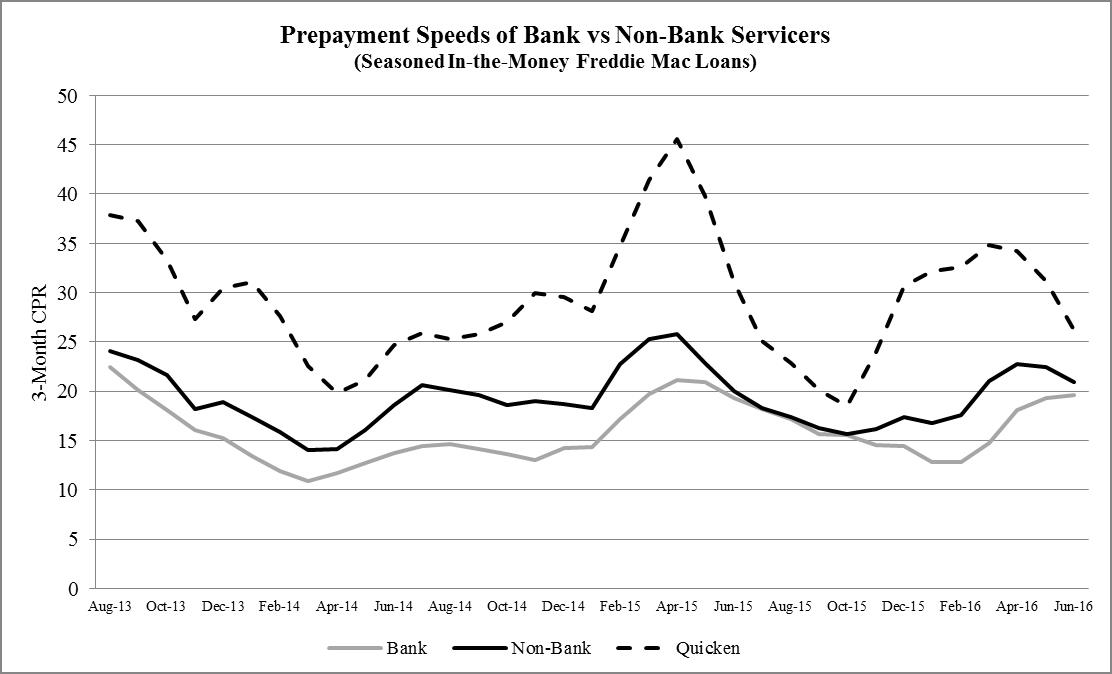
On July 8, 2016, the U.S. Bureau of Labor Statistics, or "BLS," reported that, in June 2016, the U.S. unemployment rate was 4.9%, down from 5.3% a year earlier and at levels generally considered consistent with an economy near full employment. In light of the drop in the labor force participation rate since the financial crisis, another, perhaps more relevant, measure of labor market conditions is employment growth. The BLS also reported that non-farm payrolls rose by 287,000 in June 2016, which represented a significant improvement over the corresponding level reported in May, which had been the lowest reported level since 2010. The BLS's initial estimate of May non-farm payroll increase had been 38,000, which was revised even lower to 11,000 when updated levels for May were released in the June update. May non-farm payrolls were partially impacted by a worker strike in the information sector, and these workers resumed employment in June. Over the three months from April to June 2016, the monthly increase in non-farm payrolls averaged only approximately 147,000, which is well below the average monthly increase of 229,000 for the twelve months ended in 2015, and may indicate that total job growth is slowing and that the overall health of the labor market may be less robust than the unemployment data alone would suggest.
While it is difficult to quantify the relationship between employment data and the housing and mortgage markets, we believe that current levels of unemployment and job creation are generally supportive of the housing market. While the housing market is also currently supported by low mortgage rates, it faces a number of potential headwinds. These include high interest rate volatility, the constraining effects of still-tight credit standards on both housing starts and new loan originations, and the uneven pace of the recovery of the U.S. economy.
GSE/Government Agency Developments
On April 14, 2016, the FHFA announced its Principal Reduction Modification program, offering one-time principal reductions to certain seriously delinquent, underwater borrowers in order to help them avoid foreclosure on their homes. The program applies to borrowers whose loans are owned or guaranteed by Fannie Mae or Freddie Mac, and who meet specific eligibility criteria, such as borrowers who are 90 or more days delinquent as of March 1, 2016, with outstanding principal balances of no more than $250,000, and whose mark-to-market LTV ratios are greater than 115%. As there are estimated to be only about 33,000 borrowers eligible for this program, it should have only a minor impact on the overall prepayment environment. However, the announcement does underline the continued risk from sudden changes in government policy.
In a request for comment released on May 19, 2016, the Federal Housing Administration, or "FHA," proposed changes to its Home Equity Conversion Mortgage, or "HECM," reverse mortgage program. The program allows for seniors who have equity in their homes to withdraw a portion of that equity, in order to help ease financial burdens associated with increasing health, housing and living costs during a time of retirement and reduced income. In the period since the recent 2008 financial
78
downturn, declining property values and the deteriorating financial condition of many borrowers have led to increased HECM default rates, and increases in the costs and risks of the HECM program to FHA. In order to further stabilize and maintain the HECM program, FHA in its request for comment proposed to implement certain statutory changes, codify certain existing guidelines and policies, clarify existing language, and issue new origination and servicing policies. The proposed changes would increase the sustainability of the HECM program and reduce risk to FHA. One particular proposed rule change, involving a reduction in the lifetime interest rate cap, may increase prepayment risk on adjustable rate HECM pools, as lenders could justify refinancings based purely on a reduction in the lifetime interest rate cap, even without a principal limit increase. Currently, National Reverse Mortgage Lenders Association rules prohibit member lenders from pursuing such refinancings, but lenders may disregard these rules in certain cases in light of the proposed rule change.
On July 7, 2016, the FHFA released "An Update on Implementation of the Single Security and the Common Securitization Platform," which detailed progress made by the two GSEs to date on developing and operating a Common Securitization Platform. The report also outlined expectations for future stated goals, including the issuance by Fannie Mae and Freddie Mac of a single mortgage-backed security, or "Single Security." According to the timeline in the report, issuance of a Single Security is expected to occur in 2018. The goal of establishing a Single Security is to create a single, liquid market that can be maintained over time, for MBS backed by GSE-issued fixed-rate mortgage loans. The improved liquidity of the Single Security should also help improve the liquidity of the TBA market and aid the FHFA in meeting its statutory obligation of providing for the liquidity of the national housing finance market.
To date, no definitive legislation has been enacted with respect to a possible unwinding of the GSEs or a material reduction in their roles in the U.S. mortgage market. There have been several proposals offered by members of Congress, including the Corker-Warner bill introduced in June 2013, the Johnson-Crapo bill introduced in March 2014, the Partnership to Strengthen Homeownership Act introduced in July 2014, and a Senate draft bill introduced in May 2015 by Senator Richard Shelby that pushes for increased credit risk transfers to private investors. To date, the GSEs have engaged predominantly in "second-loss" risk sharing transactions, where the GSEs bear losses on their mortgage pools up to a capped amount first, before private investors bear any losses. Furthermore, these risk sharing transactions to date have generally been "back-end" transactions, where the GSE seeks to offload its risk only after it has actually issued guarantees on a defined pool of mortgages. Under the Shelby bill, not only would the GSEs be required to engage in significant and increasing levels of risk sharing transactions generally, but for the first time the GSEs would be required to engage both in "first-loss" risk sharing transactions and in "front-end" risk sharing transactions. Many of these proposed bills could potentially increase private capital flows to the mortgage sector while reducing taxpayer risk. Though it appears unlikely that any of these bills will be passed in their current form, features may be incorporated into future proposals.
Portfolio Overview and Outlook
General Market Overview
Over the first two months of the second quarter, interest rates generally trended slightly higher and volatility declined. However, during the month of June, as a result of the United Kingdom's vote to leave the European Union, or the "Brexit" vote, and the ensuing concerns around its ultimate impact on the global economy, interest rates sharply reversed course and dropped dramatically. Market participants were generally caught off guard with respect to the outcome of the vote which, in turn, fueled demand for U.S. Treasury and other safe haven securities, such as Agency RMBS. The relative yields and liquidity of these instruments increased what had been already high investor demand for them. For most credit-sensitive assets, such as non-Agency RMBS and high-yield corporate credit, yield spreads initially widened in reaction to the Brexit vote. However, this widening was short-lived, as investors were emboldened by the quick response from a number of major central banks indicating that global central bank monetary policy would continue to be highly accommodative in the face of Brexit-related uncertainty. Sharply lower yields on safe haven securities also pushed many global investors to add to their credit-sensitive portfolios. As a result of these factors, credit spreads generally ended the quarter tighter than where they had begun the quarter, although some credit-sensitive sectors, such as CMBS, experienced some degree of net widening for the quarter.
Since its December 2015 initial increase in the target range for the federal funds rate, which followed a long period of monetary policy easing actions, the Federal Reserve has not announced any additional interest rate increases. Concerns around a global economic slowdown, as well as mixed data regarding the state of the U.S. economy, have led the Federal Reserve to delay the timing and expected pace of increases in the target range. However, as market developments occur, speculation about when the Federal Reserve will resume its plan to increase rates continues to be a significant factor in the volatility and direction of interest rates.
The yield curve flattened significantly over the course of the second quarter, as the 10-year U.S. Treasury yield fell 30 basis points to 1.47%, while the 2-year U.S. Treasury yield fell 14 basis points to 0.58%. All of the yield declines, and most of the yield curve flattening, were concentrated in last week of June following the Brexit vote. The average rate for a fixed rate 30-
79
year conventional mortgage fell 23 basis points over the course of the quarter, and ended the quarter at 3.48%, its lowest level since May 2013. In addition, the Mortgage Bankers Association US Refinancing Index, a metric that tracks the volume of mortgage loan applications that have been submitted to lenders, increased sharply around quarter end, indicating an increase in refinancing activity.
Credit
As of June 30, 2016, our total long Credit portfolio was $570.5 million, as compared to $600.3 million as of March 31, 2016. Over the course of the second quarter, and continuing recent trends, we net sold non-Agency RMBS but increased our investments in consumer loans and non-QM residential mortgage loans. As we continue to focus on growth in our loan portfolio, we have reduced our positions in certain other strategies such as distressed debt.
Non-Agency RMBS performed well during the second quarter, despite uncertainty and credit spread volatility brought on by the Brexit vote. As the case has been for some time, the fundamentals underlying non-Agency RMBS, led by a stable housing market, continue to be strong. Included in our non-Agency RMBS results for the quarter were strong net carry, appreciation from our held positions, and net realized gains from positions sold. We net sold non-Agency RMBS during the second quarter, mainly in order to redeploy the net proceeds into our other targeted Credit assets. While our non-Agency RMBS portfolio currently represents a much smaller portion of our total Credit portfolio than it ever has, it continues to be a core segment of our overall portfolio. We intend to continue to opportunistically increase and decrease the size of this portfolio as market conditions vary. As of
June 30, 2016
, our investments in U.S. non-Agency RMBS totaled $152.2 million as compared to $182.4 million as of
March 31, 2016
.
During the second quarter, we turned over approximately 9% of our Credit bond portfolio, as measured by sales, excluding paydowns. Active portfolio trading is a key component of our strategy, and we trade our bond portfolio not only for the generation of total return, but also to enhance the composition of our portfolio.
Our credit hedges are currently primarily in the form of credit default swaps, or "CDS," on high-yield corporate bond indices, as well as tranches and options on these indices, and we opportunistically overlay these positions with certain relative value long/short positions involving the same or similar instruments. High-yield corporate credit spreads tightened on a quarter-over-quarter basis. While these spreads had widened immediately following the Brexit vote in late June, they generally fully recovered within just a few days, and closed the quarter near the year-to-date highs. For the second quarter, the Markit CDX North American High Yield 5-year Index had a total return of 1.83%, or 7.52% annualized. The net tightening in high-yield corporate bond index spreads over the course of the quarter led to net losses on our credit hedges. We also had net losses on our interest rate hedges, as interest rates declined over the course of the quarter. Our interest rate hedges are principally in the form of interest rate swaps and, to a lesser extent, Eurodollar and U.S. Treasury futures. We had net gains on our foreign currency hedges, which offset foreign currency related transaction and translation losses from our holdings denominated in euros and British pounds. We continue to believe that the credit-sensitive sectors of the fixed income markets remain vulnerable to potential yield spread widening, and so we intend to continue to hedge credit risk in our portfolio using a variety of hedging instruments. We believe that our publicly traded partnership structure affords us valuable flexibility, especially with respect to our ability to reduce exposures nimbly through hedging both credit and interest rate risks. At the same time, we believe that any additional substantial yield spread widening will lead to attractive opportunities for us, especially given the many diverse sectors in which we are active.
Yield spreads for CMBS were volatile during the second quarter. In the early part of the quarter, yield spreads generally tightened amidst strong investor demand, only to widen in the latter part of the quarter, following the Brexit vote and a decline in crude oil prices. The CMBS new issue credit curve steepened over the course of the quarter, as yield spreads on higher rated tranches of CMBS tightened while those on lower rated tranches widened. Our CMBS portfolio continues to be comprised entirely of new issue "B-pieces" that we purchased at original issuance. B-pieces are the most subordinated (and therefore the highest yielding and riskiest) CMBS tranches. By purchasing new issue B-pieces, we believe that we are often able to effectively "manufacture" our risk more efficiently than what is generally available in the secondary market, and to better target the collateral profiles and structures we prefer. Recent CMBS yield spread volatility has reduced the pace of conduit commercial mortgage loan originations, and this led to lower CMBS conduit issuance in the first half of 2016. Conduit new issue volume in the first half of 2016 was $18.5 billion, or 38% lower than the first half of 2015. Our CMBS strategy performed well during the second quarter. We had positive net carry on our securities held, and we had net gains on our CMBX positions. As of June 30, 2016, our U.S. CMBS bond portfolio was relatively unchanged at $27.0 million, as compared to $27.2 million as of
March 31, 2016
.
As of
June 30, 2016
, our portfolio of small balance commercial mortgage loans included 20 loans and one real estate owned, or "REO," property with an aggregate value of $51.3 million; by comparison, as of March 31, 2016 this portfolio included 23 loans and five REO properties with an aggregate value of $75.4 million. We had a modest profit in our small
80
balance commercial mortgage loan portfolio in the second quarter. The number and aggregate value of loans held, as well as the income generated by our loans, may fluctuate significantly from period to period, especially as loans are resolved or sold. During the first quarter, we executed a two-year financing arrangement with a large financial institution for a subset of our small balance commercial mortgage loan portfolio, and as of
June 30, 2016
and
March 31, 2016
we had $13.0 million and $23.2 million, respectively in borrowings outstanding under this facility. We believe that volumes in this sector will accelerate as recent market turmoil may make it more difficult for certain commercial mortgage borrowers to refinance their loans at maturity.
Leading up to the Brexit vote, the European MBS/ABS and CLO sectors were generally characterized by an ongoing rally that had begun in mid-February. However, following the vote, these sectors reversed course and declined in light of concerns around the British economy in particular and the European economy more generally. The ongoing lack of liquidity provided by the dealer community remains a significant concern in these sectors, and this also contributed to the decline in the latter part of the quarter. We believe that this lack of liquidity has caused many market participants to remain sidelined, preferring to wait for the new issue market to provide attractive investment opportunities. While we continue to be active in European MBS, we are currently more focused on the European non-performing loan market. When we acquire assets in this market, they are typically in securitized form. We believe that non-performing loans in certain select markets, such as in Spain and Portugal, will continue to present attractive opportunities, and we are actively pursuing additional opportunities in these and other areas. As of
June 30, 2016
, our investments in European non-dollar denominated assets totaled $67.5 million, as compared to $70.3 million as of
March 31, 2016
. As of
June 30, 2016
our total holdings of European non-dollar denominated assets included $39.1 million in RMBS, $7.9 million in CMBS, $17.8 million in CLOs, $2.5 million in ABS, and $0.2 million in distressed corporate debt. As of
March 31, 2016
our total holdings of European non-dollar denominated assets included $41.3 million in RMBS, $8.2 million in CMBS, $17.7 million in CLOs, $2.8 million in ABS, and $0.3 million in distressed corporate debt. These assets include
securities denominated in British pounds as well as in euros.
We remain active in non-performing and sub-performing U.S. residential mortgage loans, or "residential NPLs." During the second quarter, widely-distributed offerings of residential NPLs totaled approximately $7.2 billion, up significantly from approximately $4.8 billion in the first quarter of 2016. Offering volumes continue to be dominated by the U.S. Department of Housing and Urban Development, or "HUD," the GSEs, and large banks. Fannie Mae has emerged as the largest government-related participant, having ramped up its sales program materially since inception only one year ago. The market for large residential NPL pools has remained highly concentrated, with the great majority having traded to only a handful of large players who typically securitize the NPLs that they purchase. As a result, we have continued to focus our acquisitions on smaller, less-competitively-bid, and more attractively-priced mixed legacy pools sourced from motivated sellers. Our residential NPL portfolio performed well during the second quarter, and included net realized gains from the resolution and sale of certain loans. As of June 30, 2016, we held $9.5 million in residential NPLs and related foreclosure property, as compared to $14.8 million as of
March 31, 2016
. While our portfolio declined in size in the second quarter, we expect to see additional opportunities to invest in this sector over the near-term.
During the second quarter, under flow agreements with multiple originators, we continued to add to our consumer loan portfolio, which primarily consists of unsecured loans, but also includes auto loans. Our U.S. consumer loan and ABS portfolio performed well in the second quarter, although this was somewhat offset by a small loss on our credit hedges. We expect the contribution from our consumer loan portfolio to continue to increase as the portfolio grows. We are currently purchasing consumer loans under multiple flow agreements, and we continue to evaluate new opportunities in the space. We expect that most of the near-to-medium-term growth in our portfolio will come from increased flow from our existing partnerships (as opposed to flow from new agreements with new originators), especially as we continue to be pleased with the collateral characteristics and performance of the loans sourced through these existing partnerships
.
We are financing most of our consumer loan portfolio through reverse repurchase agreements with a large financial institution. As of
June 30, 2016
, our investments in U.S. consumer loans and ABS totaled $151.9 million, as compared to $141.0 million as of
March 31, 2016
. Loan performance to date in our consumer loan and ABS business has been in line with our expectations, and the growth of the business has exceeded our expectations. Over the near to medium term, and as our portfolio grows, we expect to begin permanently financing many of our investments through the securitization market.
The pace of our non-QM loan purchases continued to accelerate in the second quarter, and we expect that our investments in non-QM loans will continue to grow meaningfully over the medium to longer term. As of
June 30, 2016
, our non-QM mortgage loans totaled $39.4 million as compared to $23.6 million as of
March 31, 2016
. To date, loan performance has been excellent, and the number of states where our origination partner is producing loans for us has increased according to expectations. We finance certain of our non-QM loans under a facility with a large financial institution.
In the distressed corporate debt markets, the second quarter of 2016 was characterized by a broad rally in leveraged loans and high yield bonds. This rally led to a meaningful rebound in the market prices of some of the more stressed/distressed names
81
in our portfolio that had previously experienced declines. During the second quarter, we net sold certain of our distressed debt and related equity positions, capturing net gains as prices rallied. We have remained cautious by keeping our distressed book small and focusing on senior secured leveraged loans. We have also opportunistically established short positions in energy related companies where we deemed it prudent. During the second quarter, our distressed corporate debt portfolio, including credit hedges, performed well. As of
June 30, 2016
, our net long holdings of distressed corporate debt, including related equity and the underlying value of loans acquired through total return swap contracts, totaled $48.3 million, as compared to $63.2 million as of
March 31, 2016
.
Within our U.S. CLO portfolio, we have historically focused on the legacy sector, where we have found opportunities in both mezzanine and equity tranches. We have focused our efforts on identifying those securities that we believe have experienced yield spread widening for liquidity reasons as opposed to fundamental reasons. During the second quarter, our U.S. CLO portfolio, net of hedges, generated a modest profit and the size of the portfolio declined to $15.3 million as of
June 30, 2016
, from $16.7 million as of
March 31, 2016
.
Agency
As of June 30, 2016, our long Agency RMBS portfolio was $849.7 million as compared to $936.8 million as of March 31, 2016.
Consistent with past quarters, as of
June 30, 2016
, our Agency RMBS were principally comprised of "specified pools." Specified pools are fixed rate Agency pools with special characteristics, such as pools comprised of low loan balance mortgages, pools comprised of mortgages backed by investor properties, pools containing mortgages originated through the government-sponsored "Making Homes Affordable" refinancing programs, and pools containing mortgages with various other characteristics. Our Agency strategy also includes RMBS which are backed by ARMs or Hybrid ARMs, and reverse mortgages; and CMOs, including IOs, POs and IIOs. Our Agency strategy also includes interest rate hedges for our Agency RMBS, as well as certain relative value trading positions in interest rate-related and TBA-related instruments.
Prices of Agency RMBS increased over the course of the second quarter, and yield spreads on Agency RMBS relative to interest rate swaps and U.S. Treasury securities were relatively stable. While the 10-year interest rate swap spread to U.S. Treasury securities continued to be negative at the end of the second quarter, it was negative 11 basis points, or 2 basis points less negative than at March 31, 2016, finally reversing its tightening trend of the last several quarters. Since a significant portion of our interest rate hedging portfolio is comprised of interest rate swaps, this positively impacted our results for the quarter. In addition, pay-ups on specified pools increased as prepayment protection became more valuable in light of lower interest rates and expected increases in prepayment rates. Performance of specified pools meaningfully augmented our results for the second quarter.
Specifically, for the quarter ended
June 30, 2016
, we had total net realized and unrealized gains of
$6.2 million
, or
$0.18
per share, on our aggregate Agency RMBS portfolio, while we had total net realized and unrealized losses of
$(6.8) million
, or
$(0.20)
per share, on our interest rate hedges and other activities. Over the course of the second quarter, average pay-ups on our specified pools increased to 1.05% as of
June 30, 2016
, from 0.88% as of
March 31, 2016
. Pay-ups are price premiums for specified pools relative to their TBA counterparts. We actively traded our Agency RMBS portfolio during the second quarter in order to take advantage of volatility and to harvest modest gains. Our portfolio turnover for the quarter was 17% (as measured by sales and excluding paydowns), and we captured net realized gains of
$1.6 million
, excluding interest rate hedges.
During the second quarter, we continued to use short positions in TBAs to hedge interest rate risk, and these positions generated net losses as interest rates fell. However, TBAs generally underperformed specified pools, which benefited our results for the quarter because we hold a net short position in TBAs against a long position in specified pools. TBAs primarily underperformed specified pools as a result of increased investor demand for pools with better prepayment protection in a lower interest rate environment. Also contributing to TBA underperformance was a material weakening in dollar rolls, which was driven by both the increase in prepayment speeds and the slowly shrinking presence of the Federal Reserve in the market. As trading volumes for specified pools expand, and to the extent prepayments remain elevated, we believe that the underperformance of generic pools relative to specified pools will persist.
During the second quarter, we continued to focus our Agency RMBS purchasing activity primarily on specified pools, especially those with higher coupons. As of
June 30, 2016
, the weighted average coupon on our fixed rate specified pools was 4.05%. Our Agency RMBS portfolio also includes small allocations to Agency reverse mortgage pass-throughs, Agency ARMs and Agency IOs. Reverse mortgage pools tightened throughout the second quarter, largely in response to lower prepayment speeds, which were primarily the result of the anti-churning guidelines issued last October by the National Reverse Mortgage Lenders' Association. We believe that there remains a heightened risk of substantial interest rate and prepayment volatility in the near term, thus reinforcing the importance of our ability to hedge our Agency RMBS portfolio using a variety of tools, including TBAs.
82
The following table summarizes prepayment rates for our portfolio of fixed rate specified pools (excluding those backed by reverse mortgages) for the three month periods ended June 30, 2016, March 31, 2016 and December 31, 2015.
|
Three Month Period Ended
|
|||||||||
|
June 30, 2016
|
March 31, 2016
|
December 31, 2015
(2)
|
|||||||
|
Three Month Constant Prepayment Rates
(1)
|
10.3
|
%
|
8.9
|
%
|
8.7
|
%
|
|||
|
(1)
|
Excludes Agency fixed rate RMBS without any prepayment history.
|
|
(2)
|
Prior period calculation methodology has been conformed to current period calculation methodology.
|
The following table provides details about the composition of our portfolio of fixed rate specified pools (excluding those backed by reverse mortgages) as of June 30, 2016 and December 31, 2015:
|
June 30, 2016
|
December 31, 2015
|
||||||||||||||||||||||||
|
Coupon
|
Current Principal
|
Fair Value
|
Weighted
Average Loan
Age (Months)
|
Current Principal
|
Fair Value
|
Weighted
Average Loan
Age (Months)
|
|||||||||||||||||||
|
Fixed rate Agency RMBS:
|
(In thousands)
|
(In thousands)
|
|||||||||||||||||||||||
|
15-year fixed rate mortgages:
|
|||||||||||||||||||||||||
|
3.00
|
|
$
|
18,210
|
|
$
|
19,183
|
|
16
|
|
$
|
21,707
|
|
$
|
22,434
|
|
12
|
|
||||||||
|
3.50
|
|
65,589
|
|
70,126
|
|
17
|
|
68,743
|
|
72,367
|
|
15
|
|
||||||||||||
|
4.00
|
|
13,249
|
|
14,309
|
|
36
|
|
13,546
|
|
14,405
|
|
33
|
|
||||||||||||
|
4.50
|
|
3,927
|
|
4,227
|
|
63
|
|
4,564
|
|
4,914
|
|
56
|
|
||||||||||||
|
Total 15-year fixed rate mortgages
|
100,975
|
|
107,845
|
|
21
|
|
108,560
|
|
114,120
|
|
19
|
|
|||||||||||||
|
20-year fixed rate mortgages:
|
|||||||||||||||||||||||||
|
4.00
|
|
2,405
|
|
2,612
|
|
32
|
|
6,114
|
|
6,558
|
|
25
|
|
||||||||||||
|
4.50
|
|
1,264
|
|
1,395
|
|
31
|
|
1,352
|
|
1,471
|
|
25
|
|
||||||||||||
|
Total 20-year fixed rate mortgages
|
3,669
|
|
4,007
|
|
32
|
|
7,466
|
|
8,029
|
|
25
|
|
|||||||||||||
|
30-year fixed rate mortgages:
|
|||||||||||||||||||||||||
|
3.00
|
|
7,264
|
|
7,556
|
|
33
|
|
7,395
|
|
7,406
|
|
35
|
|
||||||||||||
|
3.50
|
|
103,248
|
|
110,028
|
|
15
|
|
112,219
|
|
116,168
|
|
17
|
|
||||||||||||
|
4.00
|
|
269,001
|
|
291,421
|
|
18
|
|
320,635
|
|
341,144
|
|
14
|
|
||||||||||||
|
4.50
|
|
138,592
|
|
152,958
|
|
24
|
|
171,237
|
|
186,509
|
|
17
|
|
||||||||||||
|
5.00
|
|
57,359
|
|
64,186
|
|
40
|
|
63,336
|
|
70,117
|
|
34
|
|
||||||||||||
|
5.50
|
|
4,765
|
|
5,351
|
|
90
|
|
5,402
|
|
6,012
|
|
84
|
|
||||||||||||
|
6.00
|
|
3,856
|
|
4,418
|
|
78
|
|
4,141
|
|
4,673
|
|
73
|
|
||||||||||||
|
Total 30-year fixed rate mortgages
|
584,085
|
|
635,918
|
|
22
|
|
684,365
|
|
732,029
|
|
18
|
|
|||||||||||||
|
Total fixed rate Agency RMBS
|
$
|
688,729
|
|
$
|
747,770
|
|
22
|
|
$
|
800,391
|
|
$
|
854,178
|
|
19
|
|
|||||||||
Our net Agency premium as a percentage of our long Agency RMBS holdings is one metric that we use to measure our overall prepayment risk. Net Agency premium represents the total premium (excess of market value over outstanding principal balance) on long Agency RMBS holdings less the total premium on related net short (TBA) Agency RMBS positions. The net short TBA position related to our long Agency RMBS had a notional value of $348.2 million and a fair value of $375.2 million as of
June 30, 2016
, and a notional value of $342.4 million and a fair value of $368.6 million as of
March 31, 2016
. The lower our net Agency premium, the less we believe that we are exposed to market-wide increases in Agency RMBS prepayments. As of
June 30, 2016
and
March 31, 2016
, our net Agency premium as a percentage of fair value on long Agency RMBS holdings was approximately 4.7% and 4.5%, respectively. Excluding TBA positions used to hedge our long Agency RMBS portfolio, our
83
Agency premium as a percentage of fair value was approximately 8.0% and 7.4% as of
June 30, 2016
and
March 31, 2016
, respectively. These percentages may fluctuate from period to period based on market factors, including interest rates and mortgage rates, as well as, with respect to the net percentages, the degree to which we hedge prepayment risk with short TBAs. We believe that our focus on purchasing pools with specific prepayment characteristics provides a measure of protection against prepayments.
Financing
Our weighted average cost of funds, including reverse repo and securitized debt financing for the quarter ended June 30, 2016 increased 25 basis points to 1.31%, from 1.06% for the quarter ended March 31, 2016, largely as a result of a quarter-over-quarter increase in our cost of funds for our Credit-related borrowings, from 2.52% to 3.14%. The increase in our average cost of funds for our Credit portfolio was in turn primarily the result of a shift in the mix of our borrowings, as more of our Credit-related borrowings now relate to our loan portfolios; also included in the second quarter cost of funds for our Credit portfolio was 22 basis points (annualized) of amortization expenses related to certain financing facility set-up costs. Our loans generally carry higher borrowing rates and debt issuance costs as compared to securities. Nevertheless, borrowing rates for each of our various asset classes were relatively stable during the three month period ended June 30, 2016. Following the Brexit vote, there was a brief spike in repo rates, but they quickly recovered. As of June 30, 2016 our outstanding reverse repos were with twenty different counterparties.
Under the Dodd-Frank Act, bank capital treatment of repo transactions has become more onerous, thereby making it less attractive for banks to provide certain forms of repo financing. While large banks still dominate the repo market, non-bank firms, not subject to the same regulations as large banks, are becoming more active in providing repo financing. The vast majority of our outstanding repo financing is still provided by larger banks and dealers; however, in limited amounts, we have also entered into repo agreements with smaller non-bank dealers. In general, we continue to see strong appetite and competitive terms from both types of lenders.
In January 2016 we executed a one-year reverse repurchase agreement for our non-QM mortgage loan portfolio, and in March 2016 we executed a two-year financing agreement structured as a securitization for certain of our small balance commercial mortgage loans and commercial REO.
Our leverage ratio including reverse repo and securitized debt decreased to 1.59:1, excluding U.S. Treasury securities, as of June 30, 2016, as compared to 1.67:1 as of March 31, 2016. Our leverage ratio may fluctuate period over period based on portfolio management decisions, market conditions, and the timing of security purchase and sale transactions.
Critical Accounting Policies
Our unaudited consolidated financial statements have been prepared in conformity with accounting principles generally accepted in the United States, or "U.S. GAAP," for investment companies. In June 2007, the AICPA issued Amendments to ASC 946-10 ("ASC 946-10"),
Clarification of the Scope of the Audit and Accounting Guide Investment Companies and Accounting by Parent Companies and Equity Method Investors for Investments in Investment Companies
. ASC 946-10 was effective for fiscal years beginning on or after December 15, 2007 with earlier application encouraged. After we adopted ASC 946-10, the FASB issued guidance which effectively delayed indefinitely the effective date of ASC 946-10. However, this additional guidance explicitly permitted entities that early adopted ASC 946-10 before December 31, 2007 to continue to apply the provisions of ASC 946-10. We have elected to continue to apply the provisions of ASC 946-10. ASC 946-10 provides guidance for determining whether an entity is within the scope of the AICPA Audit and Accounting Guide for Investment Companies, or the "Guide." The Guide provides guidance for determining whether the specialized industry accounting principles of the Guide should be retained in the financial statements of a parent company, of an investment company or of an equity method investor in an investment company. Effective August 17, 2007, we adopted ASC 946-10 and follow its provisions which, among other things, requires that investments be reported at fair value in the financial statements. Although we conduct our operations so that we are not required to register as an investment company under the Investment Company Act, for financial reporting purposes, we have elected to continue to apply the provisions of ASC 946-10.
In June 2013, the FASB issued ASU 2013-08,
Financial Services-Investment Companies
("ASC 946"). This update modified the guidance for ASC 946 for determining whether an entity is an investment company for U.S. GAAP purposes. It requires entities that adopted Statement of Position 07-1 prior to its deferral to reassess whether they continue to meet the definition of an investment company for U.S. GAAP purposes. The guidance was effective for interim and annual reporting periods in fiscal years that began after December 15, 2013, with retrospective application; earlier application was prohibited.
84
We have determined that we still meet the definition of an investment company under ASC 946 and, as a result, the presentation of our financial statements has not changed since the effective date of this ASU.
Certain of our critical accounting policies require us to make estimates and assumptions that affect the reported amounts of assets and liabilities at the date of the consolidated financial statements and the reported amounts of revenues and expenses during the reporting period. Actual results could differ from those estimates. We believe that all of the decisions and assessments upon which our consolidated financial statements are based were reasonable at the time made based upon information available to us at that time. We rely on the experience of our Manager and Ellington and analysis of historical and current market data in order to arrive at what we believe to be reasonable estimates. See Note 2 of the notes to the consolidated financial statements for a complete discussion of our significant accounting policies. We have identified our most critical accounting policies to be the following:
Valuation
:
For financial instruments that are traded in an "active market," the best measure of fair value is the quoted market price. However, many of our financial instruments are not traded in an active market. Therefore, management generally uses third-party valuations when available. If third-party valuations are not available, management uses other valuation techniques, such as the discounted cash flow methodology. Summary descriptions, for various categories of financial instruments, of the valuation methodologies management uses in determining fair value of our financial instruments are detailed in Note 2 of the notes to our consolidated financial statements. Management utilizes such methodologies to assign a good faith fair value (the estimated price that, in an orderly transaction at the valuation date, would be received to sell an asset, or paid to transfer a liability, as the case may be) to each such financial instrument.
See the notes to our consolidated financial statements for more information on valuation techniques used by management in the valuation of our assets and liabilities.
Purchases and Sales of Investments and Investment Income
:
Purchase and sales transactions are generally recorded on trade date. Realized and unrealized gains and losses are calculated based on identified cost. We generally amortize premiums and accrete discounts on our fixed income investments using the effective interest method.
See the notes to our consolidated financial statements for more information on the assumptions and methods that we use to amortize purchase premiums and accrete purchase discounts.
Recent Accounting Pronouncements
Refer to the notes to our consolidated financial statements for a description of relevant recent accounting pronouncements.
85
Financial Condition
The following table summarizes our investment portfolio
(1)
as of
June 30, 2016
and December 31, 2015.
|
June 30, 2016
|
December 31, 2015
|
||||||||||||||||||||||||||||||||||||||
|
(In thousands)
|
Current Principal
|
Fair Value
|
Average Price
(2)
|
Cost
|
Average Cost
(2)
|
Current Principal
|
Fair Value
|
Average Price
(2)
|
Cost
|
Average Cost
(2)
|
|||||||||||||||||||||||||||||
|
Non-Agency RMBS and Residential Mortgage Loans
|
$
|
385,332
|
|
$
|
233,231
|
|
$
|
60.53
|
|
$
|
231,724
|
|
$
|
60.14
|
|
$
|
450,262
|
|
$
|
272,117
|
|
$
|
60.44
|
|
$
|
265,855
|
|
$
|
59.04
|
|
|||||||||
|
Non-Agency CMBS and Commercial Mortgage Loans
|
161,812
|
|
81,568
|
|
50.41
|
|
89,746
|
|
55.46
|
|
169,422
|
|
98,668
|
|
58.24
|
|
103,578
|
|
61.14
|
|
|||||||||||||||||||
|
ABS and Consumer Loans
|
175,320
|
|
175,056
|
|
99.85
|
|
177,942
|
|
101.50
|
|
150,946
|
|
149,149
|
|
98.81
|
|
150,890
|
|
99.96
|
|
|||||||||||||||||||
|
Total Non-Agency MBS, Mortgage loans, and ABS and Consumer Loans
(3)
|
722,464
|
|
489,855
|
|
67.80
|
|
499,412
|
|
69.13
|
|
770,630
|
|
519,934
|
|
67.47
|
|
520,323
|
|
67.52
|
|
|||||||||||||||||||
|
Agency RMBS:
|
|||||||||||||||||||||||||||||||||||||||
|
Floating
|
14,284
|
|
15,080
|
|
105.57
|
|
14,911
|
|
104.39
|
|
15,777
|
|
16,615
|
|
105.31
|
|
16,610
|
|
105.29
|
|
|||||||||||||||||||
|
Fixed
|
688,728
|
|
747,771
|
|
108.57
|
|
732,384
|
|
106.34
|
|
800,391
|
|
854,178
|
|
106.72
|
|
850,775
|
|
106.29
|
|
|||||||||||||||||||
|
Reverse Mortgages
|
59,814
|
|
66,358
|
|
110.94
|
|
65,130
|
|
108.89
|
|
62,197
|
|
66,860
|
|
107.50
|
|
68,135
|
|
109.55
|
|
|||||||||||||||||||
|
Total Agency RMBS
(4)
|
762,826
|
|
829,209
|
|
108.70
|
|
812,425
|
|
106.50
|
|
878,365
|
|
937,653
|
|
106.75
|
|
935,520
|
|
106.51
|
|
|||||||||||||||||||
|
Total Non-Agency and Agency MBS, Mortgage loans, and ABS and Consumer Loans
(3)(4)
|
1,485,290
|
|
1,319,064
|
|
88.81
|
|
1,311,837
|
|
88.32
|
|
1,648,995
|
|
1,457,587
|
|
88.39
|
|
1,455,843
|
|
88.29
|
|
|||||||||||||||||||
|
Agency Interest Only RMBS
|
n/a
|
20,506
|
|
n/a
|
22,504
|
|
n/a
|
n/a
|
24,918
|
|
n/a
|
26,237
|
|
n/a
|
|||||||||||||||||||||||||
|
Non-Agency Interest Only and Principal Only MBS and Other
(5)
|
n/a
|
20,048
|
|
n/a
|
23,239
|
|
n/a
|
n/a
|
18,966
|
|
n/a
|
22,768
|
|
n/a
|
|||||||||||||||||||||||||
|
TBAs:
|
|||||||||||||||||||||||||||||||||||||||
|
Long
|
153,018
|
|
161,619
|
|
105.62
|
|
160,874
|
|
105.13
|
|
94,602
|
|
98,009
|
|
103.60
|
|
97,914
|
|
103.50
|
|
|||||||||||||||||||
|
Short
|
(455,613
|
)
|
(488,151
|
)
|
107.14
|
|
(486,569
|
)
|
106.79
|
|
(580,992
|
)
|
(612,777
|
)
|
105.47
|
|
(612,749
|
)
|
105.47
|
|
|||||||||||||||||||
|
Net Short TBAs
|
(302,595
|
)
|
(326,532
|
)
|
107.91
|
|
(325,695
|
)
|
107.63
|
|
(486,390
|
)
|
(514,768
|
)
|
105.83
|
|
(514,835
|
)
|
105.85
|
|
|||||||||||||||||||
|
Long U.S. Treasury Securities
|
371
|
|
374
|
|
100.78
|
|
372
|
|
100.32
|
|
—
|
|
—
|
|
—
|
|
—
|
|
—
|
|
|||||||||||||||||||
|
Short U.S. Treasury Securities
|
(30,028
|
)
|
(30,856
|
)
|
102.76
|
|
(30,101
|
)
|
100.24
|
|
(90,120
|
)
|
(89,489
|
)
|
99.30
|
|
(89,735
|
)
|
99.57
|
|
|||||||||||||||||||
|
Short European Sovereign Bonds
|
(54,785
|
)
|
(56,470
|
)
|
103.08
|
|
(57,455
|
)
|
104.87
|
|
(23,907
|
)
|
(24,562
|
)
|
102.74
|
|
(26,010
|
)
|
108.80
|
|
|||||||||||||||||||
|
Repurchase Agreements
|
116,003
|
|
116,003
|
|
100.00
|
|
116,985
|
|
100.85
|
|
105,702
|
|
105,700
|
|
100.00
|
|
105,329
|
|
99.65
|
|
|||||||||||||||||||
|
Long Corporate Debt
|
75,630
|
|
36,974
|
|
48.89
|
|
46,834
|
|
61.92
|
|
62,530
|
|
27,028
|
|
43.22
|
|
34,786
|
|
55.63
|
|
|||||||||||||||||||
|
Short Corporate Debt
|
(10,654
|
)
|
(9,947
|
)
|
93.37
|
|
(9,616
|
)
|
90.27
|
|
(1,120
|
)
|
(448
|
)
|
39.96
|
|
(676
|
)
|
60.34
|
|
|||||||||||||||||||
|
Non-Exchange Traded Preferred and Common Equity Investment in Mortgage-Related Entities
|
n/a
|
8,525
|
|
n/a
|
8,835
|
|
n/a
|
n/a
|
15,926
|
|
n/a
|
16,251
|
|
n/a
|
|||||||||||||||||||||||||
|
Non-Exchange Traded Corporate Equity
|
n/a
|
10,893
|
|
n/a
|
11,625
|
|
n/a
|
n/a
|
6,162
|
|
n/a
|
6,347
|
|
n/a
|
|||||||||||||||||||||||||
|
Short Common Stock
|
n/a
|
(30,913
|
)
|
n/a
|
(30,015
|
)
|
n/a
|
n/a
|
(1,471
|
)
|
n/a
|
(1,878
|
)
|
n/a
|
|||||||||||||||||||||||||
|
Real Estate Owned
|
n/a
|
4,162
|
|
n/a
|
4,225
|
|
n/a
|
n/a
|
12,522
|
|
n/a
|
12,254
|
|
n/a
|
|||||||||||||||||||||||||
|
Total
|
$
|
1,081,831
|
|
$
|
1,093,574
|
|
$
|
1,038,071
|
|
$
|
1,046,681
|
|
|||||||||||||||||||||||||||
86
|
(1)
|
For more detailed information about the investments in our portfolio, please refer to the Consolidated Condensed Schedule of Investments as of these dates contained in our consolidated financial statements.
|
|
(2)
|
Represents the dollar amount (not shown in thousands) per $100 of current principal of the price or cost for the security.
|
|
(3)
|
Excludes non-Agency Interest Only and Principal Only MBS and Other.
|
|
(4)
|
Excludes Agency Interest Only RMBS.
|
|
(5)
|
Other includes equity tranches of CLOs, Other private label securities, and residual-like non-Agency RMBS and ABS backed by consumer loans.
|
The following table summarizes our financial derivatives portfolio
(1)
as of
June 30, 2016
and December 31, 2015.
|
June 30, 2016
|
December 31, 2015
|
||||||||||||||
|
(In thousands)
|
Notional Value
|
Fair Value
|
Notional Value
|
Fair Value
|
|||||||||||
|
Mortgage-Related Derivatives:
|
|||||||||||||||
|
Long CDS on RMBS and CMBS Indices
|
$
|
32,753
|
|
$
|
(5,817
|
)
|
$
|
5,926
|
|
$
|
(309
|
)
|
|||
|
Short CDS on RMBS and CMBS Indices
|
(140,273
|
)
|
24,565
|
|
(95,589
|
)
|
5,354
|
|
|||||||
|
Short CDS on Individual RMBS
|
(11,372
|
)
|
5,834
|
|
(12,176
|
)
|
6,111
|
|
|||||||
|
Net Mortgage-Related Derivatives
|
(118,892
|
)
|
24,582
|
|
(101,839
|
)
|
11,156
|
|
|||||||
|
Credit Derivatives:
|
|||||||||||||||
|
Long CDS referencing Corporate Bond Indices
|
696,360
|
|
100,887
|
|
793,824
|
|
135,752
|
|
|||||||
|
Short CDS referencing Corporate Bond Indices
|
(1,049,181
|
)
|
(35,773
|
)
|
(1,017,121
|
)
|
(45,407
|
)
|
|||||||
|
Long CDS on Corporate Bonds
|
12,457
|
|
(1,763
|
)
|
—
|
|
—
|
|
|||||||
|
Short CDS on Corporate Bonds
|
(28,360
|
)
|
(1,376
|
)
|
(13,370
|
)
|
(673
|
)
|
|||||||
|
Purchased Put Options on CDS on Corporate Bond Indices
(2)
|
—
|
|
—
|
|
138,000
|
|
2,050
|
|
|||||||
|
Written Put Options on CDS on Corporate Bond Indices
(3)
|
(155,500
|
)
|
(243
|
)
|
(171,750
|
)
|
(720
|
)
|
|||||||
|
Written Call Options on CDS on Corporate Bond Indices
(4)
|
—
|
|
—
|
|
(273,100
|
)
|
(884
|
)
|
|||||||
|
Long Total Return Swaps on Corporate Equities
(5)
|
—
|
|
—
|
|
21,670
|
|
—
|
|
|||||||
|
Short Total Return Swaps on Corporate Equities
(5)
|
(78,839
|
)
|
(2
|
)
|
(4,106
|
)
|
—
|
|
|||||||
|
Long Total Return Swaps on Corporate Debt
(6)
|
29,361
|
|
(192
|
)
|
45,051
|
|
(4,577
|
)
|
|||||||
|
Interest Rate Derivatives:
|
|||||||||||||||
|
Long Interest Rate Swaps
|
527,824
|
|
13,929
|
|
675,207
|
|
6,976
|
|
|||||||
|
Short Interest Rate Swaps
|
(949,730
|
)
|
(22,856
|
)
|
(1,126,600
|
)
|
(1,967
|
)
|
|||||||
|
Long U.S. Treasury Note Futures
(7)
|
2,000
|
|
2
|
|
44,000
|
|
(233
|
)
|
|||||||
|
Long Eurodollar Futures
(8)
|
11,000
|
|
4
|
|
23,000
|
|
17
|
|
|||||||
|
Short U.S. Treasury Bond and Note Futures
(9)
|
(1,600
|
)
|
(3
|
)
|
—
|
|
—
|
|
|||||||
|
Short Eurodollar Futures
(8)
|
(266,000
|
)
|
(353
|
)
|
(396,000
|
)
|
(280
|
)
|
|||||||
|
Purchased Straddle Swaptions
|
—
|
|
—
|
|
8,400
|
|
(31
|
)
|
|||||||
|
Written Straddle Swaptions
|
—
|
|
—
|
|
(13,100
|
)
|
(125
|
)
|
|||||||
|
Interest Rate Caps
|
23,200
|
|
1
|
|
—
|
|
—
|
|
|||||||
|
Purchased Put Options on U.S. Treasury Security Futures
(10)
|
—
|
|
—
|
|
3,900
|
|
61
|
|
|||||||
|
Purchased Call Options on U.S. Treasury Security Futures
(11)
|
—
|
|
—
|
|
3,900
|
|
51
|
|
|||||||
|
Total Net Interest Rate Derivatives
|
(9,276
|
)
|
4,469
|
|
|||||||||||
|
Other Derivatives:
|
|||||||||||||||
|
Long Foreign Currency Forwards
(12)
|
—
|
|
—
|
|
2,734
|
|
(13
|
)
|
|||||||
|
Short Foreign Currency Forwards
(13)
|
(74,782
|
)
|
1,578
|
|
(95,326
|
)
|
1,138
|
|
|||||||
|
Warrants
(14)
|
1,554
|
|
100
|
|
1,555
|
|
150
|
|
|||||||
|
Mortgage Loan Purchase Commitments
(15)
|
2,330
|
|
8
|
|
7,713
|
|
(8
|
)
|
|||||||
|
Total Net Derivatives
|
$
|
78,530
|
|
$
|
102,433
|
|
|||||||||
|
(1)
|
For more detailed information about the financial derivatives in our portfolio, please refer to the Consolidated Condensed Schedule of Investments as of these dates contained in our consolidated financial statements.
|
|
(2)
|
Represents the option on our part to enter into a CDS on a corporate bond index whereby we would pay a fixed rate and receive credit protection payments.
|
|
(3)
|
Represents the option on the part of a counterparty to enter into a CDS on a corporate bond index whereby we would receive a fixed rate and pay credit protection payments.
|
87
|
(4)
|
Represents the option on the part of a counterparty to enter into a CDS on a corporate bond index whereby we would pay a fixed rate and receive credit protection payments.
|
|
(5)
|
Notional value represents number of underlying shares times the closing price of the underlying security.
|
|
(6)
|
Notional value represents outstanding principal on underlying corporate debt.
|
|
(7)
|
Notional value represents the total face amount of U.S. Treasury Notes underlying all contracts held. As of
June 30, 2016
and December 31, 2015, a total of 16 and 343 contracts were held, respectively.
|
|
(8)
|
Every $1,000,000 in notional value represents one Eurodollar future contract.
|
|
(9)
|
Notional value represents the total face amount of U.S. Treasury securities underlying all contracts held. As of
June 30, 2016
a total of 16 contracts were held.
|
|
(10)
|
Represents the option on our part to enter into a futures contract with a counterparty; as of December 31, 2015 39 put options contracts were held.
|
|
(11)
|
Represents the option on our part to enter into a futures contract with a counterparty; as of December 31, 2015 39 call options contracts were held.
|
|
(12)
|
Notional amount represents U.S. Dollars to be paid by us at the maturity of the forward contract.
|
|
(13)
|
Notional amount represents U.S. Dollars to be received by us at the maturity of the forward contract.
|
|
(14)
|
Notional amount represents number of warrants.
|
|
(15)
|
Notional amount represents principal balance of mortgage loan purchase commitments. Actual loan purchases are contingent upon successful loan closings in accordance with agreed-upon parameters.
|
As of
June 30, 2016
, our Consolidated Statement of Assets, Liabilities, and Equity reflects total assets of
$2.8 billion
as compared to
$3.0 billion
as of
December 31, 2015
. Total liabilities as of
June 30, 2016
and December 31, 2015 were
$2.1 billion
and
$2.3 billion
, respectively. Our portfolios of investments, financial derivatives, and repurchase agreements included in total assets were
$1.9 billion
as of both
June 30, 2016
and
December 31, 2015
, while our investments sold short and financial derivatives included in total liabilities were
$690.4 million
and
$789.2 million
as of
June 30, 2016
and
December 31, 2015
, respectively. Investments sold short are primarily comprised of short positions in TBAs, which we primarily use to hedge the risk of rising interest rates on our investment portfolio. Typically, we hold a net short position in TBAs. The amounts of net short TBAs, as well as other hedging instruments, may fluctuate according to the size of our investment portfolio as well as according to how we view market dynamics as favoring the use of one hedging instrument or another. As of
June 30, 2016
and December 31, 2015, we had a net short TBA position of
$326.5 million
and
$514.8 million
, respectively.
TBA-related assets include TBAs and receivables for TBAs sold short, and TBA-related liabilities include TBAs sold short and payables for TBAs purchased. As of
June 30, 2016
, total assets included
$161.6 million
of TBAs as well as
$486.7 million
of receivables for securities sold relating to unsettled TBA sales. As of
December 31, 2015
, total assets included
$98.0 million
of TBAs as well as
$613.0 million
of receivables for securities sold relating to unsettled TBA sales. As of
June 30, 2016
, total liabilities included
$488.2 million
of TBAs sold short as well as
$161.6 million
of payables for securities purchased relating to unsettled TBA purchases. As of
December 31, 2015
, total liabilities included
$612.8 million
of TBAs sold short as well as
$98.0 million
of payables for securities purchased relating to unsettled TBA purchases. Open TBA purchases and sales involving the same counterparty, the same underlying deliverable Agency pass-throughs, and the same settlement date are reflected in our consolidated financial statements on a net basis.
For a more detailed discussion of our investment portfolio, see "—
Trends and Recent Market Developments—Portfolio Overview and Outlook
" above.
We use mortgage-related credit derivatives primarily to hedge credit risk in our non-Agency MBS portfolio, although we also take net long positions in certain CDS on RMBS and CMBS indices. Our CDS on individual RMBS represent "single-name" positions whereby we have synthetically purchased credit protection on specific non-Agency RMBS bonds. As there is no longer an active market for CDS on individual RMBS, our portfolio continues to run off. We also use CDS on corporate bond indices, options thereon, and various other instruments as a means to hedge credit risk, or for relative value trading purposes. As market conditions change, especially as the pricing of various credit hedging instruments changes in relation to our outlook on future credit performance, we continuously re-evaluate both the extent to which we hedge credit risk and the particular mix of instruments that we use to hedge credit risk.
We often hold long and or short positions in corporate equities. Our short and long positions in corporate equities referencing publicly traded REITs and other financial institutions can serve either as portfolio hedges or as relative value opportunities. In addition, we acquire certain of our distressed corporate loans synthetically, in the form of total return swaps. We have also implemented an interest rate derivatives trading strategy. Within this strategy, we can take long and/or short positions in various interest rate-related instruments, such as U.S. Treasury securities, interest rate swaps, futures, and options. While some of the trading positions in this strategy are intended as hedges for various exposures in our overall portfolio, we also may take speculative positions to capitalize on what we view as market inefficiencies or anomalies.
We use a variety of instruments to hedge interest rate risk in our portfolio, including non-derivative instruments such as TBAs, U.S. Treasury securities and sovereign debt instruments, and derivative instruments such as interest rate swaps, Eurodollar and U.S. Treasury futures, and options on the foregoing. The mix of instruments that we use to hedge interest rate risk may change materially from one period to the next.
88
We have also entered into foreign currency forward contracts in order to hedge risks associated with foreign currency fluctuations.
We have entered into reverse repos to finance some of our assets. As of
June 30, 2016
and December 31, 2015, indebtedness outstanding on our reverse repos was approximately
$1.1 billion
and $1.2 billion, respectively. As of
June 30, 2016
, we had total Agency RMBS financed with reverse repos of $852.4 million as compared to $971.1 million as of December 31, 2015. As of
June 30, 2016
, we had total Credit assets financed with reverse repos of $385.8 million as compared to $383.8 million as of December 31, 2015. As of June 30, 2016 we also had total U.S. Treasury securities financed with reverse repos of $143 thousand. We did not have any U.S. Treasury securities financed with reverse repos at December 31, 2015. Outstanding indebtedness under reverse repos for Agency RMBS as of
June 30, 2016
and December 31, 2015 was $815.8 million and $933.3 million, respectively, while outstanding indebtedness under reverse repos for our Credit portfolio as of
June 30, 2016
and December 31, 2015 was $254.2 million and $240.9 million, respectively. We also had outstanding indebtedness under reverse repos on U.S. Treasury securities of $143 thousand. We did not have any reverse repos on U.S. Treasury securities at December 31, 2015. Our reverse repos bear interest at rates that have historically moved in close relationship to LIBOR. We account for our reverse repos as collateralized borrowings. In addition to our reverse repos, as of
June 30, 2016
we had outstanding indebtedness of $13.0 million in the form of a securitized debt transaction used to finance $29.0 million of commercial loans and REO. There was no indebtedness under securitized debt transactions as of December 31, 2015. As of
June 30, 2016
and December 31, 2015 our debt-to-equity ratio was
1.59
to one. Excluding U.S. Treasury securities our debt-to-equity ratio as of
June 30, 2016
was 1.59 to one. See the discussion in "—
Liquidity and Capital Resources
" below for further information on our reverse repos.
In connection with our derivative and TBA transactions, in certain circumstances we may require that counterparties post collateral with us. When we exit a derivative or TBA transaction for which a counterparty has posted collateral, we may be required to return some or all of the related collateral to the respective counterparty. As of
June 30, 2016
and December 31, 2015, our derivative and TBA counterparties posted an aggregate value of approximately $94.7 million and $114.1 million of collateral with us, respectively. This collateral posted with us is included in Due to brokers on our Consolidated Statement of Assets, Liabilities, and Equity.
TBA Market
We generally do not settle our purchases and sales of TBAs. If, for example, we wish to maintain a short position in a particular TBA as a hedge, we may "roll" the short TBA transaction. In a hypothetical roll transaction, we might have previously entered into a contract to sell a specified amount of 30-year FNMA 4.5% TBA pass-throughs to a particular counterparty on a specified settlement date. As this settlement date approaches, because we generally do not intend to settle the sale transaction, but we wish to maintain the short position, we enter into a roll transaction whereby we purchase the same amount of 30-year FNMA 4.5% TBA pass-throughs (but not necessarily from the same counterparty) for the same specified settlement date, and we sell the same amount of 30-year FNMA 4.5% TBA pass-throughs (potentially to yet another counterparty) for a later settlement date. In this way, we have essentially "flattened out" our 30-year FNMA 4.5% TBA pass-through position for the earlier settlement date (
i.e.
, offset the original sale with a corresponding purchase), and established a new short position for the later settlement date, hence maintaining our short position. By rolling our transaction, we maintain our desired short position in 30-year FNMA 4.5% securities without settling the original sale transaction.
In the case where the counterparty from whom we purchase (or to whom we sell) for the earlier settlement date is the same as the counterparty to whom we sell (or from whom we purchase) for the later settlement date, and when the purchase and sale are transacted simultaneously, the pair of simultaneous purchase and sale transactions is often referred to as a "TBA roll" transaction.
In some instances, to avoid taking or making delivery of TBA securities, we will "pair off" an open purchase or sale transaction with an offsetting sale or purchase with the same counterparty. Alternatively, we will "assign" open transactions from counterparties from whom we have purchased to other counterparties to whom we have sold. In either case, no securities are actually delivered, but instead the net difference in trade proceeds of the offsetting transactions is calculated and a money wire representing such difference is sent to the appropriate party.
For the six month period ended
June 30, 2016
, as disclosed on our Consolidated Statement of Cash Flows, the aggregate TBA activity, or volume of closed transactions based on the sum of the absolute value of buy and sell transactions, was
$11.2 billion
, as compared to
$17.2 billion
for the six month period ended
June 30, 2015
. Our TBA activity has principally consisted of: (a) sales (respectively purchases) of TBAs as hedges in connection with purchases (respectively sales) of certain other assets (especially fixed rate Agency whole pools); (b) TBA roll transactions (as described above) effected to maintain existing TBA short positions; and (c) TBA "sector rotation" transactions whereby a short position in one TBA security is replaced with a short position in a different TBA security. Since we have actively turned over our portfolio of fixed rate Agency whole pools, the
89
volume of TBA hedging transactions has also been correspondingly high. Moreover, our fixed rate Agency whole pool portfolio is typically larger in gross size than our equity capital base, and so we tend to hold large short TBA positions relative to our equity capital base at any time. Finally, the entire amount of short TBA positions held at each monthly TBA settlement date is typically rolled to the following month, and since the amount of short TBA positions tends to be large relative to our equity capital base, TBA roll transaction volume over multi-month periods can represent a multiple of our equity capital base.
Equity
As of
June 30, 2016
, our equity decreased by approximately
$59.8 million
to
$679.2 million
from $739.0 million as of December 31, 2015. This decrease principally consisted of a net decrease in equity resulting from operations for the six months ended June 30, 2016 of $(18.2) million, dividends paid of
$33.6 million
, distributions to joint venture partners of approximately
$2.2 million
, and payments to repurchase common shares of
$6.6 million
, partially offset by an increase related to contributions from our non-controlling interests of approximately
$0.7 million
. Shareholders' equity, which excludes the non-controlling interests related to the minority interest in the Operating Partnership as well the minority interests of our joint venture partners, was
$674.0 million
as of
June 30, 2016
.
Results of Operations for the Three Month Periods Ended
June 30, 2016
and 2015
The table below represents the net increase (decrease) in equity resulting from operations for the three month periods ended
June 30, 2016
and 2015.
|
Three Month Period Ended June 30,
|
||||||||
|
(In thousands except per share amounts)
|
2016
|
2015
|
||||||
|
Interest income
|
$
|
18,990
|
|
$
|
25,739
|
|
||
|
Other income
|
1,024
|
|
1,023
|
|
||||
|
Total investment income
|
20,014
|
|
26,762
|
|
||||
|
Expenses:
|
||||||||
|
Base management fee
|
2,553
|
|
2,920
|
|
||||
|
Interest expense
|
4,234
|
|
2,867
|
|
||||
|
Other investment related expenses
|
2,191
|
|
1,163
|
|
||||
|
Other operating expenses
|
2,515
|
|
2,082
|
|
||||
|
Total expenses
|
11,493
|
|
9,032
|
|
||||
|
Net investment income
|
8,521
|
|
17,730
|
|
||||
|
Net realized and change in net unrealized gain (loss) on investments
|
4,612
|
|
(5,830
|
)
|
||||
|
Net realized and change in net unrealized gain (loss) on financial derivatives, excluding currency forwards
|
(8,004
|
)
|
1,251
|
|
||||
|
Net realized and change in net unrealized gain (loss) on financial derivatives—currency forwards
|
2,528
|
|
(2,616
|
)
|
||||
|
Net foreign currency gain (loss)
|
(2,655
|
)
|
2,688
|
|
||||
|
Net increase (decrease) in equity resulting from operations
|
5,002
|
|
13,223
|
|
||||
|
Less: Net increase in equity resulting from operations attributable to non-controlling interests
|
17
|
|
71
|
|
||||
|
Net increase (decrease) in shareholders' equity resulting from operations
|
$
|
4,985
|
|
$
|
13,152
|
|
||
|
Net increase (decrease) in shareholders' equity resulting from operations per share
|
$
|
0.15
|
|
$
|
0.39
|
|
||
Summary of Net Increase (Decrease) in Shareholders' Equity from Operations
For the three month periods ended
June 30, 2016
and June 30, 2015, we had a net increase in shareholders' equity resulting from operations of
$5.0 million
and
$13.2 million
, respectively. The period-over-period decrease in our results of operations was principally due to a decrease in our net investment income for the three month period ended June 30, 2016. Lower interest income was the main component of the period-over period change in net investment income. The decrease in interest income was primarily the result of a decrease in the size of our investment portfolio, as we have reduced our capital allocation to our securities portfolio and are reallocating that capital to our loan portfolio, which continues to ramp up in size. We also employed less leverage in our Agency RMBS portfolio in the current period as compared to the same period in 2015. As our loan portfolio continues to grow, our expectation is that our interest income and leverage will increase from current levels. During the three month period ended June 30, 2016, our long portfolio performed well. Our investments in securities
90
benefited from tightening spreads and our active trading, and the credit performance of our loan portfolios met with our expectations. While interest rate volatility eased in the first two months of the second quarter, the month of June was marked by the resumption of significant volatility, principally tied to uncertainty around the Brexit vote and its ultimate impact on the global macroeconomic environment. Over the course of the quarter, interest rates dropped significantly and credit spreads on high-yield corporates tightened, leading to losses on our interest rate and credit hedges, which dampened our results for the quarter. Our credit hedges are primarily in the form of short credit default swaps on high-yield corporate bond indices. Total return based on changes in "net asset value" or "book value" for our common shares was 0.82% for the three month period ended
June 30, 2016
as compared to 1.67% for the three month period ended
June 30, 2015
. Total return on our common shares is calculated based on changes in net asset value per share or book value per share and assumes reinvestment of dividends.
Net Investment Income
Net investment income was
$8.5 million
for the three month period ended
June 30, 2016
as compared to
$17.7 million
for the three month period ended
June 30, 2015
. Net investment income consists of interest and other income less total expenses. The period-over-period decrease in net investment income was primarily due to lower interest income for the three month period ended
June 30, 2016
as compared to the three month period ended
June 30, 2015
.
Interest Income
Interest income was
$19.0 million
for the three month period ended
June 30, 2016
as compared to
$25.7 million
for the three month period ended
June 30, 2015
. Interest income includes coupon payments received and accrued on our holdings, the net accretion and amortization of purchase discounts and premiums on those holdings and interest on our cash balances, including those balances held by our counterparties as collateral. On a period-over-period basis, interest income from both our Agency and Credit portfolios decreased, mainly in connection with the decrease in our average portfolio holdings. For the three month period ended
June 30, 2016
, interest income from our Agency RMBS was
$5.3 million
, while for the three month period ended
June 30, 2015
, interest income was
$8.2 million
. For the three month period ended
June 30, 2016
, interest income from our Credit portfolio was
$13.4 million
, while for the three month period ended
June 30, 2015
, interest income was
$17.4 million
. The decrease in interest income was primarily due to a decline in our average portfolio holdings, as well as a decrease in the average yield of our Credit portfolio. The decrease in the average yield of our Credit portfolio was generally based on the decrease in the relative contribution from certain higher-yielding asset classes in which our positions have decreased in size.
The following table details our interest income, average holdings of interest-earning assets, and weighted average yield based on amortized cost for the three month periods ended
June 30, 2016
and 2015:
|
Credit
(1)
|
Agency
(1)
|
Total
(1)
|
||||||||||||||||||||||||||||||
|
(In thousands)
|
Interest Income
|
Average Holdings
|
Yield
|
Interest Income
|
Average Holdings
|
Yield
|
Interest Income
|
Average Holdings
|
Yield
|
|||||||||||||||||||||||
|
Three month period ended June 30, 2016
|
$
|
13,441
|
|
$
|
576,198
|
|
9.33
|
%
|
$
|
5,322
|
|
$
|
903,380
|
|
2.36
|
%
|
$
|
18,763
|
|
$
|
1,479,578
|
|
5.07
|
%
|
||||||||
|
Three month period ended June 30, 2015
|
$
|
17,397
|
|
$
|
693,417
|
|
10.04
|
%
|
$
|
8,203
|
|
$
|
1,160,628
|
|
2.83
|
%
|
$
|
25,600
|
|
$
|
1,854,045
|
|
5.52
|
%
|
||||||||
|
(1)
|
Amounts exclude interest income on cash and cash equivalents (including when posted as margin) and long positions in U.S. Treasury securities.
|
Base Management Fees
For the three month periods ended
June 30, 2016
and 2015, base management fee incurred, which is based on total equity at the end of each quarter, was $2.6 million and $2.9 million, respectively. The decrease in the base management fee was due to our smaller capital base period over period.
91
Interest Expense
Interest expense primarily includes interest on funds borrowed under reverse repos and securitized debt, coupon interest on securities sold short, the related net accretion and amortization of purchase discounts and premiums on those short holdings, and interest on our counterparties' cash collateral held by us. We had average borrowed funds under reverse repos and securitized debt of
$1.14 billion
and
$1.43 billion
for the three month periods ended
June 30, 2016
and 2015, respectively. Our total interest expense, inclusive of interest expense on our counterparties' cash collateral held by us, increased to
$4.2 million
for the three month period ended
June 30, 2016
as compared to
$2.9 million
for the three month period ended
June 30, 2015
. This increase in our interest expense was in part due to the increase in the cost of repo and securitized debt in the current period relative to the prior period. In December 2015, for the first time in several years, the Federal Reserve increased the target range for the federal funds rate by 25 basis points to 0.25% to 0.50% from 0.0% to 0.25%.The increase in our interest expense was also the result of a shift in the mix of our borrowings, as more of our Credit-related borrowings now relate to our growing loan portfolios, and as loans generally carry higher borrowing rates and debt issuance costs as compared to securities.
The tables below show our average borrowed funds, interest expense, average cost of funds, and average one-month and average six-month LIBOR rates under our reverse repos and securitized debt for the three month periods ended
June 30, 2016
and 2015.
Agency Securities
|
(In thousands)
|
Average Borrowed Funds
|
Interest Expense
|
Average Cost of Funds
|
Average One-Month LIBOR
|
Average Six-Month LIBOR
|
||||||||||||
|
For the three month period ended June 30, 2016
|
$
|
850,986
|
|
$
|
1,499
|
|
0.71
|
%
|
0.44
|
%
|
0.92
|
%
|
|||||
|
For the three month period ended June 30, 2015
|
$
|
1,095,056
|
|
$
|
1,069
|
|
0.39
|
%
|
0.18
|
%
|
0.42
|
%
|
|||||
Credit Portfolio
|
(In thousands)
|
Average Borrowed Funds
|
Interest Expense
|
Average Cost of Funds
|
Average One-Month LIBOR
|
Average Six-Month LIBOR
|
||||||||||||
|
For the three month period ended June 30, 2016
|
$
|
283,775
|
|
$
|
2,216
|
|
3.14
|
%
|
0.44
|
%
|
0.92
|
%
|
|||||
|
For the three month period ended June 30, 2015
|
$
|
299,675
|
|
$
|
1,584
|
|
2.12
|
%
|
0.18
|
%
|
0.42
|
%
|
|||||
U.S. Treasury Securities
|
(In thousands)
|
Average Borrowed Funds
|
Interest Expense
|
Average Cost of Funds
|
Average One-Month LIBOR
|
Average Six-Month LIBOR
|
||||||||||||
|
For the three month period ended June 30, 2016
|
$
|
9,280
|
|
$
|
7
|
|
0.28
|
%
|
0.44
|
%
|
0.92
|
%
|
|||||
|
For the three month period ended June 30, 2015
|
$
|
32,638
|
|
$
|
(1
|
)
|
(0.01
|
)%
|
0.18
|
%
|
0.42
|
%
|
|||||
Total
|
(In thousands)
|
Average Borrowed Funds
|
Interest Expense
|
Average Cost of Funds
|
Average One-Month LIBOR
|
Average Six-Month LIBOR
|
||||||||||||
|
For the three month period ended June 30, 2016
|
$
|
1,144,041
|
|
$
|
3,722
|
|
1.31
|
%
|
0.44
|
%
|
0.92
|
%
|
|||||
|
For the three month period ended June 30, 2015
|
$
|
1,427,369
|
|
$
|
2,652
|
|
0.75
|
%
|
0.18
|
%
|
0.42
|
%
|
|||||
Among other instruments, we use interest rate swaps to hedge our portfolios against the risk of rising interest rates. If we were to include as a component of our cost of funds the actual and accrued periodic payments on our interest rate swaps used to hedge our yield-bearing targeted assets, our total average cost of funds would increase to 1.50% and 0.82% for the three month periods ended
June 30, 2016
and 2015, respectively. Our net interest margin, defined as the yield on our portfolio of yield-bearing targeted assets (See—Interest Income above), less our cost of funds (including actual and accrued periodic payments on interest rate swaps as described above) was 3.57% and 4.70% for the three month periods ended
June 30, 2016
and 2015, respectively. These metrics do not include amortization of upfront payments associated with certain of our interest rate swaps or the costs associated with other instruments that we use to hedge interest rate risk, such as TBAs and futures.
Incentive Fees
92
In addition to the base management fee, our Manager is also entitled to a quarterly incentive fee if our performance (as measured by adjusted net income, as defined in the management agreement) over the relevant rolling four quarter calculation period exceeds a defined return hurdle for the period. No incentive fee was incurred for the three month periods ended
June 30, 2016
and 2015, since on a rolling four quarter basis, our income did not exceed the prescribed hurdle amount. Because our operating results can vary materially from one period to another, incentive fee expense can also be highly variable.
Other Investment Related Expenses
Other investment related expenses consist of servicing fees on our mortgage and consumer loans, as well as various other expenses and fees directly related to our financial assets. For the three month periods ended
June 30, 2016
and 2015 other investment related expenses were
$2.2 million
and
$1.2 million
, respectively. The increase was primarily due to increased servicing fees and other expenses relating to our loan portfolios, which have increased in size period over period.
Other Operating Expenses
Other operating expenses consist of professional fees, compensation expense related to our dedicated or partially dedicated personnel, administration fees, share-based LTIP expense, insurance expense, and various other operating expenses necessary to run our business. Other operating expenses exclude management and incentive fees, interest expense, and other investment related expenses. Other operating expenses for the three month period ended
June 30, 2016
were
$2.5 million
as compared to
$2.1 million
for the three month period ended
June 30, 2015
. The increase in our other operating expenses was primarily related to increased professional fees and compensation expense.
Net Realized and Unrealized Gains (Losses) on Investments
During the three month period ended
June 30, 2016
, we had net realized and unrealized gains on investments of
$4.6 million
as compared to net realized and unrealized losses of
$(5.8) million
for the three month period ended
June 30, 2015
. Net realized and unrealized gains on investments of
$4.6 million
for the three month period ended
June 30, 2016
resulted principally from net realized and unrealized gains from U.S. non-Agency RMBS, Agency RMBS pass-throughs, non-performing residential whole loans, commercial and residential REO, and distressed corporate debt, partially offset by net realized and unrealized losses on net short TBAs, U.S. Treasury securities and sovereign debt, European MBS, and U.S. CMBS. Our net short positions in TBAs, U.S. Treasury and sovereign securities are used primarily to hedge interest rate and/or prepayment risk with respect to our investment holdings. While market volatility was relatively low in the first two months of the three month period ended June 30, 2016, it increased significantly in June, leading up to and following the Brexit vote. Yield spreads on many fixed-income sectors tightened over the course of the three month period, while certain others widened.
Net realized and unrealized losses on investments of
$(5.8) million
for the three month period ended
June 30, 2015
resulted principally from net realized and unrealized losses on Agency pass-throughs, distressed corporate debt holdings, non-Agency CMBS, small balance commercial loans, CLOs, net short positions in U.S. Treasury securities, and net short positions in sovereign bonds, partially offset by net realized and unrealized gains on net short positions in TBAs, non-Agency RMBS, residential mortgage loans, and non-listed equities.
Net Realized and Unrealized Gains and (Losses) on Financial Derivatives
During the three month period ended
June 30, 2016
, we had net realized and unrealized losses on our financial derivatives of
$(5.5) million
as compared to net realized and unrealized losses of
$(1.4) million
for the three month period ended
June 30, 2015
. Our financial derivatives consist of interest rate derivatives, which we use primarily to hedge interest rate risk, and of credit derivatives and total return swaps, both of which we use primarily to hedge credit risk, but also for non-hedging purposes. Non-hedging credit derivatives and total return swaps include both long and short positions. Our derivatives also include foreign currency forwards, which we use to hedge foreign currency risk. Our interest rate derivatives are primarily in the form of net short positions in interest rate swaps, short and/or long positions in Eurodollar futures and U.S. Treasury Note futures, as well as purchased and written swaptions. We also use certain non-derivative instruments, such as TBAs, U.S. Treasury securities and sovereign debt instruments, to hedge interest rate risk. Our credit hedges are primarily in the form of credit default swaps on high-yield corporate bond indices, as well as tranches and options on these indices, and credit default swaps where we have purchased credit protection on non-Agency MBS indices and individual MBS. We also use total return swaps to take synthetic long or short positions in the equity of certain publicly traded mortgage-related or corporate entities. We acquire certain of our distressed corporate loans synthetically, in the form of total return swaps. Net realized and unrealized losses of
$(5.5) million
on our financial derivatives for the three month period ended
June 30, 2016
resulted primarily from net losses related to our CDS on high yield corporate bond indices, interest rate swaps, and total return swaps, partially offset by net gains on our options on CDS on high yield corporate bond indices and our CDS on asset-backed indices. Net gains on our currency forwards were largely offset by translation and transaction losses related to our non-dollar denominated European assets.
93
Net realized and unrealized losses on our financial derivatives of
$(1.4) million
for the three month period ended
June 30, 2015
resulted primarily from net losses related to our equities strategy, total return swaps on distressed debt, and foreign currency hedges, partially offset by net gains related to our interest rate swaps, options, and credit hedges. While our currency forwards generated net losses during the period, we had offsetting net translation and transaction gains.
Results of Operations for the Six Month Periods Ended
June 30, 2016
and 2015
The table below represents the net increase (decrease) in equity resulting from operations for the six month periods ended
June 30, 2016
and 2015.
|
Six Month Period Ended
June 30,
|
||||||||
|
(In thousands except per share amounts)
|
2016
|
2015
|
||||||
|
Interest income
|
$
|
39,417
|
|
$
|
52,252
|
|
||
|
Other income
|
2,692
|
|
1,316
|
|
||||
|
Total investment income
|
42,109
|
|
53,568
|
|
||||
|
Expenses:
|
||||||||
|
Base management fee
|
5,164
|
|
5,872
|
|
||||
|
Interest expense
|
7,702
|
|
5,853
|
|
||||
|
Other investment related expenses
|
3,938
|
|
2,365
|
|
||||
|
Other operating expenses
|
4,962
|
|
4,281
|
|
||||
|
Total expenses
|
21,766
|
|
18,371
|
|
||||
|
Net investment income
|
20,343
|
|
35,197
|
|
||||
|
Net realized and change in net unrealized gain (loss) on investments
|
(1,764
|
)
|
4,597
|
|
||||
|
Net realized and change in net unrealized gain (loss) on financial derivatives, excluding currency forwards
|
(36,896
|
)
|
(7,227
|
)
|
||||
|
Net realized and change in net unrealized gain (loss) on financial derivatives—currency forwards
|
(851
|
)
|
1,715
|
|
||||
|
Net foreign currency gain (loss)
|
984
|
|
(1,642
|
)
|
||||
|
Net increase (decrease) in equity resulting from operations
|
(18,184
|
)
|
32,640
|
|
||||
|
Less: Net increase in equity resulting from operations attributable to non-controlling interests
|
31
|
|
227
|
|
||||
|
Net increase (decrease) in shareholders' equity resulting from operations
|
$
|
(18,215
|
)
|
$
|
32,413
|
|
||
|
Net increase (decrease) in shareholders' equity resulting from operations per share
|
$
|
(0.54
|
)
|
$
|
0.96
|
|
||
Summary of Net Increase (Decrease) in Shareholders' Equity from Operations
For the six month period ended
June 30, 2016
we had a net decrease in shareholders' equity resulting from operations of
$(18.2) million
and for the six month period ended June 30, 2015 we had a net increase in shareholders' equity resulting from operations of
$32.4 million
. The period-over-period reversal in our results of operations was due to an increase in our combined net realized and unrealized losses on our financial derivatives and to a lesser degree our investments, and a decrease in our net investment income. Lower interest income was the main component of the period-over-period change in net investment income. The decrease in interest income was primarily the result of a decrease in the size of our investment portfolio, as we have reduced our capital allocation to our securities portfolio and are reallocating that capital to our loan portfolio, which continues to ramp up in size. We also employed less leverage in our Agency RMBS portfolio in the current period as compared to the same period in 2015. As our loan portfolio continues to grow, our expectation is that our interest income and leverage will increase from current levels. During the six month period ended June 30, 2016, credit markets experienced an overall high level of volatility. As a result of these market movements, we had net realized and unrealized losses on both our credit hedges, which are primarily in the form of CDS on high-yield corporate bond indices, and on certain of our securities holdings. These losses were partially offset by positive results from our loan portfolios, including consumer loans, small balance commercial mortgage loans and residential mortgage loans. Total return based on changes in "net asset value" or "book value" for our common shares was -2.38% for the six month period ended
June 30, 2016
as compared to 4.18% for the six month period ended
June 30, 2015
. Total return on our common shares is calculated based on changes in net asset value per share or book value per share and assumes reinvestment of dividends.
94
Net Investment Income
Net investment income was
$20.3 million
for the six month period ended
June 30, 2016
as compared to
$35.2 million
for the six month period ended
June 30, 2015
. Net investment income consists of interest and other income less total expenses. The period-over-period decrease in net investment income was primarily due to lower interest income for the six month period ended
June 30, 2016
as compared to the six month period ended
June 30, 2015
.
Interest Income
Interest income was
$39.4 million
for the six month period ended
June 30, 2016
as compared to
$52.3 million
for the six month period ended
June 30, 2015
. Interest income includes coupon payments received and accrued on our holdings, the net accretion and amortization of purchase discounts and premiums on those holdings and interest on our cash balances, including those balances held by our counterparties as collateral. On a period-over-period basis, interest income from both our Agency and Credit portfolios decreased, mainly in connection with the decrease in our average portfolio holdings. For the six month period ended
June 30, 2016
, interest income from our Agency RMBS was
$12.9 million
, while for the six month period ended
June 30, 2015
, interest income was
$17.2 million
. For the six month period ended
June 30, 2016
, interest income from our Credit portfolio was
$26.2 million
, while for the six month period ended
June 30, 2015
, interest income was
$34.8 million
. The decrease in interest income was primarily due to a decline in our average portfolio holdings, as well as a decrease in the average yield of our Credit portfolio. The decrease in the average yield of our Credit portfolio was generally based on the decrease in the relative contribution from certain higher-yielding asset classes in which our positions have decreased in size.
The following table details our interest income, average holdings of interest-earning assets, and weighted average yield based on amortized cost for the six month periods ended
June 30, 2016
and 2015:
|
Credit
(1)
|
Agency
(1)
|
Total
(1)
|
||||||||||||||||||||||||||||||
|
(In thousands)
|
Interest Income
|
Average Holdings
|
Yield
|
Interest Income
|
Average Holdings
|
Yield
|
Interest Income
|
Average Holdings
|
Yield
|
|||||||||||||||||||||||
|
Six month period ended June 30, 2016
|
$
|
26,206
|
|
$
|
576,567
|
|
9.09
|
%
|
$
|
12,878
|
|
$
|
922,412
|
|
2.79
|
%
|
$
|
39,084
|
|
$
|
1,498,979
|
|
5.21
|
%
|
||||||||
|
Six month period ended June 30, 2015
|
$
|
34,794
|
|
$
|
718,774
|
|
9.68
|
%
|
$
|
17,211
|
|
$
|
1,180,030
|
|
2.92
|
%
|
$
|
52,005
|
|
$
|
1,898,804
|
|
5.48
|
%
|
||||||||
|
(1)
|
Amounts exclude interest income on cash and cash equivalents (including when posted as margin) and long positions in U.S. Treasury securities.
|
Base Management Fees
For the six month periods ended
June 30, 2016
and 2015, base management fee incurred, which is based on total equity at the end of each quarter, was
$5.2 million
and
$5.9 million
, respectively. The decrease in the base management fee was due to our smaller capital base period over period.
Interest Expense
Interest expense primarily includes interest on funds borrowed under reverse repos and securitized debt, coupon interest on securities sold short, the related net accretion and amortization of purchase discounts and premiums on those short holdings, and interest on our counterparties' cash collateral held by us. We had average borrowed funds under reverse repos and securitized debt of
$1.16 billion
and
$1.47 billion
for the six month periods ended
June 30, 2016
and 2015, respectively. Our total interest expense, inclusive of interest expense on our counterparties' cash collateral held by us, increased to
$7.7 million
for the six month period ended
June 30, 2016
, as compared to
$5.9 million
for the six month period ended
June 30, 2015
. This increase in our interest expense was in part due to the increase in the cost of repo and securitized debt in the current period relative to the prior period. In December 2015, for the first time in several years, the Federal Reserve increased the target range for the federal funds rate by 25 basis points to 0.25% to 0.50% from 0.0% to 0.25%.The increase in our interest expense was also the result of a shift in the mix of our borrowings, as more of our Credit-related borrowings now relate to our growing loan portfolios, and as loans generally carry higher borrowing rates and debt issuance costs as compared to securities.
95
The tables below show our average borrowed funds, interest expense, average cost of funds, and average one-month and average six-month LIBOR rates under our reverse repos and securitized debt for the six month periods ended
June 30, 2016
and 2015.
Agency Securities
|
(In thousands)
|
Average Borrowed Funds
|
Interest Expense
|
Average Cost of Funds
|
Average One-Month LIBOR
|
Average Six-Month LIBOR
|
||||||||||||
|
For the six month period ended June 30, 2016
|
$
|
873,731
|
|
$
|
2,926
|
|
0.67
|
%
|
0.44
|
%
|
0.90
|
%
|
|||||
|
For the six month period ended June 30, 2015
|
$
|
1,117,150
|
|
$
|
2,088
|
|
0.38
|
%
|
0.18
|
%
|
0.40
|
%
|
|||||
Credit Portfolio
|
(In thousands)
|
Average Borrowed Funds
|
Interest Expense
|
Average Cost of Funds
|
Average One-Month LIBOR
|
Average Six-Month LIBOR
|
||||||||||||
|
For the six month period ended June 30, 2016
|
$
|
274,642
|
|
$
|
3,896
|
|
2.85
|
%
|
0.44
|
%
|
0.90
|
%
|
|||||
|
For the six month period ended June 30, 2015
|
$
|
323,612
|
|
$
|
3,350
|
|
2.09
|
%
|
0.18
|
%
|
0.40
|
%
|
|||||
U.S. Treasury Securities
|
(In thousands)
|
Average Borrowed Funds
|
Interest Expense
|
Average Cost of Funds
|
Average One-Month LIBOR
|
Average Six-Month LIBOR
|
||||||||||||
|
For the six month period ended June 30, 2016
|
$
|
14,838
|
|
$
|
17
|
|
0.22
|
%
|
0.44
|
%
|
0.90
|
%
|
|||||
|
For the six month period ended June 30, 2015
|
$
|
25,321
|
|
$
|
4
|
|
0.03
|
%
|
0.18
|
%
|
0.40
|
%
|
|||||
Total
|
(In thousands)
|
Average Borrowed Funds
|
Interest Expense
|
Average Cost of Funds
|
Average One-Month LIBOR
|
Average Six-Month LIBOR
|
||||||||||||
|
For the six month period ended June 30, 2016
|
$
|
1,163,211
|
|
$
|
6,839
|
|
1.18
|
%
|
0.44
|
%
|
0.90
|
%
|
|||||
|
For the six month period ended June 30, 2015
|
$
|
1,466,083
|
|
$
|
5,442
|
|
0.75
|
%
|
0.18
|
%
|
0.40
|
%
|
|||||
Among other instruments, we use interest rate swaps to hedge our portfolios against the risk of rising interest rates. If we were to include as a component of our cost of funds the actual and accrued periodic payments on our interest rate swaps used to hedge our yield-bearing targeted assets, our total average cost of funds would increase to 1.42% and 0.99% for the six month periods ended
June 30, 2016
and 2015, respectively. Our net interest margin, defined as the yield on our portfolio of yield-bearing targeted assets (See—Interest Income above), less our cost of funds (including actual and accrued periodic payments on interest rate swaps as described above) was 3.79% and 4.49% for the six month periods ended
June 30, 2016
and 2015, respectively. These metrics do not include amortization of upfront payments associated with certain of our interest rate swaps or the costs associated with other instruments that we use to hedge interest rate risk, such as TBAs and futures.
Incentive Fees
In addition to the base management fee, our Manager is also entitled to a quarterly incentive fee if our performance (as measured by adjusted net income, as defined in the management agreement) over the relevant rolling four quarter calculation period exceeds a defined return hurdle for the period. No incentive fee was incurred for the six month periods ended
June 30, 2016
and 2015, since on a rolling four quarter basis, our income did not exceed the prescribed hurdle amount. Because our operating results can vary materially from one period to another, incentive fee expense can also be highly variable.
Other Investment Related Expenses
Other investment related expenses consist of servicing fees on our mortgage and consumer loans, as well as various other expenses and fees directly related to our financial assets. For the six month periods ended
June 30, 2016
and 2015 other investment related expenses were
$3.9 million
and
$2.4 million
, respectively. The increase was primarily due to increased servicing fees and other expenses relating to our loan portfolios, which have increased in size period over period.
96
Other Operating Expenses
Other operating expenses consist of professional fees, compensation expense related to our dedicated or partially dedicated personnel, administration fees, share-based LTIP expense, insurance expense, and various other operating expenses necessary to run our business. Other operating expenses exclude management and incentive fees, interest expense, and other investment related expenses. Other operating expenses for the six month period ended
June 30, 2016
were
$5.0 million
as compared to
$4.3 million
for the six month period ended
June 30, 2015
. The increase in our other operating expenses was primarily related to increased professional fees and compensation expense.
Net Realized and Unrealized Gains (Losses) on Investments
During the six month period ended
June 30, 2016
, we had net realized and unrealized losses on investments of
$(1.8) million
as compared to net realized and unrealized gains of
$4.6 million
for the six month period ended
June 30, 2015
. Net realized and unrealized losses on investments of
$(1.8) million
for the six month period ended
June 30, 2016
resulted principally from net realized and unrealized losses on U.S. CMBS and European MBS, distressed corporate debt and equities, net short TBAs, net short U.S. Treasury and sovereign positions, and investments in mortgage originators, partially offset by net realized and unrealized gains on Agency RMBS pass-throughs, non-Agency RMBS, small balance commercial mortgage loans, residential loans, and REO. Our net short positions in TBAs, U.S. Treasury and sovereign securities are used primarily to hedge interest rate and/or prepayment risk with respect to our investment holdings. During the six month period ended
June 30, 2016
, the fixed income market was subject to significant interest rate volatility, leading to overall market value declines, especially in many credit-sensitive sectors.
Net realized and unrealized gains on investments of
$4.6 million
for the six month period ended
June 30, 2015
resulted principally from net realized and unrealized gains on non-Agency RMBS, residential and consumer loans, REO, Agency IOs, and net short positions in sovereign bonds, partially offset by net realized and unrealized losses on Agency pass-throughs, non-Agency CMBS, CLOs, distressed debt, and net short positions in U.S. Treasury securities and TBAs.
Net Realized and Unrealized Gains and (Losses) on Financial Derivatives
During the six month period ended
June 30, 2016
, we had net realized and unrealized losses on our financial derivatives of
$(37.7) million
as compared to net realized and unrealized losses of
$(5.5) million
for the six month period ended
June 30, 2015
. Our financial derivatives consist of interest rate derivatives, which we use primarily to hedge interest rate risk, and of credit derivatives and total return swaps, both of which we use primarily to hedge credit risk, but also for non-hedging purposes. Non-hedging credit derivatives and total return swaps include both long and short positions. Our derivatives also include foreign currency forwards, which we use to hedge foreign currency risk. Our interest rate derivatives are primarily in the form of net short positions in interest rate swaps, short and/or long positions in Eurodollar futures and U.S. Treasury Note futures, as well as purchased and written swaptions. We also use certain non-derivative instruments, such as TBAs, U.S. Treasury securities and sovereign debt instruments, to hedge interest rate risk. Our credit hedges are primarily in the form of credit default swaps on high-yield corporate bond indices, as well as tranches and options on these indices, and credit default swaps where we have purchased credit protection on non-Agency MBS indices and individual MBS. We also use total return swaps to take synthetic long or short positions in the equity of certain publicly traded mortgage-related or corporate entities. We acquire certain of our distressed corporate loans synthetically, in the form of total return swaps. Net realized and unrealized losses of
$(37.7) million
on our financial derivatives for the six month period ended
June 30, 2016
resulted primarily from net losses related to our CDS on high yield corporate bond indices, our interest rate swaps, and our total return swaps, partially offset by net gains on our options on CDS on high yield corporate bond indices and our CDS on asset-backed indices. Net losses on our currency forwards were largely offset by translation and transaction gains related to our non-dollar denominated European assets.
Net realized and unrealized losses on our financial derivatives of
$(5.5) million
for the six month period ended
June 30, 2015
resulted primarily from net losses related to our total return and interest rate swaps, partially offset by net realized and unrealized gains on our currency forwards.
97
Liquidity and Capital Resources
Liquidity refers to our ability to meet our cash needs, including repaying our borrowings, funding and maintaining positions in MBS and other assets, making distributions in the form of dividends, and other general business needs. Our short-term (one year or less) and long-term liquidity requirements include acquisition costs for assets we acquire, payment of our base management fee and incentive fee, compliance with margin requirements under our repurchase agreements, or "repos," reverse repos, TBAs, and financial derivative contracts, repayment of reverse repo borrowings to the extent we are unable or unwilling to extend our reverse repos, payment of our general operating expenses, and payment of our quarterly dividend. Our capital resources primarily include cash on hand, cash flow from our investments (including monthly principal and interest payments received on our investments and proceeds from the sale of investments), borrowings under reverse repos, and proceeds from equity offerings. We expect that these sources of funds will be sufficient to meet our short-term and long-term liquidity needs.
The following summarizes our reverse repos:
|
Reverse Repurchase Agreements
|
||||||||
|
(In thousands)
|
Average Borrowed Funds During
the Period
|
Borrowed Funds Outstanding at End of the Period
|
||||||
|
Six Month Period Ended June 30, 2016
|
$
|
1,151,718
|
|
$
|
1,070,105
|
|
||
|
Six Month Period Ended June 30, 2015
|
$
|
1,466,083
|
|
$
|
1,360,408
|
|
||
The following summarizes our borrowings under reverse repos by remaining maturity:
|
(In thousands)
|
June 30, 2016
|
||||||
|
Remaining Days to Maturity
|
Outstanding Borrowings
|
%
|
|||||
|
30 Days or Less
|
$
|
380,990
|
|
35.6
|
%
|
||
|
31 - 60 Days
|
272,586
|
|
25.5
|
%
|
|||
|
61 - 90 Days
|
272,479
|
|
25.5
|
%
|
|||
|
91 - 120 Days
|
4,518
|
|
0.4
|
%
|
|||
|
121 - 150 Days
|
9,669
|
|
0.9
|
%
|
|||
|
151 - 180 Days
|
12,021
|
|
1.1
|
%
|
|||
|
181 - 360 Days
|
85,671
|
|
8.0
|
%
|
|||
|
> 360 Days
|
32,171
|
|
3.0
|
%
|
|||
|
$
|
1,070,105
|
|
100.0
|
%
|
|||
Reverse repos involving underlying investments that we sold prior to
June 30, 2016
, for settlement following
June 30, 2016
, are shown using their original maturity dates even though such reverse repos may be expected to be terminated early upon settlement of the sale of the underlying investment. Not included are any reverse repos that we may have entered into prior to
June 30, 2016
for which delivery of the borrowed funds is not scheduled until after
June 30, 2016
.
The amounts borrowed under our reverse repo agreements are generally subject to the application of "haircuts." A haircut is the percentage discount that a repo lender applies to the market value of an asset serving as collateral for a repo borrowing, for the purpose of determining whether such repo borrowing is adequately collateralized. As of
June 30, 2016
, the weighted average contractual haircut applicable to the assets that serve as collateral for our outstanding repo borrowings (excluding repo borrowings related to U.S. Treasury securities) was 30.9% with respect to Credit assets, 5.1% with respect to Agency RMBS assets, and 13.2% overall. As of December 31, 2015 these respective weighted average contractual haircuts were 32.8%, 5.3%, and 13.1%.
We expect to continue to borrow funds in the form of reverse repos as well as other similar types of financings. The terms of these borrowings under our master repurchase agreements generally conform to the terms in the standard master repurchase agreement as published by the Securities Industry and Financial Markets Association as to repayment and margin requirements. In addition, each lender may require that we include supplemental terms and conditions to the standard master repurchase agreement. Typical supplemental terms and conditions include the addition of or changes to provisions relating to margin calls, net asset value requirements, cross default provisions, certain key person events, changes in corporate structure, and requirements that all controversies related to the repurchase agreement be litigated in a particular jurisdiction. These provisions may differ for each of our lenders.
98
As of
June 30, 2016
and December 31, 2015, we had
$1.1 billion
and $1.2 billion, respectively, of borrowings outstanding under our reverse repos. As of
June 30, 2016
, the remaining terms on our reverse repos ranged from
1
day to
484
days, with a weighted average remaining term of
78
days. As of December 31, 2015, the remaining terms on our reverse repos ranged from
4
days to
666
days, with a weighted average remaining term of
100
days. Our reverse repo borrowings were with a total of
twenty
counterparties as of
June 30, 2016
and eighteen counterparties as of December 31, 2015. As of
June 30, 2016
and December 31, 2015, our reverse repos, excluding those on U.S. Treasury securities, had a weighted average borrowing rate of 1.18% and
0.97%
, respectively. As of
June 30, 2016
, our reverse repos had interest rates ranging from
0.57%
to
3.46%
. As of December 31, 2015, our reverse repos had interest rates ranging from
0.37%
to
2.92%
. Investments transferred as collateral under reverse repos had an aggregate estimated fair value of
$1.2 billion
and $1.4 billion as of
June 30, 2016
and December 31, 2015, respectively. The interest rates of our reverse repos have historically moved in close relationship to short-term LIBOR rates, and in some cases are explicitly indexed to short-term LIBOR rates and reset accordingly. It is expected that amounts due upon maturity of our reverse repos will be funded primarily through the roll/re-initiation of reverse repos and, if we are unable or unwilling to roll/re-initiate our reverse repos, through free cash and proceeds from the sale of securities.
In addition to our borrowings under reverse repurchase agreements, in March 2016 we entered into a securitization transaction to finance certain of our commercial mortgage loans and REO which was accounted for as a collateralized borrowing. As of
June 30, 2016
we had outstanding borrowings in the amount of
$13.0 million
in connection with this securitization which is reflected under the caption "Securitized debt" on the Consolidated Statement of Assets, Liabilities, and Equity. As of
June 30, 2016
, the fair value of commercial mortgage loans and REO collateralizing this financing was
$29.0 million
. Interest accrues on this debt at a rate of LIBOR plus 3.25% and the debt has a maturity date of March 16, 2018. See Note 7 in the notes to our consolidated financial statements for further information on the Company's securitized debt.
The following table details total outstanding borrowings, average outstanding borrowings, and the maximum outstanding borrowings at any month end for each quarter under reverse repurchase agreements for the past twelve quarters:
|
Quarter Ended
|
Borrowings Outstanding at
Quarter End
|
Average
Borrowings Outstanding
|
Maximum Borrowings Outstanding at Any Month End
|
|||||||||
|
(In thousands)
|
||||||||||||
|
June 30, 2016
|
$
|
1,070,105
|
|
$
|
1,124,885
|
|
$
|
1,160,096
|
|
|||
|
March 31, 2016
|
1,149,064
|
|
1,158,155
|
|
1,205,385
|
|
||||||
|
December 31, 2015
(1)
|
1,174,189
|
|
1,335,360
|
|
1,401,378
|
|
||||||
|
September 30, 2015
|
1,372,794
|
|
1,378,821
|
|
1,386,610
|
|
||||||
|
June 30, 2015
|
1,360,408
|
|
1,427,369
|
|
1,497,281
|
|
||||||
|
March 31, 2015
|
1,396,112
|
|
1,505,226
|
|
1,554,589
|
|
||||||
|
December 31, 2014
|
1,669,433
|
|
1,882,629
|
|
1,889,410
|
|
||||||
|
September 30, 2014
|
1,395,132
|
|
1,214,553
|
|
1,395,132
|
|
||||||
|
June 30, 2014
|
1,188,831
|
|
1,172,898
|
|
1,190,258
|
|
||||||
|
March 31, 2014
|
1,175,907
|
|
1,167,542
|
|
1,175,907
|
|
||||||
|
December 31, 2013
|
1,236,166
|
|
1,301,378
|
|
1,328,601
|
|
||||||
|
September 30, 2013
|
1,345,223
|
|
1,277,966
|
|
1,345,223
|
|
||||||
|
(1)
|
Our outstanding borrowings as of December 31, 2015 declined relative to our average borrowings outstanding for the quarter ended December 31, 2015. In light of continued and anticipated significant market volatility, during the quarter ended December 31, 2015, we net sold Agency RMBS, thereby reducing our outstanding borrowings and increasing our cash holdings in order to be more defensively positioned.
|
Amount at risk represents the aggregate excess, if any, for each counterparty of the fair value of collateral held by such counterparty over the amounts outstanding under reverse repos. The following tables reflect counterparties for which the amounts at risk relating to our reverse repos was greater than 5% of total equity as of
June 30, 2016
and December 31, 2015:
June 30, 2016
:
|
Counterparty
|
Amount at Risk
|
Weighted Average Remaining Days
to Maturity
|
Percentage of Equity
|
|||||
|
(In thousands)
|
||||||||
|
Wells Fargo Bank, N.A.
|
$
|
50,173
|
|
174
|
7.39%
|
|||
|
CS First Boston
|
$
|
47,867
|
|
211
|
7.05%
|
|||
99
December 31, 2015:
|
Counterparty
|
Amount at Risk
|
Weighted Average Remaining Days
to Maturity
|
Percentage of Equity
|
|||||
|
(In thousands)
|
||||||||
|
CS First Boston
|
$
|
52,463
|
|
143
|
7.1%
|
|||
|
Wells Fargo Bank, N.A.
|
$
|
45,147
|
|
501
|
6.1%
|
|||
Although we typically finance most of our holdings of Agency RMBS, as of
June 30, 2016
and December 31, 2015, we held unencumbered Agency pools, on a settlement date basis, in the amount of $1.9 million and $1.6 million, respectively.
We held cash and cash equivalents of approximately
$140.4 million
and
$183.9 million
as of
June 30, 2016
and December 31, 2015, respectively.
On August 3, 2015, our Board of Directors approved the adoption of a share repurchase program under which we are authorized to repurchase up to 1.7 million common shares. The program, which is open-ended in duration, allows us to make repurchases from time to time on the open market or in negotiated transactions. Repurchases are at our discretion, subject to applicable law, share availability, price and our financial performance, among other considerations. This program supersedes the program that was previously adopted on August 4, 2011. During the three month period ended
June 30, 2016
we repurchased 219,623 common shares at an average price per share of $17.26 and a total cost of $3.8 million. During the six month period ended
June 30, 2016
we repurchased 382,656 common shares at an average price per share of $17.31 and a total cost of $6.6 million. Since the inception of the repurchase plan through August 3, 2016 we repurchased 821,810 common shares at a total cost of $14.2 million.
We may declare dividends based on, among other things, our earnings, our financial condition, our working capital needs, and new opportunities. Dividends are declared and paid on a quarterly basis in arrears. The declaration of dividends to our shareholders and the amount of such dividends are at the discretion of our Board of Directors. During the six month period ended
June 30, 2016
, we paid total dividends in the amount of
$33.6 million
related to the three month periods ended December 31, 2015 and March 31, 2016. In August 2016, our Board of Directors approved a dividend related to the second quarter of 2016 in the amount of
$0.50
per share, or approximately
$16.7 million
, payable on September 15, 2016 to shareholders of record as of September 1, 2016. During the six month period ended
June 30, 2015
, we paid total dividends in the amount of
$44.3 million
related to the three month periods ended December 31, 2014 and March 31, 2015.
The following tables set forth the dividend distributions authorized by the Board of Directors payable to shareholders and LTIP holders for the periods indicated below:
Six Month Period Ended
June 30, 2016
|
(In thousands except per share amounts)
|
Dividend Per Share
|
Dividend Amount
|
Record Date
|
Payment Date
|
||||||
|
First Quarter
|
$0.50
|
$
|
16,744
|
|
June 1, 2016
|
June 15, 2016
|
||||
|
Second Quarter
|
$0.50
|
$
|
16,646
|
|
*
|
September 1, 2016
|
September 15, 2016
|
|||
*
Estimated
Six Month Period Ended
June 30, 2015
|
(In thousands except per share amounts)
|
Dividend Per Share
|
Dividend Amount
|
Record Date
|
Payment Date
|
||||||
|
First Quarter
|
$0.65
|
$
|
22,159
|
|
June 1, 2015
|
June 15, 2015
|
||||
|
Second Quarter
|
$0.65
|
$
|
22,144
|
|
September 1, 2015
|
September 15, 2015
|
||||
For the six month period ended
June 30, 2016
, our operating activities provided net cash in the amount of
$89.3 million
, and our reverse repo activity used to finance many of our investments (including repayments, in conjunction with the sales of investments, of amounts borrowed under our reverse repo agreements) used net cash of
$104.1 million
. In addition we received proceeds from the issuance of securitized debt of
$23.2 million
less repayments of $10.2 million. Thus our operating activities, when combined with our reverse repo and securitized debt financings, used net cash of
$1.8 million
for the six month period ended
June 30, 2016
. We also used
$33.6 million
to pay dividends,
$2.2 million
for distributions to non-controlling interests (our joint venture partners), and
$6.6 million
to repurchase common shares. In addition, contributions from non-controlling interests provided cash of
$0.7 million
. As a result there was a decrease in our cash holdings of
$43.6 million
from
$183.9 million
as of December 31, 2015 to
$140.4 million
as of
June 30, 2016
.
100
For the six month period ended
June 30, 2015
, our operating activities provided net cash of
$363.2 million
. Our reverse repo activity used to finance many of our investments (including repayments, in conjunction with the sales of investments, of amounts borrowed under our reverse repo agreements) used net cash of
$309.0 million
. Thus our operating activities, when combined with our reverse repo financings, provided net cash of
$54.1 million
for the six month period ended
June 30, 2015
. In addition, contributions from a non-controlling interest member provided cash of
$1.4 million
. We used
$44.3 million
to pay dividends,
$1.4 million
for distributions to a non-controlling interest (our joint venture partner), and $0.1 million for other financing activities. As a result there was an increase in our cash holdings of
$9.7 million
from
$114.1 million
as of December 31, 2014 to
$123.9 million
as of
June 30, 2015
.
Based on our current portfolio, amount of free cash on hand, debt-to-equity ratio, and current and anticipated availability of credit, we believe that our capital resources will be sufficient to enable us to meet anticipated short-term and long-term liquidity requirements. However, the unexpected inability to finance our Agency RMBS portfolio would create a serious short-term strain on our liquidity and would require us to liquidate much of that portfolio, which in turn would require us to restructure our portfolio to maintain our exclusion from registration as an investment company under the Investment Company Act. Steep declines in the values of our Credit assets financed using reverse repos, or in the values of our derivative contracts, would result in margin calls that would significantly reduce our free cash position. Furthermore, a substantial increase in prepayment rates on our assets financed by reverse repos could cause a temporary liquidity shortfall, because we are generally required to post margin on such assets in proportion to the amount of the announced principal paydowns before the actual receipt of the cash from such principal paydowns. If our cash resources are at any time insufficient to satisfy our liquidity requirements, we may have to sell assets or issue debt or additional equity securities.
We are not required by our investment guidelines to maintain any specific debt-to-equity ratio, and we believe that the appropriate leverage for the particular assets we hold depends on the credit quality and risk of those assets, as well as the general availability and terms of stable and reliable financing for those assets.
Contractual Obligations and Commitments
We are a party to a management agreement with our Manager. Pursuant to that agreement, our Manager is entitled to receive a base management fee, an incentive fee, reimbursement of certain expenses and, in certain circumstances, a termination fee. Such fees and expenses do not have fixed and determinable payments. For a description of the management agreement provisions, see Note 7 of the notes to our consolidated financial statements.
We enter into reverse repos with third-party broker-dealers whereby we sell securities to such broker-dealers at agreed-
101
upon purchase prices at the initiation of the reverse repos and agree to repurchase such securities at predetermined repurchase prices and termination dates, thus providing the broker-dealers with an implied interest rate on the funds initially transferred to us by the broker-dealers. We enter into repos with third-party broker-dealers whereby we purchase securities under agreements to resell at an agreed-upon price and date. In general, we most often enter into repo transactions in order to effectively borrow securities that we can then deliver to counterparties to whom we have made short sales of the same securities. The implied interest rates on the repos and reverse repos we enter into are based upon competitive market rates at the time of initiation. Repos and reverse repos that are conducted with the same counterparty may be reported on a net basis if they meet the requirements of ASC 210-20,
Balance Sheet, Offsetting
. See "—
Liquidity and Capital Resources
" for a summary of our borrowings on reverse repos. As of
June 30, 2016
and December 31, 2015 there were no repos or reverse repos reported on a net basis on the Consolidated Statement of Assets, Liabilities, and Equity.
As of
June 30, 2016
, we had an aggregate amount at risk under our reverse repos with twenty counterparties of approximately $209.6 million and as of December 31, 2015, we had an aggregate amount at risk under our reverse repos with nineteen counterparties of approximately $211.4 million. Amounts at risk represent the aggregate excess, if any, for each counterparty of the fair value of collateral held by such counterparty over the amounts outstanding under reverse repos. If the amounts outstanding under repos and reverse repos with a particular counterparty are greater than the collateral held by the counterparty, there is no amount at risk for the particular counterparty. Amount at risk as of
June 30, 2016
and December 31, 2015 does not include approximately $3.1 million and $4.9 million, respectively, of net accrued interest receivable, which is defined as accrued interest on securities held as collateral less interest payable on cash borrowed.
Our derivatives are predominantly subject to bilateral collateral arrangements or clearing in accordance with the Dodd-Frank Act. We may be required to deliver or receive cash or securities as collateral upon entering into derivative transactions. Changes in the relative value of derivative transactions may require us or the counterparty to post or receive additional collateral. Entering into derivative contracts involves market risk in excess of amounts recorded on our balance sheet. In the case of cleared derivatives, the clearinghouse becomes our counterparty and the Future Commission Merchant acts as an intermediary between us and the clearinghouse with respect to all facets of the related transaction, including the posting and receipt of required collateral.
As of
June 30, 2016
, we had an aggregate amount at risk under our derivative contracts with seventeen counterparties of approximately $77.8 million. We also had $21.4 million of initial margin for cleared OTC derivatives posted to central clearinghouses as of that date. As of December 31, 2015, we had an aggregate amount at risk under our derivatives contracts with nineteen counterparties of approximately $59.7 million. We also had $28.8 million of initial margin for cleared OTC derivatives posted to central clearinghouses as of that date. Amounts at risk under our derivatives contracts represent the aggregate excess, if any, for each counterparty of the fair value of our derivative contracts plus our collateral held directly by the counterparty less the counterparty's collateral held by us. If a particular counterparty's collateral held by us is greater than the aggregate fair value of the financial derivatives plus our collateral held directly by the counterparty, there is no amount at risk for the particular counterparty.
We are party to a tri-party collateral arrangement under one of our International Swaps and Derivatives Association, or "ISDA," trading agreements whereby a third party holds collateral posted by us. Pursuant to the terms of the arrangement, the third party must follow certain pre-defined actions prior to the release of the collateral to the counterparty or to us. Due from Brokers on the Consolidated Statement of Assets, Liabilities, and Equity includes, as of
June 30, 2016
and December 31, 2015, collateral posted by us and held by a third-party custodian in the amount of approximately $3.1 million and $2.6 million, respectively.
We purchase and sell TBAs and Agency pass-through certificates on a when-issued or delayed delivery basis. The delayed delivery for these securities means that these transactions are more prone to market fluctuations between the trade date and the ultimate settlement date, and thereby are more vulnerable, especially in the absence of margining arrangements with respect to these transactions, to increasing amounts at risk with the applicable counterparties. As of
June 30, 2016
, in connection with our forward settling TBA and Agency pass-through certificates, we had an aggregate amount at risk with six counterparties of approximately $4.6 million. As of December 31, 2015, in connection with our forward settling TBA and Agency pass-through certificates, we had an aggregate amount at risk with seven counterparties of approximately $1.3 million. Amounts at risk in connection with our forward settling TBA and Agency pass-through certificates represent the aggregate excess, if any, for each counterparty of the net fair value of the forward settling securities plus our collateral held directly by the counterparty less the counterparty's collateral held by us. If a particular counterparty's collateral held by us is greater than the aggregate fair value of the forward settling securities plus our collateral held directly by the counterparty, there is no amount at risk for the particular counterparty.
See Note 15 in the notes to our consolidated financial statements for further detail on our other contractual obligations and commitments.
102
Off-Balance Sheet Arrangements
As of
June 30, 2016
, we did not have any relationships with unconsolidated entities or financial partnerships, such as entities often referred to as structured finance or special purpose entities, which would have been established for the purpose of facilitating off-balance sheet arrangements or other contractually narrow or limited purposes. Further, we have not guaranteed any obligations of unconsolidated entities nor do we have any commitment to provide funding to any such entities that have or are reasonably likely to have a current or future effect on our financial condition, changes in financial condition, revenues or expenses, results of operations, liquidity, capital expenditures or resources that would be material to an investor in our securities. As such, we are not materially exposed to any market, credit, liquidity, or financing risk that could arise if we had engaged in such relationships.
At
June 30, 2016
the Company has entered into reverse repurchase agreements for which delivery of the borrowed funds is not scheduled until after period end in the amount of
$0.1 million
.
Inflation
Virtually all of our assets and liabilities are interest rate sensitive in nature. As a result, interest rates and other factors influence our performance far more so than does inflation. Changes in interest rates do not necessarily correlate with inflation rates or changes in inflation rates. Our activities and balance sheet are measured with reference to historical cost and/or fair market value without considering inflation.
The primary components of our market risk at
June 30, 2016
are related to credit risk, prepayment risk, and interest rate risk. We seek to actively manage these and other risks and to acquire and hold assets that we believe justify bearing those risks, and to maintain capital levels consistent with those risks.
Credit Risk
We are subject to credit risk in connection with many of our assets, especially non-Agency MBS, mortgage and consumer loans. Credit losses on real estate loans can occur for many reasons, including, but not limited to, poor origination practices, fraud, faulty appraisals, documentation errors, poor underwriting, legal errors, poor servicing practices, weak economic conditions, decline in the value of homes, businesses or commercial properties, special hazards, earthquakes and other natural events, over-leveraging of the borrower on a property, reduction in market rents and occupancies and poor property management services, changes in legal protections for lenders, reduction in personal income, job loss, and personal events such as divorce or health problems. Property values are subject to volatility and may be affected adversely by a number of factors, including, but not limited to, national, regional, and local economic conditions (which may be adversely affected by industry slowdowns and other factors), local real estate conditions (such as an oversupply of housing), changes or continued weakness in specific industry segments, construction quality, age and design, demographic factors, and retroactive changes to building or similar codes. The ability of borrowers to repay consumer loans may be adversely affected by numerous borrower-specific factors, including unemployment, divorce, major medical expenses or personal bankruptcy. General factors, including an economic downturn, high energy costs or acts of God or terrorism, may also affect the financial stability of borrowers and impair their ability or willingness to repay their loans. Whenever any of our consumer loans defaults, we are at risk of loss to the extent of any deficiency between the liquidation value of the collateral, if any, securing the loan, and the principal and accrued interest of the loan. Many of our consumer loans are unsecured, or are secured by collateral (such as an automobile) that depreciates rapidly; as a result, these loans may be at greater risk of loss than residential real estate loans.
Similarly, we are exposed to the risk of potential credit losses on other credit-related assets in our portfolio, including distressed corporate debt, CLOs, and investments in mortgage-related entities.
For many of our investments, the two primary components of credit risk are default risk and severity risk.
Default Risk
Default risk is the risk that borrowers will fail to make principal and interest payments on mortgage loans or other debt obligations. We may attempt to mitigate our default risk by, among other things, opportunistically entering into credit default swaps and total return swaps. These instruments can reference various MBS indices, corporate bond indices, or corporate entities, such as publicly traded REITs. We often rely on third-party servicers to mitigate our default risk, but such third-party servicers may have little or no economic incentive to mitigate loan default rates.
Severity Risk
Severity risk is the risk of loss upon a borrower default on a mortgage loan or other debt obligation. Severity risk includes the risk of loss of value of the property or other asset securing the mortgage loan or debt obligation, as well as the risk of loss
associated with taking over the property or other asset, including foreclosure costs. We often rely on third-party servicers to mitigate our severity risk, but such third-party servicers may have little or no economic incentive to mitigate loan loss severities. In the case of mortgage loans, such mitigation efforts may include loan modification programs and prompt foreclosure and property liquidation following a default.
Prepayment Risk
Prepayment risk is the risk of change, whether an increase or a decrease, in the rate at which principal is returned in respect of fixed income assets in our portfolio, including both through voluntary prepayments and through liquidations due to defaults and foreclosures. Most significantly, our portfolio is exposed to the risk of changes in prepayment rates of mortgage loans underlying our RMBS holdings. This rate of prepayment is affected by a variety of factors, including the prevailing level of interest rates as well as economic, demographic, tax, social, legal, and other factors. Changes in prepayment rates will have varying effects on the different types of securities in our portfolio, and we attempt to take these effects into account in making asset management decisions. Additionally, increases in prepayment rates may cause us to experience losses on our interest only securities and inverse interest only securities, as those securities are extremely sensitive to prepayment rates. In the current relatively low interest rate environment, one might typically expect higher prepayment rates; however, as mortgage originators have tightened their lending standards and have also made the refinancing process far more cumbersome, the current level of prepayments is not nearly what would otherwise be expected. Prepayment rates, besides being subject to interest rates and borrower behavior, are also substantially affected by government policy and regulation. For example, the government sponsored HARP program, which was designed to encourage mortgage refinancings, continues to be a factor in prepayment risk, and could become a bigger factor if eligibility requirements are expanded or qualification processes are streamlined. Mortgage rates remain very low by historical standards, and as a result, prepayments continue to represent a meaningful risk, especially with respect to our Agency RMBS.
Interest Rate Risk
Interest rates are highly sensitive to many factors, including governmental monetary and tax policies, domestic and international economic and political considerations, and other factors beyond our control. We are subject to interest rate risk in connection with most of our assets and liabilities. For some securities in our portfolio, the coupon interest rates on, and therefore also the values of, such securities are highly sensitive to interest rate movements, such as inverse floating rate RMBS, which benefit from falling interest rates. We selectively hedge our interest rate risk by entering into interest rate swaps, TBAs, U.S. Treasury securities, Eurodollar futures, U.S. Treasury futures, and other instruments. In general, such hedging instruments are used to offset the large majority of the interest rate risk we estimate to arise from our Agency RMBS positions. Hedging instruments may also be used to offset a portion of the interest rate risk arising from certain non-Agency MBS positions.
The following sensitivity analysis table shows the estimated impact on the value of our portfolio segregated by certain identified categories as of
June 30, 2016
, assuming a static portfolio and immediate and parallel shifts in interest rates from current levels as indicated below.
|
(In thousands)
|
Estimated Change in value for a Decrease in Interest Rates by
|
Estimated Change in value for an Increase in Interest Rates by
|
||||||||||||||
|
Category of Instruments
|
50 Basis Points
|
100 Basis Points
|
50 Basis Points
|
100 Basis Points
|
||||||||||||
|
Agency RMBS
|
$
|
6,577
|
|
$
|
10,944
|
|
$
|
(8,787
|
)
|
$
|
(19,784
|
)
|
||||
|
Non-Agency RMBS, CMBS, Other ABS, and Mortgage Loans
|
2,712
|
|
5,846
|
|
(2,290
|
)
|
(4,159
|
)
|
||||||||
|
U.S. Treasury Securities, and Interest Rate Swaps, Options, and Futures
|
(8,352
|
)
|
(16,963
|
)
|
8,095
|
|
15,932
|
|
||||||||
|
Mortgage-Related Derivatives
|
(14
|
)
|
(57
|
)
|
(16
|
)
|
(61
|
)
|
||||||||
|
Corporate Securities and Derivatives on Corporate Securities
|
(1,780
|
)
|
(3,538
|
)
|
1,801
|
|
3,624
|
|
||||||||
|
Repurchase Agreements and Reverse Repurchase Agreements
|
(570
|
)
|
(882
|
)
|
559
|
|
1,119
|
|
||||||||
|
Total
|
$
|
(1,427
|
)
|
$
|
(4,650
|
)
|
$
|
(638
|
)
|
$
|
(3,329
|
)
|
||||
The preceding analysis does not show sensitivity to changes in interest rates for instruments for which we believe that the effect of a change in interest rates is not material to the value of the overall portfolio and/or cannot be accurately estimated. In particular, this analysis excludes certain of our holdings of corporate securities and derivatives on corporate securities, and reflects only sensitivity to U.S. interest rates.
Our analysis of interest rate risk is derived from Ellington's proprietary models as well as third-party information and
103
analytics. Many assumptions have been made in connection with the calculations set forth in the table above and, as such, there can be no assurance that assumed events will occur or that other events will not occur that would affect the outcomes. For example, for each hypothetical immediate shift in interest rates, assumptions have been made as to the response of mortgage prepayment rates, the shape of the yield curve, and market volatilities of interest rates; each of the foregoing factors can significantly and adversely affect the fair value of our interest rate-sensitive instruments.
The above analysis utilizes assumptions and estimates based on management's judgment and experience, and relies on financial models, which are inherently imperfect; in fact, different models can produce different results for the same securities. While the table above reflects the estimated impacts of immediate parallel interest rate increases and decreases on specific categories of instruments in our portfolio, we actively trade many of the instruments in our portfolio, and therefore our current or future portfolios may have risks that differ significantly from those of our
June 30, 2016
portfolio estimated above. Moreover, the impact of changing interest rates on fair value can change significantly when interest rates change by a greater amount than the hypothetical shifts assumed above. Furthermore, our portfolio is subject to many risks other than interest rate risks, and these additional risks may or may not be correlated with changes in interest rates. For all of the foregoing reasons and others, the table above is for illustrative purposes only and actual changes in interest rates would likely cause changes in the actual fair value of our portfolio that would differ from those presented above, and such differences might be significant and adverse. See "
Management's Discussion and Analysis of Financial Condition and Results of Operations—Special Note Regarding Forward-Looking Statements.
"
Disclosure Controls and Procedures
We maintain disclosure controls and procedures that are designed to ensure that information required to be disclosed in the reports that we file or submit under the Securities Exchange Act of 1934, as amended, is recorded, processed, summarized and reported within the time periods specified in the rules and forms of the SEC, and that such information is accumulated and communicated to our management as appropriate to allow timely decisions regarding required disclosures. An evaluation was performed under the supervision and with the participation of our management, including our Chief Executive Officer and Chief Financial Officer, of the effectiveness of our disclosure controls and procedures (as defined in Rules 13a-15(e) and 15d-15(e) under the Securities Exchange Act of 1934, as amended) as of
June 30, 2016
. Based upon that evaluation, our Chief Executive Officer and Chief Financial Officer concluded that our disclosure controls and procedures were effective as of
June 30, 2016
.
Internal Control Over Financial Reporting
There have been no changes in our internal control over financial reporting that occurred during the three month period ended
June 30, 2016
that have materially affected, or are reasonably likely to materially affect, our internal control over financial reporting.
Neither we nor our Manager are currently subject to any legal proceedings that we or our Manager consider material. Nevertheless, we, our Manager and Ellington operate in highly regulated markets that currently are under intense regulatory scrutiny, and Ellington and its affiliates have received, and we expect in the future that they may receive, inquiries and requests for documents and information from various federal, state and foreign regulators. See "
Risk Factors—We, Ellington, or its affiliates may be subject to regulatory inquiries or proceedings
" included in Part 1A of our Annual Report on Form 10-K for the year ended December 31, 2015. Ellington has advised us that, at the present time, it is not aware that any material legal proceeding against Ellington and its affiliates is contemplated in connection with any such inquiries or requests. Ellington and we cannot provide any assurance that these inquiries and requests will not result in further investigation of or the initiation of a proceeding against Ellington or its affiliates or that, if any such investigation or proceeding were to arise, it would not materially adversely affect our company.
For information regarding factors that could affect our results of operations, financial condition, and liquidity, see the risk factors discussed under "
Risk Factors
" in Part I, Item 1A of our Annual Report on Form 10-K for the year ended December 31, 2015. There have been no material changes from these previously disclosed risk factors. See also "
Special Note Regarding Forward-Looking Statements
," included in Part I, Item 2 of this Quarterly Report on Form 10-Q.
104
Purchases of Equity Securities
|
Total Number of Shares Purchased
|
Average Price Paid
|
Total Number of Shares Purchased as Part of Publicly Announced Plans or Programs
|
Number of Shares that May Yet be Purchased Under the Plans or Programs
|
|||||||||||
|
(In thousands)
|
||||||||||||||
|
April 1, 2016 - April 30, 2016
|
131,707
|
|
$
|
17.21
|
|
131,707
|
|
$
|
1,079,647
|
|
||||
|
May 1, 2016 - May 31, 2016
|
4,845
|
|
17.28
|
|
4,845
|
|
1,074,802
|
|
||||||
|
June 1, 2016 - June 30, 2016
|
83,071
|
|
17.34
|
|
83,071
|
|
991,731
|
|
||||||
|
Total
|
219,623
|
|
$
|
17.26
|
|
219,623
|
|
$
|
991,731
|
|
||||
On August 3, 2015, the Company's Board of Directors approved the adoption of a share repurchase program under which the Company is authorized to repurchase up to 1.7 million common shares. The program, which is open-ended in duration, allows the Company to make repurchases from time to time on the open market or in negotiated transactions, including under Rule 10b5-1 plans. Repurchases are at the Company's discretion, subject to applicable law, share availability, price and our financial performance, among other considerations. This program supersedes the program that was previously adopted on August 4, 2011.
|
Exhibit
|
|
Description
|
|
31.1
|
|
Certification of Chief Executive Officer pursuant to Section 302 of the Sarbanes – Oxley Act of 2002
|
|
31.2
|
|
Certification of Chief Financial Officer pursuant to Section 302 of the Sarbanes – Oxley Act of 2002
|
|
32.1*
|
|
Certification of Chief Executive Officer pursuant to 18 U.S.C. Section 1350, as adopted pursuant to Section 906 of the Sarbanes – Oxley Act of 2002
|
|
32.2*
|
|
Certification of Chief Financial Officer pursuant to 18 U.S.C. Section 1350, as adopted pursuant to Section 906 of the Sarbanes – Oxley Act of 2002
|
|
101
|
|
The following financial information from Ellington Financial LLC's Quarterly Report on Form 10-Q for the six month period ended June 30, 2016, formatted in XBRL (Extensible Business Reporting Language): (i) Consolidated Statement of Assets, Liabilities, and Equity, (ii) Consolidated Statement of Operations, (iii) Consolidated Statements of Changes in Equity, (iv) Consolidated Statements of Cash Flows and (v) Notes to Consolidated Financial Statements.
|
|
*
|
Furnished herewith. These certifications are not deemed "filed" for purposes of Section 18 of the Securities Exchange Act of 1934, as amended.
|
105
SIGNATURES
Pursuant to the requirements of Section 13 or 15(d) of the Securities Exchange Act of 1934, the registrant has duly caused this report to be signed on its behalf by the undersigned, thereunto duly authorized.
|
|
ELLINGTON FINANCIAL LLC.
|
|||
|
Date:
|
August 8, 2016
|
|
By:
|
/s/ L
AURENCE
P
ENN
|
|
|
Laurence Penn
Chief Executive Officer
(Principal Executive Officer)
|
|||
|
ELLINGTON FINANCIAL LLC.
|
||||
|
Date:
|
August 8, 2016
|
By:
|
/s/ L
ISA
M
UMFORD
|
|
|
Lisa Mumford
Chief Financial Officer
(Principal Financial and Accounting Officer)
|
||||
106
EXHIBIT INDEX
|
Exhibit
|
|
Description
|
|
31.1
|
|
Certification of Chief Executive Officer pursuant to Section 302 of the Sarbanes – Oxley Act of 2002
|
|
31.2
|
|
Certification of Chief Financial Officer pursuant to Section 302 of the Sarbanes – Oxley Act of 2002
|
|
32.1*
|
|
Certification of Chief Executive Officer pursuant to 18 U.S.C. Section 1350, as adopted pursuant to Section 906 of the Sarbanes – Oxley Act of 2002
|
|
32.2*
|
|
Certification of Chief Financial Officer pursuant to 18 U.S.C. Section 1350, as adopted pursuant to Section 906 of the Sarbanes – Oxley Act of 2002
|
|
101
|
|
The following financial information from Ellington Financial LLC's Quarterly Report on Form 10-Q for the six month period ended June 30, 2016, formatted in XBRL (Extensible Business Reporting Language): (i) Consolidated Statement of Assets, Liabilities, and Equity, (ii) Consolidated Statement of Operations, (iii) Consolidated Statements of Changes in Equity, (iv) Consolidated Statements of Cash Flows and (v) Notes to Consolidated Financial Statements.
|
|
*
|
Furnished herewith. These certifications are not deemed "filed" for purposes of Section 18 of the Securities Exchange Act of 1934, as amended.
|
107
TABLE OF CONTENTS
Part 1. Financial InformationItem 1. Consolidated Financial Statements (unaudited)Item 2. Management's Discussion and Analysis Of Financial Condition and Results Of OperationsItem 3. Quantitative and Qualitative Disclosures About Market RiskItem 4. Controls and ProceduresPart IIItem 1. Legal ProceedingsItem 1A. Risk FactorsItem 2. Unregistered Sales Of Equity Securities and Use Of ProceedsItem 6. Exhibits